IRIDIUM COMMUNICATIONS INC.
ANNUAL REPORT ON FORM 10-K
Year Ended December 31, 20172023
TABLE OF CONTENTS
| PART I | ||||||||
| Item 1. | ||||||||
| Item 1A. | ||||||||
| Item 1B. | ||||||||
| Item | ||||||||
| Item 2. | ||||||||
| Item 3. | ||||||||
| Item 4. | ||||||||
| PART II | ||||||||
| Item 5. | ||||||||
| Item 6. | ||||||||
| Item 7. | ||||||||
| Item 7A. | ||||||||
| Item 8. | ||||||||
| Item 9. | ||||||||
| Item 9A. | ||||||||
| Item 9B. | ||||||||
| Item 9C. | ||||||||
| PART III | ||||||||
| Item 10. | ||||||||
| Item 11. | ||||||||
| Item 12. | ||||||||
| Item 13. | ||||||||
| Item 14. | ||||||||
| PART IV | ||||||||
| Item 15. | ||||||||
| Item 16. | ||||||||
Forward-Looking Statements
This report contains forward-looking statements within the meaning of the Private Securities Litigation Reform Act of 1995. For this purpose, any statements contained herein that are not statements of historical fact may be deemed to be forward-looking statements. Such forward-looking statements include those that express plans, anticipation, intent, contingencies, goals, targets or future developments or otherwise are not statements of historical fact. Without limiting the foregoing, the words “believes,” “anticipates,” “plans,” “expects,” “intends” and similar expressions are intended to identify forward-looking statements. These forward-looking statements are based on our current expectations and projections about future events, and they are subject to risks and uncertainties, known and unknown, that could cause actual results and developments to differ materially from those expressed or implied in such statements. The important factors discussed under the caption “Risk Factors” in this Form 10-K could cause actual results to differ materially from those indicated by forward-looking statements made herein. We undertake no obligation to publicly update or revise any forward-looking statements, whether as a result of new information, future events or otherwise.
1
PART I
Item 1. Business
Corporate Background
Iridium Holdings was formed under the laws of Delaware in 2000, and on December 11, 2000, Iridium Holdings, through its wholly owned subsidiary Iridium Satellite LLC, or Iridium Satellite, acquired certain satellite assets from Iridium LLC, a non-affiliated debtor in possession, pursuant to an asset purchase agreement.
Business Overview
We are the only commercial provider of communications services offering true global coverage, connecting people, organizations and assets to and from anywhere, in real time. Our uniquelow-earth orbit (LEO), L-band satellite network provides reliable, weather-resilient communications services to regions of the world where terrestrial wireless or wireline networks do not exist or are limited, including remote land areas, open ocean, airways, the polar regions, and regions where the telecommunications infrastructure has been affected by political conflicts or natural disasters.
We provide voice and data communications services to businesses, the U.S. and foreign governments, non-governmental organizations, and consumers via our satellite network, which has an architecture of 66 operational satellites with in-orbit spares and related ground infrastructure. We utilize an interlinked mesh architecture to route traffic across our satellite constellation using radio frequency crosslinks between satellites. This unique architecture minimizes the need for local ground facilities to support the constellation, which facilitates the global reach of our services and allows us to offer services in countries and regions where we have no physical presence.
Our commercial business, which we view as our primary source of long-term growth, is diverse and includesserves markets such as emergency services, maritime, aviation, government, utilities, oil and gas, mining, recreation, forestry, heavy equipment,
construction, railways and other transportation. Many of our end users view our products and services as critical to their daily operations and integral to their communications and business infrastructure. For example, multinational corporations in various sectors use our services for business telephony, e-mailemail and data transfer, including telematics and personal location tracking, and to provide mobile communications services for employees in areas inadequately served by other telecommunications networks. Commercial enterprises use our services to track assets in remote areas and provide telematics information such as location and engine diagnostics. Ship crews and passengers use our services for ship-to-shore calling, as well as to send and receive e-mailemail and data files, and to receive electronic media, weather reports, emergency bulletins and electronic charts. Shipping operators use our services to manage operations on board ships and to transmit data, such as course, speed, fuel, weather and fuel stock.other navigation service data. Aviation end users use our services for air-to-ground telephony and data communications for position reporting, flight following, emergency tracking, weather information, electronic flight bag updates, and fleet information.airline operational communications. Recreational users rely on our services as a safety and critical personal communications lifeline to remain in contact with friends and family, as well as for emergency distress signals. We have also seen growing adoption of our services to support autonomous systems, for which Iridium is used for command and control, image transmission and environmental data gathering via unmanned aerial, underwater and surface vehicles. Iridium Certus® provides a platform for our partners to develop specialized broadband and midband (a term we use to describe services between our legacy 2.4 Kbps narrowband and
2
our 128 Kbps and higher broadband offerings) applications on our network. With broadband services provided for the maritime and land-mobile industries and a midband service designed for maximum mobility, Iridium Certus offers the flexibility to scale device speeds, sizes and power requirements both up and down based on the needs of the end-user. We expect that these and future Iridium Certus service offerings will continue to drive growth opportunities in our commercial business.
The U.S. government, directly and indirectly, has been and continues to be our largest single customer, generating $106.1$196.1 million in service and engineering and support service revenue, or 24%25% of our total revenue, for the year ended December 31, 2017.2023. This does not include revenue from the sale of equipment that may be ultimately purchased by U.S. or non-U.S. government agencies through third-party distributors, or airtime services purchased by U.S. or non-U.S. government agencies that are provided through our commercial gateway, as we lack specific visibility into these activities and the related revenue. We haveoperate under a multi-year, fixed-price contract with the U.S. government, which we refer to as our Enhanced Mobile Satellite Services, or EMSS, contract to provide specified satellite airtime services for an unlimited number of U.S. Department of Defense, or DoD, and other federal government subscribers, withsubscribers. The EMSS contract, entered into in September 2019, has a total contract value of $400$738.5 million over its five-yearseven-year term, through October 2018.September 2026, with annual revenues between $100 million and $110.5 million over the term. We may provide other services, such as Iridium Certus, to the U.S. government under separate arrangements for an additional fee.
The DoDU.S. government owns and operates a dedicated gateway in Hawaii that is only compatible with our satellite network. The U.S. armed services, State Department, Department of Homeland Security, Federal Emergency Management Agency, or FEMA, Customs and Border Protection, and other U.S. government agencies, as well as other nations’ governmental agencies, use our voice and data services for a wide variety of applications. Our voice and data products are used for numerous primary and backup communications solutions, including logistical, administrative, morale and welfare, tactical, and emergency communications. In addition, our products are installed in ground vehicles, ships, rotaryand rotary- and fixed-wing aircraft and are used for command-and-control and situational awareness purposes. Our satellite network provides increased network security to the DoDU.S. government because traffic is routed across our satellite constellation before being brought down to earth through the dedicated, secure DoDU.S. government gateway. The DoDU.S. government has made, and continues to make, significant investments to upgrade its dedicated gateway, for Iridium NEXT and to purchase our voice and data devices, all of which are only compatible with our satellite network. In addition, the DoD continuesand to invest directly and indirectly in research and development and implementation support for additional services on our network, such as Distributed Tactical Communications Services, or DTCS.DTCS, and Iridium Certus.
We also provide engineering and support services to the U.S. government under a contract awarded by the Space Development Agency in May 2022 to General Dynamics Mission Systems, with Iridium as a subcontractor, which we refer to as the SDA contract. Under this contract, General Dynamics Mission Systems and Iridium will build ground entry points and operations centers for the Proliferated Warfighter Space Architecture (PWSA), as well as provide network operations and systems integration services for the SDA’s next tranche of proliferated low-earth orbit satellites.
We sell our products and services to commercial end users primarily through a wholesale distribution network, encompassing approximately 140100 service providers, approximately 220300 value-added resellers, or VARs, and approximately 85 value-added manufacturers, or VAMs, which create and sell technology that uses the Iridium network either directly to the end user or indirectly through other service providers, VARs or dealers. These distributors often integrate our products and services with other complementary hardware and software and have developed a broad suite of applications using our products and services to target specific lines of business. We expect that demand for our services will increase as more applications are developed and deployed that utilize our technology.
At December 31, 2017,2023, we had approximately 969,0002,279,000 billable subscribers worldwide, representing a 14% increase compared to December 31, 2016.2022. Total revenue increased from $433.6$721.0 million in 20162022 to $448.0$790.7 million in 2017.2023, representing a 10% increase.
Industry
We compete primarily in the mobile satellite services sector of the global communications industry. Mobile satellite services operators provide voice and data services to people and machines using a network of satellites and ground facilities. Mobile satellite services are intended to meet users’ needs for connectivity in all locations where terrestrial wirelinewireless and wirelesswireline communications networks do not exist, do not provide sufficient coverage, or are impaired. Further, many regions of the world benefit from satellite networks, such as impaired, includingrural and developing areas that lack adequate wireless or wireline networks, airways, ocean and polar regions where few alternatives exist, and regions where the telecommunications infrastructure has been affected by political conflicts or natural disasters.
3
Government organizations, including military and intelligence agencies and disaster response agencies, non-governmental organizations, and industrial operations and support teams depend on mobile and fixed voice and data satellite communications services on a regular basis. Businesses with global operations require reliable communications services when operating in remote locations around the world. Mobile satellite services users span many sectors, including emergency services, maritime,
aviation, government, utilities, oil and gas, mining, recreation, forestry, heavy equipment, construction, railways and other transportation, among others. Many of our customers view satellite communications services as critical to their daily operations.
We believe that increasing mobile penetration creates additional demand for the mobile satellite services industry.services. According to a 20172023 study by the GSM Association, totalunique mobile connectionssubscribers, excluding cellular Internet of Things, or IoT, reached 7.95.4 billion throughout the world as of the end of 20162022 and are projected to reach 9.76.3 billion by 2020.2030.
We believe that growth in the terrestrial wireless industry has increased awareness of the need for reliable mobile voice and data communications services. In addition, despite significant penetration and competition, terrestrial wireless systems only servedo not cover a small fractionlarge majority of the earth’s surface and are focused mainly in those areas where people live, excluding oceans and other remote regions where ships, airplanes and other remote assets may travel or be located.be. By offering mobile communications services with global voice and data coverage, mobile satellite service providers address the demand from businesses, governments and individuals for connectivity and reliability in locations not consistently served by wireline and wireless terrestrial networks.
The mobile satellite services sector of the global telecommunications industry also benefits from the continued development of innovative, lower-cost technology and applications integrating mobile satellite products and services, including the continued advancement of the Internet of Things, or IoT. We believe that growth in demand for mobile satellite services is driven in large part by the declining cost of these services, the diminishing size and lower costs of voice, data and IoT devices, the rollout of new applications tailored to the specific needs of customers across a variety of markets, and a more favorable regulatory environment inexpansion into new international markets.
Communications industry sectors include:
•mobile satellite services, which provide customers with voice and data connectivity to mobile and fixed devices using ground facilities and networks of geostationary, or GEO, satellites, which are located approximately 22,300 miles above the equator, medium earth orbit satellites, which orbit between approximately 6,400 and 10,000 miles above the earth’s surface, or low earth orbit, or LEO, satellites, such as those in our constellation, which orbit between approximately 300 and 1,000 miles above the earth’s surface;
•fixed satellite services, which typically use GEO satellites to provide customers with broadband communications links between fixed points on the earth’s surface; and
•terrestrial services, which use a network of land-based equipment, including switching centers and radio base stations, to provide wireless or wireline connectivity and are complementary to satellite services.
Within the two major satellite sectors, fixed satellite services and mobile satellite services, the products that operators offer differ significantly from each other with respect to size of antenna and types of services offered.that the products can offer. Fixed satellite services providers, such as Intelsat S.A., Eutelsat Communications S.A. and SES S.A., are characterized by large, often stationary or fixed ground terminals that send and receive high-bandwidth signals to and from the satellite network for video and high-speed data customers and international telephone markets. By contrast, mobile satellite services providers, such as us, Inmarsat plc, Globalstar, Inc., and ORBCOMM Inc. focus more on voice and data services, where mobility and small-sized terminals are essential. Other mobile satellite service providers include Globalstar, Inc., ORBCOMM Inc., and in some portions of their businesses, Viasat Inc. (following its acquisition of Inmarsat Global Limited) and new entrants such as Space Exploration Technology Corp.’s (SpaceX) Starlink and OneWeb Holdings Limited.
Our Competitive Strengths
4
•Attractive and growing markets. We believe that mobile satellite services will continue to experience growth driven by the increasing awareness of the need for reliable mobile voice and data communications services, the lack of coverage of most of the earth’s surface by terrestrial wireless systems, the continued development of the IoT, and the continued development of other environmental factors than GEOinnovative, lower-cost technology, such as applications integrating mobile satellite networks. Asproducts and services into other devices, including embedding standards-based satellite technology in smartphones and IoT devices. Only satellite providers can offer global coverage, and developing a result, wesatellite network requires significant financial investment, as well as technological and regulatory challenges. We believe that we are well-positioned to capitalize on the growth in our industry from end users who require reliable, easy-to-use mobile communications services in all locations.
•Strategic relationship with the U.S. government. The U.S. government is our largest single customer, and we have provided airtime services to the U.S. government (particularly the DoD) since our inception. We believe the U.S. government views our encrypted handset, IoT devices, DTCS and other products as mission-critical services and equipment. The U.S. government continues to make significant investments in a dedicated gateway on a U.S. government site to provide operational security and allow U.S. government handset and IoT users to communicate securely with other U.S. government communications equipment. This gateway is only compatible with our satellite network. In September 2019, we entered into the EMSS contract and continue to see usage of our network under this contract. With ongoing investments by the DoD, we expect to see growth in adoption as enhancements are implemented and new services are launched. We also view the SDA contract as a confirmation and expansion of our strategic relationship with the U.S. government.
•Wholesale distribution network. The specialized needs of our global end users span many markets, including emergency services, maritime, aviation, government, utilities, oil and gas, mining, recreation, forestry, heavy equipment, construction, railways and other transportation. We sell our products and services to commercial end users primarily through a wholesale distribution network of service providers, VARs and VAMs, which often specialize in a particular line of business. Our distributors use our products and services to develop innovative and integrated communications solutions for their target markets, oftenembedding our technology in their products or combining our products with other technologies, such as GPS and terrestrial wireless technology. In addition to promoting innovation, our wholesale distribution model allows us to capitalize on the research and development expenditures of our distribution partners, while lowering overall customer acquisition costs and mitigating some risks, such as consumer relationship risks. By supporting these distributors as they develop new products, services and applications, we believe we create additional demand for our products and services and expand our target markets at a lower cost than would a more direct marketing model. We believe our distribution network can continue to grow with us and increase our market penetration.
Our Business and Growth Strategies
•Leverage our largely fixed-cost infrastructure by growingto grow our service revenue. Our business model is characterized by high capital costs, primarily incurred every 10 to 15 years, in connection with designing, building and launching new generations of our satellite constellation, but theand a low incremental cost of providing service to additional end users is relatively low.users. We believe that service revenue will continue to be our largest source of future growth and profits, and we intend to focus on growing both our commercial and government service revenue in order to leverage our largely fixed-cost infrastructure. In particular, we believe that competitive broadband, midband and narrowband data services through Iridium Certus and satellite IoT services, where we are engaging large, global enterprises as long-term customers for data and telematics solutions, represent our greatest opportunities for service revenue growth.
5
•Expand our target markets through the development of new products and services. We believe that we can expand our target markets by developing and offering a broader range of products and services, including a wider array of cost-effective and competitive broadband, midband, safety services, and IoT data services using our proprietary Iridium Certus technology to complement and expand on our legacy narrowband services. Iridium Certus is a multi-service technology platform that can deliver a range of services, from voice to a high-throughput L-band data connection, at a range of competitive price points, data speeds, and terminal dimensions to meet an expanding set of customer requirements. Beyond Iridium Certus technology, we also plan to expand our target markets by adding in a standards-based IoT solution. For example, during 2024, we announced Project Stardust, which is what we call our new, multi-year project to develop standards-based Narrowband-Internet of Things (NB-IoT) and Non-Terrestrial Network (NB-NTN) messaging and SOS capabilities for smartphones, tablets, cars and related consumer applications.
•Accelerate the development of personal communications capabilities. Part of our strategy for the development of personal mobile satellite communications is to allow individuals to connect to our network in more ways, including from devices such as smartphones, tablets and laptops through our Iridium GO!® and Iridium GO! exec® devices or a variety of personal communication devices from VAMs and VARs like Garmin. We are making our technology more accessible and cost-effective for our distribution partners to integrate by licensing our core technologies; by adding functionality, such as push-to-talk, or PTT, capability, which allows multiple users to participate in talk groups worldwide; by providing rugged, dependable devices and services; and by developing new services that take advantage of the capabilities of our global constellation.
•Continued growth in services provided to the U.S. government. Under our EMSS contract, we provide Iridium airtime services, including unlimited global standard and secure voice, paging, fax, Short Burst Data®, or SBD®, Iridium Burst®, Router-Based Unrestricted Digital Interworking Connectivity Solutions (or RUDICs) and DTCS services for an unlimited number of DoD and other federal government subscribers. The fixed-price annual rate of the EMSS contract through September 2024 is $106 million, with increases thereafter up to $110.5 million for the final contract year ending in September 2026. Other services such as Iridium Certus and Satellite Time and Location provide us with opportunities to offer new products and services to the U.S. government for an additional fee.
•Continue to expand our distribution network. We believe our wholesale distribution network lowers our costs and risks, and we plan to continue to selectively expand our network of service providers, VAMs and VARs, and to expand our sales and distribution efforts geographically.geographically, and to add additional industries or lines of business. We expect that our current and future value-added partners will continue to develop customized products, services and applications targeted to the land mobile, IoT, maritime, aviation and government markets. We believe these markets and the new service providers, VAMs and VARs who join our network as a result of new product offerings represent an attractive opportunity for continued subscriber and revenue growth.
•Continue to developsupport Aireon in the execution of its business plan. Aireon, which we formed in 2011, with subsequent investments from five ANSPs, is our primary hosted payload customer. Aireon received subsequent investments from four ANSPs, NAV CANADA, Enav (Italy), Naviair (Denmark) and the Irish Aviation Authority. Aireon has developed an ADS-B receiver whichpayload that is hosted on Iridium NEXTour satellites and gathers ADS-B position information from aircraft to provide a global air traffic surveillance service. Aireon has contracted to offer its service to our co-investors in Aireon, as well as NATSANSPs and other ANSPs, and plans to offer it to othercommercial customers worldwide, including the FAA.worldwide. Aireon has also contracted to pay us a fee to host the ADS-B receiverstheir payloads on Iridium NEXTour satellites and pays us data service fees for the delivery of the air traffic surveillance data from those payloads over the Iridium NEXT system. We will also continue to hold ana meaningful equity stake in Aireon.
Distribution Channels
We sell our products and services to customers through a wholesale distribution network of approximately 140100 service providers, approximately 220300 VARs and approximately 85 VAMs. These distributors sell our products and services to end users, either directly or indirectly through service providers, VARs or dealers. Of these distributors, 34over 53 sell primarily to U.S. and international government customers. Our distributors often integrate our products and services with other complementary hardware and software and have developed individual solutions targeting specific lines of business. We also sell airtime services directly to the U.S. government, including the DoD, for resale to other government agencies. The U.S. government and international government agencies may purchase additional services as well as our products and related applications through our network of distributors.
We provide our distributors with support services, including assistance with coordinating end user sales and marketing, strategic planning and training, and second-tier customer support, as well as helping them market our products and services and respond to new opportunities for our products and services.business opportunities. We have representatives covering three regions around the world to better manage our distributor relationships: the Americas, which includes North, South and Central America; Asia Pacific, which includes Australia and Asia; and Europe, the Middle East, Africa and Russia. We have also established a global service program to
6
provide portside service for our maritime customers at major ports worldwide. In addition, we maintain various online management tools that allow us to communicate efficiently with our distributors and allow them to manage their customers’ Iridium devices from anywhere in the world. By relying on our distributors to manage end user sales, we believe that we reduce some of the risks and costs related to our business, such as consumer relationship risks and sales and marketing costs, while providing a broad and expanding distribution network for our products and services with access to diverse and geographically dispersed niche markets. We are also able to benefit from the specialized expertise of our distributors, who continue to develop innovative and improved solutions and applications integrating our product and service offerings, providing us with an attractive platform to support our growth.
Commercial Markets
We view our commercial business as our primary source of long-term growth. Service providers and VARs serve as our main distribution channel by purchasing our products and services and marketing them directly to their customers or indirectly through independent dealers. They are each responsible for customer billing, end user customer care, managing credit risk and maintaining all customer account information. If our service providers or VARs provide our services through dealers, these dealers will often provide such services directly to the end user. Service providers typically purchase our most basic products and services, such as mobile voice services and related satellite handsets, and offer additional services such as voice mail.voicemail. Unlike service providers, our VARs typically focus more on data applications and provide a broader array of value-added services specifically targeted to the niche markets they serve, such as IoT, maritime, aviation and government markets, where high-use customers with specialized needs are concentrated. These VARs integrate our handsets, transceivers, high-speed data devices and Short-Burst Data®, or SBD®, modems with other hardware and software to create packaged solutions for end users. Examples of these applications include cockpit voice and data solutions for use by the aviation sector and voice, data and tracking applications for industrial customers, such as Caterpillar Inc., the DoD, and other U.S. and foreign government agencies. Our service providers include satellite service providers such as Marlink SAS,AS, Applied Satellite Technology Limited and Network Innovations, as well as some of the largest telecommunications companies in the world, including Telstra Corporation Limited, KDDI Corporation and Singapore Telecommunications Limited.Limited (Singtel). Our VARs include ARINC Incorporated, Beam Communications Pty Ltd., Blue Sky Network, LLC, CaterpillarGarmin Services Inc., Garmin Ltd.International Inc., General Dynamics Corporation, Gogo Business Aviation LLC, Komatsu Limited,Ltd, Kore Telematics Inc., MetOcean Telematics Limited, Mix Telematics International (Pty) Ltd., NAL Research Corporation, OnixSat Rastreamento de Veículos Ltda. and Zunibal S.A.
We also sell our products to VAMs, who integrate our transceivers or chipsets into their proprietary hardware. These VAMs produce specialized end-user equipment, including integrated ship, vehicular and aviation communications systems, and global asset tracking devices, which they offer to end users in IoT, maritime, aviation and government markets. As with our service providers and VARs, VAMs sell their products either directly or through other distributors, including some of our service providers and VARs. Our VAMs include Applied Satellite Engineering, Inc., Beam Communications Pty Ltd., Calamp Wireless Networks Corporation, Cobham plc, Garmin Ltd.Services Inc., Gilat Satcom Ltd.Jacobs Technology, Inc., Honeywell and Quake Global, Inc.Lars Thrane A/S.
In addition to VARs and VAMs, we maintain relationships with approximately 4595 value-added developers, or VADs. We typically provide technical information to these companies on our products and services, which they then use to develop software and hardware that complements our products and services in line with the specifications of our VARs and VAMs. These products include handset docking stations, airline tracking and flight management applications and crew e-mail applications for the maritime industry. We believe that working with VADs allows us to create new platforms for our products and services and increases our market opportunity while reducing our overall research and development, marketing, and support
expenses. Our VADs include Global Marine Networks, LLC, Hirschmann AutomationAeroAntenna Technology, Inc., AnsuR Technologies AS, ASIQ Pty Ltd. Crib Gogh Ltd, Ocean and Controls,Coastal Environment Sensing Inc., Maxtena,Rockwell Collins Inc. and Two10degreestwo10degrees Limited.
We maintainuse a pricing modelwholesale rate structure for our commercial products and services with a wholesale rate structure.services. Under our distribution agreements, we charge our distributors wholesale rates for commercial products and services, subject to discount and promotional arrangements and geographic pricing. We also charge fixed monthly access fees per subscriber for some of our services. Our distributors are in turn responsible for setting their own pricing to their customers.end users. Our agreements with distributors typically have terms of one year and are automatically renewable for additional one-year terms, subject to termination rights. We believe this business model providesreduces back-office complexities and costs and allows distributors to remain focused on revenue generation, while also providing incentives for distributors to focus on selling our commercial product and service portfolio and developing additional applications. An additional benefit of this model is simplicity. This model reduces back-office complexities and costs and allows distributors to remain focused on revenue generation.
7
Government Markets
We provide mission-critical mobile satellite products and services to all military branches of the DoD as well as to other U.S. government departments and agencies. These users require voice and two-way data capability with global coverage, low latency, mobility and security and often operate in areas where no other terrestrial or wireless means of communications are available. We believe we are well-positionedwell positioned to satisfy demand from these users. Our 9575A satellite handset is the only commercial, mobile handheld satellite phone that is capable of Type I encryption accredited by the U.S. National Security Agency for Top Secret voice communications. In addition, the DoDU.S. government continues to make significant investments in a dedicated gateway that provides operational security and allows users of encrypted DoDIridium handsets to communicate securely with other U.S. government communications equipment. These investments include upgrading the gateway to take advantage of the enhanced capabilities of our network, including Iridium NEXT, including new products.Certus and other enhanced services. This U.S. government gateway is only compatible with our satellite network.
We provide airtime and airtime support to U.S. government and other authorized customers pursuant to our five-yearseven-year EMSS contract which is effective through October 21, 2018, but can be unilaterally extendedmanaged by the government for a period of six months.U.S. Space Force, which we entered into in September 2019. Under the terms of this agreement, authorized customers utilize our airtime services through the DoD’sU.S. government’s dedicated gateway. These services include unlimited global standard and secure voice, broadcast, netted, or DTCS, and unsecure voice, low and high-speed data, paging, broadcast, and DTCSselect other services for an unlimited number of DoD and other federalU.S. government subscribers. Other services may be purchased at an additional cost. The fixed-price rate for the current year of the EMSS contract is $88$106 million, per year.with increases in annual value resulting in a total contract value of $738.5 million over the seven-year term. While we sell airtime directly to the U.S. government for resale to end users, our hardware products are sold to U.S. government customers through our network of distributors, whichwho typically integrate them with other products and technologies. PursuantWe may provide other services, such as Iridium Certus, to federal acquisition regulations, the U.S. government may terminate the EMSS contract, in whole or in part, at any time. We have begun discussions with the U.S. government on a new EMSS contract, and we expect that we will be successful in renewing this agreement.under separate arrangements for an additional fee.
We also provide maintenance services for the DoDU.S. government gateway pursuant to our Gateway Maintenance and Support Services, or GMSS, contract managed by DISA.the U.S. Space Force. This agreement, which became effective September 2013, provides for a one-year base term and up to four additional one-year options, all of which have been exercised, forin April 2019, has a total contract value of the contract to us of approximately $38$60.4 million. Pursuant to federal acquisition regulations, the U.S. government may terminate theThe GMSS contract in whole or in part, at any time. In addition, it may be unilaterallyhas been extended bythrough March 31, 2024, as we negotiate a renewal of the government for a period of six months. We have begun discussions with the U.S. government on a new GMSS contract and we expect that we will be successful in renewing this agreement.
In October 2012,September 2019, we were also awarded a five-year indefinite-delivery/indefinite-quantity gateway evolution contract from DISAmanaged by the U.S. Space Force to upgradeenable ongoing innovation and enhancements for the DoD gateway and ensure its compatibility with Iridium NEXT.U.S. government gateway. This contract has a one-year base periodtotal contract value to us of $76 million. We expect to renew this agreement prior to its expiration in September 2024.
In May 2022, the SDA awarded General Dynamics Mission Systems, with Iridium as a subcontractor, the SDA contract, to establish the ground Operations and four one-year options, allIntegration (O&I) segment for Tranche 1 of which have been exercised, andthe PWSA. The SDA contract has aan estimated value of $47$324.5 million, which includes a $163 million base amount and $161.5 million in options. We expect to usreceive $202 million in revenue over the full five-year period. Currentlycourse of the DoD is working under a continuing statementcontract’s seven-year term. Revenues from the SDA contract contributed to our higher engineering and support service revenue in 2023, as well as associated expenses, compared to the prior year, and we expect that higher level of work.revenues and expenses to continue throughout the life of the SDA contract.
U.S. government services, including engineering services, accounted for approximately 24%25% of our total revenue for the year ended December 31, 2017.2023. Our reported U.S. government revenue includes airtime revenue derived from the EMSS contract and services provided through the GMSS contract, the gateway evolution contract, and other engineering and support contracts with the U.S. government. Thisgovernment, primarily the SDA contract. Pursuant to federal acquisition regulations, the U.S. government may terminate the EMSS, GMSS, gateway evolution, or SDA contracts, in whole or in part, at any time.
Our government revenue does not include airtime services purchased by U.S. or non-U.S. government agencies that are provided through our commercial gateway, which we report as commercial service revenue, or equipment purchased by government customers from third-party distributors. We are unable to determine the specific amount of U.S. government revenue derived from these commercial sources.
Lines of Business
The specialized needs of our global customers span many markets. Our system is able to offer our customers cost-effective communications solutions with true global coverage in areas unserved or underserved by existing telecommunications
infrastructure. Our mission-critical communications solutions have become an integral part of the communications and business
8
infrastructure of many of our end users. In many cases, our service is the only connectivity for these critical applications or is used to complement terrestrial communications solutions. We expect our planned 2018 introduction of Iridium Certus to impact our opportunities in each of our lines of business by providing end users an additional competitive broadband communication solution.
Our current principal vertical lines of business include land mobile, IoT, maritime, aviation, IoT, hosted payloads and other data services, and U.S. government. We report commercial voice and data service, IoT data service, commercial broadband, hosted payload and other data service, and government service revenue separately. Land mobile and aviation are the principal contributors to the revenue we report as commercial voice and data, while maritime is primarily reported in commercial broadband revenue.
Commercial Voice and Data and Commercial Broadband
We offer commercial voice and data and commercial broadband services primarily in the land mobile, maritime, and aviation sectors. We separately report commercial Iridium Certus broadband revenue with Iridium OpenPort® service revenue as commercial broadband revenue.Because there is considerable overlap in these services, we have combined our discussion of these revenue lines in this report, noting within the discussion where our broadband services contribute, particularly in maritime.
Land Mobile
We are the leading provider of mobile satellite communications services to the land mobile sector, providing handset services to areas not served or inconsistently served by existing terrestrial communications networks. In a 2017 report, Euroconsult estimated that there were approximately 645,000 active satellite handsets in the market in 2016. Mining, forestry, construction, oil and gas, utilities, heavy industry and transport companies as well as the military, public safety and disaster relief agencies constitute the largest portionare significant users of our land mobile end users. We also include salesservices. Sales of Iridium GO! and Iridium push-to-talk, or PTT services inalso contribute to the land mobile sector. We believe that demand for mobile communications devices operating outside the coverage of terrestrial networks, combined with our small, lightweight, durable handsets with truetruly global coverage, will allow us to capitalize on growth opportunities among these users.
In addition, we believe Iridium Certus broadband land mobile units are attractive in this market, as the combination of price, speeds, equipment, reliability in various weather conditions, and durability of equipment addresses a distinct market need.We also expect Iridium Certus midband products and services, such as our new Iridium GO! exec device, to be a source of revenue growth in the coming years.
Our land mobile end users utilize our satellite communications services for:
•Voice and data: Multinational corporations in various sectors use our services for business telephony, email and data transfer services, location-based services, and broadband for employees in areas inadequately served by terrestrial networks. Oil and gas and mining companies, for example, provide their personnel with our equipment solutions while surveying new drilling and mining opportunities and while conducting routine operations in remote areas that are not served by terrestrial wireless communications networks. In addition, a number of recreational, scientific and other outdoor users rely on our mobile handheld satellite phones and services for use when beyond terrestrial wireless coverage. Iridium PTT offers non-governmental organizations (NGOs), military, first responder, oil and gas, civil government and other users the ability to hold group calls using the Iridium Extreme® PTT handset or other devices developed by our VAMs and VARs using the Iridium 9523 PTT core transceiver. The Thales MissionLINK terminal, the first Iridium Certus offering in the land mobile area, allows rapid deployment and on-the-move communications, location tracking and telemetry. In 2022 and 2023, several VAMs introduced products supporting midband capabilities for land-based applications including remote monitoring, business continuity, and fleet management.
•Mobile and remote office connectivity: A variety of enterprises use our services to make and receive voice calls and to establish data, e-mail,email, internet and corporate network connections.
•Public safety and disaster relief: Relief agencies, such as FEMA, and other agencies, such as the Department of Homeland Security, use our products and services in their emergency response plans, particularly in the aftermath of natural disasters such as Hurricane Harvey, Hurricane Irma, Hurricane Mariathe California and Maui wildfires in 2023, the volcanic eruption in Tonga in 2022, Hurricanes Ian and Nicole in 2022, and earthquakes in Haiti in 2021 and the Mexican earthquake andMexico City area in places like Puerto Rico after the 2017 hurricanes.2017. These agencies generate significant demand for both our voice and data products, especially in advance of the hurricane season in North America. Further, many enterprises and governments include mobile satellite services such as ours as part of their PACE (Primary/Alternate/Contingency/Emergency) plan, to maintain communications continuity in case of terrestrial communication network outages.
9
•Public telephone infrastructure: Telecommunications service providers use our services to satisfy regulatory mandates and government expectations regarding the availability of communications services for rural populations currently not served by terrestrial infrastructure. Telstra Corporation, for example, uses our services to provide communications services in some of Australia’s most remote locations.
Maritime
We serve the commercial maritime market with a variety of products, including broadband terminals, embedded devices and handsets. This market includes merchant shipping, fishing, leisure and research vessels, and specialized watercraft. Since we introduced Iridium Certus broadband in January 2019, Iridium Certus services have accounted for an increasing portion of our revenue from this market, and we expect that trend to continue, although we still support our legacy broadband offering, Iridium OpenPort service. Our products and services targeting the maritime market typically have high average revenue per subscriber. Once one of our maritime systems is installed on a vessel, it often generates a multi-year recurring revenue stream from the customer. To take advantage of this, from time to time, we may offer promotions or rebates to accelerate new customer acquisitions and solidify this expected long-term revenue stream.
We believe Iridium Certus, which offers data speeds of up to 704 Kbps, presents a compelling communication solution for L-band users in the maritime market. Iridium Certus has been increasingly installed on oceangoing vessels as a companion to Ku-band Very Small Aperture Terminal, or VSAT, and new Non-Geostationary Orbit, or NGSO, providers, and we have seen lower usage levels of those other providers on some vessels where we had previously been used as the primary communications service. We expect additional offerings, such as the Iridium Certus 200 service, to increase the addressable market for our maritime services.
Maritime end users utilize our satellite communications services for the following:
•Business critical data applications: Ship operators use our services to exchange email and data files and to receive other information such as meteorological reports, emergency bulletins, cargo and voyage data and electronic chart updates. We believe the breadth of our Iridium Certus offerings provides attractively priced options for shipping operators and fishing fleets seeking increased functionality, as well as for yachts, work boats and other vessels for which traditional marine satellite systems have typically been costly and underperforming. In conjunction with our distributors, we also offer services that permit service providers and VARs to offer complete integrated solutions for prepaid calling, email and IP-based data communications. For example, one of our distribution partners, Marlink Inc., has been integrating Iridium Certus with its miniature Very Small Aperture Terminal, or mini-VSATSM, broadband service to provide companion connectivity when the mini-VSAT terminal is out of its coverage area or non-operational.
•Voice services: Maritime global voice services are used for both vessel operations and communications for crew welfare. Merchant shipping companies use phone cards for crew use at preferential around-the-clock flat rates.
•Vessel management and asset tracking: Shipping operators use our services to manage operations on ships and to transmit data, such as course, speed and fuel stock. Our services are commonly integrated with GPS to provide a real-time position reporting capability. Many fishing vessels are required by law to carry terminals using approved mobile satellite services for tracking purposes as well as to monitor catches and to ensure compliance with geographic fishing restrictions. European Union (EU) regulations, for example, require EU-registered fishing vessels of over 15 meters to carry terminals for the purpose of positional reporting of those vessels. Furthermore, new environmental regulations in some jurisdictions are expected to require monitoring of merchant vessels in territorial waters, which would provide an additional growth opportunity for us.
•Safety and Security applications: Ships in distress, including as a result of potential piracy, hijack or terrorist activity, rely on mobile satellite voice and data services. The Ship Security and Alert Systems, or SSAS, and Long Range Identification Tracking, or LRIT, regulations were adopted by the International Maritime Organization, or IMO, to enhance maritime security in response to the threat from terrorism and piracy. Most deep-sea passenger and cargo ships must be fitted with a device that can send an alert message containing the ship’s ID and position whenever the ship is under threat or has been compromised. In addition, the IMO and a NATO advisory group have recommended the installation of a safe room or citadel equipped with a standalone secure communication link the crew can use from inside the room to communicate with rescuing forces. Our distribution partners have developed several product solutions using our network to meet these requirements for merchant and fishing vessels.
In addition, we have been recognized by the IMO as a provider for the GMDSS. The GMDSS is a maritime service built to alert a maritime rescue coordination center of each vessel’s situation and position, information that can then be used to coordinate search and rescue efforts among ships in the area. As part of the GMDSS service, navigational and meteorological information
10
is distributed to vessels. The IMO requires all vessels flagged by signatories to the International Convention for the Safety of Life at Sea, or SOLAS, over 300 gross tons and certain passenger vessels, irrespective of size, that travel in international waters to carry distress and safety terminals that provide GMDSS services. GMDSS service using our network became available in 2020, and our partners offer maritime terminals that include GMDSS service capabilities to vessel operators.
Aviation
We are one of Thingsthe leading providers of mobile satellite communications services to the aviation sector, and we continue to see aviation as an area of potential revenue growth. Our services are increasingly used in commercial and government aviation applications, principally by business jets, corporate and government helicopter fleets, specialized general aviation fleets, such as medevac companies and fire suppression fleets, and high-end personal aircraft. Our services are also employed by commercial airline operators for flight deck voice and data link services for aircraft operational and safety communications. As a result of authorizations by the U.S. Federal Aviation Administration, or FAA, and U.S. Federal Communications Commission, or FCC, for us to provide air traffic datalink communications, commercial operators are installing avionics that use the Iridium network on the flight deck to comply with international air navigation communications requirements to operate in oceanic and remote airspace, including polar regions. Voice and data avionics platforms from our VAMs have been adopted as standard equipment and as factory options for a range of airframes in business aviation and air transport, such as Gulfstream Aerospace Corporation, Bombardier Inc., Cessna Aircraft Company, Boeing and Airbus. Avionics platforms that utilize our network are also retrofitted on thousands of corporate and commercial aircraft already in operation.
Aviation end users utilize our satellite communications services for:
•Air traffic control communications and safety applications: The International Civil Aviation Organization, or ICAO, has approved standards and recommended practices allowing us to provide Aeronautical Mobile Satellite (Route) Service, or AMS(R)S, to commercial aircraft on long-haul routes. This allows member states to evaluate and approve our services for safety communications on flights in oceanic and remote airspace. The FAA has approved Iridium for use in the Future Air Navigation Services, or FANS, including Automatic Dependent Surveillance - Contract, or ADS-C, datalink communications and Controller-Pilot Data Link Communications, or CPDLC, with air traffic control. Aircraft crew and air traffic controllers use our services for data and voice communications between the aircraft flight deck and ground-based air traffic control facilities. We are the only satellite provider capable of offering these critical flight safety applications around the entire globe, including the polar regions. We believe this particular sector of the market provides us with significant growth opportunities, as our services and applications can serve as a cost-effective alternative to systems currently in operation.
•Aviation operational communications: Aircraft crew and ground operations use our services for air-to-ground telephony and data communications. This includes the ADS-C automatic reporting of an aircraft’s position and mission-critical condition data to the ground and CPDLC for clearance and information services. We provide critical communications applications for numerous airlines and air transport customers, including Hawaiian Airlines, United Airlines, UPS, Fedex, Cathay Pacific Airways, Delta Airlines, Southwest Airlines, American Airlines, Iceland Airlines, and El Al Airlines. These operators rely on our services because other forms of communication may be unaffordable or unreliable in areas such as the polar regions. Collins Aerospace (ARINC) and SITA, the two leading providers of voice and data link communications services and applications to the commercial airline industry, integrate our products and services into their offerings.
•Aviation passenger communications: Corporate and private fleet aircraft passengers use our services for air-to-ground telephony and data communications. We believe our distributors’ small, lightweight, cost-effective solutions offer an attractive option for aircraft operators, particularly small fleet operators; for example, some operators use our services to enable small-cabin passengers to email using their own Wi-Fi-enabled mobile devices, including smartphones, without causing interference with aircraft operation. We expect that users in the corporate aviation market, and original equipment manufacturers, or OEMs, for business jets, will increase adoption of our services for in-flight passenger data communications using our network. We believe this presents a significant opportunity to increase market penetration and revenues in this market.
•Rotary and general aviation applications: The Iridium network is uniquely suited to these sectors, as we have small antenna designs that work under rotor blades and enable installation on smaller general aviation platforms. We are also a major supplier for rotary aviation applications to end users in a number of markets, including medevac, law enforcement, oil and gas, and corporate work fleets. Companies such as Air Logistics, EagleMed and Air Evac Lifeteam rely on applications from our distributors for traditional voice communications, fleet tracking and management, and real-time flight diagnostics. VARs and VAMs such as Flightcell International Limited, Garmin
11
Services Inc., Honeywell International, Inc., SkyTrac Systems Limited, and Spider Tracks Limited incorporate Iridium products and services into their applications for these markets.
•Unmanned Aerial Vehicles (UAVs): Our small antennas and system designs support a wide range of UAV platforms. In addition, our global footprint enables reliable, beyond-line-of-sight communications for these UAV platforms regardless of their operational range. We operate as the communication link for remote-piloted aircraft for uses such as package delivery, medical supply, power-line inspection, law enforcement, corporate surveying and even military applications.
We believe the benefits of Iridium Certus enhance our ability to address aviation market needs across these sectors.
Commercial IoT Data
We are one of the leading providers of satellite-based IoT services. We believe the early stage of this market continues to experience increasing penetration and its low penetration presentpresents opportunities for future growth. As with land mobile, our largest IoT users include mining, construction, oil and gas, utilities, heavy industry, maritime, forestry and transport companies, as well as the military, public safety and disaster relief agencies. We believe increasing demand for automated data collection processes from mobile and remote assets operating outside the coverage of terrestrial wireline and wireless networks, as well as the continued need to integrate the operation of such assets into enterprise management and information technology systems, will likewise increase demand for our IoT applications. For example, our IoT devices have been adopted as standard equipment and as factory options by heavy equipment manufacturers such as Caterpillar Inc., to provide telematics solutions for end users.
Our IoT services are used for:
•Personal tracking devices and location-based services: Several of our VARs, such as Garmin Services Inc., ACR Electronics, and Zoleo, Inc., market small, portable devices that provide personal tracking and data communications services to consumers and commercial end users. In addition, Iridium GO! and the Iridium Extreme handsets offer personal tracking and location-based services. These devices use IoT data services to send location information and other data to web-based portals for tracking.
•Heavy equipment monitoring:telematics: Large, global heavy equipment original equipment manufacturers, such as Caterpillar Inc., Komatsu Limited,Ltd, Hitachi Construction Machinery Co. Ltd., CNH Global N.V.Hyundai Doosan Infracore Co. LTD and AGCO Corporation,Appareo Systems LLC, use our global IoT services to monitor their off-road heavy equipment in markets such as construction, mining, agriculture and forestry.
•Fleet management: Our global coverage permits our products and services to be used to monitor the location of vehicle fleets, hours of service and engine telemetry data, as well as to conduct two-way communications with drivers around the world. Fleet management companies, such as Trimble Transportation & Logistics,I.D. Systems, Mix Telematics International (Pty) Ltd, and Zatix,Omnilink Tecnologia S/A, use our service to provide distance drivers with reliable communicationcommunications to their dispatchers and their destinations to coordinate changing business needs, and our satellite network provides continuous communications coverage while they are in transit. We expect that the need for more efficient, cost-effective and safer fleet operations, as well as the imposition of regulatory mandates related to driver safety, such as drive-time monitoring, will increase demand for our services in this area.
•Fixed-asset monitoring: Multinational corporations, such as oil-field service companies like Schlumberger Limited and ConocoPhillips Company, use our services through one of our service providers to run applications that allow remote monitoring and operation of equipment and facilities around the globe, such as oil pipelines and offshore drilling platforms.
•Asset tracking: Leveraging IoT applications developed by several of our distributors, companies use our services and related devices to track assets, including personnel, for logistics, theft-prevention and safety purposes. Companies and organizations that have fleets of vehicles use IoT solutions from Iridium distributors to improve the efficiency of their operations. For example, customers use inthinc's waySmart IoTTrimble Transportation’s solution to reduce accidents and increase vehicle uptime,provide global communication to transportation assets, and the Department of Homeland SecuritySecurity’s Office of Enforcement and Removal uses Fleet Management Solutions’ IoT solution to transmit position, direction, speed and other data for management of its vehicle fleet.
•Resource management: Our global coverage and data throughput capabilities support natural resource management applications, such as fisheries management systems. CLS and FW Telematics, twoThree of our VARs, haveVARs—Collecte Localisation Satellites (CLS), MetOcean Telematics Limited and Ground Control Technologies UK Ltd —have developed applications for the fishing industry that enable regulatory compliance of fishing practices in a number of countries around the world.
•Scientific data monitoring: The global coverage of our network supports many scientific data collection applications, such asincluding the Argo float program of the National Oceanographic and Atmospheric Administration, or NOAA, and the Global Ocean Observation project Challenger, operated by Rutgers University.University, and anti-poaching programs run by the
12
Smithsonian National Zoo & Conservation Institute, the Zoological Society of London, and Veterans Empowered to Protect African Wildlife, or VETPAW. These programs rely on our IoT services to collect scientific data from buoys and ocean gliders located throughout the world’s oceans and from wildlife habitats for monitoring and analysis. We believe the increased need for monitoring climate and environmental data associated with global climate change and human impact on the planet will increase demand for these services.
Hosted Payload and Other Data Services
Our Iridium satellites also host customer payloads. We generate revenue from these customers both from the hosted payload capacity and from data service capabilities developed by our manufacturing licensees, to be available to vessel operators.
In addition to access and usage fees in the vertical lines of business described above, we generate revenue from several ancillary services related to our core service offerings. In conjunction with Satelles, Inc., we offer Satellite Time and Location services, which helps augment GPS and provides reliable location, timing and positioning data. We provide inbound connections from the public switched telephone network, or PSTN, short message services, or SMS, subscriber identity module, or SIM, activation, customer reactivation, and other peripheral services. We also provide research and development services to the aviation sector. Our services are increasingly usedassist customers in commercial and global government aviation applications, principally by corporate jets, corporate and government helicopter fleets, specialized general aviation fleets, such as medevac companies and fire suppression fleets, and high-end personal aircraft. Our services are also employed by commercial airline operators for flight deck voice and data link services for aircraft operational and safety communications. As a result of authorizations by the FAA and U.S. Federal Communications Commissions, or FCC, for us to provide air traffic datalink communications, commercial operators are installing avionics that use the Iridium network on the flight deck to complydeveloping new technologies compatible with international air navigation communications requirements to operate in oceanic and remote airspace. Voice and data avionics platforms from our VAMs and VARs have
U.S. Government
We are one of the leading providers of mobile satellite communications services to the U.S. government, principally the DoD. We provide mobile satellite products and services to all branches of the U.S. armed forces. Our voice products are used for a variety of primary and backup communications solutions, including tactical operations, logistical, administrative, morale and welfare, and emergency communications. In addition, our products and related applications are installed on ground vehicles, ships, rotary- and fixed-wing aircraft, embedded in unattended sensors and used for command and control and situational awareness purposes. Global security concerns are among the factors driving demand for our products and services in this sector. See “—U.S.“U.S. Government Services” below for more information.
Seasonality
Our business is subject to seasonal usage changes for commercial customers, and we expect it to be affected by similar seasonality going forward. March through October are typically the peak months for commercial voice traffic and related subscriber equipment sales, given the predominance of population and outdoor activity in the northern hemisphere. U.S. government usage and commercial IoT usage have been less subject to seasonal changes.
Services and Products
At December 31, 2017,2023, we had approximately 969,0002,279,000 billable subscribers worldwide. Our principal services are mobile satellite services, including mobile voice and data services, IoT services, hosted payload and high-speedother data services and engineering services. Sales of our commercial services collectively accounted for approximately 59%62% of our total revenue for the year ended December 31, 2017.2023. We also sell related voice and data equipment to our customers, which accounted for approximately 17%13% of our total revenue for the year ended December 31, 2017.2023. In addition, we offer services to U.S. government customers, including the DoD. U.S. government services, including engineering services, accounted for approximately 24%25% of our total revenue for the year ended December 31, 2017.2023.
Commercial Services
Postpaid Mobile Voice and Data Satellite Communications Services
We sell our mobile voice and data services to service providers and VARs who in turn offer such services to end users, either directly or indirectly through dealers, using various packaged solutions such as monthlyseasonal or annual plans with differing price
13
levels that vary depending upon expected usage. In exchange for these services, we typically charge service providers and VARs a monthly access fee per subscriber, as well as usage fees for airtime resources consumed by their respective subscribers.
Prepaid Mobile Voice Satellite Communications Services
We also offer mobile voice services to service providers and VARs through prepaid plans. Service providers and VARs pay us in advance for defined blocks of airtime minutes with expiration periods in various configurations, generally ranging from 30 days to two years, but which can be extended by the purchase of additional e-vouchers up to a maximum of three or four years. These services are then generally sold to subscribers in the form of prepaid e-vouchers and scratch cards and e-vouchers that enable subscribers to use our services on a per-minute basis. Unused minutes generally are forfeited on the applicable expiration date. We believe service providers and VARs are drawn to these services because they enable greater cost control by eliminating the need for monthly billings and reducing collection costs, and can be sold in countries where credit may not be readily available for end users. Our distributors often offer our prepaid voice services through fixed devices to subscribers in rural villages, at remote industrial, commercial and residential sites, and on ships at sea, among other places. Fixed voice satellite communications services are in many cases an attractive alternative to handheld mobile satellite communications services in situations where multiple users will access the service within a defined geographic area and terrestrial wireline or wireless service is not available. Fixed phones, for example, can be configured as pay phones that accept prepaid scratch cards and can be installed at a central location, for example in a rural village or on a maritime vessel.
Iridium PTT Service
Building on the foundation of DTCS technology, which provides regional tactical radio service to DoDU.S. government users, our Iridium PTT service enables regional PTT calls, or global PTT calls among users on the same talkgroup in up to 10 customer-defined, geographically disparate locations around the world, providing a fast and robust communication experience. Iridium PTT can be used via the Iridium Extreme PTT satellite phone or the Iridium 9523 PTT core transceiver, which gives our VAMs the ability to build Iridium PTT into existing land mobile, maritime and aviation communications platforms. For example, Icom Inc. of Japan offers a purpose-built satellite PTT radio handheld unit for use on the Iridium network. We and our partners are also developing interoperability solutions for existing terrestrial Land Mobile Radioland mobile radio systems, which will further extend the utility of the service.
Internet of Things Services
Our IoT services are designed to address the market need for a small and cost-effective solution for sending and receiving data, such as location, from fixed and mobile assets in remote locations to a central monitoring station. This service operatesMost of our IoT services operate through a two-way SBD transmission or circuit-switched data, between our network and a transceiver, which may be located, for example, on a container in transit or a buoy monitoring oceanographic conditions. The small size of our devices and their low-cost, omnidirectional antennas make them attractive for use in applications such as tracking asset shipments and monitoring unattended remote assets, including oil and gas assets, as well as vehicle tracking and mobile security. We sell our IoT services to our distributors, who incorporate them and in turn provide a solution package to commercial and government customers. Increasingly, our IoT transceivers are being built into products for consumer markets, such as personal location devices that provide two-way messaging. In the future, we expect our IoT partners to develop new offerings with increased capabilities based on our Iridium Certus 9770 transceiver and other future midband devices we plan to create that have optimized size, speed, power, and antenna characteristics for various applications. As with our mobile voice and data offerings, we typically charge service providers and VARs a monthly access fee per subscriber as well as usage fees for data used by their respective subscribers.
14
We also continue to offer our legacy Iridium OpenPort service, which provides maritime, aviation and terrestrial users speeds of up to 134 Kbps and three independent voice lines. For this service, we typically charge service providers monthly access fees and usage fees we generate revenue from several ancillaryfor airtime consumed by the respective subscribers for voice and data communications. We have discontinued the manufacture of the Iridium Pilot platform that supports Iridium OpenPort services, relatedwith those customers often upgrading to our core service offerings. In conjunction with Satelles, Inc., we offer Satellite Timing and Location services which helps augment GPS and provides reliable location, timing and positioning data. We provide inbound connections from the public switched telephone network, or PSTN, short message services, or SMS, subscriber identity module, or SIM, activation, customer reactivation, and other peripheral services. We also provide research and development services to assist customers in developing new technologies compatible with our system, which we may leverage for use in service and product offerings in the future. We charge our distributors fees for these services.Iridium Certus technology.
U.S. Government Services
We provide U.S. government customers bulk access to our services, including voice, netted voice, data, messaging and paging services, as well as maintenance services for the DoD’sU.S. government’s dedicated gateway. We provide airtime to U.S. government subscribers through DoD’sthe U.S. government’s gateway under the EMSS contract, which is a fixed-price contract covering voice, low-speed data, paging, broadcast and DTCS services. Additional services, such as broadband capabilities utilizing Iridium Certus technology, wouldmay be provided at an additional fee. To comply with U.S. government requirements, we ensure handsets sold for use by the U.S. government are manufactured in the United States. U.S. government customers procure our voice and data devices through specific, approved distributors from our network of VARsservice providers and service providers.VARs. Our VARs and VAMs typically integrate our products with other products, which they then offer to U.S. government customers as customized products. They areproducts, typically provisioned then by DISA.the U.S. Space Force. Our voice and data solutions for the U.S. government include:
•personnel tracking devices;
•asset tracking devices for equipment, vehicles and aircraft;
•beyond-line-of-sight aircraft communications applications;
•specialized communications solutions for high-value individuals; and
•specialized, secure, mobile communications and data devices for the military and intelligence community,other government agencies, such as secure satellite handsets with U.S. National Security Agency Type I encryption capability.
With funding support from the DoD,U.S. government, we continue to invest in research and development to develop new products and applications for use by all branches of the U.S. armed forces. For example, in conjunction with DISA,the U.S. Space Force, we and select distribution partners offer DTCS, which provides critical, secure, PTT, netted communications using lightweight, handheld tactical radios, or add-ons to existing government tactical radios. In addition, in 2017 we introducedoffer a next-generation secure satellite phone based on the Iridium Extreme, which we have also developed with funding support from the DoDU.S. government and which washas been accredited by the National Security Agency, or NSA, to provide Type-1 encryption, enabling communications up to Top Secret from anywhere in the world.
Our Products
We offer a broad array of voice and data products for customers that work worldwide. In most cases, our devices or an antenna must be located outside and within view of a satellite to be able to access our network.
Satellite Handsets and Iridium GO!
Our principal handset offerings are the Iridium 9555 and Iridium Extreme satellite handsets, which are similar in functionality to ordinary cellular phones but with the solid, durable feel that satellite phone users demand.phones. We believe our reputation forthe industrial-strength design of these products is critical for customers, many of whom are located in the most inhospitable spots on the planet and require rugged and reliable communications equipment.
•Iridium 9555. The Iridium 9555 provides voice, SMS and narrowband data connectivity. This model introduced several features including a larger, brightergrayscale screen, improved SMS and e-mail capabilities,capability, an integrated antenna and a speakerphone. The Iridium 9555 weighs 9.4 ounces and offers up to 3.1 hours of talk time. The Iridium 9555 has an industrial feel with a rugged housing to protect its sophisticated satellite transceiver.
•Iridium Extreme. The Iridium Extreme adds to the Iridium 9555’s capabilities by providing a rugged exterior that meets DoD Military Standard 810F for durability, a dedicated, two-way emergency SOS button, and fully integrated GPS and location-based services. These extra features are provided in a handset that is even smaller than the Iridium 9555, weighing 8.7 ounces and offering up to four hours of talk time. An emergency response service provided by GEOS Travel Safety Group, or GEOS, is included with the purchase of the phone and airtime usage. The two-way emergency SOS button initiates a phonevoice call and an emergency text message via SMS to GEOS, which then coordinates with local emergency responders.
15
•Iridium Extreme PTT.We also offer theThe Iridium Extreme PTT which enhances the Iridium Extreme with an intelligently designed push-to-talk mode, expanded loudspeaker,speakerphone, reinforced PTT button, and extended capacity battery. The user interface provides access to multiple communication services, including voice calling, SMS and SOS, in phone mode and PTT mode, allowing users to connect to a talkgroup located in up to 10 customer-defined geographic regions worldwide. The Iridium Extreme PTT weighs 9.5 ounces and offers up to 6.5 hours of talk time in phone modefor voice calls and five hours of talk time in PTT mode.while using PTT.
•Iridium GO!
•Iridium GO! exec. Iridium GO! exec, a premium version of the Iridium GO!, is powered by our Iridium Certus 100 service and provides IP connectivity to the Internet and up to two high-quality voice lines. Data speeds are up to 40 times faster for downloads and 10 times faster for uploads compared to the Iridium GO!. The Iridium GO! exec has a sleek design with built-in color touch screen and speakerphone for mobile office connectivity and Wi-Fi for access from smartphones or laptops within a range of up to 100 feet. The built-in battery provides up to 24 hours of standby and up to 6 hours of use.
We expect these devices to help us maintain our competitive position as premium offerings in the market due to their capabilities, mobility, reliability and global coverage. In addition to these devices, we offer variants of the Iridium 9555 satellite phone and the Iridium Extreme satellite phone that are qualified for sale to U.S. government customers.
Broadband Data Devices
Iridium Certus terminals are specifically designed for the maritime, aviation, land mobile or government markets and offer a variety of enhanced data speeds and antenna types. Iridium Certus terminals provide enterprise-grade broadband data and high-quality voice capabilities that can be used on a global basis. Iridium Certus is designed to support a variety of cost points, antenna types and data speeds ranging from midband to broadband up to 704 Kbps. We have licensed the Iridium Certus technology to a group of VAMs who have introduced products for the maritime and land mobile markets and are developing additional products for those markets as well as the aviation and government markets.
Iridium Certus is designed for maritime operational and safety services, combining the benefits of L-band with broadband and truly global coverage. Iridium Certus terminals offer reliable connectivity for maritime customers whether used as a standalone service or as a companion to VSAT services. Our principal end users for Iridium Certus in the maritime market are merchant shipping, commercial fishing, large leisure vessels, and work boats. The initial terminals in this market were the Cobham Sailor 4300 and Thales VesseLINK. In addition, Intellian, a Korean maritime terminal manufacturer, introduced an Iridium Certus terminal to the market in 2020, and Thales introduced its VesseLINK 200 terminal, which uses our Iridium Certus 200 service, in 2021. Additional Iridium Certus 200 terminals were launched in 2023, including the Lars Thrane LT-4200, and our partners continue to develop additional products.
In aviation, Iridium Certus delivers critical safety services and in-flight communications. Our principal targeted end users for Iridium Certus in the aviation market include commercial, corporate and government users, general aviation, rotorcraft and unmanned aircraft. Terminals certified in this sector include the Blue Sky Networks SkyLink 7100, Guardian Mobility G6, Atmosphere Planet 9770, Honeywell Aspire 350, Collins IRT NX, and Skytrac SDL-350. A number of other VAMs have been licensed to create aviation terminals using Iridium Certus services, and we expect that additional Iridium Certus aviation products will become commercially available in 2024.
In the land mobile market, enterprises, governments, and individuals that want to maintain mobile IP and telephony connectivity utilize Iridium Certus for their operations while in remote areas without having to deploy ground-based infrastructure or expensive terminals. Iridium Certus devices may be integrated with internet, cellular, land mobile radio, and location-based applications targeted to specific customer segments.keep users connected, offering global push-to-talk, situational awareness, email, messaging and voice-over-IP. Our principal end users for Iridium Certus in the land mobile market are military users, rail, first responders, non-governmental organizations, oil and gas users, and remote fleets. Iridium offers Iridium Certus 100, Iridium Certus 200 and
16
Iridium Certus 700 services, supporting a portfolio of broadband and midband terminals through our partners to provide a range of capabilities at various price points. Terminals that are approved for the land mobile market include the Thales MissionLINK 700 and 200, BSN SkyLink 5100, NAL Research Quicksilver, and McQ CONNECT.
In the government market, Iridium Certus terminals provide beyond-line-of-sight communications critical to mission
success. The initial terminal in this market is the Thales MissionLINK, with additional terminals expected in the future.
Our legacy broadband terminal, the Iridium Pilot, provides up to three independent voice lines and an internet connection for data communications of up to 134 Kbps, using our Iridium OpenPort service.We have discontinued the manufacture of the Iridium Pilot terminal but still provide the Iridium OpenPort service. With the introduction of the more powerful Iridium Certus terminals, we expect our distributors to focus on selling Iridium Certus and to eventually upgrade ships with Iridium Pilot to Iridium Certus technology.
Voice and Data Modems
We also offer a combined voice transceiver and data modem, which our distributorsVAMs integrate into a variety of communications solutions that are deployed in different applications around the world. Our principal offering in this spacecategory is the Iridium Core 9523 L-BandL-band transceiver, which utilizes the transceiver core of our Iridium Extreme satellite handset. The Iridium Core 9523 providesis a small voice and data module that can be integrated with other components and allows our VAMs to create a modem tailored for typical VAM applications as well as specific applications,design and build products, such as a dual-mode terrestrial radio and satellite phone or IoT applications that require more efficient data throughput through circuit switchedvia circuit-switched data transmission. The Iridium 9523 PTT adds PTT capability, allowing development partners to design and build land mobile, fixed, aviation and maritime devices with Iridium PTT.PTT service. We also offer the 9522B L-BandIridium Certus 9770 transceiver, which utilizes the same transceiver core that is used inprovides Iridium Certus 100 service to our Iridium 9555 satellite handsetGO! exec device and several devices offered by our value-added partners. We expect our partners to provide voicecontinue to develop new products based on our Iridium Certus 9770 transceiver and circuit-switched data services.other optimized midband devices. Our principal customers for our L-BandL-band transceivers are VAMs and VARs, who integrate them into specialized devices that access our network.
Internet of Things Data Devices
Our principal IoT devices are the Iridium 9602 and 9603 full-duplex SBD transceivers. The Iridium 9602 is a small data device with two-way transmission, capable of sending packet data to and from any point in the world with low latency. The principal customers for our Iridium 9602 data modems are VARs and VAMs, who embed the device into their tracking, sensor, and data applications and systems, such as asset tracking systems. Our partners often combine the Iridium 9602 with a GPS receiver to provide location information to customer applications. We also offer the Iridium 9603, an even smaller transceiver that is functionally identical to the Iridium 9602. In addition, a number of VARs and VAMs include a cellular modem as part of their Iridium applications to provide low-cost cellular data transmission when available. These types of multimode applications are adopted by end users who require the ability to regularly transfer data but operate in areas with inconsistent cellular coverage. We provide gap-filler coverage for these applications, allowing users to operate anywhere on the globe. In addition, several partners now offer products with Iridium Certus 9770 transceivers supporting Iridium Certus 100 service for IoT, including the SkyLink product from Blue Sky Networks and the RockREMOTE from Ground Control.
Iridium also offers a suite of Iridium Edge® finished IoT products designed to lower the barrier to adoption and speed time to market for customer applications. The Iridium Edge device is an off-the-shelf, environmentally sealed, rugged device that complements existing cellular solutions to create dual-mode connectivity for the most remote and inaccessible areas of the world, reducing the cost and complications associated with hardware development, manufacture and certification of satellite-specific terminals. We also offer Iridium Edge Pro, a standalone IoT device that offers real-time GPS tracking capabilities, with a flexible programming platform that allows partners to create and run their own custom-made applications, and Iridium Edge Solar, a standalone, programmable, solar-powered device that offers real-time GPS tracking in a self-charging, low-maintenance unit with over-the-air configuration that allows partners to create distinct tracking applications.
We also offer Iridium Burst,®, our one-to-many global data broadcast service, which enables enterprises to send data to an unlimited number of devices anywhere in the world, even inside buildings, vehicles or aircraft, and Iridium Edge®, an off-the-shelf, environmentally sealed, rugged device that complements existing cellular solutions to create dual-mode connectivity for the most remote and inaccessible areas of the world. Iridium Edge reduces the cost and complications associated with hardwareaircraft.
Device Development and Manufacturing
We contract with Cambridge Consulting Ltd. and other suppliers to develop all of our devices, and with Benchmark Electronics Inc., or Benchmark, to manufacture most of our devices in facilitiesa facility in Thailand, and with Verigon to manufacture a portion of our
17
devices in the U.S.United States. We also utilize other suppliers, some of which are the sole source, to manufacture some of the component parts of our devices. Pursuant to our contractcontracts with Benchmark and Verigon, we may be required to purchase excess materials at cost plus a contractual markup if the materials are not used in production within the periods specified in the agreement.respective agreements. Benchmark and Verigon generally repurchasesrepurchase the materials from us at the same price we paid, as required for the production of the devices. Our agreementagreements with Benchmark isand Verigon are automatically renewable for additional one-year terms unless terminated by either party.
We generally provide our distributors with a warranty on subscriber equipment for a period ranging from one year to five years18 months from the date of activation, depending on the product. We also utilize other suppliers, some of which are the sole source, to manufacture some of the component parts of our devices.
In addition to our principal products, we also offer a selection of accessories for our devices, including extended-life batteries, holsters, earbud headphones, portable auxiliary antennas, antenna adaptors, USB data cables and charging units, among others.units. We purchase these products from several third-party suppliers either pursuant to contractual agreements or off the shelf at market prices.
Domestic and Foreign Revenue
We supply services and products to customers in a number of foreign countries. We allocate revenue geographically based on where we invoice our distributors, whom we bill for mobile satellite services and related equipment sales, and not according to the location of the end user. These distributors sell services directly or indirectly to end users, who may be located elsewhere. It is not feasible for us to determine the geographical distribution of revenue from each end user, as we do not contract directly with them. Substantially all of our revenue is invoiced in U.S. dollars. The table below sets forth the percentage of our revenue from the United States and outside of the United States for the last three years. No single country outside the United States represented more than 10% of our revenue for any of the periods indicated.
| Year Ended December 31, | |||||||||||||||||
| 2023 | 2022 | 2021 | |||||||||||||||
| United States | 55 | % | 52 | % | 54 | % | |||||||||||
| Other Countries | 45 | % | 48 | % | 46 | % | |||||||||||
For more information about our revenue from sales to foreign and domestic customers, see Note 15 to our consolidated financial statements included in this annual report.
Traffic Originating Outside the United States
Most of our voice and data traffic originates outside the United States. The table below sets forth the percentage of our commercial voice and data traffic originating outside the United States for the last three years.
| Year Ended December 31, | |||||||||||||||||
| 2023 | 2022 | 2021 | |||||||||||||||
| Commercial voice traffic (minutes) | 91 | % | 90 | % | 90 | % | |||||||||||
| Commercial data traffic (kilobytes) | 96 | % | 95 | % | 97 | % | |||||||||||
Our Network
Our satellite network has an architecture of 66 operational LEO satellites in six orbital planes of eleven vehicles, each in nearly circular polar orbits, in addition to in-orbit spares and related ground infrastructure. Our operational satellites orbit at an altitude of approximately 483 miles (778 kilometers) above the earth and travel at approximately 16,689 miles per hour, resulting in a complete orbit of the earth approximately every 100 minutes. The design of our constellation ensures that generally at least one satellite is visible to subscribers from any point on the earth’s surface at any given time. While our constellation offers true global coverage, most of our devices and antennas must have a direct line of sight to a satellite to transmit or receive a signal, and services on those devices are not available in locations where a satellite signal cannot be transmitted or received, which for some devices includes inside a building.
Our constellation uses radio frequency crosslinks between our satellites, which eliminates the need for local ground infrastructure. These crosslinks enable each satellite to communicate with up to four other satellites in space, two in the same orbital plane and two in adjacent planes. Our traffic is routed on a preplanned route between satellites to a predetermined
18
satellite that is in contact with one of the Iridium teleport network, or TPN, locations. The TPN sites then transmit and receive the traffic to and from the gateways, which in turn provide the interface to terrestrial-based networks such as the PSTN, a public land mobile network, or PLMN, and the internet. The use of a TPN allows grounding traffic at multiple locations within our ground network infrastructure. This and other design elements provide flexibility that allows for rapid reconfiguration of grounding traffic from the satellites in the event of a space, antenna or ground routing anomaly and results in greater reliability of our network. The design of our space and ground control system also facilitates the real-time monitoring and management of the satellite constellation and facilitates service upgrades via software enhancements.
We believe our interlinked satellite infrastructure provides several advantages over low-earth-orbiting “bent-pipe” satellite networks that rely on multiple terrestrial gateways, such as Globalstar’s and ORBCOMM’s networks. We have the only satellite network with true global coverage using weather-resilient L-band spectrum, and our constellation is less vulnerable to single points of failure, as traffic can be routed around any one satellite problem to complete the communications path to the ground. In addition, the small number of ground stations increases the security of our constellation, a factor that makes our network particularly attractive to government institutions and large enterprises. The low orbit of our constellation also allows our network to operate with low latency and with smaller antennas due to the proximity of our satellites to the earth.
Our constellation is designed to provide significant coverage overlap for mitigation of service gaps from individual satellite outages, particularly at higher northern and southern latitudes. Each satellite in our constellation was designed with a high degree of on-board subsystem robustness, an on-board fault detection system, and isolation and recovery capabilities for safe and quick risk mitigation. Our ability to reposition our satellites provides us with operating flexibility and enhances our ability to maintain a commercially acceptable level of service. If a satellite should fail or become unusable, in most cases we will be able to reposition one of our in-orbit spare satellites to take over its functions within days, with minimal impact on our services.
We do not currently hold any active in-orbit insurance policies covering losses from satellite failures, and we do not expect to obtain in-orbit insurance covering losses from satellite failures or other operational problems affecting our constellation.
Our primary commercial gateway is located in Tempe, Arizona, with a second dedicated commercial gateway located in Russia. A gateway processes and terminates calls and data and generates and controls user information pertaining to registered users, such as geo-location and call detail records. The U.S. government owns and operates a dedicated gateway for U.S. government users, which provides an interface between voice and data devices and the Defense Information Systems Network and other terrestrial infrastructure, providing U.S. government users with secure communications capabilities. Our network has multiple antennas located at the TPN facilities, including the Tempe gateway, that communicate with our satellites and pass calls and data between the gateway and the satellites as the satellites pass above our antennas, thereby connecting signals from the terminals of end users to our gateways. This system, together with our satellite crosslinks, enables communications that are not dependent on a ground station in the region where the end user is using our services.
We operate our satellite constellation from our satellite network operations center, or SNOC, in Leesburg, Virginia. This facility manages the performance and status of each of our satellites, directing traffic routing through the network and controlling the formation of coverage areas by the satellites’ main mission antennas. We also operate TPN facilities in Fairbanks, Alaska and Tempe, Arizona in the United States, in Svalbard, Norway, and in Punta Arenas, Chile that perform telemetry, tracking and control functions and route commercial services.
From time to time, individual satellites in our constellation experience operating problems that may result in a satellite outage, but due to the overlapping coverage within our constellation and the dynamic nature of our LEO system, the individual satellite outages typically do not negatively affect our customers’ use of our system for a prolonged period. In addition, most system processing related to our service is performed using software on board each satellite instead of on the ground. We believe this provides us with significant flexibility and contributes to the longevity of the constellation by enabling engineers to develop additional functionality and software-based solutions to occasional faults and anomalies in the system.
We continually monitor and upgrade our gateway and TPN facilities as necessary and also maintain an inventory of spare parts. When we do not have necessary spares in inventory or our spares become obsolete, we may rely on third parties to develop necessary parts.
We hold a space station license for the launch and operation of our constellation, which expires February 23, 2032. Our U.S. gateway earth station and the U.S. government customer and commercial subscriber earth station licenses expire between February 2036 and March 2037. We must file renewal applications for earth station licenses between 30 and 90 days prior to expiration.
19
The Iridium constellation also hosts the Aireon system. The Aireon system was developed by Aireon LLC, which we formed in 2011 and which received subsequent investments from several ANSPs, to provide a global air traffic surveillance service through a series of ADS-B receivers on our satellites. Aireon has contracted to offer this service to ANSPs, which use the service to provide improved air traffic control services over the oceans, as well as polar and remote regions. Aireon also markets its data and services to airlines and other commercial users.
Under our agreements with Aireon, Aireon will pay us fees of $200.0 million to host the ADS-B receivers on our satellites, of which they have paid us $94.5 million as of December 31, 2023. These fees are recognized over the estimated useful life of the satellites. Additionally, Aireon pays power and data services fees of approximately $23.5 million per year in the aggregate for the delivery of the air traffic surveillance data over the Iridium system.
While the Aireon ADS-B receivers are the primary hosted payload on our satellites, L3Harris utilizes a portion of the remaining space for its customers’ payloads. This agreement resulted in an additional $74.1 million in hosting and data service fees to us, all of which has been paid.
Regulatory Matters
Our Spectrum
We hold licenses to use 8.725 MHz of contiguous spectrum in the L-Band,L-band, which operates at 1.6 GHz, and allows for two-way communication between our devices and our satellites. In addition, we are authorized to use 200 MHz of K-Band (23 GHz) spectrum for satellite-to-satellite communications, known as inter-satellite links, and 400 MHz of Ka-Band spectrum (19.4 GHz to 19.6 GHz and 29.1 GHz to 29.3 GHz) for two-way communication between our satellites and our gateways,ground stations, known as feeder links. Our license for the launch and operation of our Iridium NEXT constellationWe are also authorizes ourauthorized to use of the 156.0125-162.0375 MHz spectrum for reception of Automatic Identification System transmissions from maritime vessels and the 1087.7-1092.3 MHz spectrum for reception of Automatic Dependent Surveillance-Broadcast transmissions from aircraft. Access to this spectrum enables us to design satellites, network and terrestrial infrastructure enhancements cost effectively because each product and service can be deployed and sold worldwide. Our products and services are offered in over 100 countries, and we and our distributors continue to seek authorizations in additional countries.
Our use of spectrum is globally coordinated and recorded by, and subject to the frequency rules and regulations of, the International Telecommunication Union, or ITU. The ITU is the United Nations organization responsible for worldwide co-operation in the telecommunications sector. In order to protect satellite systems from harmful radio frequency interference from other satellite systems, the ITU maintains a Master International Frequency Register of radio frequency assignments. Each ITU administration is required to give notice of, coordinate and record its proposed use of radio frequency assignments with the ITU’s Radiocommunication Bureau. The coordination negotiations are conducted by the national administrations with the assistance of satellite operators. When the coordination process is completed, the ITU formally notifies all proposed users of frequencies and orbital locations in order to protect the recorded assignments from subsequent nonconforming or interfering uses by member states of the ITU. Only member states have full standing within this inter-governmental organization. Filings to the ITU for our first-generation constellation were made on our behalf by the United States.
The ITU also controls the assignment of country codes used for placing telephone calls between different countries. Our network has been assigned the 8816 and 8817 country codes and uses these numbers for calling and communications between terminals.
Constellation De-Orbiting Obligations
| Year Ended December 31, | ||||||||
| 2017 | 2016 | 2015 | ||||||
| United States | 51 | % | 52 | % | 50 | % | ||
| Canada | 10 | % | 10 | % | 10 | % | ||
| United Kingdom | 10 | % | 11 | % | 11 | % | ||
Other Countries (1) | 29 | % | 27 | % | 29 | % | ||
| Year Ended December 31, | ||||||||
| 2017 | 2016 | 2015 | ||||||
| Commercial voice traffic (minutes) | 88 | % | 88 | % | 88 | % | ||
| Commercial data traffic (kilobytes) | 75 | % | 72 | % | 67 | % | ||
We have begun launchingcertain de-orbit obligations under our Iridium NEXT system, and through the full deployment of Iridium NEXT, which we expect to occur during 2018, we will operate a hybrid constellation. In addition, during 2017 we began de-orbiting someFCC licenses. All of our first-generationsecond-generation satellites on an individual basis after they were replaced by Iridium NEXT vehicles, although as permitted by our FCC license, some first-generation satellites will remain in orbit as spares until the completion of the Iridium NEXT deployment. In addition, we also have some Iridium NEXT satellites, which we refer to as “drifters,” which move from their initial orbital plane after launch to their designated operational orbital plane over a period of months.
20
In June 2022, we entered into a Second Amendedsubscription agreement with Aireon Holdings and Restated Limited Liability Company Agreement, or the Aireon LLC Agreement, with NAV CANADA; Enav S.p.A., the ANSP of Italy; Naviair, the ANSP of Denmark; Irish Aviation Authority Limited, the ANSP of Ireland; and wholly owned subsidiaries of NAV CANADA, Enav and Naviair.
The Aireon Holdings LLC Agreement provides for Aireon Holdings to be managed by a board of directors consisting of 11 members. Currently, Iridium Satellite maymembers, of which we have the right to nominate two directors, NAV CANADA may nominate six directors, Enav may nominate one director and the other two investors may together nominate one director.directors. The chief executive officer of Aireon serves as the eleventh director. The AireonHoldings LLC Agreement also provides the minority-interestminority holders, including us, with several protective provisions. We account for our investment in Aireon Holdings in our consolidated financial statements as an equity method investment.
Competition
The mobile satellite services industry is highly competitive, but has significant barriers to entry, including the cost and difficulty associated with obtaining spectrum licenses and successfully building and launching a satellite network. In addition to cost, there is a significant amount of lead-time associated with obtaining the required licenses, building and launching the satellite constellation, and deploying the ground network technology. Wewe currently face substantial competition from other service providers that offer a range of mobile and fixed communications options. Currently, our principal mobile satellite services competitors are Inmarsat,Viasat, Globalstar, ORBCOMM, and Thuraya Telecommunications Co., or Thuraya, and ORBCOMM.Thuraya. We compete primarily on the basis of coverage, quality, mobility and pricing of services and products.
Viasat, following its acquisition of Inmarsat, owns and operates a fleet of GEO satellites. Unlike LEO satellites, GEO satellites orbit the earth at approximately 22,300 miles above the equator. GEO operatorssystems require substantially larger and more expensive antennas, and typically have higher transmission delays than LEO operators.systems. Due to its GEO system, Inmarsat’sViasat’s coverage area extends and covers most bodies of water except for a majority of the polar regions. InmarsatViasat is the leading provider of satellite communications services to the maritime sector. InmarsatViasat also offers land-based and aviation communications services.
Globalstar owns and operates a fleet of LEO satellites. Globalstar’s service is available only on a multi-regional basis as a result of its “bent pipe” architecture, which requires that voice and data transmissions be routed from satellites immediately to nearby ground stations. This design requires the use of multiple ground stations, which are impractical in extreme latitudes or over oceans. Unlike Inmarsat and us, Globalstar sells a higher percentage of its products and services directly to end users. Globalstar completed its most recent launch campaign in February 2013. It has currently arranged to replace only 24 of its original 48 satellites.
ORBCOMM also provides commercial services using a fleet of LEO satellites. Like Globalstar, ORBCOMM’s network also has a “bent pipe” architecture, which limitsconstrains its real-time coverage area. ORBCOMM’s principal focus is low-cost data and IoT services, where it directly competes with our IoT offerings. Because a ground station may not be within view of a satellite, ORBCOMM’s services may have a significant amount of latency, which may limit their use in some mission-critical applications. ItORBCOMM does not offer voice service or high-speed data services.
We also compete with regional mobile satellite communications services in several geographic markets. In these cases, the majority of our competitors’ customers only require regional, not global, mobile voice and data services, so our competitors may present a viable alternative to our services. All of these regional competitors operate or plan to operate GEO satellites. Our regional mobile satellite services competitors currently include Thuraya, principally in Europe, the Middle East, Africa, Australia and several countries in Asia.
In addition, there are a number of more recent entrants to the mobile satellite services industry, including Starlink and OneWeb, with varying constellation designs and business models. These newer entrants are primarily focused on commodity broadband services, where Iridium often operates as a companion service. We also see some of these companies investing in direct-to-device services that in the future may increase competition for products Iridium is offering or plans to offer.
While we view our services as largely complementary to terrestrial wireline and wireless communications networks, we also compete with them indirectly. We provide service in areas that are inadequately covered by these ground systems. To the extent that terrestrial communications companies invest in underdeveloped areas, we will face increased competition in those areas. We believe that local telephone companies currently are reluctant to invest in new switches, landlines and cellular towers to
21
expand their networks in rural and remote areas due to high costs and limited usage. Many of the underdeveloped areas are sparsely populated, making it difficult to generate the necessary returns on the capital expenditures required to build terrestrial wireless networks in those areas. We believe that our solutions offer a cost-effective and reliable alternative to terrestrial-based wireline and wireless systems in these remote regions.
Research and Development
Our research and development efforts have focused on the development, design and testing of our new constellation and new products, and services, such as Iridium Certus, Iridium Messaging Transport, Iridium Edge, Iridium PTT, Iridium Burst, Iridium Pilot Land StationGO!, Iridium GO! exec, transceiver modules and Iridium GO!, and the planning and development of the Iridium NEXT constellation, ground infrastructure and chipsets, as well as new products and services to be offered on Iridium NEXT, such as Iridium Certus.chipsets. We also develop productnetwork and serviceproduct enhancements and new applications for our existing products and services.products. Our research and development expenses were $15.2$20.3 million, $16.1$16.2 million and $16.1$11.9 million for the years ended December 31, 2017, 20162023, 2022, and 2015,2021, respectively.
Employees and Human Capital Resources
Employees
As of December 31, 2017,2023, we had 414760 full-time employees and 6six part-time employees, none of whom are subject to any collective bargaining agreement. We consider our employee relations to be good.
Human Capital Resources
Our company is made up of varied and creative teams, and we are committed to creating an innovative and inclusive environment where our employees are proud to work. We foster this goal by focusing on development, employee wellness and social responsibility. This starts with an onboarding process that introduces our core mission and values, policies and procedures, performance review process and background about our company. We support our employees in their career development by providing on-the-job training and education reimbursement to help employees maintain or enhance skills in their current position or help with acquiring new skills to prepare for future opportunities. To measure employee engagement, we conduct an annual survey to assess and track retention and satisfaction. We take responses from our employees seriously and use them to inform specific strategies every year tailored to both the entire company as well as specific teams. In addition to performing benchmarking, we also conduct an annual survey to understand what benefits are important to our employees and ensure that we are offering a competitive total rewards package.
We offer various ways for our employees to stay engaged, including participation in Employee Resource Groups, or ERGs, volunteer activities through the Iridium Cares Program, and other outreach efforts that cover a range of topics and interests.
In 2023, we launched our first cohort of the Iridium Orbit Program. Participants in this program embed with three engineering teams over 18 months, completing six-month rotations in operations, engineering, and customer care across our company in Arizona and Virginia. This program aims to increase cross-functional knowledge and ensure new hires feel engaged and supported in their new roles.
We formed our Diversity and Inclusion Advisory Council in 2020, and it has identified four objectives to make our Iridium community, and the world, a more diverse and inclusive place:
•Helping to recruit and retain team members with diverse backgrounds and experiences;
•Fostering participation in activities supporting diversity and inclusion within our communities;
•Training, educating, and communicating with team members on the importance of diversity and inclusion to our culture and viability; and
•Periodically assessing our continual growth toward greater diversity and inclusion.
In 2022, we introduced the Uplinks program, which aims to embrace new ideas and the diversity of thinking across our teams. This popular program pairs employees from different generations to encourage intra-company conversations and promote collaboration. We currently have four working groups to put these objectives into practice. Each working group has its own goals, stakeholder relationships, strategy and executive sponsorship.
22
Intellectual Property
At December 31, 2017,2023, we held 2138 U.S. patents and one foreign patent. These patents coverrelate to several aspects of our satellite system, oursystems, global network, our communicationnetworks, communications services, and ourcommunications devices.
In addition to our owned intellectual property, we also license critical system technologyintellectual property from Motorola Solutions including software and systems to operate and maintain aspects of our network and related ground infrastructure and services as well as technical information for theto design and manufacture certain of our devices. This intellectual property is essential to our ability to continue to operate aspects of our constellation and sell certain of our devices. We also have licensed technology from Motorola Solutions relating to the developmentservices and operation of Iridium NEXT and related ground infrastructure, products and services.devices. We maintain our licenses with Motorola Solutions pursuant to several agreements, any of which can be terminated by Motorola Solutions upon the commencement by or against us of any bankruptcy proceeding or other specified liquidation proceedings or upon our material failure to perform or comply with any provision of the agreements. If Motorola Solutions were to terminate any such agreement, it may be difficult or, under certain circumstances, impossible to obtain the technology from alternative vendors. Motorola Solutions has assigned to a third party a portion of the patents that are covered by some of these licenses.
We license additional systemintellectual property and technology from other third parties and expect to do so in the future both in connection with our first-generation network products and services and with the development and operation of Iridium NEXT and related ground infrastructure products and services.services as well as our devices. If any such third party were to terminate its agreement with us or cease to support and service thissuch intellectual property or technology, or if we are unable to renew such licenses on commercially reasonable terms or at all, it may be difficult, more expensive or impossible to obtain substitute intellectual property or technology from alternative vendors. Any substitute intellectual property or technology may also have lower quality or performance standards, which would adversely affect the quality of our productsdevices and services. For more information, see “Risk Factors—We are dependentdepend on intellectual property licensed from third parties to operate our constellation and sell our devices and for the enhancement of our existing productsdevices and services.”
Available Information
Copies of our annual reports on Form 10-K, quarterly reports on Form 10-Q, current reports on Form 8-K, and amendments, if any, to those reports filed pursuant to Section 13(a) or 15(d) of the Securities Exchange Act of 1934, as amended, are available free of charge through our website at www.iridium.com and on the website of the Securities and Exchange Commission, or SEC, at www.sec.gov. A request for any of these reports may also be submitted to us by writing: Investor Relations, Iridium Communications Inc., 1750 Tysons Boulevard, Suite 1400, McLean, VA 22102, or by calling our Investor Relations line at 703-287-7570.
Item 1A. Risk Factors
Risks related to our satellites and network
Our business plan depends on increased demand for mobile satellite services, among other factors.
customers.
From time to time, we are advised by our customers and end users ofexperience temporary intermittent losses of signal cutting off calls in progress, preventing completions of calls when made, or disrupting the transmission of data. If the magnitude or frequency of such problems increaseincreases and we are no longer able to provide a commercially acceptable level of service, our business and financial results and our reputation would be hurt, and our ability to pursue our business plan would be compromised.
We may be required in the future to make further changes to our constellation to maintain or improve its performance. Any such changes may require prior FCC approval, and the FCC may subject the approval to other conditions that could be unfavorable to our business. In addition, from time to time we may reposition our satellites within the constellation in order to optimize our service, which could result in degraded service during the repositioning period. Although we have some ability to remedy some types of problems affecting the performance of our satellites remotely from the ground, the physical repair of our satellites in space is not feasible.
Our products could fail to perform or could perform at reduced levels of service because of technological malfunctions or deficiencies, regulatory compliance issues, or events outside of our control, which would seriously harm our business and reputation.
Our products and services are subject to the risks inherent in a large-scale, complex telecommunications system employing advanced technology.technology and heavily regulated by, among others, the FCC and similar authorities internationally. Any disruption to our satellites, services, information systems or telecommunications infrastructure, or regulatory compliance issues, could result in the inability or reduced ability of our customers to receive our services for an indeterminate period of time. These customers include government agencies conducting mission-critical work throughout the world, as well as consumers and businesses located in remote areas of the world and operating under harsh environmental conditions where traditional telecommunications services may not be readily available. Any disruption to our services or extended periods of reduced levels of service could cause us to lose customers or revenue, result in delays or cancellations of future implementations of our products and services, result in failure to attract customers, or result in litigation, customer service or repair work that would involve substantial costs and distract management from operating our business. The failure of any of the diverse elements of our system, including our satellites, our commercial gateway, our satellite teleport network facilities or our satellite network operations center, to function as required could render our system unable to perform at the quality and capacity levels required for success. Any system failures, repeated product failures or shortened product life, or extended reduced levels of service could reduce our sales, increase costs, or result in warranty or liability claims or litigation, cause us to extend our warranty period, and seriously harm our business.
Our failure to effectively manage the expansion ofsatellites have a limited life and may fail prematurely, which could cause our product portfolio could impede our ability to execute our business plan, and we may experience increased costs or disruption in our operations.
We have no local entity, employees or infrastructure. We could face a variety of enforcement actions or government inquiries or be forced to incur significant expenses if we were required to modify our products, our services, or our existing security and privacy procedures in order to comply with new or expanded regulations.
replace our constellation sooner than currently planned, either of which would increase our projected capital expenditures.
If we experience operational disruptions with respect tooperations at our commercial gateways or operations center were to be disrupted, we may not be ableexperience interruptions in our ability to provide service to our customers.
Our commercial satellite network traffic is supported by gatewaysa gateway in Tempe, Arizona, andas well as a gateway in Izhevsk, Russia, for traffic within Russian boundaries, and we operate our satellite constellation from our satellite network operations center in
24
Leesburg, Virginia. Currently,If we do not have aare unable to use our primary commercial gateway in Tempe, it could take us from one to eight hours to switch operations to our backup facility for most services, and potentially longer for some services. During this time, our primary gateway in Arizona, and our facilities are subject to the risk of significant malfunctions or catastrophic loss due to unanticipated events andcustomers would be difficultunable to replace or repairuse those services, and we could require substantial lead-time to do so. Material changes in the operationsuffer a loss of these facilities may be subject to prior FCC approval,revenue and the FCC might not give such approval or may subject the approval to other conditions that could be unfavorableharm to our business.reputation. When operating on our backup facility, any further failure could leave us unable to offer services for an extended period. Our gateways and operations center may also experience service shutdowns or periods of reduced service in the future as a result of equipment failure,failures, delays in deliveries, or regulatory issues. Any such failure would impede our ability to provide service to our customers.
Some of the hardware and software we use in operating our gateways is significantly customized and tailored to meet our requirements and specifications and could be difficult and expensive to service, upgrade or replace. Although we maintain inventories of some spare parts, it nonetheless may be difficult, expensive or impossible to obtain replacement parts for the hardware due to a limited number of those parts being manufactured to our requirements and specifications. In addition, our business plan contemplates updating or replacing some of the hardware and software in our network as technology advances, but the complexity of our requirements and specifications may present us with technical and operational challenges that complicate or otherwise make it expensive or infeasible to carry out such upgrades and replacements. If we are not able to suitably service, upgrade or replace our equipment, our ability to provide our services and therefore to generate revenue could be harmed.
Rapid and significant technological changes in the satellite communications industry may impair our competitive position and require us to make significant additional capital expenditures.
The satellite communications industry is subject to rapid advances and innovations in technology. We may face competition in the future from companies using new technologies and new satellite systems.systems, including a significant number of new entrants who are developing or have announced a wide array of technologies, some of which would compete directly with one or more of our existing or planned products and services. New technology could render our system obsolete or less competitive by satisfying customer demand in more attractive ways or through the introduction of incompatible standards. Particular technological developments that could adversely affect us include the deployment by our competitors of new satellites with greater power, flexibility, efficiency or capabilities than our first-generation satellites or Iridium NEXT,ours, as well as continuing improvements in terrestrial wireless technologies. For us to keep up with technological changes and remain competitive, we may need to make significant capital expenditures, including capital to design and launch new products and services on Iridium NEXT.over the short to medium term, and, over the longer term, the acquisition of additional spectrum, satellites, launch vehicles and other network resources to support continued growth. Customer acceptance of the products and services that we offer will continually be affected by technology-based differences in our product and service offerings compared to those of our competitors. New technologies may also be protected by patents or other intellectual property laws and therefore may not be available to us. Any failure on our part to implement new technology within our system may compromise our ability to compete.
Our networks and those of our third-party service providers may be vulnerable to securitycybersecurity risks.
We expect the secure transmission of confidential information over public networks to continue to be a critical element of our ability to compete for business, manage our risks, and protect our customers and our reputation. Our network and those of our third-party service providers and our customers may be vulnerable to unauthorized access, computer attacks, viruses and other security problems. Persons who circumvent security measures could wrongfully access and obtain or use information on theour network or cause service interruptions, delays or malfunctions in our devices, services or operations, any of which could harm our reputation, cause demand for our products and services to fall, and compromise our ability to pursue our business plans. Recently, there have been reported a number ofseveral significant, widespread security attacks and breaches that have compromised network integrity for many companies and governmental agencies, in some cases reportedly originating from outside the United States. In addition, there are reportedly private products available in the market today whichthat may attempt to unlawfully intercept communications made using our network. We may be required to expend significant resources to respond to, contain, remediate, and protect against the threat of security breaches or to remediate harm caused by a breach,these attacks and threats, including compliance with applicable data breach notificationand security laws and regulations, and to alleviate problems, including reputational harm and litigation, caused by any breaches.these security incidents. In addition, in the event of such a security incident, our customer contracts may not adequately protect us against liability to third parties with whom our customers conduct business. Although we have implemented and intend to continue to implement industry-standard and other security measures, these measures may prove to be inadequateinadequate. These security incidents could have a significant effect on our systems, devices and result in incidents,services, including system failures and delays that could limit network availability, which could harm our business and our reputation and result in substantial liability.
25
Our satellites may collide with space debris or another spacecraft, which could adversely affect the performance of our constellation.
In February 2009, we lost an operational satellite as a result of a collision with a non-operational Russian satellite. Although we have some ability to actively maneuver our satellites to avoid potential collisions with space debris or other spacecraft, this ability is limited by, among other factors, uncertainties and inaccuracies in the projected orbit location of and predicted conjunctions with debris objects tracked and cataloged by the U.S. government. Additionally, some space debris is too small to be tracked, and therefore its orbital location is completely unknown; nevertheless, this debris is still large enough to potentially cause severe damage or a failure of our satellites should a collision occur. If our constellation experiences additional satellite collisions with space debris or other spacecraft, our service could be impaired.
The space debris created by the February 2009 satellite collision may cause damage to other spacecraft positioned in a similar orbital altitude.
The 2009 collision of one of our satellites with a non-operational Russian satellite created a space debris field concentrated in the orbital altitude where the collision occurred, and thus increased the risk of space debris damaging or interfering with the operation of our satellites, which travel in this orbital altitude, as well as satellites owned by third parties, such as U.S. or foreign governments or agencies and other satellite operators. Although there are tools used by us and providers of tracking services, such as the U.S. Combined Space Operations Center, to detect, track and identify space debris, we or third parties may not be able to maneuver the satellites away from such debris in a timely manner. Any such collision could potentially expose us to significant losses and liability if we were found to be at fault.
Risks related to our business operations
Our business plan depends on increased demand for mobile satellite services, among other factors.
Our business plan is predicated on growth in demand for mobile satellite services. Demand for mobile satellite services may not grow, or may even contract, either generally or in particular geographic markets, for particular types of services or during particular time periods. A lack of demand could impair our ability to sell products and services, develop and successfully market new products and services and could exert downward pressure on prices. Any decline in prices would decrease our revenue and profitability and negatively affect our ability to generate cash to pay down our debt or for capital expenditures, investments and other working capital needs.
Our ability to successfully implement our business plan will also depend on a number of other factors, including:
•our ability to maintain the health, capacity and control of our satellite constellation;
•the level of market acceptance and demand for our products and services;
•our ability to introduce innovative new products and services that satisfy market demand;
•our ability to expand our business using our existing spectrum resources both in the United States and internationally;
•our ability to sell our products and services in additional countries;
•our ability to comply with applicable regulatory requirements, both in the United States and internationally;
•our ability to maintain our relationship with U.S. government customers, particularly the DoD;
•the ability of our distributors to market and distribute our products, services and applications effectively and their continued development of innovative and improved solutions and applications for our products and services;
•the effectiveness of our competitors in developing and offering similar services and products; and
•our ability to maintain competitive prices for our products and services and to control our costs.
Our agreements with U.S. government customers, particularly the DoD, which represent a significant portion of our revenue, are subject to termination and renewal.
The U.S. government, through a dedicated gateway owned and operated by the DoD, has been and continues to be, directly and indirectly, our largest customer, representing 25% and 21% of our revenue for the years ended December 31, 2023 and 2022, respectively. We provide the majority of our services to the U.S. government pursuant to our GMSS, EMSS, and SDA contracts. We entered into these contracts in April 2019, September 2019, and June 2022, respectively. The GMSS contract had an initial term through September 2023 and has been extended through March 31, 2024, as we negotiate renewal of the agreement. The EMSS contract continues through September 2026, and the SDA contract has a base term until January 2025 and up to five one-year options exercisable at the election of the U.S. government. The U.S. government may terminate these agreements, in whole or in part, at any time for its convenience. Our relationship with the U.S. government is also subject to the
26
overall U.S. government budget and appropriation decisions and processes. U.S. government budget decisions, including with respect to defense spending, are dependentbased on changing government priorities and objectives, which are driven by numerous factors, including geopolitical events and macroeconomic conditions, and are beyond our control. If the U.S. government terminates any or all of these agreements, we would lose a significant portion of our revenue.
Further, operational control of our contracts has been moved from the Defense Information Systems Agency to the U.S. Space Force. In connection with this operational shift, changes in internal pricing and cost recovery have resulted in reduced subscribers under the EMSS contract. Lower subscriber use may negatively affect our ability to negotiate a renewal of the EMSS contract on favorable terms in 2026.
If we fail to comply with the terms of our U.S. government contracts, including applicable federal acquisition regulations, we may be subject to contract price adjustments, civil or criminal penalties, or debarment from future U.S. government contracts.
As a U.S. government contractor or subcontractor, we are subject to federal acquisition regulations, which govern, among other things, the allowability of costs incurred by us in the performance of U.S. government contracts. The pricing of some contracts, including the SDA contract, is based on estimated direct and indirect costs. The U.S. government is entitled to examine our cost records with respect to such contracts and to seek a downward adjustment to the price of the contract if it determines that we failed to furnish complete, accurate and current cost or pricing data in connection with the negotiation of the price of the contract. We may also be subject to government audits and to review and approval of our policies, procedures and internal controls for compliance with procurement regulations and other applicable laws. If we do not comply with the terms of a contract or with regulations or statutes, we could be subject to downward contract price adjustments or refund obligations or could be assessed civil and criminal penalties or be debarred or suspended from obtaining future contracts for a specified period. Any such suspension or debarment or other sanction could have an adverse effect on our business. In addition, if we are unable to comply with security clearance requirements, we may be unable to perform these contracts or compete for other projects of this nature, which could adversely affect our revenue.
Aireon, our primary hosted payload customer, may not successfully grow its business, which could reduce or eliminate the value of our agreements with, and ownership interest in, Aireon.
Aireon is our primary hosted payload customer, and we expect annual revenue to us from Aireon hosting, data services and power fees to be approximately $32.6 million. In addition, we currently hold a substantial ownership interest in Aireon’s parent company, Aireon Holdings, and, if and when funds are available following a planned refinancing of its credit facility, Aireon’s parent company, Aireon Holdings is required to redeem a portion of our ownership interest for a payment of $120.0 million. Based on Aireon’s business plan and restrictions under Aireon’s debt facility, we do not expect this redemption of our ownership interest to occur for several years.
Aireon’s business model requires expansion of its customer base to achieve its projected financial results, which may not occur when projected or at all. While our fee arrangements with Aireon are fixed, if Aireon does not achieve its projected results, they may not be able to pay us the contractually required hosting, data services and power fees in a timely manner or at all. Further, Aireon may need to seek additional financing. Any sale of equity securities by Aireon would dilute our ownership if and to the extent that we do not invest additional funds to maintain our proportional ownership interest. If additional funding is not available, Aireon may default on its credit facility, which could result in the loss or reduction in value of our investment in Aireon, or be forced out of business, in which case we would not receive any further hosting, data or power fees, or the expected $120.0 million redemption payment, and we would lose the fair value of our retained investment in Aireon Holdings.
We depend on intellectual property licensed from third parties to operate our constellation and sell our devices and for the enhancement of our existing devices and services.
We license critical intellectual property and technology to operate and maintain our network and related ground infrastructure and services as well as to design, manufacture, and sell our devices. This intellectual property and technology is essential to our ability to continue to operate our constellation and sell our services and devices. In addition, we depend on third parties to develop enhancements to our current products and services even in circumstances where we own the intellectual property. If any third-party owner of such intellectual property or technology were to terminate any license agreement with us or cease to support and service such intellectual property or technology or perform development on our behalf, or if we are unable to renew such licenses on commercially reasonable terms or at all, it may be difficult, more expensive or impossible to obtain such intellectual property, technology, or services from alternative vendors. Any substitute intellectual property or technology may also be costly to develop and integrate, or could have lower quality or performance standards, which would adversely affect the quality of our devices and services. In connection with the development of new devices and services, we may be required to obtain additional intellectual property rights from third parties. We can offer no assurance that we will be able to obtain such
27
intellectual property rights on commercially reasonable terms or at all. If we are unable to obtain such intellectual property rights on commercially reasonable terms, we may not be able to develop some new devices and services.
Our failure to effectively manage the expansion of our portfolio of products and services could impede our ability to execute our business plan, and we may experience increased costs or disruption in our operations.
In order to achieve the substantial future revenue growth we have projected, we must develop and market new products and services. We currently face a variety of challenges, including maintaining the infrastructure and systems necessary for us to manage the growth of our business. As our product and service portfolio continues to expand, the responsibilities of our management team and demands on other company resources also increase. Consequently, we may further strain our management and other company resources with the increased complexities and administrative burdens associated with a larger, more complex portfolio of products and services. For example, we have in the past experienced quality issues and incorrect market assessments in connection with the introduction of new products and services, and we may experience such issues in the future. Our failure to meet these challenges as a result of insufficient management or other resources could significantly impede our ability to execute our business plan, which relies in part on our ability to leverage our largely fixed-cost infrastructure. To properly manage our growth, we may need to hire and retain additional personnel, upgrade our existing operational management and financial and reporting systems, and improve our business processes and controls. Failure to effectively manage the expansion of our portfolio of products and services in a cost-effective manner could result in declines in product and service quality and customer satisfaction, disruption of our operations, or increased costs, any of which would reduce our ability to increase our profitability.
We could lose market share and revenue as a result of increasing competition from companies in the wireless communications industry, including cellular and other satellite operators, and from the extension of land-based communications services.
We face intense competition in all of our markets, which could result in a loss of customers and lower revenue and make it more difficult for us to enter new markets. We compete primarily on the basis of coverage, quality, portability, and pricing of services and products.
The provision of satellite-based services and products is subject to downward price pressure when capacity exceeds demand or as a result of aggressive discounting by some operators under financial pressure to expand their respective market share. In addition, we may face competition from new competitors, new technologies or new equipment, including new and proposed LEO constellations. For example, we may face competition for our services in the United States from service providers with ancillary terrestrial component, or ATC, authorities who are designing a satellite operating business and a terrestrial component around their spectrum holdings, or from service providers developing satellite direct to terrestrial phone capabilities. In addition, some of our competitors have announced plans for the launch of additional satellites. As a result of competition, we may not be able to successfully retain our existing customers and attract new customers.
In addition to our satellite-based competitors, terrestrial voice and data service providers, both wireline and wireless, could further expand into rural and remote areas and provide the same general types of services and products that we provide through our satellite-based system. Although satellite communications services and terrestrial communications services are not perfect substitutes, the two compete in some markets and for some services. Consumers generally perceive terrestrial wireless voice communication products and services as cheaper and more convenient than those that are satellite-based. Many of our terrestrial competitors have greater resources, wider name recognition and newer technologies than we do. In addition, industry consolidation could hurt us by increasing the scale or scope of our competitors, thereby making it more difficult for us to compete.
We depend on third parties to market and sell our products and services.
services, and their inability to do so effectively could impair our revenue and our reputation.
We select third-party distributors, in some cases on an exclusive basis, and rely on them to market and sell our products and services to end users and to determine the prices end users pay, in some cases on an exclusive basis.pay. We also depend on our distributors to develop innovative and improved solutions and applications integrating our product and service offerings. As a result of these arrangements, we are dependent on the performance of our distributors to generate most of our revenue. Our distributors operate independently of us, and we have limited control over their operations, which exposes us to significant risks. Distributors may not commit the necessarysame level of resources to market and sell our products and services that we would, and these distributors may also market and sell competitive products and services. In addition, our distributors may not comply with the laws and regulatory requirements in their local jurisdictions, which could limit their ability to market or sell our products and services. If our distributors develop faulty or poorly performing products using our technology or services, we may be subject to claims, and our reputation could be harmed. If current or future distributors do not perform adequately, or if we are unable to locate competent distributors in particular countries and secure their services on favorable terms, we may be unable to increase or maintain our revenue in these
28
markets or enter new markets, we may not realize our expected growth, and our brand image and reputation could be hurt.
For example, in 2023, we announced an arrangement with Qualcomm Technologies, Inc., or Qualcomm, to include our services on a processor for use in smartphonesand act as our VAM and service provider with smartphone manufacturers.Although Qualcomm successfully developed and demonstrated the service, they were unable to market the processor successfully to smartphone manufacturers.As a result, Qualcomm elected to terminate our arrangement with them.This arrangement included large penalties had we marketed a similar technology with another partner; as a result, we expect a substantial delay in our ability to develop a similar service with a different third party.
In addition, we may lose distributors due to competition, industry consolidation, regulatory developments, business developments affecting our distributors or their customers, or for other reasons. In 2009, one of our largest competitors, Inmarsat (now Viasat), acquired our then largest distributor, Stratos Global Wireless, Inc., and in January 2014, Inmarsat acquired Globe Wireless, one of our service providers. Following each acquisition, Inmarsat essentially stopped promoting sales of our products and services, and they mayand other competitors could further reduce their distribution efforts with respect to our products and services in the future. Any future consolidation of our distributors would further increase our reliance on a few key distributors of our services and the amount of volume discounts that we may have to give those distributors. Our two largest distributors, Applied Satellite Technology LTDMarlink Group and Network Innovation,Garmin, together represented a total of 12%approximately 10% of our revenue for the year ended December 31, 2017,2023, and our ten largest distributors represented, in the aggregate, 37%27% of our revenue for the year ended December 31, 2017.2023. The loss or consolidation of any of these distributors, or a decrease in the level of effort
expended by any of them to promote our products and services, could reduce the distribution of our products and services as well as the development of new products and applications.applications, which would negatively affect our revenue.
Our business was negatively affected by the COVID-19 pandemic, actions taken to mitigate the pandemic, and the economic disruptions that resulted, and a resurgence or similar pandemic in the future could harm our business.
The COVID-19 pandemic, the steps taken to respond, and the resulting substantial domestic and global economic disruption led to reduced sales and limited our distributors’ ability to install or service our products. The aviation industry was particularly hard hit, which had an adverse effect on our primary hosted payload customer, Aireon, in which we have also made substantial investments.
The pandemic also negatively affected the payment of accounts receivable and collections. For example, one of our distributors sought protection in bankruptcy, reducing the amount we received from them for past services. Finally, factors related to the pandemic, including changing work environments, concerns over safety, reluctance to obtain vaccines, and changing economic conditions, caused an increase in employee resignations across many industries and companies, including ours.
Any resurgence of the COVID-19 pandemic, or another future pandemic, that causes similar disruption could further adversely affect our business, results of operations and financial condition.
We rely on a limited number of key vendors for supply of equipment, components and services; the loss of any such supplier, or shortages experienced by such suppliers, could cause us to incur additional costs and delays in the production and delivery of our products, which could reduce the sales of those products and use of the related services.
We currently rely on Benchmark Electronics Inc., or Benchmark, as the exclusive manufacturera limited number of manufacturers of our current devices, including our mobile handsets, L-BandL-band transceivers and SBD devices and Iridium Pilot terminals. Benchmark may choose to terminate its business relationship with us when its current contractual obligations are completed, or if we default under our current agreement.devices. We also utilize sole source suppliers for some of the component parts of our devices. If Benchmark or any of our other suppliers were to terminate its relationship with us, we may not be able to find a replacement supplier in a timely manner, at an acceptable price or at all.
Any future delay in production or one or more component suppliers may decide to cease production of various componentsdelivery of our products resulting in a shortage or interruption in supplies or an inability to meet increased demand. Althoughcomponents by our suppliers could similarly adversely affect our business. Even if we may beare able to replace or supplement sole source or other component suppliers, there could be a substantial period of time in which our products would not be available; any new relationship may involve higher costs and delays in development and delivery, and we may encounter technical challenges in successfully replicating the manufacturing processes. If our manufacturers or suppliers terminate their relationships with us, fail to provide equipment or services to us on a timely basis, or fail to meet our performance expectations, we may be unable to provide products or services to our customers in a competitive manner, which could in turn negatively affect our financial results and our reputation.
29
shut down those operations entirely.
We operateprovide satellite communications services in an industry that is susceptible to significant intellectual property litigation.Russia through two local subsidiaries employing 36 people and authorized Russian service providers, using a dedicated gateway in Russia. In 2023, revenue from our operations in Russia represented approximately 1.8% of our total revenue, all of which was service revenue. As a result of Russia’s invasion of Ukraine in February 2022, we orceased shipments of equipment to Russia and made other adjustments to our productsoperations in light of U.S. and international sanctions. Further, our sales in Russia are conducted in rubles and then translated to U.S. dollars in our financial results. The value of the ruble has fluctuated substantially since the invasion, which may become subjectaffect our reported revenues. As a result of these factors, we expect revenue from our operations in Russia to intellectual property infringement claims or litigation. The defense of intellectual property suits is both costlybe variable and time-consuming, even if ultimately successful, and may divert management’s attention from other business concerns. An adverse determination in litigationdifficult to whichpredict.
In addition, we may becomein the future choose or be required to further limit or cease operations in Russia entirely, in which case we will no longer receive any revenue from those operations. We could also incur significant expenses as a party could, among other things:
shutting down operations in Russia.
Conducting and expanding our operations outside the United States creates numerous risks, which may harm our operations and compromise our ability to expand our international operations.
We have significant operations outside the United States. We estimate that commercial data traffic originating outside the United States excluding our Iridium OpenPort broadband data service traffic, accounted for 75%96% and 72%95% of total commercial data traffic for the years ended December 31, 20172023 and 2016,2022, respectively, while commercial voice traffic originating outside the United States excluding Iridium OpenPort traffic, accounted for 88%91% and 90% of total commercial voice traffic for each of the years ended December 31, 20172023 and 2016.2022. We cannot provide the precise geographical distribution of revenue from end users because we do not contract directly with them. Instead, we determine the country in which we earn our revenue based on where we invoice our distributors. These distributors sell services directly or indirectly to end users, who may be located or use our products and services elsewhere. We and our distributors are also seeking authorization to sell our services in additional countries.
Conducting operations outside the United States involves numerous risks and, while expanding our international operations would advance our growth, it would also increase our exposure to these risks. For example, in 2013 we commenced the provision of satellite communications services in Russia through a local subsidiary and its authorized Russian service providers and subsequently constructed a dedicated gateway in Russia. The U.S. government has imposed economic and diplomatic sanctions on certain Russian corporations, banks, and citizens and might impose additional sanctions in the future. If such sanctions, or any Russian response to such sanctions, affects our operations in Russia, it could limit our growth in Russia or prevent us from continuing to operate there at all, which would reduce our revenues.
•difficulties in penetrating new markets due to established and entrenched competitors;
•difficulties in developing products and services that are tailored to the needs of local customers;
•lack of local acceptance or knowledge of our products and services;
•lack of recognition of our products and services;
•unavailability of, or difficulties in establishing, relationships with distributors;
•significant investments, including the development and deployment of dedicated gateways, as some countries require physical gateways within their jurisdiction to connect the traffic coming to and from their territory;
•instability of international economies and governments;
•effects of a global pandemic, such as COVID-19, including on international economies, supply chains and travel;
•changes in laws and policies affecting trade and investment in other jurisdictions, including the United Kingdom’s proposed exit from the European Union;jurisdictions;
•exposure to varying legal standards, including data privacy, security and intellectual property protection in other jurisdictions;
•difficulties in obtaining required regulatory authorizations;
•difficulties in enforcing legal rights in other jurisdictions;
•local domestic ownership requirements;
•requirements that operational activities be performed in-country;
•changing and conflicting national and local regulatory requirements;
•foreign currency exchange rates and exchange controls; and
•ongoing compliance with the U.S. Foreign Corrupt Practices Act, U.S. export controls, anti-money laundering and trade sanction laws, and similar international anti-corruption and international trade laws in other countries.
If any of these risks were to materialize, it could affect our ability to successfully compete and expand internationally.
30
Government organizations, foreign military and intelligence agencies, natural disaster aid associations, and event-driven response agencies use our commercial voice and data satellite communications services. Accordingly, we may experience reductions in usage due to changing global circumstances.
The prices for our products and services are typically denominated in U.S. dollars. Any appreciation of the U.S. dollar against other currencies will increase the cost of our products and services to our international customers and, as a result, may reduce the competitiveness of our international offerings and make it more difficult for us to grow internationally. Conversely,
Pursuing strategic transactions may cause us to incur additional risks.
We may pursue acquisitions, joint ventures or other strategic transactions from time to time. We may face costs and risks arising from any such transactions, including integrating a new business into our business or managing a joint venture. These risks may include adverse legal, organizational and financial consequences, loss of key customers and distributors, and diversion of management’s time.
In addition, any major business combination or similar strategic transaction may require significant additional financing, and our ability to obtain such financing may be restricted by the credit agreement governing our currently outstanding term loan with various lenders administered by Deutsche Bank AG, or the Term Loan. Further, depending on market conditions, investor perceptions of our company and other factors, we might not be able to obtain financing on acceptable terms, in some locations, primarily Russia, we conductacceptable amounts, or at appropriate times to implement any such transaction. Any such financing, if obtained, may dilute existing stockholders.
Spectrum values historically have been volatile, which could cause the value of our business to fluctuate.
Our business plan is evolving, and it may in the local currency,future include forming strategic partnerships to maximize value for our spectrum, network assets and combined service offerings in the United States and internationally. Values that we may be able to realize from such partnerships will depend in part on the value placed on our spectrum authorizations. Valuations of spectrum in other frequency bands historically have been volatile, and we cannot predict at what amount a depreciationfuture partner may be willing to value our spectrum and other assets. In addition, to the extent that the FCC takes action that makes additional spectrum available or promotes the more flexible use or greater availability of existing satellite or terrestrial spectrum allocations, for example by means of spectrum leasing or new spectrum sales, the availability of such additional spectrum could reduce the value of our spectrum authorizations and, as a result, the value of our business.
We may be negatively affected by global economic conditions.
Our operations and performance depend significantly on worldwide economic conditions. Uncertainty about global economic conditions poses a risk as individual consumers, businesses and governments may postpone spending in response to tighter credit, negative financial news, declines in income or asset values, or budgetary constraints. Reduced demand would cause a decline in our revenue and make it more difficult for us to operate profitably, potentially compromising our ability to pursue our business plan. We expect our future growth rate will be affected by the condition of the local currency againstglobal economy, increased competition, maturation of the satellite communications industry, and the difficulty in sustaining high growth rates as we increase in size. Any substantial appreciation of the U.S. dollar will reducemay also negatively affect our growth by increasing the U.S. dollar valuecost of our revenues from thoseproducts and services in foreign countries. In recent years, Russia has experienced significant currency depreciation against the U.S. dollar.
Our ability to provideoperate our company effectively could be impaired if we lose members of our senior management team or key technical personnel.
We depend on the continued service in some regions isof key managerial and technical personnel and personnel with security clearances, as well as our ability to continue to attract and retain highly qualified personnel. We compete for such personnel with other companies, government entities, academic institutions and other organizations. The unexpected loss or interruption of the services of such personnel could compromise our ability to effectively manage our operations, execute our business plan and meet our strategic objectives.
Risks related to our capital structure
We have a considerable amount of debt, which may limit our ability to fulfill our obligations and/or to obtain additional financing.
As of December 31, 2023, we had $1,500.0 million of consolidated gross indebtedness. Our capital structure and reliance on indebtedness can have several important consequences, including, but not limited by local regulations. Some countries have specific regulatory requirements such as local domestic ownership requirements or requirements for physical gateways within their jurisdiction to, connect traffic coming to and from their territory. While we have had discussions with parties in these countries to satisfy these regulatory requirements,the following:
•If future cash flows are insufficient, we may not be able to findmake principal or interest payments on our debt obligations, which could result in the occurrence of an acceptable local partnerevent of default under one or reach an agreementmore of those debt instruments.
31
•Our leverage level could increase our vulnerability to develop additional gateways,adverse economic and industry conditions.
•Our indebtedness requires us to dedicate a substantial portion of our cash flow from operations to payments on our debt, thereby reducing the availability of our cash flow for operations and other purposes.
•Our leverage level could make it more difficult for us to satisfy our obligations to our lenders, resulting in possible defaults on and acceleration of such indebtedness.
•Our leverage level could place us at a competitive disadvantage compared to any competitors that have less debt or the cost of developingcomparable debt at more favorable interest rates and deploying such gatewaysthat, as a result, may be prohibitive,better positioned to withstand economic downturns.
•Our consolidated indebtedness has the general effect of reducing our flexibility to react to changing business and economic conditions insofar as they affect our financial condition. The interest rates at which we might secure additional financings may be higher than our currently outstanding debt instruments or higher than forecasted at any point in time, which could impairadversely affect our abilitybusiness, financial condition, results of operations and cash flows.
•Market conditions could affect our access to expand our product and service offerings in such areas and undermine our value for potential users who require service in these areas. Also, other countries where we already provide service may impose similar requirements, which couldcapital markets, restrict our ability to continuesecure financing to provide servicemake planned capital expenditures and investments and pay other expenses, which could adversely affect our business, financial condition, cash flows and results of operations.
Further, despite our substantial levels of indebtedness, we and our subsidiaries have the ability to incur substantially more indebtedness, which could further intensify the risks described above.
If we do not generate sufficient cash flows, we may be unable to repay our Term Loan when it matures.
We will need to repay our Term Loan in those countries. The inabilityfull at maturity in September 2030. If our cash flows and capital resources are insufficient to offerrepay the Term Loan when it matures, we may have to sellundertake alternative financing plans, such as refinancing or restructuring our productsdebt, selling assets or operations, reducing or delaying capital investments, or seeking to raise additional capital. We may not be able to refinance our debt, or any refinancing of our debt could be at higher interest rates and services in all major international markets could impair our international growth. In addition, the construction of such gateways in foreign countries may trigger and require us to comply with various U.S. regulatory requirementsmore restrictive covenants that could conflict withfurther restrict our business operations. Our ability to implement successfully any such alternative financing plans will depend on a range of factors, including our financial condition, general economic conditions and the level of activity in capital markets generally. Failure to repay or contravenerefinance the lawsTerm Loan at or regulationsprior to maturity would result in an event of default under the Term Loan.
The credit agreement governing our Term Loan contains cross-default or cross-acceleration provisions that may cause all of the local jurisdiction. Anydebt issued under that instrument to become immediately due and payable because of these developmentsa default under an unrelated debt instrument.
Our failure to comply with the obligations contained in the credit agreement governing our Term Loan or other future instruments of indebtedness could limit, delayresult in an event of default under the applicable instrument, which could result in the related debt and the debt issued under other instruments (together with accrued and unpaid interest and other fees) becoming immediately due and payable. In such event, we would need to raise funds from alternative sources, which funds may not be available to us on favorable terms, on a timely basis, or at all. Alternatively, such a default could require us to sell our assets and otherwise curtail our operations in order to pay our creditors. These alternative measures could have a material adverse effect on our business, financial position, results of operations and/or cash flows, which could cause us to become bankrupt or insolvent or otherwise interfere withimpair our ability to construct gatewaysmake payments in respect of our indebtedness.
If we default under the Term Loan, the lenders may require immediate repayment in full of amounts borrowed or other infrastructure or network solutions around the world.
foreclose on our assets.
The U.S. governmentcredit agreement governing our Term Loan contains events of default, including cross-default with other indebtedness, bankruptcy, and Motorola Solutionsa change in control (as defined in the credit agreement). If we experience an event of default, the lenders may unilaterally require usrepayment in full of all principal and interest outstanding under the Term Loan. If we fail to de-orbit our first-generation satellites uponrepay such amounts, the occurrencelenders may foreclose on the assets we have pledged under the Term Loan, which includes substantially all of specified events.
Certain provisions in the credit agreement governing our Term Loan limit our financial and operating flexibility.
The credit agreement governing our Term Loan contains covenants that place restrictions on, among other things, our ability to:
•incur liens,
•engage in mergers or asset sales,
•pay dividends,
32
•repay subordinated indebtedness,
•incur indebtedness,
•make investments and loans, and
•engage in other specified transactions.
These restrictions are typically structured with dollar limits based on a non-affiliated debtorpercentage of our trailing twelve month earnings before interest, taxes, depreciation and amortization and vary depending on our leverage level (in each case as calculated under the credit agreement). Complying with these restrictions may make it more difficult for us to successfully execute our business plan and compete against companies who are not subject to such restrictions.
Our Board of Directors may reduce, suspend or terminate our planned dividends.
In December 2022, our Board of Directors initiated a quarterly dividend and declared a cash dividend on our common stock. Decisions regarding future dividends are within the discretion of the Board of Directors and may be influenced by a number of factors, including the price of our common stock, general business and economic conditions, our financial condition and operating results, the emergence of alternative investment or acquisition opportunities, changes in possession, outour business strategy and other factors. These or other factors could cause our Board of bankruptcy, MotorolaDirectors to reduce, suspend or terminate our planned quarterly dividends, which could reduce the value of our common stock. For more information on our dividends, see “Management’s Discussion and Analysis of Financial Conditions and Results of Operations.”
Adverse changes in our credit ratings or withdrawal of the ratings assigned to our debt securities by rating agencies may negatively affect us.
Our ability to access capital markets is important to our ability to operate our business. Increased scrutiny of the satellite industry and the U.S. government required specified de-orbit rightsimpact of regulation, as a way to control potential liability exposure arising from future operation ofwell as changes in our first-generation constellation. As a result, Iridium Satellite, Boeing, which then operated our constellation, Motorolafinancial performance and the U.S. government entered into an agreement giving the U.S. government the right, in its sole discretion, to require us to de-orbit our first-generation satellites upon the occurrence of specified events, including any time on or after January 1, 2015 or if more than four of our first-generation satellites have insufficient fuel to execute a 12-month de-orbit, both of which have already occurred. In addition, the U.S. government has the right to require us to de-orbit any of our individual functioning first-generation satellites, including in-orbit spares, that have been in orbit for more than seven years. All of our functioning first-generation satellites have been in orbit for more than seven years.
The market price terms and availability of insurance have fluctuated significantly since we began offering commercial satellite services. The cost of obtaining insurance can vary as a result of either satellite failures or general conditions in the insurance industry. Higher premiums on insurance policies would increase our cost. In-orbit liability insurance policies on satellites may not continue to be available on commercially reasonable terms or at all. In addition to higher premiums, insurance policies may provide for higher deductibles, shorter coverage periods and additional policy exclusions. For example, our current de-orbit insurance covers only twelve months from attachment and therefore would not cover losses arising outside that timeframe. Our failure to renew our current in-orbit liability insurance policy or obtain a replacement policy would trigger de-orbit rights with respect to our first-generation satellites held by the U.S. government and Boeing described in the immediately preceding risk factor, which, if exercised prior to the deployment of an adequate number of Iridium NEXT satellites, would harm our ability to provide a commercially acceptable level of service. In addition, even if we continue to maintain an in-orbit liability insurance policy, the coverage may not protect us against all third-party losses, which could be material.
The trading price of our satellites. If we are unable to obtain such insurance on commercially reasonable terms and the U.S. government has not agreed to cover the amounts that would have otherwise been paid by such insurance, Motorola Solutions could invoke its de-orbit rights which, if exercised prior to the deployment of an adequate number of Iridium NEXT satellites, would harm our ability to provide a commercially acceptable level of service.
•actual or anticipated variations in our operating results, including termination or expiration of one or more of our key contracts, or a change in sales levels under one or more of our key contracts;
•failure of Aireon to successfully carry out its business plan or obtain expected financing;
•failure to comply with the terms of the credit agreement governing our Term Loan;
•sales of a large number of adverse health consequences, including cancer,shares of our common stock or the perception that such sales may occur;
•the dilutive effect of outstanding stock options and other equity awards;
•changes in financial estimates by industry analysts, or our failure to meet or exceed any such estimates, or changes in the recommendations of any industry analysts that elect to follow our common stock or the common stock of our competitors;
•impairment of intangible assets;
•actual or anticipated changes in economic, political or market conditions, such as a result of wireless phone usage. Other claims allege consumer harm from failures to disclose information about radio frequency emissionsrecessions or aspects ofinternational currency fluctuations;
•actual or anticipated changes in the regulatory regimes governing those emissions. Although we have not been party to any such lawsuits, we may be exposed to such litigationenvironment affecting our industry;
•changes in the future. While we comply with applicable standards for radio frequency emissionsmarket valuations of our competitors;
•low trading volume; and power and
•announcements by our competitors regarding significant new products or services or significant acquisitions, strategic partnerships, divestitures, joint ventures or other strategic initiatives.
33
The trading price of our common stock might also decline in reaction to events that affect other companies in our industry even if these events do not believe that there is valid scientific evidence that usedirectly affect us. If our stock, the market for other stocks in our industry, or the stock market in general experiences a loss of investor confidence, the trading price of our devices poses a health risk, courtscommon stock could decline for reasons unrelated to our business, financial condition or governmental agencies could determine otherwise. Any such finding could reduce our revenueresults of operations.
Risks related to legal and profitability and expose us and other communications service providers or device sellers to litigation, which, even if frivolous or unsuccessful, could be costly to defend.
regulatory matters
Our business is subject to extensive government regulation, which mandates how we may operate our business and may increase our cost of providing services and slow our expansion into new markets.
Our ownership and operation of a satellite communications system and the sale of products that operate on that system are subject to significant regulation in the United States, including by the FCC, the U.S. Department of Commerce and others, and in foreign jurisdictions by similar local authorities. The rules and regulations of these U.S. and foreign authorities may change, and such authorities may adopt regulations that limit or restrict our operations as presently conducted or currently contemplated.contemplated, including our de-orbit obligations. Such authorities may also make changes in the licenses of our competitors that affect our spectrum. Such changes may significantly affect our business. Further, because regulations in each country are different, we may not be aware if some of our distribution partners or persons with whom we or they do business do not hold the requisite licenses and approvals. Our failure to provide services in accordance with the terms of our licenses or our failure to operate our satellites or ground stations as required by our licenses and applicable laws and government regulations could result in the imposition of government sanctions on us, including the suspension or cancellation of our licenses. Our failure or delay in obtaining the approvals required to operate in other countries would limit or delay our ability to expand our operations into those countries. Our failure to obtain industry-standard or government-required certifications for our products could compromise our ability to generate revenue and conduct our business in other countries. Any imposition of sanctions, loss of license or failure to obtain the authorizations necessary to use our assigned radio frequency spectrum and to distribute our products in the United States or foreign jurisdictions could cause us to lose sales, hurt our reputation and impair our ability to pursue our business plan.
In addition, one of our subsidiaries, Iridium Carrier Services LLC, holds a common carrier radio license and is thus subject to regulation as a common carrier, including limitations and prior approval requirements with respect to direct or indirect foreign ownership. A change in the manner in which we provide service, or a failure to comply with any common carrier regulations that apply to us or to pay required fees, could result in sanctions including fines, loss of authorizations, or the denial of applications for new authorizations or the renewal of existing authorizations.
Repurposing of satellite spectrum by adjacent operators of L-band spectrum for terrestrial services could interfere with our services.
In February 2003, the FCC adopted ATC rules that permit satellite service providers to establish terrestrial wireless networks in previously satellite-only bands, subject to certain requirements intended to ensure that terrestrial services remain ancillary to primary satellite operations and do not interfere with existing operators. In 2011, the FCC granted Ligado Networks (then known as Lightsquared), or Ligado, a waiver to convert its L-band satellite spectrum to terrestrial use, including a 10 MHz band close to the spectrum that we use for all of our services. That waiver was subsequently suspended in 2012 due to concerns about potential interference to GPS operations. Ligado sought another waiver in 2015 to modify the ATC of its L-band mobile satellite service network with a terrestrial-only proposal designed to address GPS industry concerns. In April 2020, the FCC announced that it had approved Ligado’s waiver request. We, along with a variety of other private parties and the National Telecommunications and Information Administration on behalf of federal government users, filed petitions for reconsideration opposing this waiver out of concern for the interference that we believe Ligado’s proposed operations would cause. These petitions remain pending. In October 2023, Ligado brought suit against the U.S. government in the Federal Court of Claims alleging that the Department of Defense, the Department of Commerce, and Congress unlawfully prevented Ligado from using its exclusively licensed services and seeking damages based on their inability to deploy ATC services in the band.
Ligado’s implementation of these services would result in terrestrial use of L-band spectrum in the 1.6 GHz band, which we use to provide our services, and such implementation may affect the performance of our system for customers of our existing and future services. While the FCC’s decision to approve these services included conditions designed to protect other satellite services that use L-band spectrum from harmful interference, these conditions may prove insufficient, or the level of services provided may exceed those estimated by the FCC, in which case these or future terrestrial services permitted by the FCC could substantially interfere with our satellites and devices, which would adversely affect our services. If other countries permit similar terrestrial use of L-band spectrum in the 1.6 GHz band, the performance of our system may be subject to interference there as well.
34
If the FCC revokes, modifies or fails to renew our licenses, or fails to grant a new license or modification, our ability to operate will be harmed or eliminated.
We hold FCC licenses, specifically a license for our satellite constellation, licenses for our U.S. gateway and other ground facilities, and blanket earth station licenses for U.S. government customers and commercial subscribers, that are subject to revocation if we fail to satisfy specified conditions. The FCC licenses are also subject to modification by the FCC. Our satellite constellation license expires on February 23, 2032. Our U.S. gateway earth station and the U.S. government customer and commercial subscriber earth station licenses expire between February 2036 and March 2037. There can be no assurance that the FCC will renew the FCC licenses we hold or grant new ones or modifications. If the FCC revokes, modifies or fails to renew the FCC licenses we hold, or fails to grant a new license or modification, or if we fail to satisfy any of the conditions of our respective FCC licenses, we may not be able to continue to provide mobile satellite communications services.
As we and our distributors expand our offerings to include more consumer-oriented devices, we are more likely to be subject to product liability claims, recalls or litigation, which could adversely affect our business and financial performance.
Through our distributors, we offer several services and devices aimed at individual consumers, and we and our distributors continue to introduce additional services and devices for use with our services. For example, we are working to enable satellite messaging and emergency services directly in smartphones and other devices using our services, which may dramatically increase the number of devices that use our services. These services and devices aimed at individual consumers, such as location-based services, emergency services, satellite handsets, smartphones, and personal locator devices, may contain design and manufacturing defects. Defects may also occur in components and devices that we purchase from third parties or that our distributors offer. There can be no assurance we or our distributors will be able to detect and fix all defects in the services, hardware and software that we or our distributors sell. These services and devices could be used in isolated and dangerous locations, including emergency response situations, and users who suffer property damage, personal injury or death while using such services or devices may seek to assert claims or bring lawsuits against us. Further, it is possible that our distributors’ devices could become the subject of consumer protection investigations, enforcement actions or litigation, including class actions. We seek to limit our exposure to all of these claims by maintaining a consumer protection compliance program, and through appropriate notices, disclosures, indemnification provisions and disclaimers, but these steps may not be effective or available in all cases. We also maintain product liability insurance, but this insurance may not cover any particular claim or litigation, or the amount of insurance may be inadequate to cover the claims brought against us. Product liability insurance could become more expensive and difficult to maintain and might not be available on acceptable terms or at all. In addition, it is possible that our or our distributors’ devices could become the subject of a product recall as a result of a device defect. We do not maintain recall insurance, nor do we have control over our distributors’ devices, and any recall could have a significant effect on our financial results. In addition to the direct expenses of and potential liability for product liability claims, investigations, recalls and litigation, a claim, investigation, recall or litigation might cause us adverse publicity, which could harm our reputation and compromise our ability to sell our services or devices in the future.
The collection, storage, transmission, use and disclosure of user data and personal information could give rise to liabilities or additional costs as a result of laws, governmental regulations, and evolving views of personal privacy rights and information security standards.
We transmit, process, and in some cases store in the normal course of our business, personal information. Many jurisdictions around the world have adopted laws and regulations regarding the collection, storage, transmission, use and disclosure of personal information. The legal standards for processing, storing and using this personal information continue to evolve, impose additional obligations and risk on our business, and have the potential to make some of our business processes more costly or less feasible. For example, numerous U.S. states have adopted consumer privacy laws that gives residents expanded rights to access and delete their personal information, opt out of certain personal information sharing and receive detailed information about how their personal information is used by requiring companies to provide new disclosures to consumers and provide such consumers new ways to opt out of certain sales of personal information. In Europe, the European Commission enacted the General Data Protection Regulation, or GDPR, which since 2018 has imposed more stringent EU data protection requirements and provided for greater penalties for noncompliance.
In addition, the interpretation of privacy and data protection laws and regulations regarding the collection, storage, transmission, use and disclosure of such information in some jurisdictions remains unclear. These laws may be interpreted, applied and enforced in conflicting ways from state to state and country to country and in a manner that is not consistent with our current business practices. Complying with these varying privacy and data security legal requirements could cause us to incur additional costs and change our business practices. Further, our services are accessible in many foreign jurisdictions, and some of these jurisdictions may claim that we are required to comply with their laws, even where we have no operating entity, employees or infrastructure located in that jurisdiction. We could face direct expenses related to a variety of enforcement actions, government investigations, or litigation, and an interruption to our business and adverse publicity because of such
35
enforcement actions, government investigations, or litigation. Such enforcement actions, government investigations, or litigation could also cause us to incur significant expenses if we were required to modify our products, our services, our infrastructure, or our existing security and privacy procedures in order to comply with new or expanded privacy and security regulations.
In addition, if end users allege that their personal information is not collected, stored, transmitted, used or disclosed by us or our business partners appropriately or in accordance with our policies or applicable laws, or that our failure to adequately secure their personal information compromised its security, we could have liability to them or to consumer protection agencies, including claims, investigations and litigation related to such allegations. Any failure on our part to protect end users’ personal information could result in a loss of user confidence, harm our reputation, result in the loss of users, and cause us to incur significant expenses.
We have been and may in the future become subject to claims that our devices or services violate the patent or intellectual property rights of others, which could be costly and disruptive to us.
We operate in an industry that is susceptible to significant intellectual property litigation. As a result, we or our devices or services from time to time have been and may in the future be subject to intellectual property infringement claims or litigation. The defense of intellectual property suits is both costly and time-consuming, even if ultimately successful, and may divert management’s attention from other business concerns. An adverse determination in litigation to which we may become a party could, among other things:
•subject us to significant liabilities to third parties, including treble damages;
•require disputed rights to be licensed from a third party for royalties that may be substantial;
•require us to cease using technology that is important to our business; or
•prohibit us from selling some or all of our devices or offering some or all of our services.
We may be unable to offer one or more services in important regions of the world due to regulatory requirements, which could limit our growth.
While our constellation is capable of providing service globally, our ability to sell one or more types of service in some regions may be limited by local regulations. Some countries have specific regulatory requirements such as local domestic ownership requirements or requirements for physical gateways within their jurisdiction to connect traffic coming to and from their territory. In some countries, we may not be able to find an acceptable local partner or reach an agreement to develop additional gateways, or the cost of developing and deploying such gateways may be prohibitive, which could impair our ability to expand our product and service offerings in such areas and undermine our value for potential users who require service in these areas. Also, other countries where we already provide service may impose similar requirements in the future, which could restrict our ability to continue to sell service in those countries. The inability to offer to sell our products and services in all major international markets could impair our international growth. In addition, the construction of such gateways in foreign countries may trigger and require us to comply with various U.S. regulatory requirements that could conflict with or contravene the laws or regulations of the local jurisdiction. Any of these developments could limit, delay or otherwise interfere with our ability to construct gateways or other infrastructure or network solutions around the world.
Security and emergency services regulations in the U.S.United States and other countries may affect our ability to operate our system and to expand into new markets.
Our operations are subject to regulations of the U.S. Department of Commerce’s Bureau of Industry and Security relating to the export of satellites and related technical data as well as our subscriber equipment, the U.S. Treasury Department’s Office of Foreign Assets Control relating to transactions involving entities sanctioned by the United States, and the U.S. State Department’s Office of Defense Trade Controls relating to satellite launch. We are also required to provide U.S. and some foreign government law enforcement and security agencies with call interception services and related government assistance, in respect of which we face legal obligations and restrictions in various jurisdictions. Given our global operations and unique network architecture, these requirements and restrictions are not always easy to comply with or harmonize. In addition, some countries require providers of telecommunications services to connect specified emergency numbers to local emergency services. We have discussed and continue to discuss with authorities in various countries the procedures used to satisfy our obligations, and have had to, and may in the future need to, obtain amendments or waivers to licenses or obligations in various countries. Countries are not obligated to grant requested amendments or waivers, and there can be no assurance that relevant authorities will not suspend or revoke our licenses or take other legal actions to attempt to enforce the requirements of their respective jurisdictions.
36
These U.S. and foreign obligations and regulations may limit or delay our ability to offer products and services in a particular country. As new laws and regulations are issued, we may be required to modify our business plans or operations. In addition, changing and conflicting national and local regulatory requirements may cause us to be in compliance with local requirements in one country, while not being in compliance with the laws and regulations of another. If we fail to comply with regulations in the United States or any other country, we could be subject to substantial fines or sanctions that could make it difficult or impossible for us to operate in the United States or such other country, or we may need to make substantial additional expenditures to bring our systems, products and services into compliance with the requirements.
We may be unable to obtain and maintain contractually required liability insurance, and the insurance we obtain may not cover all liabilities to which we may become subject.
Our current in-orbit liability insurance policy contains, and we expect any future policies would likewise contain, specified exclusions and material change limitations customary in the industry. These exclusions may relate to, among other things, losses resulting from in-orbit collisions such as the one we experienced in 2009, acts of war, insurrection, terrorism or military action, government confiscation, strikes, riots, civil commotions, labor disturbances, sabotage, unauthorized use of the conditionssatellites, and nuclear or radioactive contamination, as well as claims directly or indirectly occasioned as a result of noise, pollution, electrical and electromagnetic interference, and interference with the use of property.
In addition to our in-orbit liability insurance policy, we are required to maintain insurance to cover the potential liability of Motorola Solutions, the successor to the manufacturer of our respective FCC licenses, wefirst-generation satellites. We may not in the future be able to continuerenew this coverage on reasonable terms and conditions, or at all. Our failure to provide mobile satellitemaintain this insurance could increase our exposure to liability arising in relation to our first-generation satellites.
Wireless devices’ radio frequency emissions are the subject of regulation and litigation concerning their environmental effects, which includes alleged health and safety risks. As a result, we may be subject to new regulations, demand for our services may decrease, and we could face liability based on alleged health risks.
There has been adverse publicity concerning alleged health risks associated with radio frequency transmissions from portable hand-held telephones that have transmitting antennas. Lawsuits have been filed against participants in the wireless industry alleging a number of adverse health consequences, including cancer, as a result of wireless phone usage. Other claims allege consumer harm from failures to disclose information about radio frequency emissions or aspects of the regulatory regimes governing those emissions. Although we have not been party to any such lawsuits, we may be exposed to such litigation in the future. While we believe we comply with applicable standards for radio frequency emissions and power and do not believe that there is valid scientific evidence that use of our devices poses a health risk, courts or governmental agencies could determine otherwise. Any such finding could reduce our revenue and profitability and expose us and other communications service providers or device sellers to litigation, which, even if frivolous or unsuccessful, could be costly to defend.
If consumers’ health concerns over radio frequency emissions increase, they may be discouraged from using wireless handsets or other wireless consumer devices. Further, government authorities might increase regulation of wireless handsets and other wireless consumer devices as a result of these health concerns. Any actual or perceived risk from radio frequency emissions could reduce the number of our subscribers and demand for our products and services.
Our ability to use our net operating loss carryforwards to offset future taxable income may be subject to certain limitations.
Our ability to utilize U.S. net operating loss carryforwards and other tax attributes may be limited if we experience an “ownership change” under Section 382 of the Internal Revenue Code of 1986, as amended, or the Code, which generally occurs if one or more stockholders or groups of stockholders who own at least 5% of our common stock increase their ownership in the
37
aggregate by more than 50% over their lowest ownership percentage within a rolling period that begins on the later of three years prior to the testing date and the date of the last ownership change. Similar rules may apply under state tax laws. If such an ownership change were to occur, Section 382 of the Code would impose an annual limit on the amount of pre-ownership change net operating loss carryforwards and other tax attributes we could use to reduce our taxable income. It is possible that such an ownership change could materially reduce our ability to use our net operating loss carryforwards or other tax attributes to offset taxable income, which could impact our profitability.
We could be subject to adverse determinations by taxing authorities or changes to tax laws.
authorities.
We are subject to regular review and audit by both domestic and foreign tax authorities. As a result, we have received, and may in the future receive, assessments in multiple jurisdictions on various tax-related assertions, including transfer pricing adjustments or permanent establishment. Any adverse outcome of such a review or audit could have a negative effect on our operating results and financial condition. In addition, the determination of our provision for income taxes and other tax liabilities requires significant judgment, including transactions and calculations where the ultimate tax determination is uncertain. Although we believe our estimates are reasonable, the ultimate tax outcome may differ from the amounts recorded in our consolidated financial statements and may materially affect our financial results in the period or periods for which such determination is made. Furthermore,
Changes in tax laws could increase our worldwide tax rate and materially affect our financial position and results of operations.
Tax policies, laws or rates in various jurisdictions may be subject to significant change, which could materially and adversely affect our financial position and results of operations.
operations.
If we fail to maintain proper and effective internal controls, our ability to produce accurate financial statements on a timely basis could be impaired.
We are subject to the reporting requirements of the Securities Exchange Act of 1934, the Sarbanes-Oxley Act of 2002, the Dodd-Frank Wall Street Reform and Consumer Protection Act of 2010, and the rules and regulations of the SEC and The Nasdaq Global Select Market. The Sarbanes-Oxley Act requires, among other things, that we maintain effective disclosure controls and procedures and internal controls over financial reporting. We perform system and process evaluation and testing of our internal controls over financial reporting to allow management to report on the effectiveness of our internal controls over financial reporting in our Annual Reports on Form 10-K, as required by Section 404 of the Sarbanes-Oxley Act. If we are not able to comply with the requirements of Section 404 of the Sarbanes-Oxley Act in a timely manner, or if we are unable to maintain proper and effective internal controls, we may not be able to produce timely and accurate financial statements, and we may conclude that our internal controls over financial reporting are not effective. If that were to happen, the market price of our stock could decline, and we could be subject to sanctions or investigations by the Nasdaq Global Select Market, the SEC or other regulatory authorities.
Maintaining effective internal controls over financial reporting is necessary for us to produce reliable financial statements. If we fail to maintain such controls, it could result in a material misstatement of our financial statements that would not be prevented or detected on a timely basis, and which could cause investors and other users to lose confidence in our financial statements.
Item 1B. Unresolved Staff Comments
None.
Item 1C. Cybersecurity
Risk management and strategy
We have implemented and maintain information security processes designed to identify, assess and manage material risks from cybersecurity threats to our information systems and critical data, including intellectual property and confidential information that is proprietary, strategic or competitive in nature. Our most important information system is our satellite network and related ground systems that carry our customers’ traffic on our network. We also maintain critical internal computer networks, as well as third-party hosted services, communications systems, hardware and software.
38
Our management, led by our chief information officer, in conjunction with our internal management security committee and third-party service providers, helps to identify, assess and manage our cybersecurity threats and risks by monitoring and evaluating our threat environment and risk profile. These teams use a number of methods to do this, including manual and automated tools, internal and external threat assessments, and internal and external vulnerability assessments. The third parties we engage in this effort generally consist of threat intelligence service providers; cybersecurity consultants and software providers; penetration testing firms; monitoring services; forensic investigators; and other professional services firms, including legal counsel.
Depending on the environment and system, we implement and maintain several technical, physical, and organizational measures, processes, standards and policies designed to manage and mitigate material risks from cybersecurity threats to our systems and data. These include, for example, IT policies and procedures; a network security policy; an information and asset management policy; an information security policy; incident planning, detection and response plans, including backup systems; vulnerability management, including of third parties; risk assessments; establishment of network security controls, including physical security; annual employee training; systems monitoring; and penetration testing.
We integrate our assessment and management of material risks from cybersecurity threats into our overall risk management processes. For example, our management security committee generally meets on a monthly basis and evaluates material risks from cybersecurity threats against our overall business objectives. Our management generally provides reports and status updates to our board of directors on a quarterly basis, as the board monitors our overall enterprise risk.
In addition to our internal resources, we also use third-party service providers, including application providers and hosting companies, distributors, and supply chain resources. We have an IT vendor management program designed to identify and manage cybersecurity risks associated with our use of these providers. As part of this program, we typically conduct risk assessments for certain IT vendors on an annual basis, including, for example, using security assessment measures such as a security questionnaire, perform a review of the vendor’s own security program, audits, and vulnerability scans. Depending on the nature of the services provided, the sensitivity of the information systems and data at issue, and the identity of the provider, our vendor management process may involve different levels of assessment designed to help identify cybersecurity risks associated with a provider and may impose contractual obligations related to cybersecurity on the provider.
Despite these measures, we may not be successful in preventing, mitigating or recovering from a cybersecurity incident, which could have a material adverse effect on our operations or financial results or reputation. While we maintain cybersecurity insurance, it may not be adequate to cover the costs related to cybersecurity incidents we experience. For a description of the primary risks from cybersecurity threats that may materially affect our business and how they may do so, see Part I, Item 1A. Risk Factors in this Annual Report on Form 10-K, including “— Our networks and those of our third-party service providers may be vulnerable to cybersecurity risks.”
Governance
Our board of directors addresses cybersecurity risk management as part of its general oversight function. The board oversees our cybersecurity risk management processes, including oversight and mitigation of risks from cybersecurity threats.
Our cybersecurity risk assessment and management processes are implemented and maintained by members of our management team, led by our chief information officer, who has 15 years of experience in information technology roles and supported by our director of information security, who holds several certifications in the field of information security and technology. In addition to our chief information officer, our internal management security committee includes our chief executive officer, chief financial officer, chief operations officer and chief legal officer, as well as others within our organization in information technology roles.
Our chief information officer is responsible for hiring appropriate personnel and helping to integrate cybersecurity risk considerations into our overall risk management strategy and communicating key priorities to relevant personnel. Our chief information officer is also responsible for approving budgets, helping prepare for cybersecurity incidents, approving cybersecurity processes and reviewing security assessments and other security-related reports.
Our cybersecurity incident response and vulnerability management processes are designed to escalate certain cybersecurity incidents to members of management depending on the circumstances. Information regarding cyber incidents is reported at the monthly meeting of the management security committee or sooner if warranted. Members of this committee work with our incident response team to help mitigate and remediate cybersecurity incidents of which they are notified. Our incident response and vulnerability management processes include reporting by management to the board of directors for certain cybersecurity incidents.
39
The board generally receives quarterly reports from our chief operations officer, chief information officer or other members of management, as well as periodic presentations from outside advisors concerning our significant cybersecurity threats and risk and the processes we have implemented to address them. The board also has access to various reports, summaries or presentations related to cybersecurity threats, risk and mitigation.
40
Item 2. Properties
lease:
| Location | Country | Approximate Square Feet | Facilities | Owned/Leased | ||||||||||||||||||||||||||||
| McLean, Virginia | USA | 30,600 | Corporate Headquarters | Leased | ||||||||||||||||||||||||||||
| Chandler, Arizona | USA | 197,000 | Technical Support Center, Distribution Center, Warehouse and Satellite Teleport Network Facility | Leased | ||||||||||||||||||||||||||||
| Leesburg, Virginia | USA | 40,000 | Satellite Network Operations Center | Owned | ||||||||||||||||||||||||||||
| Tempe, Arizona | USA | 31,000 | System Gateway and Satellite Teleport Network Facility | Owned Building on Leased Land | ||||||||||||||||||||||||||||
| Chandler, Arizona | USA | 24,000 | Operations | Leased | ||||||||||||||||||||||||||||
| Fairbanks, Alaska | USA | 4,000 | Satellite Teleport Network Facility | Owned | ||||||||||||||||||||||||||||
| Svalbard | Norway | 1,800 | Satellite Teleport Network Facility | Owned Building on Leased Land | ||||||||||||||||||||||||||||
| Izhevsk, Udmurtia | Russia | 8,785 | System Gateway and Satellite Teleport Network Facility | Leased | ||||||||||||||||||||||||||||
| Moscow | Russia | 2,158 | Sales and Administration Offices | Leased | ||||||||||||||||||||||||||||
| Punta Arenas | Chile | 3,200 | Satellite Teleport Network Facility | Owned Building on Leased Land | ||||||||||||||||||||||||||||
| Bishop’s Stortford | United Kingdom | 2,400 | Sales Offices | Leased | ||||||||||||||||||||||||||||
Item 3. Legal Proceedings
Neither we nor any of our subsidiaries are currently subject to any material legal proceeding, nor, to our knowledge, is any material legal proceeding threatened against us or any of our subsidiaries.
Item 4. Mine Safety Disclosures
Not applicable.
41
PART II
Item 5. Market for Registrant’s Common Equity, Related Stockholder Matters and Issuer Purchases of Equity Securities
Our common stock is currently listed on the NASDAQNasdaq Global Select Market under the symbol “IRDM.” The following table sets forth, for the quarters indicated, the quarterly intra-day high and low sales prices of our common stock as reported on the NASDAQ Global Select Market.
| Common Stock | |||||||
| High | Low | ||||||
| Quarter Ended March 31, 2016 | $ | 8.53 | $ | 6.14 | |||
| Quarter Ended June 30, 2016 | $ | 8.88 | $ | 7.15 | |||
| Quarter Ended September 30, 2016 | $ | 9.37 | $ | 6.80 | |||
| Quarter Ended December 31, 2016 | $ | 11.15 | $ | 7.50 | |||
| Quarter Ended March 31, 2017 | $ | 11.54 | $ | 7.80 | |||
| Quarter Ended June 30, 2017 | $ | 11.58 | $ | 9.40 | |||
| Quarter Ended September 30, 2017 | $ | 11.50 | $ | 9.68 | |||
| Quarter Ended December 31, 2017 | $ | 12.90 | $ | 9.95 | |||
Stockholders are entitled to receive, when and if declared by the Company’s Board of Directors from time to time, dividends and other distributions in cash, stock or property from the Company’s assets or funds legally and contractually available for such purposes. In each of December 2022, May 2023, September 2023, and December 2023, the Company’s Board of Directors approved a dividend of $0.13 per share of common stock. The dividends, which were paid on March 30, 2023, June 30, 2023, September 29, 2023, and December 29, 2023, to stockholders of record as of March 15, 2023, June 15, 2023, September 15, 2023, and December 15, 2023, respectively, resulted in total payments of $64.8 million for the twelve months ended December 31, 2023. The liability related to dividends on common shares underlying unvested RSUs was $1.3 million as of December 31, 2023.
We have notcurrently expect that comparable cash dividends will continue to be paid anyin the future, although future dividends will depend on our common stockearnings, capital requirements, financial conditions and other factors considered relevant by the Board. On February 2, 2024, the Board of Directors approved a dividend of $0.13 per share, payable on March 29, 2024 to date.holders of record as of March 15, 2024. The Credit Facility currently restricts us from declaring, making or paying dividends on our common stock, and we do not anticipate that we will declare any dividends on our common stock inBoard of Directors plans to increase the foreseeable future.quarterly dividend to $0.14 per share starting with the second quarter 2024 dividend.
42
Stock Price Performance Graph
The graph below compares the cumulative total return of our common stock from December 31, 20122018 through December 31, 20172023, with the comparable cumulative return of three indices, the S&P 500 Index, the Dow Jones Industrial Average Index and the NASDAQNasdaq Telecommunications Index. The graph plots the growth in value of an initial investment of $100 in each of our common stock, the S&P 500 Index, the Dow Jones Industrial Average Index and the NASDAQNasdaq Telecommunications Index over the indicated time periods. The stock price performance shown on the graph is not necessarily indicative of future price performance. The following stock price performance graph shall not be deemed to be "filed"“filed” for purposes of Section 18 of the Exchange Act, nor shall this information be incorporated by reference into any future filing under the Securities Act or the Exchange Act or any other document, except to the extent that we specifically incorporate it by reference into such filing or document.

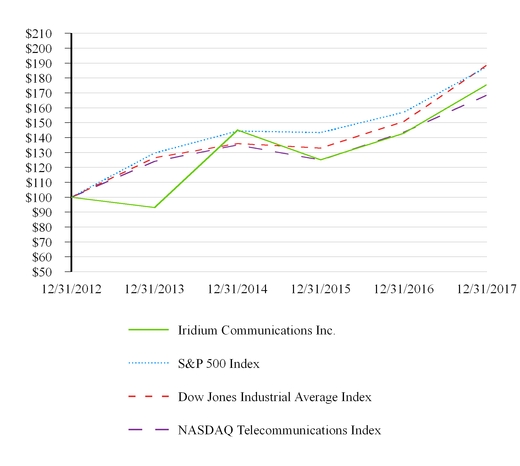
43
| 12/31/2012 | 12/31/2013 | 12/31/2014 | 12/31/2015 | 12/31/2016 | 12/31/2017 | ||||||||||||||||||
| Iridium Communications Inc. | $ | 100.00 | $ | 93.01 | $ | 145.09 | $ | 125.15 | $ | 142.86 | $ | 175.60 | |||||||||||
| S&P 500 Index | $ | 100.00 | $ | 129.60 | $ | 144.36 | $ | 143.31 | $ | 156.98 | $ | 187.47 | |||||||||||
| Dow Jones Industrial Average Index | $ | 100.00 | $ | 126.50 | $ | 136.01 | $ | 132.97 | $ | 150.81 | $ | 188.64 | |||||||||||
| NASDAQ Telecommunications Index | $ | 100.00 | $ | 124.02 | $ | 135.07 | $ | 124.94 | $ | 143.52 | $ | 168.54 | |||||||||||
The following table presents our monthly share repurchases for the quarter ended December 31, 2023:
| Period | (a) Total number of shares purchased | (b) Average price paid per share | (c) Total number of shares purchased as part of publicly announced plans or programs | (d) Maximum dollar value of shares that may yet be purchased under the plans or programs | |||||||||||||||||||||||||
| October 1-31 | 255,843 | $41.23 | 255,843 | $375.1 million | |||||||||||||||||||||||||
| November 1-30 | 844,963 | (1) | $37.37 | 816,963 | $344.6 million | ||||||||||||||||||||||||
| December 1-31 | 261,264 | $40.37 | 261,264 | $334.0 million | |||||||||||||||||||||||||
| Total | 1,362,070 | $38.67 | 1,334,070 | — | |||||||||||||||||||||||||
(1) Includes 28,000 shares purchased on November 20, 2023 at an average price of $37.01 per share by Matthew J. Desch, our chief executive officer, who may be deemed an affiliated purchaser.
To date, our board of directors has authorized the repurchase of up to $1,000.0 million of our common stock through December 31, 2025. Except for the shares purchased by Mr. Desch, all shares listed above were purchased under these authorizations in open market transactions.
Item 6. Selected Financial Data[Reserved].
| For the Year Ended December 31, | ||||||||||||||||||||
| Statement of Operations Data | 2017 | 2016 | 2015 | 2014 | 2013 | |||||||||||||||
| (In thousands, except per share amounts) | ||||||||||||||||||||
| Revenue: | ||||||||||||||||||||
| Services | $ | 349,735 | $ | 334,822 | $ | 317,022 | $ | 309,424 | $ | 292,092 | ||||||||||
| Subscriber equipment | 77,119 | 74,211 | 73,615 | 78,152 | 73,303 | |||||||||||||||
| Engineering and support services | 21,192 | 24,607 | 20,741 | 20,981 | 17,254 | |||||||||||||||
| Total revenue | $ | 448,046 | $ | 433,640 | $ | 411,378 | $ | 408,557 | $ | 382,649 | ||||||||||
Total operating expenses (1) | $ | 346,759 | $ | 257,269 | $ | 337,575 | $ | 285,646 | $ | 272,755 | ||||||||||
Operating income (3) | $ | 115,476 | $ | 176,371 | $ | 73,803 | $ | 122,911 | $ | 109,894 | ||||||||||
Net income (4) | $ | 233,856 | $ | 111,032 | $ | 7,123 | $ | 74,989 | $ | 62,517 | ||||||||||
| Comprehensive income | $ | 235,506 | $ | 114,649 | $ | 980 | $ | 72,758 | $ | 62,185 | ||||||||||
| Weighted average shares outstanding - basic | 97,934 | 95,967 | 95,097 | 88,080 | 76,909 | |||||||||||||||
| Weighted average shares outstanding - diluted | 128,130 | 124,875 | 95,097 | 109,400 | 87,511 | |||||||||||||||
| Net income (loss) per share - basic | $ | 2.23 | $ | 1.00 | $ | (0.09 | ) | $ | 0.71 | $ | 0.72 | |||||||||
| Net income (loss) per share - diluted | $ | 1.82 | $ | 0.89 | $ | (0.09 | ) | $ | 0.69 | $ | 0.71 | |||||||||
| As of December 31, | ||||||||||||||||||||
| Balance Sheet Data | 2017 | 2016 | 2015 | 2014 | 2013 | |||||||||||||||
| (In thousands) | ||||||||||||||||||||
| Total current assets | $ | 411,072 | $ | 516,770 | $ | 481,718 | $ | 573,113 | $ | 369,558 | ||||||||||
Total assets (1) (2) (4) | $ | 3,782,051 | $ | 3,499,625 | $ | 3,071,174 | $ | 2,773,237 | $ | 2,179,760 | ||||||||||
Total long-term liabilities (2) (4) | $ | 1,971,356 | $ | 2,072,673 | $ | 1,740,839 | $ | 1,439,023 | $ | 1,138,766 | ||||||||||
| Total stockholders' equity | $ | 1,596,469 | $ | 1,343,758 | $ | 1,228,721 | $ | 1,231,864 | $ | 939,495 | ||||||||||
| For the Year Ended December 31, | ||||||||||||||||||||
| Other Cash Flow Data | 2017 | 2016 | 2015 | 2014 | 2013 | |||||||||||||||
| (In thousands) | ||||||||||||||||||||
| Cash provided by (used in): | ||||||||||||||||||||
| Operating activities | $ | 259,621 | $ | 225,199 | $ | 217,479 | $ | 214,872 | $ | 183,048 | ||||||||||
| Investing activities | $ | (372,680 | ) | $ | (242,360 | ) | $ | (439,374 | ) | $ | (626,254 | ) | $ | (485,836 | ) | |||||
| Financing activities | $ | 16,866 | $ | 202,151 | $ | 197,066 | $ | 438,844 | $ | 234,712 | ||||||||||
Item 7. Management’s Discussion and Analysis of Financial Condition and Results of Operations
A discussion regarding our financial condition and results of operations for the year ended December 31, 2022 compared to the year ended December 31, 2021 can be found in Part II, Item 7, “Management’s Discussion and Analysis of Financial Condition and Results of Operations,” of our Annual Report on Form 10-K for the year ended December 31, 2022, as filed with the SEC on February 16, 2023.
Background
We were initially formed in 2007 as GHL Acquisition Corp., a special purpose acquisition company. In 2009, we acquired all the outstanding equity in Iridium Holdings LLC and changed our name to Iridium Communications Inc.
Overview of Our Business
We are engaged primarily in providing mobile voice and data communications services using a constellation of orbiting satellites. We are the only commercial provider of communications services offering true global coverage, connecting people, organizations and assets to and from anywhere, in real time. Our uniquelow-earth orbit, L-band satellite network provides reliable, weather-resilient communications services to regions of the world where terrestrial wireless or wireline networks do not exist or are limited, including remote land areas, open ocean, airways, the polar regions and regions where the telecommunications infrastructure has been affected by political conflicts or natural disasters.
We provide voice and data communications services to businesses, the U.S. and foreign governments, non-governmental organizations and consumers via our satellite network, which has an architecture of 66 operational satellites with in-orbit spares and related ground infrastructure. We utilize an interlinked mesh architecture to route traffic across the satellite constellation using radio frequency crosslinks.crosslinks between satellites. This unique architecture minimizes the need for ground facilities to support the constellation, which facilitates the global reach of our services and allows us to offer services in countries and regions where we have no physical presence.
We sell our products and services to commercial end users through a wholesale distribution network, encompassing approximately 140100 service providers, approximately 220300 value-added resellers, or VARs, and approximately 85 value-added manufacturers, or VAMs, who either sell directly to the end user or indirectly through other service providers, VARs or dealers. These distributors often integrate our products and services with other complementary hardware and software and have developed a broad suite of applications for our products and services targeting specific lines of business.
44
At December 31, 2017,2023, we had approximately 969,0002,279,000 billable subscribers worldwide, an increase of 119,000,280,000, or 14%, from approximately 850,0001,999,000 billable subscribers at December 31, 2016.2022. We have a diverse customer base, including end users in the following lines of business: land mobile;land-mobile, Internet of Things, or IoT; maritime; aviation;IoT, maritime, aviation and government.
We recognize revenue primarily from both the provision of services and the sale of equipment. Service revenue represented 78% and 77%74% of total revenue for each of the years ended December 31, 20172023 and 2016, respectively.2022. Voice and data, and IoT data and broadband service revenuerevenues have historically generated higher gross margins than subscriber equipment revenue.
revenue, and we expect this trend to continue. We are currently devoting a substantial part of our resources to develop Iridium NEXT, our next-generation satellite constellation, along with the development of new product and service offerings, upgrades to our current services, and hardware and software upgrades to maintain our ground infrastructure. We estimate the aggregate costs associated with the design, build and launch of Iridium NEXT and related ground infrastructure upgrades through 2018 to be approximately $3 billion. We expect to fund the costs of Iridium NEXT with the substantial majority of the fundsalso recognize revenue from our $1.8 billion loan facility, orhosted payloads, principally from Aireon, including fees for hosting the Credit Facility, which was fully drawn in February 2017,payloads and fees for transmitting data from the payloads over our network, as well as cash on handrevenue from other services, such as satellite time and internally generated cash flows, including cash flows from hosted payloads. We may also raise additional funds through the incurrence of indebtedness, as discussed below.location services.
During 2022, we expect those hosted payload payments to continue to be delayed. Aireon is working to secure additional contractsentered into agreements with air navigation service providers, or ANSPs, including the FAA, for the sale of Aireon’s space-based automatic dependent surveillance-broadcast, or ADS-B, services. Aireon is currently seeking to raise the capital it will need to fund its continued operationsSpace Exploration Technology Corp. and its hosted payload payments to us. Aireon’s ability to make its hosted payload payments to us in the previously anticipated timeframe has been adversely affected by delays in its completion of sales to these ANSPs.
Term Loan
On September 20, 2023, pursuant to an amended and restated credit agreement, or the Credit Agreement, we refinanced our previously existing term loan resulting in total borrowing of $1,500.0 million, which as amended and restated we refer to as the Term Loan. We also have an accompanying $100.0 million revolving loan, or the Revolving Facility. The Term Loan now bears interest at an annual rate equal to the Secured Overnight Financing Rate, or SOFR, plus 2.50%, with a 0.75% SOFR floor. We typically select a one-month interest period, with the result that interest is calculated using one-month SOFR. Interest is paid monthly on the last business day of the month. The maturity date of the Term Loan is in September 2030. Principal payments, payable quarterly beginning with the quarter ending March 31, 2024, equal $15.0 million per annum, which is one percent of the full principal amount of the Term Loan, with the remaining principal due upon maturity.
The Revolving Facility bears interest at an annual rate of SOFR plus 2.50% (but without a SOFR floor) if and as drawn, with no original issue discount, a commitment fee of 0.5% per year on the undrawn amount, which will be reduced to 0.375% if we have a consolidated first lien net leverage ratio, as defined in the Credit Agreement, of less than 3.5 to 1, and a maturity date in September 2028. See Note 7 to the consolidated financial statements included in this annual report for further discussion of our Term Loan and Revolving Facility.
In the fourth quarter of 2017.
The Credit Agreement restricts our ability to incur liens, engage in mergers or asset sales, pay dividends, repay subordinated indebtedness, incur indebtedness, make investments and loans, and engage in other transactions as restricted cash on our consolidated balance sheet. This minimum DSRA cash reserve requirement will increase to $189.0 millionspecified in 2019, subject to reduction as permitted by the anticipated agreement with our Credit Facility lenders as described above.
45
event our net leverage ratio rises above 3.5 to 1. As of December 31, 2023, our leverage ratio was below the specified level, and we were not required to make a mandatory prepayment with respect to 2023 cash flows.
Derivative Financial Instruments
We previously entered into a long-term interest rate swap, or the Swap, to mitigate variability in forecasted interest payments on a portion of our borrowings under the Term Loan. The Swap expired in November 2021. Under the Swap, on the last business day of each month, we received variable interest payments based on one-month LIBOR from the counterparty. We paid a fixed rate of 1.565% per annum on the Swap.
In July 2021, we entered into an interest rate cap agreement, or the Cap, that began in December 2021. The Cap manages our exposure to interest rate movements on a portion of the Term Loan through November 2026. The Cap, which was not affected by the refinancing of the Term Loan in September 2023, is designed to mirror the terms of the Term Loan and to offset the cash flows being hedged. We designated the Cap as a cash flow hedge of the variability of the SOFR-based interest payments on the Term Loan. The effective portion of the Cap’s change in fair value is recorded in accumulated other comprehensive income (loss) and reclassified into earnings during the period in which the hedged transaction affects earnings.
In December 2022, we modified the Cap to replace the previous LIBOR base rate with SOFR and received a credit risk adjustment from the counterparty of 0.064%. The modified Cap now provides us the right to receive payment from the counterparty if one-month SOFR exceeds 1.436% (1.5% less 0.064%). Prior to the amendment, we received payment under the terms of the Cap if one-month LIBOR exceeded 1.5%. We began paying a fixed monthly premium based on an annual rate of 0.31% for the 12-month periods ending each June 30 andCap in December 31 through December 31, 2017;
2021. The Cap carried a debt service coverage ratio, measured during the repayment period,notional amount of not less than 1 to 1.5;
We also entered into an interest rate swaption agreement, or the Swaption, for which we paid a fixed annual rate of 0.50%. We sold the Swaption in May 2021 for $0.7 million but continued to 1pay the fixed rate through the expiration of the Swaption in November 2021.
At inception, the Swap and Swaption were designated as of December 31, 2017. We were also in compliance with the operational EBITDA covenant, the annual capital expenditure covenant and the cumulative cash flow requirements from customers who have hosted payloads covenant, whichhedges for hedge accounting. The unrealized changes in market value were the onlyrecorded in accumulated other applicable covenants, as of December 31, 2017.
See Note 8 to our consolidated financial statements included in this report for further discussion of our derivative financial instruments.
Total Interest on Debt and Loss on Extinguishment
Total interest incurred includes amortization of deferred financing fees and capitalized interest. Due to the refinancing of the Term Loan in 2023, we incurred third-party financing costs of $15.9 million, of which $14.7 million was expensed. Due to the prepayments on the Term Loan in the respective covenant,fourth quarter of 2022, we would be permitted to allocate available cure amount, if any, to preventincurred a breach$1.2 million loss on extinguishment of debt for the write-off of the applicable covenant.related unamortized debt issuance costs for the portion of the Term Loan that was prepaid. To reprice the Term Loan in 2021, we incurred third-party financing costs of $4.9 million. These costs were expensed and are included within interest expense on the consolidated statements of operations and comprehensive income (loss) for the years ended December 31, 2023, 2022 and 2021. The repricings of the Term Loan in 2021 resulted in a $0.9 million loss on extinguishment of debt, as we wrote off the unamortized debt issuance costs related to the lenders who were fully repaid in an exchange of principal.
Total interest incurred during the years ended December 31, 2023, 2022 and 2021 was $102.3 million, $72.1 million and $72.8 million, respectively. Interest incurred includes amortization of deferred financing fees of $4.0 million, $4.8 million and $4.3 million for the years ended December 31, 2023, 2022 and 2021, respectively. Interest capitalized during the years ended December 31, 2023, 2022 and 2021 was $5.1 million, $2.6 million and $2.1 million, respectively. As of December 31, 2017, we had an amount of $8.1 million in available cure, although it was not necessary for us to apply any available cure amount to maintain compliance with the covenants. The available cure amount has fluctuated significantly from one measurement period to the next,2023 and we expect that it will continue to do so.
46
Material Trends and Uncertainties
Our industry and customer base hashave historically grown as a result of:
•demand for remote and reliable mobile communications services;
•a growing number of new products and services and related applications;
•a broad wholesale distribution network with access to diverse and geographically dispersed niche markets;
•increased demand for communications services by disaster and relief agencies and emergency first responders;
•improved data transmission speeds for mobile satellite service offerings;
•regulatory mandates requiring the use of mobile satellite services;
•a general reduction in prices of mobile satellite services and subscriber equipment; and
•geographic market expansion through the ability to offer our services in additional countries.
Nonetheless, we face a number of challenges and uncertainties in operating our business, including:
•our ability to maintain the health, capacity, control and level of service of our first-generation satellites through the completion of Iridium NEXT;satellites;
•our ability to develop and launch new and innovative products and services;
•changes in general economic, business and industry conditions, including the effects of currency exchange rates;
•our reliance on a single primary commercial gateway and a primary satellite network operations center;
•competition from other mobile satellite service providers and, to a lesser extent, from the expansion of terrestrial-based cellular phone systems and related pricing pressures;
•market acceptance of our products;
•regulatory requirements in existing and new geographic markets;
•challenges associated with global operations, including as a result of conflicts in or affecting markets in which we operate;
•rapid and significant technological changes in the telecommunications industry;
•our ability to generate sufficient internal cash flows to repay our debt;
•reliance on our wholesale distribution network to market and sell our products, services and applications effectively;
•reliance on a global supply chain, including single-source suppliers for the manufacture of most of our subscriber equipment and for some of the components required in the manufacture of our end-user subscriber equipment and our ability to purchase
component parts that are periodically subject to shortages resulting from surges in demand, natural disasters or other events;events, including a global pandemic, such as COVID-19; and
•reliance on a few significant customers, particularly agencies of the U.S. government, for a substantial portion of our revenue, as a result of which the loss or decline in business with any of these customers may negatively impact our revenue and collectability of related accounts receivable.
Critical Accounting Policies and Estimates
The discussion and analysis of our financial condition and results of operations is based upon our consolidated financial statements, which have been prepared in accordance with accounting principles generally accepted in the United States, or U.S. GAAP. The preparation of these financial statements requires the use of estimates and judgments that affect the reported amounts of assets, liabilities, revenue and expenses, and related disclosure of contingent assets and liabilities. On an ongoing basis, we evaluate our estimates, including those related to revenue recognition, collectability of accounts receivable,income taxes, useful lives of property and equipment, long-lived assets, goodwill and other intangible assets, inventory, internally developed software, deferred financing costs, income taxes, stock-based compensation, warranty expenses, loss contingencies, and other estimates. We base our estimates on historical experience and on various other assumptions that we believe to be reasonable under the circumstances. Actual results may differ from these estimates under different assumptions or conditions.
The accounting policies we believe to be most critical to understanding our financial results and condition and that require complex and subjective management judgments are discussed below. Our accounting policies are more fully described in Note 2 in Item 8 “Financial Statements and Supplementary Data.” Please see to the notes to our consolidated financial statements for a full discussion of these significant accounting policies.included in this report.
47
Income Taxes
We account for income taxes using the asset and liability approach. This approach requires that we recognize deferred tax assets
and liabilities based on differences between the financial statement bases and tax bases of our assets and liabilities. Deferred tax
assets and liabilities are recorded based upon enacted tax rates for the period in which the deferred tax items are expected to
reverse. Changes in tax laws or tax rates in various jurisdictions are reflected in the period of change. Significant judgment is
required in the calculation of our tax provision and the resulting tax liabilities as well as our ability to realize our deferred tax
assets. Our estimates of future taxable income and any changes to such estimates can significantly affectimpact our tax provision in a
given period. Significant judgment is required in determining our ability to realize our deferred tax assets related to federal,
state and foreign tax attributes within their carryforward periods including estimating the amount and timing of the future
reversal of deferred tax items in our projections of future taxable income. A valuation allowance is established to reduce
deferred tax assets to the amounts we expect to realize in the future. We also recognize tax benefits related to uncertain tax
positions only when we estimate that it is “more likely than not” that the position will be sustainable based on its technical
merits. If actual results are not consistent with our estimates and assumptions, this may result in material changes to our income
tax provision.
Property and Equipment
Property and equipment are stated at cost, less accumulated depreciation and amortization. Property and equipment are depreciated or amortized over their estimated useful lives. We apply judgment in determining the useful lives based on factors such as engineering data, our long-term strategy for using the assets, contractual terms related tothe manufacturer’s estimated design life for the assets, laws and regulations that could impact the useful lives of the assets and other economic factors. In evaluating the useful lives of our satellites, we assess the current estimated operational life of the satellites, including the potential impact of environmental factors on the satellites, ongoing operational enhancements and software upgrades. Additionally, we review engineering data relating to the operation and performance of our satellite network.
We depreciate our satellites over the shorter of their potential operational life or the period of their expected use. The appropriateness of the useful lives is evaluated on a quarterly basis or as events occur that require additional assessment. Our first-generationThe upgraded satellites are depreciated on a straight-line basis through the earlier of their estimated remaining useful life or the date they are expected to be replaced by Iridium NEXT satellites, which defines the period of their expected use, because we expect this will occur before the end of their operational lives. Iridium NEXT satellites whichthat have already been placed into service are depreciated using the straight-line method over their respective estimated useful lives.
In the fourth quarter of 2017, as noted above. No such charges were recorded for the years ended December 31, 2016 and 2015. We capitalize interest on the Credit Facility during the construction period of Iridium NEXT. Capitalized interest is added to the cost of2023, we updated our next-generation satellites.
48
Comparison of Our Results of Operations for the YearYears Ended December 31, 20172023 and the Year Ended December 31, 20162022
| Year Ended December 31, | |||||||||||||||||||||||||||||||||||
| % of Total Revenue | % of Total Revenue | Change | |||||||||||||||||||||||||||||||||
| ($ In thousands) | 2023 | 2022 | Dollars | Percent | |||||||||||||||||||||||||||||||
| Revenue: | |||||||||||||||||||||||||||||||||||
| Service revenue | |||||||||||||||||||||||||||||||||||
| Commercial | $ | 478,454 | 61 | % | $ | 428,721 | 59 | % | $ | 49,733 | 12 | % | |||||||||||||||||||||||
| Government | 106,000 | 13 | % | 106,000 | 15 | % | — | 0 | % | ||||||||||||||||||||||||||
| Total service revenue | 584,454 | 74 | % | 534,721 | 74 | % | 49,733 | 9 | % | ||||||||||||||||||||||||||
| Subscriber equipment | 105,136 | 13 | % | 134,714 | 19 | % | (29,578) | (22) | % | ||||||||||||||||||||||||||
| Engineering and support services | 101,133 | 13 | % | 51,599 | 7 | % | 49,534 | 96 | % | ||||||||||||||||||||||||||
| Total revenue | 790,723 | 100 | % | 721,034 | 100 | % | 69,689 | 10 | % | ||||||||||||||||||||||||||
| Operating expenses: | |||||||||||||||||||||||||||||||||||
| Cost of services (exclusive of depreciation | |||||||||||||||||||||||||||||||||||
| and amortization) | 158,710 | 20 | % | 115,137 | 16 | % | 43,573 | 38 | % | ||||||||||||||||||||||||||
| Cost of subscriber equipment | 66,410 | 8 | % | 86,012 | 12 | % | (19,602) | (23) | % | ||||||||||||||||||||||||||
| Research and development | 20,269 | 3 | % | 16,218 | 2 | % | 4,051 | 25 | % | ||||||||||||||||||||||||||
| Selling, general and administrative | 143,706 | 18 | % | 123,504 | 17 | % | 20,202 | 16 | % | ||||||||||||||||||||||||||
| Depreciation and amortization | 320,000 | 41 | % | 303,484 | 43 | % | 16,516 | 5 | % | ||||||||||||||||||||||||||
| Total operating expenses | 709,095 | 90 | % | 644,355 | 90 | % | 64,740 | 10 | % | ||||||||||||||||||||||||||
| Operating income | 81,628 | 10 | % | 76,679 | 10 | % | 4,949 | 6 | % | ||||||||||||||||||||||||||
| Other expense: | |||||||||||||||||||||||||||||||||||
| Interest expense, net | (90,387) | (11) | % | (65,089) | (9) | % | (25,298) | 39 | % | ||||||||||||||||||||||||||
| Loss on extinguishment of debt | — | 0 | % | (1,187) | 0 | % | 1,187 | (100) | % | ||||||||||||||||||||||||||
| Other income, net | 4,012 | 1 | % | 107 | 0 | % | 3,905 | 3,650 | % | ||||||||||||||||||||||||||
| Total other expense | (86,375) | (10) | % | (66,169) | (9) | % | (20,206) | 31 | % | ||||||||||||||||||||||||||
| Income (loss) before income taxes and equity in net earnings of affiliates | (4,747) | 0 | % | 10,510 | 1 | % | (15,257) | (145) | % | ||||||||||||||||||||||||||
| Income tax benefit (expense) | 26,251 | 3 | % | (292) | 0 | % | 26,543 | (9,090) | % | ||||||||||||||||||||||||||
| Loss on equity method investments | (6,089) | (1) | % | (1,496) | 0 | % | (4,593) | 307 | % | ||||||||||||||||||||||||||
| Net income | $ | 15,415 | 2 | % | $ | 8,722 | 1 | % | $ | 6,693 | 77 | % | |||||||||||||||||||||||
49
| Year Ended December 31, | ||||||||||||||||||||
% of Total Revenue | % of Total Revenue | Change | ||||||||||||||||||
| ($ In thousands) | 2017 | 2016 | Dollars | Percent | ||||||||||||||||
| Revenue: | ||||||||||||||||||||
| Service revenue | ||||||||||||||||||||
| Commercial | $ | 261,735 | 58 | % | $ | 246,822 | 57 | % | $ | 14,913 | 6 | % | ||||||||
| Government | 88,000 | 20 | % | 88,000 | 20 | % | — | 0 | % | |||||||||||
| Total service revenue | 349,735 | 78 | % | 334,822 | 77 | % | 14,913 | 4 | % | |||||||||||
| Subscriber equipment | 77,119 | 17 | % | 74,211 | 17 | % | 2,908 | 4 | % | |||||||||||
| Engineering and support services | 21,192 | 5 | % | 24,607 | 6 | % | (3,415 | ) | (14 | )% | ||||||||||
| Total revenue | 448,046 | 100 | % | 433,640 | 100 | % | 14,406 | 3 | % | |||||||||||
| Operating expenses: | ||||||||||||||||||||
| Cost of services (exclusive of depreciation | ||||||||||||||||||||
| and amortization) | 80,396 | 18 | % | 64,958 | 15 | % | 15,438 | 24 | % | |||||||||||
| Cost of subscriber equipment | 44,445 | 10 | % | 44,286 | 10 | % | 159 | 0 | % | |||||||||||
| Research and development | 15,247 | 3 | % | 16,079 | 4 | % | (832 | ) | (5 | )% | ||||||||||
| Selling, general and administrative | 84,405 | 19 | % | 82,552 | 19 | % | 1,853 | 2 | % | |||||||||||
| Depreciation and amortization | 122,266 | 27 | % | 49,394 | 11 | % | 72,872 | 148 | % | |||||||||||
| Total operating expenses | 346,759 | 77 | % | 257,269 | 59 | % | 89,490 | 35 | % | |||||||||||
| Gain on Boeing transaction | 14,189 | 3 | % | — | — | % | 14,189 | 100 | % | |||||||||||
| Operating income | 115,476 | 26 | % | 176,371 | 41 | % | (60,895 | ) | (35 | )% | ||||||||||
| Other income (expense): | ||||||||||||||||||||
| Interest income, net | 4,328 | 1 | % | 2,934 | 1 | % | 1,394 | 48 | % | |||||||||||
| Undrawn credit facility fees | (25 | ) | 0 | % | (1,346 | ) | 0 | % | 1,321 | (98 | )% | |||||||||
| Other income (expense), net | (207 | ) | 0 | % | 206 | (1 | )% | (413 | ) | (200 | )% | |||||||||
| Total other income (expense) | 4,096 | 1 | % | 1,794 | 0 | % | 2,302 | 128 | % | |||||||||||
| Income before income taxes | 119,572 | 27 | % | 178,165 | 41 | % | (58,593 | ) | (33 | )% | ||||||||||
| Income tax benefit (expense) | 114,284 | 25 | % | (67,133 | ) | (15 | )% | 181,417 | (270 | )% | ||||||||||
| Net income | $ | 233,856 | 52 | % | $ | 111,032 | 26 | % | $ | 122,824 | 111 | % | ||||||||
Commercial Service Revenue
| Year Ended December 31, | ||||||||||||||||||||||||||||||||
| 2017 | 2016 | Change | ||||||||||||||||||||||||||||||
| Revenue | Billable Subscribers (1) | ARPU (2) | Revenue | Billable Subscribers (1) | ARPU (2) | Revenue | Billable Subscribers | ARPU | ||||||||||||||||||||||||
| (Revenue in millions and subscribers in thousands) | ||||||||||||||||||||||||||||||||
| Commercial voice and data | $ | 177.7 | 359 | $ | 42 | $ | 177.7 | 353 | $ | 42 | $ | — | 6 | $ | — | |||||||||||||||||
| Commercial IoT data | 74.1 | 510 | 13 | 65.5 | 413 | 14 | 8.6 | 97 | (1.0 | ) | ||||||||||||||||||||||
Hosted payload and other data services (3) | 9.9 | N/A | 3.6 | N/A | 6.3 | N/A | ||||||||||||||||||||||||||
| Total Commercial | $ | 261.7 | 869 | $ | 246.8 | 766 | $ | 14.9 | 103 | |||||||||||||||||||||||
| Year Ended December 31, | |||||||||||||||||||||||||||||||||||||||||||||||||||||
| 2023 | 2022 | Change | |||||||||||||||||||||||||||||||||||||||||||||||||||
| Revenue | Billable Subscribers (1) | ARPU (2) | Revenue | Billable Subscribers (1) | ARPU (2) | Revenue | Billable Subscribers | ARPU | |||||||||||||||||||||||||||||||||||||||||||||
| (Revenue in millions and subscribers in thousands) | |||||||||||||||||||||||||||||||||||||||||||||||||||||
| Commercial services: | |||||||||||||||||||||||||||||||||||||||||||||||||||||
| Voice and data | $ | 219.2 | 408 | $ | 45 | $ | 193.1 | 397 | $ | 42 | $ | 26.1 | 11 | $ | 3 | ||||||||||||||||||||||||||||||||||||||
| IoT data | 141.0 | 1,709 | $ | 7.45 | 125.0 | 1,448 | $ | 7.89 | 16.0 | 261 | $ | (0.44) | |||||||||||||||||||||||||||||||||||||||||
Broadband (3) | 57.9 | 16.7 | $ | 305 | 51.1 | 15.0 | $ | 302 | 6.8 | 1.7 | $ | 3 | |||||||||||||||||||||||||||||||||||||||||
| Hosted payload and other data | 60.3 | N/A | 59.5 | N/A | 0.8 | N/A | |||||||||||||||||||||||||||||||||||||||||||||||
| Total commercial services | $ | 478.4 | 2,134 | $ | 428.7 | 1,860 | $ | 49.7 | 274 | ||||||||||||||||||||||||||||||||||||||||||||
(1)Billable subscriber numbers are shown as of the end of the respective period.
(2)Average monthly revenue per unit, or ARPU, is calculated by dividing revenue in the respective period by the average of the number of billable subscribers at the beginning of the period and the number of billable subscribers at the end of the period and then dividing the result by the number of months in the period. Billable subscriber and ARPU data is not applicable for hosted payload and other data service revenue items.
(3)Commercial broadband consists of Iridium OpenPort and Iridium Certus broadband services.
For the year ended December 31, 2017,2023, total commercial service revenue increased $14.9$49.7 million, or 6%12%, primarily as a result of increases in voice and data, IoT, and broadband revenue mainly driven by increases in billable subscribers. Commercial voice and data revenue increased $26.1 million, or 14%, from the prior year primarily due to thean increase in ARPU resulting from certain price increases in access fees and an increase in volume across voice and data services. Commercial IoT of $8.6revenue increased $16.0 million, or 13%, compared to the prior year. Theyear, driven by an 18% increase in IoT is primarily due to a 23%billable subscribers including continued strength in personal communications devices. The subscriber increase in commercial IoT data billable subscribers,effect on revenue was partially offset by a decline6% reduction in the relatedIoT ARPU, primarily due to the growth inshifting mix of subscribers using lower data usage plans.ARPU plans, including the increased proportion of personal communication subscribers. Commercial broadband revenue increased $6.8 million, or 13%, compared to the prior year, due to the increase in broadband billable subscribers. Hosted payload and other data service revenue increased $6.3$0.8 million, or 175%1%, fromwhich is relatively consistent year over year. There were two offsetting items in the priorcurrent year, primarily duethe one-time recognition of approximately $2.0 million of revenue related to an updated estimate on a customer contract, offset by a $2.3 million decrease in hosted payload revenue related to the commencementchange in the estimated useful lives of hosting and data services. We anticipateour satellites. As a result of this change in estimate, we expect that hosted payload revenue from our hosting and data services to increase as more Iridium NEXT satellites are placed into service overwill decrease by approximately $9.1 million per year for the launch campaign, which is expected to be completed in 2018. remainder of the estimated useful lives.
Government Service Revenue
| Year Ended December 31, | ||||||||||||||||||||
| 2017 | 2016 | Change | ||||||||||||||||||
| Revenue | Billable Subscribers (1) | Revenue | Billable Subscribers (1) | Revenue | Billable Subscribers | |||||||||||||||
| (Revenue in millions and subscribers in thousands) | ||||||||||||||||||||
| Government service revenue | $ | 88 | 100 | $ | 88 | 84 | $ | — | 16 | |||||||||||
| Year Ended December 31, | |||||||||||||||||||||||||||||||||||
| 2023 | 2022 | Change | |||||||||||||||||||||||||||||||||
| Revenue | Billable Subscribers (1) | Revenue | Billable Subscribers (1) | Revenue | Billable Subscribers | ||||||||||||||||||||||||||||||
| (Revenue in millions and subscribers in thousands) | |||||||||||||||||||||||||||||||||||
| Government service revenue | $ | 106.0 | 145 | $ | 106.0 | 139 | $ | — | 6 | ||||||||||||||||||||||||||
(1)Billable subscriber numbers shown are at the end of the respective period.
We provide Iridium airtime and airtime support to U.S. government and other authorized customers pursuant to a five-yearour Enhanced Mobile Satellite Services, or EMSS, contract executed in October 2013 and managed by DISA.contract. Under the terms of this agreement, which we entered into in September 2019, authorized customers utilize specified Iridium airtime services provided through the U.S. Department of Defense’s, or DoD’s,government’s dedicated gateway. These services include unlimited global secure and unsecure voice, low and high-speed data, paging, broadcast, and Distributed Tactical Communications System, or DTCS, services for an unlimited number of DoD and other federal subscribers. The service fee under the EMSS contract is fixed at $88 million per year for the remainder of the term, and is not based on subscribers or usage, allowing an unlimited number of users access to existingthese services. The EMSS contract expiresRevenue for the year ended December 31, 2023 was unchanged from the prior year, in October 2018, although based on federal acquisition regulations, the government has the ability to unilaterally extend for an additional six months. We have begun discussionsaccordance with the U.S. government on a new EMSS contract, which we expect to enter into later in 2018 or in 2019.contract.
50
Subscriber Equipment Revenue
Subscriber equipment revenue increased $2.9decreased $29.6 million, or 4%22%, to $77.1$105.1 million for the year ended December 31, 20172023 compared to the prior year. This increase wasyear, primarily due to increased unitthe expected decrease in sales volume of handsetsShort Burst Data devices, L-Band transceivers and L-band transceivers.handsets. In 2024, we expect equipment sales to be lower than 2023 and more in line with periods prior to 2022, before we and our competitors began to experience supply chain disruptions due to the pandemic.
Engineering and Support Service Revenue
| Year Ended December 31, | ||||||||||||||||||||||||||||||||||
| Year Ended December 31, | 2023 | 2022 | Change | |||||||||||||||||||||||||||||||
| 2017 | 2016 | Change | (In millions) | |||||||||||||||||||||||||||||||
| (In millions) | ||||||||||||||||||||||||||||||||||
| Commercial | $ | 3.1 | $ | 2.2 | $ | 0.9 | ||||||||||||||||||||||||||||
| Commercial | ||||||||||||||||||||||||||||||||||
| Commercial | ||||||||||||||||||||||||||||||||||
| Government | 18.1 | 22.4 | (4.3 | ) | ||||||||||||||||||||||||||||||
| Total | $ | 21.2 | $ | 24.6 | $ | (3.4 | ) | |||||||||||||||||||||||||||
Engineering and support service revenue decreasedincreased by $3.4$49.5 million, or 14%96%, for the year ended December 31, 20172023 compared to the prior year primarily due to the increased work under certain government projects, predominantly the contract awarded by the Space Development Agency, or the SDA. Based on the SDA contract, we expect engineering and support service revenue, as a resultwell as associated expenses, to be generally higher than in prior years throughout the life of decreased revenue under a contract with the DoD to adapt the Iridium Extreme® handset for DoD applications, which was completed during 2017.SDA contract.
Operating Expenses
Cost of Services (exclusive of depreciation and amortization)
Cost of services (exclusive of depreciation and amortization) includes the cost of network engineering and operations staff, including contractors, software maintenance, product support services, and cost of services for government and commercial engineering and support service revenue.
Cost of services (exclusive of depreciation and amortization) increased by $15.4$43.6 million, or 24%38%, for the year ended December 31, 20172023 compared to the prior year, primarily as a result of insurance costs from Iridium NEXT satellites placed into service during 2017. We expect our insurance expenses to increaseincreased work under certain government projects, including the SDA contract, as we place Iridium NEXT satellites into service throughout the launch campaign, which we expect to complete in 2018.noted above.
Cost of Subscriber Equipment
Cost of subscriber equipment includes the direct costs of equipment sold, which consist of manufacturing costs, allocation of overhead, and warranty costs.
Cost of subscriber equipment increased $0.2decreased $19.6 million, which was substantially the sameor 23%, for the year ended December 31, 2017 as in2023 compared to the prior year.year period primarily due to the decrease in volume of device sales, as described above.
Research and Development
Research and development expenses increased by $4.1 million, or 25%, for the year ended December 31, 2023 compared to the prior year period based on increased spending on device-related features for our network.
Selling, General and Administrative
Selling, general and administrative expenses that are not directly attributable to the sale of services or products include sales and marketing costs as well as employee-related expenses (such as salaries, wages, and benefits), legal, finance, information technology, facilities, billing and customer care expenses.
Selling, general and administrative expenses increased by $1.9$20.2 million, or 2%16%, for the year ended December 31, 2017 compared to the prior year,2023, primarily due to personnel costs from increased headcount and higher employee stock-based compensation expense, increased marketing expenses and increased professional fees, associated with government regulatory requirements and other services.offset in part by a decrease in stock appreciation rights expense in the current year resulting from a decrease in our stock valuation between the years.
51
Depreciation and Amortization
Depreciation and amortization expense increased by $72.9$16.5 million, or 148%5%, for the year ended December 31, 20172023, compared to the prior year. As described above, we recorded accelerated depreciation expense of $37.5 million for our remaining ground spare satellite in the second quarter of 2023, following completion of on-orbit testing of our five newly launched spare satellites. This increase was offset in part by a decrease in depreciation expense of $25.5 million for the year ended December 31, 2023 due to the change in estimated useful lives of our satellites. As a result of this change in estimate, we expect that depreciation expense will decrease by approximately $111.0 million per year for the remainder of the estimated useful lives.
Other Expense
Interest Expense, net
Interest expense, net, for the year ended December 31, 2023 was $90.4 million, compared to $65.1 million for the prior year. The increase in interest expense, net resulted primarily from the $14.7 million in fees expensed in connection with the refinancing of our Term Loan in September 2023 and an increase in the base rate of our Term Loan compared to the prior year primarily dueperiod.
Loss on Extinguishment of Debt
Loss on extinguishment of debt was $1.2 million for the year ended December 31, 2022 as a result of our election to prepay a total of $100.0 million, and the write-off the related unamortized debt issuance costs. There were no losses for the year ended December 31, 2023 in connection with the refinancing of $36.8our Term Loan.
Other Income, net
Other income, net, was $4.0 million for the year ended December 31, 2023, compared to other expense, net, of $0.1 million for the prior year primarily as a result of a one-time customer contractual settlement which resulted in recognition of $3.5 million of the construction-in-progress associated with the Kosmotras launch services in 2017 and the addition of new assets, including Iridium NEXT satellites placed into service during 2017. Excluding the impact of Kosmotras, we expect our depreciation expense to increase as we place Iridium NEXT satellites into service throughout the launch campaign, which we expect to complete in 2018.
Income Tax Benefit (Expense)
For the year ended December 31, 2017,2023, our income tax benefit was $114.3$26.3 million, compared to an income tax expense of $67.1$0.3 million for the prior year. Our effective tax rate was approximately -95.6%553.0% for the year ended December 31, 20172023 compared to 37.7%2.8% for the prior year. The decreaseincrease in the effectiveincome tax rate wasbenefit is primarily related to the net impact of (i) pre-tax book loss in the current year compared to pre-tax book income in the prior year, (ii) an increase in estimated R&D credits, and (iii) an increased stock compensation tax benefit on remeasuring our ending deferred tax balances at 21%, from 35%, for years beginning after December 31, 2017, to reflect the new tax rate under the Tax Act. Asbenefit. If our current estimates change in future periods, the impact on the deferred tax assets and liabilities may change correspondingly. See Note 12 to our consolidated financial statements for more detail on the individual items impacting our effective tax rate for the years.
Loss on Equity Method Investments
For the year ended December 31, 2023, our loss on equity method investments was $6.1 million, compared to a loss $1.5 million in the prior year. The increase in loss primarily reflects the increased duration the equity method investments were outstanding and the related portion of losses recorded on our those investments during each period.
Net Income
Net income was $233.9$15.4 million for the year ended December 31, 2017, an increase of $122.82023, compared to $8.7 million from the prior year. This increase in net income was primarily driven by the decrease in the provision for income taxes and increase in revenue, offset by increases in depreciation expense, including the accelerated depreciation related to the write-off of Kosmotras launch services, as described above.
| Year Ended December 31, | Change | |||||||||||||||||||
| ($ In thousands) | 2016 | % of Total Revenue | 2015 | % of Total Revenue | Dollars | Percent | ||||||||||||||
| Revenue: | ||||||||||||||||||||
| Service revenue | ||||||||||||||||||||
| Commercial | $ | 246,822 | 57 | % | $ | 241,925 | 59 | % | $ | 4,897 | 2 | % | ||||||||
| Government | 88,000 | 20 | % | 75,097 | 18 | % | 12,903 | 17 | % | |||||||||||
| Total service revenue | 334,822 | 77 | % | 317,022 | 77 | % | 17,800 | 6 | % | |||||||||||
| Subscriber equipment | 74,211 | 17 | % | 73,615 | 18 | % | 596 | 1 | % | |||||||||||
| Engineering and support services | 24,607 | 6 | % | 20,741 | 5 | % | 3,866 | 19 | % | |||||||||||
| Total revenue | 433,640 | 100 | % | 411,378 | 100 | % | 22,262 | 5 | % | |||||||||||
| Operating expenses: | ||||||||||||||||||||
Cost of services (exclusive of depreciation and amortization) | 64,958 | 15 | % | 60,306 | 15 | % | 4,652 | 8 | % | |||||||||||
| Cost of subscriber equipment | 44,286 | 10 | % | 40,807 | 10 | % | 3,479 | 9 | % | |||||||||||
| Research and development | 16,079 | 4 | % | 16,144 | 4 | % | (65 | ) | 0 | % | ||||||||||
| Selling, general and administrative | 82,552 | 19 | % | 81,445 | 20 | % | 1,107 | 1 | % | |||||||||||
| Depreciation and amortization | 49,394 | 11 | % | 51,834 | 13 | % | (2,440 | ) | (5 | )% | ||||||||||
| Impairment of goodwill | — | 0 | % | 87,039 | 21 | % | (87,039 | ) | (100 | )% | ||||||||||
| Total operating expenses | 257,269 | 59 | % | 337,575 | 82 | % | (80,306 | ) | (24 | )% | ||||||||||
| Operating income | 176,371 | 41 | % | 73,803 | 18 | % | 102,568 | 139 | % | |||||||||||
| Other income (expense): | ||||||||||||||||||||
| Interest income, net | 2,934 | 1 | % | 3,069 | 1 | % | (135 | ) | (4 | )% | ||||||||||
| Undrawn credit facility fees | (1,346 | ) | 0 | % | (3,289 | ) | (1 | )% | 1,943 | (59 | )% | |||||||||
| Other expense, net | 206 | (1 | )% | (468 | ) | (1 | )% | 674 | (144 | )% | ||||||||||
| Total other expense | 1,794 | 0 | % | (688 | ) | (1 | )% | 2,482 | (361 | )% | ||||||||||
| Income before income taxes | 178,165 | 41 | % | 73,115 | 17 | % | 105,050 | 144 | % | |||||||||||
| Income tax expense | (67,133 | ) | (15 | )% | (65,992 | ) | (16 | )% | $ | (1,141 | ) | 2 | % | |||||||
| Net income | $ | 111,032 | 26 | % | $ | 7,123 | 1 | % | $ | 103,909 | 1,459 | % | ||||||||
| Year Ended December 31, | |||||||||||||||||||||||||||||
| 2016 | 2015 | Change | |||||||||||||||||||||||||||
| Revenue | Billable Subscribers (1) | ARPU(2) | Revenue | Billable Subscribers (1) | ARPU(2) | Revenue | Billable Subscribers | ARPU | |||||||||||||||||||||
| (Revenue in millions and subscribers in thousands) | |||||||||||||||||||||||||||||
| Commercial voice and data | $ | 177.7 | 353 | $ | 42 | $ | 178.4 | 351 | $ | 42 | $ | (0.7 | ) | 2 | $ | — | |||||||||||||
| Commercial IoT data | 65.5 | 413 | $ | 14 | 61.3 | 359 | $ | 15 | 4.2 | 54 | $ | (1 | ) | ||||||||||||||||
Hosted payload and other data services (3) | $ | 3.6 | N/A | $ | 2.2 | N/A | $ | 1.4 | N/A | ||||||||||||||||||||
| Total Commercial | $ | 246.8 | 766 | $ | 241.9 | 710 | $ | 4.9 | 56 | ||||||||||||||||||||
| Year Ended December 31, | |||||||||||||||||
| 2016 | 2015 | Change | |||||||||||||||
| Revenue | Billable Subscribers (1) | Revenue | Billable Subscribers (1) | Revenue | Billable Subscribers | ||||||||||||
| (Revenue in millions and subscribers in thousands) | |||||||||||||||||
| Government service revenue | $ | 88.0 | 84 | $ | 75.1 | 72 | $ | 12.9 | 12 | ||||||||
| Year Ended December 31, | |||||||||||
| 2016 | 2015 | Change | |||||||||
| (In millions) | |||||||||||
| Commercial | $ | 2.2 | $ | 2.0 | $ | 0.2 | |||||
| Government | 22.4 | 18.7 | 3.7 | ||||||||
| Total | $ | 24.6 | $ | 20.7 | $ | 3.9 | |||||
Liquidity and Capital Resources
Our primary sources of liquidity are cash provided by operations, cash and cash equivalents and our Revolving Facility. At December 31, 2023, we had $1.5 billion of indebtedness, consisting exclusively of amounts outstanding under the Term Loan, the terms of which are described above under the section captioned “Term Loan.” We have additional borrowing available to us under our Revolving Facility of $100.0 million at December 31, 2023. These sources are expected to meet our short-term and long-term liquidity needs, including annual payments for (i) required principal and interest on the Term Loan, which we expect
52
to be $15.0 million and, based on the current interest rate, approximately $80.0 million, respectively, (ii) capital expenditures of approximately $60.0 million, (iii) working capital, (iv) potential share repurchases, and (v) anticipated cash dividend payments to holders of our common stock.
As of December 31, 2017,2023, our total cash and cash equivalents balance was $285.9$71.9 million, and our marketable securities balancedown from $168.8 million as of December 31, 2022. The decrease was $11.8 million. Our principal sources of liquidity are cash, cash equivalents and marketable securities, and internally generated cash flows. Our principal liquidity requirements over the next twelve months are to meet capital expenditure needs, principally the continued deploymentresult of Iridium NEXT, as well as for working$247.0 million in repurchases of our common stock, $73.5 million in capital interest, DSRA contributions, principal payments on the Credit Facility,expenditures and $64.8 million in dividends payable on our Series A Preferred Stock and Series B Preferred Stock. As described in more detail below, we also anticipate incurring additional debt in order to raise additional capital for these purposes.
As of December 31, 2017,2023, we reported $1,703.6held non-cancelable purchase obligations of approximately $21.5 million in borrowingsfor inventory purchases with Benchmark, our primary third-party equipment supplier. Our purchase obligations, all of which are due during 2024, decreased $35.4 million from the end of 2022 primarily due to recovery from supply-chain constraints.
Our material long-term cash requirement is the repayment of the remaining principal amount under the Credit FacilityTerm Loan upon its maturity in 2030, which is expected to be $1,402.5 million, at that time. We expect to refinance this amount at or prior to maturity.
Dividends
On December 8, 2022, our consolidated balance sheet, netBoard of $96.4 million of deferred financing costs, for an aggregate balance of $1,800.0 million outstanding under the Credit Facility. Pursuant to the Credit Facility, we maintain the DSRA. AsDirectors initiated a quarterly dividend. In each of December 31, 2017, the DSRA balance was $102.4 million, which is classified as restricted cash in our condensed consolidated balance sheet. The DSRA requirement is scheduled to increase to $189.0 million in 2019. In addition to the minimum debt service levels, financial covenants under the Credit Facility, as amended to date, include:
Cash Flows - Comparison of the YearYears Ended December 31, 20172023 and the Year Ended December 31, 20162022
The following table shows our consolidated cash flows from operating, investing and financing activities for the years ended December 31 (in millions):flows:
| Year Ended December 31, | ||||||||||||||||||||||||||||||||||||||||||||||||||||||
| Statement of Cash Flows | ||||||||||||||||||||||||||||||||||||||||||||||||||||||
| Statement of Cash Flows | ||||||||||||||||||||||||||||||||||||||||||||||||||||||
| Statement of Cash Flows | 2023 | 2022 | Change | |||||||||||||||||||||||||||||||||||||||||||||||||||
| (in thousands) | (in thousands) | |||||||||||||||||||||||||||||||||||||||||||||||||||||
| Statement of Cash Flows | 2017 | 2016 | Change | |||||||||||||||||||||||||||||||||||||||||||||||||||
| Net cash provided by operating activities | ||||||||||||||||||||||||||||||||||||||||||||||||||||||
| Net cash provided by operating activities | ||||||||||||||||||||||||||||||||||||||||||||||||||||||
| Net cash provided by operating activities | $ | 259.6 | $ | 225.2 | $ | 34.4 | ||||||||||||||||||||||||||||||||||||||||||||||||
| Net cash used in investing activities | $ | (372.7 | ) | $ | (242.4 | ) | $ | (130.3 | ) | |||||||||||||||||||||||||||||||||||||||||||||
| Net cash provided by financing activities | $ | 16.9 | $ | 224.2 | $ | (207.3 | ) | |||||||||||||||||||||||||||||||||||||||||||||||
| Net cash used in financing activities | ||||||||||||||||||||||||||||||||||||||||||||||||||||||
Cash Flows from Operating Activities
Net cash provided by operating activities for the year ended December 31, 2017 increased by $34.42023 decreased $29.8 million from the prior year. This increase was primarily dueCash flows related to a $33.0 million decreasechanges in working capital decreased by approximately $38.7 million, primarily as a result of an increase in cash outflows for replenished finished goods and component inventory, including last-time buys, as well as lower cash inflows related to timing ofdeferred revenue. These changes in working capital were offset by cash flows provided by prepaid and other current assets, accrued expenses and deferred revenues. Working capital provided by operations is primarily driven by launch related activities, including utilization of prepaid expensesinflows for accounts receivable related to launch serviceslower equipment sales. These changes were also partially offset by net income, as adjusted for non-cash activities, which increased by $8.9 million over the prior year. Net income was adjusted for non-cash, positive adjustments, including depreciation expense associated with the write-off of the remaining spare satellite in the third quarter, and receipt of payments for milestones related to hosted payloads.stock-based compensation expense, partially offset by non-cash deferred taxes.
Cash Flows from Investing Activities
Net cash used in investing activities for the year ended December 31, 20172023 decreased $37.8 million from the prior year period primarily as a result of our $50.0 million investment in Aireon Holdings in 2022, compared to our $10.0 million investment in Satelles in 2023, offset in part by increased by $130.3capital expenditures of $2.2 million, primarily duerelated to fewer available-for-sale securities held inpayments for the current period, resulting in lower proceeds from investment maturities, offset by a $5.6 million decrease in capital expenditures. Welaunched ground spares. Going forward, we expect our capital expenditures to continue to decline as we complete the construction and launch of the Iridium NEXT constellation in 2018.average approximately $60.0 million per year through 2030.
53
Cash Flows from Financing Activities
Net cash provided byused in financing activities for the year ended December 31, 20172023 decreased by $207.3$47.9 million compared to the prior year period primarily due to the decrease in borrowings and related fees under our Credit Facility in 2017, as it was fully drawn in February 2017, offset by the decrease in payments of preferred stock dividends related to the five-quarter deferral of preferred dividends that began in the second quarter of 2017.
| Statement of Cash Flows | 2016 | 2015 | Change | |||||||||
| Net cash provided by operating activities | $ | 225.2 | $ | 217.5 | $ | 7.7 | ||||||
| Net cash used in investing activities | $ | (242.4 | ) | $ | (439.4 | ) | $ | 197.0 | ||||
| Net cash provided by financing activities | $ | 224.2 | $ | 202.1 | $ | 22.1 | ||||||
| Contractual Obligations | Less than 1 year | 1-3 Years | 3-5 years | More than 5 years | Total | |||||||||||||||
| Payment obligations: | ||||||||||||||||||||
Thales (1) | $ | 216.8 | $ | 100.0 | $ | — | $ | — | $ | 316.8 | ||||||||||
Interest on Thales bills of exchange (1) | — | 3.6 | — | — | 3.6 | |||||||||||||||
SpaceX (2) | 46.9 | 10.2 | — | — | 57.1 | |||||||||||||||
Launch and in-orbit insurers (3) | 43.2 | — | — | — | 43.2 | |||||||||||||||
Boeing (4) | 6.0 | 12.0 | 6.0 | — | 24.0 | |||||||||||||||
Debt obligations: (5) | ||||||||||||||||||||
| Principal | 85.5 | 490.5 | 612.0 | 612.0 | 1,800.0 | |||||||||||||||
| Contractual interest | 79.6 | 154.4 | 98.6 | 37.5 | 370.1 | |||||||||||||||
| Debt service reserve account | — | 87.0 | — | — | 87.0 | |||||||||||||||
Operating lease obligations (6) | 3.7 | 7.5 | 7.2 | 8.8 | 27.2 | |||||||||||||||
Uncertain tax positions (7) | — | — | — | — | 1.0 | |||||||||||||||
Unconditional purchase obligations (8) | 17.0 | 3.4 | 1.0 | — | 21.4 | |||||||||||||||
| Total | $ | 498.7 | $ | 868.6 | $ | 724.8 | $ | 658.3 | $ | 2,751.4 | ||||||||||
Seasonality
Our results of operations have been subject to seasonal usage changes for commercial customers, and we expect that our results will be affected by similar seasonality going forward. March through October are typically the peak months for commercial voice services revenue and related subscriber equipment sales. U.S. government revenue and commercial IoT revenue have been less subject to seasonal usage changes.
Item 7A. Quantitative and Qualitative Disclosures About Market Risk
We have not borrowed under our Revolving Facility. Accordingly, although the CreditRevolving Facility bearbears interest at SOFR plus 2.5%, without a floating rate equalSOFR floor, if and as drawn, we are not currently exposed to the London Interbank Offered Rate, or LIBOR, plus 1.95% and will, accordingly, subject us to interest rate fluctuations in future periods. Had the currently outstanding borrowings under the Credit Facility been outstanding throughout the year ended December 31, 2017, a one-half percentage point increase or decrease in the LIBOR would not have had a material impact oninterest rates with respect to our interest cost for the period.Revolving Facility.
Financial instruments that potentially subject us to concentrations of credit risk consist primarily of cash and cash equivalents, as well as accounts receivable. We maintain our cash and cash equivalents with financial institutions with high credit ratings and at times maintain the balance of our deposits in excess of federally insured limits. The majority of our cash is swept nightly into a money market fund invested in U.S. treasuries, Agency Mortgage Backed Securitiesagency mortgage backed securities and/or U.S. government guaranteed debt. Accounts receivable are due from both domestic and international customers. We perform credit evaluations of our customers’ financial condition and record reserves to provide for estimated credit losses. Accounts payable are owed to both domestic and international vendors.
54
Item 8. Financial Statements and Supplementary Data
| Page | |||||
| Iridium Communications Inc.: | |||||
55
Report of Ernst & Young LLP, Independent Registered Public Accounting Firm
To the Stockholders and the Board of Directors of
Iridium Communications Inc.:
Opinion on the Consolidated Financial Statements
We have audited the accompanying consolidated balance sheetssheet of Iridium Communications Inc. and subsidiaries (the Company) as of December 31, 20172023 and 2016, andDecember 31, 2022, the related consolidated statements of operations and comprehensive income (loss), changes in stockholders’ equity, and cash flows for each of the three years in the periodthen ended, December 31, 2017 and the related notes (collectively, referred to as the “consolidatedconsolidated financial statements”)statements). In our opinion, the consolidated financial statements present fairly, in all material respects, the financial position of the Company as of December 31, 20172023 and 2016,December 31, 2022, and the results of its operations and its cash flows for each of the three years in the periodthen ended, December 31, 2017, in conformity with U.S. generally accepted accounting principles.
Basis for Opinion
These consolidated financial statements are the responsibility of the Company’s management. Our responsibility is to express an opinion on the Company’sthese consolidated financial statements based on our audits. We are a public accounting firm registered with the PCAOB and are required to be independent with respect to the Company in accordance with the U.S. federal securities laws and the applicable rules and regulations of the Securities and Exchange Commission and the PCAOB.
We conducted our audit in accordance with the standards of the PCAOB. Those standards require that we plan and perform the audit to obtain reasonable assurance about whether the consolidated financial statements are free of material misstatement, whether due to error or fraud. Our audits included performing procedures to assess the risks of material misstatement of the consolidated financial statements, whether due to error or fraud, and performing procedures that respond to those risks. Such procedures included examining, on a test basis, evidence regarding the amounts and disclosures in the consolidated financial statements. Our audits also included evaluating the accounting principles used and significant estimates made by management, as well as evaluating the overall presentation of the consolidated financial statements. We believe that our audits provides a reasonable basis for our opinion.
Critical Audit Matter
The critical audit matter communicated below is a matter arising from the current period audit of the consolidated financial statements that was communicated or required to be communicated to the audit committee and that: (1) relates to accounts or disclosures that are material to the consolidated financial statements and (2) involved our especially challenging, subjective, or complex judgments. The communication of a critical audit matter does not alter in any way our opinion on the consolidated financial statements, taken as a whole, and we are not, by communicating the critical audit matter below, providing a separate opinion on the critical audit matter or on the accounts or disclosures to which it relates.
Changes in estimated useful lives of satellites
As discussed in Note 2 to the consolidated financial statements, the Company’s satellites are depreciated using the straight-line method over their respective estimated useful lives, which was extended from 12.5 years to 17.5 years during the fourth quarter of 2023. The Company applied judgment in determining the useful lives based on factors such as engineering data relating to the operation and performance of its satellite network, the Company’s long-term strategy for using the assets, and the manufacturer’s estimated design life for the assets. As discussed in Note 4, as of December 31, 2023, the Company had recorded $1,926,487 thousand in total depreciable property and equipment, net of accumulated depreciation, which included its satellites.
We identified the evaluation of the determination of changes in estimated useful lives of satellites as a critical audit matter. A high degree of subjective auditor judgment was required to evaluate the Company’s estimated useful lives of the satellites. Specifically, assessing the factors used to determine the estimated useful lives required subjective auditor judgment due to the degree of uncertainty associated with the outcome of uncertain future events which required forward looking assumptions. Changes to the estimated useful lives of satellites could have a significant impact on the timing of recognition of depreciation expense and hosted payload revenue.
The following are the primary procedures we performed to address this critical audit matter. We evaluated the design and tested the operating effectiveness of an internal control related to the Company’s process to determine changes in the
56
estimated useful lives of its satellites. We involved valuation professionals with specialized skills and knowledge, who assisted in evaluating the estimated useful lives of the satellites by:
•comparing the Company’s useful life estimates to the manufacturer’s estimated design life, and the lives of its first-generation satellite constellation
•reading publicly available information on the estimated useful lives of similar assets
•inquiring of operations and engineering management personnel regarding satellite operation and performance
•evaluating the Company’s longevity assessment for the satellites
•evaluating the effect of changes, if any, in the Company’s long-term strategy for use of the assets on the useful life estimates.
/s/ KPMG LLP
We have served as the Company’s auditor since 2022.
McLean, Virginia
February 15, 2024
57
Report of Ernst & Young LLP, Independent Registered Public Accounting Firm
To the Stockholders and the Board of Directors of Iridium Communications Inc.
Opinion on the Financial Statements
We have audited the accompanying consolidated statements of operations and comprehensive income (loss), changes in stockholders’ equity, and cash flows for the year ended December 31, 2021 and the related notes (collectively referred to as the “consolidated financial statements”) of Iridium Communications Inc. (the Company). In our opinion, the consolidated financial statements present fairly, in all material respects, the results of the Company’s operations and its cash flows for the year ended December 31, 2021, in conformity with U.S. generally accepted accounting principles.
Basis for Opinion
These financial statements are the responsibility of the Company’s management. Our responsibility is to express an opinion on the Company’s financial statements based on our audit. We are a public accounting firm registered with the PCAOB and are required to be independent with respect to the Company in accordance with the U.S. federal securities laws and the applicable rules and regulations of the Securities and Exchange Commission and the PCAOB.
We conducted our audit in accordance with the standards of the PCAOB. Those standards require that we plan and perform the audit to obtain reasonable assurance about whether the financial statements are free of material misstatement, whether due to error or fraud. Our auditsaudit included performing procedures to assess the risks of material misstatement of the financial statements, whether due to error or fraud, and performing procedures that respond to those risks. Such procedures includeincluded examining, on a test basis, evidence regarding the amounts and disclosures in the financial statements. Our auditsaudit also included evaluating the accounting principles used and significant estimates made by management, as well as evaluating the overall presentation of the financial statement presentation.statements. We believe that our audits provideaudit provides a reasonable basis for our opinion.
/s/ Ernst & Young LLP
We have served as Company'sthe Company’s auditor since 2001.from 2001 to 2022.
Tysons, Virginia
February 22, 2018
17, 2022
58
Iridium Communications Inc.
Consolidated Balance Sheets
(In thousands, except per share data)
| December 31, 2023 | December 31, 2022 | ||||||||||
| Assets | |||||||||||
| Current assets: | |||||||||||
| Cash and cash equivalents | $ | 71,870 | $ | 168,770 | |||||||
| Accounts receivable, net | 91,715 | 82,273 | |||||||||
| Inventory | 91,135 | 39,776 | |||||||||
| Prepaid expenses and other current assets | 16,364 | 15,385 | |||||||||
| Total current assets | 271,084 | 306,204 | |||||||||
| Property and equipment, net | 2,195,758 | 2,433,305 | |||||||||
| Equity method investments | 67,130 | 49,853 | |||||||||
| Other assets | 86,708 | 122,072 | |||||||||
| Intangible assets, net | 41,095 | 42,577 | |||||||||
| Total assets | $ | 2,661,775 | $ | 2,954,011 | |||||||
| Liabilities and stockholders’ equity | |||||||||||
| Current liabilities: | |||||||||||
| Short-term secured debt | 15,000 | 16,500 | |||||||||
| Accounts payable | 28,671 | 21,372 | |||||||||
| Accrued expenses and other current liabilities | 54,826 | 67,963 | |||||||||
| Deferred revenue | 33,057 | 35,742 | |||||||||
| Total current liabilities | 131,554 | 141,577 | |||||||||
| Long-term secured debt, net | 1,467,490 | 1,470,685 | |||||||||
| Deferred income tax liabilities, net | 114,642 | 151,569 | |||||||||
| Deferred revenue, net of current portion | 43,965 | 45,265 | |||||||||
| Other long-term liabilities | 16,025 | 16,360 | |||||||||
| Total liabilities | 1,773,676 | 1,825,456 | |||||||||
| Commitments and contingencies | |||||||||||
| Stockholders’ equity: | |||||||||||
| Common stock, $0.001 par value, 300,000 shares authorized, 122,776 and 125,902 shares issued and outstanding at December 31, 2023 and 2022, respectively | 123 | 126 | |||||||||
| Additional paid-in capital | 1,089,466 | 1,124,610 | |||||||||
| Accumulated deficit | (235,397) | (47,744) | |||||||||
| Accumulated other comprehensive income, net of tax | 33,907 | 51,563 | |||||||||
| Total stockholders’ equity | 888,099 | 1,128,555 | |||||||||
| Total liabilities and stockholders’ equity | $ | 2,661,775 | $ | 2,954,011 | |||||||
| December 31, 2017 | December 31, 2016 | ||||||
| Assets | |||||||
| Current assets: | |||||||
| Cash and cash equivalents | $ | 285,873 | $ | 371,167 | |||
| Marketable securities | 11,753 | 39,328 | |||||
| Accounts receivable, net | 68,031 | 57,373 | |||||
| Inventory | 20,068 | 18,204 | |||||
| Prepaid expenses and other current assets | 25,347 | 30,698 | |||||
| Total current assets | 411,072 | 516,770 | |||||
| Property and equipment, net | 3,210,162 | 2,813,084 | |||||
| Restricted cash | 102,384 | 113,139 | |||||
| Other assets | 8,414 | 10,836 | |||||
| Intangible assets, net | 50,019 | 45,796 | |||||
| Total assets | $ | 3,782,051 | $ | 3,499,625 | |||
| Liabilities and stockholders' equity | |||||||
| Current liabilities: | |||||||
| Short-term credit facility | $ | 85,500 | $ | — | |||
| Accounts payable | 43,100 | 11,131 | |||||
| Accrued expenses and other current liabilities | 32,215 | 23,840 | |||||
| Interest payable | 15,021 | 14,136 | |||||
| Deferred revenue | 38,390 | 34,087 | |||||
| Total current liabilities | 214,226 | 83,194 | |||||
| Accrued satellite operations and maintenance expense, net | |||||||
| of current portion | — | 13,138 | |||||
| Long-term credit facility, net | 1,618,055 | 1,657,145 | |||||
| Deferred income tax liabilities, net | 246,170 | 361,656 | |||||
| Deferred revenue, net of current portion | 47,612 | 36,417 | |||||
| Other long-term liabilities | 59,519 | 4,317 | |||||
| Total liabilities | 2,185,582 | 2,155,867 | |||||
| Commitments and contingencies | |||||||
| Stockholders' equity: | |||||||
| Series A preferred stock, $0.0001 par value, 1,000 shares authorized, | |||||||
| issued and outstanding | — | — | |||||
| Series B preferred stock, $0.0001 par value, 500 shares | |||||||
| authorized, issued and outstanding | — | — | |||||
| Common stock, $0.001 par value, 300,000 shares authorized, 98,203 and 95,879 | |||||||
| shares issued and outstanding | 98 | 96 | |||||
| Additional paid-in capital | 1,081,373 | 1,060,311 | |||||
| Retained earnings | 518,794 | 288,797 | |||||
| Accumulated other comprehensive loss, net of tax | (3,796 | ) | (5,446 | ) | |||
| Total stockholders' equity | 1,596,469 | 1,343,758 | |||||
| Total liabilities and stockholders' equity | $ | 3,782,051 | $ | 3,499,625 | |||
See notes to consolidated financial statements
59
Iridium Communications Inc.
Consolidated Statements of Operations and Comprehensive Income (Loss)
(In thousands, except per share amounts)
| Year Ended December 31, | |||||||||||||||||
| 2023 | 2022 | 2021 | |||||||||||||||
| Revenue: | |||||||||||||||||
| Services | $ | 584,454 | $ | 534,721 | $ | 491,991 | |||||||||||
| Subscriber equipment | 105,136 | 134,714 | 92,071 | ||||||||||||||
| Engineering and support services | 101,133 | 51,599 | 30,438 | ||||||||||||||
| Total revenue | 790,723 | 721,034 | 614,500 | ||||||||||||||
| Operating expenses: | |||||||||||||||||
| Cost of services (exclusive of depreciation and amortization) | 158,710 | 115,137 | 97,020 | ||||||||||||||
| Cost of subscriber equipment | 66,410 | 86,012 | 53,376 | ||||||||||||||
| Research and development | 20,269 | 16,218 | 11,885 | ||||||||||||||
| Selling, general and administrative | 143,706 | 123,504 | 100,474 | ||||||||||||||
| Depreciation and amortization | 320,000 | 303,484 | 305,431 | ||||||||||||||
| Total operating expenses | 709,095 | 644,355 | 568,186 | ||||||||||||||
| Operating income | 81,628 | 76,679 | 46,314 | ||||||||||||||
| Other income (expense): | |||||||||||||||||
| Interest expense, net | (90,387) | (65,089) | (73,906) | ||||||||||||||
| Loss on extinguishment of debt | — | (1,187) | (879) | ||||||||||||||
| Other income (expense), net | 4,012 | 107 | (417) | ||||||||||||||
| Total other expense | (86,375) | (66,169) | (75,202) | ||||||||||||||
| Income (loss) before income taxes and equity in net earnings of affiliates | (4,747) | 10,510 | (28,888) | ||||||||||||||
| Income tax benefit (expense) | 26,251 | (292) | 19,569 | ||||||||||||||
| Loss on equity method investments | (6,089) | (1,496) | — | ||||||||||||||
| Net income (loss) | 15,415 | 8,722 | (9,319) | ||||||||||||||
| Weighted average shares outstanding - basic | 125,598 | 128,255 | 133,530 | ||||||||||||||
| Weighted average shares outstanding - diluted | 127,215 | 130,134 | 133,530 | ||||||||||||||
| Net income (loss) attributable to common stockholders per share - basic and diluted | $ | 0.12 | $ | 0.07 | $ | (0.07) | |||||||||||
| Comprehensive income (loss): | |||||||||||||||||
| Net income (loss) | $ | 15,415 | $ | 8,722 | $ | (9,319) | |||||||||||
| Foreign currency translation adjustments | (58) | (53) | (280) | ||||||||||||||
| (17,598) | 58,668 | 10,408 | |||||||||||||||
| Comprehensive income (loss) | $ | (2,241) | $ | 67,337 | $ | 809 | |||||||||||
| Year Ended December 31, | |||||||||||
| 2017 | 2016 | 2015 | |||||||||
| Revenue: | |||||||||||
| Services | $ | 349,735 | $ | 334,822 | $ | 317,022 | |||||
| Subscriber equipment | 77,119 | 74,211 | 73,615 | ||||||||
| Engineering and support services | 21,192 | 24,607 | 20,741 | ||||||||
| Total revenue | 448,046 | 433,640 | 411,378 | ||||||||
| Operating expenses: | |||||||||||
| Cost of services (exclusive of depreciation and amortization) | 80,396 | 64,958 | 60,306 | ||||||||
| Cost of subscriber equipment | 44,445 | 44,286 | 40,807 | ||||||||
| Research and development | 15,247 | 16,079 | 16,144 | ||||||||
| Selling, general and administrative | 84,405 | 82,552 | 81,445 | ||||||||
| Depreciation and amortization | 122,266 | 49,394 | 51,834 | ||||||||
| Impairment of goodwill | — | — | 87,039 | ||||||||
| Total operating expenses | 346,759 | 257,269 | 337,575 | ||||||||
| Gain on Boeing transaction | 14,189 | — | — | ||||||||
| Operating income | 115,476 | 176,371 | 73,803 | ||||||||
| Other income (expense): | |||||||||||
| Interest income, net | 4,328 | 2,934 | 3,069 | ||||||||
| Undrawn credit facility fees | (25 | ) | (1,346 | ) | (3,289 | ) | |||||
| Other income (expense), net | (207 | ) | 206 | (468 | ) | ||||||
| Total other income (expense) | 4,096 | 1,794 | (688 | ) | |||||||
| Income before income taxes | 119,572 | 178,165 | 73,115 | ||||||||
| Income tax benefit (expense) | 114,284 | (67,133 | ) | (65,992 | ) | ||||||
| Net income | 233,856 | 111,032 | 7,123 | ||||||||
| Series A preferred stock dividends, declared and paid | 1,750 | 7,000 | 7,000 | ||||||||
| Series B preferred stock dividends, declared and paid | 2,109 | 8,436 | 8,436 | ||||||||
| Series A preferred stock dividends, undeclared | 5,250 | — | — | ||||||||
| Series B preferred stock dividends, undeclared | 6,327 | — | — | ||||||||
| Net income (loss) attributable to common stockholders | $ | 218,420 | $ | 95,596 | $ | (8,313 | ) | ||||
| Weighted average shares outstanding - basic | 97,934 | 95,967 | 95,097 | ||||||||
| Weighted average shares outstanding - diluted | 128,130 | 124,875 | 95,097 | ||||||||
| Net income (loss) attributable to common stockholders per share - basic | $ | 2.23 | $ | 1.00 | $ | (0.09 | ) | ||||
| Net income (loss) attributable to common stockholders per share - diluted | $ | 1.82 | $ | 0.89 | $ | (0.09 | ) | ||||
| Comprehensive income: | |||||||||||
| Net income | $ | 233,856 | $ | 111,032 | $ | 7,123 | |||||
| Foreign currency translation adjustments | 1,664 | 3,487 | (5,777 | ) | |||||||
| Unrealized gain (loss) on marketable securities, net of tax | (14 | ) | 130 | (366 | ) | ||||||
| Comprehensive income | $ | 235,506 | $ | 114,649 | $ | 980 | |||||
See notes to consolidated financial statements
60
Iridium Communications Inc.
Consolidated Statements of Changes in Stockholders’ Equity
(In thousands)
Series A Convertible | Series B Convertible | Additional Paid-In Capital | Accumulated Other Comprehensive Income (Loss) | Retained Earnings | Total Stockholders' Equity | |||||||||||||||||||||||||||||||
| Preferred Stock | Preferred Stock | Common Stock | ||||||||||||||||||||||||||||||||||
| Shares | Amount | Shares | Amount | Shares | Amount | |||||||||||||||||||||||||||||||
| Balance at December 31, 2014 | 1,000 | $ | — | 500 | $ | — | 93,905 | $ | 94 | $ | 1,033,176 | $ | (2,920 | ) | $ | 201,514 | $ | 1,231,864 | ||||||||||||||||||
| Stock-based compensation | — | — | — | — | — | — | 9,649 | — | — | 9,649 | ||||||||||||||||||||||||||
| Stock options exercised and awards vested | — | — | — | — | 1,221 | 1 | 2,154 | — | — | 2,155 | ||||||||||||||||||||||||||
| Stock withheld to cover employee taxes | — | — | — | — | — | — | (886 | ) | — | — | (886 | ) | ||||||||||||||||||||||||
| Excess tax benefit from exercise of stock-based compensation | — | — | — | — | — | — | 395 | — | — | 395 | ||||||||||||||||||||||||||
| Net income | — | — | — | — | — | — | — | — | 7,123 | 7,123 | ||||||||||||||||||||||||||
| Dividends on Series A preferred stock | — | — | — | — | — | — | — | — | (7,000 | ) | (7,000 | ) | ||||||||||||||||||||||||
| Dividends on Series B preferred stock | — | — | — | — | — | — | — | — | (8,436 | ) | (8,436 | ) | ||||||||||||||||||||||||
| Cumulative translation adjustments, net of tax | — | — | — | — | — | — | — | (5,777 | ) | — | (5,777 | ) | ||||||||||||||||||||||||
| Unrealized gain on marketable securities, net of tax | — | — | — | — | — | — | — | (366 | ) | — | (366 | ) | ||||||||||||||||||||||||
| Balance at December 31, 2015 | 1,000 | — | 500 | — | 95,126 | 95 | 1,044,488 | (9,063 | ) | 193,201 | 1,228,721 | |||||||||||||||||||||||||
| Stock-based compensation | — | — | — | — | — | — | 15,973 | — | — | 15,973 | ||||||||||||||||||||||||||
| Stock options exercised and awards vested | — | — | — | — | 753 | 1 | 548 | — | — | 549 | ||||||||||||||||||||||||||
| Stock withheld to cover employee taxes | — | — | — | — | — | — | (627 | ) | — | — | (627 | ) | ||||||||||||||||||||||||
| Excess tax benefit from exercise of stock-based compensation | — | — | — | — | — | — | (71 | ) | — | — | (71 | ) | ||||||||||||||||||||||||
| Net income | — | — | — | — | — | — | — | — | 111,032 | 111,032 | ||||||||||||||||||||||||||
| Dividends on Series A preferred stock | — | — | — | — | — | — | — | — | (7,000 | ) | (7,000 | ) | ||||||||||||||||||||||||
| Dividends on Series B preferred stock | — | — | — | — | — | — | — | — | (8,436 | ) | (8,436 | ) | ||||||||||||||||||||||||
| Cumulative translation adjustments, net of tax | — | — | — | — | — | — | — | 3,487 | — | 3,487 | ||||||||||||||||||||||||||
| Unrealized loss on marketable securities, net of tax | — | — | — | — | — | — | — | 130 | — | 130 | ||||||||||||||||||||||||||
| Balance at December 31, 2016 | 1,000 | — | 500 | — | 95,879 | 96 | 1,060,311 | (5,446 | ) | 288,797 | 1,343,758 | |||||||||||||||||||||||||
| Stock-based compensation | — | — | — | — | — | — | 18,694 | — | — | 18,694 | ||||||||||||||||||||||||||
| Stock options exercised and awards vested | — | — | — | — | 2,537 | 2 | 4,233 | — | — | 4,235 | ||||||||||||||||||||||||||
| Stock withheld to cover employee taxes | — | — | — | — | (213 | ) | — | (1,865 | ) | — | — | (1,865 | ) | |||||||||||||||||||||||
| Net income | — | — | — | — | — | — | — | — | 233,856 | 233,856 | ||||||||||||||||||||||||||
| Dividends on Series A preferred stock | — | — | — | — | — | — | — | — | (1,750 | ) | (1,750 | ) | ||||||||||||||||||||||||
| Dividends on Series B preferred stock | — | — | — | — | — | — | — | — | (2,109 | ) | (2,109 | ) | ||||||||||||||||||||||||
| Cumulative translation adjustments, net of tax | — | — | — | — | — | — | — | 1,664 | — | 1,664 | ||||||||||||||||||||||||||
| Unrealized loss on marketable securities, net of tax | — | — | — | — | — | — | — | (14 | ) | — | (14 | ) | ||||||||||||||||||||||||
| Balance at December 31, 2017 | 1,000 | $ | — | 500 | $ | — | 98,203 | $ | 98 | $ | 1,081,373 | $ | (3,796 | ) | $ | 518,794 | $ | 1,596,469 | ||||||||||||||||||
| Additional Paid-In Capital | Accumulated Other Comprehensive Income (Loss) | Retained Earnings (Accumulated Deficit) | Total Stockholders’ Equity | |||||||||||||||||||||||||||||||||||
| Common Stock | ||||||||||||||||||||||||||||||||||||||
| Shares | Amount | |||||||||||||||||||||||||||||||||||||
| Balance at December 31, 2020 | 134,056 | $ | 134 | $ | 1,160,570 | $ | (17,180) | $ | 275,915 | $ | 1,419,439 | |||||||||||||||||||||||||||
| Stock-based compensation | — | — | 29,616 | — | — | 29,616 | ||||||||||||||||||||||||||||||||
| Stock options exercised and awards vested | 1,769 | 1 | 7,442 | — | — | 7,443 | ||||||||||||||||||||||||||||||||
| Stock withheld to cover employee taxes | (144) | — | (5,918) | — | — | (5,918) | ||||||||||||||||||||||||||||||||
| Repurchases and retirements of common stock | (4,339) | (4) | (37,652) | — | (125,786) | (163,442) | ||||||||||||||||||||||||||||||||
| Net loss | — | — | — | — | (9,319) | (9,319) | ||||||||||||||||||||||||||||||||
| Cumulative translation adjustments | — | — | — | (280) | — | (280) | ||||||||||||||||||||||||||||||||
| Unrealized gain on cash flow hedges, net of tax | — | — | — | 10,408 | — | 10,408 | ||||||||||||||||||||||||||||||||
| Balance at December 31, 2021 | 131,342 | 131 | 1,154,058 | (7,052) | 140,810 | 1,287,947 | ||||||||||||||||||||||||||||||||
| Stock-based compensation | — | — | 48,367 | — | — | 48,367 | ||||||||||||||||||||||||||||||||
| Stock options exercised and awards vested | 1,484 | 2 | 3,870 | — | — | 3,872 | ||||||||||||||||||||||||||||||||
| Stock withheld to cover employee taxes | (130) | — | (5,293) | — | — | (5,293) | ||||||||||||||||||||||||||||||||
| Repurchases and retirements of common stock | (6,794) | (7) | (59,776) | — | (197,276) | (257,059) | ||||||||||||||||||||||||||||||||
| Net income | — | — | — | — | 8,722 | 8,722 | ||||||||||||||||||||||||||||||||
| Dividends declared | — | — | (16,616) | — | — | (16,616) | ||||||||||||||||||||||||||||||||
| Cumulative translation adjustments | — | — | — | (53) | — | (53) | ||||||||||||||||||||||||||||||||
| Unrealized gain on cash flow hedges, net of tax | — | — | — | 58,668 | — | 58,668 | ||||||||||||||||||||||||||||||||
| Balance at December 31, 2022 | 125,902 | 126 | 1,124,610 | 51,563 | (47,744) | 1,128,555 | ||||||||||||||||||||||||||||||||
| Stock-based compensation | — | — | 64,139 | — | — | 64,139 | ||||||||||||||||||||||||||||||||
| Stock options exercised and awards vested | 1,788 | 2 | 3,956 | — | — | 3,958 | ||||||||||||||||||||||||||||||||
| Stock withheld to cover employee taxes | (162) | — | (9,680) | — | — | (9,680) | ||||||||||||||||||||||||||||||||
| Repurchases and retirements of common stock | (4,752) | (5) | (43,946) | — | (203,068) | (247,019) | ||||||||||||||||||||||||||||||||
| Net income | — | — | — | — | 15,415 | 15,415 | ||||||||||||||||||||||||||||||||
| Dividends declared | — | — | (49,613) | — | — | (49,613) | ||||||||||||||||||||||||||||||||
| Cumulative translation adjustments | — | — | — | (58) | — | (58) | ||||||||||||||||||||||||||||||||
| Unrealized loss on cash flow hedges, net of tax | — | — | — | (17,598) | — | (17,598) | ||||||||||||||||||||||||||||||||
| Balance at December 31, 2023 | 122,776 | $ | 123 | $ | 1,089,466 | $ | 33,907 | $ | (235,397) | $ | 888,099 | |||||||||||||||||||||||||||
See notes to consolidated financial statements
61
Iridium Communications Inc.
Consolidated Statements of Cash Flows
(In thousands)
| Year Ended December 31, | |||||||||||||||||
| 2023 | 2022 | 2021 | |||||||||||||||
| Cash flows from operating activities: | |||||||||||||||||
| Net income (loss) | $ | 15,415 | $ | 8,722 | $ | (9,319) | |||||||||||
| Adjustments to reconcile net income (loss) to net cash provided by operating activities: | |||||||||||||||||
| Deferred income taxes | (31,828) | (1,189) | (21,314) | ||||||||||||||
| Depreciation and amortization | 320,000 | 303,484 | 305,431 | ||||||||||||||
| Loss on extinguishment of debt | — | 1,187 | 879 | ||||||||||||||
| Stock-based compensation (net of amounts capitalized) | 57,455 | 43,732 | 26,782 | ||||||||||||||
| Amortization of deferred financing fees | 3,739 | 4,602 | 4,201 | ||||||||||||||
| Loss on equity method investments | 6,089 | 1,496 | — | ||||||||||||||
| All other items, net | 732 | 638 | (160) | ||||||||||||||
| Changes in operating assets and liabilities: | |||||||||||||||||
| Accounts receivable | (9,538) | (18,712) | (1,823) | ||||||||||||||
| Inventory | (50,958) | (10,183) | 3,592 | ||||||||||||||
| Prepaid expenses and other current assets | (1,153) | (4,227) | (1,696) | ||||||||||||||
| Other assets | 3,019 | 3,441 | 3,911 | ||||||||||||||
| Accounts payable | 2,759 | 4,730 | (2,166) | ||||||||||||||
| Accrued expenses and other current liabilities | 4,899 | 5,929 | 7,170 | ||||||||||||||
| Deferred revenue | (2,961) | 4,871 | (7,531) | ||||||||||||||
| Other long-term liabilities | (2,756) | (3,792) | (5,083) | ||||||||||||||
| Net cash provided by operating activities | 314,913 | 344,729 | 302,874 | ||||||||||||||
| Cash flows from investing activities: | |||||||||||||||||
| Capital expenditures | (73,487) | (71,267) | (42,147) | ||||||||||||||
| Investment in related parties | (10,000) | (50,000) | — | ||||||||||||||
| Purchases of other investments | — | — | (1,635) | ||||||||||||||
| Sales and maturities of marketable securities | — | — | 7,400 | ||||||||||||||
| Net cash used in investing activities | (83,487) | (121,267) | (36,382) | ||||||||||||||
| Cash flows from financing activities: | |||||||||||||||||
| Borrowings under the Term Loan | 63,940 | — | 179,285 | ||||||||||||||
| Payments on the Term Loan | (72,315) | (116,500) | (195,785) | ||||||||||||||
| Repurchases of common stock | (247,019) | (257,059) | (163,442) | ||||||||||||||
| Payment of deferred financing fees | (1,162) | — | (4,052) | ||||||||||||||
| Proceeds from exercise of stock options | 3,958 | 3,872 | 7,443 | ||||||||||||||
| Tax payments upon settlement of stock awards | (9,680) | (5,293) | (5,918) | ||||||||||||||
| Payment of common stock dividends | (64,774) | — | — | ||||||||||||||
| Net cash used in financing activities | (327,052) | (374,980) | (182,469) | ||||||||||||||
| Effect of exchange rate changes on cash and cash equivalents | (1,274) | (625) | (288) | ||||||||||||||
| Net increase (decrease) in cash and cash equivalents and restricted cash | (96,900) | (152,143) | 83,735 | ||||||||||||||
| Cash, cash equivalents and restricted cash, beginning of period | 168,770 | 320,913 | 237,178 | ||||||||||||||
| Cash, cash equivalents and restricted cash, end of period | $ | 71,870 | $ | 168,770 | $ | 320,913 | |||||||||||
| Year Ended December 31, | |||||||||||
| 2017 | 2016 | 2015 | |||||||||
| Cash flows from operating activities: | |||||||||||
| Net income | $ | 233,856 | $ | 111,032 | $ | 7,123 | |||||
| Adjustments to reconcile net income to net cash provided by operating activities: | |||||||||||
| Deferred income taxes | (115,812 | ) | 63,808 | 63,376 | |||||||
| Depreciation and amortization | 122,266 | 49,394 | 51,834 | ||||||||
| Impairment of goodwill | — | — | 87,039 | ||||||||
| Stock-based compensation (net of amounts capitalized) | 15,958 | 13,708 | 8,603 | ||||||||
| Excess tax benefit from stock-based compensation | — | — | (806 | ) | |||||||
| Gain from contract liability write-off | (14,189 | ) | — | — | |||||||
| Provision for doubtful accounts | (277 | ) | 703 | 252 | |||||||
| Provision for obsolete inventory | 361 | 1,053 | 723 | ||||||||
| Amortization of premiums on marketable securities | 124 | 888 | 2,030 | ||||||||
| Non-cash foreign currency losses, net | (163 | ) | 166 | 196 | |||||||
| Changes in operating assets and liabilities: | |||||||||||
| Accounts receivable | (10,343 | ) | (6,037 | ) | (1,843 | ) | |||||
| Inventory | (1,946 | ) | 9,029 | (169 | ) | ||||||
| Prepaid expenses and other current assets | 2,875 | (16,613 | ) | (3,788 | ) | ||||||
| Other assets | 2,823 | (2,128 | ) | (1,253 | ) | ||||||
| Accounts payable | 896 | 3,209 | 3,110 | ||||||||
| Accrued expenses and other current liabilities | 8,166 | (6,416 | ) | (7,815 | ) | ||||||
| Deferred revenue | 15,129 | 4,115 | 9,038 | ||||||||
| Accrued satellite and network operation expense, net of current portion | — | (1,045 | ) | (869 | ) | ||||||
| Other long-term liabilities | (103 | ) | 333 | 698 | |||||||
| Net cash provided by operating activities | 259,621 | 225,199 | 217,479 | ||||||||
| Cash flows from investing activities: | |||||||||||
| Capital expenditures | (400,107 | ) | (405,687 | ) | (494,810 | ) | |||||
| Purchases of marketable securities | (7,013 | ) | (19,865 | ) | (204,672 | ) | |||||
| Sales and maturities of marketable securities | 34,440 | 183,192 | 260,108 | ||||||||
| Net cash used in investing activities | (372,680 | ) | (242,360 | ) | (439,374 | ) | |||||
| Cash flows from financing activities: | |||||||||||
| Borrowings under the Credit Facility | 22,207 | 251,498 | 230,421 | ||||||||
| Payment of deferred financing fees | (3,852 | ) | (11,806 | ) | (14,984 | ) | |||||
| Proceeds from exercise of stock options | 4,235 | 549 | 2,154 | ||||||||
| Tax payment upon settlement of stock awards | (1,865 | ) | (627 | ) | (886 | ) | |||||
| Excess tax benefits from stock-based compensation | — | — | 806 | ||||||||
| Payment of Series A preferred stock dividends | (1,750 | ) | (7,000 | ) | (7,000 | ) | |||||
| Payment of Series B preferred stock dividends | (2,109 | ) | (8,436 | ) | (8,436 | ) | |||||
| Net cash provided by financing activities | 16,866 | 224,178 | 202,075 | ||||||||
| Effect of exchange rate changes on cash and cash equivalents | 144 | 512 | (755 | ) | |||||||
| Net increase (decrease) in cash and cash equivalents | (96,049 | ) | 207,529 | (20,575 | ) | ||||||
| Cash, cash equivalents, and restricted cash, beginning of period | 484,306 | 276,777 | 297,352 | ||||||||
| Cash, cash equivalents, and restricted cash, end of period | $ | 388,257 | $ | 484,306 | $ | 276,777 | |||||
See notes to consolidated financial statements
Iridium Communications Inc.
Consolidated Statements of Cash Flows, continued
(In thousands)
| Year Ended December 31, | |||||||||||||||||
| 2023 | 2022 | 2021 | |||||||||||||||
| Supplemental cash flow information: | |||||||||||||||||
| Interest paid, net of amounts capitalized | $ | 91,936 | $ | 63,880 | $ | 72,195 | |||||||||||
| Income taxes paid, net | $ | 4,225 | $ | 2,224 | $ | 1,784 | |||||||||||
| Supplemental disclosure of non-cash investing and financing activities: | |||||||||||||||||
| Property and equipment received but not paid for yet | $ | 7,070 | $ | 5,697 | $ | 8,225 | |||||||||||
| Capitalized stock-based compensation | $ | 6,684 | $ | 4,635 | $ | 2,834 | |||||||||||
| Dividends accrued on common stock | $ | 1,315 | $ | 16,616 | $ | — | |||||||||||
| Year Ended December 31, | |||||||||||
| 2017 | 2016 | 2015 | |||||||||
| Supplemental cash flow information: | |||||||||||
| Interest paid | $ | 85,261 | $ | 22,910 | $ | 18,878 | |||||
| Income taxes paid, net | $ | 1,660 | $ | 1,391 | $ | 3,429 | |||||
| Supplemental disclosure of non-cash investing activities: | |||||||||||
| Property and equipment received but not paid for yet | $ | 90,748 | $ | 2,753 | $ | 26,770 | |||||
| Interest capitalized but not paid | $ | 15,021 | $ | 14,136 | $ | 12,232 | |||||
| Capitalized amortization of deferred financing costs | $ | 27,304 | $ | 28,688 | $ | 18,372 | |||||
| Capitalized paid-in-kind interest | $ | — | $ | 52,873 | $ | 43,073 | |||||
| Capitalized stock-based compensation | $ | 2,736 | $ | 2,265 | $ | 1,046 | |||||
See notes to consolidated financial statements
62
Iridium Communications Inc.
Notes to Consolidated Financial Statements
December 31, 20172023
1. Organization and Business
Iridium Communications Inc. (the “Company”), a Delaware corporation, offers voice and data communications services and products to businesses, U.S. and international government agencies and other customers on a global basis. The Company is a provider of mobile voice and data communications services via a constellation of low earth orbiting satellites. The Company holds various licenses and authorizations from the U.S. Federal Communications Commission (the “FCC”) and from foreign regulatory bodies that permit the Company to conduct its business, including the operation of its satellite constellation.
The Company’s operations are conducted through, and its operating assets are owned by, its principal operating subsidiary, Iridium Satellite LLC(“Iridium Satellite”), Iridium Satellite’s immediate parent, Iridium Holdings LLC, and their subsidiaries. As a result, there are no material differences between the information presented in these consolidated financial statements of the Company and the financial information of Iridium Holdings, Iridium Satellite and their subsidiaries, on a consolidated basis, other than as a result of tax provisions as a result of Iridium Holdings, Iridium Satellite and their subsidiaries being classified as flow-through entities for U.S. federal income tax purposes.
2. Significant Accounting Policies and Basis of Presentation
Principles of Consolidation and Basis of Presentation
The Company has prepared the consolidated financial statements in accordance with accounting principles generally accepted in the United States (“U.S. GAAP”). The accompanying consolidated financial statements include the accounts of (i) the Company, (ii) its wholly owned subsidiaries, and (iii) all less than wholly owned subsidiaries that the Company controls. All material intercompany transactions and balances have been eliminated. The Company has reclassified certain items in the consolidated financial statements for the prior periods to be comparable with the classification for the year ended December 31, 2023. These reclassifications had no effect on previously reported net income (loss).
Use of Estimates
The preparation of financial statements in conformity with U.S. GAAP requires management to make estimates and assumptions that affect the reported amounts of assets and liabilities and disclosures of contingent assets and liabilities at the date of the financial statements and the reported amounts of income and expenses during the reporting period. On an ongoing basis, the Company evaluates its estimates and assumptions, including those related to revenue recognition, the useful lives and recoverability of long-lived and intangible assets, income taxes, stock-based compensation, the incremental borrowing rate for its leases, and contingencies, among others. The Company bases these estimates on historical and anticipated results, trends, and various other assumptions that it believes are reasonable, including assumptions as to future events. These estimates form the basis for making judgments about the carrying values of assets and liabilities and recorded revenues and expenses. Actual results could differ materially from those estimates.
In March 2016,November 2023, the Financial Accounting Standards Board ("FASB"(“FASB”) issued Accounting Standards Update ("ASU") No. 2016-09, Compensation – Stock Compensation, Improvements to Employee Share-Based Payment Accounting (“ASU 2016-09”). ASU 2016-09 addresses multiple changes that are primarily focused on income taxes and the presentation of taxes related to stock compensation, but also provides an option for two methods to account for forfeitures. The requirements resulting from the adoption of ASU 2016-09 were accounted for on a prospective basis as of January 1, 2017, as required.
| Year Ended December 31, | ||||||||
| 2017 | 2016 | |||||||
| Cash and cash equivalents | $ | 285,873 | $ | 371,167 | ||||
| Restricted cash | 102,384 | 113,139 | ||||||
| Cash, cash equivalents and restricted cash shown in the consolidated statements of cash flows | $ | 388,257 | $ | 484,306 | ||||
In December 2023, the FASB issued ASU No. 2023-09, Income Taxes (Topic 740): Improvements to Income Tax Disclosures (“ASU 2023-09”). The amendments in ASU 2023-09 address investor requests for more transparency about income tax information through improvements to income tax disclosures primarily related to the financial statements.rate reconciliation and income taxes paid information. The Company intends to apply the new guidance effective for the year ending December 31, 2025, as required. The Company is currently evaluating the effect ASU 2016-022023-09 may have on its condensed consolidated financial statements and related disclosures, but a lease liability and related right-of-use asset will be recognized for operating lease arrangements where the Company is the lessee. disclosures.
63
Fair Value Measurements
The Company evaluates assets and liabilities subject to fair value measurements on a recurring and non-recurring basis to determine the appropriate level to classify them for each reporting period. This determination requires significant judgments to be made by management of the Company. The instruments identified as subject to fair value measurements on a recurring basis are cash and cash equivalents, marketable securities, prepaid expenses and other current assets, accounts receivable, accounts payable and accrued expenses and other current liabilities. Fair value is the price that would be received from the sale of an asset or paid to transfer a liability assuming an orderly transaction in the most advantageous market at the measurement date. U.S. GAAP establishes a hierarchical disclosure framework which prioritizes and ranks the level of observability of inputs used in measuring fair value.
The fair value hierarchy consists of the following tiers:
•Level 1, defined as observable inputs such as quoted prices in active markets for identical assets or liabilities;
•Level 2, defined as observable inputs other than Level 1 prices such as quoted prices for similar assets or liabilities; quoted prices in markets that are not active; or other inputs that are observable or can be corroborated by observable market data for substantially the full term of the assets or liabilities; and
•Level 3, defined as unobservable inputs in which little or no market data exists, therefore requiring an entity to develop its own assumptions.
The fair value estimates are based upon certain market assumptions and information available to the Company. The carrying values of short-termthe following financial instruments (primarilyapproximated their fair values as of December 31, 2023 and 2022: cash and cash equivalents, prepaid expenses and other current assets, accounts receivable, accounts payable, and accrued expenses and other current liabilities)liabilities. Fair values approximate their faircarrying values because of their short-term nature. The fair value of the Company’s investments inLevel 2 cash equivalents include money market funds, approximates its carrying value; such instruments are classified as Level 1 and are included in cash and cash equivalents on the accompanying consolidated balance sheets. The fair value of the Company’s investments in commercial paper and short-term U.S. agency securities with original maturities of less than ninety days approximates their carrying value; suchsecurities. The Company also classifies its derivative financial instruments are classified as Level 2. In determining fair value of Level 2 assets, the Company uses a market approach utilizing valuation models that incorporate observable inputs such as interest rates, bond yields and quoted prices for similar assets.
Leases
For new leases, the Company determines if an arrangement is or contains a lease at inception. Leases are included in cashas right-of-use (“ROU”) assets within other assets and cash equivalentsROU liabilities within accrued expenses and other liabilities and within other long-term liabilities on the accompanyingCompany’s consolidated balance sheets.
ROU assets and liabilities are recognized at commencement date based on the present value of lease payments over the lease term. Certain leases contain variable contractual obligations as a result of future base rate escalations which are estimated based on observed trends and included within the measurement of present value. The Company’s investments in fixed-income debt securities and commercial paper with original maturities of greater than ninety days are obtained using similar investments traded on active securities exchanges and are classified as Level 2. For fixed income securities thatleases do not have quoted pricesprovide an implicit rate. The Company uses its incremental borrowing rate based on the information available at commencement date in active markets,determining the present value of lease payments. The ROU asset also includes any lease payments made and excludes lease incentives. Lease expense for lease payments is recognized on a straight-line basis over the lease term.
The Company has lease agreements with lease and non-lease components, which are generally accounted for separately. For certain leases, such as teleport network facilities, the Company uses third-party vendorselected the practical expedient to price its debt securities resultingcombine lease and non-lease components as a single lease component. Taxes assessed on leases in classification as Level 2. All fixed-income securitieswhich the Company is either a lessor or lessee are included in marketable securities on the accompanying consolidated balance sheets.excluded from contract consideration and variable payments when measuring new lease contracts or remeasuring existing lease contracts.
Concentrations of Credit Risk
Financial instruments that potentially subject the Company to concentrations of credit risk consist primarily of cash and cash equivalents marketable securities, and receivables. The majority of cash is swept nightlyinvested into a money market fund invested inwith U.S. treasuries, Agency Mortgage Backed Securitiesagency mortgage backed securities and/or U.S. Governmentgovernment guaranteed debt. While the Company maintains its cash and cash equivalents with financial institutions with high credit ratings, it often maintains those deposits in federally insured financial institutions in excess of federally insured limits. The Company’s marketable securities are highly-rated corporate and foreign fixed-income debt securities and commercial paper with an original maturity in excess of ninety days. The Company performs credit evaluations of its customers’ financial condition and records reserves to provide for estimated credit losses. Accounts receivable are due from both domestic and international customers.
64
Cash and Cash Equivalents and Restricted Cash
The Company considers all highly liquid investments with original maturities of ninety days or less to be cash equivalents. These investments, along with cash deposited in institutional money market funds, regular interest bearing depository accounts and non-interest bearing depository accounts, are classified as cash and cash equivalents on the accompanying consolidated balance sheets. The
Investments
Investments where the Company is requiredhas the ability to maintain a minimum cash reserveexercise significant influence, but does not control, are accounted for debt service related to its $1.8 billion credit facility (as amended to date,under the “Credit Facility”).
Investments where the Company has less than 20% ownership interest in the investee and lacks the ability to exercise significant influence are accounted for under ASC 321-10-35, Investments - Equity Securities. Under this topic, the Company’s investment equals its cost, less impairment, if any. For investments without a readily determinable fair value, the Company performs a qualitative assessment to determine if any impairment indicator is present. If an indicator is present, the cost basis ofCompany determines whether fair value was less than the marketable securities sold. There were no material realized gains or losses on the sale of marketable securities for the years ended December 31, 2017 and 2016. The Company regularly monitors and evaluatesinvestment’s carrying value. If the fair value ofis less than its investments to identify other-than-temporary declines in value. The Company determined that any decline in faircarrying value of these investmentsor if there is temporary asan observable price change through a similar security from the same issuer, the Company does not intend to sell these securities and it is not likely that the Company will be required to sell the securities before the recovery of their amortized cost basis.would record an impairment charge.
Accounts Receivable
Trade accounts receivable are recorded at the invoiced amount and are subject to late fee penalties. Management develops its estimate of an allowance for uncollectible receivables based on the Company’s experience with specific customers, aging of outstanding invoices, its understanding of customers’ current economic circumstances and its own judgment as to the likelihood that the Company will ultimately receive payment. The Company writes off its accounts receivable when balances ultimately are deemed uncollectible. The allowance for doubtful accounts was not material as of December 31, 20172023 and 2016.2022.
Foreign Currencies
Deferred Financing Costs
Direct and incremental costs incurred in connection with securing debt financing are deferred and are amortized as additional interest expense using the effective interest method over the term of the related debt. As of December 31, 2017 and 2016, the Company had deferred approximately $97.2 million and $120.6 million, respectively, of direct and incremental financing costs, net of amortization, associated with securing debt financing for Iridium NEXT, the Company’s next-generation satellite constellation.
Capitalized Interest
Inventory
Inventory consists primarily of finished goods, although the Company at times also maintains an inventory of raw materials from third-party manufacturers. The Company outsources manufacturing of subscriber equipment to a third-party manufacturer and
65
purchases accessories from third-party suppliers. The Company’s cost of inventory includes an allocation of overhead, including payroll and payroll-related costs of employees directly involved in bringing inventory to its existing condition, and freight. Inventories are valued using the average cost method and are carried at the lower of cost or net realizable value. Accordingly, the Company recorded expenses of $0.4 million, $1.1 million
The Company’s expense for excess and $0.7 million, forobsolete inventory was not material during the years ended December 31, 2017, 2016 and 2015, respectively, included within the cost of subscriber equipment for excess and obsolete inventory. The expenses for the years ended December 31, 2017 and 2016 were primarily related to certain handset parts and accessories, and the expenses for the year ended December 31, 2015 were primarily related to Iridium Pilot equipment.2023, 2022 or 2021.
The Company has a manufacturing agreement with Benchmark Electronics Inc. (“Benchmark”) to manufacture most of its subscriber equipment. Pursuant to the agreement, the Company may be required to purchase excess materials at cost plus a contractual markup if the materials are not used in production within the periods specified in the agreement. Benchmark will then repurchase such materials from the Company at the same price paid by the Company, as required for the production of the subscriber equipment.
The following table summarizes the Company’s inventory balance:
| December 31, | |||||||||||
| 2023 | 2022 | ||||||||||
| (In thousands) | |||||||||||
| Finished goods | $ | 48,698 | $ | 17,964 | |||||||
| Raw materials | 43,599 | 23,014 | |||||||||
| Inventory valuation reserve | (1,162) | (1,202) | |||||||||
| Total | $ | 91,135 | $ | 39,776 | |||||||
The Company’s raw materials balance includes $32.2 million and $9.0 million at December 31, 2023 and December 31, 2022, respectively, of inventory held on consignment at third-party manufacturers.
Stock-Based Compensation
The Company accounts for stock-based compensation at estimated fair value. The fair value of stock options is determined at the grant date using the Black-ScholesBlack-Scholes-Merton option pricing model. The fair value of restricted stock units (“RSUs”) is equal to the closing price of the underlying common stock on the grant date. The fair value of an award that is ultimately expected to vest is recognized on a straight-line basis over the requisite service or performance period and is classified in the consolidated statements of operations and comprehensive income (loss) in a manner consistent with the classification of the recipient’s compensation. The expected vesting of the Company’s performance-based RSUs is based upon the probability that the Company achieves the defined performance goals. The level of achievement of performance goals, if any, is determined by the compensation committee.Compensation Committee. Stock-based awards to non-employee consultants are expensed at their grant-date fair value as services are provided according to the terms of their agreements and are classified in selling, general and administrative expenses in the accompanying consolidated statements of operations and comprehensive income. Classificationincome (loss). The following table presents the classification of stock-based compensation was presented below:by line item on the balance sheet and statement of operations:
| As of and For Year Ended December 31, | |||||||||||
| 2023 | 2022 | ||||||||||
| (In thousands) | |||||||||||
| Property and equipment, net | $ | 5,963 | $ | 4,018 | |||||||
| Inventory | 721 | 617 | |||||||||
| Cost of subscriber equipment | 60 | 69 | |||||||||
| Cost of services (exclusive of depreciation and amortization) | 16,128 | 12,337 | |||||||||
| Research and development | 1,282 | 648 | |||||||||
| Selling, general and administrative | 39,985 | 30,678 | |||||||||
| Total stock-based compensation | $ | 64,139 | $ | 48,367 | |||||||
66
| Year Ended December 31, | |||||||
| 2017 | 2016 | ||||||
| (In thousands) | |||||||
| Property and equipment, net | $ | 2,458 | $ | 1,906 | |||
| Inventory | 280 | 359 | |||||
| Cost of subscriber equipment | 30 | 56 | |||||
| Cost of services (exclusive of depreciation and amortization) | 4,366 | 1,655 | |||||
| Research and development | 349 | 457 | |||||
| Selling, general and administrative | 11,211 | 11,540 | |||||
| Total stock-based compensation | $ | 18,694 | $ | 15,973 | |||
Property and Equipment
Property and equipment is carried at cost less accumulated depreciation. Depreciation is calculated using the straight-line method over the following estimated useful lives:
The Company calculates depreciation expense using the straight-line method over the useful lives of each asset. The Company applies judgment in determining the useful lives based on factors such as engineering data, long-term strategy for using the assets, the manufacturer’s estimated design life for the assets, laws and evaluatesregulations that could impact the appropriatenessuseful lives of the assets and other economic factors. The Company assesses the current estimated operational life of the satellites, including the potential impact of environmental factors on the satellites, ongoing operational enhancements and software upgrades when evaluating the useful lifelives of its satellites. Additionally, the Company reviews engineering data relating to the operation and performance of its satellite network.
During the fourth quarter of 2023, the Company updated its estimate of the satellites’ remaining useful lives based on the health of the constellation and related engineering data. As a result, the estimated useful lives of the satellites were extended by five years, from 12.5 years to 17.5 years. The impact of this change for the year ended December 31, 2023 was a decrease in depreciation expense of approximately $27.8 million and a decrease in hosted payload and other service revenue of approximately $2.3 million. For the year ended December 31, 2023, the impact of the change in useful lives of the satellites resulted in an increase in basic and diluted net income per share of $0.21 and $0.20, respectively.
During the quarter ended June 30, 2023, the Company launched five of its remaining six ground spare satellites. Following completion of successful on-orbit testing of the five launched satellites, the Company has no plans to use, develop or launch the remaining ground spare. As the Company believed the construction-in-progress associated with the remaining ground spare satellite would no longer be used, the Company wrote off the full amount remaining in this calculation on a quarterly basis or as events occurconstruction-in-progress for that require additional assessment. satellite by recording accelerated depreciation expense of $37.5 million, which more than offset the decrease in depreciation expense related to the increase in estimated useful lives of the satellites described above.
Repairs and maintenance costs are expensed as incurred.
Derivative Financial Instruments
The Company uses derivatives (interest rate swap, swaption, cap) to manage its exposure to fluctuating interest rate risk on variable rate debt. Its derivatives are measured at fair value and are recorded on the consolidated balance sheets within assets and other current liabilities. When the Company’s derivatives are designated as cash flow hedges, the effective portion of the changes in fair value of the derivatives are recorded in accumulated other comprehensive income (loss) within the Company’s consolidated balance sheets and subsequently recognized in earnings when the hedged items impact earnings. Any ineffective portion of a derivative’s change in fair value will be recognized in earnings in the same period in which the hedged interest payments affect earnings. Within the consolidated statements of operations and comprehensive income (loss), the gains and losses related to cash flow hedges are recognized within interest income (expense), net, as this is the same financial statement line item associated with the hedged items. Cash flows from hedging activities are included in operating activities within the Company’s consolidated statements of cash flows, which is the same category as the item being hedged. See Note 8 for further information.
Long-Lived Assets
The Company assesses its long-lived assets for impairment when indicators of impairment exist. Recoverability of assets is measured by comparing the carrying amounts of the assets to the future undiscounted cash flows expected to be generated by the assets. Any impairment loss would be measured as the excess of the assets’ carrying amount over their fair value.
The Company’s intangible assets with finite lives are amortized over their useful lives and reviewed for impairment whenever events or changes in circumstances indicate that the carrying amount of the asset may not be recoverable. If any indicators were present, the Company would test for recoverability by comparing the carrying amount of the asset to the net undiscounted cash flows expected to be generated from the asset. If those net undiscounted cash flows do not exceed the carrying amount (i.e., the asset is not recoverable), the Company would perform the next step, which is to determine the fair value of the asset and record an impairment loss, if any. The Company evaluates the useful lives for these intangible assets each reporting period to determine whether events and circumstances warrant a revision in their remaining useful lives.
asset may be impaired. The Company’s trade names, spectrum and licenses are expected to generate cash flows indefinitely.
67
Revenue Recognition
The Company derives its revenue primarily as a wholesaler of satellite communications products and services. The primary types of revenue include (i) service revenue (access and usage-based airtime fees), (ii) subscriber equipment revenue, and (iii) revenue generated by providing engineering and support services to commercial and government customers. In addition to the discussion immediately below, see Note 11 for further discussion of the Company’s revenue recognition.
Wholesaler of satellite communications products and services
Pursuant to wholesale agreements, the Company sells its products and services to service providers who,and recognizes revenue as it fulfills its performance obligations to the service providers, based an amount that reflects the consideration to which it expects to be entitled to in exchange for those products and services. The service providers, in turn, sell the products and services to other distributors or directly to the end users. The Company recognizes revenue when services are performed or delivery has occurred, evidence of an arrangement exists, services or equipment are transferred, the feetransaction price is fixed or determinable,determined, the arrangement has commercial substance, and collection of consideration is reasonably assured, as follows:probable.
Contracts with multiple elementsperformance obligations
At times, the Company sells services and equipment through multi-element arrangements that bundle equipment, airtime and other services. For multi-elementthese revenue arrangements, when the Company sells services and equipment in bundled arrangements and determines that it has separate units of accounting,distinct performance obligations, the Company allocates the bundled contract price among the various contract deliverablesperformance obligations based on each deliverable’s relativestand-alone selling price. The selling price used for each deliverable is based on vendor-specific objective evidence when available, third-party evidence when vendor-specific objective evidence is not available, orIf the estimated selling price when neither vendor-specific evidence nor third party evidence is available. The Company determines vendor-specific objective evidence of selling price by assessing sales prices of subscriber equipment, airtime and other services when they are sold to customers on a stand-alone basis. The Company’s determination of best estimate of selling price is consistent with its determination of vendor-specific objective evidence of selling price, andnot directly observable, the Company assesses qualitative and quantitativeestimates the amount to be allocated for each performance obligation based on observable market factors and entity-specific factors when estimatingtransactions or the selling price.residual approach. When the Company determines the elementsperformance obligations are not separate units of accounting,distinct, the Company recognizes revenue on a combined basis asbasis. To the last elementextent the Company’s contracts include variable consideration, the transaction price includes both fixed and variable consideration. The variable consideration contained within the Company’s contracts with customers may include discounts, credits and other similar items. When a contract includes variable consideration, the Company evaluates the estimate of the variable consideration to determine whether the estimate needs to be constrained; therefore, the Company includes the variable consideration in the transaction price only to the extent that it is delivered.probable that a significant reversal of the amount of cumulative revenue recognized will not occur when the uncertainty associated with the variable consideration is subsequently resolved. Variable consideration estimates are updated at the end of each quarter.
Service revenue sold on a stand-alone basis
Service revenue is generated from the Company’s service providers through usage of its satellite system and through fixed monthly access fees per user charged to service providers. Revenue for usage is recognized when usage occurs.occurs and is billed in arrears with payments generally submitted within 30 days. Revenue for fixed-per-user access fees is billed monthly in advance and generally recognized ratably over the month, or related usage period, in which the services are provided to the end user. The Company sells prepaid services in the form of e-vouchers and prepaid cards. A liability is established equal to the cash paid upon purchase for the e-voucher or prepaid card. The Company recognizes revenue from (i) the prepaid services upon the use of the e-voucher or prepaid card by the customer or uponand (ii) the expirationestimated pattern of the right to access the prepaid service. While the terms of prepaid e-vouchers can be extended by the purchase of additional e-vouchers, prepaid e-vouchers may not be extended beyond three or four years, dependent on the initial expiry period when purchased.use. The Company does not offer refunds for unused prepaid services.
Services sold to the U.S. government
The Company provides airtime and airtime support to U.S. government and other authorized customers pursuant to the Enhanced Mobile Satellite Services (“EMSS”) contract managed by the U.S. Space Force. Under the terms of this agreement, authorized customers continue to utilize airtime services, provided through the U.S. government’s dedicated gateway. These services include unlimited global standard and secure voice, low and high-speed data, paging, broadcast and Distributed Tactical Communications Services (“DTCS”) services for an unlimited number of Department of Defense (“DoD”) and other federal subscribers. Under this contract, revenue is based on the annual fee for the fixed-price contract with unlimited subscribers and is recognized on a straight-line basis over each contractual year, with equal payments submitted monthly. The U.S. government purchases its subscriber equipment from third-party distributors and not directly from the Company.
68
Subscriber equipment sold on a stand-alone basis
The Company recognizes subscriber equipment sales and the related costs when title to the equipment (and the risks and rewards of ownership) passes to the customer, typically upon shipment.
Government engineering and support services
The Company provides maintenance services to the U.S. government’s dedicated gateway. This revenue is recognized ratably over the periods in which the services are provided; the related costs are expensed as incurred.
Other government and commercial engineering and support services
The Company also provides engineering services to assist customers in developing new technologies for use on the Company’s satellite system. Fees to customers under these agreements are generally based on milestones, and payments are submitted as milestones are achieved. The revenue associated with these servicesfixed-fee contracts is recorded whenrecognized over time using costs incurred to date relative to total estimated costs at completion to measure progress toward satisfying its performance obligation. The Company does not include purchases of goods from a third party in its evaluation of costs incurred. Incurred costs represent work performed, which corresponds with, and thereby best depicts, the services are rendered, typically on a proportional performance methodtransfer of accounting based oncontrol to the Company’s estimate of total costs expected to complete the contract, and the related costs are expensed as incurred. Revenue oncustomer. The revenue associated with cost-plus-fixed-fee contracts is recognized to the extent of estimated costs incurred plus the applicable fees earned. The Company considers fixed fees under cost-plus-fixed-fee contracts to be earned in proportion to the allowable costs incurred in performance of the contract.
Research and Development
Research and development costs are charged to expense in the period in which they are incurred.
Advertising Costs
Costs associated with advertising and promotions are expensed as incurred. Advertising expenses were $0.3$1.4 million, $0.5$1.7 million and $0.5$1.9 million for the years ended December 31, 2017, 20162023, 2022 and 2015,2021, respectively.
Income Taxes
The Company accounts for income taxes using the asset and liability approach, which requires the recognition of tax benefits or
expenses for temporary differences between the financial reporting and tax bases of assets and liabilities. A valuation allowance is established when necessary to reduce deferred tax assets to the amounts expected to be realized. The Company also recognizes a tax benefit from uncertain tax positions only if it is “more likely than not” that the position is sustainable based on its technical merits. The Company’s policy is to recognize interest and penalties on uncertain tax positions as a component of income tax expense.
Net Income (Loss) Per Share
The Company calculates basic net income (loss) per share by dividing net income (loss) attributable to common stockholders by the weighted-average number of shares of common stock outstanding during the period. Diluted net income (loss) per share takes into account the effect of potentialpotentially dilutive common shares when the effect is dilutive. The effect of potentialpotentially dilutive common shares, including common stock issuable upon exercise of outstanding stock options, is computed using the treasury stock method. The effect of potentialpotentially dilutive common shares from the conversion of the outstanding convertible preferred securities iswas computed using the as-if converted method at the stated conversion rate. The Company’s unvested restricted stock units ("RSUs")RSUs awarded to the board of directors contain non-forfeitable rights to dividends and therefore are considered to be participating securities in periods of net income. The calculation of basic and diluted net income (loss) per share excludes net income attributable to these unvested RSUs from the numerator and excludes the impact of these unvested RSUs from the denominator.
69
3. Cash and Cash Equivalents and Marketable Securities
Cash and Cash Equivalents
The following table summarizes the Company’s cash and cash equivalents:
| December 31, | Recurring Fair Value Measurement | |||||||||||||||||||
| 2023 | 2022 | |||||||||||||||||||
| (In thousands) | ||||||||||||||||||||
| Cash and cash equivalents: | ||||||||||||||||||||
| Cash | $ | 32,526 | $ | 16,247 | ||||||||||||||||
| Money market funds | 39,344 | 152,523 | Level 2 | |||||||||||||||||
| Total cash and cash equivalents | $ | 71,870 | $ | 168,770 | ||||||||||||||||
4. Property and Equipment
| Year Ended December 31, | |||||||||
| 2017 | 2016 | Recurring Fair Value Measurement | |||||||
| (In thousands) | |||||||||
| Cash and cash equivalents: | |||||||||
| Cash | $ | 24,092 | $ | 102,194 | |||||
| Money market funds | 251,950 | 266,478 | Level 1 | ||||||
| Commercial paper | 9,831 | 2,495 | Level 2 | ||||||
| Total cash and cash equivalents | $ | 285,873 | $ | 371,167 | |||||
| December 31, 2017 | |||||||||||||||||
Amortized Cost | Gross Unrealized Gains | Gross Unrealized Losses | Estimated Fair Value | Recurring Fair Value Measurement | |||||||||||||
| (In thousands) | |||||||||||||||||
| Fixed-income debt securities | $ | 9,520 | $ | 2 | $ | (15 | ) | $ | 9,507 | Level 2 | |||||||
| U.S. Treasury notes | 2,249 | — | (3 | ) | 2,246 | Level 2 | |||||||||||
| Total marketable securities | $ | 11,769 | $ | 2 | $ | (18 | ) | $ | 11,753 | ||||||||
| December 31, 2016 | |||||||||||||||||
Amortized Cost | Gross Unrealized Gains | Gross Unrealized Losses | Estimated Fair Value | Recurring Fair Value Measurement | |||||||||||||
| (In thousands) | |||||||||||||||||
| Fixed-income debt securities | $ | 30,037 | $ | 14 | $ | (11 | ) | $ | 30,040 | Level 2 | |||||||
| U.S. Treasury notes | 9,283 | 7 | (2 | ) | 9,288 | Level 2 | |||||||||||
| Total marketable securities | $ | 39,320 | $ | 21 | $ | (13 | ) | $ | 39,328 | ||||||||
The following table presents the contractual maturitiescomposition of the fixed income debt securities, commercial paperproperty and U.S. Treasury notes:equipment:
| December 31, 2017 | December 31, 2016 | ||||||||||||||
Amortized Cost | Fair Value | Amortized Cost | Fair Value | ||||||||||||
| (In thousands) | (In thousands) | ||||||||||||||
| Mature within one year | $ | 11,519 | $ | 11,504 | $ | 32,776 | $ | 32,788 | |||||||
| Mature after one year and within three years | 250 | 249 | 6,544 | 6,540 | |||||||||||
| Total | $ | 11,769 | $ | 11,753 | $ | 39,320 | $ | 39,328 | |||||||
| Year ending December 31, | Amount | |||
| (In thousands) | ||||
| 2018 | $ | 85,500 | ||
| 2019 | 202,500 | |||
| 2020 | 288,000 | |||
| 2021 | 306,000 | |||
| 2022 | 306,000 | |||
| Thereafter | 612,000 | |||
| Total debt commitments | $ | 1,800,000 | ||
| Original issuance discount | 96,445 | |||
| Total short-term debt | 85,500 | |||
| Total long-term debt, net | $ | 1,618,055 | ||
| December 31, | |||||||
| 2017 | 2016 | ||||||
| (In thousands) | |||||||
| Satellite system | $ | 1,199,794 | $ | 314,228 | |||
| Ground system | 67,576 | 63,519 | |||||
| Equipment | 35,616 | 34,139 | |||||
| Internally developed software and purchased software | 191,089 | 127,498 | |||||
| Building and leasehold improvements | 32,130 | 32,099 | |||||
| 1,526,205 | 571,483 | ||||||
| Less: accumulated depreciation | (432,833 | ) | (422,098 | ) | |||
| 1,093,372 | 149,385 | ||||||
| Land | 8,037 | 8,037 | |||||
| Construction in process: | |||||||
| Iridium NEXT systems under construction | 2,088,380 | 2,639,824 | |||||
| Other construction in process | 20,373 | 15,838 | |||||
| Total property and equipment, net of accumulated depreciation | $ | 3,210,162 | $ | 2,813,084 | |||
| December 31, | December 31, | ||||||||||||||||||||||||||||||||||||||||||||
| Useful Life | 2023 | 2022 | |||||||||||||||||||||||||||||||||||||||||||
| (In thousands) | |||||||||||||||||||||||||||||||||||||||||||||
| December 31, | |||||||||||||||||||||||||||||||||||||||||||||
| 2017 | 2016 | ||||||||||||||||||||||||||||||||||||||||||||
| (In thousands) | |||||||||||||||||||||||||||||||||||||||||||||
| Internally developed software | $ | 14,782 | $ | 14,218 | |||||||||||||||||||||||||||||||||||||||||
| Satellite system | |||||||||||||||||||||||||||||||||||||||||||||
| Satellite system | |||||||||||||||||||||||||||||||||||||||||||||
| Satellite system | |||||||||||||||||||||||||||||||||||||||||||||
| Ground system | |||||||||||||||||||||||||||||||||||||||||||||
| Equipment | 4,241 | 1,546 | |||||||||||||||||||||||||||||||||||||||||||
| Ground system | 1,350 | 74 | |||||||||||||||||||||||||||||||||||||||||||
| Total other construction in process | $ | 20,373 | $ | 15,838 | |||||||||||||||||||||||||||||||||||||||||
| Internally developed software and purchased software | |||||||||||||||||||||||||||||||||||||||||||||
| Building and leasehold improvements | |||||||||||||||||||||||||||||||||||||||||||||
| Total depreciable property and equipment | |||||||||||||||||||||||||||||||||||||||||||||
| Less: accumulated depreciation | |||||||||||||||||||||||||||||||||||||||||||||
| Total depreciable property and equipment, net of accumulated depreciation | |||||||||||||||||||||||||||||||||||||||||||||
| Land | |||||||||||||||||||||||||||||||||||||||||||||
| Construction-in-process: | |||||||||||||||||||||||||||||||||||||||||||||
| Spare satellites | |||||||||||||||||||||||||||||||||||||||||||||
| Spare satellites | |||||||||||||||||||||||||||||||||||||||||||||
| Spare satellites | |||||||||||||||||||||||||||||||||||||||||||||
| Other construction-in-process | |||||||||||||||||||||||||||||||||||||||||||||
| Total property and equipment, net of accumulated depreciation | |||||||||||||||||||||||||||||||||||||||||||||
Depreciation expense for the years ended December 31, 2017, 2016 and 2015 was $120.7$318.5 million, $48.6$301.9 million and $51.0 million, respectively. The increase in depreciation from 2016 to 2017 partially results from the write-off of $36.8 million previously paid to Kosmotras, and the addition of new assets, including Iridium NEXT satellites placed into service during 2017. See Note 9 for further details on Kosmotras.
| December 31, 2017 | |||||||||||||
Useful Life (years) | Gross Carrying Value | Accumulated Amortization | Net Carrying Value | ||||||||||
| (In thousands) | |||||||||||||
| Indefinite life intangible assets: | |||||||||||||
| Trade names | Indefinite | $ | 21,195 | $ | — | $ | 21,195 | ||||||
| Spectrum and licenses | Indefinite | 14,030 | — | 14,030 | |||||||||
| Total | 35,225 | — | 35,225 | ||||||||||
| Definite life intangible assets: | |||||||||||||
| Intellectual property | 20 years | 16,439 | (6,651 | ) | 9,788 | ||||||||
| Assembled workforce | 7 years | 5,678 | (812 | ) | 4,866 | ||||||||
| Patents | 14 - 20 | 146 | (6 | ) | 140 | ||||||||
| Total | 22,263 | (7,469 | ) | 14,794 | |||||||||
| Total intangible assets | $ | 57,488 | $ | (7,469 | ) | $ | 50,019 | ||||||
| December 31, 2016 | |||||||||||||
Useful Life (years) | Gross Carrying Value | Accumulated Amortization | Net Carrying Value | ||||||||||
| (In thousands) | |||||||||||||
| Indefinite life intangible assets: | |||||||||||||
| Trade names | Indefinite | $ | 21,195 | $ | — | $ | 21,195 | ||||||
| Spectrum and licenses | Indefinite | 14,030 | — | 14,030 | |||||||||
| Total | 35,225 | — | 35,225 | ||||||||||
| Definite life intangible assets: | |||||||||||||
| Intellectual property | 20 years | 16,439 | (5,868 | ) | 10,571 | ||||||||
| Total | 16,439 | (5,868 | ) | 10,571 | |||||||||
| Total intangible assets | $ | 51,664 | $ | (5,868 | ) | $ | 45,796 | ||||||
70
5. Intangible Assets
The following table presents identifiable intangible assets:
| December 31, 2023 | ||||||||||||||||||||||||||
| Useful Life | Gross Carrying Value | Accumulated Amortization | Net Carrying Value | |||||||||||||||||||||||
| (In thousands) | ||||||||||||||||||||||||||
| Indefinite life intangible assets: | ||||||||||||||||||||||||||
| Trade names | Indefinite | $ | 21,195 | $ | — | $ | 21,195 | |||||||||||||||||||
| Spectrum and licenses | Indefinite | 14,030 | — | 14,030 | ||||||||||||||||||||||
| Total | 35,225 | — | 35,225 | |||||||||||||||||||||||
| Definite life intangible assets: | ||||||||||||||||||||||||||
| Intellectual property | 20 years | 16,439 | (10,987) | 5,452 | ||||||||||||||||||||||
| Assembled workforce | 7 years | 5,678 | (5,678) | — | ||||||||||||||||||||||
| Patents | 14 - 20 years | 587 | (169) | 418 | ||||||||||||||||||||||
| Total | 22,704 | (16,834) | 5,870 | |||||||||||||||||||||||
| Total intangible assets | $ | 57,929 | $ | (16,834) | $ | 41,095 | ||||||||||||||||||||
| December 31, 2022 | ||||||||||||||||||||||||||
| Useful Life | Gross Carrying Value | Accumulated Amortization | Net Carrying Value | |||||||||||||||||||||||
| (In thousands) | ||||||||||||||||||||||||||
| Indefinite life intangible assets: | ||||||||||||||||||||||||||
| Trade names | Indefinite | $ | 21,195 | $ | — | $ | 21,195 | |||||||||||||||||||
| Spectrum and licenses | Indefinite | 14,030 | — | 14,030 | ||||||||||||||||||||||
| Total | 35,225 | — | 35,225 | |||||||||||||||||||||||
| Definite life intangible assets: | ||||||||||||||||||||||||||
| Intellectual property | 20 years | 16,439 | (10,347) | 6,092 | ||||||||||||||||||||||
| Assembled workforce | 7 years | 5,678 | (4,867) | 811 | ||||||||||||||||||||||
| Patents | 14 - 20 years | 576 | (127) | 449 | ||||||||||||||||||||||
| Total | 22,693 | (15,341) | 7,352 | |||||||||||||||||||||||
| Total intangible assets | $ | 57,918 | $ | (15,341) | $ | 42,577 | ||||||||||||||||||||
Amortization expense was $1.5 million, $1.6 million and $1.6 million for the years ended December 31, 2023, 2022 and 2021, respectively.
The following table presents future amortization expense with respect to intangible assets existing at December 31, 2017,2023, by year and in the aggregate, is as follows:aggregate:
| Year ending December 31, | Amount | |||||||
| (In thousands) | ||||||||
| 2024 | $ | 473 | ||||||
| 2025 | 473 | |||||||
| 2026 | 473 | |||||||
| 2027 | 473 | |||||||
| 2028 | 473 | |||||||
| Thereafter | 3,505 | |||||||
| Total estimated future amortization expense | $ | 5,870 | ||||||
71
| Year ending December 31, | Amount | |||
| (In thousands) | ||||
| 2018 | $ | 1,604 | ||
| 2019 | 1,604 | |||
| 2020 | 1,604 | |||
| 2021 | 1,604 | |||
| Thereafter | 8,378 | |||
| Total estimated future amortization expense | $ | 14,794 | ||
6. Leases
The following table summarizes the Company’s lease-related assets and liabilities:
| Leases | Classification | December 31, 2023 | December 31, 2022 | |||||||||||||||||
| (In thousands) | ||||||||||||||||||||
| Operating lease assets | ||||||||||||||||||||
| Noncurrent | Other assets | $ | 16,133 | $ | 16,925 | |||||||||||||||
| Total lease assets | $ | 16,133 | $ | 16,925 | ||||||||||||||||
| Operating lease liabilities | ||||||||||||||||||||
| Current | Accrued expenses and other current liabilities | $ | 4,327 | $ | 3,784 | |||||||||||||||
| Noncurrent | Other long-term liabilities | $ | 14,087 | 15,801 | ||||||||||||||||
| Total lease liabilities | $ | 18,414 | $ | 19,585 | ||||||||||||||||
During the years ended December 31, 2023, 2022 and 2021, the Company incurred lease expense of $5.2 million, $5.2 million and $5.6 million, respectively. A portion of lease expense during these comparable periods was derived from leases that were not included within the ROU asset and liability balances shown above as they had madeterms shorter than twelve months and were therefore excluded from balance sheet recognition under ASU 2016-02.
The following table presents future payment obligations with respect to the Company’s operating leases in which it was the lessee at December 31, 2023, by year and in the aggregate:
| Year Ending December 31, | Amount | |||||||
| (In thousands) | ||||||||
| 2024 | $ | 5,548 | ||||||
| 2025 | 5,646 | |||||||
| 2026 | 3,792 | |||||||
| 2027 | 2,226 | |||||||
| 2028 | 1,982 | |||||||
| Thereafter | 2,592 | |||||||
| Total lease payments | $ | 21,786 | ||||||
Lessor Arrangements
Operating leases in which the Company is a lessor consist primarily of hosting agreements with Aireon LLC(“Aireon”) (see Note 14)and L3Harris Technologies, Inc. (“L3Harris”) for space on the Company’s satellites. These agreements provide for a fee that will be recognized over the estimated useful lives of the satellites, which is now approximately 17.5 years, prospectively from the change in estimated useful lives of the satellites that occurred in the fourth quarter of 2023. Lease income related to these agreements was $19.2 million for the year ended December 31, 2023 and $21.4 million for each of the years ended December 31, 2022 and 2021. The decrease for 2023 as compared to 2022 was solely the result of the change in estimated useful life of the satellites. Lease income is recorded as hosted payload and other data service revenue within service revenue on the Company’s consolidated statements of operations and comprehensive income (loss).
72
The following table presents future income, after giving effect to the extension of estimated useful lives of the satellites, with respect to the Company’s operating leases in which it was the lessor at December 31, 2023, by year and in the aggregate:
| Year Ending December 31, | Amount | |||||||
| (In thousands) | ||||||||
| 2024 | $ | 12,391 | ||||||
| 2025 | 12,391 | |||||||
| 2026 | 12,391 | |||||||
| 2027 | 12,391 | |||||||
| 2028 | 12,391 | |||||||
| Thereafter | 82,106 | |||||||
| Total lease income | $ | 144,061 | ||||||
7. Debt
Term Loan and Revolving Facility
In September 2023, pursuant to an amended and restated credit agreement (the “Credit Agreement”), the Company refinanced its previously existing term loan resulting in total borrowing of $1,500.0 million (as so amended and restated, the “Term Loan”) in aggregate principal amount with various lenders administered by Deutsche Bank AG and an accompanying $100.0 million revolving loan (the “Revolving Facility”). The Term Loan was issued at a price equal to 99.75% of its face value and bears interest at an annual rate equal to the Secured Overnight Financing Rate (“SOFR”) plus 2.50%, with a 0.75% SOFR floor. The maturity of the Term Loan is in September 2030. The Company typically selects a one-month interest period, with the result that interest is calculated using one-month SOFR. Interest is paid monthly on the last business day of the month. Principal payments, payable quarterly beginning with the quarter ending March 31, 2024, equal $15.0 million per annum (one percent of $1.9 billionthe full principal amount of the Term Loan), with the remaining principal due upon maturity.
The Revolving Facility bears interest at the same rate (but without a SOFR floor) if and as drawn, with no original issue discount, a commitment fee of 0.5% per year on the undrawn amount, which will be reduced to Thales,0.375% if the Company has a consolidated first lien net leverage ratio (as defined in the Credit Agreement) of less than 3.5 to 1, and a maturity date in September 2028.
The Company paid $3.8 million of issuance costs to refinance the Term Loan in September 2023, which $1.5 billion were financed fromdeferred and will be amortized through the term of the loan. Lenders making up approximately $16.8 million of the Term Loan did not participate in the refinancing. Those portions of the Term Loan were replaced by new or existing lenders. This resulted in an immaterial loss on extinguishment of debt, as the Company wrote off the unamortized debt issuance costs related to the lenders who were fully repaid in an exchange of principal. The Company deferred an additional $1.2 million of third-party fees associated with the refinancing of the Term Loan and the Revolving Facility.
In the fourth quarter of 2022, the Company elected to prepay $100.0 million of principal on the Term Loan. This resulted in a $1.2 million loss on extinguishment of debt, as the Company wrote off the unamortized debt issuance costs related to this prepayment.
In the third quarter of 2021, the Company repriced the Term Loan and incurred a $0.9 million loss on extinguishment of debt, as the Company wrote off the unamortized debt issuance costs related to the lenders who were fully repaid in an exchange of principal.
As of December 31, 2023 and 2022, the Company reported an aggregate of $1,500.0 million and $1,504.6 million in borrowings under the Credit FacilityTerm Loan, respectively. These amounts do not include $17.5 million and were capitalized$17.4 million of net unamortized deferred financing costs as constructionof December 31, 2023 and 2022, respectively. The net principal balance in progress within property and equipment, netborrowings in the accompanying consolidated balance sheet. The Credit Facility was fully drawn in February 2017. With the exceptionsheets as of the invoicesDecember 31, 2023 and 2022 amounted to be paid with the bills of exchange described below, the Company expects to pay 100% of each invoice received from Thales from cash$1,482.5 million and marketable securities on hand.
The Credit Agreement restricts the CompanyCompany’s ability to incur liens, engage in mergers or asset sales, pay Thales for the BPIAE premium on the guaranteedividends, repay subordinated indebtedness, incur indebtedness, make investments and loans, and engage in other transactions as specified in the amountCredit Agreement. The Credit Agreement provides for specified exceptions, including baskets measured as a percentage of $1.0 million
73
trailing twelve months of earnings before interest, taxes, depreciation and amortization (“EBITDA”) and unlimited exceptions in the case of incurring indebtedness and liens and making investments, dividend payments, and payments of subordinated indebtedness, based on achievement and maintenance of specified leverage ratios. The Credit Agreement also contains an annual mandatory prepayment sweep mechanism with respect to a portion of the Company’s excess cash at signing (which was recorded as original issue discount) plus 1.62%.
The Credit Agreement contains no financial maintenance covenants with respect to the Term Loan. With respect to the Revolving Facility, the Credit Agreement requires the Company received $28.6 million from GFZto maintain a consolidated first lien net leverage ratio (as defined in the Credit Agreement) of no greater than 6.25 to 1 if more than 35% of the Revolving Facility has been drawn. The Credit Agreement contains other customary representations and warranties, affirmative and negative covenants, and events of default. The Company was in compliance with all covenants as of December 31, 2017.2023.
comprehensive income (loss).
The Credit Facility requiresfollowing table presents the Company to obtain insurance covering the launchinterest and first 12 monthsamortization of operation of the Iridium NEXT satellites. The launch and in-orbit insurance the Company has obtained contains elements, consistent with the
| Year Ended December 31, | ||||||||||||||||||||
| 2023 | 2022 | 2021 | ||||||||||||||||||
| (In thousands) | ||||||||||||||||||||
| Total interest incurred | $ | 102,321 | $ | 72,090 | $ | 72,816 | ||||||||||||||
| Amortization of deferred financing fees | $ | 3,958 | $ | 4,760 | $ | 4,316 | ||||||||||||||
| Capitalized interest | $ | 5,086 | $ | 2,590 | $ | 2,146 | ||||||||||||||
As of December 31, 2017,2023 and 2022, accrued interest under the aggregate unconditional purchase obligations were $45.4Term Loan was $1.0 million which includes the Company’s commitments with Boeing and Benchmark. The Boeing obligations (see Note 6) represent the new take-or-pay commitment with the execution of the DSA, which was met as of December 31, 2017 and final payment for the acquisition of the assembled workforce. The Company's obligation to Benchmark for the year ending December 31, 2018 is $9.2 million.$0.3 million, respectively.
Total Debt
The current policy has a renewable one-year term, which is scheduled to expire on December 8, 2018. The policy coverage is separated into Sections A, B, and C.
| Year ending December 31, | Amount | |||||||
| (In thousands) | ||||||||
| 2024 | $ | 15,000 | ||||||
| 2025 | 15,000 | |||||||
| 2026 | 15,000 | |||||||
| 2027 | 15,000 | |||||||
| 2028 | 15,000 | |||||||
| Thereafter | 1,425,000 | |||||||
| Total debt commitments | 1,500,000 | |||||||
| Less: Original issuance discount | 17,510 | |||||||
| Less: Total short-term debt | 15,000 | |||||||
| Total long-term debt, net | $ | 1,467,490 | ||||||
74
The repayment schedule above excludes future amounts that may be required to be prepaid pursuant to the excess cash flow sweep provision of the Credit Agreement, as those amounts are not determinable in advance.
8. Derivative Financial Instruments
The Company is exposed to interest rate fluctuations related to its Term Loan. The Company has reduced its exposure to fluctuations in the cash flows associated with changes in the variable interest rate by entering into offsetting positions through the use of interest rate hedges. This will reduce the negative impact of increases in the variable rate over the term of the derivative contracts. These contracts are not used for trading or other speculative purposes. Historically, the Company has not incurred, and does not expect to incur in the future, any losses as a result of counterparty default.
Hedge effectiveness of the current interest rate cap agreement (the “Cap”) is based on a long-haul hypothetical derivative methodology and includes all changes in value. The Company formally assesses, both at the hedge’s inception and on an ongoing quarterly basis, whether the designated derivative instruments are highly effective in offsetting changes in the cash flows of the hedged items. When the hedging instrument is sold, expires, is terminated, is exercised, no longer qualifies for hedge accounting, is designated, or is no longer probable, hedge accounting is discontinued prospectively.
Interest Rate Cap
In July 2021, the Company entered into the Cap, which had an effective date of December 2021 upon the expiration of the Company’s long-term interest rate swap (the “Swap”). The Cap manages the Company’s exposure to interest rate movements on a portion of the Term Loan through November 2026. In December 2022, the Company modified the Cap to replace the previous LIBOR base rate with SOFR and received a credit risk adjustment of 0.064%. The modified Cap provides the Company the right to receive payment from the counterparty if one-month SOFR exceeds 1.436%. Prior to the modification, the Company received payment under noncancelable operating leases atthe terms of the Cap if one-month LIBOR exceeded 1.5%. The Company pays a fixed monthly premium based on an annual rate of 0.31% for the Cap. The Cap carried a notional amount of $1.0 billion as of December 31, 2017,2023 and 2022.
The Cap, which was not affected by the refinancing of the Term Loan in September 2023, is designed to mirror the terms of the Term Loan and to offset the cash flows being hedged. The Company designated the Cap as a cash flow hedge of the variability of the SOFR-based rate interest payments on the Term Loan. The effective portion of the Cap’s change in fair value will be recorded in accumulated other comprehensive income (loss). Any ineffective portion of the Cap’s change in fair value will be recorded in current earnings as interest expense.
Interest Rate Swaps
In November 2019, the Company entered into the Swap which had a term through November 2021 and was intended to mitigate variability in forecasted interest payments on a portion of the Term Loan. On the last business day of each month, the Company received variable interest payments based on one-month LIBOR from the counterparty. The Company paid a fixed rate of 1.565% per annum on the notional amount of $1.0 billion on the Swap until its expiration in November 2021. The Company also entered into an interest rate swaption agreement (“Swaption”), for which the Company paid a fixed annual rate of 0.50% of the notional amount. At inception, the Swap and Swaption (collectively, the “swap contracts”) were designated as cash flow hedges for hedge accounting. The unrealized changes in market value were recorded in accumulated other comprehensive income (loss) and any remaining balance was reclassified into earnings during the period in which the hedged transaction affected earnings. Due to the changes made to the Term Loan as a result of the July 2021 repricing, at that time the Company elected to de-designate the Swap as a cash flow hedge. Accordingly, as the related interest payments were still probable, the accumulated balance within other comprehensive income (loss) as of the de-designation date was amortized into earnings through the November 2021 expiration date.
Fair Value of Derivative Instruments
As of December 31, 2023 and 2022, the Company had an asset balance of $66.5 million and $92.3 million, respectively, for the fair value of the Cap, and a liability balance of $8.4 million and $11.0 million, respectively, for the fair value of the Cap premium. Both the Cap and the Cap premium are as follows:recorded within other assets on the consolidated balance sheet.
75
| Year ending December 31, | Operating Leases | |||
| (In thousands) | ||||
| 2018 | $ | 3,741 | ||
| 2019 | 3,692 | |||
| 2020 | 3,734 | |||
| 2021 | 3,827 | |||
| 2022 | 3,402 | |||
| Thereafter | 8,849 | |||
| Total | $ | 27,245 | ||
The following table presents the amount of unrealized gain or loss and related tax impact associated with the derivative instruments that the Company recorded in its business, financial results or financial condition.consolidated statements of operations and comprehensive income (loss):
| Year Ended December 31, | ||||||||||||||||||||
| 2023 | 2022 | 2021 | ||||||||||||||||||
| (In thousands) | ||||||||||||||||||||
| Unrealized gain (loss), net of tax | $ | (17,598) | $ | 58,668 | $ | 10,408 | ||||||||||||||
| Tax benefit (expense) | $ | 5,379 | $ | (17,834) | $ | (3,316) | ||||||||||||||
9. Stock-Based Compensation
In May 2017,2023, the Company’s stockholders approved the amendment and restatement of the Company'sCompany’s 2015 Equity Incentive Plan (as so amended and restated, the “Amended 2015 Plan”), primarily to increase the number. As of shares available under the plan. As such, the Company registered an additional 5,199,239 shares of common stock made available for issuance pursuant to the Amended 2015 Plan, bringing the total to 28,402,248 shares. Through December 31, 2017,2023, the remaining aggregate number of shares of ourthe Company’s common stock available for future grants under the Amended 2015 Plan was 15,012,331.12,917,165. The Amended 2015 Plan provides for the grant of stock-based awards, including nonqualified stock options, incentive stock options, restricted stock, awardsrestricted stock units (“RSUs”), stock appreciation rights and other equity securities as incentives and rewards forto employees, consultants and non-employee directors of the Company and its affiliated entities. The number of shares of common stock available for issuance under the Amended 2015 Plan is reduced by (i) one share for each share of common stock issued pursuant to an appreciation award, such as a stock option or stock appreciation right with an exercise or strike price of at least 100% of the fair market value of the underlying common stock on the date of grant, and (ii) 1.8 shares for each share of common stock issued pursuant to any stock award that is not an appreciation award, also referred to as a “full value award.” The Amended 2015 Plan allows usthe Company to utilize a broad array of equity incentives and performance cash incentives in order to secure and retain the services of ourits employees, directors and consultants, and to provide long-term incentives that align the interests of ourits employees, directors and consultants with the interests of ourthe Company’s stockholders. The Company accounts for stock-based compensation at estimated fair value.
Restricted Stock Units
Each RSU represents the right to receive one share of common stock at a future date. Historically, RSUs granted to employees for service generally vested over four years, with 25% vesting on the first anniversary of the grant date and the remainder vesting ratably on a quarterly basis thereafter, subject to continued employment. Beginning with grants made in 2024, RSUs granted to employees for service will generally vest over three years, with 34% vesting on the first anniversary of the grant date and the remainder vesting ratably on a quarterly basis thereafter, subject to continued employment. Some RSUs granted to employees for performance vest upon the completion of defined performance goals, subject to continued employment. The RSUs granted to non-employee directors generally vest in full on the first anniversary of the grant date. The RSUs granted to non-employee consultants generally vest 50% on the first anniversary of the grant date, with the remaining 50% vesting quarterly thereafter through the second anniversary of the grant date. The Company’s RSUs are classified as equity awards because the RSUs will be settled in the Company’s common stock upon vesting. The fair value of RSUs is determined at the grant date based on the closing price of the Company’s common stock on the date of grant. The related compensation expense is recognized over the service period, or shorter periods based on the retirement eligibility of certain grantees, and is based on the grant date fair value of the Company’s common stock and the number of shares expected to vest. The fair value of the awards is not remeasured at the end of each reporting period. RSUs do not carry voting rights until the RSUs are vested, but certain unvested RSUs are entitled to accrue dividends, and shares are issued upon settlement in accordance with the terms of the award.
76
RSU Summary
The following table summarizes the Company’s RSU activity:
| RSUs | Weighted- Average Grant Date Fair Value Per RSU | |||||||||||||
| (In thousands) | ||||||||||||||
| Outstanding at December 31, 2020 | 2,664 | $ | 18.96 | |||||||||||
| Granted | 913 | $ | 41.55 | |||||||||||
| Forfeited | (115) | $ | 29.49 | |||||||||||
| Released | (912) | $ | 21.12 | |||||||||||
| Outstanding at December 31, 2021 | 2,550 | $ | 25.80 | |||||||||||
| Granted | 1,562 | $ | 40.21 | |||||||||||
| Forfeited | (152) | $ | 32.80 | |||||||||||
| Released | (990) | $ | 30.05 | |||||||||||
| Outstanding at December 31, 2022 | 2,970 | $ | 31.60 | |||||||||||
| Granted | 1,184 | $ | 57.85 | |||||||||||
| Forfeited | (76) | $ | 46.02 | |||||||||||
| Released | (1,283) | $ | 36.02 | |||||||||||
| Outstanding at December 31, 2023 | 2,795 | $ | 40.24 | |||||||||||
Vested and unreleased at December 31, 2023 (1) | 713 | |||||||||||||
(1) These RSUs were granted to the Company’s board of directors as a part of their compensation for board and committee service and had vested but had not yet settled, meaning that the underlying shares of common stock had not been issued and released.
As of December 31, 2023, the total unrecognized cost related to non-vested RSUs was approximately $42.6 million. This cost is expected to be recognized over a weighted-average period of 1.4 years. The Company recognized $57.5 million, $43.2 million and $26.0 million of stock-based compensation expense related to RSUs in the years ended December 31, 2023, 2022 and 2021, respectively.
Service-Based RSU Awards
The majority of the annual compensation the Company provides to non-employee members of its board of directors is paid in the form of RSUs. In addition, some members of the Company’s board of directors elect to receive their cash retainers, or a portion thereof, in the form of RSUs. An aggregate amount of approximately 55,000, 57,000 and 39,000 service-based RSUs were granted to the Company’s non-employee directors as a result of these payments and elections during the years ended December 31, 2023, 2022 and 2021, respectively, with an estimated grant date fair value of $2.9 million, $2.2 million and $1.6 million, respectively.
During the years ended December 31, 2023, 2022 and 2021, the Company granted approximately 746,000, 1,082,000 and 531,000 service-based RSUs, respectively, to its employees, with an estimated aggregate grant date fair value of $43.0 million, $44.2 million and $22.0 million, respectively.
During the years ended December 31, 2023, 2022 and 2021, the Company granted approximately 1,000, 7,000 and 2,000 service-based RSUs, respectively, to non-employee consultants, with an estimated grant date fair value of $0.1 million, $0.3 million and $0.1 million, respectively.
Performance-Based RSU Awards
In March 2023, 2022 and 2021, the Company awarded approximately 193,000, 248,000 and 228,000 performance-based RSUs, respectively, to the Company’s executives and employees (the “Bonus RSUs”), with an estimated grant date fair value of $11.9 million, $9.7 million and $9.5 million, respectively. Vesting of the Bonus RSUs is and was dependent upon the Company’s achievement of defined performance goals for the respective fiscal year in which the Bonus RSUs were granted. The Company
77
records stock-based compensation expense related to performance-based RSUs when it is considered probable that the performance conditions will be met. Management believes it is probable that substantially all of the 2023 Bonus RSUs will vest. The level of achievement, if any, of performance goals will be determined by the compensation committee of the Company’s board of directors and, if such goals are achieved, the 2023 Bonus RSUs will vest, subject to continued employment, in March 2024. Substantially all of the Bonus RSUs awarded in 2022 and 2021 vested in March 2023 and March 2022, respectively, upon the determination of the level of achievement of the respective performance goals.
Additionally, during 2023, 2022 and 2021, the Company awarded approximately 134,000, 167,000 and 110,000 performance-based RSUs, respectively, to the Company’s executives (the “Executive RSUs”). The estimated aggregate grant date fair value of the Executive RSUs for the 2023, 2022 and 2021 grants was $8.2 million, $6.5 million and $4.6 million, respectively. Vesting of the Executive RSUs is and was dependent upon the Company’s achievement of defined performance goals over a two-year period (the year of grant and the following year). The vesting of Executive RSUs will ultimately range from 0% to 150% of the number of shares underlying the Executive RSUs granted based on the level of achievement of the performance goals.
If the Company achieves the performance goals for the Executive RSUs at the end of the two-year performance period, 50% of the number of Executive RSUs earned based on performance will then vest on the second anniversary of the grant date, and the remaining 50% will then vest on the third anniversary of the grant date, in each case subject to the executive’s continued service as of the vesting date. In March 2023, the Company awarded approximately 55,000 additional shares related to performance-based RSUs granted to the Company’s executives for over-achievement of performance targets for the Executive RSUs with a performance period that ended December 31, 2022. In March 2022, the Company cancelled approximately 50,000 shares related to performance-based RSUs granted to the Company’s executives in 2020 for under-achievement of performance targets for the performance period that ended December 31, 2021. In March 2021, the Company awarded approximately 3,000 additional shares related to performance-based RSUs granted to the Company’s executives in 2019 for over-achievement of performance targets for the performance period that ended December 31, 2020.
Stock Option Awards
The Company last granted stock options in 2019. The stock option awards granted to employees generally (i) have a term of ten years, (ii) vest over a four-year periodfour years with 25% vesting after the first year of service and the remainder vesting ratably on a quarterly basis thereafter, (iii) are contingent upon employment on the vesting date, and (iv) have an exercise price equal to the fair market value of the underlying shares at the date of grant. The fair value of stock options was determined at the grant date using the Black-Scholes-Merton option pricing model.
The following table summarizes the Company’s stock option awards granted to the Company’s board of directors generally (i) represent a portion of their annual compensation, (ii) have a term of ten years, (iii) vest over the calendar year with 25% vesting on the last day of each calendar quarter, (iv) are contingent upon continued service on the vesting date, and (v) have an exercise price equal to theaward activity:
| Shares | Weighted- Average Exercise Price Per Share | Weighted- Average Remaining Contractual Term (Years) | Aggregate Intrinsic Value | |||||||||||||||||||||||
| (In thousands, except years and per share data) | ||||||||||||||||||||||||||
| Options outstanding at December 31, 2020 | 2,554 | $ | 9.10 | 3.94 | $ | 77,182 | ||||||||||||||||||||
| Cancelled or expired | (3) | 10.67 | ||||||||||||||||||||||||
| Exercised | (857) | 8.51 | $ | 31,544 | ||||||||||||||||||||||
| Forfeited | (13) | 16.07 | ||||||||||||||||||||||||
| Options outstanding at December 31, 2021 | 1,681 | $ | 9.35 | 3.28 | $ | 53,698 | ||||||||||||||||||||
| Cancelled or expired | (1) | 8.28 | ||||||||||||||||||||||||
| Exercised | (494) | 7.83 | $ | 18,992 | ||||||||||||||||||||||
| Forfeited | (1) | 18.35 | ||||||||||||||||||||||||
| Options outstanding at December 31, 2022 | 1,185 | $ | 9.97 | 2.64 | $ | 49,094 | ||||||||||||||||||||
| Cancelled or expired | (4) | 10.25 | ||||||||||||||||||||||||
| Exercised | (505) | 7.84 | $ | 26,928 | ||||||||||||||||||||||
| Options outstanding and exercisable at December 31, 2023 | 676 | $ | 11.55 | 2.39 | $ | 20,036 | ||||||||||||||||||||
78
The total fair value of the shares underlying shares at the date of grant.
| Year Ended December 31, | |||||
| 2017 | 2016 | 2015 | |||
| Expected volatility | 40% - 41% | 40% - 42% | 39% - 42% | ||
| Expected term (years) | 6.25 | 6.25 | 6.25 | ||
| Expected dividends | —% | —% | —% | ||
| Risk free interest rate | 1.86% - 2.14% | 1.15% - 2.45% | 1.50% - 2.35% | ||
| Shares | Weighted- Average Exercise Price Per Share | Weighted- Average Remaining Contractual Term (Years) | Aggregate Intrinsic Value | |||||||||
| (In thousands, except years and per share data) | ||||||||||||
| Options outstanding at January 1, 2015 | 6,671 | $ | 7.68 | |||||||||
| Granted | 885 | 9.25 | ||||||||||
| Cancelled or expired | (92 | ) | 8.66 | |||||||||
| Exercised | (287 | ) | 7.87 | |||||||||
| Forfeited | (57 | ) | 7.81 | |||||||||
| Options outstanding at December 31, 2015 | 7,120 | 7.86 | 6.33 | $ | 3,937 | |||||||
| Granted | 249 | 8.13 | ||||||||||
| Cancelled or expired | (39 | ) | 8.92 | |||||||||
| Exercised | (73 | ) | 7.33 | |||||||||
| Forfeited | (55 | ) | 7.62 | |||||||||
| Options outstanding at December 31, 2016 | 7,202 | 7.87 | 5.45 | $ | 12,473 | |||||||
| Granted | 209 | 10.50 | ||||||||||
| Cancelled or expired | (2 | ) | 7.24 | |||||||||
| Exercised | (534 | ) | 7.93 | |||||||||
| Forfeited | (19 | ) | 9.13 | |||||||||
| Options outstanding at December 31, 2017 | 6,856 | $ | 7.94 | 4.63 | $ | 26,459 | ||||||
| Options exercisable at December 31, 2017 | 6,212 | $ | 7.81 | 4.27 | $ | 24,760 | ||||||
| Options exercisable and expected to vest at December 31, 2017 | 6,842 | $ | 7.94 | 4.63 | $ | 26,425 | ||||||
10. Equity Transactions
Preferred Stock
The Company is authorized to issue 2.0 million shares of preferred stock with a par value of $0.0001 per share. The Company previously issued 1.5 million shares of preferred stock. The remaining 0.5 million authorized shares of preferred stock remain undesignated and unissued as of December 31, 2023 and 2022. As of December 31, 2023 and 2022, there were no outstanding shares of preferred stock, as all previously designated and issued preferred stock was converted into common stock in prior periods.
Dividends
Stockholders are entitled to receive, when and if declared by the Company’s Board of Directors from time to time, such dividends and other distributions in cash, stock or property from the Company’s assets or funds legally and contractually available for such purposes. In each of December 2022, May 2023, September 2023 and December 2023, the Company’s Board of Directors approved a dividend of $0.13 per share of common stock. The dividends, which were paid on March 30, June 30, September 29 and December 29, 2023 to stockholders of record as of March 15, June 15, September 15 and December 15, 2023, respectively, resulted in total payments of $64.8 million during 2023. The Company’s liability related to dividends on common stock was $1.3 million and $16.6 million as of December 31, 2023 and 2022, respectively.
Share Repurchase Program
Since February 2021, the Company’s Board of Directors has authorized the repurchase of up to $1,000.0 million of the Company’s common stock through December 31, 2025. This time frame can be extended or shortened by the Board of Directors. Repurchases may be made from time to time on the open market at prevailing prices or in negotiated transactions off the market. The Company records share repurchases at cost, which includes broker commissions and related excise taxes. All shares are immediately retired upon repurchase in accordance with the board-approved policy. When treasury shares are retired, the Company’s policy is to allocate the excess of the repurchase price over the par value of shares acquired first, to additional paid-in capital, and then to retained earnings/accumulated deficit. The portion to be allocated to additional paid-in capital is calculated by applying a percentage, determined by dividing the number of shares to be retired by the number of shares outstanding, to the balance of additional paid-in capital as of the date of retirement.
The Company repurchased and subsequently retired 4.8 million, 6.8 million and 4.3 million shares of its common stock during the years ended December 31, 2017, 20162023, 2022 and 2015 was $2.02021, respectively, for a total purchase price of $244.6 million, $2.9$257.0 million and $3.6$163.4 million, respectively.
| RSUs | Weighted- Average Grant Date Fair Value Per RSU | |||||
| (In thousands) | ||||||
| Outstanding at January 1, 2015 | 2,282 | $ | 6.80 | |||
| Granted | 834 | 9.42 | ||||
| Forfeited | (193 | ) | 7.18 | |||
| Released | (979 | ) | 7.06 | |||
| Outstanding at December 31, 2015 | 1,944 | 7.76 | ||||
| Granted | 2,297 | 7.09 | ||||
| Forfeited | (152 | ) | 7.44 | |||
| Released | (766 | ) | 7.36 | |||
| Outstanding at December 31, 2016 | 3,323 | 7.40 | ||||
| Granted | 2,431 | 8.89 | ||||
| Forfeited | (203 | ) | 8.42 | |||
| Released | (2,003 | ) | 7.16 | |||
| Outstanding at December 31, 2017 | 3,548 | 8.50 | ||||
Vested and unreleased at December 31, 2017 (1) | 521 | |||||
79
11. Revenue
The following table summarizes the Company’s services revenue:
| Year Ended December 31, | ||||||||||||||||||||
| 2023 | 2022 | 2021 | ||||||||||||||||||
| (In thousands) | ||||||||||||||||||||
| Commercial services: | ||||||||||||||||||||
| Voice and data | $ | 219,242 | $ | 193,112 | $ | 175,584 | ||||||||||||||
| IoT data | 141,036 | 125,015 | 110,919 | |||||||||||||||||
| Broadband | 57,878 | 51,143 | 42,990 | |||||||||||||||||
| Hosted payload and other data | 60,298 | 59,451 | 58,611 | |||||||||||||||||
| Total commercial services | 478,454 | 428,721 | 388,104 | |||||||||||||||||
| Government services | 106,000 | 106,000 | 103,887 | |||||||||||||||||
| Total services | $ | 584,454 | $ | 534,721 | $ | 491,991 | ||||||||||||||
The following table summarizes the Company’s engineering and support services revenue:
| Year Ended December 31, | ||||||||||||||||||||
| 2023 | 2022 | 2021 | ||||||||||||||||||
| (In thousands) | ||||||||||||||||||||
| Commercial | $ | 11,050 | $ | 7,833 | $ | 4,613 | ||||||||||||||
| Government | 90,083 | 43,766 | 25,825 | |||||||||||||||||
| Total | $ | 101,133 | $ | 51,599 | $ | 30,438 | ||||||||||||||
The Company’s contracts with customers generally do not contain performance obligations with terms in excess of one year. As such, the Company does not disclose details related to the value of performance obligations that are unsatisfied as of the Company’send of the reporting period. The total value of any performance obligations that extend beyond a year is immaterial to the financial statements. The timing of revenue recognition, billings and cash collections results in billed accounts receivable, balance.
unbilled receivables (contract assets), and deferred revenue (contract liabilities) on the consolidated balance sheets. The Company contracts for the manufacturebills amounts under its agreed-upon contractual terms at periodic intervals (for services), upon shipment (for equipment), or upon achievement of its subscriber equipment primarily from one manufacturercontractual milestones or as work progresses (for engineering and utilizes other sole source suppliers for certain component parts of its devices. Should events or circumstances prevent the manufacturer or the suppliers from producing the equipment or component parts, the Company’s business could be adversely affected until the Company is ablesupport services). Billing may occur subsequent to move production to other facilities of the manufacturer or secure a replacement manufacturer or an alternative supplier for such component parts.
| December 31, | |||||||
| 2017 | 2016 | ||||||
| (In thousands) | |||||||
| United States | $ | 165,337 | $ | 124,483 | |||
| Satellites in orbit | 926,090 | 13,405 | |||||
| Iridium NEXT systems under construction | 2,088,380 | 2,639,824 | |||||
All others (1) | 30,355 | 35,372 | |||||
| Total | $ | 3,210,162 | $ | 2,813,084 | |||
| Year Ended December 31, | |||||||||||
| 2017 | 2016 | 2015 | |||||||||
| (In thousands) | |||||||||||
| United States | $ | 229,741 | $ | 226,190 | $ | 204,777 | |||||
| Canada | 44,107 | 42,373 | 42,063 | ||||||||
| United Kingdom | 46,245 | 47,135 | 44,012 | ||||||||
Other countries (1) | 127,953 | 117,942 | 120,526 | ||||||||
| Total | $ | 448,046 | $ | 433,640 | $ | 411,378 | |||||
| Year Ended December 31, | ||||||||||||||
| 2023 | 2022 | |||||||||||||
| (In thousands) | ||||||||||||||
| Contract Assets: | ||||||||||||||
| Commissions | $ | 1,114 | $ | 1,258 | ||||||||||
| Other contract costs | $ | 1,970 | $ | 2,255 | ||||||||||
80
12. Income Taxes
The following table presents U.S. and foreign components of income (loss) before income taxes are presented below:taxes:
| Year Ended December 31, | |||||||||||
| 2017 | 2016 | 2015 | |||||||||
| (In thousands) | |||||||||||
| U.S. income | $ | 120,281 | $ | 176,448 | $ | 75,431 | |||||
| Foreign income (loss) | (709 | ) | 1,717 | (2,316 | ) | ||||||
| Total income before income taxes | $ | 119,572 | $ | 178,165 | $ | 73,115 | |||||
| Year Ended December 31, | |||||||||||||||||
| 2023 | 2022 | 2021 | |||||||||||||||
| (In thousands) | |||||||||||||||||
| U.S. income (loss) | $ | (10,596) | $ | 10,179 | $ | (31,352) | |||||||||||
| Foreign income | 5,849 | 331 | 2,464 | ||||||||||||||
| Total income (loss) before income taxes | $ | (4,747) | $ | 10,510 | $ | (28,888) | |||||||||||
The following table summarizes the components of the Company’s income tax provision were as follows:provision:
| Year Ended December 31, | |||||||||||||||||
| 2023 | 2022 | 2021 | |||||||||||||||
| (In thousands) | |||||||||||||||||
| Current taxes: | |||||||||||||||||
| Federal tax benefit | $ | — | $ | — | $ | (537) | |||||||||||
| State tax expense | 1,032 | 272 | 42 | ||||||||||||||
| Foreign tax expense | 4,545 | 1,209 | 2,240 | ||||||||||||||
| Total current tax (benefit) expense | 5,577 | 1,481 | 1,745 | ||||||||||||||
| Deferred taxes: | |||||||||||||||||
| Federal tax benefit | (31,311) | (3,354) | (14,109) | ||||||||||||||
| State tax expense (benefit) | (226) | 1,794 | (6,686) | ||||||||||||||
| Foreign tax expense (benefit) | (291) | 371 | (519) | ||||||||||||||
| Total deferred tax benefit | (31,828) | (1,189) | (21,314) | ||||||||||||||
| Total income tax expense (benefit) | $ | (26,251) | $ | 292 | $ | (19,569) | |||||||||||
| Year Ended December 31, | |||||||||||
| 2017 | 2016 | 2015 | |||||||||
| (In thousands) | |||||||||||
| Current taxes: | |||||||||||
| Federal tax expense | $ | 13 | $ | 1,206 | $ | 1,700 | |||||
| State tax expense | 422 | 978 | 266 | ||||||||
| Foreign tax expense | 863 | 1,141 | 650 | ||||||||
| Total current tax expense | 1,298 | 3,325 | 2,616 | ||||||||
| Deferred taxes: | |||||||||||
| Federal tax expense (benefit) | (110,811 | ) | 60,295 | 54,906 | |||||||
| State tax expense (benefit) | (4,851 | ) | 3,454 | 8,803 | |||||||
| Foreign tax expense (benefit) | 80 | 59 | (333 | ) | |||||||
| Total deferred tax expense (benefit) | (115,582 | ) | 63,808 | 63,376 | |||||||
| Total income tax expense (benefit) | $ | (114,284 | ) | $ | 67,133 | $ | 65,992 | ||||
The Securities and Exchange Commission issued Staff Accounting Bulletin No. 118 ("SAB 118") to address the application of U.S. GAAP in situations whenfollowing table presents a registrant does not have the necessary information available, prepared, or analyzed (including computations) in reasonable detail to complete the accounting for certain income tax effects of the Tax Act. SAB 118 is effective for reporting periods that include December 22, 2017. Due to the timing of the enactment and the complexity involved in applying the provisions of the Tax Act, the Company made reasonable estimates of the effects and recorded provisional amounts in its financial statements as of December 31, 2017. As the Company collects and prepares the necessary data, and interprets the Tax Act and any additional guidance issued by the U.S. Treasury Department, the IRS, and other standard-setting bodies, it may make adjustments to the provisional amounts. Those adjustments may materially impact the Company's provision for income taxes and effective tax rate in the period in which the adjustments are made. The accounting for the tax effects of the Tax Act will be completed in 2018.
| Year Ended December 31, | |||||||||||||||||
| 2023 | 2022 | 2021 | |||||||||||||||
| (In thousands) | |||||||||||||||||
| Expected tax expense (benefit) at U.S. federal statutory tax rate | $ | (997) | $ | 1,893 | $ | (6,067) | |||||||||||
| State taxes, net of federal benefit | 927 | 1,260 | (9,094) | ||||||||||||||
| State tax valuation allowance | (338) | 748 | 711 | ||||||||||||||
| Deferred impact of state tax law changes and elections | — | — | 1,200 | ||||||||||||||
| Equity-based compensation | (10,234) | (6,184) | (9,597) | ||||||||||||||
| Limitation on executive compensation deduction | 4,011 | 2,905 | 3,140 | ||||||||||||||
| Other nondeductible items | 114 | 33 | 65 | ||||||||||||||
| Tax credits | (21,817) | (949) | (1,278) | ||||||||||||||
| Foreign taxes | 3,570 | 386 | 1,100 | ||||||||||||||
| Other adjustments | (1,487) | 200 | 251 | ||||||||||||||
| Total income tax expense (benefit) | $ | (26,251) | $ | 292 | $ | (19,569) | |||||||||||
81
| Year Ended December 31, | |||||||||||
| 2017 | 2016 | 2015 | |||||||||
| (In thousands) | |||||||||||
| Expected tax expense at U.S. federal statutory tax rate | $ | 41,850 | $ | 62,309 | $ | 25,590 | |||||
| State taxes, net of federal benefit | 5,133 | 9,757 | 11,663 | ||||||||
| State tax valuation allowance | 582 | (2,710 | ) | (2,763 | ) | ||||||
| Deferred impact of Arizona tax law changes and elections | (10,217 | ) | (2,962 | ) | 99 | ||||||
| Tax Act - deferred tax effects | (150,903 | ) | — | — | |||||||
| Impairment of goodwill | — | — | 30,464 | ||||||||
| Other nondeductible expenses | (841 | ) | 596 | 557 | |||||||
| Tax credits | (528 | ) | (442 | ) | (97 | ) | |||||
| Foreign taxes and other items | 640 | 585 | 479 | ||||||||
| Total income tax expense (benefit) | $ | (114,284 | ) | $ | 67,133 | $ | 65,992 | ||||
The following table presents the components of deferred tax assets and liabilities are as follows:liabilities:
| December 31, | |||||||||||
| 2023 | 2022 | ||||||||||
| (In thousands) | |||||||||||
| Deferred tax assets | |||||||||||
| Long-term contracts | $ | 51,226 | $ | 52,553 | |||||||
| Federal, state and foreign net operating losses, other carryforwards and tax credits | 351,094 | 374,767 | |||||||||
| Other | 26,676 | 24,553 | |||||||||
| Total deferred tax assets | 428,996 | 451,873 | |||||||||
| Valuation allowance | (33,420) | (34,643) | |||||||||
| Net deferred tax assets | 395,576 | 417,230 | |||||||||
| Deferred tax liabilities | |||||||||||
| Fixed assets, intangibles and research and development expenditures | (425,980) | (490,384) | |||||||||
| Investment in joint venture | (63,108) | (48,754) | |||||||||
| Other | (19,336) | (27,976) | |||||||||
| Total deferred tax liabilities | (508,424) | (567,114) | |||||||||
| Net deferred income tax liabilities | $ | (112,848) | $ | (149,884) | |||||||
| As of December 31, | |||||||
| 2017 | 2016 | ||||||
| (In thousands) | |||||||
| Deferred tax assets | |||||||
| Long-term contracts | $ | 61,358 | $ | 74,720 | |||
| Federal, state and foreign net operating loss carryforwards and tax credits | 107,566 | 60,667 | |||||
| Other | 22,680 | 34,330 | |||||
| Total deferred tax assets | 191,604 | 169,717 | |||||
| Valuation allowance | (3,815 | ) | (2,825 | ) | |||
| Net deferred tax assets | 187,789 | 166,892 | |||||
| Deferred tax liabilities | |||||||
| Fixed assets, intangibles and research and development expenditures | (403,545 | ) | (513,905 | ) | |||
| Investment in joint venture | (27,796 | ) | (14,643 | ) | |||
| Other | (2,276 | ) | — | ||||
| Total deferred tax liabilities | (433,617 | ) | (528,548 | ) | |||
| Net deferred income tax liabilities | $ | (245,828 | ) | $ | (361,656 | ) | |
Pursuant to ASC 740, the Company nets deferred tax assets and liabilities within the same jurisdiction. As of December 31, 2017,2023, the Company had a net deferred tax asset of $0.3$1.8 million that is included in other assets on the balance sheet and a net deferred tax liability of $246.2$114.6 million.
The Company recognizes valuation allowances to reduce deferred tax assets to the amount that is more likely than not to be realized. In assessing the likelihood of realization, management considers: (i) future reversals of existing taxable temporary differences; (ii) future taxable income exclusive of reversing temporary differences and carryforwards; (iii) taxable income in prior carryback year(s) if carryback is permitted under applicable tax law; and (iv) tax planning strategies.
The Company had deferred tax assets related to cumulative U.S. federal net operating loss carryforwards and interest expense carryforwards of approximately $80.5$257.4 million and $42.9$296.4 million as of December 31, 2023 and 2022, respectively. The 2017 and 2016, respectively. TheseU.S. federal net operating loss carryforwards,carryforward, if unutilized,not utilized, will expire in various amounts from 2031 through 2037. The Company believes that the 2017 U.S. federal net operating losses will be utilized before the expiration datesdate and, as such, no valuation allowance has been established for thesethis deferred
tax assets.asset. U.S. federal net operating loss carryforwards for 2018 and thereafter and interest expense carryforwards do not expire. The Company had deferred tax assets related to the state net operating loss carryforwards of approximately $10.9$59.2 million and $4.1$60.0 million as of December 31, 20172023 and 2016,2022, respectively, thatsome of which expire from 2025 through 2037.as early as 2025. The Company does not expect to fully utilize all of its state net operating losses within the respective carryforward periods and as such reflects a partial valuation allowance of $0.7$33.0 million and $33.3 million as of December 31, 20172023 and 2022, respectively, against these deferred tax assets on its consolidated balance sheet.sheets. The Company had deferred tax assets related to the foreign net operating loss carryforwards of approximately $1.3$0.5 million and $1.2$0.7 million, as of December 31, 20172023 and 2016,2022, respectively, that begin to expire in 2022.do not expire. The Company does not expect to fully utilize all of its foreign net operating losses within the respective carryforward periods and asperiods. As such, reflectsthe Company had recorded a partial valuation allowance of $0.2 million and $0.4 million as of December 31, 2023 and 2022, respectively, against these deferred tax assets on its consolidated balance sheet.sheets. The timing and manner in which the Company will utilize the net operating loss carryforwards in any year, or in total, may be limited in the future as a result of alternative minimum taxes, changes in the Company’s ownership and any limitations imposed by the jurisdictions in which the Company operates.
The Company hashad approximately $6.1$32.3 million and $5.0$12.1 million of deferred tax assets related to research and development tax credits as of December 31, 20172023 and 2016,2022, respectively, that expire in various amounts from 20272029 through 2037.2043. As of December 31, 2023, the Company established a reserve of approximately $2.4 million on its estimate of R&D credits. The Company hashad approximately $4.7$8.7 million and $3.5$5.2 million of deferred tax assets related to foreign tax credits as of December 31, 20172023 and 2016,2022, respectively, that expire in various amounts from 2020 through 2027. The Company has $3.8 million and $3.4 million of deferred tax assets related to Alternative Minimum Tax credits as of December 31, 2017 and 2016, respectively which do not expire. Under the Tax Act, the Alternative Minimum Tax credits will convert to refunds if not used as a credit. The Company believes that the research and development credits will be fully utilized within the carryforward period. However,2033. Previously, the Company doesdid not expect to utilize all of its foreign tax credits, within the respective carryforward periods. As such,resulting in the Company hasrecording a partial valuation allowance of $1.1$0.5 million as of December 31, 2017, which2022. There is unchanged fromno valuation allowance on foreign tax credits as of December 31, 2016.2023.
82
The Company has provided for U.S. income taxes on all undistributed earnings of its significant foreign subsidiaries since the
Company does not indefinitely reinvest these undistributed earnings. The Company measures deferred tax assets and liabilities
using tax rates expected to apply to taxable income in the years in which those temporary differences are expected to be
recovered or settled. The Company recognizes the effect on deferred tax assets and liabilities of a change in tax rates in income
in the period that includes the enactment date.
Uncertain Income Tax Positions
The Company is subject to income taxes in the U.S. and various state and foreign jurisdictions. Significant judgment is required
in evaluating tax positions and determining the provision for income taxes. The Company establishes liabilities for tax-related
uncertainties based on estimates of whether, and the extent to which, additional taxes may be due. These liabilities are
established when the Company believes that certain positions might be challenged despite its belief that its tax return positions
are fully supportable. The Company adjusts these liabilities in light of changing facts and circumstances, such as the outcome of
a tax audit. The provision for income taxes includes the impact of changes to these liabilities.
The amount ofCompany had unrecognized tax benefits was $1.0of approximately $2.4 million and $0.9 million atas of December 31, 2017 and 2016, respectively.2023 primarily due to additional U.S. tax credits from prior periods. There were no unrecognized tax benefits as of December 31, 2022. Any changes in the next twelve months are not anticipated to have a significant impact on the results of operations, financial position or cash flows of the Company. All of the Company’s uncertain tax positions, if recognized, would affect its income tax expense.
The Company has elected an accounting policy to classify interest and penalties related to unrecognized tax benefits as a component of income tax expense. As of December 31, 20172023 and 2016, potential2022, there were no interest and penalties on unrecognized tax benefits. The following is a tabular reconciliation of the total amounts of unrecognized tax benefits were not significant.which includes related interest and penalties:
| Year Ended December 31, | |||||||||||
| 2023 | 2022 | ||||||||||
| (In thousands) | |||||||||||
| Balance at January 1, | $ | — | $ | — | |||||||
| Change attributable to tax positions taken in a prior period | 2,162 | — | |||||||||
| Change attributable to tax positions taken in the current period | 236 | — | |||||||||
| Balance at December 31, | $ | 2,398 | $ | — | |||||||
The Company is subject to tax audits in all jurisdictions for which it files tax returns. Tax audits by their very nature are often complex and can require several years to complete. Currently, there are no U.S. federal, state or foreign jurisdiction tax audits pending. The Company’s corporate U.S. federal and state tax returns from 20102011 to 20162022 remain subject to examination by tax authorities and the Company’s foreign tax returns from 20092017 to 20162022 remain subject to examination by tax authorities.
83
| 2017 | 2016 | ||||||
| (In thousands) | |||||||
| Balance at January 1, | $ | 920 | $ | 916 | |||
| Change attributable to tax positions taken in a prior period | 146 | 25 | |||||
| Change attributable to final assessment | (27 | ) | — | ||||
| Change attributable to tax positions taken in the current period | 10 | 8 | |||||
| Decrease attributable to lapse of statute of limitations | (3 | ) | (29 | ) | |||
| Balance at December 31, | $ | 1,046 | $ | 920 | |||
The Company calculates basic net income (loss) per common share by dividing net income (loss) attributable to common stockholders by the weighted-average number of shares of common stock outstanding during the period. DilutedIn periods of net income, diluted net income per share takes into account the effect of potentialpotentially dilutive common shares when the effect is dilutive. The effect of potentialPotentially dilutive common shares includinginclude (i) shares of common stock issuable upon exercise of outstanding stock options and (ii) shares underlying RSUs that are contingently issuable upon achievement of certain service and performance requirements. The effect of potentially dilutive common shares is computed using the treasury stock method. The effect of potential dilutive common shares from the conversion of outstanding convertible preferred securities is computed using the as-if converted method at the stated conversion rate. The RSUs granted to members of the Company’s board of directors contain non-forfeitable rights to dividends and therefore are considered to be participating securities in periods of net income. As a result, the calculation of basic and diluted net income (loss) per share excludes net income (loss) attributable to the unvested RSUs granted to the Company’s board of directors from the numerator and excludes the impact of the unvested RSUs granted to the Company’s board of directors from the denominator.
The following table summarizes the computations of basic and diluted net income (loss)loss per share are set forth below:common share:
| Year Ended December 31, | |||||||||||||||||
| 2023 | 2022 | 2021 | |||||||||||||||
| (In thousands, except per share data) | |||||||||||||||||
| Numerator: | |||||||||||||||||
| Net income (loss) attributable to common stockholders - basic and diluted | $ | 15,415 | $ | 8,722 | $ | (9,319) | |||||||||||
| Denominator: | |||||||||||||||||
| Weighted average common shares - basic | 125,598 | 128,255 | 133,530 | ||||||||||||||
| Weighted average common shares - diluted | 127,215 | 130,134 | 133,530 | ||||||||||||||
| Net income (loss) attributable to common stockholders per share - basic and diluted | $ | 0.12 | $ | 0.07 | $ | (0.07) | |||||||||||
| Year Ended December 31, | |||||||||||
| 2017 | 2016 | 2015 | |||||||||
| (In thousands, except per share data) | |||||||||||
| Numerator: | |||||||||||
| Net income (loss) attributable to common stockholders (numerator for basic net income per share) | $ | 218,420 | $ | 95,596 | $ | (8,313 | ) | ||||
| Net (income) loss allocated to participating securities | (215 | ) | (123 | ) | 3 | ||||||
| Numerator for basic net income (loss) per share | 218,205 | 95,473 | (8,310 | ) | |||||||
| Dividends on Series A preferred stock, declared and undeclared | 7,000 | 7,000 | — | ||||||||
| Dividends on Series B preferred stock, declared and undeclared | 8,436 | 8,436 | — | ||||||||
| Numerator for diluted net income (loss) per share | $ | 233,641 | $ | 110,909 | $ | (8,310 | ) | ||||
Denominator: Denominator for basic net income (loss) per share - weighted average outstanding common shares | 97,934 | 95,967 | 95,097 | ||||||||
| Dilutive effect of stock options | 1,558 | 250 | — | ||||||||
| Dilutive effect of Performance RSUs | 1,308 | 1,328 | — | ||||||||
| Dilutive effect of Series A preferred stock | 10,602 | 10,602 | — | ||||||||
| Dilutive effect of Series B preferred stock | 16,728 | 16,728 | — | ||||||||
| Denominator for diluted net income (loss) per share | 128,130 | 124,875 | 95,097 | ||||||||
| Net income (loss) per share attributable to common stockholders - basic | $ | 2.23 | $ | 1.00 | $ | (0.09 | ) | ||||
| Net income (loss) per share attributable to common stockholders - diluted | $ | 1.82 | $ | 0.89 | $ | (0.09 | ) | ||||
For the year ended December 31, 2017, $5.3 million and $6.3 million in cumulative unpaid dividends to holders of the Series A Preferred Stock and Series B Preferred Stock, respectively, were not declared as a result of all cash dividends being suspended in connection with the amendments to the Credit Facility described in Note 5, but such amounts were deducted to arrive at net income attributable to common stockholders. For the year ended December 31, 2017, 2.12022, 0.2 million unvested service-based RSUs were excluded from the computation of basic net income per share and not included in the computation of diluted net income per share, as the effect would be anti-dilutive, and 0.2 million unvested performance-based RSUs were not included in the computation of basic and diluted net income per share, as certain performance criteria have not been satisfied.
anti-dilutive and therefore excluded from the calculation of diluted net loss per share.
The following representstable presents the incremental number of shares underlying stock options and RSUs outstanding with anti-dilutive effects:
| Year Ended December 31, | ||||||||||||||||||||
| 2023 | 2022 | 2021 | ||||||||||||||||||
| (In thousands) | ||||||||||||||||||||
| Performance-based RSUs | — | 210 | 183 | |||||||||||||||||
| Service-based RSUs | — | — | 536 | |||||||||||||||||
| Stock options | — | — | 1,189 | |||||||||||||||||
84
14. Related Party Transactions
Aireon LLC and Aireon Holdings LLC
The Company’s satellite constellation hosts the Aireon® system. The Aireon system was developed by Aireon LLC, which the Company formed in 2011 and which received subsequent investments from several air navigation service providers (“ANSPs”) to provide a global air traffic surveillance service through a series of automatic dependent surveillance-broadcast (“ADS-B”) receivers on the Company’s unaudited quarterly results:satellites. Aireon has contracted to offer this service to ANSPs, which use the service to provide improved air traffic control services over the oceans, as well as polar and remote regions. Aireon also markets its data and services to airlines and other commercial users. The Company and the other Aireon investors hold their interests in Aireon Holdings LLC (“Aireon Holdings”) through an amended and restated LLC agreement (the “Aireon Holdings LLC Agreement”). Aireon Holdings holds 100% of the membership interests in Aireon, which is the operating entity.
In June 2022, the Company entered into a subscription agreement with Aireon Holdings and invested $50.0 million in exchange for an approximate 6% preferred membership interest. The Company’s investment in Aireon Holdings is accounted for as an equity method investment. The carrying value of the Company’s investment in Aireon Holdings was $44.6 million and $48.8 million as of December 31, 2023 and 2022, respectively. The investments by the Company prior to June 2022 had previously been written down to a carrying value of zero.
At each of December 31, 2023 and 2022, the Company’s fully diluted ownership stake in Aireon Holdings was approximately 39.5%, which is subject to partial future redemption under provisions contained in the Aireon Holdings LLC Agreement.
Under the agreements with Aireon, Aireon will pay the Company fees of $200.0 million to host the ADS-B receivers, of which $94.5 million had been paid as of December 31, 2023. These fees are recognized over the estimated useful lives of the satellites, which is expected to result in revenue of approximately $9.3 million, following the change in estimate of the useful lives of the satellites that occurred in the fourth quarter of 2023. The Company recognized $14.4 million of hosting fee revenue under the Hosting Agreement for the year ended December 31, 2023 and $16.1 million of hosting fee revenue for the years ended December 31, 2022 and 2021. There were no receivables due under the Hosting Agreement as of December 31, 2023 and 2022.
Additionally, Aireon pays power and data services fees of approximately $23.5 million per year, in the aggregate for the delivery of the air traffic surveillance data over the Iridium system. The Company recorded $23.5 million of power and data service fee revenue from Aireon for each of the years ended December 31, 2023, 2022 and 2021.
During the year ended December 31, 2023, the Company recorded other income of $3.5 million related to a contractual settlement with Aireon. This is a one-time payment that is not expected to recur.
Under two services agreements, the Company also provides Aireon with administrative services and support services, the fees for which are paid monthly. Aireon receivables due to the Company under these two agreements totaled $2.2 million at each of December 31, 2023 and 2022.
The Company and the other Aireon investors have agreed to participate pro rata, based on their respective fully diluted ownership stakes, in funding an investor bridge loan to Aireon. The Company’s maximum commitment under the investor bridge loan is $11.9 million. No bridge loan amounts were outstanding as of December 31, 2023 or 2022.
Satelles
In the first quarter of 2023, the Company entered into a stock purchase agreement with Satelles, Inc. (“Satelles”) and invested $10.0 million, in addition to its previous equity investment in Satelles. The Company’s fully diluted ownership stake in Satelles was approximately 19.5% as of December 31, 2023, and the investment in Satelles is now accounted for as an equity method investment. The carrying value of the Company’s investment in Satelles was approximately $21.8 million as of December 31, 2023.
85
15. Segments, Significant Customers, Supplier and Service Providers and Geographic Information
The Company operates in one business segment, providing global satellite communications services and products.
The Company derived approximately 25%, 21% and 21% of its total revenue in the years ended December 31, 2023, 2022 and 2021, respectively, from prime contracts or subcontracts with agencies of the U.S. government. For the years ended December 31, 2023, 2022 and 2021, no single commercial customer accounted for more than 10% of the Company’s total revenue.
Approximately 46% and 25% of the Company’s accounts receivable balance at December 31, 2023 and 2022, respectively, was due from prime contracts or subcontracts with agencies of the U.S. government. As of December 31, 2023 and 2022, no single commercial customer accounted for more than 10% of the Company’s total accounts receivable balance.
The Company contracts for the manufacture of its subscriber equipment primarily from a limited number of manufacturers and utilizes other sole source suppliers for certain component parts of its devices. Should events or circumstances prevent the manufacturer or the suppliers from producing the equipment or component parts, the Company’s business could be adversely affected until the Company is able to move production to other facilities of the manufacturer or secure a replacement manufacturer or an alternative supplier for such component parts.
The following table summarizes net property and equipment by geographic area:
| December 31, | |||||||||||
| 2023 | 2022 | ||||||||||
| (In thousands) | |||||||||||
| United States | $ | 412,002 | $ | 461,820 | |||||||
| Satellites in orbit | 1,782,000 | 1,968,999 | |||||||||
| All others | 1,756 | 2,486 | |||||||||
| Total | $ | 2,195,758 | $ | 2,433,305 | |||||||
The following table summarizes revenue by geographic area:
| Year Ended December 31, | |||||||||||||||||
| 2023 | 2022 | 2021 | |||||||||||||||
| (In thousands) | |||||||||||||||||
| United States | $ | 431,476 | $ | 374,687 | $ | 330,948 | |||||||||||
Other countries (1) | 359,247 | 346,347 | 283,552 | ||||||||||||||
| Total | $ | 790,723 | $ | 721,034 | $ | 614,500 | |||||||||||
(1)No single country in this group represented more than 10% of revenue.
| Quarter Ended | |||||||||||||||
| March 31, 2017 | June 30, 2017 | September 30, 2017 | December 31, 2017 | ||||||||||||
| (In thousands, except per share data) | |||||||||||||||
| Revenue | $ | 104,426 | $ | 111,604 | $ | 116,547 | $ | 115,469 | |||||||
Operating income (loss) (1) | $ | 55,602 | $ | 35,742 | $ | 38,082 | $ | (13,950 | ) | ||||||
Net income (2) | $ | 37,948 | $ | 24,778 | $ | 29,253 | $ | 141,877 | |||||||
| Net income per common share - basic | $ | 0.35 | $ | 0.21 | $ | 0.26 | $ | 1.40 | |||||||
| Net income per common share -diluted | $ | 0.30 | $ | 0.20 | $ | 0.23 | $ | 1.10 | |||||||
| Quarter Ended | |||||||||||||||
| March 31, 2016 | June 30, 2016 | September 30, 2016 | December 31, 2016 | ||||||||||||
| (In thousands, except per share data) | |||||||||||||||
| Revenue | $ | 104,202 | $ | 109,195 | $ | 112,794 | $ | 107,449 | |||||||
| Operating income | $ | 43,278 | $ | 41,729 | $ | 49,768 | $ | 41,596 | |||||||
| Net income | $ | 28,520 | $ | 26,854 | $ | 31,555 | $ | 24,103 | |||||||
| Net income per common share - basic | $ | 0.26 | $ | 0.24 | $ | 0.29 | $ | 0.21 | |||||||
| Net income per common share -diluted | $ | 0.23 | $ | 0.22 | $ | 0.26 | $ | 0.19 | |||||||
The sumCompany is exposed to foreign currency exchange fluctuations from sales made and costs incurred in foreign currencies.
16. Employee Benefit Plan
The Company sponsors a defined-contribution 401(k) retirement plan (the “Plan”) that covers all employees. Employees are eligible to participate in the Plan on the first day of the month following the date of hire, and participants are 100% vested from the date of eligibility. The Company matches employees’ contributions equal to 100% of the salary deferral contributions up to 5% of the employees’ eligible compensation each pay period. The Company’s matching contributions to the Plan were $4.3 million, $3.5 million and $3.5 million for the years ended December 31, 2023, 2022 and 2021, respectively.
86
17. Subsequent Event
On February 2, 2024, the Company’s Board of Directors approved a dividend of $0.13 per share amounts does not equal the annual amounts duepayable on March 29, 2024, to changes in the weighted-average numberstockholders of common shares outstanding during the year.record as of March 15, 2024.
87
Item 9. Changes in and Disagreements with Accountants on Accounting and Financial Disclosure
None.
Item 9A. Controls and Procedures
Evaluation of Disclosure Controls and Procedures
Under the supervision and with the participation of our management, including our chief executive officer, who is our principal executive officer, and our chief financial officer, who is our principal financial officer, we conducted an evaluation of our disclosure controls and procedures, as such term is defined in RuleRules 13a-15(e) and 15d-15(e) under the Securities Exchange Act of 1934, as amended, or the Exchange Act, as of the end of the period covered by this report. In evaluating the disclosure controls and procedures, management recognized that any controls and procedures, no matter how well designed and operated, can provide only reasonable assurance of achieving the desired control objectives. In addition, the design of disclosure controls and procedures must reflect the fact that there are resource constraints and that management is required to apply its judgment in evaluating the benefits of possible controls and procedures relative to their costs. In addition, the design of any system of controls also is based in part upon certain assumptions about the likelihood of future events, and there can be no assurance that any design will succeed in achieving its stated goals under all potential future conditions; over time, controls may become inadequate because of changes in conditions, or the degree of compliance with policies or procedures may deteriorate. Because of the inherent limitations in a control system, misstatements due to error or fraud may occur and not be detected.
Based on this evaluation, our chief executive officer and our chief financial officer concluded that our disclosure controls and procedures were effective to provide reasonable assurance that information required to be disclosed by us in reports we file or submit under the Exchange Act is recorded, processed, summarized and reported within the time periods specified in the U.S. Securities and Exchange Commission’s rules and forms, and is accumulated and communicated to our management, including our principal executive officer and principal financial officer, as appropriate to allow timely decisions regarding required disclosures.
Management’s Report on Internal Control Over Financial Reporting
Our management is responsible for establishing and maintaining adequate internal control over financial reporting. Internal control over financial reporting is defined in Rules 13a-15(f) and 15d-15(f) promulgated under the Exchange Act as a process designed by, or under the supervision of, our principal executive and principal financial officers and effected by our board of directors, management and other personnel, to provide reasonable assurance regarding the reliability of financial reporting and the preparation of financial statements for external purposes in accordance with U.S. generally accepted accounting principles. Such internal control includes those policies and procedures that:
•Pertain to the maintenance of records that in reasonable detail accurately and fairly reflect the transactions and dispositions of the assets of our company;
•Provide reasonable assurance that transactions are recorded as necessary to permit preparation of financial statements in accordance with generally accepted accounting principles, and that receipts and expenditures of the company are being made only in accordance with authorizations of management and directors of our company; and
•Provide reasonable assurance regarding prevention or timely detection of unauthorized acquisition, use or disposition of our company’s assets that could have a material effect on the financial statements.
Because of its inherent limitations, internal control over financial reporting may not prevent or detect misstatements. Projections of any evaluation of effectiveness to future periods are subject to the risk that controls may become inadequate because of changes in conditions, or that the degree of compliance with the policies or procedures may deteriorate.
Our management assessed the effectiveness of our internal control over financial reporting as of December 31, 2017.2023. In making this assessment, our management used the criteria set forth in Internal Control-Integrated Framework issued by the Committee of Sponsoring Organizations of the Treadway Commission (2013 Framework). Based on its assessment, our management has determined that, as of December 31, 2017,2023, our internal control over financial reporting was effective based on those criteriacriteria.
88
Our independent registered public accounting firm, Ernst & YoungKPMG LLP, has audited our 20172023 financial statements. Ernst & YoungKPMG LLP was given unrestricted access to all financial records and related data, including minutes of all meetings of stockholders, the Board of Directors and committees of the Board. Ernst & YoungKPMG LLP has issued an unqualified report on our 20172023 financial statements as a result of the audit and also has issued an unqualified report on our internal controls over financial reporting which is attached hereto.
Changes in Internal Control Over Financial Reporting
During the quarter ended December 31, 2017,2023, there were no changes in our internal control over financial reporting, as such term is defined in Rules 13a-15(f) and 15d-15(f) under the Exchange Act, that have materially affected, or are reasonably likely to materially affect, our internal control over financial reporting.
89
Report of Ernst and Young LLP, Independent Registered Public Accounting Firm
Iridium Communications Inc.:
Opinion on Internal Control overOver Financial Reporting
We have audited Iridium Communications Inc.’s and subsidiaries’ (the Company) internal control over financial reporting as of December 31, 2017,2023, based on criteria established in Internal Control-IntegratedControl – Integrated Framework (2013) issued by the Committee of Sponsoring Organizations of the Treadway Commission (2013 framework) (the COSO criteria).Commission. In our opinion, Iridium Communications Inc. (the Company)the Company maintained, in all material respects, effective internal control over financial reporting as of December 31, 2017,2023, based on criteria established in Internal Control – Integrated Framework (2013) issued by the COSO criteria.Committee of Sponsoring Organizations of the Treadway Commission.
We also have audited, in accordance with the standards of the of the Public Company Accounting Oversight Board (United States) (PCAOB), the consolidated balance sheetssheet of Iridium Communications Inc.the Company as of December 31, 20172023 and 2016,December 31, 2022, the related consolidated statements of operations and comprehensive income (loss), changes in stockholders’ equity, and cash flows for each of the three years in the periodthen ended, December 31, 2017 and the related notes (collectively, the consolidated financial statements), and our report dated February 22, 201815, 2024 expressed an unqualified report thereon.opinion on those consolidated financial statements.
Basis for Opinion
The Company’s management is responsible for maintaining effective internal control over financial reporting and for its assessment of the effectiveness of internal control over financial reporting, included in the accompanying Management’s Report on Internal Control overOver Financial Reporting. Our responsibility is to express an opinion on the company’sCompany’s internal control over financial reporting based on our audit. We are a public accounting firm registered with the PCAOB and are required to be independent with respect to the Company in accordance with the U.S. federal securities laws and the applicable rules and regulations of the Securities and Exchange Commission and the PCAOB.
We conducted our audit in accordance with the standards of the PCAOB. Those standards require that we plan and perform the audit to obtain reasonable assurance about whether effective internal control over financial reporting was maintained in all material respects.
Our audit of internal control over financial reporting included obtaining an understanding of internal control over financial reporting, assessing the risk that a material weakness exists, and testing and evaluating the design and operating effectiveness of internal control based on the assessed risk, andrisk. Our audit also included performing such other procedures as we considered necessary in the circumstances. We believe that our audit provides a reasonable basis for our opinion.
A company’s internal control over financial reporting is a process designed to provide reasonable assurance regarding the reliability of financial reporting and the preparation of financial statements for external purposes in accordance with generally accepted accounting principles. A company’s internal control over financial reporting includes those policies and procedures that (1) pertain to the maintenance of records that, in reasonable detail, accurately and fairly reflect the transactions and dispositions of the assets of the company; (2) provide reasonable assurance that transactions are recorded as necessary to permit preparation of financial statements in accordance with generally accepted accounting principles, and that receipts and expenditures of the company are being made only in accordance with authorizations of management and directors of the company; and (3) provide reasonable assurance regarding prevention or timely detection of unauthorized acquisition, use, or disposition of the company’s assets that could have a material effect on the financial statements.
Because of its inherent limitations, internal control over financial reporting may not prevent or detect misstatements. Also, projections of any evaluation of effectiveness to future periods are subject to the risk that controls may become inadequate because of changes in conditions, or that the degree of compliance with the policies or procedures may deteriorate.
/s/ Ernst & YoungKPMG LLP
February 22, 201815, 2024
90
Item 9B. Other Information
None.
Item 9C. Disclosure Regarding Foreign Jurisdictions that Prevent Inspections
Not applicable.
91
PART III
We will file a definitive Proxy Statement for our 20182024 Annual Meeting of Stockholders (the “2018“2024 Proxy Statement”) with the SEC, pursuant to Regulation 14A, not later than 120 days after the end of our fiscal year. Accordingly, certain information required by Part III has been omitted as permitted by General Instruction G (3) to Form 10-K. Only those sections of the 20182024 Proxy Statement that specifically address the items set forth herein are incorporated by reference.
Item 10. Directors, Executive Officers and Corporate Governance
The information required by this Item is incorporated by reference to the sections of our 20182024 Proxy Statement entitled “Board of Directors and Committees,” “Election of Directors,” “Management” and “Section“Delinquent Section 16(a) Beneficial Ownership Reporting Compliance.Reports.”
Item 11. Executive Compensation
The information required by this Item is incorporated by reference to the sections of our 20182024 Proxy Statement entitled “Compensation Discussion and Analysis,” “Executive Compensation” and “Director Compensation.”
Item 12. Security Ownership of Certain Beneficial Owners and Management and Related Stockholder Matters
The information required by this Item is incorporated by reference to the sections of our 20182024 Proxy Statement entitled “Security Ownership of Certain Beneficial Owners and Management” and “Securities Authorized for Issuance under Equity Compensation Plans.”
Item 13. Certain Relationships and Related Transactions, and Director Independence
The information required by this Item is incorporated by reference to the sections of our 20182024 Proxy Statement entitled “Transactions with Related Parties” and “Director Independence.”
Item 14. Principal Accountant Fees and Services
The information required by this Item is incorporated by reference to the section of our 20182024 Proxy Statement entitled “Independent Registered Public Accounting Firm Fees.”
92
PART IV
Item 15. Exhibits, and Financial Statement Schedules
(a) The following documents are filed as part of this Form 10-K:
(1) Financial Statements
| Iridium Communications Inc.: | |||||
(2) Financial Statement Schedules
The financial statement schedules are not included here because required information is included in the consolidated financial statements.
(3) Exhibits
The following list of exhibits includes exhibits submitted with this Form 10-K as filed with the Securities and Exchange Commission.
| Exhibit No. | Document | |||||||
| 3.1 | ||||||||
| 3.2 | ||||||||
| 4.1 | ||||||||
| 10.1# | ||||||||
| 10.2 | ||||||||
| 10.3 | ||||||||
| 10.4 | ||||||||
93
| 10.6† | ||||||||
| 10.10 | ||||||||
Amended and Restated Performance Share Program established under the Iridium Communications Inc. Amended and Restated 2015 Equity Incentive Plan, incorporated by reference to Exhibit | ||||||||
| 10.23* | ||||||||
94
| Exhibit No. | Document | |||||||
| 21.1 | ||||||||
| 23.1 | ||||||||
| 23.2 | ||||||||
| 31.1 | ||||||||
| 31.2 | ||||||||
| 101.INS | XBRL Instance Document | |||||||
| 101.SCH | XBRL Taxonomy Extension Schema | |||||||
| 101.CAL | XBRL Taxonomy Extension Calculation Linkbase | |||||||
| 101.DEF | XBRL Taxonomy Extension Definition Linkbase | |||||||
| 101.LAB | XBRL Taxonomy Extension Label Linkbase | |||||||
| 101.PRE | XBRL Taxonomy Extension Presentation Linkbase | |||||||
| 104 | Cover Page Interactive Data File (formatted as Inline XBRL and contained in Exhibit 101). | |||||||
95
# Exhibits and schedules have been omitted pursuant to Item 601(a)(5) of Regulation S-K and will be furnished on a supplemental basis to the Securities and Exchange Commission upon request.
† Certain confidential portions of this exhibit, marked by asterisks, were omitted because the identified confidential portions are (i) not material and (ii) the type that the registrant treats as private or confidential.
* Denotes management contract or compensatory plan or arrangement.
** These certifications are being furnished solely to accompany this Annual Report pursuant to 18 U.S.C. Section 1350, and are not being filed for purposes of Section 18 of the Securities Exchange Act of 1934, as amended, and are not to be incorporated by reference into any filing of the registrant, whether made before or after the date hereof, regardless of any general incorporation language in such filing.
Item 16.Form 10-K Summary
Not applicable.
96
SIGNATURES
Pursuant to the requirements of Section 13 or 15(d) of the Securities Exchange Act of 1934, the registrant has duly caused this report to be signed on its behalf by the undersigned, thereunto duly authorized.
| IRIDIUM COMMUNICATIONS INC. | |||||||||
| Date: February | By: | /s/ Thomas J. Fitzpatrick | |||||||
| Thomas J. Fitzpatrick | |||||||||
| Chief Financial Officer | |||||||||
Pursuant to the requirements of the Securities Exchange Act of 1934, this report has been signed below by the following persons on behalf of the registrant and in the capacities and on the dates indicated:
| Name | Title | Date | |||||||||||||
| /s/ Matthew J. Desch | Chief Executive Officer and Director | February | |||||||||||||
| Matthew J. Desch | (Principal Executive Officer) | ||||||||||||||
| /s/ Thomas J. Fitzpatrick | Chief Financial Officer, Chief Administrative Officer and Director | February | |||||||||||||
| Thomas J. Fitzpatrick | (Principal Financial Officer) | ||||||||||||||
| /s/ Timothy P. Kapalka | February | ||||||||||||||
| Timothy P. Kapalka | (Principal Accounting Officer) | ||||||||||||||
| /s/Robert H. Niehaus | Director and Chairman of the Board | February | |||||||||||||
| Robert H. Niehaus | |||||||||||||||
| /s/ Thomas C. Canfield | Director | February | |||||||||||||
| Thomas C. Canfield | |||||||||||||||
| /s/ L. Anthony Frazier | Director | February 15, 2024 | |||||||||||||
| L. Anthony Frazier | |||||||||||||||
| /s/ Jane L. Harman | Director | February | |||||||||||||
| Jane L. Harman | |||||||||||||||
| /s/ Alvin B. Krongard | Director | February | |||||||||||||
| Alvin B. Krongard | |||||||||||||||
| /s/ Suzanne E. McBride | Chief Operations Officer and Director | February 15, 2024 | |||||||||||||
| Suzanne E. McBride | |||||||||||||||
| /s/ Eric T. Olson | Director | February | |||||||||||||
| Eric T. Olson | |||||||||||||||
| /s/ Kay N. Sears | Director | February 15, 2024 | |||||||||||||
| Kay N. Sears | |||||||||||||||
| /s/ | Director | February | |||||||||||||
97