You should carefully consider the following risk factors. Our future performance is subject to a variety of risks and uncertainties that could materially and adversely affect our business, financial condition, and results of operations, and the trading price of our common stock. We may be subject to other risks and uncertainties not presently known to us. See "Cautionary Note Regarding Forward-Looking Statements."
Part of our strategy is to continue to expand our sales of Trio® both domestically and internationally. Our expansion efforts may not be successful, which would temper any Trio® sales growth. In addition, it is difficult to determine if or how any expanded international demand and pricing for Trio® will develop. Our international sales often result in lower gross margins than domestic sales due to higher costs. These costs could include higher transportation costs, importation costs, and costs associated with duties, trade requirements, or other import or export control laws and regulations. Also, we could face increased price pressure and competition in some international markets where substitutes are more prevalent. Any of these items could negatively impact our results of operations. In addition, as we expand our international sales program, these sales may occur on an irregular basis, which could cause volatility in our inventories and our results of operations.
International sales could present risks to our business.
As discussed above, we are working to grow our international sales of Trio®.Participating in international markets requires significant resources and management attention and may subject us to economic, regulatory, and political risks that are different from those in the United States. These risks include accounts receivable collection; the need to adapt marketing and sales efforts for specific countries; new and different sources of competition; disputes and losses associated with overseas shipping; tariffs, export controls, and trade duties; additional time and effort to obtain product certifications; adverse tax consequences; restrictions on the transfer of funds; changes in legal and regulatory requirements or import policies; compliance with potentially unfamiliar local laws and customs; and political and economic instability. International sales may also be subject to fluctuations in currency exchange rates, which could increase the price of our products outside the United States and expose us to foreign currency exchange rate risk. Certain international markets require significant time and effort on the part of management to develop relationships and gain market acceptance for our products. Overall, there are additional logistical requirements associated with international sales, which may increase the time between production and our ability to recognize related revenue. Our failure to manage any of these risks successfully could harm our future international operations and our overall business.
Current and future indebtedness could adversely affect our financial condition and impair our ability to operate our business.
We have outstanding $60 million aggregate principal amount of senior notes. We also have an asset-based revolving credit facility that allows us to borrow up to an additional $35 million. We may incur additional indebtedness in the future. The agreements governing the senior notes and credit facility restrict, but do not prohibit, us from incurring additional indebtedness.
Current and future indebtedness could have important consequences, including the following:
it could limit our ability to borrow additional money or sell additional shares of common stock to fund our working capital, capital expenditures, and debt service requirements
it could limit our flexibility in planning for, or reacting to, changes in our business
we could be more highly leveraged than some of our competitors, which could place us at a competitive disadvantage
it could make us more vulnerable to a downturn in our business or the economy
it could require us to dedicate a substantial portion of our cash flows from operations to the repayment of our indebtedness, thereby reducing the availability of our cash flows for other purposes
it could adversely affect our business and financial condition if we default on or are unable to service our indebtedness or are unable to obtain additional financing, as needed
Our debt agreements contain financial and other restrictive covenants. For example, the agreements include financial covenants that require us to maintain a minimum level of adjusted EBITDA (earnings before interest, income taxes, depreciation, amortization, and certain other expenses, as defined under the agreements) and require us to meet specified financial covenants. Also, the interest rates under the notes are adjusted quarterly, and we may be subject to additional interest in the future based on our financial performance and certain financial covenant levels. For more information about these financial covenants, see "Management's Discussion and Analysis of Financial Condition and Results of Operations - Liquidity and Capital Resources."
These covenants could limit our ability to engage in activities that are in our long-term best interests. Our failure to comply with these covenants would result in an event of default that, if not waived, could result in the acceleration of all outstanding indebtedness. The senior notes and credit facility are variously secured by substantially all of our assets. As such, an event of default could also result in our lenders foreclosing on some or all of our assets.
The credit facility expires in 2019 and the senior notes are due in 2020, 2023, and 2025. In June 2017, we entered into an agreement with the holders of the Notes that requires us to prepay $10 million of the Notes, together with accrued interest and a make-whole amount, on or before December 31, 2018. In the future, we may be unable to obtain new financing or refinancing on acceptable terms.
We may not be successful in our efforts to sustain or expand water sales due to the status of our water rights, challenges to our water rights, changes in the demand for water in the areas around our facilities, restrictions on water use, or other events, which could adversely impact our financial condition and results of operations.
We have permitted, licensed, declared and partially adjudicated water rights in New Mexico and Utah under which we sell water primarily for industrial uses such as in the oil and gas services industry. We continue to work to expand sales of water, especially to support oil and gas development in the Permian Basin near our New Mexico facilities. If there are changes in state or federal regulations regarding oil and gas production or water usage, this could materially impact our ability to monetize our water rights. Third parties regularly challenge our applications to the OSE to change our water rights permits so that we are authorized to sell water to oil and gas producers. We may not be successful in these efforts.our efforts to obtain the requisite permit changes. In many cases, sales of water require governmental permits or approvals. A decision to deny, delay, revoke, or modify a permit or approval could prevent us from selling water, or increase the cost to provide water. Third parties may also challengewater, or result in our having to refund prepayments that we have received for future water rights or sales. If oil or gas prices decline, or if oil and gas development in the Permian Basin decreases, or if demand for fresh water in the Permian Basin declines for other reasons, the demand for water under our water rights could be adversely affected. In addition, although we currently expect to incur minimal expenditures associated with water sales, we could be required to expend capital to meet customer needs. Any of these events could adversely impact our financial condition and results of operations.
Water rights in New Mexico are subject to a stated place of withdrawal, purpose and place of use. Some of our water right permits, declarations and licenses were originally issued for uses relating to our mining operations. To sell water under these rights for oil and gas development, we must apply for a permit from the OSE to change the point of diversion, purpose and/or place of use of the underlying water rights. The OSE reviews such applications and makes a determination as to the validity of the right and, will approve the proposed change if it determines the requested change will not impair existing water rights, will not be contrary to the conservation of water within the state, and will not be detrimental to the public welfare of the state. In some situations, the OSE can issue a preliminary authorization for the change, which allows for the proposed change to go into effect immediately while pending further administrative review. Such authorizations for water sales are often subject to repayment if the underlying water rights were ultimately found to be invalid. Third parties may protest an application to change a point of diversion, purpose or place of use or a preliminary authorization at minimal cost and frequently do so. Once protested, an administrative process begins, whereby the OSE will ultimately determine if the subject application or preliminary authorization will impair existing water rights, will be contrary to the conservation of water within the state or will be detrimental to the public welfare of the state. The OSE’s findings can be appealed to a New Mexico district court. A significant portion of our water sales are being made under leases issued by the OSE. Additionally, some of our water rights are permitted water rights for which we still need to provide proof of completion of works and proof of beneficial use to the OSE. Please see Note 14 of the Notes to Consolidated Financial Statements for an update on challenges to our water rights.
We may face political and regulatory issues relating to the potential use of the maximum amount of our rights. Any decrease in our water rights could materially impact our ability to monetize our water rights.
A decline in oil and gas drilling could decrease our revenue.
A portion of our revenue comes from the sale of water, brines, and potassium chloride for use in oil and gas development. We also generate revenue from the sale of caliche, a produced water royalty, and various surface use agreements with operators. A decline in oil and gas drilling, especially in the Permian Basin, could reduce our sales of water, brines, and potassium chloride and result in reduced revenue from our other oilfield related offerings. For example, the decline in oil and gas drilling in 2020 due to restrictions implemented by local, state and federal authorities in response to the COVID-19 pandemic and the resulting impacts of these restrictions on the global economy as a whole, reduced our sales of water, brine, and potassium chloride and revenue for other oilfield related offerings into industrial markets in 2020 and the first quarter of 2021. In addition, oil and gas developers are regularly looking for ways to use more produced water instead of fresh water in oil and gas development and operations. Also, there are other products available that have some of the same clay-inhibiting properties as our potassium chloride. These alternative products could temporarily or permanently replace some of our sales of water or potassium chloride. We also have other oilfield product and service offerings, such as caliche and brine products, the sales of which were negatively impacted by the decline in oil and gas development in 2020, and may be further impacted in the future by declines in oil and gas development.
We may alter or expand our operations or continue to pursue acquisitions, which could adversely affect our business if we are unable to manage any expansion or acquisition effectively.
We are in the process of implementing or considering initiativescontinue to look for opportunities designed to maximize the value of our existing assets, such as through increased production and sales of water, salt, and brine. For example, in 2019 we purchased water and real property assets in southeastern New Mexico, which we refer to as Intrepid South, in an effort to expand our water sales and other revenue from the oil and gas industry. We aremay also exploring ways to potentially monetize the known but small lithium resource in our Wendover ponds. In addition, we may enter into new or complementary businesses that expand our product offerings beyond our existing assets. For example, weassets, which may include leveraging our existing oil and gas businesses in southeast New Mexico and expand into additional
oil naturaland gas or other commodities ormidstream and upstream activities. For instance, as part of this strategy, in May 2020, we acquired an 11% equity stake in the W.D. Von Gonten Laboratories, a global industry leader in drilling and completion chemistry and a strong supporter of the use of potassium chloride in oil and gas drilling and completion activities. We may also expand into new products or services up or down the supply chain in our current industry or newother industries. WeUltimately, we may not be able to successfully implementunsuccessful in implementing any alteration of our activities or expansion initiatives. Further, we may not be able to fully realize any anticipated benefits of these initiatives. Any expansion initiatives may require significant capital investments and those investments may not produce theour expected benefits.returns.
As part of thisour growth strategy, we may consider the acquisition of other companies or assets that complement or expand our business. We may not be able to successfully identify suitable acquisition opportunities, prevail against competing potential acquirers, negotiate appropriate acquisition terms, obtain necessary financing, complete proposed acquisitions, successfully integrate acquired businesses or assets into our existing operations, or expand into new markets. An acquisition may require us to use a significant portion of available cash or may result in significant dilution to our stockholders. We may be required to assume unanticipated liabilities or contingencies as part of an acquisition, or we may face substantial costs, delays, or other problems as part of the integration process. In addition, acquired businesses or assets may not achieve the desired effects or otherwise perform as we expect. We may not realize the synergies that we expect to achieve. Additionally, while we execute these acquisitions and related integration activities, our attention may be diverted from our ongoing operations, which could have a negative impact on our business.
Any of these items could negatively impact our financial condition and results of operations.
AggressiveCompetitors' aggressive pricing or operating strategies by our competitors could adversely affect our sales and results of operations.
The potassium-fertilizer industry is concentrated, with a small number of producers accounting for the majority of global production. Many of these producers have significantly larger operations and more resources than we do. These larger producers may have greater leverage in pricing negotiations with customers and transportation providers. They also have a broader product portfolio, which may allow them to offer rebates or bundle products to offer discounts or incentives to gain a competitive advantage. TheyCompetitors may also be able to mine their potash or langbeinite at a lower cost due to economies of scale or other competitive advantages. In addition, they may decide to pursue aggressive pricing or operating strategies that disrupt the global and U.S. markets. These disruptions could cause lower prices or demand for our product, which would adversely affect our sales and results of operations.
Changes in the agricultural industry could exacerbate the cyclical nature of the prices and demand for our products or adversely affect the markets for our products.
Farmers attempt to apply the optimum amounts of fertilizer to maximize their economic returns. A farmer's decision about the application rate for each fertilizer, or the decision to forgo the application of a fertilizer, particularly potash and Trio®, varies from year to year depending on a number of factors. These factors include crop types, crop prices, weather patterns, fertilizer and other crop input costs, and the level of crop nutrients remaining in the soil following the previous harvest. Farmers are more likely to increase application rates of fertilizers when crop prices are relatively high, fertilizer and other crop input costs are relatively low, or the level of crop nutrients remaining in the soil is relatively low. Conversely, farmers are likely to reduce application of fertilizers when farm economics are weak or declining or the level of crop nutrients remaining in the soil is relatively high. This variability in application rates can impact the cyclical nature of the prices and demand for our products. In addition, farmers may buy and apply potash or Trio® in excess of current crop needs, which results in a build-up of potassium in the soil that can be used by crops in subsequent crop years. If this occurs, demand for our products could be delayed to future periods.
State and federal governmental policies, including farm and ethanol subsidies and commodity support programs, may also influence the number of acres planted, the mix of crops planted, and the use of fertilizers. In addition, there are various city, county, and state initiatives to regulate the use and application of fertilizers due to various environmental concerns. If U.S. agricultural production or fertilizer use decreased significantly due to one or more of these factors, our results of operations could be adversely affected.
The seasonal demand for our products, and the resulting variations in our cash flows from quarter to quarter, could have an adverse effect on our results of operations and working capital requirements.
The fertilizer business is seasonal. With respect to domestic sales, we typically experience increased sales during the North American spring and fall application seasons. The degree of seasonality can change significantly from one year to the next due to weather-related shifts in planting schedules and purchasing patterns. We and our customers generally build inventories during low-demand periods of the year to ensure timely product availability during high-demand periods, resulting in increased working capital requirements just before the start of these seasons. If we are unable to accurately predict the timing of demand for our products due to variations in seasonality from year to year, our results of operations and working capital could be adversely affected. Similarly, if we do not have adequate storage capacity to manage varying inventory needs, we may need to reduce production or lower the price at which we sell product, either of which would adversely affect our results of operations.
In mid-2016, we transitioned our East mine to Trio®-only, resulting in an increased supply of Trio®.Previously, Trio® was supply-constrained, which meant that we did not see as much seasonality with respect to purchases as we did for potash. As purchasers have gained increased confidence in our ability to supply this product closer to the traditional spring application season in the U.S., these purchasers have moved to more of a just-in-time purchasing model. As a result, we now experience more traditional seasonality with respect to our domestic Trio® sales. sales, which exposes us to inventory and demand risks similar to those with respect to our potash.
As noted above, part of our strategy is to expand international sales of We market Trio®.We are currently marketing Trio® into many different parts of in various countries around the world, all of which have different climates and fertilizer-application patterns. As a result, seasonality in our international Trio® sales may develop, which could cause volatility in our results of operations.
Our Trio® profitability could be affected by market entrants or the introduction of langbeinite alternatives.
Langbeinite is produced by us and one other company from a single resource located in Carlsbad, New Mexico. Additional competition in the market for langbeinite and comparable products exists and could increase in the future. Other companies could seek to create and market chemically similar alternatives to langbeinite, some of which could be superior to langbeinite, or less costly to produce. In addition, companies sometimes blend several nutrients to obtain a product with similar
agronomic benefits as langbeinite. The market for langbeinite and our Trio® sales could be affected by the success of these and other products that are competitive with langbeinite, which could adversely affect the viability of our Trio® business and our results of operations and
financial condition. Further, recent increases in the supply of langbeinite by us and the other producer may continue to pressure the sales price of Trio®.
International sales could present risks to our business.
Sales of Trio® into international markets often require more resources and management attention than domestic sales and may subject us to economic, regulatory, and political risks that are different from those in the U.S. These risks include accounts receivable collection; the need to adapt marketing and sales efforts for specific countries; new and different sources of competition; disputes and losses associated with overseas shipping; tariffs, export controls, and trade duties; additional time and effort to obtain product certifications; adverse tax consequences; restrictions on the transfer of funds; changes in legal and regulatory requirements or import policies including sanctions; compliance with potentially unfamiliar local laws and customs; and political and economic instability. International sales may also be subject to fluctuations in currency exchange rates, which could increase the price of our products outside the U.S. and expose us to foreign currency exchange rate risk. Certain international markets require significant time and effort on the part of management to develop relationships and gain market acceptance for our products. Overall, there are additional logistical requirements associated with international sales, which may increase the time between production and our ability to recognize related revenue. Our failure to manage any of these risks successfully could harm our future international operations and our overall business.
If potash or Trio® prices decline, or oil and gas activity declines, we could be required to record additional write-downs of our long-lived and indefinite-lived assets, which could adversely affect our results of operations and financial condition.
We evaluate our long-lived assets for impairment when events or changes in circumstances indicate that the related carrying amount may not be recoverable. Impairment is considered to exist if an asset's total estimated future cash flows on an undiscounted basis are less than the carrying amount of the related asset. An impairment loss is measured and recorded based on the discounted estimated future cash flows. For example,
In 2023, we recorded total impairment charges to our long-lived assets and mineral properties of $43.3 million. We recorded impairment charges of $31.9 million related to our long-lived assets and mineral property assets at our East mine. We determined that sufficient indicators of potential impairment existed because higher Trio® production costs and lower realized Trio® prices led to negative gross margins for our Trio® segment. We also recorded impairment charges of $9.9 million related to our long-lived assets that are in care and maintenance at our West mine, and $1.5 million related to certain assets in our oilfield solutions segment.
We also have certain indefinite-lived intangible assets that we evaluate for impairment at least annually or more frequently when events or changes in circumstances indicate the fair value may have changed. An impairment loss is measured and recorded based on the current fair value of the asset.
After recording impairment charges to our long-lived assets in the fourth quarter of 2015, we recorded impairment charges of approximately $324 million related to our East and West conventional mining facilities, and our North facility in Carlsbad, New Mexico, due to declining potash prices at the time.
Although2023, we believe the carrying values of our long-lived assets and our indefinite-lived intangible assets were realizable as of the balance sheet dates,dates. However, future events could cause us to conclude otherwise. These future events could include further significant and sustained declines in potash or Trio® prices, further significant or sustained declines in water prices and demand, or higher production and operating costs. Further, based on our analysis of the profitability of any of our facilities, we may decide to terminate or suspend operations at additional facilities. These events could require a further write-down of the carrying value of our assets, which would adversely affect our results of operations and financial condition.
If we are required to write down the value of our inventories, our financial condition and results of operations would be adversely affected.
We carry our inventories at the lower of cost or market.net realizable value. In periods when the market prices for our products fall below our cost to produce them and the lower prices are not expected to be temporary, we are required to write down the value of our inventories. Any write-down of our inventory would adversely affect our financial condition and results of operations, possibly materially. We recorded $6.5 million of lower of cost or net realizable value adjustments in 2023, $3.8 million in our Trio® segment, and $2.7 million in our potash segment.
Weakening of foreign currencies against the U.S. dollar could lead to lower domestic potash prices, which would adversely affect our results of operations. Currency fluctuations could cause our results of operations to fluctuate.
The U.S. imports the majority of its potash, including from Canada, Russia and other countries. If the local currencies for foreign suppliers strengthen in comparison to the U.S. dollar, foreign suppliers realize a smaller margin in their local currencies unless they increase their nominal U.S. dollar prices. Strengthening of these local currencies therefore tends to support higher U.S. potash prices as the foreign suppliers attempt to maintain their margins. However, if these local currencies
weaken in comparison to the U.S. dollar, foreign suppliers may lower prices to increase sales volume while again maintaining a margin in their local currency. Changes in the strength of the U.S. dollar compared to other currencies could cause our sales prices and results of operations to decrease or fluctuate significantly.
Our business depends on skilled and experienced workers, and our inability to find and retain quality workers could have an adverse effect on our development and results of operations.
The success of our business depends on our ability to attract and retain skilled managers, engineers, and other workers. At times, we may not be able to find or retain qualified workers. In particular, the labor market around Carlsbad, New Mexico, is competitive and employee turnover is generally high. In that market, we compete for experienced workers with several other employers, including natural resource and hazardous waste facilities, oil and gas producers, and another producer of langbeinite. If we are unable to attract and retain quality workers, the development and growth of our business could suffer, or we could be required to raise wages to keep our employees, hire less qualified workers, or incur higher training costs. These risks may be exacerbated in times when we need to reduce our workforce due to economic conditions. The occurrence of any of these events could have an adverse effect on our results of operations. For example, in mid-2016, we idled our West mine and transitioned our East mine to Trio®-only, resulting in our laying off a significant number of skilled employees in New Mexico. This may make it more difficult for us to re-hire skilled employees in the future.
Increases in the prices of energy and other important materials used in our business, or disruptions to their supply, could adversely impact our sales, results of operations, or financial condition.
Natural gas, electricity, chemicals, diesel, and gasoline are key materials that we purchase and use in the production of our products. The prices of these commodities are volatile.
Our sales and profitability are impacted by the price and availability of these materials. A significant increase in the price of these materials that is not recovered through an increase in the price of our products, or an extended interruption in the supply of these materials to our production facilities, could adversely affect our results of operations or financial condition. In addition, high natural gas or other fuel costs could increase input costs for end-users of our products, which could cause them to spend less on our products.
Increased costs could affect our per-ton profitability.
A substantial portion of our operating costs is comprised of fixed costs that do not vary based on production levels. These fixed costs include labor and benefits, base energy usage, property taxes, insurance, maintenance expenditures, and depreciation. Any increase in fixed costs or decrease in production generally increases our per-ton costs and correspondingly decreases our per-ton operating margin. We operate our East Plant at less than full capacity in order to curtail our Trio® production to match expected demand and manage inventory levels. A significant increase in costs at any of our facilities could have an adverse effect on our profitability and cash flows, particularly during periods of lower potash and Trio® prices.
A shortage of railcars or trucks for transporting our products, increased transit times, or interruptions in railcar or truck transportation could result in customer dissatisfaction, loss of sales, higher transportation or equipment costs, or disruptions in production.
We rely heavily upon truck and rail transportation to deliver our products to our customers. In addition, the cost of transportation is an important component of the price of our products. A shortage of trucks or railcars for carrying product or increased transit times due to accidents, highway or railway disruptions, congestion, high or compressed demand, labor disputes, adverse weather, natural disasters, changes to transportation systems, or other events could prevent us from making timely delivery to our customers or lead to higher transportation costs. As a result, we could experience customer dissatisfaction or a loss of sales. Similarly, disruption within the steady decreases intransportation systems could negatively affect our average net realized sales price per ton duringability to obtain the year ended December 31, 2017, we recorded lower-of-cost-or-market adjustments totaling $7.3 million.supplies and equipment necessary to produce our products. We may also have difficulty obtaining access to vessels to deliver our products to overseas customers.
TheWe rely on our management personnel for the development and execution of strategic projectsour business strategy, and the loss of one or more members of our management team could requireharm our business.
Our management personnel have significant relevant industry and company-specific experience. Our senior management team has developed and implemented first-of-their-kind processes and other innovative ideas that are important to our business. If we are unable to retain these individuals, our operations could be disrupted and we may be unable to achieve our business strategies and grow effectively. We do not currently maintain "key person" life insurance on any of our management personnel.
We have less product diversification than nearly all of our competitors, which could have an adverse effect on our financial condition and results of operations.
A significant portion of our revenue comes from the sale of potash and langbeinite, whereas nearly all of our competitors are diversified, primarily into nitrogen- or phosphate-based fertilizer businesses or other chemical or industrial businesses. In addition, a majority of our sales are to customers in the U.S., and generally these customers are concentrated in key geographies where we have a freight advantage. As a result, we could be impacted more time and moneyacutely by factors affecting our industry or the regions in which we operate than we expect,would if our business was more diversified and our sales more global. A decrease in the demand for potash and langbeinite would have an adverse effect on our financial condition and results of operations. Similarly, in periods when production exceeds demand, the price at which couldwe sell our potash and langbeinite and our sales volumes would likely fall, which would adversely affect our results of operations and financial condition.condition more than our diversified competitors.
Heavy precipitation or low evaporation rates at our solar solution mines could impact our potash production at those facilities, which could adversely affect our sales and results of operations.
All of our potash production comes from our solar solution mines. These facilities use solar evaporation ponds to form potash crystals from brines. Weather conditions at these facilities could negatively impact potash production. For example, heavy rainfall in September and October, just after the evaporation season ends, can reduce the amount of potash we produce in that year or the following year by causing the potash crystals to dissolve and consume pond capacity. Similarly, lower‑than‑average temperatures or higher-than-average seasonal rainfall would reduce evaporation rates and therefore impact production. We experienced significant rainfall in the summer of 2019 at our Wendover facility which reduced the product available for sale in 2020. Similarly, our HB facility experienced a higher-than-average seasonal rainfall in the summer of 2021, which led to fewer tons available for sale in the second half of 2021 and in the spring of 2022. If we experience heavy rainfall or low evaporation rates at any of our solar solution mines, we would have less potash available for sale, and our sales and results of operations would be adversely affected. Reduced potash available for sale could also affect our ability to produce and sell byproducts such as salt and magnesium chloride.
Inflows of water into our langbeinite mine from heavy rainfall or groundwater could result in increased costs and production downtime and could require us to abandon the mine, any of which could adversely affect our results of operations.
Major weather events such as heavy rainfall can result in water inflows into our underground, langbeinite mine. The presence of water-bearing strata in many underground mines carries the risk of water inflows into the mines. If we experience water inflows at our langbeinite mine, our employees could be injured and our equipment and mine shafts could be seriously damaged. We could be forced to shut down the mine temporarily, potentially resulting in significant production delays, and we could spend substantial funds to repair or replace damaged equipment. Inflows may also destabilize the mine shafts over time, resulting in safety hazards for employees and potentially leading to the permanent abandonment of the mine.
A significant disruption to our information technology systems could adversely affect our business and operating results.
We rely on a variety of information technology and automated operating systems to manage or support our operations. We depend on our information technology systems for a variety of functions, including, but not limited to, financial reporting, inventory management, procurement, invoicing and email. We also have access to, and we create and store, sensitive data, including our proprietary business information and that of our customers, and personally identifiable information of our employees. The proper functioning of these systems and the security of this data is critical to the efficient operation and management of our business. In addition, these systems could require modifications or upgrades as a result of technological changes or growth in our business. These changes could be costly and disruptive to our operations and could impose substantial demands on management time. Our systems, and those of third-party providers, also could be vulnerable to damage or disruption caused by catastrophic events, power outages, natural disasters, computer system or network failures, viruses or malware, physical or electronic break-ins, unauthorized access, and cyber-attacks. Although we take steps to secure our systems and electronic information, these cybersecurity measures may not be adequate. Any security breaches could compromise our networks and the information stored on them could be improperly accessed, disclosed, lost or stolen. Any such access, disclosure or other loss of information could disrupt our operations and the services we provide to customers, damage our reputation or our relationships with our customers or result in legal claims or proceedings, any of which could adversely affect our business, reputation, and operating results.
Our business may be adversely affected by union activities.
Hourly employees at our Wendover facility are represented by a labor union. These employees represent approximately 9% of our total workforce. Our current collective bargaining agreement with the union, which became effective on June 1, 2023, expires on May 31, 2026. Although we believe that our relations with our unionized employees are good, we may not be successful in negotiating a new collective bargaining agreement as a result of general economic, financial,
competitive, legislative, political, and other factors beyond our control. Any new agreement could result in a significant increase in our labor costs. In addition, a breakdown in negotiations or failure to timely enter into a new collective bargaining agreement could materially disrupt our Wendover operations.
From time to time, we invest in strategic projects. The completion of these projectsefforts have been made to unionize employees at our other facilities. Additional unionization efforts could require significantly more time and money than we expect. In some cases, the constructiondisrupt our business, consume management attention, or commissioning processes could force us to slow or shut down normal operations at the affected facility for a period of time, which would cause lower production volume and higher production costs per ton.increase our operating costs. In addition, if these efforts were successful, we could experience increased labor costs, an increased risk of work stoppages, and limits on our management teamflexibility to run our business in the most efficient manner to remain competitive.
Risks Related to Our Industry
Changes in the agricultural industry could exacerbate the cyclical nature of the prices and demand for our products or adversely affect the markets for our products.
Farmers attempt to apply the optimum amounts of fertilizer to maximize their economic returns. A farmer's decision about the application rate for each fertilizer, or the decision to forgo the application of a fertilizer, particularly potash and Trio®, varies from year to year depending on several factors. These factors include crop types, crop prices, weather patterns, fertilizer and other employeescrop input costs, and the level of crop nutrients remaining in the soil following the previous harvest. Farmers are more likely to increase application rates of fertilizers when crop prices are relatively high, fertilizer and other crop input costs are relatively low, or the level of crop nutrients remaining in the soil is relatively low. Conversely, farmers are likely to reduce application of fertilizers when farm economics are weak or declining or the level of crop nutrients remaining in the soil is relatively high. This variability in application rates can impact the cyclical nature of the prices and demand for our products. In addition, farmers may buy and apply potash or Trio® in excess of current crop needs, which results in a build-up of potassium in the soil that can be requiredused by crops in subsequent crop years. If this occurs, demand for our products could be delayed to spend a significant amountfuture periods.
State and federal governmental policies, including farm and ethanol subsidies and commodity support programs, may also influence the number of time addressing strategic projects, which could mean that our normal operations receive less timeacres planted, the mix of crops planted, and attention.
Wethe use of fertilizers. In addition, there are considering potential long-term opportunities for revenuevarious city, county, and strategic growth, including additional solution mining relatedstate initiatives to our HB mine. These potential projects are at an early stage,regulate the use and we may not proceed with anyapplication of them. Even if we proceed withfertilizers due to various environmental concerns. If U.S. agricultural production or fertilizer use decreases significantly due to one or more of these or other strategic projects, we may not realize the expected benefits despite substantial investments, they may cost significantly more than we expect, or we may encounter additional risks that we did not initially expect.factors, our results of operations could be adversely affected.
Mining is a complex process that frequently experiences production disruptions, which could adversely affect our results of operations.
The process of mining is complex. Production delays can occur due to equipment failures, unusual or unexpected geological conditions, environmental hazards, acts of nature, and other unexpected events or problems. Furthermore, production is dependent upon the maintenance and geotechnical structural integrity of our tailings and storage ponds. The amounts that we are required to spend on maintenance and repairs may be significant.
Our East mine, surface, and support facilities are greater thanover 50 years old. As mining progresses at an underground mine, operations typically move further away from the shafts and, despite modernization through sustaining capital, fixed assets may require increased repair or refurbishment. These conditions increase the exposure to higher operating costs or the increased probability of incidents.
Mining is aan inherently hazardous process,industry, and accidents could result in significant costs or production delays.
The process of miningMining is hazardous and involves various risks and hazards that can result in serious accidents. If accidents or unforeseen events occur, or if our safety procedures are not effective,followed or are ineffective, we could be subject to liabilities arising out of personal injuries or death, our operations could be interrupted, or we could be required to shut down or abandon affected facilities. Accidents could cause us to expend significant amounts to remediate safety issues or repair damaged facilities.
Existing or expanded oil and gas development near our mines could result in methane gas leaking from an oil and gas well into our mines. We test our mines regularly for methane gas. However, unlikeUnlike coal mines, our mines are not constructed or equipped to deal with methane gas. Any intrusion of methane gas into our mines could cause a fire or an explosion resulting in loss of life or significant property damage or could require the suspension of all mining operations until the completion of extensive modifications and re-equipping of the mine. The costs of modifying our mines and equipment could make it uneconomical to reopen our mines. You can find more information about the co-development of potash and oil and gas resources near our New Mexico facilities under the risk factor below entitled "Existing-Existing and further oil and gas development in the Designated Potash Area could impair our potash reserves, which could adversely affect our financial condition or results of operations."
The grade of ore that we mine could vary from our projections due to the complex geology and mineralogy of our reserves, which could adversely affect our production and our results of operations.
Ore bodies have complex geology. Our production is affected by the mineral content and other mineralogy of the ore. Our projections of ore grade may not be accurate. There are numerous uncertainties inherent in estimating ore grade, including many factors beyond our control. As the grade of our remaining ore reserves decreases over time, we need to process more ore to produce the same amount of saleable-grade product, increasing our costs and slowing our production. In addition, there are few opportunities to acquire more reserves in the areas around our current operations. If we are unable to process more ore to maintain current production levels, if the processing of more ore materially increases our costs, or if our ore grade projections are not accurate, our results of operations would be adversely affected.
If the assumptions underlying our reserve estimates are inaccurate or if future events cause us to negatively adjust our previous assumptions, the quantities and value of our reserves, and in turn our financial condition and results of operations, could be adversely affected.
There are numerous uncertainties inherent in estimating our potash and langbeinite reserves. As a result, our reserve estimates necessarily depend upon a number ofseveral assumptions, including the following:
•geologic and mining conditions, which may not be fully identified by available exploration data and may differ from our experiences in areas where we currently mine or operateoperate;
| |
• | future potash and Trio® prices, operating costs, capital expenditures, royalties, severance and excise taxes, and development and reclamation costs
|
•future potash and Trio® prices, operating costs, capital expenditures, royalties, severance and excise taxes, and development and reclamation costs;
•future mining technology improvementsimprovements;
•the effects of governmental regulationregulation; and
•variations in mineralogymineralogy.
In addition, because reserves are estimates built on various assumptions, they cannot be audited for the purpose of verifying exactness. It is only after extraction that reserve estimates can be compared to actual values to adjust estimates of the remaining reserves. If any of the assumptions that we make in connection with our reserve estimates are incorrect, the amounts of potash and langbeinite that we are able tocan economically recover from our mines could be significantly lower than our reserve estimates. In addition, we periodically review the assumptions underlying our reserve estimates. If future events cause us to negatively adjust our previous assumptions, our reserve estimates could be adversely affected. In any of these events, our financial condition and results of operations could be adversely affected.
WeakeningWe updated our mineral reserves and resources as of foreign currencies againstDecember 31, 2023, and we determined we do not have any mineral reserves at our East facility because the U.S. dollarmineral deposit could lead to lower domestic potash prices, which would adversely affect our results of operations. Currency fluctuations could cause our results of operations to fluctuate.
The U.S. imports the majority of its potash, including from Canada, Russia, and Belarus. If the local currencies for foreign suppliers strengthen in comparison to the U.S. dollar, foreign suppliers realize a smaller margin in their local currencies unless they increase their nominal U.S. dollar prices. Strengthening of these local currencies therefore tends to support higher U.S. potash prices as the foreign suppliers attempt to maintain their margins. However, if these local currencies weaken in comparison to the U.S. dollar, foreign suppliers may lower prices to increase sales volume while again maintaining a margin in their local currency. Currently, the U.S. dollar is still relatively strong in comparison to many foreign currencies, which has led to increased imports into the U.S. These activities could cause our sales prices and results of operations to decrease or fluctuate significantly.
Adverse conditions in the global economy and disruptions in the financial markets could negatively affect our results of operations and financial condition.
Global economic volatility and uncertainty can create uncertainty for farmers and customers in the geographic areas where we sell our products. If farmers reduce, delay, or forgo their potash and Trio® purchases due to this uncertainty, our results of operations would be adversely affected. Moreover, volatility and disruptions in the financial markets could limit our
customers' ability to obtain adequate financing or credit to purchase and pay for our products, which would decrease our sales volume. Changes in governmental banking, monetary, and fiscal policies to restore liquidity and increase credit availability may not be effective. It is difficult to determine the extent of economic and financial market problems and the many ways in which they could negatively affect our customers and business. In addition, if we are required to raise additional capital or obtain additional credit during an economic downturn, we could be unable to do so on favorable terms or at all.
Changes in laws and regulations affecting our business, or changes in enforcement practices, could have an adverse effect on our financial condition or results of operations.
We are subject to numerous federal and state laws and regulations covering a wide variety of business practices. Changes in these laws or regulations could require us to modify our operations, objectives, or reporting practices in ways that adversely impact our financial condition or results of operations. In addition, new laws and regulations, or new interpretations of or enforcement practices with respect to existing laws and regulations, could similarly impact our business.
For example, we are subject to significant regulation under MSHA and OSHA. High-profile mining accidents could prompt governmental authorities to enact new laws and regulations that apply to our operations or to more strictly enforce existing laws and regulations.
Physical effects of climate change, and climate change legislation, could have a negative effect on our operations and results of operations.
The physical effects of climate change could have an adverse effect on us and our customers. These effects could include changes in weather patterns including drought and rainfall levels, water availability, storm patterns and intensities, and temperature levels. These changes could have an adverse effect on our costs, production, or sales, especially with respect to our solar operations. These changes could also have an adverse effect on our agricultural customers, which in turn could reduce the demand or price for our products.
In addition, federal and state legislators and regulators regularly consider ways to mitigate climate change. Any new rules could have a significant impact on our operations and products and could result in substantial additional costs for us.
Our business depends on skilled and experienced workers, and our inability to find and retain quality workers could have an adverse effect on our development and results of operations.
The success of our business depends on our ability to attract and retain skilled managers, engineers, and other workers. At times, we may not be able to find or retain qualified workers. In particular, the labor market around Carlsbad, New Mexico, is competitive and employee turnover is generally high. In that market, we compete for experienced workers with several other employers, including natural resource and hazardous waste facilities, oil fields, and another producer of langbeinite. If we are not able to attract and retain quality workers, the development of our business could suffer or we could be required to raise wages to keep our employees, hire less qualified workers, or incur higher training costs. These risks may be exacerbated in times when we need to reduce our workforce due to economic conditions, such as in 2016. The occurrence of any of these events could have an adverse effect on our results of operations. For example, in mid-2016, we idled our West mine and transitioned it into care-and-maintenance mode and transitioned our East mine to Trio®-only, resulting in our laying off a significant number of skilled employees in New Mexico. This may make it more difficult for us to re-hire skilled employees in the future.
Changes in the prices of energy and other important materials used in our business, or disruptions to their supply, could adversely impact our sales, results of operations, or financial condition.
Natural gas, electricity, chemicals, diesel, and gasoline are key materials that we purchase and use in the production of our products. The prices of these commodities are volatile.
Our sales and profitability are impacted by the price and availability of these materials. A significant increase in the price of these materials that is not recovered through an increase in the price of our products, or an extended interruption in the supply of these materials to our production facilities, could adversely affect our results of operations or financial condition. In addition, high natural gas or other fuel costs could increase input costs for end-users of our products, which could cause them to spend less on our products.
A decline in oil and gas drilling or a reduction in the use of potash in drilling fluids could increase our operating costs and decrease our revenue.
A portion of our revenue comes from the sale of potassium chloride for use in oil and gas drilling fluids. A decline in oil and gas drilling, especially in the areas around our production facilities, could reduce our sales into this industrial market. In addition, alternative products that have some of the same clay-inhibiting properties as potash are commercially available. These alternative products could temporarily or permanently replace some of our sales into the industrial market, where our average
net realized sales price per ton is higher than it is for the agricultural market. If a significant amount of our sales shift from the industrial market to the agricultural market due to any of these factors, our revenue could decline and shipping costs could increase to reach these markets.
Increased costs could affect our per-ton profitability.
A substantial portion of our operating costs is comprised of fixed costs that do not vary based on production levels. These fixed costs include labor and benefits, base energy usage, property taxes, insurance, maintenance expenditures, and depreciation. Any increase in fixed costs or decrease in production generally increases our per-ton costs and correspondingly decreases our per-ton operating margin. Beginning in December 2016, we curtailed our Trio® production to match expected demand and manage inventory levels. A significant increase in costs at any of our facilities could have an adverse effect on our profitability and cash flows, particularly during periods of lower potash and Trio® prices.
A shortage of railcars or trucks for transporting our products, increased transit times, or interruptions in railcar or truck transportation could result in customer dissatisfaction, loss of sales, higher transportation or equipment costs, or disruptions in production.
We rely heavily upon truck and rail transportation to deliver our products to our customers. In addition, the cost of transportation is an important component of the price of our products. A shortage of trucks or railcars for carrying product or increased transit times due to accidents, highway or railway disruptions, congestion, high or compressed demand, labor disputes, adverse weather, natural disasters, changes to transportation systems, or other events could prevent us from making timely delivery to our customers or lead to higher transportation costs. As a result, we could experience customer dissatisfaction or a loss of sales. Similarly, disruption within the transportation systems could negatively affect our ability to obtain the supplies and equipment necessary to produce our products. We may also have difficulty obtaining access to ships to deliver our products to overseas customers.
We rely on our management personnel for the development and execution of our business strategy, and the loss of one or more members of our management team could harm our business.
Our management personnel have significant relevant industry and company-specific experience. Our senior management team has developed and implemented first-of-their-kind processes and other innovative ideas that are important to our business. If we are unable to retain these individuals, our operations could be disrupted and we may be unable to achieve our business strategies and grow effectively. We do not currently maintain "key person" life insurance on any of our management personnel.economically extracted.
Existing and further oil and gas development in the Designated Potash Area could impair our potash reserves, which could adversely affect our financial condition or results of operations.
The U.S. Department of the Interior ("DOI") regulates the developmentco-development of federal mineral resources-both potash and oil and gas-on federal lands in what the DOI has designated as the Designated Potash Area. This 497,000-acre region outside of Carlsbad, New Mexico, includes all of our New Mexico operations and facilities. In 2012, the U.S. Department of the InteriorDOI issued an updated order that provides guidance to the U.S. Bureau of Land Management ("BLM")BLM and industry on the co-development of these resources. See Order 3324 issued by the Secretary of the Interior on December 4, 2012 ("2012 Secretary's Order").
It is possible that oil and gas drilling in this areathe Designated Potash Area could limit our ability to mine valuable potash and langbeinite reserves or mineralized deposits because of setbacks from oil and gas wells and the establishment of unminable buffer areas around oil or gas wells. It is also possible that the BLM could determine that the size of these unminable buffer areas should be larger than they are currently, which could impact our ability to mine our reserves. We review applications for permits to drill oil and gas wells as they are publicly disclosed by the BLM and the State of New Mexico. When appropriate, we protest applications for drilling permits that we believe should not be drilled consistent with the operative federal and state rules and that could impair our ability to mine our reserves or put at risk the safety of our employees. We may not prevail in these protests or be able to prevent wells from being drilled in the vicinity of our reserves. If, notwithstanding our protests and appeals, a sufficient number of wells are drilled through or near our reserves, our reserves could be significantly impaired, which could adversely affect our financial condition or results of operations.
The mining business is capital intensive and our inability to fund necessary or desirable capital expenditures could have an adverse effect on our growth and profitability.
The mining business is capital intensive. We may find it necessary or desirable to make significant capital expenditures in the future to sustain or expand our existing operations and may not have, or have access to, the financial resources to pursue these expenditures. If costs associated with capital expenditures increase or if our earnings decrease significantly or we do not have access to the capital markets, we could have difficulty funding any necessary or desirable capital expenditures at an acceptable rate or at all. This could limit the expansion of our production or make it difficult for us to sustain
our existing operations at optimal levels. Increased costs for capital expenditures could also have an adverse effect on the profitability of our existing operations and returns from our most recent strategic projects.
Risks Related to Financial Position, Indebtedness and Additional Capital Needs
The execution of strategic projects could require more time and money than we expect, which could adversely affect our results of operations and financial condition.
From time to time, we invest in strategic projects. The completion of these projects could require significantly more time and money than we expect. In some cases, the construction or commissioning processes could force us to slow or shut down normal operations at the affected facility for a period of time, which would cause lower production volume and higher production costs per ton. In addition, our management team and other employees may be required to spend a significant amount of time addressing strategic projects, which could mean that our normal operations receive less time and attention. As we proceed with one or more of these strategic projects, we may not realize the expected benefits despite substantial investments, they may cost significantly more than we expect, or we may encounter additional risks that we did not initially anticipate.
Future indebtedness could adversely affect our financial condition and impair our ability to operate our business.
As of December 31, 2023, we had $4 million in outstanding borrowings under a revolving credit facility that allows us to borrow up to $150 million. This credit facility expires in 2027. In the future, we may be unable to obtain new financing or refinancing on acceptable terms, or at all. In addition, we may incur additional indebtedness in the future. The agreements governing the credit facility restrict, but do not prohibit, us from incurring additional indebtedness.
Future indebtedness could have important consequences, including the following:
•limiting our ability to borrow additional money or sell additional shares of common stock to fund our working capital, capital expenditures, and debt service requirements;
•limiting our flexibility in planning for, or reacting to, changes in our business;
•being more highly leveraged than some of our competitors, which could place us at a competitive disadvantage;
•being vulnerable to a downturn in our business or the economy;
•requiring us to dedicate a substantial portion of our cash flows from operations to the repayment of our indebtedness, thereby reducing the availability of our cash flows for other purposes; and
•adversely affecting our business and financial condition if we default on or are unable to service our indebtedness, are unable to refinance such indebtedness on favorable terms or are unable to obtain additional financing, as needed.
Our debt agreement contains financial and other restrictive covenants. For example, the agreement includes financial covenants that require us to maintain a maximum leverage ratio (as these ratios are defined under the agreement). For more information about financial covenants, see Item 7. "Management's Discussion and Analysis of Financial Condition and Results of Operations - Liquidity and Capital Resources."
These covenants could limit our ability to engage in activities that are in our long-term best interests. Our failure to comply with these covenants would result in an event of default that, if not waived, could result in the acceleration of all outstanding indebtedness. The credit facility is secured by substantially all of our assets. As such, an event of default could also result in our lenders foreclosing on some or all of our assets.
Adverse conditions in the domestic and global economy and disruptions in the financial markets could negatively affect our results of operations and financial condition.
Global and domestic economic volatility and uncertainty, for example, as a result of rising interest rates, a recession or fear of a recession, global trade uncertainties, international conflicts, epidemics or other significant health concerns, and inflation, can create uncertainty for farmers and customers in the geographic areas where we sell our products. If farmers reduce, delay, or forgo their potash and Trio® purchases because of economic volatility or uncertainties the results of our operations would be adversely affected. Moreover, volatility and disruptions in the financial markets could limit our customers' ability to obtain adequate financing or credit to purchase and pay for our products, which would decrease our sales volume and increase our risk of non-payment by customers. Changes in governmental banking, monetary, and fiscal policies to restore liquidity and increase credit availability may not be effective. It is difficult to determine the extent of economic and financial market problems and the many ways in which they could negatively affect our customers and business. In addition, if we are required to raise additional capital or obtain additional credit during an economic downturn, we could be unable to do so on favorable terms or at all.
Market upheavals due to military actions, pandemics, terrorist attacks, other catastrophic events, or economic repercussions from those events could reduce our sales or increase our costs.
Actual or threatened armed conflicts, terrorist attacks, military or trade disruptions, or other catastrophic events, including pandemics and other public health crises, affecting the areas where we or our competitors do business could disrupt the global market for potassium-based products. As a result, our competitors may increase their sales efforts in our geographic markets and pricing of our products could suffer. If this occurs, we could lose sales to our competitors or be forced to lower our prices. In addition, due to concerns related to terrorism or the potential use of certain fertilizers as explosives, local, state, and federal governments could implement new regulations impacting the production, transportation, sale, or use of potassium-based products. These new regulations could result in lower sales or higher costs.
The loss or substantial decline in revenue from larger customers or certain industries could have a material adverse effect on our revenues, profitability, and liquidity.
Despite diversification across multiple industries, including agricultural, industrial, and feed, larger customers, at times, comprise a significant portion of our sales revenue. For example, in 2023, one customer in our potash and Trio® segments accounted for approximately 12%, or $33.4 million, of our total consolidated revenues. In 2022, this same customer accounted for approximately 10%, or $35.0 million of our total consolidated revenues. If we experience a significant decline in sales from our larger customers or in certain industries, it may be difficult to replace those sales which could have a material effect on our results of operations.
Risks Related to Compliance, Regulatory and Legal Issues
Changes in laws and regulations affecting our business, or changes in enforcement practices, could adversely affect our financial condition or results of operations.
We are subject to numerous federal, state and local laws and regulations covering a wide variety of business practices. Changes in these laws or regulations could require us to modify our operations, objectives, or reporting practices in ways that adversely impact our financial condition or results of operations. In addition, new laws and regulations, including economic sanctions, or new interpretations of or enforcement practices with respect to existing laws and regulations, could similarly impact our business.
For example, we are subject to significant regulation under MSHA and OSHA. High-profile mining accidents could prompt governmental authorities to enact new laws and regulations that apply to our operations or to more strictly enforce existing laws and regulations. See also “Environmental laws and regulations could subject us to significant liability and require us to incur additional costs.”
If we are unable to obtain and maintain the required permits, governmental approvals, and leases necessary for our operations, our business could be adversely affected.
We hold numerous environmental, mining, safety, and other permits and governmental approvals authorizing and regulating the operations at each of our facilities. AAn agency's decision by a governmental agency to deny or delay a new or renewed permit or approval, or to revoke or substantially modify an existing permit or approval, could prevent or limit us from continuing our operations at the affected facility, which could have an adverse effect on our business, financial condition, and results of operations. In addition, we could be required to expend significant amounts to obtain, or come into compliance with, these permits, approvals, and leases, or we could be required to make significant capital investments to modify or suspend our operations at one or more of our facilities.
Any expansion of our existing operations would require us to secure the necessary environmental and other permits and approvals. We may not be able to obtain these permits and approvals in a timely manner or at all. In addition, under certain circumstances, the federal government must consider and study a project's likely environmental impacts. Based on the federal government's conclusion,evaluation, it could require an environmental assessment or an environmental impact statement as a condition of approvingin order to approve a project or permit, which could result in significant time delays and costs. Furthermore, many of our operations take placeoccur on land that is leased from federal and state governmentalgovernment authorities. Expansion of our existing operations could require securing additional federal and state leases. We may not be able to obtain or renew these leases on favorable terms or at all. In addition, our existing leases generally require us to commence mining operations within a specified time frame and to continue mining in order to retain the lease. The loss or non-renewal of a lease could adversely affect our ability to mine the associated reserves.
Also, certain of our existing leases require us to make royalty payments based on the revenue generated by the potash, langbeinite, water, or by-productsbyproducts that we produceextract from the leased land. The royalty rates are subject to change whenever we renew our leases, which could lead to significant increases in these rates. As of December 31, 2017,2023 approximately 22%17% of our state, federal and federalprivate lease acres at our New Mexico facilities (including leases at the HB and North mines) and 0.2%22% of our state and federal lease acres at our Utah operations will be up for renewal within the next five years. Increases in royalty rates would reduce our profit margins and, if the increases were significant, would adversely affect our results of operations.
We have less product diversification than nearly all Reporting of our competitors, which could have an adverse effect on our financial condition and results of operations.
A significant portion of our revenue comes from the sale of potash and langbeinite, whereas nearly all of our competitors are diversified, primarily into nitrogen- or phosphate-based fertilizer businesses or other chemical or industrial businesses. In addition, a majority of our sales are to customers in the U.S., and generally these customers are concentrated in key geographies where we have a freight advantage. As a result, we could be impacted more acutely by factors affecting our industry or the regions in which we operate than we would if our business was more diversified and our sales more global. A decrease in the demand for potash and langbeinite would have an adverse effect on our financial condition and results of operations. Similarly, in periods when production exceeds demand, the price at which we sell our potash and langbeinite and our sales volumes would likely fall, which would adversely affect our results of operations and financial condition more than our diversified competitors.
Heavy precipitation or low evaporation rates at our solar solution mines could impact our potash production at those facilities, which could adversely affect our sales and results of operations.
All of our potash production comes from our solar solution mines. These facilities use solar evaporation ponds to form potash crystals from brines. Weather conditions at these facilities could negatively impact potash production. For example, heavy rainfall in September and October, just after the evaporation season ends, can reduce the amount of potash we produce in that year or the following year by causing the potash crystals to dissolve and consume pond capacity. Similarly, lower‑than‑average temperatures or higher-than-average seasonal rainfall would reduce evaporation rates and therefore impact production. If we experience heavy rainfall or low evaporation rates at any of our solar solution mines, we would have less potash available for sale, and our sales and results of operations would be adversely affected.
Inflows of water into our langbeinite mine from heavy rainfall or groundwater could result in increased costs and production downtime and could require us to abandon the mine, any of which could adversely affect our results of operations.
Major weather events such as heavy rainfall can result in water inflows into our underground, langbeinite mine. The presence of water-bearing strata in many underground mines carries the risk of water inflows into the mines. If we experience water inflows at our langbeinite mine, our employees could be injured and our equipment and mine shafts could be seriously damaged. We could be forced to shut down the mine temporarily, potentially resulting in significant production delays, and spend substantial funds to repair or replace damaged equipment. Inflows may also destabilize the mine shafts over time, resulting in safety hazards for employees and potentially leading to the permanent abandonment of the mine.
Environmental laws and regulations could subject us to significant liability and require us to incur additional costs.
We areroyalties is subject to many environmental, safety, and health laws and regulations, including laws and regulations relating to mine safety, mine land reclamation, remediation of hazardous substance releases, and discharges into the soil, air, and water.
Our operations, as well as those of our predecessors, have involved the use and handling of regulated substances, hydrocarbons, potash, salt, related potash and salt by-products, and process tailings. These operations resulted, or may have resulted, in soil, surface water, and groundwater contamination. At some locations, salt-processing waste, building materials (including asbestos-containing material), and ordinary trash may have been disposed of or buried in areas that have since been closed and covered with soil and other materials.
We could incur significant liabilities under environmental remediation laws such as CERCLA with regard to our current or former facilities, adjacent or nearby third-party facilities, or off-site disposal locations. Under CERCLA and similar state laws, in some circumstances liability may be imposed without regard to fault or legality of conduct and one party may be required to bear more than its proportional share of cleanup costs at a site. Liability under these laws involves inherent uncertainties.
We are also subject toperiodic audits by federal and state environmental laws that regulate dischargesofficials. The Office of pollutants and contaminants into the environment, such as the U.S. Clean Water Act and the U.S. Clean Air Act. For example, our water disposal processes rely on dikes and reclamation ponds that could breach or leak, resulting in a possible prohibited release into the environment. Moreover, although the North and East mines in New Mexico and the Moab mine in Utah are designated as zero discharge facilities under the applicable water quality laws and regulations, these mines could experience some water discharges during significant rainfall events.Natural Resources Revenue
We expect that we will be required to continue to invest in environmental controls at our facilities and that these expenses could be significant. In addition, violations
changes in the interpretation of environmental laws
modifications to current environmental laws
the issuance of more stringent environmental laws
malfunctioning process or pollution control equipment
The mining and processing of potash and langbeinite also generate residual materials that must be managed both during the operation of the facility and upon facility closure. For example, potash tailings, consisting primarily of salt, iron, and clay, are stored in surface disposal sites and require management. At least one("ONRR") completed their draft audit report of our New Mexico facilities,royalty reporting in September 2019. As of February 2024, we are continuing to progress on the HB mine, may have issues regarding leadaudit in the tailings pile as a result of operations conducted by previous owners. During the life of the tailings management areas, we have incurred and will continue to incur significant costs to manage potash residual materials in accordancecooperation with environmental laws and regulations and permit requirements.
As a potash producer, we currently are exempt from certain State of New Mexico mining laws related to reclamation obligations. If this exemption were to be eliminated or restricted, we could be required to incur significant expenses related to reclamation at our New Mexico facilities.
For more information about environmental, safety and health matters affecting our business, see "Business-Environmental, Safety, and Health Matters."ONRR.
Anti-corruption laws and regulations could subject us to significant liability and require us to incur costs.
As a result of our international sales, we are subject to the U.S. Foreign Corrupt Practices Act (the "FCPA") and other laws that prohibit improper payments or offers of payments to foreign governments and their officials for the purpose of obtaining or retaining business. Our international activities create the risk of unauthorized payments or offers of payments in violation of the FCPA or other anti-corruption laws by one of our employees, consultants, sales agents, or distributors even though these persons are not always subject to our control. Although we have implemented policies and training designed to promote compliance with these laws, these persons may take actions in violation of our policies. Any violations of the FCPA or other anti-corruption laws could result in significant civil or criminal penalties and have an adverse effect on our reputation.
The mining business is capital intensive,Risks Related to the Environment and Climate
Physical effects of climate change, and climate change legislation, could have a negative effect on us and our inabilitycustomers, and, in turn, our results of operations.
The impact of climate change on our operations and our customers’ operations remains variable and uncertain. The physical effects of climate change could have an adverse effect on us and our customers as experts believe that climate change may be associated with more extreme weather conditions. These effects could include, but may not be limited to, fund necessarychanges in regional weather patterns, including drought and rainfall levels, timing and duration of wintry precipitation and snow events, water availability, sea levels, storm patterns and intensities and temperature levels, including increased volatility in seasonal temperatures via excessively hot or desirable capital expenditurescold temperatures. These extreme weather conditions could vary by geographic location.
Severe climate change could have an adverse effect on our growthcosts, production, or sales, especially with respect to our solar operations, which require hot, arid summer weather conditions. Prolonged periods of precipitation or cooler weather during the evaporation season could reduce evaporation rates, leading to decreases in our production levels. Similarly, drought or decreased mountain snowfall and profitability.
associated freshwater run-off could change brine levels, impacting our mineral harvesting process at our Wendover facility. The mining business is capital intensive. We may find it necessary or desirableoccurrence of these events at our solar operations could lead to decreased production levels, increased operating costs and require us to make significant additional capital expendituresexpenditures. Furthermore, weather conditions have historically caused volatility in the futureagricultural industry and, as a result, in our results of operations, by causing crop failures or significantly reduced harvests, which can adversely affect application rates, demand for our products and our customers’ creditworthiness. Weather conditions can also lead to sustaindrought or expandwildfires, which could adversely impact growers’ crop yields and the uptake of our existing operationsproducts, which would reduce the need for application of our products for the following planting season, which could result in lower demand for our products and negatively impact the prices of our products. Finally, salt and magnesium chloride sales into the deicing market and our ability to utilize certain water rights for sale into oil and gas markets may not have,be adversely affected by weather conditions in our markets. Any prolonged change in weather patterns in our markets, as a result of climate change or have access to, the financial resources to pursue these expenditures. If costs associated with capital expenditures increase or if our earnings decrease significantly or we do not have access to the capital markets, weotherwise, could have difficulty funding any necessary or desirable capital expenditures at an acceptable rate or at all. This could limita material impact on the expansionresults of our productionoperations.
In recent years, the U.S. Congress considered legislation to reduce emissions of greenhouse gases (“GHGs”). Such initiatives could restrict our or our customers’ operations, require us or our customers to make it difficult forchanges in our respective businesses that would increase our operating costs, reduce our efficiency or limit our output, require us to sustainmake capital improvements to our facilities, increase our energy, raw material and transportation costs or limit their availability, or otherwise materially adversely affect our financial condition and results of operations. In addition, a number of states are addressing GHG emissions, primarily through the development of emission inventories or regional GHG cap and trade programs. Depending on the particular program, we and our customers could be required to control GHG emissions or to purchase and surrender allowances for GHG emissions resulting from our operations.
Independent of Congress, the Environmental Protection Agency ("EPA") has adopted regulations controlling GHG emissions under its existing operationsauthority under the CAA. For example, following its findings that emissions of GHGs present an endangerment to human health and the environment because such emissions contributed to warming of the earth’s atmosphere and other climate changes, the EPA has adopted regulations under existing provisions of the CAA that, among other things, establish construction and operating permit reviews for GHG emissions from certain large stationary sources that are already potential major sources for conventional pollutants. In addition, the EPA has adopted rules requiring the monitoring and reporting of GHG emissions from specified production, processing, transmission and storage facilities in the U.S. on an annual basis.
Further, in December 2015, over 190 countries, including the U.S., reached an agreement to reduce global GHG emissions, also known as the Paris Agreement. The Paris Agreement entered into force in November 2016 after more than 170 nations, including the U.S., ratified or otherwise indicated their intent to be bound by the agreement. After previously withdrawing, the U.S. rejoined the Paris Agreement in January 2021. The U.S. and other countries' actions to implement the
mandates of the Paris Agreement or otherwise impose regulations on our industry or our customers’ industries aimed at optimal levels. Increased costs for capital expendituresreducing GHG emissions could also have an adverse effect on our business.
It is possible that future legislation or regulation addressing climate change, including in response to the profitability of our existing operations and returns from our most recent strategic projects.
Market upheavals due to global pandemics, military actions, terrorist attacks,Paris Agreement or economic repercussions from those events could reduce our sales or increase our costs.
Global pandemics, actual or threatened armed conflicts, terrorist attacks, or military or trade disruptions affecting the areas where we or our competitors do business could disrupt the global market for potassium-based products. As a result, our
competitors may increase their sales efforts in our geographic markets and pricing of our products could suffer. If this occurs, we could lose sales to our competitors or be forced to lower our prices. In addition, due to concerns related to terrorism or the potential use of certain fertilizers as explosives, local, state, and federal governments could implementany new regulations impacting the production, transportation, sale, or use of potassium-based products. These new regulations could result in lower sales or higher costs.
A significant disruption to our information technology systemsinternational agreements, could adversely affect our businessoperations, energy, raw material and operating results.transportation costs, results of operations, liquidity or capital resources, and these effects could be material or adversely impact us. In addition, to the extent climate change restrictions imposed in countries where our competitors operate, such as Canada, Russia, and Belarus, are less stringent than in the U.S., our competitors could gain cost or other competitive advantages over us.
We have also made certain public statements regarding our commitment to the environment and our focus on protecting the environments, resources, and ecosystems surrounding our locations. Although we intend to work closely with communities and make it a priority to protect the natural resources surrounding our operation, we may be required to expend significant resources to do so, which could increase our operational costs. Further, there can be no assurance of the extent to which our goals will be achieved, or that any future investments we make in furtherance of achieving such target and goal will meet investor expectations or legal standards, if any, regarding sustainability performance. Moreover, we may determine that it is in the best interest of our Company and our stockholders to prioritize other business, social, governance or sustainable investments over the achievement of our current plans based on economic, technological developments, regulatory and social factors, business strategy or pressure from investors, activist groups or other stakeholders. If we are unable to meet these commitments, then we could incur adverse publicity and reaction from investors, activist groups or other stakeholders, which could adversely impact the perception of us and our products and services by current and potential customers, as well as investors, which could in turn adversely impact our results of operations. Failure to adapt to or comply with regulatory requirements or investor or stakeholder expectations and standards could negatively impact our reputation, ability to do business with certain partners, and harm our business.
Environmental laws and regulations could subject us to significant liability and require us to incur additional costs.
We are subject to many environmental, safety, and health laws and regulations, including laws and regulations relating to mine safety, mine land reclamation, remediation of hazardous substance releases, and discharges into the soil, air, and water.
Our operations, as well as those of our predecessors, have involved the use and handling of regulated substances, hydrocarbons, potash, salt, related potash and salt byproducts, and process tailings. These operations resulted, or may have resulted, in soil, surface water, and groundwater contamination. At some locations, salt-processing waste, building materials (including asbestos-containing material), and ordinary trash may have been disposed of or buried in areas that have since been closed and covered with soil and other materials.
We could incur significant liabilities under environmental remediation laws such as CERCLA due to the ownership or operations in our current or former facilities, adjacent or nearby third-party facilities, or off-site disposal locations. Under CERCLA and similar state laws, in some circumstances liability may be imposed without regard to fault or legality of conduct and one party may be required to bear more than its proportional share of cleanup costs at a site. Liability under these laws involves inherent uncertainties.
We are also subject to federal and state environmental laws that regulate discharges of pollutants and contaminants into the environment, such as the CWA and the CAA. For example, our water disposal processes rely on dikes and reclamation ponds that could breach or leak, resulting in a varietypossible prohibited release into the environment. Moreover, although the North and East mines in New Mexico and the Moab mine in Utah are designated as zero discharge facilities under the applicable water quality laws and regulations, these mines could experience some water discharges during significant rainfall events.
We expect that we will be required to continue to invest in environmental controls at our facilities and that these expenses could be significant. In addition, violations of information technologyenvironmental, safety, and automated operating systemshealth laws could subject us to managecivil and, in some cases, criminal sanctions. We could also be required to invest in additional equipment, facilities, or support our operations.employees, or could incur significant liabilities, due to any of the following:
•changes in the interpretation of environmental laws;
•modifications or amendments to current environmental laws;
•the issuance of more stringent environmental laws; and
•malfunctioning process or pollution control equipment.
The proper functioningmining and processing of these systems is critical topotash and langbeinite also generate residual materials that must be managed both during the efficient operation of the facility and managementupon facility closure. For example, potash tailings, consisting primarily of salt, iron, and clay, are stored in surface disposal sites and require management. At least one of our business. In addition, these systems could require modifications or upgrades as of a result of technological changes or growthNew Mexico facilities, the HB mine, may have issues regarding lead in our business. These changes could be costly and disruptive to our operations and could impose substantial demands on management time. Our systems, and those of third-party providers, also could be vulnerable to damage or disruption caused by catastrophic events, power outages, natural disasters, computer system or network failures, viruses or malware, physical or electronic break-ins, unauthorized access, and cyber-attacks. Although we take steps to secure our systems and electronic information, these cybersecurity measures may not be adequate. Any significant disruption to our systems could adversely affect our business, reputation, and operating results.
Our business may be adversely affected by union activities.
Hourly employees at our Wendover facility are represented by a labor union. These employees represent approximately 9% of our workforce. Our current collective bargaining agreement with the union expires on May 31, 2020. Although we believe that our relations with our unionized employees are good, we may not be successful in negotiating a new collective bargaining agreementtailings pile as a result of general economic, financial, competitive, legislative, political,previous owners' operations. During the life of the tailings management areas, we have incurred and other factors beyond our control. Any new agreementwill continue to incur significant costs to manage potash residual materials in accordance with environmental laws and regulations and permit requirements.
As a potash producer, we currently are exempt from certain State of New Mexico mining laws related to reclamation obligations. If this exemption were to be eliminated or restricted, we could result in abe required to incur significant increase in our labor costs. In addition, a breakdown in negotiations or failureexpenses related to timely enter into a new collective bargaining agreement could materially disrupt our Wendover operations.
From time to time, efforts have been made to unionize employeesreclamation at our otherNew Mexico facilities. Additional unionization efforts could disrupt
For more information about environmental, safety and health matters affecting our business, consume management attention, or increase our operating costs. In addition, if these efforts were successful, we could experience increased labor costs, an increased risk of work stoppages,see "Business-Environmental, Safety, and limits on our flexibility to run our business in the most efficient manner to remain competitive.
Health Matters."
Risks Related to our Common Stock
The price of our common stock may be volatile, and you could lose all or part of your investment.
The market price of our common stock has historically experienced, and may continue to experience, volatility. For example, during 2017,2023, the market price of our common stock ranged between $1.24$17.23 and $5.12.$34.51. These fluctuations may continue because of numerous factors, including, but not limited to, the following:
▪our operating performance and the performance of our competitorscompetitors;
▪the public's reaction to our press releases, other public announcements, or filings with the SECSEC;
▪changes in earnings estimates or recommendations by research analysts who follow us or other companies in our industryindustry;
▪variations in general economic, market, and political conditionsconditions;
▪changes in commodity prices or foreign currency exchange ratesrates;
▪substantial sales of common stock by us in connection with future acquisitions or capital raising activities;
▪actions of our current stockholders, including sales of common stock by our directors and executive officersofficers;
▪the arrival or departure of key personnelpersonnel;
▪other developments affecting us, our industry, or our competitorscompetitors; and
▪the other risks described in this reportAnnual Report.
Our financial position, cash flows, results of operations, and stock price could be materially adversely affected if commodity prices decline. In addition, in recent years the stock market has experienced extreme price and volume fluctuations. This volatility has had a significant effect on the market prices of securities issued by many companies for reasons unrelated to their operating performance. Our stock price may experience extreme volatility due to uncertainty regarding, among other things, commodity prices. These market fluctuations regardless of the cause, may materially and adversely affect our stock price, regardless of our operating results.
Our stock is currently listed on the New York Stock Exchange (“NYSE”).NYSE. For continued listing, we are required to meet specified listing standards, including a minimum stock price, market capitalization, and stockholders’ equity. If we are unable to
meet the NYSE’s listing standards including the requirement that our common stock continue to trade at over $1.00 per share, the NYSE would delist our common stock. At that point, it is possible that our common stock could be quoted on the over-the-counter bulletin board or the pink sheets. This could have negative consequences, including reduced liquidity for stockholders; reduced trading levels for our common stock; limited availability of market quotations or analyst coverage of our common stock; stricter trading rules for brokers trading our common stock; and reduced access to financing alternatives for us. We also would be subject to greater state securities regulation if our common stock was no longer listed on a national securities exchange. Volatility of our common stock may make it difficult for you to resell shares of our common stock when you want or at attractive prices.
The market price of our common stock may be adversely affected by the future issuance and sale of additional shares of our common stock including pursuant to our at-the-market offering program, or by ouran announcement that the issuances and sales may occur.occur, may adversely affect the market price of our common stock.
We cannot predict the size of future issuances or sales of shares of our common stock including those made pursuant to our at-the-market offering program or in connection with future acquisitions or capital raising activities, or the effect, if any, that the issuances or sales may have on the market price of our common stock. In addition, the sales agent for our at-the-market offering program will not engage in any transactions that stabilize the price of our common stock. The issuance and sale of substantial amounts of shares of our common stock including issuances and sales pursuant to our at-the-market offering program, or an announcement that the issuances and sales may occur, could adversely affect the market price of our common stock.
We do not anticipate paying cash dividends on our common stock.
We currently intend to retain earnings to reinvest for future operations and growth of our business and do not anticipate paying any cash dividends on our common stock. Accordingly, realization of any gain on our common stock will depend on the appreciation of the price of the shares of our common stock, which may never occur. However, our boardBoard of directors,Directors, in its discretion, may decide to declare a dividend at an appropriate time in the future, subject to the terms of our debt agreements.revolving credit agreement. A decision to pay a dividend would depend upon, among other factors, our results of operations, financial condition, and cash requirements and the terms of our debt agreementsrevolving credit agreement at the time a payment is considered.
Provisions in our charter documents and Delaware law may delay or prevent a third party from acquiring us.
We are a Delaware corporation and the anti-takeover provisions of Delaware law impose various barriers to the ability of a third party to acquire control of us, even if a change of control would be beneficial to our existing stockholders. In addition, our current certificate of incorporation and bylaws contain several provisions that may make it more difficult for a third party to acquire control of us without the approval of our boardBoard of directors.Directors. These provisions may make it more difficult or expensive for a third party to acquire a majority of our outstanding common stock. Among other things, these provisions provide for the following:provisions:
•allow our boardBoard of directorsDirectors to create and issue preferred stock with rights senior to those of our common stock without prior stockholder approval, except as may be required by NYSE rulesrules;
•do not permit cumulative voting in the election of directors, which would otherwise allow less than a majority of stockholders to elect director candidatescandidates;
•prohibit stockholders from calling special meetings of stockholdersstockholders;
•prohibit stockholders from acting by written consent, thereby requiring all stockholder actions to be taken at a meeting of our stockholdersstockholders;
•require vacancies and newly created directorships on the boardBoard of directorsDirectors to be filled only by affirmative vote of a majority of the directors then serving on the boardBoard;
•establish advance notice requirements for submitting nominations for election to the boardBoard of directorsDirectors and for proposing matters that can be acted upon by stockholders at a meetingmeeting; and
•classify our boardBoard of directorsDirectors so that only some of our directors are elected each yearyear.
These provisions also may delay, prevent, or deter a merger, acquisition, tender offer, proxy contest, or other transaction that might otherwise result in our stockholders receiving a premium over the market price of the common stock they own.
We may issue additional securities, including securities that are senior in right of dividends, liquidation, and voting to our common stock, without your approval, which would dilute your existing ownership interests.
Our boardBoard of directorsDirectors may issue shares of preferred stock or additional shares of common stock without the approval of our stockholders, except as may be required by NYSE rules. Our boardBoard of directorsDirectors may approve the issuance of preferred stock with terms that are senior to our common stock in right of dividends, liquidation, or voting. Our issuance of additional common shares or other equity securities of equal or senior rank will have the following effects:
•our pre-existing stockholders’ proportionate ownership interest in us will decreasedecrease;
•the relative voting strength of each previously outstanding common share may diminishdiminish; and
•the market price of the common stock may declinedecline.
If securities or industry analysts do not publish research or reports about our business, if they adversely change their recommendations regarding our stock, or if our operating results do not meet their expectations, our stock price could decline.
The trading market for our common stock may be influenced by the research and reports that industry or securities analysts publish about us or our business. If one or more of these analysts cease coverage of Intrepid or fail to publish reports on us regularly, we could lose visibility in the financial markets, which in turn could cause our stock price or trading volume to decline. Moreover, if one or more of the analysts who cover Intrepid downgrade our stock or if our operating results do not meet their expectations, our stock price could decline.
| |
ITEM 1B. | UNRESOLVED STAFF COMMENTS |
ITEM 1B.UNRESOLVED STAFF COMMENTS
None.
ITEM 1C.CYBERSECURITY
Cybersecurity Risk Management and Strategy
We take cybersecurity seriously and have developed a cybersecurity program that consists of processes, policies, and controls for assessing, identifying, managing, and responding to material risks from these threats. Our cybersecurity program is integrated within our broader risk management function that identifies, monitors, and mitigates business, operational, financial, and legal risks.
Our processes include controls that our Director of Information Technology and our Technology Department implement, which seek to protect our company, assets, information, and our employees from cyber threats, and provide regular education for our employees.
For example, as part of our cybersecurity program, we have implemented controls that are designed to prohibit unauthorized access to our systems. These include password requirements, onboarding and termination processes, multi-factor authentication, and other condition-based access controls. We also use external controls and security systems that identify and prevent malicious activity or unauthorized access on an ongoing basis such as firewalls, endpoint protection, intrusion detection, and email security, among others.
In addition, our intrusion detection systems identify patterns of behavior consistent with attack methods, as well as other anomalous behavior on our network. This technology acts autonomously to block activities deemed to be high risk. Our endpoint protection system is monitored twenty-four hours a day, seven days a week, by a third-party service provider who investigates every alert and remotely resolves issues such as removal of malware, blocking malicious activity, or by quarantining systems from the network if necessary.
We recognize that cybersecurity incidents are often a result of employees’ actions, including responding to phishing emails, opening malicious attachments, or visiting compromised websites. Therefore, another aspect of our cybersecurity program focuses on preventing such incidents by way of strong email security, web browsing protection systems, and by providing regular education and communication to our employees to increase their cybersecurity awareness of how to detect and respond to cyber threats. We periodically assess our employees’ awareness level of these risks by conducting periodic phishing tests.
In the event of an incident, meaning a compromise is not contained by our security systems and has the potential to adversely impact the organization, we have a structured Incident Response Plan in place that is based on National Institute of Standards and Technology (NIST) guidelines that provide rules for communicating incidents to management based on defined categorizations of the incident, as well as an orderly process for addressing and documenting the incident. As part of our business continuity and disaster recovery strategy, we have a strong backup and off-site data replication process, including an air-gap data vault solution for replication of backups of critical systems. Restorations from these systems are tested on a quarterly basis.
We use external third parties to perform annual security assessments such as penetration testing and vulnerability scans for both our internal network and critical online systems. We currently do not have any formal processes to oversee or identify cybersecurity risks associated with third-party service providers but our Director of Information Technology generally evaluates such risks.
Governance
Our Board of Directors, in coordination with the Audit Committee, oversees our risk management program, including the management of cyber threats. The Board of Directors and senior management are actively involved in reviewing our information security and cybersecurity strategies and updating as risks evolve.
Our Board of Directors and our Audit Committee each receive annual presentations and reports from our Director of Information Technology on developments in the cybersecurity space, including risk management practices, evolving standards, vulnerability assessments, third-party and independent reviews, the threat environment, technological trends, and information security issues encountered by our peers and third parties. In addition, on an annual basis, our Board of Directors and the Audit Committee discuss our approach to overseeing cybersecurity threats with our Director of Information Technology and other members of senior management to better assess our approach to cyber threats.
When a threat or other issue is identified, our Director of Information Technology will notify the senior management team and initiate the appropriate response plan based on the criticality of the threat or issue. Our Director of Information Technology along with our management team, which includes our Chief Executive Officer, Chief Financial Officer, and General Counsel, will coordinate to execute the appropriate response plan and will also investigate any issue to determine whether an incident is material, requiring disclosure to shareholders in SEC filings. Our Board of Directors and our Audit Committee also receive prompt and timely information regarding any cybersecurity risk and ongoing updates regarding any such risk.
Our Director of Information Technology has thirty years of experience in information technology, which includes the past nineteen years managing Intrepid's information technology infrastructure, business applications, compliance programs, and cybersecurity systems. Although our management team and Audit Committee receive information regarding our cybersecurity program and help assess our strategy based on their knowledge of our business and industry, no member of the management team or Audit Committee has technology or cybersecurity expertise. Certain members of the Audit Committee have experience with cybersecurity programs and implementing cybersecurity procedures as leaders of businesses and through their service on other boards. Risks from cybersecurity threats have not materially affected our company, including our business strategy, results of operations, or financial condition. While we believe our approach to cybersecurity is reasonable, given the rapidly evolving nature of cybersecurity incidents, there can be no assurance that the controls we have designed and implemented will be sufficient in preventing future incidents or attacks.
Overview of Properties
Our extraction and production operations are conducted entirely in the continental U.S. We produce potash atfrom three solution mining facilities: our HB solution mine in Carlsbad, New Mexico, aour solution mine in Moab, Utah and aour brine recovery mine in Wendover, Utah. Additionally, weWe also operate our North compaction facility in Carlsbad, New Mexico, which compacts and granulates product from the HB mine. We produce Trio® from our conventional underground East mine in Carlsbad, New Mexico. We also have the West facility, which is a conventional underground potash mine that is not in operation and is in care-and-maintenance mode.
We control the rights to mine approximately 138,000operate Intrepid South located in Lea County in southeastern New Mexico, which is comprised of 21,834 surface acres, 27,858 acres of land northeastBLM grazing leases and 10,400 acres of Carlsbad, New Mexico. We lease approximately 32,000 acres from thepending State of New Mexico approximately 106,000 acres from the U.S. government through the BLM, and approximately 240 acres from private leaseholders. We own approximately 4,700 surface acres in the vicinity of our mine sites and adjacent to federal and state mininggrazing leases.
We control the rights to mine approximately 10,300 acres of land west of Moab, Utah. We lease approximately 10,100 acres from the State of Utah and approximately 200 acres from the BLM. We own approximately 3,700 surface acres overlying and adjacent to portions of our mining leases with the state of Utah.
We control the rights to mine approximately 90,000 acres of land near Wendover, Utah. We own approximately 57,000 acres, and we lease approximately 8,000 acres from the State of Utah and approximately 25,000 acres from the federal government through the BLM.
We conduct most of our mining operations on properties that we lease from states or the state or federal government. These leases generally contain stipulations that require us to commence mining operations within a specified term and continue mining to retain the lease.
The stipulations on our leases are subject to periodic readjustment by the applicable state government and the federal government. The lease stipulations could change in the future, which could impact the economics of our operations. Our federal leases are for indefinite terms subject to readjustment of the lease stipulations, including the royalty payable to the federal government, every 20 years. Our leases with the State of New Mexico are issued for terms of ten10 years and for as long thereafter as potash is produced in commercial quantities and are subject to readjustment of the lease stipulations, including the royalty payable to the state. Our leases with the State of Utah are for terms of ten10 years subject to extension and possible readjustment of the lease by the State of Utah. Our leases for our Moab mine are operated as a unit under a unit agreement with the State of Utah, which extends the terms of all of the leases as long as operations are conducted on any portion of the leases. The term of the state leases for our Moab mine is currently extended until 2024 or so long as potash is being produced. Our federal leases are for indefinite terms subject to readjustment every 20 years. As of December 31, 2017,2023, approximately 22%17% of our state, federal, and private lease acres at our New Mexico facilities will be up for renewal within the next five years. Only 0.2%years, and 22% of our state and federal lease acres at our Utah operations will be up for renewal within the next five years.
We have water rights at eachThe following tables provide a summary of our mine properties that we believe are adequate for our needs. All of our mining operations are accessible by paved state or county highwaysmineral resources and are accessible by rail. All of our operations obtain electric power from local utilities.
Our mines, plants, and equipment have been in substantially continuous operation since the dates indicatedreserves. Additional information is provided in the chart entitled "Our ProvenIndividual Property Disclosures below.
| | | | | | | | | | | | | | | | | | | | | | | | | | | | | | | | | | | | | | | | | | | | | | | | | | |
| Summary of Mineral Resources in Millions of Tons of Sylvinite and Langbeinite as of December 31, 2023. Based on $450/potash product ton mine site and $470/langbeinite product ton mine site. |
| | Measured Mineral Resources | | Indicated Mineral Resources | | Measured + Indicated Mineral Resources | | Inferred Mineral Resources |
| | Amount (Mt) | | Grade (%K2O) | | Amount (Mt) | | Grade (%K2O) | | Amount (Mt) | | Grade (%K2O) | | Amount (Mt) | | Grade (%K2O) |
| Sylvinite | | | | | | | | | | | | | | | | |
| New Mexico | | | | | | | | | | | | | | | | |
| IPNM | | 289.0 | | 16.0 | | 164.0 | | 14.0 | | 453.0 | | 15.0 | | — | | — |
| Utah | | | | | | | | | | | | | | | | |
| Moab | | 97.0 | | 26.0 | | 190.0 | | 25.0 | | 287.0 | | 25.0 | | 38.0 | | 23.0 |
| Wendover | | — | | — | | 175.0 | | 0.5 | | 175.0 | | 0.5 | | 1,358.0 | | 0.5 |
| Total | | 386.0 | | 18.5 | | 529.0 | | 13.5 | | 915.0 | | 15.6 | | 1,396.0 | | 1.1 |
| | | | | | | | | | | | | | | | |
| Langbeinite | | | | | | | | | | | | | | | | |
| New Mexico | | | | | | | | | | | | | | | | |
| IPNM | | 72.0 | | 10.0 | | 60.0 | | 10.0 | | 132.0 | | 10.0 | | — | | — |
| Total | | 72.0 | | 10.0 | | 60.0 | | 10.0 | | 132.0 | | 10.0 | | — | | — |
| | | | | | | | | | | | | | | | | | | | | | | | | | | | | | | | | | | | | | | | | | | | | | | | | | |
| Summary of Mineral Resources in Millions of Tons of Sylvinite and Langbeinite as of December 31, 2022. Based on $406/potash product ton mine site and $425/langbeinite product ton mine site. |
| | Measured Mineral Resources | | Indicated Mineral Resources | | Measured + Indicated Mineral Resources | | Inferred Mineral Resources |
| | Amount (Mt) | | Grade (%K2O) | | Amount (Mt) | | Grade (%K2O) | | Amount (Mt) | | Grade (%K2O) | | Amount (Mt) | | Grade (%K2O) |
| Sylvinite | | | | | | | | | | | | | | | | |
| New Mexico | | | | | | | | | | | | | | | | |
| IPNM | | 370.0 | | 15.0 | | 200.0 | | 14.0 | | 570.0 | | 14.6 | | — | | — |
| Utah | | | | | | | | | | | | | | | | |
| Moab | | 113.0 | | 26.0 | | 190.0 | | 25.0 | | 303.0 | | 25.4 | | 38.0 | | 23.0 |
| Wendover | | — | | — | | 250.0 | | 0.5 | | 250.0 | | 0.5 | | 1,360.0 | | 0.5 |
| Total | | 483.0 | | 17.6 | | 640.0 | | 12.0 | | 1,123.0 | | 14.4 | | 1,398.0 | | 1.1 |
| | | | | | | | | | | | | | | | |
| Langbeinite | | | | | | | | | | | | | | | | |
| New Mexico | | | | | | | | | | | | | | | | |
| IPNM | | 50.0 | | 10.0 | | 60.0 | | 10.0 | | 110.0 | | 10.0 | | — | | — |
| Total | | 50.0 | | 10.0 | | 60.0 | | 10.0 | | 110.0 | | 10.0 | | — | | — |
The material assumptions and Probable Reserves" oncriteria used for the following pages (except for our West facility, which is currentlymineral resource estimates are discussed in care-and-maintenance mode), and our mineral development assets, mills, and equipment have been acquired overmore detail in Section 11 of the interval since these dates.respective Technical Report Summaries filed as Exhibits 96.1 through 96.3 to this Annual Report.
| | | | | | | | | | | | | | | | | | | | | | | | | | | | | | | | | | | | | | | | | | | | | | | | | | | | | | | | | | | | | | | | | | | | | | | | | | |
| Summary of Mineral Reserves in Millions of Product Tons of Potash as of December 31, 2023, and 2022. Based on $360/potash product ton mine site for 2023, and $325/potash product ton mine site for 2022. |
| | Proven Mineral Reserves | | Probable Mineral Reserves | | Total Mineral Reserves |
| | Amount (Mt) | | In Situ Grade (%K2O) | | Amount (Mt) | | In Situ Grade (%K2O) | | Amount (Mt) | | In Situ Grade (%K2O) |
| | 2023 | | 2022 | | 2023 | | 2022 | | 2023 | | 2022 | | 2023 | | 2022 | | 2023 | | 2022 | | 2023 | | 2022 |
| Sylvinite | | | | | | | | | | | | | | | | | | | | | | | | |
New Mexico1 | | | | | | | | | | | | | | | | | | | | | | | | |
| IPNM | | 4.0 | | 4.3 | | 22.9 | | 21.7 | | — | | 0.2 | | — | | 19.1 | | 4.0 | | 4.5 | | 22.9 | | 21.6 |
| Utah | | | | | | | | | | | | | | | | | | | | | | | | |
Moab1 | | 2.3 | | 1.8 | | 28.3 | | 27.2 | | 0.3 | | 0.6 | | 28.9 | | 27.8 | | 2.6 | | 2.4 | | 28.4 | | 27.3 |
Wendover2 | | — | | — | | — | | — | | 1.7 | | 1.7 | | 0.5 | | 0.5 | | 1.7 | | 1.7 | | 0.5 | | 0.5 |
| Total | | 6.3 | | 6.1 | | 25.3 | | 23.3 | | 2.0 | | 2.5 | | 5.9 | | 8.5 | | 8.3 | | 8.6 | | 20.0 | | 19.0 |
| | | | | | | | | | | | | | | | | | | | | | | | |
1 - In situ grade corresponds to the amount of K2O in the contact area of the caverns |
2 - In situ grade corresponds to the amount of K2O in the brines |
| | | | | | | | | | | | | | | | | | | | | | | | | | | | | | | | | | | | | | | | | | | | | | | | | | | | | | | | | | | | | | | | | | | | | | | | | | |
| Summary of Mineral Reserves in Millions of Product Tons of Langbeinite as of December 31, 2023, and 2022. Based on $340/langbeinite product ton mine site for 2022. |
| | Proven Mineral Reserves | | Probable Mineral Reserves | | Total Mineral Reserves |
| | Amount (Mt) | | In Situ Grade (%K2O) | | Amount (Mt) | | In Situ Grade (%K2O) | | Amount (Mt) | | In Situ Grade (%K2O) |
| | 2023 | | 2022 | | 2023 | | 2022 | | 2023 | | 2022 | | 2023 | | 2022 | | 2023 | | 2022 | | 2023 | | 2022 |
| Langbeinite | | | | | | | | | | | | | | | | | | | | | | | | |
New Mexico1 | | | | | | | | | | | | | | | | | | | | | | | | |
| IPNM | | — | | 4.6 | | — | | 8.6 | | — | | 1.2 | | — | | 9.1 | | — | | 5.8 | | — | | 8.7 |
| Total | | — | | 4.6 | | — | | 8.6 | | — | | 1.2 | | — | | 9.1 | | — | | 5.8 | | — | | 8.7 |
1 - In situ grade corresponds to the amount of K2O in the langbeinite ore |
We are not reporting any langbeinite reserves as of December 31, 2023, only langbeinite resources because, in the opinion of the Qualified Person, none of the langbeinite resources are economically mineable.
As noted, we have relatively long-lived proven and probable potash reserves and consequently expect to conduct limited and focused additional exploration in the coming five years. We plan to drill core holes in areas near our Carlsbad, New Mexico, facility, in order to further define the ore body. Development of the underground mines is expected to be coincident with the continued advancement of ore zones. Development of the solution mine and brine evaporation operations is expected to be enhanced by the drilling of additional wells and flooding of new solution mine caverns. Although not in our current plans, we also have opportunities to rehabilitate the shafts at the currently idled North mine and additional surface infrastructure to accelerate mining of conventional reserves.
Our leased office space in Denver, Colorado, is approximately 25,50026,000 square feet and has a term extending through Marchexpiring on January 31, 2019.2025. We lease approximately 1,400 square feet of office space in Albuquerque, New Mexico, which has a term expiring on May 31, 2027.
We believe that all of our present facilities are adequate for our current needs and that additional space is available for future expansion on acceptable terms.
Individual Property Disclosure - New Mexico ProvenOverview
Our New Mexico operations ("IPNM") consists of our HB Solar Solution, East, West, and ProbableNorth Mines and are located in southeastern New Mexico in Eddy and Lea Counties in the Carlsbad Potash District ("CPD"). The location is further defined by the boundary of the Known Potash Leasing Area ("KPLA"). This BLM managed area consists of that part of the KPLA where the co-development guidelines for oil and gas and potash are in effect for federal lands under the 2012 Secretary's Order issued on December 4, 2012. The 2012 Secretary's Order revises and supersedes a previous Order issued in 1986 and corrected in 1987. The 2012 Secretary’s Order does not alter the boundaries of the area. The area also contains state lands that are managed by the State of New Mexico under the New Mexico Oil Conservation Division Order R‐111‐P ("R-111-P"). In general, the stated objective of the 2012 Secretary’s Order and R‐111‐P is to prevent waste of petroleum and mineral resources and maximize the economic recovery of oil, gas, and potash minerals in the area.
The geology of the potash‐bearing beds of the Carlsbad area is well documented. Overall, the potash‐bearing beds may be described as bedded sedimentary rocks, deposited across the Delaware Basin and Northwest Shelf backreef from the Capitan Reef. The Carlsbad area falls within the Delaware Basin, part of the Permian Basin. The Delaware Basin has a maximum width of approximately 100 miles and a length of approximately 150 miles, extending from north of Carlsbad, New Mexico, to Pecos County, Texas.
The Permian Age sequence comprises the Ochoan, Guadalupe, Leonard, and Wolfcamp series in order of increasing age. Laterally extensive, evaporite beds containing deposits of halite, sylvite, langbeinite, kainite, carnallite, and other evaporite minerals are found within the Ochoan Series, whose top ranges from a depth of 2,000 feet near the Texas State line to approximately 200 feet below surface north of Carlsbad. Mining occurs in the Salado Formation which contains 12 potash ore zones, of which six have been or are currently being mined.
Sylvinite is currently being mined using solution methods in the 1st and 3rd ore zone. Historically, sylvinite has been conventionally underground mined in the 1st, 3rd, 5th, 7th, and 10th ore zones. Mechanical mining of langbeinite is currently occurring in the 3rd and 5th ore zones at the East Mine. Langbeinite is prevalent in the 3rd and 4th ore zones in the southern part of the Delaware Basin, and occurs mixed with sylvite in the 5th ore zone.
The property includes two operating mines, the East Underground and HB Solution Mines, one idled mine, the West Mine and the North Mine which was shut down in the early 1980’s. The property is located in Eddy and Lea Counties, near Carlsbad, New Mexico.
The two mining methods currently in practice at IPNM are high‐extraction mechanical underground room‐and‐pillar mining and solution mining. Mechanical mining is well suited to bedded deposits. All potash production at IPNM comes from the HB Solar Solution Mine in the 1st and 3rd ore zones. Trio® production is from langbeinite mined using room‐and‐pillar mechanical mining methods at the East Mine in the 3rd, 4th, and 5th ore zones. Historically, potash was sourced from the West Mine 5th, 7th, and 10th ore zones. Approximately 300 people are employed at IPNM.
The IPNM properties are pledged as collateral for our revolving credit facility. During 2023, we recorded impairment charges of $41.8 million related to our IPNM material properties. After the impairment, at December 31, 2023 the net book value of our IPNM material properties was $175.2 million. Various surety bonds are currently in place for approximately $6.2 million.
IPNM has all necessary operating permits and is in production, both underground and solution mining, and through permit reporting maintains environmental compliance. Environmental studies are conducted for major project expansions and modifications to any operations. The most recent Environmental Audit was completed in 2015 for the expansion of the HB In Situ Solution Mining project to include the solution mining of the abandoned AMAX potash mine. The work referenced the initial Environment Impact Study ("EIS") for the HB In Situ Solar Solution Mining Project.
East Mine and Plant
The East Mine is a high‐extraction, mechanical room‐and‐pillar mine. Potash was the primary product extracted from the mine until mining progressed to the mixed langbeinite and potash ore in the 5th ore zone. The mixed ore was processed into two products: potash sourced from the sylvinite portion of the mixed ore, and Trio® sourced from the langbeinite portion of the mixed ore. The East Mine plant was converted to a langbeinite‐only operation in April 2016 and potash is no longer produced from the East Mine. The maximum productive capacity of the plant is 400,000 tons of Trio® concentrate annually.
There are five active sections within the East Mine, the operations of which consist of miner and shuttle car loading onto a belt conveyor. Each mining section produces approximately 240,000 tons of run‐of‐mine ore each year. The long‐range production balanced with sales projections results in a long‐term annual production of 1.2 million tons of ore for 250,000 tons of Trio® annually.
During 2003 and 2004, we modified the East Plant to allow dual processing to recover the K2O value from both the sylvite and langbeinite fractions of the ore. Langbeinite, marketed as Trio®, is recovered using dense media separation and a fine langbeinite recovery circuit. Currently approximately one million tons per year of ore is processed at a rate of 300 tons per hour. The ore is crushed, screened, pulped, and rescreened. Coarse material is forwarded to the dense media separation ("DMS") circuit. The DMS concentrate is water leached, debrined, and dried. We separate the coarse product into the three Trio® products. We recover fine material from the screening process using gravity separation, leaching, debrining, and drying. We upgrade fine material to premium product using pelletization.
HB Mine and Plant
Historical room‐and-pillar mining operations at the HB complex recovered about 70% of the ore, leaving approximately 30% of the ore available for secondary recovery in pillars plus what can be recovered beyond the limits of the conventional mine works. Mining at the HB Solar Solution Mine recovers potash by injecting saturated saline NaCl brine into the old mine works to create underground leach lakes. Over time, the solution enriched with potash is pumped to the surface to solar evaporation ponds. Selective solar evaporation leaves behind a potash‐enriched salt that is collected using scrapers, pumped, and processed at the HB Plant. The solution mine comprises six injection wells, five extraction wells, and three monitoring wells.
In 2012, IPNM commenced filling the HB solar evaporation ponds. The extraction brine sourced from the mined‐out areas of the 1st ore zones of the former underground workings of portions of HB Eddy, HB South, HB North, and HB Crescent, collectively referred to as the HB Mine, contains approximately 21.7% NaCl and 7.0% KCl. The brine is collected and crystallized in 18 solar evaporation ponds. The HB flotation mill processes the harvested potash and salts from the solar evaporation ponds. Following the separation of KCl, the HB Solar Solution Mine also recovers significant quantities of NaCl.
The North Plant provides classification, compaction, quality control, and load‐out services for production from the HB Solar Solution Mine. Belly dump trucks unload HB product into a dump pocket. We then send the material to surge bins. The product is screened, preheated, weighed, and sent to a compactor feed bin. Material is fed to the roll compactor, and resulting flakes are further reduced in size with the subsequent flake breaker and crusher. Product is then screened and sent to the curing dryer and screened once again before being sent to final product storage. The product is shipped to market in trucks or rail cars.
West Mine
The West Mine is a high‐extraction, mechanical room‐and‐pillar mine that was idled in July 2016 and placed in care‐and‐maintenance mode. The mine was last operated in the 5th, 7th, and 10th ore zones.
North Mine and Compaction Plant
The North Mine operated from 1957 to 1982 when it was idled, mainly due to low potash prices and a change in the mineralogy of the readily accessible remaining reserves which negatively impacted mineral processing. Although the mining and processing equipment has been removed, the mine shafts remain open. The compaction facility at the North Mine is where the HB potash product is granulated, stored, and shipped. The North Facility receives compactor feed from the HB Solar Solution Mine via truck and converts the compactor feed to finished granular‐sized product and standard‐sized product.
We anticipate the need to construct a new sylvite processing facility to handle the higher insoluble and higher carnallitic ores that are contained in the 8th and 10th ore zones. A new processing plant is expected to have a plant recovery of
75%, which is supported by the metallurgical test work done on the 10th ore zone ore by Tetra Tech in 2009 in support of Phase 1 of the North Mine Reopening Feasibility Study.
Leases and Permits
We control the right to mine approximately 143,000 acres in New Mexico. Of that acreage, we lease 32,000 acres from the State of New Mexico, 106,000 acres from the federal government through the Bureau of Land Management (“BLM”), and 280 acres from private owners. We own 4,700 surface acres near the mine site, adjacent to the federal and state mining leases. Most mining operations are on properties leased from the State of New Mexico or the federal government. These leases generally contain stipulations that require us to commence mining operations within a specified term and to continue mining to retain the lease. The stipulations on our leases are subject to periodic readjustment by the State of New Mexico and the federal government. Federal leases are for indefinite terms subject to readjustment of the lease stipulations, including the royalty payable to the federal government, every 20 years. Royalty payments equal a percentage of product sales less freight. Most of our leases with the federal government stipulate a five percent royalty rate. However, certain federal leases contain a sliding scale royalty rate of a minimum of two percent and up to a maximum of five percent based on the grade of ore extracted under the lease. In 2023, IPNM paid royalties of $5.9 million to the federal government.
Our leases with the State of New Mexico are issued for terms of 10 years and for as long thereafter as potash is produced in commercial quantities and are subject to readjustment of the lease stipulations, including the royalty payable to the state. Royalty payments equal a percentage of product sales less freight. Our leases with the State of New Mexico stipulate a five percent royalty rate. In 2023, IPNM paid royalties of $1.8 million to the State of New Mexico.
History of Operations
Potash was first discovered in southwest New Mexico in 1925 in Eddy County, New Mexico, in Snowden McSweeney Well No. I on a V. H. McNutt permit near the center of the portion of the KPLA. Commercial potash shipments began in 1931. The mines have had numerous owners beginning with the U.S. Potash Company’s ownership of the West Mine from 1929 to 1956. Intrepid Mining, the predecessor to Intrepid, acquired the mines, excluding the Amax Mine, from Mississippi Potash, Inc. in 2004. Intrepid acquired the lease to the Amax Mine in 2012. A full ownership history for each mine is included in Section 5 of the technical summary report in Exhibit 96.1 to this Annual Report.
Mineral Resource and Reserves Comparison to Prior Year
We engaged RESPEC, a qualified firm and independent of Intrepid, to prepare a technical report summary for our IPNM material properties as of December 31, 2023 because changes in our cost of production resulted in material changes in the mineral reserves and mineral resources estimates from the revised technical report summary prepared as of December 31, 2021 for the New Mexico properties. As of December 31, 2023, we no longer show mineral reserves for our East mine because, in the opinion of the Qualified Person, none of the langbeinite resources are economically mineable. The technical report summary for the IPNM material properties as of December 31, 2023 is included with this Annual Report on Form 10-K.
Mineral Resource and Reserves
Overview
We continue ongoing exploration as a part of our operational long‐term planning. Exploration includes the drilling of core holes from the surface and underground, and the collection of channel samples, which are collected as mining advances. We provided RESPEC their dataset beginning in 2007. Since that time, we have added multiple data points by reassessing several drillholes. Our potash (producedreserves are also identified from sylvite ore)gamma ray geophysical logs in oil and langbeinite (marketedgas wells. We estimate and quantify bed thickness and potash grade with input from 2,928 sample points. Extensive work was completed with geophysical tools in collaboration with the United States Geologic Survey ("USGS") to determine and verify potash grades from gamma logs. The dataset is from oil and gas wells, surface core holes, underground core holes, channel samples, shaft samples, and roof bolt holes. The key sample types include 7,209 drillholes and channel samples and are broken down by mining zone.
The characterization of the hydrogeology was completed for the HB In Situ Solution Mine by AECCOM in 2011 and is included as Trio®) reserves each have substantial life, with remaining reserve lifepart of the publicly available EIS. The study confirmed the availability of water for the initial flooding of the solution mines at a pumping rate ranging from 14 years177 to over 100 years, based1,440 gallons per minute.
Mineral Resource
The exploration drillhole and channel sample data were compiled to form the database, which serves as the basis for estimating the resources. As part of evaluating the mineral resource, we evaluated and reviewed the geologic setting and bed assignments. Of the data within the lease boundary, all data points contribute bed thickness, and several have assay information. The geology was modeled using Carlson Software (2020). A basic inverse distance squared algorithm was used with a search
radius of ¾ mile to prepare the 100‐foot by 100‐foot grids for bed thickness and grade. The search radius was applied for Measured and Indicated Resources of ¼ mile and ¾ mile, respectively. Where data is dense, the nearest 25 data points were used to assign values for the grid block. The grids were multiplied by each other to compile a grade‐thickness ("GT") grid within the lease boundaries held by IPNM. The base grid was adjusted for each ore type cutoff. Key assumptions and parameters for resource estimation are listed in the tables below.
The classification of cutoff in terms of GT in units of feet-percent was defined in the Secretaries Order dated October 21, 1986 for mechanically mined potash deposits. The criteria are not dependent on proventhickness or grade, but on the product of the thickness and probablegrade. To evaluate the viability of mining the IPNM mechanically mined resources, a break‐even cutoff GT was established. Inputs to the estimation of the break‐even cutoff analysis are cost of goods sold, product sale price, mill recovery, and nominal grade.
The cutoff for solution mining in flooded abandoned underground potash mines is a function of the grade of the brine being extracted which results in enough product tons to cover the cost of production. The cutoff grade for resources of abandoned underground sylvinite is not a parameter for use in the estimation of solution mining resources but does establish an operational minimum limit for the brine grade reserves. The solution mining resources are the pillars remaining after mining and the fringe boundary of the mine. Resources could also be unmined ore left behind to provide geotechnical support. An operational limit of the flood elevation establishes the cutoff between resource and reserve for this deposit. When mining using solution methods in proximity to other mines, or other underground mines not within the control of IPNM, the critical factor in establishing a flood elevation is to keep adjoining properties dry or to protect structures such as shafts.
| | | | | | | | | | | | | | | | | | | | | | | | | | | | | | | | |
| IPNM—Summary Mineral Resources in Millions of Tons of Sylvinite effective December 31, 2023. Based on $450/product ton mine site. |
| | Resources | | Mechanical Mining Cutoff 2 (ft%K2O) | | Processing
Recovery (%) |
| | Sylvinite 1 (Mt) | | Grade (%K2O) | | Contained K2O (Mt) | | |
| | | | | |
| Measured mineral resources | | 289 | | 16 | | 45 | | 54-64 | | 75-85 |
| Indicated mineral resources | | 164 | | 14 | | 24 | | 54-64 | | 75-85 |
| Measured + Indicated resources | | 453 | | 15 | | 69 | | | | |
| Inferred mineral resources | | — | | — | | — | | | | |
| | | | | | | | | | |
| IPNM—Summary Mineral Resources in Millions of Tons of Sylvinite effective December 31, 2022. Based on $406/product ton mine site. |
| | Resources | | Mechanical Mining Cutoff 2 (ft%K2O) | | Processing
Recovery (%) |
| | Sylvinite 1 (Mt) | | Grade (%K2O) | | Contained K2O (Mt) | | |
| | | | | |
| Measured mineral resources | | 370 | | 15 | | 56 | | 45-59 | | 75-85 |
| Indicated mineral resources | | 200 | | 14 | | 29 | | 45-59 | | 75-85 |
| Measured + Indicated resources | | 570 | | 15 | | 85 | | | | |
| Inferred mineral resources | | — | | | | — | | | | |
1 Sylvinite is a mixed evaporite containing NaCl and KCl. |
2 Solution mining resource cutoff for flooded old working is the mining extents boundary. |
| Mineral Resources were prepared by RESPEC, a qualified firm for the estimate and independent of Intrepid. |
| Mineral Resources are reported exclusive of Mineral Reserves. |
| Mineral Resources are reported using Inverse Distance Squared estimation methods. |
Mt = million tons, % = percent K2O = potassium oxide, ft = feet |
|
| | | | | | |
| | | | | | | | | | |
| | | | | | | |
| | | | | |
| | | | | | | | | | |
| | | | | | | | | | |
| | | | | | | | | | |
| | | | | | | | | | |
|
|
|
|
|
|
| | | | | | | | | | | | | | | | | | | | | | | | | | | | | | | | |
| IPNM—Summary of Mineral Resource in Millions of Tons of Langbeinite Mineralized Rock in Place effective December 31, 2023. Based on $470/product ton mine site. |
| | Resources | | Mechanical Mining Cutoff (ft%K2O) | | Processing
Recovery (%) |
| | Langbeinite Mineralized Rock (Mt) | | Grade (%K2O) | | Contained K2O (Mt) | | |
| | | | | |
| | | | | | | | | | |
| Measured mineral resources | | 72 | | 10 | | 7 | | 25 | | 68 |
| Indicated mineral resources | | 60 | | 10 | | 6 | | 25 | | 68 |
| Measured + Indicated resources | | 132 | | 10 | | 13 | | | | |
| Inferred mineral resources | | — | | — | | — | | | | |
| | | | | | | | | | |
| IPNM—Summary of Mineral Resource in Millions of Tons of Langbeinite Mineralized Rock in Place effective December 31, 2022. Based on $425/product ton mine site. |
| | Resources | | Mechanical Mining Cutoff (ft%K2O) | | Processing
Recovery (%) |
| | Langbeinite Mineralized Rock (Mt) | | Grade (%K2O) | | Contained K2O (Mt) | | |
| | | | | |
| Measured mineral resources | | 50 | | 10 | | 5 | | 32 | | 68 |
| Indicated mineral resources | | 60 | | 10 | | 6 | | 32 | | 68 |
| Measured + Indicated resources | | 110 | | 10 | | 11 | | | | |
| Inferred mineral resources | | — | | | | — | | | | |
| Mineral Resources were prepared by RESPEC, a qualified firm for the estimate and independent of Intrepid. |
| Mineral Resources are reported exclusive of Mineral Reserves. |
Mt = million tons, % = percent, K2O = potassium oxide, ft = feet |
The material assumptions and criteria used for the IPNM mineral resource estimates are discussed in more detail in Section 11 of the Technical Report Summary in Exhibit 96.1 to this Annual Report.
Mineral Reserve
Mineral reserves that are to be mined using mechanical methods are estimated by the application of a detailed mine plan for the measured and indicated resources within the boundaries of the cutoff GT for reserves. The plan sets the basis for the estimation of annual production of product. The income from product sales and the operating and capital costs to mine the resource is fundamental to the cash flow used to establish economic viability.
Mineral reserves that are mined using solution mining methods are not subject to the traditional application of a cutoff grade, and instead operational limitations are considered. An operational limit of the flood elevation establishes the cutoff between resource and reserve for this deposit.
By definition, modifying factors are the factors applied to indicated and measured mineral resources and then evaluated in accordance with SEC requirements. This lasting reserve base isorder to establish the resulteconomic viability of our past acquisitionmineral reserves. These factors for IPNM include mechanical and development strategy. The estimates of our provensolution mining parameters; mineral processing; oil and probablegas drill islands and well locations; economic cutoff GT; deleterious minerology; and lease boundaries.
Mechanically Mined Reserves
We are not reporting any langbeinite reserves as of December 31, 2017, were prepared by us2023, only langbeinite resources because, in the opinion of the Qualified Person, none of the langbeinite resources are economically mineable. Modeling indicates a cutoff of 64 feet-percent K2O for the high‐insoluble sylvinite resources in the 8th and were reviewed10th ore zones, which requires the capital investment of a new plant and independently determined by Agapito Associates, Inc. ("Agapito") based onrefurbishment of shafts. A cutoff of 54 feet-percent K2O is indicated for the West Mine sylvinite resources which requires the processing plant, mine plans and other data furnished by us as described in footnote one below the table. The following table summarizes our proven and probable reserves, stated as product tonsequipment, and associated percent ore grade,infrastructure to be rehabilitated.
Solution Mined Reserves
Breakeven Cutoff for solution mined reserves is shown in the table below:
| | | | | | | | | | | | | | | | | | | | | | | | | | | | | | | | |
| IPNM—Summary of Potash Mineral Reserves effective December 31, 2023. Based on $360/product ton mine site |
| | In-Place KCl (Mt) | | In Situ Grade1 (%K2O) | | Product2 (Mt) | | Brine Cutoff Grade3 (%K2O) | | Processing Recovery (%) |
| | | | | |
| | | | | |
| Proven Mineral Reserves | | 5.3 | | 22.9 | | 4.0 | | 3.0 | | 85 |
| Probable Mineral Reserves | | — | | — | | — | | — | | — |
| Total Mineral Reserves | | 5.3 | | 22.9 | | 4.0 | | | | |
| | | | | | | | | | |
| IPNM—Summary of Potash Mineral Reserves effective December 31, 2022. Based on $325/product ton mine site |
| | In-Place KCl (Mt) | | In Situ Grade1 (%K2O) | | Product4 (Mt) | | Brine Cutoff Grade3 (%K2O) | | Processing Recovery (%) |
| | | | | |
| | | | | |
| Proven Mineral Reserves | | 5.4 | | 21.7 | | 4.3 | | 2.0 | | 85 |
| Probable Mineral Reserves | | 0.3 | | 19.1 | | 0.2 | | 2.0 | | 85 |
| Total Mineral Reserves | | 5.7 | | 21.6 | | 4.5 | | | | |
1 In situ grade is the amount of K2O in the contact area of the caverns and is used to calculate the In-Place KCl. |
2 Product is calculated by multiplying In-Place KCl by: dissolution factor of 96%, areal recovery of 100%, geologic factor of 94.2%, plant recovery of 85%, cavern loss factor of 98%, and a product purity factor of 103%, and a handling loss factor of 97%. |
3 Brine cutoff grade is the amount of K2O in the extracted brine necessary to cover the costs of production. |
4 Product is calculated by multiplying In-Place KCl by: dissolution factor of 96%, areal recovery of 100%, geologic factor of 94.2%, plant recovery of 85%, cavern loss factor of 98%, and a product purity factor of (1/.95). |
| Mineral Reserves were prepared effective December 31, 2023, and 2022, by RESPEC, a qualified firm for the estimate and independent of Intrepid. |
| Mineral Reserves are reported exclusive of Mineral Resources. |
Mt = million tons, % = percent, K2O = potassium oxide, ft = feet, ROM = Run-of-Mine |
We are not reporting any langbeinite reserves as of December 31, 2017.2023, only langbeinite resources because, in the opinion of the Qualified Person, none of the langbeinite resources are economically mineable. The table below shows the Breakeven Cutoff for mechanically mined langbeinite reserves as of December 31, 2022.
Our Proven and Probable Reserves 1
|
| | | | | | | | | | | | | | | | | | | | | | | | |
| (tons in thousands) | |
| |
| |
| | Proven 4 | | Probable 7 |
| Product/Operations | | Date Mine Opened 2 | | Current Extraction Method | | Minimum Remaining Life (years) 3 | | Recoverable Ore Tons 5 | | Ore Grade 6 (% KCl) | | Product Tons as KCl | | Recoverable Ore Tons 5 | | Ore Grade 6 (% KCl) | | Product Tons as KCl |
| Potash | |
| |
| |
| |
|
| |
|
| |
|
| |
|
| |
|
| |
|
|
West 2 | | 1931 | | Underground | | 71 | | 102,960 |
| | 23.0 | % | | 19,730 |
| | 57,170 |
| | 22.4 | % | | 10,710 |
|
| East | | 1965 | | Underground | | 14 | | 21,620 |
| | 22.0 | % | | 3,640 |
| | 14,620 |
| | 22.7 | % | | 2,500 |
|
HB Mine 2, 9 | | 2012 | | Solution | | 39 | | 18,680 |
| | 37.1 | % | | 6,310 |
| | 2,190 |
| | 40.2 | % | | 800 |
|
| Moab | | 1965 | | Solution | | 100+ | | 29,890 |
| | 42.5 | % | | 11,890 |
| | 32,110 |
| | 44.0 | % | | 14,800 |
|
Wendover 10 | | 1932 | | Brine Evaporation | | 30 | | — |
| | — |
| | — |
| | — |
| | 0.7 | % | | 3,100 |
|
| Total Potash | |
| |
| |
| |
|
| | 30.6 | % | | 41,570 |
| |
|
| | 30.8 | % | | 31,910 |
|
| | | | | | | | | | | | | | | | | | | | | | | | | | | | | | | | |
|
| | | | | | | | | | |
| | | | | |
| | | | | |
| | | | | | | | | | |
| | | | | | | | | | |
| | | | | | | | | | |
| | | | | | | | | | |
| IPNM—Summary of Langbeinite Mineral Reserves effective December 31, 2022. Based on $340/product ton mine site. |
| | ROM Ore1 (Mt) | | In Situ Grade2 (Diluted) (%K2O) | | Product3 (Mt) | | Cutoff Grade (ft%K2O) | | Processing Recovery (%) |
| | | | | |
| | | | | |
| Proven Mineral Reserves | | 17.3 | | 8.6 | | 4.6 | | 43 | | 68 |
| Probable Mineral Reserves | | 4.2 | | 9.1 | | 1.2 | | 43 | | 68 |
| Total Mineral Reserves | | 21.5 | | 8.7 | | 5.8 | | | | |
1 ROM Ore is reported based on a detailed conventional mine plan adjusted for random impurities of 10%. |
2 In situ grade (diluted) is the amount of K2O in the ore body with consideration for dilution occurring during mining. |
3 Product tons are calculated by multiplying ROM Ore by: In-Situ Grade (Diluted)/22.70%, plant recovery of 68%, and a product purity factor of (1/.944). In-situ Grade (Diluted) is divided by 22.70% to convert K2O grade to pure langbeinite by mass. |
| Mineral Reserves were prepared effective December 31, 2023, and 2022, by RESPEC, a qualified firm for the estimate and independent of Intrepid. |
| Mineral Reserves are reported exclusive of Mineral Resources. |
Mt = million tons, % = percent, K2O = potassium oxide, ft = feet, ROM = Run-of-Mine |
Additional information regarding the methodology and key assumptions used to calculate the IPNM mineral reserve can be found in Section 12 of the technical report summary in Exhibit 96.1 to this Annual Report.
Internal Controls
IPNM has an internal protocol that provides for well‐defined, safe practices. IPNM has standard operating procedures ("SOP's") in place for logging and sampling core from underground and surface core drilling. According to the SOP’s, the geologist uses gamma ray to initially select the sample interval prior to prepping the sample for analysis. The samples are assayed at the on‐site laboratory. The site laboratory has the capability to conduct X‐ray Diffraction ("XRD"), Total Organic Carbon, and flame photometry laboratory techniques. The mineral analysis for all core and channel samples is analyzed with the XRD. A sample of approximately 300–500 grams is collected. The sample is split down to around 100 g and run through a grinding mill to reduce the size down to approximately 100 mesh. A sample is weighed out to five grams and put into a micronizing mill that reduces the particle size to ~10 microns and pressed into a sample holder. The sample is inserted into the instrument and a diffraction pattern is retrieved. The diffraction pattern is then analyzed using the Rietveld refinement software, reporting weight percent of solid mineral in the sample. The sample preparation, security, and laboratory analytical procedures are conventional industry practice and are adequate for the reporting of resources and reserves.
Individual Property Disclosure - Moab
Overview
The Moab property is in a unique high‐altitude desert landscape formed from the sandstone of ancient seafloors and sand dunes. Elevations range from 3,900 feet (ft) to 4,400 ft above mean sea level. The property is located approximately 20 miles west of Moab, Utah, which is 234 miles southeast of Salt Lake City, Utah. The Colorado River runs north–south along the eastern boundary of the property. The Moab property covers approximately 14,100 acres of land.
Moab’s potash leases include 10,100 acres from the State of Utah and approximately 200 acres from the U.S. through the BLM. Moab owns approximately 3,800 surface acres overlying and adjacent to portions of the mining leases with the State of Utah.
|
| | | | | | | | | | | | | | | | | | | | | | | | |
| (tons in thousands) | | | | | | | | Proven 4 | | Probable 7 |
| Product/Operations | | Date Mine Opened 2 | | Current Extraction Method | | Minimum Remaining Life (years) 3 | | Recoverable Ore Tons 5 | | Ore Grade 6 (% Lang) | | Product Tons as Langbeinite | | Recoverable Ore Tons 5 | | Ore Grade 6 (% Lang) | | Product Tons as Langbeinite |
| Langbeinite | |
| |
| |
| |
|
| |
|
| |
|
| |
|
| |
|
| |
|
|
East 8,11 | | 1965 | | Underground | | 92 | | 96,120 |
| | 30.0 | % | | 28,830 |
| | 69,370 |
| | 29 | % | | 22,160 |
|
| |
1
| The determination of estimated reserves has been prepared by us and is based on an independent review and analysis of our mine plans and geologic, financial and other data by Agapito, which is familiar with our mines. The most recent review performed by Agapito for the New Mexico East, West, and HB properties was in 2017. Agapito's analysis for the West, East and HB mines was based on detailed examination of our geologic site data and mine plan, which was updated with information from 2017, 2016, and 2015. As a result of Agapito's 2017 review, sylvite reserves in the West and East mines and the langbeinite reserves in the East mine decreased compared to previously reported reserves. The reduction was primarily due to an increased economic cut-off grade for both sylvite and langbeinite ore reserves and for depletion for the 2017 production from the East mine. The HB mine reserve estimate decreased due to depletion for 2017 production from the HB mine. The Moab property reserves are based on Agapito's 2015 mine reserve estimate adjusted for depletion for the 2016 and 2017 production. The Wendover property reserves are based on Agapito's 2015 brine aquifer reserve estimate. However, depletion did not change the reserve life of 30 years as discussed in footnote 3 below. Because reserves are estimates, they cannot be audited for the purpose of verifying exactness. Instead, reserve information was reviewed in sufficient detail to determine if, in the aggregate, the data provided by us is reasonable and sufficient to estimate reserves in conformity with practices and standards generally employed by, and within the mining industry, and that are consistent with the requirements of U.S. securities laws. |
| |
2
| These mines, excluding the HB and West mines, have operated in a substantially continuous manner since the dates set forth in this table. The HB mine was originally opened in 1934 and operated continuously as an underground mine until 1996. In July 2016, we transitioned our West facility into care-and-maintenance mode due to a decline in potash prices. |
| |
3
| Minimum remaining lives are calculated by dividing reserves by annual effective capacity. Effective capacity is the estimated amount of production that will likely be achieved based on the amount and quality of ore that we estimate can be mined, milled, and/or processed, assuming an estimated average reserve grade, potential future modifications to the systems, a normal amount of scheduled down time, average or typical mine development efforts and operation of all of our mines and facilities at or near full capacity. Minimum remaining lives at the West, East, HB mine, and Moab mines are based on reserves (product tons) divided by annual effective capacity over the full expected life of the ore body, and corrections for purity: one ton of red muriate of potash equals 0.95 ton of KCl; one ton of Moab white muriate of potash equals 0.97 ton of KCl; one ton of sulfate of potash magnesia equals 0.97 ton of langbeinite. East langbeinite minimum remaining life was based on a langbeinite-only plant and associated plant capacity. Langbeinite-only production commenced in April 2016 at the East facility and the sylvite plant was shut down at that time. The West facility was shut down and placed into care-and-maintenance mode in July 2016 due to low potash prices. If we decided to produce potash from our East and West mine sylvite ore reserves in the future, we expect that we would reopen the West facility and be required to construct a new plant to replace the East sylvite plant closed in 2016 to process the remaining reserves. Calculated mine lives that exceed 100 years are reported at 100+ years to balance the reserve life with the uncertainties associated with those extended time frames. We |
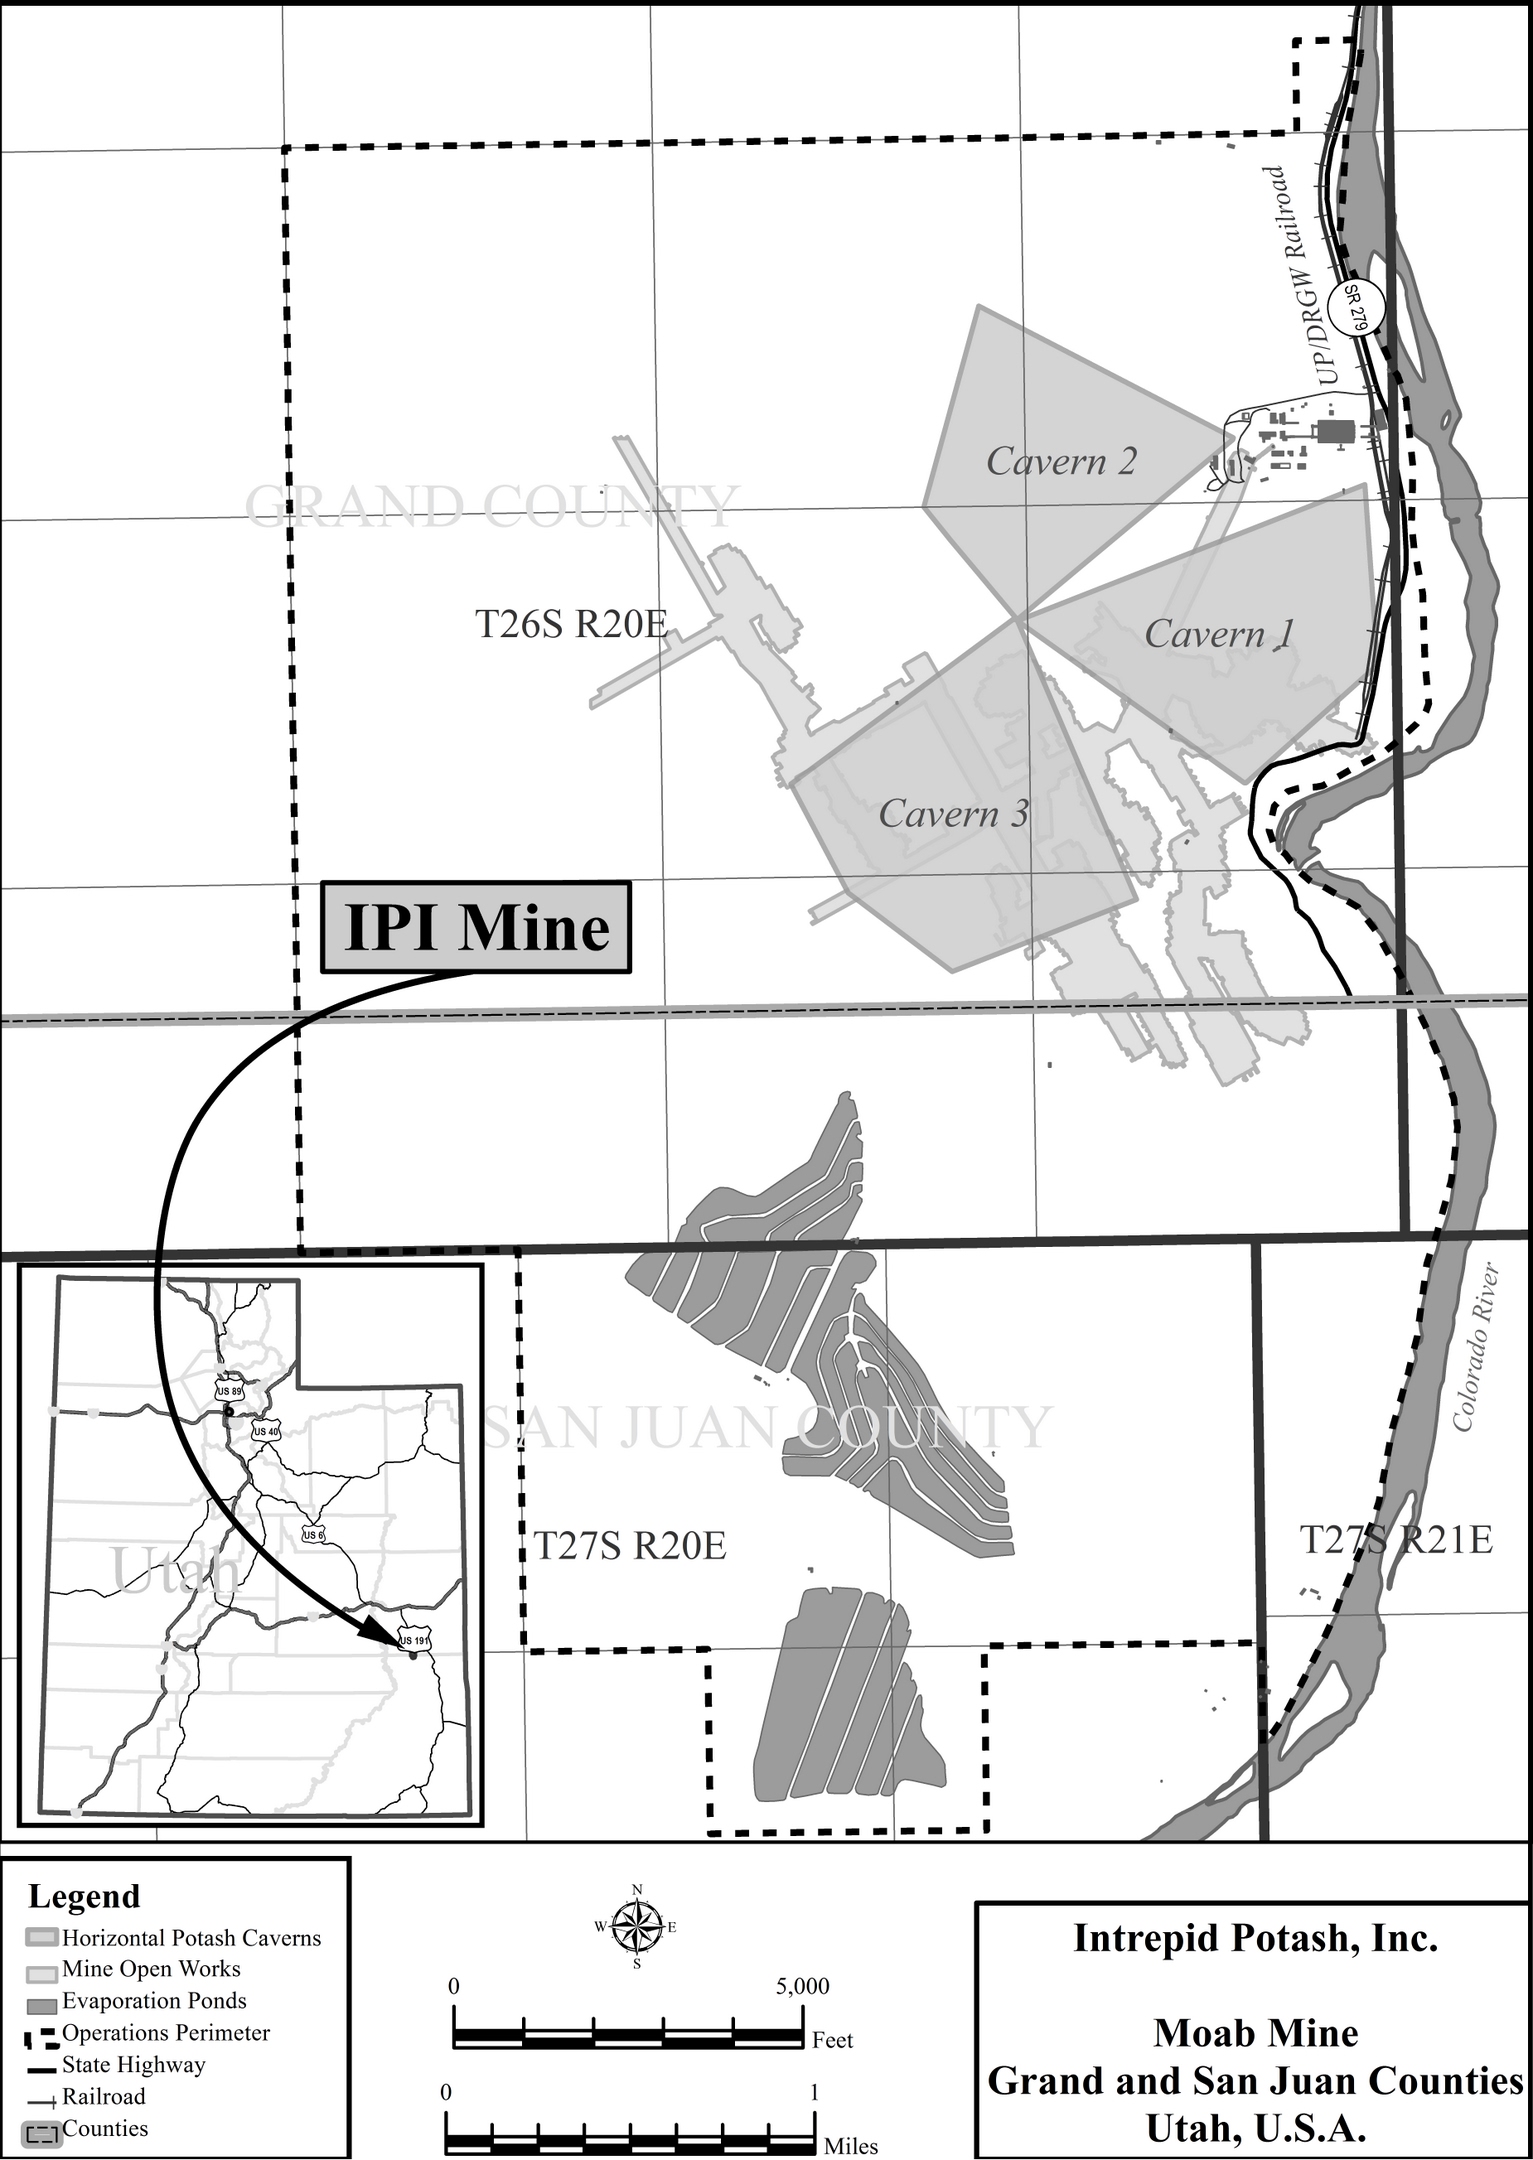
The depositional history of eastern Utah’s vast salt and potash resources begins during the regionally arid Pennsylvanian Period, 330–310 million years ago. An immense block of the Earth’s crust, in what is today western Colorado, was thrust upward to form the Uncompahgre Highlands and identified as the westernmost expression of the Ancestral Rocky Mountains. As is common throughout geologic history, dramatic uplift was coupled with subsidence in an adjoining area. The subsequent topographical basin was inundated by seawater as it subsided. Throughout the Pennsylvanian Period, sea levels rose and fell. With each retreat of the sea, the Paradox Basin, as it is called, became devoid of fresh sea water, allowing the process of evaporation to dominate which resulted in widespread precipitation of chloride minerals. This retreat/inflow cycle is known to have occurred a minimum of 29 times, with each marked by a specific and predictable sequence of sedimentary deposition. This series of depositional cycles is collectively known as the Paradox Formation. Potash is documented to exist in 17 of the 29 cycles, and it is from these formational cycles that commercial production of potash occurs. Of these 17, two are principally targeted by us for commercial potash production: Bed 5 and Bed 9.
Moab commercially produces potash from two zones, referred to as Bed 5 and Bed 9. These beds are part of a thick sequence of evaporite cycles predominantly composed of halite interspersed with sedimentary layers of black shale and anhydrite. Within Beds 5 and 9, the sylvinite is bounded above and below by occurrences of halite. Sylvite and halite are both water‐soluble by nature. By using water already saturated with sodium, it is possible to selectively dissolve a greater amount of the potassium chloride ore.
Mining at the Moab property is by the solution mining technique referred to as “selective solution mining.” Selective solution mining dissolves only the KCl component of the sylvinite and leaves the sodium chloride component underground. KCl production is a function of brine grade and the well extraction rate and is limited by the solar ponds’ evaporation rate. Brine grade is a function of retention time within each bed.
Mining by solution methods ends with the delivery of the brine to the evaporation ponds. Mineral processing begins with pond sequencing to enhance crystallization of the potash. The crystals remaining in the ponds after solar evaporation are harvested and processed through the mill where the potash is separated from other salts, then concentrated by flotation. The concentrates are then dried, compacted, and screened into premium grades of white potash. We ship the product to market in
trucks or rail cars. Both potash and salt products are processed at the plant facility at a rate of 400 to 1,200 tons per day. The Moab property exhibits the normal results of a surface salt-based operation and is in good working condition. A new compaction facility was installed in 2010.
Access to the property is predominantly via state highway 191 and state road 279, locally referred to as Potash Road. A Union Pacific/Denver and Rio Grande Western Railroad rail spur services the property. The nearest town to the Moab property is Moab, Utah (with an estimated population of about 5,300). Salt Lake City, Utah (population of 200,500) and Grand Junction, Colorado (population of 67,000), are located approximately 240 and 120 miles to the west and east, respectively, by road, and are the nearest major industrial and commercial airline terminals. Moab also has a commercial airline terminal with scheduled flights to Salt Lake City and other nearby cities depending on the season.
The nearby Colorado River provides the Moab mining operation with make‐up water under existing water rights with the State of Utah for a water supply of nine cubic feet per second. The Moab mine has been in operation as a solution mine since 1970 and, as a result, has the infrastructure and available personnel. The mining operation is accessible by a paved county road and accessible by rail. Electric power is fed from local utilities to a recently upgraded substation. The local area population is sufficient to support the Moab mine.
The Moab property is pledged as collateral for our revolving credit facility. We have a reclamation bond in place for approximately $7.5 million. There are no other significant encumbrances to the Moab property, including current and future permitting requirements and associated timelines, permit conditions, and violations and fines. As of December 31, 2023, the net book value of our material Moab property was $79.5 million. There are no significant factors and risks that may affect access, title, or the right or ability to perform work on the Moab property. The Moab property holds numerous environmental and other permits and governmental approvals authorizing the operations at the facility.
Leases and Permits
At our Moab facility, we lease approximately 10,100 acres from the State of Utah and approximately 200 acres from the federal government through the BLM. We own approximately 3,800 surface acres overlying and adjacent to portions of acres leased from the State of Utah. These leases generally contain stipulations that require us to commence mining operations within a specified term and to continue mining to retain the leases.
Our lease with the federal government is for an indefinite term subject to readjustment of the lease stipulations, including the royalty payable to the federal government. Royalty payments equal a percentage of product sales less freight. The current royalty rate stipulated in the federal lease is five percent. In 2023, Moab made no royalty payments to the federal government.
Our Moab leases with the State of Utah are for terms of 10 years subject to extension and possible readjustment of the lease stipulations, including the royalty payable to the State of Utah. Our Moab leases with the State of Utah are operated as a unit under a unit agreement with the State of Utah, which extends the terms of all the Moab state leases as long as operations are conducted on any portion of these state leases. Our Moab leases with the State of Utah are currently extended until 2024 or so long as potash is being produced and stipulate royalty rates of five percent. In 2023, Moab paid $2.5 million of royalties to the State of Utah.
History of Operations
Texasgulf, Inc. began conventional underground mining in 1964, but various mining problems caused management to convert to a system combining solution mining and solar evaporation in 1971. Prior to 1970, approximately 6.5 million tons of sylvinite ore were mined and from that, 1.7 million tons of potash produced. Mining was by continuous miners and made difficult by the irregular floor, gas, and high rock temperatures. The height mined was typically eight feet. The dip of the ore was such that maintaining the miners in the seam was difficult. The seam floor rolls and folds resulted in an irregular mine plan with many large areas left unmined as pillars. In some areas, secondary mining resulted in high extraction.
We purchased the Moab Salt operation in 1999. In 2000, we drilled two new recovery wells to revitalize production from Bed 5. Production from Bed 5 had declined from near 100,000 tons in 1994 to 60,000 tons in 1999. After completion of the two new recovery wells, the brine concentration improved, and production increased to near 100,000 tons in 2001. Maintaining production at or near the target rate of 100,000 tons per year was difficult from Bed 5 because of declining product concentration. It was believed that solution mining over the prior 32 years had solution mined most of the remnant pillars in the old workings and that active solution mining was restricted to the updip faces of the mine ribs.
We evaluated methods to enhance the production rate and decided to develop solution mining in Bed 9. Bed 9 is located 800 to 1,000 feet below Bed 5 and is of higher KCl content. Bed 9 had not been solution mined previously, although, some test mining was completed by the prior owners in the late‐1960s. A novel method of solution mining was adopted for recovery of potash from Bed 9. Moab Salt‐27 and Moab Salt‐28 were drilled “horizontally” in 2002 in Bed 9 to connect and
provide pathways for the liquor injected in Moab Salt‐27 to contact the sylvinite and differentially dissolve the sylvite before being lifted from Moab Salt‐28. Currently, Moab Salt‐29 connects Moab Salt‐27 and ‐28 and serves as an alternative to Moab Salt‐27 for injection.
Mineral Resource and Reserves Comparison to Prior Year
We engaged RESPEC, a qualified firm and independent of Intrepid, to prepare a technical report summary for our Moab material property as of December 31, 2023 because changes in our cost of production and recent capital investments resulted in material changes in the mineral reserves and mineral resources estimates from the revised technical report summary prepared as of December 31, 2021 for the Moab property. The technical report summary for the Moab material property as of December 31, 2023 is included with this Annual Report on Form 10-K.
Mineral Resource and Reserves
Overview
The ore resource model created from the exploration and sampling database in 2007 serves as the basis for this evaluation. Personal inspection of the properties has occurred over the years by the QP, with the most recent inspection done on May 17, 2021. The inspection began with a tour of the tailings lake then the solar evaporating ponds. In addition, the injection and extraction wellfields, processing plant, product packaging and shipping areas were all inspected. During the site visit, harvesting was occurring, and the plant was operating. The plant is typically idle during the peak evaporation season from June 1 to September 1.
Mineral Resource
The property was evaluated using exploration drillhole and channel sample data to form the database that serves as the basis for estimating the resources. The geologic setting was evaluated, and zone assignments reviewed. All the core holes used in this resource estimation report both bed thickness and grade values that lie within the mine lease boundary. As an exception to this, the two potash exploration wells, Wells 28 and IPI‐037, which report bed thicknesses with no assay data, are included in the resource estimate for thickness modeling.
The rationale for the measured, indicated, and inferred limits is based on industry practice in the potash industry. Measured resources are within ¼ of a mile (1,320 feet) of a hole, conveying the highest level of confidence. In addition, the indicated resources are selected to be within ¾ of a mile (3,960 feet) of a hole and the inferred resources are selected to be within 1½ miles (7,920 feet) of a hole. Indicated tons exclude measured tons, inferred tons exclude the indicated and measured tons. This convention is considered reasonable for the geologic characteristics of the Cane Creek potash deposit.
The mineral resource for the Cane Creek Mine was estimated using Carlson Software 2020 ("Carlson 2020"), a commercially available geology and mine modeling software package. The resources within the property were segregated in the model into 100‐feet by 100‐feet blocks. The resource estimates included in this report are based on the 2018 modeling.
A deterministic estimate of the potash mineral resource was made using the inverse distance squared method. Invoking the theory that closer samples should be better predictors than those further away, the method assigns weights to samples inversely proportional to the separation distance between the estimation point and the sample point. The inverse distance squared method is useful for providing unbiased estimates of the overall resources.
The block grade and heights were generated within a 1.9‐mile search radius. The 1.9‐mile search radius was selected to capture more than one core hole in estimating block values in the areas of interest. The maximum number of drill holes for block estimation was limited to the 20 nearest drill holes. Inverse distance squared behaves as an exact interpolator. When calculating a block value, the weights assigned to the data points are fractions, and the sum of all the weights is equal to 1.0. An average unit density of 130 pounds per cubic foot was used to convert in‐place volume to tons. NaCl (salt) is not reported.
The proportion of the mineral deposit that is considered a resource depends on the following key factors: deposit thickness, deposit grade, and geologic factors. Areas where a bed thickness and potassium oxide (K2O) grade do not meet a 3‐foot and 18.95% K2O cutoff are excluded from the resource. The minimum thickness cutoff is used because sufficient recovery in thin beds by selective solution mining has not been demonstrated and because of difficulties in locating/maintaining horizontal holes within the bed. The grade cutoff is used because of the difficulty in selective mining in beds with less than 30% KCl content (18.95% K2O).
The gross in‐place sylvinite tonnage for each resource block was calculated by multiplying the net area of the block by the thickness of the bed and the density. The measured, indicated, and inferred Mineral Resource tonnages were estimated within the prescribed radius from the sampling location.
The mineral resources for Bed 5 have been estimated using the end of year 2018 geologic model. Measured, indicated, and inferred resources were estimated by sampling blocks within a 1,320‐feet, 3,960‐feet, and 7,920‐feet radius of influence, respectively, from a sample location (drill hole).
The resource estimate for Bed 9 is based on cored intervals and assay data from 21 holes (19 with grade and thickness). A similar methodology used for the Bed 5 resource estimation was used in the resource estimate for Bed 9.
| | | | | | | | | | | | | | | | | | | | | | | | | | | | | | | | |
| Moab—Summary of Mineral Resources in Millions of Tons of Sylvinite in Place effective December 31, 2023 Based on $450/product ton mine site |
| | Resources | | | | |
| | Sylvinite1 (Mt) | | Grade (%K2O) | | Contained K2O (Mt) | | Cutoff 2 | | Processing Recovery (%) |
| | | | | |
| Measured mineral resources | | 97 | | 26 | | 25 | | Minimum of 3-ft and 18.95%K2O | | 83 |
| Indicated mineral resources | | 190 | | 25 | | 47 | | Minimum of 3-ft and 18.95%K2O | | 83 |
| Measured + Indicated mineral resources | | 287 | | 25 | | 72 | | | | |
| Inferred mineral resources | | 38 | | 23 | | 9 | | Minimum of 3-ft and 18.95%K2O | | 83 |
| Moab—Summary of Mineral Resources in Millions of Tons of Sylvinite in Place effective December 31, 2022 Based on $406/product ton mine site |
| | Resources | | | | |
| | Sylvinite1 (Mt) | | Grade (%K2O) | | Contained K2O (Mt) | | Cutoff 2 | | Processing Recovery (%) |
| | | | | |
| Measured mineral resources | | 113 | | 26 | | 30 | | Minimum of 3-ft and 18.95%K2O | | 83 |
| Indicated mineral resources | | 190 | | 25 | | 47 | | Minimum of 3-ft and 18.95%K2O | | 83 |
| Measured + Indicated mineral resources | | 303 | | 25 | | 77 | | | | |
| Inferred mineral resources | | 38 | | 23 | | 9 | | Minimum of 3-ft and 18.95%K2O | | 83 |
1 Sylvinite is a mixed evaporite containing NaCl and KCl. Pure KCl equates to 63.17% K2O by mass. |
2 Solution mining resource cutoff for flooded old workings is the mining extents boundary. |
| Mineral Resources were prepared by RESPEC, a qualified firm for the estimate and independent of Intrepid. |
| Mineral Resources are reported exclusive of Mineral Reserves. |
| Mineral Resources are reported using Inverse Distance Squared estimation methods. |
Mt = million tons, % = percent, K2O = potassium oxide, ft = feet |
Additional information regarding the methodology and key assumptions used to calculate the Moab mineral resource can be found in Section 11 of the technical report summary in Exhibit 96.2 to this Annual Report.
Mineral Reserve
Mineral reserves that are mined using solution mining methods are not subject to the traditional application of a cutoff grade but instead of operational limitations. By definition, modifying factors are the factors applied to a mine plan for the indicated and measured mineral resources and then evaluated in order to establish the economic viability of mineral reserves. The factors for Moab are solution mining parameters, mineral processing, and lease boundaries are shown below.
The reserve estimate is based on a mine plan developed for the Cane Creek Mine. The estimate is based on the geologic model and assigned thicknesses and grades for the flooded old mine workings updip boundary (Bed 5) mapped to the decline curve and the individual caverns (Bed 9).
The mine plan for Bed 5 was determined using a study developed to estimate the area of reserves that have been depleted through solution mining inside and around the perimeter of the old mine workings, with the exception of a large pillar within the perimeter. As such, this perimeter area has been excluded from the reserve estimates for Bed 5. Reserves were estimated for updip and horizontal areas outside of the perimeter. The mineral reserves were estimated as the difference between the reserves from the resource area and the net KCl tons extracted since 2001.
Although Bed 5 resources can be solution mined with additional horizontal caverns, the reserves estimate only focuses on the net reserves remaining in the old mine as the planned horizontal caverns in Bed 9 are more than 30 years miningenough to support the required mine life for this report.
The mine plan for Bed 9 includes the three existing operating caverns and three additional planned caverns. Estimate of the reserves within the current and future well system area uses grade and thickness drillhole data and production to date. No estimate was made of the ore tons, average thickness, and average grade for the previously solution‐mined areas from Bed 9, only the equivalent tons of K2O and KCl were estimated. To date, about 1,110,000 tons of KCl have been mined from Bed 9. The modifying factors required to convert the in‐place tons into reserve tons are the same as those listed for Bed 5 with the exception of the dissolution factor. The Bed 9 dissolution factor was estimated using a concentration of 7.42% KCl by weight.
| | | | | | | | | | | | | | | | | | | | | | | | | | | | | | | | |
| Moab—Summary of Potash Mineral Reserves effective December 31, 2023. Based on $360/product ton mine site. |
| | In-Place KCl (Mt) | | In Situ Grade1 (%K2O) | | Product (Mt)2 | | Brine Cutoff Grade3 (%K2O) | | Processing Recovery (%) |
| | | | | |
| | | | | |
| Proven Mineral Reserves | | 3.1 | | 28.3 | | 2.3 | | 2.5 | | 83.0 |
| Probable Mineral Reserves | | 0.4 | | 28.9 | | 0.3 | | 2.5 | | 83.0 |
| Total Mineral Reserves | | 3.5 | | 28.4 | | 2.6 | | | | |
| | | | | | | | | | |
| Moab—Summary of Potash Mineral Reserves effective December 31, 2022. Based on $325/product ton mine site. |
| | In-Place KCl (Mt) | | In Situ Grade1 (%K2O) | | Product (Mt)4 | | Brine Cutoff Grade3 (%K2O) | | Processing Recovery (%) |
| | | | | |
| | | | | |
| Proven Mineral Reserves | | 2.5 | | 27.2 | | 1.8 | | 1.9 | | 83.0 |
| Probable Mineral Reserves | | 0.8 | | 27.8 | | 0.6 | | 1.9 | | 83.0 |
| Total Mineral Reserves | | 3.3 | | 27.3 | | 2.4 | | | | |
1 In situ grade is the amount of K2O in the remaining pillars of old works and is used to calculate In-Place KCL. |
2 Product tons are calculated by multiplying the In-Place KCl by: dissolution factor of 89%, areal recovery of 100%, geologic factor of 94%, plant recovery of 86%, handling loss factor of 97.5%, and product purity of 104% (1/0.96). |
3 Brine cutoff grade is the amount of K2O in the extracted brine necessary to cover the cash costs of production. |
4 Product tons are calculated by multiplying the In-Place KCl by: dissolution factor of 89%, areal recovery of 94%, geologic factor of 94%, plant recovery of 83%, and product purity of 1/95%. |
| Mineral Reserves were prepared by RESPEC., a qualified firm for the estimate and independent of Intrepid. |
| Mineral Reserves are reported exclusive of Mineral Resources. |
Mt = million tons, % = percent, K2O = potassium oxide, ft = feet |
Additional information regarding the methodology and key assumptions used to calculate the Moab mineral reserve can be found in Section 12 of the technical report summary in Exhibit 96.2 to this Annual Report.
Internal Controls
Moab has an internal protocol that provides for well‐defined, safe practices. Moab has SOPs in place for gamma‐ray logging, core handling, and sample collection. The cores are collected and analyzed for ore zone identification. Cores are
compared to the gamma‐ray log to determine sampling intervals. Duplicate samples are collected with one sample sent to the on‐site lab and the other stored with the corresponding core box from which the sample was sourced.
Individual Property Disclosure - Wendover
Overview
The Wendover operation is located near the Nevada-Utah border along the western edge of Utah’s Great Salt Lake Desert and is situated within the Bonneville Salt Flats ("BSF"). The BSF is an enclosed-subbasin that contains 150 square miles of salt crust. Because the basin is closed topographically and has no outlet, loss of water is ultimately through evaporation. The BSF was formed through the prolonged accumulation of evaporite minerals in conjunction with periodic lacustrine events. There are three aquifers known to exist beneath the BSF, in descending order, the shallow-brine aquifer, the alluvial-fan aquifer, and the deep-brine aquifer. We produce potash from the shallow-brine aquifer and the deep-brine aquifer. The climate in western Utah is arid with low precipitation and low relative humidity. Average rainfall is five inches and average evaporation is eighty inches.
We produce potash at the Wendover facility through solar evaporation of naturally occurring brines collected from the sedimentary basin adjacent to the processing facility via brine collection ditches and extraction wells. The potash content of the collected brine is concentrated by solar evaporation in a series of ponds to the point that solids are precipitated and can be collected. The precipitated solids are primarily sylvinite, a combination of NaCl and KCl. Harvested solid salts are hauled to the processing facility, where grinding and flotation processes are used to concentrate KCl. The concentrate is then leached with freshwater to remove most of the remaining NaCl. KCl is then dried, sized, and stored for shipment. Potash, NaCl, MgCL2, and metal recovery salt are shipped by truck and rail via Interstate 80 and the Union Pacific Railroad.
The Wendover potash operation is located in the westernmost part of Tooele County, Utah. The plant facilities and offices are located approximately three miles east of Wendover, Utah, on old US Highway 40. The site is approximately three miles east of the Nevada border and is primarily located south of Interstate 80, although portions of the site are located north of Interstate 80. The area of the Wendover mine operation is shown below. The facility, collection ditches, and evaporation systems cover approximately 91,600 acres (approximately 141 square miles). The majority of the ditch collection system is located to the south and east of the processing facilities.
A robust set of infrastructure is in place for Wendover. Natural gas, electricity, and water have historically been readily available and are expected to continue into the future. Process materials are readily available in the greater Salt Lake Area. All infrastructure for the operation is located approximately three miles east of Wendover, Utah, on old US Highway 40. Interstate 80 bisects the property. The Union Pacific Railroad runs next to the operations. The majority of personnel live and work in Wendover, Utah or West Wendover, Nevada, approximately three to six miles from the operation. The Wendover Airport is located near the operations, although most commercial flights serve the Salt Lake City Airport, which is approximately 115 miles from the operation.
We have operated the property continuously since 2004. The property exhibits the normal results of a surface salt-based operation and is in good working condition. We installed a new compaction facility in 2010, and a new product warehouse in 2012. We use monitoring wells drilled in October 2005 to evaluate brine quality in the shallow-brine aquifer.
The Wendover property is pledged as collateral for our revolving credit facility. The only other significant encumbrance is a reclamation bond of $8.9 million to cover the cost of site reclamation. There are no other significant encumbrances to the property, including current and future permitting requirements and associated timelines, permit conditions, and violations and fines. As of December 31, 2023, the net book value of our material Wendover property was $42.2 million. There are no significant factors and risks that may affect access, title, or the right or ability to perform work on the property. Wendover holds numerous environmental and other permits and governmental approvals authorizing the operations at the facility.
Leases and Permits
We own approximately 57,500 acres of the Wendover site. The BLM and the State of Utah own approximately 34,000 acres of the Wendover site, which we lease (excluding lands used for highway and utility purposes).
We hold leases from the federal government that include 25,900 acres adjoining the Wendover property to the east. Our Wendover federal leases have an indefinite term subject to readjustment of the lease stipulations, including the royalty payable to the federal government. Royalty payments equal a percentage of product sales less freight. The current royalty rate
stipulated in the federal leases is three percent. In 2023, Wendover made $0.3 million in royalty payments to the federal government.
The State of Utah owns several state land trust sections within the Wendover property site boundaries. We lease approximately 8,100 acres of property from the State of Utah under special use and mineral leases. The Wendover state leases are interspersed among our property and the Wendover federal leases. The Wendover state leases are for an indefinite term subject to readjustment of the lease stipulations, including the royalty payable to the State of Utah. Royalty payments equal a percentage of product sales less freight. The current royalty rate stipulated in our Wendover state leases is four percent. In 2023, Wendover made $0.1 million in royalty payments to the State of Utah.
History of Operations
The Bonneville area was recognized in the early 1900s as a source for potash. The original operation was known as the Salduro Works, which operated until 1918 and then closed due to a decline in potash demand. The original Salduro Works was responsible for acquiring lands on which a system of collection ditches was constructed. In the mid‐1930s, Bonneville Limited acquired more land to the west of the original property and constructed primary harvest ponds and additional infrastructure to support the mining operations. Between 1961 and 1963, various potash leases were acquired from the federal and state governments. Kaiser Aluminum & Chemical Corporation acquired Bonneville Limited in 1963. The property, including the ponds, processing operation, and lease land, was acquired by Reilly Industries, Inc. from Kaiser Aluminum & Chemical Corporation in 1988. Intrepid acquired the property from Reilly Industries, Inc. in April 2004.
Mineral Resource and Reserves Comparison to Prior Year
We engaged RESPEC, a qualified firm and independent of Intrepid, to prepare a technical report summary for our Wendover material property as of December 31, 2023 because changes in our cost of production resulted in material changes in the mineral reserves and mineral resources estimates from the revised technical report summary prepared as of December 31, 2021 for the Wendover property. The technical report summary for the Wendover material property as of December 31, 2023 is included with this Annual Report on Form 10-K.
Mineral Resource and Reserves
Overview
The ore resource model used to determine resources and reserves was created from a database of brine sampling data in 2007 and includes brine samples from the active mining horizon. The QP's most recent inspection was on May 19, 2021 and included the potash plant, evaporation ponds, wellheads, and ditches.
No traditional drilling exploration has taken place in Wendover. We monitor KCl grade from 27 wells that were drilled in October 2005. We sample these wells at least yearly to evaluate brine quality in the shallow-brine aquifer. Samples are evaluated at the on-site lab with full analysis capabilities, including X-ray fluorescence. Additional information on exploration can be found in Section 7 of the technical summary report in Exhibit 96.3 to this Annual Report.
Mineral Resource
Estimates for potash resources were based on KCl brine concentration, porosity, and aquifer thickness from historical reports and brine monitoring data. Cutoff grade assumptions are based on historic cost data sourced from operations. Product sales prices used in the cutoff grade analyses are based on historical sales and marketing results and forward-looking pricing provided by Intrepid marketing and compared to third party sources.
Resource estimates for shallow-brine aquifer were based on the difference between historic well data collected between 1965 and 1967 and current monitoring data with consideration of the cutoff grade. There has been no change in trend of KCl grade to the primary pond or in potash production with brine grade held steady at approximately 0.97% for 60 years without declining.
Resource estimates for the deep-brine aquifer were based on current deep-well draw-down, pumping rates, and historical brine concentration variations. This resource is classified as an indicated resource due to the uncertainties associatedhydrological uncertainty of the aquifer and is expected to support production for at least 25 years.
| | | | | | | | | | | | | | | | | | | | | | | | | | | | | | | | |
| Wendover—Summary of Mineral Resources in Millions of Tons of Sylvinite as of December 31, 2023. Based on $450/product ton mine site. |
| | Resources | | | | Processing Recovery
(%) |
| | K2O Brine 1 (Mt) | | Grade (%K2O) | | Contained K2O2 (Mt) | | Cutoff 3 (%K2O) | |
| | | | | |
| Measured mineral resources | | — | | — | | — | | | | |
| Indicated mineral resources | | 175 | | 0.5 | | 0.9 | | 0.23 | | 85 |
| Measured + Indicated mineral resources | | 175 | | 0.5 | | 0.9 | | 0.23 | | |
| Inferred mineral resources | | 1,358 | | 0.5 | | 6.8 | | 0.23 | | 85 |
| Wendover—Summary of Mineral Resources in Millions of Tons of Sylvinite as of December 31, 2022. Based on $406/product ton mine site. |
| | Resources | | | | Processing Recovery
(%) |
| | K2O Brine 1 (Mt) | | Grade (%K2O) | | Contained K2O2 (Mt) | | Cutoff 3 (%K2O) | |
| | | | | |
| Measured mineral resources | | — | | — | | | | | | |
| Indicated mineral resources | | 250 | | 0.5 | | 1.2 | | 0.19 | | 85 |
| Measured + Indicated mineral resources | | 250 | | 0.5 | | 1.2 | | 0.19 | | |
| Inferred mineral resources | | 1,360 | | 0.5 | | 6.8 | | 0.19 | | 85 |
1 K2O Brine is the recovered KCl bearing brine in solution at average concentrations by weight. |
2 Contained K2O is calculated by multiplying K2O Brine by the Grade. |
3 Solution mining resource cutoff is the grade at which production covers operating costs. |
| Mineral Resources were prepared RESPEC, a qualified firm for the estimate and independent of Intrepid. |
| Mineral Resources are reported exclusive of Mineral Reserves. |
Mineral Resources are reported using Inverse Distance Squared (ID2) estimation methods. |
Mt = million tons, % = percent, K2O = potassium oxide, ft = feet |
Additional information regarding the methodology and key assumptions used to calculate the Wendover mineral resource can be found in Section 11 of the technical report summary in Exhibit 96.3 to this Annual Report.
Mineral Reserve
Key assumptions for the mineral reserve estimates include KCl grade, thickness, geometry, and hydrogeological properties of the aquifer, presence of geologic anomalies that distort the aquifer, impurities that impact solubility or the surface concentration, separation, crystallization, or packaging process, and the cost of goods sold and estimated final price of the product. Due to its history of operations, infrastructure is mature and the processing and cost factors are well understood. Recovery estimates are based on past, current, and anticipated future performance and supported by laboratory or metallurgical testing of the plant feed.
| | | | | | | | | | | | | | | | | | | | | | | | | | | | | | | | |
| Wendover—Summary of Potash Mineral Reserves effective December 31, 2023. Based on $360/product ton mine site. |
| | Brine 1 (Mt) | | In Situ Grade 2 (%K2O) | | Product 3 (Mt) | | Cutoff 4 (%K2O) | | Processing Recovery (%) |
| | | | | |
| | | | | |
| Proven Mineral Reserves | | | | | | | | | | |
| Probable Mineral Reserves | | 832 | | 0.5 | | 1.7 | | 0.3 | | 85 |
| Total Mineral Reserves | | 832 | | 0.5 | | 1.7 | | 0.3 | | |
| | | | | | | | | | |
| Wendover—Summary of Potash Mineral Reserves effective December 31, 2022. Based on $325/product ton mine site. |
| | Brine 1 (Mt) | | In Situ Grade 2 (%K2O) | | Product 3 (Mt) | | Cutoff 4 (%K2O) | | Processing Recovery (%) |
| | | | | |
| | | | | |
| Proven Mineral Reserves | | | | | | | | | | |
| Probable Mineral Reserves | | 820 | | 0.5 | | 1.7 | | 0.3 | | 85 |
| Total Mineral Reserves | | 820 | | 0.5 | | 1.7 | | 0.3 | | |
1 Brine advanced through the pond system. |
2 In-situ grade is the amount of K2O contained in the brine. |
3 Potash Product tons are calculated by multiplying Brine by: the In-Situ Grade divided by 63.17% K2O/KCl conversion factor, an overall pond recovery factor of 30%, processing recovery of 85%, a handling loss factor of 97%, and a product purity factor of 105%. |
4 Solution mining reserve cutoff is the grade at which production covers operating costs. |
| Mineral Reserves were prepared RESPEC, a qualified firm for the estimate and independent of Intrepid. |
| Mineral Reserves are reported exclusive of Mineral Resources, on a 100% basis |
Mineral Reserves are reported using Inverse Distance Squared (ID2) estimation methods. |
| Mt = million tons, % = percent, K2O = potassium oxide, ft = feet |
Additional information regarding the methodology and key assumptions used to calculate the Wendover mineral reserve can be found in Section 12 of the technical report summary in Exhibit 96.3 to this Annual Report.
Internal Controls
Our Wendover operations have internal quality assurance and quality control procedures for sample collection. Monitoring wells are sampled at least yearly to evaluate brine quality in the shallow-brine aquifer. During the evaporation season, we collect daily brine samples at brine advancement points. We sample brackish ponds and transfer pumps weekly. We evaluate samples at an on-site lab with natural brine‑containing aquifers.
| |
4
| Generally, "proven reserves" are reserves for which (a) quantity is computed from dimensions revealed in outcrops, trenches, workings, or drill holes; grade and/or quality are computed from the results of detailed sampling, and (b) the sites for inspection, sampling, and measurement are spaced so closely and the geologic character is so well-defined that the size, shape, depth, and mineral content of the reserves are well-established. Proven reserve tonnages are computed from projection of data using the inverse distance squared method taking into account mining dilution, mine extraction efficiency, ore body impurities, metallurgical recovery factors, sales prices, and operating costs from potash ore zone measurements as observed and recorded either in drill holes using cores, or channel samples in mine workings. This classification has the highest degree of geologic assurance. The data points for measurement are adequately spaced and the geologic character so well defined that the thickness, areal extent, size, shape, and depth of the potash ore zone are well-established. The maximum acceptable distance for projection from ore zone data points varies with the geologic nature of the ore zone being studied. |
| |
5
| Recovery is the percentage of valuable material in the ore that is beneficiated prior to further treatment to develop a saleable product. Recoverable ore tons is defined as the hoisted ore for the conventionally mined ore in our East and West mines. This figure was derived from the in-place ore estimate that has been adjusted for factors such as geologic impurities and mine extraction ratios. For the HB mine and the Moab property, recoverable ore tons are defined as the potassium that can be extracted from the underground workings and pumped to the surface. This figure was derived from the in-place ore estimate that has been adjusted for factors such as geologic impurities, potash that dissolves but remains in the cavern (dissolution factor), and an extraction factor that accounts for potash that may not be recovered because solution may be channeled away or stranded due to cavern geometry. We do not calculate recoverable ore tons for the Wendover property as it is a lake brine resource, not an in-place ore deposit. |
| |
6
| Ore grade expressed as expected mill feed grade to account for minimum mining height for the East and West mines. Potash ore grade is reported in % KCl and langbeinite ore grade is reported in % langbeinite. The ore grade for the Moab and HB mines is the in-place KCl grade. |
| |
7
| "Probable reserves" are reserves for which quantity and grade and/or quality are computed from information similar to that used for proven (measured) reserves, but the sites for inspection, sampling and measurement are farther apart or are otherwise less adequately spaced. The degree of assurance of probable (indicated) reserves, although lower than that for proven (measured) reserves, is high enough to assume geological continuity between points of observation. The classification of minerals as probable reserves requires that we believe with reasonable certainty that access to the reserves can be obtained, even though currently-issued permits are not required. Probable reserve tonnages are computed by projection of data using the inverse distance squared method taking into account mining dilution, mine extraction efficiency, ore body impurities, metallurgical recovery factors, sales prices, and operating costs from available ore zone measurements as observed either in drill holes using cores or in mine workings for a distance beyond potash classified as proven reserves. This classification has a moderate degree of geological assurance. |
| |
8
| Our reserves in the 1st, 3rd, 4th, 7th, 8th and 10th ore zones contain either sylvite (KCl) or langbeinite (K2SO4(MgSO4)2) separately. Ore reserves in the East 5th ore zone contain both sylvite and langbeinite which we call mixed ore. We ceased processing sylvite at the East facility in April 2016, and only the langbeinite ore contained in the East 5th ore zone is included in the mine reserve estimate. Additionally, the reserve amounts include West mine 3rd and 4th ore zones which contain langbeinite that we anticipate will be processed at the East facility.
|
| |
9
| The HB mine reserves were based on solution mining of old workings and recovery of potash from the residual pillars. Reserves are based on thicknesses, grades, and mine maps provided by us. The data presented here includes reserves available via the AMAX/Horizon mine as further described below under Our Development Assets.
|
| |
10
| The Wendover facility reserves are the combination of a shallow and a deep aquifer. There were no proven reserves reported for either aquifer because the shallow aquifer represents an unconventional resource and there is uncertainty of the hydrogeology of the deep aquifer. The estimating method for the shallow aquifer was based on brine concentration, brine density, soil porosity within the aquifer, and aquifer thickness from historical reports. The brine concentrations and brine density were confirmed by us recently, but values for the aquifer thickness and the porosity were obtained from literature published by other sources. Probable reserves for the shallow brine at the Wendover facility were calculated from KCl contained in the shallow aquifer based on estimates of porosity and thickness over the reserve area. The distance for projection of probable reserves is a radius of three‑quarters of a mile from points of measurement of brine concentration. Probable reserves for the deep-brine aquifer were estimated based on historical draw-down and KCl brine concentrations. The ore grade (% KCl) for both the shallow and deep aquifer is the percentage by weight of KCl in the brine. |
| |
11
| A portion of these reserves are within the West mine boundary. The classification of the reserve as being associated with the East mine is a result of where the ore is intended to be processed. |
full analysis capabilities, including X-ray fluorescence.
Production
Our facilities have a current estimated annual productive capacity of approximately 390,000365,000 tons of potash, and approximately 400,000 tons of langbeinite, based on current design.designs. Our annual production rates are less than our estimated productive capacity. Actual production is affected by operating rates, the grade of ore mined, recoveries, mining rates, evaporation rates, product pricing, and the amount of development work that we perform. Therefore, as with other producers in our industry, our production results tend to be lower than reported productive capacity.
Our production capabilities and capital improvements at our facilities are described in more detail below, along with our historical production of our primary products and by-productsbyproducts for the years ended December 31, 2017, 2016,2023, 2022, and 2015.2021.
Solution Mines
•Potash ore at HB is mined from idled original mine workings in the Carlsbad, New Mexico, area.
•The HB mine has a current estimated productive capacity of 180,000 tons annually. The productive capacity may vary between approximately 160,000 and 200,000 tons of potash, primarily due to evaporation rates. Potash produced from our HB mine is shipped by truck to the North facility for compaction.
•Potash ore at the Moab facility is mined from two stacked ore zones: the original mine workings in Potash 5 and the horizontal caverns in Potash 9.
•The Moab mine has a current estimated productive capacity of approximately 110,000 tons of potash annually; evaporation rates have historically varied and, consequently, productive capacity may vary between approximately 75,000 and 120,000 tons of potash.annually.
•Potash at Wendover facility is produced primarily from brine containing salt, potash, and magnesium chloride that is collected in ditches from the shallow aquifers of the West Desert. These materials are also collected from a deeper aquifer by means of deep-brine wells.
•The Wendover facility has a current estimated productive capacity of approximately 100,00075,000 tons of potash annually; evaporation rates have historically varied resulting in actual production between approximately 65,000 and 100,000 tons of potash.annually.
Conventional Underground Mines
•Sylvite and langbeinite ore at our Carlsbad locations occurs in a stacked ore body containing at least 10 different mineralized zones, seven of which contain proven and probable reserves.
•The East mine has a current estimated productive capacity of approximately 400,000 tons of Trio® annually, based on current design. The East mine was converted to a Trio®-only operation in April 2016 and potash is no longer produced from the East mine.
•The West mine was idled in July 2016 and placed in care-and-maintenance mode. When operational, it has an estimated productive capacity of approximately 400,000 tons of red potash annually. Potash produced from our West mine was shipped to the North facility for compaction.
| |
• | The East mine was converted to a Trio®-only operation in April 2016 and potash is no longer produced from the East mine. The Trio® productive capacity of the East mine increased in 2016 as a result of the transition to a Trio®‑only operation. The East mine has a current estimated productive capacity of approximately 400,000 tons of Trio® annually, based on current design.
|
Compaction Facility
•The North facility receives compactor feed from the HB mine via truck and converts the compactor feed to finished granular-sized product and standard-sized product.
Our Development Assets
We have development opportunities in our New Mexico facilities with the acceleration of production from our reserves and mineralized deposits of potash, and the potential construction of additional production facilities in the region. We also own the leases on two idled mines near Carlsbad: the AMAX/Horizon mine and the North mine.
AMAX/Horizon Mine
•We acquired the potash leases associated with the AMAX/Horizon mine in October 2012. The AMAX/Horizon mine was in continuous operation between 1952 and 1993. This mine, similar to the HB mine, ismay be a viable candidate for solution mining in a manner that is consistent with thesimilar to our HB mine.
State•We obtained state and federal permits were obtained in 2015 to utilize these leases for solution mining. The AMAX/Horizon solution mine is expectedThese permits may need to be updated if we decide to operate this facility. We expect to utilize the sameHB evaporation ponds and processing mill asfor the HBAMAX/Horizon mine. We have not yet made a determinationdecision to proceed with this potential development project; however, we may perform future work may be performed to determine the ability to convertif this idled underground mine tois a viable solution mining opportunity.
As noted in footnote 9 to Our Proven and Probable Reserves table, these tons are included in the data presented for the HB Mine.
North Mine
•The North mine operated from 1957 to 1982 when it was idled mainly due to low potash prices and mineralogy changes which negatively impacted mineral processing at the facilities. Although the mining and processing equipment has been removed, the mine shafts remain open. The compaction facility at the North mine is where we granulate, store, and ship potash produced from the HB mine. Two abandoned mine shafts, rail access, storage facilities, water rights, utilities and leases covering potash deposits, are already in place. As part of our long-term mine planning efforts, we may choose to evaluate our strategic development options with respect to the shafts at the North mine and their access to mineralized deposits of potash.
Our Production of Our Primary ProductsPotash and Trio®
One product ton of potash contains approximately 0.60 tons of K2O when produced at our Moab and Wendover facilities and approximately 0.60 or 0.62 tons of K2O when produced at our HB facility. One product ton of langbeinite produced at our East facility contains approximately 0.22 tons of K2O. The following table summarizes production of our primary products at each of our facilities for each of the years ended December 31, 2017, 2016,2023, 2022, and 2015:2021: |
| | | | | | | | | | | | | | | | | | | | | | | | | | | |
| (tons in thousands) | | Year Ended December 31, |
| | | 2017 | | 2016 | | 2015 |
| | | Ore Production | | Mill Feed Grade1 | | Finished Product | | Ore Production | | Mill Feed Grade1 | | Finished Product | | Ore Production | | Mill Feed Grade1 | | Finished Product |
| Potash | | | | | | | | | | | | | | | | | | |
| West | | — |
| |
|
| | — |
| | 1,425 |
| | 11.9 | % | | 191 |
| | 2,532 |
| | 11.1 | % | | 322 |
|
East 2 | | — |
| |
|
| | — |
| | 1,935 |
| | 7.9 | % | | 32 |
| | 2,368 |
| | 7.8 | % | | 145 |
|
| HB | | 728 |
| | 18.0 | % | | 172 |
| | 587 |
| | 16.1 | % | | 124 |
| | 695 |
| | 14.9 | % | | 134 |
|
| Moab | | 472 |
| | 16.7 | % | | 109 |
| | 429 |
| | 16.6 | % | | 97 |
| | 411 |
| | 16.0 | % | | 93 |
|
| Wendover | | 362 |
| | 15.9 | % | | 78 |
| | 239 |
| | 16.3 | % | | 49 |
| | 379 |
| | 16.2 | % | | 74 |
|
| | | 1,562 |
| | | | 359 |
| | 4,615 |
| | | | 493 |
| | 6,385 |
| | | | 768 |
|
| Langbeinite | | | | | | | | | | | | | | | | | | |
East 2 | | 1,177 |
| | 8.0 | % | | 243 |
| | 1,935 |
| | 6.2 | % | | 279 |
| | 2,368 |
| | 4.7 | % | | 162 |
|
| Total Primary Products | | | | 602 |
| | | | | | 772 |
| | | | | | 930 |
|
| | | | | | | | | | | | | | | | | | | | | | | | | | | | | | | | | | | | | | | | | | | | | | | | | | | | | | | | |
| (tons in thousands) | | Year Ended December 31, |
| | 2023 | | 2022 | | 2021 |
| | Ore Production | | Mill Feed Grade1 | | Finished Product | | Ore Production | | Mill Feed Grade1 | | Finished Product | | Ore Production | | Mill Feed Grade1 | | Finished Product |
| Potash | | | | | | | | | | | | | | | | | | |
| | | | | | | | | | | | | | | | | | |
| | | | | | | | | | | | | | | | | | |
| HB | | 717 | | 11.3% | | 90 | | 672 | | 13.7% | | 114 | | 746 | | 13.6% | | 117 |
| Moab | | 429 | | 17.2% | | 95 | | 504 | | 16.9% | | 105 | | 648 | | 15.0% | | 118 |
| Wendover | | 247 | | 12.5% | | 39 | | 296 | | 13.6% | | 51 | | 338 | | 13.3% | | 52 |
| | 1,393 | | | | 224 | | 1,472 | | | | 270 | | 1,732 | | | | 287 |
| Langbeinite | | | | | | | | | | | | | | | | | | |
| East | | 1,285 | | 7.3% | | 216 | | 1,348 | | 7.8% | | 226 | | 1,057 | | 8.6% | | 228 |
| Total Primary Products | | | | 440 | | | | | | 496 | | | | | | 515 |
1 Mill feed grade shown is as percent of K2O. Mill freedfeed grade is a measurement of the amount of mineral contained in an ore as a percentage of the total weight of the ore. For potash it is often represented as a percent of potassium oxide (K2O) or percent potassium chloride (KCl).
2 Potash
Water and langbeinite at our East mine were processed from the same ore until April 2016.
Our By-ProductByproduct Production
We have permitted, licensed, declared and partially adjudicated water rights in New Mexico under which we sell water primarily to support oil and gas operations and developments in the Permian Basin near our Carlsbad facilities. During the extraction of potash and Trio®, we also recover marketable salt, magnesium chloride, metal recovery salts,water, and brine containing salt and potassium from our mining processes. Our salt is used in a variety of markets including animal feed, industrial applications, pool salt, and the treatment of roads and walkways for ice melting or to manage road conditions. Magnesium chloride is typically used as a road treatment agent for both deicing and dedusting. At our Wendover facility, we also produce metal recovery salt, which is potash mixed with salt, in ratios requested by our customers. Metal recovery salt is a combination of potash and salt that chemically enhances the recovery of aluminum in aluminum recycling processing facilities. Our brines are used primarily by the oil and gas industry to support well development and completion activities. We account for the revenue generated from sales of these minerals as by-product credits to our cost of goods sold of our primary potash product.
In February 2015, Mosaic Potash Carlsbad Inc. (“Mosaic”) filed a complaint and application for preliminary injunction and permanent injunction against Steve Gamble and Intrepid Potash, Inc.,ITEM 3.LEGAL PROCEEDINGS
A description of our legal proceedings, if any, is contained in the Fifth Judicial District Court for the County of Eddy in the State of New Mexico (the “State Court Matter”). Mosaic subsequently amended its complaint to add Intrepid Potash - New Mexico, LLC, as a second defendant. Mr. Gamble is a former employee of both Intrepid and Mosaic. The complaint alleged violations of law relating to alleged misappropriation of Mosaic’s trade secrets and other issues. In August 2015, the court in the State Court Matter denied Mosaic’s application for preliminary injunction.
In July 2016, Mosaic filed a complaint against Mr. Gamble and both Intrepid Potash, Inc., and Intrepid Potash - New Mexico, LLC, in US District Court for the District of New Mexico (the “Federal Court Matter”). The complaint alleged violations of law relating to alleged misappropriation of Mosaic’s confidential information, including a Computer Fraud and Abuse Act and additional claims.
In a series of filings in December 2017 and January 2018, the parties removed the State Court Matter to federal court and consolidated it with the Federal Court Matter, resulting in one consolidated lawsuit pending in the US District Court for the District of New Mexico. Mosaic alleges against Intrepid Potash, Inc., and Intrepid Potash - New Mexico, LLC, violationsNote 14 of the New Mexico Uniform Trade Secrets Act, tortious interference with contract relatingNotes to Mr. Gamble’s separation of employment from Mosaic, violations of the Computer Fraud and Abuse Act, conversion, and civil conspiracy relating to the alleged misappropriation of Mosaic’s confidential information and related actions. Mosaic seeks monetary relief of an unspecified amount, including damages for actual loss and unjust enrichment, exemplary damages, attorneys’ fees, and injunctive relief and has alleged that it has spent hundreds of millions of dollars to research and develop its alleged trade secrets. The lawsuit is progressing through discovery. We are vigorously defending against the lawsuit.Consolidated Financial Statements.We are subject to other claims and legal actions in the ordinary course of business. While there are uncertainties in predicting the outcome of any claim or legal action, we believe that the ultimate resolution of these other claims or actions is not reasonably likely to have a material adverse effect on our financial condition, results of operations, or cash flows.
| |
ITEM 4. | MINE SAFETY DISCLOSURES |
ITEM 4.MINE SAFETY DISCLOSURES
We are committed to providing a safe and healthy work environment. The objectives of our safety programs are to eliminate workplace accidents and incidents, preserve employee health, and comply with all safety- and health-based regulations. We seeklaws. In order to achieve these objectives, by trainingwe train employees inon safe work practices; establishing, following,establish, follow, and improvingimprove safety standards; involvinginvolve employees in safety processes; openly communicatingcommunicate safety matters with employees about safety matters;employees; and recording, reporting,record, report, and investigatinginvestigate accidents, incidents, and losses to help avoid recurrence. As part of our ongoing safety programs, we collaborate with MSHA and the New Mexico Bureau of Mine Safety to identify and implement accident prevention techniques and practices.
Our East, West, and North facilities in New Mexico are subject to regulation by MSHA under the Federal Mine Safety and Health Act of 1977 and the New Mexico Bureau of Mine Safety. MSHA inspects these facilities on a regular basis and issues various citations and orders when it believes a violation has occurred under federal law. Exhibit 95.1 to this Annual Report on Form 10-K provides the information concerning mine safety violations and other regulatory matters required by SEC rules. Our Utah and HB facilities are subject to regulation by OSHA and, therefore, are not required to be included in the information provided in Exhibit 95.1.
PART II
| |
ITEM 5. | MARKET FOR REGISTRANT'S COMMON EQUITY, RELATED STOCKHOLDER MATTERS AND ISSUER PURCHASES OF EQUITY SECURITIES |
ITEM 5.MARKET FOR REGISTRANT'S COMMON EQUITY, RELATED STOCKHOLDER MATTERS AND ISSUER PURCHASES OF EQUITY SECURITIES
Market Information
Our common stock is traded on the NYSE under the symbol "IPI".
The following table sets forth the range As of high and low sales pricesFebruary 29, 2024, we had 77 record holders of our common stock for the periods indicated, as reportedbased upon information provided by the NYSE: |
| | | |
| | High | | Low |
| 2017 | | | |
| Quarter ended December 31, 2017 | $5.12 | | $3.42 |
| Quarter ended September 30, 2017 | $4.43 | | $2.24 |
| Quarter ended June 30, 2017 | $2.72 | | $1.58 |
| Quarter ended March 31, 2017 | $2.53 | | $1.24 |
| 2016 | | | |
| Quarter ended December 31, 2016 | $3.04 | | $0.93 |
| Quarter ended September 30, 2016 | $1.68 | | $1.05 |
| Quarter ended June 30, 2016 | $1.83 | | $0.85 |
| Quarter ended March 31, 2016 | $3.26 | | $0.65 |
our transfer agent.
Performance Graph—Comparison of Cumulative Return
The graph below compares the cumulative total stockholder return on our common stock with the cumulative total stockholder return on the S&P 500 Index, the Dow Jones U.S. Basic Materials Index, and a peer group consisting of Potash Corporation of Saskatchewan Inc., The Mosaic Company, and Agrium Inc. for the period beginning on December 31, 2012,2018, through December 31, 2017,2023, assuming an initial investment of $100 and the reinvestment of dividends. On January 1, 2018, Potash CorporationThe peer group consisted of SaskatchewanThe Mosaic Company, Compass Minerals International, Inc., and Agrium Inc. merged to form Nutrien Ltd.
| | | | | | | | | | | | | | | | | | | | | | | |
| IPI | | Peer Group | | S&P 500 | | Dow Jones U.S. Basic Materials |
| December 31, 2018 | $ | 100.00 | | | $ | 100.00 | | | $ | 100.00 | | | $ | 100.00 | |
| December 31, 2019 | $ | 104.23 | | | $ | 97.93 | | | $ | 131.47 | | | $ | 119.76 | |
| December 31, 2020 | $ | 92.88 | | | $ | 103.82 | | | $ | 155.65 | | | $ | 141.70 | |
| December 31, 2021 | $ | 164.35 | | | $ | 166.39 | | | $ | 200.29 | | | $ | 181.07 | |
| December 31, 2022 | $ | 111.04 | | | $ | 170.01 | | | $ | 163.98 | | | $ | 167.35 | |
| December 31, 2023 | $ | 91.88 | | | $ | 136.87 | | | $ | 207.04 | | | $ | 185.77 | |
|
| | | | | | | | | | | | | | | |
| | IPI | | Peer Group | | S&P 500 | | Dow Jones U.S. Basic Materials |
| December 31, 2012 | $ | 100.00 |
| | $ | 100.00 |
| | $ | 100.00 |
| | $ | 100.00 |
|
| December 31, 2013 | $ | 74.40 |
| | $ | 88.24 |
| | $ | 132.39 |
| | $ | 120.38 |
|
| December 31, 2014 | $ | 65.19 |
| | $ | 96.73 |
| | $ | 150.51 |
| | $ | 124.46 |
|
| December 31, 2015 | $ | 13.86 |
| | $ | 64.72 |
| | $ | 152.59 |
| | $ | 108.99 |
|
| December 31, 2016 | $ | 9.77 |
| | $ | 76.22 |
| | $ | 170.84 |
| | $ | 131.09 |
|
| December 31, 2017 | $ | 22.36 |
| | $ | 85.93 |
| | $ | 208.14 |
| | $ | 163.98 |
|
Holders
As of February 16, 2018, we had 66 record holders of our common stock based upon information provided by our transfer agent.
Dividends
We currently intend to retain earnings to reinvest for future operations and growth of our business and do not anticipate paying any cash dividends on our common stock. However, our boardBoard of directors,Directors, in its discretion, may decide to declare a dividend at an appropriate time in the future, subject to the terms of our debt agreements.revolving credit agreement. A decision to pay a dividend would depend upon, among other factors, our results of operations, financial condition, and cash requirements and the terms of our debt agreementsrevolving credit agreement at the time a payment is considered.
Our debt agreements contain restrictions on our ability to declare and pay dividends. In general, the terms of our senior notes prohibit us from declaring and paying a dividend unless our leverage ratio is less than 3.5 to 1, our fixed charge coverage ratio after giving effect to the dividend would be greater than 1.3 to 1, and our cash on hand and availability under our credit facility after giving effect to the dividend would not be less than $15 million. In addition, the terms of our credit facility prohibit us from declaring and paying a dividend unless availability under the credit facility after giving effect to the dividend and during a specified period before the dividend is more than $10 million. More information about how the financial ratios are calculated under our debt agreements is provided in Item 7. Management's Discussion and Analysis of Financial Condition and Results of Operations under the heading "Liquidity and Capital Resources."
Unregistered SalesPurchases of Equity Securities and Use of Proceedsby the Issuer
| | | | | | | | | | | | | | | | | | | | | | | | | | |
| Issuer Purchases of Equity Securities |
| Period | | (a)
Total Number of Shares Purchased1 | | (b)
Average Price Paid Per Share | | (c)
Total Number of Shares Purchased as Part of Publicly Announced Plans or Programs | | (d) Maximum Number (or Approximate Dollar Value) of Shares that May Yet Be Purchased Under the Plan or Programs2 |
| October 1, 2023, through October 31, 2023 | | — | | $— | | — | | $12,987,860 |
| November 1, 2023, through November 30, 2023 | | — | | $— | | — | | $12,987,860 |
| December 1, 2023, through December 31, 2023 | | 7,472 | | $23.33 | | — | | $12,987,860 |
| Total | | 7,472 | | $23.33 | | — | | $12,987,860 |
|
| | | | | | | | |
| Issuer Purchases of Equity Securities |
| Period | | (a)
Total Number of Shares Purchased1 | | (b)
Average Price Paid Per Share | | (c)
Total Number of Shares Purchased as Part of Publicly Announced Plans or Programs | | (d)
Maximum Number (or Approximate Dollar Value) of Shares that May Yet Be Purchased Under the Plan or Programs |
| October 1, 2017, through October 31, 2017 | | — | | — | | — | | N/A |
| November 1, 2017, through November 30, 2017 | | 159,457 | | $3.91 | | — | | N/A |
| December 1, 2017, through December 31, 2017 | | — | | — | | — | | N/A |
| Total | | 159,457 | | $3.91 | | — | | N/A |
1 Represents shares of common stock we withheld by us as a payment of withholding taxes due upon the vesting of restricted stock held by our employees.
| |
ITEM 6. | SELECTED FINANCIAL DATA |
2 Represents the dollar value of remaining availability under the $35 million share repurchase program approved by the Board of Directors in February 2022. Under the share repurchase program, we may repurchase shares from time to time in the open market or in privately negotiated transactions. The following table sets forthtiming, volume and nature of share repurchases, if any, will be at our historical selected financial data forsole discretion and will be dependent on market conditions, liquidity, applicable securities laws, and other factors. We may suspend or discontinue the periods indicated (in thousands, except per share data). The selected financial data should be read together withrepurchase program at any time. During 2023, we did not purchase any shares under the other information contained in this document, including "Item 7. Management's Discussion and Analysis of Financial Condition and Results of Operations" and the audited historical financial statements and notes in "Item 8. Financial Statements and Supplemental Data."share repurchase program.
|
| | | | | | | | | | | | | | | | | | | | |
| | | Year Ended December 31, |
| | | 2017 | | 2016 | | 2015 | | 2014 | | 2013 |
| Sales | | $ | 157,607 |
| | $ | 210,948 |
| | $ | 287,183 |
| | $ | 410,389 |
| | $ | 336,312 |
|
| Net (loss) income | | $ | (22,910 | ) | | $ | (66,633 | ) | | $ | (524,776 | ) | | $ | 9,761 |
| | $ | 22,275 |
|
| Basic and diluted (loss) earnings per share: | | $ | (0.20 | ) | | $ | (0.88 | ) | | $ | (6.94 | ) | | $ | 0.13 |
| | $ | 0.30 |
|
ITEM 6.RESERVED
|
| | | | | | | | | | | | | | | | | | | | |
| | | December 31, |
| | | 2017 | | 2016 | | 2015 | | 2014 | | 2013 |
| Total assets | | $ | 511,054 |
| | $ | 540,901 |
| | $ | 639,969 |
| | $ | 1,166,119 |
| | $ | 1,174,590 |
|
| Total debt, net | | $ | 63,337 |
| | $ | 133,434 |
| | $ | 149,485 |
| | $ | 149,402 |
| | $ | 149,318 |
|
|
| | | | | | | | | | | | | | | | | | | | |
| | | December 31, |
| | | 2017 | | 2016 | | 2015 | | 2014 | | 2013 |
| Cash, cash equivalents, and investments | | $ | 1,068 |
| | $ | 4,464 |
| | $ | 63,629 |
| | $ | 89,879 |
| | $ | 25,113 |
|
| Stockholders' equity | | $ | 402,553 |
| | $ | 363,371 |
| | $ | 426,526 |
| | $ | 947,285 |
| | $ | 933,971 |
|
| |
ITEM 7. | MANAGEMENT'S DISCUSSION AND ANALYSIS OF FINANCIAL CONDITION |
ITEM 7.MANAGEMENT'S DISCUSSION AND ANALYSIS OF FINANCIAL CONDITION
AND RESULTS OF OPERATIONS
This ManagementManagement's Discussion and Analysis should be read in conjunction with the accompanying consolidated financial statements and related notes contained elsewhere in "Item 8. Financial Statements and Supplemental Data" of this Annual Report on Form 10-K.Report.
This ManagementManagement's Discussion and Analysis contains forward‑looking statements that involve risks, uncertainties, and assumptions as described under the heading "Cautionary Note Regarding Forward‑Looking Statements," in Part I of this Annual Report on Form 10-K.Report. Our actual results could differ materially from those anticipated by these forward‑looking statements as a result of many factors, including those discussed under "Item 1A. Risk Factors" and elsewhere in this Annual Report.
A discussion of the changes in our results of operations between the years ended December 31, 2022 and December 31, 2021 has been omitted from this Annual Report on Form 10-K.10-K but may be found in Item 7. Management's Discussion and Analysis of Financial Condition and Results of Operations of our Annual Report on Form 10-K for the year ended December 31, 2022, filed with the SEC on March 7, 2023, which is available free of charge on the SEC's website at www.sec.gov and our corporate website (www.intrepidpotash.com).
Overview
We are a diversified mineral company that delivers potassium, magnesium, sulfur, salt, and water products essential for customer success in agriculture, animal feed and the oil and gas industry. We are the only U.S. producer of muriate of potash in the United States and are one of two global producers of langbeinite, which we market and sell(sometimes referred to as Trio®. We sell potash and Trio® primarily into the agricultural market as a fertilizer. We also sell these products into the animal feed market as a nutritional supplement and sell potash into the industrial market as a component in drilling and fracturing fluids for oil and gas wells and other industrial inputs. We also sell water,potassium chloride or potash), which is recordedapplied as an essential nutrient for healthy crop development, utilized in other operating income.several industrial applications, and used as an ingredient in animal feed. In addition, we sell by-products including salt,produce a specialty fertilizer, Trio®, which delivers three key nutrients, potassium, magnesium, and sulfur, in a single particle. We also provide water, magnesium chloride, brine and brine, whichvarious oilfield products and services.
Our extraction and production operations are recorded as a credit to our cost of goods sold. These by-product credits represented approximately 4% to 9% of total cost of goods soldconducted entirely in each of the last three years.
continental United States. We produce potash from three solution mining facilities: our HB solar solution mine in Carlsbad, New Mexico, a solarour solution mine in Moab, Utah and aour brine recovery mine in Wendover, Utah. We also operate theour North compaction facility in Carlsbad, New Mexico, which servicescompacts and granulates product from the HB mine. We produce Trio® from our conventional underground East mine in Carlsbad, New Mexico. In April 2016,Until mid-2016, we convertedalso produced potash from our East facility from a mixed-ore facility that produced both potash and Trio® to a Trio®-only facility. In July 2016, we idled mining operations at our West facilitymines in Carlsbad, New Mexico,Mexico.
We have permitted, licensed, declared and transitioned it intopartially adjudicated water rights in New Mexico. We sell a care-and-maintenance mode dueportion of water from these water rights to support oil and gas operations and development in the Permian Basin. We continually work to expand our sales of water.
In May 2019, we acquired certain land, water rights, federal and state grazing leases for cattle, and other related assets from Dinwiddie Cattle Company. We refer to these assets and operations as "Intrepid South." Due to the decline in potash prices at that time.strategic location of Intrepid South, part of our long-term operating strategy is selling small parcels of land to other companies, where such sales provide a solution to a company's need.
We have additional opportunities to develop mineralized depositsthree segments: potash, Trio®, and oilfield solutions. We account for the sale of byproducts as revenue in the potash in New Mexico, as well as to continueor Trio® segment based on which segment generated the optimizationbyproduct. For each of the years ended December 31, 2023, 2022, and 2021, a majority of our processing plants. These opportunities include additional solution mining activities, additional recoveries of langbeinite, development of by-product and water markets, and acceleration of production from our reserves.byproduct sales were accounted for in the potash segment.
Significant Business Trends and Activities
Our financial results have been, or are expected to be, impacted by several significant trends and activities, which are described below.including impacts from global health issues, such as the COVID-19 pandemic, and other global disruptions. Given the dynamic nature of such disruptions, we cannot reasonably estimate the impacts of such disruptions, if any, on our financial condition, results of operations, liquidity or cash flows in the future. We expect thesethat any such disruptions may have a material effect on revenue growth, financial condition, liquidity, and overall profitability in future reporting periods. Please see further discussion under "Item 1A. Risk Factors."
We expect that the trends todescribed below may continue to impact our results of operations, cash flows, and financial position.
| |
• | Trio®•Potash pricing and demand. Our 2017 Trio® sales volume increased by 57% over 2016 due to stronger domestic demand and increased international sales. However, pricing pressure from competitors lowered our average net realized sales price per ton for Trio® by 32% to $196 for 2017 compared to $287 for 2016, resulting in a gross deficit in our Trio® segment for 2017. Domestically, we expect pricing pressure from competitors to continue. In December 2017, we announced a price increase for Trio®, which we believe may indicate that the sales price is stabilizing after a sustained period of price declines that began in the second half of 2016. Internationally, freight costs incurred to ship product have negatively impacted our average net realized sales price per ton. |
We experience seasonality in domestic Trio® demand, with more purchases coming in the first and second quarters.demand. In turn, we generally see fewer purchases and increased inventory levels in the third and fourth quarters in anticipation of expected demand for the following year, although this trend may change as we increase international sales and adjust production volumes. We continue our efforts to expand our marketing reach for Trio®. Given the current pricing environment, we intend to operate our facilities at production levels that approximate expected demand and allow us to manage inventory levels.
We have been expanding our Trio® marketing efforts outside the United States. As a result, in 2017, we sold more tons of Trio® internationally than at any other time in our history.
| |
• | Potash pricing and demand. Our average net realized sales price for potash increased in 2017 to $238 per ton compared to $195 per ton for 2016. Over this same period, however, our potash sales decreased by 40% as we had fewer tons to sell after the transition of our East facility to Trio®-only in April 2016, and the idling of our West facility in July 2016. With lower production, we can be more selective in our sales to maximize our sales prices, which benefited our average net realized sales price and results for the year. During 2017, we increased our percentage of sales into the industrial and feed markets, which generally have higher average net realized sales prices than sales into the agricultural market.
|
Although production curtailments from us and other producers in 2015 and 2016 have reduced2023, potash supply in North America, global effective capacity continues to exceed demand. Potash prices areremained a significant driver of our profitability, comprising 47% of our total sales. Our average net realized sales price for our business. Domesticpotash decreased in 2023 to $466 per ton compared to $713 per ton for 2022. Agricultural pricing peaked at $800 per ton in April 2022 as a result of sanctions on Belarusian potash and concerns about global potash supply due to Russia's invasion of Ukraine. Prices started to decrease in the fall of 2022 as global potash production rates improved. Agricultural potash pricing was $480 per ton at the beginning of 2023 and decreased from there. Despite the declining potash price, demand remained strong throughout 2023 with two good
application seasons in the spring and fall supported by above average commodity prices. In January 2024, a winter-fill agricultural potash program was announced decreasing the list price to $385 per ton in January 2024 during a ten-day order window, before the list price increased by $30 per ton. We saw a good response to the program and expect distributors will continue to layer in tons as the 2024 spring season continues, with most distributors targeting minimal carryover inventory to end the spring. We expect to realize the increased price after the order window on certain spot sales in the first quarter of 2024. Our price expectations could be affected by, among other things, weather, planting decisions, rail car availability, commodity price decreases and the price and availability of other potassium products. As a smaller producer relative to the overall market, domestic pricing of our potash is influenced principally by the price established by our competitors. The interaction of global potash supply and demand, ocean, land, and barge freight rates, and currency fluctuations, and crop commodity values and outlook, also influence pricing.
The specific timing•Trio® pricing and demand. Our average net realized sales price for Trio® decreased to $321 per ton in 2023, compared to $479 per ton in 2022, as Trio® price generally followed price decreases in potash. After the January 2024 price announcement for potash, we maintained our posted Trio® price of when farmers apply potash remains highly$330 per ton for premium Trio®, $320 per ton for granular and $290 per ton for standard Trio®, which is approximately $75 per ton below the price levels in January 2023. We've seen good subscription for the 2024 spring season and similar to past years we expect distributors to target minimal carryover inventory into summer. Our ability to realize the increased prices may be affected by, among other things, weather, dependentplanting decisions, rail car availability, commodity price decreases, and varies across the numerous growing regions within the U.S. The timingprice and availability of potashother potassium products.
Overall average net realized sales is significantly influencedprice per ton for Trio® will continue to be impacted by the marketing programspercentage of potash producers, as well as storage volumes closerinternational sales, particularly to offshore markets. Competition from lower cost alternatives and freight costs continue to negatively impact our average net realized sales price per ton to offshore markets. We plan to continue a price-over-volume strategy internationally by focusing on those international markets where we obtain the farm gate. highest average net realized sales price per ton and thus the highest margin.
We also experience seasonality in potashdomestic Trio® demand, similar to domestic Trio®. The combination of these items results in variability in potash sales and shipments, thereby increasing volatility of sales volumes from quarter to quarter and season to season. Our sales volumes into the industrial market are correlated to drilling activitywith more purchases coming in the oilfirst and gas market.
Watersecond quarters in advance of the spring application season in the U.S. In turn, we generally have increased inventory levels in the third and by-product sales.fourth quarters in anticipation of expected demand for the following year. We continue to diversifyoperate our sourcesfacilities at reduced production levels that approximate expected demand and allow us to manage inventory levels.
•Water sales. Water sales decreased in 2023 to $15.2 million, compared to $22.4 million in 2022. The decrease is attributable to fewer fracs on our South Ranch and more fresh water used at our HB facility to improve injection rates while we complete the second phase of income by expandingour new HB injection pipeline. In addition to fewer fracs on our South Ranch in 2023, we purchased less water for resale resulting in fewer sales but also a corresponding decrease in costs. In 2023, we purchased $1.4 million of water for resale compared to $6.4 million in 2022. We continue to see certain operators switch to using exclusively recycled water or a combination of fresh water and by-products, particularlyrecycled water when completing wells. We believe this change is due to service the growing focus on water conservation efforts, environmentally responsible operations and the large amounts of produced water that is present in certain basins and formations, such as the Delaware Basin in southeast New Mexico. By recycling and reusing produced water, operators are able to reduce freshwater purchases and decrease the cost of transporting and disposing of produced water into disposal wells.
An update to legal proceedings concerning our water rights is contained in Note 14 to our audited consolidated financial statements included in "Item 8. Financial Statements and Supplementary Data" of this Annual Report.
•Byproduct sales. Byproduct sales increased to $30.6 million in 2023 compared to $26.7 million in 2022, driven primarily by a $1.7 million increase in magnesium chloride sales at our Wendover facility due to increased pricing. Byproduct brine sales into oil and gas markets nearin southeast New Mexico increased $0.9 million during 2023 as we successfully implemented multiple per-barrel price increases in 2023 while continuing to grow sales volumes. Byproduct water and salt sales both increased $0.7 million compared to the prior year.
•Strategic Focus on our operating plants. Solar Solution Mining Facilities. Key current and future projects include:
◦We havesuccessfully commissioned the Eddy Shaft Brine Extraction Project in October 2023 at our HB Solar Solution Mine. This project targets a meaningful amount of water rights under which we sell water primarily for industrial uses such assignificant, high-grade brine pool in the oilEddy Cavern that is estimated to contain approximately 270 million gallons of brine at an expected grade of over 9% potassium chloride (“KCl”). Access to this brine pool immediately increases the brine available to our pond system and gas services industry. We have put in place a diverse set of arrangements aimed at generating a long-term recurring revenue stream from water sales. We have pre-arranged water commitments of $15 million per year for each of the next five years. With these and other sales, we expect to generate $20 million to $30 million from water salessee incremental production contributions starting in 2018. the second half of 2024.
◦We also expect to continue to incur minimal expenditures associatedwork through the permitting and contracting processes for the replacement extraction well at our HB Solar Solution Mine and expect the well will be commissioned in the second quarter of 2024. This new extraction well is designed to have a long-term operational life and will initially target approximately
330 million gallons of high-grade brine from the Eddy Cavern at HB, with this revenue stream.
additional brine being at lower depths than the Eddy Shaft project can access.◦Phase Two of the HB Injection Pipeline Project is the installation of an in-line pigging system to clean the pipeline and remove scaling to help ensure more consistent flow rates. We also produce salt, magnesium chloride, and brines as by-products of our potash and Trio® operations. Our salt is used in a variety of markets. Magnesium chloride is typically used as a road-treatment agent. Our brines are used primarily bycontinue to work through the oil and gas industry to support well development and completion activities. The sales of these by-products are accounted for as by-product credits to our cost of goods sold.
Debt repayments and interest rates. During 2017, we repaid a total of $75 million of principal on our senior notes, decreasing the outstanding principal balance to $60 million at December 31, 2017, from $135 million at December 31, 2016. Of the $75 million, $57.2 million came from the net proceeds from an underwritten public offering of our common stockpermitting requirements with commissioning expected in the first half of 2024, assuming we have no further delays in permitting. Upon Phase 2 commissioning, we expect our brine injection rates to be the highest in company history, which is key for maximizing brine availability and residence time.
◦We started construction on a new primary pond in Wendover to increase the brine evaporative area, which will result in two primary ponds when complete. Similar to our caverns at Moab and HB, the primary ponds at Wendover serve as the brine storage area, and adding another primary pond will help us meet our goals of maximizing brine availability, increasing our brine grade, and improving our production. We expect this project to be commissioned in the third quarter of 2017, $5.52024.
•Diversification of products and services. Our revenue from brine and other oilfield products and services recorded in our oilfield solutions segment increased by $0.6 million camein 2023, compared to 2022, mainly driven by an increase in brine sales at Intrepid South. Brine sales from the sale of an asset, and the remainder came from cash generated from operations. The interest rates that we pay under our senior notes may adjust quarterly based on our financial performance. As our financial performance improvedHB facility are recorded as byproduct revenue in 2017, our weighted-average interest rates under our senior notes decreased from 8.32% for the first 10 months of 2017, to 4.32% beginning November 1, 2017. We expect our interest rates to remain at this level for 2018.
Weather impact. Our solar facilities experienced average to above-average evaporation rates during the 2016 evaporation season. As a result, our potash production from our solar solution facilities for 2017 increasedsegment. Our total brine sales and byproduct brine sales were $8.3 million during 2023, compared to 2016. $6.1 million during 2022.
We experienced average evaporation rates duringcontinue to progress on a sand mine opportunity at Intrepid South and have received all necessary permits to begin construction and full operation. We are currently evaluating the 2017 evaporation season, which will moderate 2018 potash production.market and our options, including the potential to add a strategic partner.
| |
• | Growth strategy. We are in the process of implementing or considering initiatives designed to maximize the value of our existing assets, such as through increased potash and Trio® production, and increased sales of water, salt, and brine. We are also exploring ways to potentially monetize the known but small lithium resource in our Wendover ponds. In addition, we may enter into new or complementary businesses that expand our product offerings beyond our existing assets, through the acquisition of companies or assets or otherwise. These efforts are at a very early exploratory stage and may not come to fruition.
|
Consolidated Results
| | | | | | | | | | | | | | | | |
| (in thousands) | | Year Ended December 31, |
| | 2023 | | 2022 | | |
Sales1 | | $ | 279,083 | | | $ | 337,568 | | | |
| | | | | | |
| Cost of Goods Sold | | $ | 187,278 | | | $ | 152,276 | | | |
| | | | | | |
| Gross Margin | | $ | 36,846 | | | $ | 141,408 | | | |
| | | | | | |
| (Loss) Income Before Income Taxes | | (44,062) | | | 96,509 | | | |
| Income Tax Benefit (Expense) | | 8,389 | | | (24,289) | | | |
| Net (Loss) Income | | $ | (35,673) | | | $ | 72,220 | | | |
| | | | | | |
Average Net Realized Sales Price per Ton2 | | | | | | |
| Potash | | $ | 466 | | | $ | 713 | | | |
Trio® | | $ | 321 | | | $ | 479 | | | |
|
| | | | | | | | | | | | |
| (in thousands) | | Year Ended December 31, |
| | | 2017 | | 2016 | | 2015 |
| Sales | | $ | 157,607 |
| | $ | 210,948 |
| | $ | 287,183 |
|
| | | | | | | |
Cost of Goods Sold1 | | $ | 105,795 |
| | $ | 170,852 |
| | $ | 217,821 |
|
| | | | | | | |
| Gross Margin (Deficit) | | $ | 5,779 |
| | $ | (29,247 | ) | | $ | (15,477 | ) |
|
| | | | | | | | | | | | |
| Net Loss | | $ | (22,910 | ) | | $ | (66,633 | ) | | $ | (524,776 | ) |
|
| | | | | | | | | |
| Production Volume (in thousands of tons): | | | | |
| Potash | | 359 |
| | 493 |
| | 768 |
|
| Langbeinite | | 243 |
| | 279 |
| | 162 |
|
| Sales Volume (in thousands of tons): | | | | | | |
| Potash | | 352 |
| | 681 |
| | 587 |
|
Trio® | | 229 |
| | 146 |
| | 163 |
|
|
| | | | | | | | | | | | |
Average Net Realized Sales Price per Ton2 | | | | |
| Potash | | $ | 238 |
| | $ | 195 |
| | $ | 339 |
|
Trio® | | $ | 196 |
| | $ | 287 |
| | $ | 364 |
|
1CostSales include sales of goods sold is presented net of by-product creditsbyproducts which were $10.6 million, $9.0$30.6 million and $7.9$26.7 million for the years ended December 31, 2017, 2016,2023 and 2015,2022, respectively.
2Average net realized sales price per ton is a non-GAAP measure that we calculate as sales less freight costs then divided by sales tons.measure. More information about this non-GAAP measure is below under the heading "Non-GAAP Financial Measure."
Consolidated Results for the Years Ended December 31, 2017,2023, and 20162022
TotalSales
Our total sales decreased $58.5 million, or 17% in 20172023, compared to 2022, as potash segment sales decreased $35.5 million, Trio® segment sales decreased $15.6 million, and our oilfield solutions segment sales decreased $7.4 million.
Our total potash segment sales decreased $35.5 million during 2023, compared to 2022, driven by a decrease of $37.4 million in potash sales. Our potash sales decreased as compared to 2016 due to significantly lower sales volume forour potash as we had fewer tons to sell after the transition of our East facility to Trio®-only in April 2016, and the idling of our West facility in July 2016. In addition, total sales were negatively impacted by a lower average net realized sales price per ton for Trio® due to pricing pressure from competitorsdecreased 35%, partially offset by a 16% increase in tons of potash sold. Generally strong crop prices supported good potash demand during 2023. Potash prices peaked during the second quarter of 2022 and higher freight costs for international sales. These decreases werehave steadily declined in each succeeding quarter as global production rates and product availability improved. The decrease in potash sales during 2023 was partially offset by an increase of $1.9 million in potash segment byproduct sales. The increase in potash segment byproduct sales was due to increased byproduct magnesium chloride sales and increased byproduct brine sales. Our byproduct magnesium chloride sales increased as we realized higher prices during 2023, compared to 2022. Our byproduct brine sales increased due to continuing strong oil and gas activities near our facilities in New Mexico during 2023.
Our total Trio® segment sales decreased by $15.6 million during 2023, compared to 2022, driven by a decrease of $17.6 million in Trio® sales. Our Trio® average net realized sales price per ton decreased 33% during 2023, partially offset by a 16% increase in tons of Trio® sold. Similar to potash, Trio® prices have declined in each succeeding quarter after peaking during the second quarter of 2022. Generally strong crop prices and lower Trio® prices drove good demand for Trio®. The decrease in Trio® sales was partially offset by an increase of $2.0 million in Trio® segment byproduct sales during 2023, as our Trio® byproduct water sales increased as a larger portion of our total water sales was byproduct water used in our Trio® production process.
Our oilfield solutions segment sales decreased by $7.4 million in 2023, compared to 2022, mainly driven by a decrease of $7.9 million in water sales during 2023. Water sales decreased as we purchased $5.0 million less in third-party water for resale in 2023, compared to 2022, and we used more water at our HB facility to improve injection rates while we complete the second phase of our new HB injection pipeline.
Cost of Goods Sold
Our total cost of goods sold increased $35.0 million, or 23%, in 2023, compared to 2022. Our potash segment cost of goods increased $20.9 million, or 27%, and our Trio® segment cost of goods sold increased $19.7 million, or 36%, partially offset by a decrease of $5.6 million, or 27%, in our oilfield solutions segment cost of goods sold.
Our potash segment cost of goods sold mainly increased due to selling 16% more tons of potash in 2023, compared to 2022. In addition to selling more tons of potash in 2023, our weighted average carrying cost per ton increased as production labor costs, including contract labor and benefits, increased in 2023. We also produced fewer tons of potash during 2023 compared to 2022 and, because most of our production costs are fixed, a decrease in tons produced causes our weighted average price per ton to increase.
Our Trio® segment cost of goods sold increased in 2023 compared to 2022 as we sold 16% more tons of Trio® in 2023, and our weighted average carrying costs increased as we incurred more production labor expenses and produced fewer tons compared to the prior year.
Our oilfield solutions segment cost of goods sold decreased in 2023, as we purchased $5.0 million less in third-party water for resale in 2023, compared to 2022.
Lower of Cost or Net Realizable Value Inventory Adjustments
During 2023, we recorded lower of cost or net realizable value inventory adjustments of $6.5 million as our weighted average carrying costs for certain potash and Trio® products exceeded our expected selling price for those products. As discussed above, our average net realized sales price per ton for potash and Trio® declined during 2023, and our weighted average carrying costs for potash and Trio® increased Trio® sales volume due to selling more tons internationally as we expand our marketing reach. During the years ended December 31, 2017, and 2016, 87% and 98%, respectively, of our total sales were in the United States, with the remaining sales primarily into Canada, Asia, and Latin America.
Cost of goods sold in 2017 decreased as compared to 2016 as all of our 2017 potash production now comes from our lower-cost solar evaporation solution mining facilities. During 2016, we stopped producing potash from our East and West conventional mining facilities, which previously represented our highest cost facilities. In addition, we increased by-products sales, which are recorded as a credit to our cost of goods sold.
During 2016, we recorded $20.4 million of lower-of-cost-or-market adjustments primarily related to the potash segment due to declining average net realized sales prices. During 2017, potash prices stabilized. However, we recorded $7.3 million of lower-of-cost-or-market adjustments primarily related to the decreases in Trio® pricing as compared to our carrying cost of Trio® inventory.
Net loss decreased in 2017 as compared to 2016 primarily due to the increase in our potash average net realized sales price per ton, the decrease in our total cost of goods sold and an increase in water and by-products sales.
Debt Restructuring Expense
In 2016, we had debt restructuring expense of $3.1 million relating to professional fees paid to third parties in connection with the restructuring of our senior notes and credit facility.during 2023. We did not haverecord any debt restructuring expenselower of cost or net realizable value inventory adjustments during 2022.
Gross Margin
Our gross margin percentage decreased to 13% in 2017.
Restructuring Expense
In 2017, we reduced our Trio® production to manage our product inventory levels. In connection with this action, we recorded $0.3 million in restructuring expense, primarily for severance related activities, all of which was paid in 2017.
In 2016, we recorded restructuring expenses of $2.7 million related to the conversion of our East facility to Trio®-only and the idling of our West facility.
Other Operating (Income) Expense
For 2017, we recorded other operating income of $2.8 million, which included $6.3 million in water sales, partially offset by the loss on the sale of an asset of approximately $1.7 million, a $1.1 million increase in the allowance for stores inventory obsolescence, and the recording of a one-time $0.6 million accrual related to land impact issues on or adjacent to our property in New Mexico.
For 2016, we recorded other operating income of $1.7 million primarily due to insurance proceeds received for damaged property during a December 2015 snowstorm in New Mexico, and an adjustment for compensating taxes.
Interest Expense
Interest expense increased $0.1 million in 2017 as2023, compared to 2016. Included42% in interest expense for 20172022. The decrease was $3.0 million of expense relating to make-whole payments in conjunction with principal prepayments of $75 million made on our senior secured notes, compared to $0.8 million relating to a make-whole payment in conjunction with a principal prepayment of $15 million made on our senior secured notes in 2016. This increase was offsetdriven primarily by a decrease in interest on our senior secured notes of $2.2 million as our outstanding principal balance decreased throughout 2017. The weighted-average interest rates on the senior notes decreased from 8.32% to 4.32% beginning November 1, 2017.
Consolidated Results for the Years Ended December 31, 2016, and 2015
Total sales in 2016 decreased as compared to 2015revenue due to lowerdecreases in our average net realized sales price per ton for both potash and Trio®, as well as lower sales volume forincreases in both potash and Trio®, partially offset by increased potash sales volume. Our total cost of goods sold, decreasedand recording lower of cost or net realizable value inventory adjustments during 2023.
Selling and Administrative Expense
In 2023, selling and administrative expenses increased $0.6 million or 2% from 2023. The increase in 20162023 was due mainly to increases in labor and benefits expense as compareda result of salary increases given to 2015 primarily from less depreciation on our assetsemployees in 2016 due to the impairmentApril 2023.
Impairment of long-lived assets in 2015, and from selling fewer potash tons from our East facility, previously our highest cost facility, which transitioned to Trio®-only production in the second quarter of 2016. Long-Lived Assets
During the yearsyear ended December 31, 2016, and 2015, 98% and 97%2023, we recorded total impairment charges of our total sales were in$43.3 million. During the United States, with the remaining sales primarily into Canada, Asia, and Latin America.year ended December 31, 2022, we recorded no impairment charges.
In total, our cost of goods sold decreased $46.9 million, or 22%, from $217.8 million in 2015 to $170.9 million in 2016. Due to the idling of our West facility, and the transition of our East facility to a Trio®-only facility, we sold fewer tons of potash from these facilities, which previously represented our highest cost facilities. Further, due to the impairment of long‑lived assets recorded in the fourth quarter of 2015, we recorded less depreciation expense in 2016.
Net loss for 2016 was $66.6 million, compared to a net loss for 2015 of $524.8 million, which primarily related to long-lived asset impairment charges of $323.8 million and an increase2023, given the decrease in our valuation allowancegross margin for our Trio® segment we determined that sufficient indicators of $300.3 million on our deferred tax assets.
Selling and Administrative Expense
Selling and administrative expenses decreased to $20.0 million in 2016 compared to $27.5 million in 2015 as a result of lower administrative headcount, aircraft-related costs, corporate facility rent expense and professional fees.
Debt Restructuring Expense
In 2016, we had debt restructuring expense of $3.1 million relating to professional fees paid to third parties in connection with the restructuringpotential impairment of our senior notesTrio® segment long-lived assets existed. We performed a recoverability test and credit facility. We did not have any debt restructuring expense in 2015.
Restructuring Expense
In January 2016, we undertook a number of cost-saving actions in response to continued downward pressure on potash prices. These actions includeddetermined that the elimination of a portioncarrying value of our workforce and reductions in compensation and benefits (including elimination of annual bonuses for 2015 and 2016 for most employees). Additionally, in connection withTrio® segment long-lived assets was not recoverable. We engaged a third-party valuation firm to determine the transitionfair value of our East facility to Trio®-only production in April 2016, the transitionsegment assets. The fair value of our West facility to care-and-maintenance modeTrio® segment assets was primarily determined using the expected proceeds received in July 2016, and the implementation of a reduced operating schedule at our East facility in December 2016, our overall headcount was approximately 48% less as of December 31, 2016, as compared to December 31, 2015. In connection with these events, we recorded restructuring expenses of approximately $2.7 million, primarily for severance related activities, the majority of which was paid in 2016.
Impairment of Long-Lived Assets
During 2015, in connection with our periodic evaluationan orderly sale of the recoverabilityindividual assets. The carrying value of our assets, due to the significant decrease in potash prices during the second half of 2015,Trio® segment asset group exceeded its fair value, and we recognizedrecorded an impairment charge of $323.8$31.9 million.
Our long-lived assets at our West facility have been in care and maintenance since July 2016. Given the length of time since the assets were placed in care and maintenance, we engaged a third-party valuation firm to determine if the fair value of the West assets supports the carrying value of those assets. The fair value of the West assets was determined using the expected proceeds received in an orderly sale of the individual assets. The carrying value of the West assets exceeded the fair value of those assets, and we recorded an impairment charge of $9.9 million during the fourth quarter of 2023.
Finally, during 2023, we recorded impairment charges of $1.5 million related to certain assets in our EastOilfield Solutions Segment, specifically certain water recycling equipment and West conventional mining facilities,an investment in a non-operating interest in an oil and our North facilitygas investment.
Loss on Sale or Disposal of Assets
During 2023, we recorded a $0.8 million loss on the sale or disposal of assets in New Mexico due to the continued decline in potash prices noted during this period.
Other Operating (Income) Expense
In December 2015, a snowstorm caused damagenormal course of business, compared to a portionloss of one of our warehouses in New Mexico and product stored in the warehouse. These damages, as well as alternative handling and storage costs were covered by our insurance policies at replacement value, less a $1$7.5 million deductible.during 2022. During the fourth quarter of 2015,2022, we recognized $2.5 worked on drilling a new extraction well for our HB solar solution mine. During the drilling process, the planned well failed and we expensed approximately $6.2
million of costs related to the project. In addition, we also incurred approximately $1.2 million in losses related to this snowstorm, and those losses are reflected in "Other operating (income) expense"the disposal of various other assets in the accompanying consolidated statementnormal course of operations.business.
Other Operating Expense
In the second quarter2023, we recognized other operating expense of 2016, we received $1.2$2.2 million compared to $4.7 million in insurance proceeds related to this event, and recognized that amount in "Other operating (income) expense" at that time.
In late 2014, we initiated legal action to protest property tax valuations in New Mexico. In the second quarter of 2015, we reached an agreement with the State of New Mexico that resulted in a net $2.0 million reduction in previously paid property taxes. Accordingly, as the inventory produced during 2014 has since been sold,2022. During 2023, we recorded the settlement in "Other operating (income) expense" during the second quarter of 2015.
Interest Expense
Interest expense increased to $11.6an additional $1.0 million in 2016, as compared to $6.4 million in 2015. This increase was the result of higher interest rates on our senior notes required as part of an amendment to the notes in 2016; an accelerated maturity date for our previous unsecured credit facility during 2016, which necessitated the expensing of deferred financing costs related to that facility;fines and the expensing of a modified make-whole paymentpenalties related to a $15trespass on federal surface minerals at Intrepid South. We settled this trespass issue with the BLM during 2023, and the matter is now closed. We also recorded $0.5 million principal paymentof additions in our allowance for obsolete inventory, $0.5 million in care and maintenance expenses and we accrued $0.4 million related to a potential violation of one of our environmental permits.
During 2022, we recorded $1.8 million of additions in our allowance for obsolete inventory, accrued $1.7 million for fines and penalties related to a trespass on federal surface minerals at Intrepid South, $1.6 million related to potential underpayment of royalties found during an ongoing royalty audit by the Department of the Interior's Office of Natural Resources Revenue ("ONRR") and care and maintenance expenses of $0.6 million.
Income Tax
During 2023 we recorded income tax benefit of $8.4 million compared to an income tax expense of $24.3 million in 2022. During 2023, we recorded a $1.1 million valuation allowance against certain state net operating loss carryforwards due to a change in the forecast of the amount of the loss carryforwards that may be used before expiration.
Net Income
Our 2023 net income decreased $107.9 million to a net loss of $35.7 million. The decrease was primarily due to the decreased gross margins in our senior notes.potash and Trio® segments and the impairment expense recorded in 2023.
Potash Segment Results
| | | | | | | | | | | | | | | | |
| | Year Ended December 31, |
| (in thousands) | | 2023 | | 2022 | | |
Sales1 | | $ | 155,920 | | | $ | 191,378 | | | |
| Less: Freight costs | | 14,753 | | | 14,780 | | | |
| Warehousing and handling costs | | 5,957 | | | 5,305 | | | |
| Cost of goods sold | | 97,452 | | | 76,524 | | | |
| Lower of cost or NRV inventory adjustments | | 2,709 | | | — | | | |
| | | | | | |
| Gross Margin | | $ | 35,049 | | | $ | 94,769 | | | |
Depreciation, Depletion, and Amortization Incurred2 | | $ | 28,378 | | | $ | 26,572 | | | |
| Potash Sales Volumes (tons in thousands) | | 258 | | | 222 | | | |
| Potash Production Volumes (tons in thousands) | | 224 | | | 270 | | | |
Average Potash Net Realized Sales Price per Ton3 | | $ | 466 | | | $ | 713 | | | |
|
| | | | | | | | | | | | |
| | | Year Ended December 31, |
| (in thousands) | | 2017 | | 2016 | | 2015 |
| Sales | | $ | 95,540 |
| | $ | 159,494 |
| | $ | 217,467 |
|
| Less: Freight costs | | 11,818 |
| | 26,661 |
| | 18,262 |
|
| Warehousing and handling costs | | 5,555 |
| | 8,439 |
| | 11,213 |
|
Cost of goods sold1 | | 61,948 |
| | 134,017 |
| | 172,355 |
|
| Lower-of-cost-or-market inventory adjustments | | 550 |
| | 18,380 |
| | 31,772 |
|
| Costs associated with abnormal production and other | | — |
| | 649 |
| | 10,405 |
|
| Gross Margin (Deficit) | | $ | 15,669 |
| | $ | (28,652 | ) | | $ | (26,540 | ) |
Depreciation, Depletion, and Amortization Incurred2, 3 | | $ | 27,839 |
| | $ | 37,936 |
| | $ | 68,562 |
|
| Sales Volumes (tons in thousands) | | 352 |
| | 681 |
| | 587 |
|
| Production Volumes (tons in thousands) | | 359 |
| | 493 |
| | 768 |
|
Average Net Realized Sales Price per Ton4 | | $ | 238 |
| | $ | 195 |
| | $ | 339 |
|
1Cost of goods sold is presented net of by-product creditsPotash segment sales include byproduct sales which were $10.6 million, $9.0$24.7 million and $7.9$22.8 million for the years ended December 31, 2017, 2016,2023, and 2015,2022, respectively.
2Depreciation, depletion, and amortization incurred excludes depreciation, depletion, and amortization amounts absorbed in or (relieved from) inventory.
3Depreciation expense decreased in 2016 compared to 2015 as a result of the impairment charge discussed above in the "Consolidated Results" section.
4Average net realized sales price per ton is a non-GAAP measure that we calculate as sales less freight costs then divided by sales tons.measure. More information about this non-GAAP measure is below under the heading "Non-GAAP Financial Measure."
Potash Segment Results for the Years Ended December 31, 2017,2023, and 20162022
Sales of Our total potash segment sales in 2023 decreased 40% for 2017,$35.5 million, or 19%, compared to 2016 primarily due to a 48% decrease2022, as potash sales recorded in sales volume,the potash segment decreased 22%, partially offset by a 22%an 8% increase in potash segment byproduct sales.
Potash sales recorded in the potash segment decreased $37.4 million, or 22%, in 2023 compared to 2022, as our potash average net realized sales price per ton for potash.decreased 35%, partially offset by a 16% increase in potash tons sold. Potash prices peaked during the second quarter of 2022 and steadily declined in each succeeding quarter as global production rates and
product availability improved. Our potash tons sold increased in 2023, as supporting farm commodity prices and lower potash prices continued to drive solid demand.
Potash segment byproduct sales volumesincreased $1.9 million, or 8%, in 2023 compared to 2022, due to a $1.7 million increase in byproduct magnesium chloride sales, a $0.9 million increase in byproduct brine sales, a $0.7 million increase in potash byproduct salt sales, partially offset by a decrease of $1.3 million in potash byproduct water sales. Our byproduct magnesium chloride sales increased as we realized higher prices during 2023, compared to 2022. Our byproduct brine sales increased due to continuing strong oil and gas activities near our facilities in New Mexico during 2023. Our byproduct salt sales increased due to strong demand from feed and industrial salt customers and higher realized pricing during 2023. Our potash byproduct water sales decreased as we had fewer tonsless byproduct water to sell afterbecause we used more water at our HB facility to improve injection rates as we work to complete the transitionsecond phase of our East facilitynew HB injection pipeline.
Potash cost of goods sold increased $20.9 million, or 27%, in 2023, compared to Trio®-only2022, mainly due to a 16% increase in April 2016potash tons sold. In addition, our weighted average carrying cost per ton increased mainly due to a 15%, or $3.8 million increase in production labor, contract labor, and the idlingbenefits expenses in 2023. Our total tons of potash produced decreased 17% in 2023, compared to 2022, which also increased our per ton production costs. Because most of our West facilityproduction costs are fixed, decreases in July 2016. With lower potash production, we have been more selectivetons produced result in our sales to maximize our sales prices which benefited our results for the year.higher per ton costs.
Potash segment freight costs decreased 56%expenses were virtually unchanged in 2017,2023, compared to 2016, as2022, even though we sold fewer tons. In addition, we continue to be16% more strategic abouttons of potash. Increases in potash freight expense from selling into areas where we havemore tons of potash in 2023 were offset by a geographic advantage, which positively impactsdecrease in freight costs. Freight costs also areexpense associated with our potash byproduct salt sales. Our freight expense is impacted by the proportion of customers paying for their own freight, therates charged by carriers, geographic distribution of our products and by the proportion of customers arranging for and paying their own freight rates of our carriers.
Cost of goods sold of potash decreased in 2017 compared to 2016 due to decreased sales and lower production costs as we no longer produce potash from higher-cost conventional mines. Depreciation, depletion, and amortization expense for potash decreased in 2017 as compared to 2016 because we accelerated depreciation on the potash assets at our East facility in the first quarter of 2016, in anticipation of the transition to Trio®-only production. Additionally, by-product sales, which are recorded as a credit to cost of goods sold, increased in 2017. During 2016, we recorded $18.4 million of lower-of-cost-or-market adjustments due to declining average net realized sales prices. As price stabilized in 2017, only $0.6 million of lower-of-cost-or-market adjustments for potash were recorded for the year ended December 31, 2017.
Production volume of potash decreased 27% in 2017, compared to 2016 as we stopped producing potash at our East and West facilities in 2016. All of our potash production in 2017 came from solar solution mining facilities, as compared to 55%, or 270,000 tons in 2016.
We routinely evaluate our production levels and costs to determine if any costs are associated with abnormal production. The assessment of normal production levels is judgmental and unique to each period. We recorded costs associated with abnormal production and other costs of $0.6 million in 2016, as potash production was temporarily suspended at the East facility related to testing for the conversion to Trio®-only production.
Potash Segment Results for the Years Ended December 31, 2016, and 2015costs.
We sold 681,000produced 17% fewer tons of potash during 2023 compared to 2022, due to reduced brine grades at our HB and Wendover facilities.
During 2023, we recorded $2.7 million in 2016 compared with 587,000 tons in 2015. In late 2015, there was significant uncertainty surrounding declininglower of cost or net realizable value inventory adjustments as our weighted average carry cost per ton exceeded our expected net realizable value per potash prices resulting from global and domesticton. As discussed above, our potash supplies exceeding demand. As a result, customers limited their exposure to inventory price risk and deferred purchases. In 2016, we saw increased purchases based on farmer demand.
Sales of potash decreased by $58.0 million, or 27%, to $159.5 million for the year ended December 31, 2016, from $217.5 million for the year ended December 31, 2015. This decrease was primarily the result of a 42% decrease in average net realized sales price per ton for potash partially offset by a 16% increasedecreased during 2023 while our weighted average carrying cost per ton increased in sales volume.2023. We did not record any lower of cost or net realizable value inventory adjustments during 2022.
Our potash freight costs increased to $26.7segment gross margin decreased $59.7 million in 2016 from $18.32023, compared to 2022, due to the $35.5 million decrease in 2015 as we sold more tons in 2016 than in 2015. Our freight costs are impacted by the proportion of customers paying for their own freight, the geographic distribution of our products and the freight rates of our carriers.
Totalpotash segment sales, increased cost of goods sold expense, and recording lower of potash, which includes royaltiescost or net realizable value inventory adjustments, as discussed above.
Our long-lived assets at our West facility have been in care and depreciation, depletionmaintenance since July 2016. Given the length of time since the assets were placed in care and amortization, decreasedmaintenance, we engaged a third-party valuation firm to determine if the fair value of the West assets supports the carrying value of those assets. The fair value of the West assets was determined using the expected proceeds received in 2016 compared to 2015 asan orderly sale of the individual assets. The carrying value of the West assets exceeded the fair value of those assets, and we recorded less depreciation in 2016 due to thean impairment charge of long-lived assets recorded in$9.9 million during the fourth quarter of 2015. Further, our potash cost of goods sold also benefited from the direct expensing of lower-of-cost-or-market adjustments and abnormal production costs related to reduced production at our East facility. We recorded lower-of-cost-or-market inventory adjustments, and costs associated with abnormal production and other costs, during 2016, of $18.4 million and $0.6 million respectively, which are excluded from our cost of goods sold.
Our production volume of potash in 2016 decreased to 493,000 tons, compared with 768,000 tons produced in 2015. Our potash production was lower as we stopped producing potash at our East facility in April 2016 and idled potash production at our West facility in July 2016.
We routinely evaluate our production levels and costs to determine if any costs are associated with abnormal production, as described under generally accepted accounting principles. The assessment of normal production levels is judgmental and unique to each period. During 2015, we received an order issued by MSHA related to maintenance issues and salt build-up in the ore hoisting shaft at our West mine. Upon issuance of the order, we suspended production at the West mine for 15 days while we took corrective actions to resolve the issues. As a result, potash production from our West mine was abnormally low during this period. Further, during 2015 and in the first quarter of 2016, we temporarily suspended potash production periodically at our East facility as we performed testing related to developing our plans to convert the East facility to a Trio®-only facility in April 2016. As a result of these temporary suspensions of production, during 2015, we determined that approximately $10.4 million of costs would have been allocated to additional potash tons produced, assuming we had been operating at normal production rates. Accordingly, these costs were excluded from our inventory values and instead directly
expensed in 2015 as production costs. As a result of the same analysis, $0.6 million of abnormal production costs were determined to have been incurred in 2016.2023.
Potash Segment - Additional Information
The table below shows our potash sales mix for 2017, 2016,2023, and 2015.2022.
| | | | | | | | | | | | | | | | |
| | Year Ended December 31, |
| | 2023 | | 2022 | | |
| Agricultural | | 74 | % | | 69 | % | | |
| Industrial | | 3 | % | | 8 | % | | |
| Feed | | 23 | % | | 23 | % | | |
Trio® Segment Results
|
| | | | | | | | | |
| | | Year Ended December 31, |
| | 2017 | | 2016 | | 2015 |
| Agricultural | | 77 | % | | 89 | % | | 75 | % |
| Industrial | | 10 | % | | 5 | % | | 17 | % |
| Feed | | 13 | % | | 6 | % | | 8 | % |
| | | | | | | | | | | | | | | | |
| | Year Ended December 31, |
| (in thousands) | | 2023 | | 2022 | | |
Sales1 | | $ | 102,182 | | | $ | 117,826 | | | |
| Less: Freight costs | | 23,211 | | | 19,661 | | | |
| Warehousing and handling costs | | 4,875 | | | 4,442 | | | |
| Cost of goods sold | | 74,308 | | | 54,600 | | | |
| Lower of cost or NRV inventory adjustments | | 3,783 | | | — | | | |
| | | | | | |
| Gross (Deficit) Margin | | $ | (3,995) | | | $ | 39,123 | | | |
Depreciation, Depletion, and Amortization incurred2 | | $ | 6,288 | | | $ | 4,370 | | | |
| Sales Volumes (tons in thousands) | | 228 | | | 197 | | | |
| Production Volumes (tons in thousands) | | 216 | | | 226 | | | |
Average Net Realized Sales Price per Ton3 | | $ | 321 | | | $ | 479 | | | |
Historically,1Trio® segment sales intoinclude byproduct sales which were $5.8 million and $3.9 million for the industrialyears ended December 31, 2023, and feed markets have carried a higher average net realized sales price per ton compared to sales into the agricultural market. As a result, we continue to work to increase the percentage of potash sales into the industrial and feed markets, which had a positive effect on our average net realized sales price per ton in 2017. Because of our geographic proximity to areas that have seen recent increases in oil and gas drilling activity, we believe that we have an opportunity to increase our industrial sales volumes to more historical percentages of our total volume, which have averaged 16% over the past ten years.2022, respectively.
|
| | | | | | | | | | | | |
| | | Year Ended December 31, |
| (in thousands) | | 2017 | | 2016 | | 2015 |
| Sales | | $ | 62,067 |
| | $ | 51,454 |
| | $ | 69,716 |
|
| Less: Freight costs | | 17,221 |
| | 9,595 |
| | 10,461 |
|
| Warehousing and handling costs | | 4,115 |
| | 2,567 |
| | 2,726 |
|
| Cost of goods sold | | 43,847 |
| | 36,835 |
| | 45,466 |
|
| Lower-of-cost-or-market inventory adjustments | | 6,774 |
| | 1,994 |
| | — |
|
| Costs associated with abnormal production and other | | — |
| | 1,058 |
| | — |
|
| Gross (Deficit) Margin | | $ | (9,890 | ) | | $ | (595 | ) | | $ | 11,063 |
|
Depreciation, Depletion, and Amortization incurred1, 2 | | $ | 6,783 |
| | $ | 3,836 |
| | $ | 16,993 |
|
| Sales Volumes (tons in thousands) | | 229 |
| | 146 |
| | 163 |
|
| Production Volumes (tons in thousands) | | 243 |
| | 279 |
| | 162 |
|
Average Net Realized Sales Price per Ton3 | | $ | 196 |
| | $ | 287 |
| | $ | 364 |
|
12Depreciation, depletion, and amortization incurred excludes depreciation, depletion, and amortization amounts absorbed in or (relieved from) inventory.
2Depreciation expense decreased in 2016 compared to 2015 as a result of the impairment charge discussed above in the "Consolidated Results" section.
3Average net realized sales price per ton is a non-GAAP measure that we calculate as sales less freight costs then divided by sales tons.measure. More information about this non-GAAP measure is below under the heading "Non-GAAP Financial Measure."
Trio® Segment Results for the Years Ended December 31, 2017,2023, and 20162022
Our total Trio® segment sales increased 21%decreased $15.6 million, or 13%, in 20172023, as compared to 2016, due to a 57% increase in2022, as Trio® sales volume,decreased $17.6 million, or 15%, partially offset by a 32% decrease$2.0 million increase, or 51%, in theTrio® segment byproduct sales.
Our 2023 Trio® sales decreased $17.6 million, or 15%, in 2023, as compared to 2022, as our average net realized sales price per ton of Trio®. Thedecreased 33%, partially offset by a 16% increase in Trio® tons sold. Similar to potash, Trio® prices peaked during the second quarter of 2022, and steadily declined in each succeeding quarter as global production rates and product availability of potassium fertilizers improved. Our increase in tons sold in 2023 benefited from the reduced sales volume wasvolumes we experienced in the second half of 2022, as customers delayed purchases in anticipation of lower price levels combined with overall strong commodity prices throughout 2023. Our Trio® byproduct sales increased $2.0 million in 2023 due to selling more tons internationally as we continue our efforts to expand our marketing reach for an increase in byproduct water sales.
Trio®. Our average net realized sales price per ton of Trio® was negativelyimpacted by pricing pressure from competitors and higher freight costs for international sales.
Trio®freight costs increased 79% for 201718% in 2023, compared to 2016 due2022, mainly related to thea 16% increase in Trio® tons sold. Our freight expense is impacted by the geographic distribution of our Trio®sales volumes and an increase in international sales, which carry higherby the proportion of customers arranging for and paying their own freight costs. Generally, our Trio® freight expense is higher than our potash freight expense because we sell potash to regional customers located closer to our production facilities.
Our Trio®segment cost of goods sold increased 19%36% in 20172023, compared to 20162022, driven by a 16% increase in Trio® tons sold combined with an increase in our per-ton production costs. We also began 2023 with a higher average cost per ton of inventory compared to 2022. Our Trio® production costs increased in 2023, compared to the prior year, due to a 6%, or $1.8 million, increase in labor and benefits, a 12%, or $1.8 million, increase in operating and maintenance supplies, a 49%, or $1.8 million increase in depreciation due to increased capital investments, and a 61%, or $1.0 million increase in property taxes and insurance, partially offset by a 22%, or $1.0 million decrease in royalty expense due to decreased sales revenue.
We recorded $3.8 million in lower of cost or net realizable value inventory adjustments in 2023, due to increased carrying costs of our Trio® inventory and lower realized prices compared to 2022.
Our Trio® segment gross margin decreased $43.1 million in 2023, compared 2022, due to the increase in sales volume in 2017. For the years ending December 31, 2017 and 2016, our Trio® cost of goods sold benefited from the direct expensing of lower-of-cost-or-market inventory adjustments of $6.8 million and $2.0 million, respectively, which are excluded from our cost of goods sold.factors discussed above.
The lower-of-cost-or-market inventory adjustments related to the decreases in Trio® pricing as compared to our carrying cost of Trio® inventory.
Trio® production decreased 13% in 2017 compared to 2016 as we curtailed production in 2017 to manage our product inventory levels.
Trio® Segment Results for the Years Ended December 31, 2016, and 2015
Total sales of Trio® decreased to $51.5 million for the year ended December 31, 2016 from $69.7 million for the year ended December 31, 2015, due to a $77 decrease in the average net realized sales price per ton of Trio®, further reduced by a 10% decrease in sales volume. As some of our domestic Trio® customers gained confidence in our inventory and production levels, they delayed purchases in late 2016 and moved to more of a just-in-time purchasing model as they await the traditional spring application season.
Our freight costs related to Trio® sales were $9.6 million in 2016 as compared to $10.5 million in 2015, as the volume of product sold decreased.
Total cost of goods sold of Trio® decreased on lower sales volumes in 2016 as compared to 2015. Further, our Trio® cost of goods sold decreased in 2016 as compared to 2015 as depreciation and depletion expense for Trio® was lower than in 2015 resulting from the impairment of long-lived assets at our East facility recorded inIn the fourth quarter of 2015. We also incurred lower production costs attributable to2023, given the conversiondecrease in our gross margin for our Trio® segment we determined that sufficient indicators of potential impairment of our East facilityTrio® segment long-lived assets existed. We performed a recoverability test and determined that the carrying value of our Trio® segment long-lived assets was not recoverable. We engaged a third-party valuation firm to adetermine the fair value of our Trio®-only facilitysegment assets. The fair value of our Trio® segment assets was primarily determined using the expected proceeds received in April 2016.
Ouran orderly sale of the individual assets. The carrying value of our Trio® production increased 72% in 2016 compared to 2015, as we transitioned our East facility to Trio®-only in April 2016.
In 2016, segment asset group exceeded its fair value of those assets, and we recorded $2.0 millionan impairment charge of lower-of-cost-or-market adjustments related to the decreases in Trio® pricing as compared to our carrying cost$31.9 million.
Further, in 2016, we recorded $1.1 million of abnormal production costs for the period which we transitioned our East facility from a mixed-ore processing facility that produced potash and Trio® to Trio®-only production in April 2016.
Trio® Segment - Additional Information
The table below shows the percentage of total Trio® sales that were sold internationally in the past three years. | | | | | | | | | | | | | | |
| | United States | | Export |
| For the year ended December 31, 2023 | | 86 | % | | 14 | % |
| For the year ended December 31, 2022 | | 82 | % | | 18 | % |
| For the year ended December 31, 2021 | | 92 | % | | 8 | % |
Oilfield Solutions Segment Results
|
| | | | | | |
| | | United States | | Export |
| For the year ended December 31, 2017 | | 72 | % | | 28 | % |
| For the year ended December 31, 2016 | | 94 | % | | 6 | % |
| For the year ended December 31, 2015 | | 91 | % | | 9 | % |
| | | | | | | | | | | | | | | | |
| | Year Ended December 31, |
| (in thousands) | | 2023 | | 2022 | | |
| Sales | | $ | 21,310 | | | $ | 28,668 | | | |
| | | | | | |
| Less: Cost of goods sold | | 15,518 | | | 21,152 | | | |
| Gross Margin | | $ | 5,792 | | | $ | 7,516 | | | |
| Depreciation, Depletion, and Amortization incurred | | $ | 3,849 | | | $ | 3,298 | | | |
Oilfield Solutions Segment Results for the Years Ended December 31, 2023, and 2022
Our oilfield solutions segment sales decreased 26% in 2023, compared to 2022. Water sales decreased $7.9 million in 2023 to $9.6 million, and revenue from right-of-way agreements, surface damages and easements decreased $0.7 million. Brine sales increased $1.4 million, and produced water disposal royalties increased $0.1 million during 2023, compared to 2022.
Water sales decreased as we purchased $5.0 million less in third-party water for resale in 2023, compared to 2022 and we used more water at our HB facility to improve injection rates while we complete the second phase of our new HB injection pipeline. Brine sales increased $1.4 million as we sold increased volumes of brine at a higher per-barrel price in 2023, compared to 2022. Oilfield solutions sales are highly correlated to oil and gas activities near our facilities in New Mexico and oil prices continued to support oil and gas exploration activities in the Permian Basin near our Intrepid South property in southeast New Mexico during 2023.
Cost of goods sold decreased 27% in 2023, compared to 2022, primarily due to a $5.0 million decrease in third-party water purchased for resale. We incurred $0.6 million in increased labor and benefits expenses and a $0.6 million increase in depreciation related to new infrastructure placed in service in 2023, compared to 2022. These increased costs were partially offset by a $0.5 million decrease in royalty expense in 2023, compared to 2022, due to reduced water sales.
Gross margin decreased $1.7 million, or 23%, in 2023 compared to 2022, due to the factors described above.
Specific Factors Affecting Our Results
Sales
Our gross sales are derived from the sales of potash, Trio®, water, salt, magnesium chloride, brine water and Trio®various other products and services offered to oil and gas producers. Total sales are determined by the quantities of product we sell and the sales prices we realize. WeFor potash, Trio® and salt, we quote prices to customers both on a delivered basis and on the basis of pick-up at our plants and warehouses. Freight costs are incurred on only a portionmost of our potash, Trio® and salt sales, as many of ourbut some customers arrange and pay for their own freight directly. When we arrange and pay for freight, our quotes and billings are based on expected freight costs to the points of delivery. When we calculate our potash and Trio® average net realized sales price per ton, we deduct any freight costs from grossincluded in sales before dividing by the number of tons sold. We believe the deduction of freight costs provides a more representative measure of our performance in the market due to variations caused by ongoing changes in the proportion of customers paying for their own freight, the geographic distribution of our products, and freight rates. Rail freightFreight rates have been steadily increasing, thereby negatively influencingand if we are unable to pass the increased freight costs on to the customer, our average net realized sales price per ton.ton is negatively affected. We manage our sales and marketing operations centrally and we work to achieve the highest average net realized sales price per ton we can by evaluating the product needs of our customers and associated logistics and then determining which of our production facilities can best satisfy these needs.
The volume of product we sell is determined by demand for our products and by our production capabilities. We operate our potash and Trio®facilities at production levels that approximate expected demand and take into accountconsider current inventory levels and expect to continue to do so for the foreseeable future.
Our water sales and other products and services offered through our oilfield solutions segment are driven by demand from oil and gas exploration companies drilling in the Permian Basin. As such, demand for our water and other products and services is generally stronger during a cyclical expansion of oil and gas drilling. Likewise, a cyclical contraction of oil and gas drilling may decrease demand for our water.
Cost of Goods Sold
Our cost of goods sold reflects the costs to produce our potash and Trio® products, less credits generated from the sale of our by-products.products. Many of our production costs are largely fixed and, consequently, our cost of sales per ton on a facility-by-facility basis tends to move inversely with the number of tons we produce, within the context of normal production levels. Prior to 2017, we experienced variability in our cost of goods sold due to the mix of product that we produced through conventional and solar solution mining. Our potash cost of goods sold per ton for our solar solution facilities is less than it previously was for our conventional facilities. Since July 2016, all of our potash production comes from solar solution mining. Our principal production costs include labor and employee benefits, maintenance materials, contract labor, and materials for operating or maintenance projects, natural gas, electricity, operating supplies, chemicals, depreciation and depletion, royalties, and leasing costs. There areSome elements of our cost structure associated with contract labor, consumable operating supplies, reagents, and royalties that are variable, whichbut such elements make up a smaller component of our cost base. Our costs often vary from period to period based on the fluctuation of inventory, sales, and production levels at our facilities.
Our production costs per ton are also impacted when our production levels change, due to factors such as changes in the grade of ore delivered to the plant, levels of mine development, plant operating performance, downtime, and annual maintenance turnarounds.downtime. We expect that our labor and contract labor costs in Carlsbad, New Mexico, will continue to be influenced most directly by the demand for labor in the local region where we compete for labor with another fertilizer company, companies in the oil and gas industry, and a nuclear waste processing and storage facility. Prior to converting our East facility to a Trio®-only facility, we mined in a complex, mixed ore body comprised of both sylvite and langbeinite. This complex ore was processed through a singular product flow at the surface facility. As a result of this complex ore body and the related complexities of processing the mixed ore at the surface, our cost structure at our East facility was our highest cost facility. Subsequent to the transition to mining in langbeinite areas and the conversion of our East facility to Trio®‑only, our cost structure was reduced as the process flow was simplified.
We pay royalties to federal, state, and private lessors under our mineral leases. These payments typically equal a percentage of sales (less freight) of minerals extracted and sold under the applicable lease. In some cases, federal royalties for potash are paid on a sliding scale that varyvaries with the grade of ore extracted. Our average royalty rate was 4.6%4.9%, 4.2%4.8%, and 4.1%4.7% in 2017, 2016,2023, 2022, and 2015,2021, respectively.
We incur costs to transfer water from our water source to our customers' facilities. Our operating costs depend on the distance and amount of water we must transfer. For water sold from certain of our water sources, we pay the State of New Mexico $0.11 per barrel of water sold. Additionally, water rights in New Mexico are subject to a stated point of diversion, purpose and place of use, and many of our water rights were originally issued for uses relating to our mining operations, or in the case of the water rights at Intrepid South, for agricultural uses. To sell water commercially under these rights, we must apply for a permit from the OSE to change point of diversion, purpose and/or place of use of the underlying water rights. Third parties often protest our applications and the decisions made by the OSE concerning the changes to our water rights permits. As we have worked to sell more water commercially, we have incurred significant legal expenses associated with defending our water rights as they proceed through adjudication and obtaining water permits and approvals.
Income Taxes
We are a subchapter C corporation and are therefore, are subject to U.S. federal and state income taxes on our taxable income. We recognize deferred tax assets and liabilities for the tax effect of temporary differences between the financial statement and tax basis of recorded assets and liabilities at enacted tax rates in effect when the related taxes are expected to be settled or realized. We also reduce deferred tax assets by a valuation allowance if it is more likely than not that some portion or all of the deferred tax assets will not be realized. Each reporting period we analyze if any additionalIn determining how much of a valuation allowance to recognize we consider our projections of future taxable income. All available evidence, both positive and negative, that may affect the realizability of deferred tax assets is necessary using historicalidentified and anticipated earnings amounts to determine if it is more likely than not that amounts will not be recovered.considered in determining the appropriate amount of the valuation allowance. We have concluded a valuation allowancesallowance of $221.6$3.2 million $326.1 million, and $300.6 million werewas required as of December 31, 2017, 2016,2023, and 2015, respectively.$2.0 million as of December 31, 2022.
The amount of valuation allowance decreased significantlyincreased in 20172023 as compared to 2016 as a result of re-computing our deferred tax assets at the lower enacted tax rate when these items will be recovered2022, due to the recently passed Tax Cuts and Jobs Act. The resulting decrease in our deferred tax assets correlates to a corresponding decreasechange in the valuation allowance.forecast of the amount of state net operating losses that may be used before expiration. Our effective tax rate for the years ended December 31, 2017, 2016,2023, 2022, and 20152021 was 10.8%19.0%, 2.0%25.2%, and (40.0)(509.9)%, respectively. Our effective income tax rates are impacted primarily by changes in the underlying tax rates in jurisdictions in which we are subject to income tax, the need for a valuation allowance or release, and permanent differences between book and tax income for the period, including the benefit associated with the estimated effect of the percentage depletion deduction.deduction and the expense for the estimated effect of the disallowed deduction for officers' compensation.
The effective tax rate for the year ended December 31, 2023, differs from the U.S. federal statutory rate primarily due to the change in the valuation allowance. The effective tax rate for the years ended December 31, 2022, and 2021, differs from the U.S. federal statutory rate due to state income taxes, and the change in valuation allowance, respectively.
During the year ended December 31, 2017, our effective2023, we recognized $8.5 million of deferred federal tax rate was primarily impacted by a $115.5benefit, $0.1 million decrease to ourof deferred state tax assets resulting from a rate change under the Tax Cutsexpense, and Jobs Act, and a net decrease to our valuation allowance$0.1 million of $104.5 million primarily from the Tax Cuts and Jobs Act's corresponding decrease to the valuation allowance. We also recorded a receivable of $2.6 million related to the monetization of our alternative minimumcurrent state income tax carryforwards based on a carryback, an election available to taxpayers for 2017, and on monetization made available from the Tax Cuts and Jobs Act.
expense. During the year ended December 31, 2016 our effective2022, we recognized $19.4 million of deferred federal tax rate was impacted primarily by the recordingexpense, $3.9 million of an addition to our valuation allowancedeferred state tax expense and $1.0 million of $25.5 million relating to deferredcurrent state income tax assets, including $34.6 million for federal and state net operating losses offset by reductions in the valuation allowance relating to deferred tax assets, including $6.7 million for property, plant, equipment and mineral properties, and $5.6 million for inventory. We also recorded a receivable of $1.4 million related to the monetization of a portion of our alternative minimum tax carryforwards based on an election made available to taxpayers for 2016.
Duringexpense. For the year ended December 31, 2015, our effective tax rate was impacted primarily by recording an additional valuation allowance of $300.3 million related to existing deferred tax assets, including $218.8 million for property, plant, equipment and mineral properties, $39.3 million for federal and state net operating losses, and $4.2 million for federal and state alternative minimum tax credits. The additional valuation allowance was recorded due to the uncertainty around our ability to generate sufficient taxable income to realize the deferred tax assets.
During the year ended December 31, 2017,2021, we recognized a$157.3 million deferred federal tax benefit, $51.7 million of $2.8 million. During the years ended December 31, 2016,deferred state tax benefit and 2015, we recognized an$0.2 million of current state income tax benefit of $1.4 million, and income tax expense of $150.0 million, respectively. In 2017, 2016, and 2015, we incurred net operating losses for income tax purposes, which have been carried forward as a deferred tax asset.expense.
The estimated statutory income tax rates that are applied to our current and deferred income tax calculations are impacted most significantly by the states in which we conduct business. Changing business conditions for normal business transactions and operations as well as changes to state tax rate and apportionment laws potentially alter our apportionment of income among the states for income tax purposes. These changes in apportionment laws result in changes in the calculation of our current and deferred income taxes, including the valuation of our deferred tax assets and liabilities. The effects of any such changes are recorded in the period of the adjustment. These adjustments can increase or decrease the net deferred tax asset on the balance sheet and impact the corresponding deferred tax benefit or deferred tax expense on the income statement.
A valuation allowance is recognized for deferred tax assets if it is more likely than not that a portion or all of the net deferred tax assets will not be realized. In making such a determination, we consider all available positive and negative evidence, including future reversals of existing taxable temporary differences, projected future taxable income, tax-planning strategies, and results of recent operations. As of December 31, 2023, we were in a cumulative three-year income position. The cumulative three-year income position is significant positive evidence when evaluating the realizability of our deferred tax assets. Additionally, industry trends and forecasts as well as internal forecasts of future business show sustained amounts of taxable income. Thus, we have concluded it is more likely than not that most of our $197.4 million of deferred tax assets will be realized.
Liquidity and Capital Resources
As of December 31, 2017, we had cash of $1.1 million, compared with cash of $4.5 million at December 31, 2016.
In March 2017, we issued 50.1 million shares of common stock in an underwritten public offering for net proceeds of $57.2 million, which was used to partially repay indebtedness. In September 2017, we also issued 0.5 million shares of common stock under our at-the-market offering program for net proceeds of $1.9 million, which was used for general corporate purposes.
Our operations have primarily been funded from cash on hand, and cash generated by operations. operations, and proceeds from debt and equity offerings. During 2023, we generated $43.2 million in cash flows from operating activities and we ended the year with $4.1 million of cash and cash equivalents, compared with $18.5 million at December 31, 2022.
As of December 31, 2023, we had $146.0 million available to borrow under our credit facility, $4.0 million in outstanding borrowings, and no outstanding letters of credit. With the remaining availability under our credit facility and expected cash generated from operations, we believe we have sufficient liquidity to meet our obligations for the next twelve months.
We continue to monitor our future sources and uses of cash and anticipate that we will adjust our capital allocation strategies, when, and if,as determined by our Board of Directors. We expect to continue to look for opportunities to improve our capital structure by reducing debt and its related interest expense. We may, at any time we deem conditions favorable, also attempt to improve our liquidity position by accessing debt or equity markets including through our at-the-market offering program, in accordance with our existing revolving credit agreement. We may also raise capital in the future through the issuance of additional equity or debt agreements. We cannot provide anysecurities, subject to prevailing market conditions. However, there is no assurance that we will pursue any of these transactions or that we will be successful in completing themable to successfully raise additional capital on acceptable terms toor at all.
We also have the ability to borrow under our credit facility, to the extent available and subject to the limitations described below under the heading "Credit Facility." At December 31, 2017, we had outstanding borrowings under our credit facility of $3.9 million and had $22 million available under the facility. We may use our credit facility as a source of liquidity for operating activities and to give us additional flexibility to finance, among other things, capital investments. With the availability under our credit facility and future cash generated from operations, we believe that we have sufficient liquidity for the next twelve months.
The following summarizes our cash flow activity for the years ended December 31, 2017, 2016,2023, and 2015:2022:
| | | | | | | | | | | | | | | | |
| | Year ended December 31, |
| | 2023 | | 2022 | | |
| | (In thousands) |
| Cash flows provided by operating activities | | $ | 43,229 | | | $ | 88,821 | | | |
| Cash flows used in investing activities | | $ | (59,554) | | | $ | (79,179) | | | |
| Cash flows provided by (used in) financing activities | | $ | 1,892 | | | $ | (27,704) | | | |
|
| | | | | | | | | | | | |
| | | Year ended December 31, |
| | | 2017 | | 2016 | | 2015 |
| | | (In thousands) |
| Cash flows provided by (used in) operating activities | | $ | 17,215 |
| | $ | (18,270 | ) | | $ | 22,690 |
|
| Cash flows (used in) provided by investing activities | | $ | (7,852 | ) | | $ | 32,510 |
| | $ | (79,577 | ) |
| Cash flows used in financing activities | | $ | (12,759 | ) | | $ | (19,083 | ) | | $ | (1,395 | ) |
Our debt agreements containrevolving credit agreement contains restrictions on our ability to declare and pay dividends. In general, the terms of our senior notes prohibit us from declaring and paying a dividend unless our leverage ratio is less than 3.5 to 1, our fixed charge coverage ratio after giving effect to the dividend would be greater than 1.3 to 1, and our cash on hand and availability under our credit facility after giving effect to the dividend, would not be less than $15 million. In addition, theThe terms of our credit facility prohibit us from declaring and paying a dividend unless availability under the credit facility after giving effect to the dividend and during a specified period before the dividend is more than $10$15 million. More information about how the financial ratios are calculated under our debt agreements is provided below under the heading "Senior Notes."
Operating Activities
Total cash provided by operating activities for the year ended December 31, 2017,2023, was $17.2$43.2 million, an increasea decrease of $35.5$45.6 million compared with the year ended December 31, 2016.2022. The primary driverdecrease was mainly driven by decreased potash and Trio® net realized sales prices. Prior year operating cash flows included a $32.6 million refund paid in September 2022 of this increase wasa customer's prepayment for future water deliveries.
Investing Activities
Total cash used in investing activities decreased $19.6 million in 2023, compared to 2022, primarily a result of an overall decrease in expenses leading to a $43.7$11.6 million decrease in purchases of investments compared to the prior year. In 2022, we invested $13.0 million of cash in investment grade, short-term debt instruments. Additions to property, plant, equipment, and mineral properties also decreased $3.5 million in 2023, compared to the prior year. Proceeds from the redemption/maturity of investments increased $3.5 million in 2023, compared to 2022.
Financing Activities
Total cash flows provided by financing activities increased $29.6 million in 2023, as compared to 2022. During 2022, we paid $22.0 million under a share repurchase program. We did not repurchase any shares in 2023. Proceeds from borrowings on the credit facility (net of repayments) increased $4.0 million and employee tax withholding paid for restricted shares upon vesting decreased $3.3 million in 2023, compared to the prior year. We did not have any outstanding borrowings under our net losscredit facility in 2022.
Share Repurchase Program
In February 2022, our Board of Directors approved a $35 million share repurchase program. Under the share repurchase program, we may repurchase shares from time to time in the open market or in privately negotiated transactions. The timing, volume and nature of share repurchases is at our sole discretion and is dependent on market conditions, liquidity, applicable securities laws, and other factors. We may suspend or discontinue the share repurchase program at any time. We made no repurchases of shares for the yeartwelve months ended December 31, 2017 compared to2023. For the yeartwelve months ended December 31, 2016.
Investing Activities
Total cash provided by investing activities decreased $40.42022, we repurchased 608,657 shares with a total cost of $22.0 million, in 2017, compared to 2016. In 2016, we sold allor a weighted average price per share of our investments to fund operations. The change from proceeds from the sale of investments in 2016, was offset in 2017, by the sale of an asset and less capital expenditures
Financing Activities
Total cash flows used in financing activities decreased $6.3 million in 2017, as compared to 2016, due to the repayment of $75 million of Notes, partially offset by the proceeds from the equity offerings.
Senior Notes
$36.17. As of December 31, 2017,2023, we had outstanding $60have approximately $13.0 million of senior notes (the "Notes") consistingremaining availability under the share repurchase program.
Credit Facility
In August 2022, we and certain of our subsidiaries entered into the following series:
$24Second Amended and Restated Credit Agreement with a syndicate of lenders with the Bank of Montreal, as administrative agent, which provides for a revolving credit facility. The agreement amended our existing revolving credit facility to, among other things, increase the amount available under the facility from $75 million of Senior Notes, Series A, due April 16, 2020
$18 million of Senior Notes, Series B, due April 14, 2023
$18 million of Senior Notes, Series C, due April 16, 2025
We originally issuedto $150 million, ofextend the Notes in 2013. Since the beginning of the fourth quarter of 2016, we have repaid an aggregate principal amount of $90 million of the Notes, including $75 million paid in the year ended December 31, 2017. In June 2017, we entered into an amendment with the holders of the Notes that requires usmaturity date to prepay an additional $10 million of the Notes, together with accrued interestAugust 4, 2027, and transition from LIBOR (London Interbank Offered Rate) to SOFR (Secured Overnight Financing Rate) as a make-whole amount, on or before December 31, 2018, of which none had been paid as of December 31, 2017. The June 2017 amendment also altered the methodology for determining the variable interestreference rate for borrowings under the Notes, thoughcredit agreement. Borrowings under the amended credit facility bear interest rates will continueat SOFR plus an applicable margin of 1.50% to be2.25% per annum, based on our financial performanceleverage ratio as measured by certain financial covenant levels, and modified certain terms regardingcalculated in accordance with the mandatory redemptions or offers of prepayment to the holders of the Notes.
Theamended agreement governing the Notes provides forrevolving credit facility. Borrowings under the following:
We granted to the collateral agent for the noteholders a first lien on substantially all of our non-current assets and second lien onrevolving credit facility are secured by substantially all of our current assets.
The agreement requires us to maintain a minimum trailing twelve-month adjusted EBITDA, which is measured quarterly through March 2018, of negative $7.5 million. Adjusted EBITDA is a non-GAAP measure that is calculated as adjusted earnings before interest, income taxes, depreciation, amortization, and certain other expenses fornon-current assets, and the prior four quarters, as defined under the agreement. Our adjusted EBITDA as calculated under the agreement was $25.9 million for the four quarters ended December 31, 2017, satisfying the adjusted EBITDA covenant.
The agreement requires us to maintain minimum liquidity of $15 million as of the last day of any month ending on or prior to March 31, 2018, and monthly thereafter if we do not meet certain financial covenants. Liquidity is calculated as unencumbered cash and unused availability under our credit facility. Our liquidity as calculated under the agreement was $23.1 million as of December 31, 2017, satisfying the liquidity covenant.
The agreement requires us to maintain a minimum fixed charge coverage amount of negative $15 million and negative $10 million for the quarters ending June 30, 2018, and September 30, 2018, respectively. The agreement also includes requirements relating to a leverage ratio and a fixed charge coverage ratio to be tested on a quarterly basis commencing with the quarter ending June 30, 2018, with respect to the leverage ratio, and
December 31, 2018, with respect to the fixed charge coverage ratio. The maximum leverage ratio will be 11.5 to 1.0 for the quarter ending June 30, 2018, and decreases to 3.5 to 1.0 for the quarter ending September 30, 2019, and each quarter thereafter. The minimum fixed charge coverage ratio will be 0.25 to 1.0 for the quarter ending December 31, 2018, and increases to 1.3 to 1.0 for the quarter ending September 30, 2019, and each quarter thereafter. In general, our fixed charge coverage amount is calculated as adjusted EBITDA for the prior four quarters, minus capital expenditures, cash paid for income taxes, and interest expense plus scheduled principal amortization of long-term funded indebtedness; our leverage ratio is calculated as the ratio of funded indebtedness to adjusted EBITDA for the prior four quarters; and our fixed charge coverage ratio is calculated as the ratio of adjusted EBITDA for the prior four quarters, minus capital expenditures and cash paid for income taxes, to interest expense plus scheduled principal amortization of long-term funded indebtedness. As of December 31, 2017, our fixed charge coverage amount was a negative $0.5 million, our leverage ratio was 2.5 to 1.0, and our fixed charge coverage ratio was 0.9 to 1.0.
The interest rates on the Notes may adjust quarterly based on our leverage ratio and an adjusted fixed charge coverage ratio. As our financial position improves as measured by these ratios, we pay lower interest rates under the Notes. For the ten months ended October 31, 2017, the interest rates on the Notes were 7.73% for the Series A Notes, 8.63% for the Series B Notes and 8.78% for the Series C Notes. Beginning November 1, 2017, the interest rates on the Notes were reduced to 3.73% for the Series A Notes, 4.63% for the Series B Notes and 4.78% for the Series C Notes. These rates represent the lowest interest rates available under the Notes. In addition, additional interest of 2%, which may be paid in kind, will begin to accrue on April 1, 2018, unless we satisfy certain financial covenant tests. We currently expect to satisfy these tests.
We are required to offer to prepay the Notes with the proceeds of dispositions of certain specified property and with the proceeds of certain equity issuances, as set forth in the agreement.
The obligations under the Notescredit facility are unconditionally guaranteed by several of our subsidiaries.
We were in compliance with the applicable covenants under the agreement governing the Notes as of December 31, 2017.
Our outstanding long-term debt, net, as of December 31, 2017, and 2016 is as follows (in thousands):
|
| | | | | | | |
| | December 31, |
| | 2017 | | 2016 |
| Notes, at carrying value | $ | 60,000 |
| | $ | 135,000 |
|
| Less current portion of Notes | (10,000 | ) | | — |
|
| Less deferred financing costs | (563 | ) | | (1,566 | ) |
| Long-term portion of Notes, net | $ | 49,437 |
| | $ | 133,434 |
|
Credit Facility
In October 2016, we entered into a credit agreement with Bank of Montreal that provides an asset-based revolving credit facility of up to $35 million in aggregate principal amount.
In June 2017, we amended the agreement to extend the maturity date to October 31, 2019, and to permit up to $10 million of borrowings under the agreement to be used to make payments on the Notes.
The credit facility allows us to borrow up to $35 million, subject to monthly borrowing base limits based on our inventory and receivables. If our total remaining availability under the credit facility was to fall below $6 million, we would be subject to a minimum fixed charge coverage ratio of 1 to 1, which we would not currently meet. Any borrowings on the credit facility bear interest at 1.75% to 2.25% above LIBOR (London Interbank Offered Rate), based on average availability under the credit facility. We have granted to Bank of Montreal a first lien on substantially all of our current assets and a second lien on substantially all of our non-current assets. We regularlyoccasionally borrow and repay amounts under the facility for near-term working capital needs or other purposes and may do so in the future. For the year ended December 31, 2017,2023, we borrowed $22.0made $9.0 million in borrowings and repaid $18.1$5.0 million in repayments under the facility. For the year ended December 31, 2022, we made no borrowings and made no repayments under the facility. As of December 31, 2017,2023, we had $3.9$4.0 million ofin borrowings outstanding and $3.1 million inno outstanding letters of credit under the facility. Considering theAs of December 31, 2022, we had no borrowings outstanding borrowings and letters$1.0 million in an outstanding letter of credit andunder the fixed charge coverage ratio requirement described above, we have $22.0facility. We had $146.0 million available under the facility as of December 31, 2017.2023.
We were in compliance with the applicable covenants under the facility as of December 31, 2017.
At-the-Market Offering Program
In May 2017, we established an at-the-market offering program, which gives us the capacity to issue up to $40 million of our common stock. In September 2017, we issued 539,110 shares of common stock under the at-the-market offering program for gross proceeds of $2.2 million. We paid sales commissions to our sales agent of $0.1 million and incurred other offering related expenses of $0.2 million. Net proceeds of $1.9 million were used for general corporate purposes. After taking into account the gross proceeds received under the at-the-market offering program in September 2017, we have remaining capacity to issue up to $37.8 million of additional shares of common stock under the program.
2023.
Capital Investments
During 2023, we paid cash of $65.1 million to acquire property, plant, equipment, and mineral properties.
We expect to make capital investments in 20182024 of $12$40 million to $16$50 million. We anticipate spending approximately $20 million to $25 million on sustaining capital projects in 2024, with the majorityremainder of our estimated spending on opportunity projects, which we expect to be sustaining capital.include the completion of phase two of our new HB injection pipeline project, a new extraction well at our HB mine, and a new primary pond at our Wendover facility. We may adjust our investment plans as our expectations for 2024 change. We anticipate our 20182024 operating plans and capital programs will be funded out of operating cash flows and existing cash. We may also use our revolving credit facility, to the extent available, to fund capital investments.
During 2017, we paid cash of $13.5 million for capital projects, the majority of which was sustaining capital.
Contractual Obligations
As of December 31, 2017, we had contractual obligations totaling $159.4 million on an undiscounted basis, as indicated below. Contractual commitments shown are for the full calendar year indicated unless otherwise indicated.
|
| | | | | | | | | | | | | | | | | | | | | | | | | | | | |
| | | Payments Due By Period |
| | | Total | | 2018 | | 2019 | | 2020 | | 2021 | | 2022 | | More Than 5 Years |
| | | (In thousands) |
| Long-term debt | | $ | 60,000 |
| | $ | 10,000 |
| | $ | — |
| | $ | 20,000 |
| | $ | — |
| | $ | — |
| | $ | 30,000 |
|
Variable rate interest obligations on long-term debt1 | | 11,684 |
| | 2,689 |
| | 2,247 |
| | 1,785 |
| | 1,412 |
| | 1,412 |
| | 2,139 |
|
Operating lease obligations2 | | 6,663 |
| | 2,400 |
| | 1,369 |
| | 977 |
| | 661 |
| | 442 |
| | 814 |
|
Purchase commitments3 | | 5,702 |
| | 5,682 |
| | 20 |
| | — |
| | — |
| | — |
| | — |
|
Asset retirement obligation4 | | 59,434 |
| | 35 |
| | — |
| | 2,597 |
| | 1,325 |
| | 1,325 |
| | 54,152 |
|
Minimum royalty payments5 | | 15,875 |
| | 635 |
| | 635 |
| | 635 |
| | 635 |
| | 635 |
| | 12,700 |
|
| Total | | $ | 159,358 |
| | $ | 21,441 |
| | $ | 4,271 |
| | $ | 25,994 |
| | $ | 4,033 |
| | $ | 3,814 |
| | $ | 99,805 |
|
| |
1
| See "Senior Notes" section above for more detail on the variable rate interest associated with our long-term debt. Amounts in the table above represent interest calculated at rates in effect as of December 31, 2017. |
| |
2
| Amounts include all operating lease payments, inclusive of sales tax, for leases for office space, railcars, and other equipment. |
| |
3
| Purchase contractual commitments include the approximate amount due to vendors for non-cancelable purchase commitments for materials and services. |
| |
4
| We are obligated to reclaim and remediate lands that our operations have disturbed, but, because of the long-term nature of our reserves and facilities, we estimate that the majority of those expenditures will not be required until after 2022. Although our reclamation obligation activities are not required to begin until after we cease operations, we anticipate certain activities to occur prior to then related to reclamation of facilities that have been replaced with newly constructed assets, as well as certain shaft closure activities for shafts that are no longer in use. Commitments shown are in today's dollars and are undiscounted. |
| |
5
| Estimated annual minimum royalties due under mineral leases, assuming approximately a 25-year life, consistent with estimated useful lives of plant assets. |
Off-Balance Sheet Arrangements
As of December 31, 2017, we had no material off-balance sheet arrangements aside from the operating leases described above under "Contractual Obligations" and bonding obligations described in the Notes to the Consolidated Financial Statements in this Annual Report on Form 10-K.
Critical Accounting Policies and Estimates
Our discussion and analysis of our financial condition and results of operations are based upon our consolidated financial statements, which have been prepared in accordance with GAAP. The preparation of the consolidated financial statements in conformity with GAAP requires management to make estimates and assumptions that affect the amounts reported in our financial statements. Actual results could differ from our estimates and assumptions, and these differences could result in material changes to our financial statements. The following discussion presents information about our most critical accounting policies and estimates.
Our significant accounting policies are further described in Note 2 to our audited consolidated financial statements for the year ended December 31, 2017, included elsewhere in "Item 8. Financial Statements and Supplemental Data" of this Annual Report on Form 10-K.
Revenue Recognition
Revenue is recognized when evidenceReport. We believe the following accounting policies include a higher degree of an arrangement exists, riskssubjective and rewards of ownership have been transferredcomplex judgments in their application and are most critical to customers, which is generally when title passes, the selling price is fixedaid in fully understanding and determinable,evaluating our reported financial condition and collection is reasonably assured. Title passes at the designated shipping point for the majority of sales, but, in a few cases, title passes at the delivery destination. The shipping point may be the plant, a distribution warehouse, a customer warehouse, or a port. Title passes for some international shipments upon payment by the purchaser; however, revenue is not recognized for these transactions until shipment because the risks and rewards of ownership have not transferred pursuant to a contractual arrangement. Prices are generally set at the time of, or prior to, shipment. In cases where the final price is determined after shipment and agreed to with our customer, revenue is recognized when the final sales price is fixed and determinable and the other revenue recognition criteria have been met.
Sales are reported on a gross basis. We quote prices to customers both on a delivered basis and on the basis of pick‑up at our plants and warehouses. When a sale occurs on a delivered basis, we incur and, in turn, bill the customer and record as gross revenue the product sales value, freight, packaging, and certain other distribution costs. Many customers, however, arrange and pay for these costs directly and, in these situations, only the product sales are included in gross revenues.
Application of this policy requires that we make estimates regarding creditworthiness of the customer, which impacts the timing of revenue recognition and, ultimately, the determination of allowance for doubtful accounts. We make those estimates based on the most recent information available and historical experience, but they may be affected by subsequent changes in market conditions.
Property, Plant, and Equipment
Property, plant, and equipment are stated at historical cost. Expenditures for property, plant, and equipment relating to new assets or improvements are capitalized, provided the expenditure extends the useful life of an asset or extends the asset's functionality. Property, plant, and equipment are depreciated under the straight-line method using estimated useful lives. No depreciation is taken on assets classified as construction in progress until the asset is placed into service. Gains or losses are recorded upon retirement, sale or disposal of assets. Maintenance and repair costs are recognized as period costs when incurred. Capitalized interest, to the extent of debt outstanding, is calculated and assigned to assets that are being constructed, drilled, being built or otherwise are classified as construction in progress.
Mineral Properties and Development Costs
Mineral properties and development costs, which are referred to collectively as mineral properties, include acquisition costs, the cost of drilling wells, and the cost of other development work, all of which are capitalized. Depletion of mineral properties is calculated using the units-of-production method over the estimated life of the relevant ore body. The lives of reserves used for accounting purposes are shorter than current reserve life determinations due to uncertainties inherent in long-term estimates. We have prepared these reserve life estimates and they have been reviewed and independently determined by mine consultants. Tons of potash and langbeinite in the proven and probable reserves are expressed in terms of expected finished tons of product to be realized, net of estimated losses. Market price fluctuations of potash or Trio®, as well as increased production costs or reduced recovery rates, could render proven and probable reserves containing relatively lower grades of mineralization uneconomic to exploit and might result in a reduction of reserves. In addition, the provisions of our mineral leases, including royalties payable, are subject to periodic readjustment by the state and federal government, which could affect the economics of our reserve estimates. Significant changes in the estimated reserves could have a material impact on our results of operations and financial position.
Inventory and Long-Term Parts Inventory
Inventory consists of product and by-product stocks that are ready for sale; mined ore; potash in evaporation ponds, which is considered work-in-process; and parts and supplies inventory. Product and by-product inventory cost is determined using the lower of weighted average cost or estimated net realizable value and includes direct costs, maintenance, operational overhead, depreciation, depletion, and equipment lease costs applicable to the production process. Direct costs, maintenance, and operational overhead include labor and associated benefits.
We evaluate production levels and costs to determine if any should be deemed abnormal and therefore excluded from inventory costs and expensed directly during the applicable period. The assessment of normal production levels is judgmental and unique to each period. We model normal production levels and evaluate historical ranges of production by operating plant in assessing what is deemed to be normal.
Parts inventory, including critical spares, that is not expected to be used within a period of one year is classified as non-current. Parts and supply inventory cost is determined using the lower of average acquisition cost or estimated replacement cost. Detailed reviews are performed related to the net realizable value of parts inventory, giving consideration to quality, slow-
moving items, obsolescence, excessive levels, and other factors. Parts inventories that have not turned over in more than a year, excluding parts classified as critical spares, are reviewed for obsolescence and, if deemed appropriate, are included in the determination of an allowance for obsolescence.operations.
Recoverability of Long-Lived Assets
We evaluate our long-lived assets for impairment when events or changes in circumstances indicate that the related carrying amount may not be recoverable. An impairment is potentially considered to potentially exist if an asset group's total estimated net future cash flows on an undiscounted basis are less than the carrying amount of the related asset. An impairment loss is measured and recorded based on the excess of the carrying amount of long-lived assets over its estimated fair value. Changes in significant assumptions underlying future cash flow estimates or fair values of asset groups may have a material effect on our financial position and results of operations. Sales price is a significant element of any cash flow estimate, particularly for higher cost operations. Other assumptions
In 2023, we estimate include, among other things, the economic life of the asset, sales volume, inflation, raw materials costs, cost of capital, tax rates and capital spending. These assumptions do not change in isolation; therefore, it is not practicable to present the impact of changing a single assumption.
Factors we generally will consider important and which could triggerrecorded an impairment reviewcharge for long-lived assets and mineral properties at two of our facilities in New Mexico. The impairment charge equals the difference between the carrying value of long-livedthe assets includeor asset group and the following:
significant underperformance relative to expected operating resultsestimated fair value of the assets or operating losses
significant changesasset group. We estimated the fair value of mineral properties using a discounted cash flow technique and we used the estimated fair value of the other assets using estimated proceeds received in an orderly sale of these assets. Significant estimates used in the mannerestimated fair values include inputs to arrive at estimated net cash flows, such as product selling prices, volumes of useproduct sold, and production costs. Estimated proceeds received in an orderly sale of an asset have a high degree of subjectivity and actual proceeds received in an orderly sale of assets may vary from the estimates used, which may result in further impairment charges.
Reserves and Resources
We prepare our reserves and resources estimates in accordance with SEC requirements. We have prepared these reserve and resources estimates and they have been reviewed and independently determined by mine consultants. We express tons of potash and langbeinite in resources and reserves in terms of expected finished tons of product to be realized, net of estimated losses. Market price fluctuations of potash or the strategy forTrio®, as well as increased production costs or reduced recovery rates, could render resources and reserves containing relatively lower grades of mineralization uneconomic to exploit and might result in a reduction of resources and reserves. We updated our overall business
the denial or delay of necessary permits or approvals that would affect the utilization of our tangible assets
underutilization of our tangible assets
discontinuance of certain products by us or our customers
a decrease in estimated mineral reserves
significant negative industry or economic trends
Although we believe the carrying values of our long-lived assets were realizable and resources as of December 31, 2023, and we determined we do not have any mineral reserves at our East facility because the balance sheet dates, future eventsmineral deposit could cause usnot be economically extracted. All mineral deposits at our East facility are categorized as a mineral resource. A mineral reserve is defined as that part of a mineral deposit which can be economically and legally extracted. A mineral resource refers to conclude otherwise.a concentration or occurrence of material deposits of economic interest.
Asset Retirement Obligation
AllWe deplete our mineral properties using the units-of-production method. Under this method, we determine a depletion rate for one ton of our miningfinished product by dividing the total mineral properties involve certain reclamation liabilities as requirednet balance by the states innumber expected finished tons of product, which they operate oris obtained from the resources and reserve estimates. Depletion expense is calculated by multiplying the number of tons of product produced by the BLM. Reclamation costs are initially recorded as a liability associated with the asset to be reclaimed or abandoned, based on applicable inflation assumptions and discount rates. The accretion of this discounted liability is recognized as expense over the life of the related assets, and the liability is periodically adjusted to reflect changes in the estimates of the time or amount of the reclamation and abandonment costs. These asset retirement obligations are reviewed and updated at least annually with any changes in balances recorded as adjustments to the related assets and liabilities. The estimates of amounts to be spent are subject to considerable uncertainty and long timeframes. Changes in these estimates could have a material impact on our results of operations and financial position.
Planned Turnaround Maintenance
Each production operation typically shuts down periodically for planned maintenance activities. Our New Mexico operations have historically shut down for up to two weeks to perform turnaround maintenance. Generally, our HB, Moab, and Wendover operations cease harvesting potash from our solar ponds during one or more summer months to make the most of the evaporation season. During these summer turnarounds, annual maintenance is performed. The costs of maintenance turnarounds at our facilities are considered part of production costs and are absorbed into inventory in the period incurred.depletion rate per ton.
Income Taxes
We are a subchapter C corporation and therefore are subject to U.S. federal and state income taxes. We recognize income taxes under the asset and liability method. Deferred tax assets and liabilities are recognized for the estimated future tax consequences attributable to differences between the financial statement carrying amounts of assets and liabilities and their respective tax bases. Deferred tax assets and liabilities are measured using the enacted tax rates expected to apply to taxable income in the periods in which the deferred tax liability or asset is expected to be settled or realized. We record a valuation allowance if it is deemed more likely than not that our deferred income tax assets will not be realized in full; such determinations are subject to ongoing assessment.
We account for stock‑based compensation by recording expense using the fair value
market based conditions. The expense associated with these awards is recognized over the service period associated with each issuance.
Non-GAAP Financial Measure
To supplement our consolidated financial statements, which are prepared and presented in accordance with GAAP, from time to time we use "average net realized sales price per ton," which is a non-GAAP financial measure, to monitor and evaluate our performance.measure. This non-GAAP financial measure should not be considered in isolation or as a substitute for, or superior to, the financial information prepared and presented in accordance with GAAP. In addition, because the presentation of this non-GAAP financial measure varies among companies, our presentation of this non-GAAP financial measure may not be comparable to similarly titled measures used by other companies.
We believe average net realized sales price per ton provides useful information to investors for analysis of our business. We use this non-GAAP financial measure as one of our tools in comparing period-over-period performance on a consistent basis and when planning, forecasting, and analyzing future periods. We believe this non-GAAP financial measure is used by professional research analysts and others in the valuation, comparison, and investment recommendations of companies in the potash mining industry. Many investors use the published research reports of these professional research analysts and others in making investment decisions.
We calculate average net realized sales price per ton for each of potash and Trio®. Average net realized sales price per ton for potash is calculated as potash segment sales less potash segment byproduct sales and potash freight costs dividedand then dividing that difference by the number of tons of potash sold in the period. Likewise, average net realized sales price per ton for Trio® is calculated as Trio® segment sales less Trio® segment byproduct sales and Trio® freight costs and then dividing that difference by Trio® tons sold. We consider average net realized sales price per ton to be useful, and believe it to be useful for investors, because it shows our potash and Trio® average per-ton pricing without the effect of certain transportation and delivery costs. When we arrange transportation and delivery for a customer, we include in revenue and in freight costs the costs associated with transportation and delivery. However, manysome of our customers arrange for and pay their own transportation and delivery costs, in which case these costs are not included in our revenue and freight costs. We use average net realized sales price per ton as a key performance indicator to analyze potash and Trio®sales and price trends.
Below is a reconciliation of average net realized sales price per ton for potash and Trio® to the most directly comparable GAAP measure for the years ended December 31, 2017, 2016,2023, and 2015:2022 (in thousands, except per ton amounts):
| | | | | | | | | | | | | | | | |
| | Potash Segment |
| | 2023 | | 2022 | | |
| Total Segment Sales | | $ | 155,920 | | | $ | 191,378 | | | |
| Less: Segment byproduct sales | | 24,714 | | | 22,807 | | | |
| Potash freight costs | | 10,911 | | | 10,336 | | | |
| Subtotal | | $ | 120,295 | | | $ | 158,235 | | | |
| | | | | | |
| Divided by: | | | | | | |
| Potash tons sold (in thousands) | | 258 | | | 222 | | | |
| Average net realized sales price per ton | | $ | 466 | | | $ | 713 | | | |
| | | | | | | | | | | | | | | | |
| | Trio® Segment |
| | 2023 | | 2022 | | |
| Total Segment Sales | | $ | 102,182 | | | $ | 117,826 | | | |
| Less: Segment byproduct sales | | 5,838 | | | 3,864 | | | |
Trio® freight costs | | 23,211 | | | 19,661 | | | |
| Subtotal | | $ | 73,133 | | | $ | 94,301 | | | |
| | | | | | |
| Divided by: | | | | | | |
Trio® Tons sold (in thousands) | | 228 | | | 197 | | | |
| Average net realized sales price per ton | | $ | 321 | | | $ | 479 | | | |
|
| | | | | | | | | | | | |
| | | Year Ended December 31, 2017 |
| | | Potash | | Trio® | | Total |
| Sales | | $ | 95,540 |
| | $ | 62,067 |
| | $ | 157,607 |
|
| Freight costs | | 11,818 |
| | 17,221 |
| | 29,039 |
|
| Subtotal | | $ | 83,722 |
| | $ | 44,846 |
| | $ | 128,568 |
|
| | | | | | | |
| Divided by: | | | | | | |
| Tons sold (in thousands) | | 352 |
| | 229 |
| | |
| Average net realized sales price per ton | | $ | 238 |
| | $ | 196 |
| | |
|
| | | | | | | | | | | | |
| | | Year Ended December 31, 2016 |
| | | Potash | | Trio® | | Total |
| Sales | | $ | 159,494 |
| | $ | 51,454 |
| | $ | 210,948 |
|
| Freight costs | | 26,661 |
| | 9,595 |
| | 36,256 |
|
| Subtotal | | $ | 132,833 |
| | $ | 41,859 |
| | $ | 174,692 |
|
| | | | | | | |
| Divided by: | | | | | | |
| Tons sold (in thousands) | | 681 |
| | 146 |
| | |
| Average net realized sales price per ton | | $ | 195 |
| | $ | 287 |
| | |
|
| | | | | | | | | | | | |
| | | Year Ended December 31, 2015 |
| | | Potash | | Trio® | | Total |
| Sales | | $ | 217,467 |
| | $ | 69,716 |
| | $ | 287,183 |
|
| Freight costs | | 18,262 |
| | 10,461 |
| | 28,723 |
|
| Subtotal | | $ | 199,205 |
| | $ | 59,255 |
| | $ | 258,460 |
|
| | | | | | | |
| Divided by: | | | | | | |
| Tons sold (in thousands) | | 587 |
| | 163 |
| | |
| Average net realized sales price per ton | | $ | 339 |
| | $ | 364 |
| | |
| |
ITEM 7A. | QUANTITATIVE AND QUALITATIVE DISCLOSURES ABOUT MARKET RISK |
ITEM 7A.QUANTITATIVE AND QUALITATIVE DISCLOSURES ABOUT MARKET RISK
Our operations may be impacted by commodity prices, geographic concentration, changes in interest rates, and foreign currency exchange rates.
Commodity Prices
Potash, Trio®, and Trio®water are commodities but are not traded on any commodity exchange. As such, direct hedging of thefuture prices for future production cannot be undertaken. Generally,For potash and Trio®, we generally do not enter into long-term sales contracts for these products, so prices vary for each particular transaction depending on the market into which we are selling and the individual bids that we receive. For water sales, a portion of our sales are under a long-term agreement where the price per barrel of water is fixed. This agreement allows for the parties to periodically review and adjust the price per barrel of water to the prevailing market price.
Our sales and profitability are determined principally by the price of potash, Trio®, and water. Potash and Trio® sales and profitability are also influenced, to a lesser extent, by the price of natural gas and other commodities used in production. The price of potash and Trio® is influenced by agricultural demand, global and domestic supply, competing specialty fertilizers, and the prices of agricultural commodities. Decreases in agricultural demand, increases in supply, or decreases in agricultural commodity prices could reduce our agricultural potash and
Trio® sales. The price of water is influenced by demand from the oil and gas operators in the Permian Basin. Natural gas and oil price declines may result in a reduction in drilling activity, which could reduce our industrial potash sales.sales of water.
Our costs and capital investments are subject to market movements in other commodities such as natural gas, electricity, steel, and chemicals.
Interest Rate Fluctuations
Balances outstanding under our $35the amended $150 million credit facility bear interest at a floating rateSOFR plus an applicable margin of 1.75%1.50% to 2.25% above LIBOR (London Interbank Offered Rate),per annum, based on average availabilityour leverage ratio as calculated in accordance with the amended agreement governing the revolving credit facility. Borrowings under the revolving credit facility are secured by substantially all of our current and non-current assets, and the obligations under the credit facility.facility are unconditionally guaranteed by several of our subsidiaries. As of December 31, 2017,2023, we had $3.9$4.0 million in borrowings outstanding on this facility. We occasionally borrowfacility and repay amountsno outstanding letters of credit under the facility for near-term working capital needs.
The $60 million aggregate principal amount of senior notes bears interest based on a pricing grid set forth in the agreement governing the notes. As of December 31, 2017, the Series A Senior Notes bear interest at 3.73%, the Series B Senior Notes bear interest at 4.63%, and the Series C Senior Notes bear interest at 4.78%, which reflect the lowest rates in the pricing grid. These interest rates may adjust quarterly based upon our financial performance and certain financial covenant levels. In addition, additional interest of 2%, which may be paid in kind, will begin to accrue on April 1, 2018, unless we satisfy certain financial covenant tests. As of December 31, 2017, these financial covenant tests would have been met. The fair value of the senior notes fluctuates based on the assessment of our credit and movements in market interest rates. As of December 31, 2017, the aggregate principal amount of senior notes due was $60.0 million and the estimated fair value of these notes was $58.8 million.facility.
Geographic Concentration
Our mines, facilities, and many of our customers are concentrated in the western half of United StatesU.S. and are, therefore, affected by weather and other conditions in this region.
Foreign Exchange Rate Fluctuations
We typically do not have low balances of accounts receivable denominated in Canadiancurrencies other than U.S. dollars and, as a result, we do not have minimala direct foreign exchange risk. We do, however, have an indirect foreign exchange risk due to the industry in which we operate.
Specifically, the U.S. imports the majority of its potash, including from Canada, Russia, and Belarus.other countries. If the local currencies for foreign suppliers strengthen in comparison to the U.S. dollar, foreign suppliers realize a smaller margin in their local currencies unless they increase their nominal U.S. dollar prices. Strengthening of these local currencies therefore tends to support higher U.S. potash prices as the foreign suppliers attempt to maintain their margins. However, if local currencies weaken in comparison to the U.S. dollar, foreign suppliers may choose to lower prices proportionally to increase sales volume while again maintaining a margin in their local currency.
| |
ITEM 8. | FINANCIAL STATEMENTS AND SUPPLEMENTARY DATA |
ITEM 8.FINANCIAL STATEMENTS AND SUPPLEMENTARY DATA Report of Independent Registered Public Accounting Firm
To the Stockholders and the Board of Directors
Intrepid Potash, Inc.:
Opinions on the Consolidated Financial Statements and Internal Control Over Financial Reporting
We have audited the accompanying consolidated balance sheets of Intrepid Potash, Inc. and subsidiaries (the "Company")Company) as of December 31, 20172023 and 2016,2022, the related consolidated statements of operations, comprehensive loss, stockholders'stockholders’ equity, and cash flows for each of the years in the three-year period ended December 31, 2017,2023, and the related notes and the financial statement schedule II (collectively, the "consolidatedconsolidated financial statements")statements). We also have audited the Company'sCompany’s internal control over financial reporting as of December 31, 2017,2023, based on criteria established in Internal Control -– Integrated Framework (2013) issued by the Committee of Sponsoring Organizations of the Treadway Commission.
In our opinion, the consolidated financial statements referred to above present fairly, in all material respects, the financial position of the Company as of December 31, 20172023 and 2016,2022, and the results of its operations and its cash flows for each of the years in the three-year period ended December 31, 2017,2023, in conformity with U.S. generally accepted accounting principles. Also in our opinion, the Company maintained, in all material respects, effective internal control over financial reporting as of December 31, 2017,2023 based on criteria established in Internal Control -– Integrated Framework (2013) issued by the Committee of Sponsoring Organizations of the Treadway Commission.
Basis for OpinionOpinions
The Company’s management is responsible for these consolidated financial statements, for maintaining effective internal control over financial reporting, and for its assessment of the effectiveness of internal control over financial reporting, included in the accompanying Management's Report on Internal Control over Financial Reporting. Our responsibility is to express an opinion on the Company'sCompany’s consolidated financial statements and an opinion on the Company'sCompany’s internal control over financial reporting based on our audits. We are a public accounting firm registered with the Public Company Accounting Oversight Board (United States) (“PCAOB”)(PCAOB) and are required to be independent with respect to the Company in accordance with the U.S. federal securities laws and the applicable rules and regulations of the Securities and Exchange Commission and the PCAOB.
We conducted our audits in accordance with the standards of the PCAOB. Those standards require that we plan and perform the audits to obtain reasonable assurance about whether the consolidated financial statements are free of material misstatement, whether due to error or fraud, and whether effective internal control over financial reporting was maintained in all material respects.
Our audits of the consolidated financial statements included performing procedures to assess the risks of material misstatement of the consolidated financial statements, whether due to error or fraud, and performing procedures that respond to those risks. Such procedures included examining, on a test basis, evidence regarding the amounts and disclosures in the consolidated financial statements. Our audits also included evaluating the accounting principles used and significant estimates made by management, as well as evaluating the overall presentation of the consolidated financial statements. Our audit of internal control over financial reporting included obtaining an understanding of internal control over financial reporting, assessing the risk that a material weakness exists, and testing and evaluating the design and operating effectiveness of internal control based on the assessed risk. Our audits also included performing such other procedures as we considered necessary in the circumstances. We believe that our audits provide a reasonable basis for our opinions.
Definition and Limitations of Internal Control Over Financial Reporting
A company'scompany’s internal control over financial reporting is a process designed to provide reasonable assurance regarding the reliability of financial reporting and the preparation of financial statements for external purposes in accordance with generally accepted accounting principles. A company'scompany’s internal control over financial reporting includes those policies and procedures that (1) pertain to the maintenance of records that, in reasonable detail, accurately and fairly reflect the transactions and dispositions of the assets of the company; (2) provide reasonable assurance that transactions are recorded as necessary to permit preparation of financial statements in accordance with generally accepted accounting principles, and that receipts and expenditures of the company are being made only in accordance with authorizations of management and directors of the
company; and (3) provide reasonable assurance regarding prevention or timely detection of unauthorized acquisition, use, or disposition of the company’s assets that could have a material effect on the financial statements.
Because of its inherent limitations, internal control over financial reporting may not prevent or detect misstatements. Also, projections of any evaluation of effectiveness to future periods are subject to the risk that controls may become inadequate because of changes in conditions, or that the degree of compliance with the policies or procedures may deteriorate.
Critical Audit Matters
The critical audit matters communicated below are matters arising from the current period audit of the consolidated financial statements that were communicated or required to be communicated to the audit committee and that: (1) relate to accounts or disclosures that are material to the consolidated financial statements and (2) involved our especially challenging, subjective, or complex judgments. The communication of critical audit matters does not alter in any way our opinion on the consolidated financial statements, taken as a whole, and we are not, by communicating the critical audit matters below, providing separate opinions on the critical audit matters or on the accounts or disclosures to which they relate.
Realizability of deferred tax assets
As discussed in Notes 2 and 13 to the consolidated financial statements, the Company records a valuation allowance if it is deemed more likely than not deferred tax assets will not be realized in full. The ultimate realization of deferred tax assets is dependent upon the generation of certain types of future taxable income during the periods in which those temporary differences become deductible. In making this assessment, the Company considers the scheduled reversal of deferred tax liabilities, their ability to carry back the deferred tax assets, projected future taxable income, and tax planning strategies. The Company analyzes its valuation allowance using historical and projected future operating results. As of December 31, 2023, the Company had gross deferred tax assets of $197.4 million and a related valuation allowance of $3.2 million.
We identified the evaluation of the realizability of the Company’s deferred tax assets as a critical audit matter. This evaluation required especially challenging auditor judgment to assess the Company’s estimated future taxable income over the period in which the deferred tax assets will generally reverse. Specifically, the Company’s assumptions of projected future taxable income were based primarily on prices for products subject to market volatility and forecasted sales volumes. Changes in these assumptions could have a significant impact on the realization of the Company’s deferred tax assets and the amount of the valuation allowance.
The following are the primary procedures we performed to address this critical audit matter. We evaluated the design and tested the operating effectiveness of certain internal controls related to the Company’s income tax process. This included controls related to the development of assumptions in determining the projected future taxable income, including the development of prices for products and forecasted sales volumes. We assessed the data used in the pricing assumptions used by the Company by comparing them to publicly available pricing data and existing contractual arrangements. We compared the forecasted sales volumes to historical sales volumes, and we compared the Company’s historical forecasted sales volumes to actual sales volumes to assess the Company’s ability to accurately forecast.
Impairment of long-lived assets
As discussed in Note 2 to the consolidated financial statements, the Company evaluates its long-lived assets for impairment when events or changes in circumstances indicate that the related carrying amount may not be recoverable. As discussed in Note 6, during the fourth quarter of 2023, the gross margin of the Trio® segment decreased and the Company determined that sufficient indicators of potential impairment of the Trio® segment long-lived assets existed. The Company engaged a third-party valuation firm to determine the fair value of the Trio® segment assets. The carrying value of the Trio® segment asset group exceeded its fair value, and the Company recognized impairment charges of $31.9 million. Additionally, given the length of time since the West facility had been placed in care and maintenance, the Company engaged a third-party valuation firm to determine the fair value of the West assets. The carrying value of the West asset group exceeded its fair value, and the Company recognized impairment charges of $9.9 million. The fair value of the Trio® segment assets and the West assets were determined primarily using the expected proceeds received in an orderly sale of individual assets.
We identified the evaluation of the fair value of certain assets included in the impairment of the Trio® segment and West assets as a critical audit matter. Challenging and subjective auditor judgment was required in assessing the liquidation factors used to develop the orderly liquidation values as there is not a liquid secondary market for certain specialized assets. The evaluation of the liquidation factors required specialized skills and knowledge.
The following are the primary procedures we performed to address this critical audit matter. We evaluated the design and tested the operating effectiveness of certain internal controls related to the Company’s long-lived asset impairment process. This included a control related to the Company’s determination of the liquidation factors used to develop the orderly
liquidation values for certain assets. We involved valuation professionals with specialized skills and knowledge, who assisted in:
•evaluating whether the valuation techniques used by the Company to develop the fair value for certain assets were reasonable and consistent with common valuation practice given the nature of the assets
•assessing the Company’s orderly liquidation values by developing independent estimates of the orderly liquidation values using third-party data and independently developed liquidation factors and comparing the amounts to the Company’s estimates.
/s/ KPMG LLP
We have served as the Company's auditor since 2007.
Denver, Colorado
February 27, 2018March 7, 2024
INTREPID POTASH, INC.
CONSOLIDATED BALANCE SHEETS
(In thousands, except share and per share amounts)
| | | | | December 31, |
| | | 2017 | | 2016 |
| | December 31, | | | | December 31, |
| | 2023 | | | | 2023 | | 2022 |
| ASSETS | | | | |
| Cash and cash equivalents | | $ | 1,068 |
| | $ | 4,464 |
|
| Cash and cash equivalents | |
| Cash and cash equivalents | |
| Short-term investments | |
| Accounts receivable: | | | | |
| Trade, net | | 15,076 |
| | 10,343 |
|
| Trade, net | |
| Trade, net | |
| Other receivables, net | | 762 |
| | 492 |
|
| Refundable income taxes | | 2,663 |
| | 1,379 |
|
| | Inventory, net | |
| Inventory, net | |
| Inventory, net | | 83,126 |
| | 94,355 |
|
| Other current assets | | 9,251 |
| | 12,710 |
|
| Total current assets | | 111,946 |
| | 123,743 |
|
| Property, plant, equipment, and mineral properties, net | | 364,542 |
| | 388,490 |
|
| Water rights | |
| Long-term parts inventory, net | | 30,611 |
| | 21,037 |
|
| Long-term investments | |
| Other assets, net | | 3,955 |
| | 7,631 |
|
| Non-current deferred tax asset, net | |
| Total Assets | | $ | 511,054 |
| | $ | 540,901 |
|
| | | | | |
| LIABILITIES AND STOCKHOLDERS' EQUITY | | | | |
| Accounts payable: | | | | |
| Trade | | $ | 11,103 |
| | $ | 10,210 |
|
| Related parties | | 28 |
| | 31 |
|
| LIABILITIES AND STOCKHOLDERS' EQUITY | |
| LIABILITIES AND STOCKHOLDERS' EQUITY | |
| | Accounts payable | |
| | Accounts payable | |
| | Accounts payable | |
| | Income taxes payable | |
| Income taxes payable | |
| Income taxes payable | |
| Accrued liabilities | | 8,074 |
| | 8,690 |
|
| Accrued employee compensation and benefits | | 4,317 |
| | 4,225 |
|
| Other current liabilities | | 64 |
| | 964 |
|
| Advances on credit facility | | 3,900 |
| | — |
|
| Current portion of long-term debt | | 10,000 |
| | — |
|
| | Total current liabilities | | 37,486 |
| | 24,120 |
|
| | | | | |
| Long-term debt, net | | 49,437 |
| | 133,434 |
|
| Total current liabilities | |
| | Total current liabilities | |
| | Advances on credit facility | |
| Advances on credit facility | |
| Advances on credit facility | |
| | Asset retirement obligation | | 21,476 |
| | 19,976 |
|
| Asset retirement obligation | |
| Asset retirement obligation | |
| Operating lease liabilities | |
| Finance lease liabilities | |
| Other non-current liabilities | | 102 |
| | — |
|
| Total Liabilities | | 108,501 |
| | 177,530 |
|
| | | | | |
| Commitments and Contingencies | |
| |
|
| Commitments and Contingencies | |
| Commitments and Contingencies | | | |
| | | | | |
| Common stock, $0.001 par value; 400,000,000 shares authorized: | | | | |
| and 127,646,530 and 75,839,998 shares outstanding | | | | |
| at December 31, 2017, and 2016, respectively | | 128 |
| | 76 |
|
| Common stock, $0.001 par value; 40,000,000 shares authorized: | |
| Common stock, $0.001 par value; 40,000,000 shares authorized: | |
| Common stock, $0.001 par value; 40,000,000 shares authorized: | |
| and 12,807,316 and 12,687,822 shares outstanding | |
| and 12,807,316 and 12,687,822 shares outstanding | |
| and 12,807,316 and 12,687,822 shares outstanding | |
| at December 31, 2023 and 2022, respectively | |
| at December 31, 2023 and 2022, respectively | |
| at December 31, 2023 and 2022, respectively | |
| Additional paid-in capital | | 645,813 |
| | 583,653 |
|
| Retained deficit | | (243,388 | ) | | (220,358 | ) |
| | Retained earnings | |
| Retained earnings | |
| Retained earnings | |
| Less treasury stock, at cost | |
| Total Stockholders' Equity | | 402,553 |
| | 363,371 |
|
| Total Liabilities and Stockholders' Equity | | $ | 511,054 |
| | $ | 540,901 |
|
See accompanying notes to these consolidated financial statements.
INTREPID POTASH, INC.
CONSOLIDATED STATEMENTS OF OPERATIONS
(In thousands, except share and per share amounts)
| | | | | Year Ended December 31, |
| | | 2017 | | 2016 | | 2015 |
| | Year Ended December 31, | | | | Year Ended December 31, |
| | 2023 | | | | 2023 | | 2022 | | 2021 |
| Sales | | $ | 157,607 |
| | $ | 210,948 |
| | $ | 287,183 |
|
| Less: | | | | | | |
| Freight costs | | 29,039 |
| | 36,256 |
| | 28,723 |
|
| Freight costs | |
| Freight costs | |
| Warehousing and handling costs | | 9,670 |
| | 11,006 |
| | 13,939 |
|
| Cost of goods sold | | 105,795 |
| | 170,852 |
| | 217,821 |
|
| Lower-of-cost-or-market inventory adjustments | | 7,324 |
| | 20,374 |
| | 31,772 |
|
| Costs associated with abnormal production and other | | — |
| | 1,707 |
| | 10,405 |
|
| Gross Margin (Deficit) | | 5,779 |
| | (29,247 | ) | | (15,477 | ) |
| Lower of cost or net realizable value inventory adjustments | |
| Costs associated with abnormal production | |
| Gross Margin | |
| | | | | | | |
| Selling and administrative | | 19,461 |
| | 20,034 |
| | 27,486 |
|
| Debt restructuring expense | | — |
| | 3,072 |
| | — |
|
| Selling and administrative | |
| Selling and administrative | |
| | Accretion of asset retirement obligation | | 1,558 |
| | 1,768 |
| | 1,696 |
|
| Restructuring expense | | 266 |
| | 2,723 |
| | — |
|
| Accretion of asset retirement obligation | |
| Accretion of asset retirement obligation | |
| | Impairment of long-lived assets | | — |
| | — |
| | 323,796 |
|
| Care and maintenance expense | | 1,687 |
| | 2,603 |
| | — |
|
| Other operating (income) expense | | (2,789 | ) | | (1,666 | ) | | 1,335 |
|
| Operating Loss | | (14,404 | ) | | (57,781 | ) | | (369,790 | ) |
| Impairment of long-lived assets | |
| Impairment of long-lived assets | |
| Loss (gain) on sale or disposal of assets | |
| Other operating expense | |
| Operating (Loss) Income | |
| | | | | | | |
| Other Income (Expense) | | | | | | |
| Other Income (Expense) | |
| Other Income (Expense) | |
| Equity in earnings of unconsolidated entities | |
| Equity in earnings of unconsolidated entities | |
| Equity in earnings of unconsolidated entities | |
| Interest expense, net | | (11,692 | ) | | (11,622 | ) | | (6,351 | ) |
| Interest income | | 6 |
| | 286 |
| | 763 |
|
| Other income | | 397 |
| | 1,122 |
| | 575 |
|
| Loss Before Income Taxes | | (25,693 | ) | | (67,995 | ) | | (374,803 | ) |
| Gain on extinguishment of debt | |
| (Loss) Income Before Income Taxes | |
| | | | | | | |
| Income Tax Benefit (Expense) | | 2,783 |
| | 1,362 |
| | (149,973 | ) |
| Net Loss | | $ | (22,910 | ) | | $ | (66,633 | ) | | $ | (524,776 | ) |
| Income Tax Benefit (Expense) | |
| Income Tax Benefit (Expense) | |
| Net (Loss) Income | |
| | | | | | | |
| Weighted Average Shares Outstanding: | | | | | | |
| Basic and diluted | | 115,708,859 |
| | 75,818,735 |
| | 75,669,489 |
|
| Loss Per Share: | | | | | | |
| Basic and diluted | | $ | (0.20 | ) | | $ | (0.88 | ) | | $ | (6.94 | ) |
| Weighted Average Shares Outstanding: | |
| Weighted Average Shares Outstanding: | |
| Basic | |
| Basic | |
| Basic | |
| Diluted | |
| (Loss) Income Per Share: | |
| Basic | |
| Basic | |
| Basic | |
| Diluted | |
See accompanying notes to these consolidated financial statements.
INTREPID POTASH, INC.
CONSOLIDATED STATEMENTS OF COMPREHENSIVE LOSS
(In thousands)
|
| | | | | | | | | | | | |
| | | Year Ended December 31, |
| | | 2017 | | 2016 | | 2015 |
| Net Loss | | $ | (22,910 | ) | | $ | (66,633 | ) | | $ | (524,776 | ) |
| Other Comprehensive Income (Loss): | | | | | | |
| Net change in unrealized gains (losses) on investments available for sale | | — |
| | 52 |
| | (24 | ) |
| Other Comprehensive Loss | | — |
| | 52 |
| | (24 | ) |
| Comprehensive Loss | | $ | (22,910 | ) | | $ | (66,581 | ) | | $ | (524,800 | ) |
See accompanying notes to these consolidated financial statements.
INTREPID POTASH, INC.
CONSOLIDATED STATEMENTS OF STOCKHOLDERS' EQUITY
(In thousands, except share amounts)
| | | | | | | | | | | | | | | | | | | | | | | | | | | | | | | | | | | | | | | | |
| | Common Stock | | Treasury Stock | | Additional Paid-in Capital | | | | Retained Earnings (Accumulated) Deficit | | Total Stockholders' Equity |
| | Shares | | Amount | | | | | |
| Balance, December 31, 2020 | | 13,049,820 | | | $ | 13 | | | $ | — | | | $ | 656,837 | | | | | $ | (245,591) | | | $ | 411,259 | |
| | | | | | | | | | | | | | |
| | | | | | | | | | | | | | |
| Net income | | — | | | — | | | — | | | — | | | | | 249,834 | | | 249,834 | |
| Stock-based compensation | | — | | | — | | | — | | | 3,012 | | | | | — | | | 3,012 | |
Vesting of restricted shares, net of common stock
used to fund employee income tax withholding
due upon vesting | | 90,844 | | | — | | | — | | | (791) | | | | | — | | | (791) | |
| Exercise of stock options | | 8,651 | | | — | | | — | | | 89 | | | | | — | | | 89 | |
| Balance, December 31, 2021 | | 13,149,315 | | | 13 | | | — | | | 659,147 | | | | | 4,243 | | | 663,403 | |
| | | | | | | | | | | | | | |
| Net income | | — | | | — | | | — | | | — | | | | | 72,220 | | | 72,220 | |
| Stock-based compensation | | — | | | — | | | — | | | 6,152 | | | | | — | | | 6,152 | |
| Purchase of treasury stock | | (608,657) | | | — | | | (22,012) | | | — | | | | | — | | | (22,012) | |
Vesting of restricted shares, net of common stock
used to fund employee income tax withholding
due upon vesting | | 136,446 | | | — | | | — | | | (4,795) | | | | | — | | | (4,795) | |
| Exercise of stock options | | 10,718 | | | — | | | — | | | 110 | | | | | — | | | 110 | |
| Balance, December 31, 2022 | | 12,687,822 | | | 13 | | | (22,012) | | | 660,614 | | | | | 76,463 | | | 715,078 | |
| | | | | | | | | | | | | | |
| | | | | | | | | | | | | | |
| | | | | | | | | | | | | | |
| Net loss | | — | | | — | | | — | | | — | | | | | (35,673) | | | (35,673) | |
| Stock-based compensation | | — | | | — | | | — | | | 6,534 | | | | | — | | | 6,534 | |
| | | | | | | | | | | | | | |
Vesting of restricted shares, net of common stock
used to fund employee income tax withholding
due upon vesting | | 119,494 | | | — | | | — | | | (1,511) | | | | | — | | | (1,511) | |
| | | | | | | | | | | | | | |
| Balance, December 31, 2023 | | 12,807,316 | | | $ | 13 | | | $ | (22,012) | | | $ | 665,637 | | | | | $ | 40,790 | | | $ | 684,428 | |
|
| | | | | | | | | | | | | | | | | | | | | | | |
| | | Common Stock | | Additional Paid-in Capital | | Accumulated Other Comprehensive Loss | | Retained Earnings (Deficit) | | Total Stockholders' Equity |
| | | Shares | | Amount | | | | |
| Balance, December 31, 2014 | | 75,536,741 |
| | $ | 76 |
| | $ | 576,186 |
| | $ | (28 | ) | | $ | 371,051 |
| | $ | 947,285 |
|
| Net change in other comprehensive loss | | — |
| | — |
| | — |
| | (24 | ) | | — |
| | (24 | ) |
| Net loss | | — |
| | — |
| | — |
| | — |
| | (524,776 | ) | | (524,776 | ) |
| Stock-based compensation | | — |
| | — |
| | 5,080 |
| | — |
| | — |
| | 5,080 |
|
Vesting of restricted shares, net of common stock
used to fund employee income tax withholding
due upon vesting | | 165,959 |
| | — |
| | (1,039 | ) | | — |
| | — |
| | (1,039 | ) |
| Balance, December 31, 2015 | | 75,702,700 |
| | 76 |
| | 580,227 |
| | (52 | ) | | (153,725 | ) | | 426,526 |
|
| Net change in other comprehensive loss | | — |
| | — |
| | — |
| | 52 |
| | — |
| | 52 |
|
| Net loss | | — |
| | — |
| | — |
| | — |
| | (66,633 | ) | | (66,633 | ) |
| Stock-based compensation | | — |
| | — |
| | 3,599 |
| | — |
| | — |
| | 3,599 |
|
Vesting of restricted shares, net of common stock
used to fund employee income tax withholding
due upon vesting | | 137,298 |
| | — |
| | (173 | ) | | — |
| | — |
| | (173 | ) |
| Balance, December 31, 2016 | | 75,839,998 |
| | 76 |
| | 583,653 |
| | — |
| | (220,358 | ) | | 363,371 |
|
| Adjustment to opening balance | | — |
| | — |
| | 120 |
| | — |
| | (120 | ) | | — |
|
| Issuance of common stock | | 50,612,027 |
| | 51 |
| | 59,079 |
| | | | | | 59,130 |
|
| Net change in other comprehensive loss | | — |
| | — |
| | — |
| |
|
| | — |
| | — |
|
| Net loss | | — |
| | — |
| | — |
| | — |
| | (22,910 | ) | | (22,910 | ) |
| Stock-based compensation | | — |
| | — |
| | 3,622 |
| | — |
| | — |
| | 3,622 |
|
Vesting of restricted shares, net of common stock
used to fund employee income tax withholding
due upon vesting | | 1,077,292 |
| | 1 |
| | (782 | ) | | — |
| | — |
| | (781 | ) |
| Exercise of stock options | | 117,213 |
| | — |
| | 121 |
| | | | | | 121 |
|
| Balance, December 31, 2017 | | 127,646,530 |
| | $ | 128 |
| | $ | 645,813 |
| | $ | — |
| | $ | (243,388 | ) | | $ | 402,553 |
|
See accompanying notes to these consolidated financial statements.
INTREPID POTASH, INC.
CONSOLIDATED STATEMENTS OF CASH FLOWS
|
| | | | | | | | | | | | |
| | | Year Ended December 31, |
| | | 2017 | | 2016 | | 2015 |
| Cash Flows from Operating Activities: | | | | | | |
| Adjustments to reconcile net loss to net cash provided by operating activities: | | | | | | |
| Net loss | | $ | (22,910 | ) | | $ | (66,633 | ) | | $ | (524,776 | ) |
| Impairment of long-lived assets | | — |
| | — |
| | 323,796 |
|
| Deferred income taxes | | — |
| | — |
| | 150,096 |
|
| Depreciation, depletion, and accretion | | 34,767 |
| | 42,681 |
| | 87,676 |
|
| Amortization of deferred financing costs | | 1,778 |
| | 2,113 |
| | 352 |
|
| Stock-based compensation | | 3,622 |
| | 3,599 |
| | 5,080 |
|
| Reserve for obsolescence | | 1,072 |
| | 349 |
| | 2,260 |
|
| Allowance for doubtful accounts | | 865 |
| | — |
| | — |
|
| Loss on disposal of assets | | 1,830 |
| | 262 |
| | 679 |
|
| Lower-of-cost-or-market inventory adjustments | | 7,324 |
| | 20,374 |
| | 31,772 |
|
| Other | | 3,008 |
| | 480 |
| | 1,495 |
|
| Changes in operating assets and liabilities: | | | | | | |
| Trade accounts receivable, net | | (5,599 | ) | | (600 | ) | | 18,818 |
|
| Other receivables, net | | (270 | ) | | 977 |
| | 2,126 |
|
| Refundable income taxes | | (1,284 | ) | | (1,163 | ) | | (201 | ) |
| Inventory, net | | (6,740 | ) | | (12,239 | ) | | (57,448 | ) |
| Other current assets | | 3,459 |
| | 5,370 |
| | (13,227 | ) |
Accounts payable, accrued liabilities, and accrued employee
compensation and benefits | | (3,809 | ) | | (12,387 | ) | | (5,553 | ) |
| Other liabilities | | 102 |
| | (1,453 | ) | | (255 | ) |
| Net cash provided by (used in) operating activities | | 17,215 |
| | (18,270 | ) | | 22,690 |
|
| | | | | | | |
| Cash Flows from Investing Activities: | | | | | | |
| Additions to property, plant, equipment, and mineral properties | | (13,505 | ) | | (17,892 | ) | | (46,016 | ) |
| Proceeds from sale of property, plant, equipment, and mineral properties | | 5,652 |
| | — |
| | — |
|
| Purchases of investments | | — |
| | (10,325 | ) | | (78,568 | ) |
| Proceeds from sale of investments | | 1 |
| | 60,727 |
| | 45,007 |
|
| Net cash (used in) provided by investing activities | | (7,852 | ) | | 32,510 |
| | (79,577 | ) |
| | | | | | | |
| Cash Flows from Financing Activities: | | | | | | |
| Issuance of common stock, net of transaction expenses | | 59,130 |
| | — |
| | — |
|
| Repayment of long-term debt | | (75,000 | ) | | (15,000 | ) | | — |
|
| Proceeds from short-term borrowings on credit facility | | 22,000 |
| | — |
| | — |
|
| Repayments of short-term borrowings on credit facility | | (18,100 | ) | | — |
| | — |
|
| Debt issuance costs | | (129 | ) | | (3,910 | ) | | (356 | ) |
| Employee tax withholding paid for restricted shares upon vesting | | (781 | ) | | (173 | ) | | (1,039 | ) |
| Proceeds from exercise of stock options | | 121 |
| | — |
| | — |
|
| Net cash used in financing activities | | (12,759 | ) | | (19,083 | ) | | (1,395 | ) |
| | | | | | | |
| Net Change in Cash and Cash Equivalents | | (3,396 | ) | | (4,843 | ) | | (58,282 | ) |
| Cash and Cash Equivalents, beginning of period | | 4,464 |
| | 9,307 |
| | 67,589 |
|
| Cash and Cash Equivalents, end of period | | $ | 1,068 |
| | $ | 4,464 |
| | $ | 9,307 |
|
| | | | | | | |
| Supplemental disclosure of cash flow information | | | | | | |
| Net cash paid (received) during the period for: | | | | | | |
| Interest, net of $0.1 million, $0.4 million, and $0.3 million of capitalized interest | | $ | 11,639 |
| | $ | 8,966 |
| | $ | 6,080 |
|
| Income taxes | | $ | (1,499 | ) | | $ | (100 | ) | | $ | 13 |
|
| Accrued purchases for property, plant, equipment, and mineral properties | | $ | 4,068 |
| | $ | 793 |
| | $ | 3,778 |
|
| | | | | | | | | | | | | | | | | | | | |
| | Year Ended December 31, |
| | 2023 | | 2022 | | 2021 |
| Cash Flows from Operating Activities: | | | | | | |
| Adjustments to reconcile net (loss) income to net cash provided by operating activities: | | | | | | |
| Net (loss) income | | $ | (35,673) | | | $ | 72,220 | | | $ | 249,834 | |
| | | | | | |
| | | | | | |
| Depreciation, depletion, and amortization | | 39,078 | | | 34,711 | | | 35,635 | |
| Amortization of intangible assets | | 322 | | | 322 | | | 322 | |
| Accretion of asset retirement obligation | | 2,140 | | | 1,961 | | | 1,858 | |
| Amortization of deferred financing costs | | 301 | | | 265 | | | 314 | |
| Stock-based compensation | | 6,534 | | | 6,152 | | | 3,012 | |
| Reserve for obsolescence | | 509 | | | 1,750 | | | 2,108 | |
| Allowance for doubtful accounts | | 110 | | | — | | | — | |
| Impairment of long-lived assets | | 43,288 | | | — | | | — | |
| Loss (gain) on disposal of assets | | 807 | | | 7,470 | | | (2,542) | |
| Equity in earnings of unconsolidated entities | | 486 | | | (689) | | | — | |
| Distribution of earnings from unconsolidated entities | | 452 | | | — | | | — | |
| Gain on extinguishment of debt | | — | | | — | | | (10,113) | |
| Lower of cost or net realizable value inventory adjustments | | 6,492 | | | — | | | — | |
| | | | | | |
| Changes in operating assets and liabilities: | | | | | | |
| Trade accounts receivable, net | | 4,550 | | | 8,673 | | | (12,615) | |
| Other receivables, net | | (701) | | | 140 | | | 589 | |
| | | | | | |
| Inventory, net | | (11,861) | | | (33,283) | | | 7,358 | |
| Other current assets | | (3,857) | | | 191 | | | (1,974) | |
| Deferred tax assets, net | | (8,471) | | | 23,323 | | | (209,075) | |
Accounts payable, accrued liabilities, and accrued employee
compensation and benefits | | 1,284 | | | (3,596) | | | 13,456 | |
| Income tax payable | | 32 | | | (33) | | | 42 | |
| Operating lease liabilities | | (1,735) | | | (2,025) | | | (2,508) | |
| Other liabilities | | (858) | | | (28,731) | | | 3,366 | |
| Net cash provided by operating activities | | 43,229 | | | 88,821 | | | 79,067 | |
| | | | | | |
| Cash Flows from Investing Activities: | | | | | | |
| Additions to property, plant, equipment, mineral properties and other assets | | (65,060) | | | (68,696) | | | (19,789) | |
| | | | | | |
| Proceeds from sale of property, plant, equipment, and mineral properties | | 125 | | | 58 | | | 6,042 | |
| Purchase of investments | | (1,415) | | | (13,047) | | | (1,076) | |
| Proceeds from redemptions/maturities of investments | | 6,000 | | | 2,506 | | | — | |
| Other investing, net | | 796 | | | — | | | — | |
| Net cash used in investing activities | | (59,554) | | | (79,179) | | | (14,823) | |
| | | | | | |
| Cash Flows from Financing Activities: | | | | | | |
| | | | | | |
| Repayment of long-term debt | | — | | | — | | | (15,000) | |
| Debt prepayment costs | | — | | | — | | | (505) | |
| | | | | | |
| Proceeds from borrowings on credit facility | | 9,000 | | | — | | | — | |
| Repayments of borrowings on credit facility | | (5,000) | | | — | | | (29,817) | |
| Payments of financing lease | | (597) | | | — | | | (1,258) | |
| Capitalized debt costs | | — | | | (1,007) | | | — | |
| Employee tax withholding paid for restricted shares upon vesting | | (1,511) | | | (4,795) | | | (791) | |
| Repurchases of common stock | | — | | | (22,012) | | | — | |
| Proceeds from exercise of stock options | | — | | | 110 | | | 89 | |
| Net cash provided by (used in) financing activities | | 1,892 | | | (27,704) | | | (47,282) | |
| | | | | | |
| Net Change in Cash, Cash Equivalents, and Restricted Cash | | (14,433) | | | (18,062) | | | 16,962 | |
| Cash, Cash Equivalents, and Restricted Cash, beginning of period | | 19,084 | | | 37,146 | | | 20,184 | |
| Cash, Cash Equivalents, and Restricted Cash, end of period | | $ | 4,651 | | | $ | 19,084 | | | $ | 37,146 | |
| | | | | | |
| Supplemental disclosure of cash flow information | | | | | | |
| Net cash paid during the period for: | | | | | | |
| Interest | | $ | 411 | | | $ | 113 | | | $ | 875 | |
| Income taxes | | $ | 179 | | | $ | 1,015 | | | $ | 193 | |
| Accrued purchases for property, plant, equipment, and mineral properties | | $ | 4,578 | | | $ | 8,532 | | | $ | 2,192 | |
See accompanying notes to these consolidated financial statements.
INTREPID POTASH, INC.
NOTES TO CONSOLIDATED FINANCIAL STATEMENTS
"Intrepid," "our," "we," or "us" means Intrepid Potash, Inc. and its consolidated subsidiaries.
Note 1— COMPANY BACKGROUND | |
Note 1 | — COMPANY BACKGROUND |
We are a diversified mineral company that delivers potassium, magnesium, sulfur, salt, and water products essential for customer success in agriculture, animal feed and the oil and gas industry. We are the only U.S. producer of muriate of potash ("(sometimes referred to as potassium chloride"chloride or "potash") in the United States and one of two global producers of langbeinite ("sulfate of potash magnesia")potash), which we marketis applied as an essential nutrient for healthy crop development, utilized in several industrial applications, and sellused as Trio®. We sell potash and Trio® primarily into the agricultural market as a fertilizer. We also sell these products into thean ingredient in animal feed market as a nutritional supplement and sell potash into the industrial market as a component in drilling and fracturing fluids for oil and gas wells and other industrial inputs.feed. In addition, we sell by-products including salt,produce a specialty fertilizer, Trio®, which delivers three key nutrients, potassium, magnesium, and sulfate, in a single particle. We also provide water, magnesium chloride, and brine and othervarious oilfield products such as water.and services.
Our extraction and production operations are conducted entirely in the continental United States.U.S. We produce potash from three solution mining facilities: our HB solution mine in Carlsbad, New Mexico, our solution mine in Moab, Utah and our brine recovery mine in Wendover, Utah. We also operate our North compaction facility in Carlsbad, New Mexico, which compacts and granulates product from the HB mine. We produce Trio® from our conventional underground East mine in Carlsbad, New Mexico. Until mid-2016, we also produced potash from our East
We have permitted, licensed, declared and West minespartially adjudicated water rights in Carlsbad, New Mexico. We sell a portion of water from these water rights to support oil and gas development in the Permian Basin. We continually work to expand water sales.
In April 2016,May 2019, we convertedacquired certain land, water rights, federal and state grazing leases for cattle, and other related assets from Dinwiddie Cattle Company. We refer to these assets and operations as "Intrepid South." Due to the strategic location of Intrepid South, part of our East facility fromlong-term operating strategy is selling small parcels of land, including restricted use agreements of surface or subsurface rights, to customers, where such sales provide a mixed-ore facility that produced both potash and Trio®solution to a Trio®‑only facility. In addition,customer's operations in early July 2016, we idled mining operations atthe oil and gas industry.
We have three segments: potash, Trio®, and oilfield solutions. We account for the sales of byproducts as revenue in the potash or Trio® segment, based on which segment generates the byproduct. For each of the years ended December 31, 2023, 2022, and 2021, a majority of our West facility and transitionedbyproduct sales were accounted for in the facility into care and maintenance. These changes were designed to increase our production of Trio®, a product that had traditionally shown more resilience to pricing pressure than potash and to lower costs in a time of declining potash prices.segment.
We manage sales and marketing operations centrally. This allows us to evaluate the product needs of our customers and then centrally determine which of our production facilities to use to fill customer orders in a manner designed to realize the highest average net realized sales price per ton. Average net realized sales price per ton is a non-GAAP measure that we calculate by deductingfor each of potash and Trio® as segment sales less segment byproduct sales and segment freight costs, from total sales and thendivided by dividing this result bythe number of tons of product sold duringin the period. We also monitor product inventory levels and overall production costs centrally.
| |
Note 2 | — SUMMARY OF SIGNIFICANT ACCOUNTING POLICIES |
Note 2— SUMMARY OF SIGNIFICANT ACCOUNTING POLICIES
Basis of Presentation—Our consolidated financial statements include our accounts and those of our wholly-owned subsidiaries. All intercompany balances and transactions have been eliminated in consolidation.
Use of Estimates—The preparation of financial statements requires management to make estimates and assumptions that affect the reported amounts of assets and liabilities, the disclosure of contingent assets and liabilities as of the date of the financial statements, and the reported amounts of revenues and expenses during the reporting period. We base our estimates on historical experience and on various other assumptions that are believed to be reasonable under the circumstances. Accordingly, actual results may differ significantly from these estimates under different assumptions or conditions.
Significant estimates include, but are not limited to, those for proven and probable mineral reserves, the related present value of estimated future net cash flows, useful lives of plant assets, asset retirement obligations, normal inventory production levels, inventory valuations, the valuation of equity awards, revenue from products we sell to customers where the price is variable, the valuation of receivables, estimated future net cash flows used in long-lived assets impairment analysis, the related valuation of our long-lived assets, valuation of our deferred tax assets and estimated blended income tax rates utilized in the current and deferred income tax calculations. There are numerous uncertainties inherent in estimating quantities of proven and probable reserves, projecting future rates of production, and the timing of development expenditures. Future mineral prices may vary significantly from the prices in effect at the time the estimates are made, as may estimates of
future operating costs. The estimate of proven and probable mineral reserves, the related present value of estimated future cash flows, and useful lives of plant assets can affect various other items including depletion, the net carrying value of our mineral properties, the useful lives of related property, plant, and equipment, depreciation expense, and estimates associated with recoverability of long-lived assets and asset retirement obligations. Specific to income tax items, we experience fluctuations in the valuation of the deferred tax assets and liabilities due to changing income tax rates and the blend of state tax rates.
Revenue Recognition—We account for revenue in accordance with Accounting Standards Codification ("ASC") Topic 606 Revenue is recognizedfrom Contracts with Customers ("ASC 606"). Under ASC 606, we recognize revenue when evidencecontrol of an arrangement exists, risks and rewards of ownership have beenthe promised goods or services is transferred to customers whichin an amount that reflects the consideration we expect to be entitled in exchange for those goods or services.
Performance Obligations: A performance obligation is generally when title passes,a promise in a contract to transfer a distinct good or service to the sellingcustomer and is the unit of account in ASC 606. The contract's transaction price is fixedallocated to the performance obligations and determinable,
and collection is reasonably assured. Title passes at the designated shipping point for the majority of sales, but in a few cases, title passes at the delivery destination. The shipping point may be the plant, a distribution warehouse, a customer warehouse, or a port. Prices are generally set at the time of, or prior to, shipment. In cases where the final price is determined after shipment and agreed to with our customer,recognized as revenue is recognized when the finalperformance obligations are satisfied. Substantially all our contracts are of a short-term nature and contain a single performance obligation because the sale is for one type of product and shipping and handling charges are accounted for as a fulfillment cost and are not considered to be a separate performance obligation. The performance obligation is satisfied when control of the product is transferred to the customer, which typically occurs when we ship mineral products or deliver water from our facility to the customer. We account for substantially all of our revenue from sales to customers at a single point in time.
Contract Estimates: In certain circumstances, we may sell products to customers where the sales price is fixedvariable. For variable consideration sales, we estimate the sales price we expect to realize at contract inception based on the facts and determinablecircumstances for each sale, including historical experience, and recognize revenue to the otherextent it is probable that a subsequent change in estimate will not result in a significant revenue reversal compared to the cumulative revenue recognized once the uncertainty is resolved. We update variable consideration estimates at each reporting date for any changes in facts and circumstances and adjust financial information as necessary in the period the change is identified.
Contract Balances: The timing of revenue recognition, criteria have been met.
Sales are reported on a gross basis. We quote prices to customers both on a delivered basisbillings, and on the basis of pick‑up at our plants and warehouses. When a sale occurs on a delivered basis, we incur and,cash collection may result in turn, billcontract assets or contract liabilities. For certain contracts, the customer and record as gross revenue the product sales value, freight, packaging, and certain other distribution costs. Many customers, however, arrange andhas agreed to pay for these costs directly and, in these situations, only the product salesus before we have satisfied our performance obligations. Customer payments received before we have satisfied our performance obligations are included in gross revenues.
By-Product Credits—When by-product inventories are sold, we record the sale of by-productsaccounted for as a credit to costcontract liability.
Disaggregation of goods sold.Revenue: We present disaggregation of revenue by products which we believe best depicts how the nature, amount, timing and uncertainty of revenue and cash flows are affected by economic conditions.
Inventory and Long-Term Parts Inventory—Inventory consists of product and by-productbyproduct stocks that are ready for sale; mined ore; potash in evaporation ponds, which is considered work-in-process; and parts and supplies inventory. Product and by-productbyproduct inventory cost is determined using the lower of weighted average cost or estimated net realizable value and includes direct costs, maintenance, operational overhead, depreciation, depletion, and equipment lease costs applicable to the production process. Direct costs, maintenance, and operational overhead include labor and associated benefits.
We evaluate our production levels and costs to determine if any should be deemed abnormal and therefore excluded from inventory costs and expensed directly during the applicable period. The assessment of normal production levels is judgmental and unique to each period. We model normal production levels and evaluate historical ranges of production by operating plant in assessing what is deemed to be normal. Each production operation typically shuts down periodically for planned maintenance activities. The costs of maintenance turnarounds at our facilities are considered part of production costs and are absorbed into inventory in the period incurred.
Parts inventory, including critical spares that is not expected to be used within a period of one year is classified as non-current. Parts and supply inventory cost is determined using the lower of average acquisition cost or estimated replacement cost. Detailed reviews are performed related to the net realizable value of parts inventory, giving consideration to quality, slow-moving items, obsolescence, excessive levels, and other factors. Parts inventories that have not turned over in more than a year, excluding parts classified as critical spares, are reviewed for obsolescence and, if deemed appropriate, are included in the determination of an allowance for obsolescence.
Property, Plant, Equipment, Mineral Properties, and Development Costs—Property, plant, and equipment are stated at historical cost. Expenditures for property, plant, and equipment relating to new assets or improvements are capitalized, provided the expenditure extends the useful life of an asset or extends the asset's functionality. Property, plant, and equipment are depreciated under the straight-line method using estimated useful lives. The estimated useful lives of property, plant, and equipment are evaluated periodically as changes in estimates occur. No depreciation is taken on assets
classified as construction in progress until the asset is placed into service. Gains and losses are recorded upon retirement, sale, or disposal of assets. Maintenance and repair costs are recognized as period costs when incurred. Capitalized interest, to the extent of debt outstanding, is calculated and capitalized on assets that are being constructed, drilled, or built or that are otherwise classified as construction in progress.
Mineral properties and development costs, which are referred to collectively as mineral properties, include acquisition costs, the cost of drilling production wells, and the cost of other development work, all of which are capitalized. Exploration costs include geological and geophysical work performed on areas that do not yet have proven and probable reserves declared. These costs are expensed as incurred. Depletion of mineral properties is calculated using the units-of-production method over the estimated life of the relevant ore body. The lives of reserves used for accounting purposes are shorter than current reserve life determinations due to uncertainties inherent in long-term estimates. These reserve life estimates have been prepared by us and reviewed and independently determined by mine consultants. Tons of potash and langbeinite in the proven and probable reserves are expressed in terms of expected finished tons of product to be realized, net of estimated losses. Market price fluctuations of potash or Trio®, as well as increased production costs or reduced recovery rates, could render proven and probable reserves containing relatively lower grades of mineralization uneconomic to exploit and might result in a reduction of reserves. In addition, the provisions of our mineral leases, including royalty provisions, are subject to periodic readjustment by the state and federal government, which could affect the economics of our reserve estimates. Significant changes in the estimated reserves could have a material impact on our results of operations and financial position.
Recoverability of Long-Lived Assets—We evaluate our long-lived assets for impairment when events or changes in circumstances indicate that the related carrying amount may not be recoverable. An impairment is potentially considered to exist if an asset group's total estimated net future cash flows on an undiscounted basis are less than the carrying amount of the related asset. An impairment loss is measured and recorded based on the excess of the carrying amount of long-lived assets over its estimated fair value. Changes in significant assumptions underlying future cash flow estimates or fair values of asset groups may have a material effect on our financial position and results of operations. Sales price is a significant element of any cash
flow estimate, particularly for higher cost operations. Other assumptions we estimate include, among other things, the economic life of the asset, sales volume, inflation, raw materials costs, cost of capital, tax rates, and capital spending.
Factors we generally will consider important and which could trigger an impairment review of the carrying value of long-lived assets include the following:
•significant underperformance relative to expected operating results or operating losses
•significant changes in the manner of use of assets or the strategy for our overall business
•the denial or delay of necessary permits or approvals that would affect the utilization of our tangible assets
•underutilization of our tangible assets
•discontinuance of certain products by us or our customers
•a decrease in estimated mineral reserves
•significant negative industry or economic trends
Exploration CostsIntangible Assets—Exploration costsWater rights are accounted for as indefinite-lived intangible assets. We test indefinite-lived intangible assets for impairment at least annually on October 1, and more frequently if circumstances require. We use a qualitative assessment to determine whether it is more likely than not that the fair value of the unamortized intangible asset is less than its carrying value. If our qualitative assessment indicates it is more likely than not that the fair value of the unamortized assets is less than its carrying value, we estimate the fair value of the unamortized asset and record an impairment loss based on the excess of the carrying amount of the unamortized intangible asset over its estimated fair value. Fair value is estimated using quoted market prices, if available. If quoted market prices are not available, the estimated fair value is based on various valuation techniques, including the discounted value of estimated future cash flows. Changes in significant assumptions underlying fair value estimates may have a material effect on our financial position and results of operations.
We also have finite-lived intangible assets consisting of contractual agreements. These intangible assets are amortized over the period of estimated benefit using the straight-line method. No significant residual value is estimated for our finite-lived intangible assets. We estimate the useful life of intangible assets considering various factors, including but not limited to, the expected use of the asset, the expected life of other assets the intangible asset may relate, any legal, regulatory, contractual provisions, or relevant economic factors that may limit the use of the intangible asset. We evaluate the remaining useful lives of intangible assets each reporting period to determine if a revision to the asset's remaining life is necessary. Changes in significant assumptions underlying useful lives may have a material effect on our financial position and results of operations.
We evaluate our finite-lived intangible assets for impairment when events or changes in circumstances indicate that the related carrying amount may not be recoverable. Such circumstances may include geological and geophysical work performed on areas that dobut are not yet have proven and probable reserves declared. These costs are expensed as incurred.limited to (1) significant adverse changes in the manner the asset is used, or (2) significant adverse changes in legal factors or economic conditions, including adverse actions by regulatory authorities.
Asset Retirement ObligationObligations—Reclamation costs are initially recorded as a liability associated with the asset to be reclaimed or abandoned, based on applicable inflation assumptions and discount rates. The accretion of this discounted liability is recognized as expense over the life of the related assets, and the liability is periodically adjusted to reflect changes in the estimates of either the timing or amount of the reclamation and abandonment costs.
Planned Turnaround MaintenanceLeases—Each production operation typically shuts down periodicallyWe determine if an arrangement is a lease or contains a lease at inception. Operating and finance lease liabilities are recognized based on the present value of the remaining lease payments, discounted using the discount rate for planned maintenance activities. The costs of maintenance turnaroundsthe lease at our facilities are considered part of production costs and are absorbed into inventorythe commencement date. If readily determinable, we use the implicit rate in the period incurred.
Leases—Upon entering into leases,lease to determine the present value of future lease payments. If the implicit rate is not readily determinable, we evaluate whether leasesuse an incremental borrowing rate based on information available at the commencement date to determine the present value of future lease payments. Operating right-of-use ("ROU") assets and finance lease assets are operating or capital leases. Operatinggenerally recognized based on the amount of the initial measurement of the lease liability. Lease expense is recognized as incurred. Iffor operating lease payments change over the contractual term or involve contingent amounts, the total estimated cost over the term is recognized on a straight-line basis.basis over the lease term. For finance leases, interest expense is recognized on the lease liability and the ROU asset is amortized over the lease term. We account for lease and non-lease components as a single lease component, and we do not apply the requirements of ASC Topic 842 to short-term leases with a term of one year or less at inception.
Income Taxes—We are a subchapter C corporation and, therefore, are subject to U.S. federal and state income taxes. We recognize income taxes under the asset and liability method. Deferred tax assets and liabilities are recognized for the estimated future tax consequences attributable to differences between the financial statement carrying amounts of assets and liabilities and their respective tax bases. Deferred tax assets and liabilities are measured using the enacted tax rates expected to apply to taxable income in the periods in which the deferred tax liability or asset is expected to be settled or realized. We record a valuation allowance if it is deemed more likely than not that our deferred income tax assets will not be realized in full. These determinations are subject to ongoing assessment.
Cash and Cash Equivalents and Investments—Cash and cash equivalents consist of cash and liquid investments with an original maturity of three months or less.
We classify our investments in debt securities, which include U.S treasury and government agency obligations, and corporate bonds and notes, as held-to-maturity investments because we have the intent and ability to hold these investments to maturity. Our held to maturity investments are carried at amortized cost.
We use the equity method of accounting for investments in limited partnerships where we own more than 3% of the limited partnership, as required by the Securities and Exchange Commission. Under this method of accounting, we record our share of the net earnings or losses of the investee in the "Other Income (Expense)" section of our Consolidated Statements of Operations.
We record equity investments without a readily determinable fair value using the measurement alternative of cost, with adjustments for observable changes in prices resulting from orderly transactions for the identical or similar investments of the same issuer, or impairment.
Fair Value of Financial Instruments—Our financial instruments include cash and cash equivalents, restricted cash, accounts receivable, refundable income taxes, accounts payable and current accrued liabilities. These instruments are carried at cost, which approximates fair value due to the short-term maturities of the instruments. Allowances for doubtful accounts are recorded against the accounts receivable balance to estimate net realizable value. The fair value of the long-term debt is estimated using discounted cash flow analysis based on current borrowing rates for debt with similar remaining maturities and ratings. Amounts outstanding under our secured credit facility are carried at cost, which approximates fair value, due to the short-term nature of the borrowings.
Earnings per Share—Basic net income or loss per common share of stock is calculated by dividing net income or loss available to common stockholders by the weighted average basic common shares outstanding for the respective period.
Diluted net income per common share of stock is calculated by dividing net income by the weighted average diluted common shares outstanding, which includes the effect of potentially dilutive securities. Potentially dilutive securities for the diluted earnings or loss per share calculation consist of awards of restricted shares, performance units, and non‑qualified stock options. The dilutive effect of stock basedstock-based compensation arrangements is computed using the treasury‑stock method. Following the lapse of the vesting period of restricted shares, the shares are considered issued and therefore are included in the number of issued and outstanding shares for purposes of these calculations. When we report a net loss, all potentially dilutive securities are considered anti-dilutive and are excluded from the dilutive loss per share calculation.
Treasury Stock —Repurchases of our common stock are accounted for at cost and are recorded as treasury stock.
Stock‑Based Compensation—We account for stock-based compensation by recording expense using the fair value of the awards at the time of grant. We have recorded compensation expense associated with the issuance of restricted shares, performance units, and non-qualified stock options, all of which are subject to service conditions and in some cases subject to operational performance or market-based conditions. TheWe recognize expense associated with such awards is recognized over the service
period associated with each grant. Expense associated withFor awards with service only conditions is recognizedwe recognize expense using the straight-line recognition method over the requisite service period of the award, which is generally the vesting period of the award. Expense associatedWe recognize expense for awards with awards that contain both a service condition and a market condition are recognizedoperational performance conditions using the accelerated recognition method over the requisite service period of the award, which is generally the longestvesting period of the award. We recognize expense associated with awards that contain both a service condition and a market condition using the accelerated recognition method over the requisite service period of the award, which is generally the longer of the explicit service period or the derived service period (expected date the market condition is estimated to be achieved).
Recently Adopted Accounting Standards—In August 2013,June 2016, the Financial Accounting Standards Board (the "FASB"("FASB") issued Accounting Standards Update ("ASU") No. 2014-15, "Disclosure2016-13, as amended by ASU No. 2019-04 and ASU No. 2019-10, Financial Instruments - (Topic 326): Measurement of Uncertainties about an Entity's AbilityCredit Losses on Financial Instruments ("ASC Topic 326"), which we adopted on January 1, 2020. ASC Topic 326 changed the way entities recognized impairment of many financial assets by requiring immediate recognition of estimated credit losses expected to Continue as a Going Concern," which describes how an entity should assess its ability to meet obligations and sets rules for howoccur over their remaining life. Because our trade receivables are short-term in nature, the adoption of this information should be disclosed in the financial statements. The new standard applies to all entities for the first annual period in fiscal years ending after December 15, 2016, with early application permitted. We adopted this guidance in 2016 and it did not have a material impact on the disclosures included in our consolidated financial statements.
In April 2015,December 2019, the FASB issued ASU No. 2015-03, "Simplifying the Presentation of Debt Issuance Costs," which became effective for us beginning January 1, 2016, and requires retrospective adoption. In accordance with this standard, our deferred financing costs associated with outstanding debt balances have been reclassified from "Prepaid expenses and other current assets" and "Other assets, net" to "Long-term debt, net" and "Current portion of long-term debt, net." Amortization of such costs continues to be reported as "Interest expense, net." In accordance with the adoption of this new accounting standard, we have reclassified $1.6 million of deferred financing costs associated with our outstanding debt from "Prepaid expenses and other current assets" and "Other assets" to "Long-term debt, net" as of December 31, 2015 to conform to the December 31, 2016, presentation.
In July 2015, the FASB issued ASU No. 2015-11, "Inventory2019-12, Income Taxes (Topic 330)740): Simplifying the Measurement of Inventory." An entity using an inventory method other than last-in, first-out orAccounting for Income Taxes, which simplifies the retail inventory method should measure inventory ataccounting for income taxes by removing certain exceptions to the lower of costgeneral principles in Topic 740 and net realizable value. This standard clarifies that net realizable value is the estimated selling prices in the ordinary course of business, less reasonably predictable costs of completion, disposal, and transportation and was effective for us beginning January 1, 2017.amending existing guidance to improve consistent application. The adoption of this standard did not have a material impact on our consolidated financial statements.
In March 2016, the FASB issued ASU No. 2016-09, "Compensation - Stock Compensation (Topic 718): Improvements to Employee Share-Based Payment Accounting," which became effective for us beginning January 1, 2017. This standard changes several aspects of how we account for share-based payment award transactions, including income tax consequences, classification of awards as either equity or liabilities, classification of excess tax benefits on the statement of cash flows, forfeitures, minimum statutory tax withholding payments, and classification of employee taxes paid on the statement of cash flows when an employer withholds shares for tax-withholding purposes. In accordance with adoption of this standard share-based payment award forfeiture expense will no longer be estimated and will be recorded as forfeitures occur and we have recorded a $0.1 million adjustment to beginning retained earnings for the impact of this cumulative change.
Pronouncements Issued But Not Yet Adopted—In May 2014,December 2023, the FASB issued ASU No. 2014-09, as amended by 2023-09, "Income Taxes (Topic 740): Improvements to Income Tax Disclosures" ("ASU No. 2016-12, "Revenue from Contracts with Customers (Topic 606)," which2023-09"). ASU 2023-09 requires revenue to be recognized based on the amountthat an entity is expected to be entitled todisclose specific categories in the effective tax rate reconciliation as well as provide additional information for promised goods or services provided to customers. The standard also requires expandedreconciling items that meet a quantitative threshold, certain disclosures regarding contracts with customers. The guidance in this standard supersedes the revenue recognition requirements in Topic 605, "Revenue Recognition,"of state versus federal income tax expenses and most industry-specific guidance. Adoption of the standard may be applied retrospectively to each prior period presented (full retrospective method) or retrospectively with the cumulative effect recognized as of the date of initial application (modified retrospective method). This guidancetaxes paid. ASC 2023-09 is effective for us beginning January 1, 2018 and we will apply the full retrospective method. Accordingly, for our public filings beginning with our Quarterly Report on Form 10-Q for the quarter ending March 31, 2018, we will present prior periods as if revenue were recognized under Topic 606.
Our revenue is primarily generated from the sale of Potash and Trio® to customers. These sales predominantly contain a single delivery element and revenue is recognized at a single point in time when ownership, risk and rewards transfer to the buyer.
During the fourth quarter of 2017, we finalized our assessment of the impact that the new standard will have on our consolidated results of operations, financial position, and disclosures. As the adoption of the new guidance will not result in a significant shift in the timing of revenue recognition for our sales, we do not expect the new guidance to have a material impact on our Consolidated Financial Statements.
In February 2016, the FASB issued ASU No. 2016-02, "Leases (Topic 842)," which requires, among other things, lessees to recognize lease assets and liabilities on their balance sheets for those leases classified as operating leases under previous generally accepted accounting principles. These assets and liabilities must be recorded generally at the present value of the contracted lease payments, and the cost of the lease must be allocated over the lease term on a straight-line basis. This
guidance is effective for us for annual and interim periods in fiscal years beginning after December 15, 2018,2024. We are currently evaluating the guidance and expect it to only impact disclosures with a modified retrospective transition method mandated. As our mineral leases are exempt from the new standardno impact to results of operations, cash flows and our current operating leases are generally less than twelve months in term, we do not believe the adoption of this new standard will have a material impact on our consolidated financial statements.condition.
In August 2016,November 2023, the FASB issued ASU No. 2016-15, "Statement2023-07, "Segment Reporting (Topic 280): Improvements to Reportable Segment Disclosures" ("ASU 2023-07"). This new guidance: (i) introduces a requirement to disclose significant segment expenses regularly provided to the chief operating decision maker ("CODM"), (ii) extends certain annual disclosures to interim periods, (iii) clarifies disclosure requirements for single reportable segment entities, (iv) permits more than one measure of Cash Flows (Topic 230)" which is intendedsegment profit or loss to clarifybe reported under certain conditions, and align how certain cash receipts and cash payments are presented and classified in the statement of cash flows where there is currently diversity in practice. ASU 2016-15 specifically addresses eight classification issues within the statement of cash flows including debt prepayments or debt extinguishment costs; proceeds from the settlement of insurance claims; and separately identifiable cash flows and application(v) requires disclosure of the predominance principle. ASU 2016-15title and position of the CODM. The standard is effective for annual and interim periods in fiscal years beginning after December 15, 2017. We do not expect the adoption of this guidance to have a material impact on our consolidated financial statements.
In October 2016, the FASB issued ASU No. 2016-16, "Income Taxes (Topic 740)" which requires entities to recognize at the transaction date the income tax consequences of intercompany asset transfers other than inventory. ASU No. 2016-16 is effective for annual2023, and interim periods inwithin fiscal years beginning after December 15, 2017. We do not expect the2024. Early adoption of thisis permitted. The guidance applies retrospectively to have a material impact on our consolidated financial statements.
In November 2016, the FASB issued ASU Updated 2016-18, "Statement of Cash Flows (Topic 230): Restricted Cash" which will require entities to show the changesall periods presented in the totalfinancial statements. We are currently evaluating the guidance and expect it to only impact disclosures with no impact to results of cash, cash equivalents, restricted cash and restricted cash equivalents in the statement ofoperations, cash flows and will no longer require transfers between cash and cash equivalents and restricted cash and restricted cash equivalents in the statementfinancial condition.
Note 3— EARNINGS PER SHARE
| |
Note 3 | — EARNINGS PER SHARE |
Basic earnings or loss per share is computed by dividing net income or loss by the weighted-average number of shares of common stock outstanding during the period. For purposes of determining diluted earnings per share, basic weighted-average common shares outstanding areis adjusted to include potentially dilutive securities, including restricted shares,stock, stock options, and performance units. The treasury-stock method is used to measure the dilutive impact of potentially dilutive shares. Potentially dilutive shares are excluded from the diluted weighted-average shares outstanding computation in periods in which they have an anti-dilutive effect, such as when there is a net loss. Because we have net losses for eacheffect. The following table shows the calculation of the three years ended December 31, 2017, 2016,basic and 2015, all potentially dilutive shares are excluded from the diluted weighted-average common shares outstanding for each of those years. earnings (loss) per share (in thousands, except per share amounts):
| | | | | | | | | | | | | | | | | | | | |
| | Year Ended December 31, |
| | 2023 | | 2022 | | 2021 |
| Net (loss) income | | $ | (35,673) | | | $ | 72,220 | | | $ | 249,834 | |
| | | | | | |
| Basic weighted average common shares outstanding | | 12,761 | | | 13,152 | | | 13,099 | |
| Add: Dilutive effect restricted common stock | | — | | | 191 | | | 221 | |
| Add: Dilutive effect of stock options outstanding | | — | | | 109 | | | 71 | |
| | | | | | |
| Diluted weighted average common shares outstanding | | 12,761 | | | 13,452 | | | 13,391 | |
| | | | | | |
| (Loss) earnings per share: | | | | | | |
| Basic | | $ | (2.80) | | | $ | 5.49 | | | $ | 19.07 | |
| Diluted | | $ | (2.80) | | | $ | 5.37 | | | $ | 18.66 | |
The following table shows anti-dilutive shares excluded from the calculation of diluted loss per share:
|
| | | | | | | | | |
| | | Year Ended December 31, |
| | | 2017 | | 2016 | | 2015 |
| Anti-dilutive effect of restricted shares | | 3,327,789 |
| | 992,751 |
| | 468,737 |
|
| Anti-dilutive effect of stock options outstanding | | 1,711,288 |
| | 468,724 |
| | 294,318 |
|
| Anti-dilutive effect of performance units | | 63,025 |
| | 126,846 |
| | 167,443 |
|
The following table sets forth the calculation of basic and diluted earnings (loss) per share (in thousands, except per share amounts)thousands):
| | | | | | | | | | | | | | | | | | | | |
| | Year Ended December 31, |
| | 2023 | | 2022 | | 2021 |
| Anti-dilutive effect of restricted shares | | 348 | | | 63 | | | 57 | |
| Anti-dilutive effect of stock options outstanding | | 273 | | | — | | | 156 | |
| | | | | | |
|
| | | | | | | | | | | | |
| | | Year Ended December 31, |
| | | 2017 | | 2016 | | 2015 |
| Net loss | | $ | (22,910 | ) | | $ | (66,633 | ) | | $ | (524,776 | ) |
| Basic and diluted weighted average common shares outstanding | | 115,709 |
| | 75,819 |
| | 75,669 |
|
| Basic and diluted loss per share | | $ | (0.20 | ) | | $ | (0.88 | ) | | $ | (6.94 | ) |
Note 4— CASH, CASH EQUIVALENTS AND RESTRICTED CASH
Total cash, cash equivalents and restricted cash, as shown on the consolidated statements of cash flows are included in the following accounts at December 31, 2023, 2022, and 2021 (in thousands):
| | | | | | | | | | | | | | | | | |
| Year Ended December 31, |
| 2023 | | 2022 | | 2021 |
| Cash and cash equivalents | $ | 4,071 | | | $ | 18,514 | | | $ | 36,452 | |
| Restricted cash included in "Other current assets" | 25 | | | 25 | | | 175 | |
| Restricted cash included in "Other assets, net" | 555 | | | 545 | | | 519 | |
| Total cash, cash equivalents, and restricted cash shown in the statement of cash flows | $ | 4,651 | | | $ | 19,084 | | | $ | 37,146 | |
Restricted cash included in "Other assets, net" on the balance sheet at December 31, 2023, 2022, and 2021 represents amounts whose use is restricted by contractual agreements with the BLM or the State of Utah as security to fund future reclamation obligations at our sites. Restricted cash included in "Other current assets" on the balance sheet at December 31, 2023 and 2022 represents cash deposits with supply vendors.
Note 5— INVENTORY AND LONG-TERM PARTS INVENTORY
The following summarizes our inventory, recorded at the lower of weighted average cost or estimated net realizable value as of December 31, 2017,2023, and 2016,2022, respectively (in thousands):
| | | | | | | | | | | | | | |
| | December 31, |
| | 2023 | | 2022 |
| Finished goods product inventory | | $ | 66,033 | | | $ | 74,777 | |
| In-process inventory | | 28,044 | | | 24,767 | |
| Total product inventory | | 94,077 | | | 99,544 | |
| Current parts inventory, net | | 20,175 | | | 15,272 | |
| Total current inventory, net | | 114,252 | | | 114,816 | |
| Long-term parts inventory, net | | 30,231 | | | 24,823 | |
| Total inventory, net | | $ | 144,483 | | | $ | 139,639 | |
|
| | | | | | | | |
| | | December 31, |
| | | 2017 | | 2016 |
| Finished goods product inventory | | $ | 54,577 |
| | $ | 52,571 |
|
| In-process mineral inventory | | 19,822 |
| | 22,126 |
|
| Total product inventory | | 74,399 |
| | 74,697 |
|
| Current parts inventory, net | | 8,727 |
| | 19,658 |
|
| Total current inventory, net | | 83,126 |
| | 94,355 |
|
| Long-term parts inventory, net | | 30,611 |
| | 21,037 |
|
| Total inventory, net | | $ | 113,737 |
| | $ | 115,392 |
|
Parts inventories are shownDuring the year ended December 31, 2023, we recorded $6.5 million in charges for lower of weighted average cost or estimated net of any required allowances.realizable value on our finished goods product inventory. During the years ended December 31, 2017, 2016,2022 and 2015,2021, we recorded no charges of approximately $7.3 million, $20.4 million, and $31.8 million, respectively, as a result of routine assessments of thefor lower of weighted average cost or estimated net realizable value on our finished goods product inventory.
Parts inventories are shown net of any required allowances. During the conversion of the East plant to a Trio®-only facility in 2016, we suspended potash production at our East facility for a total of seven days. As a result, approximately $1.7 million of production costs at our East facility that would have been allocated to additional tons produced, were excluded from our inventory values and instead expensed as period production costs in the yearyears ended December 31, 2016.
During the third quarter2023, 2022, and 2021, we recorded reserves for obsolete parts inventory of 2015, we received an order issued by MSHA relating to maintenance issues and salt build‑up in the ore hoisting shaft at our West mine. Upon issuance of the order, we suspended production at the West mine for 15 days while we took corrective actions to resolve the issues. As a result, potash production from our West mine was abnormally low during this period. In addition, although production resumed in mid-September 2015, we continued to perform incremental maintenance on the ore hoisting shaft into the fourth quarter of 2015, during which time production at the West mine was temporarily suspended.
As a result of the temporary suspensions of production during 2015, we determined that approximately $7.5$0.5 million, $1.8 million and $2.9$2.1 million, respectively.
Note 6— PROPERTY, PLANT, EQUIPMENT, AND MINERAL PROPERTIES
| |
Note 5 | — PROPERTY, PLANT, EQUIPMENT, AND MINERAL PROPERTIES |
"Property, plant, equipment, and mineral properties, net" were comprised of the following (in thousands):
| | | | | December 31, | | Range of remaining useful
lives (years) |
| | | 2017 | | 2016 | | Lower Limit | | Upper Limit |
| | December 31, | |
| | December 31, | |
| | December 31, | |
| | 2023 | |
| | 2023 | |
| | 2023 | |
| Land | |
| Land | |
| Land | |
| Ponds and land improvements | |
| Ponds and land improvements | |
| Ponds and land improvements | |
| Mineral properties and development costs | |
| Mineral properties and development costs | |
| Mineral properties and development costs | |
| Buildings and plant | |
| Buildings and plant | |
| Buildings and plant | | $ | 79,757 |
| | $ | 82,457 |
| | 1 | | 25 |
| Machinery and equipment | | 234,861 |
| | 227,987 |
| | 1 | | 25 |
| Machinery and equipment | |
| Machinery and equipment | |
| Vehicles | | 4,835 |
| | 4,750 |
| | 3 | | 10 |
| Office equipment and improvements | | 12,637 |
| | 12,505 |
| | 1 | | 20 |
| Ponds and land improvements | | 56,194 |
| | 57,474 |
| | 1 | | 25 |
| Total depreciable assets | | 388,284 |
| | 385,173 |
| |
| Accumulated depreciation | | $ | (141,818 | ) | | $ | (116,194 | ) | |
| Total depreciable assets, net | | $ | 246,466 |
| | $ | 268,979 |
| |
| | | | | | |
| Mineral properties and development costs | | 138,841 |
| | 138,578 |
| |
| |
|
| Accumulated depletion | | (26,840 | ) | | (21,974 | ) | |
| Total depletable assets, net | | 112,001 |
| | 116,604 |
| |
| | | | | | |
| Land | | $ | 519 |
| | $ | 719 |
| |
| Vehicles | |
| Vehicles | |
| Office equipment and leasehold improvements | |
| Office equipment and leasehold improvements | |
| Office equipment and leasehold improvements | |
| Operating lease ROU assets | |
| Operating lease ROU assets | |
| Operating lease ROU assets | |
| Breeding stock | |
| Breeding stock | |
| Breeding stock | |
| Construction in progress | | 5,556 |
| | 2,188 |
| |
| Construction in progress | |
| Construction in progress | |
| Total property, plant, equipment, and mineral properties, gross | |
| Total property, plant, equipment, and mineral properties, gross | |
| Total property, plant, equipment, and mineral properties, gross | |
| Less: accumulated depreciation, depletion, and amortization | |
| Less: accumulated depreciation, depletion, and amortization | |
| Less: accumulated depreciation, depletion, and amortization | |
| Total property, plant, equipment, and mineral properties, net | | $ | 364,542 |
| | $ | 388,490 |
| |
| Total property, plant, equipment, and mineral properties, net | |
| Total property, plant, equipment, and mineral properties, net | |
We incurred the following expenses for depreciation, depletion, and accretion,amortization of ROU assets, including expenses capitalized into inventory, for the following periods (in thousands):
| | | | | | | | | | | | | | | | | | | | |
| | Year Ended December 31, |
| | 2023 | | 2022 | | 2021 |
| Depreciation | | $ | 34,307 | | | $ | 29,805 | | | $ | 29,447 | |
| Depletion | | 3,190 | | | 3,168 | | | 3,979 | |
| Amortization of ROU assets | | 1,581 | | | 1,738 | | | 2,209 | |
| Total incurred | | $ | 39,078 | | | $ | 34,711 | | | $ | 35,635 | |
|
| | | | | | | | | | | | |
| | | Year Ended December 31, |
| | | 2017 | | 2016 | | 2015 |
| Depreciation | | $ | 28,323 |
| | $ | 36,169 |
| | $ | 79,999 |
|
| Depletion | | 4,886 |
| | 4,744 |
| | 5,981 |
|
| Accretion | | 1,558 |
| | 1,768 |
| | 1,696 |
|
| Total incurred | | $ | 34,767 |
| | $ | 42,681 |
| | $ | 87,676 |
|
We recorded approximately $4.8 million of additional depreciation in 2015, as a result of the accelerated depreciation of assets that were taken out of service as a result of the transitioning of our East facility to Trio®-only. This accelerated depreciation increased our operating loss and our net loss by $4.8 million forDuring the year ended December 31, 2015 and increased our basic and diluted loss per share by $0.07.2023, we recorded total impairment charges of $43.3 million, as discussed in more detail below. During the year ended December 31, 2022, we recorded no impairment charges.
In the fourth quarter of 2015, due to2023, given the declinedecrease in potash prices,our gross margin for our Trio® segment we recognized $323.8 milliondetermined that sufficient indicators of potential impairment charges related toof our EastTrio® segment long-lived assets existed. We performed a recoverability test and West conventional mining facilities, and our North facility in New Mexico. Our estimated fair values were determined primarily using the market values in exchange method. As such, we have determined that the non-recurring faircarrying value measurements of our Trio® segment long-lived assets fall into Level 3 ofwas not recoverable. We engaged a third-party valuation firm to determine the fair value hierarchy.of our Trio® segment assets. The fair value of our Trio® segment assets was primarily determined using the expected proceeds received in an orderly sale of the individual assets. The carrying value of our Trio® segment asset group exceeded its fair value, and we recorded an impairment charge of $31.9 million.
Our long-lived assets at our West facility have been in care and maintenance since July 2016. Given the length of time since the assets were placed in care and maintenance, we engaged a third-party valuation firm to determine if the fair value of the West assets supports the carrying value of those assets. The fair value of the West assets was determined using the expected proceeds received in an orderly sale of the individual assets. The carrying value of the West assets exceeded the fair value and we recorded an impairment charge of $9.9 million during the fourth quarter of 2023.
| |
Note 6 | — OTHER FINANCIAL STATEMENT DATA |
OtherFinally, during 2023, we recorded impairment charges of $1.5 million related to certain assets in our Oilfield Solutions Segment, specifically certain water recycling equipment and an investment in a non-operating interest in an oil and gas investment.
Note 7— LEASES
We determine if an arrangement is a lease or contains a lease at inception. We have operating (income) expense consistedleases for mining equipment, trucks, rail cars, and office space. Our operating leases have remaining leases terms ranging from less than one year to four years. Our finance leases have remaining terms ranging from less than one year to five years. Leases recorded on the balance sheet consist of the following amounts: (amounts in thousands):
| | | | | | | | | | | | | | | | | | | | |
| Leases | | Classification on the Balance Sheet | | Balance, December 31, 2023 | | Balance, December 31, 2022 |
| Assets | | | | | | |
| Operating lease ROU assets, net | | Property, plant, equipment, and mineral properties, net | | $ | 2,031 | | | $ | 3,663 | |
| Finance lease ROU assets, net | | Property, plant, equipment, and mineral properties, net | | $ | 2,609 | | | $ | — | |
| Liabilities | | | | | | |
| Current operating lease liabilities | | Other current liabilities | | $ | 1,387 | | | $ | 1,608 | |
| Current finance lease liability | | Other current liabilities | | $ | 961 | | | $ | — | |
| Non-current operating lease liabilities | | Operating lease liabilities | | $ | 741 | | | $ | 2,206 | |
| Non-current finance lease liabilities | | Finance lease liabilities | | $ | 1,451 | | | $ | — | |
| | | | | | |
Other information related to lease term and discount rate is as follows:
| | | | | | | | | | | | | | |
| | December 31, 2023 | | December 31, 2022 |
| Weighted average remaining lease term - operating leases | | 1.7 years | | 2.5 years |
| Weighted average remaining lease term - finance leases | | 2.3 years | | 0.0 years |
| | | | |
| Weighted average discount rate - operating leases | | 5.7 | % | | 5.4 | % |
| Weighted average discount rate - finance leases | | 8.5 | % | | — | % |
The components of lease expense are as follows (amounts in thousands):
| | | | | | | | | | | | | | | | | | | | |
| | For the Year Ended December 31, 2023 | | For the Year Ended December 31, 2022 | | For the Year Ended December 31, 2021 |
| Operating lease expense | | $ | 1,667 | | | $ | 1,904 | | | $ | 2,370 | |
| Short-term lease expense | | 122 | | | 150 | | | 122 | |
| Total lease expense | | $ | 1,789 | | | $ | 2,054 | | | $ | 2,492 | |
Supplemental cash flow information related to leases was as follows (amounts in thousands):
|
| | | | | | | | | | | | |
| | | Year Ended December 31, |
| | | 2017 | | 2016 | | 2015 |
| | | (in thousands) |
| Water sales | | $ | (6,312 | ) | | $ | — |
| | $ | — |
|
| Loss on disposal of assets | | 1,830 |
| | 262 |
| | 679 |
|
| Reserve for inventory obsolescence | | 1,107 |
| | 496 |
| | — |
|
| Accrual for land issues | | 600 |
| | — |
| | — |
|
| Property damage insurance reimbursement | | — |
| | (1,211 | ) | | — |
|
| Property damage | | — |
| | — |
| | 2,453 |
|
| Compensating tax adjustment | | — |
| | (1,086 | ) | | — |
|
| Property tax refund | | — |
| | — |
| | (2,504 | ) |
| Other (income) expense | | (14 | ) | | (127 | ) | | 707 |
|
| Other operating (income) expense | | $ | (2,789 | ) | | $ | (1,666 | ) | | $ | 1,335 |
|
| | | | | | | | | | | | | | |
| | For the Year Ended December 31, 2023 | | For the Year Ended December 31, 2022 |
| Cash paid for amounts included in the measurement of lease liabilities | | | | |
| Operating cash flows from operating leases | | $ | 1,724 | | | $ | 1,889 | |
| Operating cash flows from finance leases | | 139 | | | — | |
| Financing cash flows from finance leases | | 597 | | | — | |
| | | | |
| Right-of-Use Assets exchanged for new operating lease liabilities | | 48 | | | 2,305 | |
| Right-of-Use Assets exchanged for new finance lease liabilities | | 3,009 | | | — | |
The following tables provide additional information concerning selected balance sheet accounts:
|
| | | | | | | | |
| | | December 31, |
| | | 2017 | | 2016 |
| | | (in thousands) |
Final price deferred1 | | $ | 5,989 |
| | $ | 7,814 |
|
| Prepaid expenses | | 3,051 |
| | 4,063 |
|
| Other current assets | | 211 |
| | 833 |
|
| Total Other current assets | | $ | 9,251 |
| | $ | 12,710 |
|
1Final price deferred is product that has shipped to customers, but the price has not yet been agreed upon. This has not been included in inventory as it is not held for sale. Revenue has not been recognized as the amount is not fixed or determinable.
|
| | | | | | | | |
| | | December 31, |
| | | 2017 | | 2016 |
| | | (in thousands) |
| Accrued property taxes | | $ | 854 |
| | $ | 1,539 |
|
| Accrued utility expenses | | 823 |
| | 955 |
|
| Accrued interest expense | | 717 |
| | 2,312 |
|
| Accrued construction in progress | | 662 |
| | 581 |
|
| Customer pre-payments | | 513 |
| | — |
|
Other1 | | 4,505 |
| | 3,303 |
|
| Total Accrued liabilities | | $ | 8,074 |
| | $ | 8,690 |
|
1None of the individual amounts included in "Other" in the above table represent more than five percent of total current liabilities at December 31, 2017 and 2016.Senior Notes—As of December 31, 2017, we had outstanding $60 million2023, maturities of senior notes (the "Notes") consistinglease liabilities are summarized as follows (amounts in thousands):
| | | | | | | | | | | | | | | | | | | | |
| Years Ending December 31, | | Operating Leases | | Finance Leases | | Total |
| 2024 | | $ | 1,471 | | | $ | 1,104 | | | $ | 2,575 | |
| 2025 | | 618 | | | 810 | | | 1,428 | |
| 2026 | | 114 | | | 644 | | | 758 | |
| 2027 | | 40 | | | 67 | | | 107 | |
| 2028 | | — | | | 39 | | | 39 | |
| | | | | | |
| Total future minimum lease payments | | $ | 2,243 | | | 2,664 | | | 4,907 | |
| Less - amount representing interest | | 115 | | | 252 | | | 367 | |
| Present value of future minimum lease payments | | $ | 2,128 | | | 2,412 | | | 4,540 | |
| Less - current lease obligations | | 1,387 | | | 961 | | | 2,348 | |
| Long-term lease obligations | | $ | 741 | | | $ | 1,451 | | | $ | 2,192 | |
$24 million of Senior Notes, Series A, due April 16, 2020
$18 million of Senior Notes, Series B, due April 14, 2023
$18 million of Senior Notes, Series C, due April 16, 2025
Note 8— INTANGIBLE ASSETS
We originally issued $150have water rights, recorded at $19.2 million of the Notes in 2013. Since the beginning of the fourth quarter of 2016, we have repaid an aggregate principal amount of $90 million of the Notes, including $75 million paid in the year endedat December 31, 2017. In June 2017, we entered into an amendment with the holders2023, and 2022. Our water rights have indefinite lives and are not amortized. We evaluate our water rights at least annually as of the Notes that requires us to prepay an additional $10October 1 for impairment, or more frequently if circumstances require.
We have other intangible assets recorded at $6.4 million of the Notes, together with accrued interest and a make-whole amount, on or before December 31, 2018, of which none had been paid as of December 31, 2017.2023 and 2022. We account for the other intangible assets as finite-lived intangible assets and amortize those intangible assets over the period of estimated benefit, using the straight-line method. As of December 31, 2023, the weighted-average remaining amortization period for the other intangible assets was 15.3 years. These intangible assets are included in "Other assets, net" on the consolidated balance sheets.
As of December 31, 2023, and December 31, 2022, we have the following amounts recorded for intangible assets (amounts in thousands):
| | | | | | | | | | | | | | | | | | | | | | | | | | | | | | |
| | December 31, 2023 | | December 31, 2022 | | |
| Finite-lived intangible assets: | | Gross Carrying Amount | | Accumulated Amortization | | Gross Carrying Amount | | Accumulated Amortization | | | | |
| Produced water disposal royalty agreements | | $ | 2,694 | | | $ | (630) | | | $ | 2,694 | | | $ | (495) | | | | | |
| Surface damage and easement agreements | | 3,723 | | | (871) | | | 3,723 | | | (685) | | | | | |
| Total | | $ | 6,417 | | | $ | (1,501) | | | $ | 6,417 | | | $ | (1,180) | | | | | |
| | | | | | | | | | | | |
| Indefinite-lived intangible assets: | | | | | | | | | | | | |
| Water rights | | $ | 19,184 | | | | | $ | 19,184 | | | | | | | |
Total amortization of intangible assets for the years ended December 31, 2023, 2022, and 2021 was $0.3 million. We estimate the annual amortization expense of intangible assets will be $0.3 million for each of the next five years.
Note 9— DEBT
Credit Facility—In August 2022, we and certain of our subsidiaries entered into the Second Amended and Restated Credit Agreement with a syndicate of lenders with the Bank of Montreal, as administrative agent, which provides for a revolving credit facility. The June 2017 amendment also alteredagreement amended our existing revolving credit facility to, among other things, increase the methodology for determiningamount available under the variable interestfacility from $75 million to $150 million, extend the maturity date to August 4, 2027, and transition from LIBOR (London Interbank Offered Rate) to SOFR (Secured Overnight Financing Rate) as a reference rate for borrowings under the Notes, thoughcredit agreement. Borrowings under the amended credit facility bear interest rates will continueat SOFR plus an applicable margin of 1.50% to be2.25% per annum, based on our financial performanceleverage ratio as measured by certain financial covenant levels, and modified certain terms regardingcalculated in accordance with the mandatory redemptions or offers of prepayment to the holders of the Notes.
Theamended agreement governing the Notes provides forrevolving credit facility. Borrowings under the following:
We granted to the collateral agent for the noteholders a first lien on substantially all of our non-current assets and second lien onrevolving credit facility are secured by substantially all of our current assets.
The agreement requires us to maintain a minimum trailing twelve-month adjusted EBITDA, which is measured quarterly through March 2018, of negative $7.5 million. Adjusted EBITDA is a non-GAAP measure that is calculated as adjusted earnings before interest, income taxes, depreciation, amortization, and certain other expenses fornon-current assets, and the prior four quarters, as defined under the agreement. Our adjusted EBITDA as calculated under the agreement was $25.9 million for the four quarters ended December 31, 2017, satisfying the adjusted EBITDA covenant.
The agreement requires us to maintain minimum liquidity of $15 million as of the last day of any month ending on or prior to March 31, 2018, and monthly thereafter if we do not meet certain financial covenants. Liquidity is calculated as unencumbered cash and unused availability under our credit facility. Our liquidity as calculated under the agreement was $23.1 million as of December 31, 2017, satisfying the liquidity covenant.
The agreement requires us to maintain a minimum fixed charge coverage amount of negative $15 million and negative $10 million for the quarters ending June 30, 2018, and September 30, 2018, respectively. The agreement also includes requirements relating to a leverage ratio and a fixed charge coverage ratio to be tested on a quarterly basis commencing with the quarter ending June 30, 2018, with respect to the leverage ratio, and December 31, 2018, with respect to the fixed charge coverage ratio. The maximum leverage ratio will be 11.5 to 1.0 for the quarter ending June 30, 2018, and decreases to 3.5 to 1.0 for the quarter ending September 30, 2019, and each quarter thereafter. The minimum fixed charge coverage ratio will be 0.25 to 1.0 for the quarter ending December 31, 2018, and increases to 1.3 to 1.0 for the quarter ending September 30, 2019, and each quarter thereafter. In general, our fixed charge coverage amount is calculated as adjusted EBITDA for the prior four quarters, minus capital expenditures, cash paid for income taxes, and interest expense plus scheduled principal amortization of long-term funded indebtedness; our leverage ratio is calculated as the ratio of funded indebtedness to adjusted EBITDA for the prior four quarters; and our fixed charge coverage ratio is calculated as the ratio of adjusted EBITDA for the prior four quarters, minus capital expenditures and cash paid for income taxes, to interest expense plus scheduled principal amortization of long-term funded indebtedness. As of December 31, 2017, our fixed charge coverage amount was a negative $0.5 million, our leverage ratio was 2.5 to 1.0 and our fixed charge coverage ratio was 0.9 to 1.0.
The interest rates on the Notes may adjust quarterly based on our leverage ratio and an adjusted fixed charge coverage ratio. As our financial position improves as measured by these ratios, we pay lower interest rates under the Notes. For the ten months ended October 31, 2017, the interest rates on the Notes were 7.73% for the Series A Notes, 8.63% for the Series B Notes and 8.78% for the Series C Notes. Beginning November 1, 2017, the interest rates on the Notes were reduced to 3.73% for the Series A Notes, 4.63% for the Series B Notes and 4.78% for the Series C Notes. These rates represent the lowest interest rates available under the Notes. In addition, additional interest of 2%, which may be paid in kind, will begin to accrue on April 1, 2018, unless we satisfy certain financial covenant tests. We currently expect to satisfy these tests.
We are required to offer to prepay the Notes with the proceeds of dispositions of certain specified property and with the proceeds of certain equity issuances, as set forth in the agreement.
The obligations under the Notescredit facility are unconditionally guaranteed by several of our subsidiaries.
We were in compliance with the applicable covenants under the agreement governing the Notes as of December 31, 2017.
Our outstanding long-term debt, net, was as follows (in thousands): |
| | | | | | | |
| | December 31, 2017 | | December 31, 2016 |
| Notes, at carrying value | $ | 60,000 |
| | $ | 135,000 |
|
| Less current portion of Notes | (10,000 | ) | | — |
|
| Less deferred financing costs | (563 | ) | | (1,566 | ) |
| Long-term portion of Notes, net | $ | 49,437 |
| | $ | 133,434 |
|
Credit Facility—In 2016, we entered into a credit agreement with Bank of Montreal that provides an asset-based revolving credit facility of up to $35 million in aggregate principal amount.
In June 2017, we amended the agreement to extend the maturity date to October 31, 2019, and to permit up to $10 million of borrowings under the agreement to be used to make payments on the Notes.
The credit facility allows us to borrow up to $35 million, subject to monthly borrowing base limits based upon our inventory and receivables. If our total remaining availability under the credit facility was to fall below $6 million, we would be subject to a minimum fixed charge coverage ratio of 1 to 1, which we would not currently meet. Any borrowings on the credit facility bear interest at 1.75% to 2.25% above LIBOR (London Interbank Offered Rate), based on average availability under the credit facility. We have granted to Bank of Montreal a first lien on substantially all of our current assets and a second lien on substantially all of our non-current assets. We regularlyoccasionally borrow and repay amounts under the facility for near-term working capital needs or other purposes and may do so in the future. For the year ended December 31, 2017,2023, we borrowed $22.0made $9.0 million in borrowings and repaid $18.1made $5.0 million in repayments under the facility. For the year ended December 31, 2022, we made no borrowings and made no repayments under the facility. For the year ended December 31, 2021, we made no borrowings and made $29.8 million in repayments under the facility. As of December 31, 2017,2023, we had $3.9$4.0 million ofin borrowings outstanding and $3.1 million inno outstanding letters of credit under the facility. Considering theAs of December 31, 2022, and 2021, we had no borrowings outstanding borrowings and letters$1.0 million in an outstanding letter of credit andunder the fixed charge coverage ratio requirement described above, we have $22.0facility. We had $146.0 million available under the facility as of December 31, 2017.2023.
We were in compliance with the applicable covenants under the facility as of December 31, 2017.2023.
Previous Credit FacilityPPP Loan—Until September 30, 2016,In April 2020, we received a $10 million loan under the CARES Act Paycheck Protection Program (the "PPP"). We submitted our application for forgiveness of the full amount of the loan in November 2020. In June 2021, we received notice that the SBA had an unsecured credit facilityremitted funds to our bank to fully repay our PPP loan and accrued interest. Accordingly, we recognized a gain of $10.1 million related to the forgiveness of the PPP loan and the associated accrued interest on the loan.
Senior Notes—In June 2021 we repaid the remaining $15.0 million of principal outstanding on our Series B Senior Notes and satisfied all obligations under the related Note Purchase Agreement. In connection with this repayment, the Company paid in place. Pursuant to a series of amendments during 2016, the amount available to us under our previous unsecured credit facility was reduced from $250 million to $1aggregate approximately $15.6 million, which consisted of (i) $15.0 million of remaining aggregate principal amount could be used only for letters of credit. The credit facility matured according to its terms on September 30, 2016,Series B Senior Notes, (ii) approximately $0.1 million of accrued interest and therefore is no longer outstanding.(iii) a "make-whole" premium of $0.5 million. As a result of the repayment, the Note Purchase Agreement was terminated.
Additional Letter of Credit—In addition to the letters of credit referred to above, as of December 31, 2016, we also had a $0.5 million letter of credit outstanding secured by a restricted cash account reflected in "Prepaid expenses and other current assets" on the condensed consolidated balance sheets. In 2017, this letter of credit was canceled and the $0.5 million restricted cash account was released.
Interest Expense—Interest expense is recorded net of any capitalized interest associated with investments in capital projects. We incurred gross interest expense of $11.8$0.8 million, $12.1$0.4 million, and $6.6$1.5 million for the years ended December 31, 2017, 2016,2023, 2022, and 2015,2021, respectively.
Amounts included in interest expense for the years ended December 31, 2017, 2016,2023, 2022, and 20152021 (in thousands) are as follows:
| | | | | | | | | | | | | | | | | | |
| Year ended December 31, |
| 2023 | | 2022 | | 2021 | |
| Interest expense on borrowings | $ | 275 | | | $ | — | | | $ | 654 | | |
| Commitment fee on unused credit facility | 226 | | | 155 | | | 70 | | |
| Make-whole payments | — | | | — | | | 505 | | |
| Amortization of deferred financing costs | 301 | | | 265 | | | 314 | | |
| Gross interest expense | 802 | | | 420 | | | 1,543 | | |
| Less capitalized interest | 802 | | | 319 | | | 75 | | |
| Interest expense, net | $ | — | | | $ | 101 | | | $ | 1,468 | | |
|
| | | | | | | | | | | | |
| | | Year ended December 31, |
| | | 2017 | | 2016 | 2015 | |
| Interest on notes and credit facility | | $ | 7,043 |
| | $ | 9,152 |
| $ | 6,292 |
| |
| Make-whole payments | | 3,001 |
| | 806 |
| — |
| |
| Amortization of deferred financing costs | | 1,778 |
| | 2,113 |
| 352 |
| |
| Gross interest expense | | 11,822 |
| | 12,071 |
| 6,644 |
| |
| Less capitalized interest | | 130 |
| | 449 |
| 293 |
| |
| Interest expense, net | | $ | 11,692 |
| | $ | 11,622 |
| $ | 6,351 |
| |
Note 10— ASSET RETIREMENT OBLIGATION | |
Note 8 | — ASSET RETIREMENT OBLIGATION |
We recognize an estimated liability for future costs associated with the abandonmentclosure and reclamation of our mining properties. A liability for the fair value of an asset retirement obligation and a corresponding increase to the carrying value of the related long-lived asset are recorded as the mining operations occur or the assets are acquired.
Our asset retirement obligation is based on the estimated cost to abandonclose and reclaim the mining operations, the economic life of the properties, and federal and state regulatory requirements. The liability is discounted using credit adjusted risk-free rate estimates at the time the liability is incurred or when there are upward revisions to estimated costs. The credit adjusted risk-free rates used to discount our abandonment liabilities range from 6.9% to 9.7%12.0%. Revisions to the liability occur due to construction of new or expanded facilities, changes in estimated abandonment costs or economic lives, changes in the estimated timing of the reclamation activities or if federal or state regulators enact new requirements regarding the abandonment or reclamation of mines. In the fourth quarter of 2016, we extended our estimate of when the majority of our reclamation activities would occur by five years. This longer period of time resulted in a decrease in our asset retirement obligation.
Following is a table of the changes to our asset retirement obligations for the following periods (in thousands):
| | | | | | | | | | | | | | | | | | | | |
| | Year Ended December 31, |
| | 2023 | | 2022 | | 2021 |
| Asset retirement obligation, at beginning of period | | $ | 26,864 | | | $ | 27,024 | | | $ | 23,872 | |
| Liabilities settled | | (197) | | | (1,533) | | | — | |
| Liabilities incurred | | — | | | 297 | | | — | |
| Changes in estimated obligations | | 1,552 | | | (885) | | | 1,294 | |
| Accretion of discount | | 2,140 | | | 1,961 | | | 1,858 | |
| Total asset retirement obligation, at end of period | | $ | 30,359 | | | $ | 26,864 | | | $ | 27,024 | |
| Less current portion of asset retirement obligation | | $ | (282) | | | $ | (300) | | | $ | — | |
| Long-term portion of asset retirement obligation | | $ | 30,077 | | | $ | 26,564 | | | $ | 27,024 | |
|
| | | | | | | | | | | | |
| | | Year Ended December 31, |
| | | 2017 | | 2016 | | 2015 |
| Asset retirement obligation, at beginning of period | | $ | 19,976 |
| | $ | 22,951 |
| | $ | 22,037 |
|
| Liabilities settled | | — |
| | (3 | ) | | (86 | ) |
| Liabilities incurred | | 29 |
| | — |
| | — |
|
| Changes in estimated obligations | | (87 | ) | | (4,740 | ) | | (696 | ) |
| Accretion of discount | | 1,558 |
| | 1,768 |
| | 1,696 |
|
| Total asset retirement obligation, at end of period | | $ | 21,476 |
| | $ | 19,976 |
| | $ | 22,951 |
|
The undiscounted amount of We estimate approximately $7.8 million in asset retirement obligation is $59.5 million as of December 31, 2017, of which we estimate approximately $5.3 million in payments may occur in the next five years.
In March 2017,Note 11— REVENUE
Revenue Recognition—Under ASC 606, we completedrecognize revenue when control of the promised goods or services is transferred to customers in an underwritten public offeringamount that reflects the consideration we expect to be entitled in exchange for those goods or services.
Contract Balances—As of our common stockDecember 31, 2023, and issued 50.12022, we had $2.3 million shares of common stock for net cash proceeds of $57.2 million. The net proceeds from the offering were used to partially repay indebtedness.
In May 2017, we established an at-the-market offering program, which gives us the capacity to issue up to $40and $2.4 million of contract liabilities, respectively, of which $1.0 million and $0.9 million were current as of December 31, 2023 and 2022, respectively, and included in "Other current liabilities" on the consolidated balance sheets. Customer advances received before we have satisfied our common stock. In September 2017, we issued 0.5 million sharesperformance obligations are accounted for as a contract liability (sometimes referred to in practice as deferred revenue).
As of common stockDecember 31, 2021, our contract liability balance primarily consisted of prepayments from a customer for net cash proceeds of $1.9 million. The net proceeds were used for general corporate purposes. We may offer additional sharesfuture water deliveries under the at-the-market offering programterms of a water sales agreement. In August 2022, our customer notified us that they were terminating the water sales agreement and in September 2022 we intend to userefunded the net proceeds from anycustomer's prepayment balance of $32.6 million. See Note 14—Commitments and Contingencies below for additional offerings under this program for general corporate purposes, which may include, among other things, theinformation regarding our water rights and repayment of indebtedness under our senior notes or revolving credit facility, acquisitions,the customer's prepayment balance.
Our contract liability activity for the years ended December 31, 2023, 2022, and funding capital expenditures.2021 is shown below (in thousands):
| | | | | | | | | | | | | | | | | | | | |
| | Year Ended December 31, |
| | 2023 | | 2022 | | 2021 |
| Beginning balance | | $ | 2,374 | | | $ | 33,788 | | | $ | 30,419 | |
| Additions | | 1,030 | | | 1,823 | | | 4,310 | |
| Refund of prepayments | | — | | | (32,579) | | | — | |
| Recognized as revenue during period from the beginning balance | | (1,101) | | | (658) | | | (941) | |
| Ending balance | | $ | 2,303 | | | $ | 2,374 | | | $ | 33,788 | |
Disaggregation of Revenue—The table below shows the disaggregation of revenue by product and reconciles disaggregated revenue to segment revenue for the years ended December 31, 2023, 2022, and 2021. We believe the disaggregation of revenue by products best depicts how the nature, amount, timing and uncertainty of revenue and cash flows are affected by economic conditions (in thousands):
| | | | | | | | | | | | | | | | | | | | | | | | | | | | | | | | |
| | Year Ended December 31, 2023 |
| Product | | Potash Segment | | Trio® Segment | | Oilfield Solutions Segment | | Intersegment Eliminations | | Total |
| Potash | | $ | 131,206 | | | $ | — | | | $ | — | | | $ | (329) | | | $ | 130,877 | |
Trio® | | — | | | 96,344 | | | — | | | — | | | 96,344 | |
| Water | | 297 | | | 5,316 | | | 9,569 | | | — | | | 15,182 | |
| Salt | | 11,973 | | | 522 | | | — | | | — | | | 12,495 | |
| Magnesium Chloride | | 8,161 | | | — | | | — | | | — | | | 8,161 | |
| Brines | | 4,283 | | | — | | | 4,056 | | | — | | | 8,339 | |
| Other | | — | | | — | | | 7,685 | | | — | | | 7,685 | |
| Total Revenue | | $ | 155,920 | | | $ | 102,182 | | | $ | 21,310 | | | $ | (329) | | | $ | 279,083 | |
| |
Note 10 | — COMPENSATION PLANS |
| | | | | | | | | | | | | | | | | | | | | | | | | | | | | | | | |
| | Year Ended December 31, 2022 |
| Product | | Potash Segment | | Trio® Segment | | Oilfield Solutions Segment | | Intersegment Eliminations | | Total |
| Potash | | $ | 168,571 | | | $ | — | | | $ | — | | | $ | (304) | | | $ | 168,267 | |
Trio® | | — | | | 113,962 | | | — | | | — | | | 113,962 | |
| Water | | 1,637 | | | 3,302 | | | 17,510 | | | — | | | 22,449 | |
| Salt | | 11,270 | | | 562 | | | — | | | — | | | 11,832 | |
| Magnesium Chloride | | 6,472 | | | — | | | — | | | — | | | 6,472 | |
| Brines | | 3,428 | | | — | | | 2,670 | | | — | | | 6,098 | |
| Other | | — | | | — | | | 8,488 | | | — | | | 8,488 | |
| Total Revenue | | $ | 191,378 | | | $ | 117,826 | | | $ | 28,668 | | | $ | (304) | | | $ | 337,568 | |
| | | | | | | | | | | | | | | | | | | | | | | | | | | | | | | | |
| | Year Ended December 31, 2021 |
| Product | | Potash Segment | | Trio® Segment | | Oilfield Solutions Segment | | Intersegment Eliminations | | Total |
| Potash | | $ | 130,460 | | | $ | — | | | $ | — | | | $ | (247) | | | $ | 130,213 | |
Trio® | | — | | | 91,125 | | | — | | | — | | | 91,125 | |
| Water | | 2,050 | | | 4,355 | | | 15,594 | | | — | | | 21,999 | |
| Salt | | 9,592 | | | 578 | | | — | | | — | | | 10,170 | |
| Magnesium Chloride | | 7,847 | | | — | | | — | | | — | | | 7,847 | |
| Brines | | 1,802 | | | — | | | 1,129 | | | — | | | 2,931 | |
| Other | | — | | | — | | | 6,047 | | | — | | | 6,047 | |
| Total Revenue | | $ | 151,751 | | | $ | 96,058 | | | $ | 22,770 | | | $ | (247) | | | $ | 270,332 | |
Note 12— COMPENSATION PLANS
Cash Bonus Programs—At times, weWe use cash bonus programs under which our employees may be eligible to receive cash bonuses based on corporate, department, location, or individual performance or other events or accomplishments. We accrue cash bonus expense related to the current year's performance. In December 2015,performance and we suspended most of our cash bonus programs for 2015 as part of our cost saving initiatives at that time. We did not implementexpect to pay in March 2024 a cash bonus to our employees under our 2023 bonus program. We met our performance metrics related to our 2022 cash bonus program for 2017 or 2016.and paid a cash bonus in March 2023. We met our performance metrics related to our 2021 cash bonus program and paid a cash bonus in March 2022.
Equity Incentive Compensation Plan—Our Board of Directors and stockholders adopted a long-term incentive compensation plan called the Intrepid Potash, Inc. Amended and Restated Equity Incentive Plan (the "Plan"). We have issued restricted shares, common stock, performance units, and non-qualified stock option awards under the Plan. As of December 31, 2017, the following awards were outstanding under the Plan: 3,163,9032023, 340,924 restricted shares;shares and options to purchase 2,075,821273,206 shares of common stock; and performance units representing a maximum of 126,050 shares of common stock.stock were outstanding. As of December 31, 2017,2023, approximately 4.01.0 million shares of common stock remained available for issuance under the Plan. Total compensation expense related to the Plan was $3.6$6.5 million, $3.6$6.2 million, and $5.1$3.0 million, for the years ended December 31, 2017, 2016,2023, 2022, and 2015,2021, respectively. As of December 31, 2017,2023, there was $5.0$5.6 million of total remaining unrecognized compensation expense that is expected to be recognized through 2020 related to share-based awards.over a weighted-average period of 1.3 years. When restricted shares and performance units vest and when stock options are exercised, new shares are issued and considered outstanding for financial statement purposes.
Restricted Shares
•Restricted Shares with Service-Based VestingService Conditions—Under the Plan, the Compensation Committee of the Board of Directors (the "Compensation Committee") has granted restricted shares of common stock to members of the Board of Directors, executive officers, and other key employees. The restricted shares contain service conditions associated with continued employment or service. The restricted shares provide voting and regular dividend rights to the holders of the awards. Upon vesting, the restrictions on the restricted shares lapse and the shares are considered issued and outstanding for accounting purposes.
In 2017,2023, the Compensation Committee granted 993,517130,975 restricted shares to executives and key employees under the Plan as part of our annual equity award program. The awards vest over three years, subject to continued employment or service.
In 2017,2023, the Compensation Committee granted 198,59522,226 restricted shares to non-employee members of the Board of Directors and one employee member of the Board of Directors under the Plan for their annual service as directors.Directors. The restricted shares vest one year after the date of grant, subject to continued service.
The estimated fair value on the grant date of restricted shares that contain only a service condition is determined usingWe use the closing price of our common stock on the grant date. Compensationdate as the grant date fair value for these awards. We record compensation expense is recorded monthly using the straight-line recognition method over the vesting period of the award. The weighted-average grant date fair value per share for restricted shares with service-based vestingservice conditions issued in 2017, 2016,2023, 2022, and 20152021 was $2.27, $1.07,$25.11, $66.07, and $14.28,$37.49, respectively.
•Restricted Shares with Service-Service and Market-Condition-Based VestingMarket Conditions—In 2017, Under the Plan in March 2023, the Compensation Committee granted 213,753 restricted shares of common stock with service and market conditions to certain members of our executive team as part of their annual compensation package. The grants vest over three years from the grant date if the volume-weighted average share closing price for 20 consecutive days has met one of the applicable price achievement targets; provided, however, that no vesting would occur if the volume-weighted average closing price for 20 consecutive days has not met one or more applicable price achievement goals on or before March 17, 2026. The share price achievement goals of these awards have not been met as of December 31, 2023.
Under the Plan in March 2023, the Compensation Committee also granted restricted shares of common stock with service and market conditions to another member of our executive team as part of his annual compensation package. This grant vests over two years from the quarter ended in which the volume-weighted average share closing price for 20 consecutive trading days has met one of the applicable price achievement targets; provided, however, that no vesting would occur if the volume-weighted average closing price for 20 consecutive trading days has not met one or more applicable price achievement goals on or before March 17, 2027. The share price achievement goal for this award has not been met as of December 31, 2023.
Under the Plan in March 2022, the Compensation Committee granted restricted shares of common stock with service and market conditions to certain members of our executive team as part of their annual compensation
package. The grants vest over three years from the quarter ended in which the volume-weighted average share closing price for 20 consecutive days has met one of the applicable price achievement targets; provided, however, that no vesting would occur if the volume-weighted average closing price for 20 consecutive days has not met one or more applicable price achievement goals on or before March 17, 2025. The share price achievement goals of these awards were met in 2022, and 1,737 shares vested in 2023.
Under the Plan in March 2022, the Compensation Committee granted restricted shares of common stock with service and market conditions to a member of our executive team as part of his annual compensation package. This grant vests over two years from the quarter ended in which the volume-weighted average share closing price for 20 consecutive trading days has met one of the applicable price achievement targets; provided, however, that no vesting would occur if the volume-weighted average closing price for 20 consecutive trading days has not met one or more applicable price achievement goals on or before March 17, 2026. The share price achievement goals of these awards were met in 2022, and 14,512 shares vested in 2023.
Under the Plan in March 2021, the Compensation Committee granted restricted shares of common stock with service and market conditions to certain members of our executive team as part of their annual compensation package. The grants vest over three years on the grant date anniversary; provided, however, that no vesting would occur if the volume-weighted average closing price for 20 consecutive trading days has not met one or more applicable price achievement goals on or before March 11, 2024. The share price achievement goals of these awards were met in 2021, and 886 shares vested in 2023.
Under the plan in 2021, the Compensation Committee granted restricted shares of common stock with service and market conditions to a member of our executive team as part of his annual compensation package. The restricted shares vest2021 grant vests over two years from the quarter ended in three equal installments, subject to his continued employment;which the volume weighted average share closing price for 20 consecutive trading days has met one of the applicable price achievement targets; provided, however, that no vesting would occur unless and untilif the volume-weighted average closing market price of our common stock equaled or exceeded $3.44, for 20 consecutive trading days has not met one or more applicable price achievement goals on or before the five-year anniversary of the grant date.December 23, 2026. The market conditionconditions for this award waswere met in 2017.2022, and 24,152 shares vested during 2023.
The estimated fair valueDuring 2023, share price achievement targets were met for shares granted to a member of the award on the grant date was determined usingexecutive team in 2020 and 47,259 shares vested in 2023.
We used a Monte Carlo simulation valuation model. Compensationmodel to estimate the fair value of these awards on the grant date. We record compensation expense is recorded monthly using the accelerated recognition method over the vestinglonger of the explicit or derived service period of the award. The weighted-average grant date fair value per share of restricted shares with service-service and market-condition-based vestingmarket conditions issued in 2017,2023, 2022, and 2016,2021, was $2.10,$24.96, $62.32 and $0.91,$23.76, respectively.
A summary of all activity relating to our restricted shares for the year ended December 31, 2017, is presented below:
|
| | | | | | | |
| | | | | Weighted Average
Grant-Date
Fair Value |
| | | Shares | |
| Restricted shares of common stock, beginning of period | | 3,531,418 |
| | $ | 1.78 |
|
| Granted with service only condition | | 1,192,112 |
| | $ | 2.27 |
|
| Granted with service and market conditions | | 213,753 |
| | $ | 2.10 |
|
| Vested | | (1,306,766 | ) | | $ | 2.48 |
|
| Forfeited | | (466,614 | ) | | $ | 1.41 |
|
| Restricted shares of common stock, end of period | | 3,163,903 |
| | $ | 1.73 |
|
Performance Units
In 2015, the Compensation Committee granted at-risk performance units under the Plan to a member of our executive team as part of his annual compensation package. The performance units vest in February 2018, and payout, if any, is based on market-based conditions relating to one-, two- and three-year performance periods beginning on the grant date. No shares were earned under the first one-year performance period or the second two-year performance period. As of December 31, 2017, a total of 126,050 shares of common stock were available for future payout under these performance units, subject to the third, three-year performance measure being met and continued employment through the vesting date. Compensation cost is recognized monthly using the accelerated recognition method over the vesting period of the award. The estimated fair value of the award was determined
using a Monte Carlo simulation valuation model. Compensation cost is recognized monthly using the accelerated recognition method over the vesting period of the award. The weighted-average fair value per performance unit issued in 2015 was $13.84.
Non-qualified Stock Options
• Non-qualified Stock Options with Service-Based Vesting—In 2017, the Compensation Committee granted 117,878 non-qualified stock options under the Plan to our executives and other key employees as part of our annual award program. The stock options have a ten-year term from the grant date and vest over three years. In measuring compensation expense for options, we estimated the fair value of the award on the grant dates using the Black‑Scholes option valuation model. Option valuationValuation models require the input of highly subjective assumptions, including the expected volatility of the price of the underlying stock. Compensation expense is recorded monthly usingWe used the straight-line recognition method over the vesting period of the award.
The following assumptions were used to compute the weighted averageweighted-average grant date fair market value of optionsrestricted stock with service-based vestingservice and market conditions granted in 20172023, 2022, and 2016:2021:
| | | | | | | | | | | | | | | | | | | | |
| | 2023 | | 2022 | | 2021 |
| Closing stock price on grant date | | $ | 26.05 | | | $ | 66.33 | | | $ | 42.03 | |
| Risk free interest rate | | 3.6 | % | | 2.2 | % | | 1.1 | % |
| Dividend yield | | — | % | | — | % | | — | % |
| Estimated volatility | | 82.9 | % | | 79.8 | % | | 89.0 | % |
| Expected life | | 3.8 years | | 6.0 years | | 5.5 years |
|
| | | | | | |
| | | 2017 | | 2016 |
| Risk free interest rate | | 1.6 | % | | 1.8 | % |
| Dividend yield | | — | % | | — | % |
| Estimated volatility | | 71.5 | % | | 63.8 | % |
| Expected option life | | 6.00 years |
| | 6.25 years |
|
We granted no options in 2015. Our estimateA summary of volatility was based on the historic volatility ofall activity relating to our common stock over a period comparable to the expected life of the option. The estimate of expected option life was determined based on the "simplified method," giving consideration to the overall vesting period and the contractual terms of the award. This method was used because we have very little option exercise history for options issued prior to 2017. The risk-free interest raterestricted shares for the period that matched the option awards' expected life was based on the U.S. Treasury constant maturity yield at the time of grant.year ended December 31, 2023, is presented below:
•Non-qualified Stock Options with Service- and Market-Condition-Based Vesting—In 2017, the Compensation Committee granted 513,698 non-qualified stock options with service- and market-condition-based vesting requirements under the Plan to a member of our executive team as part of his annual compensation package. The stock options vest in three equal annual installments, subject to continued employment: provided, however, that no vesting would occur unless and until the volume-weighted average closing market price of our common stock equals or exceeds $3.44 for 20 consecutive trading days on or before the five-year anniversary of the grant date. The market condition for the award was met in 2017. | | | | | | | | | | | | | | |
| | | | Weighted Average
Grant-Date
Fair Value |
| | Shares | |
| Restricted shares of common stock, beginning of period | | 300,268 | | | $ | 40.25 | |
| Granted with service only condition | | 153,201 | | | $ | 25.11 | |
| | | | |
| Granted with service and market conditions | | 94,142 | | | $ | 24.96 | |
| Vested, service only condition | | (89,225) | | | $ | 20.30 | |
| Vested, service and market conditions | | (88,546) | | | $ | 29.70 | |
| Forfeited, service only condition | | (21,828) | | | $ | 38.14 | |
| Forfeited, service and market conditions | | (7,088) | | | $ | 56.45 | |
| | | | |
| Restricted shares of common stock, end of period | | 340,924 | | | $ | 36.98 | |
The estimated fair value of the award on the grant date was determined using a Monte Carlo simulation valuation model. Compensation cost is recognized monthly using the accelerated recognition method over the vesting period of the award.
Non-Qualified Stock Option Activity
We have not granted any non-qualified stock options to our employees since 2018. A summary of all stock option activity for the year ended December 31, 2017,2023, is as follows:
| | | | | | | | | | | | | | | | | | | | | | | | | | |
| | Shares | | Weighted Average Exercise Price | | Aggregate Intrinsic Value1 | | Weighted Average Remaining Contractual Life |
Outstanding non-qualified stock
options, beginning of period | | 273,206 | | | $29.04 | | | | |
| Granted | | — | | | $— | | | | |
| Exercised | | — | | | $— | | | | |
| Forfeited | | — | | | $— | | | | |
| Expired | | — | | | $— | | | | |
Outstanding non-qualified stock
options, end of period | | 273,206 | | | $29.04 | | $948,054 | | 3.7 |
| | | | | | | | |
Vested or expected to vest,
end of period | | 273,206 | | | $29.04 | | $948,054 | | 3.7 |
| | | | | | | | |
Exercisable non-qualified
stock options, end of period | | 273,206 | | | $29.04 | | $948,054 | | 3.7 |
|
| | | | | | | | | |
| | | Shares | | Weighted Average Exercise Price | | Aggregate Intrinsic Value1 | | Weighted Average Remaining Contractual Life |
Outstanding non-qualified stock
options, beginning of period | | 1,883,706 |
| | $3.90 | | | | |
| Granted | | 631,576 |
| | $2.29 | | | | |
| Exercised | | (117,213 | ) | | $1.03 | | | | |
| Forfeited | | (302,562 | ) | | $1.14 | | | | |
| Expired | | (19,686 | ) | | $28.73 | | | | |
Outstanding non-qualified stock
options, end of period | | 2,075,821 |
| | $3.74 | | $6,238,639 | | 8.3 |
| | | | | | | | | |
Vested or expected to vest,
end of period | | 2,075,821 |
| | $3.74 | | $6,238,639 | | 8.3 |
| | | | | | | | | |
Exercisable non-qualified
stock options, end of period | | 455,622 |
| | $11.70 | | $956,562 | | 5.7 |
| |
1
| The intrinsic value of a stock option is the amount by which the market value exceeds the exercise price as of the end of the period presented. |
1The weighted-average fairintrinsic value per share of a stock option is the amount by which the market value exceeds the exercise price as of the end of the period presented.
No stock options to purchase stock grantedwere exercised during 2017 and 2016 was $1.38 and $0.61 per share, respectively. There were no options to purchase stock granted in 2015.2023. The total intrinsic value of exercised options to purchase stock exercised during 20172022 was $0.3$0.6 million. There were noThe total intrinsic value of exercised options to purchase stock exercised in 2016, and 2015.during 2021 was immaterial.
Note 13— INCOME TAXES
We account for income taxes in accordance with Accounting Standard CodificationASC Topic 740, Income Taxes.Taxes. This standard requires the recognition of deferred tax assets and liabilities for the tax effect of temporary differences between the financial statement and tax basis of recorded assets and liabilities at enacted tax rates in effect when the related taxes are expected to be settled or realized. We recognize income taxes in each of the tax jurisdictions where we conduct business. The effect on deferred tax assets and liabilities of a change in tax rates is recognized in income in the period that includes the enactment date.
A summary of the provision for income taxes is as follows (in thousands):
| | | | | Year Ended December 31, |
| | | 2017 | | 2016 | | 2015 |
| | Year Ended December 31, | | | | Year Ended December 31, |
| | 2023 | | | | 2023 | | 2022 | | 2021 |
| Current portion of income tax expense (benefit): | | | | | | |
| Federal | | $ | (2,793 | ) | | $ | (1,365 | ) | | $ | — |
|
| Federal | |
| Federal | |
| State | | 10 |
| | 3 |
| | (123 | ) |
| Deferred portion of income tax expense: | | | | | | |
| Deferred portion of income tax expense (benefit): | |
| Federal | |
| Federal | |
| Federal | | — |
| | — |
| | 116,128 |
|
| State | | — |
| | — |
| | 33,968 |
|
| Total income tax (benefit) expense | | $ | (2,783 | ) | | $ | (1,362 | ) | | $ | 149,973 |
|
A reconciliation of the federal statutory income tax rate of 35%21% to our effective rate is as follows (in thousands, except percentages):
| | | | | | | | | | | | | | | | | | | | |
| | Year Ended December 31, |
| | 2023 | | 2022 | | 2021 |
| Federal taxes at statutory rate | | $ | (9,253) | | | $ | 20,267 | | | $ | 8,603 | |
| Add: | | | | | | |
| State taxes, net of federal benefit | | (1,274) | | | 5,406 | | | 1,278 | |
| | | | | | |
| Change in valuation allowance | | 1,121 | | | — | | | (215,910) | |
| PPP loan forgiveness | | — | | | — | | | (2,115) | |
| Change in federal and state tax rates | | 238 | | | (125) | | | 138 | |
| Officers' Compensation | | 848 | | | 546 | | | 195 | |
| Percentage depletion | | (282) | | | (827) | | | (463) | |
| Other | | 213 | | | (978) | | | (595) | |
| Net (benefit) expense as calculated | | $ | (8,389) | | | $ | 24,289 | | | $ | (208,869) | |
| | | | | | |
| Effective tax rate | | 19.0 | % | | 25.2 | % | | (509.9) | % |
|
| | | | | | | | | | | | |
| | | Year Ended December 31, |
| | | 2017 | | 2016 | | 2015 |
| Federal taxes at statutory rate | | $ | (8,992 | ) | | $ | (23,793 | ) | | $ | (131,181 | ) |
| Add: | |
|
| |
|
| |
|
|
| State taxes, net of federal benefit | | (1,414 | ) | | (4,982 | ) | | (18,639 | ) |
| Change in valuation allowance | | (104,507 | ) | | 25,496 |
| | 300,333 |
|
| Change in federal and state tax rates | | 115,545 |
| | — |
| | — |
|
| Percentage depletion | | (598 | ) | | (552 | ) | | (1,285 | ) |
| Other | | (2,817 | ) | | 2,469 |
| | 745 |
|
| Net (benefit) expense as calculated | | $ | (2,783 | ) | | $ | (1,362 | ) | | $ | 149,973 |
|
| | | | | | | |
| Effective tax rate | | 10.8 | % | | 2.0 | % | | (40.0 | )% |
During Our effective tax rate for the yearyears ended December 31, 2017,2023, differs from the U.S. federal statutory rate due to the change in our valuation allowance. Our effective tax rate was impacted byrates for the decrease in our expected futureyears ended December 31, 2022, and 2021, differs from the U.S. federal statutory rate at which our deferred tax assets will reverse due to newly enacted federal tax legislation, which reducedstate income taxes and the value of our deferred tax assets by $115.5 million. Since we have a full valuation allowance against our deferred tax assets, a corresponding decreasechange in our valuation allowance, was also required. Additionally, our valuation allowance increased due to increases in our deferred tax asset related to current year activity. The net decrease in our valuation allowance was $104.5 million for the year ended December 31, 2017. Finally, our effective tax rate was impacted by a benefit of $2.7 million related to our ability to monetize existing alternative minimum tax credits through a carryback as well as an election available to taxpayers in 2017.respectively.
During the year ended December 31, 2016, our effective tax rate was impacted by the increase in our valuation allowance of $25.5 million, as well as an election to monetize a portion of our existing alternative minimum tax credits in the amount of $1.4 million.
During the year ended December 31, 2015, our effective tax rate was impacted by the increase in our valuation allowance of $300.3 million.
As of December 31, 2017,2023, and 2016,2022, we had gross deferred tax assets of $221.6$197.4 million and $326.1$187.8 million, respectively. During the year ended December 31, 2017,2023, our deferred tax assets decreasedincreased primarily due to a decrease infrom impairments booked against our expected future tax rate at which our deferred tax assets will be recovered because of federal tax legislation enacted in December 2017.property, plant, equipment, and mineral properties. Included in gross deferred tax assets as of December 31, 2017,2023, were approximately $247.8$201.4 million of federal net operating loss carryforwards, which expire beginning in 2033,2034, and approximately $314.4$271.9 million of state net operating loss carry forwards,carryforwards, the majority of which begin to expire in 2033. Also included are $1.9 million of federal research and development credits which begin to expire in 2031. The federal loss carryforward could be subject to examination by the tax authorities within three years after the carryforward is utilized, while the state net operating loss carryforwards could be subject to examination by the tax authorities generally within three and four years after the carryforward is utilized, depending on jurisdiction.
Significant components of our deferred tax assets and liabilities were as follows (in thousands):
| | | | | | | | | | | | | | |
| | December 31, |
| | 2023 | | 2022 |
| | |
| Deferred tax assets (liabilities): | | | | |
| Property, plant, equipment and mineral properties, net | | $ | 127,368 | | | $ | 119,919 | |
| Federal and state net operating loss carryforwards | | 55,486 | | | 53,440 | |
| Asset retirement obligation | | 7,768 | | | 7,409 | |
| Deferred revenue | | 1,869 | | | 607 | |
| Other | | 3,017 | | | 4,540 | |
| Federal R&D credits | | 1,870 | | | 1,870 | |
| | | | |
| | | | |
| | | | |
| | | | |
| Total deferred tax assets | | 197,378 | | | 187,785 | |
| Valuation allowance | | (3,155) | | | (2,033) | |
| Deferred tax asset, net | | $ | 194,223 | | | $ | 185,752 | |
|
| | | | | | | | |
| | | December 31, |
| | | 2017 | | 2016 |
| Deferred tax assets (liabilities): | | | | |
| Property, plant, equipment and mineral properties, net | | $ | 136,543 |
| | $ | 212,049 |
|
| Federal and state net operating loss carryforwards | | 68,733 |
| | 85,695 |
|
| Other | | 7,225 |
| | 9,665 |
|
| Asset retirement obligation | | 5,472 |
| | 10,934 |
|
| R&D credits | | 1,896 |
| | 1,896 |
|
| Equity compensation | | 1,529 |
| | 3,542 |
|
| Inventory | | 947 |
| | 1,285 |
|
| Accrued employee compensation and benefits | | 24 |
| | (239 | ) |
| AMT credits | | — |
| | 2,861 |
|
| Prepaid expenses | | $ | (779 | ) | | $ | (1,591 | ) |
| Total deferred tax assets | | 221,590 |
| | 326,097 |
|
| Valuation allowance | | (221,590 | ) | | (326,097 | ) |
| Deferred tax asset, net | | $ | — |
| | $ | — |
|
In assessing the need for a valuation allowance, we consider whether it is more likely than not that some portion or all of the deferred tax assets will not be realized. We evaluate our ability to realize the tax benefits associated with deferred tax assets by analyzing the relative impact of all the available positive and negative evidence regarding our forecasted taxable income using both historical and projected future operating results, the reversal of existing taxable temporary differences, taxable income in prior carryback years, as permitted by regulation, and the availability of tax planning strategies. In determining how much of a valuation allowance to recognize we primarily consider our projections of future taxable income. All available evidence, both positive and negative, that may affect the realizability of deferred tax assets is identified and considered in determining the appropriate amount of the valuation allowance. The ultimate realization of deferred tax assets is dependent upon the generation of certain types of future taxable income during the periods in which those temporary differences become deductible. Assumptions of expected future taxable income are based primarily on prices and forecasted sales volumes which are subject to market volatility. In making this assessment, we consider the scheduled reversal of deferred tax liabilities, our ability to carry back the deferred tax asset, projected future taxable income, and tax planning strategies.
As of December 31, 2017, and 2016,2023, we havewere in a full valuation allowance againstcumulative three-year income position. The cumulative three-year income position is significant positive evidence when evaluating the realizability of our deferred tax assets becauseassets. Additionally, industry trends and forecasts as well as internal forecasts of future business show sustained amounts of taxable income. Thus, we do not believehave concluded that it is more likely than not that we will fully realize the benefitmost of the deferred tax assets. During 2017, our valuation allowance decreased $104.5$197.4 million due to the decrease in our deferred tax assets related to a decrease in our expected future rate at which ourof deferred tax assets will reverse, due to federal andbe realized. During 2023, our valuation allowance increased as our forecast changed regarding the amount of state tax legislation enacted in late 2017, and the change in ournet operating losses that will be used before expiration. Our deferred tax assets, due to current year activity. The net change in our valuation allowance is reflected in income tax benefit for the year ended December 31, 2017. Our deferred tax asset, net of the valuation allowance at both December 31, 2017,2023, and 2016, is zero.2022, were $194.2 million and $185.8 million, respectively.
The estimated statutory income tax rates that are applied to our current and deferred income tax calculations are impacted most significantly by the tax jurisdictions in which we conduct business. Changing business conditions for normal business transactions and operations, as well as changes to state tax rates and apportionment laws, potentially alter the apportionment of income among the states for income tax purposes. These changes to apportionment laws result in changes in the calculation of our current and deferred income taxes, including the valuation of our deferred tax assets and liabilities. The effects of any such changes are recorded in the period of the adjustment. Such adjustments can increase or decrease the net deferred tax asset on the balance sheet and impact the corresponding deferred tax benefit or deferred tax expense on the statement of operations.
A decrease of our state tax rate decreases the value of its deferred tax asset, resulting in additional deferred tax expense being recorded inon the income statement. Conversely, an increase in our state income tax rate would increase the value of the deferred tax asset, resulting in an increase in our deferred tax benefit. Because of the magnitude of the temporary differences between our book and tax basis in the assets, relatively small changes in the state tax rate may have a pronounced impact on the value of our net deferred tax asset.
Each quarter we evaluate the need for a liability for uncertain tax positions. At December 31, 2017,2023, and 2016, there were2022, we had no items that required disclosure in accordance with FASB guidance on accounting for uncertainty in income taxes.
We operate, and accordingly file income tax returns, in the U.S. federal jurisdiction and various U.S. state jurisdictions. With few exceptions, we are no longer subject to income tax examinationsaudits that could result in an assessment for years prior to 2014.2020.
The Tax Cuts and Jobs Act was enacted on December 22, 2017. Significant changes to the Internal Revenue Code including reducing the U.S. corporate tax rate were included in the legislation. As a result, the reduced tax rate caused a $115.5 million decrease to our deferred tax asset and related valuation allowance. As the deferred tax asset is subject to a full valuation allowance, the change in rates had no financial statement impact.Note 14— COMMITMENTS AND CONTINGENCIES
| |
Note 12 | — COMMITMENTS AND CONTINGENCIES |
Reclamation Deposits and Surety Bonds—As of December 31, 2017,2023, and 2016,2022, we had $18.8$26.8 million and $21.4$24.6 million, respectively, of security placed principally with the State of Utah and the Bureau of Land Management for eventual reclamation of its various facilities. Of this total requirement, as of December 31, 2017,2023, and 2016,2022, $0.5 million and $3.5 million, respectively, consisted of long-term restricted cash deposits reflected in "Other" long-term assets on the balance sheet, and $18.3$26.3 million and $17.9$24.1 million, respectively, was secured by surety bonds issued by an insurer. The surety bonds are held in place by an annual fee paid to the issuer.
We may be required to post additional security to fund future reclamation obligations as reclamation plans are updated or as governmental entities change requirements.
Legal—In February 2015, Mosaic Potash Carlsbad Inc. (“Mosaic”) filed a complaintWe are subject to claims and application for preliminary injunction and permanent injunction against Steve Gamble and Intrepid Potash, Inc.,legal actions in the Fifth Judicial District Court forordinary course of business. We expense legal costs as incurred. While there are uncertainties in predicting the Countyoutcome of Eddy inany claim or legal action, except as noted below, we believe the Stateultimate resolution of New Mexico (the “State Court Matter”). Mosaic subsequently amended its complaintthese claims or actions is not reasonably likely to add Intrepid Potash - New Mexico, LLC, ashave a second defendant. Mr. Gamble is a former employeematerial adverse effect on our financial condition, results of both Intrepid and Mosaic. The complaint alleged violations of law relating to alleged misappropriation of Mosaic’s trade secrets and other issues. In August 2015, the court in the State Court Matter denied Mosaic’s application for preliminary injunction.operations, or cash flows.
Water Rights
In July 2016, Mosaic filedMarch 17, 2022, following an expedited inter se proceeding, a complaint against Mr. Gamblecourt entered a subfile order and both Intrepid Potash, Inc.,partial final judgment and Intrepid Potash - New Mexico, LLC,decree ("Order") determining the validity of our claim to 20,000 acre feet of Pecos River surface water rights. The Order found that our predecessors in US District Courtinterest had forfeited all but approximately 5,800 acre feet of water per year, and that of the remaining 5,800 acre feet of water that had not been forfeited, all but 150 acre feet of water had been abandoned prior to 2017. The Order limited our right to 150 acre fee per annum of water for industrial-salt processing use. We appealed the District of New Mexico (the “Federal Court Matter”). The complaint alleged violations of law relatingOrder to alleged misappropriation of Mosaic’s confidential information, including a Computer Fraud and Abuse Act and additional claims.
In a series of filings in December 2017 and January 2018, the parties removed the State Court Matter to federal court and consolidated it with the Federal Court Matter, resulting in one consolidated lawsuit pending in the US District Court for the District of New Mexico. Mosaic alleges against Intrepid Potash, Inc., and Intrepid Potash - New Mexico, LLC, violations of the New Mexico Uniform Trade Secrets Act, tortious interference with contract relatingCourt of Appeals ("NMCA"), which, on July 7, 2023, affirmed the Order. On November 17, 2023, we filed a request for the New Mexico Supreme Court ("NMSC") to Mr. Gamble’s separation of employment from Mosaic, violationsreconsider and review the NMCA's decision to affirm the Order's abandonment determination. The NMSC agreed to review the NMCA's abandonment determination on February 7, 2024.
In 2017 and 2018 the New Mexico Office of the Computer Fraud and Abuse Act, conversion, and civil conspiracy relatingState Engineer (“OSE”) had granted us preliminary authorizations to sell approximately 5,700 acre feet of water per year from our Pecos River water rights. The preliminary authorizations allowed for water sales to begin immediately, subject to repayment if the underlying water rights are ultimately found to be invalid. If our appeal of the adjudication court's ruling is unsuccessful, we may have to repay for the water we sold under the preliminary authorizations. Repayment of this water can be up to two times the amount of water removed from the river. Repayment is customarily made in-kind over a period of time but can take other forms including cash repayment. If we are not able to repay in-kind due to the alleged misappropriationlack of Mosaic’s confidential informationremaining water rights or logistical constraints, we may need to purchase water to meet this repayment or be subject to a cash repayment. We cannot reasonably estimate the potential volume, timing, or form of repayment, if any, and have not recorded a loss contingency in our statement of operations related actions. Mosaic seeks monetary reliefto this legal matter.
In March 2021, we received notice from a customer of an unspecified amount, including damagesa default under the terms of a long-term sales contract because we have not been able to deliver water to diversion points specified in the contract. We had relied primarily upon our Pecos River water rights to deliver water under this contract, the majority of which are currently unavailable due to the factors discussed above. Under this contract we have received quarterly installments of approximately $3.9 million for actual lossthe future delivery of water to the customer. In April 2021, we agreed to suspend the second quarter and unjust enrichment, exemplary damages, attorneys’ fees,future quarterly installments due from the customer as we continued to work to resolve the issue. In December 2021, we amended our long-term sales agreement with the customer due to our inability to deliver water. In the amendment, we agreed to suspend all rights and injunctive reliefobligations of both parties under the agreement until July 1, 2022. During the suspension period, we had no obligation to deliver water and our customer has allegedno obligation to take water, if available, or make quarterly payments to us. In August 2022, the customer notified us that it has spent hundredsthey were terminating the long-term sales contract and in September 2022, we refunded the $32.6 million outstanding contract liability we had with this customer. See Note 11—Revenue above for additional information.
In August 2021, NGL Energy Partners (NGL), our partner in the Joint Marketing Agreement (“JMA”) that was entered into in May 2019, filed suit against us alleging, amongst other items, we overcharged the JMA for various operating costs and that we used third party water to service certain fracs when JMA water should have been used in those fracs. On June 22, 2022, the parties entered into a settlement agreement and the lawsuit was dismissed with prejudice on June 29, 2022.
The settlement did not have a material impact on our results of dollarsoperations and the JMA was terminated effective May 1, 2022.
As of December 31, 2023, we have estimated contingent liabilities recorded in "Other current liabilities" on the consolidated balance sheets of $3.4 million, mainly related to researchthe potential underpayment of royalties in 2012 to 2016 and develop its alleged trade secrets. The lawsuit is progressing through discovery. We are vigorously defending againstpotential royalties on water revenues in 2019 to 2022. As of December 31, 2022 we had estimated contingent liabilities recorded in "Other current liabilities" on the lawsuit.consolidated balance sheets of $4.2 million, mainly related to a trespass issue at Intrepid South and the potential underpayment of royalties in 2012 to 2016.
We are subject to other claims and legal actions in the ordinary course of business. Legal costs are expensed as incurred. While there are uncertainties in predicting the outcome of any claim or legal action, we believe that the ultimate resolution of these other claims or actions is not reasonably likely to have a material adverse effect on our financial condition, results of operations, or cash flows.
Future Operating Lease Commitments—We have certain operating leases for land, mining and other operating equipment, offices, and railcars, with original terms ranging up to 20 years. The annual minimum lease payments for the next five years and thereafter are presented below (in thousands):
|
| | | | |
| Years Ending December 31, | | |
| 2018 | | $ | 2,400 |
|
| 2019 | | 1,369 |
|
| 2020 | | 977 |
|
| 2021 | | 661 |
|
| 2022 | | 442 |
|
| Thereafter | | 814 |
|
| Total | | $ | 6,663 |
|
Rental and lease expenses follow for the indicated periods (in thousands):
|
| | | | |
| For the year ended December 31, 2017 | | $ | 5,693 |
|
| For the year ended December 31, 2016 | | $ | 6,591 |
|
| For the year ended December 31, 2015 | | $ | 7,216 |
|
| |
Note 13 | — RESTRUCTURING EXPENSE |
During 2016, in response to declining potash prices, we undertook several cost saving actions that were intended to better align our cost structure with the business environment. These initiatives included workforce reductions, bonus plan curtailments, and temporary salary decreases for most employees. For the year ended December 31, 2016, we recorded restructuring expense of $2.7 million related to these initiatives. For the year ended December 31, 2017, we recorded restructuring expense of $0.3 million as a result of our decision to reduce Trio® production based on expected demand and product inventory levels.
| |
Note 14 | — FAIR VALUE MEASUREMENTS |
We measure our financial assets and liabilities in accordance with Accounting Standards Codification™Codification ("ASC") Topic 820, Fair Value Measurements and Disclosures. ASC Topic 820 defines fair value as the price that would be received to sell an asset or paid to transfer a liability (an exit price) in an orderly transaction between market participants at the measurement date. The topic establishes market or observable inputs as the preferred sources of values, followed by assumptions based on hypothetical transactions in the absence of market inputs. The topic also establishes a hierarchy for grouping these assets and liabilities based upon the lowest level of input that is significant to the fair value measurement. The definition of each input is described below:
•Level 1—Quoted prices in active markets for identical assets and liabilitiesliabilities.
•Level 2—Quoted prices in active markets for similar assets and liabilities, quoted prices for identical or similar instruments in markets that are not active, and model‑derived valuations whose inputs are observable or whose significant value drivers are observableobservable.
•Level 3—Significant inputs to the valuation model that are unobservableunobservable.
As The classification of December 31, 2017, and 2016, our cash consistedfair value measurement within the hierarchy is based upon the lowest level of bank deposits. input that is significant to the measurement.
Other financial assets and liabilities including,instruments consist primarily of cash equivalents, accounts receivable, refundable income taxes, accounts payable, accrued liabilities, and, if any, advances onunder our credit facility are carried atfacility. With the exception of investment securities, we believe cost which approximates fair value for our financial instruments because of the short-term nature of these instruments.
Cash Equivalents—As of December 31, 2017,2023, and 2016,December 31, 2022, we had cash equivalents of $0.5 million and $1.7 million, respectively.
Held-to-Maturity Investments—As of December 31, 2023 and 2022, we owned debt investment securities classified as held-to-maturity because we have the intent and ability to hold these investments to maturity. Our held-to-maturity debt investment securities consist of investment grade corporate bonds and U.S. government issued bonds.
Our held-to-maturity investments at December 31, 2023 and 2022, are carried at amortized cost and consist of the following (amounts in thousands):
| | | | | | | | | | | | | | | | | | | | | | | | | | |
| | As of December 31, 2023 |
| | Amortized Cost | | Gross Unrealized Gains | | Gross Unrealized Losses | | Fair Value |
| Short-term | | | | | | | | |
| Corporate bonds | | $ | 991 | | | $ | — | | | $ | (9) | | | $ | 982 | |
| Government bonds | | 1,979 | | | — | | | (13) | | | 1,966 | |
| Total | | $ | 2,970 | | | $ | — | | | $ | (22) | | | $ | 2,948 | |
| Long-term | | | | | | | | |
| Corporate bonds | | $ | — | | | $ | — | | | $ | — | | | $ | — | |
| Government bonds | | 954 | | | 1 | | | (4) | | | 951 | |
| Total | | $ | 954 | | | $ | 1 | | | $ | (4) | | | $ | 951 | |
| | | | | | | | | | | | | | | | | | | | | | | | | | |
| | As of December 31, 2022 |
| | Amortized Cost | | Gross Unrealized Gains | | Gross Unrealized Losses | | Fair Value |
| Short-term | | | | | | | | |
| Corporate bonds | | $ | 3,992 | | | $ | — | | | $ | (24) | | | $ | 3,968 | |
| Government bonds | | 1,967 | | | — | | | (18) | | | 1,949 | |
| Total | | $ | 5,959 | | | $ | — | | | $ | (42) | | | $ | 5,917 | |
| Long-term | | | | | | | | |
| Corporate bonds | | $ | 499 | | | $ | — | | | $ | (10) | | | $ | 489 | |
| Government bonds | | 1,935 | | | — | | | (26) | | | 1,909 | |
| Total | | $ | 2,434 | | | $ | — | | | $ | (36) | | | $ | 2,398 | |
Equity Investments without a Readily Determinable Fair Value—As of December 31, 2023, 2022, and 2021, we had a $3.5 million non-controlling interest in W.D. Von Gonten Laboratories ("WDVGL"). This investment is an equity investment without a readily determinable fair value and is recorded at cost with adjustments for observable changes in prices resulting from orderly transactions for the identical or a similar investment of the same issuer, or impairment (a Level 3 input), and is included in "Other assets, net" on the Consolidated Balance Sheets. We did not record any adjustments to the $3.5 million carrying value of the investment during 2023, 2022 or 2021.
In July 2022, WDVGL entered into a purchase agreement with another company (“Acquiror”), a foreign issuer whose shares are traded on the Nasdaq Capital Market (“Nasdaq”). Under the terms of the purchase agreement, WDVGL would be combined with the consulting business owned by W.D. Von Gonten (“Consulting”) to form a new entity, W.D. Von Gonten Engineering, LLC (“Engineering”), and Acquiror would then purchase Engineering in a majority stock transaction at an agreed upon selling price. Stock received from the sale of Engineering would be distributed to investors in WDVGL and Consulting.
Acquiror delivered equity shares and a nominal amount of cash to WDVGL for purchase of Engineering in July 2022, with the number of shares equal to the selling price divided by an assumed $10 share price. At the time the purchase agreement was signed, the Acquiror was working to file restated financial statements for the fiscal years ending December 31, 2018, 2019 and 2020. On April 27, 2023, Acquiror disclosed it had not been able to file its Annual Report on Form 20-F for the fiscal year ended December 31, 2021 with the SEC by April 25, 2023, which was the deadline set by the Nasdaq Hearings Panel in connection with a delisting proceeding, and Acquiror's shares were subsequently delisted from Nasdaq. Acquiror also disclosed on April 27, 2023 that it has shifted its focus to filing audited financial statements with the SEC for the fiscal years ended December 31, 2020, 2021 and 2022 to regain compliance with Nasdaq listing standards before the end of 2023.
Pursuant to the purchase agreement with Engineering, if the Acquiror did not file current financial statements with the SEC by June 30, 2023, Engineering had the option to terminate the purchase agreement, beginning on July 1, 2023. Although Acquiror did not file current financial statements by June 30, 2023, Engineering agreed to proceed with the purchase agreement to allow Acquiror additional time to file updated financial statements.
On December 29, 2023, Acquiror disclosed it had filed its audited financial statements for the years ended December 31, 2022, 2021, and 2020, with the SEC.
We have not impaired our investment in WDVGL because our share of the estimated fairselling price of Engineering exceeds the carrying value of our outstanding Notes was $58.8investment in WDVGL. We continue to monitor the investment for impairment. If the purchase transaction is not finalized, we may need to impair our investment in WDVGL.
Equity Method Investments—We have committed to invest $4.0 million in cash as a limited partner for a 16% interest in PEP Ovation, LP ("Ovation"), of which we had invested $2.0 million, $3.2 million and $131.0$1.1 million of cash as of December 31, 2023, 2022, and 2021, respectively. The fair valueThis investment is accounted for under the equity method whereby we recognize our proportional share of the income or loss from our Notes is estimated usinginvestment in Ovation on a discounted cash flow analysis based on current borrowing rates for debt with similar remaining maturities and ratings (a Level 2 input)one-quarter lag and is designed to approximateincluded in "Long-term investments" on the amount at whichCondensed Consolidated Balance Sheets. For the instruments could be exchanged in an arm's-length transaction between knowledgeable willing parties.year ended December 31, 2023, our proportional share of Ovation's net loss was $0.5 million.
| |
Note 15 | — EMPLOYEE BENEFITS |
Note 16— EMPLOYEE BENEFITS
401(k) Plan
We maintain a savings plan qualified under Internal Revenue Code Sections 401(a) and 401(k). The 401(k) Plan is available to eligible employees of our consolidated entities. Employees may contribute amounts as allowed by the U.S. Internal Revenue Service to the 401(k) Plan (subject to certain restrictions) in before-tax contributions. In January 2018, we increased the past, we have matched employeematching contributions on a dollar-for-dollar basis up to a maximum of 5% of the employee's base compensation. In January 2016, we elected to suspend matching employee contributions to the 401(k) Plan and resumed contributions to the 401(k) Plan in August 2016, matching employee contributions on a dollar-for-dollar basis up to a maximum of 2% of the employee's base compensation. Our contributions to the 401(k) Plan in the following periods were (in thousands):
|
| | | | |
| | | Contributions |
| Year Ended December 31, 2017 | | $ | 685 |
|
| Year Ended December 31, 2016 | | $ | 176 |
|
| Year Ended December 31, 2015 | | $ | 2,277 |
|
| | | | | | | | |
| | Contributions |
Note 16Year Ended December 31, 2023 | | — BUSINESS SEGMENTS$ | 2,057 | |
| Year Ended December 31, 2022 | | $ | 1,760 | |
| Year Ended December 31, 2021 | | $ | 1,633 | |
Note 17— BUSINESS SEGMENTS
Our operations are organized into twothree segments: potash, Trio®, and Trio®.oilfield solutions. The reportable segments are determined by management based on a several factors including the types of potassium based fertilizer produced,products and services sold, production processes, markets served and the financial information available for our chief operating decision maker. We evaluate performance based on the gross margins of the respective business segments and do not allocate corporate selling and administrative
expenses, among others, to the respective segments. Intersegment sales prices are market-based and are eliminated in the "Other" column. Information for each segment is provided in the tables that follow (in thousands).
| | | | | | | | | | | | | | | | | | | | | | | | | | | | | | | | |
| Year Ended December 31, 2023 | | Potash | | Trio® | | Oilfield Solutions | | Other | | Consolidated |
Sales1 | | $ | 155,920 | | | $ | 102,182 | | | $ | 21,310 | | | $ | (329) | | | $ | 279,083 | |
| Less: Freight costs | | 14,753 | | | 23,211 | | | — | | | (329) | | | 37,635 | |
| Warehousing and handling costs | | 5,957 | | | 4,875 | | | — | | | — | | | 10,832 | |
| Cost of goods sold | | 97,452 | | | 74,308 | | | 15,518 | | | — | | | 187,278 | |
| Lower of cost or NRV inventory adjustments | | 2,709 | | | 3,783 | | | — | | | — | | | 6,492 | |
| | | | | | | | | | |
| Gross Margin (Deficit) | | $ | 35,049 | | | $ | (3,995) | | | $ | 5,792 | | | $ | — | | | $ | 36,846 | |
Depreciation, depletion, and amortization incurred2 | | $ | 28,378 | | | $ | 6,288 | | | $ | 3,849 | | | $ | 885 | | | $ | 39,400 | |
| | | | | | | | | | |
| Year Ended December 31, 2022 | | Potash | | Trio® | | Oilfield Solutions | | Other | | Consolidated |
Sales1 | | $ | 191,378 | | | $ | 117,826 | | | $ | 28,668 | | | $ | (304) | | | $ | 337,568 | |
| Less: Freight costs | | 14,780 | | | 19,661 | | | — | | | (304) | | | 34,137 | |
| Warehousing and handling costs | | 5,305 | | | 4,442 | | | — | | | — | | | 9,747 | |
| Cost of goods sold | | 76,524 | | | 54,600 | | | 21,152 | | | — | | | 152,276 | |
| | | | | | | | | | |
| | | | | | | | | | |
| Gross Margin | | $ | 94,769 | | | $ | 39,123 | | | $ | 7,516 | | | $ | — | | | $ | 141,408 | |
Depreciation, depletion, and amortization incurred2 | | $ | 26,572 | | | $ | 4,370 | | | $ | 3,298 | | | $ | 793 | | | $ | 35,033 | |
| | | | | | | | | | |
| Year Ended December 31, 2021 | | Potash | | Trio® | | Oilfield Solutions | | Other | | Consolidated |
Sales1 | | $ | 151,751 | | | $ | 96,058 | | | $ | 22,770 | | | $ | (247) | | | $ | 270,332 | |
| Less: Freight costs | | 17,483 | | | 20,656 | | | — | | | (247) | | | 37,892 | |
| Warehousing and handling costs | | 5,169 | | | 4,113 | | | — | | | — | | | 9,282 | |
| Cost of goods sold | | 87,281 | | | 54,847 | | | 19,293 | | | — | | | 161,421 | |
| | | | | | | | | | |
| Costs associated with abnormal production and other | | 5,973 | | | — | | | — | | | — | | | 5,973 | |
| Gross Margin (Deficit) | | $ | 35,845 | | | $ | 16,442 | | | $ | 3,477 | | | $ | — | | | $ | 55,764 | |
Depreciation, depletion, and amortization incurred2 | | $ | 26,828 | | | $ | 5,477 | | | $ | 2,996 | | | $ | 656 | | | $ | 35,957 | |
|
| | | | | | | | | | | | | | | | |
| Year Ended December 31, 2017 | | Potash | | Trio® | | Corporate | | Consolidated |
| Sales | | $ | 95,540 |
| | $ | 62,067 |
| | $ | — |
| | $ | 157,607 |
|
| Less: Freight costs | | 11,818 |
| | 17,221 |
| | — |
| | 29,039 |
|
| Warehousing and handling costs | | 5,555 |
| | 4,115 |
| | — |
| | 9,670 |
|
Cost of goods sold1 | | 61,948 |
| | 43,847 |
| | — |
| | 105,795 |
|
Lower-of-cost-or-market inventory adjustments | | 550 |
| | 6,774 |
| | — |
| | 7,324 |
|
Costs associated with abnormal production and other | | — |
| | — |
| | — |
| | — |
|
| Gross Margin (Deficit) | | $ | 15,669 |
| | $ | (9,890 | ) | | $ | — |
| | $ | 5,779 |
|
Depreciation, depletion and amortization incurred2 | | $ | 27,839 |
| | $ | 6,783 |
| | $ | 145 |
| | $ | 34,767 |
|
| | | | | | | | | |
| Year Ended December 31, 2016 | | Potash | | Trio® | | Corporate | | Consolidated |
| Sales | | $ | 159,494 |
| | $ | 51,454 |
| | $ | — |
| | $ | 210,948 |
|
| Less: Freight costs | | 26,661 |
| | 9,595 |
| | — |
| | 36,256 |
|
| Warehousing and handling costs | | 8,439 |
| | 2,567 |
| | — |
| | 11,006 |
|
Cost of goods sold1 | | 134,017 |
| | 36,835 |
| | — |
| | 170,852 |
|
Lower-of-cost-or-market inventory adjustments | | 18,380 |
| | 1,994 |
| | — |
| | 20,374 |
|
Costs associated with abnormal production and other | | 649 |
| | 1,058 |
| | — |
| | 1,707 |
|
| Gross Deficit | | $ | (28,652 | ) | | $ | (595 | ) | | $ | — |
| | $ | (29,247 | ) |
Depreciation, depletion and amortization incurred2 | | $ | 37,936 |
| | $ | 3,836 |
| | $ | 909 |
| | $ | 42,681 |
|
| | | | | | | | | |
| Year Ended December 31, 2015 | | Potash | | Trio® | | Corporate | | Consolidated |
| Sales | | $ | 217,467 |
| | $ | 69,716 |
| | $ | — |
| | $ | 287,183 |
|
| Less: Freight costs | | 18,262 |
| | 10,461 |
| | — |
| | 28,723 |
|
| Warehousing and handling costs | | 11,213 |
| | 2,726 |
| | — |
| | 13,939 |
|
Cost of goods sold1 | | 172,355 |
| | 45,466 |
| | — |
| | 217,821 |
|
Lower-of-cost-or-market inventory adjustments | | 31,772 |
| | — |
| | — |
| | 31,772 |
|
Costs associated with abnormal production and other | | 10,405 |
| | — |
| | — |
| | 10,405 |
|
| Gross (Deficit) Margin | | $ | (26,540 | ) | | $ | 11,063 |
| | $ | — |
| | $ | (15,477 | ) |
Depreciation, depletion and amortization incurred2 | | $ | 68,562 |
| | $ | 16,993 |
| | $ | 2,121 |
| | $ | 87,676 |
|
1 Cost of goods sold for Potash is presented net of by-product credits, which were $10.6 million, $9.0 million and $7.9 million for the years ended December 31, 2017, 2016, and 2015, respectively.
2 Depreciation, depletion, and amortization incurred for potash and Trio® excludes depreciation, depletion, and amortization amounts absorbed in or (relieved from) inventory.
The following table shows the reconciliation of reportable segment sales to consolidated sales and the reconciliation of segment gross margins to consolidated income before taxes (in thousands):
| | | | | | | | | | | | | | | | | | | | |
| | Year Ended December 31, |
| | 2023 | | 2022 | | 2021 |
| Total sales for reportable segments | | $ | 279,412 | | | $ | 337,872 | | | $ | 270,579 | |
| Elimination of intersegment sales | | (329) | | | (304) | | | (247) | |
| Total consolidated sales | | $ | 279,083 | | | $ | 337,568 | | | $ | 270,332 | |
| | | | | | |
| Total gross margin for reportable segments | | $ | 36,846 | | | $ | 141,408 | | | $ | 55,764 | |
| Elimination of intersegment sales | | (329) | | | (304) | | | (247) | |
| Elimination of intersegment expenses | | 329 | | | 304 | | | 247 | |
| Unallocated amounts: | | | | | | |
| Selling and administrative | | 32,423 | | | 31,799 | | | 23,998 | |
| Impairment of long-lived assets | | 43,288 | | | — | | | — | |
| Loss (gain) on disposal of assets | | 807 | | | 7,470 | | | (2,542) | |
| Accretion of asset retirement obligation | | 2,140 | | | 1,961 | | | 1,858 | |
| Other operating expense | | 2,157 | | | 4,738 | | | 178 | |
| Equity in loss/(earnings) of unconsolidated entities | | 486 | | | (689) | | | — | |
| Interest expense, net | | — | | | 101 | | | 1,468 | |
| Gain on extinguishment of debt | | — | | | — | | | (10,113) | |
| Interest income | | (298) | | | (176) | | | — | |
| Other non-operating income | | (95) | | | (305) | | | (48) | |
| (Loss) income before income taxes | | $ | (44,062) | | | $ | 96,509 | | | $ | 40,965 | |
Total assets are not presented for each reportable segment as they are not reviewed by, nor otherwise regularly provided to, the chief operating decision maker. All sales of both segments are to external customers.
During the year ended December 31, 2017, we recorded restructuring charges of $0.3 million, all of which was attributable to Trio®.
During the year ended December 31, 2016, we recorded restructuring charges of $2.7 million, of which $2.1 million was attributable to the potash segment, $0.4 million was attributable to Trio®, and $0.2 million was attributable to corporate.
Note 18— CONCENTRATION OF CREDIT RISK
| |
Note 17 | — CONCENTRATION OF CREDIT RISK |
Credit risk represents the loss that would be recognized at the reporting date if counterparties failed completely to perform as contracted. Concentrations of credit risk, whether on- or off-balance sheet, that arise from financial instruments exist for counterparties when they have similar economic characteristics that would cause their ability to meet contractual obligations to be similarly affected by changes in economic or other conditions.
Our products are marketed for sale into three primary markets. These markets are the agricultural market as a fertilizer, the industrial market as a component in drilling fluids for oil and gas exploration, and the animal feed market as a nutrient. Credit risks associated with the collection of accounts receivable are primarily related to the impact of external factors on our customers. Our customers are distributors and end-users whose credit worthinesscreditworthiness and ability to meet their payment obligations will be affected by factors in their industries and markets. Those factors include soil nutrient levels, crop prices, weather, the type of crops planted, changes in diets, growth in population, the amount of land under cultivation, fuel prices and consumption, oil and gas drilling and completion activity, the demand for biofuels, government policy, and the relative value of currencies. Our industrial sales are significantly influenced by oil and gas drilling activity.
In 2023 and 2022, we had one customer in our potash and Trio® segments that accounted for approximately $33.4 million and $35.0 million of our total consolidated revenues, respectively. See Item 1A. "Risks Related to Financial Position, Indebtedness and Additional Capital Needs - The loss or substantial decline in revenue from larger customers or certain industries could have a material adverse effect on our revenues, profitability, and liquidity."
In 2017, 2016 and 2015,2021, no customer accounted for more than 10% of our sales. Because of the size of our company compared to the overall size of the North American market and the regional demands for our products, we believe that a decline in a specific customer's purchases would not have a material adverse long-term effect on our financial results.
In each of the last three years ended December 31, 2017, 2016,2023, 2022, and 2015, 87%2021, 95%, 98%94%, and 97%, respectively, of our total sales were sold to customers located in the United States.U.S. All of our long-lived assets are located in the U.S.
We maintain cash accounts with several financial institutions. At times, the balances in the accounts may exceed the $250,000$250,000 balance insured by the Federal Deposit Insurance Corporation.
| |
Note 18 | — FINANCIAL INFORMATION FOR SUBSIDIARY GUARANTORS |
Note 19— FINANCIAL INFORMATION FOR SUBSIDIARY GUARANTORS
OF POSSIBLE FUTURE PUBLIC DEBT
Intrepid Potash, Inc., as the parent company, has no independent assets or operations, and operations are conducted solely through its subsidiaries. Cash generated from operations is held at the parent company level as cash on hand and short- and long-term investments. Cash on handand cash equivalents totaled $1.1$4.1 million and $4.5$18.5 million at December 31, 2017,2023, and 2016,2022, respectively. In the event that one or more of our wholly-owned operating subsidiaries guarantee public debt securities in the future, those guarantees will be full and unconditional and will constitute the joint and several obligations of the subsidiary guarantors. Our other subsidiaries are minor. There are no restrictions on our ability to obtain cash dividends or other distributions of funds from the subsidiary guarantors, except those imposed by applicable law.
| |
Note 19 | — QUARTERLY FINANCIAL DATA (UNAUDITED) (in thousands, except per share amounts) |
Note 20— SHARE REPURCHASE PROGRAM
In February of 2022, our Board of Directors approved a $35 million share repurchase program. Under the share repurchase program, we may repurchase shares from time to time in the open market or in privately negotiated transactions. The timing, volume and nature of share repurchases, if any, will be at our sole discretion and will be dependent on market conditions, liquidity, applicable securities laws, and other factors. We may suspend or discontinue the share repurchase program at any time.
We made no repurchases of shares of our common stock for the twelve months ended December 31, 2023. In 2022, we repurchased 608,657 shares of our common stock and paid $22.0 million under the share repurchase program.
As of December 31, 2023, we have approximately $13.0 million of remaining availability under the share repurchase program.
|
| | | | | | | | | | | | | | | | |
| | | Three Months Ended |
| | | December 31, 2017 | | September 30, 2017 | | June 30, 2017 | | March 31, 2017 |
| Sales | | $ | 33,305 |
| | $ | 32,060 |
| | $ | 43,910 |
| | $ | 48,332 |
|
| Cost of Goods Sold | | $ | 20,813 |
| | $ | 19,395 |
| | $ | 29,714 |
| | $ | 35,873 |
|
| Lower-of-cost-or-market inventory adjustments | | $ | 2,516 |
| | $ | 667 |
| | $ | 317 |
| | $ | 3,824 |
|
| Gross Margin (Deficit) | | $ | 1,146 |
| | $ | 3,792 |
| | $ | 3,697 |
| | $ | (2,856 | ) |
| Net Loss | | $ | (1,389 | ) | | $ | (1,908 | ) | | $ | (5,935 | ) | | $ | (13,678 | ) |
Basic and Diluted
Loss Per Share | | $ | (0.01 | ) | | $ | (0.02 | ) | | $ | (0.05 | ) | | $ | (0.17 | ) |
Note 21.— SUBSEQUENT EVENT
On December 12, 2023, we entered into the Third Amendment of Cooperative Development Agreement (the “Amendment”) with XTO Holdings, LLC (“XTO Holdings”) and XTO Delaware Basin, LLC, as successors in interest to BOPCO, L.P. (“XTO Delaware Basin,” and together with XTO Holdings, “XTO”). The Amendment had an effective date of January 1, 2024 (“Amendment Date”). The Amendment further amends that certain Cooperative Development Agreement, by and between us, BOPCO, L.P. and the other parties thereto, effective as of February 28, 2011 (as amended, including by the Amendment, the “CDA”), which was executed for the purpose of cooperative development of certain lands for potassium and oil and gas. The Cooperative Development Agreement restricts and limits the rights of us and XTO, as successors in interest to BOPCO, L.P. to explore and develop their respective interests, including limitations on the location of wells. We and XTO entered into the Amendment in an effort to further the cooperation, remove the restrictions and limitations, and allow for the efficient co-development of resources within the Designated Potash Area (“DPA”) consistent with the United States Secretary of the Interior Order 3324.
Pursuant to the Amendment, among other things, we agree to support and not oppose XTO’s development and operation of XTO’s oil and gas interests within the DPA. As consideration under the Amendment, on December 12, 2023 we received an initial payment of $5.0 million, which is included in "Accrued liabilities" on the December 31, 2023 Consolidated Balance Sheet.
On January 2, 2024, we received an additional $45.0 million initial payment from XTO. The Amendment also provides that we shall receive an additional one-time payment equal to $50.0 million as an “Access Fee,” which XTO will pay within 90 days upon the earlier occurrence of (i) the approval of the first new or expanded drilling island within a specific area to be used by XTO or (ii) within seven (7) years of the anniversary of the Amendment Date. XTO is also required to pay additional amounts to Intrepid as an “Access Realization Fee,” up to a maximum amount of $100.0 million, in the event of certain additional drilling activities by XTO. The CDA also contains other customary representations, warranties, covenants, and dispute resolution provisions.
For the twelve months ended December 31, 2023, we have recorded no revenue associated with the Amendment.
|
| | | | | | | | | | | | | | | | |
| | | Three Months Ended |
| | | December 31, 2016 | | September 30, 2016 | | June 30, 2016 | | March 31, 2016 |
| Sales | | $ | 42,188 |
| | $ | 43,643 |
| | $ | 51,840 |
| | $ | 73,277 |
|
| Cost of Goods Sold | | $ | 33,953 |
| | $ | 35,272 |
| | $ | 41,850 |
| | $ | 59,777 |
|
| Lower-of-cost-or-market inventory adjustments | | $ | 3,245 |
| | $ | 5,192 |
| | $ | 2,930 |
| | $ | 9,007 |
|
Costs Associated with
Abnormal Production | | $ | — |
| | $ | — |
| | $ | 1,057 |
| | $ | 650 |
|
| Gross Deficit | | $ | (7,004 | ) | | $ | (7,624 | ) | | $ | (5,466 | ) | | $ | (9,153 | ) |
| Net Loss | | $ | (16,567 | ) | | $ | (18,241 | ) | | $ | (13,398 | ) | | $ | (18,427 | ) |
Basic and Diluted
Loss Per Share | | $ | (0.22 | ) | | $ | (0.24 | ) | | $ | (0.18 | ) | | $ | (0.24 | ) |
SCHEDULE II - VALUATION AND QUALIFYING ACCOUNTS
| | | | | | | | | | | | | | | | | | | | | | | | | | |
| | (In thousands) |
| Description | | Balance at Beginning of Year | | Charged to Costs and Expenses | | Deductions | | Balance at End of Year |
| | | | | | | | |
| | | | | | | | |
| | | | | | | | |
| | | | | | | | |
| | | | | | | | |
| | | | | | | | |
| | | | | | | | |
| | | | | | | | |
| | | | | | | | |
| | | | | | | | |
| | | | | | | | |
| | | | | | | | |
| | | | | | | | |
| | | | | | | | |
| | | | | | | | |
| | | | | | | | |
| | | | | | | | |
| | | | | | | | |
| | | | | | | | |
| | | | | | | | |
| | | | | | | | |
| For the Year Ended December 31, 2021 | | | | | | | | |
| Allowances deducted from assets | | | | | | | | |
| Deferred tax assets - valuation allowance | | 217,943 | | | — | | | (215,910) | | | 2,033 | |
| Reserve for parts inventory obsolescence | | 1,050 | | | 2,108 | | | — | | | 3,158 | |
| Allowance for doubtful accounts and other receivables | | 555 | | | — | | | — | | | 555 | |
| Total allowances deducted from assets | | $ | 219,548 | | | $ | 2,108 | | | $ | (215,910) | | | $ | 5,746 | |
| | | | | | | | |
| For the Year Ended December 31, 2022 | | | | | | | | |
| Allowances deducted from assets | | | | | | | | |
| Deferred tax assets - valuation allowance | | 2,033 | | | — | | | — | | | 2,033 | |
| Reserve for parts inventory obsolescence | | 3,158 | | | 1,750 | | | (3,646) | | | 1,262 | |
| Allowance for doubtful accounts and other receivables | | 555 | | | — | | | — | | | 555 | |
| Total allowances deducted from assets | | $ | 5,746 | | | $ | 1,750 | | | $ | (3,646) | | | $ | 3,850 | |
| | | | | | | | |
| For the Year Ended December 31, 2023 | | | | | | | | |
| Allowances deducted from assets | | | | | | | | |
| Deferred tax assets - valuation allowance | | 2,033 | | | 1,121 | | | — | | | 3,154 | |
| Reserve for parts inventory obsolescence | | 1,262 | | | 509 | | | (856) | | | 915 | |
| Allowance for doubtful accounts and other receivables | | 555 | | | 110 | | | — | | | 665 | |
| Total allowances deducted from assets | | $ | 3,850 | | | $ | 1,740 | | | $ | (856) | | | $ | 4,734 | |
| | | | | | | | |
|
| | | | | | | | | | | | | | | | |
| | | (In thousands) |
| Description | | Balance at Beginning of Year | | Charged to Costs and Expenses | | Deductions | | Balance at End of Year |
| For the Year Ended December 31, 2015 | | | | | | | | |
| Allowances deducted from assets | | | | | | | | |
| Deferred tax assets - valuation allowance | | $ | 268 |
| | $ | 300,333 |
| | $ | — |
| | $ | 300,601 |
|
| Reserve for parts inventory obsolescence | | 500 |
| | 2,260 |
| | — |
| | 2,760 |
|
| Allowance for doubtful accounts and other receivables | | 845 |
| | — |
| | (438 | ) | | 407 |
|
| Total allowances deducted from assets | | $ | 1,613 |
| | $ | 302,593 |
| | $ | (438 | ) | | $ | 303,768 |
|
| | | | | | | | | |
| For the Year Ended December 31, 2016 | | | | | | | | |
| Allowances deducted from assets | | | | | | | | |
| Deferred tax assets - valuation allowance | | $ | 300,601 |
| | $ | 25,496 |
| | $ | — |
| | $ | 326,097 |
|
| Reserve for parts inventory obsolescence | | 2,760 |
| | 349 |
| | — |
| | 3,109 |
|
| Allowance for doubtful accounts and other receivables | | 407 |
| | — |
| | (407 | ) | | — |
|
| Total allowances deducted from assets | | $ | 303,768 |
| | $ | 25,845 |
| | $ | (407 | ) | | $ | 329,206 |
|
| | | | | | | | | |
| For the Year Ended December 31, 2017 | | | | | | | | |
| Allowances deducted from assets | | | | | | | | |
| Deferred tax assets - valuation allowance | | $ | 326,097 |
| | $ | — |
| | $ | (104,507 | ) | | $ | 221,590 |
|
| Reserve for parts inventory obsolescence | | 3,109 |
| | 1,073 |
| | — |
| | 4,182 |
|
| Allowance for doubtful accounts and other receivables | | — |
| | 865 |
| | — |
| | 865 |
|
| Total allowances deducted from assets | | $ | 329,206 |
| | $ | 1,938 |
| | $ | (104,507 | ) | | $ | 226,637 |
|
| |
ITEM 9. | CHANGES IN AND DISAGREEMENTS WITH ACCOUNTANTS ON ACCOUNTING |
ITEM 9.CHANGES IN AND DISAGREEMENTS WITH ACCOUNTANTS ON ACCOUNTING
AND FINANCIAL DISCLOSURE
None.
| |
ITEM 9A. | CONTROLS AND PROCEDURES |
ITEM 9A.CONTROLS AND PROCEDURES
Evaluation of Disclosure Controls and Procedures
We maintain "disclosure controls and procedures." Our disclosure controls and procedures are designed to ensure that information required to be disclosed by us in reports that we file or submit under the Exchange Act is recorded, processed, summarized, and reported within the time periods specified in SEC rules and forms. Our disclosure controls and procedures are also designed to ensure that this information is accumulated and communicated to our management, including our principal executive officer and principal financial officer, as appropriate, to allow timely decisions regarding required disclosure. Under the supervision and with the participation of our management, including our principal executive officer and principal financial officer, we conducted an evaluation of our disclosure controls and procedures as of December 31, 2017.2023. Based on this evaluation, our principal executive officer and principal financial officer have concluded that our disclosure controls and procedures were effective as of December 31, 2017,2023, at the reasonable assurance level.
Management's Report on Internal Control over Financial Reporting
Our management is responsible for establishing and maintaining adequate "internal control over financial reporting." Our internal control over financial reporting is a process designed to provide reasonable assurance regarding the reliability of financial reporting and the preparation of financial statements for external purposes in accordance with GAAP. Under the
supervision and with the participation of our management, including our principal executive officer and principal financial
officer, we conducted an evaluation of the effectiveness of our internal control over financial reporting as of December 31, 2017,2023, based on the criteria established in Internal Control—Integrated Framework issued by the Committee of Sponsoring Organizations of the Treadway Commission (COSO) in 2013.
Based on the results of our evaluation, our management concluded that our internal control over financial reporting was effective as of December 31, 2017.2023.
The effectiveness of our internal control over financial reporting as of December 31, 2017,2023, has been audited by KPMG LLP, our independent registered public accounting firm, as stated in their report which appears herein.
Changes in Internal Control over Financial Reporting
There were no changes in our internal control over financial reporting that occurred during the three months ended December 31, 2017,2023, that materially affected, or are reasonably likely to materially affect, our internal control over financial reporting.
Inherent Limitations on Effectiveness of Controls
Our management, including our principal executive officer and principal financial officer, do not expect that our disclosure controls or our internal control over financial reporting will prevent all errors and all fraud. A control system, no matter how well conceived and operated, can provide only reasonable, not absolute, assurance that the objectives of the control system are met. Further, the design of a control system must reflect the fact that there are resource constraints, and the benefits of controls must be considered relative to their costs. Because of the inherent limitations in all control systems, no evaluation of controls can provide absolute assurance that all control issues and instances of fraud, if any, within Intrepid have been detected. These inherent limitations include the realities that judgments in decision-making can be faulty, and that breakdowns can occur because of a simple error or mistake. Additionally, controls can be circumvented by the individual acts of some persons, by collusion of two or more people, or by management override of the controls. The design of any system of controls also is based in part upon certain assumptions about the likelihood of future events, and there can be no assurance that any design will succeed in achieving its stated goals under all potential future conditions. Over time, controls may become inadequate because of changes in conditions, or the degree of compliance with policies or procedures may deteriorate. Because of the inherent limitations in a cost-effective control system, misstatements due to error or fraud may occur and not be detected.
| |
ITEM 9B. | OTHER INFORMATION |
Not applicable.ITEM 9B.OTHER INFORMATION
During the three months ended December 31, 2023, no director or officer of the Company adopted, modified or terminated a "Rule 10b5-1 trading arrangement" or "non-Rule 10b5-1 trading arrangement" as each term is defined in Item 408 of Regulation S-K.
ITEM 9C.DISCLOSURE REGARDING FOREIGN JURISDICTIONS THAT PREVENT INSPECTIONS
None
PART III
| |
ITEM 10. | DIRECTORS, EXECUTIVE OFFICERS AND CORPORATE GOVERNANCE |
Biographical information about our executive officers is set forth in "Item 1. Business—Executive Officers." Other informationITEM 10.DIRECTORS, EXECUTIVE OFFICERS AND CORPORATE GOVERNANCE
Information required by this item will be included in the proxy statement for our 20182024 annual stockholders' meeting and is incorporated by reference into this report.Annual Report.
| |
ITEM 11. | EXECUTIVE COMPENSATION |
ITEM 11.EXECUTIVE COMPENSATION
Information required by this item will be included in the proxy statement for our 20182024 annual stockholders' meeting and is incorporated by reference into this report.Annual Report.
| |
ITEM 12. | SECURITY OWNERSHIP OF CERTAIN BENEFICIAL OWNERS AND MANAGEMENT AND RELATED STOCKHOLDER MATTERS |
ITEM 12.SECURITY OWNERSHIP OF CERTAIN BENEFICIAL OWNERS AND MANAGEMENT AND RELATED STOCKHOLDER MATTERS
Information required by this item will be included in the proxy statement for our 20182024 annual stockholders' meeting and is incorporated by reference into this report.Annual Report.
| |
ITEM 13. | CERTAIN RELATIONSHIPS AND RELATED TRANSACTIONS, |
ITEM 13.CERTAIN RELATIONSHIPS AND RELATED TRANSACTIONS,
AND DIRECTOR INDEPENDENCE
Information required by this item will be included in the proxy statement for our 20182024 annual stockholders' meeting and is incorporated by reference into this report.Annual Report.
| |
ITEM 14. | PRINCIPAL ACCOUNTING FEES AND SERVICES |
ITEM 14.PRINCIPAL ACCOUNTANT FEES AND SERVICES
Information required by this item will be included in the proxy statement for our 20182024 annual stockholders' meeting and is incorporated by reference into this report.Annual Report.
PART IV
| |
ITEM 15. | EXHIBITS, FINANCIAL STATEMENT SCHEDULES |
ITEM 15.EXHIBITS, FINANCIAL STATEMENT SCHEDULES
(a)Financial Statements, Financial Statement Schedules and Exhibits
The following are filed as a part of this Annual Report on Form 10-K:Report:
(1) Financial Statements
Management's Report on Internal Control over Financial Reporting
Report of Independent Registered Accounting Firm (KPMG LLP, Denver, CO Auditor Firm ID 185)
Consolidated Balance Sheets as of December 31, 2017,2023, and 20162022
Consolidated Statements of Operations for the years ended December 31, 2017, 2016,2023, 2022, and 20152021
Consolidated Statements of Comprehensive Loss for the years ended December 31, 2017, 2016, and 2015
Consolidated Statements of Stockholders' Equity for the years ended December 31, 2017, 2016,2023, 2022, and 20152021
Consolidated Statements of Cash Flows for the years ended December 31, 2017, 2016,2023, 2022, and 20152021
Notes to Consolidated Financial Statements
(2) Financial Statement Schedules
| | | | | | | | |
| Schedule | | Schedule Description |
| | |
Schedule | | Schedule Description |
| Schedule II | | Schedule of Valuation and Qualifying Accounts |
Schedule II is filed as part of this Annual Report on Form 10-K and is set forth immediately following the Notes to the Consolidated Financial Statements referred to above. All other financial statement schedules have been omitted because they are not required, are not applicable, or the information is included in the consolidated financial statements or notes thereto.
(3) Exhibits
The following exhibits are filed or incorporated by reference in this report:
| | | | | | | | | | | | | | | | | |
| | | | | |
| | | | Incorporated by Reference from the Below-Listed Form (Each Filed under SEC File Number 001-34025) |
| Exhibit Number | | Exhibit Description | | Form | Form | Filing Date |
| | Restated Certificate of Incorporation of Intrepid Potash, Inc. | | 8-K | 8-K | April 25, 2008 |
| | Certificate of Amendment to Restated Certificate of Incorporation of Intrepid Potash, Inc. | | 8-K | 8-K | May 26, 2016 |
| | Certificate of Amendment to Restated Certificate of Incorporation of Intrepid Potash, Inc. | | 8-K | August 14, 2020 |
| | Amended and Restated Bylaws of Intrepid Potash, Inc. | | 8-K | 8-K | June 25, 2015 |
| | Description of Registrant's Securities | | 10-K | March 7, 2023 |
| | Form of Indemnification Agreement with each director and officer | | 8-K | 8-K | April 25, 2008 |
| | Director Designation and Voting Agreement, dated as of April 25, 2008, by and among Intrepid Potash, Inc., Harvey Operating and Production Company, Intrepid Production Corporation, and Potash Acquisition, LLC | | 8-K | 8-K | May 1, 2008 |
| | Registration Rights Agreement, dated as of April 25, 2008, by and among Intrepid Potash, Inc., Harvey Operating & Production Company, Intrepid Production Corporation, and Potash Acquisition, LLC | | 8-K | 8-K | May 1, 2008 |
| | Acknowledgment and Relinquishment, dated as of December 19, 2011, by and among Intrepid Potash, Inc., Harvey Operating and Production Company, Intrepid Production Corporation, and Potash Acquisition, LLC | | 10-K | 10-K | February 16, 2012 |
| | Amended and Restated Credit Agreement, dated as of October 31, 2016,August 1, 2019, by and among Intrepid Potash, Inc., the subsidiaries named therein,party thereto, Bank of Montreal, as administrative agent, swing line lender, lead arranger, and each ofbook runner, and the lenders named thereinparty thereto. | | 8-K | 8-K | NovemberAugust 1, 20162019 |