UNITED STATES
SECURITIES AND EXCHANGE COMMISSION
Washington, D.C. 20549
_______________________________
FORM 10-K
(Mark One)
|
| | | | |
x☒ | ANNUAL REPORT PURSUANT TO SECTION 13 OR 15(d) OF THE SECURITIES EXCHANGE ACT OF 1934 |
For the Fiscal Year Ended October 31, 20182021
or
|
| | | | |
¨☐ | TRANSITION REPORT PURSUANT TO SECTION 13 OR 15(d) OF THE SECURITIES EXCHANGE ACT OF 1934 |
Commission file number 1-33913
_______________________________
QUANEX BUILDING PRODUCTS CORPORATION
(Exact name of registrant as specified in its charter) |
| | | | | | | |
| Delaware | | 26-1561397 |
| (State or other jurisdiction of incorporation or organization) | | (I.R.S. Employer Identification No.) |
1800 West Loop South, Suite 1500, Houston, Texas | | 77027 |
(Address of principal executive offices) | | (Zip code) |
1800 West Loop South, Suite 1500, Houston, Texas 77027
(Address of principal executive offices and zip code)
Registrant’s telephone number, including area code: (713) 961-4600
Securities registered pursuant to Section 12(b) of the Act:
|
| | | | | | | |
| Title of each class | Trading Symbol(s) | Name of each exchange on which registered |
| Common Stock, $0.01 par value | NX | New York Stock Exchange Inc. |
Securities registered pursuant to Section 12(g) of the Act: NONE
_______________________________
Indicate by check mark if the registrant is a well-known seasoned issuer, as defined in Rule 405 of the Securities Act. Yes x☒No ¨
Indicate by check mark if the registrant is not required to file reports pursuant to Section 13 or Section 15(d) of the Act. Yes¨Nox☒
Indicate by check mark whether the registrant: (1) has filed all reports required to be filed by Section 13 or 15(d) of the Securities Exchange Act of 1934 during the preceding 12 months (or for such shorter period that the registrant was required to file such reports), and (2) has been subject to such filing requirements for the past 90 days. Yes x☒No¨
Indicate by check mark whether the registrant has submitted electronically and posted on its corporate Web site, if any, every Interactive Data File required to be submitted and posted pursuant to Rule 405 of Regulation S-T during the preceding 12 months (or for such shorter period that the registrant was required to submit and post such files). Yes x☒No¨
Indicate by check mark if disclosure of delinquent filers pursuant to Item 405 of Regulation S-K is not contained herein, and will not be contained, to the best of registrant’s knowledge, in definitive proxy or information statements incorporated by reference in Part III of this Form 10-K or any amendment to this Form 10-K.¨
Indicate by check mark whether the registrant is a large accelerated filer, an accelerated filer, a non-accelerated filer, or a smaller reporting company, or an emerging growth company. See the definition of “large accelerated filer,” “accelerated filer,” “smaller reporting company,"” and "emerging“emerging growth company” in Rule 12b-2 of the Exchange Act. (Check one):
|
| | | | | | | | | | | | | |
| Large accelerated filer | x☒ | | Accelerated filer | o☐ |
| Non-accelerated filer | o☐ | | Smaller reporting company | o☐ |
| | | Emerging growth company | o☐ |
| If an emerging growth company, indicate by check mark if the registrant has elected not to use the extended period for complying with any new or revised financial accounting standards provided pursuant to Section 7(a)(2)(B) of the Securities Act. | o☐ |
Indicate by check mark whether the registrant is a shell company (as defined in Rule 12b-2 of the Act). Yes ☐No☒
Indicate by check mark whether the registrant has filed a report on and attestation to its management’s assessment of the effectiveness of its internal control over financial reporting under Section 404(b) of the Sarbanes-Oxley Act (15 U.S.C. 7262(b)) by the registered public accounting firm that prepared or issued its audit report. Yes ☒No ¨Nox
The aggregate market value of the voting and non-voting common equity held by non-affiliates as of April 30, 2018,2021, computed by reference to the closing price for the Common Stock on the New York Stock Exchange, Inc. on that date, was $593,689,919.$901,994,657. Such calculation assumes only the registrant’s officers and directors at such date were affiliates of the registrant.
At December 7, 20188, 2021 there were outstanding 33,500,95333,248,039 shares of the registrant’s Common Stock, $0.01 par value.
_______________________________
DOCUMENTS INCORPORATED BY REFERENCE
Portions of the Registrant’s definitive Proxy Statement for its 20192022 Annual Meeting of Stockholders to be filed with the Commission within 120 days of October 31, 20182021 are incorporated herein by reference in Part III of this Annual Report on Form 10-K.
TABLE OF CONTENTS
| | | | | | | | |
| | Page |
| PART I | |
| | |
| | Page |
| |
| | |
| Item 1. | Business | | |
| | |
| Item 1A. | Risk Factors | | |
| | |
| Item 1B. | | |
| | |
| Item 2. | Properties | | |
| | |
| Item 3. | Legal Proceedings | | |
| | |
| Item 4. | | |
| |
| |
| | |
| Item 5. | | |
| | |
Item 6. | | |
| | |
| Item 7. | | |
| | |
| Item 7A. | | |
| | |
| Item 8. | | |
| | |
| Item 9. | | |
| | |
| Item 9A. | | |
| |
| Item 9B. | Other Information | |
| |
| |
| | |
| Item 10. | | |
| | |
| Item 11. | Executive Compensation | | |
| | |
| Item 12. | | |
| | |
| Item 13. | | |
| | |
| Item 14. | | |
| |
| IV | |
| | |
| Item 15. | | |
Unless the context indicates otherwise, references to "Quanex"“Quanex”, the "Company"“Company”, "we"“we”, "us"“us” and "our"“our” refer to the consolidated business operations of Quanex Building Products Corporation and its subsidiaries.
Cautionary Note Regarding Forward-Looking Statements
Certain of the statements contained in this document and in documents incorporated by reference herein, including those made under the caption “Management’s Discussion and Analysis of Financial Condition and Results of Operations” are “forward-looking” statements as defined under the Private Securities Litigation Reform Act of 1995. Generally, the words “expect,” “believe,” “intend,” “estimate,” “anticipate,” “project,” “will” and similar expressions identify forward-looking statements, which generally are not historical in nature. Forward looking statements are (1) all statements which address future operating performance, (2) events or developments that we expect or anticipate will occur in the future, including statements relating to volume, sales, operating income and earnings per share, and (3) statements expressing general outlook about future operating results. Forward-looking statements are subject to certain risks and uncertainties that could cause actual results to differ materially from our historical experience and our current projections or expectations. As and when made, we believe that these forward-looking statements are reasonable. However, caution should be taken not to place undue reliance on any such forward-looking statements since such statements speak only as of the date when made and there can be no assurance that such forward-looking statements will occur. We are not obligated to publicly update or revise any forward-looking statements, whether as a result of new information, future events or otherwise.
Factors that could cause actual results to differ materially from those expressed or implied by the forward-looking statements include, but are not limited to the following:
•impacts from public health issues (including pandemics, such as the recent COVID-19 pandemic and quarantines) on the economy, demand for our products or our operations, including the responses of governmental authorities to contain such public health issues;
•changes in market conditions, particularly in the new home construction, and residential remodeling and replacement (R&R) activity markets in the United States, United Kingdom, Germany and Germany;elsewhere;
•changes in non-pass-through raw material costs;
•changes in domestic and international economic conditions;
•changes in availability and prices of raw material;
•our ability to attract and retain skilled labor;
•changes in purchases by our principal customers;
•fluctuations in foreign currency exchange rates;
•our ability to maintain an effective system of internal controls;
•our ability to successfully implement our internal operating plans and acquisition strategies;
•our ability to successfully implement our plans with respect to information technology (IT) systems and processes;
•our ability to control costs and increase profitability;
•changes in environmental laws and regulations;
•changes in warranty obligations;
•changes in energy costs;
•changes in tax laws, and interpretations thereof;
•changes in interest rates;
•our ability to service our debt facilities and remain in good standing with our lenders;
•changes in the availability or applicability of our insurance coverage;
•our ability to maintain good relationships with our suppliers, subcontractors, and key customers; and
•the resolution of litigation and other legal proceedings.
Additional factors that could cause actual results to differ materially are discussed under "“Item 1A. Risk Factors” included elsewhere in this Annual Report on Form 10-K.
About Third-Party Information
In this report, we rely on and refer to information regarding industry data obtained from market research, publicly available information, industry publications, United States government sources and other third parties. Although we believe this
information is reliable, we cannot guarantee the accuracy or completeness of the information and have not independently verified it.
PART I
Item 1. Business (Continuing Operations).Business.
Our Company
Quanex was incorporated in Delaware on December 12, 2007, as Quanex Building Products Corporation. We manufacture components for original equipment manufacturers (OEM) in the building products industry. These components can be categorized as window and door (fenestration) components and kitchen and bath cabinet components. Examples of fenestration components include (1) energy-efficient flexible insulating glass spacers, (2) extruded vinyl profiles, (3) window and door screens, and (4) precision-formed metal and wood products. In addition, we provide certain other non-fenestration components and products, which include solar panel sealants, trim moldings, vinyl decking, vinyl fencing, water retention barriers, and conservatory roof components. We use low-cost production processes and engineering expertise to provide our customers with specialized products for their specific window, door, and cabinet applications. We believe these capabilities provide us with unique competitive advantages. We serve a primary customer base in North America and the United Kingdom (U.K.), and also serve customers in international markets through our operating plants in the United KingdomU.K. and Germany, as well as through sales and marketing efforts in other countries.
Our History
Our predecessor company, Quanex Corporation, was organized in Michigan in 1927 as Michigan Seamless Tube Company, and was later reincorporated in Delaware in 1968. In 1977, Michigan Seamless Tube Company changed its name to Quanex Corporation. On December 12, 2007, Quanex Building Products Corporation was incorporated as a wholly-owned subsidiary in the state of Delaware, in order to facilitate the separation of Quanex Corporation's vehicular products and building products businesses. This separation became effective on April 23, 2008, through a spin-off of the building products business to Quanex Corporation's then-existing shareholders. Immediately following the spin-off, our former parent company, consisting principally of the vehicular products business and all non-building products related corporate accounts, merged with a wholly-owned subsidiary of Gerdau S.A.
Since the spin-off in 2008, we have evolved our business by making investments in organic growth initiatives and taking a disciplined approach to new business and strategic acquisition opportunities, while disposing of non-core businesses.
Notable developments and transactions which occurred since the spin-off include the following:
in March 2011, we acquired Edgetech, I.G. Inc. and its German subsidiary, which provided us with three manufacturing facilities, one each in the United States, United Kingdom and Germany, that produce and market a full line of flexible insulating glass spacer systems for window and door customers in North America and abroad. This acquisition complemented our then existing insulating glass products business in the United States and, as a result, we committed to a plan to consolidate these facilities in November 2011. This consolidation plan, in part, resulted in the closure of a plant in Barbourville, Kentucky, and the relocation of equipment that was used to manufacture the single seal, warm-edge spacer system to our facility in Cambridge, Ohio. This consolidation was substantially completed by August 2012, with minor residual cash payments and program costs incurred during fiscal 2013. We sold the facility in Barbourville in May 2014;
in December 2012, we acquired substantially all of the assets of Alumco Inc. and its subsidiaries (Alumco), an aluminum screen manufacturer, which allowed us to expand the scope of our fenestration business to include screens for vinyl window and door manufacturers and to expand our geographic reach throughout the United States;
in April 2014, we sold our interest in a limited liability company which held the net assets of our Nichols Aluminum business to a privately held company that provides aluminum rolled products and extrusions, aluminum recycling and specification aluminum alloy production;
in June 2015, we acquired the outstanding ownership shares of Flamstead Holdings Limited, an extruder of vinyl lineal products and manufacturer of other plastic products incorporated and registered in England and Wales. Following a pre-sale reorganization and purchase, Flamstead Holdings Limited owned 100% of the ownership shares of the following subsidiaries: HL Plastics Limited, Vintage Windows Limited, Wegoma Machinery Sales Limited (renamed in 2016 as Avantek Machinery Company), and Liniar Limited (collectively referred to as “HLP”), each registered in England and Wales. This acquisition expanded our vinyl extrusion product offerings and expanded our international presence in the global fenestration business;
in November 2015, we completed the merger of QWMS, Inc., a Delaware corporation which was a newly-formed and wholly-owned Quanex subsidiary, and WII Holding, Inc. (WII), a Delaware corporation. Upon satisfaction or waiver of
conditions set forth in the merger agreement, QWMS, Inc. merged with and into WII, and WII became our wholly-owned subsidiary, and, as a result, we acquired all the subsidiaries of WII (referred to collectively as Woodcraft). Woodcraft is a manufacturer of cabinet doors and other components for OEMs in the kitchen and bathroom cabinet industry, operating various plants in the United States and Mexico;
in October 2016, we committed to a restructuring plan that included the closure of two vinyl extrusion plants in the United States and our kitchen and bathroom cabinet door plant in Guadalajara, Mexico; and
in September 2017, we closed a kitchen and bathroom cabinet door plant in Lansing, Kansas, and, in October 2017, sold a wood-flooring business in Shawano, Wisconsin.
As of October 31, 2018,2021, we operated 3428 manufacturing facilities located in 1715 states in the United States,U.S., two facilities in the United Kingdom,U.K., and one in Germany. These facilities feature efficient plant design and flexible manufacturing processes, enabling us to produce a wide variety of custom engineered products and components primarily focused on the window and door segment of the residential building products markets. We are able to maintain minimal levels of finished goods inventories at most locations because we typically manufacture products upon order to customer specifications. We believe the primary drivers of our operating results are residential remodeling and replacement activity and new home construction in the markets we serve.
Our Industry
Our business is largely based in North American basedAmerica and dependent upon the spending and growth activity levels of our customers which include national and regional residential window, door and cabinet manufacturers. Our international presence includes vinyl extruded lineals for large house systems to smaller customers primarilyindividual customers. We also have insulating glass businesses in the United Kingdom, as well as our insulating glass business in the United KingdomU.K. and Germany.
We use data related to housing starts and window shipments in the United States,U.S., as published by or derived from third-party sources, to evaluate the fenestration market in these countries.market. We also use data related to cabinet demand in the United StatesU.S. to evaluate the residential cabinet market.
The following table presents calendar-year annual housing starts information as of October 2018, as published by the United States Census Bureau based on data collectedNovember 2021 from the National Association of Home Builders (NAHB), (units in thousands):
| | | | | | | | | | | | | | | | | | | | | | | | | | | | | | | | | | | | | | | | | | | | |
| | Single-family Units | | Multi-family Units | | Manufactured Units | | |
| Period | | Units | | % Change | | Units | | % Change | | Units | | % Change | | Total Units |
| Annual Data | | | | | | | | | | | | | | |
| | | | | | | | | | | | | | |
| | | | | | | | | | | | | | |
| | | | | | | | | | | | | | |
| 2017 | | 849 | | 8% | | 356 | | (9)% | | 93 | | 15% | | 1,298 |
| 2018 | | 871 | | 3% | | 376 | | 6% | | 96 | | 3% | | 1,343 |
| 2019 | | 889 | | 2% | | 403 | | 7% | | 95 | | (1)% | | 1,387 |
| 2020 | | 1,004 | | 13% | | 393 | | (2)% | | 94 | | (1)% | | 1,491 |
| Annual Data - Forecast | | | | | | | | | | | | | | |
| | | | | | | | | | | | | | |
| 2021 | | 1,111 | | 11% | | 469 | | 19% | | 106 | | 13% | | 1,686 |
| 2022 | | 1,113 | | —% | | 440 | | (6)% | | 114 | | 8% | | 1,667 |
| 2023 | | 1,111 | | —% | | 440 | | —% | | 115 | | 1% | | 1,666 |
|
| | | | | | | | | | | | | | |
| | | Single-family Units | | Multi-family Units | | Manufactured Units | | |
| Period | | Units | | % Change | | Units | | % Change | | Units | | % Change | | Total Units |
| Annual Data | | | | | | | | | | | | | | |
| 2012 | | 537 | | N/A | | 247 | | N/A | | 55 | | N/A | | 839 |
| 2013 | | 620 | | 15% | | 308 | | 25% | | 60 | | 9% | | 988 |
| 2014 | | 647 | | 4% | | 355 | | 15% | | 64 | | 7% | | 1,066 |
| 2015 | | 713 | | 10% | | 394 | | 11% | | 71 | | 11% | | 1,178 |
| 2016 | | 785 | | 10% | | 393 | | —% | | 81 | | 14% | | 1,259 |
| 2017 | | 852 | | 9% | | 356 | | (9)% | | 93 | | 15% | | 1,301 |
| Annual Data - Forecast | | | | | | | | | | | | | | |
| 2018 | | 885 | | 4% | | 383 | | 8% | | 105 | | 13% | | 1,373 |
| 2019 | | 927 | | 5% | | 366 | | (4)% | | 115 | | 10% | | 1,408 |
| 2020 | | 979 | | 6% | | 364 | | (1)% | | 125 | | 9% | | 1,468 |
The following table presents calendar-year annual window shipments information as of November 2018, derived from reports published by Ducker Worldwide LLC, a consulting and research firm, (unitsindicated in thousands):November 2021 that window shipments in the residential remodeling and replacement (R&R) market are expected to increase approximately 4.5% for the calendar-year 2021 and approximately 4% in 2022 and 3% during 2023. Derived from reports published by Ducker, the overall increase in window shipments for the trailing twelve months ended September 30, 2021 was 8.9%. During this period, new construction activity increased 14.2% and R&R replacement increased 4.7% respectively.
|
| | | | | | | | | | | | | | | | | | | | | | | | |
| | | New Construction | | Remodeling & Replacement |
| Period | | Wood | | Aluminum | | Vinyl | | Fiberglass | | Other | | Total | | Wood | | Aluminum | | Vinyl | | Fiberglass | | Other | | Total |
| Annual Data | | | | | | | | | | | | | | | | | | | | | | | | |
| 2012 | | 2,736 | | 2,516 | | 8,625 | | 592 | | 237 | | 14,706 | | 4,566 | | 696 | | 18,902 | | 657 | | 594 | | 25,415 |
| 2013 | | 2,989 | | 3,077 | | 10,585 | | 668 | | 264 | | 17,583 | | 4,739 | | 658 | | 19,588 | | 685 | | 658 | | 26,328 |
| 2014 | | 3,108 | | 3,471 | | 11,651 | | 728 | | 291 | | 19,249 | | 4,697 | | 718 | | 19,972 | | 698 | | 677 | | 26,762 |
| 2015 | | 2,911 | | 3,470 | | 12,925 | | 793 | | 358 | | 20,457 | | 4,324 | | 562 | | 20,742 | | 766 | | 740 | | 27,134 |
| 2016 | | 3,028 | | 3,432 | | 13,690 | | 909 | | 355 | | 21,414 | | 4,225 | | 573 | | 21,302 | | 781 | | 759 | | 27,640 |
| 2017 | | 3,109 | | 3,525 | | 14,648 | | 984 | | 391 | | 22,657 | | 4,122 | | 573 | | 21,719 | | 810 | | 955 | | 28,179 |
| Annual Data - Forecast | | | | | | | | | | | | | | | | | | | | | | | | |
| 2018 | | 3,199 | | 3,430 | | 15,551 | | 1,112 | | 402 | | 23,694 | | 4,163 | | 558 | | 22,268 | | 858 | | 1,007 | | 28,854 |
| 2019 | | 3,258 | | 3,423 | | 16,155 | | 1,198 | | 416 | | 24,450 | | 4,228 | | 545 | | 22,966 | | 914 | | 1,067 | | 29,720 |
| 2020 | | 3,320 | | 3,541 | | 16,765 | | 1,240 | | 430 | | 25,296 | | 4,294 | | 531 | | 23,686 | | 972 | | 1,130 | | 30,613 |
According to data from Catalina Research, a consulting and research firm, total United StatesU.S. residential cabinet demand is expected to increase annually through 2020. Projections2022. Projections from Catalina Research as of September 2018November 2021 include growth rates for the stock, semi-custom (the cabinet market we primarily operate in) and custom cabinet markets, which are presented in the table below:
|
| | | | | | | | |
| Cabinet Market Annual Growth Rates |
| Period | | Stock | | Semi-Custom(1) | | Custom | | Overall |
| Annual Data | | | | | | | | |
| 2012 | | (4.9)% | | 10.0% | | 5.3% | | 1.7% |
| 2013 | | 28.9% | | 5.7% | | 6.3% | | 17.0% |
| 2014 | | 16.6% | | (15.6)% | | (10.0)% | | 2.3% |
| 2015 | | 16.7% | | 10.1% | | 21.6% | | 15.4% |
| 2016 | | 5.3% | | 1.0% | | 8.1% | | 4.4% |
| 2017 | | 7.3% | | 5.7% | | (0.3)% | | 6.0% |
| Annual Data - Forecast | | | | | | | | |
| 2018 | | 6.0% | | 2.7% | | 3.9% | | 4.9% |
| 2019 | | 5.7% | | 2.7% | | 4.3% | | 4.8% |
| 2020 | | 5.4% | | 3.0% | | 4.7% | | 4.7% |
(1)We operate primarily in the semi-custom cabinet market. | | | | | | | | | | | | | | | | | | | | | | | | | | |
| Cabinet Market Annual Growth Rates |
| Period | | Stock | | Semi-Custom | | Custom | | Overall |
| Annual Data | | | | | | | | |
| | | | | | | | |
| | | | | | | | |
| | | | | | | | |
| | | | | | | | |
| 2017 | | 8.5% | | 5.7% | | (0.9)% | | 6.6% |
| 2018 | | 7.9% | | (1.6)% | | 3.8% | | 4.9% |
| 2019 | | 1.8% | | (4.9)% | | 1.1% | | —% |
| 2020 | | 3.7% | | (1.3)% | | 0.3% | | 2.2% |
| Annual Data - Forecast | | | | | | | | |
| 2021 | | 15.2% | | 13.4% | | 17.5% | | 15.0% |
| 2022 | | 7.2% | | 5.2% | | 4.7% | | 6.5% |
We have noted the following trends which we believe affect our industry:
the number of housing starts and window shipments in the United States has increased in recent years following a dramatic decline from 2007 through 2011. The NAHB expects this trend to continue for the next several years, which should result in higher demand for our fenestration and kitchen and bathroom cabinet door products;
•the recent growth in the housing market over the past several years has been predominately in new construction which has outpaced the growth in the residential remodeling and replacement sector;
the recovery of the housing market has slowed due primarily to the declining growth of multi-family units;
•programs in the United StatesU.S. such as Energy Star have improved customer awareness of the technological advances in window and door energy-efficiency, but the government has been reluctant to enforce stricter energy standards;
•supply chain disruptions and inflationary pressures related to transportation, labor, and raw materials have increased causing delays in production and higher prices;
•foreign currency rates in the United KingdomU.K. and other European nations have changed significantly relative to the United States Dollar due in part to Brexit in the United Kingdom,U.K., as well as other international unrest or uncertainties;
•commodity prices have fluctuated in recent years, and to the extent we cannot pass this cost to our customers, this impacts the cost of critical materials used in our manufacturing processes such as resin, which affects margins related to our vinyl extrusion products; oil products such as butyl, which affects our insulating glass products; and aluminum, wood and silicone products used by our other businesses; and
•higher energy efficiency standards in Europe should favorably impact sales of our insulating glass spacer products in
the short- to mid-term.
Strategy
Our vision is to be the preferred supplier to our customers in each market we serve. Our strategy to achieve this vision includes the following:
•focus on organic growth with our current customer base and expand our market share with national and regional customers by providing: (1) a quality product; (2) a high level of customer service; (3) product choices at different price points; and (4) new products or enhancements to existing product offerings. These enhancements may include higher thermal efficiency, enhanced functionality, improved weatherability, better appearance and best-in-class quality for our fenestration and cabinet door products;
•realize improved profitability in our manufacturing processes through: (1) ongoing preventive maintenance programs; (2) better utilization of our capacity by focusing on operational efficiencies and reducing scrap; (3) marketing our value added products; and (4) focusing on employee safety;
•offer logisticlogistics solutions that provide our customers with just-in-time service which can reduce their processing costs;
•recognizing the importance of sustainability and corporate social responsibility by continually looking for ways to reduce our environmental impact, protect the health and safety of our employees and communities, and engage diverse workers and leaders;
•pursue targeted business acquisitions that allow us to expand our existing footprint, enhance our existing product offerings, acquire complementary technology, enhance our leadership position within the markets we serve, and expand into adjacent markets or service lines; and
•exit unprofitable service lines or customer relationships.
Our Strengths
We believe our strengths include design expertise, new technology development capability, high quality manufacturing, just-in-time delivery systems, customer service and the ability to generate unique patented products and participation in industry advocacy.products.
Raw Materials and Supplies
We purchase a diverse range of raw materials, which include PVC resin, epoxy resin, butyl, titanium dioxide (TiO2)(TiO2) desiccant powder, silicone and EPDM rubber compounds, coated and uncoated aluminum sheet and wood (both hardwood and softwood). These raw materials are generally available from several suppliers at market prices. We may enter into sole sourcing arrangements with our suppliers from time to time if we believe we can realize beneficial savings, but only after we have determined that the vendor can reliably supply our raw material requirements. These sole sourcing arrangements generally have termination clauses to protect us if a sole sourced vendor could not provide raw materials timely and on economically feasible terms. We believe there are other qualified suppliers from which we could purchase raw materials and supplies.
Competition
Our products are sold under highly competitive conditions. We compete with a number of companies, some of which have greater financial resources than us. We believe the primary competitive factors in the markets we serve include price, product quality, delivery and the ability to manufacture to customer specifications. The volume of engineered building products that we manufacture represents a small percentage of annual domestic consumption. Similarly, our subsidiaries in the United KingdomU.K. compete against some larger vinyl producers and smaller window manufacturers. For our kitchen and bathroom cabinet door business, we believe we are the largest supplier to OEMs in the United States,U.S., but we compete with other national and regional businesses, including OEMs who are vertically integrated.
We compete against a range of small and mid-size metal, vinyl and wood products suppliers, wood molding companies, and the in-house operations of customers who have vertically integrated fenestration operations. We also compete against insulating glass (IG) spacer manufacturing firms. IG systems are used in numerous end markets including residential housing, commercial construction, appliances and transportation vehicles, but we primarily serve the residential housing market. Competition is largely based on regional presence, custom engineering, product development, quality, service and price. Primary competitors include, but are not limited to, Veka, Deceuninck, Energi, Vision Extrusions, GED Integrated Solutions, Technoform, Swiss Spacer, Thermix, RiteScreen, Allmetal, Endura, Klinger, Thermoseal and Endura. Fenzi Group. Competitors in the vinyl extrusion business in the United KingdomU.K. include Epwin, Veka, Synseal,Profine UK Extrustions Ltd., Eurocell and others. Primary competitors in the cabinet door business in the United StatesU.S. include Conestoga, Decore-ative Specialties,Appalachian Wood, Olon, Northern Contours and others.
Sales, Marketing, and Distribution
We sell our products to customers in various countries. Therefore, we have sales representatives whose territories essentially cover the United States,U.S., Canada, Europe, and to a lesser extent, the Middle East, Latin and South America, Australia, New Zealand and Asia. Our sales force is tasked with selling and marketing our complete range of components, products and systems to national and regional OEMs through a direct sales force in North America and Europe, supplemented with the limited use of distributors and independent sales agents.
Customers
Certain of our businesses or product lines are largely dependent on a relatively few large customers. See Note 1, "Nature“Nature of Operations, Basis of Presentation and Significant Accounting Policies - Concentration of Credit Risk and Allowance for Doubtful Accounts,"Credit Losses,” of the accompanying financial statements in this Annual Report on Form 10-K for related disclosure.
Sales Backlog
Given the short lead times involved in our business, we have a relatively low backlog approximately $20of approximately $83 million as of October 31, 2018.2021. The criteria for revenue recognition has not been met with regard to sales backlog, and therefore, we havehave not recorded revenue or deferred revenue pursuant to these sales orders. If these sales orders result in a sale, we will record revenue during fiscal 20192022 in accordance with our revenue recognition accounting policy.
Seasonal Nature of Business
Our business is impacted by seasonality. We have historically experienced lower sales for our products during the first half of our fiscal year as winter weather reduces homebuilding and home improvement activity. Our operating income tends to decline during this period of lower sales because a higher percentage of our operating expenses are fixed overhead. We typically experience more favorable results in the third and fourth quarters of the fiscal year. Our exposure to seasonality was somewhat tempered with the entry into the kitchen and bathroom cabinet door industry, which is focused "inside the house" and less susceptible to inclement weather. Expenses for labor and other costs are generally semi-variable throughout the year.
Working Capital
We fund operations through a combination of available cash and cash equivalents, cash flow generated from our operations, and borrowings from our revolving credit facility. We extend credit to our domestic customers in the ordinary course of business generally for a term of 30 days, while the terms for our international customers vary from cash advances to 90 days. Inventories of raw materials are carried in quantities deemed necessary to ensure a smooth production process, some of which are governed by consignment agreements with suppliers. We strive to maintain minimal finished goods inventories, while ensuring an adequate supply on hand to service customer needs.
Service Marks, Trademarks, Trade Names, and Patents
Our federally registered trademarks or service marks include QUANEX, QUANEX and design, "Q"“Q” design, TRUSEAL TECHNOLOGIES, DURASEAL, DURALITE, SOLARGAIN, EDGE TAPE, ENVIROSEALED WINDOWS, EDGETHERM, COLONIAL CRAFT, EDGETECH, ECOBLEND, SUPER SPACER, TSS, TRUE WARM, E & Design, QUIET EDGE, HEALTH SMART WINDOWS, ENERGY WISE WINDOWS, DESI-ROPE, 360 and design, INTELLICLIP, SUSTAINAVIEW, MIKRON, MIKRONWOOD, MIKRONBLEND, MIKRON BLEND and design, ENERGYCORE, FUSION INSULATED SYSTEM, AIRCELL, SUPERCOAT, SUPERCAP, STYLELOCK, STYLELOCK and design, K2 MIKRON and design, HOMESHIELD, HOMESHIELD and design, STORM SEAL, and TENON. We consider the following marks, design marks and associated trade names to be valuable in the conduct of our business: HOMESHIELD, COLONIAL CRAFT, TRUSEAL TECHNOLOGIES, EDGETECH, MIKRON,
WOODCRAFT and QUANEX. Through HLP,Liniar, we hold a number of registered designs, patents and trademarks registered in the United Kingdom,U.K., which include: MODLOK, LINIAR, SUPERCUT,SUPER CUT, ENERGY PLUS & Device, FLAMSTEAD HOLDINGS & Device, HL PLASTICS & Device, VINTAGE WINDOWS & Device, RESURGENCE, FUSE, ELEVATE, SWITCHBOARD and various other trademarks and patents which are pending approval. Generally, our business does not depend on patent protection, but patents obtained with regard to our vinyl extrusion products and processes, fabricated metal components and IG spacer products business remain a valuable competitive advantage over other building products manufacturers. We obtain patent protection for various diesdyes and other tooling created in connection with the production of customer-specific vinyl profile designs and vinyl extrusions. Our fabricated metal components business obtains patent protection for its thresholds. Our window sealant business unit relies on patents to protect the design of several of its window spacer products. Although we hold numerous patents, the proprietary process technology that has been developed is also considered a source of competitive advantage.
Environmental and Employee Safety Matters
We are subject to extensive laws and regulations concerning worker safety, the discharge of materials into the environment and the remediation of chemical contamination. To satisfy such requirements, we must make capital and other expenditures on an on-goingongoing basis. The cost of worker safety and environmental matters has not had a material adverse effect on our operations or financial condition in the past, and we are not currently aware of any existing conditions that we believe are likely to have a material adverse effect on our operations, financial condition, or cash flows.
Safety and Environmental Policies
For many years, we have maintained compliance policies that are designed to help protect our workforce, to identify and reduce the potential for job-related accidents, and to minimize liabilities and other financial impacts related to worker safety and environmental issues. These policies include extensive employee training and education, as well as internal policies embodied in our Code of Business Conduct and Ethics. We have a Director of Environmental, Health and Safety and maintain a company-wide committee, comprising leaders from across the organization, which meets regularly to discuss safety issues and drive safety improvements. We plan to continue to focus on safety in particular as a core strategy to improve our operational efficiency and financial performance.
Remediation
Under applicable state and federal laws, we may be responsible for, among other things, all or part of the costs required to remove or remediate wastes or hazardous substances at locations we, or our predecessors, have owned or operated. From time to time, we also have been alleged to be liable for all or part of the costs incurred to clean up third-party sites where there might have been an alleged improper disposal of hazardous substances. At present, we are not involved in any such matters.
Environmental Compliance Costs
From time to time, we incur routine expenses and capital expenditures associated with compliance with existing environmental regulations, including control of air emissions and water discharges, and plant decommissioning costs. We have not incurred any material expenses or capital expenditures related to environmental matters during the past three fiscal years, and do not expect to incur a material amount of such costs in fiscal 2019.2022. While we will continue to have future expenditures related to environmental matters, any such amounts are impossible to reasonably estimate at this time. Based upon our experience to date, we do not believe that our compliance with environmental requirements will have a material adverse effect on our operations, financial condition or cash flows.
Human Capital
We track human capital metrics that we consider to be key to our business, including employee headcount, temporary workers, health and safety, and turnover.As of October 31, 2018,2021, we had 3,8183,860 employees. Of these employees, 3,1623,083 were domiciled in the United States, 573U.S., 665 in the United Kingdom,U.K., and 83112 in Germany. Generally, the total number of employees of Quanex and its subsidiaries does not significantly fluctuate throughout the year. Currently, none of our employees are subject to collective bargaining agreements.
Employee turnover rates are monitored monthly at the division and plant levels. Both voluntary and involuntary terminations, including retirements, are used to calculate the turnover rate. Our human capital objectives include attracting, developing, motivating, rewarding, and retaining our existing and new employees. We offer our employees online training courses and on-the-job training on job duties, safety requirements, and leadership skills. The health and safety of our employees is our high priority and in particular, in response to the COVID-19 pandemic. We have taken additional measures to limit possible infections at the workplace. See Part 2 Item 7, “Management's Discussion and Analysis of Financial Condition and Results of Operations - Notable Items - COVID-19 Impacts,” elsewhere in this Annual Report on Form 10-K for related disclosure.
For Investors
We periodically file or furnish documents to the Securities and Exchange Commission (SEC), including our Annual Reports on Form 10-K, Quarterly Reports on Form 10-Q, Current Reports on Form 8-K and other reports as required. These reports are also available free of charge from the Investor Relations Section of our website at http://www.quanex.com,, as soon as reasonably practicable after we file such material or furnish it to the SEC. As permitted by the SEC rules, we post relevant information on our website. However, the information contained on our website is not incorporated by reference into this Annual Report on Form 10-K and should not be considered part of this report.
Item 1A. Risk Factors.
The following risk factors, along with other information contained elsewhere in this Annual Report on Form 10-K and our other public filings with the SEC, should be carefully considered before deciding to invest in our securities. Additional risks and uncertainties that are not currently known to us or that we may view as immaterial could impair our business if such risks were to develop into actual events. Therefore, any of these risks could have a material adverse effect on our financial condition, results of operations and cash flows. This listing of risk factors is not all-inclusive and is not necessarily presented in order of importance.
Industry Risks
Any sustained decline in residential remodeling, replacement activities, or housing starts could have a material adverse effect on our business, financial condition and results of operations.
The primary drivers of our business are residential remodeling, replacement activities and housing starts. The home building and residential construction industry is cyclical and seasonal, and product demand is based on numerous factors such as interest rates, general economic conditions, consumer confidence and other factors beyond our control. Declines in the number of housing starts and remodeling expenditures resulting from such factors could have a material adverse effect on our business, results of operations and financial condition.
If the availability of critical raw materials were to become scarce or if the price of these items were to increase significantly, we might not be able to timely produce products for our customers or maintain our profit levels.
We purchase from outside sources significant amounts of raw materials, such as butyl, titanium dioxide, vinyl resin, aluminum, steel, silicone and wood products for use in our manufacturing facilities. Because we do not have long-term contracts for the supply of many of our raw materials, their availability and price are subject to market fluctuation and may be subject to curtailment or change. Any of these factors could affect our ability to timely and cost-effectively manufacture products for our customers.
Compliance with, or liabilities under, existing or future environmental laws and regulations could significantly increase our costs of doing business.
We are subject to extensive federal, state and local laws and regulations concerning the discharge of materials into the environment and the prevention and/or remediation of chemical contamination. To satisfy such requirements, we must make capital and other expenditures on an on-goingongoing basis. Future expenditures relating to environmental matters will necessarily depend upon whether such regulations and future governmental decisions or interpretations of these regulations apply to us and our facilities. It is likely that we will be subject to increasingly stringent environmental standards, and we will incur additional expenditures to comply with such standards. Furthermore, if we fail to comply with applicable environmental regulations, we could be subject to substantial fines or penalties and to civil and criminal liability.
Our goodwill and indefinite-lived intangible assets may become impaired and could result in a charge to income.
We evaluate our goodwill and indefinite-lived intangible assets at least annually to determine whether we must test for impairment. In making this assessment, we must use judgment to make estimates of future operating results and appropriate residual values. Actual future operating results and residual values associated with our operations could differ significantly from these estimates, which may result in an impairment charge in a future period, resulting in a decrease in net income from operations in the year of the impairment, as well as a decline in our recorded net worth. We recorded a goodwill impairment chargecharges in 20162019 and could record future impairment charges. Goodwill totaled $219.6$149.2 million at October 31, 2018.2021. The results of goodwill impairment testing are described in the accompanying notes to the audited financial statements, Note 6, "Goodwill“Goodwill and Intangible Assets" included elsewhereAssets” of the accompanying financial statements in this Annual Report on Form 10-K.
We may not be able to protect our intellectual property.
We rely on a combination of copyright, patent, trade secrets, confidentiality procedures and contractual commitments to protect our proprietary information. However, these measures can only provide limited protection and unauthorized third parties may try to copy or reverse engineer portions of our products or may otherwise obtain and use our intellectual property. If we cannot protect our proprietary information against unauthorized use, we may not be able to retain a perceived competitive advantage and we may lose sales to the infringing sellers, which may have a material adverse effect on our financial condition, results of operations and cash flows.
We are subject to various existing and contemplated laws, regulations and government initiatives that may materially impact the demand for our products, our profitability or our costs of doing business.
Our business may be materially impacted by various governmental laws, regulations and initiatives that may artificially create, deflate, accelerate, or decelerate consumer demand for our products. For example, when the government issues tax credits designed to encourage increased homebuilding or energy-efficient window purchases, the credits may create a spike in demand that would not otherwise have occurred and our production capabilities may not be able to keep pace, which could materially impact our profitability. Likewise, when such laws, regulations or initiatives expire, our business may experience a material loss in sales volume or an increase in production costs as a result of the decline in consumer demand.
Our operations outside the United StatesU.S. require us to comply with a number of United StatesU.S. and international anti-corruption regulations, violations of which could have a material adverse effect on our consolidated results of operations and consolidated financial condition.
Our international operations require us to comply with a number of United StatesU.S. and international regulations, including the Foreign Corrupt Practices Act (FCPA) and the United Kingdom Bribery Act 2010. While we have implemented appropriate training and compliance programs to prevent violations of these anti-bribery regulations, we cannot ensure that our policies, procedures and programs will always protect us from reckless or criminal acts committed by our employees or agents. Allegations of violations of applicable anti-corruption laws, may result in internal, independent, or government investigations, and violations of anti-corruption laws may result in severe criminal or civil sanctions or other liabilities which could have a material adverse effect on our business, consolidated results of operations and financial condition.
DueOur operations within the U.K. may be negatively affected as a result of the U.K.'s exit from the European Union (E.U.), (commonly referred to the fact that weas Brexit).
We have operations located within the United Kingdom (UK)U.K., and as such, our business and financial results may be negatively impacted as a result of the UK's planned exit from the European Union (EU),Brexit, resulting primarily from (a) continued depression in the value of the British Pound Sterling as compared to the United States Dollar; and (b) potential price increases foror unavailability of supplies purchased by our UKU.K. businesses from companies located in the EUE.U. or elsewhere. These risks would be heightened in the event that the UK and the EU are unable to reach a mutually satisfactory exit agreement before the current deadline of March 29, 2019.
Following the UK’s vote to leave the EU in 2016 (commonly referred to as Brexit), the value of the British Pound Sterling incurred significant fluctuations. Additionally, further actions related to Brexit may occur in the future. If the value of the British Pound Sterling continues to incur similar fluctuations, fluctuate as a result of Brexit,
unfavorable exchange rate changes may negatively affect the value of our operations and businesses located in the UK,U.K., as translated to our reporting currency, the United States Dollar, in accordance with USU.S. GAAP, which may impact the revenue and earnings we report. For more information with respect to Exchange Rate risk applicable to us, please see Part 2 Item 7A. "Market“Market Risk Disclosures"Disclosures,” elsewhere in this Annual Report on Form 10-K. Continued fluctuations in the British Pound Sterling may also result in the imposition of price adjustments by EU-basedE.U.-based suppliers to our UKU.K. businesses, as those suppliers seek to compensate for the changes in value of the British Pound Sterling as compared to the European Euro. In addition, a so-called “Hard Brexit,” where no formal agreement is made between the EU and UK prior to the UK’s exit, could result in a continued deflation of the British Pound Sterling; additional increases in prices, fees, taxes or tariffs applicable to goods that are bought and sold between the UK and Europe, and a negative impact on end markets in the UK as a result of declines in consumer sentiment or decreased immigration rates into the UK. Any of these results could have a material adverse effect on the business, revenues and financial condition of our UK and European operations.
Failure to achieve and maintain effective internal controls could have a material adverse effect on our business and on our stock price.
Effective internal controls are necessary for us to effectively monitor our business, prevent fraud or theft, remain in compliance with our credit facility covenants, and provide reliable financial reports, both to the public and to our lenders. If we fail to maintain the adequacy of our internal controls, both in accordance with current standards and as standards are modified over time, we could trigger an event of default under our credit facilities or lose the confidence of the investing community, both of which could result in a material adverse effect on our stock price, limit our ability to borrow funds, or result in the application of unfavorable commercial terms to borrowings then outstanding.
The impact of foreign trade relations and associated tariffs could adversely impact our business.
We currently source a number of raw materials from international suppliers. Import tariffs, taxes, customs duties and/or other trading regulations imposed by the United StatesU.S. government on foreign countries, or by foreign countries on the United States,U.S., could significantly increase the prices we pay for certain raw materials, such as aluminum and wood, that are critical to our ability to manufacture our products. In addition, we may be unable to find a domestic supplier to provide the necessary raw materials on an economical basis in the amounts we require. If the cost of our raw materials increases, or if we are unable to procure the necessary raw materials required to manufacture our products, then we could experience a negative impact on our operating results, profitability, customer relationships and future cash flows.
Company Risks
Our business will suffer if we are unable to adequately address potential supplier or customer pricing pressures, both with respect to OEMs that have significant pricing leverage over suppliers, and to large suppliers who have significant pricing leverage over ourtheir customers.
Our primary customers are OEMs, who have substantial leverage in setting purchasing and payment terms. In addition, many of our suppliers are large international conglomerates with numerous customers that are much larger than us, which lessens our leverage in pricing and supply negotiations. We attempt to manage this pricing pressure and to preserve our business relationships with suppliers and OEMs by negotiating reasonable price concessions when needed, and by reducing our production costs through various measures, which may include managing our purchase process to control the cost of our raw materials and components, maintaining multiple supply sources where possible, and implementing cost-effective process improvements. However, our efforts in this regard may not be successful and our operating margins could be negatively impacted.
Our revenues could decline or we may lose business if our customers vertically integrate their operations, diversify their supplier base, or transfer manufacturing capacity to other regions.
Certain of our businesses or product lines are largely dependent on a relatively few large customers. For example, the revenues of our United States vinyl business declined significantly in 2017 as a result of shedding less profitable business with one such OEM. Although we believe we have an extensive customer base, if we were to lose one of these large customers or if one such customer were to materially reduce its purchases as a result of vertical integration, supplier diversification, or a shift in regional focus, our revenue, general financial condition and results of operations could be adversely affected.
Our credit facility contains certain operational restrictions, reporting requirements, and financial covenants that limit the aggregate availability of funds.
Our revolving credit facility contains certain financial covenants and other operating and reporting requirements that could present risk to our operating results or limit our ability to access capital for use in the business. For a full discussion of the various covenants and operating requirements imposed by our revolving credit facility and information related to the potential limitations on our ability to access capital, see Item 7, Management’s“Management’s Discussion and Analysis of Financial Conditions and Results of Operations-Liquidity and Capital Resources,,” included elsewhere in this Annual Report on Form 10-K.
We may not be able to successfully manage or integrate acquisitions, and if we are unable to do so, then our profitability could be adversely affected.
We cannot provide assurance that we will successfully manage or integrate acquisition targets once we have purchased them. If we acquire a business for which we do not fully understand or appreciate the specific business risks, if we overvalue or fail to conduct effective due diligence on an acquisition, or if we fail to effectively and efficiently integrate a business that we acquire, then there could be a material adverse effect on our ability to achieve the projected growth and cash flow goals associated with the new business, which could result in an overall material adverse effect on our long-term profitability or revenue generation.
If our information technology systems fail, or if we experience an interruption in our operations due to an aging information system infrastructure, then our results of operations and financial condition could be materially adversely affected.
The failure of our information technology systems, our inability to successfully maintain, enhance and/or replace our information technology systems when necessary, or a significant compromise of the integrity or security of the data that is generated from our information technology systems, could adversely affect our results of operations and could disrupt business and prevent or severely limit our ability to respond to data requests from our customers, suppliers, auditors, shareholders, employees or government authorities.
We are subject to data security and privacy risks that could negatively affect our results or operations.
In addition to our own sensitive and proprietary business information, we collect transactional and personal information about our customers and employees. Any breach, including ransomware attacks or other cybersecurity breaches, of our or our service providers’ network or other vendor systems, may result in the loss of confidential business and financial data, misappropriation of our consumers’ or employees’ personal information or a disruption of our business. Any of these outcomes could have a material adverse effect on our business or our vendor and customer relationships, and could also result in unwanted media attention, reputational damage, or the imposition of fines, lawsuits, or significant legal or remediation expenses.
Epidemics, pandemics or other disease outbreaks could significantly disrupt our operations or those of our customers or suppliers.
If the COVID-19 coronavirus continues to disrupt the worldwide economy, or if similar widespread disease outbreaks occur in the future, our business, financial condition and results of operations could be negatively affected to the extent such event harms the economy or region in which we operate.
Our business could be materially and adversely affected by the occurrence of a widespread health epidemic or pandemic. In particular, any outbreak or resurgence of COVID-19 such as the increased presence and spread of the Omicon variant, Delta variant or any other future variants, or governmental imposition of mandatory or voluntary closures in areas where our manufacturing facilities, suppliers or customers are located, could severely disrupt our operations and result in (a) plant slowdowns or shutdowns, (b) difficulty obtaining necessary supplies, and (c) reduced customer orders and revenues. In addition to this potential direct impact on our facilities and operations, continuing outbreaks of the virus could negatively impact our industry and end markets as a whole, or result in a longer-term economic recession. Any of these factors could negatively affect our business, financial condition, cash flows, profitability, and results of operations.
The COVID-19 pandemic has had and may continue to create inefficiencies or interruptions in the supply chain as our suppliers may be forced to close their own plants or prove unable to obtain their own raw materials. If our suppliers are unable to timely meet our supply needs, it could impact our ability to provide our customers with high quality products on a timely basis, which could result in order cancellations, delivery refusals, price concessions, or other negative customer outcomes, any
of which could negatively impact our business, revenues, financial condition, results of operations and liquidity. We could also be forced to pay higher prices for the supplies we purchase, which could negatively impact our results of operations and profitability.
We may not have the right personnel in place to achieve our operating goals, and the rural location of some of our operations may make it difficult to locate or hire highly skilled employees.
We operate in some rural areas and small towns where the competition for labor can be fierce, and where the pool of qualified employees may be very small. If we are unable to obtain or retain skilled workers and adequately trained professionals to conduct our business, we may not be able to manage our business to the necessary high standards. In addition, we may be forced to pay higher wages or offer other benefits that might impact our cost of labor and thereby negatively impact our profitability.
Equipment failures or catastrophic loss at any of our manufacturing facilities could prevent us from manufacturingproducing our products.
An interruption in production capabilities at any of our facilities due to equipment failure, catastrophic loss, or other reasons could result in our inability to manufacture products, which could severely affect delivery times, return or cancellation rates, and future sales, any of which could result in lower sales and earnings or the loss of customers. Although we have a disaster recovery plan in place, we currently have one plant which is the sole source for our insulating glass spacer business in the United States.U.S. If that plant were to experience a catastrophic loss and our disaster recovery plan were to fail, it could have a material adverse effect on our results of operations or financial condition.
Product liability claims and product replacements could harm our reputation, revenue generation and financial condition, or could result in costs related to litigation, warranty claims, or customer accommodations.
We have, on occasion, found flaws and deficiencies in the manufacturing, design, testing or installation of our products, which may result from a product defect, a defect in a component part provided by our suppliers, or as a result of the product being installed incorrectly by our customer or an end user. The failure of products before or after installation could result in litigation or claims by our customers or other users of the products, or in the expenditure of costs related to warranty coverage, claim settlement, litigation, or customer accommodation. In addition, we are currently party to certain legal claims related to a commercial sealant product, and there is no assurance that we will prevail on those claims. We may be required to expend legal fees, expert costs, and other costs associated with defending the claims and/or lawsuits. We may elect to enter into legal settlements or be forced to pay any judgments that result from an adverse court decision. Any such settlements, judgments, fees and/or costs could negatively impact our profitability, results of operations, cash flows and financial condition.
Our insurance coverage may be inapplicable or inadequate to cover certain liabilities, and our insurance policies may exclude coverage for certain products.
matters.
While we maintain a robust insurance program that is reasonably designed to cover our known and unknown risks, there is no assurance that our insurance carriers will voluntarily agree to cover every potential liability, or that our insurance policies include limits largehigh enough to cover all liabilities associated with our business or products. In addition, coverage under our insurance policies may be unavailable in the future for certain products. For example, during a prior renewal of our insurance program, our insurance carriers excluded future coverage of a product line we no longer manufacture or sell. If our insurers refuse to cover claims, in whole or in part, or if we exhaust our available insurance coverage at some point in the future, then we might be forced to expend legal fees and settlement or judgment costs, which could negatively impact our profitability, results of operations, cash flows and financial condition.
Climate change and related extreme weather events could disrupt our supply chain, decrease customer demand for our products, or damage our manufacturing facilities.
We, along with many of our customers and suppliers, operate manufacturing facilities in areas at risk for extreme weather events such as hurricanes, tornadoes, drought, wildfires, winter storms, or floods. Ongoing climate change has increased the frequency and severity of these events and the related risk of a catastrophic weather event affecting one of our plants, or a plant owned by one of our customers or suppliers. If such an event occurs at a facility belonging to one of our customers, we could see reduced demand for our products. If such an event occurs at a facility belonging to us or one of our suppliers, we may be unable to timely and cost-effectively manufacture products for our customers. These declines in demand or impacts to our ability to manufacture our products could negatively impact our revenues, earnings, cash flow, and other operating results.
Changes in taxation as well as the inherent difficulty in quantifying potential tax effects of business decisions could have a material adverse effect on the results of our operations, financial condition, or cash flows.
We file income tax returns, including tax returns for our subsidiaries, with federal, state, local, and foreign jurisdictions. We consider the United States to be our most significant jurisdiction; however, all tax returns are subject to routine compliance review by the taxing authorities in the jurisdictions in which we file tax returns in the ordinary course of business. We make judgments regarding the utilization of existing deferred tax assets and the potential tax effects of various financial transactions and results of operations to estimate our obligations to taxing authorities. Tax obligations include income, franchise, real estate, sales and use, and employment-related taxes. These judgments include reserves for potential adverse outcomes regarding tax positions that have been taken. Changes in federal, state, or local tax laws, adverse tax audit results, or adverse tax rulings on positions taken could have a material adverse effect on the results of our operations, financial condition, or cash flows.
Risks Associated with Investment in Quanex Securities
Our corporate governance documents and the provisions of Delaware law may delay or preclude a business acquisition or divestiture that stockholders may consider to be favorable, which might result in a decrease in the value of our common shares.
Our certificate of incorporation and bylaws and Delaware law contain provisions that could make it more difficult for a third party to acquire us without the consent of our Board of Directors. These provisions include restrictions on the ability of our stockholders to remove directors and supermajority voting requirements for stockholders to amend our organizational documents and limitations on action by our stockholders by written consent. In addition, our Board of Directors has the right to issue preferred stock without stockholder approval, which could be used to dilute the stock ownership of a potential hostile acquirer. Although we believe these provisions protect our stockholders from coercive or otherwise unfair takeover tactics, and thereby provide for an opportunity for us to receive a higher bid by requiring potential acquirers to negotiate with our Board of Directors, these provisions apply even if the offer may be considered beneficial by some stockholders.
We have the ability to issue additional equity securities, which would lead to dilution of our issued and outstanding common stock.
We are authorized to issue, without stockholder approval, 1,000,000 shares of preferred stock, no par value, in one or more series, which may give other stockholders dividend, conversion, voting, and liquidation rights, among other rights, which may be superior to the rights of holders of our common stock. The issuance of additional equity securities or securities convertible into equity securities would result in dilution of existing stockholders' equity interests. Our Board of Directors has no present intention to issue any such preferred shares, but has the right to do so in the future. In addition, we were authorized, by prior stockholder approval, to issue up to 125,000,000 shares of our common stock, $0.01 par value per share, of which 37,433,81737,273,510 were issued at October 31, 2018.2021. These authorized shares can be issued, without stockholder approval, as securities convertible into either common stock or preferred stock.
Item 1B. Unresolved Staff Comments.
None.
Item 2. Properties.
The following table lists our principal properties by location, general character and use as of October 31, 2018. These properties are owned by us, unless indicated otherwise.
| | | | | | | | |
| Location | | Character & Use of Property |
| Executive Offices | | |
| Houston, Texas* | | Executive corporate office |
| North American Fenestration Segment | | |
| Akron, Ohio* | | Segment executive office and R&D facility |
| Rice Lake, Wisconsin | | Fenestration products |
| | |
| | |
Location | | Character & Use of Property |
Executive Offices | | |
Houston, Texas (Lease expires 2023)Cambridge, Ohio* | | Executive corporate office |
NA Engineered Components Segment | | |
Rice Lake, Wisconsin | | Fenestration products |
Chatsworth, Illinois | | Fenestration products |
Richmond, Indiana | | Fenestration products |
Dubuque, Iowa (Lease expires 2018) | | Fenestration products |
Akron, Ohio (Lease expires 2026) | | Flexible spacer, and adhesive research and sales |
Cambridge, Ohio, (Lease expires 2032) | | Flexible spacer and solar adhesives |
| Richmond, Kentucky | | Vinyl and composite extrusions |
Winnebago, Illinois | | Vinyl extrusions |
Kent, Washington (Lease expires 2020)Washington* | | Vinyl and composite extrusions |
Durham, North Carolina (Lease expires 2021) | | Division executive offices |
Sacramento, California (Lease expires 2021) | | Screens for vinyl windows and doors |
Dallas, Texas (Lease expires 2022) | | Screens for vinyl windows and doors |
Des Moines, Iowa (Lease expires 2019) | | Screens for vinyl windows and doors |
Phoenix, Arizona (Lease expires 2023) | | Screens for vinyl windows and doors |
Denver, Colorado (Lease expires 2020) | | Screens for vinyl windows and doors |
Paris, Illinois (Lease expires 2019) | | Screens for vinyl windows and doors |
Parkersburg, West Virginia (Lease expires 2020) | | Screens for vinyl windows and doors |
Fontana, California (Lease expires 2019) | | Screens for vinyl windows and doors |
Perrysburg, Ohio (Lease expires 2019) | | Screens for vinyl windows and doors |
Chehalis, Washington (Lease expires 2019) | | Screens for vinyl windows and doors |
Tumwater, Washington (Lease expires 2024) | | Division executive offices |
EU Engineered ComponentsEuropean Fenestration Segment | | |
Denby, United Kingdom (Leases expire 2027 & 2037)Kingdom* | | Vinyl and composite extrusions |
Alfreton, United Kingdom (Lease expires 2022) | | Vinyl and composite extrusions |
Coventry, United Kingdom | | Flexible spacer |
Heinsberg, Germany (Lease expires 2025)Germany* | | Flexible spacer |
NANorth American Cabinet Components Segment | | |
Bowling Green, Kentucky | | Hardwood components for kitchen and bath |
Conover, North Carolina (Lease expires 2021) | | Hardwood doors for kitchen and bath |
Foreston, Minnesota | | Hardwood components for kitchen and bath |
Greenville, Pennsylvania | | Hardwood components for kitchen and bath |
Middlefield, Ohio (Leases expire 2019) | | Hardwood components for kitchen and bath |
Orwell, Ohio | | Hardwood doors for kitchen and bath |
| St. Cloud, Minnesota | | Hardwood doors & components for kitchen and bath |
Moorefield, West Virginia (Lease expires 2026) | | Engineered wood products for kitchen and bath |
Wahpeton, North Dakota | | Engineered wood products for kitchen and bath |
Molalla, Oregon | | Hardwood & engineered products for kitchen & bath |
Luck, Wisconsin | | Wood products |
Mounds View, Minnesota (Lease expires 2021) | | Wood products |
We maintain a lease* These locations are leased as of October 31, 2021.
In addition to the locations identified above, our North American Fenestration Segment maintains 13 additional facilities for the manufacture and distribution of fenestration, spacer and extrusion products within the continental U.S., our European Fenestration Segment maintains one additional location for the production of spacer in Yakima, Washington, which will expire in 2021, relatedthe U.K., and our North American Cabinet Components Segment maintains 10 locations to a location which was closed as a result of restructuring activities.manufacture hardwood doors and other wood components for kitchen and bath cabinets. See Note 1, "Nature“Nature of Operations, Basis of Presentation and Significant Accounting Policies - Restructuring"Restructuring,” to the accompanying consolidated financial statements included elsewhere in this Annual Report on Form 10-K.
We believe our operating properties are in good condition and well maintained, and are generally suitable and adequate to carry on our business. In fiscal 2018,2021, on a consolidated basis, our facilities operated at approximately 59%62% of machine capacity. This capacity utilization is subject to variability by product line, seasonality, and location.
Item 3. Legal Proceedings.
From time to time, we, along with our subsidiaries, are involved in various litigation matters arising in the ordinary course of our business, including those arising from or related to contractual matters, commercial disputes, intellectual property, personal injury, environmental matters, product performance or warranties, product liability, insurance coverage and personnel and employment disputes.
We regularly review with legal counsel the status of all ongoing proceedings, and we maintain insurance against these risks to the extent deemed prudent by our management and to the extent such insurance is available. However, there is no assurance that we will prevail in these matters or that our insurers will accept full coverage of these matters, and we could, in the future, incur judgments, enter into settlements of claims, or revise our expectations regarding the outcome or insurability of matters we face, which could materially impact our results of operations.
We have been and are currently party to multiple claims, some of which are in litigation, relating to alleged defects in a commercial sealant product that was manufactured and sold during the 2000's. Several claims were resolved during fiscal 20172019, 2020 and 2018,2021, and we continue to defend the remaining claims. While we believe that our product was not defective and that we would prevail in these commercial sealant product claims if taken to trial, the timing, ultimate resolution and potential impact of these claims is not currently determinable. Nevertheless, after taking into account all currently available information, including our defenses, the advice of our counsel, and the extent and currently-expected availability of our existing insurance coverage, we believe that the eventual outcome of these commercial sealant claims will not have a material adverse effect on our overall financial condition, results of operations or cash flows, and we have not recorded any accrual with regard to these claims.
We reserve for litigation loss contingencies that are both probable and reasonably estimable. We do not expect that losses resulting from any current legal proceedings will have a material adverse effect on our consolidated financial statements if or when such losses are incurred.
For discussion of environmental issues, see Item 1,, "Business “Business - Environmental and Employee Safety Matters”Matters,” discussed elsewhere in this Annual Report on Form 10-K.
Item 4. Mine Safety Disclosures.
Not Applicable.
PART II
Item 5. Market for Registrant’s Common Equity, Related Stockholder Matters and Issuer Purchases of Equity Securities.
Our common stock has been listed on the New York Stock Exchange under the ticker symbol NX since April 24, 2008. Electronic copies of our public filings are available on the Securities and Exchange Commission's website (www.sec.gov)(www.sec.gov).
There were approximately 1,742 holders of our common stock (excluding individual participants in securities positions listings) on record as of December 8, 2021.
Equity Compensation Plan Information
The following table summarizes certain information regarding equity compensation to our employees, officers and directors under equity compensation plans as of October 31, 2018:2021:
| | | | | | | | | | | | | | | | | |
| (a) | | (b) | | (c) |
| Plan Category | Number of securities to be issued upon exercise of outstanding options, warrants and rights(1) | | Weighted-average exercise price of outstanding options, warrants and rights(2) | | Number of securities remaining available for future issuance under equity compensation plans (excluding securities reflected in column (a)) |
| Equity compensation plans approved by security holders | 218,304 | | | $ | 19.37 | | | 1,164,421 | |
|
| | | | | | | | | |
| | (a) | | (b) | | (c) |
| Plan Category | Number of securities to be issued upon exercise of outstanding options, warrants and rights(1) | | Weighted-average exercise price of outstanding options, warrants and rights(2) | | Number of securities remaining available for future issuance under equity compensation plans (excluding securities reflected in column (a)) |
| Equity compensation plans approved by security holders | 2,866,758 |
| | $ | 18.47 |
| | 1,438,160 |
|
(1) Column (a) includes securities that may be issued upon future vesting of performance share awards that have been previously granted to key employees and officers. The number of securities reflected in this column includes the maximum number of shares that would be issued pursuant to these performance share awards assuming the performance measures are achieved. The performance measures may not be achieved.
(2) The weighted-average exercise price in column (b) does not include the impacts of the performance share awards or any securities that may be issued thereunder. For additional details, see Note 15, "Stock-Based Compensation" included elsewhere within13, “Stock-Based Compensation,” of the accompanying financial statements in this Annual Report on Form 10-K.
Issuer Purchases of Equity Securities
Set forth below is a table summarizing the program and the repurchase of shares during the quarter ended October 31, 2018.2021.
| | | | | | | | | | | | | | | | | | | | | | | | | | |
| Period | | (a) Total Number of Shares Purchased (1) | | (b) Average Price Paid per Share(1) | | (c) Total Number of Shares Purchased as Part of Publicly Announced Plans or Programs(1) | | (d) Maximum US Dollars Remaining that May Yet Be Used to Purchase Shares Under the Plans or Programs(1) |
| August 2021 | | — | | | $ | — | | | — | | | $ | 5,441,697 | |
| September 2021 | | 199,625 | | | $ | 22.10 | | | 199,625 | | | $ | 1,029,645 | |
| October 2021 | | 47,378 | | | $ | 21.37 | | | 47,378 | | | $ | 16 | |
| Total | | 247,003 | | | $ | 22.03 | | | 247,003 | | | |
|
| | | | | | | | |
| Period | | (a) Total Number of Shares Purchased (1) | | (b) Average Price Paid per Share(1) | | (c) Total Number of Shares Purchased as Part of Publicly Announced Plans or Programs(1) | | (d) Maximum US Dollars Remaining that May Yet Be Used to Purchase Shares Under the Plans or Programs(1) |
| August 1, 2018 through August 31, 2018 | | — | | — | | — | | $60,000,000 |
| September 1, 2018 through September 30, 2018 | | — | | — | | — | | $60,000,000 |
| October 1, 2018 through October 31, 2018 | | 1,900,000 | | 16.86 | | 1,900,000 | | $27,966,000 |
| Total | | 1,900,000 | | $16.86 | | 1,900,000 | | |
(1) On August 30, 2018, our Board of Directors approved a stock repurchase program that authorized the repurchase of up to $60.0 million worth of shares of our common stock. During the years ended October 31, 2021, 2020 and 2019, we purchased 478,311, 450,000 and 583,398 shares, respectively, at a cost of $11.2 million, $7.2 million and $9.6 million, respectively, under this program. As of October 31, 2021, this share repurchase authorization was exhausted and the program is now complete. In December 2021, our Board of Directors approved a stock repurchase program that authorized the repurchase of up to $75.0 million worth of shares of our common stock. Repurchases under the new program will be made in open market transactions or privately negotiated transactions, subject to market conditions, applicable legal requirements and other relevant factors. The program does not have an expiration date or a limit on the number of shares that may be purchased. During the year ended October 31, 2018, we purchased 1,900,000 shares at a cost of $32.0 million under this program.
Stock Performance Graph
The following chart represents a comparison of the five year total return of our common stock to the Standard & Poor’s 500 Index (S&P 500)500 Index), the Russell 2000 Index, and a peer group index selected by us, which includes companies offering similar products and services to ours. Following our execution of various strategic initiatives, we made a change to our peer group index for the year ended October 31, 2018 in order to ensure that it continues to reflect an appropriate comparison to our business. To that end, we added Insteel Industries Inc. to the peer group. As such, theThe companies in our peer group for the year ended October 31, 20182021 are AAON Inc., American Woodmark Corp, Apogee Enterprises Inc., ContinentalArmstrong Flooring Inc., Cornerstone Building ProductsBrands Inc., CSW Industrials Inc., Gibraltar Industries Inc., Griffon Corporation, LCI Industries, Insteel Industries Inc., Louisiana-Pacific Corp.,L.B. Foster Company, Masonite International NCI Building SystemsCorp, Mueller Water Products, Inc., Patrick Industries Inc., PGT Innovations, Inc., Ply Gem Holdings Inc., Simpson Manufacturing Company Inc., and Trex Company Inc., and Universal Forest Products Inc.
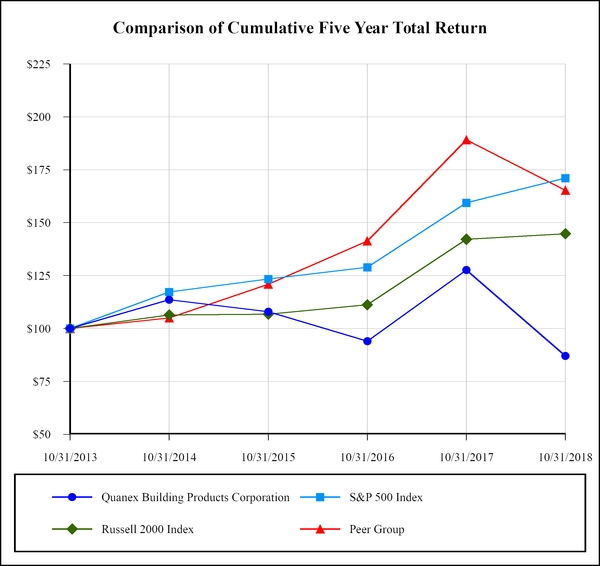
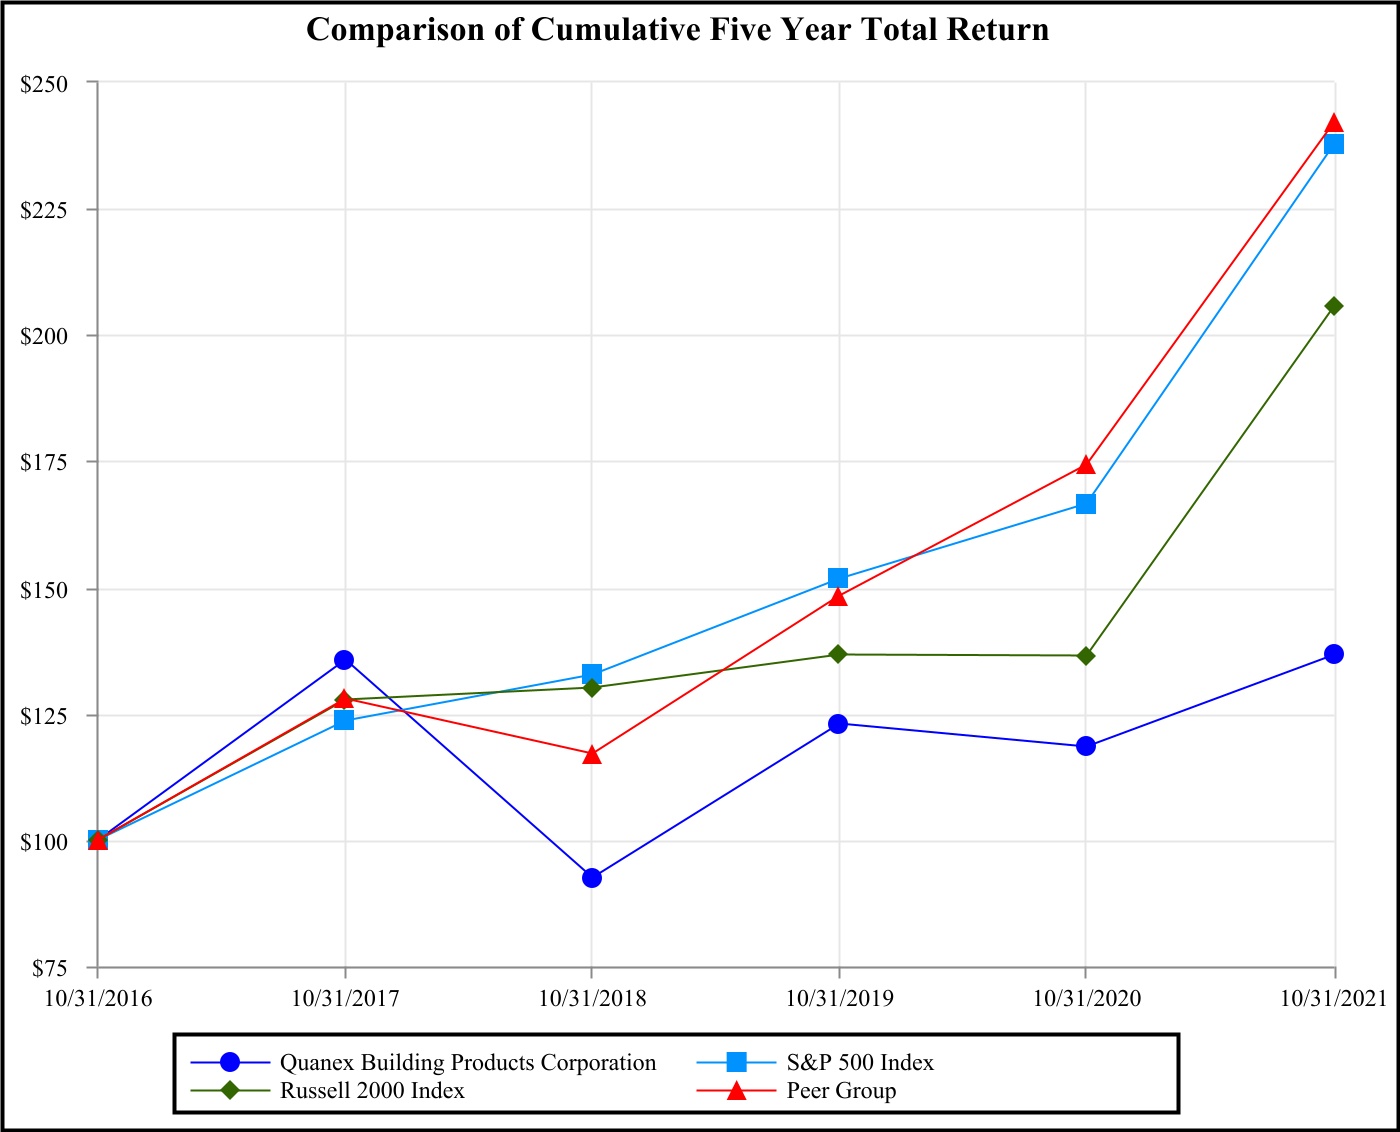
| | | | | | | | | | | | | | | | | | | | | | | | | | | | | | | | | | | |
| INDEXED RETURNS | For the Years Ended |
| Company Name / Index | 10/31/2016 | | 10/31/2017 | | 10/31/2018 | | 10/31/2019 | | 10/31/2020 | | 10/31/2021 |
| Quanex Building Products Corporation | $ | 100.00 | | | $ | 135.72 | | | $ | 92.57 | | | $ | 122.92 | | | $ | 118.46 | | | $ | 136.68 | |
| S&P 500 Index | $ | 100.00 | | | $ | 123.63 | | | $ | 132.71 | | | $ | 151.73 | | | $ | 166.46 | | | $ | 237.90 | |
| Russell 2000 Index | $ | 100.00 | | | $ | 127.83 | | | $ | 130.22 | | | $ | 136.60 | | | $ | 136.42 | | | $ | 205.72 | |
| Peer Group | $ | 100.00 | | | $ | 127.92 | | | $ | 117.12 | | | $ | 148.38 | | | $ | 174.33 | | | $ | 242.10 | |
|
| | | | | | | | | | | | | | | | | | | | | | | | |
| INDEXED RETURNS | | For the Years Ended |
| Company Name / Index | | 10/31/2013 |
| | 10/31/2014 |
| | 10/31/2015 |
| | 10/31/2016 |
| | 10/31/2017 |
| | 10/31/2018 |
|
| Quanex Building Products Corporation | | $ | 100.00 |
| | $ | 113.55 |
| | $ | 107.91 |
| | $ | 94.02 |
| | $ | 127.58 |
| | $ | 87.06 |
|
| S&P 500 Index | | $ | 100.00 |
| | $ | 117.27 |
| | $ | 123.37 |
| | $ | 128.93 |
| | $ | 159.40 |
| | $ | 171.11 |
|
| Russell 2000 Index | | $ | 100.00 |
| | $ | 106.43 |
| | $ | 106.79 |
| | $ | 111.18 |
| | $ | 142.14 |
| | $ | 144.78 |
|
| New Peer Group | | $ | 100.00 |
| | $ | 104.99 |
| | $ | 120.92 |
| | $ | 141.34 |
| | $ | 189.14 |
| | $ | 165.32 |
|
Item 6. Selected Financial Data.
The following table presents selected historical consolidated financial and operating data for the periods shown. The selected consolidated financial data as of October 31, 2018, 2017, 2016, 2015 and 2014 and for each of the fiscal years then ended was derived from our audited consolidated financial statements for those dates and periods, adjusted for discontinued operations, as indicated. The following information should be read in conjunction with “Management’s Discussion and Analysis of Financial Condition and Results of Operations” and our audited financial statements and related notes included elsewhere in this Annual Report on Form 10-K.
|
| | | | | | | | | | | | | | | | | | | |
| | Fiscal Years Ended October 31, |
| | 2018(1)(2)(3) | | 2017(1) | | 2016(1)(4)(5)(6) | | 2015(7) | | 2014(8)(9) |
| | (Dollars in thousands, except per share data) |
| Consolidated Statements of Income | | | | | | | | | |
| Net sales | $ | 889,785 |
| | $ | 866,555 |
| | $ | 928,184 |
| | $ | 645,528 |
| | $ | 595,384 |
|
| Cost and expenses: | | | | | | | | | |
| Cost of sales (excluding depreciation and amortization) | 696,567 |
| | 672,162 |
| | 710,644 |
| | 499,097 |
| | 464,584 |
|
| Selling, general and administrative | 103,535 |
| | 97,981 |
| | 114,910 |
| | 86,536 |
| | 82,150 |
|
| Restructuring charges | 1,486 |
| | 4,550 |
| | 529 |
| | — |
| | — |
|
| Depreciation and amortization | 51,822 |
| | 57,495 |
| | 53,146 |
| | 35,220 |
| | 33,869 |
|
| Asset impairment charges | — |
| | — |
| | 12,602 |
| | — |
| | 505 |
|
| Operating income (loss) | 36,375 |
| | 34,367 |
| | 36,353 |
| | 24,675 |
| | 14,276 |
|
| Non-operating income (expense): | | | | | | | | | |
| Interest expense | (11,100 | ) | | (9,595 | ) | | (36,498 | ) | | (991 | ) | | (562 | ) |
| Other, net | 178 |
| | 730 |
| | (5,479 | ) | | (531 | ) | | 92 |
|
| Income (loss) from continuing operations before income taxes | 25,453 |
| | 25,502 |
| | (5,624 | ) | | 23,153 |
| | 13,806 |
|
| Income tax (expense) benefit | 875 |
| | (6,819 | ) | | 3,765 |
| | (7,539 | ) | | (5,468 | ) |
| Income (loss) from continuing operations | 26,328 |
| | 18,683 |
| | (1,859 | ) | | 15,614 |
| | 8,338 |
|
| Income (loss) from discontinued operations, net of taxes | — |
| | — |
| | — |
| | 479 |
| | 20,896 |
|
| Net income (loss) | $ | 26,328 |
| | $ | 18,683 |
| | $ | (1,859 | ) | | $ | 16,093 |
| | $ | 29,234 |
|
| Basic earnings (loss) per common share: | | | | | | | | | |
| Basic earnings (loss) from continuing operations | $ | 0.76 |
| | $ | 0.55 |
| | $ | (0.05 | ) | | $ | 0.46 |
| | $ | 0.22 |
|
| Basic earnings (loss) from discontinued operations | — |
| | — |
| | — |
| | 0.01 |
| | 0.57 |
|
| Basic earnings (loss) per share | $ | 0.76 |
| | $ | 0.55 |
| | $ | (0.05 | ) | | $ | 0.47 |
| | $ | 0.79 |
|
| Diluted earnings (loss) per common share: | | | | | | | | | |
| Diluted earnings (loss) from continuing operations | $ | 0.75 |
| | $ | 0.54 |
| | $ | (0.05 | ) | | $ | 0.46 |
| | $ | 0.22 |
|
| Diluted earnings (loss) from discontinued operations | — |
| | — |
| | — |
| | 0.01 |
| | 0.56 |
|
| Diluted earnings (loss) per share | $ | 0.75 |
| | $ | 0.54 |
| | $ | (0.05 | ) | | $ | 0.47 |
| | $ | 0.78 |
|
| Cash dividends declared per share | $ | 0.20 |
| | $ | 0.16 |
| | $ | 0.16 |
| | $ | 0.16 |
| | $ | 0.16 |
|
| Other Financial & Operating Data | | | | | | | | | |
| Cash provided by operating activities | $ | 104,611 |
| | $ | 79,778 |
| | $ | 87,341 |
| | $ | 67,087 |
| | $ | 20,778 |
|
| Cash (used for) provided by investing activities | (26,052 | ) | | (41,124 | ) | | (282,103 | ) | | (160,144 | ) | | 74,124 |
|
| Cash (used for) provided by financing activities | (65,817 | ) | | (46,636 | ) | | 195,448 |
| | (4,581 | ) | | (24,459 | ) |
| Acquisitions, net of cash acquired | — |
| | 8,497 |
| | 245,904 |
| | 131,689 |
| | 5,161 |
|
| Capital expenditures | $ | 26,484 |
| | $ | 34,564 |
| | $ | 37,243 |
| | $ | 29,982 |
| | $ | 33,779 |
|
| Selected Consolidated Balance Sheet Data at Year End | | | | | | | | | |
| Cash and cash equivalents | $ | 29,003 |
| | $ | 17,455 |
| | $ | 25,526 |
| | $ | 23,125 |
| | $ | 120,384 |
|
| Total assets | 741,849 |
| | 773,879 |
| | 780,353 |
| | 565,516 |
| | 517,113 |
|
| Long-term debt, excluding current portion | 209,332 |
| | 218,184 |
| | 259,011 |
| | 53,767 |
| | 586 |
|
| Total liabilities | $ | 347,697 |
| | $ | 367,032 |
| | $ | 412,522 |
| | $ | 170,221 |
| | $ | 96,193 |
|
| |
(1)
| In 2018, 2017 and 2016, we incurred $1.5 million, $4.6 million and $0.5 million, respectively, of restructuring costs associated with the closure of several plant facilities. See Note 1, "Nature of Operations, Basis of Presentation and Significant Accounting Policies - Restructuring," included elsewhere in this Annual Report on Form 10-K. |
| |
(2)
| In October 2018, we refinanced our credit facility resulting in a charge of $1.1 million of unamortized deferred financing fees. See Note 8, "Debt and Capital Lease Obligations" included elsewhere in this Annual Report on Form 10-K. |
| |
(3)
| In 2018, we recorded a $6.5 million net benefit related to the tax effect of implementing the Tax Cuts and Jobs Act, which was signed into law on December 22, 2017. See note 11, "Income Taxes" included elsewhere in this Annual Report on Form 10-K. |
| |
(4)
| In November 2015, we acquired Woodcraft, a manufacturer of cabinet doors and other components to OEMs in the kitchen and bathroom cabinet industry. The results of operations of Woodcraft including revenue of $223.4 million and net income of $4.1 million have been included in our consolidated operating results since the date of acquisition, November 2, 2015. |
| |
(5)
| In July 2016, we refinanced our credit facility resulting in a $3.1 million prepayment call premium fee, a charge of $8.1 million of unamortized deferred financing fees and a charge of $5.5 million of unamortized original issuer’s discount. See Note 8, "Debt and Capital Lease Obligations" included elsewhere in this Annual Report on Form 10-K. |
| |
(6)
| In October 2016, we recorded a goodwill impairment charge of $12.6 million associated with our United States vinyl extrusion business. |
| |
(7)
| In June 2015, we acquired HLP, a vinyl profile extruder with operations located in the United Kingdom. The results of operations of HLP include revenue of $42.3 million and net income of $1.5 million for the period June 15, 2015 through October 31, 2015. |
| |
(8)
| In April 2014, we sold Nichols Aluminum, LLC. Accordingly, the related assets and liabilities were reported as discontinued operations in the consolidated balance sheets for the applicable periods presented, and the related operating results, including the gain on the sale, are reported as discontinued operations, net of tax, in the consolidated statements of income (loss) presented, as applicable. |
(9) In fiscal 2014, we decreased our warranty reserve and reduced expense by $2.8 million ($1.8 million net of tax) related to claims associated with a discontinued legacy product.
Item 7. Management’s Discussion and Analysis of Financial Condition and Results of Operations.
The following discussion and analysis contains forward-looking statements based on our current assumptions, expectations, estimates and projections about our business and the homebuilding industry, and therefore, it should be read in conjunction with our consolidated financial statements and related notes thereto, as well as "our “Cautionary Note Regarding Forward-Looking Statements" Statements” discussedelsewhere within this Annual Report on Form 10-K. For a listing of potential risks and uncertainties which impact our business and industry, see "Item“Item 1A. Risk Factors.” Actual results could differ from our expectations due to several factors which include, but are not limited to: the impact of the ongoing COVID-19 pandemic, market price and demand for our products, economic and competitive conditions, capital expenditures, new technology, regulatory changes and other uncertainties. Unless otherwise required by law, we undertake no obligation to publicly update any forward-looking statements, even if new information becomes available or other events occur in the future.
Our Business
We manufacture components for original equipment manufacturers in the building products industry. These components can be categorized as window and door (fenestration) components and kitchen and bath cabinet components. Examples of fenestration components include (1) energy-efficient flexible insulating glass spacers, (2) extruded vinyl profiles, (3) window and door screens, and (4) precision-formed metal and wood products. In addition, we provide certain other non-fenestration components and products, which include solar panel sealants, trim moldings, vinyl decking, vinyl fencing, water retention barriers, and conservatory roof components. We use low-cost production processes and engineering expertise to provide our customers with specialized products for their specific window, door, and cabinet applications. We believe these capabilities provide us with unique competitive advantages. We serve a primary customer base in North America and the United Kingdom,U.K., and also serve customers in international markets through our operating plants in the United KingdomU.K. and Germany, as well as through sales and marketing efforts in other countries.
We continue to invest in organic growth initiatives and have completed several targeted business acquisitions in recent years. Wewe intend to continue to pursueevaluating business acquisitions that allow us to expand our existing fenestration and cabinet component footprint, enhance our product offerings, provide new complementary technology, enhance our leadership position within the markets we serve, and expand into new markets or service lines. We have disposed of non-core businesses in the past, and continue to evaluate our business portfolio to ensure that we are investing in markets where we believe there is potential future growth.
We currently have three reportable business segments: (1) North American Engineered ComponentsFenestration segment (“NA Engineered Components”Fenestration”), comprising fourthree operating segments, primarily focused on the fenestration market in North America manufacturing vinyl profiles, IG spacers, screens &and other fenestration components; (2) European Engineered ComponentsFenestration segment (“EU Engineered Components”Fenestration”), comprising our United Kingdom-basedU.K.-based vinyl extrusion business, manufacturing vinyl profiles and conservatories, and the European insulating glass business manufacturing IG spacers; and (3) North American Cabinet Components segment (“NA Cabinet Components”), comprising theour North American cabinet door and components business acquired in November 2015 and two wood-manufacturing plants. We maintain a grouping called Unallocated Corporate & Other, which includes transaction expenses, stock-based compensation, long-term incentive awards based on the performance of our common stock and other factors, certain severance and legal costs not deemed to be allocable to all segments, depreciation of corporate assets, interest expense, other, net, income taxes and inter-segment eliminations, and beginning in 2018, executive incentive compensation and medical expense fluctuations relative to planned costs as determined during the annual planning process. Other corporate general and administrative costs have been allocated to the reportable business segments, based upon a relative measure of profitability in order to more accurately reflect each reportable business segment's administrative costs. We allocate corporate expenses to businesses acquired mid-year from the date of acquisition. No change in historical corporate expense allocation has been made to reflect the plant moves noted above as the impact would not have been significant. The accounting policies of our operating segments are the same as those used to prepare our accompanying consolidated financial statements. Corporate general and administrative expenses allocated during the years ended October 31, 2018, 20172021, 2020 and 20162019 were $18.7$21.6 million, $17.0$21.7 million and $19.1$18.3 million, respectively.
Notable Items
During 2017, we rationalized capacity and closed two United States vinyl plants and two cabinet door plants, relocating assets to improve overall operational efficiency. We have incurred $1.5 million and $4.6 million of expense associated with these restructuring efforts during fiscal 2018 and 2017, respectively, and have recognized $6.2 million of accelerated depreciation and amortization associated with related assets during fiscal 2017.COVID-19 Impacts
On February 20, 2017, we entered intoMarch 11, 2020, the WHO declared the outbreak of COVID-19 to be a $16.6 million capital lease arrangementglobal pandemic and recommended containment and mitigation measures. Our first priority with a related party to purchase a new manufacturing facility in the United Kingdom, as further described in Note 8, "Debt and Capital Lease Obligations,"regard to the accompanying consolidated financial statements contained elsewhere herein.COVID-19 pandemic is to do everything we can to ensure the safety, health and welfare of our employees, customers, suppliers and other partners. With the implementation of health and safety practices at our facilities, we are continuing to supply the industry during this uncertain time, recognizing the essential role the construction industry plays in providing housing and necessary infrastructure.
On November 2, 2015, we acquired Woodcraft, a manufacturer of cabinet doorsAs federal, state and other componentslocal governments react to OEMsthe public health crisis, significant uncertainties have been created in the kitcheneconomy. The COVID-19 pandemic and bathroom cabinet industry. We paid $245.9 million in cash, resulting in goodwill totaling $113.7 million. For additional detailsits related effects continue to have a significant adverse affect on many sectors of this acquisition, see Note 2, "Acquisitionsthe economy and Dispositions,"we may be further impacted.
As part of our response to the accompanying consolidated financial statements contained elsewhere herein.COVID-19 pandemic, we have taken the following measures:
On June 15, 2015, we acquired HLP, an extruder•We are continuing to provide our products to support critical infrastructure needs while following national, state, and local guidelines required to continue operations during the existence of vinyl lineal productsthe pandemic and manufacturerrelated local declarations of emergency. However, local or regional hotspots of the pandemic could result in other plastic products incorporated and registered in England and Wales, for $131.7 million in cash, net of cash acquired, $7.7 million of debt assumed and contingent consideration of $10.3 million, resulting in goodwill of approximately $61.3 million. The agreement contains an earn-out provision which is calculated as a percentage of earnings before interest, tax and depreciation and amortization for a specified period, as defined in the purchase agreement. Pursuant to this earn-out provision, the former owner selected the twelve-month period ended July 31, 2016 as the measurement period for the earn-out calculation. On November 7, 2016, we paid $8.5 million pursuant to this earn-out agreement, as further described in Note 2, "Acquisitions and Dispositions,"locations being temporarily idled due to the accompanying consolidated financial statements contained elsewhere herein.need to deep clean areas where an employee who has tested positive for COVID-19 worked or any similar impacts in our supply chain. We work with our customers to the extent idling affects fulfillment timing.
•We have taken precautionary measures intended to help minimize the risk of the virus to our employees by implementing social distancing, sanitizing the workspace, and requiring employees to report any COVID-19 symptoms to ensure safety as infection surges dictate.
•We continue to monitor the rapidly evolving situation and guidance from international and domestic authorities, including federal, state and local public health authorities and may take additional actions based on their recommendations. In these circumstances, there may be developments outside our control requiring us to adjust our operating plan.
Market Overview and Outlook
We believe the primary drivers of our operating results continue to be North American residential remodeling and replacement (R&R) and new home construction activity. We believe that housing starts and window shipments are indicators of activity levels in the homebuilding and window industries, and we use this data, as published by or derived from third-party sources, to evaluate the market. We have historically evaluated the market using data from the National Association of Homebuilders (NAHB) with regard to housing starts, and published reports by Ducker Worldwide, LLC (Ducker), a consulting and research firm, with regard to window shipments. These sources generally provide information about activity levels in the United States.
Housing starts and window shipments in the United States have increased in recent years. TheU.S. We obtain market data from Catalina research, a consulting and research firm, for insight into the U.S. residential wood cabinet demand.
In November 2021, the NAHB has forecasted calendar-year housing starts (excluding manufactured units) at 1.2to be 1.6 million units in 2017 increasing to 1.3 million units in 2018 through 2020, reflecting increasing consumer confidence2021, 2022 and a healthier economy.2023 calendar-years. The November 2021, Ducker forecast indicated that window shipments in the R&R market are expected to increase from 28.2 million unitsapproximately 4.5%, 4% and 3% in 2017 to 28.9 million unitsthe calendar-years ended 2021, 2022, 2023, respectively, and window shipments in 2018 and 29.7 million units in 2019, andthe new construction market are expected to grow 13%, 2%, and 1% in the calendar-years ended 2021, 2022, and 2023, respectively, resulting in overall window shipments are forecasted to increase at a higher pace. shipment improvements of 8% in 2021, 3% in 2022, and 2% in 2023.Derived from reports published by Ducker, the overall growthincrease in window shipments for the trailing twelve-month periodtwelve months ended September 30, 20182021 was 3.7%8.9%. During this period, growth in new construction activities increased 5.2%, while growth in14.2% and R&R activity increased 2.5%4.7%. GrowthIn November 2021, Catalina Research estimated that residential semi-custom cabinet demand in new construction continuesthe U.S. is estimated to outpace the growthincrease 13.4% in R&R, with a greater portion of the new construction growth associated with multi-family housing.2021 and 5.2% in 2022.
Our HLPU.K. vinyl business (commonly referred to as “Liniar”) is largely focused on the sale of vinyl house systems under the trade name “Liniar” to smaller window manufacturers in the United Kingdom. HLPU.K. Liniar is one of the larger providers of vinyl extruded products in the United KingdomU.K. in terms of volume shipped. Currently, the United KingdomU.K. is experiencing a shortage in affordable housing, with rising demand due in part to a growing immigrant population. HLP’sLiniar’s current primary customers are smaller window fabricators, as opposed to the larger OEMs that comprise a large portion of the North American market. These manufacturers seek the quality and technology of the specific products identified by the Liniar trade name. In addition, HLPLiniar services non-fenestration markets including the manufacture of roofing for conservatories, vinyl decking and vinyl water retention barriers used for landscaping. We believe there are growth opportunities within these markets in the United KingdomU.K. and potential synergies which may enable us to sell complementary products.
WoodcraftNA Cabinet Components manufactures kitchen and bathroom cabinet doors and components, amongst other products, using a variety of woods from traditional hardwoods to engineered wood products. Currently, Woodcraft sells allmost of its productsthe revenue in the United States,NA Cabinet Components is earned in the U.S., so domestic housing starts and R&R activity constitute the primary drivers of this business as well. We also utilize industry publications to evaluate the wood markets and commodity trends. Although NAHB forecasts indicate expected continued growth in the United States housing market, much of this anticipated growth is in new construction for multi-family dwellings, or rental properties, which is not the primary market for Woodcraft’s products. In recent years, forecasts project increased growth in single family homes. The cabinet door market is stratified as follows: stock (low-cost, low-variations), semi-custom (more customized, just-in-time manufacturing, higher price point) and custom (precise customer specifications, just-in-time manufacturing, high-end price point). Woodcraft'sNA Cabinet Component's primary market is semi-custom.
Our business is seasonal, particularly our fenestration business, as inclement weather during the winter months tends to slow down construction, particularly as related to “outside of the house” construction. To some extent, we believe our kitchen
and bathroom cabinet door business lessens the impact of seasonality on our operating results, as the cabinet business is “inside of the house” and less susceptible to weather. However, significant weather events do disrupt the construction industry. The Southern United States was impacted by Hurricane Michael in October 2018 and Hurricanes Harvey and Irma in August and September of 2017. Although our operating plants were not directly impacted, several of our customers were impacted directly, as well as indirectly, as some skilled laborers relocated to the region for construction jobs. From a longer-term perspective, the rebuilding efforts from these storms spur additional growth in construction beyond the year in which they make landfall.
We are impacted by regulation of energy standards. Although the United StatesU.S. government has been less aggressively pursuing higher energy efficiency standards in recent years, other countries have implemented higher energy efficiency standards which should bode well for our fenestration-related business in these markets, particularly our warm-edge spacer products.
We utilize severalSeveral commodities in our business for whichare subject to pricing can fluctuate,fluctuations, including polyvinyl resin (PVC), titanium dioxide (TiO2), petroleum products, aluminum titanium dioxide (TIO2), silicone and wood. For the majority of our customers and critical suppliers, we have price adjusters in place which effectively share the base pass-through price changes for theseour primary commodities with our customers commensurate with the market at large. Our long-term exposure to these price fluctuations is somewhat mitigated due to the contractual component of the adjuster program. However, these adjusters are not in place with all customers and for all commodities, and there is a level of exposure to such volatility due to the lag associated with the timing of price updates in accordance with our customer agreements.
agreements, particularly with regard to hardwoods. In July 2016,addition, some of these commodities, such as silicone, are in high demand, particularly in Europe, which can affect the United Kingdom voted to exit the European Union (commonly referred to as “Brexit”), which has impacted the valuationcost of the British Pound Sterling relativeraw materials, a portion of which we may not be able to other currencies used in our business, including our reporting currency, the United States Dollar. Although the British Pound Sterling relativefully recover. We also began to the United States Dollar appears to have stabilized during fiscal 2017, the Pound remains well below the pre-Brexit level, andexperience some general market uncertainty remains in the United Kingdom. Although we do not know the long-term effectssupply disruptions as high demand reduced availability of this change, there has been some impact on our results of operations to date (primarily foreign currency translation).raw materials.
The global economy remains uncertain due to global supply chain interruptions, inflationary pressures, currency devaluations, political unrest, terror threats, global pandemics such as COVID-19, and even the political landscape in the United States.U.S. These and other macro-economic factors have impacted the global financial markets, which may have contributed to significant changes in foreign currencies. We continue to monitor our exposure to changes in exchange rates.
We remain optimistic about our growth prospects in the near-term and believe our restructuring efforts in fiscal 2017 will enhance our financial performance and cash flow generation in fiscal 2018 and beyond.
Comparison of the fiscal years ended October 31, 20182021 and 20172020
This table sets forth our consolidated results of operations for the twelve-month periods ended October 31, 20182021 and 2017.2020.
| | | | For the Years Ended October 31, | | For the Years Ended October 31, |
| | 2018 | | 2017 | | 2018 vs. 2017 | | 2021 | | 2020 | | 2021 vs. 2020 |
| | Amounts | | % of Sales | | Amounts | | % of Sales | | $ Change | | Variance % | | Amounts | | % of Sales | | Amounts | | % of Sales | | $ Change | | Variance % |
| | (Dollars in millions) | | (Dollars in millions) |
| Net sales | $ | 889.8 |
| | 100% | | $ | 866.6 |
| | 100% | | $ | 23.2 |
| | 3% | Net sales | $ | 1,072.1 | | | 100% | | $ | 851.6 | | | 100% | | $ | 220.5 | | | 26% |
| Cost of sales (excluding depreciation and amortization) | 696.6 |
| | 78% | | 672.2 |
| | 78% | | 24.4 |
| | (4)% | Cost of sales (excluding depreciation and amortization) | 831.6 | | | 78% | | 658.8 | | | 77% | | 172.8 | | | (26)% |
| Selling, general and administrative | 103.5 |
| | 12% | | 98.0 |
| | 11% | | 5.5 |
| | (6)% | Selling, general and administrative | 116.0 | | | 11% | | 89.7 | | | 11% | | 26.3 | | | (29)% |
| Restructuring charges | 1.5 |
| | —% | | 4.5 |
| | 1% | | (3.0 | ) | | 67% | Restructuring charges | — | | | —% | | 0.6 | | | —% | | (0.6) | | | 100% |
| Depreciation and amortization | 51.8 |
| | 6% | | 57.5 |
| | 7% | | (5.7 | ) | | 10% | Depreciation and amortization | 42.7 | | | 4% | | 47.2 | | | 6% | | (4.5) | | | 10% |
| | Operating income | 36.4 |
| | 4% | | 34.4 |
| | 4% | | 2.0 |
| | 6% | Operating income | 81.8 | | | 8% | | 55.3 | | | 6% | | 26.5 | | | 48% |
| Interest expense | (11.1 | ) | | (1)% | | (9.6 | ) | | (1)% | | (1.5 | ) | | (16)% | Interest expense | (2.5) | | | —% | | (5.2) | | | (1)% | | 2.7 | | | 52% |
| Other, net | 0.2 |
| | —% | | 0.7 |
| | —% | | (0.5 | ) | | (71)% | Other, net | 0.8 | | | —% | | 0.2 | | | —% | | 0.6 | | | 300% |
| Income tax benefit (expense) | 0.9 |
| | —% | | (6.8 | ) | | (1)% | | 7.7 |
| | 113% | |
| Income tax expense | | Income tax expense | (23.1) | | | (2)% | | (11.8) | | | (1)% | | (11.3) | | | (96)% |
| Net income | $ | 26.4 |
| | 3% | | $ | 18.7 |
| | 2% | | $ | 7.7 |
| | 41% | Net income | $ | 57.0 | | | 5% | | $ | 38.5 | | | 5% | | $ | 18.5 | | | 48% |
Our year-over-year results by reportable segment follow. Our comparison of the results for the fiscal years ended October 31, 2020 and 2019 by reportable segment for the prior year comparative periods can be found in the annual report on Form 10-K for the year ended October 31, 2020.
Changes Related to Operating Income by Reportable Segment:
NA Engineered ComponentsFenestration | | | | | | | | | | | | | | | | | | | | | | | |
| For the Years Ended October 31, |
| 2021 | | 2020 | | $ Change | | Variance % |
| | (Dollars in millions) |
| Net sales | $ | 578.3 | | | $ | 483.4 | | | $ | 94.9 | | | 20% |
| Cost of sales (excluding depreciation and amortization) | 450.4 | | | 371.8 | | | 78.6 | | | (21)% |
| Selling, general and administrative | 53.0 | | | 47.8 | | | 5.2 | | | (11)% |
| Restructuring charges | — | | | 0.3 | | | (0.3) | | | 100% |
| Depreciation and amortization | 18.6 | | | 23.6 | | | (5.0) | | | 21% |
| | | | | | | |
| Operating income | $ | 56.3 | | | $ | 39.9 | | | $ | 16.4 | | | 41% |
| Operating income margin | 10 | % | | 8 | % | | | | |
|
| | | | | | | | | | | | | |
| | For the Years Ended October 31, |
| | 2018 | | 2017 | | $ Change | | Variance % |
| | (Dollars in millions) |
| Net sales | $ | 485.4 |
| | $ | 474.9 |
| | $ | 10.5 |
| | 2% |
| Cost of sales (excluding depreciation and amortization) | 371.3 |
| | 357.8 |
| | 13.5 |
| | (4)% |
| Selling, general and administrative | 54.0 |
| | 52.9 |
| | 1.1 |
| | (2)% |
| Restructuring charges | 1.4 |
| | 3.6 |
| | (2.2 | ) | | 61% |
| Depreciation and amortization | 27.2 |
| | 34.3 |
| | (7.1 | ) | | 21% |
| Operating income | $ | 31.5 |
| | $ | 26.3 |
| | $ | 5.2 |
| | 20% |
| Operating income margin | 6 | % | | 6 | % | | | | |
Net SalesSales. Net sales increased $10.5$94.9 million, or 2%20%, for the twelve months ended October 31, 20182021 compared to the same period in 2017. We experienced market growth of $24.52020, which was primarily driven by a $74.7 million year-over-year across the core product salesincrease in volumes, including a recovery from prior year COVID-19 impacts, and an increase in revenue of $8.0 million related to base price increases,and raw material price and surcharges. This was offset by a $22.0 million decrease related to the U.S. vinyl volume we shed and the divestituresurcharges of the wood flooring business.$20.2 million.
Cost of Sales. Sales. Cost of sales increased $13.5$78.6 million, or 4%21%, for the twelve months ended October 31, 20182021 compared to the same period in 2017. This increase is2020. Cost of sales, including labor, increased primarily due to inflationary increases in raw material, freighthigher volumes and labor costs.price inflation during the period.
Selling, General and Administrative.Administrative. Our selling, general and administrative expenses increased by $1.1$5.2 million, or 2%11%, for the twelve monthsmonths ended October 31, 20182021 compared to the same period in 2017.2020. This increase iswas due primarily related to higher compensation, including higher incentive accruals based on cash flow performance. The increase in annual incentive accruals was partially offset by a decrease related to a $1.8 million loss on the sale of our wood-flooring business in 2017.financial performance, and benefits year-over-year.
Restructuring Charges. Charges. Restructuring charges of $1.4 million relate to facility lease expenses related to the leases of two vinyl extrusion plants which were closed in November 2016 and January 2017 in the United States, one of which was terminated during September 2018. Restructuring charges of $3.6 million incurred during the twelve months ended October 31, 2017 represent equipment and inventory moving costs incurred in conjunction with the announced closure of two vinyl extrusion plants in the United States, and other related costs including2020 relate to facility lease expense severance and employee benefit costs.for a vinyl extrusion plant in the U.S. which was closed in January 2017. We exited the lease during December 2020.
Depreciation and Amortization. Amortization. Depreciation and amortization expense decreased $7.1$5.0 million, foror 21%, for the twelve months ended October 31, 20182021 compared to the same period in 2017. This decrease reflects the impact of restructuring efforts in 2017 which included accelerated depreciation of $4.3 million and amortization of $1.9 million associated with an October 2016 change in estimate of the remaining service lives of select fixed and intangible assets. Incremental depreciation expense associated with property, plant and equipment placed in service during the twelve months ended October 31, 2018, was more than offset by2020, reflecting the run-off of depreciation expense associated withrelated to existing assets and disposals during thisthe period.
EU Engineered ComponentsFenestration | | | | | | | | | | | | | | | | | | | | | | | |
| For the Years Ended October 31, |
| 2021 | | 2020 | | $ Change | | Variance % |
| | (Dollars in millions) |
| Net sales | $ | 251.6 | | | $ | 161.1 | | | $ | 90.5 | | | 56% |
| Cost of sales (excluding depreciation and amortization) | 172.0 | | | 108.8 | | | 63.2 | | | (58)% |
| Selling, general and administrative | 29.9 | | | 22.7 | | | 7.2 | | | (32)% |
| Depreciation and amortization | 10.4 | | | 9.5 | | | 0.9 | | | (9)% |
| Operating income | $ | 39.3 | | | $ | 20.1 | | | $ | 19.2 | | | 96% |
| Operating income margin | 16 | % | | 12 | % | | | | |
|
| | | | | | | | | | | | | |
| | For the Years Ended October 31, |
| | 2018 | | 2017 | | $ Change | | Variance % |
| | (Dollars in millions) |
| Net sales | $ | 160.0 |
| | $ | 148.0 |
| | $ | 12.0 |
| | 8% |
| Cost of sales (excluding depreciation and amortization) | 114.9 |
| | 104.9 |
| | 10.0 |
| | (10)% |
| Selling, general and administrative | 22.8 |
| | 20.6 |
| | 2.2 |
| | (11)% |
| Depreciation and amortization | 9.6 |
| | 8.8 |
| | 0.8 |
| | (9)% |
| Operating income | $ | 12.7 |
| | $ | 13.7 |
| | $ | (1.0 | ) | | (7)% |
| Operating income margin | 8 | % | | 9 | % | | | | |
Net Sales. Net sales increased $12.0$90.5 million, or 8%56%, when comparing the twelve months ended October 31, 20182021 compared to the same period in 2017. This2020, which was primarily driven by a $70.7 million increase includesin volumes, including a favorablerecovery from prior year COVID-19 impacts and the reopening of manufacturing facilities in the U.K. which were forced to close for several weeks in the second quarter of 2020, $11.8 million of foreign exchange impactcurrency rate changes, and $8.0 million of $8.7 million, volume increases of $4.4 million, and base price increases of $6.0 million, partially offset by $7.1 million of lower U.K. vinyl business that was shed during 2017.increases.
Cost of Sales. The cost of sales increased $10.0$63.2 million, or 58%, for the twelve months ended October 31, 20182021 compared to the same period in 2017. This2020. Cost of sales increased primarily due to higher volumes and price inflation during the period.
Selling, General and Administrative. Our selling, general and administrative expense increased $7.2 million, or 32%, for the twelve months ended October 31, 2021 compared to the same period in 2020. The increase is primarily relateddue to anhigher
compensation, including higher incentive accruals based on financial performance, general expenses and foreign currency impacts year-over-year.
NA Cabinet Components | | | | | | | | | | | | | | | | | | | | | | | |
| For the Years Ended October 31, |
| 2021 | | 2020 | | $ Change | | Variance % |
| | (Dollars in millions) |
| Net sales | $ | 246.1 | | | $ | 210.1 | | | $ | 36.0 | | | 17% |
| Cost of sales (excluding depreciation and amortization) | 211.1 | | | 179.8 | | | 31.3 | | | (17)% |
| Selling, general and administrative | 20.8 | | | 18.7 | | | 2.1 | | | (11)% |
| Restructuring charges | — | | | 0.3 | | | (0.3) | | | 100% |
| Depreciation and amortization | 13.3 | | | 13.7 | | | (0.4) | | | 3% |
| | | | | | | |
| Operating income (loss) | $ | 0.9 | | | $ | (2.4) | | | $ | 3.3 | | | 138% |
| Operating income (loss) margin | — | % | | (1) | % | | | | |
Net Sales. Net sales increased $36.0 million, or 17%, for the twelve months ended October 31, 2021 compared to the same period in 2020, which was primarily driven by a $19.8 million increase in vinylprice and siliconeraw material indexes and a $16.2 million increase in volumes.
Cost of Sales. The cost inflation experiencedof sales increased $31.3 million, or 17%, for the twelve months ended October 31, 2021 compared to the same period in the U.K.2020 as wella primarily as the impacta result of foreign exchange rate changes during the period.higher volumes and rising lumber prices, which are recovered on a lag.
Selling, General and Administrative. Our selling, general and administrative expense increased $2.2 million for the twelve months ended October 31, 2018 compared to the same period in 2017. This increase reflects an increase in salaries and higher incentive accruals related to cash flow performance, as well as the impact of foreign exchange rate changes during the period.
Depreciation and Amortization. Depreciation and amortization expense increased $0.8 million for the twelve months ended October 31, 2018 compared to the same period in 2017, primarily attributable to the effect of foreign exchange rate changes as well as the timing of new property, plant and equipment placed in service during the twelve months ended October 31, 2018, less the run-off of depreciation expense associated with existing assets and disposals during the period.
NA Cabinet Components
|
| | | | | | | | | | | | | |
| | For the Years Ended October 31, |
| | 2018 | | 2017 | | $ Change | | Variance % |
| | (Dollars in millions) |
| Net sales | $ | 249.8 |
| | $ | 248.8 |
| | $ | 1.0 |
| | —% |
| Cost of sales (excluding depreciation and amortization) | 214.1 |
| | 213.3 |
| | 0.8 |
| | —% |
| Selling, general and administrative | 18.0 |
| | 16.6 |
| | 1.4 |
| | (8)% |
| Restructuring charges | 0.1 |
| | 0.9 |
| | (0.8 | ) | | 89% |
| Depreciation and amortization | 14.4 |
| | 13.9 |
| | 0.5 |
| | (4)% |
| Operating income | $ | 3.2 |
| | $ | 4.1 |
| | $ | (0.9 | ) | | (22)% |
| Operating income margin | 1 | % | | 2 | % | | | | |
Net Sales. Net sales increased $1.0 million for the twelve months ended October 31, 2018 compared to the same period in 2017. On a year-over-year basis, we experienced a $12.0 million increase in price and raw material surcharges, which was partially offset by a $3.9 million decrease in sales volume related to the closure of two facilities during 2017 and additional lower margin business we shed and $7.1 million of market declines in existing business.
Cost of Sales. The cost of sales increased $0.8 million for the twelve months ended October 31, 2018 compared to the same period in 2017. This increase was primarily impacted by higher wood and material costs partially offset by market volume declines.
Selling, General and Administrative. Our selling, general and administrative expense increased $1.4$2.1 million, or 8%11%, for the twelve months ended October 31, 2018 as2021 compared to the same period in 2017. This2020. The increase wasis primarily relateddue to higher compensation, including higher incentive accruals related to cash flow performance.based on financial performance, and general expenses year-over-year.
Restructuring Charges.Charges. Restructuring charges of $0.1 million for the year ended October 31, 2018 represent the remaining costs from the Kansas plant closure effected in September 2017 which were incurred during the first quarter of the year ended October 31, 2018. Restructuring charges of $0.9$0.3 million in the twelve months ended October 31, 2017 represent2020 related to severance, equipment moving and other related costs associated with the Mexican plant closure effected in October 2016 and the Kansas plant closure.
Depreciation and Amortization. Depreciation and amortization expense increased $0.5 millioncharges incurred for the twelve months ended October 31, 2018 compared to the same period in 2017. This increase primarily reflects accelerated depreciation expense associated with a change in estimate for useful lives of certain assets associated with a plant re-layout, partially offset by a decrease in accelerated depreciation of assets at the Kansas plant, which was closed in September 2017. The incremental depreciation and amortization expense associated with property, plant and equipment placed into service during the twelve months ended October 31, 2018, was largely offset by the run-off of depreciation expense associated with existing assets and disposals during this period.closure.
Unallocated Corporate & Other | | | | | | | | | | | | | | | | | | | | | | | |
| For the Years Ended October 31, |
| 2021 | | 2020 | | $ Change | | Variance % |
| | (Dollars in millions) |
| Net sales | $ | (3.9) | | | $ | (3.0) | | | $ | (0.9) | | | (30)% |
| Cost of sales (excluding depreciation and amortization) | (1.9) | | | (1.6) | | | (0.3) | | | 19% |
| Selling, general and administrative | 12.3 | | | 0.5 | | | 11.8 | | | (2,360)% |
| Depreciation and amortization | 0.4 | | | 0.4 | | | — | | | —% |
| Operating loss | $ | (14.7) | | | $ | (2.3) | | | $ | (12.4) | | | (539)% |
|
| | | | | | | | | | | | | |
| | For the Years Ended October 31, |
| | 2018 | | 2017 | | $ Change | | Variance % |
| | (Dollars in millions) |
| Net sales | $ | (5.4 | ) | | $ | (5.1 | ) | | $ | (0.3 | ) | | (6)% |
| Cost of sales (excluding depreciation and amortization) | (3.7 | ) | | (3.8 | ) | | 0.1 |
| | (3)% |
| Selling, general and administrative | 8.7 |
| | 7.9 |
| | 0.8 |
| | (10)% |
| Depreciation and amortization | 0.6 |
| | 0.5 |
| | 0.1 |
| | (20)% |
| Operating loss | $ | (11.0 | ) | | $ | (9.7 | ) | | $ | (1.3 | ) | | (13)% |
Net Sales. Net sales for Unallocated Corporate & Other represents the elimination of inter-segment sales for the twelve months ended October 31, 20182021 and 2017.2020.
Cost of Sales. Cost of sales for Corporate & Other consists of the elimination of inter-segment sales, profit in inventory, and changes in the LIFO reserve adjustments and other costs. The change for the twelve-month periods ended October 31, 2018 and 2017 of $0.1 million was primarily related to the elimination of inter-segment sales partially offset by an increase in the LIFO reserve of $0.3 million in 2018.
Selling, General and Administrative. Our selling, general and administrative expenses increased $0.8$11.8 million, or 2,360%, for the twelve months ended October 31, 2021 compared to the same period in 2020. This increase is attributable to $7.3 million of higher compensation expense related to the valuations of our stock based compensation awards and executive bonuses due to financial performance, $4.8 million of medical expenses due to a higher claims experience during the twelve months ended October 31, 2021 compared to the same period in 2020, and $1.4 million of loss on the sale of a plant. These increases were partially offset by a reduction in executive severance and legal charges.
Changes Related to Non-Operating Items:
Interest Expense. Interest expense decreased $2.7 million for the twelve months ended October 31, 20182021 compared to the same period in 2017. This increase was driven by higher medical costs2020 primarily due to a higher claims experience during the year, higher executive annual incentive accruals based on cash flow performance, and higher advisory fees during the period. These increases were offset by stock based compensation, which decreased $8.2 million year-over-year based on revised lower estimates of performance shares expected to vest in December 2018, the impact of the lower stock price on other long-term liabilities that are marked-to-market, and the impact of issuing performance restricted stock units in December 2017 instead of stock options.
Depreciation and Amortization. Depreciation and amortization expense increased $0.1 million, or 20%, for the twelve months ended October 31, 2018 compared to the same period in 2017. The incremental depreciation expense associated with property, plant and equipment placed into service during the trailing twelve months was mostly offset by the run-off of depreciation expense associated with existing assets and disposals during the period.
Changes Related to Non-Operating Items:
Interest Expense. Interest expense increased $1.5 million for the twelve months ended October 31, 2018 compared to the same period in 2017. The increase in interest expense was primarily driven by the impact of $1.1 million of deferred financing fees which were incurred related to amending the 2016 Credit Agreement. Excluding these fees, interest expense increased due to higher interest rates partially offset byand lower overall debt balances during 2018.outstanding. The weighted average interest rate for borrowings outstanding for the twelve months ended October 31, 20182021 was 3.76%1.42% compared with 2.95%2.45% for the twelve months ended October 31, 2017.2020.
Other, net. Other, net. The reduction in other, net of $0.5 increased $0.6 million for the twelve months ended October 31, 20182021 compared to the same period in 2017 relates2020. The increase is primarily due to foreign exchange gains and losses. In 2018 and 2017, we recorded gains of $0.2 million and $0.7 million, respectively, largely associated with an unhedged foreign currency position with regard to the borrowings to fund the HLP transaction, which were partially offset by net foreign currency exchange derivative losses.increase in pension benefits year-over-year.
Income Taxes. We recorded an income tax benefitexpense of $0.9$23.1 million on pre-tax income of $80.1 million for the twelve months ended October 31, 2018,2021, an effective benefit rate of 3.4%28.9%, and income tax expense of $11.8 million on pre-tax income of $50.3 million for the twelve months ended October 31, 2020, an effective rate of 23.5%. The effective rate for 2018the twelve months ended October 31, 2021 was primarily impacted by state income taxes, global intangible low-taxed income, and changes in uncertain tax positions, partially offset by U.S. foreign tax credits. The effective rate for the twelve months ended October 31, 2020 was impacted by the Tax Cuts and Jobs Act which was signed into law on December 22, 2017. The act reduced our federal tax rate from 35% to 23.3% for the fiscal year ending October 31, 2018. As a result, the effective rate was impacted by a discrete benefit of $7.7 million for the re-measurement of our deferred income tax assets and liabilities due to the decrease in the federal corporate income tax rate, a benefit of $0.2 million for the true uptrue-up of our accruals and related deferred taxes from prior year filings and settled tax audits, and a benefit of $0.2 million related to the vesting or exercise of equity-based compensation awards, partially offset by a tax expense of $1.2 million for the one-time mandatory transition tax on deemed repatriation of previously tax-deferred and unremitted foreign earnings. We recorded income tax expense of $6.8 million for the twelve months ended October 31, 2017, an effective rate of 26.7%. The effective rate for 2017 was impacted by a $1.0 million discrete benefit associated with a change in the statutory deferred tax rate in the United Kingdom from 19% to 17% over the next three years.audits.
Comparison of the fiscal years ended October 31, 2017 and 2016
This table sets forth our consolidated results of operations for the twelve-month periods ended October 31, 2017 and 2016.
|
| | | | | | | | | | | | | | | | | |
| | For the Years Ended October 31, |
| | 2017 | | 2016 | | 2017 vs. 2016 |
| | Amounts | | % of Sales | | Amounts | | % of Sales | | $ Change | | Variance % |
| | (Dollars in millions) |
| Net sales | $ | 866.6 |
| | 100% | | $ | 928.2 |
| | 100% | | $ | (61.6 | ) | | (7)% |
| Cost of sales (excluding depreciation and amortization) | 672.2 |
| | 78% | | 710.6 |
| | 77% | | (38.4 | ) | | 5% |
| Selling, general and administrative | 98.0 |
| | 11% | | 114.9 |
| | 12% | | (16.9 | ) | | 15% |
| Restructuring charges | 4.5 |
| | 1% | | 0.5 |
| | —% | | 4.0 |
| | (800)% |
| Depreciation and amortization | 57.5 |
| | 7% | | 53.2 |
| | 6% | | 4.3 |
| | (8)% |
| Asset impairment charges | — |
| | —% | | 12.6 |
| | 1% | | (12.6 | ) | | 1% |
| Operating income | 34.4 |
| | 4% | | 36.4 |
| | 4% | | (2.0 | ) | | (5)% |
| Interest expense | (9.6 | ) | | (1)% | | (36.5 | ) | | (4)% | | 26.9 |
| | 74% |
| Other, net | 0.7 |
| | —% | | (5.5 | ) | | (1)% | | 6.2 |
| | 113% |
| Income tax (expense) benefit | (6.8 | ) | | (1)% | | 3.7 |
| | —% | | (10.5 | ) | | (284)% |
| Net income (loss) | $ | 18.7 |
| | 2% | | $ | (1.9 | ) | | —% | | $ | 20.6 |
| | 1,084% |
Our operating results for the twelve months ended October 31, 2017 and 2016 include the contributions of Woodcraft acquired on November 2, 2015. Our year-over-year results by reportable segment follow.
Changes Related to Operating Income (Loss) by Reportable Segment:
NA Engineered Components
|
| | | | | | | | | | | | | |
| | For the Years Ended October 31, |
| | 2017 | | 2016 | | $ Change | | Variance % |
| | (Dollars in millions) |
| Net sales | $ | 474.9 |
| | $ | 538.3 |
| | $ | (63.4 | ) | | (12)% |
| Cost of sales (excluding depreciation and amortization) | 357.8 |
| | 399.2 |
| | (41.4 | ) | | 10% |
| Selling, general and administrative | 52.9 |
| | 62.1 |
| | (9.2 | ) | | 15% |
| Restructuring charges | 3.6 |
| | 0.4 |
| | 3.2 |
| | (800)% |
| Depreciation and amortization | 34.3 |
| | 29.8 |
| | 4.5 |
| | (15)% |
| Asset impairment charges | — |
| | 12.6 |
| | (12.6 | ) | | 1% |
| Operating income | $ | 26.3 |
| | $ | 34.2 |
| | $ | (7.9 | ) | | (23)% |
| Operating income margin | 6 | % | | 6 | % | | | | |
Net Sales. Net sales decreased $63.4 million, or 12%, for the twelve months ended October 31, 2017 compared to the same period in 2016. On a year-over-year basis, we experienced a $66.4 million decrease in sales attributable to volume, an increase of $5.4 million related to surcharges for commodities used in our business, primarily resin and aluminum, and a decrease of $2.4 million attributable to price. The significant decrease in volume was anticipated with regard to our previously-announced plan to shed low-margin business associated with our United States vinyl business, although the transition of this volume to other suppliers was at a quicker pace than originally expected. In addition, $2.4 million of the decrease was associated with poor performance of our wood-flooring business which was sold on October 31, 2017. The overall decrease in volume is significantly offset by a corresponding decrease in cost of goods sold including purchases of raw materials used in our manufacturing process and labor, thereby mitigating some of the negative impact on our operating margins. We continue to align our cost structure to counter the effects of the anticipated volume reduction.
Cost of Sales. The cost of sales decreased $41.4 million, or 10%, for the twelve months ended October 31, 2017 compared to the same period in 2016. This decrease correlates with a 12% decrease in revenues for the respective period. Overall material and labor costs decreased year-over-year, directly related to the lower sales volume, and cost saving measures to align the labor
force in light of the decreased volume. In addition, freight and repair and maintenance costs declined, and fixed cost savings were realized due to restructuring efforts in 2017. Consolidated gross margin for the segment declined year-over-year primarily due to the mix of products produced and sold during 2017 compared to 2016, particularly at our United States vinyl operations, and lower volume of solar edge tape sales for our insulating glass business.
Selling, General and Administrative. Our selling, general and administrative expenses decreased by $9.2 million, or 15%, for the twelve months ended October 31, 2017 compared to the same period in 2016. Of this decrease, $1.2 million represents a decline in the amount of corporate costs allocated to the segment year-over-year, reflecting an overall decline in such corporate office costs. The remainder of the difference is primarily associated with lower headcount following restructuring efforts at our United States vinyl operations, lower incentive accruals based on financial performance, and lower professional fees. Partially offsetting these declines in expense is a loss on the sale of our wood-flooring business of $1.8 million in October 2017, and normal salary and employee benefit costs inflation.
Restructuring Charges. Restructuring charges of $3.6 million represent equipment and inventory moving costs incurred in conjunction with the announced closure of two vinyl extrusion plants in the United States, and other related costs including facility lease expense, severance and employee benefit costs.
Depreciation and Amortization. Depreciation and amortization expense increased $4.5 million for the twelve months ended October 31, 2017 compared to the same period in 2016 primarily due to a change in estimate regarding the remaining service lives for assets associated with the restructuring efforts noted above, resulting in incremental depreciation of $3.2 million, and a change in estimate related to certain intangible assets resulting in incremental amortization of $1.6 million. Incremental depreciation expense associated with property, plant and equipment placed in service during the twelve months ended October 31, 2017, was more than offset by the run-off of depreciation expense associated with existing assets and disposals during this period.
Asset Impairment Charges. We recorded an asset impairment charge of $12.6 million in 2016 which represents the write-off of the remaining goodwill asset associated with our United States vinyl extrusion business. We did not incur an asset impairment charge during 2017.
|
| | | | | | | | | | | | | |
| | For the Years Ended October 31, |
| | 2017 | | 2016 | | $ Change | | Variance % |
| | (Dollars in millions) |
| Net sales | $ | 148.0 |
| | $ | 150.2 |
| | $ | (2.2 | ) | | (1)% |
| Cost of sales (excluding depreciation and amortization) | 104.9 |
| | 104.5 |
| | 0.4 |
| | —% |
| Selling, general and administrative | 20.6 |
| | 23.2 |
| | (2.6 | ) | | 11% |
| Depreciation and amortization | 8.8 |
| | 9.3 |
| | (0.5 | ) | | 5% |
| Operating income | $ | 13.7 |
| | $ | 13.2 |
| | $ | 0.5 |
| | 4% |
| Operating income margin | 9 | % | | 9 | % | | | | |
Net Sales. Net sales decreased $2.2 million, or 1%, when comparing the twelve months ended October 31, 2017 to the same period in 2016. This decrease is entirely attributable to a $10.7 million negative impact associated with changes in foreign exchange rates. Excluding the foreign exchange impact, revenue increased $8.5 million, of which $8.6 million related to volume, partially offset by a slight decrease in price of $0.1 million. The volume improvement reflects favorable market growth despite the intentional shed of some lower margin customers at HLP.
Cost of Sales. The cost of sales increased $0.4 million, year-over-year compared to a decrease in revenue for these periods. Excluding the impact of foreign exchange rate changes as noted above, the increase in cost of goods sold reflects higher material costs, due in part to volume, but also due to higher cost of commodities such as resin and silicone. In addition, margins were impacted during 2017 at HLP due to some inefficiencies caused by delays transitioning to the new warehouse.
Selling, General and Administrative. Our selling, general and administrative expense decreased $2.6 million for the twelve months ended October 31, 2017 compared to the same period in 2016. The decrease reflects a $0.4 million decline in costs allocated from corporate in 2017, as well as lower selling and marketing costs, lower incentive accruals based on earnings, and the impact of foreign exchange rate changes.
Depreciation and Amortization. Depreciation and amortization expense decreased $0.5 million for the twelve months ended October 31, 2017 compared to the same period in 2016, primarily attributable to the effect of foreign exchange rate changes as
well as the timing of new property, plant and equipment placed in service during the twelve months ended October 31, 2017, less the run-off of depreciation expense associated with existing assets and disposals during the period.
NA Cabinet Components
|
| | | | | | | | | | | | | |
| | For the Years Ended October 31, |
| | 2017 | | 2016 | | $ Change | | Variance % |
| | (Dollars in millions) |
| Net sales | $ | 248.8 |
| | $ | 248.1 |
| | $ | 0.7 |
| | —% |
| Cost of sales (excluding depreciation and amortization) | 213.3 |
| | 213.3 |
| | — |
| | —% |
| Selling, general and administrative | 16.6 |
| | 15.8 |
| | 0.8 |
| | (5)% |
| Restructuring charges | 0.9 |
| | 0.1 |
| | 0.8 |
| | (800)% |
| Depreciation and amortization | 13.9 |
| | 13.5 |
| | 0.4 |
| | (3)% |
| Operating income | $ | 4.1 |
| | $ | 5.4 |
| | $ | (1.3 | ) | | (24)% |
| Operating income margin | 2 | % | | 2 | % | | | | |
Net Sales. Net sales increased $0.7 million for the twelve months ended October 31, 2017 compared to the same period in 2016. On a year-over-year basis, we experienced a $0.7 million increase in sales attributable to higher volume, an increase of $2.4 million in revenues associated with pricing, offset by a $2.4 million decrease in revenue associated with lower wood surcharges. The increase in volume reflects market growth of approximately 5%, some new customers, higher-than-expected spot sales, and incremental volume of $1.1 million associated with the two plants transferred from the NA Engineered Components segments. These volume increases are partially offset by volume lost as a result of restructuring efforts that included the closure of a plant in Mexico in October 2016 and a plant in Kansas in September 2017, as well as the previously-announced plan to shed less profitable business. The decrease in revenue associated with wood surcharges represents the change in the price of wood used in our business and the timing lag associated with our contractual ability to pass this cost to our customers.
Cost of Sales. The cost of sales remained consistent at $213.3 million for the years ended October 31, 2017 and 2016. However, the results for 2016 include a charge of $2.3 million related to purchase accounting (step-up and turn of inventory acquired) which did not occur in 2017. Excluding this item, cost of sales increased $2.3 million, or 1%, year-over-year. Margins in 2017 reflect a more favorable product mix, but were negatively impacted by some labor inefficiency, higher health insurance and benefit costs, less favorable material pricing and inventory adjustments and reserves. Overall, cost of sales reflects changes in sales volume and product mix.
Selling, General and Administrative. Our selling, general and administrative expense increased $0.8 million, or 5%, for the twelve months ended October 31, 2017 as compared to the same period in 2016, despite a $0.5 million decrease in allocated corporate costs during this period. The overall $1.3 million increase reflects some additional administrative headcount, normal wage inflation, and higher medical insurance and employee benefit costs year-over-year.
Restructuring Charges. Restructuring charges of $0.9 million represent equipment moving and other related costs associated with the Mexican plant closure effected in October 2016 and a Kansas plant closure effected in September 2017.
Depreciation and Amortization. Depreciation and amortization expense increased $0.4 million for the twelve months ended October 31, 2017 compared to the same period in 2016. Of this increase, $0.2 million was associated with accelerated depreciation of assets at the Kansas plant, closed in September 2017. The incremental depreciation and amortization expense associated with property, plant and equipment placed into service during the twelve months ended October 31, 2017, slightly exceeded the run-off of depreciation expense associated with existing assets and disposals during this period.
Unallocated Corporate & Other |
| | | | | | | | | | | | | |
| | For the Years Ended October 31, |
| | 2017 | | 2016 | | $ Change | | Variance % |
| | (Dollars in millions) |
| Net sales | $ | (5.1 | ) | | $ | (8.4 | ) | | $ | 3.3 |
| | 39% |
| Cost of sales (excluding depreciation and amortization) | (3.8 | ) | | (6.4 | ) | | 2.6 |
| | (41)% |
| Selling, general and administrative | 7.9 |
| | 13.8 |
| | (5.9 | ) | | 43% |
| Depreciation and amortization | 0.5 |
| | 0.6 |
| | (0.1 | ) | | 17% |
| Operating loss | $ | (9.7 | ) | | $ | (16.4 | ) | | $ | 6.7 |
| | 41% |
Net Sales. Net sales for Unallocated Corporate & Other represents the elimination of inter-segment sales for the twelve months ended October 31, 2017 and 2016. The change between periods reflects the amount of inter-segment sales (primarily between NA Engineered Components and EU Engineered Components related to a change in the terms of a royalty agreement in 2017).
Cost of Sales. Cost of sales for Corporate & Other consists of the elimination of inter-segment profit in inventory and changes in the LIFO reserve adjustments and other costs. The change for the twelve-month periods ended October 31, 2017 and 2016 of $2.6 million was primarily related to the elimination of inter-segment sales and a decrease in the LIFO reserve of $0.3 million in 2016.
Selling, General and Administrative. Our selling, general and administrative expenses decreased $5.9 million, for the twelve months ended October 31, 2017 compared to the same period in 2016, despite a $2.1 million decrease in the amount of corporate expense allocated to the operating segments in 2017 compared to 2016. Therefore, the overall decrease in selling, general and administrative expenses is $8.0 million. Of this amount, a net decrease of $4.7 million relates to transaction costs, as the prior year included $5.2 million associated with the Woodcraft acquisition. The remainder of the difference relates primarily to lower professional fees as we received $4.0 million of insurance reimbursement in 2017 for legal fees incurred defending an alleged product defect claim. We also recorded lower incentive accruals based on financial performance. These decreases were partially offset by normal wage inflation and higher medical insurance and benefit costs.
Depreciation and Amortization. Depreciation and amortization expense decreased $0.1 million, or 17%, for the twelve months ended October 31, 2017 compared to the same period in 2016, reflecting the run-off of depreciation during 2016 primarily related to computer software, hardware and licensing. Relatively few new assets were placed in service at corporate during the twelve months ended October 31, 2017.
Changes Related to Non-Operating Items:
Interest Expense. Interest expense decreased $26.9 million for the twelve months ended October 31, 2017 compared to the same period in 2016. Of this amount, $16.7 million was attributable to the write-off of unamortized deferred financing fees, original issuer’s discount and a 1% prepayment penalty associated with the July 2016 refinance and retirement of our Term Loan B and asset-based lending facilities. This facility was replaced with a Term Loan A and revolving credit facility with significantly lower interest rates. The relative outstanding balances under our credit facilities decreased at October 31, 2017 compared to October 31, 2016 due to net repayments. The weighted average interest rate for borrowings outstanding for the twelve months ended October 31, 2017 was 2.95% compared with 5.26% for the twelve months ended October 31, 2016.
Other, net. The change in other net of $6.2 million for the twelve months ended October 31, 2017 compared to the same period in 2016 relates to foreign exchange gains and losses. In 2017, we recorded a gain of $0.7 million and for 2016 we recorded a loss of $5.5 million, largely associated with an unhedged foreign currency position with regard to the borrowings to fund the HLP transaction, as well as net foreign exchange losses associated with our other foreign operations.
Income Taxes. We recorded income tax expense of $6.8 million for the twelve months ended October 31, 2017, an effective rate of 26.7%. The effective rate for 2017 was impacted by a $1.0 million discrete benefit associated with a change in the statutory deferred tax rate in the United Kingdom from 19% to 17% over the next three years. We recorded an income tax benefit of $3.7 million, an effective rate of 66.9%, for the twelve months ended October 31, 2016. The effective rate for 2016 was impacted by a discrete benefit of $0.8 million for the R&D credit which was made permanent in December 2015. However, this rate was also impacted by permanent items, and the foreign tax rate differential, as a greater percentage of our taxable income for fiscal 2016 was derived from our foreign operations, primarily in the United Kingdom, a jurisdiction with a lower statutory tax rate than the United States.
Liquidity and Capital Resources
Overview
Historically, our principal sources of funds have been cash on hand, cash flow from operations, and borrowings under our credit facilities. As of October 31, 2018,2021, we had $29.0$40.1 million of cash and equivalents, $195.0cash equivalents, $38.0 million outstanding under our credit facilities, $5.3$4.5 million of outstanding letters of credit and $17.0$15.5 million outstanding under capitalfinance leases. We had $124.7$282.5 million available for use under the Credit Agreementa revolving credit facility at October 31, 2018.
On November 2, 2015, we acquired Woodcraft for $245.9 million in cash, net of cash acquired, subject to a working capital true-up and including certain holdbacks with regard to potential indemnity claims, as more fully described in the accompanying notes to consolidated financial statements (Note 2, “Acquisitions and Dispositions”).
In order to fund this acquisition, we entered into senior secured credit facilities of $410.0 million consisting of an asset-based lending (ABL) revolving credit facility of $100.0 million (for which the borrowing base was determined monthly) and a Term Loan B facility of $310.0 million. On November 2, 2015, we borrowed $310.0 million under the term loan facility and $10.5 million under the ABL facility to fund the Woodcraft acquisition, to refinance and retire outstanding debt of $50.0 million under a predecessor credit facility and to pay fees associated with these borrowings. The proceeds were reduced by a debt discount of $6.2 million, which was being recognized on the effective interest method over the term of the facility. We recorded expense of $0.5 million in November 2015 to write off the unamortized deferred financing fees associated with the predecessor facility.
On July 29, 2016, we refinanced and retired our Term Loan B and ABL credit facilities and entered into a $450.0 million credit agreement comprising a $150.0 million Term Loan A and a $300.0 million revolving credit facility (collectively, the “ 2016 Credit Agreement”), under which we borrowed $150.0 million and $150.0 million, respectively. The proceeds from the 2016 Credit Agreement, along with additional funding of $16.4 million of cash on hand, were used to repay outstanding borrowings under the Term Loan B and ABL credit facilities of $309.2 million, to pay a 1% prepayment call premium under the Term Loan B facility, to settle outstanding interest accrued under the prior facility, and to pay loan fees which totaled $2.8 million. In addition, we expensed $8.1 million to write-off unamortized deferred financing fees and $5.5 million of unamortized original issuer’s discount associated with the Term Loan B and ABL credit facilities. The 2016 Credit Agreement was to mature in 2021 (5-year term) and required interest payments calculated, at our election and depending upon our Consolidated Leverage Ratio, at either a Base Rate plus an applicable margin (0.50% to 1.25%) or the LIBOR Rate plus an applicable margin (1.50% to 2.25%). We included deferred financing fees of $2.8 million as a contra-liability account, and were amortizing this balance straight-line over the term of the facility.2021.
On October 18, 2018, we amended and restated the 2016 Credit Agreement by enteringentered into a $325.0 million revolving credit facility (the “ 2018 Credit“Credit Facility”), under which we borrowed $205.0 million. The proceeds from the 2018 Credit Facility, along with additional funding of $10.0 million of cash on hand, were used to repay outstanding borrowings under the 2016 Credit Agreementa previous credit agreement of $213.5 million, to settle outstanding interest accrued under the prior facility, and to pay loan fees which totaled $1.0 million. In addition, we expensed $1.1 million to write-off unamortized deferred financing fees associated with the 2016 Credit Agreement.previous credit agreement. The 2018 Credit Facility matures in 2023 (5-year term) and requires interest payments calculated, at our election and depending upon our Consolidated Leverage Ratio, at either a Base Rate plus an applicable margin (0.25% to 1.00%) or the LIBOR Rate plus an applicable margin (1.25% to 2.00%). We included deferred financing fees of $1.5 million as a contra-liability account, and are amortizing this balance straight-line over the term of the facility.
The weighted average interest rate of borrowings outstanding for the twelve-month periods ended October 31, 20182021 and 20172020 was 3.76%1.42% and 2.95%2.45%, respectively. We were in compliance with our debt covenants as of October 31, 2018.2021. For additional details of the Credit Agreement, see "Item“Item 1A. Risk Factors"Factors,” included elsewhere within this Annual Report on Form 10-K.
We expect to repatriate excess cash moving forward and use the funds to retire debt or meet current working capital needs. We believe our business model, our current cash reserves and the recent steps we have taken to strengthen our balance sheet leave us well-positioned to manage our business and remain in compliance with our debt covenants through the COVID-19 crisis as it continues to unfold.
Analysis of Cash Flow
The following table summarizes our cash flow results for the years ended October 31, 2018, 20172021, 2020, and 2016:2019: | | | | | | | | | | | | | | | | | |
| Year Ended October 31, |
| | 2021 | | 2020 | | 2019 |
| | (In millions) |
| Cash flows provided by operating activities | $ | 78.6 | | | $ | 100.8 | | | $ | 96.4 | |
| Cash flows used for investing activities | $ | (18.7) | | | $ | (25.2) | | | $ | (23.6) | |
| Cash flows used for financing activities | $ | (71.9) | | | $ | (55.1) | | | $ | (71.3) | |
|
| | | | | | | | | | | |
| | Year Ended October 31, |
| | 2018 | | 2017 | | 2016 |
| | (In millions) |
| Cash flows provided by operating activities | $ | 104.6 |
| | $ | 79.8 |
| | $ | 87.3 |
|
| Cash flows used for investing activities | $ | (26.1 | ) | | $ | (41.1 | ) | | $ | (282.1 | ) |
| Cash flows (used for) provided by financing activities | $ | (65.8 | ) | | $ | (46.6 | ) | | $ | 195.4 |
|
Operating Activities
Cash provided by operating activities increased $24.8 millionOur year-over-year cash flow analysis follows. Our cash flow analysis for the fiscal years ended October 31, 2020 and 2019 for the prior year comparative periods can be found in the annual report on Form 10-K for the year ended October 31, 2018 compared to the year ended October 31, 2017. Cash receipts were impacted favorably by higher net income along with a reduction of inventory in 2018 versus a build in 2017 and favorable changes in accounts payable and accrued liabilities. Cash provided by operating activities decreased $7.5 million2020.
Operating Activities
Operating cash flow for the year ended October 31, 2017 compared to2021 decreased $22.2 million while cash flow for the year ended October 31, 2016. Despite2020 increased by $4.4 million. The decrease in cash provided by operating activities is primarily due to an increase in working capital partially offset by higher net income cash receipts and disbursements declined as a result of lower activity levels, primarily within our United States vinyl business. Although collection of receivables was favorable, investment in inventory levels grewyear-over-year due to a slower-than-expected busy season, which was exacerbated by the impact of the hurricanesincreased demand. The increase in late 2017. Partially offsetting this decline was the collection of a tax receivable of $1.2 million and lower interest costs under our debt facilities. Workingworking capital was $87.3 million, $85.3 millionlargely driven by an inventory build and $89.8 million as of October 31, 2018, 2017raw material price inflation and 2016, respectively. Working capital remained fairly consistent despite the decreasean increase in activity levels in 2017.accounts receivable.
Investing Activities
Cash used for investing activities for the year ended October 31, 2021 decreased $15.1$6.5 million in 2018 compared to 2017. In 2017, we paid $8.5 million relatedthe year ended October 31, 2020 due to the HLP acquisition earn-out, with no corresponding cash payment in 2018. Our investment in capital expenditures declined $8.1 million during 2018, which partially offset a decreasean increase of $1.5$4.8 million in proceeds from the saledisposition of capital assets during the year. Cash used for investing activities decreased $241.0and a $1.7 million in 2017 compared to 2016, as the 2016 results included an incremental $237.4 million greater investment in acquisitions, as $245.9 million was incurred in 2016 related to the Woodcraft acquisition and only $8.5 million was paid in 2017 associated with the HLP earn-out. In addition, we invested an incremental $2.7 milliondecrease in capital equipment in 2016 relative to 2017.expenditures.
At October 31, 2018,2021, we had firm purchase commitments of approximately $1.1$5.2 million for the purchase or construction of capital assets. We plan to fund these capital expenditures through cash from operations or borrowings under our revolving credit facility.
Financing Activities
OurIn the year ended October 31, 2021, cash used for financing activities for 2018 was $65.8$71.9 million and related primarily to share repurchases of $32.0 million, net debt repayments of $29.5$65.7 million, share repurchases of $11.2 million and payment of dividends of $7.0 million, and other spending of $2.0$10.8 million, partially offset by funds received$16.3 million of proceeds from the issuance of common stock in settlementexercise of stock option exercises of $4.7 million.options. In 2017,the year ended October 31, 2020, cash used for financing activities was $46.6$55.1 million and related primarily to repaymentnet debt repayments of borrowings under our credit facility and$40.5 million, payment of dividends of $5.5 million, partially offset by funds received from the issuance of common stock in settlement of stock option exercises of $8.0 million. For 2016, funds provided by financing activities of 195.4 million included net debt borrowings of $209.7$10.5 million, and cash receivedshare repurchases of $3.4 million from stock issuances, partially offset by cash paid for debt issuance costs of $11.4 million, cash paid for dividends of $5.5 million, and $0.8 million used for other financing activities.$7.2 million.
Liquidity Requirements
Our strategy for deploying cash is to invest in organic growth opportunities, develop our infrastructure, and makeexplore strategic acquisitions. Other uses of cash include paying cash dividends to our shareholders and repurchasing our own stock. We have historically invested cash and cash equivalents in commercial paper with terms of three months or less. We did not have any investments during the years ended October 31, 2018 and 2017. We maintain cash balances in foreign countries which totaled $15.7$10.6 million and $9.0$16.8 million as of October 31, 20182021 and 2017.2020. During the yearyears ended October 31, 2018,2021 and 2020, we repatriated $2.8$28.4 million and $31.9 million, respectively, of foreign earnings from our insulating spacer division in the United Kingdom. We utilize cash flow from HLP to fund the operation in the United Kingdom. During the fourth quarter of 2018, we repaid a note arrangement implemented as part of the initial capitalization of the acquisition.
international divisions.
We believe that we have sufficient funds and adequate financial resources available to meet our anticipated liquidity needs. We expect to use our cash flow from operations to fund operations for the next twelve months and the foreseeable future. We believe these funds should be adequate to provide for our working capital requirements, capital expenditures, and dividends, while continuing to meet our debt service requirements.
Senior Credit Facility
We maintain our $325.0 million 2018 Credit Facility, which contains a revolving credit facility, with Wells Fargo Bank, National Association, as Agent, Swingline Lender and Issuing Lender, and Bank of America, N.A. serving as Syndication Agent. The 2018 Credit Facility has a five-year term, maturing on October 18, 2023, and requires interest payments calculated, at our election and depending upon our Consolidated Leverage Ratio, at either a Base Rate plus an applicable margin or the LIBOR Rate plus an applicable margin. At the time of the initial borrowing, the applicable rate was LIBOR + 1.50%. In addition, we are subject to commitment fees for the unused portion of the 2018 Credit Facility. The applicable margin and commitment fees range from 0.45% to 2.30%, depending upon the type of loan and consolidated leverage ratio. The Credit Facility contains appropriate provisions to substitute LIBOR with a replacement rate upon transition away from LIBOR. These provisions include a temporary conversion of applicable interest for all borrowings outstanding to be calculated as base rate loans until such time that the replacement rate is agreed upon.
The 2018 Credit Facility provides for revolving credit commitments for a minimum principal amount of $10.0 million, up to an aggregate amount of $150.0 million, subject to the lender's discretion to elect or decline the incremental increase. We can also borrow up to the lesser of $15.0 million or the revolving credit commitment, as defined, under a Swingline feature of the 2018 Credit Facility.
The 2018 Credit Facility contains a: (1) Consolidated Interest Coverage Ratio requirement whereby we must not permit the Consolidated Interest Coverage Ratio, as defined, to be less than 2.25 to 1.00, and (2) Consolidated Leverage Ratio requirement, whereby we must not permit the Consolidated Leverage Ratio, as defined, to be greater than 3.25 to 1.00.
In addition to maintaining these financial covenants, the 2018 Credit Facility also limits our ability to enter into certain business transactions, such as to incur indebtedness or liens, to acquire businesses or dispose of material assets, make restricted payments, pay dividends (limited to $20.0 million per year) and to conduct other transactions as further defined in the 2018 Credit Facility. Some of these limitations, however, do not take effect so long as total leverage is less than or equal to 2.75 to 1.00 and available liquidity exceeds $25$25.0 million. Substantially all of our domestic assets, with the exception of real property, are pledged as collateral for the 2018 Credit Facility.
Issuer Purchases of Equity Securities
On August 30, 2018, our Board of Directors approved a stock repurchase program that authorized the repurchase of up to $60.0 million worth of shares of our common stock. Repurchases under the new program will bewere made in open market transactions or privately negotiated transactions, subject to market conditions, applicable legal requirements and other relevant factors. The program does not have an expiration date or a limit on the number of shares that may be purchased. During the yearyears ended October 31, 2018,2021, 2020 and 2019, we purchased 1,900,000478,311, 450,000 and 583,398 shares, respectively, at a cost of $32.0$11.2 million, $7.2 million and $9.6 million, respectively, under this program.
Contractual Obligations and Commercial Commitments
The following table summarizes our known contractual obligations and commitments as of October 31, 2018: |
| | | | | | | | | | | | | | | | | | | |
| | Payments Due by Period |
| | Total | | 2019 | | 2020-2021 | | 2022-2023 | | Thereafter |
| Contractual Obligations: | (In thousands) |
Long-term debt, including interest(1) | $ | 232,070 |
| | $ | 7,414 |
| | $ | 14,828 |
| | $ | 209,828 |
| | $ | — |
|
Capital leases(2) | 17,043 |
| | 1,523 |
| | 1,960 |
| | 1,683 |
| | 11,877 |
|
Operating leases(3) | 49,651 |
| | 8,407 |
|
| 12,152 |
| | 8,818 |
| | 20,274 |
|
Unconditional purchase obligations(4) | 17,761 |
| | 17,761 |
| | — |
| | — |
| | — |
|
Total contractual cash obligations(5) | $ | 316,525 |
| | $ | 35,105 |
| | $ | 28,940 |
| | $ | 220,329 |
| | $ | 32,151 |
|
| |
(1)
| Interest on our long-term debt was computed using rates in effect at October 31, 2018. |
| |
(2)
| Capital leases includes a related party capital lease arrangements at HLP for a warehouse acquired in February 2017. |
| |
(3)
| Operating leases include facilities, light vehicles, forklifts, office equipment and other operating equipment. |
| |
(4)
| The unconditional purchase obligations consist of commitments to buy miscellaneous parts, inventory, and expenditures related to capital projects in progress.
|
| |
(5)
| This table excludes tax reserves recorded in accordance with ASC Topic 740 “Income Taxes,” as we are unable to reasonably estimate the timing of future cash flows related to these reserves.
|
During fiscal 2019, we expect to contribute approximately $0.8 million to our pension plan to maintain our 100% funding threshold and meet our minimum contribution requirements. Pension contributions beyond 2019 cannot be determined since the amount of any contribution is heavily dependent on the future economic environment and investment returns on pension plan assets. Obligations are based on current and projected obligations of the plans, performance of the plan assets, if applicable, and the timing and amount of funding contributions. At October 31, 2018, we have recorded a long-term liability for deferred pension and postretirement benefits totaling $4.2 million. We believe the effect of the plans on liquidity is not significant to our overall financial condition.
Our supplemental benefit plan and deferred compensation plan liabilities fluctuate based on changes in the market value of certain equity securities, including our common stock. As of October 31, 2018, our liability under the supplemental benefit plan2021, this share repurchase authorization was exhausted and the deferred compensation plan was approximately $4.0 million and $3.5 million, respectively.program is now complete.
The following table reflects other commercial commitments or potential cash outflows that may result from a contingent event.
|
| | | | | | | | | | | | | | | | | | | |
| | Amount of Commitment Expiration per Period |
| | Total | | 2018 | | 2019-2020 | | 2021-2022 | | Thereafter |
| Other Commercial Commitments: | (In thousands) |
| Standby letters of credit | $ | 5,300 |
| | $ | 5,300 |
| | $ | — |
| | $ | — |
| | $ | — |
|
Off-Balance Sheet Arrangements
We do not have any off-balance sheet arrangements, as such term is defined in the rules promulgated by the SEC, that we believe would be material to investors and for which it is reasonably likely to have a current or future effect on our financial condition, results of operations, liquidity, capital expenditures or capital resources.
Effects of Inflation
We have experienced the impact of inflation on our cost of raw materials, labor, freight and overhead. While we utilize contractual price indexing along with periodic base price increases to minimize the effect of inflation on our results, we have not been able to fully recover all of the inflationary cost increases. We believe inflation has not had a significant effect on our earnings or financial position over the previous three fiscal years. We cannot provide assurance, however, that our results of operations and financial position will not be materially impacted by inflation in the future.
Critical Accounting Policies and Estimates
The preparation of our financial statements in accordance with accounting principles generally accepted in the United States of America (U.S. GAAP) requires us to make estimates and assumptions that affect the reported amount of assets, liabilities, revenues and expenses and related disclosures of contingent assets and liabilities. Estimates and assumptions about future events and their effects cannot be perceived with certainty. Estimates may change as new events occur, as more experience is acquired, as additional information becomes available and as our operating environment changes. We base our estimates on historical experience and on various other assumptions that we believe are reasonable under the circumstances, and that we believe provide a basis for making judgments about the carrying value of assets and liabilities that are not readily available through open market quotes. We must use our judgment with regard to uncertainties in order to make these estimates. Actual results could differ from these estimates.
We believe the following are the most critical accounting policies used in the preparation of our consolidated financial statements as well as the significant judgments and uncertainties affecting the application of these policies. We consider an estimate to be critical if it is subjective and if changes in the estimate using different assumptions would result in a material impact to our financial position or results of operations.
Revenue Recognition
We recognize revenue when products are shipped and title has passed to the customer. Revenue is deemed to be realized or earned when the following criteria is met: (a) persuasive evidence that a contractual sales arrangement exists; (b) delivery has occurred; (c) the price to the buyer is fixed or determinable; and (d) collection is reasonably assured. Sales allowances and customer incentives are treated as reductions to revenue and are provided for based on historical experience and current estimates.
Allowance for Doubtful Accounts
We record trade accounts receivable at billed amounts, less an allowance for doubtful accounts. This allowance is established to estimate the risk of loss associated with our trade receivables which may arise due to the inability of our customers to pay or due toWhile there have been no changes in circumstances. The allowance is maintained at a level thatthe application of principles, methods, and assumptions used to determine our significant estimates, we consider appropriate based on factors that affect collectability, including: (a) historical trends of write-offs, recoveries and credit losses; (b) the credit quality of our customers; and (c) projected economic and market conditions. Different assumptions or changes in economic circumstances could result in changesmay be required to the allowance. Our historical bad debt expense has approximated 0.1% of sales for the years ended October 31, 2018, 2017 and 2016. If bad debt expense increased by 1% of net sales, the impact on operating results would have been a decrease in net income of $9.2 million and $6.4 million for the years ended October 31, 2018 and 2017, respectively, and an increase in net loss of $3.1 million for the year ended October 31, 2016.
Business Combinations - Contingencies
We apply the acquisition method ofrevise certain accounting for business combinations in accordance with U.S. GAAP, which requires us to make use of estimates and judgments to allocate the purchase price paid for acquisitions to the fair value of the net assets and liabilities acquired. We use established valuation techniques and engage reputable valuation specialists to assist us with these valuations. However, there is a risk that we may not identify all pre-acquisition contingencies or that our estimates may not reflect the actual results when realized. We utilize a reasonable measurement period to record any adjustment related to the opening balance sheet (generally, less than one year). Aftereconomic and business impact of the measurement period, changesCOVID-19 pandemic, such as, but not limited to, the opening balance sheet can result in the recognition of income or expense as period costs. To the extent these items stem from contingencies that existed at the balance sheet date, but are contingent upon the realization of future events, the cost is charged to expense at the time the future event becomes known. In November 2016, we settled an earn-out provisionthose related to the HLP acquisition for $8.5 million. We usedvaluation of goodwill, intangibles, long-lived assets, accounts receivable, and inventory, which could have a probability-weighted estimate to value this liability, discounted usingmaterial adverse effect on our incremental borrowing rate. We recognized the change in this liability as income/expense over time to reflect the time valuefinancial position and results of money and changes in the probability weighting as to when the former owner would elect a measurement period pay-out. If our purchase accounting estimates are not correct, or if we do not recognize contingent assets or liabilities accurately, we may incur losses.operations.
Impairment or Disposal of Long-Lived Assets
Property, Plant and Equipment and Intangible Assets with Defined Lives
We make judgments and estimates in conjunction with the carrying value of our long-term assets, including property, plant and equipment, and identifiable intangibles. These judgments may include the basis for capitalization, depreciation and amortization methods and the useful lives of the underlying assets. In accordance with U.S. GAAP, we review the carrying values of these assets for impairment whenever events or changes in circumstances indicate that the carrying value may not be recoverable. We determine that the carrying amount is not recoverable if it exceeds the sum of the undiscounted cash flows expected to result from the use and eventual disposition of the asset. If the carrying value exceeds the sum of the undiscounted cash flows and after considering alternate uses for the asset, an impairment charge would be recorded in the period in which such review is performed. We measure the impairment loss as the amount by which the carrying amount of the long-lived asset exceeds its fair value. Fair value is determined by reference to quoted market prices in active markets, if available, or by calculating the discounted cash flows associated with the use and eventual disposition of the asset. Therefore, if there are indicators of impairment, we are required to make long-term forecasts of our future revenues and costs related to the assets subject to review. Forecasts require assumptions about demand for our products and future market conditions. Although there may be no indicators of impairment in the current period, unanticipated changes to assumptions or circumstances in future
periods could result in an impairment charge in the period of the change.change. No impairment charges werewere incurred with regard to our property, plant and equipment for the years ended October 31, 2018, 20172021, 2020 and 2016.2019.
We monitor relevant circumstances, including industry trends, general economic conditions, and the potential impact that such circumstances might have on the valuation of our identifiable intangibles. Events and changes in circumstances that may cause a triggering event and necessitate such a review include, but are not limited to: a decrease in sales for certain customers, improvements or changes in technology, and/or a decision to phase-out a trademark or trade name. Such events could negatively impact the carrying value of our identifiable intangibles. It is possible that changes in such circumstances or in the numerous variables associated with the judgments, assumptions, and estimates made by us in assessing the appropriate valuation of our identifiable intangibles could require us to further write down a portion of our identifiable intangibles and record related non-cash impairment charges in the future. We apply a variety of techniques to establish the carrying value of our intangible assets, including the relief from royalty and excess current year earnings methods.
During October 2016 and continuing throughout 2017, we determined that a triggering event occurred which necessitated a review of our long-term assets as prescribed above (expected reduction in volume for our United States vinyl business and results below our forecasts for Woodcraft). Based on an undiscounted cash flow analysis, we determined that our property, plant and
Goodwill
equipmentWe use the acquisition method to account for business combinations and, defined-lived intangible assets were not impaired. However, with regard to our United States vinyl business, we recorded a change in accounting estimate associated with shortening the remaining useful lives of certain property, plant and equipment to be retired as partextent that the purchase price exceeds the fair value of the announced closures of several plants. We recognized incremental depreciation expense of $4.3 million in 2017 as a result of the change in estimates. In addition,net assets acquired, we shortened the life of several defined-lived intangible assets, which resulted in the recognition of incremental amortization expense of $1.9 million for the year ended October 31, 2017. There have been no impairments or related expenses of property, plant and equipment and defined-lived intangibles during the year ended October 31, 2018.
Goodwill
record goodwill. In accordance with U.S. GAAP, we review various qualitative factorsare required to determine whether we believe there are indicators of impairment associated withevaluate our goodwill or other indefinite lived intangible assets. If no impairment is indicated, no additional testing is required. Otherwise, weat least annually. We perform aour annual goodwill impairment test annuallyassessment as of August 31, or more oftenfrequently if there are indicators of impairment dueexist. Qualitative factors that indicate impairment could include, but are not limited to, changes in circumstances or(i) macroeconomic conditions, (ii) industry and market considerations, (iii) cost factors, (iv) overall financial performance of the occurrence of certainreporting unit, and (v) other relevant entity-specific events. The test for impairment offirst step in our annual goodwill requires a two-step approach as prescribed inassessment is to perform the optional qualitative assessment allowed by ASC Topic 350 “Intangibles“Intangibles - Goodwill and Other”Other” (ASC 350). The first step of the impairment testIn our qualitative assessment, we evaluate relevant events or circumstances to determine whether it is to compare the carrying value of each reportable unit, including goodwill, to the fair value as determined using various valuation methods or a weighting of several such methods. If the fair value exceeds the carrying value, no further testing is required and there is no impairment charge. If the carrying value exceeds the fair value, a second step of the goodwill impairment test is required, whereby we compare the implied fair value of goodwill to its carrying value. The implied fair value of goodwill is determined by allocatingmore likely than not (i.e., greater than 50%) that the fair value of a reporting unit to the assets and liabilities ofis less than its carrying amount. If we determine that unit as if the reporting unit had been acquired in a business combination under which the consideration paid equals the calculated fair value of the reporting unit. The excess ofit is more likely than not that the fair value of a reporting unit overis less than its carrying amount, ASC 350 requires us to compare the amounts assigned to its assets and liabilities is the implied fair value of such reporting unit to its carrying value including goodwill. AnTo determine the fair value of our reporting units, we use multiple valuation techniques including a discounted cash flow analysis, using the applicable weighted average cost of capital, in combination with a market approach that uses market multiples and a selection of guideline public companies. This test requires us to make assumptions about the future growth of our business and the market in general, as well as other variables such as the level of investment in capital expenditure, growth in working capital requirements and the terminal or residual value of our reporting units beyond the periods of estimated annual cash flows. We use a third-party valuation firm to assist us with this analysis. If the fair value of each reporting unit exceeds its carrying value, no action is required. Otherwise, an impairment loss is recorded to the extent that the carrying amount of the reporting unit including goodwill exceeds the implied fair value of that goodwill for the particular reporting unit. We usebelieve the presentestimates and assumptions used in our impairment assessment are reasonable based on available market information, but variations in any of the assumptions could result in materially different calculations of fair value and determinations of whether or not an impairment is indicated during current or future periods.
As a result of quantitative assessments performed during the year ended October 31, 2019, we recorded impairment charges totaling $74.6 million during the year ended October 31, 2019, reducing the goodwill balance applicable to the reporting unit included in our NA Cabinet Components operating segment from $113.7 million to $39.1 million.
For the year ended October 31, 2020, the World Health Organization's declaration of COVID-19 as a global pandemic also created significant changes in market conditions that were indicators of triggering events which necessitated an evaluation of certain long-term assets, including goodwill, for potential impairment. We performed quantitative assessments based upon undiscounted cash flows we expected to realize associated with these assets over the remaining useful lives of the primary operating assets to the net book value of future cash flows, discounted at our weighted average cost of capital, to determine fair value in combination with the market approach. Future cash flows are projected based upon our long-term forecasts by reportable unitassets, including goodwill, and an estimated residual value. Our judgment is required in the estimation of future operating results and in determining the appropriate residual values of our reportable units. The residual values are determined by reference to an exchange transaction in an existing market for similar assets. Future operating results and residual values could reasonably differ from our estimates and a provision for impairment may be required in a future period depending upon such a change in circumstances or the occurrence of future events.that these assets, including goodwill, were not impaired.
As ofAt our annual testing date, August 31, 2018,2021, we had five reporting units with goodwill balances: two reporting units included in our NA Engineered ComponentsFenestration operating segment, two reporting units included in our EU Engineered ComponentsFenestration operating segment, and one reporting unit included in our NA Cabinet Components operating segment. For the reporting units in our NA Engineered Components and our EU Engineered Components operating segments, weWe performed a qualitative assessment of the two reporting units in the NA Fenestration segment and determinedone of the two reporting units in the EU Fenestration segment. This review included an analysis of historical goodwill test results, operating results relative to forecast, projected results over the next five years, and other measures and concluded that there were no indicators of impairment.potential impairment associated with these reporting units. Therefore, no additional goodwill impairment testing was deemed necessary for those units. For the reporting units in the NA Fenestration segment and the EU Fenestration segment that were assessed qualitatively. We also updated the quantitative assessments for the reportable unit included in ourthe NA Cabinet Components operating segment we performedand the first step ofsecond reportable unit in the goodwill impairment test at March 31, 2018, as our annual long-range planning effort produced lower forecasted results compared to the prior year's process, a potential indicator of impairment.EU Fenestration segment. We determined the fair value of thisthese reportable unitunits exceeded its carrying value by approximately 4.5%. At August 31, 2018, additional qualitative factors were considered and the step-one analysis was updated. The determined fair value of this reportable unit continued to exceed the carrying value by 7.2%.17.6% and 113.6%, respectively, and concluded that no impairment was necessary.
Restructuring
We account for restructuring costs in accordance with U.S. GAAP, whereby we accrue for one-time severance benefits pursuant to an approved plan of restructuring at the communication date, when affected employees have been notified of the potential severance and sufficient information has been provided for the employee to calculate severance benefits, in the event the employee is involuntarily terminated. In addition, we accrue costs associated with the termination of contractual commitments including operating leases at the time the lease is terminated pursuant to the lease provisions or in accordance with another agreement with the landlord. Otherwise, we continue to recognize operating lease expense through the cease-use date. After the cease-use date, we determine if our operating lease payments are at market. We assume sublet of the facility at the market rate. To the extent our lease obligations exceed the fair value rentals, we discount to arrive at the present value and record a liability. If the facility is not sublet, we expense the amount of the lease in the current period until sublet. For other costs directly related to the restructuring effort, such as equipment moving costs, we expense in the period incurred.
In October 2016, we announced the closure of three operating plants, two related to our United States vinyl operations, and one related to our kitchen and bathroom cabinet door business in Mexico. We expensed $0.5 million pursuant to these restructuring efforts as of October 31, 2016, including an accrual for one-time severance cost of $0.4 million included in accrued liabilities in the accompanying consolidated balance sheet. Our facility lease obligations were deemed to be at fair market value. In 2017, we
incurred costs related to these plant closures including equipment moving costs, additional employee termination and severance costs, retirements and inventory adjustments, operating lease costs, accelerated amortization and depreciation costs, and equipment lease termination costs. In addition, we incurred costs related to the closure of a kitchen and bathroom cabinet door plant in Lansing, Kansas. Restructuring costs totaled $4.6 million for the year ended October 31, 2017. During the year ended October 31, 2018, we negotiated the exit from one of the vinyl extrusion plants, and the lease for the plant in Lansing, Kansas expired. During the year ended October 31, 2018, we incurred $1.5 million of restructuring costs related to these leases, and expect to continue to incur costs related to the remaining vinyl plant during fiscal 2019 until such time we are able to sublet or otherwise negotiate an exit from the facility.
Income Taxes
We operate in various jurisdictions and therefore our income tax expense relates to income taxes in the United States, United Kingdom,U.S., U.K., Canada, and Germany, as well as local and state income taxes. We recognize the effect of a change in tax rates in the period of the change. We record the estimated future tax effects of temporary differences between the tax basis of assets and liabilities and the amounts reported in our consolidated balance sheets, as well as net operating losses and tax credit carry forward. We evaluate the carrying value of our net deferred tax assets and determine if our business will generate sufficient future taxable income to realize the net deferred tax assets. We perform this review for recoverability on a jurisdictional basis, whereby we consider both positive and negative evidence related to the likelihood of realization of the deferred tax assets. The weight given to the positive and negative evidence is commensurate with the extent to which the evidence can be objectively verified. We evaluate recoverability based on an estimate of future taxable income using the long-term forecasts we use to evaluate long-lived assets, goodwill and intangible assets for impairment, taking into consideration the future reversal of existing taxable temporary differences and reviewing our current financial operations. In the event that our estimates and assumptions indicate we will not generate sufficient future taxable income to realize our deferred tax assets, we will record a valuation allowance, to the extent indicated, to reduce our deferred tax assets to their realizable value.
Annually, we evaluate our tax positions to determine if there have been any changes in uncertain tax positions or if there has been a lapse in the statute of limitations with regard to such positions. Our liability for uncertain tax positions at October 31, 20182021 and 20172020 totaled $0.6 $1.4 million and $0.5 million, respectively, and related to certain federal and state tax items regarding the interpretation of tax laws and regulations.
We believe we will have sufficient taxable income in the future to fully utilize our unreserved deferred tax assets recorded as of October 31, 2018.2021, net of our valuation allowance. There is a risk that our estimates related to the future use of loss carry forwards and our ability to realize our deferred tax assets may not come to fruition, and that the results could materially impact our financial position and results of operations. We have recorded the benefit associated with the “patent box” deduction in the United Kingdom with regard to our operations at HLP. We believe that it is more likely than not that our deduction with regard to this position would be sustained upon examination. In addition, we recorded the effect of a statutory change in the deferred tax rate from 19% to 17% in the United Kingdom in 2017 results, which provided a discrete tax benefit of $1.0 million during the period. Our total gross deferred tax assets at October 31, 20182021 and 20172020 totaled $19.8 $13.8 million and $28.0$14.3 million, respectively, against which we had recorded a valuation allowance of $1.3$1.2 million and $1.3 million,$1.5 million, respectively.
Insurance
We manage our costs of workers’ compensation, group medical, property, casualty and other liability exposures through a combination of self-insurance retentions and insurance coverage with third-party carriers. Liabilities associated with our portion of this exposure are not discounted. We estimate our exposure by considering various factors which may include: (1) historical claims experience, (2) severity factors, (3) estimated claims incurred but not reported and (4) loss development factors, which are used to estimate how claims will develop over time until settled or closed. While we consider a number of factors in preparing our estimate of risk exposure, we must use our judgment to determine the amounts to accrue in our financial statements. Actual claims can differ significantly from estimated liabilities if future claims experience differs from historical experience, and if we determine that our assumptions used for analysis or our development factors are flawed. We do not recognize insurance recoveries until any contingencies relating to the claim have been resolved.
Inventory
We record inventory at the lower of cost or net realizable value. Inventories are valued using the first-in first-out (FIFO) and last-in first-out (LIFO) methods. We use the dollar-value link chain LIFO method, and the LIFO reserve is calculated on a consolidated basis in a single consolidated pool. We recorded an expense of $0.3 million associated with a change in LIFO for the year ended October 31, 2018. Conversely, we recorded a benefit associated with the change in the LIFO reserve of approximately $0.3 million for the year ended October 31, 2016. We did not record a LIFO reserve adjustment for the year ended October 31, 2017. When we integrate acquisitions into our business, we may value inventory utilizing either the LIFO or FIFO basis.method. Fixed costs related to excess manufacturing capacity have been expensed in the period, and therefore, are not capitalized into inventory. Inventory quantities are regularly reviewed and provisions for excess or obsolete inventory are recorded primarily based on our forecast of future demand and market conditions. Significant unanticipated changes to our forecasts or changes in the net realizable value of our inventory would require a change in the provisionprovision for excess or obsolete inventory. For the years ended October 31, 2018, 20172021, 2020 and 2016,2019, our inventory reserves excluding the LIFO reserve, are approximately 6%3%, 5%10%, and 6%5% of gross inventory, respectively. Assuming an increase in obsolescence equal to 1% of gross inventory, net income would have been reduced by $1.0 million and $0.7 million for the years ended October 31, 2018 and 2017, respectively, and net loss from continuing operations would have been increased by $0.3 million in 2016.
Retirement Plans
We sponsor a defined benefit pension plan and an unfunded postretirement plan that provides health care and life insurance benefits for a limited pool of eligible retirees and dependents. On January 1, 2020, we enacted changes to our pension plan whereby the benefits for all participants were frozen and thereafter those participants will receive increased benefits in the company sponsored defined contribution plan in lieu of participation in a defined benefit plan. The measurement of liabilities related to these plans is based on our assumptions related to future events, including expected return on plan assets rate of compensation increases, and healthcare cost trend rates. The discount rate reflects the rate at which benefits could be effectively settled on the measurement date. We determine our discount rate using a RATE: Link Model whereby target yields are developed from bonds across a range of maturity points, and a curve is fitted to those targets. Spot rates (zero coupon bond yields) are developed from the curve and used to discount benefit payments associated with each future year. This model assumes spot rates will remain level beyond the 30-year point. We determine the present value of plan benefits by applying the discount rates to projected benefit cash flows. Actual pension plan asset investment performance, as well as other economic experience such as discount rate and demographic experience, will either reduce or increase unamortized pension losses at the end of any fiscal year, which ultimately affects future pension costs.
The effects of the decrease in selected assumptions, assuming no changes in benefit levels and no amortization of gains or losses for the pension plans in fiscal 2018, is shown below: |
| | | | | | | | |
| | | Increase in Projected Benefit Obligation | | Increase in Net Periodic Benefit Cost |
| Changes in Assumptions: | | (Dollar amounts in thousands) |
| 1% decrease in discount rate | | $ | 4,426 |
| | $ | 548 |
|
| 1% decrease in expected long-term rate of return on plan assets | | N/A |
| | $ | 309 |
|
As of October 31, 2018,2021, our projected benefit obligation (PBO) and accumulated benefit obligation (ABO) each exceeded the fair value of the plan assets by $3.9$4.7 million and $3.3 million, respectively.. As a comparison, our PBO and ABO exceeded the fair value of plan assets by $4.0$10.7 million and $3.1 million, respectively, as of October 31, 2017.2020. During fiscal 2018,2021, we contributed $0.8$0.5 million to the pension plan to continue to target a 100% funding threshold and to meet minimum contribution requirements. We expect to continue to fund at this level for fiscal 2019. Expected contributions are dependent on many variables, including the variability of the market value of the assets as compared to the obligation and other market or regulatory conditions. In addition, we take into
consideration our business investment opportunities and our cash requirements. Accordingly, actual funding may differ greatly from current estimates.
Under U.S. GAAP, we are not required to immediately recognize the effects of a deviation between actual and assumed experience under our pension plan, or to revise our estimate as a result. This approach allows the favorable and unfavorable effects that fall within an acceptable range to be netted and disclosed as an unrecognized gain or loss. As of October 31, 20182021 and 2017,2020, a net actuarial loss of $3.0$4.5 million and $5.2and $9.9 million, respectively, was included in our accumulated other comprehensive income (loss). income. There were no net prior service costs or transition obligations for the years ended October 31, 20182021 and 2017.2020. The effect on fiscal years after 20182021 will depend on the actual experience of the plans.
Mortality assumptions used to determine the obligations for our pension plans are based on the RP-2006Pri-2012 base mortality table with MP-2018MP-2020 mortality improvement scale.
Contractual Obligations and Commercial Commitments
Stock-Based Compensation
We have issued stock-based compensationcommitments to buy miscellaneous parts, inventory, and expenditures related to capital projects in progress. In addition, during fiscal 2022, we do not expect to need to contribute to our pension plan to meet our minimum contribution requirements. Pension contributions beyond 2022 cannot be determined since the formamount of stock options to directors, employees and officers, and non-vested restricted stock awards to certain key employees and officers. We apply the provisions of ASC Topic 718 “Compensation - Stock Compensation” (ASC 718), to determine the fair value of stock option awardsany contribution is heavily dependent on the date of grant using the Black-Scholes valuation model. We recognize the fair value as compensation expensefuture economic environment and investment returns on a straight-line basis over the requisite service periodpension plan assets. Obligations are based on current and projected obligations of the awardplans, performance of the plan assets, if applicable, and the timing and amount of funding contributions. At October 31, 2021, we have recorded a long-term liability for deferred pension benefits totaling $4.7 million. We believe the effect of the plans on liquidity is not significant to our overall financial condition.
Our supplemental benefit plan and deferred compensation plan liabilities fluctuate based on awards ultimately expected to vest. Stock options granted to directors vest immediately while the stock options granted to our employees and officers typically vest ratably over a three-year period with service and continued employment as the vesting conditions. For new option grants to retirement-eligible employees, we recognize expense and vest immediately upon grant, consistent with the retirement vesting acceleration provisions of these grants. For employees near retirement age, we amortize such grants over the period from the grant date to the retirement-eligibility date if such period is shorter than the standard vesting schedule. For grants of non-vested restricted stock, we calculate the compensation expense at the grant date as the number of shares granted multiplied by the closing stock price of our common stock on the date of grant. This expense is recognized ratably over the vesting period. Our non-vested restricted stock grants to officers and employees cliff vest over a three-year period with service and continued employment as the only vesting criteria. Our fair value determination of stock-based payment awards on the date of grant using an option-pricing model is affected by our stock price as well as assumptions regarding a number of highly complex and subjective variables. These variables include, but are not limited to, our expected stock price volatility over the term of the awards, actual and projected employee stock option exercise behavior over the expected term, our dividend rate, risk-free rate and expectation with regards to forfeitures. Option-pricing models were developed for use in estimating the value of traded options that have no vesting or hedging restrictions and are fully transferable. Because our employee stock options have certain characteristics that are significantly different from traded options, and because changes in the subjective assumptions can materially affect the estimated value, the valuation models may not provide an accurate measure of the fairmarket value of certain equity securities, including our employee stock options. Accordingly,common stock. As of October 31, 2021, our liability under the supplemental benefit plan and the deferred compensation plan was approximately $2.9 million and $3.4 million, respectively.
Off-Balance Sheet Arrangements
We do not have any off-balance sheet arrangements, as such term is defined in the rules promulgated by the SEC, that value may notwe believe would be indicativematerial to investors and for which it is reasonably likely to have a current or future effect on our financial condition, results of the fair value observed in a willing buyer/willing seller market transaction.operations, liquidity, capital expenditures or capital resources.
Effects of Inflation
We have granted other awards which are linked toexperienced the performanceimpact of inflation on our common stock, but will settle in cash rather than the issuancecost of shares of our common stock. The value of these awards fluctuates with changes in our stock price, with the resulting gains or losses reflected in the period of the change. We have recorded currentraw materials, labor, freight and non-current liabilities related to these awards reflected in our consolidated balance sheets at October 31, 2018 and 2017, included elsewhere within this Annual Report on Form 10-K.
In addition, we have granted performance share awards which settle in cash and shares. These awards have vesting criteria based on a market condition (relative total shareholder return) and an internal performance condition (earnings per share growth). We utilize a Monte Carlo simulation model to value the market condition and our stock price on the date of grant to value the internal performance condition. We bifurcate the liability and equity portion of the awards (amounts expected to settle in cash and shares, respectively) and recognize expense ratably over the vesting period of three years. We estimate that the performance measures will be met and shares will vest at target until the year of settlement (third year of cliff vesting). Foroverhead, particularly during the year ended October 31, 2018,2021. Although we douse contractual price indexing along with periodic base price increases to minimize the effect of inflation on our results, we have not expect any sharesbeen able to vest.
We also awarded performance restricted stock units to key employees and officers in December 2017. These awards cliff vest upon a three-year service period with the absolute total shareholder return of our common stock over this three-year term as the vesting criteria. The number of performance restricted stock units earned is variable depending on the metric achieved, and the settlement method is 100% in our common stock, with accrued dividends paid in cash at the time of vesting, assuming the shares had been outstanding throughout the performance period. To value the performance restricted stock units, we utilize a Monte Carlo simulation model to arrive at a grant-date fair value. This amount will be adjusted for forfeitures and expensed over the three-year termfully recover all of the award with a credit to additional paid-in-capital. Similar to performance shares, the performance restricted stock units areinflationary cost increases. We cannot provide assurance, however, that our results of operations and financial position will not considered outstanding shares, do not have voting rights, and are excluded from diluted weighted-average shares used to calculate earnings per share until the performance criteria is probable to resultbe materially impacted by inflation in the issuance of contingent shares.future.
Recent Accounting Pronouncements
In May 2017,June 2016, the Financial Accounting Standards Board (FASB) issued Accounting Standards Update (ASU) No. 2017-09, Compensation - Stock Compensation (Topic 718), which provides guidance as to when changes in share-based payment awards under Topic 718 should be accounted for as a modification of the award. Essentially, the changes should be considered a modification unless specific criteria are met. This guidance becomes effective for annual periods and interim periods within those annual periods, beginning after December 15, 2017. We will adopt this guidance in Fiscal 2019. We do not expect this guidance to have a material impact on our consolidated financial statements.
In March 2017, the FASB issued ASU No. 2017-07, Compensation - Retirement Benefits (Topic 715), Improving the Presentation of Net Periodic Pension Cost and Net Periodic Postretirement Benefit Cost. This update provides explicit guidance on how to present the service cost component and other components of net benefit cost in the income statement and allows only
the service cost component of net benefit cost to be eligible for capitalization. The amendments in this update are effective for annual periods beginning after December 15, 2017. We anticipate adopting ASU 2017-07 in fiscal 2019 and are currently evaluating the impact on our consolidated financial statements.
In January 2017, the FASB issued ASU 2017-04, Intangibles - Goodwill and Other (Topic 350). This guidance simplifies the current two-step goodwill impairment test by eliminating the second step. Essentially, the entity would compare the fair value of a reporting unit with its carrying value amount and recognize an impairment charge for the amount by which the carrying value exceeds the fair value. The resulting loss would be limited to the amount of goodwill. This guidance also eliminates the requirement for a reporting unit with zero or negative carrying value to perform a qualitative assessment of goodwill and apply step-two of the goodwill impairment test if the qualitative assessment fails. Thus, the same impairment assessment will be applied to all reporting units (even if the carrying value is zero or negative). This guidance should be applied prospectively and becomes effective for public entities for the annual period, and interim periods within that year, beginning after December 15, 2019. We will adopt this guidance in Fiscal 2021. We are currently evaluating the impact that this guidance will have on our consolidated financial statements.
In January 2017, the FASB issued ASU 2017-01, Business Combinations (Topic 805), which provides clarity when determining whether a set of assets and activities constitutes a business. Specifically, if substantially all of the fair value of the gross assets acquired (or disposed of) is concentrated in a single identifiable asset or a group of similar identifiable assets, the set is not deemed to be a business. This guidance becomes effective for public entities for annual periods beginning after December 15, 2017. We will adopt this guidance in Fiscal 2019. We are currently evaluating the impact that this guidance will have on our consolidated financial statements.
In August 2016, the FASB issued ASU No. 2016-15, Statement of Cash Flows (Topic 230), Classification of Certain Cash Receipts and Cash Payments. This amendment is intended to reduce diversity in practice as to how certain cash receipts and cash payments are presented and classified in the statement of cash flows by providing guidance for several specific cash flow issues. This guidance becomes effective for fiscal years beginning after December 15, 2017 and, therefore, we will adopt this pronouncement in fiscal 2019. We are currently evaluating the impact of this pronouncement on our consolidated financial statements.
In June 2016, the FASB issued ASU No. 2016-13, Financial Instruments - Credit Losses (Topic 326). This amendment replacesASU sets forth a “current expected credit loss” model, which requires the incurred loss impairment methodology in current U.S. GAAP and requires that financial assets be measured on an amortized cost basis and presented at the net amount expected to be collected. This new methodology reflectsmeasurement of all expected credit losses (rather than probable credit losses) and requires consideration of a broader range of supportable information when determining these estimated credit losses, including relevantfor financial instruments or other assets (e.g., trade receivables), held at the reporting date based on historical experience, current conditions, and reasonable supportable forecasts to determine collectability. In addition, the amendment provides guidance with regard to the use of an allowance for credit losses for purchased financial assets and available-for-sale debt securities. This amendment becomes effective for fiscal years beginning after December 15, 2019, including interim periods within that fiscal year.forecasts. We expect to adoptadopted this amendment during fiscal 2021,on November 1, 2020, with no material impact on our condensed consolidated financial statements.
In February 2016,statements as pre-existing processes for estimating credit losses for trade receivables aligned with the FASB issued ASU No. 2016-02, Leases (Topic 842): Amendments to the Accounting Standards Codification. These amendments replace current guidance and require the recognition of lease assets and lease liabilities by lessees for those leases classified as operating leases under previous U.S. GAAP. The amendments apply to any entity that enters into leasing arrangements. This guidance becomes effective for fiscal years beginning after December 15, 2018, and, therefore, we will adopt this pronouncement in fiscal 2020. We are currently evaluating the impact of this pronouncement on our consolidated financial statements.
In May 2014, the FASB issued ASU No. 2014-09, Revenue from Contracts with Customers, which supersedes and replaces existing revenue recognition guidance, including industry specific guidance. This guidance prescribes a principles-based approach to revenue recognition under which revenue is recognized as goods and services are transferred to the customer in the amount the entity expects to be entitled to in exchange for those goods or services. In addition, this guidance requires additional disclosures regarding the nature, amount, timing and uncertainty of revenue from contracts with customers. We will adopt this guidance as of November 1, 2018 using the modified retrospective approach with a cumulative adjustment to retained earnings.
As of October 31, 2018, we have completed the evaluation of our revenue streams and have reviewed samples of customer contracts that we believe fairly represent contract traits that could be accounted for differently under amended guidance. We have evaluated the potential impact of the new revenue standard on each of the selected contracts including: (i) estimating the contract consideration under the new standard, (ii) identifying the performance obligations within the customer contracts, (iii) calculating the anticipated allocation of contract consideration to each performance obligation, (iv) determining the timing of revenue recognition for each performance obligation, and (v) determining the classification of the contract revenue for disclosure purposes.expected credit loss model.
Based on the contract reviews and evaluations performed to date, we do not anticipate any material impacts from implementing the amended guidance.
Item 7A. Quantitative and Qualitative Disclosures About Market Risk.
The following discussion of our exposure to various market risks contains “forward looking statements” regarding our estimates, assumptions and beliefs concerning our exposure. Although we believe these estimates and assumptions are reasonable in light of information currently available to us, we cannot provide assurance that these estimates will not materially differ from actual results due to the inherent unpredictability of interest rates, foreign currency rates and commodity prices as well as other factors. We do not use derivative financial instruments for speculative or trading purposes.
Interest Rate Risk
Our outstanding debt bears interest at variable rates and accordingly is sensitive to changes in interest rates. Based upon the balances of the variable rate debt at October 31, 2018,2021, a hypothetical 1.0% increase or decrease in interest rates could result in approximately $2.0 million $0.4 million of additional pre-tax charges or credit to our operating results. This sensitivity pertains primarily to our outstanding Term Loan A and revolving credit facility borrowings outstanding under the Credit AgreementFacility as of October 31, 2018.2021.
Foreign Currency Rate Risk
Our international operations have exposure to foreign currency rate risks, primarily due to fluctuations in the Euro, the British Pound Sterling and the Canadian Dollar. From time to time, we enter into foreign exchange contracts associated with our operations to manage a portion of the foreign currency rate risk.
The notional and fair market values There were no derivatives outstanding as of these positions at October 31, 2018 and 2017, were as follows:
|
| | | | | | | | | | | | | | |
| | | Notional as indicated | | Fair Value in $ |
| | | October 31, 2018 | | October 31, 2017 | | October 31, 2018 | | October 31, 2017 |
| Foreign currency exchange derivatives: | | (In thousands) |
| Buy EUR, Sell USD | EUR | 455 |
| | 1,271 |
| | $ | 1 |
| | $ | 24 |
|
| Sell CAD, Buy USD | CAD | 229 |
| | 320 |
| | — |
| | 1 |
|
| Sell GBP, Buy USD | GBP | 22 |
| | 75 |
| | — |
| | — |
|
| Buy EUR, Sell GBP | EUR | 34 |
| | 30 |
| | — |
| | (1 | ) |
| Buy USD, Sell EUR | USD | 12 |
| | — |
| | — |
| | — |
|
At October 31, 2018 and 2017, we held2021 or 2020. These foreign currency derivative contracts hedginghedge cross-border intercompany and commercial activity for our insulating glass spacer business. Although these derivatives hedge our exposure to fluctuations in foreign currency rates, we do not apply hedge accounting and therefore, the change in the fair value of these foreign currency derivatives is recorded directly to other, income and expensenet in the accompanying consolidated statements of income (loss). To the extent the gain or loss on the derivative instrument offsets the gain or loss from the remeasurement of the underlying foreign currency balance, changes in exchange rates should have no effect. See Note 13, "Derivative Instruments", contained elsewhere herein this Annual Report on Form 10-K.
DuringOn June 23, 2016, citizens of the October 2018, we settled an unhedged foreign currency intercompany loan which facilitated the HLP acquisition. For the year ended October 31, 2018, we recorded a realized loss of less than $0.1 million related to this foreign currency exposure. For the year ended October 31, 2017, we recorded a foreign currency gain of $0.7 million, of which $0.5 million was realized.
In July 2016, the United KingdomU.K. voted to exit the European Union (commonly referred(E.U.) (referred to as “Brexit”), which hasBrexit). Since the 2016 Brexit vote, we have been impacted the valuationby foreign currency fluctuations of the British Pound Sterling relative to other currencies usedand delays within the supply chain for the procurement of raw materials. These have caused fluctuations in our business, including our reportingforeign currency translation impacts, as well as raw material cost increases from upstream suppliers located outside of the United States Dollar. Although we do not know the long-term effects of this change, our operations have been impacted somewhat primarily with regard to the cost of materials purchased by our British subsidiaries from suppliers who ultimately source from outside the United Kingdom. We continue to monitor our exposure to changes in exchange rates.
U.K.
Commodity Price Risk
We purchase polyvinyl resin (PVC)PVC as the significant raw material consumed in the manufacture of vinyl extrusions. We have a monthly resin adjusteradjusters in place with a majority of our customers and our resin supplier that is adjusted based upon published industry indices for lagging resin prices for the prior month. This adjusterprices. These adjusters effectively sharesshare the base pass-through price changes of PVC with our customers commensurate with the market at large. Our long-term exposure to changes in PVC prices is somewhat mitigated due to the contractual component of the resin adjuster program. In addition,However, there is a level of exposure to short-term volatility due to the one month lag.timing lags.
We also chargeadjust the pricing of petroleum-based raw materials for the majority of our customers a surcharge related to petroleum-based rawwho purchase products using these materials. The surchargeThis is intended to offset the risingfluctuating cost of products which are highly correlated to the price of oil including butyl and other oil-based raw materials. The surcharge is in place with the majority of our customers who purchase these products andThis program is adjusted monthly based upon the 90-day average published price for Brent crude. The oil-based raw materials that we purchase are subject to similar pricing schemes. As such, our long-term exposure to changesincreases in oil-based raw material prices is significantly reduced under this surcharge program.
Similarly, WoodcraftNA Cabinet Components includes a surchargeprice index provision in the majority of its customer arrangements to insulate against significant fluctuations in the price for various hardwood products used as the primary raw material for kitchen and bathroom cabinet doors. Like our vinyl extrusion business, we are exposed to short-term volatility in wood prices due to a lag in the timing of price updates which generally could extend for up to three months.
From timeWe have begun implementing additional programs for other raw materials to time,facilitate more accurate pricing and reduce our exposure to changing material costs when necessary, however these are also subject to timing lags. While we maintain surcharges and other adjusters to manage our exposure to changes in the normal course of business, we may enter into firm price sales commitments with customers in which aluminum is an integral fabrication input. In an effort to protect cost of sales from the effects of changing prices of aluminum,our critical raw materials, we enter into firm price raw material purchase commitments,use several commodities in our business that are not covered by contractual surcharges or adjusters for which are designated as "normal purchases" under Accounting Standards Codification Topic 815, "Derivativespricing can fluctuate, including PVC compound micro ingredients, silicone and Hedging." As a result, firm price sales commitments are matched with firm price raw material purchase commitments so that changes in aluminum prices should have no effect. While we consider the derivative contracts to provide an economic hedge against changes in aluminum prices, the derivatives have not been designated as hedges in accordance with ASC 815 for accounting purposes. As such, any mark-to-market net gain or loss is recorded as a period cost with the offsetting amount reflected as an asset or liability on the balance sheet. During the year ended October 31, 2016, we incurred a gain of less than $0.1 million on a forward purchase contract with a notional amount of approximately 1.4 million pounds of aluminum. There were no contracts outstanding as of October 31, 2016, and there were no such contracts utilized during the years ended October 31, 2018 and 2017. For additional details, see Note 13, "Derivative Instruments," contained elsewhere herein this Annual Report on Form 10-K.other inputs.
Item 8. Financial Statements and Supplementary Data.
INDEX TO FINANCIAL STATEMENTS
Quanex Building Products Corporation
| | | | | |
| Page |
| Page |
| Reports of Independent Registered Public Accounting Firm | |
| Management's Annual Report on Internal Control over Financial Reporting | |
| Consolidated Financial Statements | |
| Consolidated Balance Sheets | |
| Consolidated Statements of Income (Loss) | |
| Consolidated Statements of Comprehensive Income (Loss) | |
| Consolidated Statement of Stockholders’ Equity | |
| Consolidated Statements of Cash Flow | |
| |
REPORT OF INDEPENDENT REGISTERED PUBLIC ACCOUNTING FIRM
Board of Directors and Stockholders
Quanex Building Products Corporation
Opinion on the financial statements
We have audited the accompanying consolidated balance sheets of Quanex Building Products Corporation (a Delaware corporation) and subsidiaries (the “Company”) as of October 31, 20182021 and 2017,2020, the related consolidated statements of income (loss), comprehensive income (loss), changes in stockholders’ equity, and cash flows for each of the three years in the period ended October 31, 2018,2021, and the related notes (collectively referred to as the “financial statements”). In our opinion, the financial statements present fairly, in all material respects, the financial position of the Company as of October 31, 20182021 and 2017,2020, and the results of its operations and its cash flows for each of the three years in the period ended October 31, 2018,2021, in conformity with accounting principles generally accepted in the United States of America.
We also have audited, in accordance with the standards of the Public Company Accounting Oversight Board (United States) (“PCAOB”), the Company’s internal control over financial reporting as of October 31, 2018,2021, based on criteria established in the 2013 Internal Control-IntegratedControl—Integrated Framework issued by the Committee of Sponsoring Organizations of the Treadway Commission (“COSO”), and our report dated December 11, 201817, 2021 expressed an unqualified opinion.
Basis for opinion
These financial statements are the responsibility of the Company’s management. Our responsibility is to express an opinion on the Company’s financial statements based on our audits. We are a public accounting firm registered with the PCAOB and are required to be independent with respect to the Company in accordance with the U.S. federal securities laws and the applicable rules and regulations of the Securities and Exchange Commission and the PCAOB.
We conducted our audits in accordance with the standards of the PCAOB. Those standards require that we plan and perform the audit to obtain reasonable assurance about whether the financial statements are free of material misstatement, whether due to error or fraud. Our audits included performing procedures to assess the risks of material misstatement of the financial statements, whether due to error or fraud, and performing procedures that respond to those risks. Such procedures included examining, on a test basis, evidence supporting the amounts and disclosures in the financial statements. Our audits also included evaluating the accounting principles used and significant estimates made by management, as well as evaluating the overall presentation of the financial statements. We believe that our audits provide a reasonable basis for our opinion.
Critical audit matters
The critical audit matter communicated below is a matter arising from the current period audit of the financial statements that was communicated or required to be communicated to the audit committee and that: (1) relate to accounts or disclosures that are material to the financial statements and (2) involved our especially challenging, subjective, or complex judgments. The communication of critical audit matter does not alter in any way our opinion on the financial statements, taken as a whole, and we are not, by communicating the critical audit matter below, providing a separate opinion on the critical audit matter or on the accounts or disclosures to which it relates.
Quantitative goodwill impairment assessment of the reporting unit included in the North American Cabinet Components operating segment
As described in Note 1 to the financial statements, the Company performs its annual goodwill impairment test as of August 31. The Company performed a quantitative assessment of the reporting unit included in the North American Cabinet Components operating segment primarily due to the recent impairment of goodwill during the second and fourth quarters of 2019 and the history of a narrow margin of fair value over carrying value in the quantitative assessments performed in prior years. We identified the estimation of the fair value of this reporting unit as a critical audit matter.
The principal considerations for our determination that the estimation of the fair value of this reporting unit is a critical audit matter relates to the income approach which is one method management uses to estimate the fair value of the reporting unit. Auditing the fair value of the reporting unit involved a high degree of auditor judgment, subjectivity and audit effort in evaluating management’s significant assumptions, including future cash flows related to the reporting unit and the weighted average cost of capital (WACC). In addition, the audit effort involved the use of valuation specialists to assist in performing these procedures and evaluating the audit evidence obtained.
Our audit procedures related to the estimation of the fair value of this reporting unit included the following, among others.
•We tested the effectiveness of controls over goodwill impairment including those over the determination of fair value, including controls relating to management’s development of forecasts of future revenues, earnings, cash flows and WACC.
•We evaluated management’s ability to accurately forecast revenues, earnings and cash flows by comparing actual results to management’s historical forecasts.
•We evaluated the reasonableness of management’s forecasts of revenues, earnings and cash flows by comparing the forecasts to historical revenues, earnings and cash flows, current budgets, our understanding of the current business strategy, communications to the Board of Directors, press releases and industry reports.
•We utilized our valuation specialists to evaluate the reasonableness of the WACC used by management, including the testing of underlying source information and developing a range of independent estimates and comparing those to the rate selected by management.
|
| |
| /s/ GRANT THORNTON LLP | |
| |
| We have served as the Company's auditor since 2014. | |
| |
| Houston, Texas | |
December 11, 2018 | 17, 2021 |
REPORT OF INDEPENDENT REGISTERED PUBLIC ACCOUNTING FIRM
Board of Directors and Stockholders
Quanex Building Products Corporation
Opinion on internal control over financial reporting
We have audited the internal control over financial reporting of Quanex Building Products Corporation (a Delaware corporation) and subsidiaries (the “Company”) as of October 31, 2018,2021, based on criteria established in the 2013 Internal Control-IntegratedControl—Integrated Framework issued by the Committee of Sponsoring Organizations of the Treadway Commission (“COSO”). In our opinion, the Company maintained, in all material respects, effective internal control over financial reporting as of December 11, 2018,October 31, 2021, based on criteria established in the 2013 Internal Control-IntegratedControl—Integrated Framework issued by COSO.
We also have audited, in accordance with the standards of the Public Company Accounting Oversight Board (United States) (“PCAOB”), the consolidated financial statements of the Company as of and for the year ended October 31, 2018,2021, and our report dated December 11, 201817, 2021 expressed an unqualified opinion on those financial statements.
Basis for opinion
The Company’s management is responsible for maintaining effective internal control over financial reporting and for its assessment of the effectiveness of internal control over financial reporting, included in the accompanying Management’s Annual Report on Internal ControlControls over Financial Reporting. Our responsibility is to express an opinion on the Company’s internal control over financial reporting based on our audit. We are a public accounting firm registered with the PCAOB and are required to be independent with respect to the Company in accordance with the U.S. federal securities laws and the applicable rules and regulations of the Securities and Exchange Commission and the PCAOB.
We conducted our audit in accordance with the standards of the PCAOB. Those standards require that we plan and perform the audit to obtain reasonable assurance about whether effective internal control over financial reporting was maintained in all material respects. Our audit included obtaining an understanding of internal control over financial reporting, assessing the risk that a material weakness exists, testing and evaluating the design and operating effectiveness of internal control based on the assessed risk, and performing such other procedures as we considered necessary in the circumstances. We believe that our audit provides a reasonable basis for our opinion.
Definition and limitations of internal control over financial reporting
A company’s internal control over financial reporting is a process designed to provide reasonable assurance regarding the reliability of financial reporting and the preparation of financial statements for external purposes in accordance with generally accepted accounting principles. A company’s internal control over financial reporting includes those policies and procedures that (1) pertain to the maintenance of records that, in reasonable detail, accurately and fairly reflect the transactions and dispositions of the assets of the company; (2) provide reasonable assurance that transactions are recorded as necessary to permit preparation of financial statements in accordance with generally accepted accounting principles, and that receipts and expenditures of the company are being made only in accordance with authorizations of management and directors of the company; and (3) provide reasonable assurance regarding prevention or timely detection of unauthorized acquisition, use, or disposition of the company’s assets that could have a material effect on the financial statements.
Because of its inherent limitations, internal control over financial reporting may not prevent or detect misstatements. Also, projections of any evaluation of effectiveness to future periods are subject to the risk that controls may become inadequate because of changes in conditions, or that the degree of compliance with the policies or procedures may deteriorate.
| | |
| /s/ GRANT THORNTON LLP |
|
/s/ GRANT THORNTON LLPHouston, Texas |
|
Houston, Texas |
December 11, 201817, 2021 |
MANAGEMENT’S ANNUAL REPORT ON INTERNAL CONTROL OVER FINANCIAL REPORTING
Management of the Company, including the Chief Executive Officer and Chief Financial Officer, is responsible for establishing and maintaining adequate internal control over financial reporting as defined in Rule 13a-15(f) under the Securities Exchange Act of 1934, as amended. The Company’s internal control system was designed to provide reasonable assurance to management and the Company’s Board of Directors regarding the reliability of financial reporting and the preparation of financial statements for external purposes in accordance with generally accepted accounting principles.
All internal control systems, no matter how well designed, have inherent limitations. A system of internal control may become inadequate over time because of changes in conditions, or deterioration in the degree of compliance with the policies or procedures. Therefore, even those systems determined to be effective can provide only reasonable assurance with respect to financial statement preparation and presentation.
Management assessed the effectiveness of the Company’s internal control over financial reporting as of October 31, 20182021 using the criteria set forth by the Committee of Sponsoring Organizations of the Treadway Commission in Internal Control — Integrated Framework (2013). Based on this assessment, management has concluded that, as of October 31, 2018,2021, the Company’s internal control over financial reporting was effective to provide reasonable assurance regarding the reliability of financial reporting and the preparation of financial statements for external purposes in accordance with generally accepted accounting principles based on such criteria.
Grant Thornton LLP, the Company’s independent registered public accounting firm, has issued an attestation report on the effectiveness of the Company’s internal control over financial reporting. This report appears on page 45.
QUANEX BUILDING PRODUCTS CORPORATION
CONSOLIDATED BALANCE SHEETS
As of October 31, 20182021 and 2017 |
| | | | | | | |
| | October 31, |
| | 2018 | | 2017 |
| | (In thousands, except share amounts) |
| ASSETS | | | |
| Current assets: | | | |
| Cash and cash equivalents | $ | 29,003 |
| | $ | 17,455 |
|
| Accounts receivable, net of allowance for doubtful accounts of $325 and $333 (Note 3) | 84,014 |
| | 79,411 |
|
| Inventories, net (Note 4) | 69,365 |
| | 87,529 |
|
| Prepaid and other current assets | 7,296 |
| | 7,406 |
|
| Total current assets | 189,678 |
| | 191,801 |
|
| Property, plant and equipment, net of accumulated depreciation of $288,607 and $264,047 (Note 5) | 201,370 |
| | 211,131 |
|
| Goodwill (Note 6) | 219,627 |
| | 222,194 |
|
| Intangible assets, net (Note 6) | 121,919 |
| | 139,778 |
|
| Other assets | 9,255 |
| | 8,975 |
|
| Total assets | $ | 741,849 |
| | $ | 773,879 |
|
| LIABILITIES AND STOCKHOLDERS' EQUITY | | | |
| Current liabilities: | | | |
| Accounts payable | $ | 52,389 |
| | $ | 44,150 |
|
| Accrued liabilities (Note 7) | 45,968 |
| | 38,871 |
|
| Income taxes payable (Note 11) | 2,780 |
| | 2,192 |
|
| Current maturities of long-term debt (Note 8) | 1,224 |
| | 21,242 |
|
| Total current liabilities | 102,361 |
| | 106,455 |
|
| Long-term debt (Note 8) | 209,332 |
| | 218,184 |
|
| Deferred pension and postretirement benefits (Note 9) | 4,218 |
| | 4,433 |
|
| Deferred income taxes (Note 11) | 17,215 |
| | 21,960 |
|
| Liability for uncertain tax positions (Note 11) | 606 |
| | 591 |
|
| Other liabilities | 13,965 |
| | 15,409 |
|
| Total liabilities | 347,697 |
| | 367,032 |
|
| Commitments and contingencies (Note 12) |
| |
|
| Stockholders’ equity: | | | |
| Preferred stock, no par value, shares authorized 1,000,000; issued and outstanding - none | — |
| | — |
|
| Common stock, $0.01 par value, shares authorized 125,000,000; issued 37,433,817 and 37,508,877 respectively; outstanding 33,339,032 and 34,838,134, respectively | 374 |
| | 375 |
|
| Additional paid-in-capital | 254,678 |
| | 255,719 |
|
| Retained earnings | 242,834 |
| | 225,704 |
|
| Accumulated other comprehensive loss | (30,705 | ) | | (25,076 | ) |
| Less: Treasury stock at cost, 4,094,785 and 2,670,743 shares, respectively | (73,029 | ) | | (49,875 | ) |
| Total stockholders’ equity | 394,152 |
| | 406,847 |
|
| Total liabilities and stockholders' equity | $ | 741,849 |
| | $ | 773,879 |
|
| | | | | | | | | | | |
| October 31, |
| 2021 | | 2020 |
| | (In thousands, except share
amounts) |
| ASSETS | | | |
| Current assets: | | | |
| Cash and cash equivalents | $ | 40,061 | | | $ | 51,621 | |
| Accounts receivable, net of allowance for credit losses of $340 and $161 | 108,309 | | | 88,287 | |
| Inventories, net | 92,529 | | | 61,181 | |
| | | |
| Prepaid and other current assets | 8,148 | | | 6,217 | |
| Total current assets | 249,047 | | | 207,306 | |
| Property, plant and equipment, net of accumulated depreciation of $336,493 and $340,144 | 178,630 | | | 184,104 | |
| Operating lease right-of-use assets | 52,708 | | | 51,824 | |
| Goodwill | 149,205 | | | 146,154 | |
| Intangible assets, net | 82,410 | | | 93,068 | |
| Other assets | 5,323 | | | 9,129 | |
| Total assets | $ | 717,323 | | | $ | 691,585 | |
| LIABILITIES AND STOCKHOLDERS' EQUITY | | | |
| Current liabilities: | | | |
| Accounts payable | $ | 86,765 | | | $ | 77,335 | |
| Accrued liabilities | 56,156 | | | 38,289 | |
| Income taxes payable | 6,038 | | | 6,465 | |
| Current maturities of long-term debt | 846 | | | 692 | |
| Current operating lease liabilities | 8,196 | | | 7,459 | |
| Total current liabilities | 158,001 | | | 130,240 | |
| Long-term debt | 52,094 | | | 116,728 | |
| Noncurrent operating lease liabilities | 45,367 | | | 44,873 | |
| Deferred pension and postretirement benefits | 4,737 | | | 10,923 | |
| Deferred income taxes | 21,965 | | | 19,116 | |
| Liability for uncertain tax positions | 1,388 | | | 522 | |
| Other liabilities | 13,989 | | | 13,424 | |
| Total liabilities | 297,541 | | | 335,826 | |
| Commitments and contingencies | | | |
| Stockholders’ equity: | | | |
| Preferred stock, no par value, shares authorized 1,000,000 issued and outstanding - none | — | | | — | |
| Common stock, $0.01 par value, shares authorized 125,000,000 issued 37,273,510 and 37,296,166 respectively; outstanding 33,274,785 and 32,804,737, respectively | 373 | | | 373 | |
| Additional paid-in-capital | 254,162 | | | 253,458 | |
| Retained earnings | 259,718 | | | 213,517 | |
| Accumulated other comprehensive loss | (21,770) | | | (33,024) | |
| Less: Treasury stock at cost, 3,998,725 and 4,491,429 shares, respectively | (72,701) | | | (78,565) | |
| Total stockholders’ equity | 419,782 | | | 355,759 | |
| Total liabilities and stockholders' equity | $ | 717,323 | | | $ | 691,585 | |
See notes to consolidated financial statements.
QUANEX BUILDING PRODUCTS CORPORATION
CONSOLIDATED STATEMENTS OF INCOME (LOSS)
For the Years Ended October 31, 2018, 20172021, 2020 and 20162019 | | | | | | | | | | | | | | | | | |
| Year Ended October 31, |
| 2021 | | 2020 | | 2019 |
| | (In thousands, except per share amounts) |
| Net sales | $ | 1,072,149 | | | $ | 851,573 | | | $ | 893,841 | |
| Cost and expenses: | | | | | |
| Cost of sales (excluding depreciation and amortization) | 831,541 | | | 658,750 | | | 694,420 | |
| Selling, general and administrative | 115,967 | | | 89,707 | | | 101,292 | |
| Restructuring charges | 39 | | | 622 | | | 370 | |
| Depreciation and amortization | 42,732 | | | 47,229 | | | 49,586 | |
| Asset impairment charges | — | | | — | | | 74,600 | |
| Operating income (loss) | 81,870 | | | 55,265 | | | (26,427) | |
| Non-operating income (expense): | | | | | |
| Interest expense | (2,530) | | | (5,245) | | | (9,643) | |
| Other, net | 754 | | | 280 | | | 116 | |
| Income (loss) before income taxes | 80,094 | | | 50,300 | | | (35,954) | |
| Income tax expense | (23,114) | | | (11,804) | | | (10,776) | |
| Net income (loss) | $ | 56,980 | | | $ | 38,496 | | | $ | (46,730) | |
| | | | | |
| Basic earnings (loss) per common share | $ | 1.72 | | | $ | 1.18 | | | $ | (1.42) | |
| | | | | |
| Diluted earnings (loss) per common share | $ | 1.70 | | | $ | 1.17 | | | $ | (1.42) | |
| | | | | |
| Weighted-average common shares outstanding: | | | | | |
| Basic | 33,193 | | | 32,689 | | | 32,960 | |
| Diluted | 33,495 | | | 32,821 | | | 32,960 | |
| | | | | |
| Cash dividends per share | $ | 0.32 | | | $ | 0.32 | | | $ | 0.32 | |
|
| | | | | | | | | | | |
| | Year Ended October 31, |
| | 2018 | | 2017 | | 2016 |
| | (In thousands, except per share amounts) |
| Net sales | $ | 889,785 |
| | $ | 866,555 |
| | $ | 928,184 |
|
| Cost and expenses: | | | | | |
| Cost of sales (excluding depreciation and amortization) | 696,567 |
| | 672,162 |
| | 710,644 |
|
| Selling, general and administrative | 103,535 |
| | 97,981 |
| | 114,910 |
|
| Restructuring charges | 1,486 |
| | 4,550 |
| | 529 |
|
| Depreciation and amortization | 51,822 |
| | 57,495 |
| | 53,146 |
|
| Asset impairment charges | — |
| | — |
| | 12,602 |
|
| Operating income | 36,375 |
| | 34,367 |
| | 36,353 |
|
| Non-operating (expense) income: |
| | | | |
| Interest expense | (11,100 | ) | | (9,595 | ) | | (36,498 | ) |
| Other, net | 178 |
| | 730 |
| | (5,479 | ) |
| Income (loss) from continuing operations before income taxes | 25,453 |
| | 25,502 |
| | (5,624 | ) |
| Income tax benefit (expense) | 875 |
| | (6,819 | ) | | 3,765 |
|
| Net income (loss) | $ | 26,328 |
| | $ | 18,683 |
| | $ | (1,859 | ) |
| |
| | | | |
| Basic earnings (loss) per common share | $ | 0.76 |
| | $ | 0.55 |
| | $ | (0.05 | ) |
| | | | | | |
| Diluted earnings (loss) per common share | $ | 0.75 |
| | $ | 0.54 |
| | $ | (0.05 | ) |
| | | | | | |
| Weighted-average common shares outstanding: | | | | | |
| Basic | 34,701 |
| | 34,230 |
| | 33,876 |
|
| Diluted | 35,025 |
| | 34,837 |
| | 33,876 |
|
| | | | | | |
| Cash dividends per share | $ | 0.20 |
| | $ | 0.16 |
| | $ | 0.16 |
|
See notes to consolidated financial statements.
QUANEX BUILDING PRODUCTS CORPORATION
CONSOLIDATED STATEMENTS OF COMPREHENSIVE INCOME (LOSS)
For the Years Ended October 31, 2018, 20172021, 2020 and 20162019 | | | | | | | | | | | | | | | | | |
| Year Ended October 31, |
| 2021 | | 2020 | | 2019 |
| | (In thousands) |
| Net income (loss) | $ | 56,980 | | | $ | 38,496 | | | $ | (46,730) | |
| Other comprehensive income (loss): | | | | | |
| Foreign currency translation adjustments gain | 7,152 | | | 1,078 | | | 1,864 | |
| | | | | |
| Change in pension from net unamortized gain (loss) (pretax) | 5,477 | | | (376) | | | (6,572) | |
| Change in pension from net unamortized gain (loss) tax (expense) benefit | (1,375) | | | 91 | | | 1,596 | |
| Total other comprehensive income (loss), net of tax | 11,254 | | | 793 | | | (3,112) | |
| Comprehensive income (loss) | $ | 68,234 | | | $ | 39,289 | | | $ | (49,842) | |
|
| | | | | | | | | | | |
| | Year Ended October 31, |
| | 2018 | | 2017 | | 2016 |
| | (In thousands) |
| Net income (loss) | $ | 26,328 |
| | $ | 18,683 |
| | $ | (1,859 | ) |
| Other comprehensive income (loss): | | | | | |
| Foreign currency translation adjustments (loss) gain | (6,640 | ) | | 11,524 |
| | (26,838 | ) |
| Change in pension from net unamortized gain (loss) (pretax) | 2,253 |
| | 3,462 |
| | (2,864 | ) |
| Change in pension from net unamortized gain (loss) tax (expense) benefit | (1,242 | ) | | (1,297 | ) | | 986 |
|
| Total other comprehensive (loss) income, net of tax | (5,629 | ) | | 13,689 |
| | (28,716 | ) |
| Comprehensive income (loss) | $ | 20,699 |
| | $ | 32,372 |
| | $ | (30,575 | ) |
See notes to consolidated financial statements.
QUANEX BUILDING PRODUCTS CORPORATION
CONSOLIDATED STATEMENT OF STOCKHOLDERS’ EQUITY
For the Years Ended October 31, 2018, 20172021, 2020 and 2016
|
| | | | | | | | | | | | | | | | | | | | | | | | | | | | | |
| | Common Stock | | | | | | Accumulated | | Treasury Stock | | Total |
| | Shares | | Amount | | Additional Paid-in Capital | | Retained Earnings | | Other Comprehensive Loss | | Shares | | Amount | | Stockholders’ Equity |
| | (In thousands, except share amounts) |
| Balance at October 31, 2015 | 37,609,563 |
| | $ | 376 |
| | $ | 250,937 |
| | $ | 222,138 |
| | $ | (10,049 | ) | | (3,647,103 | ) | | $ | (68,107 | ) | | $ | 395,295 |
|
| Net loss | — |
| | — |
| | — |
| | (1,859 | ) | | — |
| | — |
| | — |
| | (1,859 | ) |
| Foreign currency translation adjustment | — |
| | — |
| | — |
| | — |
| | (26,838 | ) | | — |
| | — |
| | (26,838 | ) |
| Change in pension from net unamortized gain (net of tax benefit of $986) | — |
| | — |
| | — |
| | — |
| | (1,878 | ) | | — |
| | — |
| | (1,878 | ) |
| Common dividends ($0.16 per share) | — |
| | — |
| | — |
| | (5,470 | ) | | — |
| | — |
| | — |
| | (5,470 | ) |
| Expense related to stock-based compensation | — |
| | — |
| | 6,089 |
| | — |
| | — |
| | — |
| | — |
| | 6,089 |
|
| Stock options exercised | — |
| | — |
| | (106 | ) | | (637 | ) | | — |
| | 221,850 |
| | 4,143 |
| | 3,400 |
|
| Tax benefit from share-based compensation | — |
| | — |
| | (146 | ) | | — |
| | — |
| | — |
| | — |
| | (146 | ) |
| Restricted stock awards granted | — |
| | — |
| | (1,591 | ) | | (6 | ) | | — |
| | 85,500 |
| | 1,597 |
| | — |
|
| Other | (49,314 | ) | | — |
| | (643 | ) | | (119 | ) | | — |
| | — |
| | — |
| | (762 | ) |
| Balance at October 31, 2016 | 37,560,249 |
| | $ | 376 |
| | $ | 254,540 |
| | $ | 214,047 |
| | $ | (38,765 | ) | | (3,339,753 | ) | | $ | (62,367 | ) | | $ | 367,831 |
|
| Net loss | — |
| | — |
| | — |
| | 18,683 |
| | — |
| | — |
| | — |
| | 18,683 |
|
| Foreign currency translation adjustment | — |
| | — |
| | — |
| | — |
| | 11,524 |
| | — |
| | — |
| | 11,524 |
|
| Change in pension from net unamortized gain (net of tax expense of $1,297) | — |
| | — |
| | — |
| | — |
| | 2,165 |
| | — |
| | — |
| | 2,165 |
|
| Common dividends ($0.16 per share) | — |
| | — |
| | — |
| | (5,516 | ) | | — |
| | — |
| | — |
| | (5,516 | ) |
| Expense related to stock-based compensation | — |
| | — |
| | 5,189 |
| | — |
| | — |
| | — |
| | — |
| | 5,189 |
|
| Stock options exercised | — |
| | — |
| | (76 | ) | | (1,451 | ) | | — |
| | 507,660 |
| | 9,480 |
| | 7,953 |
|
| Tax benefit from share-based compensation | — |
| | — |
| | (4 | ) | | — |
| | — |
| | — |
| | — |
| | (4 | ) |
| Restricted stock awards granted | — |
| | — |
| | (1,752 | ) | | — |
| | — |
| | 161,350 |
| | 1,752 |
| | — |
|
| Performance share awards vested | — |
| | — |
| | (1,261 | ) | | — |
| | — |
| | — |
| | 1,261 |
| | — |
|
| Other | (51,372 | ) | | (1 | ) | | (917 | ) | | (59 | ) | | — |
| | — |
| | (1 | ) | | (978 | ) |
| Balance at October 31, 2017 | 37,508,877 |
| | $ | 375 |
| | $ | 255,719 |
| | $ | 225,704 |
| | $ | (25,076 | ) | | (2,670,743 | ) | | $ | (49,875 | ) | | $ | 406,847 |
|
| Net income | — |
| | — |
| | — |
| | 26,328 |
| | — |
| | — |
| | — |
| | 26,328 |
|
| Foreign currency translation adjustment | — |
| | — |
| | — |
| | — |
| | (6,640 | ) | | — |
| | — |
| | (6,640 | ) |
| Change in pension from net unamortized loss (net of tax expense of $1,242) | — |
| | — |
| | — |
| | — |
| | 1,011 |
| | — |
| | — |
| | 1,011 |
|
| Common dividends ($0.20 per share) | — |
| | — |
| | — |
| | (7,020 | ) | | — |
| | — |
| | — |
| | (7,020 | ) |
| Treasury shares purchased, at cost | — |
| | — |
| | — |
| | — |
| | — |
| | (1,900,000 | ) | | (32,034 | ) | | (32,034 | ) |
| Expense related to stock-based compensation | — |
| | — |
| | 1,874 |
| | — |
| | — |
| | — |
| | — |
| | 1,874 |
|
| Stock options exercised | — |
| | — |
| | (149 | ) | | (2,141 | ) | | — |
| | 377,218 |
| | 7,036 |
| | 4,746 |
|
| Restricted stock awards granted | — |
| | — |
| | (1,371 | ) | | — |
| | — |
| | 73,400 |
| | 1,371 |
| | — |
|
| Performance share awards vested | — |
| | — |
| | (473 | ) | | — |
| | — |
| | 25,340 |
| | 473 |
| | — |
|
| Other | (75,060 | ) | | (1 | ) | | (922 | ) | | (37 | ) | | — |
| | — |
| | — |
| | (960 | ) |
| Balance at October 31, 2018 | 37,433,817 |
| | $ | 374 |
| | $ | 254,678 |
| | $ | 242,834 |
| | $ | (30,705 | ) | | (4,094,785 | ) | | $ | (73,029 | ) | | $ | 394,152 |
|
| | | | | | | | | | | | | | | | | | | | | | | | | | | | | | | | | | | | | | | | | | | | | | | |
| Common Stock | | | | | | Accumulated | | Treasury Stock | | Total |
| Shares | | Amount | | Additional Paid-in
Capital | | Retained
Earnings | | Other Comprehensive Loss | | Shares | | Amount | | Stockholders’
Equity |
| | (In thousands, except share amounts) |
| Balance at October 31, 2018 | 37,433,817 | | | $ | 374 | | | $ | 254,678 | | | $ | 243,904 | | | $ | (30,705) | | | (4,094,785) | | | $ | (73,029) | | | $ | 395,222 | |
| Net loss | — | | | — | | | — | | | (46,730) | | | — | | | — | | | — | | | (46,730) | |
| Foreign currency translation adjustments | — | | | — | | | — | | | — | | | 1,864 | | | — | | | — | | | 1,864 | |
| Change in pension from net unamortized loss (net of tax benefit of $1,596) | — | | | — | | | — | | | — | | | (4,976) | | | — | | | — | | | (4,976) | |
| Common dividends ($0.32 per share) | — | | | — | | | — | | | (10,644) | | | — | | | — | | | — | | | (10,644) | |
| Treasury shares purchased, at cost | — | | | — | | | — | | | — | | | — | | | (583,398) | | | (9,551) | | | (9,551) | |
| Expense related to stock-based compensation | — | | | — | | | 2,045 | | | — | | | — | | | — | | | — | | | 2,045 | |
| Stock options exercised | — | | | 1 | | | — | | | (322) | | | — | | | 204,770 | | | 3,609 | | | 3,288 | |
| Restricted stock awards granted | — | | | — | | | (1,720) | | | (505) | | | — | | | 124,800 | | | 2,225 | | | — | |
| | | | | | | | | | | | | | | |
| Other | (63,415) | | | (1) | | | (330) | | | — | | | — | | | — | | | — | | | (331) | |
| Balance at October 31, 2019 | 37,370,402 | | | $ | 374 | | | $ | 254,673 | | | $ | 185,703 | | | $ | (33,817) | | | (4,348,613) | | | $ | (76,746) | | | $ | 330,187 | |
| Net income | — | | | — | | | — | | | 38,496 | | | — | | | — | | | — | | | 38,496 | |
| Foreign currency translation adjustments | — | | | — | | | — | | | — | | | 1,078 | | | — | | | — | | | 1,078 | |
| Change in pension from net unamortized loss (net of tax of benefit of $91) | — | | | — | | | — | | | — | | | (285) | | | — | | | — | | | (285) | |
| Common dividends ($0.32 per share) | — | | | — | | | — | | | (10,534) | | | — | | | — | | | — | | | (10,534) | |
| Expense related to stock-based compensation | — | | | — | | | 879 | | | — | | | — | | | — | | | | | 879 | |
| Treasury shares purchased, at cost | — | | | — | | | — | | | — | | | — | | | (450,000) | | | (7,233) | | | (7,233) | |
| Stock options exercised | — | | | — | | | 66 | | | (242) | | | — | | | 215,733 | | | 3,801 | | | 3,625 | |
| Restricted stock awards granted | — | | | — | | | (1,212) | | | 94 | | | — | | | 63,400 | | | 1,118 | | | — | |
| Performance share awards vested | — | | | — | | | (495) | | | — | | | — | | | 28,051 | | | 495 | | | — | |
| Other | (74,236) | | | (1) | | | (453) | | | — | | | — | | | — | | | — | | | (454) | |
| Balance at October 31, 2020 | 37,296,166 | | | $ | 373 | | | $ | 253,458 | | | $ | 213,517 | | | $ | (33,024) | | | (4,491,429) | | | $ | (78,565) | | | $ | 355,759 | |
| Net income | — | | | — | | | — | | | 56,980 | | | — | | | — | | | — | | | 56,980 | |
| Foreign currency translation adjustments | — | | | — | | | — | | | — | | | 7,152 | | | — | | | — | | | 7,152 | |
| Change in pension from net unamortized loss (net of tax expense of $1,375) | — | | | — | | | — | | | — | | | 4,102 | | | — | | | — | | | 4,102 | |
| Common dividends ($0.32 per share) | — | | | — | | | — | | | (10,779) | | | — | | | — | | | — | | | (10,779) | |
| Treasury shares purchased, at cost | — | | | — | | | — | | | — | | | — | | | (478,311) | | | (11,182) | | | (11,182) | |
| Expense related to stock-based compensation | — | | | — | | | 1,970 | | | — | | | — | | | — | | | | | 1,970 | |
| Stock options exercised | — | | | — | | | 1,073 | | | — | | | — | | | 865,393 | | | 15,199 | | | 16,272 | |
| | | | | | | | | | | | | | | |
| Restricted stock awards granted | — | | | — | | | (1,282) | | | — | | | — | | | 73,300 | | | 1,282 | | | — | |
| Performance share awards vested | — | | | — | | | (565) | | | — | | | — | | | 32,322 | | | 565 | | | — | |
| Other | (22,656) | | | — | | | (492) | | | — | | | — | | | — | | | — | | | (492) | |
| Balance at October 31, 2021 | 37,273,510 | | | $ | 373 | | | $ | 254,162 | | | $ | 259,718 | | | $ | (21,770) | | | (3,998,725) | | | $ | (72,701) | | | $ | 419,782 | |
See notes to consolidated financial statements.
QUANEX BUILDING PRODUCTS CORPORATION
CONSOLIDATED STATEMENTS OF CASH FLOW
For the Years Ended October 31, 2018, 20172021, 2020 and 20162019
| | | | | | | | | | | | | | | | | |
| | Year Ended October 31, |
| | 2021 | | 2020 | | 2019 |
| | (In thousands) |
| Operating activities: | | | | | |
| Net income (loss) | $ | 56,980 | | | $ | 38,496 | | | $ | (46,730) | |
| Adjustments to reconcile net income (loss) to cash provided by operating activities: | | | | | |
| Depreciation and amortization | 42,732 | | | 47,229 | | | 49,586 | |
| Loss on disposition of capital assets | 3,039 | | | — | | | 732 | |
| Stock-based compensation | 1,970 | | | 879 | | | 2,045 | |
| Deferred income tax | 1,785 | | | (189) | | | 3,260 | |
| | | | | |
| Asset impairment charges | — | | | — | | | 74,600 | |
| | | | | |
| | | | | |
| Other, net | 2,126 | | | 1,689 | | | 2,176 | |
| Changes in assets and liabilities: | | | | | |
| (Increase) decrease in accounts receivable | (19,017) | | | (5,766) | | | 574 | |
| (Increase) decrease in inventory | (31,382) | | | 6,119 | | | 3,797 | |
| (Increase) decrease in other current assets | (1,817) | | | 2,896 | | | (2,014) | |
| Increase in accounts payable | 7,097 | | | 15,922 | | | 8,124 | |
| Increase (decrease) in accrued liabilities | 16,212 | | | (3,156) | | | (6,760) | |
| (Decrease) increase in income taxes payable | (378) | | | 237 | | | 3,416 | |
| (Decrease) increase in deferred pension and postretirement benefits | (708) | | | (2,775) | | | 2,531 | |
| Increase (decrease) in other long-term liabilities | 477 | | | (236) | | | 513 | |
| Other, net | (528) | | | (549) | | | 522 | |
| Cash provided by operating activities | 78,588 | | | 100,796 | | | 96,372 | |
| Investing activities: | | | | | |
| | | | | |
| | | | | |
| Capital expenditures | (24,008) | | | (25,726) | | | (24,883) | |
| Proceeds from disposition of capital assets | 5,300 | | | 502 | | | 1,324 | |
| | | | | |
| Cash used for investing activities | (18,708) | | | (25,224) | | | (23,559) | |
| Financing activities: | | | | | |
| Borrowings under credit facility | — | | | 114,500 | | | 83,500 | |
| Repayments of credit facility borrowings | (65,000) | | | (154,000) | | | (136,000) | |
| | | | | |
| Repayments of other long-term debt | (680) | | | (1,027) | | | (1,526) | |
| Common stock dividends paid | (10,779) | | | (10,534) | | | (10,644) | |
| Issuance of common stock | 16,272 | | | 3,626 | | | 3,287 | |
| | | | | |
| Payroll tax paid to settle shares forfeited upon vesting of stock | (492) | | | (454) | | | (330) | |
| Purchase of treasury stock | (11,182) | | | (7,233) | | | (9,551) | |
| | | | | |
| Cash used for financing activities | (71,861) | | | (55,122) | | | (71,264) | |
| Effect of exchange rate changes on cash and cash equivalents | 421 | | | 303 | | | 316 | |
| (Decrease) increase in cash and cash equivalents | (11,560) | | | 20,753 | | | 1,865 | |
| Cash and cash equivalents at beginning of period | 51,621 | | | 30,868 | | | 29,003 | |
| Cash and cash equivalents at end of period | $ | 40,061 | | | $ | 51,621 | | | $ | 30,868 | |
|
| | | | | | | | | | | |
| | Year Ended October 31, |
| | 2018 | | 2017 | | 2016 |
| | (In thousands) |
| Operating activities: | | | | | |
| Net income (loss) | $ | 26,328 |
| | $ | 18,683 |
| | $ | (1,859 | ) |
| Adjustments to reconcile net income (loss) to cash provided by operating activities: | | | | | |
| Depreciation and amortization | 51,822 |
| | 57,495 |
| | 53,146 |
|
| (Gain) loss on disposition of capital assets | (142 | ) | | 1,528 |
| | (20 | ) |
| Stock-based compensation | 1,874 |
| | 5,189 |
| | 6,089 |
|
| Deferred income tax | (5,631 | ) | | (112 | ) | | (8,469 | ) |
| Charge for deferred loan costs and debt discount | 1,064 |
| | — |
| | 16,022 |
|
| Asset impairment charges | — |
| | — |
| | 12,602 |
|
| Other, net | 135 |
| | 1,741 |
| | 339 |
|
| Changes in assets and liabilities, net of effects from acquisitions: | | | | | |
| (Increase) decrease in accounts receivable | (5,550 | ) | | 5,378 |
| | 796 |
|
| Decrease (increase) in inventory | 17,530 |
| | (3,240 | ) | | 5,346 |
|
| Decrease in other current assets | 217 |
| | 186 |
| | 2,503 |
|
| Increase (decrease) in accounts payable | 8,325 |
| | (4,893 | ) | | (2,273 | ) |
| Increase (decrease) in accrued liabilities | 6,892 |
| | (7,521 | ) | | 2,033 |
|
| Increase (decrease) in income taxes | 676 |
| | 4,670 |
| | (365 | ) |
| Increase (decrease) in deferred pension and postretirement benefits | 2,038 |
| | (271 | ) | | 588 |
|
| (Decrease) increase in other long-term liabilities | (523 | ) | | 1,382 |
| | 956 |
|
| Other, net | (444 | ) | | (437 | ) | | (93 | ) |
| Cash provided by operating activities | 104,611 |
| | 79,778 |
| | 87,341 |
|
| Investing activities: | | | | | |
| Acquisitions, net of cash acquired | — |
| | (8,497 | ) | | (245,904 | ) |
| Capital expenditures | (26,484 | ) | | (34,564 | ) | | (37,243 | ) |
| Proceeds from disposition of capital assets | 432 |
| | 1,937 |
| | 1,044 |
|
| Cash used for investing activities | (26,052 | ) | | (41,124 | ) | | (282,103 | ) |
| Financing activities: | | | | | |
| Borrowings under credit facility | 268,500 |
| | 53,500 |
| | 634,800 |
|
| Repayments of credit facility borrowings | (296,250 | ) | | (98,875 | ) | | (422,875 | ) |
| Debt issuance costs | (1,001 | ) | | — |
| | (11,435 | ) |
| Repayments of other long-term debt | (1,798 | ) | | (2,722 | ) | | (2,185 | ) |
| Common stock dividends paid | (7,020 | ) | | (5,516 | ) | | (5,470 | ) |
| Issuance of common stock | 4,746 |
| | 7,953 |
| | 3,400 |
|
| Payroll tax paid to settle shares forfeited upon vesting of stock | (960 | ) | | (976 | ) | | (787 | ) |
| Purchase of treasury stock | (32,034 | ) | | — |
| | — |
|
| Cash (used for) provided by financing activities | (65,817 | ) | | (46,636 | ) | | 195,448 |
|
| Effect of exchange rate changes on cash and cash equivalents | (1,194 | ) | | (89 | ) | | 1,715 |
|
| Increase (decrease) in cash and cash equivalents | 11,548 |
| | (8,071 | ) | | 2,401 |
|
| Cash and cash equivalents at beginning of period | 17,455 |
| | 25,526 |
| | 23,125 |
|
| Cash and cash equivalents at end of period | $ | 29,003 |
| | $ | 17,455 |
| | $ | 25,526 |
|
QUANEX BUILDING PRODUCTS CORPORATION
NOTES TO CONSOLIDATED FINANCIAL STATEMENTS
1. Nature of Operations, Basis of Presentation and Significant Accounting Policies
Nature of Operations
Quanex Building Products Corporation is a component supplier to original equipment manufacturers (OEMs) in the building products industry. These components can be categorized as window and door (fenestration) components and kitchen and bath cabinet components. Examples of fenestration components include: (1) energy-efficient flexible insulating glass spacers, (2) extruded vinyl profiles, (3) window and door screens, and (4) precision-formed metal and wood products. We also manufacture cabinet doors and other components for OEMs in the kitchen and bathroom cabinet industry. In addition, we provide certain other non-fenestration components and products, which include solar panel sealants, trim moldings, vinyl decking, fencing, water retention barriers, and conservatory roof components. We have organized our business into three3 reportable business segments.segments: (1) North American Fenestration (NA Fenestration), (2) European Fenestration (EU Fenestration) and (3) North American Cabinet Components (NA Cabinet Components). For additional discussion of our reportable business segments, including the transfer of two wood-manufacturing plants from the NA Engineered Components segment to the NA Cabinet Component segment, see Note 18, "Segment16, “Segment Information."” We use low-cost production processes and engineering expertise to provide our customers with specialized products for their specific window, door, and cabinet applications. We believe these capabilities provide us with unique competitive advantages. We serve a primary customer base in North America and the United Kingdom (U.K.), and also serve customers in international markets through our operating plants in the United KingdomU.K. and Germany, as well as through sales and marketing efforts in other countries.
Unless the context indicates otherwise, references to "Quanex"“Quanex”, the "Company"“Company”, "we"“we”, "us"“us” and "our"“our” refer to the consolidated business operations of Quanex Building Products Corporation and its subsidiaries.
Basis of Presentation and Principles of Consolidation
Our consolidated financial statements have been prepared by us in accordance with accounting principles generally accepted in the United States of America (U.S. GAAP). We consolidate our wholly-owned subsidiaries and eliminate intercompany sales and transactions. We have no cost or equity investments in companies that are not wholly-owned. In our opinion, these audited financial statements contain all adjustments necessary to fairly present our financial position, results of operations and cash flows for the periods presented.
Use of Estimates
In preparing financial statements, we make informed judgments and estimates that affect the reported amounts of assets and liabilities as of the date of the financial statements and affect the reported amounts of revenues and expenses during the reporting period. We review our estimates on an ongoing basis, including those related to impairment of long lived assets and goodwill, pension and retirement liabilities, contingencies and income taxes. Changes in facts and circumstances may result in revised estimates and actual results may differ from these estimates. During the year ended October 31, 2017, we recorded a change in estimate related to certain assets involved in restructuring activities, as more fully described under the caption "Restructuring."
A summary of our significant accounting policies consistently applied in the preparation of the accompanying consolidated financial statements follows:
Revenue Recognitionfrom Contracts with Customers
Revenue recognition
We recognize revenue that reflects the consideration we expect to receive for product sales upon transfer to customers. Revenue for product sales is recognized when control of the promised products is transferred to our customers, and we are shippedentitled to consideration in exchange for such transfer. We account for a contract when a customer provides us with a firm purchase order that identifies the products to be provided, the payment terms for those products, and when title has passedcollectability of the consideration due is probable.
Performance obligations
A performance obligation is a promise to provide the customer with a good or service. Our performance obligations include product sales, with each product included in a customer contract being recognized as a separate performance obligation. For contracts with multiple performance obligations, the standalone selling price of each product is generally readily observable.
QUANEX BUILDING PRODUCTS CORPORATION
NOTES TO CONSOLIDATED FINANCIAL STATEMENTS (continued)
Revenue from product sales is recognized at a point in time when the product is transferred to the customer. Revenuecustomer, in accordance with the shipping terms, which is deemedgenerally upon shipment. We estimate a provision for sales returns and warranty allowances to account for product returns related to general returns and product nonconformance.
We generally expense incremental costs of obtaining a contract when incurred because the amortization period would be realizedless than one year. Additionally, we do not disclose the value of unsatisfied performance obligations for contracts with an original expected length of one year or earned when the following criteria are met: (a) persuasive evidence that a contractualless.
Pricing and sales arrangement exists; (b) delivery has occurred;incentives
Pricing is established at or when title passesprior to the buyers; (c)time of sale with our customers and we record sales at the agreed-upon net selling price, reflective of current and prospective discounts.
Shipping and handling costs
We account for shipping and handling services as fulfillment services; accordingly, freight revenue is combined with the product deliverable rather than being accounted for as a distinct performance obligation within the terms of the agreement. Shipping and handling costs incurred by us for the delivery of goods to customers are considered a cost to fulfill the buyer is fixed or determinable; and (d) collection is reasonably assured. Sales allowances and customer incentives, including volume discounts or rebates, are treated as reductions to revenuecontract and are providedincluded in cost of sales in the accompanying consolidated statements of income.
Contract assets and liabilities
Deferred revenue, which is not significant, is recorded when we have remaining unsatisfied performance obligations for based on historical experience, current estimates or contract terms.which we have received consideration.
Disaggregation of revenue
We produce a wide variety of products that are used in the fenestration industry, including insulating glass spacer systems; extruded vinyl products; metal fabricated products; and astragals, thresholds and screens. In addition, we produce certain non-fenestration products, including kitchen and bath cabinet doors and components, flooring and trim moldings, solar edge tape, plastic decking, fencing, water retention barriers, conservatory roof components, and other products.
The following table summarizes our product sales for the three years ended October 31, 2021, 2020, and 2019 into groupings by segment which we believe depicts how the nature, amount, timing and uncertainty of our revenues and cash flows are affected by economic factors. For further details regarding our results by segment, refer to Note 16, “Segment Information.”
QUANEX BUILDING PRODUCTS CORPORATION
NOTES TO CONSOLIDATED FINANCIAL STATEMENTS (continued)
| | | | | | | | | | | | | | | | | |
| Year Ended October 31, |
| 2021 | | 2020 | | 2019 |
| (in thousands) |
| NA Fenestration: | | | | | |
| United States - fenestration | $ | 507,634 | | | $ | 427,616 | | | $ | 439,536 | |
| International - fenestration | 34,610 | | | 28,585 | | | 31,106 | |
| United States - non-fenestration | 24,534 | | | 19,279 | | | 17,061 | |
| International - non-fenestration | 11,554 | | | 7,935 | | | 16,134 | |
| $ | 578,332 | | | $ | 483,415 | | | $ | 503,837 | |
| EU Fenestration: | | | | | |
| | | | | |
| International - fenestration | $ | 199,511 | | | $ | 134,432 | | | $ | 139,638 | |
| International - non-fenestration | 52,088 | | | 26,622 | | | 25,359 | |
| $ | 251,599 | | | $ | 161,054 | | | $ | 164,997 | |
| NA Cabinet Components: | | | | | |
| United States - fenestration | $ | 13,326 | | | $ | 11,842 | | | $ | 13,144 | |
| United States - non-fenestration | 230,559 | | | 196,479 | | | 214,211 | |
| International - non-fenestration | 2,190 | | | 1,778 | | | 2,289 | |
| $ | 246,075 | | | $ | 210,099 | | | $ | 229,644 | |
| Unallocated Corporate & Other: | | | | | |
| Eliminations | $ | (3,857) | | | $ | (2,995) | | | $ | (4,637) | |
| $ | (3,857) | | | $ | (2,995) | | | $ | (4,637) | |
| Net sales | $ | 1,072,149 | | | $ | 851,573 | | | $ | 893,841 | |
Cash and Cash Equivalents
Cash equivalents include all highly liquid investments with an original maturity of three months or less. Such securities with an original maturity which exceeds three months are deemed to be short-term investments. We maintain cash and cash equivalents at several financial institutions, which at times may not be federally insured or may exceed federally insured limits. We have not experienced any losses in such accounts and believe we are not exposed to any significant credit risks on such accounts.
QUANEX BUILDING PRODUCTS CORPORATION
NOTES TO CONSOLIDATED FINANCIAL STATEMENTS (continued)
Concentration of Credit Risk and Allowance for Doubtful AccountsCredit Losses
Certain of our businesses or product lines are largely dependent on a relatively few large customers. Although we believe we have an extensive customer base, the loss of one1 of these large customers or if such customers were to incur a prolonged period of decline in business, our financial condition and results of operations could be adversely affected. For the yearsyear ended October 31, 2018 and 2017,2021, no customers provided more than 10% of our consolidated net sales. For the year ended October 31, 2016, one2020, 1 customer providedprovided more than 10% of our consolidated net sales.
We have established an allowance for doubtful accountscredit losses to estimate the risk of loss associated with our accounts receivable balances. Our policy for determining the allowance is based on factors that affect collectability, including: (a) historical trends of write-offs, recoveries and credit losses; (b) the credit quality of our customers; and (c) projected economic and market conditions. We believe our allowance is adequate to absorb any known or probable losseslosses as of October 31, 2018.2021. Different assumptions or changes in economic circumstances could result in changes to the allowance.
QUANEX BUILDING PRODUCTS CORPORATION
NOTES TO CONSOLIDATED FINANCIAL STATEMENTS (continued)
Business Combinations
We apply the acquisition method of accounting for business combinations in accordance with U.S. GAAP, which requires us to make use of estimates and judgments to allocate the purchase price paid for acquisitions to the fair value of the assets and liabilities acquired. We account for contingent assets and liabilities at fair value on the acquisition date, and record changes to fair value associated with these assetsassets and liabilities as a period cost as incurred. We use established valuation techniques and engage reputable valuation specialists to assist us with these valuations. However, there is a risk that we may not identify all pre-acquisition contingencies or that our estimates may not reflect the actual results when realized. We use a reasonable measurement period to record any adjustment related to the opening balance sheet (generally, less than one year). After the measurement period, changes to the opening balance sheet can result in the recognition of income or expense as period costs. To the extent these items stem from contingencies that existed at the balance sheet date, but are contingent upon the realization of future events, the cost is charged to expense at the time the future event becomes known.
Inventory
We record inventory at the lower of cost or marketnet realizable value. Inventories are valued using the first-in first-out (FIFO) and last-in first-out (LIFO) methods, although LIFO is only used at two of our plant locations currently. We use the dollar-value link chain LIFO method, and the LIFO reserve is calculated on a consolidated basis in a single consolidated pool. The businesses that we acquire and integrate into our operations may value inventories using either the LIFO or FIFO method. Fixed costs related to excess manufacturing capacity are evaluated and expensed in the period, to insure that inventory is properly capitalized. Inventory quantities are regularly reviewed and provisions for excess or obsolete inventory are recorded primarily based on our forecast of future demand and our estimates regarding current and future market conditions. Significant unanticipated variances to our forecasts could require a change in the provision for excess or obsolete inventory, resulting in a charge to net income during the period of the change.
Long-Lived Assets
Property, Plant and Equipment and Intangible Assets with Defined Lives
We make judgments and estimates related to the carrying value of property, plant and equipment, intangible assets with defined lives, and long-lived assets, which include determining when to capitalize costs, the depreciation and amortization methods to use and the useful lives of these assets. We evaluate these assets for impairment when there are indicators that the carrying values of these assets might not be recoverable. Such indicators of impairment may include changes in technology, significant market fluctuations, historical losses or loss of a significant customer, or other changes in circumstancescircumstance that could affect the assets’ ability to generate future cash flows. When we evaluate these assets for impairment, we compare the sum of the undiscounted cash flows expected to result from the use and eventual disposition of the asset to its carrying value. If the carrying value exceeds the sum of the undiscounted cash flows, and there is no alternative use for the asset, we determine that the asset is impaired. To measure the impairment charge, we compare the carrying amount of the long-lived asset to its fair value, as determined by quoted market prices in active markets, if available, or by discounting the projected future cash flows using our incremental borrowing rate.flows. This calculation of fair value requires us to develop and employ long-term forecasts of future operating results related to these assets. These forecasts are based on assumptions about demand for our products and future market conditions. Future events and unanticipated changes to these assumptions could require a provision for impairment, resulting in a charge to net income during the period of the change.
We monitor relevant circumstances, including industry trends, general economic conditions, and the potential impact that such circumstances might have on the valuation of our identifiable intangible assets with finite lives. Events and changes in circumstancescircumstance that may cause a triggering event and necessitate such a review include, but are not limited to: a decrease in sales for certain customers, improvements or changes in technology, and/or a decision to discontinue the use of a trademark or trade name, or to allow a patent to lapse. Such events could negatively impact the fair value of our identifiable intangible assets. In such circumstances, we may evaluate the underlying assumptions and estimates made by us in order to assess the appropriate valuation of these identifiable intangible assets and compare to the carrying value of the assets. We may be required to write down these
QUANEX BUILDING PRODUCTS CORPORATION
NOTES TO CONSOLIDATED FINANCIAL STATEMENTS (continued)
identifiable intangible assets and record a non-cash impairment charge. When we originally value our intangible assets, we use a variety of techniques to establish the carrying value of the assets, including the relief from royalty method, excess current year earnings method and income method.
Changes in market conditions during the fourth quarter of 2016 and throughout 20172019 impacted our long-term forecasts of future operating results with regard to the reduction of significant sales volume to a large customer of our United States (U.S.) vinyl operations, and lower-than-expected operating performance of our North AmericanNA Cabinet Components business. The World Health Organization's (WHO), declaration of COVID-19 as a global pandemic also created significant changes in market conditions throughout 2020 that have continued into 2021. We determined that these conditions were indicators of a triggering eventsevent in 2019 and 2020 which necessitated an evaluation of certain long-term assets utilizedused in these businesses for potential impairment. We compared the projected undiscounted cash flows we expected to realize associated with these assets over the remaining useful lives of the
QUANEX BUILDING PRODUCTS CORPORATION
NOTES TO CONSOLIDATED FINANCIAL STATEMENTS (continued)
primary operating assets to the net book value of the long-term assets, including goodwill, and determined that these assets were not impaired. There were no corresponding indicators of a triggering event in 2021. Therefore, we did not record an impairment charge related to property, plant and equipment or intangible assets with defined lives during the years ended October 31, 20172021, 2020 and 2016. There were no indicators of triggering events noted for the year ended October 31, 2018.2019.
Software development costs, including costs incurred to purchase third-party software, are capitalized when we have determined that the technology is capable of meeting our performance requirements, and we have authorized funding for the project. We cease capitalization of software costs when the software is substantially complete and is ready for its intended use. The software is then amortized over its estimated useful life. When events or circumstances indicate the carrying value of internal use software might not be recoverable, we assess the recoverability of these assets by comparing the carrying value of the asset to the undiscounted future cash flows expected to be generated from the asset’s use, consistent with the methodology to test other property, plant and equipment for impairment.
Property, plant and equipment is stated at cost and is depreciated using the straight-line method over the estimated useful lives of the assets. We capitalize betterments which extend the useful lives or significantly improve the operational efficiency of assets. We expense repair and maintenance costs as incurred.
The estimated useful lives of our primary asset categories at October 31, 20182021 were as follows:
|
| | | | |
| Useful Life (in Years) |
| Land improvements | 7 to 25 |
| Buildings | 25 to 40 |
| Building improvements | 5 to 20 |
| Machinery and equipment | 2 to 15 |
Leasehold improvements are depreciated over the shorter of their estimated useful lives or the term of the lease.
Goodwill
We use the acquisition method to account for business combinations and, to the extent that the purchase price exceeds the fair value of the net assets acquired, we record goodwill. In accordance with U.S. GAAP, we are required to evaluate our goodwill on a qualitative basis to determine if there are indicators of impairment. If there are no indicators, no further analysis is deemed necessary. However, if there are indicators of impairment or if events or circumstances indicate there may be a potential impairment, weat least annually. We perform anour annual goodwill impairment testassessment as of August 31, or more frequently if indicators of impairment exist. ThisQualitative factors that indicate impairment test requires a two-step approach as prescribedcould include, but are not limited to, (i) macroeconomic conditions, (ii) industry and market considerations, (iii) cost factors, (iv) overall financial performance of the reporting unit, and (v) other relevant entity-specific events. The first step in our annual goodwill assessment is to perform the optional qualitative assessment allowed by ASC Topic 350 “Intangibles“Intangibles - Goodwill and Other”Other” (ASC 350). The first stepIn our qualitative assessment, we evaluate relevant events or circumstances to determine whether it is more likely than not (i.e., greater than 50%) that the fair value of a reporting unit is less than its carrying amount. If we determine that it is more likely than not that the impairment testfair value of a reporting unit is less than its carrying amount, ASC 350 requires us to compare the fair value of eachsuch reporting unit to its carrying value including goodwill. To determine the fair value of our reporting units, we use multiple valuation techniques including a discounted cash flow analysis, using the applicable weighted average cost of capital, in combination with a market approach.approach that uses market multiples and a selection of guideline public companies. This test requires us to make assumptions about the future growth of our business and the market in general, as well as other variables such as the level of investment in capital expenditure, growth in working capital requirements and the terminal or residual value of our reporting units beyond the periods of estimated annual cash flows. We use a third-party valuation firm to assist us with this analysis. If the fair value of each reporting unit exceeds its carrying value, no further testingaction is required. Otherwise, we perform the second step of the impairment test whereby we compare the implied fair value of goodwill to its carrying value. The implied fair value of goodwill is determined by applying the acquisition method of accounting for a business combination to the reporting unit as if it were acquired. Under this method, the fair value of the reporting unit is deemed to be the purchase price. The assets and liabilities are recorded at their fair value and the remaining excess of fair value is the implied value of goodwill. Anan impairment loss is recorded to the extent that the carrying amount of the reporting unit including goodwill exceeds the implied fair value of that goodwill. Ourreporting unit. We believe the estimates and assumptions used in our impairment assessment are reasonable based on available market information, but variations in any of the assumptions could result in materially different calculations of fair value and determinations of whether or not an impairment is indicated during current or future cash flows andperiods.
As a result of quantitative assessments performed during the residual values could differyear ended October 31, 2019, we recorded impairment charges totaling $74.6 million during the year ended October 31, 2019, reducing the goodwill balance applicable to the reporting unit included in our NA Cabinet Components operating segment from actual cash flows which may require a provision for impairment in a future period.$113.7 million to $39.1 million.
QUANEX BUILDING PRODUCTS CORPORATION
NOTES TO CONSOLIDATED FINANCIAL STATEMENTS (continued)
At our annual testing date, August 31, 2018,2021, we had five5 reporting units with goodwill balances: two2 reporting units included in our NA Engineered ComponentsFenestration operating segment, two2 reporting units included in our EU Engineered ComponentsFenestration operating segment, and one1 reporting unit included in our NA Cabinet Components operating segment. We performed a qualitative assessment of the two reportable2 reporting units in the NA Engineered ComponentsFenestration segment and 1 of the two reportablereporting units in the EU Engineered ComponentsFenestration segment. This review included an analysis of historical goodwill test results, operating results relative to forecast, projected results over the next five years, and other measures and concluded that there were no indicators of potential impairment associated with these reportablereporting units. Therefore, no additional testing was deemed necessary. Fornecessary for these 3 reporting units. Also, at our annual testing date, we performed a quantitative assessment of the reporting unit included in our NA Cabinet Components segment weprimarily due to the recent impairment of goodwill during the second and fourth quarters of 2019 and the history of a narrow margin of fair value above carrying value in quantitative assessments performed in prior years. We also elected to update the first stepquantitative assessment of the goodwill impairment test at March 31, 2018, as our annual long-range planning effort produced lower forecasted results compared toother reportable unit in the prior year's process, a potential indicator of impairment.EU Fenestration operating segment. We determined that the fair value of the net assets of thisthese reporting unitunits exceeded thetheir carrying valuevalues by approximately 4.5%. These results included the contributionapproximately 17.6% and net assets of two wood-manufacturing plants transferred from the NA Engineered Components segment to the NA Cabinet Components segment during 2018. As of August 31, 2018, with the assistance of a third-party valuation firm, we updated this step-one analysis and determined113.6%, respectively. We concluded that the fair value of the reportable unit continued to exceed its carrying value by 7.2%. Therefore, goodwillno impairment was not deemed impaired and no further testing was deemed necessary.
Restructuring
We accrue one-time severance costs pursuant to an approved plan of restructuring at the communication date, when affected employees have been notified of the potential severance and sufficient information has been provided for the employee to calculate severance benefits, in the event the employee is involuntarily terminated. In addition, we accrue costs associated with the termination of contractual commitments including operating leases at the time the lease is terminated pursuant to the lease provisions or in accordance with another agreement with the landlord. Otherwise, we continue to recognize operating lease expense through the cease-use date. After the cease-use date, we determine if our operating lease payments are at market. We assume sublet of the facility at the market rate. To the extent our lease obligations exceed the fair value rentals, we discount to arrive at the present value and record a liability. If the facility is not sublet, we expense the amount of the assumed sublet in the current period. For other costs directly related to the restructuring effort, such as equipment moving costs, we expense in the period incurred.
In October 2016, we announcedCOVID-19 Impact
On March 11, 2020, the closureWorld Health Organization (WHO) declared the outbreak of three operating plants, two relatedCOVID-19 as a global pandemic and advised aggressive containment action. The COVID-19 pandemic and its impacts are continuing to our United States vinyl operations, and one related to our kitchen and bathroom cabinet door business in Mexico. We expensed $0.5 million pursuant to these restructuring efforts during the year ended October 31, 2016. In September 2017, we closed a kitchen and bathroom cabinet door plant in Lansing, Kansas. We expensed $4.6 million associated with our restructuring efforts for the year ended October 31, 2017, including cost of equipment moves, employee termination costs and severance, professional fees and operating lease costs. Our facility lease obligations were deemed to be at fair market value. We negotiated the exit of onehave an adverse effect on many sectors of the vinyl facilities during September 2018,economy. Measures providing for business shutdowns generally exclude certain essential services commonly including critical infrastructure such as construction and the leasebusinesses that support that critical infrastructure. To date, we have not experienced significant challenges or expenses implementing crisis management plans intended for containment and prevention.
The health and safety of the cabinet door plant expired during fiscal 2018. We incurred $1.5 million of expenses related to operating leases costs during the year ended October 31, 2018, and we expect to incur costs relatedour employees are high priority. In response to the operating leases forCOVID-19 pandemic, we have taken additional measures to limit possible infections at the remaining vinyl facility during fiscal 2019 until we are ableworkplace by implementing social distancing, sanitizing the workspace, and requiring employees to sublet or otherwise exit the lease.report any COVID-19 symptoms to ensure safety as infection surges dictate. We continue to assess and refine these measures on an ongoing basis as public health guidance and applicable laws and regulations continue to evolve.
In addition, we evaluated the remaining depreciable lives of property, plant and equipment that has been abandoned, displaced or otherwise disposed asAs a result of the plant closures. We recorded a change in estimate associated with the remaining useful liveseconomic and business impact of these assets which resulted in an increase in depreciation expense of $4.3 millionCOVID-19, we may be required to revise certain accounting estimates and $1.0 million for the years ended October 31, 2017 and 2016, respectively. Furthermore, we evaluated the remaining service lives of intangible assets with defined lives associated with our United States vinyl extrusion business and recorded a change in estimate associated with the remaining useful lives of a customer relationship intangible and a utility process intangible asset resulting in an increase in amortization expense of $1.9 million and $0.3 million for the years ended October 31, 2017 and 2016, respectively. We didjudgments such as, but not incur similar increases in depreciation or amortization expenseslimited to, those related to restructuring activities during the year ended October 31, 2018.valuation of goodwill, intangibles, right-of-use assets, long-lived assets, accounts receivable (including allowances for credit losses), and inventory, which could have a material adverse effect on our financial position and results of operations.
Insurance
We manage our exposure to losses for workers’ compensation, group medical, property, casualty and other insurance claims through a combination of self-insurance retentions and insurance coverage with third-party carriers. We record undiscounted liabilities associated with our portion of these exposures, which we estimate by considering various factors such as our historical claims experience, severity factors and estimated claims incurred but not reported, for which we have developed loss development factors, which are estimates as to how claims will develop over time until closed. While we consider a number of factors in preparing the estimates, sensitive assumptions using significant judgment are made in determining the amounts that are accrued in the financial statements. Actual claims could differ significantly from these estimated liabilities, depending on future claims experience. We do not record insurance recoveries until any contingencies relating to the claim have been resolved.
QUANEX BUILDING PRODUCTS CORPORATION
NOTES TO CONSOLIDATED FINANCIAL STATEMENTS (continued)
Retirement Plans
We sponsor a defined benefit pension plan and an unfunded postretirement plan that provides health care and life insurance benefits for a limited pool of eligible retirees and dependents. To measure our liabilities associated with these plans, we make assumptions related to future events, including expected return on plan assets, rate of compensation increases, and healthcare cost trend rates. The discount rate reflects the rate at which benefits could be effectively settled on the measurement date. We determine our discount rate using a RATE: Link Model whereby target yields are developed from bonds across a range of maturity points, and a curve is fitted to those targets. Spot rates (zero coupon bond yields) are developed from the curve and used to discount benefit payments associated with each future year. Actual pension plan asset investment performance, as well as other economic experience such as discount rate and demographic experience, will either reduce or increase unamortized pension losses at the end of any fiscal year, which ultimately affects future pension costs.
Warranty Obligations
We accrue warranty obligations when we recognize revenue for certain products. Our provision for warranty obligations is based on historical costs incurred for such obligations and is adjusted, where appropriate, based on current conditions and factors. Our ability to estimate our warranty obligations is subject to significant uncertainties, including changes in product design and our overall product sales mix.
Income Taxes
We record the estimated future tax effects of temporary differences between the tax basis of assets and liabilities and the amounts reported in our consolidated balance sheets, as well as net operating losses and tax credit carry forwards. We evaluate the carrying value of the net deferred tax assets and determine whether we will be able to generate sufficient future taxable income to realize our deferred tax assets. We perform this review for recoverability on a jurisdictional basis, whereby we consider both positive and negative evidence related to the likelihood of realization of the deferred tax assets. The weight given to the positive and negative evidence is commensurate with the extent to which the evidence can be objectively verified. Cumulative losses in recent years is a significant piece of negative evidence that is difficult to overcome in determining that a valuation allowance is not needed against deferred tax assets. Thus, it is generally difficult for positive evidence regarding projected future taxable income exclusive of reversing taxable temporary differences to outweigh objective negative evidence of recent financial reporting losses. We recorded net income for the years ended October 31, 2018 and 2017 and a net loss for the year ended October 31, 2016. We have recorded pre-tax cumulative income from continuing operations of $45.3 million for the three-year period ended October 31, 2018. We believe we will fully realize our deferred tax assets, net of a recorded valuation allowance. We project future taxable income using the same forecasts used to test long-lived assets and intangibles for impairment, scheduling out the future reversal of existing taxable temporary differences and reviewing our most recent financial operations. In the event the estimates and assumptions indicate we will not generate sufficient future taxable income to realize our deferred tax assets, we record a valuation allowance against a portion of our deferred tax assets.
We evaluate our on-goingongoing tax positions to determine if it is more-likely-than-not we will be successful in defending such positions if challenged by taxing authorities. To the extent that our tax positions do not meet the more-likely-than-not criteria, we record a liability for uncertain tax positions. We have recorded a liability for uncertain tax positions which stem from certain federal and state tax items related to the interpretation of tax laws and regulations. We continue to evaluate our positions regarding various state tax interpretations at each reporting date, until the applicable statute of limitations lapse.
Final regulations were published by the Internal Revenue Service regarding Uniform Capitalization (UNICAP) that became effective during fiscal 2020. On December 22, 2017,March 27, 2020, the Tax CutsCoronavirus Aid, Relief, and JobsEconomic Security (CARES) Act (the Act) was signed into law. TheIn addition, the Consolidated Appropriations Act, reduced2021 (CAA) was signed into law on December 27, 2020 and the American Rescue Plan Act of 2021 (American Rescue Plan) was signed into law on March 11, 2021. We evaluated the UNICAP regulations, the CARES Act, the CAA and the American Rescue Plan and determined that there were no material impacts on our federal income tax statutory rate from 35.0% to 23.3% for the fiscal year ended October 31, 2018. We have re-measured our deferred income tax assets and liabilities and have recorded a provisional tax expense for the one-time mandatory transition tax on deemed repatriation of previously tax-deferred and unremitted foreign earnings. Provisional tax expense will be finalized during the one year "measurement period" allowed by Staff Accounting Bulletin No. 118. For further details of the impact of the Act, see Note 11, "Income Taxes."
QUANEX BUILDING PRODUCTS CORPORATION
NOTES TO CONSOLIDATED FINANCIAL STATEMENTS (continued)
condensed consolidated financial statements.
Derivative Instruments
We have historically used financial and commodity-based derivative contracts to manage our exposure to fluctuations in foreign currency exchange rates and aluminum prices. All derivatives are measured at fair value on a recurring basis and the methodology and classifications are discussed further in Note 13, "Derivative Instruments."basis. We have not designated the derivative instruments we use as cash flow hedges under ASC Topic 815 "Derivatives“Derivatives and Hedging”Hedging” (ASC 815). Therefore, all gains and losses, both realized and unrealized, are recognized in the consolidated statements of income (loss) in the period of the change as the underlying assets and liabilities are marked-to-market. We do not enter into derivative instruments for speculative or trading purposes. As such, these instruments are considered economic hedges, and are reflected in the operating activities section of the consolidated statements of cash flow.
QUANEX BUILDING PRODUCTS CORPORATION
NOTES TO CONSOLIDATED FINANCIAL STATEMENTS (continued)
Foreign Currency Translation
Our consolidated financial statements are presented in our reporting currency, the United States Dollar. Our German and United KingdomU.K. operations are measured using the local currency as the functional currency. The assets and liabilities of our foreign operations which are denominated in other currencies are translated to United States Dollars using the prevailing exchange rates as of the balance sheet date. Revenues and expenses are translated at the average exchange rates for the applicable period. The resulting translation adjustments are recorded as a component of accumulated other comprehensive loss on the consolidated balance sheets.
Occasionally, we enter into transactions that are denominated in currencies other than our functional currency. At each balance sheet date, we translate these asset or liability accounts to our functional currency and record unrealized transaction gains or losses. When these assets or liabilities settle, we record realized transaction gains or losses. These realized and unrealized gains or losses are included in the accompanying consolidated statements of income (loss) under the caption, “Other, net.”
Stock–Based Compensation
We have issued stock-based compensation in the form of stock options to directors, employees and officers, and non-vested restricted stock awards to certain key employees and officers. We apply the provisions of ASC Topic 718 “Compensation“Compensation - Stock Compensation”Compensation” (ASC 718), to determine the fair value of stock option awards on the date of grant using the Black-Scholes valuation model. We recognize the fair value as compensation expense on a straight-line basis over the requisite service period of the award based on awards ultimately expected to vest. Stock options granted to directors vest immediately while the stock options granted to our employees and officers typically vest ratably over a three-year period with service and continued employment as the vesting conditions. For new option grants to retirement-eligible employees, we recognize expense and vest immediately upon grant, consistent with the retirement vesting acceleration provisions of these grants. For employees near retirement age, we amortize such grants over the period from the grant date to the retirement-eligibility date if such period is shorter than the standard vesting schedule. For grants of non-vested restricted stock, we calculate the compensation expense at the grant date as the number of shares granted multiplied by the closing stock price of our common stock on the date of grant. This expense is recognized ratably over the vesting period. Our non-vested restricted stock grants to officers and employees cliff vest over a three-year period with service and continued employment as the only vesting criteria. Our fair value determination of stock-based payment awards on the date of grant using an option-pricing model is affected by our stock price as well as assumptions regarding a number of highly complex and subjective variables. These variables include, but are not limited to, our expected stock price volatility over the term of the awards, actual and projected employee stock option exercise behavior over the expected term, our dividend rate, risk-free rate and expectation with regards to forfeitures. Option-pricing models were developed for use in estimating the value of traded options that have no vesting or hedging restrictions and are fully transferable. Because our employee stock options have certain characteristics that are significantly different from traded options, and because changes in the subjective assumptions can materially affect the estimated value, the valuation models may not provide an accurate measure of the fair value of our employee stock options. Accordingly, that value may not be indicative of the fair value observed in a willing buyer/willing seller market transaction.
We have granted other awards which are linked to the performance of our common stock, but will settle in cash rather than the issuance of shares of our common stock. The value of these awards fluctuates with changes in our stock price, with the resulting gains or losses reflected in the period of the change. We have recorded current and non-current liabilities related to these awards reflected in the accompanying consolidated balance sheets at October 31, 20182021 and 2017.2020. See Note 15,13, “Stock-based Compensation.”
In addition, we have granted performance share unitsawards which use return on net assets as the vesting condition and the awards settle in cash and shares upon vesting. These awards have vesting criteria based on a market condition (relative total shareholder return) and an internal performance condition (earnings per share growth).cash. We utilizeuse a Monte Carlo simulation model to value the market condition and our stock price on the date of grant to value
QUANEX BUILDING PRODUCTS CORPORATION
NOTES TO CONSOLIDATED FINANCIAL STATEMENTS (continued)
the internal performance condition. We bifurcate the liability and equity portion of the awards (amounts expected to settle in cash and shares, respectively)condition and recognize expense ratably over the vesting period of three years. We estimate that the performance measures will be met and shares will vest at target until the year of settlement (third year of cliff vesting). As of October 31, 2021, we have deemed 183,000 performance share awards related to the December 2018 grants as probable to vest.
We have also granted performance restricted stock units which settle in shares upon vesting. These awards cliff vest upon a three-year service period with the absolute performance of our common stock as the vesting criteria. We utilizedThe number of performance restricted stock units earned is variable depending on the metric achieved, and the settlement method is 100% in our common stock, with accrued dividends paid in cash at the time of vesting, assuming the shares had been outstanding throughout the performance period. To value the performance restricted stock units, we use a Monte Carlo simulation model to
QUANEX BUILDING PRODUCTS CORPORATION
NOTES TO CONSOLIDATED FINANCIAL STATEMENTS (continued)
arrive at a grant-date value of these performance restricted stock units.fair value. This amount which is settled in our common stock, iswill be adjusted for forfeitures and expensed over the three-year term of the award with a credit to additional paid-in-capital. Similar to performance shares, the performance restricted stock units are not considered outstanding shares, do not have voting rights, and are excluded from diluted weighted-average shares used to calculate earnings per share until the performance criteria is probable to result in the issuance of contingent shares. As of October 31, 2021, we have deemed 87,919 shares related to the December 2018 grants of performance restricted stock units as probable to vest.
Treasury Stock
We use the cost method to record treasury stock purchases whereby the entire cost of the acquired shares of our common stock is recorded as treasury stock (at cost). When we subsequently reissue these shares, proceeds in excess of cost upon the issuance of treasury shares are credited to additional paid in capital,paid-in-capital, while any deficiency is charged to retained earnings.
Earnings per Share Data
We calculate basic earnings per share based on the weighted average number of our common shares outstanding for the applicable period. We calculate diluted earnings per share based on the weighted average number of our common shares outstanding for the period plus all potentially dilutive securities using the treasury stock method, whereby we assume that all such shares are converted into common shares at the beginning of the period, if deemed to be dilutive. If we incur a loss from continuing operations, the effects of potentially dilutive common stock equivalents (stock options and unvested restricted stock awards) are excluded from the calculation of diluted earnings per share because the effect would be anti-dilutive. Performance shares and performance restricted stock units are excluded from contingent shares for purposes of calculating diluted weighted average shares until the performance measure criteria is probable and shares are likely to be issued.
Supplemental Cash Flow Information
The following table summarizes our supplemental cash flow information for the years ended October 31, 2018, 20172021, 2020 and 2016:2019 (in thousands): |
| | | | | | | | | | | |
| | Year Ended October 31, |
| | 2018 | | 2017 | | 2016 |
| | (In thousands) |
| Cash paid for interest | $ | 7,890 |
| | $ | 9,019 |
| | $ | 14,594 |
|
| Cash paid for income taxes | 4,217 |
| | 3,334 |
| | 3,004 |
|
| Cash received for income tax refunds | 95 |
| | 1,167 |
| | 1,949 |
|
| Noncash investing and financing activities: | | | | | |
| Investment in capital leases | 799 |
| | 16,846 |
| | — |
|
| Increase (decrease) in capitalized expenditures in accounts payable and accrued liabilities | 264 |
| | 392 |
| | (32 | ) |
| Debt discount on Term Loan B | — |
| | — |
| | 6,200 |
|
| | | | | | | | | | | | | | | | | |
| | Year Ended October 31, |
| | 2021 | | 2020 | | 2019 |
| Cash paid for interest | $ | 1,993 | | | $ | 4,715 | | | $ | 9,020 | |
| Cash paid for income taxes | 22,160 | | | 12,118 | | | 5,081 | |
| Cash received from income tax refunds | 381 | | | 352 | | | 1,020 | |
| Noncash investing and financing activities: | | | | | |
| Increase in capitalized expenditures in accounts payable and accrued liabilities | $ | 1,124 | | | $ | 2,370 | | | $ | 2,897 | |
| | | | | |
| | | | | |
| | | | | |
| | | | | |
| | | | | |
| | | | | |
Related Party Transactions
We lease several operating facilities from a company that is directly owned by the former owner of our United Kingdom-based vinyl extrusion business, who was our employee until his retirementdid not participate in October 2018. See Note 2, "Acquisitions and Dispositions". In addition to the leases with our employee, ourany related party transactions also included purchases of less than $0.1 million and sales of approximately $0.1 million. Accounts payable and accounts receivable as ofduring the years ended October 31, 2018 included less than $0.1 million of activity from related party transactions.3021, 2020 and 2019.
Subsequent Events
We have evaluated events occurring after the balance sheet date for possible disclosure as a subsequent event through the date the financial statements were issued.
2. Acquisitions and Dispositions
Woodcraft
QUANEX BUILDING PRODUCTS CORPORATION
NOTES TO CONSOLIDATED FINANCIAL STATEMENTS (continued)
set forth in the merger agreement, QWMS, Inc. merged with and into WII, and WII became our wholly-owned subsidiary, and, as a result, we acquired all the subsidiaries of WII (referred to collectively as Woodcraft). Woodcraft is a manufacturer of cabinet doors and other components to OEMs in the kitchen and bathroom cabinet industry. At the time of purchase, Woodcraft operated 12 plants within the United States and one in Mexico. On October 31, 2016, we announced the closure of the Woodcraft plant in Mexico and subsequently closed a plant in Lansing, Kansas in September 2017. We paid $245.9 million in cash, net of cash acquired and including certain holdbacks with regard to potential indemnity claims, and received less than $0.1 million from the seller as a working capital true-up, resulting in goodwill totaling $113.7 million. We believe this acquisition expanded our business into a new segment of the building products industry, which is experiencing growth and which is less susceptible to the impact of seasonality due to inclement weather.
The purchase price was allocated to the fair value of the assets acquired and liabilities assumed, as indicated in the table below. |
| | | |
| | As of Date of
Opening Balance Sheet |
| | (In thousands) |
| Net assets acquired: | |
| Accounts receivable | $ | 23,944 |
|
| Inventory | 29,552 |
|
| Prepaid and other current assets | 4,081 |
|
| Property, plant and equipment | 63,154 |
|
| Goodwill | 113,747 |
|
| Intangible assets | 62,900 |
|
| Other non-current assets | 24 |
|
| Accounts payable | (4,620 | ) |
| Accrued expenses | (9,492 | ) |
| Deferred income tax liabilities, net | (37,386 | ) |
| Net assets acquired | $ | 245,904 |
|
| Consideration: | |
| Cash, net of cash and cash equivalents acquired | $ | 245,904 |
|
We used recognized valuation techniques to determine the fair value of the assets and liabilities, including the income approach for customer relationships, with a discount rate that reflects the risk of the expected future cash flows. Intangible assets related to the Woodcraft acquisition as of November 2, 2015 included $62.8 million of customer relationships and other intangibles of less than $0.1 million, with original estimated useful lives of 12 years and 1 year, respectively. These intangible assets are being amortized on a straight-line basis. The goodwill balance is not deductible for tax purposes. Woodcraft is allocated entirely to our North American Cabinet Components reportable business segment.
HLP
On June 15, 2015, we acquired the outstanding ownership shares of Flamstead Holdings Limited, an extruder of vinyl lineal products and manufacturer of other plastic products incorporated and registered in England and Wales, for $131.7 million in cash, net of cash acquired, debt assumed of $7.7 million and contingent consideration of $10.3 million, resulting in goodwill on the transaction of approximately $61.3 million. Following a pre-sale reorganization and purchase, Flamstead Holdings Limited owned 100% of the ownership shares of the following subsidiaries: HL Plastics Limited, Vintage Windows Limited, Wegoma Machinery Sales Limited (renamed in 2016 as Avantek Machinery), and Liniar Limited (collectively referred to as “HLP”) each of which is registered in England and Wales. The purchase price was allocated to the fair value of the assets acquired and liabilities assumed. The agreement contained an earn-out provision which was calculated as a percentage of earnings before interest, tax and depreciation and amortization for a specified period, as defined in the purchase agreement. Pursuant to this earn-out provision, the former owner could select a base year upon which to calculate the earn-out (one of the next three succeeding twelve-month periods ended July 31). In August 2016, the former owner selected the twelve-month period ended July 31, 2016 as the measurement period for the earn-out calculation. On November 7, 2016, we paid $8.5 million to settle the earn-out.
We assumed operating leases associated with the HLP acquisition for which our lessors are entities that were either wholly-owned subsidiaries or affiliates of Flamstead Holdings Limited prior to the pre-acquisition reorganization, and in which a former
QUANEX BUILDING PRODUCTS CORPORATION
NOTES TO CONSOLIDATED FINANCIAL STATEMENTS (continued)
owner, who is now our employee, has an ownership interest. These leases include our primary operating facilities, a finished goods warehouse and a mixing plant. The lease for the manufacturing plant has a 20-year term which began in 2007, the lease for the warehouse has a 15-year term which began in 2012, and the lease for the mixing plant has a 13.5-year term which began in 2013. We recorded rent expense of approximately $1.3 million, $1.2 million and $1.3 million for the years ended October 31, 2018, 2017 and 2016, respectively. Future commitments of $9.9 million under these lease arrangements are included in our operating lease commitments disclosed in Note 12, "Commitments and Contingencies."
On February 20, 2017, we entered into a capital lease arrangement with the same related party to purchase a new warehouse facility at HLP. This capital lease resulted in a non-cash increase in property, plant and equipment and a corresponding increase in debt, as more fully described at Note 8, "Debt and Capital Lease Obligations - Other Debt Instruments", included herewith.
3.2. Accounts Receivable and Allowance for Doubtful AccountsCredit Losses
Accounts receivable consisted of the following as of October 31, 20182021 and 2017:2020 (in thousands): | | | | | | | | | | | |
| October 31, |
| 2021 | | 2020 |
| Trade receivables | $ | 107,725 | | | $ | 88,287 | |
| Other | 924 | | | 161 | |
| Total | 108,649 | | | 88,448 | |
| Less: Allowance for credit losses | 340 | | | 161 | |
| Accounts receivable, net | $ | 108,309 | | | $ | 88,287 | |
|
| | | | | | | |
| | October 31, |
| | 2018 | | 2017 |
| | (In thousands) |
| Trade receivables | $ | 83,828 |
| | $ | 79,221 |
|
| Other | 511 |
| | 523 |
|
| Total | $ | 84,339 |
| | $ | 79,744 |
|
| Less: Allowance for doubtful accounts | 325 |
| | 333 |
|
| Accounts receivable, net | $ | 84,014 |
| | $ | 79,411 |
|
The changes in our allowance for doubtful accountscredit losses were as follows:follows (in thousands): | | | | | | | | | | | | | | | | | |
| Year Ended October 31, |
| 2021 | | 2020 | | 2019 |
| Beginning balance as of November 1, 2020, 2019 and 2018 | $ | 161 | | | $ | 393 | | | $ | 325 | |
Current period provision for expected credit
losses | 267 | | | 262 | | | 700 | |
| Amounts written off | (88) | | | (494) | | | (916) | |
| Recoveries | — | | | — | | | 284 | |
| Balance as of October 31, 2021, 2020 and 2019 | $ | 340 | | | $ | 161 | | | $ | 393 | |
|
| | | | | | | | | | | |
| | Year Ended October 31, |
| | 2018 | | 2017 | | 2016 |
| | (In thousands) |
| Beginning balance as of November 1, 2017, 2016 and 2015, respectively | $ | 333 |
| | $ | 251 |
| | $ | 673 |
|
| Bad debt expense (benefit) | 46 |
| | 131 |
| | (67 | ) |
| Amounts written off | (54 | ) | | (49 | ) | | (371 | ) |
| Recoveries | — |
| | — |
| | 16 |
|
| Balance as of October 31, | $ | 325 |
| | $ | 333 |
| | $ | 251 |
|
4.3. Inventories
Inventories consisted of the following at October 31, 20182021 and 2017:2020 (in thousands):
|
| | | | | | | |
| | October 31, |
| | 2018 | | 2017 |
| | (In thousands) |
| Raw materials | $ | 41,584 |
| | $ | 50,472 |
|
| Finished goods and work in process | 31,727 |
| | 40,087 |
|
| Supplies and other | 1,794 |
| | 2,655 |
|
| Total | $ | 75,105 |
| | $ | 93,214 |
|
| Less: Inventory reserves | 5,740 |
| | 5,685 |
|
| Inventories, net | $ | 69,365 |
| | $ | 87,529 |
|
QUANEX BUILDING PRODUCTS CORPORATION
NOTES TO CONSOLIDATED FINANCIAL STATEMENTS (continued)
| | | | | | | | | | | |
| October 31, |
| 2021 | | 2020 |
| Raw materials | $ | 49,867 | | | $ | 33,298 | |
| Finished goods and work in process | 43,499 | | | 32,347 | |
| Supplies and other | 2,099 | | | 2,020 | |
| Total | 95,465 | | | 67,665 | |
| Less: Inventory reserves | 2,936 | | | 6,484 | |
| Inventories, net | $ | 92,529 | | | $ | 61,181 | |
The changes in our inventory reserve accounts were as follows for the years ended October 31, 2018, 2017 and 2016:(in thousands):
| | | | | | | | | | | | | | | | | |
| Year Ended October 31, |
| 2021 | | 2020 | | 2019 |
| Beginning balance as of November 1, 2020, 2019 and 2018 | $ | 6,484 | | | $ | 3,790 | | | $ | 4,375 | |
| Charged to cost of sales | (568) | | | 2,713 | | | 341 | |
| Write-offs | (3,060) | | | — | | | (939) | |
| Other | 80 | | | (19) | | | 13 | |
| Balance as of October 31, 2021, 2020 and 2019 | $ | 2,936 | | | $ | 6,484 | | | $ | 3,790 | |
|
| | | | | | | | | | | |
| | Year Ended October 31, |
| | 2018 | | 2017 | | 2016 |
| | (In thousands) |
| Beginning balance as of November 1, 2017, 2016 and 2015, respectively | $ | 5,685 |
| | $ | 4,994 |
| | $ | 8,106 |
|
| Charged to cost of sales | 1,501 |
| | 1,296 |
| | 8 |
|
| Write-offs | (1,415 | ) | | (661 | ) | | (3,048 | ) |
| Other | (31 | ) | | 56 |
| | (72 | ) |
| Balance as of October 31, | $ | 5,740 |
| | $ | 5,685 |
| | $ | 4,994 |
|
Our inventories at October 31, 2018 and 2017 were valued using the following costing methods:QUANEX BUILDING PRODUCTS CORPORATION
NOTES TO CONSOLIDATED FINANCIAL STATEMENTS (continued)
|
| | | | | | | |
| | October 31, |
| | 2018 | | 2017 |
| | (In thousands) |
| LIFO | $ | 4,273 |
| | $ | 4,444 |
|
| FIFO | 65,092 |
| | 83,085 |
|
| Total | $ | 69,365 |
| | $ | 87,529 |
|
For inventories valued using the LIFO method, replacement cost exceeded the LIFO value by approximately $1.4 million as of October 31, 2018 and 2017. During the fiscal year ended October 31, 2018, we increased the LIFO reserve and recorded a corresponding increase to cost of sales of approximately $0.3 million. This resulted in the liquidation of two LIFO layers and a corresponding benefit of less than $0.1 million to cost of sales. During the year ended October 31, 2016, we reduced the LIFO reserve and recorded a corresponding decrease to cost of sales of approximately $0.3 million. We did not record a LIFO adjustment for the year ended October 31, 2017, and we did not liquidate any LIFO layers during the years ended October 31, 2017 or 2016.
We record LIFO reserve adjustments as corporate expenses so that our chief operating decision maker can review the operations of our operating segments on a consistent FIFO or weighted-average basis. We calculate our LIFO reserve adjustments on a consolidated basis in a single pool using the dollar-value link chain method.
For our business acquisitions which have inventory balances, we integrate these operations and allow the use of either the LIFO or FIFO costing method. The inventory costing methods selected by these acquired businesses depends upon the facts and circumstances that exist at the time, and may include expected inventory quantities and expected future pricing levels. We perform this evaluation for each business acquired individually.
5.4. Property, Plant and Equipment
Property, plant and equipment consisted of the following at October 31, 20182021 and 2017:2020 (in thousands): | | | | | | | | | | | |
| | October 31, |
| | 2021 | | 2020 |
| Land and land improvements | $ | 10,285 | | | $ | 10,298 | |
| Buildings and building improvements | 101,740 | | | 100,576 | |
| Machinery and equipment | 386,996 | | | 398,950 | |
| Construction in progress | 16,102 | | | 14,424 | |
| Property, plant and equipment, gross | 515,123 | | | 524,248 | |
| Less: Accumulated depreciation | 336,493 | | | 340,144 | |
| Property, plant and equipment, net | $ | 178,630 | | | $ | 184,104 | |
|
| | | | | | | |
| | October 31, |
| | 2018 | | 2017 |
| | (In thousands) |
| Land and land improvements | $ | 10,366 |
| | $ | 10,491 |
|
| Buildings and building improvements | 98,212 |
| | 96,622 |
|
| Machinery and equipment | 371,106 |
| | 354,197 |
|
| Construction in progress | 10,293 |
| | 13,868 |
|
| Property, plant and equipment, gross | 489,977 |
| | 475,178 |
|
| Less: Accumulated depreciation | 288,607 |
| | 264,047 |
|
| Property, plant and equipment, net | $ | 201,370 |
| | $ | 211,131 |
|
Depreciation expense for the years ended October 31, 2018, 2017,2021, 2020, and 20162019 was $35.6$28.8 million $39.1, $31.8 million and $36.2$34.3 million, respectively.
QUANEX BUILDING PRODUCTS CORPORATION
NOTES TO CONSOLIDATED FINANCIAL STATEMENTS (continued)
Assets recorded under capital leases had a historical cost of $22.2 million and $24.3 million, respectively, and accumulated depreciation of $3.4 million and $2.8 million, respectively as of October 31, 2018 and 2017. Depreciation expense related to these assets totaled $1.1 million, $2.0 million and $0.8 million for the periods ended October 31, 2018, 2017, and 2016, respectively. Refer to Note 8, "Debt and Capital Lease Obligations" for additional information on capital leases.
If there are indicators of potential impairment, we evaluate our property, plant and equipment for recoverability over the remaining useful lives of the assets. We did not incur impairment losses associated with these assets for the years ended October 31, 2018, 2017,2021, 2020, and 2016.2019. See further discussion at Note 1, "Nature“Nature of Operations, Basis of Presentation and Significant Accounting Policies - Long-Lived Assets - Property, Plant and Equipment and Intangible Assets with Defined Lives."”
5. Leases
We recognize a right-of-use (ROU) asset and lease liability for each operating and finance lease with a contractual term greater than 12 months at the time of lease inception. We include ROU assets and lease liabilities for leases that exist within other contracts. Leases with an original term of 12 months or less are not recognized on the balance sheet, and the rent expense related to those short-term leases is recognized over the lease term. We do not account for lease and non-lease (e.g. common area maintenance) components of contracts separately for any underlying asset class.
We lease certain manufacturing plants, warehouses, office space, vehicles and equipment under finance and operating leases. Lease commencement occurs on the date we take possession or control of the property or equipment. Original terms for our real estate-related leases are generally between five and twenty years. Original terms for equipment-related leases, primarily manufacturing equipment and vehicles, are generally between one and ten years. Some of our leases also include rental escalation clauses. Renewal options are included in the determination of lease payments when management determines the options are reasonably certain of exercise, considering financial performance, strategic importance and/or invested capital.
If readily determinable, the rate implicit in the lease is used to discount lease payments to present value; however, substantially all of our leases do not provide a readily determinable implicit rate. When the implicit rate is not determinable, our estimated incremental borrowing rate is utilized, determined on a collateralized basis, to discount lease payments based on information available at lease commencement.
Total lease costs recorded include fixed operating lease costs and variable lease costs. Most of our real estate leases require we pay certain expenses, such as common area maintenance costs, of which the fixed portion is included in operating lease costs. We recognize operating lease costs on a straight-line basis over the lease term. In addition to the above costs, variable lease costs are recognized when probable and are not included in determining the present value of our lease liability.
The ROU asset is measured at the initial amount of the lease liability (calculated as the present value of lease payments over the term of the lease) adjusted for lease payments made at or before the lease commencement date and initial direct costs. For operating leases, ROU assets are reduced over the lease term by the recognized straight-line lease expense less the amount of accretion of the lease liability determined using the effective interest method. For finance leases, ROU assets are amortized on a straight-line basis over the shorter of the useful life of the leased asset or the lease term. Interest expense on each finance lease liability is recognized utilizing the effective interest method. ROU assets are tested for impairment in the same manner as long-lived assets and we determined there have been no triggering events for impairment. Additionally, we monitor for events or changes in circumstances that may require a reassessment of one of our leases and determine if a remeasurement is required.
QUANEX BUILDING PRODUCTS CORPORATION
NOTES TO CONSOLIDATED FINANCIAL STATEMENTS (continued)
The table below presents the lease-related assets and liabilities recorded on the balance sheet at October 31, 2021 and 2020 (in thousands): | | | | | | | | | | | | | | | | | | | | |
| | | | October 31, |
| Leases | | Classification | | 2021 | | 2020 |
| Assets | | | | | | |
| Operating lease assets | | Operating lease right-of-use assets | | $ | 52,708 | | | $ | 51,824 | |
| Finance lease assets | | Property, plant and equipment (less accumulated depreciation of $2,300 and $1,089) | | 16,921 | | | 15,609 | |
| Total lease assets | | | | $ | 69,629 | | | $ | 67,433 | |
| | | | | | |
| Liabilities | | | | | | |
| Current | | | | | | |
| Operating | | Current operating lease liabilities | | $ | 8,196 | | | $ | 7,459 | |
| Finance | | Current maturities of long-term debt | | 1,114 | | | 962 | |
| Noncurrent | | | | | | |
| Operating | | Noncurrent operating lease liabilities | | 45,367 | | | 44,873 | |
| Finance | | Long-term debt | | 14,335 | | | 14,236 | |
| Total lease liabilities | | | | $ | 69,012 | | | $ | 67,530 | |
The table below presents the components of lease costs for the year ended October 31, 2021 and 2020 (in thousands):
| | | | | | | | | | | |
| Year Ended October 31, |
| 2021 | | 2020 |
| Operating lease cost | $ | 10,125 | | | $ | 8,866 | |
| Finance lease cost | | | |
| Amortization of leased assets | 1,165 | | | 1,181 | |
| Interest on lease liabilities | 561 | | 557 |
| Variable lease costs | 983 | | 748 |
| Total lease cost | $ | 12,834 | | | $ | 11,352 | |
The table below presents supplemental cash flow information related to leases for the year ended October 31, 2021 and 2020 (in thousands):
| | | | | | | | | | | |
| Year Ended October 31, |
| 2021 | | 2020 |
| Cash paid for amounts included in the measurement of lease liabilities: | | | |
| Finance leases - financing cash flows | $ | 1,003 | | | $ | 1,092 | |
| Finance leases - operating cash flows | $ | 561 | | | $ | 557 | |
| Operating leases - operating cash flows | $ | 9,621 | | | $ | 8,681 | |
| | | |
| Right-of-use assets obtained in exchange for lease liabilities: | | | |
| Operating leases | $ | 8,737 | | | $ | 19,559 | |
| Finance leases | $ | 469 | | | $ | 398 | |
QUANEX BUILDING PRODUCTS CORPORATION
NOTES TO CONSOLIDATED FINANCIAL STATEMENTS (continued)
The table below presents the weighted average remaining lease terms and weighted average discount rates for the Company's leases as of October 31, 2021 and 2020:
| | | | | | | | | | | |
| October 31, |
| 2021 | | 2020 |
| Weighted average remaining lease term (in years) | | | |
| Operating leases | 7.7 | | 7.8 |
| Financing leases | 15.1 | | 15.3 |
| | | |
| Weighted average discount rate | | | |
| Operating leases | 3.23 | % | | 3.52 | % |
| Financing leases | 3.72 | % | | 3.62 | % |
The table below presents the maturity of the lease liabilities as of October 31, 2021 (in thousands):
| | | | | | | | | | | |
| Operating Leases | | Finance Leases |
| 2022 | $ | 9,747 | | | $ | 1,638 | |
| 2023 | 9,337 | | | 1,549 | |
| 2024 | 8,594 | | | 1,466 | |
| 2025 | 7,129 | | | 1,402 | |
| 2026 | 6,140 | | | 1,305 | |
| Thereafter | 19,340 | | | 12,311 | |
| Total lease payments | 60,287 | | | 19,671 | |
| Less: present value discount | 6,724 | | | 4,222 | |
| Total lease liabilities | $ | 53,563 | | | $ | 15,449 | |
6. Goodwill and Intangible Assets
Goodwill
The change in the carrying amount of goodwill for the years ended October 31, 20182021 and 20172020 was as follows:follows (in thousands):
| | | | | | | | | | | |
| Year Ended October 31, |
| | 2021 | | 2020 |
| Beginning balance as of November 1, 2021 and 2020 | $ | 146,154 | | | $ | 145,563 | |
| | | |
| | | |
| | | |
| Foreign currency translation adjustment | 3,051 | | | 591 | |
| Balance as of October 31, 2021 and 2020 | $ | 149,205 | | | $ | 146,154 | |
|
| | | | | | | |
| | Year Ended October 31, |
| | 2018 | | 2017 |
| | (In thousands) |
| Beginning balance as of November 1, 2017 and 2016 | $ | 222,194 |
| | $ | 217,035 |
|
| Foreign currency translation adjustment | (2,567 | ) | | 5,159 |
|
| Balance as of October 31, | $ | 219,627 |
| | $ | 222,194 |
|
At our annual testing date, August 31, 2018,2021, we had five reportablehad 5 reporting units with goodwill balances. TwoNaN of these units were included in our NA Engineered ComponentsFenestration segment and had goodwill balances of $35.9 million and $2.8 million, two2 units were included in our EU Engineered ComponentsFenestration segment with goodwill balances of $50.2$53.8 million and $17.0$17.5 million, and our NA Cabinet Components segment had one1 unit with a goodwill balance of $113.7$39.2 million. We determined our goodwill was not impaired atDuring the year ended October 31, 2018.2019, we recorded impairment charges of $74.6 million associated with our NA Cabinet Components segment. The details of the impairment charges, as well as the results of our goodwill impairment testing in August 2018 isassessments during the year ended October 31, 2021 are more fully described at Note 1, "Nature“Nature of Operations, Basis of Presentation and Significant Accounting Policies - Long-Lived Assets - Goodwill."” For a summary of the year ended October 31, 2016, we recorded an impairment chargechange in the carrying amount of $12.6 million associated with the remaining goodwill by segment, see Note 16, “Segment Information.”
QUANEX BUILDING PRODUCTS CORPORATION
NOTES TO CONSOLIDATED FINANCIAL STATEMENTS (continued)
Identifiable Intangible Assets
Amortizable intangible assets consisted of the following as of October 31, 20182021 and 2017:
|
| | | | | | | | | | | | | | | | | |
| | October 31, 2018 | | October 31, 2018 | | October 31, 2017 |
| | Remaining Weighted Average Useful Life | | Gross Carrying Amount | | Accumulated Amortization | | Gross Carrying Amount | | Accumulated Amortization |
| | | | (In thousands) |
| Customer relationships | 11 years | | $ | 153,704 |
| | $ | 59,332 |
| | $ | 155,230 |
| | $ | 48,479 |
|
| Trademarks and trade names | 11 years | | 55,583 |
| | 32,668 |
| | 56,058 |
| | 29,509 |
|
| Patents and other technology | 3 years | | 22,278 |
| | 17,646 |
| | 22,624 |
| | 16,146 |
|
| Total | | | $ | 231,565 |
| | $ | 109,646 |
| | $ | 233,912 |
| | $ | 94,134 |
|
| | | | | | | | | | | | | | | | | | | | | | | | | | | | | |
| | October 31, 2021 | | October 31, 2021 | | October 31, 2020 |
| Remaining Weighted Average Useful Life | | Gross Carrying
Amount | | Accumulated
Amortization | | Gross Carrying
Amount | | Accumulated
Amortization |
| Customer relationships | 9 years | | $ | 146,207 | | | $ | 81,086 | | | $ | 154,004 | | | $ | 80,441 | |
| Trademarks and trade names | 8 years | | 56,437 | | | 39,589 | | | 55,745 | | | 37,314 | |
| Patents and other technology | 6 years | | 22,525 | | | 22,084 | | | 22,386 | | | 21,312 | |
| | | | | | | | | |
| Total | | | $ | 225,169 | | | $ | 142,759 | | | $ | 232,135 | | | $ | 139,067 | |
We do not estimate a residual value associated with these intangible assets. During October 2016 and throughout 2017, we determined that triggering events occurred which necessitated a review of our long-term assets. Based on an undiscounted cash flow analysis, we determined that our defined-lived intangible assets were not impaired. In addition, we shortened the life of several defined-lived intangible assets, which resulted in the recognition of incremental amortization expense of $1.9 million and $0.3 million for the years ended October 31, 2017 and 2016, respectively. We did not incur any corresponding incremental amortization expense during the year ended October 31, 2018. See additional disclosure at Note 1, "Nature of Operations, Basis of Presentation and Significant Accounting Policies - Restructuring."
During the yearyears ended October 31, 2018, we retired fully amortized identifiable assets of $0.3 million related to patents2021 and other technology. During the year ended October 31, 2017,2020, we retired fully amortized identifiable intangible assets of $2.4$9.9 million primarilyand $0.3 million, respectively, related to customer relationships. During the year ended October 31, 2019, we retired fully amortized identifiable intangible assets of $0.3 million related to customer relationships and patents and other technology, including such assets associated with the restructuring mentioned above.technology.
QUANEX BUILDING PRODUCTS CORPORATION
NOTES TO CONSOLIDATED FINANCIAL STATEMENTS (continued)
The aggregate amortization expense associated with identifiable intangible assets for the years ended October 31, 2018, 2017,2021, 2020, and 20162019 was $16.2$12.8 million $18.4, $14.3 million and $16.9$15.3 million, respectively.
Estimated remaining amortization expense, assuming current intangible balances and no new acquisitions, for future fiscal years ending October 31, 2021 is as follows (in thousands): |
| | | |
| | Estimated Amortization Expense |
| 2019 | $ | 15,282 |
|
| 2020 | 14,226 |
|
| 2021 | 12,506 |
|
| 2022 | 11,883 |
|
| 2023 | 11,136 |
|
| Thereafter | 56,886 |
|
| Total | $ | 121,919 |
|
| | | | | |
| Estimated
Amortization Expense |
| 2022 | $ | 12,134 | |
| 2023 | 11,376 | |
| 2024 | 10,626 | |
| 2025 | 9,399 | |
| 2026 | 9,329 | |
| Thereafter | 29,546 | |
| Total | $ | 82,410 | |
We did not incur impairment losses related to our identifiable intangible assets during the years ended October 31, 2018, 2017,2021, 2020, and 2016.2019.
QUANEX BUILDING PRODUCTS CORPORATION
NOTES TO CONSOLIDATED FINANCIAL STATEMENTS (continued)
7. Accrued Liabilities
Accrued liabilities consisted of the following at October 31, 20182021 and 2017:2020 (in thousands):
| | | | | | | | | | | |
| | October 31, |
| | 2021 | | 2020 |
| Payroll, payroll taxes and employee benefits | $ | 30,039 | | | $ | 16,000 | |
| Accrued insurance and workers compensation | 6,340 | | | 5,108 | |
| Sales allowances | 8,590 | | | 6,297 | |
| Deferred compensation (current portion) | 395 | | | 192 | |
| Deferred revenue | 627 | | | 763 | |
| Warranties | 77 | | | 81 | |
| Audit, legal, and other professional fees | 1,886 | | | 1,562 | |
| Accrued taxes | 3,258 | | | 4,000 | |
| | | |
| Other | 4,944 | | | 4,286 | |
| Accrued liabilities | $ | 56,156 | | | $ | 38,289 | |
|
| | | | | | | |
| | October 31, |
| | 2018 | | 2017 |
| | (In thousands) |
| Payroll, payroll taxes and employee benefits | $ | 28,202 |
| | $ | 16,733 |
|
| Accrued insurance and workers compensation | 3,095 |
| | 3,591 |
|
| Sales allowances | 6,514 |
| | 9,070 |
|
| Deferred compensation (current portion) | 153 |
| | 669 |
|
| Deferred revenue | 287 |
| | 625 |
|
| Warranties | 148 |
| | 168 |
|
| Audit, legal, and other professional fees | 2,170 |
| | 2,096 |
|
| Accrued taxes | 2,286 |
| | 2,656 |
|
| Other | 3,113 |
| | 3,263 |
|
| Accrued liabilities | $ | 45,968 |
| | $ | 38,871 |
|
8. Debt and Capital Lease Obligations
Long-term debt consisted of the following at October 31, 20182021 and 2017:
|
| | | | | | | |
| | October 31, |
| | 2018 | | 2017 |
| | (In thousands) |
| Revolving Credit Facility | $ | 195,000 |
| | $ | 84,000 |
|
| Term Loan A | — |
| | 138,750 |
|
| Capital lease obligations | 17,043 |
| | 18,764 |
|
| Unamortized deferred financing fees | $ | (1,487 | ) | | $ | (2,088 | ) |
| Total debt | $ | 210,556 |
| | $ | 239,426 |
|
| Less: Current maturities of long-term debt | 1,224 |
| | 21,242 |
|
| Long-term debt | $ | 209,332 |
| | $ | 218,184 |
|
QUANEX BUILDING PRODUCTS CORPORATION
NOTES TO CONSOLIDATED FINANCIAL STATEMENTS (continued)
2020 (in thousands): | | | | | | | | | | | |
| October 31, |
| 2021 | | 2020 |
| Revolving Credit Facility | $ | 38,000 | | | $ | 103,000 | |
| | | |
| Finance lease obligations and other | 15,537 | | | 15,321 | |
| Unamortized deferred financing fees | (597) | | | (901) | |
| Total debt | 52,940 | | | 117,420 | |
| Less: Current maturities of long-term debt | 846 | | | 692 | |
| Long-term debt | $ | 52,094 | | | $ | 116,728 | |
Revolving Credit Facility
On November 2, 2015,October 18, 2018, we entered into a $310.0 million Term Loan Credit Agreement and a $100.0 million ABL Credit Agreement (collectively the “2015 Credit Facilities”) with Wells Fargo, National Association, as Agent, and Bank of America, N.A. serving as Syndication Agent. The term loan portion of the 2015 Credit Facilities was to mature on November 2, 2022, and required quarterly principal payments equal to 0.25% of the aggregate borrowings. Interest was computed, at our election, based on a Base Rate plus applicable margin of 4.25%, or LIBOR plus applicable margin of 5.25% (with the stipulation that LIBOR could not be less than 1%). The term loan provided for incremental term loan commitments for a minimum principal amount of $25.0 million, up to an aggregate amount of $50.0 million, to the extent that such borrowings did not cause the Consolidated Senior Secured Leverage Ratio to exceed 3.00 to 1.00. The term loan agreement permitted prepayment of the term loan of at least an aggregate amount of $5.0 million, or any whole multiple of $1.0 million, in excess thereof without penalty, except if such prepayment was made on or before November 2, 2016, we would pay a fee equal to 1% of such prepayment. The ABL portion of the 2015 Credit Facilities was to mature on November 2, 2020 with no stated principal repayment terms prior to maturity. Borrowing capacity and availability was determined based upon the dollar equivalent of certain working capital items including receivables and inventory, subject to eligibility as determined by Wells Fargo, National Association, as Administrative Agent, up to the facility maximum of $100.0 million. Interest was computed, at our election, on a grid as the Base Rate plus an Applicable Margin, as defined in the agreement, or LIBOR plus an Applicable Margin. The Applicable Margin applied for the duration of the 2015 Credit Facilities was 0.50% for Base Rate loans and 1.50% for LIBOR Rate loans. In addition, the ABL portion of the 2015 Credit Facilities required payment of a commitment fee (unused line fee) based on the average revolver usage. The unused line fee of 0.375% was applied for the duration of the 2015 Credit Facilities.
On July 29, 2016, we refinanced and retired the 2015 Credit Facilities and entered into a $450.0 million credit agreement comprising a $150.0 million Term Loan A and a $300.0$325.0 million revolving credit facility (collectively, the “2016 Credit Agreement”(the “Credit Facility”), with Wells Fargo Bank, National Association, as Agent, Swingline Lender and Issuing Lender, and Bank of America, N.A. serving as Syndication Agent. The 2016 Credit Agreement hadFacility has a five-year term, maturing on July 29, 2021,October 18, 2023, and requiredrequires interest payments calculated, at our election and depending upon our Consolidated Leverage Ratio, at either a Base Rate plus an applicable margin or the LIBOR Rate plus an applicable margin. At the timeAs of the initial borrowing,October 31, 2021, the applicable rate was LIBOR + 2.00%. In addition, we were subject to commitment fees for the unused portion of the 2016 Credit Agreement.
The applicable margin and commitment fees are outlined in the following table: |
| | | | | | | | |
| Pricing Level | | Consolidated Leverage Ratio | | Commitment Fee | | LIBOR Rate Loans | | Base Rate Loans |
| I | | Less than or equal to 1.50 to 1.00 | | 0.200% | | 1.50% | | 0.50% |
| II | | Greater than 1.50 to 1.00, but less than or equal to 2.25 to 1.00 | | 0.225% | | 1.75% | | 0.75% |
| III | | Greater than 2.25 to 1.00, but less than or equal to 3.00 to 1.00 | | 0.250% | | 2.00% | | 1.00% |
| IV | | Greater than 3.00 to 1.00 | | 0.300% | | 2.25% | | 1.25% |
In the event of default, outstanding borrowings would accrue interest at the Default Rate, as defined, whereby the obligations will bear interest at a per annum rate equal to 2% above the total per annum rate otherwise applicable.
The term loan portion of the 2016 Credit Agreement required quarterly principal payments on the last business day of each fiscal quarter in accordance with a stated repayment schedule. Required aggregate principal repayments totaled $15.0 million for the succeeding twelve-month period, and were included in the accompanying consolidated balance sheet under the caption “Current Maturities of Long-term Debt.” No stated principal payments were required under the revolving credit portion of the 2016 Credit Agreement, except upon maturity. We were required to make mandatory prepayments of "excess cash flow" as defined in the agreement if our Consolidated Leverage Ratio was less than 2.25 to 1.00.
The 2016 Credit Agreement provided for incremental term loan or revolving credit commitments for a minimum principal amount of $10.0 million, up to an aggregate amount of $150.0 million, subject to the lender's discretion to elect or decline the incremental increase. We could also borrow up to the lesser of $15.0 million or the revolving credit commitment, as defined, under a Swingline feature of the Credit Agreement. We were permitted to prepay the term loan under the Credit Agreement, without premium or penalty, in aggregate principal amounts of $1.0 million or whole multiples of $0.5 million in excess thereof.
The 2016 Credit Agreement contained a: (1) Consolidated Fixed Charge Coverage Ratio requirement whereby we could not permit the Consolidated Fixed Charge Coverage Ratio, as defined, to be less than 1.10 to 1.00, and (2) Consolidated Leverage Ratio requirement, as summarized by period in the following table:
QUANEX BUILDING PRODUCTS CORPORATION
NOTES TO CONSOLIDATED FINANCIAL STATEMENTS (continued)
|
| | |
Period | | Maximum Ratio |
Closing Date through January 30, 2017 | | 3.50 to 1.00 |
January 31, 2017 through January 30, 2018 | | 3.25 to 1.00 |
January 31, 2018 and thereafter | | 3.00 to 1.00 |
In addition to maintaining these financial covenants, the 2016 Credit Agreement also limited our ability to enter into certain business transactions, such as to incur indebtedness or liens, to acquire businesses or dispose of material assets, make restricted payments, pay dividends (limited to $10.0 million per year) and other transactions as further defined in the Credit Agreement. Substantially all of our domestic assets, with the exception of real property, were utilized as collateral for the Credit Agreement.
We utilized the funding from the 2016 Credit Agreement, along with additional funding of $16.4 million of cash on hand, to repay outstanding borrowings under the 2015 Credit Facilities of $309.2 million, to pay a 1% prepayment call premium under the Term Loan B portion thereof, to settle outstanding interest accrued under the prior facility, and to pay loan fees associated with the 2016 Credit Agreement which totaled $2.8 million. In addition to the 1% prepayment call premium fee, we expensed $8.1 million to write-off unamortized deferred financing fees and $5.5 million of unamortized original issuer’s discount associated with the 2015 Credit Facilities.
On October 18, 2018, we amended and extended the 2016 Credit Agreement by entering into a $325.0 million revolving credit facility (the “2018 Credit Facility”), with Wells Fargo Bank, National Association, as Agent, Swingline Lender and Issuing Lender, and Bank of America, N.A. serving as Syndication Agent. The 2018 Credit Facility has a five-year term, maturing on October 18, 2023, and required interest payments calculated, at our election and depending upon our Consolidated Leverage Ratio, at either a Base Rate plus an applicable margin or the LIBOR Rate plus an applicable margin. At the time of the initial borrowing, the applicable rate was LIBOR + 1.50%1.25%. In addition, we are subject to commitment fees for the unused portion of the 2018 Credit Facility.
The applicable margin and commitment fees are outlined in the following table:
| | | | | | | | | | | | | | | | | | | | | | | | | | |
| Pricing Level | | Consolidated Leverage Ratio | | Commitment Fee | | LIBOR Rate Loans | | Base Rate Loans |
| I | | Less than or equal to 1.50 to 1.00 | | 0.200% | | 1.25% | | 0.25% |
| II | | Greater than 1.50 to 1.00, but less than or equal to 2.25 to 1.00 | | 0.225% | | 1.50% | | 0.50% |
| III | | Greater than 2.25 to 1.00, but less than or equal to 3.00 to 1.00 | | 0.250% | | 1.75% | | 0.75% |
| IV | | Greater than 3.00 to 1.00 | | 0.300% | | 2.00% | | 1.00% |
In the event of default, outstanding borrowings accrue interest at the Default Rate, as defined, whereby the obligations will bear interest at a per annum rate equal to 2% above the total per annum rate otherwise applicable.
The 2018 Credit Facility providedprovides for incremental revolving credit commitments for a minimum principal amount of $10.0 million, up to an aggregate amount of $150.0 million, subject to the lender's discretion to elect or decline the incremental
QUANEX BUILDING PRODUCTS CORPORATION
NOTES TO CONSOLIDATED FINANCIAL STATEMENTS (continued)
increase. We can also borrow up to the lesser of $15.0 million or the revolving credit commitment, as defined, under a Swingline feature of the Credit Agreement.
The 2018 Credit Facility contains a: (1) Consolidated Interest Coverage Ratio requirement whereby we must not permit the Consolidated Interest Coverage Ratio, as defined, to be less than 2.25 to 1.00, and (2) Consolidated Leverage Ratio requirement whereby we must not permit the Consolidated Leverage Ratio, as defined, must be greater than 3.25 to 1.00.
In addition to maintaining these financial covenants, the 2018 Credit Facility also limits our ability to enter into certain business transactions, such as to incur indebtedness or liens, to acquire businesses or dispose of material assets, make restricted payments, pay dividends (limited to $20.0 million per year) and other transactions as further defined in the 2018 Credit Facility. Some of these limitations, however, do not take effect so long as total leverage is less than or equal to 2.75 to 1.00 and available liquidity exceeds $25$25.0 million. Substantially all of our domestic assets, with the exception of real property were utilizedused as collateral for the Credit Agreement.
We utilizedOur initial borrowings offrom the Credit Facility were $205.0 million from the 2018 Credit Facility,and along with additional funding of $10.0 million of cash on hand, was used to repay outstanding borrowings under the 2016 Credit Agreementa previous credit agreement of $213.5 million, to settle outstanding interest accrued and loan fees under theour prior credit facility, and to pay loan fees associated with the 2018 Credit Agreement which totaled $1.0 million. We expensed $1.1 million of unamortized deferred financing fees associated with the 2016 Credit Agreement,previous credit agreement, while
QUANEX BUILDING PRODUCTS CORPORATION
NOTES TO CONSOLIDATED FINANCIAL STATEMENTS (continued)
deferring the remaining $0.5 million of unamortized deferred financing fees attributable to the remaining lenders from the previous facility over the life of the 2018 Credit Facility.
As of October 31, 2018,2021, we had $195.0$38.0 million of borrowings outstanding under the Credit AgreementFacility (reduced by unamortized debt issuance costs of $1.5of $0.6 million), $5.3$4.5 million of outstanding letters of credit and $17.0$15.5 million outstanding under capitalfinance leases. We had $124.7$282.5 million availableavailable for use under the Credit AgreementFacility at October 31, 2018.2021. The borrowings outstanding as of October 31, 20182021 under the Credit AgreementFacility accrue interestinterest at 3.80%1.34% per annum, and our weighted average borrowing rate for borrowings outstanding during the years ended October 31, 20182021 and 20172020 was 3.76%1.42% and 2.95%2.45%, respectively. We were in compliance with our debt covenants as of October 31, 2018.2021.
Other Debt Instruments
During the year ended October 31, 2017, we fully repaid $0.4 million related to the City of Richmond, Kentucky, Industrial Building Revenue Bonds, which had annual installment payments due through October 2020. Interest was payable monthly at a variable rate, which ranged from 0.7% to 1.3% during the fiscal year ended October 31, 2017. The average interest rate during each of the fiscal years ended October 31, 2017 and 2016 was 1.0% and 0.5%, respectively.
Historically, we have maintainedWe maintain certain capitalfinance lease obligations related to equipment purchases. On February 20, 2017, we entered into a capital leasepurchases, vehicles, and warehouse space. Refer to Note 5 “Leases” for warehouse space at HLP with a related-party company that is owned byfurther information regarding our employee, the former owner of HLP. This new warehouse was anticipated at the time of the HLP acquisition in June 2015, and the lease was negotiated at arms-length. The lease accrues interest at 3.57% per annum, and extends for a twenty-year period through the year 2036. We recorded the leased asset at inception at fair value of $16.6 million and recorded a corresponding liability for our obligation under this lease. The accompanying statement of cash flows as of October 31, 2017 excludes these assets and related obligations as non-cash investing and financing activities. We are recognizing interest expense using the effective interest method over the term. Our cash commitments under this lease are £0.9 million per year for an aggregate of £17.8 million (or approximately $23.6 million). The cost and accumulated depreciation of property, plant and equipment under capital leases at October 31, 2018 was $22.2 million and $3.4 million, respectively, including $16.3 million and $1.4 million, respectively, related to this warehouse lease. These obligations accrue interest at an average rate of 3.59%, and extend through the year 2036.finance leases.
The table below presents the scheduled maturity dates of our long-term debt outstanding (excluding deferred loan costsfinancing fees of $1.5$0.6 million) at October 31, 20182021 (in thousands): | | | | | | | | | | | | | | | | | |
| Revolving Credit Facility | | Finance Leases and Other Obligations | | Aggregate Maturities |
| 2022 | $ | — | | | $ | 1,671 | | | $ | 1,671 | |
| 2023 | 38,000 | | | 1,582 | | | 39,582 | |
| 2024 | — | | | 1,489 | | | 1,489 | |
| 2025 | — | | | 1,402 | | | 1,402 | |
| 2026 | — | | | 1,305 | | | 1,305 | |
| Thereafter | — | | | 12,310 | | | 12,310 | |
| Total debt payments | 38,000 | | | 19,759 | | | 57,759 | |
| Less: present value discount of finance leases | — | | | (4,222) | | | (4,222) | |
| Total | $ | 38,000 | | | $ | 15,537 | | | $ | 53,537 | |
|
| | | | | | | | | | | |
| | Revolving Credit Facility | | Capital Leases and Other Obligations | | Aggregate Maturities |
| 2019 | $ | — |
| | $ | 1,523 |
| | $ | 1,523 |
|
| 2020 | — |
| | 1,076 |
| | 1,076 |
|
| 2021 | — |
| | 884 |
| | 884 |
|
| 2022 | — |
| | 876 |
| | 876 |
|
| 2023 | 195,000 |
| | 807 |
| | 195,807 |
|
| Thereafter | — |
| | 11,877 |
| | 11,877 |
|
| Total | $ | 195,000 |
| | $ | 17,043 |
| | $ | 212,043 |
|
9. Retirement Plans
We have a number of retirement plans covering substantially all employees. We provide both defined benefit and defined contribution plans. In general, an employee’s coverage for retirement benefits depends on the location of employment.
QUANEX BUILDING PRODUCTS CORPORATION
NOTES TO CONSOLIDATED FINANCIAL STATEMENTS (continued)
Defined Benefit Plan
We have aOur non-contributory, single employer defined benefit pension plan that covers the majoritycertain of our domestic employees excludingin the Woodcraft employees who are not currently participating. EffectiveU.S. On January 1, 2007,2020 we amended this defined benefitenacted changes to our pension plan to include a cash balance formulawhereby the benefits for all new salaried employees hired on or after January 1, 2007participants were frozen and for any non-union employees who were not participatingthereafter those participants will receive increased benefits in the Company sponsored defined contribution plan in lieu of participation in a defined benefit plan prior to January 1, 2007. All participating salaried employees hired after January 1, 2007, are eligible to receive credits equivalent to 4% of their annual eligible wages. Some of the employees at the time of the amendment were “grandfathered” and are eligible to receive credits ranging up to 6.5% based upon a percentage of benefits received under our defined benefit plan prior to this amendment of the pension plan. Additionally, everyEvery year, the participants will receive an interest related credit on their respective balance equivalent to the prevailing 30-year Treasury rate. The majority our pension plan participants have their benefit determined pursuant to the cash balance formula. For employees who were participating in this plan prior to January 1, 2007,the remaining participants, the benefit formula is a more traditional formula for retirement benefits, whereby the plan pays benefits to employees upon retirement, using a formula which considers years of service and pensionable compensation prior to retirement. Of our
As a result of this action, we remeasured the pension assets and obligations for the pension plan, participants, 99% have theirwhich resulted in a decrease to our projected benefit determined pursuant toobligation and a corresponding net actuarial gain that was recorded in accumulated other comprehensive income (loss). This remeasurement is included in the cash balance formula.tables below, which reflect the full impact of pension plan results and accounting measurements for the year ended October 31, 2020.
The Medicare Prescription Drug, Improvement and Modernization Act of 2003 (the "Act") was signed into law on December 8, 2003. This Act introduces a Medicare prescription-drug benefit beginning in 2006 as well as a federal subsidy to sponsors of retiree health care plans that provide a benefit at least “actuarially equivalent” to the Medicare benefit. We concluded that our plans are at least “actuarially equivalent” to the Medicare benefit. For those who are otherwise eligible for the subsidy, we have not included this subsidy per the Act in our benefit calculations. The impact to net periodic benefit cost and to benefits paid did not have a material impact on the consolidated financial statements.
Funded Status and Net periodic Benefit Cost
The changes in benefit obligationsobligation and plan assets, and our funded status (reported in deferred pension and postretirement benefits on the consolidated balance sheets) were as follows:follows (in thousands):
| | | | | | | | | | | |
| | October 31, |
| Change in Benefit Obligation: | 2021 | | 2020 |
| Beginning balance as of November 1, 2020 and 2019 | $ | 44,825 | | | $ | 44,323 | |
| Service cost | 850 | | | 1,262 | |
| Interest cost | 756 | | | 1,139 | |
| Actuarial loss | (849) | | | 2,823 | |
| Benefits paid | (359) | | | (712) | |
| Administrative expenses | (732) | | | (785) | |
| Curtailments | — | | | (1,141) | |
| Settlements | (2,112) | | | (2,084) | |
| Projected benefit obligation at October 31, 2021 and 2020 | $ | 42,379 | | | $ | 44,825 | |
| Change in Plan Assets: | | | |
| Beginning balance as of November 1, 2020 and 2019 | $ | 34,120 | | | $ | 31,212 | |
| Actual return on plan assets | 6,225 | | | 2,789 | |
| Employer contributions | 500 | | | 3,700 | |
| Benefits paid | (359) | | | (712) | |
| Administrative expenses | (732) | | | (785) | |
| Settlements | (2,112) | | | (2,084) | |
| Fair value of plan assets at October 31, 2021 and 2020 | $ | 37,642 | | | $ | 34,120 | |
| Noncurrent liability - Funded Status | $ | (4,737) | | | $ | (10,705) | |
|
| | | | | | | |
| | October 31, |
| | 2018 | | 2017 |
| Change in Benefit Obligation: | (In thousands) |
| Beginning balance as of November 1, 2017 and 2016, respectively | $ | 38,323 |
| | $ | 36,892 |
|
| Service cost | 3,908 |
| | 3,794 |
|
| Interest cost | 1,130 |
| | 859 |
|
| Actuarial gain | (4,296 | ) | | (318 | ) |
| Benefits paid | (2,551 | ) | | (2,263 | ) |
| Administrative expenses | (555 | ) | | (641 | ) |
| Projected benefit obligation at October 31, | $ | 35,959 |
| | $ | 38,323 |
|
| Change in Plan Assets: | | | |
| Beginning balance as of November 1, 2017 and 2016, respectively | $ | 34,340 |
| | $ | 29,210 |
|
| Actual return on plan assets | 66 |
| | 4,434 |
|
| Employer contributions | 764 |
| | 3,600 |
|
| Benefits paid | (2,551 | ) | | (2,263 | ) |
| Administrative expenses | (555 | ) | | (641 | ) |
| Fair value of plan assets at October 31, | $ | 32,064 |
| | $ | 34,340 |
|
| Non current liability - Funded Status | $ | (3,895 | ) | | $ | (3,983 | ) |
As of October 31, 20182021 and 2017,2020, included in our accumulated comprehensive loss was a net actuarial loss of $3.0$4.5 million and $5.2$9.9 million, respectively. There were no net prior service costs or transition obligations for the years ended October 31, 20182021 and 2017.2020.
QUANEX BUILDING PRODUCTS CORPORATION
NOTES TO CONSOLIDATED FINANCIAL STATEMENTS (continued)
As of October 31, 20182021 and 2017,2020, the accumulated benefit obligation was $35.4$42.4 million and $37.4$44.8 million, respectively. The accumulated benefit obligation is the present value of pension benefits (whether vested or unvested) attributed to employee service rendered before the measurement date, and based on employee service and compensation prior to that date. The accumulated benefit obligation differs from the projected benefit obligation in that it includes no assumption about future compensation levels.
QUANEX BUILDING PRODUCTS CORPORATION
NOTES TO CONSOLIDATED FINANCIAL STATEMENTS (continued)
The net periodic benefit cost for the years ended October 31, 2018, 20172021, 2020 and 2016,2019, was as follows:follows (in thousands):
| | | | Year Ended October 31, | | | | | | | | | | | | | | | |
| | 2018 | | 2017 | | 2016 | | Year Ended October 31, |
| | (In thousands) | | 2021 | | 2020 | | 2019 |
| Service cost | $ | 3,908 |
| | $ | 3,794 |
| | $ | 3,712 |
| Service cost | $ | 850 | | | $ | 1,262 | | | $ | 3,629 | |
| Interest cost | 1,130 |
| | 859 |
| | 828 |
| Interest cost | 756 | | | 1,139 | | | 1,456 | |
| Expected return on plan assets | (2,172 | ) | | (1,863 | ) | | (1,617 | ) | Expected return on plan assets | (1,960) | | | (2,006) | | | (1,977) | |
| Amortization of net loss | 64 |
| | 574 |
| | 384 |
| Amortization of net loss | 143 | | | 162 | | | 125 | |
| Settlements | | Settlements | 222 | | | 462 | | | — | |
| Net periodic benefit cost | $ | 2,930 |
| | $ | 3,364 |
| | $ | 3,307 |
| Net periodic benefit cost | $ | 11 | | | $ | 1,019 | | | $ | 3,233 | |
The changes in plan assets and projected benefit obligations which were recognized in our other comprehensive loss for the years ended October 31, 2018, 20172021, 2020 and 20162019 were as follows:follows (in thousands):
|
| | | | | | | | | | | |
| | Year Ended October 31, |
| | 2018 | | 2017 | | 2016 |
| | (In thousands) |
| Net (gain) loss arising during the period | $ | (2,189 | ) | | $ | (2,888 | ) | | $ | 3,556 |
|
| Less: Amortization of net loss | $ | 64 |
| | $ | 574 |
| | $ | 384 |
|
| Total recognized in other comprehensive loss | $ | (2,253 | ) | | $ | (3,462 | ) | | $ | 3,172 |
|
As of October 31, 2016, we recorded a $0.3 million pre-tax benefit associated with our postretirement benefit plan, described below at "Other Plans." | | | | | | | | | | | | | | | | | |
| | Year Ended October 31, |
| | 2021 | | 2020 | | 2019 |
| Net (gain) loss arising during the period | $ | (5,112) | | | $ | 2,141 | | | $ | 6,697 | |
| Less: Amortization of net loss | 143 | | | 162 | | | 125 | |
| Less: Curtailments | — | | | 1,141 | | | — | |
| Less: Settlements | 222 | | | 462 | | | — | |
| Total recognized in other comprehensive (income) loss | $ | (5,477) | | | $ | 376 | | | $ | 6,572 | |
Measurement Date and Assumptions
We generally determine our actuarial assumptions on an annual basis, with a measurement date of October 31. The following table presents our assumptions for pension benefit calculations for the years ended October 31, 2018, 20172021, 2020 and 2016:2019:
| | | | For the Year Ended October 31, | | For the Year Ended October 31, |
| | 2018 | | 2017 | | 2016 | | 2018 | | 2017 | | 2016 | | 2021 | | 2020 | | 2019 | | 2021 | | 2020 | | 2019 |
| Weighted Average Assumptions: | Benefit Obligation | | Net Periodic Benefit Cost | Weighted Average Assumptions: | Benefit Obligation | | Net Periodic Benefit Cost |
| Discount rate | 4.44% | | 3.68% | | 3.41% | | 4.44% | | 3.66% | | 3.92% | Discount rate | 2.77% | | 3.22% | | 3.10% | | 2.60% | | 3.10% | | 4.44% |
| Rate of compensation increase | 3.00% | | 3.00% | | 3.00% | | 3.00% | | 3.00% | | 3.00% | Rate of compensation increase | —% | | —% | | 3.00% | | —% | | —% | | 3.00% |
| Expected return on plan assets | n/a | | n/a | | n/a | | 6.50% | | 6.50% | | 6.50% | Expected return on plan assets | n/a | | n/a | | n/a | | 6.00% | | 6.50% | | 6.50% |
The discount rate was used to calculate the present value of the projected benefit obligation for pension benefits. The rate reflects the amount at which benefits could be effectively settled on the measurement date. We used a RATE: Link Model whereby target yields are developed from bonds across a range of maturity points, and a curve is fitted to those targets. Spot rates (zero coupon bond yields) are developed from the curve and used to discount benefit payments associated with each future year. This model assumes spot rates will remain level beyond the 30-year point. We determine the present value of plan benefits by applying the discount rates to projected benefit cash flows.
The expected return on plan assets was used to determine net periodic pension expense. The rate of return assumptions were based on projected long-term market returns for the various asset classes in which the plans were invested, weighted by the target asset allocations. We review the return assumption at least annually. The rate of compensation increase represents the long-term assumption for expected increases in salaries.
QUANEX BUILDING PRODUCTS CORPORATION
NOTES TO CONSOLIDATED FINANCIAL STATEMENTS (continued)
Plan Assets
The following tables provide our target allocation for the year ended October 31, 2018,2021, as well as the actual asset allocation by asset category and fair value measurements as of October 31, 20182021 and 2017:2020:
| | | | | | | | | | | | | | | | | |
| Target Allocation | | Actual Allocation |
| | October 31, 2021 | | October 31, 2021 | | October 31, 2020 |
| Equity securities | 60.0 | % | | 51.0 | % | | 60.0 | % |
| Fixed income | 40.0 | % | | 49.0 | % | | 40.0 | % |
| | | | | | | | | | | |
| Fair Value Measurements at |
| | October 31, 2021 | | October 31, 2020 |
| | (In thousands) |
| Money market fund | $ | 300 | | | $ | 3,532 | |
| | | |
| Large capitalization | 8,231 | | | 7,954 | |
| Small capitalization | 1,493 | | | 2,407 | |
| International equity | 6,992 | | | 6,130 | |
| Other | 2,236 | | | 1,853 | |
| Equity securities | $ | 18,952 | | | $ | 18,344 | |
| | | |
| High-quality core bond | 13,787 | | | 9,743 | |
| High-quality government bond | 2,301 | | | 1,249 | |
| High-yield bond | 2,302 | | | 1,252 | |
| Fixed income | $ | 18,390 | | | $ | 12,244 | |
Total securities(1) | $ | 37,642 | | | $ | 34,120 | |
|
| | | | | | | | |
| | Target Allocation | | Actual Allocation |
| | October 31, 2018 | | October 31, 2018 | | October 31, 2017 |
| Equity securities | 60.0 | % | | 61.0 | % | | 60.0 | % |
| Fixed income | 40.0 | % | | 39.0 | % | | 40.0 | % |
|
| | | | | | | |
| | Fair Value Measurements at |
| | October 31, 2018 | | October 31, 2017 |
| | (In thousands) |
| Money market fund | $ | 597 |
| | $ | 204 |
|
| | | | |
| Large capitalization | $ | 8,362 |
| | $ | 10,972 |
|
| Small capitalization | 2,559 |
| | 4,102 |
|
| International equity | 6,385 |
| | 3,756 |
|
| Other | 1,913 |
| | 1,695 |
|
| Equity securities | $ | 19,219 |
| | $ | 20,525 |
|
| | | | |
| High-quality core bond | $ | 9,736 |
| | $ | 6,801 |
|
| High-quality government bond | 1,251 |
| | 3,407 |
|
| High-yield bond | 1,261 |
| | 3,403 |
|
| Fixed income | $ | 12,248 |
| | $ | 13,611 |
|
Total securities(1) | $ | 32,064 |
| | $ | 34,340 |
|
| |
(1)
| Quoted prices in active markets for identical assets (Level 1). |
Inputs and valuation techniques used to measure the fair value of plan assets vary according to the type of security being valued. All of the equity and debt securities held directly by the plans were actively traded and fair values were determined based on quoted market prices.
Our investment objective for defined benefit plan assets is to meet the plans’ benefit obligations, while minimizing the potential for future required plan contributions. The investment strategies focus on asset class diversification, liquidity to meet benefit payments and an appropriate balance of long-term investment return and risk. Target ranges for asset allocations are determined by matching the actuarial projections of the plans’ future liabilities and benefit payments with expected long-term rates of return on the assets, taking into account investment return volatility and correlations across asset classes. Plan assets are diversified across several investment managers and are generally invested in liquid funds that are selected to track broad market equity and bond indices. Investment risk is carefully controlled with plan assets rebalanced to target allocations on a periodic basis and monitoring of performance of investment managers relative to the investment guidelines established with each investment manager.
Expected Benefit Payments and Funding
Our pension funding policy is to make the minimum annual contributions required pursuant to the plan. We accelerated contributions to target a 100% funding threshold. Additionally, we consider funding annual requirements early in the fiscal year to potentially maximize the return on assets. For the fiscal years ended October 31, 2018, 20172021, 2020 and 2016,2019, we made total pension contributionscontributions of $0.8$0.5 million $3.6, $3.7 million and $3.7$0.7 million, respectively.
During fiscal 2019,2022, we do not expect to contribute approximately $0.8 millionneed to make a contribution to the pension plan to reachmaintain targeted funding levels and meet minimum contribution requirements. This expected contribution level will be dependent on many variables, including the market value of the assets compared to the obligation, as well as other market or regulatory conditions. In addition, we consider the cash requirements of our business investment opportunities. Accordingly, actual funding amounts and the timing of such funding may differ from current estimates.
QUANEX BUILDING PRODUCTS CORPORATION
NOTES TO CONSOLIDATED FINANCIAL STATEMENTS (continued)
The following table presents the total benefit payments expected to be paid to participants by year, which includes payments funded from our assets, as well as payments paid from the plan for the year ended October 31, (in thousands):
| | | | | |
| | Pension Benefits |
| 2022 | $ | 2,899 | |
| 2023 | 2,506 | |
| 2024 | 2,411 | |
| 2025 | 2,427 | |
| 2026 | 2,363 | |
| 2027 - 2031 | 10,430 | |
| Total | $ | 23,036 | |
|
| | | |
| | Pension Benefits |
| 2019 | $ | 2,488 |
|
| 2020 | 2,516 |
|
| 2021 | 2,724 |
|
| 2022 | 2,898 |
|
| 2023 | 3,031 |
|
| 2024 - 2028 | 16,304 |
|
| Total | $ | 29,961 |
|
Defined Contribution Plan
We also sponsor a2 defined contribution planplans into which we and our employees make contributions. We merged a predecessor plan sponsored by Woodcraft into our defined contribution plan effectiveAs of January 1, 2017. We2020, we match 50%100% up to the first 5% of employee annual salary deferrals under our existing plan. Beginningplan for all employees excluding NA Cabinet Components participants, who receive a 100% match up to 4% of employee annual salary deferrals. Between January 1, 2018 the plan was amended to provide the same match to Woodcraft employees. Prior toand January 1, 2018,2020, we matched 35%50% up to the first 5% of employee deferrals for employees who participated in the predecessor Woodcraft plan.salary deferrals. We do not offer our common stock as a direct investment option under these plans. For the years ended October 31, 2018, 20172021, 2020 and 2016,2019, we contributed approximately $2.6$6.3 million $2.4, $4.8 million and $2.2$2.7 million for these plans, respectively.
Other Plans
Under our postretirement benefit plan, we provide certain healthcare and life insurance benefits for a small number of eligible retired employees who were employed prior to January 1, 1993. Certain employees may become eligible for those benefits if they reach normal retirement age while working for us. We continue to fund benefit costs on a pay-as-you-go basis. The table below indicates the amount of these liabilities included in the accompanying consolidated balance sheets:
|
| | | | | | | |
| | October 31, 2018 | | October 31, 2017 |
| | (In thousands) |
| Accrued liabilities | $ | 49 |
| | $ | 49 |
|
| Deferred pension and postretirement benefits | 323 |
| | 450 |
|
| Total | $ | 372 |
| | $ | 499 |
|
We also have supplemental benefit plans covering certain executive officers and a non-qualified deferred compensation plan covering members of the Board of Directors and certain key employees. Our liability under the supplemental benefit plan was approximately $3.4$2.9 million and $2.6 million as of October 31, 20182021 and 2017,2020, and our liability under the deferred compensation plan was approximately $3.5$3.4 million and $4.0$3.3 million, respectively. As of October 31, 20182021 and 2017,2020, the current portion of these liabilities was recorded under the caption "Accrued“Accrued Liabilities,"” and the long-term portion was included under the caption "Other Liabilities"“Other Liabilities” in the accompanying balance sheets.
10. Warranty Obligations
We accrue warranty obligations as we recognize revenue associated with certain products. We make provisions for our warranty obligations based upon historical experience of costs incurred for such obligations adjusted, as necessary, for current conditions and factors. There are significant uncertainties and judgments involved in estimating our warranty obligations, including changing product designs, differences in customer installation processes and future claims experience which may vary from historical claims experience. Therefore, the ultimate amount we incur as warranty costs in the near and long-term may not be consistent with our current estimate.
QUANEX BUILDING PRODUCTS CORPORATION
NOTES TO CONSOLIDATED FINANCIAL STATEMENTS (continued)
A reconciliation of the activity related to our accrued warranty, including both the current and long-term portions (reported in accrued liabilities and other liabilities, respectively, on the accompanying consolidated balance sheets) follows:
|
| | | | | | | |
| | Year Ended October 31, |
| | 2018 | | 2017 |
| | (In thousands) |
| Beginning balance as of November 1, 2017, and 2016, respectively | $ | 323 |
| | $ | 446 |
|
| Provision for warranty expense | 4 |
| | 41 |
|
| Change in accrual for preexisting warranties | (16 | ) | | (121 | ) |
| Warranty costs paid | (16 | ) | | (43 | ) |
| Total accrued warranty | $ | 295 |
| | $ | 323 |
|
| Less: Current portion of accrued warranty | 148 |
| | 168 |
|
| Long-term portion at October 31, | $ | 147 |
| | $ | 155 |
|
11. Income Taxes
The provision or benefit for income taxes includes U.S. federal income taxes (determined on a consolidated return basis), foreign income taxes and state income taxes. We provide for income taxes on taxable income at the applicable statutory rates applicable.rates. The following table summarizes the components of income tax (benefit) expense from continuing operations for the years ended October 31, 2018, 20172021, 2020 and 2016:2019 (in thousands):
| | | | | | | | | | | | | | | | | |
| | Year Ended October 31, |
| 2021 | | 2020 | | 2019 |
| Current | | | | | |
| Federal | $ | 10,993 | | | $ | 6,043 | | | $ | 3,338 | |
| State and local | 3,447 | | | 1,505 | | | 299 | |
| Non-United States | 6,889 | | | 4,445 | | | 3,879 | |
| Total current | 21,329 | | | 11,993 | | | 7,516 | |
| Deferred | | | | | |
| Federal | (842) | | | (64) | | | 1,497 | |
| State and local | (277) | | | (315) | | | 1,087 | |
| Non-United States | 2,904 | | | 190 | | | 676 | |
| Total deferred | 1,785 | | | (189) | | | 3,260 | |
| Total income tax expense | $ | 23,114 | | | $ | 11,804 | | | $ | 10,776 | |
QUANEX BUILDING PRODUCTS CORPORATION
NOTES TO CONSOLIDATED FINANCIAL STATEMENTS (continued)
|
| | | | | | | | | | | |
| | Year Ended October 31, |
| | 2018 | | 2017 | | 2016 |
| | (In thousands) |
| Current | | | | | |
| Federal | $ | 983 |
| | $ | 1,991 |
| | $ | 1,309 |
|
| State and local | 417 |
| | 873 |
| | 154 |
|
| Non-United States | 3,356 |
| | 4,067 |
| | 3,241 |
|
| Total current | 4,756 |
| | 6,931 |
| | 4,704 |
|
| Deferred | | | | | |
| Federal | (5,903 | ) | | 1,860 |
| | (5,932 | ) |
| State and local | 670 |
| | (450 | ) | | (712 | ) |
| Non-United States | (398 | ) | | (1,522 | ) | | (1,825 | ) |
| Total deferred | (5,631 | ) | | (112 | ) | | (8,469 | ) |
| Total income tax (benefit) expense | $ | (875 | ) | | $ | 6,819 |
| | $ | (3,765 | ) |
| | | | | | | | | | | | | | | | | |
| | Year Ended October 31, |
| 2021 | | 2020 | | 2019 |
| Domestic | $ | 36,879 | | | $ | 26,229 | | | $ | (58,247) | |
| Foreign | 43,215 | | | 24,071 | | | 22,293 | |
| Total income (loss) before income taxes | $ | 80,094 | | | $ | 50,300 | | | $ | (35,954) | |
The following table reconciles our effective income tax rate to the federal statutory rate for the years ended October 31, 2018, 20172021, 2020 and 2016:2019:
QUANEX BUILDING PRODUCTS CORPORATION
NOTES TO CONSOLIDATED FINANCIAL STATEMENTS (continued)
|
| | | | | | | | |
| | Year Ended October 31, |
| | 2018 | | 2017 | | 2016 |
| United States tax at statutory rate | 23.3 | % | | 35.0 | % | | 35.0 | % |
| State and local income tax | 3.4 |
| | 1.7 |
| | 7.4 |
|
| Non-United States income tax | (1.6 | ) | | (9.1 | ) | | 32.0 |
|
| Deferred rate impact | — |
| | (4.1 | ) | | 15.2 |
|
| General business credits | (0.4 | ) | | (0.5 | ) | | 6.4 |
|
| Transaction costs | — |
| | — |
| | (17.0 | ) |
| Change in valuation allowance | (0.1 | ) | | (0.6 | ) | | (0.9 | ) |
| Other permanent differences | (0.3 | ) | | 3.3 |
| | (5.8 | ) |
| Deferred rate impact of enactment of tax reform | (30.5 | ) | | — |
| | — |
|
| Tax impact of stock based compensation | (0.5 | ) | | — |
| | — |
|
| Impact of deemed repatriation | 4.8 |
| | — |
| | — |
|
| Return to actual adjustments | (1.5 | ) | | 1.0 |
| | (5.4 | ) |
| Effective tax rate | (3.4 | )% | | 26.7 | % | | 66.9 | % |
| | | | | | | | | | | | | | | | | |
| Year Ended October 31, |
| 2021 | | 2020 | | 2019 |
| United States tax at statutory rate | 21.0 | % | | 21.0 | % | | 21.0 | % |
| State and local income tax | 3.1 | % | | 1.7 | % | | 1.6 | % |
| Non-United States income tax | 2.3 | % | | 1.2 | % | | 1.2 | % |
| U.K. patent box benefit | (1.4) | % | | (2.0) | % | | (1.7) | % |
| U.S. income tax credits | (4.2) | % | | (2.3) | % | | (4.7) | % |
| | | | | |
| | | | | |
| | | | | |
| Foreign tax positions under the Act (GILTI and FDII) | 4.2 | % | | 2.5 | % | | 3.3 | % |
| | | | | |
| Impact of deemed repatriation | — | % | | — | % | | (1.1) | % |
| Asset impairment charges | — | % | | — | % | | (50.7) | % |
| Non-cash compensation | 1.9 | % | | (0.3) | % | | (1.6) | % |
| Other | 2.0 | % | | 1.7 | % | | 2.7 | % |
| Effective tax rate | 28.9 | % | | 23.5 | % | | (30.0) | % |
On December 22, 2017, the Tax Cuts and Jobs Act (the Act) was signed into law. TheThis Act reduced our federal income tax statutory rate from 35.0% to 23.3%21.0% for the fiscal yearyears ending October 31, 2018. Discrete items contributing2021, 2020 and 2019. This Act also imposed additional tax law changes that became effective during fiscal 2019, which include new requirements for a global intangible low-taxed income provision (GILTI) and a deduction for foreign-derived intangible income (FDII). We elected to account for the tax on GILTI as a period cost therefore we have not recorded deferred taxes related to GILTI on our foreign subsidiaries.
The October 31, 2021 effective tax rate is higher than the U.S. federal statutory rate of 21% primarily due to state income taxes, GILTI, and non-United States income tax, benefit included $7.7 million for the re-measurement of our deferred incomepartially offset by U.S. foreign tax assets and liabilities due to the decrease in the federal corporate incomecredits.
The October 31, 2020 effective tax rate a benefit of $0.2 million forwas impacted by the true uptrue-up of our accruals and related deferred taxes from prior year filings and settled tax audits and a benefit of $0.2as well as $0.6 million related to the vesting or exercise of equity-based compensation awards, partially offsetawards.
The October 31, 2019 effective rate was primarily impacted by a tax expensenet charge of $1.2 million related to GILTI and FDII, as well as discrete charge of $0.4 million for the adjustment of the one-time mandatory transition tax on deemed repatriation of previously tax-deferred and unremitted foreign earnings.
The United States statutory rateearnings and $0.6 million related to the vesting or exercise of 23.3% reflectsequity-based compensation awards. Additionally, during the period November 1, 2017 to December 31, 2017 at the previous 35.0% rate and the period January 1, 2018 toyear ended October 31, 2018 at2019, we recorded a $74.6 million asset impairment charge, which was primarily non-deductible, in the new 21.0% rate.NA Cabinet Components segment, as further explained in Note 6, “Goodwill and Intangible Assets.”
Given the significance of the Tax Cuts and Jobs Act, the SEC staff issued Staff Accounting Bulletin No. 118 (SAB 118), which allows registrants to record provisional amounts during a one year “measurement period”. During the measurement period, impacts of the Act are expected to be recorded at the time a reasonable estimate for all or a portion of the effects can be made, and provisional amounts can be recognized and adjusted as information becomes available, prepared or analyzed. In accordance with SAB 118, a company must reflect the income tax effects of those aspects of the Act for which the accounting under ASC 740 is complete. To the extent that a company’s accounting for certain income tax effects of the Tax Act is incomplete but it is able to determine a reasonable estimate, it must record a provisional estimate in the financial statements. If a company cannot determine a provisional estimate to be included in the financial statements, it should continue to apply ASC 740 on the basis of the provisions of the tax laws that were in effect immediately before the enactment of the Act.
period.” As of October 31, 2018,2019, we have not completed the accounting for the tax effects of the Act. However, we have made an initial assessment of the Act and recorded a discrete net benefit of $6.5 million. We believe that our assessment of the re-measurement of our deferred income tax assets and liabilities to be complete, while we consider our tax expense related to the one-time mandatory transition tax on deemed repatriation of previously tax-deferred and unremitted foreign earnings and our tax benefit of stock based compensation to be provisional. At this time, our estimate does not reflect changes in current interpretations of compensation deduction limitations, effects of any state tax law changes and uncertainties regarding interpretations that may arise as a result of federal tax reform. Any additional impact of the enactment of the Act will be recorded as they are identified during the one-year measurement period provided for in SAB 118.
In light of the Tax Cuts and Jobs Act, we repatriated $2.8$28.4 million and $31.9 million of excess cashforeign earnings from our insulating glass spacer division in the United Kingdominternational operations during the twelve monthsyears ended October 31, 2018.2021 and 2020, respectively. This was repatriation of excess cash that was a portion of the one-time mandatory transition tax discussed above. Management has determined that the earnings of our foreign subsidiaries are not required as a source of funding for United States operations and we intend to indefinitely reinvest the funds at October 31, 2018 in our foreign jurisdictions. We will continue to evaluate our foreign cash position and may repatriate additional foreign earnings in the future. WithOur earnings from our foreign subsidiaries are not subject to significant withholding taxes upon remittances to the exception of the one-time mandatory transition tax on deemed repatriation of previously tax-deferred and unremitted foreign earnings,U.S.. As a result, we do not anticipate any materialsignificant future tax impactimpacts from any potential repatriation of previously unremitted foreign earnings.
QUANEX BUILDING PRODUCTS CORPORATION
NOTES TO CONSOLIDATED FINANCIAL STATEMENTS (continued)
earnings. If the investment in our foreign subsidiaries were completely realized, we could incur an estimated residual United States tax liability of $0.1 million.
The decrease in the 2017 effective tax rate is due primarily to a greater proportion of United States taxable income in relation to foreign taxable income for the year. The United States tax rate is generally higher than the foreign tax rate. The effective rate is also lower due to a change over a period of three years in the deferred tax rate, primarily in the United Kingdom, from 19% to 17%. The foreign tax rate differential and the mix of earnings by jurisdiction also impacted the rate in 2016. The increase in the 2016 effective tax rate benefit was due primarily to a greater proportion of foreign taxable income in relation to United States taxable income for the year. The overall change in the 2016 effective rate was also impacted by transaction costs and a change in the deferred rate in the United Kingdom from 20% to 19%.
Significant components of our net deferred tax liabilities and assets were as follows: |
| | | | | | | |
| | October 31, |
| | 2018 | | 2017 |
| | (In thousands) |
| Deferred tax assets: | | | |
| Employee benefit obligations | $ | 9,910 |
| | $ | 12,731 |
|
| Accrued liabilities and reserves | 1,609 |
| | 2,409 |
|
| Pension and other benefit obligations | 1,872 |
| | 2,968 |
|
| Inventory | 843 |
| | 1,614 |
|
| Loss and tax credit carry forwards | 3,716 |
| | 8,098 |
|
| Other | 119 |
| | 194 |
|
| Total gross deferred tax assets | 18,069 |
| | 28,014 |
|
| Less: Valuation allowance | 1,275 |
| | 1,304 |
|
| Total deferred tax assets, net of valuation allowance | 16,794 |
| | 26,710 |
|
| Deferred tax liabilities: | | | |
| Property, plant and equipment | 10,577 |
| | 16,128 |
|
| Goodwill and intangibles | 23,432 |
| | 32,542 |
|
| Total deferred tax liabilities | 34,009 |
| | 48,670 |
|
| | | | |
| Net deferred tax liabilities | $ | 17,215 |
| | $ | 21,960 |
|
| | | | | | | | | | | |
| | October 31, |
| 2021 | | 2020 |
| Deferred tax assets: | | | |
| Employee benefit obligations | $ | 7,591 | | | $ | 6,634 | |
| Accrued liabilities and reserves | 1,425 | | | 1,471 | |
| Pension and other benefit obligations | 1,934 | | | 3,303 | |
| Inventory | 894 | | | 471 | |
| Loss and tax credit carry forwards | 1,857 | | | 2,331 | |
| Other | 107 | | | 103 | |
| Total gross deferred tax assets | 13,808 | | | 14,313 | |
| Less: Valuation allowance | 1,174 | | | 1,493 | |
| Total deferred tax assets, net of valuation allowance | 12,634 | | | 12,820 | |
| Deferred tax liabilities: | | | |
| Property, plant and equipment | 11,187 | | | 10,465 | |
| Goodwill and intangibles | 23,412 | | | 21,471 | |
| Total deferred tax liabilities | 34,599 | | | 31,936 | |
| Net deferred tax liabilities | $ | 21,965 | | | $ | 19,116 | |
| | | |
| | | |
| | | |
| | | |
At October 31, 2018,2021, state operating loss carry forwards totaled $41.8$28.0 million. The majority of these losses begin to expire in 2025. Tax credits available to offset future tax liabilities totaled $4.1 million and are expected to be utilized within the next twelve months. We evaluate tax benefits of operating losses and tax credit carry forwards on an ongoing basis, including a review of historical and projected future operating results, the eligible carry forward period and other circumstances. We have recorded a valuation allowance for certain state net operating losses as of October 31, 20182021 and 2017,2020, totaling $1.3 million and $1.5 million, respectively ($0.61.0 million and $1.2 million, respectively, net of federal taxes) for. During the respective periods. In assessingyear ended October 31, 2021, we recorded a net $0.2 million decrease in our state valuation allowances. The valuation allowances can be affected in future periods by changes to tax laws, changes to statutory tax rates, and changes in estimates of future taxable income. To fully realize these net deferred tax assets, we will need to generate sufficient future taxable income in the need for a valuation allowance, we considercountries where these tax attributes exist during the periods in which the attributes can be utilized. As of each reporting date, management considers the weight of all evidence, both positive and negative, evidence related to the likelihood of realization of thedetermine if a valuation allowance is necessary for each jurisdiction’s net deferred tax assets. We place greater weight on historical evidence over future predictions of our ability to utilize net deferred tax assets. We consider future reversals of existing taxable temporary differences, future taxable income exclusive of reversing temporary differences, and taxable income in prior carryback year(s) if carryback is permitted under applicable law.
QUANEX BUILDING PRODUCTS CORPORATION
NOTES TO CONSOLIDATED FINANCIAL STATEMENTS (continued)
The following table reconcilesshows the change in the unrecognized income tax benefit associated with uncertain tax positions for the years ended October 31, 2018, 20172021, 2020 and 20162019 (in thousands):
| | | | | |
| Unrecognized
Income Tax Benefits |
| |
| |
| |
| |
| Balance at October 31, 2018 | $ | 606 | |
| Additions for tax positions related to the current year | — | |
| Additions for tax positions related to the prior year | 16 | |
| Reassessment of position | (66) | |
| Balance at October 31, 2019 | $ | 556 | |
| Additions for tax positions related to the current year | — | |
| Additions for tax positions related to the prior year | 15 | |
| Reassessment of position | (49) | |
| Balance at October 31, 2020 | $ | 522 | |
| Additions for tax positions related to the current year | — | |
| Additions for tax positions related to the prior year | 953 | |
| Reassessment of position | (87) | |
| Balance at October 31, 2021 | $ | 1,388 | |
|
| | | | |
| | | Unrecognized Income Tax Benefits |
| Balance at October 31, 2015 | | $ | 564 |
|
| Additions for tax positions related to the current year | | — |
|
| Additions for tax positions related to the prior year | | 15 |
|
| Balance at October 31, 2016 | | $ | 579 |
|
| Additions for tax positions related to the current year | | — |
|
| Additions for tax positions related to the prior year | | 12 |
|
| Balance at October 31, 2017 | | $ | 591 |
|
| Additions for tax positions related to the current year | | — |
|
| Additions for tax positions related to the prior year | | 15 |
|
| Balance at October 31, 2018 | | $ | 606 |
|
As of October 31, 2018,2021, our unrecognized tax benefit (UTB) relates to certain federal and state tax items regarding the interpretation of tax laws and regulations. In January 2015, we reassessed our unrecognized tax benefit related to the 2008 spin-off of Quanex from a predecessor company and recognized the full benefit of the tax positions taken. This reduced the liability for uncertain tax positions by $4.1 million and increased deferred income taxes (non-current assets) by $6.8 million and resulted in a non-cash increase in retained earnings of $10.1 million, with an increase in income tax benefit of $0.8 million. At October 31, 2018, $0.62021, $1.4 million is recorded as a liability for uncertain tax positions. The disallowanceaddition related to the current year ended October 31, 2021 is associated with stock-based compensation tax deductions claimed on a prior U.S. federal income tax return. We have accrued an immaterial amount for the payment of interest, net of tax benefits, and penalties as of October 31, 2021, 2020 and 2019, respectively. We include all interest and penalties related to uncertain tax benefits within our income tax provision account. To the extent interest and penalties are not assessed with respect to uncertain tax positions or the uncertainty of deductions in the future, amounts accrued will be reduced and reflected as a reduction of the UTB would not materially affect the annual effectiveoverall income tax rate.provision.
We, along with our subsidiaries, file income tax returns in the United StatesU.S. and various state jurisdictions as well as in the United Kingdom,U.K., Germany and Canada. In certain jurisdictions, the statute of limitations has not yet expired. We generally remain subject to examination of our United StatesU.S. income tax returns for 20152017 and subsequent years. We generally remain subject to examination of our various state and foreign income tax returns for a period of four to five years from the date the return was filed. The state impact of any federal changes remains subject to examination by various states for a period of up to one year after formal notification to the state of the federal change.
Judgment is required in assessing the future tax consequences of events that have been recognized in our financial statements or tax returns. The final outcome of the future tax consequences of legal proceedings, if any, as well as the outcome of competent authority proceedings, changes in regulatory tax laws, or interpretation of those tax laws could impact our financial statements. We are subject to the effect of these matters occurring in various jurisdictions. We do not believe any of the UTB at October 31, 20182021 will be recognized within the next twelve months.
QUANEX BUILDING PRODUCTS CORPORATION 12.NOTES TO CONSOLIDATED FINANCIAL STATEMENTS (continued)
11. Commitments and Contingencies
Operating Leases and Purchase Obligations
We have operating leases for certain real estate and equipment used in our business. Rental expense for the years ended October 31, 2018, 2017 and 2016 was $9.5 million, $10.5 million and $10.3 million, respectively.
We are a party to non-cancelable purchase obligations primarily for door hardware, primary and secondary steel and primary and secondarysecondary aluminum used in our manufacturing processes, as well as expenditures related to capital projects in progress. We paid $5.2$9.9 million and $4.5$9.0 million pursuant to these arrangements for the years ended October 31, 20182021 and 2017,2020, respectively. These obligations total $16.7$23.4 million and $11.9 $22.4 million at October 31, 20182021 and 2017,2020, respectively, and extend through fiscal 2018. Futurefiscal 2022. Future amounts paid pursuant to these arrangements will depend, to some extent, on our usage.
QUANEX BUILDING PRODUCTS CORPORATION
NOTES TO CONSOLIDATED FINANCIAL STATEMENTS (continued)
The following table presents future minimum rental payments under operating leases with remaining terms in excess of one year at October 31, 2018 (in thousands):
|
| | | |
| | Operating Leases |
| 2019 | $ | 8,407 |
|
| 2020 | 6,776 |
|
| 2021 | 5,376 |
|
| 2022 | 4,528 |
|
| 2023 | 4,290 |
|
| Thereafter | 20,274 |
|
| Total | $ | 49,651 |
|
Asset Retirement Obligation
We maintain an asset retirement obligation associated with a leased facility in Kent, Washington. We have estimated our future cash flows associated with this asset retirement obligation and recorded an asset and corresponding liability. We are depreciating the asset and accreting the liability over a seven year term, to culminate in an asset retirement obligation of $2.2$2.3 million as of February 2020.2025.
Remediation and Environmental Compliance Costs
Under applicable state and federal laws, we may be responsible for, among other things, all or part of the costs required to remove or remediate wastes or hazardous substances at locations we, or our predecessors, have owned or operated. From time to time, we also have been alleged to be liable for all or part of the costs incurred to clean up third-party sites where there might have been an alleged improper disposal of hazardous substances. At present, we are not involved in any such matters.
From time to time, we incur routine expenses and capital expenditures associated with compliance with existing environmental regulations, including control of air emissions and water discharges, and plant decommissioning costs. We have not incurred any material expenses or capital expenditures related to environmental matters during the past three fiscal years, and do not expect to incur a material amount of such costs in fiscal 2019. Whilefiscal 2022. While we will continue to have future expenditures related to environmental matters, any such amounts are impossible to reasonably estimate at this time. Based upon our experience to date, we do not believe that our compliance with environmental requirements will have a material adverse effect on our operations, financial condition or cash flows.
Litigation
From time to time, we, along with our subsidiaries, are involved in various litigation matters arising in the ordinary course of our business, including those arising from or related to contractual matters, commercial disputes, intellectual property, personal injury, environmental matters, product performance or warranties, product liability, insurance coverage and personnel and employment disputes.
We regularly review with legal counsel the status of all ongoing proceedings, and we maintain insurance against these risks to the extent deemed prudent by our management and to the extent such insurance is available. However, there is no assurance that we will prevail in these matters or that our insurers will accept full coverage of these matters, and we could, in the future, incur judgments, enter into settlements of claims, or revise our expectations regarding the outcome or insurability of matters we face, which could materially impact our results of operations.
We have been and are currently party to multiple claims, some of which are in litigation, relating to alleged defects in a commercial sealant product that was manufactured and sold during the 2000's. During the years ended October 31, 2018 and 2017, our insurance carrier reimbursed fees and expenses originally incurred as part of our defense of these various commercial sealant claims totaling $0.5 million and $4.0 million, respectively. While we believe that our product was not defective and that we would prevail in these commercial sealant product claims if taken to trial, the timing, ultimate resolution and potential impact of these claims is not currently determinable. Nevertheless, after taking into account all currently available information, including our defenses, the advice of our counsel, and the extent and currently-expected availability of our existing insurance coverage, we believe that the eventual outcome of these commercial sealant claims will not have a material adverse effect on our overall financial condition, results of operations or cash flows, and we have not recorded any accrual with regard to these claims.
QUANEX BUILDING PRODUCTS CORPORATION
NOTES TO CONSOLIDATED FINANCIAL STATEMENTS (continued)
13. Derivative Instruments
Our derivative activities are subject to the management, direction, and control of the Chief Financial Officer and Chief Executive Officer. Certain transactions in excess of specified levels require further approval from the Board of Directors.
The nature of our business activities requires the management of various financial and market risks, including those related to changes in foreign currency exchange rates and aluminum scrap prices. We have historically used foreign currency forwards and options to mitigate or eliminate certain of those risks at our subsidiaries. We use foreign currency contracts to offset fluctuations in the value of accounts receivable and payable balances that are denominated in currencies other than the United States Dollar, including the Euro, British Pound Sterling and Canadian Dollar. Currently, we do not enter into derivative transactions for speculative or trading purposes. We are exposed to credit loss in the event of nonperformance by the counterparties to our derivative transactions. We attempt to mitigate this risk by monitoring the creditworthiness of our counterparties and limiting our exposure to individual counterparties. In addition, we have established master netting agreements in certain cases to facilitate the settlement of gains and losses on specific derivative contracts.
We have not designated any of our derivative contracts as hedges for accounting purposes in accordance with the provisions under the Accounting Standards Codification topic 815 "Derivatives and Hedging" (ASC 815). Therefore, changes in the fair value of these contracts and the realized gains and losses are recorded in the consolidated statements of income (loss) for the years ended October 31, 2018, 2017 and 2016 were as follows (in thousands):
|
| | | | | | | | | | | | |
| | | Year Ended October 31, |
| Derivatives Not Designated as Hedging Instruments | Location of (Loss) or Gain: | 2018 | | 2017 | | 2016 |
| Foreign currency derivatives | Other, net | $ | (11 | ) | | $ | (88 | ) | | $ | 77 |
|
We have chosen not to offset any of our derivative instruments in accordance with the provisions of ASC 815. Therefore, the assets and liabilities are presented on a gross basis on our accompanying consolidated balance sheets. Less than $0.1 million of fair value related to foreign currency derivatives was included in prepaid and other current assets as of the years ended October 31, 2018 and 2017, and less than $0.1 million of fair value related to foreign currency derivatives was included in accrued liabilities as of October 31, 2017.
The following table summarizes the notional amounts and fair value of outstanding derivative contracts at October 31, 2018 and 2017 (in thousands):
|
| | | | | | | | | | | | | | |
| | | Notional as indicated | | Fair Value in $ |
| | | October 31,
2018 | | October 31,
2017 | | October 31,
2018 | | October 31,
2017 |
| Foreign currency derivatives: | | | | | | | | |
| Buy EUR, Sell USD | EUR | 455 |
| | 1,271 |
| | $ | 1 |
| | $ | 24 |
|
| Sell CAD, Buy USD | CAD | 229 |
| | 320 |
| | — |
| | 1 |
|
| Sell GBP, Buy USD | GBP | 22 |
| | 75 |
| | — |
| | — |
|
| Buy EUR, Sell GBP | EUR | 34 |
| | 30 |
| | — |
| | (1 | ) |
| Buy USD, Sell EUR | USD | 12 |
| | — |
| | — |
| | — |
|
For the classification in the fair value hierarchy, see Note 14, "Fair Value Measurement of Assets and Liabilities", included herewith.
14.12. Fair Value MeasurementMeasurements of Assets and Liabilities
Fair value is defined as the price that would be received to sell an asset or paid to transfer a liability in an orderly transaction between market participants at the measurement date. The fair value hierarchy distinguishes between (1) market participant assumptions developed based on market data obtained from independent sources (observable inputs) and (2) an entity's own assumptions about market participant assumptions developed based on the best information available in the circumstances (unobservable inputs). The fair value hierarchy consists of three broad levels, which gives the highest priority to Level 1 and the lowest priority to Level 3. The three levels of the fair value hierarchy are described below:
•Level 1 - Unadjusted quoted prices in active markets that are accessible at the measurement date for identical, unrestricted assets or liabilities.
QUANEX BUILDING PRODUCTS CORPORATION
NOTES TO CONSOLIDATED FINANCIAL STATEMENTS (continued)
•Level 2 - Inputs other than quoted prices included within Level 1 that are observable for the asset or liability either directly or indirectly including quoted prices for similar assets or liabilities in active markets; quoted prices for identical or similar assets or liabilities in markets that are not active; inputs other than quoted prices that are observable for the asset or liability (e.g., interest rates) and inputs that are derived principally from or corroborated by observable market data byby correlation or other means.
•Level 3 - Inputs that are both significant to the fair value measurement and unobservable.
As of October 31, 2018 and 2017, foreign currency derivatives were the only instruments being measured on a recurring basis. Less than $0.1 million of foreign currency derivatives were included in total assets as of October 31, 2018 and less than $0.1 million of foreign currency derivatives were included in total assets and total liabilities as of October 31, 2017. All of our derivative contracts are valued using quoted market prices from brokers or exchanges and are classified within Level 2 of the fair value hierarchy.
As of October 31, 2018 and 2017, we had approximately $2.4 million of certain property, plant and equipment that was recorded at fair value on a non-recurring basis and classified as Level 3. The fair value was based on broker opinions.
Carrying amounts reported on the balance sheetsheets for cash, cash equivalents,equivalents, accounts receivable and accounts payable approximate fair value due to the short-term maturity of these instruments. Our outstanding debt is variable rate debt that re-prices frequently, thereby limiting our exposure to significant changes in interest rate risk. As a result, the fair value of our debt instruments approximates carrying value at October 31, 20182021 and 20172020 (Level 32 measurement).
Our restricted stock units and performance share awards are marked-to-market on a quarterly basis during a three-year vesting period based on market data (Level 2 measurement). For further information refer to Note 13. Stock-Based Compensation - Performance Share Awards. 15.
13. Stock-Based Compensation
We have established and maintain an Omnibus Incentive Plan (2008(2020 Plan) that provides for the granting of restricted stock awards, stock options, restricted stock units, performance share awards, performance restricted stock units, and other stock-based and cash-based awards. The 20082020 Plan is administered by the Compensation and Management Development Committee of the Board of Directors.
The aggregate number of shares of common stock authorized for grant under the 20082020 Plan is 7,650,0003,139,895 as approved by the shareholders. Any officer, key employee and/or non-employee director is eligible for awards under the 20082020 Plan. We grant restricted stock units to non-employee directors on the first business day of each fiscal year. Annually, pending approvalAs approved by the Compensation & Management Development Committee of our Board of Directors in December,annually, we grant a mix of stock options, restricted stock awards, performance shares and/or performance restricted stock units to officers, management and key employees. We also historically granted stock options to certain officers, directors and key employees. Occasionally, we may make additional grants to key employees at other times during the year.
Restricted Stock Awards
Restricted stock awards are granted to key employees and officers annually, and typically cliff vest over a three-year period with service and continued employment as the only vesting criteria. The recipient of thea restricted stock awardsaward is entitled to all of the rights of a shareholder, except that the awards are nontransferable during the vesting period. The fair value of the restricted stock award is established on the grant date and then expensed over the vesting period resulting in an increase in additional paid-in-capital. Shares are generally issued from treasury stock at the time of grant.
QUANEX BUILDING PRODUCTS CORPORATION
NOTES TO CONSOLIDATED FINANCIAL STATEMENTS (continued)
A summary of non-vested restricted stock awardsaward activity during the years ended October 31, 2018, 20172021, 2020 and 2016,2019, follows:
| | | | | | | | | | | |
| Restricted Stock Awards | | Weighted Average
Grant Date Fair Value per Share |
| Non-vested at October 31, 2018 | 217,200 | | | $ | 19.76 | |
| Granted | 124,800 | | | 13.78 | |
| Vested | (69,400) | | | 19.19 | |
| Forfeited | (42,500) | | | 17.87 | |
| Non-vested at October 31, 2019 | 230,100 | | | 17.02 | |
| Granted | 63,400 | | | 18.82 | |
| Vested | (55,000) | | | 19.45 | |
| Forfeited | (51,000) | | | 17.30 | |
| Non-vested at October 31, 2020 | 187,500 | | | 16.82 | |
| Granted | 73,300 | | | 20.68 | |
| Vested | (44,400) | | | 20.70 | |
| Forfeited | — | | | — | |
| Non-vested at October 31, 2021 | 216,400 | | | $ | 17.28 | |
|
| | | | | | |
| | Restricted Stock Awards | | Weighted Average Grant Date Fair Value per Share |
| Non-vested at October 31, 2015 | 293,000 |
| | $ | 18.71 |
|
| Granted | 85,500 |
| | 19.21 |
|
| Vested | (102,000 | ) | | 17.84 |
|
| Forfeited | (9,800 | ) | | 18.97 |
|
| Non-vested at October 31, 2016 | 266,700 |
| | 19.19 |
|
| Granted | 93,800 |
| | 19.46 |
|
| Vested | (73,100 | ) | | 17.67 |
|
| Forfeited | (3,100 | ) | | 19.65 |
|
| Non-vested at October 31, 2017 | 284,300 |
| | 19.66 |
|
| Granted | 73,400 |
| | 20.70 |
|
| Vested | (111,800 | ) | | 20.16 |
|
| Forfeited | (28,700 | ) | | 19.66 |
|
| Non-vested at October 31, 2018 | 217,200 |
| | $ | 19.76 |
|
The total weighted average grant-date fair value of restricted stock awards that vested during the years ended October 31, 2018, 20172021, 2020 and 2016 was $2.32019 was $0.9 million, $1.3$1.1 million and $1.8$1.3 million, respectively. As of October 31, 2018,2021, total unrecognized compensation cost related to unamortizedunamortized restricted stock awards totaled $1.6$1.5 million. We expect to recognize this expense over the remaining weighted average period of 1.71.8 years.
Stock Options
Historically, stock options have been awarded to key employees, officers and non-employee directors. Effective May 2015,In December 2017, the director compensation structure was revisedCompensation & Management Development Committee of the Board of Directors approved a change to eliminatethe long-term incentive award program eliminating the grant of stock options to non-employee directors. Additionally,and replacing this award with a grant of performance restricted stock units as further described below. As a result, stock options were not awardedgranted during the yearyears ended October 31, 2020, 2019, and 2018. Key employee and officer stockStock options typically vestvested ratably over a three-year period with service and continued employment as the vesting conditions. Our stock options may be exercised up to a maximum of ten years from the date of grant. The fair value of the stock options iswas determined on the grant date and expensed over the vesting period resulting in an increase in additional paid-in-capital.
We useused the Black-Scholes pricing model to estimate the grant date fair valuevalue. The inputs to this model included expected volatility, expected term, a risk-free rate and expected dividend rate at the time of ourgrant. For employees who were nearing retirement-eligibility, we recognized stock options. A descriptionoption expense ratably over the shorter of the methodology forvesting period or the valuation assumptions follows:
Expected Volatility – For stock options granted prior to July 1, 2013, we used an estimate of the historical volatility of a selected peer group. Effective July 1, 2013, we determined that we had sufficient historical data to calculate the volatility of our common stock since our spin-off in April 2008. We believe there has been uncertainty in the United States equities market over the past several years and that uncertainty has contributed to volatility in equities in general. We expect this volatility to continue over the foreseeable future. Therefore, we believe that our historical volatility is a proxy for expected volatility. We have not excluded any of our historical dataperiod from the volatility calculation, and we are not aware of any specific significant factors which might impact our future volatility.
Expected Term – For stock options granted prior to July 1, 2013, we determined the expected term using historical information of our former parent company priorgrant-date to the spin-off in 2008, with regards to option vesting, exercise behavior and contractual expiration, as we believed that this employee group was the most similar to our employee group. Separate groupsretirement-eligibility date.
Table of employees that have similar historical exercise behavior were considered separately. Effective July 1, 2013, we determined that we had sufficient historical data to estimate our expected term using our own data with regards to the exercise behavior, cancellations, retention patterns and remaining contractual terms. When analyzing these patterns and variables, we considered the stratification of the awards (large grants to relatively few employees versus smaller grants to many others), the age of certain employees with larger grants, the historical exercise behavior of the employee group, and fluctuations/volatility of our underlying common stock, as to whether the stock options are expected to be out-of-the-money. For our directors, stock options vested immediately, and, as such, the expected term approximated the contractual term, after adjusting for historical forfeitures. We believe our estimates are reasonable given these factors. ContentsQUANEX BUILDING PRODUCTS CORPORATION
NOTES TO CONSOLIDATED FINANCIAL STATEMENTS (continued)
Risk-Free Rate – We base the risk-free rate on the yield at the date of grant of a zero-coupon United States Treasury bond whose maturity period equals the option’s expected term.
Expected Dividend Yield – We base the expected dividend yield on our historical dividend payment of approximately $0.16 per share.
The following table summarizes the assumptions used to estimate the fair value of our stock options granted during the years ended October 31, 2017 and 2016.
|
| | | |
| Year Ended October 31, |
| | 2017 | | 2016 |
| Weighted-average expected volatility | 34.7% | | 37.1% |
| Weighted-average expected term (in years) | 5.7 | | 5.4 |
| Risk-free interest rate | 2.0% | | 1.7% |
| Expected dividend yield over expected term | 1.0% | | 1.0% |
| Weighted average grant date fair value | $6.25 | | $6.32 |
The following table summarizes our stock option activity for the years ended October 31, 2018, 20172021, 2020 and 2016.2019.
| | | | | | | | | | | | | | | | | | | | | | | |
| Stock Options | | Weighted Average
Exercise Price | | Weighted Average
Remaining Contractual
Term (in years) | | Aggregate
Intrinsic
Value (000s) |
| Outstanding at October 31, 2018 | 1,753,656 | | | $ | 18.47 | | | 5.0 | | $ | 51 | |
| Granted | — | | | — | | | | | |
| Exercised | (204,770) | | | 15.76 | | | | | |
| Forfeited/Expired | (132,700) | | | 20.01 | | | | | |
| Outstanding at October 31, 2019 | 1,416,186 | | | $ | 18.71 | | | 4.2 | | $ | 1,449 | |
| Granted | — | | | — | | | | | |
| Exercised | (215,733) | | | 17.09 | | | | | |
| Forfeited/Expired | (105,124) | | | 20.28 | | | | | |
| Outstanding at October 31, 2020 | 1,095,329 | | | $ | 18.88 | | | 3.6 | | $ | 561 | |
| Granted | — | | | — | | | | | |
| Exercised | (865,393) | | | 18.80 | | | | |
| Forfeited/Expired | (11,632) | | | 18.22 | | | | |
| Outstanding at October 31, 2021 | 218,304 | | | $ | 19.37 | | | 3.4 | | $ | 297 | |
| Vested at October 31, 2021 | 218,304 | | | $ | 19.37 | | | 3.4 | | $ | 297 | |
| Exercisable at October 31, 2021 | 218,304 | | | $ | 19.37 | | | 3.4 | | $ | 297 | |
|
| | | | | | | | | | | | |
| | Stock Options | | Weighted Average Exercise Price | | Weighted Average Remaining Contractual Term (in years) | | Aggregate Intrinsic Value (000s) |
| Outstanding at October 31, 2015 | 2,352,188 |
| | $ | 16.46 |
| | 5.4 | | $ | 6,672 |
|
| Granted | 297,900 |
| | 19.23 |
| | | | |
| Exercised | (221,850 | ) | | 15.43 |
| | | | |
| Forfeited/Expired | (42,018 | ) | | 19.78 |
| | | | |
| Outstanding at October 31, 2016 | 2,386,220 |
| | 16.84 |
| | 5.1 | | $ | 2,384 |
|
| Granted | 292,600 |
| | 19.45 |
| | | | |
| Exercised | (507,660 | ) | | 15.67 |
| | | | |
| Forfeited/Expired | (18,402 | ) | | 19.90 |
| | | | |
| Outstanding at October 31, 2017 | 2,152,758 |
| | 17.44 |
| | 5.2 | | $ | 9,700 |
|
| Granted | — |
| | — |
| | | | |
| Exercised | (377,218 | ) | | 12.58 |
| | | | |
| Forfeited/Expired | (21,884 | ) | | 19.28 |
| | | | |
| Outstanding at October 31, 2018 | 1,753,656 |
| | 18.47 |
| | 5.0 | | $ | 51 |
|
| Vested or expected to vest at October 31, 2018 | 1,753,656 |
| | 18.47 |
| | 5.0 | | $ | 51 |
|
| Exercisable at October 31, 2018 | 1,477,746 |
| | $ | 18.30 |
| | 4.4 | | $ | 51 |
|
Intrinsic value is the amount by which the market price of the common stock on the date of exercise exceeds the exercise price of the stock option. For the years ended October 31, 2018, 20172021, 2020 and 2016,2019, the total intrinsic value of our stock options that were exercised totaled $2.9totaled $4.2 million, $3.1$0.5 million and $1.0$0.4 million, respectively. The total fair value of stock options vested during the years ended October 31, 2018, 20172021, 2020 and 2016,2019, was $1.5 million, $1.8zero, $0.6 million and $1.9$1.1 million, respectively. As of October 31, 2018, total unrecognized compensation cost related to stock options was $0.2 million. We expect to recognize this expense over the remaining weighted average vesting period of 1.0 years.
QUANEX BUILDING PRODUCTS CORPORATION
NOTES TO CONSOLIDATED FINANCIAL STATEMENTS (continued)
Restricted Stock Units
Restricted stock units may be awarded to key employees and officers from time to time, and annually to non-employee directors. The non-employee director restricted stock units vest immediately but are payable only upon the director's cessation of service unless an election is made by the non-employee director to settle and pay the award on an earlier specified date. Restricted stock units awarded to employees and officers typically cliff vest after a three-year period with service and continued employment as the vesting conditions. Restricted stock units are not considered outstanding shares and do not have voting rights, although the holder does receive a cash payment equivalent to the dividend paid, on a one-for-one basis, on our outstanding common shares. Once the vesting criteria is met, each restricted stock unit is payable to the holder in cash based on the market value of one share of our common stock. Accordingly, we record a liability for the restricted stock units on our balance sheet and recognize any changes in the market value during each reporting period as compensation expense.
During the years ended October 31, 2018, 20172021, 2020 and 2016, 18,050, 24,5602019, 28,826, 25,621 and 20,44534,050 restricted stock units, respectively, were granted and immediately vested with corresponding weighted average grant date fair value of $21.85, $15.65$18.79, $18.18, and $19.56,$15.51, respectively. As of October 31, 2018, 2017 and 2016,2021 there were no non-vested restricted stock units. We did not make any payments to settle21,774 unvested restricted stock units duringfrom the fiscal 2020 grant. During the years ended October 31, 2018, 20172021, 2020 and 2016.2019, we paid $0.8 million, $0.2 million and $0.4 million to settle restricted stock units.
QUANEX BUILDING PRODUCTS CORPORATION
NOTES TO CONSOLIDATED FINANCIAL STATEMENTS (continued)
Performance Share AwardsAwards
We have grantedawarded annual grants of performance share awardsshares to key employees and officers annually in December. In addition, we awarded performance shares in January 2016 to a new officer. These awards cliff vest after a three-year periodofficers. Beginning with service and performance measures such as relative total shareholder return (R-TSR) and earnings per share (EPS) growth as vesting conditions. The number ofthe fiscal year ended October 31, 2019, performance share awards earned is variable dependingvest with return on net assets (RONA) as the metrics achieved. The settlement method is 50%vesting condition, pay out 100% in cash, and 50% in our common stock.are accounted for as liability.
To account forThe expected cash settlement of the performance share awards, we have bifurcated the portion subject to a market condition (relative total shareholder return) and the portion subject to an internal performance measure (earnings per share growth). We have further bifurcated these awards based on the settlement method, as the portion expected to settle in stock (equity component) and the portion expected to settle in cash (liability component).
To value the shares subject to the market condition, we utilized a Monte Carlo simulation model to arrive at a grant-date fair value. This amount will be expensed over the three-year term of the award with a credit to additional paid-in-capital. To value the shares subject to the internal performance measure, we used the value of our common stock on the date of grant as the grant-date fair value per share. This amount will be expensed over the three-year term of the award, with a credit to additional paid-in-capital, and could fluctuate depending on the number of shares ultimately expected to vest based on our assessment of the probability that the performance conditions will be achieved. For both performance conditions, the portion of the award expected to settle in cash will beis recorded as a liability and will beis being marked to market over the three-year term of the award, and could fluctuate depending on the number of shares ultimately expected to vest. Depending on the achievement of the performance conditions, 0% to 200% of the awarded performance shares may ultimately vest.
The following table summarizes our performance share grants and the grant date fair value for the EPS and R-TSRRONA performance metrics:metric:
| | | | | | | | | | | | | | | | | | | | | | | |
| | | | | | | | | | |
| Grant Date | Shares Awarded | | | | | | Grant Date Fair Value | | Shares Forfeited | | |
| December 5, 2018 | 132,400 | | | | | | | $ | 13.63 | | | 40,900 | | | |
| December 5, 2019 | 55,900 | | | | | | | $ | 19.40 | | | 5,300 | | | |
| December 2, 2020 | 65,300 | | | | | | | $ | 20.68 | | | — | | | |
|
| | | | | | | | | | | | | |
| | Grant Date Fair Value |
| Grant Date | Shares Awarded | | EPS | | R-TSR | | Forfeited |
| December 2, 2015 | 158,100 |
| | $ | 19.31 |
| | $ | 23.72 |
| | 18,936 |
|
| January 25, 2016 | 4,300 |
| | 17.46 |
| | 26.65 |
| | — |
|
| November 30, 2016 | 186,500 |
| | 19.45 |
| | 26.61 |
| | 17,940 |
|
| December 7, 2017 | 146,500 |
| | $ | 20.70 |
| | $ | 21.81 |
| | 12,848 |
|
In December 2020, the December 2017 grant vested, however, no shares were awarded as performance criteria were not met. On December 3, 2017, 123,600November 30, 2019, a total of 56,103 shares vested pursuant to the December 2013November 2016 grant, resulting in the issuance of 25,340which were settled with 28,051 shares of common stock and a cash payment of $0.6 million. The November 2016 grant includes a return on invested capital (ROIC) metric which, if achieved, could enhance the number of shares that are ultimately issued but cannot exceed the maximum (200%). Due to the uncertainty with regard to achieving this metric, no value has been assigned. In the event and at such time the metric is deemed achievable, compensation expense will begin to be recognized through the remaining vesting period. For the year ended October 31, 2018, we recorded a decrease in compensation expense of $0.9 million, which reflects a decrease in the number of shares expected to vest in December 2018 associated with the December 2, 2015 performance share grant. For the years ended
QUANEX BUILDING PRODUCTS CORPORATION
NOTES TO CONSOLIDATED FINANCIAL STATEMENTS (continued)
October 31, 2017 and 2016, we recorded $3.0 million and $2.7 million of compensation expense related to these performance share awards.
Performance share awards are not considered outstanding shares and do not have voting rights, although dividends are accrued over the performance period and will be payable in cash based upon the number of performance shares ultimately earned.
Performance sharesearned, and are excluded from diluted weighted-average shares used to calculate earnings per share until the performance criteria is probable to result in the issuance of contingenttherefore not considered outstanding shares. We evaluate the probability of the performance share vesting within one year of the vesting date. As of October 31, 2018, we have deemed no performance share awards to vest from our December 2, 2015 performance share award. For the years ended October 31, 2017 and 2016, there were 25,338 and 67,550 shares, respectively, related to performance shares that were potentially dilutive and considered in the diluted weighted average shares calculations. No contingent shares related to performance shares are included in diluted weighted average shares for the year ended October 31, 2018.
Performance Restricted Stock Units
We awarded performance restricted stock units to key employees and officers in December 2017.officers. These awards cliff vest upon a three-year service period with the absolute total shareholder return of our common stock over this three-year term as the vesting criteria. The number of performance restricted stock units earned is variable depending on the metric achieved, and the settlement method is 100% in our common stock, with accrued dividends paid in cash at the time of vesting, assuming the shares had been outstanding throughout the performance period.
To value the performance restricted stock units, we utilized a Monte Carlo simulation model to arrive at a grant-date fair value. This amount will be adjusted for forfeitures and expensed over the three-year term of the award with a credit to additional paid-in-capital. Depending on the achievement of the performance conditions, a minimum of 0% and a maximum of 150% of the awarded performance restricted stock units may vest. Specifically, the awards vest on a continuum with the following Absolute Total Shareholder Return (A-TSR) milestones:
|
| | | | | | | | | | | | | |
| Vesting Level | | Vesting Criteria | | Percentage of Award Vested |
| Level 1 | | A-TSR greater than or equal to 50% | | 150% |
| Level 2 | | A-TSR less than 50% and greater than or equal to 20% | | 100% |
| Level 3 | | A-TSR less than 20% and greater than or equal to -20% | | 50% |
| Level 4 | | A-TSR less than -20% | | —% |
On December 7, 2017, we awarded 78,200The following table summarizes our performance restricted stock units with aunit grants and the grant date fair value for the A-TSR performance metric:
| | | | | | | | | | | | | | | | | | | | |
| Grant Date | | Shares Awarded | | Grant Date Fair Value | | Shares Forfeited |
| December 5, 2018 | | 89,200 | | | $ | 13.63 | | | 25,500 | |
| December 5, 2019 | | 35,000 | | | $ | 19.40 | | | — | |
| December 2, 2020 | | 38,400 | | | $ | 20.68 | | | — | |
Similar to performance shares, theQUANEX BUILDING PRODUCTS CORPORATION
NOTES TO CONSOLIDATED FINANCIAL STATEMENTS (continued)
The performance restricted stock units are not considered outstanding shares, do not have voting rights, and are excluded from diluted weighted-average shares used to calculate earnings per share until the performance criteria is probable to result in the issuance of contingent shares.
The following table summarizes amounts expensed as selling, general and administrative expense related to restricted stock awards, stock options, restricted stock units, performance share awards and performance restricted stock units for the years ended October 31, 2018, 20172021, 2020 and 20162019 (in thousands):
| | | | | | | | | | | | | | | | | |
| | Year Ended October 31, |
| | 2021 | | 2020 | | 2019 |
| Restricted stock awards | $ | 1,235 | | | $ | 625 | | | $ | 1,018 | |
| Stock options | — | | | 10 | | | 158 | |
| Restricted stock units | 1,197 | | | 186 | | | 950 | |
| Performance share awards | 4,039 | | | (170) | | | 1,131 | |
| Performance restricted stock units | 729 | | | 515 | | | 708 | |
| Total compensation expense | 7,200 | | | 1,166 | | | 3,965 | |
| Income tax effect | 2,078 | | | 274 | | | 997 | |
| Net compensation expense | $ | 5,122 | | | $ | 892 | | | $ | 2,968 | |
|
| | | | | | | | | | | |
| | Year Ended October 31, |
| | 2018 | | 2017 | | 2016 |
| Restricted stock awards | $ | 1,462 |
| | $ | 1,810 |
| | $ | 1,911 |
|
| Stock options | 467 |
| | 1,820 |
| | 2,486 |
|
| Restricted stock units | (364 | ) | | 855 |
| | 161 |
|
| Performance share awards | (944 | ) | | 3,001 |
| | 2,703 |
|
| Performance restricted stock units | 401 |
| | — |
| | — |
|
| Total compensation expense | 1,022 |
| | 7,486 |
| | 7,261 |
|
| Income tax effect | (35 | ) | | 1,999 |
| | 4,858 |
|
| Net compensation expense | $ | 1,057 |
| | $ | 5,487 |
| | $ | 2,403 |
|
QUANEX BUILDING PRODUCTS CORPORATION
NOTES TO CONSOLIDATED FINANCIAL STATEMENTS (continued)
16.14. Stockholders' Equity
As of October 31, 2018,2021, our authorized capital stock consists of 125,000,000 shares of common stock, at par value of $0.01 per share, and 1,000,000 shares of preferred stock, with no par value. As of October 31, 20182021 and 2017,2020, we had 37,433,81737,273,510 and 37,508,87737,296,166 shares of common stock issued, respectively, and 33,339,032 33,274,785 and 34,838,13432,804,737 shares of common stock outstanding, respectively. There were no shares of preferred stock issued or outstanding at October 31, 20182021 and 2017.2020.
Stock Repurchase Program and Treasury Stock
On August 30, 2018, our Board of Directors approved a stock repurchase program that authorized the repurchase of up to $60.0 million worth of shares of our common stock. Repurchases under the new program will be made in open market transactions or privately negotiated transactions, subject to market conditions, applicable legal requirements and other relevant factors. The program does not have an expiration date or a limit on the number of shares that may be purchased. During the yearyears ended October 31, 2018,2021 and 2020, we purchased 1,900,000purchased 478,311 shares and 450,000 shares, respectively, at a cost of $32.0$11.2 million and $7.2 million respectively, under this program.
We record treasury stock purchases under the cost method whereby the entire cost of the acquired stock is recorded as treasury stock. Shares are generally issued from treasury stock at the time of grant of restricted stock awards, upon the exercise of stock options, and upon the vesting of performance shares and performance restricted stock units. On the subsequent issuance of treasury shares, we record proceeds in excess of cost as an increase in additional paid in capital.paid-in-capital. A deficiency of such proceeds relative to costs would be applied to reduce paid-in-capital associated with prior issuances to the extent available, with the remainder recorded as a charge to retained earnings. We recorded a charge to retained earningsearnings of $2.1zero, $0.1 million and $1.5$0.3 million, in the years ended October 31, 2021, 2020, and 2018, and 2017, respectively.
For a summary of treasury stock activity for the years ended October 31, 2018, 20172021, 2020 and 2016,2019, refer to the Consolidated Statement of Stockholders' Equity located elsewhere herein.
17.
QUANEX BUILDING PRODUCTS CORPORATION
NOTES TO CONSOLIDATED FINANCIAL STATEMENTS (continued)
15. Other, Income (Expense)net
Other income (expense) included under the caption "Other, net"“Other, net” on the accompanying consolidated statements of income (loss), consisted of the following (in thousands): | | | | | | | | | | | | | | | | | |
| Year Ended October 31, |
| | 2021 | | 2020 | | 2019 |
| Foreign currency transaction losses | $ | (98) | | | $ | (42) | | | $ | (187) | |
| Foreign currency exchange derivative losses | — | | | (15) | | | (197) | |
| Pension service benefit | 839 | | | 243 | | | 396 | |
| Interest income | 5 | | | 28 | | | 63 | |
| Other | 8 | | | 66 | | | 41 | |
| Other income | $ | 754 | | | $ | 280 | | | $ | 116 | |
|
| | | | | | | | | | | |
| | Year Ended October 31, |
| | 2018 | | 2017 | | 2016 |
| Foreign currency transaction gains (losses) | $ | 113 |
| | $ | 713 |
| | $ | (5,457 | ) |
| Foreign currency exchange derivative (losses) gains | (11 | ) | | (88 | ) | | 77 |
|
| Interest income | 69 |
| | 86 |
| | 106 |
|
| Other | 7 |
| | 19 |
| | (205 | ) |
| Other income (expense) | $ | 178 |
| | $ | 730 |
| | $ | (5,479 | ) |
QUANEX BUILDING PRODUCTS CORPORATION
NOTES TO CONSOLIDATED FINANCIAL STATEMENTS (continued)
18.16. Segment Information
We present three3 reportable business segments: (1) North American Engineered Components segment (“NA Engineered Components”),Fenestration, comprising four3 operating segments primarily focused on the fenestration market in North America including vinyl profiles, insulating glass (IG) spacers, screens & other fenestration components; (2) European Engineered Components segment (“EU Engineered Components”),Fenestration, comprising our United Kingdom-basedU.K.-based vinyl extrusion business, manufacturing vinyl profiles & conservatories, and the European insulating glass business manufacturing IGinsulating glass spacers; and (3) North AmericanNA Cabinet Components, segment (“NA Cabinet Components”), comprising Woodcraftour cabinet door and two wood manufacturing plants.components segment. We maintain a grouping called Unallocated Corporate & Other, which includes transaction expenses, stock-based compensation, long-term incentive awards based on the performance of our common stock and other factors, certain severance and legal costs not deemed to be allocable to all segments, depreciation of corporate assets, interest expense, other, net, income taxes and inter-segment eliminations, and beginning in 2018, executive incentive compensation and medical expense fluctuations relative to planned costs as determined during the annual planning process. Other general and administrative costs associated with the corporate office are allocated to the reportable segments, based upon a relative measure of profitability in order to more accurately reflect each reportable business segment's administrative costs. We allocate corporate expenses to businesses acquired mid-year from the date of acquisition. The accounting policies of our operating segments are the same as those used to prepare the accompanying consolidated financial statements. Corporate general and administrative expenses allocated during the years ended October 31, 2018, 20172021, 2020 and 20162019 were $18.7$21.6 million $17.0, $21.7 million and $19.1$18.3 million, respectively.
ASC Topic 280-10-50, “Segment Reporting”“Segment Reporting” (ASC 280) permits aggregation of operating segments based on factors including, but not limited to: (1) similar nature of products serving the building products industry, primarily the fenestration business; (2) similar production processes, although there are some differences in the amount of automation amongst operating plants; (3) similar types or classes of customers, namely the primary OEMs; (4) similar distribution methods for product delivery, although the extent of the use of third-party distributors will vary amongst the businesses; (5) similar regulatory environment; and (6) converging long-term economic similarities.
QUANEX BUILDING PRODUCTS CORPORATION
NOTES TO CONSOLIDATED FINANCIAL STATEMENTS (continued)
Segment information for the years ended October 31, 2018, 20172021, 2020 and 20162019 was as follows (in thousands): | | | | | | | | | | | | | | | | | | | | | | | | | | | | | |
| NA Fenestration | | EU Fenestration | | NA Cabinet Comp. | | Unallocated Corp. & Other | | Total |
| Year Ended October 31, 2021 | | | | | | | | | |
| Net sales | $ | 578,332 | | | $ | 251,599 | | | $ | 246,075 | | | $ | (3,857) | | | $ | 1,072,149 | |
| Depreciation and amortization | 18,730 | | | 10,373 | | | 13,263 | | | 366 | | | 42,732 | |
| Operating income (loss) | 56,248 | | | 39,299 | | | 896 | | | (14,573) | | | 81,870 | |
| Capital expenditures | 9,966 | | | 8,155 | | | 5,559 | | | 328 | | | 24,008 | |
| Total assets | $ | 268,773 | | | $ | 236,755 | | | $ | 178,671 | | | $ | 33,124 | | | $ | 717,323 | |
| Year Ended October 31, 2020 | | | | | | | | | |
| Net sales | $ | 483,415 | | | $ | 161,054 | | | $ | 210,099 | | | $ | (2,995) | | | $ | 851,573 | |
| Depreciation and amortization | 23,555 | | | 9,468 | | | 13,732 | | | 474 | | | 47,229 | |
| Operating income (loss) | 39,909 | | | 20,076 | | | (2,502) | | | (2,218) | | | 55,265 | |
| Capital expenditures | 15,761 | | | 5,435 | | | 4,423 | | | 107 | | | 25,726 | |
| Total assets | $ | 252,703 | | | $ | 223,248 | | | $ | 174,713 | | | $ | 40,921 | | | $ | 691,585 | |
| Year Ended October 31, 2019 | | | | | | | | | |
| Net sales | $ | 503,837 | | | $ | 164,997 | | | $ | 229,644 | | | $ | (4,637) | | | $ | 893,841 | |
| Depreciation and amortization | 27,054 | | | 8,845 | | | 13,178 | | | 509 | | | 49,586 | |
| Operating income (loss) | 39,765 | | | 19,040 | | | (74,236) | | | (10,996) | | | (26,427) | |
| Capital expenditures | $ | 12,984 | | | $ | 6,365 | | | $ | 5,383 | | | $ | 151 | | | $ | 24,883 | |
| | | | | | | | | |
| | | | | | | | | |
| | | | | | | | | |
| | | | | | | | | |
| | | | | | | | | |
| | | | | | | | | |
|
| | | | | | | | | | | | | | | | | | | |
| | NA Eng. Comp. | | EU Eng. Comp. | | NA Cabinet Comp. | | Unallocated Corp. & Other | | Total |
| Year Ended October 31, 2018 | | | | | | | | | |
| Net sales | $ | 485,366 |
| | $ | 159,973 |
| | $ | 249,813 |
| | $ | (5,367 | ) | | $ | 889,785 |
|
| Depreciation and amortization | 27,248 |
| | 9,607 |
| | 14,401 |
| | 566 |
| | 51,822 |
|
| Operating income (loss) | 31,484 |
| | 12,702 |
| | 3,248 |
| | (11,059 | ) | | 36,375 |
|
| Capital expenditures | 13,929 |
| | 5,450 |
| | 6,965 |
| | 140 |
| | 26,484 |
|
| Total assets | $ | 239,915 |
| | $ | 214,704 |
| | $ | 272,313 |
| | $ | 14,917 |
| | $ | 741,849 |
|
| Year Ended October 31, 2017 | | | | | | | | | |
| Net sales | $ | 474,878 |
| | $ | 147,963 |
| | $ | 248,808 |
| | $ | (5,094 | ) | | $ | 866,555 |
|
| Depreciation and amortization | 34,308 |
| | 8,833 |
| | 13,811 |
| | 543 |
| | 57,495 |
|
| Operating income (loss) | 26,311 |
| | 13,673 |
| | 4,128 |
| | (9,745 | ) | | 34,367 |
|
| Capital expenditures | 18,822 |
| | 7,841 |
| | 7,349 |
| | 552 |
| | 34,564 |
|
| Total assets | $ | 258,315 |
| | $ | 219,622 |
| | $ | 285,457 |
| | $ | 10,485 |
| | $ | 773,879 |
|
| Year Ended October 31, 2016 | | | | | | | | | |
| Net sales | $ | 538,249 |
| | $ | 150,203 |
| | $ | 248,119 |
| | $ | (8,387 | ) | | $ | 928,184 |
|
| Depreciation and amortization | 29,793 |
| | 9,339 |
| | 13,453 |
| | 561 |
| | 53,146 |
|
| Operating income (loss) | 34,229 |
| | 13,225 |
| | 5,475 |
| | (16,576 | ) | | 36,353 |
|
| Capital expenditures | $ | 22,114 |
| | $ | 6,141 |
| | $ | 8,709 |
| | $ | 279 |
| | $ | 37,243 |
|
The following table summarizes the change in the carrying amount of goodwill by segment for the years ended October 31, 20182021 and 20172020 (in thousands): |
| | | | | | | | | | | | | | | | | | | |
| | NA Eng. Comp. | | EU Eng. Comp. | | NA Cabinet Comp. | | Unallocated Corp. & Other | | Total |
| Balance as of October 31, 2016 | $ | 38,712 |
| | $ | 64,576 |
| | $ | 113,747 |
| | $ | — |
| | $ | 217,035 |
|
| Foreign currency translation adjustment | — |
| | 5,159 |
| | — |
| | — |
| | 5,159 |
|
| Balance as of October 31, 2017 | $ | 38,712 |
| | $ | 69,735 |
| | $ | 113,747 |
| | $ | — |
| | $ | 222,194 |
|
| Foreign currency translation adjustment | — |
| | (2,567 | ) | | — |
| | — |
| | (2,567 | ) |
| Balance as of October 31, 2018 | $ | 38,712 |
| | $ | 67,168 |
| | $ | 113,747 |
| | $ | — |
| | $ | 219,627 |
|
| | | | | | | | | | | | | | | | | | | | | | | | | | | | | |
| NA Fenestration | | EU Fenestration | | NA Cabinet Comp. | | Unallocated Corp. & Other | | Total |
| | | | | | | | | |
| | | | | | | | | |
| Balance as of October 31, 2019 | $ | 38,712 | | | $ | 67,704 | | | $ | 39,147 | | | $ | — | | | $ | 145,563 | |
| | | | | | | | | |
| Foreign currency translation adjustment | — | | | 591 | | | — | | | — | | | 591 | |
| Balance as of October 31, 2020 | $ | 38,712 | | | $ | 68,295 | | | $ | 39,147 | | | $ | — | | | $ | 146,154 | |
| Foreign currency translation adjustment | — | | | 3,051 | | | — | | | — | | | 3,051 | |
| Balance as of October 31, 2021 | $ | 38,712 | | | $ | 71,346 | | | $ | 39,147 | | | $ | — | | | $ | 149,205 | |
For further details of Goodwill, see Note 6, "Goodwill &“Goodwill and Intangible Assets"Assets”, located herewith.
We did not allocate non-operating expense or income tax expense to the reportable segments. The following table reconciles operating income (loss) as reported above to net income (loss) for the years ended October 31, 2018, 20172021, 2020 and 2016:2019 (in thousands):
| | | | | | | | | | | | | | | | | |
| Year Ended October 31, |
| 2021 | | 2020 | | 2019 |
| Operating income (loss) | $ | 81,870 | | | $ | 55,265 | | | $ | (26,427) | |
| Interest expense | (2,530) | | | (5,245) | | | (9,643) | |
| Other, net | 754 | | | 280 | | | 116 | |
| Income tax expense | (23,114) | | | (11,804) | | | (10,776) | |
| Net income (loss) | $ | 56,980 | | | $ | 38,496 | | | $ | (46,730) | |
|
| | | | | | | | | | | |
| | Year Ended October 31, |
| | 2018 | | 2017 | | 2016 |
| | (in thousands) |
| Operating income | $ | 36,375 |
| | $ | 34,367 |
| | $ | 36,353 |
|
| Interest expense | (11,100 | ) | | (9,595 | ) | | (36,498 | ) |
| Other, net | 178 |
| | 730 |
| | (5,479 | ) |
| Income tax benefit (expense) | 875 |
| | (6,819 | ) | | 3,765 |
|
| Income (loss) from continuing operations | $ | 26,328 |
| | $ | 18,683 |
| | $ | (1,859 | ) |
QUANEX BUILDING PRODUCTS CORPORATION
NOTES TO CONSOLIDATED FINANCIAL STATEMENTS (continued)
Geographic Information
Our manufacturing facilities and all long-lived assets are located in the United States, United KingdomU.S., U.K. and Germany. We attribute our net sales to a geographic region based on the location of the customer. The following tables provide information concerning our net sales for the years ended October 31, 2018, 20172021, 2020 and 2016,2019, and our long-lived assets as of October 31, 20182021 and 20172020 (in thousands):
| | | | | | | | | | | | | | | | | |
| Year Ended October 31, |
| Net sales | 2021 | | 2020 | | 2019 |
| United States | $ | 778,486 | | | $ | 654,802 | | | $ | 683,204 | |
| Europe | 244,308 | | | 158,831 | | | 162,106 | |
| Canada | 25,007 | | | 18,213 | | | 20,088 | |
| Asia | 18,445 | | | 11,504 | | | 18,360 | |
| Other foreign countries | 5,903 | | | 8,223 | | | 10,083 | |
| Total net sales | $ | 1,072,149 | | | $ | 851,573 | | | $ | 893,841 | |
|
| | | | | | | | | | | |
| | Year Ended October 31, |
| Net Sales: | 2018 | | 2017 | | 2016 |
| United States | $ | 676,776 |
| | $ | 667,063 |
| | $ | 724,045 |
|
| Europe | 159,652 |
| | 148,370 |
| | 150,710 |
|
| Canada | 23,610 |
| | 24,442 |
| | 24,141 |
|
| Asia | 18,584 |
| | 17,028 |
| | 20,404 |
|
| Other foreign countries | 11,163 |
| | 9,652 |
| | 8,884 |
|
| Total net sales | $ | 889,785 |
| | $ | 866,555 |
| | $ | 928,184 |
|
| | | | Year Ended October 31, | | October 31, |
| Long-lived assets, net | 2018 | | 2017 | Long-lived assets, net | 2021 | | 2020 |
| United States | $ | 384,595 |
| | $ | 404,732 |
| United States | $ | 291,282 | | | $ | 307,534 | |
| Germany | 16,507 |
| | 20,052 |
| Germany | 25,513 | | | 25,519 | |
| United Kingdom | 141,814 |
| | 148,319 |
| United Kingdom | 146,158 | | | 142,097 | |
| Total long-lived assets, net | $ | 542,916 |
| | $ | 573,103 |
| Total long-lived assets, net | $ | 462,953 | | | $ | 475,150 | |
Long-lived assets, net includes: property, plant and equipment, net; goodwill; andgoodwill, intangible assets, net.net, and operating leases.
Product Sales
We produce a wide variety
Table of products that are used in the fenestration industry, including window spacer systems; extruded vinyl products; metal fabrication; and astragals, thresholds and screens. In addition, we produce certain non-fenestration products, including: kitchen and bath cabinet doors and components, flooring and trim moldings, solar edge tape, plastic decking, fencing, water retention barriers, conservatory roof components, and other products.Contents QUANEX BUILDING PRODUCTS CORPORATION
NOTES TO CONSOLIDATED FINANCIAL STATEMENTS (continued)
The following table summarizes our product sales for the years ended October 31, 2018, 2017 and 2016 into general groupings to provide additional information to our shareholders. |
| | | | | | | | | | | |
| | Year Ended October 31, |
| | 2018 | | 2017 | | 2016 |
| | (in thousands) |
| NA Engineered Components: | | | | | |
| United States - fenestration | $ | 412,000 |
| | $ | 399,694 |
| | $ | 444,571 |
|
| International - fenestration | 39,309 |
| | 34,279 |
| | 38,439 |
|
| United States - non-fenestration | 18,211 |
| | 25,263 |
| | 36,986 |
|
| International - non-fenestration | 15,846 |
| | 15,642 |
| | 18,253 |
|
| | $ | 485,366 |
| | $ | 474,878 |
| | $ | 538,249 |
|
| EU Engineered Components: | | | | | |
| United States - fenestration | $ | — |
| | $ | 303 |
| | $ | 412 |
|
| International - fenestration | 135,415 |
| | 129,140 |
| | 134,631 |
|
| International - non-fenestration | 24,558 |
| | 18,520 |
| | 15,160 |
|
| | $ | 159,973 |
| | $ | 147,963 |
| | $ | 150,203 |
|
| NA Cabinet Components: | | | | | |
| United States - fenestration | $ | 14,596 |
| | $ | 17,083 |
| | $ | 21,779 |
|
| United States - non-fenestration | 232,990 |
| | 229,550 |
| | 223,664 |
|
| International - non-fenestration | 2,227 |
| | 2,175 |
| | 2,676 |
|
| | $ | 249,813 |
| | $ | 248,808 |
| | $ | 248,119 |
|
| Unallocated Corporate & Other | | | | | |
| Eliminations | $ | (5,367 | ) | | $ | (5,094 | ) | | $ | (8,387 | ) |
| | $ | (5,367 | ) | | $ | (5,094 | ) | | $ | (8,387 | ) |
| Net sales | $ | 889,785 |
| | $ | 866,555 |
| | $ | 928,184 |
|
QUANEX BUILDING PRODUCTS CORPORATION
NOTES TO CONSOLIDATED FINANCIAL STATEMENTS (continued)
19.17. Earnings (Loss) Per Share
We compute basic earnings (loss) per share by dividing net income (loss) by the weighted average number of common shares outstanding during the period. Diluted earnings per common and potential common shares include the weighted average of additional shares associated with the incremental effect of dilutive employee stock options, non-vested restricted stock as determined using the treasury stock method prescribed by U.S. GAAP and contingent shares associated with performance share awards, if dilutive.
The computation of basic and diluted earnings per share for the years ended October 31, 20182021, 2020 and 20172019 follows (in thousands, except per share data):
| | | | | | | | | | | | | | | | | |
| Year Ended October 31, 2021 | Net Income (Loss) | | Weighted Average Shares | | Per Share |
| Basic earnings per common share | $ | 56,980 | | | 33,193 | | $ | 1.72 | |
| Effect of dilutive securities: | | | | | |
| Stock options | | | 82 | | |
| Restricted stock awards | | | 132 | | |
| Performance restricted stock units | | | 88 | | |
| Diluted earnings per common share | $ | 56,980 | | | 33,495 | | $ | 1.70 | |
| Year Ended October 31, 2020 | | | | | |
| Basic earnings per common share | $ | 38,496 | | | 32,689 | | $ | 1.18 | |
| Effect of dilutive securities: | | | | | |
| Stock options | | | 10 | | |
| Restricted stock | | | 90 | | |
| Performance restricted stock units | | | 32 | | |
| Diluted earnings per common share | $ | 38,496 | | | 32,821 | | $ | 1.17 | |
| Year Ended October 31, 2019 | | | | | |
| Basic and diluted loss per share | $ | (46,730) | | | 32,960 | | | $ | (1.42) | |
| | | | | |
| | | | | |
| | | | | |
| | | | | |
| | | | | |
| | | | | |
| | | | | |
| | | | | |
| | | | | |
| | | | | |
| | | | | |
|
| | | | | | | | | | | | | | | | | | | | | |
| | Year Ended October 31, 2018 | | Year Ended October 31, 2017 |
| | Net Income from Continuing Operations | | Weighted Average Shares | | Per Share | | Net Income from Continuing Operations | | Weighted Average Shares | | Per Share |
| Basic earnings per common share | $ | 26,328 |
| | 34,701 |
| | $ | 0.76 |
| | $ | 18,683 |
| | 34,230 |
| | $ | 0.55 |
|
| Effect of dilutive securities: | | | | | | | | | | | |
| Stock options | — |
| | 198 |
| | | | — |
| | 446 |
| | |
| Restricted stock | — |
| | 126 |
| | | | — |
| | 138 |
| | |
| Performance shares | — |
| | — |
| | | | — |
| | 23 |
| | |
| Diluted earnings per common share | $ | 26,328 |
| | 35,025 |
| | $ | 0.75 |
| | $ | 18,683 |
| | 34,837 |
| | $ | 0.54 |
|
Basic and diluted loss per share was $0.05 for the twelve months ended October 31, 2016. The computationWe do not include equity instruments in our calculation of diluted earnings per share excludes outstanding stock options and other common stock equivalents when their inclusionif those instruments would be anti-dilutive. During the twelve-month period ended October 31, 2016, 378,542 shares of common stock equivalents, 152,227 shares of restricted stock and 67,550 contingent shares related to performance share awards and performance restricted stock units were excluded from the computation of diluted earnings per share.
For the years ended October 31, 2018, 2017 and 2016, we had 1,000,356, 686,650; and 807,372 securities, respectively, that were potentially dilutive in future earnings per share calculations.antidilutive. Such dilution will beis dependent on the excess of the market price of our stock over the exercise price and other components of the treasury stock method. The following table shows anti-dilutive instruments for the three years ended October 31, 2021, 2020 and 2019 (shares in thousands):
| | | | | | | | | | | | | | | | | |
| Year Ended October 31, |
| 2021 | | 2020 | | 2019 |
| Stock options | — | | 1,032 | | 1,307 |
| Restricted stock awards | — | | — | | 113 |
| Performance share awards | — | | — | | 28 |
| Total | — | | 1,032 | | 1,448 |
QUANEX BUILDING PRODUCTS CORPORATION
NOTES TO CONSOLIDATED FINANCIAL STATEMENTS (continued)
20.18. Unaudited Quarterly Data
Selected quarterly financial data for the years ended October 31, 20182021 and 20172020 was as follows (amounts in thousands, except per share amounts): | | | | | | | | | | | | | | | | | | | | | | | |
| For the Quarter Ended | January 31, 2021 | | April 30, 2021 | | July 31, 2021 | | October 31, 2021 |
| Net sales | $ | 230,147 | | | $ | 270,357 | | | $ | 279,877 | | | $ | 291,768 | |
| Cost of sales (excluding depreciation and amortization) | 176,397 | | | 208,460 | | | 219,866 | | | 226,818 | |
| Depreciation and amortization | 11,015 | | | 10,845 | | | 10,683 | | | 10,189 | |
| Operating income | 11,835 | | | 21,380 | | | 21,562 | | | 27,093 | |
| Net income | 7,852 | | | 14,551 | | | 13,679 | | | 20,898 | |
| Basic earnings per share | 0.24 | | | 0.44 | | | 0.41 | | | 0.63 | |
| Diluted earnings per share | 0.24 | | | 0.43 | | | 0.41 | | | 0.62 | |
| Cash dividends paid per common share | 0.08 | | | 0.08 | | | 0.08 | | | 0.08 | |
| | | | | | | | | | | | | | | | | | | | | | | |
| For the Quarter Ended | January 31, 2020 | | April 30, 2020 | | July 31, 2020 | | October 31, 2020 |
| Net sales | $ | 196,597 | | | $ | 187,475 | | | $ | 212,096 | | | $ | 255,405 | |
| Cost of sales (excluding depreciation and amortization) | 157,427 | | | 149,732 | | | 162,427 | | | 189,164 | |
| Depreciation and amortization | 12,905 | | | 11,886 | | | 11,060 | | | 11,378 | |
| Operating income | 1,980 | | | 8,893 | | | 16,563 | | | 27,829 | |
| Net income | 10 | | | 5,501 | | | 10,833 | | | 22,152 | |
| Basic earnings per share | — | | | 0.17 | | | 0.33 | | | 0.68 | |
| Diluted earnings per share | — | | | 0.17 | | | 0.33 | | | 0.68 | |
| Cash dividends paid per common share | 0.08 | | | 0.08 | | | 0.08 | | | 0.08 | |
|
| | | | | | | | | | | | | | | |
| For the Quarter Ended | January 31, 2018 | | April 30, 2018 | | July 31, 2018 | | October 31, 2018 |
| Net sales | $ | 191,666 |
| | $ | 214,212 |
| | $ | 239,821 |
| | $ | 244,086 |
|
| Cost of sales (excluding depreciation and amortization) | 154,440 |
| | 168,741 |
| | 185,610 |
| | 187,776 |
|
| Depreciation and amortization | 13,273 |
| | 13,310 |
| | 12,691 |
| | 12,548 |
|
| Operating (loss) income | (489 | ) | | 8,136 |
| | 17,087 |
| | 11,641 |
|
| Net income | $ | 4,947 |
| | $ | 4,136 |
| | $ | 10,753 |
| | $ | 6,492 |
|
| Basic earnings per share | 0.14 |
| | 0.12 |
| | 0.31 |
| | 0.19 |
|
| Diluted earnings per share | 0.14 |
| | 0.12 |
| | 0.31 |
| | 0.19 |
|
| Cash dividends paid per common share | $ | 0.04 |
| | $ | 0.04 |
| | $ | 0.04 |
| | $ | 0.08 |
|
|
| | | | | | | | | | | | | | | |
| For the Quarter Ended | January 31, 2017 | | April 30, 2017 | | July 31, 2017 | | October 31, 2017 |
| Net sales | $ | 195,096 |
| | $ | 209,133 |
| | $ | 229,367 |
| | $ | 232,959 |
|
| Cost of sales (excluding depreciation and amortization) | 154,947 |
| | 162,132 |
| | 176,758 |
| | 178,325 |
|
| Depreciation and amortization | 15,406 |
| | 14,380 |
| | 13,915 |
| | 13,794 |
|
| Operating (loss) income | (3,841 | ) | | 4,625 |
| | 17,352 |
| | 16,231 |
|
| Net (loss) income | $ | (3,726 | ) | | $ | 1,462 |
| | $ | 10,215 |
| | $ | 10,732 |
|
| Basic (loss) earnings per share | (0.11 | ) | | 0.04 |
| | 0.30 |
| | 0.31 |
|
| Diluted (loss) earnings per share | (0.11 | ) | | 0.04 |
| | 0.29 |
| | 0.31 |
|
| Cash dividends paid per common share | $ | 0.04 |
| | $ | 0.04 |
| | $ | 0.04 |
| | $ | 0.04 |
|
QuarterlyQuarterly earnings (loss) per share results may not sum to the consolidated earnings per share results on the accompanying consolidated statements of income (loss) due to roundingrounding and changes in weighted average shares during the respective periods.
21.19. New Accounting Guidance
Accounting Standards Recently Adopted
In February 2018,June 2016, the Financial Accounting Standards Board (FASB) issued Accounting Standards Update (ASU) 2018-02, Income StatementNo. 2016-13, Financial Instruments - Reporting Comprehensive IncomeCredit Losses (Topic 220): Reclassification326). This ASU sets forth a “current expected credit loss” model, which requires the measurement of Certain Tax Effects from Accumulated Other Comprehensive Income. This amendment requires disclosure ofall expected credit losses for financial instruments or other assets (e.g., trade receivables), held at the accounting policy for releasing income tax effects from accumulated other comprehensive income. It also provides an option for entities to reclassify the income tax effects of the Tax Cutsreporting date based on historical experience, current conditions, and Jobs Act from accumulated other comprehensive income to retained earnings. We elected to early adopt this ASU effective November 1, 2017. We record income tax effects related to our unrecognized pension obligations in accumulated other comprehensive income as discussed in our Annual Report on Form 10-K for the year ended October 31, 2017. We have not elected to reclassify the income tax effects of the Tax Cuts and Jobs Act from accumulated other comprehensive income to retained earnings.
In March 2016, the FASB issued ASU 2016-09, Compensation - Stock Compensation (Topic 718): Improvements to Employee Share-Based Payment Accounting. This guidance prescribes the presentation of excess tax benefits or deficiencies derived from book and tax timing differences associated with stock-based compensation arrangements and certain related statement of cash flow implications. We adopted the provisions of ASU 2016-09 effective November 1, 2017, as noted below with no significant impact on our consolidated financial statements.
Excess tax benefits or deficiencies for share-based payments are to be recorded in the income tax provision, rather than as an adjustment to additional paid-in-capital. We made this change on a prospective basis;
Cash flows related to excess tax benefits or deficiencies are included in net cash provided by operating activities rather than as a financing activity.reasonable supportable forecasts. We adopted this change retrospectively, which resulted in an increase to net cash provided by operating activities and a corresponding decrease to net cash provided by financing activities of $0.2 million and $0.1 million for the years ended October 31, 2017 and 2016, respectively;
QUANEX BUILDING PRODUCTS CORPORATION
NOTES TO CONSOLIDATED FINANCIAL STATEMENTS (continued)
Cash paid to taxing authorities when withholding shares from an employee’s vesting or exercise of equity-based compensation awards for tax-withholding purposes is to be classified as net cash used in financing activities rather than as an operating activity. We adopted this change retrospectively, which resulted in an increase to net cash provided by operating activities and a corresponding decrease to net cash provided by financing activities of $1.0 million and $0.8 million for the years ended October 31, 2017 and 2016, respectively;
We elected to continue to withhold shares associated with stock-based compensation vesting or exercises to satisfy the minimum statutory tax withholding requirements, rather than electing to withhold at a higher rate; and
We elected to continue to estimate forfeitures rather than account for forfeitures as they occur.
In February 2016, the FASB issued ASU No. 2016-02, Leases (Topic 842): Amendments to the Accounting Standards Codification. These amendments replace current guidance and require the recognition of lease assets and lease liabilities by lessees for those leases classified as operating leases under previous U.S. GAAP. The amendments apply to any entity that enters into leasing arrangements. This guidance becomes effective for fiscal years beginning after December 15, 2018, and, therefore, we will adopt this pronouncement in fiscal 2020. We are currently evaluating the impact of this pronouncementamendment on our consolidated financial statements.
In July 2015, the FASB issued ASU No. 2015-11, Inventory (Topic 330): Simplifying the Measurement of Inventory. This amendment simplifies the subsequent measurement of inventories by replacing the lower of cost or market revaluation method with the lower of cost and net realizable value test. This guidance is applicable to all inventories measured using methods other than last-in first-out method and the retail inventory method. We adopted the provisions of ASU 2016-09 effective November 1, 2017,2020, with no material impact on our condensed consolidated financial statements.statements as pre-existing processes for estimating credit losses for trade receivables aligned with the expected credit loss model.
In May 2014, the FASB issued ASU No. 2014-09, Revenue from Contracts with Customers, which supersedes and replaces existing revenue recognition guidance, including industry specific guidance. This guidance prescribes a principles-based approach to revenue recognition under which revenue is recognized as goods and services are transferred to the customer in the amount the entity expects to be entitled to in exchange for those goods or services. In addition, this guidance requires additional disclosures regarding the nature, amount, timing and uncertainty
As of October 31, 2018, we have completed the evaluation of our revenue streams and have reviewed samples of customer contracts that we believe fairly represent contract traits that could be accounted for differently under amended guidance. We have evaluated the potential impact of the new revenue standard on each of the selected contracts including: (i) estimating the contract consideration under the new standard, (ii) identifying the performance obligations within the customer contracts, (iii) calculating the anticipated allocation of contract consideration to each performance obligation, (iv) determining the timing of revenue recognition for each performance obligation, and (v) determining the classification of the contract revenue for disclosure purposes. Based on the contract reviews and evaluations performed to date, we do not anticipate any material impacts from implementing the amended guidance.
Item 9. Changes in and Disagreements with Accountants on Accounting and Financial Disclosure.
None.
Item 9A. Controls and Procedures.
Evaluation of Disclosure Controls and Procedures
Under the supervision and with the participation of our management, including the Chief Executive Officer and Chief Financial Officer, we have evaluated the effectiveness of our disclosure controls and procedures pursuant to RulesRule 13a-15(e) under the Securities Exchange Act of 1934 (1934 Act) as of October 31, 2018.2021. Based on that evaluation, the Chief Executive Officer and Chief Financial Officer concluded that, as of October 31, 2018,2021, the disclosure controls and procedures are effective.
Management’s Annual Report on Internal Control over Financial Reporting
Refer to Management’s Annual Report on Internal Control over Financial Reporting located in "“Part 2, Item 8. Financial Information"Information” of this Annual Report on Form 10-K.
Auditor's Report Relating to Effectiveness of Internal Control over Financial Reporting
Refer to the Report of Independent Registered Public Accounting Firm located in "“Part 2, Item 8. Financial Information"Information” in this Annual Report on Form 10-K.
Changes in Internal Control over Financial Reporting
There have been no changes in internal controls over financial reporting (as defined in Rules 13a-15(f) and 15d-15(f) under the 1934 Act) during the most recent fiscal quarter that have materially affected or are reasonably likely to materially affect our internal control over financial reporting.
Item 9B. Other Information.
None.
PART III
Item 10. Directors, Executive Officers and Corporate Governance.
Pursuant to General Instruction G(3) to Form 10-K, the information on "“Directors, Executive Officers and Corporate Governance"Governance” is incorporated herein by reference from the Registrant's Definitive Proxy Statement relating to the 20192022 Annual Meeting of Stockholders of Quanex Building Products Corporation or an amendment to this Form 10-K, which is to be filed with the SEC pursuant to Regulation 14A under the Securities Exchange Act of 1934, as amended, within 120 days after the close of the fiscal year ended October 31, 2018.2021.
Item 11. Executive Compensation.
Pursuant to General Instruction G(3) to Form 10-K, the information on "“Executive Compensation"Compensation” is incorporated herein by reference from the Registrant's Definitive Proxy Statement relating to the 20192022 Annual Meeting of Stockholders of Quanex Building Products Corporation or an amendment to this Form 10-K, which is to be filed with the SEC pursuant to Regulation 14A under the Securities Exchange Act of 1934, as amended, within 120 days after the close of the fiscal year ended October 31, 2018.2021.
Item 12. Security Ownership of Certain Beneficial Owners and Management and Related Stockholder Matters.
Pursuant to General Instruction G(3) to Form 10-K, the information on "“Security Ownership of Certain Beneficial Owners and Management and Related Stockholder Matters"Matters” is incorporated herein by reference from the Registrant's Definitive Proxy Statement relating to the 20192022 Annual Meeting of Stockholders of Quanex Building Products Corporation or an amendment to this Form 10-K, which is to be filed with the SEC pursuant to Regulation 14A under the Securities Exchange Act of 1934, as amended, within 120 days after the close of the fiscal year ended October 31, 2018.2021.
Item 13. Certain Relationships and Related Transactions, and Director Independence.
Pursuant to General Instruction G(3) to Form 10-K, the information on "“Certain Relationships and Related Transactions, and Director Independence"Independence” is incorporated herein by reference from the Registrant's Definitive Proxy Statement relating to the 20192022 Annual Meeting of Stockholders of Quanex Building Products Corporation or an amendment to this Form 10-K, which is to be filed with the SEC pursuant to Regulation 14A under the Securities Exchange Act of 1934, as amended, within 120 days after the close of the fiscal year ended October 31, 2018.2021.
Item 14. Principal Accountant Fees and Services.
Pursuant to General Instruction G(3) to Form 10-K, the information on "“Principal Accountant Fees and Services"Services” is incorporated herein by reference from the Registrant's Definitive Proxy Statement relating to the 20192022 Annual Meeting of Stockholders of Quanex Building Products Corporation or an amendment to this Form 10-K, which is to be filed with the SEC pursuant to Regulation 14A under the Securities Exchange Act of 1934, as amended, within 120 days after the close of the fiscal year ended October 31, 2018.2021.
PART IV
Item 15. Exhibits and Financial Statement Schedules.
1. Financial Statements
The financial statements included in this report are listed in the Index to Financial Statements located elsewhere in this Annual Report on Form 10-K.
2. Financial Statement Schedules
Schedules for which provision is made in the applicable accounting regulations of the SEC are either not required under the related instructions or inapplicable.
3. Exhibits
The exhibits required to be filed pursuant to Item 15(b) of Form 10-K are listed in the Exhibit Index filed herewith, which Exhibit Index is incorporated herein by reference.ExhibitsCertain of our exhibits as denoted with a † between exhibits 10.1 through 10.4810.39 listed in the Exhibit Index filed herewith, are management or compensatory plans or arrangements required to be filed as exhibits to this Annual Report on Form 10-K pursuant to Item 15(b) thereof.
SIGNATURES
Pursuant to the requirements of Section 13 or 15(d) of the Securities Exchange Act of 1934, the Registrant has duly caused this report to be signed on its behalf by the undersigned thereunto duly authorized.
| | | | | | | | | | | |
| | | QUANEX BUILDING PRODUCTS CORPORATION |
| | | |
| Date: | December 17, 2021 | | QUANEX BUILDING PRODUCTS CORPORATION/s/ Scott M. Zuehlke |
| | | Scott M. Zuehlke |
Date: | December 11, 2018 | | /s/ Brent L. Korb |
| | | Brent L. Korb |
| | | Senior Vice President – Finance and- Chief Financial Officer and Treasurer
(Principal Financial Officer) |
Pursuant to the requirements of the Securities Exchange Act of 1934, this report has been signed below by the following persons on behalf of the Registrant and in the capacities and on the dates indicated.
| | | | | | | | | | | | | | |
| Name | | Title | | Date |
| | | | |
| /s/ William C. Griffiths | | Chairman of the Board | | December 17, 2021 |
| William C. Griffiths | | | | |
| | | | |
Name/s/ Susan F. Davis | | TitleDirector | | DateDecember 17, 2021 |
| Susan F. Davis | | | | |
| | | | |
| /s/ Joseph D. Rupp | | Director | | December 17, 2021 |
| Joseph D. Rupp | | | | |
| | | | |
| /s/ Curtis M. Stevens | | Director | | December 17, 2021 |
| Curtis M. Stevens | | | | |
| | | | |
| /s/ Donald R. Maier | | Director | | December 17, 2021 |
| Donald R. Maier | | | | |
| | | | |
| /s/ Meredith W. Mendes | | Director | | December 17, 2021 |
| Meredith W. Mendes | | | | |
| | | | |
/s/ William C. GriffithsE. Waltz | | Chairman of the Board,Director | | December 11, 201817, 2021 |
William C. GriffithsE. Waltz | | | | |
| | | | |
| /s/ Jason D. Lippert | | Director | | December 17, 2021 |
| Jason D. Lippert | | | | |
| | | | |
| /s/ George L. Wilson | | President and Chief Executive Officer | | December 17, 2021 |
| George L. Wilson | | (Principal Executive Officer) | | |
/s/ Susan F. Davis | | Director | | December 11, 2018 |
Susan F. Davis | | | | |
| | | | |
/s/ LeRoy D. NosbaumScott M. Zuehlke | | Director | | December 11, 2018 |
LeRoy D. Nosbaum | | | | |
| | | | |
/s/ Joseph D. Rupp | | Director | | December 11, 2018 |
Joseph D. Rupp | | | | |
| | | | |
/s/ Curtis M. Stevens | | Director | | December 11, 2018 |
Curtis M. Stevens | | | | |
| | | | |
/s/ Robert R. Buck | | Director | | December 11, 2018 |
Robert R. Buck | | | | |
| | | | |
/s/ Brent L. Korb | | Senior Vice President—Finance andPresident - Chief Financial Officer and Treasurer | | December 11, 201817, 2021 |
Brent L. KorbScott M. Zuehlke | | (Principal Financial Officer) | | |
| | | | |
| /s/ Mark A. Livingston | | Vice President, Chief Accounting Officer and Controller | | December 17, 2021 |
| Mark A. Livingston | | (Principal Accounting Officer) | | |
EXHIBIT INDEX
Exhibit Number Description of Exhibits
|
| | | | | | | |
| | |
| |
| | Agreement and Plan of Merger, dated as of January 31, 2011, by and among Quanex Building Products Corporation, QSB Inc., Lauren Holdco Inc., Lauren International, Inc. and Kevin E. Gray, as agent for the shareholders of Lauren Holdco Inc., filed as Exhibit 2.1 of the Registrant’s Current Report on Form 8-K (Reg. No. 001-33913) as filed with the Securities and Exchange Commission on February 2, 2011, and incorporated herein by reference. |
| | |
| | |
| | |
| | |
| | |
| | |
| |
| | Agreement and Plan of Merger, dated as of August 30, 2015, by and among Quanex Building Products Corporation, QWMS, Inc., WII Holding, Inc., and Olympus Growth Fund IV, L.P, solely in its capacity as the representative of the stockholders of WII Holding, Inc, filed as Exhibit 2.1 to the Registrant's Current Report on Form 8-K (Reg. No. 001-33913), as filed with the Securities and Exchange Commission on August 30, 2015, and incorporated herein by reference. |
| | |
| | |
| |
| | |
| | |
| | |
| | |
| | |
| | |
| | |
| | |
| | |
| | |
| | |
| | |
| | |
| | |
| | |
| | |
EXHIBIT INDEX
Exhibit Number Description of Exhibits
EXHIBIT INDEX
Exhibit Number Description of Exhibits
EXHIBIT INDEX
Exhibit Number Description of Exhibits
EXHIBIT INDEX
Exhibit Number Description of Exhibits
|
| | |
| | |
| | |
| | |
| | |
| | |
| | |
| | |
| | |
| | |
| | |
| | |
| | |
| | Agreement between Quanex Building Products Corporation and Scott Zuehlke, effective January 25, 2016,November 1, 2019, filed as Exhibit 10.1 to the Registrant’s Current Report on Form 8-K (Reg. No. 001-33913), as filed with the Securities and Exchange Commission on January 27, 2016,November 1, 2019, and incorporated herein by reference. |
| | |
| | |
| | |
| | |
| | |
| | |
| | |
| | |
| | |
| | |
| | |
| | |
| | |
| | |
| | |
EXHIBIT INDEX
Exhibit Number Description of Exhibits
EXHIBIT INDEX
Exhibit Number Description of Exhibits
| | | | | | | | |
| | |
| | |
| |
|
| | |
| |
|
| | |
| |
|
| | |
| |
|
| | |
| | |
| | |
| | |
| | |
| | |
| | |
| | |
| | |
| | |
| | |
| | |
| |
| | |
| |
| *101.INS | | XBRL Instance Document - the instance document does not appear in the Interactive Data File because its XBRL tags are embedded within the Inline XBRL document. |
| |
| *101.SCH | | XBRL Taxonomy Extension Schema Document |
| |
| *101.CAL | | XBRL Taxonomy Extension Calculation Linkbase Document |
| |
| *101.DEF | | XBRL Taxonomy Extension Definition Linkbase Document |
| |
| *101.LAB | | XBRL Taxonomy Extension Label Linkbase Document |
| |
| *101.PRE | | XBRL Taxonomy Extension Presentation Linkbase Document |
* Filed herewith
† Management Compensation or Incentive Plan
As permitted by Item 601(b)(4)(iii)(A) of Regulation S-K, the Registrant has not filed with this Annual Report on Form 10-K certain instruments defining the rights of holders of long-term debt of the Registrant and its subsidiaries because the total amount of securities authorized under any of such instruments does not exceed 10% of the total assets of the Registrant and its
EXHIBIT INDEX
Exhibit Number Description of Exhibits
subsidiaries on a consolidated basis. The Registrant agrees to furnish a copy of any such agreements to the Securities and Exchange Commission upon request.