UNITED STATES SECURITIES AND EXCHANGE COMMISSION | Annual report pursuant to Section 13 or 15(d) of The Securities Exchange Act of 1934 For the fiscal year ended December 31, 20112012 |
Commission file No. 1-8491 (Exact name of registrant as specified in its charter)
| 77–0664171 |
(State or other jurisdiction of incorporation or organization) | |
| | |
6500 N. Mineral Drive, Suite 200 | 83815-9408 |
| (Address of principal executive offices) | (Zip Code) |
(Registrant’s telephone number, including area code)
Securities registered pursuant to Section 12(b) of the Act:
| | |
| Common Stock, par value $0.25 per share | | New York Stock Exchange |
Series B Cumulative Convertible Preferred Stock, par value $0.25 per share | | New York Stock Exchange |
Securities registered pursuant to Section 12(g) of the Act: None
Indicate by check mark if the registrant is a well-known seasoned issuer, as defined in Rule 405 of the Securities Act. Yes ü No
Indicate by check mark if the registrant is not required to file reports pursuant to Section 13 or Section 15(d) of the Act. Yes No ü
Indicate by check mark whether the registrant (1) has filed all reports required to be filed by Section 13 or 15(d) of the Securities Exchange Act of 1934 during the preceding 12 months, and (2) has been subject to such filing requirements for the past 90 days. Yes ü No
Indicate by check mark whether the registrant has submitted electronically and posted on its corporate Web site, if any, every Interactive Data File required to be submitted and posted pursuant to Rule 405 of Regulation S-T (§ 232.405 of this chapter) during the preceding 12 months (or for such shorter period that the registrant was required to submit and post such files). Yes ü No Indicate by check mark if disclosure of delinquent filers pursuant to Item 405 of Regulation S-K is not contained herein, and will not be contained, to the best of registrant’s knowledge, in definitive proxy or information statements incorporated by reference in Part III of this Form 10-K or any amendment to this Form 10-K. o Indicate by check mark whether the registrant is a large accelerated filer, an accelerated filer, a non-accelerated filer, or a smaller reporting company. See the definitions of “large accelerated filer,” “accelerated filer” and “smaller reporting company” in Rule 12b-2 of the Exchange Act. (Check one): | Large Accelerated Filer ý Accelerated Filer o | | Accelerated Filer o |
| Non-Accelerated Filer o | | Smaller reporting company o |
Non-Accelerated Filer o Smaller reporting company o(Do not check if a smaller reporting company) Indicate by check mark whether the registrant is a shell company (as defined in Rule 12b-2 of the Act). Yes o No ý The aggregate market value of the registrant’s voting Common Stock held by non-affiliates was $2,139,690,446$1,349,610,385 as of June 30, 20112012 There were 279,512,363285,546,859 shares of the registrant’s Common Stock outstanding as of June 30, 2011,2012, and 285,291,773285,193,224 shares as of February 17, 2012. 21, 2013. Documents incorporated by reference herein: To the extent herein specifically referenced in Part III, the information contained in the Proxy Statement for the 20112013 Annual Meeting of Shareholders of the registrant, which will be filed with the Commission pursuant to Regulation 14A within 120 days of the end of the registrant’s 20112012 fiscal year is incorporated herein by reference. See Part III.
Special Note on Forward-Looking Statements | 1 |
| 1 |
| 1 |
| 1 |
| 4 |
| 5 |
| 5 |
| Item 1A. Risk Factors | 6 |
| 6 |
Item 1B. Unresolved Staff Comments | 19 |
Item 2. Property Descriptions | 19 |
| 19 |
| 2223 |
Item 3. Legal Proceedings | 26 |
Item 4. Mine Safety Disclosures | 26 |
| 26 |
Item 5. Market for Registrant’s Common Equity, Related Stockholder Matters and Issuer Purchases of Equity Securities | 26 |
Item 6. Selected Financial Data | 2830 |
Item 7. Management’s Discussion and Analysis of Financial Condition and Results of Operations | 3032 |
| 3032 |
| 3334 |
| 3536 |
| 37 |
| 39 |
| 41 |
| Reconciliation of Total Cash Costs (non-GAAP) to Cost of Sales and Other Direct Production Costs and Depreciation, Depletion and Amortization (GAAP) | 4142 |
Financial Liquidity and Capital Resources | 4344 |
Contractual Obligations and Contingent Liabilities and Commitments | 46 |
Off-Balance Sheet Arrangements | 47 |
Critical Accounting Estimates | 47 |
New Accounting Pronouncements | 49 |
Forward-Looking Statements | 49 |
Item 7A. Quantitative and Qualitative Disclosures About Market Risk | 49 |
| Commodity-Price Risk Management | 50 |
Commodity-Price Risk Management | 50 |
| 51 |
Item 8. Financial Statements and Supplementary Data | 51 |
Item 9. Changes in and Disagreements with Accountants on Accounting and Financial Disclosures | 51 |
Item 9A. Controls and Procedures | 51 |
Disclosure Controls and Procedures | 5251 |
Management’s Annual Report on Internal Control over Financial Reporting | 52 |
Attestation Report of Independent Registered Public Accounting Firm | 53 |
Item 9B. Other Information | 54 |
| 54 |
Item 10. Directors, Executive Officers and Corporate Governance | 54 |
Item 11. Executive Compensation | 56 |
Item 12. Security Ownership of Certain Beneficial Owners and Management and Related Stockholder Matters | 56 |
Item 13. Certain Relationships and Related Transactions and Director Independence | 56 |
Item 14. Principal Accounting Fees and Services | 56 |
| PART IV | 57 |
| 58 |
Item 15. Exhibits, Financial Statement Schedules | 57 |
| Signatures | 58 |
| 59 |
Index to Consolidated Financial Statements | F- 1F-1 |
| F-40 |
Special Note on Forward-Looking Statements Certain statements contained in this report (including information incorporated by reference) are “forward-looking statements” and are intended to be covered by the safe harbor provided for under Section 27A of the Securities Act of 1933, as amended, and Section 21E of the Securities Exchange Act of 1934, as amended. Our forward-looking statements include our current expectations and projections about future production, results, performance, prospects and opportunities, including reserves and other mineralization. We have tried to identify these forward-looking statements by using words such as “may,” “might,” “will,” “expect,” “anticipate,” “believe,” “could,” “intend,” “plan,” “estimate” and similar expressions. These forward-looking statements are based on information currently available to us and are expressed in good faith and believed to have a reasonable basis. However, our forward-looking statements are subject to a number of risks, uncertainties and other factors that could cause our actual production, results, performance, prospects or opportunities, including reserves and mineralization, to differ materially from those expressed in, or implied by, these forward-looking statements. These risks, uncertainties and other factors include, but are not limited to, those set forth under Item 1A. Risk Factors.Factors and Part II, Item 7, Management's Discussion and Analysis of Financial Condition and Results of Operations. Given these risks and uncertainties, readers are cautioned not to place undue reliance on our forward-looking statements. Projections and other forward-looking statements included in this Form 10-K have been prepared based on assumptions, which we believe to be reasonable, but not in accordance with United States generally accepted accounting principles (“GAAP”) or any guidelines of the Securities and Exchange Commission (“SEC”). Actual results may vary, perhaps materially. You are strongly cautioned not to place undue reliance on such projections and other forward-looking statements. All subsequent written and oral forward-looking statements attributable to Hecla Mining Company or to persons acting on our behalf are expressly qualified in their entirety by these cautionary statements. Except as required by federal securities laws, we disclaim any intention or obligation to update or revise any forward-looking statements, whether as a result of new information, future events or otherwise.
For information regarding the organization of our business segments and our significant customers, see Note 11 of Notes to Consolidated Financial Statements. Information set forth in Items 1A, 1B and 2 are incorporated by reference into this Item 1.
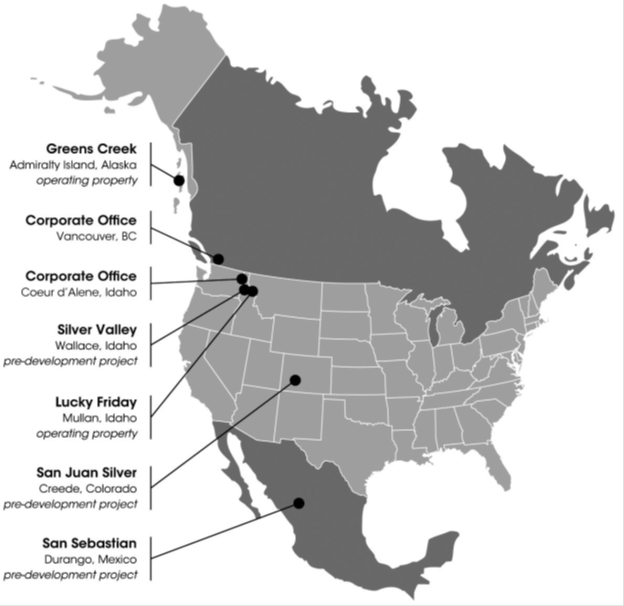
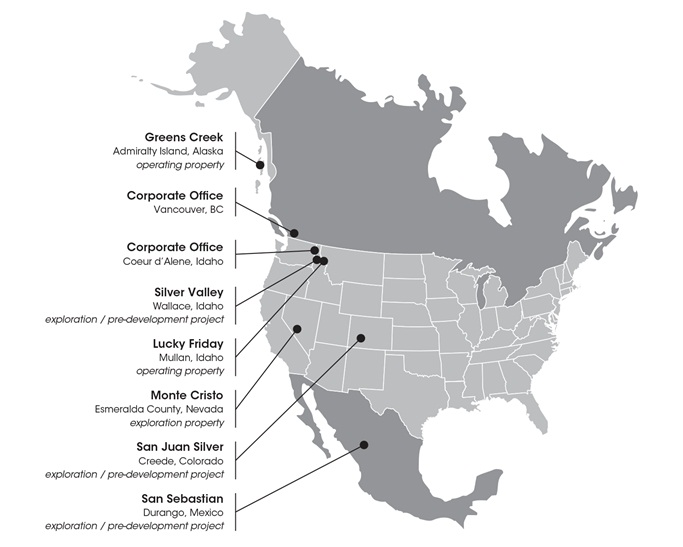
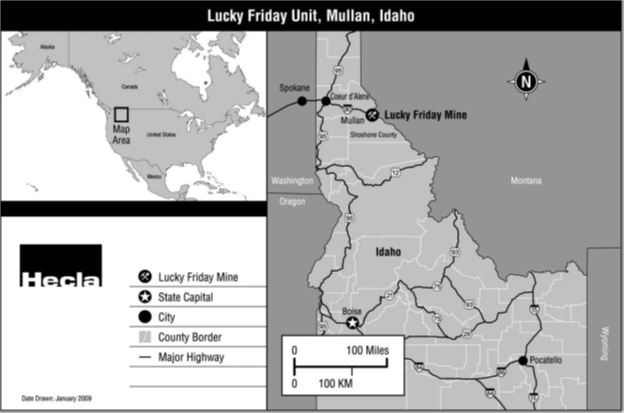
Hecla Mining Company and itsour subsidiaries have provided precious and base metals to the U.S. economy and worldwide since incorporation in 1891 (in this report, “we” or “our” or “us” refers to Hecla Mining Company and our affiliates and subsidiaries). We discover, acquire, develop, produce and market silver, gold, lead and zinc. In doing so, we intend to manage our business activities in a safe, environmentally responsible and cost-effective manner. We produce lead, zinc and bulk concentrates, which we sell to custom smelters, and unrefined gold and silver bullion bars (doré(doré), which may be sold as dorédoré or further refined before sale to precious metals traders. We are organized and managed into two segments that encompass our operating units: the Greens Creek and Lucky Friday units. The map below shows the locations of our operating units and our exploration and pre-development projects, as well as our corporate offices located in Coeur d’Alene,Idaho and Vancouver, British Columbia.
Our current business strategy is to focus our financial and human resources in the following areas: Operating our properties safely, in an environmentally responsible manner, and cost-effectively.
Resuming production and construction of the #4 Shaft project atReturning our Lucky Friday unitmine to full production during 2013. Limited production recommenced at Lucky Friday in lightthe first quarter of 2013 after the halt to most operations at the mine in January 2012. The halttemporary suspension of operations occurred because of an order from the Federal Mine Safety and Health Administration ("MSHA") closing the mine until we remove loose material from the Silver Shaft. In response, we submitted a plan to MSHA and received approval to remove loose cementitious material, along with additional work which should improve the shaft's functionality and possibly improve the shaft's hoisting capacity. In addition to the Silver Shaft work, we also have plans to build a new haulage way to bypass an area damaged by a rock burst in December 2011. We anticipate that production will be suspended at Lucky Friday until early 2013 as that work is completed. Construction ofincrease to full production levels by approximately mid-2013 (see the #4 Shaft, an internal shaft that will provide deeper access at Lucky Friday, will also be temporarily suspended as work on the Silver Shaft is completed. See Item 7. Management’s Discussion and Analysis of Financial Condition and Results of Operations – The Lucky Friday Segment section below for more information.information);
Overcoming the challenges which have arisen at our Lucky Friday unit over the course of 2011 and into 2012. In addition to receiving an order from MSHA closing the Silver Shaft at the Lucky Friday mine (and thus the mine) until the loose material is removed, a number of accidents and other events during the past year have resulted in temporary suspensions of operations at the Lucky Friday. In April 2011, a fall of ground caused the fatality of one employee, resulting in cessation of operations for approximately 10 days. In November 2011, an accident occurring as part of the construction of #4 Shaft resulted in the fatality of one contractor employee. In an unrelated incident, in December 2011, a rock burst occurred in a primary access way at the Lucky Friday and injured seven employees, with no fatalities as a result of that incident. These events and the current halt to most operations at the Lucky Friday are a challenge to us that we will seek to overcome in 2012. See Part II,Item 7. Management’s Discussion and Analysis of Financial Condition and Results of Operations – The Lucky Friday Segment for more information.
Expanding our proven and probable reserves and production capacity at our operating properties.
Maintaining and investing in exploration projects in the vicinities of four mining districts we believe to be under-explored and under-developed: North Idaho’s Silver Valley in the historic Coeur d’Alene Mining District; our Greens Creek unit on Alaska’s Admiralty Island located near Juneau; the silver producing district near Durango, Mexico; and the Creede district of Southwestern Colorado.
Continuing to seek opportunities to acquire and invest in other mining properties and companies. Examples include our acquisition of the Monte Cristo property in Nevada and investments in Dolly Varden Silver Corporation and Canamex Resources Corp. in 2012.
Resolving alleged environmental liabilities on acceptable terms.
Below is a summary of net income (loss) for each of the last five years (in thousands): | | | Year Ended December 31, | |
| | | 2011 | | | 2010 | | | 2009 | | | 2008 | | 2007 | |
| Net income (loss) | | $ | 151,164 | | | $ | 48,983 | | | $ | 67,826 | | | $ | (66,563 | ) | | $ | 53,197 | |
| | | | | | Year Ended December 31, | | | | |
| | | 2012 | | | 2011 | | | 2010 | | | 2009 | | | 2008 | |
| Net income (loss) | | $ | 14,954 | | | $ | 151,164 | | | $ | 48,983 | | | $ | 67,826 | | | $ | (66,563 | ) |
Our financial results over the last five years have been impacted by:
Fluctuations in prices of the metals we produce. The high and low daily closing market prices for silver, gold, lead and zinc for each of the last five years are as follows:
| | | 2011 | | | 2010 | | | 2009 | | | 2008 | | | 2007 | |
| Silver (per oz.): | | | | | | | | | | | | | | | |
| High | | $ | 48.70 | | | $ | 30.70 | | | $ | 19.18 | | | $ | 20.92 | | | $ | 15.82 | |
| Low | | $ | 26.16 | | | $ | 15.14 | | | $ | 10.51 | | | $ | 8.88 | | | $ | 11.67 | |
| Gold (per oz.): | | | | | | | | | | | | | | | | | | | | |
| High | | $ | 1,895.00 | | | $ | 1,421.00 | | | $ | 1,212.50 | | | $ | 1,011.25 | | | $ | 841.10 | |
| Low | | $ | 1,319.00 | | | $ | 1,058.00 | | | $ | 810.00 | | | $ | 712.50 | | | $ | 608.40 | |
| Lead (per lb.): | | | | | | | | | | | | | | | | | | | | |
| High | | $ | 1.33 | | | $ | 1.18 | | | $ | 1.11 | | | $ | 1.57 | | | $ | 1.81 | |
| Low | | $ | 0.81 | | | $ | 0.71 | | | $ | 0.45 | | | $ | 0.40 | | | $ | 0.71 | |
| Zinc (per lb.): | | | | | | | | | | | | | | | | | | | | |
| High | | $ | 1.15 | | | $ | 1.20 | | | $ | 1.17 | | | $ | 1.28 | | | $ | 1.93 | |
| Low | | $ | 0.79 | | | $ | 0.72 | | | $ | 0.48 | | | $ | 0.47 | | | $ | 1.00 | |
| | | 2012 | | | 2011 | | | 2010 | | | 2009 | | | 2008 | |
| Silver (per oz.): | | | | | | | | | | | | | | | |
| High | | $ | 37.23 | | | $ | 48.70 | | | $ | 30.70 | | | $ | 19.18 | | | $ | 20.92 | |
| Low | | $ | 26.67 | | | $ | 26.16 | | | $ | 15.14 | | | $ | 10.51 | | | $ | 8.88 | |
| Gold (per oz.): | | | | | | | | | | | | | | | | | | | | |
| High | | $ | 1,791.75 | | | $ | 1,895.00 | | | $ | 1,421.00 | | | $ | 1,212.50 | | | $ | 1,011.25 | |
| Low | | $ | 1,540.00 | | | $ | 1,319.00 | | | $ | 1,058.00 | | | $ | 810.00 | | | $ | 712.50 | |
| Lead (per lb.): | | | | | | | | | | | | | | | | | | | | |
| High | | $ | 1.06 | | | $ | 1.33 | | | $ | 1.18 | | | $ | 1.11 | | | $ | 1.57 | |
| Low | | $ | 0.79 | | | $ | 0.81 | | | $ | 0.71 | | | $ | 0.45 | | | $ | 0.40 | |
| Zinc (per lb.): | | | | | | | | | | | | | | | | | | | | |
| High | | $ | 0.99 | | | $ | 1.15 | | | $ | 1.20 | | | $ | 1.17 | | | $ | 1.28 | |
| Low | | $ | 0.80 | | | $ | 0.79 | | | $ | 0.72 | | | $ | 0.48 | | | $ | 0.47 | |
See Item 7. Management’s Discussion and Analysis of Financial Condition and Results of Operations – Results of Operations for a summary of average market and realized prices for each of the three years ended December 31, 2012, 2011 2010 and 2009.2010. Our results of operations are significantly impacted by fluctuations in the prices of silver, gold, lead and zinc, which are affected by numerous factors beyond our control. See Item 1A. Risk Factors – Financial Risks – A substantial or extended decline in metals prices would have a material adverse effect on us for information on a number of the various factors that can impact prices of the metals we produce. Hecla’s average realized prices for silver, lead, and zinc were lower in 2012 compared to 2011, while the average realized price for gold increased. Average realized prices for all four metals increased in 2011 compared to 2010, and our realized prices for silver and gold in 2011 were higher than average market prices for those metals in 2011, due in part to the timing of concentrate shipments and their final settlement in comparison to fluctuating prices. However, we2010. We believe that market metal price trends are a significant factor in our operating and financial performance. Because we are unable to predict fluctuations in prices for metals and have limited control over the timing of our concentrate shipments, there can be no assurance that our realized prices for silver and gold will exceed or even meet average market metals prices for any future period. In April 2010, we began utilizing financially-settled forward contracts for lead and zinc with the objective of managing the exposure to changes in prices of lead and zinc contained in our concentrate shipments between the time of sale and final settlement. See Note 10 of Notes to Consolidated Financial Statements for more information on our base metal forward contract programs. $25.3 million in suspension-related costs at our Lucky Friday unit, including $6.3 million in depreciation, depletion, and amortization in 2012. Production recommenced at the Lucky Friday in the first quarter of 2013. See The Lucky Friday Segment section for more information on the temporary suspension of production.
Exploration and pre-development expenditures totaling $49.7 million, $31.4 million, $21.6 million, $9.2 million and $22.5 million and $17.0 million, respectively, for the years ended December 31, 2012, 2011, 2010, 2009 and 2008, and 2007. The amount for 2007 includes expenditures of $2.2 million for the now-divested Hollister Development Block, as its development progressed until the sale of our interest in the project in April 2007.respectively. In addition, to the amounts above, we also incurred exploration expenditures of $1.2 million and $3.9 million, respectively, for the yearsyear ended December 31, 2008 and 2007 at our now divested Venezuelan operations. These amounts haveThis amount has been reported in income (loss) from discontinued operations for eachthat period.
Provision for closed operations and environmental matters of $4.7 million, $9.7 million, $201.1 million, $7.7 million $4.3 million and $49.2$4.3 million, respectively, for the years ended December 31, 2012, 2011, 2010, 2009, 2008, and 2007.2008. The $201.1 provision in 2010 included a $193.2 million adjustment to increase our accrued liability for environmental obligations in Idaho’s Coeur d’Alene Basin as a result of Hecla,our reaching an agreement with the United States, the Coeur d’Alene Indian Tribe, and the State of Idaho reaching an agreement on proposed financial terms to be incorporated into a comprehensive settlement of the Coeur d’Alene Basin environmental litigation and related claims. The settlement was finalized upon entry of the Consent Decree by the Court in September 2011. See Note 7 of Notes to Consolidated Financial Statements for further discussion.
Net gainloss on base metal forward contracts of $10.5 million in 2012, a net gain of $38.0 million in 2011, and a net loss of $20.8 million in 2010. These gains and losses are related to financially-settled forward contracts on forecasted zinc and lead production as part of a risk management program initiated in 2010. See Item 7A. Quantitative and Qualitative Disclosures About Market Risk - Commodity-Price Risk Management for more information on our derivatives contracts.
Variability in prices for diesel fuel and amounts of fuel used, and variability in prices for other consumables, which have impacted production costs at our operations. See Item 7. Management’s Discussion and Analysis of Financial Condition and Results of Operations – The Greens Creek Segment for information on the variability in diesel fuel prices and consumption on production costs for the last three years.
Our acquisition of the remaining 70.3% of the Greens Creek mine for $758.5 million in April 2008, a portion of which was funded by a $140$140.0 million term loan and $220$220.0 million bridge loan. We recorded interest expense related to these credit facilities, including amortization of loan fees and interest rate swap adjustments, of $10.1 million and $19.1 million, respectively in 2009 and 2008. The amount of interest expense in 2009 is net of $1.9 million in capitalized interest. We also recorded approximately $6.0 million in expense in 2009 for additional debt-related fees. We completed repayment of the bridge loan balance in February 2009 and repayment of the term loan balance in October 2009.
The global financial crisis and recession beginning in 2008, which impacted metals prices, production costs, and our access to capital markets at that time.
An increase in the number of shares of our common stock outstanding, which impacts our income per common share.
LossesLoss from discontinued operations, net of tax, for the yearsyear ended December 31, 2008 and 2007 of $17.4 million, and $15.0 million, respectively, and a loss on sale of discontinued operations, net of tax, of $12.0 million recognized in 2008.
A comprehensive discussion of our financial results for the years ended December 31, 2012, 2011 2010 and 2009,2010, individual operating unit performance, general corporate expenses and other significant items can be found in Item 7. — Management’s Discussion and Analysis of Consolidated Financial Condition and Results of Operations, as well as the Consolidated Financial Statements and Notes thereto.
Our segments are differentiated by geographic region. We produce zinc, lead and bulk concentrates at our Greens Creek unit and lead and zinc concentrates at our Lucky Friday unit, which we sell to custom smelters on contract, and unrefined gold and silver bullion bars (doré(doré) at Greens Creek, which are sold directly to customers or further refined before sale to precious metals traders. The concentrates produced at our Greens Creek and Lucky Friday units contain payable silver, zinc and lead, and the concentrates produced at Greens Creek also contain payable gold. Payable metals are those included in our products that can be recovered and sold by smelters and refiners. Our segments as of December 31, 20112012 included:
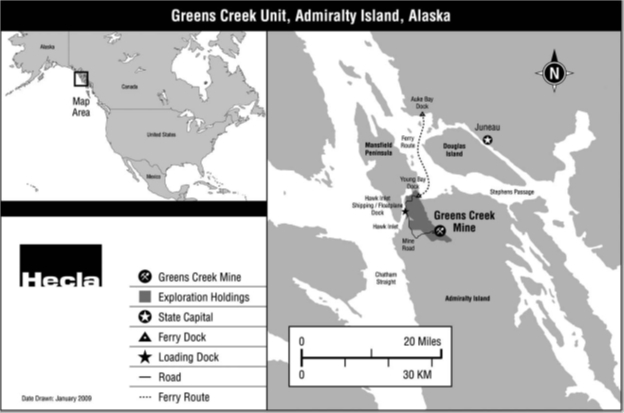
The Greens Creek unit, a joint venture arrangement which ishas been 100%-owned by us through our subsidiaries Hecla Alaska LLC, Hecla Greens Creek Mining Company and Hecla Juneau Mining Company. Wesince April of 2008 when we acquired the outstanding 70.3% of our ownership of Greens Creek in April 2008 from indirect subsidiaries of Rio Tinto, plc. Greens Creek is located on Admiralty Island, near Juneau, Alaska, and has been in production since 1989, with a temporary care and maintenance period from April 1993 through July 1996. During 2011,2012, Greens Creek contributed $342.9$320.9 million, or 72%100%, of our consolidated sales.
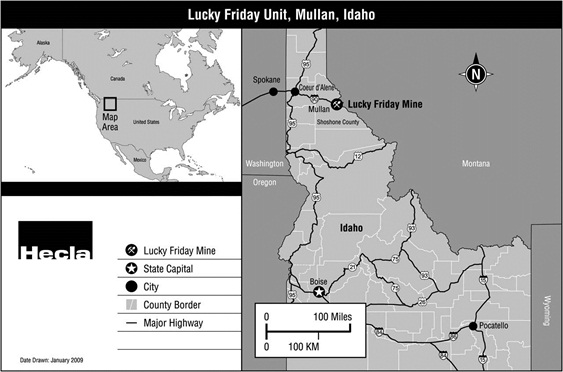
The Lucky Friday unit located in northern Idaho. Lucky Friday is through our subsidiaries Hecla Limited and Silver Hunter Mining Company, 100%-owned and has been a producing mine for us since 1958. During 2011,Production at the Lucky Friday contributed $134.7 million, or 28%,unit was suspended during 2012 as a result of our consolidated sales. Mining at Lucky Friday is currently halted and expected to resume in 2013. In the meantime, it has beenmine being placed on temporary care and maintenance.maintenance (see Item 2. Property DeScription, Operating Properties, The Lucky Friday Unit). Limited production recommenced in the first quarter of 2013, and we expect full production to resume in approximately mid-2013.
The table below summarizes our production for the years ended December 31, 2012, 2011 2010 and 2009.2010. Zinc and lead production quantities are presented in short tons (“tons”).
| | | Year | | | Year | |
| | | 2011 | | | 2010 | | | 2009 | | | 2012 | | | 2011 | | | 2010 | |
| Silver (ounces) | | | 9,483,676 | | | | 10,566,352 | | | | 10,989,660 | | | | 6,394,235 | | | | 9,483,676 | | | | 10,566,352 | |
| Gold (ounces) | | | 56,818 | | | | 68,838 | | | | 67,278 | | | | 55,496 | | | | 56,818 | | | | 68,838 | |
| Lead (tons) | | | 39,150 | | | | 46,955 | | | | 44,263 | | | | 21,074 | | | | 39,150 | | | | 46,955 | |
| Zinc (tons) | | | 73,355 | | | | 83,782 | | | | 80,995 | | | | 64,249 | | | | 73,355 | | | | 83,782 | |
Licenses, Permits and Concessions We are required to obtain various licenses and permits to operate our mines and conduct exploration and reclamation activities. The current haltsuspension in production at the Lucky Friday unit isduring 2012 was pursuant to an order from one of these regulatory authorities, the Federal Mine Safety and Health Administration. See Item 1A. Risk Factors - Legal, Market and Regulatory Risks - We are required to obtain governmental and lessor approvals and permits in order to conduct mining operations. In addition, we conduct our exploration activities in Mexico pursuant to concessions granted by the Mexican government, which are subject to certain political risks associated with foreign operations. See Item 1A. Risk Factors - Operation, Development, Exploration and Acquisition Risks - Our foreign activities are subject to additional inherent risks.
Physical Assets
Our business is capital intensive and requires ongoing capital investment for the replacement, modernization or expansion of equipment and facilities.facilities and to develop new ore reserves. At December 31, 2011,2012, the book value of our property, plant, equipment and mineral interests, net of accumulated depreciation, was approximately $923.2$996.7 million . We maintain insurance policies against property loss and business interruption. However, such insurance contains exclusions and limitations on coverage, and there can be no assurance that claims would be paid under such insurance policies in connection with a particular event. See Item 1A. Risk Factors - Operation, Development, Exploration and Acquisition Risks - Our operations may be adversely affected by risks and hazards associated with the mining industry that may not be fully covered by insurance. Employees
As of December 31, 2011,2012, we employed 735 people, and we believe relations with our employees are generally good.
Many of the employees at our Lucky Friday unit are represented by a union. The current collective bargaining agreement with workers at our Lucky Friday unit which was signed in 2010, expires on April 30, 2016. As a result of the requirement to remove any loosebuilt-up cementitious material from the Silver Shaft, which will limit underground access was limited and production temporarily suspend productionsuspended at the Lucky Friday, forcing Hecla Limited laidto lay off 121 employees in January 2012 with approximately(approximately 25 of those employees acceptingaccepted temporary positions at other Hecla operations. We anticipate that employmentoperations). Employment at the Lucky Friday will returnhas returned to roughly its level prior to the suspension of production, as the Silver Shaft work is completed.complete. See Part II, Item 7. Management's Discussion and Analysis of Financial Condition and Results of Operations - The Lucky Friday Segment section for more information.
In March 2012, Hecla Limited received notice of a complaint filed against it by the United Steel Workers, Local 5114, with the Federal Mine Safety Health Review Commission for compensation for bargaining unit workers at the Lucky Friday mine who were idled as a result of the previously-announced, temporary suspension of production at the mine (see the Other Contingencies section of Note 7 of Notes to Consolidated Financial Statements for more information). Available Information
Hecla Mining Company is a Delaware corporation. Our current holding company structure dates from the incorporation of Hecla Mining Company in 2006 and the renaming of itsour subsidiary (previously Hecla Mining Company) as Hecla Limited. Our principal executive offices are located at 6500 N. Mineral Drive, Suite 200, Coeur d’Alene, Idaho 83815-9408. Our telephone number is (208) 769-4100. Our web site address is www.hecla-mining.com. We file our annual, quarterly and current reports and any amendments to these reports with the SEC, copies of which are available on our website or from the SEC free of charge (www.sec.gov or 800-SEC-0330 or the SEC’s Public Reference Room, 100 F Street, N.E., Washington, D.C. 20549). Charters of our audit, compensation, corporate governance, and directors’ nominating committees, as well as our Code of Ethics for the Chief Executive Officer and Senior Financial Officers and our Code of Business Conduct and Ethics for Directors, Officers and Employees, are also available on our website. We will provide copies of these materials to shareholders upon request using the above-listed contact information, directed to the attention of Investor Relations, or via e-mail request sent to info@hecla-mining.com. We have included the Chief Executive Officer (CEO) and Chief Financial Officer (CFO) certifications regarding our public disclosure required by Section 302 of the Sarbanes-Oxley Act of 2002 as Exhibits 31.1 and 31.2 to this report. Additionally, we filed with the New York Stock Exchange (“NYSE”) the CEO’s certification regarding our compliance with the NYSE’s Corporate Governance Listing Standards (“Listing Standards”) pursuant to Section 303A.12(a) of the Listing Standards, which certification was dated May 26, 2011,June 6, 2012, and indicated that the CEO was not aware of any violations of the Listing Standards.
The following risks and uncertainties, together with the other information set forth in this Form 10-K, should be carefully considered by those who invest in our securities. Any of the following risks could materially adversely affect our business, financial condition or operating results and could decrease the value of our common and/or preferred stock. Global financial events may have an impact on our business and financial condition in ways that we currently cannot predict.The 2008 credit crisis and related turmoil in the global financial system had an impact on our business and financial position, and a similar financial event in the future may also impact us. The continuation or re-emergence of the financial crisis may limit our ability to raise capital through credit and equity markets. As discussed further below, the prices of the metals that we produce are affected by a number of factors, and it is unknown how these factors may be impacted by a global financial event.We have had losses that could reoccur in the future.Although we reported net income for the years ended December 31, 2011, 2010, 2009 and 2007 of $151.2 million, $49.0 million, $67.8 million and $53.2 million, respectively, we reported a net loss for the year ended December 31, 2008 of $66.6 million. A comparison of operating results over the past three years can be found in Results of Operations in Management’s Discussion and Analysis of Financial Condition and Results of Operations.Many of the factors affecting our operating results are beyond our control, including, but not limited to, the volatility of metals prices; smelter terms; rock and soil conditions; seismic events; diesel fuel prices; interest rates; global or regional political or economic policies; inflation; availability and cost of labor; economic developments and crises; governmental regulations; continuity of orebodies; ore grades; recoveries; and speculation, purchases and sales by central banks and other holders and producers of gold and silver in response to these factors. We cannot foresee whether our operations will continue to generate sufficient revenue in order for us to generate net cash from operating activities. There can be no assurance that we will not experience net losses in the future.
Commodity risk management activities could expose us to losses.We periodically enter into risk management activities, such as financially-settled forward sales contracts and commodity put and call option contracts, to manage the prices received on the metals we produce. Such activities are utilized to attempt to insulate our operating results from changes in prices for those metals. However, such activities may prevent us from realizing possible revenues in the event that the market price of a metal exceeds the price stated in a forward sale or call option contract. In addition, we may experience losses if a counterparty fails to purchase under a contract when the contract price exceeds the spot price of a commodity.
We utilize financially settled forward contract programs to manage the exposure to changes in lead and zinc prices contained in our concentrate shipments between the time of sale and final settlement, and to manage the exposure of changes in the prices of lead and zinc contained in our forecasted future concentrate shipments. See Note 10 of Notes to Consolidated Financial Statements for more information on these base metals forward contract programs.The financial terms of settlement of the Coeur d’Alene Basin environmental litigation and other claims may materially impact our cash resources and our access to additional financing.On September 8, 2011, a Consent Decree (the “Consent Decree”) settling environmental litigation and related claims involving Hecla Limited pertaining to historic releases of mining wastes in the Coeur d'Alene Basin was approved and entered by the U.S. District Court in Idaho. The Consent Decree resolved all existing claims of the United States, the Coeur d'Alene Indian Tribe, and the State of Idaho (“Plaintiffs”) against Hecla Limited and its affiliates under the Comprehensive Environmental Response, Compensation and Liability Act of 1980 (CERCLA) and certain other statutes for past response costs, future environmental remediation costs, and natural resource damages related to historic releases of mining wastes in the Coeur d'Alene River Basin, as well as all remaining obligations of Hecla Limited with respect to the Bunker Hill Superfund Site. In addition to the approximately $169 million already paid under the Consent Decree in 2011, Hecla Limited remains obligated under the Consent Decree to make the following payments:$25 million of cash by October 8, 2012;
$15 million of cash by October 8, 2013; and
approximately $55.4 million by August 2014, as quarterly payments of the proceeds from the exercise of any outstanding Series 1 and Series 3 warrants (which have an exercise price of between $2.44 and $2.49 per share) during the quarter, with the remaining balance, if any, due in August 2014.
If additional warrants are not exercised, the requirement to pay up to $95.4 million (excluding interest) in cash over the next approximately three years will cause us to use a significant portion of either our cash currently on hand, or future cash resources. Our cash on hand at December 31, 2011 was $266.5 million; however, there can be no assurance that we will have the cash on hand to meet these obligations.Financial terms of settlement also require that Hecla Mining Company or Hecla Limited post third party surety in some form to secure the remaining payments. Obtaining surety causes us to incur costs, and also to utilize credit capacity which could otherwise be used to fund other areas of our business, including operations and capital expenditures. Moreover, there is no guarantee that we will be able maintain such surety, in which case we could be in default of the Consent Decree, which could have a material adverse effect on Hecla Limited’s or our results from operations or financial position.More information about the terms of settlement is set forth in Note 7 of Notes to Consolidated Financial Statements.Our profitability could be affected by the prices of other commodities and services.Our business activities are highly dependent on the costs of commodities and services such as fuel, steel, cement and electricity. The recent prices for such commodities have been volatile and may increase our costs of production and development. A material increase in costs at any of our operating properties could have a significant effect on our profitability. For additional discussion, see Results of Operations in Management’s Discussion and Analysis of Financial Condition and Results of Operations.Our accounting and other estimates may be imprecise.Preparing financial statements requires management to make estimates and assumptions that affect the reported amounts and related disclosure of assets, liabilities, revenue and expenses at the date of the consolidated financial statements and reporting periods. The more significant areas requiring the use of management assumptions and estimates relate to:mineral reserves and other mineralized material that are the basis for future income and cash flow estimates and units-of-production depreciation, depletion and amortization calculations;
environmental, reclamation and closure obligations;
reserves for contingencies and litigation; and
deferred tax asset valuation allowance.
Actual results may differ materially from these estimates using different assumptions or conditions. For additional information, see Critical Accounting Estimates in Management’s Discussion and Analysis of Financial Condition and Results of Operations, Note 1 of Notes to Consolidated Financial Statements and the risk factors: “Our development of new orebodies and other capital costs may cost more and provide less return than we estimated,” “Our ore reserve estimates may be imprecise,” “Our environmental obligations may exceed the provisions we have made,” and “We are currently involved in ongoing legal disputes that may materially adversely affect us.”A substantial or extended decline in metals prices would have a material adverse effect on us.
Our revenue is derived from the sale of concentrates and doré containing silver, gold, lead and zinc and, as a result, our earnings are directly related to the prices of these metals. Silver, gold, lead and zinc prices fluctuate widely and are affected by numerous factors, including:
relative exchange rates of the U.S. dollar;
global and regional demand and production;
inflation, recession or increased or reduced economic activity; and
other political, regulatory and economic conditions.
These factors are largely beyond our control and are difficult to predict. If the market prices for these metals fall below our production or development costs for a sustained period of time, we will experience losses and may have to discontinue exploration, development or operations, or incur asset write-downs at one or more of our properties.
The following table sets forth the average daily closing prices of the following metals for the yearyears ended December 31, 2007 and each year thereafter2008 through 2011.2012.
| | | 2011 | | | 2010 | | | 2009 | | | 2008 | | | 2007 | | | 2012 | | | 2011 | | | 2010 | | | 2009 | | | 2008 | |
| | $ | 35.11 | | | $ | 20.16 | | | $ | 14.65 | | | $ | 15.02 | | | $ | 13.39 | | | $ | 31.15 | | | $ | 35.11 | | | $ | 20.16 | | | $ | 14.65 | | | $ | 15.02 | |
| | $ | 1,569.00 | | | $ | 1,224.66 | | | $ | 972.98 | | | $ | 871.71 | | | $ | 696.66 | | | $ | 1,669.00 | | | $ | 1,569.00 | | | $ | 1,224.66 | | | $ | 972.98 | | | $ | 871.71 | |
| | $ | 1.09 | | | $ | 0.97 | | | $ | 0.78 | | | $ | 0.95 | | | $ | 1.17 | | | $ | 0.94 | | | $ | 1.09 | | | $ | 0.97 | | | $ | 0.78 | | | $ | 0.95 | |
| | $ | 1.00 | | | $ | 0.98 | | | $ | 0.75 | | | $ | 0.85 | | | $ | 1.47 | | | $ | 0.88 | | | $ | 1.00 | | | $ | 0.98 | | | $ | 0.75 | | | $ | 0.85 | |
| | (3) | London Metals Exchange — Cash |
| | (4) | London Metals Exchange — Special High Grade — Cash |
On February 20, 2012,21, 2013, the closing prices for silver, gold, lead and zinc were $33.56$28.72 per ounce, $1,733$1,577 per ounce, $0.92$1.05 per pound and $0.89$0.95 per pound, respectively.
An extended decline in metals prices, an increase in operating or capital costs, mine accidents or closures, increasing environmental obligations, or our inability to convert exploration potential to reserves may cause us to record write-downs, which could negatively impact our results of operations.
When events or changes in circumstances indicate that the carrying value of our long-lived assets may not be recoverable, we review the recoverability of the carrying value by estimating the future undiscounted cash flows expected to result from the use and eventual disposition of the asset. Impairment must be recognized when the carrying value of the asset exceeds these cash flows, and recognizing impairment write-downs could negatively impact our results of operations. Metal price estimates are a key component used in the analysis of the carrying values of our assets, as the evaluation approach involves comparing carrying values to the average estimated undiscounted cash flows resulting from operating plans using various metals price scenarios. Our estimates of undiscounted cash flows for our long-lived assets also include an estimate of the market value of the exploration potential beyond the current operating plans. There were no events or changes in circumstances that caused us to evaluate the carrying values of our long-lived assets as of December 31, 2011.2012. However, if the prices of silver, gold, zinc and lead decline for an extended period of time, if we fail to control production costs, if regulatory issues increase costs or decrease production, or if we do not realize the mineable ore reserves or exploration potential at our mining properties, we may be required to evaluate the carrying values of outour long-lived assets and recognize asset write-downs in the future. In addition, the perceived market value of the exploration potential of our properties is dependent upon prevailing metals prices as well as our ability to discover economic ore. A decline in metals prices for an extended period of time or our inability to convert exploration potential to reserves could significantly reduce our estimations of the value of the exploration potential at our properties and result in asset write-downs. We have had losses that could reoccur in the future.
Although we reported net income for the years ended December 31, 2012, 2011, 2010 and 2009 of $15.0 million, $151.2 million, $49.0 million and $67.8 million, respectively, we reported a net loss for the year ended December 31, 2008 of $66.6 million. A comparison of operating results over the past three years can be found in Results of Operations in Management’s Discussion and Analysis of Financial Condition and Results of Operations.
Many of the factors affecting our operating results are beyond our control, including, but not limited to, the volatility of metals prices; smelter terms; rock and soil conditions; seismic events; availability of hydroelectric power; diesel fuel prices; interest rates; global or regional political or economic policies; inflation; availability and cost of labor; economic developments and crises; governmental regulations; continuity of orebodies; ore grades; recoveries; and speculation, purchases and sales by central banks and other holders and producers of gold and silver in response to these factors. We cannot foresee whether our operations will continue to generate sufficient revenue in order for us to generate net cash from operating activities. There can be no assurance that we will not experience net losses in the future.
Commodity risk management activities could expose us to losses.
We periodically enter into risk management activities, such as financially-settled forward sales contracts and commodity put and call option contracts, to manage the prices received on the metals we produce. Such activities are utilized to attempt to insulate our operating results from changes in prices for those metals. However, such activities may prevent us from realizing possible revenues in the event that the market price of a metal exceeds the price stated in a forward sale or call option contract. In addition, we may experience losses if a counterparty fails to purchase under a contract when the contract price exceeds the spot price of a commodity.
We utilize financially settled forward contract programs to manage the exposure to changes in lead and zinc prices contained in our concentrate shipments between the time of sale and final settlement, and to manage the exposure to changes in the prices of lead and zinc contained in our forecasted future concentrate shipments. See Note 10 of Notes to Consolidated Financial Statements for more information on these base metals forward contract programs. The financial terms of settlement of the Coeur d’Alene Basin environmental litigation and other claims may materially impact our cash resources and our access to additional financing.
On September 8, 2011, a Consent Decree (the “Consent Decree”) settling environmental litigation and related claims involving Hecla Limited pertaining to historic releases of mining wastes in the Coeur d'Alene Basin was approved and entered by the U.S. District Court in Idaho. The Consent Decree resolved all existing claims of the United States, the Coeur d'Alene Indian Tribe, and the State of Idaho (“Plaintiffs”) against Hecla Limited and its affiliates under the Comprehensive Environmental Response, Compensation and Liability Act of 1980 (CERCLA) and certain other statutes for past response costs, future environmental remediation costs, and natural resource damages related to historic releases of mining wastes in the Coeur d'Alene River Basin, as well as all remaining obligations of Hecla Limited with respect to the Bunker Hill Superfund Site. In addition to the approximately $194 million already paid under the Consent Decree in 2011 and 2012, Hecla Limited remains obligated under the Consent Decree to make the following payments:
$15 million of cash by October 8, 2013; and
approximately $55.5 million by August 2014, as quarterly payments of the proceeds from the exercise of any outstanding Series 1 and Series 3 warrants (which have an exercise price of between $2.41 and $2.52 per share) during the quarter, with the remaining balance, if any, due in August 2014.
If additional warrants are not exercised, the requirement to pay $70.5 million (excluding interest) in cash over the next approximately two years would cause us to use a significant portion of either our cash currently on hand, or future cash resources. Our cash on hand at December 31, 2012 was $191.0 million; however, there can be no assurance that we will have the cash on hand to meet these obligations.
Financial terms of settlement also require that Hecla Mining Company or Hecla Limited post third party surety in some form to secure the remaining payments. Obtaining surety causes us to incur costs, and also to utilize credit capacity which could otherwise be used to fund other areas of our business, including operations and capital expenditures. Moreover, there is no guarantee that we will be able maintain such surety, in which case we could be in default of the Consent Decree, which could have a material adverse effect on Hecla Limited’s or our results from operations or financial position.
More information about the terms of settlement is set forth in Note 7 of Notes to Consolidated Financial Statements.
Our profitability could be affected by the prices of other commodities and services.
Our business activities are highly dependent on the costs of commodities and services such as fuel, steel, cement and electricity. The recent prices for such commodities have been volatile and may increase our costs of production and development. A material increase in costs at any of our operating properties could have a significant effect on our profitability. For additional discussion, see Results of Operations in Management’s Discussion and Analysis of Financial Condition and Results of Operations.
Our accounting and other estimates may be imprecise.
Preparing financial statements requires management to make estimates and assumptions that affect the reported amounts and related disclosure of assets, liabilities, revenue and expenses at the date of the consolidated financial statements and reporting periods. The more significant areas requiring the use of management assumptions and estimates relate to:
mineral reserves, mineralized material, and other resources that are the basis for future income and cash flow estimates and units-of-production depreciation, depletion and amortization calculations;
environmental, reclamation and closure obligations;
valuation of business combinations;
reserves for contingencies and litigation; and
deferred tax asset valuation allowance.
Actual results may differ materially from these estimates using different assumptions or conditions. For additional information, see Critical Accounting Estimates in Management’s Discussion and Analysis of Financial Condition and Results of Operations, Note 1 of Notes to Consolidated Financial Statements and the risk factors: “Our development of new orebodies and other capital costs may cost more and provide less return than we estimated,” “Our ore reserve estimates may be imprecise,” “Our environmental obligations may exceed the provisions we have made,” and “We are currently involved in ongoing legal disputes that may materially adversely affect us.”
Our ability to recognize the benefits of deferred tax assets is dependent on future cash flows and taxable income
We recognize the expected future tax benefit from deferred tax assets when the tax benefit is considered to be more likely than not of being realized. Otherwise, a valuation allowance is applied against deferred tax assets reducing the value of such assets. Assessing the recoverability of deferred tax assets requires management to make significant estimates related to expectations of future taxable income. Estimates of future taxable income are based on forecasted income from operations and the application of existing tax laws in each jurisdiction. Metal price and production estimates are a key componentcomponents used in the determination of our ability to realize the expected future benefit of our deferred tax assets. To the extent that future taxable income differs significantly from estimates as a result of a decline in metals prices or other factors, our ability to realize the deferred tax assets could be impacted. Additionally, significant future issuances of common stock or common stock equivalents could limit our ability to utilize our net operating loss carryforwards pursuant to Section 382 of the Internal Revenue Code. Future changes in tax law or changes in ownership structure could limit our ability to utilize our recorded tax assets. As of December 31, 2010, we removed substantially all deferred tax valuation allowances, with the exception of certain amounts related to foreign net operating loss carryforwards, and our current and non-current deferred tax asset balances as of December 31, 2012 were $27.8$29.4 million and $88.0$86.4 million, respectively. See Note 5 of Notes to Consolidated Financial Statements for further discussion of our deferred tax assets. Global financial events may have an impact on our business and financial condition in ways that we currently cannot predict. The 2008 credit crisis and related turmoil in the global financial system had an impact on our business and financial position, and a similar financial event in the future could also impact us. The continuation or re-emergence of the financial crisis may limit our ability to raise capital through credit and equity markets. The prices of the metals that we produce are affected by a number of factors, and it is unknown how these factors may be impacted by a global financial event.
Returns for Investments in Pension Plans and Pension Plan Funding Requirements Are Uncertain
We maintain defined benefit pension plans for employees, which provide for specified payments after retirement for most employees. The ability of the pension plans to provide the specified benefits depends on our funding of the plans and returns on investments made by the plans. Returns, if any, on investments are subject to fluctuations based on investment choices and market conditions. A sustained period of low returns or losses on investments could require us to fund the pension plans to a greater extent than anticipated. See Note 8 of Notes to Consolidated Financial Statements for more information on our pension plans.
OPERATION, DEVELOPMENT, EXPLORATION AND ACQUISITION RISKS
Mining accidents or other adverse events at an operation could decrease our anticipated production.
Production may be reduced below our historical or estimated levels as a result of mining accidents; unfavorable ground conditions; work stoppages or slow-downs; lower than expected ore grades; unexpected regulatory actions; the metallurgical characteristics of the ore that are less economic than anticipated; or because our equipment or facilities fail to operate properly or as expected. For example, in the second quarter of 2010, mining activities at the Lucky Friday mine stopped for approximately two weeks due to some deterioration of shaft infrastructure at the #2 Shaft, which is the mine's secondary escape way. Upon completion of repairs to #2 Shaft, the mine returned to normal production. In April 2011, a fatal accident occurred at the Lucky Friday mine resulting in a cessation of operations at the mine for approximately 10 days. In November 2011, an accident occurred as part of the construction of the #4 Shaft at the Lucky Friday mine, resulting in the fatality of one contractor employee. In an unrelated incident, in December 2011, a rock burst occurred in a primary access way at the Lucky Friday mine and injured seven employees, with no fatalities as a result of that incident.employees. Each of these events temporarily suspended operations at the Lucky Friday mine and adversely impacted production. Other closures or impacts on operations or production may occur at any of our mines at any time, whether related to accidents, changes in conditions, changes to regulatory policy, or as precautionary measures.
At the end of 2011, MSHAthe Federal Mine Health and Safety Administration ("MSHA") began a special impact inspection at the Lucky Friday mine which resulted in an order closing down the Silver Shaft, the primary access way from surface at the Lucky Friday mine, until we remove looseremoved built-up cementitious material from the Silver Shaft. This occurred despite the fact that the Silver Shaft was not involved in any of the accidents at the mine in 2011. Underground access will bewas limited as thisthe work is beingwas performed, and we anticipate that production at the Lucky Friday will bewas suspended until early 2013 as a result. We anticipate returning to fullresumed limited production levels at the Lucky Friday oncein the first quarter of 2013 after completing work on the Silver Shaft work and work related to bypassinga bypass of the area impacted by the December 2011 rock burst is complete; however, no assurance can be made as to when this will occur or as to the cost of the material removal and related work.burst.
For further information, see Management's Discussion and Analysis of Financial Condition and Results of Operations.
Recent accidents and other events at our Lucky Friday mine could have additional adverse consequences to us.
Hecla Limited may face additional enforcement actions, as well as additional orders from MSHA, as a result of MSHA's inspections and investigations of events at our Lucky Friday mine, including the April 2011 fatal ground fall accident, the rock burst incident in December 2011, and the order closing the Silver Shaft for the removal of loosebuilt-up cementitious material. Hecla Limited could also face additional penalties (including monetary penalties) from MSHA or other governmental agencies relating to these incidents and any other orders or citations received by Hecla Limited. In addition, MSHA periodically notifies certain mines that a potential pattern of violations (“PPOV”) may exist based upon an initial statistical screening of violation history and pattern criteria review by MSHA. Receipt of notice of a PPOV typically triggers an undertaking by a mine to implement corrective actions, and if certain criteria are not met, MSHA could subsequently issue a Notice of Pattern of Violations (“NPOV”). Receipt of a NPOV would, among other things, impose certain onerous conditions on the mine, including the requirement to pass an inspection in which no significant and substantial violations of a mandatory health or safety standard are found before termination of the NPOV. In light of the citations/orders received in 2011 andNovember 2012, it is possible that the Lucky Friday mine received a PPOV notice from MSHA. The notice indicated that because the Lucky Friday was non-producing at the time, MSHA will postpone action on the matter until further notice. Subsequent to receipt of the PPOV notice, MSHA rules changed and effective as of March 25, 2013, the PPOV notice process will be eliminated and instead MSHA will have the discretion to issue a NPOV immediately. It is unclear if these new rules will apply to the Lucky Friday mine, but if they do, it could receive a PPOV.materially impact our operations. Finally, it is possible that Hecla Limited could face litigation relating to the 2011 incidents at the Lucky Friday mine.mine in addition to the purported class action and related derivative lawsuits filed against us in 2012. We may not resolve these claims favorably, and each one of the foregoing possibilities could have a material adverse impact on our cash flows, results of operations or financial condition. See Note 7 of Notes to Consolidated Financial Statements.
Our operations may be adversely affected by risks and hazards associated with the mining industry that may not be fully covered by insurance.
Our business is capital intensive, requiring ongoing capital investment for the replacement, modernization or expansion of equipment and facility.facilities. Our mining and milling operations are subject to risks of process upsets and equipment malfunctions. Equipment and supplies may from time to time be unavailable on a timely basis. Our business is subject to a number of other risks and hazards including:
unusual or unexpected geologic formations;
| • | unusual or unexpected geologic formations; |
rock bursts and ground falls;
| • | rock bursts and ground falls; |
underground fires or floods;
| • | underground fires or floods; |
explosive rock failures;
| • | explosive rock failures; |
unanticipated hydrologic conditions, including flooding and periodic interruptions due to inclement or hazardous weather conditions;
political and country risks;
| • | political and country risks; |
civil unrest or terrorism;
| • | civil unrest or terrorism; |
labor disputes or strikes; and
our operating mines have tailing ponds which could fail or leak as a result of seismic activity or for other reasons.
Such risks could result in:
| • | personal injury or fatalities; |
personal injury or fatalities;
| • | damage to or destruction of mineral properties or producing facilities; |
| • | delays in exploration, development or mining; |
| • | temporary or permanent closure of facilities. |
damage to or destruction of mineral properties or producing facilities;
delays in exploration, development or mining;
temporary or permanent closure of facilities.
We maintain insurance to protect against losses that may result from some of these risks, such as property loss and business interruption, in amounts we believe to be reasonably consistent with our historical experience, industry practice and circumstances surrounding each identified risk. Such insurance, however, contains exclusions and limitations on coverage, particularly with respect to environmental liability and political risk. We have received some payment for business interruption insurance claims related to the temporary suspension of operations at the Lucky Friday mine and continue to seek further reimbursement (see Mining accidents or other adverse events at an operation could decrease our anticipated production). There can be no assurance that claims would be paid under such insurance policies in connection with a particular event. Insurance againstspecific to environmental risks is generally either unavailable or, we believe, too expensive for us, and we therefore do not maintain environmental insurance. Occurrence of events for which we are not insured may have an adverse effect on our business. Our development of new orebodies and other capital costs may be higher and provide less return than we estimated. Capitalized development projects may cost more and provide less return than we estimate. If we are unable to realize a return on these investments, we may incur a related asset write-down that could adversely affect our financial results or condition. Our ability to sustain or increase our current level of metals production partly depends on our ability to develop new orebodies and/or expand existing mining operations. Before we can begin a development project, we must first determine whether it is economically feasible to do so. This determination is based on estimates of several factors, including:
expected recovery rates of metals from the ore;
facility and equipment costs;
availability of adequate manpower;staffing;
availability of affordable sources of power and adequacy of water supply;
exploration and drilling success;
capital and operating costs of a development project;
environmental considerations and permitting;
adequate access to the site, including competing land uses (such as agriculture);
foreign currency fluctuation and inflation rates; and
availability of financing.
These estimates are based on geological and other interpretive data, which may be imprecise. As a result, actual operating and capital costs and returns from a development project may differ substantially from our estimates, and, as such, it may not be economically feasible to continue with a development project.
Our ore reserve estimates may be imprecise. Our ore reserve figures and costs are primarily estimates and are not guarantees that we will recover the indicated quantities of these metals. You are strongly cautioned not to place undue reliance on estimates of reserves. Reserves are estimates made by our professional technical personnel, and no assurance can be given that the estimated amount of metal or the indicated level of recovery of these metals will be realized. Reserve estimation is an interpretive process based upon available data and various assumptions. Our reserve estimates may change based on actual production experience. Further, reserves are valued based on estimates of costs and metals prices, which may not be consistent among our properties. The economic value of ore reserves may be adversely affected by: declines in the market price of the various metals we mine;
increased production or capital costs;
reduction in the grade or tonnage of the deposit;
increase in the dilution of the ore; and
Short-term operating factors relating to our ore reserves, such as the need to sequentially develop orebodies and the processing of new or different ore grades, may adversely affect our cash flow. If the prices of metals that we produce decline substantially below the levels used to calculate reserves for an extended period, we could experience: delays in new project development;
write-downs of asset values; and
Efforts to expand the finite lives of our mines may not be successful or could result in significant demands on our liquidity, which could hinder our growth and decrease the value of our stock. One of the risks we face is that our mines are depleting assets. Thus, we must continually replace depleted ore reserves by locating and developing additional ore. Our ability to expand or replace ore reserves primarily depends on the success of our exploration programs. Mineral exploration, particularly for silver and gold, is highly speculative and expensive. It involves many risks and is often non-productive. Even if we believe we have found a valuable mineral deposit, it may be several years before production from that deposit is possible. During that time, it may become no longer feasible to produce those minerals for economic, regulatory, political or other reasons. As a result of high costs and other uncertainties, we may not be able to expand or replace our existing ore reserves as they are depleted, which would adversely affect our business and financial position in the future. To increase production and mine lifeThe #4 Shaft project, an internal shaft at the Lucky Friday mine, is expected, upon its completion, to provide deeper access in 2011 we continued progress onorder to increase the #4 Shaft project.mine's production and operational life. We commenced engineering and construction activities on #4 Shaft in late 2009,2008, and our Board of Directors gave its final approval of the project in August 2011. Work on the project thus far has included: detailed shaft design, excavation of the hoist room and off shaft development access to shaft facilities, hoist installation, placement and receipt of orders for major equipment purchases, 367 feet of vertical shaft excavation, and other construction activities. The #4 Shaft project, as currently designed, is expected to involve development down to the 8800 foot level and capital expenditures of approximately $200 million, which includes approximately $90$92 million that has been spent on the project as of December 31, 2011.2012. At the end of 2011, MSHA began a special impact inspection at the Lucky Friday mine, and as a result MSHA ordered the Silver Shaft to be closed until we remove looseremoved built-up cementitious material from the shaft. The Silver Shaft is the primary access way from the surface at the Lucky Friday, and the order has resulted in a temporary suspension of most operations at the Lucky Friday, including work on #4 Shaft. When accessAccess to the #4 Shaft project iswas restored in the first quarter of 2013, and we believe that our current capital resources will allow us to proceed. However, there are a number of factors that could affect completion of the project as currently designed, including: i)(i) a significant decline in metals prices, (ii) a reduction in available cash or credit, whether arising from decreased cash flow or other uses of available cash, (iii) increased regulatory burdens, or (iii)(iv) a significant increase in operating or capital costs. An increase in the capital costOne or more of these factors could potentially require us to suspend the project, defer some of the planned development, or access additional capital through debt financing, the sale of securities, or other external sources. This additional financing could be costly or unavailable.
Our joint development and operating arrangements may not be successful. We have in the past entered into, and may in the future enter into joint venture arrangements in order to share the risks and costs of developing and operating properties. In a typical joint venture arrangement, the partners own a proportionate shareshares of the assets, are entitled to indemnification from each other and are only responsible for any future liabilities in proportion to their interest in the joint venture. If a party fails to perform its obligations under a joint venture agreement, we could incur liabilities and losses in excess of our pro-rata share of the joint venture. We make investments in exploration and development projects that may have to be written off in the event we do not proceed to a commercially viable mining operation. On February 21, 2008, we announced that our wholly-owned subsidiary, Rio Grande Silver Inc. ("RGS"), acquired the right to earn into a 70% joint venture interest in an approximately 25-square-mile consolidated land package in the Creede Mining District of Colorado. RGS earned into the 70% interest in 2011. In December 2011, RGS completed the acquisition of the remaining 30% interest of the original joint venture, while maintaining a 70% interest in a new joint venture holding additional exploration property within the Creede District, for shares of Hecla common stock valued at approximately $33.8 million on the date that the transaction was completed. For more information on the terms of the agreement, see See Note 16 of Notes to Consolidated Financial Statements.Our ability to market our metals production may be affected by disruptions or closures of custom smelters and/or refining facilities. We sell substantially all of our metallic concentrates to custom smelters. Our dorédoré bars are sent to refiners for further processing before being sold to metal traders. If our ability to sell concentrates to our contracted smelters becomes unavailable to us, it is possible our operations could be adversely affected. See Note 11of Notes to Consolidated Financial Statements for more information on the distribution of our sales and our significant customers.
We face inherent risks in acquisitions of other mining companies or properties that may adversely impact our growth strategy. Mines have limited lives, which is an inherent risk in acquiring mining properties. We are actively seeking to expand our mineral reserves by acquiring other mining companies or properties. Although we are pursuing opportunities that we feel are in the best interest of our shareholders, these pursuits are costly and often unproductive. Inherent risks in acquisitions we may undertake in the future could adversely affect our current business and financial condition and our growth.There is a limited supply of desirable mineral landsproperties available in the United States and foreign countries where we would consider conducting exploration and/or production activities, and any acquisition we may undertake is subject to inherent risks. In addition to the risk associated with limited mine lives, we may not realize the value of the companies or properties that are acquired due to a possible decline in metals prices, failure to obtain permits, labor problems, changes in regulatory environment, failure to achieve anticipated synergies, an inability to obtain financing, and other factors previously described. Acquisitions of other mining companies or properties may also expose us to new geographic, political, operating, and geological risks. In addition, we face strong competition for companies and properties from other mining companies, some of which have greater financial resources than we do, and we may be unable to acquire attractive companies and mining properties on terms that we consider acceptable. Our business depends on finding skilled miners and maintaining good relations with our employees. We are dependent upon the ability and experience of our executive officers, managers, employees and other personnel, and there can be no assurance that we will be able to retain all of such employees. We compete with other companies both withinin and outside the mining industry in connection with the recruiting and retention ofretaining qualified employees knowledgeable of the mining business. From time to time, we have encountered, and may in the future encounter, difficulty recruiting skilled mining personnel at acceptable wage and benefit levels in a competitive labor market.market, and may be required to utilize contractors, which can be more costly. Temporary or extended lay-offs due to mine closures may exacerbate such issues and result in vacancies or the need to hire less skilled or efficient employees. The loss of these persons or our inability to attract and retain additional highly skilled employees could have an adverse effect on our business and future operations. The Lucky Friday mine is our only operation subject to a collective bargaining agreement, which expires on April 30, 2016.
We were recently orderedIn March 2012, Hecla Limited received notice of a complaint filed against it by MSHA to remove loose material from the Silver Shaft,United Steel Workers, Local 5114, with the primary access way from surface at the Lucky Friday mine. As this rehabilitation work is performed, underground accessFederal Mine Safety Health Review Commission for compensation for bargaining unit workers at the Lucky Friday mine will be limited, temporarily suspending production and underground work there. Aswho were idled as a result Hecla Limited laid off 121 employees, or approximately 42% of the workforcepreviously-announced, temporary suspension of production at the Lucky Friday mine. Asmine (see the Silver Shaft work is completed, we anticipate that employment levels at the Lucky Friday mine will returnOther Contingencies section of Note 7 of Notes to where they were at prior to the suspension of production. Although we believe that we will be able to successfully reassemble the workforce at the Lucky Friday as underground work and production resumes, competition from other companies and other factors may make recruitment difficult.Consolidated Financial Statements for more information).Competition from other mining companies may harm our business. We compete with other mining companies to attract and retain key executives, skilled labor, contractors and other employees. We compete with other mining companies for the services of skilled personnel and contractors and their specialized equipment, components and supplies, such as drill rigs, necessary for exploration and development. We also compete with other mining companies for rights to mine properties. We may be unable to continue to obtain the services of skilled personnel and contractors or specialized equipment or supplies, or to acquire additional rights to mine properties.
We may be subject to a number of unanticipated risks related to inadequate infrastructure.
Mining, processing, development and exploration activities depend on adequate infrastructure. Reliable roads, bridges, power sources and water supply are important determinants, which affect capital and operating costs. Unusual or infrequent weather phenomena, sabotage, government or other interference in the maintenance or provision of such infrastructure, or government intervention, could adversely affect our mining operations.
Our foreign activities are subject to additional inherent risks.
We currently conduct exploration and pre-development projects in Mexico and continue to own assets, including real estate and mineral interests there. We anticipate that we will continue to conduct operations in Mexico and possibly other international locations in the future. Because we conduct operations internationally, we are subject to political and economic risks such as: the effects of local political, labor and economic developments and unrest;
significant or abrupt changes in the applicable regulatory or legal climate;
exchange controls and export restrictions;
expropriation or nationalization of assets with inadequate compensation;
currency fluctuations and repatriation restrictions;
invalidation an unavailability of governmental orders, permits or agreements;
property ownership disputes;
renegotiation or nullification of existing concessions, licenses, permits and contracts;
criminal activity, corruption, demands for improper payments, expropriation, and uncertain legal enforcement and physical security;
disadvantages of competing against companies from countries that are not subject to U.S. laws and regulations;
fuel or other commodity shortages;
laws or policies of foreign countries and the United States affecting trade, investment and taxation;
civil disturbances, war and terrorist actions; and
Consequently, our exploration, development and production activities outside of the United States may be substantially affected by factors beyond our control, any of which could materially adversely affect our financial condition or results of operations. LEGAL, REGULATORY AND MARKET AND REGULATORY RISKS
We are currently involved in ongoing legal disputes that may materially adversely affect us. There are several ongoing legal disputes in which we are involved, including a putative class action lawsuit recently filed against us, and additional actions may be filed against us. We may be subject to future claims, including those relating to environmental damage, safety conditions at our mines, the two fatal accidents that occurred at the Lucky Friday mine in 2011, and other related matters. The outcomes of these pending and potential claims are uncertain. We may not resolve these claims favorably. Depending on the outcome, these actions could have adverse financial effects or cause reputational harm to us. If any of these disputes result in a substantial monetary judgment against us, are settled on terms in excess of our current accruals, or otherwise impact our operations, our financial results or condition could be materially adversely affected. For a description of some of the lawsuits in which we are involved, see Note 7 of Notes to Consolidated Financial Statements. We are required to obtain governmental and lessor approvals and permits in order to conduct mining operations.
In the ordinary course of business, mining companies are required to seek governmental and lessor approvals and permits for continuation or expansion of existing operations or for the commencement of new operations. For example, we estimate that our Greens Creek tailings impoundment area has sufficient capacity to meet our needs at least through 2014.the end of 2015. In order to increase the tailings capacity at the mine, a permit is required. Obtaining the necessary governmental permits is a complex, time-consuming and costly process. The duration and success of our efforts to obtain permits are contingent upon many variables not within our control. Obtaining environmental permits, including the approval of reclamation plans, may increase costs and cause delays or halt the continuation of mining operations depending on the nature of the activity to be permitted and the interpretation of applicable requirements implemented by the permitting authority. Interested parties may seek to prevent issuance of permits and intervene in the process or pursue extensive appeal rights. Past or ongoing violations of government mining laws could provide a basis to revoke existing permits or to deny the issuance of additional permits. In addition, evolving reclamation or environmental concerns may threaten our ability to renew existing permits or obtain new permits in connection with future development, expansions and operations. There can be no assurance that all necessary approvals and permits will be obtained and, if obtained, that the costs involved will not exceed those that we previously estimated. It is possible that the costs and delays associated with the compliance with such standards and regulations could become such that we would not proceed with the development or operation. We are often required to post surety bonds or cash collateral to secure our reclamation obligations and we may be unable to obtain the required surety bonds or may not have the resources to provide cash collateral. Similarly, we will require the consent of MSHA to reopen the Silver Shaft and resume operations at the Lucky Friday mine upon completion of refurbishing the shaft walls.
We face substantial governmental regulation and environmental risk. Our business is subject to extensive U.S. and foreign, federal, state and local laws and regulations governing development, production, labor standards, occupational health waste disposal, use of toxic substances, environmental regulations, mineand safety, the environment and other matters. For example, in 20112012 both of our operating mines received several citations, and the Lucky Friday mine also received severalmultiple orders, under the Mine Safety and Health Act of 1977, as administered by MSHA. In addition, in November 2012, the Lucky Friday mine received a PPOV notice from MSHA. See Recent accidents and other events at our Lucky Friday mine could have additional adverse consequences to us. The notice indicated that because the Lucky Friday was in a non-producing status at the time, MSHA will postpone action on the matter until further notice. Further, we have been and are currently involved in lawsuits or disputes in which we have been accused of causing environmental damage, violating environmental laws, or violating environmental permits, and we may be subject to similar lawsuits or disputes in the future. See risk titled “Our environmental obligations may exceed the provisions we have made.”
Exposure to these liabilities arises not only from our existing operations, but from operations that have been closed, or sold to third parties. parties, or properties we had a leasehold, joint venture, or other interest in. With a history dating back to 1991, our exposure to environmental claims may be greater because of the bankruptcy or dissolution of other mining companies which may have engaged in more significant activities of a mining site but which are no longer available to make claims against or obtain judgments from.
We are required to reclaim properties after mining is completed and specific requirements vary among jurisdictions. In some cases, we may be required to provide financial assurances as security for reclamation costs, which may exceed our estimates for such costs. Our historical operations and the historical operations of entities and properties we have acquired have occasionally been alleged to have generated environmental contamination. We could also be held liable for worker exposure to hazardous substances. There can be no assurances that we will at all times be in compliance with all environmental, health and safety regulations or that steps to achieve compliance would not materially adversely affect our business.
In addition to existing regulatory requirements, legislation and regulations may be adopted or permit limits reduced at any time that result in additional exposure to liability, operating expense, capital expenditures or restrictions and delays in the mining, production or development of our properties. Mining accidents and fatalities, whether or not at our mines or related to silver mining, may increase the likelihood of additional regulation or changes in law. In addition, enforcement or regulatory tools and methods available to governmental regulators such as the U.S. Environmental Protection Agency which have not been used or seldomly used against us, could in the future be used against us. Federal or state environmental or mine safety regulatory agencies may order certain of our mines to be temporarily or permanently closed, which may have a material adverse effect on our cash flows, results of operations, or financial condition. Legislative and regulatory measures to address climate change and green house gas emissions are in various phases of consideration. If adopted, such measures could increase our cost of environmental compliance and also delay or otherwise negatively affect efforts to obtain permits and other regulatory approvals with regard to existing and new facilities. Proposed measures could also result in increased cost of fuel and other consumables used at our operations, including the diesel generation of electricity at our Greens Creek operation if we are unable to regularly access utility power. Climate change legislation may also affect our smelter customers who burn fossil fuels, resulting in increased costs to us, and may affect the market for the metals we produce with effects on prices that are not possible for us to predict. From time to time, the U.S. Congress considers proposed amendments to the General Mining Law of 1872, as amended, which governs mining claims and related activities on federal lands. The extent of any future changes is not known and the potential impact on us as a result of U.S. Congressional action is difficult to predict. Changes to the General Mining Law, if adopted, could adversely affect our ability to economically develop mineral reserves on federal lands. Although we are not currently mining on federal land, explorationwe do explore and future mining could occur on federal land.
The Clean Water Act requires permits for operations that discharge into waters of the United States. Such permitting has been a frequent subject of litigation by environmental advocacy groups, which has resulted, and may in the future result, in declines in such permits or extensive delays in receiving them. This may result in delays in, or in some instances preclude, the commencement or continuation of development or production operations. Adverse outcomes in lawsuits challenging permits or failure to comply with applicable regulations could result in the suspension, denial, or revocation of required permits, which could have a material adverse impact on our cash flows, results of operations, or financial condition.
Our environmental obligations may exceed the provisions we have made. We are subject to significant environmental obligations, particularly in northern Idaho through our subsidiary Hecla Limited. At December 31, 2011,2012, we had accrued $153.8$113.2 million as a provision for environmental obligations, including $110.2 million accrued for Hecla Limited’s various liabilities in Idaho. As of the date of this report, these accrual balances included a total of $95.5$70.8 million for our remaining obligation for environmental claims with respect to the entire Coeur d’Alene Basin in northern Idaho. A settlement of the Coeur d’Alene Basin environmental litigation and related claims was finalized with entry of the Consent Decree by the Court in September 2011. For an overview ofinformation on our potential environmental liabilities, see Note 4 and Note 7 of Notes to Consolidated Financial Statements.
Shipment of our products is subject to regulatory and related risks.
Certain of the products we ship to our customers are subject to regulatory requirements regarding packaging, handling and shipping of products that may be considered to be dangerous to human health or the environment. Although we believe we are currently in compliance with all material regulations applicable to packaging, handling and shipping our products, the chemical properties of our products or existing regulations could change and cause us to fall out of compliance, or force us to incur substantial additional expenditures in order to maintain compliance with applicable regulations. Further, we do not ship our own products but instead rely on third party carriers to ship our products to our customers. To the extent that any of our carriers are unable or unwilling to ship our products in accordance with applicable regulations, including because of difficulty in obtaining, or increased cost of, insurance, we could be forced to find alternative shipping arrangements, assuming such alternatives would be available. Any such changes to our current shipping arrangements could have a material adverse impact on our operations and financial results.
The titles to some of our properties may be defective or challenged. Unpatented mining claims constitute a significant portion of our undeveloped property holdings, the validity of which could be uncertain and may be contested. Although we have conducted title reviews of our property holdings, title review does not necessarily preclude third parties from challenging our title. In accordance with mining industry practice, we do not generally obtain title opinions until we decide to develop a property. Therefore, while we have attempted to acquire satisfactory title to our undeveloped properties, some titles may be defective. The price of our stock has a history of volatility and could decline in the future. OurShares of our common and outstanding preferred stocksstock are listed on the New York Stock Exchange. The market price for our stock has been volatile, often based on:changes in metals prices, particularly silver;
our results of operations and financial condition as reflected in our public news releases or periodic filings with the Securities and Exchange Commission;SEC;
fluctuating proven and probable reserves;
factors unrelated to our financial performance or future prospects, such as global economic developments, market perceptions of the attractiveness of particular industries, or the reliability of metals markets;
political and regulatory risk;
the success of our exploration, pre-development, and capital programs;
ability to meet production estimates;
environmental, safety and legal risk;
the extent and nature of analytical coverage concerning our business; and
the trading volume and general market interest in our securities.
The market price of our stock at any given point in time may not accurately reflect our value, and may prevent shareholders from realizing a profit on their investment. Our Series B Preferred Stock has a liquidation preference of $50 per share or $7.9 million. If we were liquidated, holders of our preferred stock would be entitled to receive approximately $7.9 million (plus any accrued and unpaid dividends) from any liquidation proceeds before holders of our common stock would be entitled to receive any proceeds. We may not be able to pay common or preferred stock dividends in the future. SinceBetween July 2005 and the third quarter of 2008 we paid regular quarterly dividends on our Series B Preferred Stock . Prior to then, except for the fourth quarter of 2004, we had not declared dividends on Series B Preferred Stock since the second quarter of 2000. We similarly deferred Series B Preferred Stock dividends for the fourth quarter of 2008 through the third quarter of 2008.2009. In January 2010 we paid all dividends in arrears. Since then we have paid all regular quarterly dividends on the Series B Preferred Stock. The annual dividend payable on the Series B Preferred Stock is currently $0.6 million. Prior to the fourth quarter of 2004, we had not declared preferred dividends on Series B Preferred Stock since the second quarter of 2000. Series B Preferred Stock dividends due on January 1, 2009, for the fourth quarter of 2008 and dividends due for the three quarters thereafter were deferred. In January 2010 we paid all dividends in arrears and dividends due for the fourth quarter of 2009 for the Series B Preferred Stock, and we paid all regular quarterly dividends for 2010 and 2011. However, there can be no assurance that we will continue to pay preferred stock dividends in the future.
In September 2011, ourOur Board of Directors adopted a common stock dividend policy that has two components: (1) a dividend that links the amount of any declared dividenddividends on our common stock to our average quarterly realized silver price in the preceding quarter.quarter, and (2) a minimum annual dividend of $0.01 per share of common stock, in each case payable quarterly, when declared. See Note 9 of Notes to Consolidated Financial Statements for more information on potential dividend amounts under the first component of the policy at various silver prices. On November 8,From the fourth quarter of 2011 through and including the first quarter of 2013, our Board of Directors has declared a common stock dividend under the first quarterly silver price-linkedpolicy described above (although in some cases only a minimum dividend of $0.02 per share ($5.6 million total), based onwas declared and none relating to the average realized price of silver price indue to the third quarter of 2011 of $37.02 per ounce. prices not meeting the policy threshold). On February 17, 2012,25, 2013, our Board of Directors declared a silver price-linkedspecial common stock dividend pursuant to the policy described above, of $0.01 per share, based onin addition to the minimum dividend of $0.0025 per share, even though the average realized silver price of $31.61 per ounce induring the fourth quarter of 2011. In addition, in February 2012 our Board of Directors adopted a common stock dividenddid not meet the policy that includes a minimum annual dividend of $0.01 per share of common stock, payable quarterly when declared, and declared a dividend of $0.0025 per share pursuant to that policy. Therefore, the aggregate common stock dividend declared by ouir Board of Directors was $0.0125 per share, for a total of approximately $3.6 million expected to be paid in the first quarter of 2012.threshold. The declaration and payment of common stock dividends, whether pursuant to the policy or in addition thereto, is at the sole discretion of our Board of Directors, and there can be no assurance that we will continue to declare and pay common stock dividends in the future.Additional issuances of equity securities by us would dilute the ownership of our existing stockholders and could reduce our earnings per share. We may issue equitysecurities in the future in connection with acquisitions, strategic transactions or for other purposes, including funding our obligations under any settlement of litigation of other claims. Any such acquisition could be material to us and could significantly increase the size and scope of our business, including our market capitalization.purposes. To the extent we issue any additional equity securities (or securities convertible into equity), the ownership of our existing stockholders would be diluted and our earnings per share could be reduced. As of December 31, 2011,2012, there were outstanding warrants outstanding forto purchase of 22,332,623 shares of our common stock. The warrants expire in June and August 2014, and give the holders the right to purchase our common stock at the following prices: $2.44$2.41 (5,200,519 shares), $2.55$2.52 (460,976 shares), and $2.49$2.46 (16,671,128 shares). The remaining warrants expire in June and August 2014. See Note 9 of Notes to Consolidated Financial Statements.
The issuance of additional shares of our preferred stock or common stock in the future could adversely affect holders of common stock. The market price of our common stock may be influenced by any preferred stock we may issue. Our board of directors is authorized to issue additional classes or series of preferred stock without any action on the part of our stockholders. This includes the power to set the terms of any such classes or series of preferred stock that may be issued, including voting rights, dividend rights and preferences over common stock with respect to dividends or upon the liquidation, dissolution or winding up of the business and other terms. If we issue preferred stock in the future that has preference over our common stock with respect to the payment of dividends or upon liquidation, dissolution or winding up, or if we issue preferred stock with voting rights that dilute the voting power of our common stock, the rights of holders of the common stock or the market price of the common stock could be adversely affected. As noted above, as of December 31, 2011, there were warrants outstanding to purchase a total of 22,332,623 shares of our common stock.As described in Note 9 of Notes to Consolidated Financial Statements, we issued 18.9 million shares of our common stock in January of 2011 in connection with conversion of our 6.5% Mandatory Convertible Preferred Stock.
If a large number of shares of our common stock are sold in the public market, the sales could reduce the trading price of our common stock and impede our ability to raise future capital. We cannot predict what effect, if any, future issuances by us of our common stock or other equity will have on the market price of our common stock. In addition,Any shares of our common stock that we may issue in connection with an acquisition may not have any resale restrictions, and therefore could be subject to resale restrictions. We may issue substantial additional shares of common stock or other securities in connection with material acquisition transactions or for other purposes, including funding of our obligations under any settlement of litigation or other claims.immediately sold by the holders. The market price of our common stock could decline if certain large holders of our common stock, or recipients of our common stock, sell all or a significant portion of their shares of common stock or are perceived by the market as intending to sell these shares other than in an orderly manner. In addition, these sales could also impair our ability to raise capital through the sale of additional common stock in the capital markets. The provisions in our certificate of incorporation, our by-laws and Delaware law could delay or deter tender offers or takeover attempts that may offer a premium for our common stock. TheCertain provisions in our certificate of incorporation, our by-laws and Delaware law could make it more difficult for a third party to acquire control of us, even if that transaction wouldcould be beneficial to stockholders. These impediments include:the classification of our board of directors into three classes serving staggered three-year terms, which makes it more difficult to quickly replace board members;
the ability of our board of directors to issue shares of preferred stock with rights as it deems appropriate without stockholder approval;
a provision that special meetings of our board of directors may be called only by our chief executive officer or a majority of our board of directors;
a provision that special meetings of stockholders may only be called pursuant to a resolution approved by a majority of our entire board of directors;
a prohibition against action by written consent of our stockholders;
a provision that our board members may only be removed for cause and by an affirmative vote of at least 80% of the outstanding voting stock;
a provision that our stockholders comply with advance-notice provisions to bring director nominations or other matters before meetings of our stockholders;
a prohibition against certain business combinations with an acquirer of 15% or more of our common stock for three years after such acquisition unless the stock acquisition or the business combination is approved by our board prior to the acquisition of the 15% interest, or after such acquisition our board and the holders of two-thirds of the other common stock approve the business combination; and
a prohibition against our entering into certain business combinations with interested stockholders without the affirmative vote of the holders of at least 80% of the voting power of the then outstanding shares of voting stock.
The existence of these provisions may deprive stockholders of an opportunity to sell our stock at a premium over prevailing prices. The potential inability of our stockholders to obtain a control premium could adversely affect the market price for our common stock.If we cannot meet the New York Stock Exchange continued listing requirements, the NYSE may delist our common stock. Our common stock is currently listed on the NYSE. In the future, if we are not be able to meet the continued listing requirements of the NYSE, which require, among other things, that the average closing price of our common stock be above $1.00 over 30 consecutive trading days, our common stock may be delisted. Our closing stock price on February 20, 2012,21, 2013, was $5.02. $4.90. If we are unable to satisfy the NYSE criteria for continued listing, our common stock would be subject to delisting. A delisting of our common stock could negatively impact us by, among other things, reducing the liquidity and market price of our common stock; reducing the number of investors willing to hold or acquire our common stock, which could negatively impact our ability to raise equity financing; decreasing the amount of news and analyst coverage for the Company; and limiting our ability to issue additional securities or obtain additional financing in the future. In addition, delisting from the NYSE might negatively impact our reputation and, as a consequence, our business.
Item 1B. Unresolved Staff Comments
Item 2. Property Descriptions OPERATING PROPERTIES
Our variousVarious of our subsidiaries own 100% of the Greens Creek Mine,mine, located on Admiralty Island near Juneau in Southeast Alaska, whichAlaska. Admiralty Island is accessed by boat, float plane, or helicopter. On the island, the mine site and various surface facilities are accessed by all-weather gravel roads. The Greens Creek mine has been in production since 1989, with a temporary care and maintenance period from April 1993 through July 1996. Since the start of production, Greens Creek has been owned and operated through various joint venture arrangements involving a variety of partners, including us.arrangements. For approximately 15 years prior to April 16, 2008, our wholly-owned subsidiary, Hecla Alaska LLC, owned an undivided 29.7% joint venture interest in the assets of Greens Creek. On April 16, 2008, we completed the acquisition of all of the equity of two Rio Tinto subsidiaries holding a 70.3% interest in the Greens Creek mine and which previously operated the mine for approximately $758.5 million. The acquisition givesgave various of our various subsidiaries control of 100% of the Greens Creek mine.
The Greens Creek orebody contains silver, zinc, gold and lead, and lies adjacent towithin the Admiralty Island National Monument, an environmentally sensitive area. The Greens Creek property includes 17639 unpatented lode mining claims, 58 patented lode claims and one patented mill site. In addition, the Greens Creek site claim, in addition to property leasedincludes properties under lease from the U.S. Forest Service.Service ("USFS") for a road right-of-way, mine portal and mill site access, camp site, mine waste area and tailings impoundment. The USFS leases have varying expiration terms. Greens Creek also has title to mineral rights on 7,5007,301 acres of federal land adjacent toacquired through a land exchange with the properties. USFS. We are currently exploring, but not mining, on such federal land.
The entire project is accessed by boat and served by 13 miles of road and consists of the mine, an ore concentrating mill, a tailings impoundment area, a ship-loading facility, camp facilities and a ferry dock. The map below illustrates the location and access to Greens Creek:
The Greens Creek deposit is a polymetallic, stratiform, massive sulfide deposit. The host rock consists of predominantly marine sedimentary, and mafic to ultramafic volcanic and plutonic rocks, which have been subjected to multiple periods of deformation. These deformational episodes have imposed intense tectonic fabrics on the rocks. Mineralization occurs discontinuouslymost often along the contact between a structural hanging wall of quartz mica carbonate phyllites and a structural footwall of graphitic and calcareous argillite. Major sulfide minerals are pyrite, sphalerite, galena, and tetrahedrite/tennanite.
Pursuant to a 1996 land exchange agreement, the joint venture transferred private property equal to a value of $1.0 million to the U.S. Forest Service and received exploration and mining rights to approximately 7,500 acres of land with mining potential surrounding the existing mine. Production from new ore discoveries on the exchanged lands will be subject to federal royalties included in the land exchange agreement. The royalty is only due on production from reserves that are not part of Greens Creek’s extralateral rights. Thus far, there has been no production triggering payment of the royalty. The royalty is 3% if the average value of the ore during a year is greater than $120 per ton of ore, and 0.75% if the value is $120 per ton or less. The benchmark of $120 per ton is adjusted annually according to the Gross Domestic Product (GDP) Implicit Price Deflator until the year 2016, and at December 31, 2011,2012, was at approximately $164$167 per ton when applying the latest GDP Implicit Price Deflator observation.Deflator.
Greens Creek is an underground mine which produces approximately 2,100 to 2,300 tons of ore per day. The primary mining methods are cut and fill and longhole stoping. The Greens Creek ore processing facility includes a SAG/ball mill grinding circuit to grind the run of mine ore to liberate the minerals and produce a slurry suitable for differential flotation of mineral concentrates. A gravity circuit recovers free gold that exists as electrum, a gold/silver alloy in the ore. Doré and gravity concentrates are produced from this circuit prior to flotation. Three flotation concentrates are produced: a lead concentrate which contain most of the silver recovered; a zinc concentrate which is processed on site atlow in precious metals content; and a mill, which produces lead,zinc-rich bulk concentrate that contains gold, silver, zinc, and bulk concentrates, as well as gold doré.lead and must be marketed to an imperial smelter. Process capacity averages between 2,200 and 2,300 tons per day depending on ore grade and hardness. In 2011,2012, ore was processed at an average rate of approximately 2,1152,157 tons per day. During 2011,day and mill recovery totaled approximately 73% silver, 79%78% zinc, 68% lead and 62%61% gold. The dorédoré is further refined by precious metal refiners and sold to banks, and the three concentrate products are sold to a number of major smelters worldwide. See Note 11 of Notes to Consolidated Financial Statements for information on the significant customers for Greens Creek’s products. Concentrates are shipped from athe Hawk Inlet marine terminal located on Admiralty Island about nine miles from the mine site.mill. Underground exploration activities at the Greens Creek unit during 2012 focused on continued expansion of the 200 South, Gallagher, NWW and Southwest Bench ore zones along trend of already-existing reserves and in new areas such as the Northeast and West contacts. Definition drilling of the 200 South, 9a and NWW ore zones resulted in additions to reserves. Surface exploration drilling was conducted in 2012 on the Killer Creek and West Gallagher targets near the Greens Creek mine where mineralization was identified. Approximately 25,000 feet of surface drilling is planned at the Greens Creek unit for 2013.
Electricity for the Greens Creek unit has historically beenis provided by diesel generators located on site. However, an agreement was reached during 2005 tothrough the purchase excessof surplus hydroelectric power from the local power company, Alaska Electric Light and Power Company (“AEL&P”). Installation of the necessary infrastructure was completed in 2006, and use of hydroelectric power commenced during the third quarter of 2006. The infrastructure is also used to provide power to surrounding communities. This project has reduced production costs at Greens Creek, to the extent power has been available. Prior to 2009,it is available after the low lake levels combined with the increased demand in the Juneau area restricted the amount of power available to Green Creek. In 2009 and 2010 , the mine received an increased proportion of its power needs from AEL&P. Hydroelectric power was also available during 2011, but to a lesser extent compared toof Juneau and the previous two years due to lower precipitation.surrounding area are met. When weather conditions are not favorable to maintain lake water levels sufficient for all of the power needs at Greens Creek to be met by available hydroelectric power, the mine relies on power provided by on-site diesel generated power.generators . The employees at Greens Creek are employees of Hecla Greens Creek Mining Company, our wholly-owned subsidiary, and are not represented by a bargaining agent. There were 364386 employees at the Greens Creek unit at December 31, 2011.2012. As of December 31, 2011,2012, we have recorded a $36.1$32.9 million asset retirement obligation for reclamation and closure costs. We continue to maintainmaintained a $30 million reclamation bond for Greens Creek.Creek as of December 31, 2012. The net book value of the Greens Creek unit property and its associated plant, equipment and mineral interests was approximately $670$681 million as of December 31, 2011.2012. Based on current ore reserve estimates, the currently known remaining mine life at Greens Creek is 10 years. Information with respect to production, average costs per ounce of silver produced and proven and probable ore reserves is set forth in the following table.
| | Years Ended December 31, | | Years Ended December 31, | |
| Production | 2011 | 2010 | | 2009 | | 2012 | | | 2011 | | | 2010 | |
| Ore milled (tons) | 772,069 | | 800,397 | | 790,871 | | | | 789,569 | | | | 772,069 | | | | 800,397 | |
| Silver (ounces) | 6,498,337 | | 7,206,973 | | 7,459,170 | | | | 6,394,235 | | | | 6,498,337 | | | | 7,206,973 | |
| Gold (ounces) | 56,818 | | 68,838 | | 67,278 | | | | 55,496 | | | | 56,818 | | | | 68,838 | |
| Zinc (tons) | 66,050 | | 74,496 | | 70,379 | | | | 64,249 | | | | 66,050 | | | | 74,496 | |
| Lead (tons) | 21,055 | | 25,336 | | 22,253 | | | | 21,074 | | | | 21,055 | | | | 25,336 | |
Average Cost per Ounce of Silver Produced(1) | | | | | | | | | | | | | | | | |
| Total cash costs | $ | (1.29 | ) | $ | (3.90 | ) | | $ | 0.35 | | | $ | 2.70 | | | $ | (1.29 | ) | | $ | (3.90 | ) |
| Total production costs | $ | 5.19 | | $ | 3.36 | | $ | 7.65 | | | $ | 9.68 | | | $ | 5.19 | | | $ | 3.36 | |
Proven Ore Reserves(2,3,4,5,6,7) | | | | | | | | | | | | | |
| Total tons | | | | 12,000 | | | | — | | | | — | |
| Contained silver (ounces) | | | | 112,500 | | | | — | | | | — | |
| Contained gold (ounces) | | | | 1,100 | | | | — | | | | — | |
| Contained zinc (tons) | | | | 930 | | | | — | | | | — | |
| Contained lead (tons) | | | | 330 | | | | — | | | | — | |
Probable Ore Reserves(2,3,4,5,6,7) | | | | | | | | | | | | | | | | |
| Total tons | 7,991,000 | | 8,243,100 | | 8,314,700 | | | | 7,845,600 | | | | 7,991,000 | | | | 8,243,100 | |
| Silver (ounces per ton) | 12.3 | | 12.1 | | 12.1 | | | | 12.0 | | | | 12.3 | | | | 12.1 | |
| Gold (ounces per ton) | 0.09 | | 0.09 | | 0.10 | | | | 0.09 | | | | 0.09 | | | | 0.09 | |
| Zinc (percent) | | 9.2 | | 9.3 | | 10.3 | | | | 9.0 | | | | 9.2 | | | | 9.3 | |
| Lead (percent) | | 3.5 | | 3.5 | | 3.6 | | | | 3.4 | | | | 3.5 | | | | 3.5 | |
| Contained silver (ounces) | 98,383,300 | | 99,730,000 | | 100,973,300 | | | | 94,481,200 | | | | 98,383,300 | | | | 99,730,000 | |
| Contained gold (ounces) | 742,400 | | 757,000 | | 847,400 | | | | 718,400 | | | | 742,400 | | | | 757,000 | |
| Contained zinc (tons) | 733,140 | | 766,500 | | 852,900 | | | | 702,300 | | | | 733,140 | | | | 766,500 | |
| Contained lead (tons) | 281,620 | | 291,300 | | 303,300 | | | | 267,410 | | | | 281,620 | | | | 291,300 | |
Total Proven and Probable Ore Reserves(2,3,4,5,6,7) | | | | | | | | | | | | | |
| Total tons | | | | 7,857,600 | | | | 7,991,000 | | | | 8,243,100 | |
| Silver (ounces per ton) | | | | 12.0 | | | | 12.3 | | | | 12.1 | |
| Gold (ounces per ton) | | | | 0.09 | | | | 0.09 | | | | 0.09 | |
| Zinc (percent) | | | | 9.0 | | | | 9.2 | | | | 9.3 | |
| Lead (percent) | | | | 3.4 | | | | 3.5 | | | | 3.5 | |
| Contained silver (ounces) | | | | 94,593,700 | | | | 98,383,300 | | | | 99,730,000 | |
| Contained gold (ounces) | | | | 719,500 | | | | 742,400 | | | | 757,000 | |
| Contained zinc (tons) | | | | 703,230 | | | | 733,140 | | | | 766,500 | |
| Contained lead (tons) | | | | 267,740 | | | | 281,620 | | | | 291,300 | |
| (1) | Includes by-product credits from gold, lead and zinc production. Cash costs per ounce of silver represent measurementsrepresents a measurement that areis not in accordance with GAAP that management uses to monitor and evaluate the performance of our mining operations. We believe cash costs per ounce of silver provides an indicator of economic performance and efficiency at each location and on a consolidated basis, as well as providing a meaningful basis to compare our results to those of other mining companies and other mining operating properties. A reconciliation of this non-GAAP measure to cost of sales and other direct production costs and depreciation, depletion and amortization, the most comparable GAAP measure, can be found in Part II,Item 7. — Management's Discussion and Analysis of Financial Condition and Results of Operations, under Reconciliation of Total Cash Costs (non-GAAP) to Costs of Sales and Other Direct Production Costs and Depreciation, Depletion and Amortization (GAAP). |
| (2) | Estimates of proven and probable ore reserves for the Greens Creek unit as of December 2012, 2011 2010 and 20092010 are calculated and reviewed in-house and are derived from successive generations of reserve and feasibility analyses for different areas of the mine, using a separate assessment of metals prices for each year. The average prices used for the Greens Creek unit were: |
| | | December 31, | | | December 31, | |
| | | 2011 | | | 2010 | | | 2009 | | | 2012 | | | 2011 | | | 2010 | |
| Silver (per ounce) | | $ | 20.00 | | | $ | 16.00 | | | $ | 13.75 | | | $ | 26.50 | | | $ | 20.00 | | | $ | 16.00 | |
| Gold (per ounce) | | $ | 1,100 | | | $ | 950 | | | $ | 775 | | | $ | 1,400 | | | $ | 1,100 | | | $ | 950 | |
| Lead (per pound) | | $ | 0.85 | | | $ | 0.80 | | | $ | 0.70 | | | $ | 0.85 | | | $ | 0.85 | | | $ | 0.80 | |
| Zinc (per pound) | | $ | 0.85 | | | $ | 0.80 | | | $ | 0.70 | | | $ | 0.85 | | | $ | 0.85 | | | $ | 0.80 | |
| (3) | Ore reserves represent in-place material, diluted and adjusted for expected mining recovery. Mill recoveries of ore reserve grades differ with ore grades, and are expected tothe 2012 reserve model assumes average mill recoveries of 73% for silver, 62%61% for gold, 87% for zinc and 77% for lead. |
| (4) | The changes in reserves in 20112012 versus 20102011 are due to continued depletion of the deposit through production, partially offset by the addition of data from new drill holes and development work and increases in forecasted precioustonnage due to higher metals prices.prices used for planning. The changes in reserves in 20102011 versus 20092010 were due to the lower ore grades for gold, zinc, and lead combined with continued depletion of the deposit, partially offset by increases in forecasted metals prices and additional drilling at the East ore zone.prices. |
| (5) | We only report probableProbable reserves at the Greens Creek unit which are based on average drill spacing of 50 to 100 feet. Proven reserves typically require that mining samples are partly the basis of the ore grade estimates used, while probable reserve grade estimates can be based entirely on drilling results. The proven reserves reported for Greens Creek for 2012 represents stockpiled ore. Cutoff grade assumptions vary by orebody and are developed based on reserve prices, anticipated mill recoveries and smelter payables and cash operating costs. Due to multiple ore metals, and complex combinations of ore types, metal ratios and metallurgical performances at Greens Creek, the cutoff grade is expressed in terms of net smelter return (“NSR”), rather than metal grade. The cutoff grade was $160$190 per ton NSR. |
| (6) | Greens Creek ore reserve estimates were prepared by Ben Gage,Kerry Lear, Senior Resource Geologist at the Greens Creek unit and reviewed by John Taylor, Senior Resource Geologist at Hecla Limited. |
| (7) | An independent review by AMEC E&C, Inc. was completedoccurred in 2010 for2012. The review included the 2009 reserve models for2012 model containing a portion, 204,000 tons, of the 5250 and 9A zones.200 South zone that is included in reserves. The final report on the review is pending. |
Since 1958, we have owned and operated the Lucky Friday unit,mine, a deep underground silver, lead and zinc mine located in the Coeur d’Alene Mining District in northern Idaho. Lucky Friday is one-quarter mile east of Mullan, Idaho, and is adjacent to U.S. Interstate 90. The mine site and various surface facilities are accessed by paved roads from U.S. Interstate 90. Below is a map illustrating the location and access to the Lucky Friday unit:
There have been two ore-bearing structures mined at the Lucky Friday unit. The first, mined through 2001, was the Lucky Friday vein, a fissure vein typical of many in the Coeur d’Alene Mining District. The ore body is located in the Revett Formation, which is known to provide excellent host rocks for a number of ore bodies in the Coeur d’Alene Mining District. The Lucky Friday vein strikes northeasterly and dips steeply to the south with an average width of six to seven feet. Its principal ore minerals are galena and tetrahedrite with minor amounts of sphalerite and chalcopyrite. The ore occurs as a single continuous ore body in and along the Lucky Friday vein. The major part of the ore body has extended from 1,200 feet to 6,020 feet below surface. The second ore-bearing structure, known as the Lucky Friday Expansion Area, has been mined since 1997 pursuant to an operating agreement with Silver Hunter Mining Company (“Silver Hunter”), our wholly owned subsidiary. During 1991, we discovered several mineralized structures containing some high-grade silver ores in an area known as the Gold Hunter property, approximately 5,000 feet northwest of the then existing Lucky Friday workings. This discovery led to the development of the Gold Hunter property on the 4900 level. At approximately 4,900 feet below surface, the Gold Hunter veins are hosted in a 200-foot thick siliceous lens within the Wallace Formation that transitions to the St. Regis Formation below 5,900 feet. The veins are sub-parallel, and are numbered consecutively from the hanging wall of the favorable horizon to the footwall. The strike of the vein system is west-northwest with a dip of 85 degrees to the south. The 30-vein, which has demonstrated to contain higher silver grades, represents approximately 73%79% of our current proven and probable ore reserve tonnages, while the remaining 27%21% of our reserves are contained in various intermediate veins having lower silver grades than 30-vein. While the veins share many characteristics with the Lucky Friday vein, the Gold Hunter area possesses some mineralogical and rock mechanics differences that make it more favorable to mine at this time. On November 6, 2008, we, through Silver Hunter, completed the acquisition of substantially all of the assets of Independence Lead Mines Company, (“Independence”), includingwhich held an interest in the Gold Hunter property. The acquisition included all future interestinterests or royalty obligationobligations to Independence and the mining claims pertaining to the operating agreement with Hecla Limited that was assigned to Silver Hunter. The principal mining method at the Lucky Friday unit is ramp access, cut and fill. This method utilizes rubber-tired equipment to access the veins through ramps developed outside of the ore body. Once a cut is taken along the strike of the vein, it is backfilled with cemented tailings and the next cut is accessed, either above or below, from the ramp system. The ore produced fromOre at the Lucky Friday is processed using a conventional lead/zinc flotation flow sheet, with process control guided by a real-time on-line analyzer. Run of mine ore is crushed in a conventional flotation mill, which produces boththree stage crushing plant consisting of a lead concentrateprimary jaw crusher, and a secondary crushing circuit, and tertiary cone crushing stage. Crushed ore is ground in a ball mill, and the ground slurry reports to the lead flotation circuit. The lead circuit tailings report to the zinc concentrate.flotation circuit. Lead and zinc concentrates are thickened and filtered, and final concentrate products are shipped to smelters for final processing. Current processing capacity of the Lucky Friday facility is approximately 1,000 tons per day. As discussed further below, production at Lucky Friday was temporarily suspended during 2012. In 2011, ore was processed at an average rate of approximately 905 tons per day. During 2011, mill recovery totaled approximately 93% silver, 93% lead and 87% zinc. All silver-lead and zinc concentrate production during 2011 was shipped to Teck Cominco Limited’s smelter in Trail, British Columbia, Canada.
Underground exploration activities were suspended at the Lucky Friday unit during 2012 as rehabilitation of the Silver Shaft was completed (discussed below). During 2012 all the reserves models were converted from 2D to 3D to allow better representation of the ore zones and allow improved mining stope designs. In-fill drilling in 2013 from 6800 to 7300 Levels is expected to allow for the potential addition of reserves in the western portion of the mine. Exploration drilling has shown the pervasive continuity of mineralization at depth and encouraging results confirmed expansion to the east. In 2013, drilling is expected to evaluate areas to the east from 6400 to 7200 Levels. Surface exploration in the Silver Valley, near the Lucky Friday mine, focused in the Star-Morning area but also evaluated the Noonday, Moffat, You Like and Tamarack veins. Additional surface exploration drilling is planned for 2013.
Based on current reserve estimates of reserves, mineralized material, and other resources, the currently known remainingexpected mine life at the Lucky Friday is approximately 2526 years. Information with respect to the Lucky Friday unit’s production, average cost per ounce of silver produced and proven and probable ore reserves for the past three years is set forth in the table below.
| | | Years Ended December 31, | |
| Production | | 2011 | | | 2010 | | | 2009 | |
| Ore milled (tons) | | | 298,672 | | | | 351,074 | | | | 346,395 | |
| Silver (ounces) | | | 2,985,339 | | | | 3,359,379 | | | | 3,530,490 | |
| Lead (tons) | | | 18,095 | | | | 21,619 | | | | 22,010 | |
| Zinc (tons) | | | 7,305 | | | | 9,286 | | | | 10,616 | |
| | | | | | | | | | | | | |
Average Cost per Ounce of Silver Produced(1) | | | | | | | | | | | | |
| Total cash costs | | $ | 6.47 | | | $ | 3.76 | | | $ | 5.21 | |
| Total production costs | | $ | 8.50 | | | $ | 6.25 | | | $ | 8.02 | |
| | | | | | | | | | | | | |
Proven Ore Reserves(2,3,4) | | | | | | | | | | | | |
| Total tons | | | 2,345,500 | | | | 1,642,100 | | | | 1,358,200 | |
| Silver (ounces per ton) | | | 12.6 | | | | 12.4 | | | | 12.3 | |
| Lead (percent) | | | 7.8 | | | | 7.8 | | | | 8.0 | |
| Zinc (percent) | | | 3.0 | | | | 2.8 | | | | 2.6 | |
| Contained silver (ounces) | | | 29,573,900 | | | | 20,387,600 | | | | 16,640,300 | |
| Contained lead (tons) | | | 183,100 | | | | 128,000 | | | | 109,100 | |
| Contained zinc (tons) | | | 70,160 | | | | 46,000 | | | | 35,100 | |
| | | | | | | | | | | | | |
Probable Ore Reserves(2,3,4) | | | | | | | | | | | | |
| Total tons | | | 1,345,300 | | | | 1,545,100 | | | | 1,577,000 | |
| Silver (ounces per ton) | | | 14.7 | | | | 14.2 | | | | 13.9 | |
| Lead (percent) | | | 9.3 | | | | 8.9 | | | | 8.9 | |
| Zinc (percent) | | | 3.2 | | | | 3.0 | | | | 2.9 | |
| Contained silver (ounces) | | | 19,746,200 | | | | 21,955,000 | | | | 21,947,600 | |
| Contained lead (tons) | | | 124,720 | | | | 136,800 | | | | 140,300 | |
| Contained zinc (tons) | | | 42,890 | | | | 46,500 | | | | 46,100 | |
| | | | | | | | | | | | | |
Total Proven and Probable Ore Reserves(2,3,4,5,6) | | | | | | | | | | | | |
| Total tons | | | 3,690,800 | | | | 3,187,200 | | | | 2,935,200 | |
| Silver (ounces per ton) | | | 13.4 | | | | 13.3 | | | | 13.1 | |
| Lead (percent) | | | 8.3 | | | | 8.3 | | | | 8.5 | |
| Zinc (percent) | | | 3.1 | | | | 2.9 | | | | 2.8 | |
| Contained silver (ounces) | | | 49,320,100 | | | | 42,342,600 | | | | 38,587,900 | |
| Contained lead (tons) | | | 307,820 | | | | 264,900 | | | | 249,400 | |
| Contained zinc (tons) | | | 113,050 | | | | 92,500 | | | | 81,200 | |
| | | Years Ended December 31, | |
| Production | | 2012 | | | 2011 | | | 2010 | |
| Ore milled (tons) | | | — | | | | 298,672 | | | | 351,074 | |
| Silver (ounces) | | | — | | | | 2,985,339 | | | | 3,359,379 | |
| Lead (tons) | | | — | | | | 18,095 | | | | 21,619 | |
| Zinc (tons) | | | — | | | | 7,305 | | | | 9,286 | |
| | | | | | | | | | | | | |
Average Cost per Ounce of Silver Produced(1) | | | | | | | | | | | | |
| Total cash costs | | $ | — | | | $ | 6.47 | | | $ | 3.76 | |
| Total production costs | | $ | — | | | $ | 8.50 | | | $ | 6.25 | |
| | | | | | | | | | | | | |
Proven Ore Reserves(2,3,4) | | | | | | | | | | | | |
| Total tons | | | 2,206,600 | | | | 2,345,500 | | | | 1,642,100 | |
| Silver (ounces per ton) | | | 12.1 | | | | 12.6 | | | | 12.4 | |
| Lead (percent) | | | 7.4 | | | | 7.8 | | | | 7.8 | |
| Zinc (percent) | | | 2.7 | | | | 3.0 | | | | 2.8 | |
| Contained silver (ounces) | | | 26,778,900 | | | | 29,573,900 | | | | 20,387,600 | |
| Contained lead (tons) | | | 163,350 | | | | 183,100 | | | | 128,000 | |
| Contained zinc (tons) | | | 58,560 | | | | 70,160 | | | | 46,000 | |
| | | | | | | | | | | | | |
Probable Ore Reserves(2,3,4) | | | | | | | | | | | | |
| Total tons | | | 1,931,700 | | | | 1,345,300 | | | | 1,545,100 | |
| Silver (ounces per ton) | | | 14.8 | | | | 14.7 | | | | 14.2 | |
| Lead (percent) | | | 8.7 | | | | 9.3 | | | | 8.9 | |
| Zinc (percent) | | | 3.2 | | | | 3.2 | | | | 3.0 | |
| Contained silver (ounces) | | | 28,676,000 | | | | 19,746,200 | | | | 21,955,000 | |
| Contained lead (tons) | | | 167,390 | | | | 124,720 | | | | 136,800 | |
| Contained zinc (tons) | | | 62,300 | | | | 42,890 | | | | 46,500 | |
| | | | | | | | | | | | | |
Total Proven and Probable Ore Reserves(2,3,4,5) | | | | | | | | | | | | |
| Total tons | | | 4,138,300 | | | | 3,690,800 | | | | 3,187,200 | |
| Silver (ounces per ton) | | | 13.4 | | | | 13.4 | | | | 13.3 | |
| Lead (percent) | | | 8.0 | | | | 8.3 | | | | 8.3 | |
| Zinc (percent) | | | 2.9 | | | | 3.1 | | | | 2.9 | |
| Contained silver (ounces) | | | 55,454,900 | | | | 49,320,100 | | | | 42,342,600 | |
| Contained lead (tons) | | | 330,740 | | | | 307,820 | | | | 264,800 | |
| Contained zinc (tons) | | | 120,860 | | | | 113,050 | | | | 92,500 | |
| (1) | Includes by-product credits from lead and zinc production. Cash costs per ounce of silver represent measurementsrepresents a measurement that areis not in accordance with GAAP that management uses to monitor and evaluate the performance of our mining operations. We believe cash costs per ounce of silver provides an indicator of economic performance and efficiency at each location and on a consolidated basis, as well as providing a meaningful basis to compare our results to those of other mining companies and other mining operating properties. A reconciliation of this non-GAAP measure to cost of sales and other direct production costs and depreciation, depletion and amortization, the most comparable GAAP measure, can be found in Item 7. — Management’s Discussion and Analysis of Financial Condition and Results of Operations, under Reconciliation of Total Cash Costs (non-GAAP) to Costs of Sales and Other Direct Production Costs and Depreciation, Depletion and Amortization (GAAP). |
| (2) | Proven and probable ore reserves are calculated and reviewed in-house and are subject to periodic audit by others, although audits are not performed on an annual basis. Cutoff grade assumptions vary by ore body and are developed based on reserve prices, anticipated mill recoveries and smelter payables and cash operating costs. Due to multiple ore metals, and complex combinations of ore types, metal ratios and metallurgical performances at the Lucky Friday, the cutoff grade is expressed in terms of net smelter return (“NSR”), rather than metal grade. The cutoff grade at the Lucky Friday ranges from $74$76 per ton NSR to $92$89 per ton NSR. Our estimates of proven and probable reserves are based on the following metals prices: |
| | | December 31, | | | December 31, | |
| | | 2011 | | | 2010 | | | 2009 | | | 2012 | | | 2011 | | | 2010 | |
| Silver (per ounce) | | $ | 20.00 | | | $ | 16.00 | | | $ | 13.75 | | | $ | 26.50 | | | $ | 20.00 | | | $ | 16.00 | |
| Lead (per pound) | | $ | 0.85 | | | $ | 0.80 | | | $ | 0.70 | | | $ | 0.85 | | | $ | 0.85 | | | $ | 0.80 | |
| Zinc (per pound) | | $ | 0.85 | | | $ | 0.80 | | | $ | 0.70 | | | $ | 0.85 | | | $ | 0.85 | | | $ | 0.80 | |
| (3) | Reserves are in-place materials that incorporate estimates of the amount of waste that must be mined along with the ore and expected mining recovery. Mill recoveries are expected to be 93% for silver, 93% for lead and 87% for zinc. |
| (4) | The changes in reserves in 2012 versus 2011 are primarily due to inclusion of additional areas into the mine plan as a result of additional drilling and higher metals prices used for planning. The changes in reserves in 2011 versus 2010 are due to addition of data from new drill holes and development work, an increase in mining widths in areas utilizing mechanized mining, and increases in forecasted metals prices, which has resulted in the addition of new reserves based on updated estimates, partially offset by depletion due to production. The changes in reserves in 2010 versus 2009, and in 2009 versus 2008, are due to addition of data from new drill holes and development work, higher ore grades, and increases in forecasted metals prices, which resulted in the addition of new reserves based on updated estimates, partially offset by depletion due to production. |
| (5) | Lucky Friday ore reserve estimates were prepared by Terry DeVoe, Chief Geologist at the Lucky Friday unit and reviewed by John Taylor, Senior Resource Geologist at Hecla Limited. |
(6) | An independent audit by Scott Wilson Roscoe Postle Associates Inc. was completed in January 2010 for the 2009 reserve model at the Lucky Friday mine. |
A number of accidents and other events have recently impacted operations at the Lucky Friday. In April 2011, a fall of ground caused the fatality of one employee, resulting in cessation of operations for approximately 10 days. In November 2011, an accident occurred as part of the construction of #4 Shaft and resulted in the fatality of one contractor employee. In an unrelated incident, in December 2011, a rock burst occurring in a primary access way at the Lucky Friday injured seven employees, with no fatalities as a result of that incident.employees. At the end of 2011, the Mine Safety Health AdministrationMSHA began a special impact inspection at the Lucky Friday which resulted in an order to remove loosebuilt-up cementitious material from the Silver Shaft, the primary access way from surface at the Lucky Friday mine. In response, we submitted a plan to MSHA and received approval to remove the loosebuilt-up cementitious material. In addition, the plan includesincluded removal of unused utilities, construction of a water ring to prevent ice from forming in the winter, the installation of a metal brattice, repair of shaft steel, and installation of a new power and fiber optic cable, all of which should improve the shaft's functionality and possibly improve the shaft's hoisting capacity. Once the shaft cleanup has beenwas complete down to the 4900 level, work on a haulage way bypassing the area at the 5900 level impacted by the December 2011 rock burst is expected to commence.commenced. Work on the Silver Shaft and the haulage way was completed in the first quarter of 2013. Underground access will bewas temporarily limited (e.g., to allow maintenance of pumps in the mine) as this work iswas being performed, and we anticipate that production at the Lucky Friday mine will bewas suspended from late 2011 until early 2013 as a result. WeLimited production commenced in the first quarter of 2013, and we anticipate returninga ramp-up of mine output during the year as we perform additional rehabilitation and get necessary clearance from MSHA until we return to full production levels at the Lucky Friday once the Silver Shaft work and work related to the 5900 haulage way bypass is complete.by approximately mid-2013.
During 2008, we initiated engineering, procurement and development activities relating to construction of #4 Shaft at the Lucky Friday mine, which, upon completion, would provide access from the 4900 level down to the 8800 level of the mine. The project was temporarily placed on hold in the fourth quarter of 2008 due to then prevailing metals prices. However, detailed engineering, long lead time procurement, and other early-stage activities for the internal shaft project resumed in 2009. Activities in 2010 and 2011 relating to #4 Shaft included engineering, erection of a surface concrete batch plant, and work on #4 Shaft, including: detailed shaft design, excavation of the hoist room and off shaft development access to shaft facilities, installation of the hoist and head works, placement and receipt of orders for major equipment purchases, advancement of a geotechnical drill hole, 367 feet of vertical excavation, shaft-sinking set-up, and other construction activities. Upon completion, #4 Shaft wouldshould allow us to mine mineralized material below our current workings and provide deeper platforms for exploration. The Board of Directors approved the #4 Shaft project in its entirety in August 2011. Construction of #4 Shaft is expected to take approximately three more years to complete after re-commencement, and capital expenditures for the project are forecast to total approximately $200 million, including approximately $90$92 million spent on the project through December 31, 2011.2012. As a result of the requirement to remove any loosebuilt-up cementitious material from the Silver Shaft (discussed above), work on the #4 Shaft project will bewas suspended until completion of the Silver Shaft rehabilitation is completed. Werehabilitation. Work on #4 Shaft has re-commenced, and we believe that our current capital resources will allow us to proceed at that time.complete the #4 Shaft project as designed. However, there are a number of factors that could affect completion of the project, including a significant decline in metals prices or a significant increase in operating or capital costs. An increase in the capital cost could potentially require us to suspend the project or access additional capital though debt financing, the sale of securities, or other external sources. This additional financing could be costly or unavailable.
Reclamation activities are anticipated to include stabilization of tailings ponds and waste rock areas. No final reclamation activities wereReclamation of one of the idle tailings ponds was performed at Lucky Friday in 2011,2012, and at December 31, 2011,2012, an asset retirement obligation of approximately $1.5 million had been recorded for reclamation and closure costs.
The net book value of the Lucky Friday unit property and its associated plant, equipment and mineral interests was approximately $202$253.0 million as of December 31, 2011.2012. The constructionage of the facilities at Lucky Friday ranges from the 1950s to 2011.2012. The plant is maintained by our employees with assistance from outside contractors as needed.
At December 31, 2011,2012, there were 285239 employees at the Lucky Friday unit. The United Steel, Paper and Forestry, Rubber, Manufacturing, Energy, Allied Industrial, and Service Workers International Union is the bargaining agent for the Lucky Friday’s 217180 hourly employees. The current labor agreement expires on April 30, 2016. As a result of the requirement to remove loosebuilt-up cementitious material from the Silver Shaft, (discussed above), which will limitlimited underground access and temporarily suspendsuspended production at the Lucky Friday, Hecla Limited laid off 121 employees in January 2012, with approximately 25 of those employees accepting temporary positions at other Hecla operations. We anticipate thatThe employment levelslevel at the Lucky Friday will returnhas returned roughly to where they were atit was prior to the suspension of production, aswith most of the Silver Shaft work is completed.laid off employees returning. Avista Corporation supplies electrical power to the Lucky Friday unit.
Item 3. Legal Proceedings For a discussion of our legal proceedings, see Note 7 of Notes to Consolidated Financial Statements.
Item 4. Mine Safety Disclosures
The information concerning mine safety violations or other regulatory matters required by Section 1503(a) of the Dodd-Frank Wall Street Reform and Consumer Protection Act and Item 104 of Regulation S-K is included in exhibit 95 to this Annual Report.
Item 5. Market for Registrant’s Common Equity, Related Stockholder Matters and Issuer Purchases of Equity Securities (a) | (i) Shares of our common stock are traded on the New York Stock Exchange, Inc. |
| (ii) | Our common stock quarterly high and low sale prices for the past two years were as follows: |
| | | | | | | | | | | | | | |
| 2011 | – High | | $ | 7.00 | | | $ | 8.65 | | | $ | 9.95 | | | $ | 11.56 | |
| | – Low | | $ | 4.82 | | | $ | 5.32 | | | $ | 6.87 | | | $ | 7.81 | |
| 2010 | – High | | $ | 11.52 | | | $ | 6.44 | | | $ | 6.47 | | | $ | 6.99 | |
| | – Low | | $ | 6.20 | | | $ | 4.52 | | | $ | 4.86 | | | $ | 4.27 | |
(b) | As of February 17, 2012, there were6,933 shareholders of record of our common stock. |
| | | | Fourth Quarter | | | Third Quarter | | | Second Quarter | | | First Quarter | |
| 2012 | – High | | $ | 6.81 | | | $ | 6.94 | | | $ | 4.96 | | | $ | 5.99 | |
| | – Low | | $ | 5.25 | | | $ | 4.14 | | | $ | 3.70 | | | $ | 4.25 | |
| 2011 | – High | | $ | 7.00 | | | $ | 8.65 | | | $ | 9.95 | | | $ | 11.56 | |
| | – Low | | $ | 4.82 | | | $ | 5.32 | | | $ | 6.87 | | | $ | 7.81 | |
(c) | Quarterly dividends were paid on our Series B Preferred Stock for 2011 and 2012, and no dividends are in arrears. The final quarterly dividend on our 6.5% Mandatory Convertible Preferred Stock for the fourth quarter of 2010 was paid in January 2011, and no dividends are in arrears. All outstanding shares of our 6.5% Mandatory Convertible Preferred Stock converted to common stock on January 1, 2011. In September 2011, our Board of Directors adopted a common stock dividend policy that links the anticipated amount of any dividend declared on our common stock to our average quarterly realized silver price in the preceding quarter. In November 2011, we paid the first quarterly common stock dividend totaling $5.6 million in cash under the policy. Prior to 2011, no dividends had been declared on our common stock since 1990. We cannot pay dividends on our common stock if we fail to pay dividends on our Series B Preferred Stock. In January 2010, we paid all cumulative, unpaid dividends on both our Series B and 6.5% Mandatory Convertible Preferred Stock. Prior to January 2010, quarterly dividends were paid on our Series B Preferred Stock through the first three quarters of 2008, with $0.7 million for cumulative, unpaid dividends at December 31, 2009 for the fourth quarter 2008 and year ended December 31, 2009. Prior to January 2010, dividends were paid on our 6.5% Mandatory Convertible Preferred Stock through the first three quarters of 2008, with cumulative, unpaid dividends of $16.5 million at December 31, 2009 for the fourth quarter of 2008 and year ended December 31, 2009. The $0.7 million in dividends paid in January 2010 on our Series B Preferred Stock were paid in cash, while the $16.5 million in dividends paid in January 2010 on our 6.5% Mandatory Convertible Preferred Stock were paid in shares of our common stock. |
(d) | The following table provides information as of December 31, 2011, regarding our compensation plans under which equity securities are authorized for issuance: |
In September 2011 and February 2012, our Board of Directors adopted a common stock dividend policy that has two components: (1) a dividend that links the amount of dividends on our common stock to our average quarterly realized silver price in the preceding quarter, and (2) a minimum annual dividend of $0.01 per share of common stock, in each case, payable quarterly, when declared. See Note 9 of Notes to Consolidated Financial Statements for more information on potential dividend amounts under the first component of the policy at various silver prices. The following table summarizes the common stock dividends declared by our Board of Directors under the policy described above:
| | | (A) | | | (B) | | | (A+B) | | | | | |
| Declaration date | | Silver-price-linked component per share | | | Minimum annual component per share | | | Total dividend per share | | | Total dividend amount (in millions) | | Month of payment |
| November 8, 2011 | | $ | 0.02 | | | $ | 0 | | | $ | 0.02 | | | $ | 5.6 | | December 2011 |
| February 17, 2012 | | $ | 0.01 | | | $ | 0.0025 | | | $ | 0.0125 | | | $ | 3.6 | | March 2012 |
| May 8, 2012 | | $ | 0.02 | | | $ | 0.0025 | | | $ | 0.0225 | | | $ | 6.4 | | June 2012 |
| August 7, 2012 | | $ | — | | | $ | 0.0025 | | | $ | 0.0025 | | | $ | 0.7 | | September 2012 |
| November 2, 2012 | | $ | 0.02 | | | $ | 0.0025 | | | $ | 0.0225 | | | $ | 6.4 | | December 2012 |
| February 25, 2013 | | $ | — | | | $ | 0.0025 | | | $ | 0.0025 | | | $ | 0.7 | | anticipated in March 2013 |
Because the average realized silver price for the second and fourth quarters of 2012 was $27.05 and $29.20 per ounce, respectively, below the minimum threshold of $30 according to the policy, no silver-price-linked component was declared or paid. However, on February 25, 2013, our Board of Directors declared a special common stock dividend of $0.01 per share, in addition to the minimum dividend of $0.0025 per share, for an aggregate dividend of $3.6 million. Once declared, it is payable in March 2013. Prior to 2011, no dividends had been declared on our common stock since 1990. We cannot pay dividends on our common stock if we fail to pay dividends on our Series B Preferred Stock. The declaration and payment of common stock dividends, whether pursuant to the policy or in addition thereto, is at the sole discretion of our Board of Directors, and there can be no assurance that we will continue to declare and pay common stock dividends in the future.
The following table provides information as of December 31, 2012 regarding our compensation plans under which equity securities are authorized for issuance:
| | | Number of Securities To Be Issued Upon Exercise of Outstanding Options, Warrants and Rights | | | Weighted-Average Exercise Price of Outstanding Options | | | Number of Securities Remaining Available For Future Issuance Under Equity Compensation Plans | |
| Equity Compensation Plans Approved by Security Holders: | | | | | | | | | |
| 2010 Stock Incentive Plan | | | — | | | | N/A | | | | 19,605,740 | |
| 1995 Stock Incentive Plan | | | 938,408 | | | | 6.23 | | | | — | |
| Stock Plan for Non-employee Directors | | | — | | | | N/A | | | | 622,685 | |
| Key Employee Deferred Compensation Plan | | | — | | | | N/A | | | | 1,325,012 | |
| Total | | | 938,408 | | | | 6.23 | | | | 21,553,437 | |
| | | | | | | | | | |
| Equity Compensation Plans Approved by Security Holders: | | | | | | | | | |
| 2010 Stock Incentive Plan | | | 14,663 | | | | 5.94 | | | | 19,696,320 | |
| 1995 Stock Incentive Plan | | | 1,180,133 | | | | 6.73 | | | | — | |
| Stock Plan for Non-employee Directors | | | — | | | | N/A | | | | 671,061 | |
| Key Employee Deferred Compensation Plan | | | — | | | | N/A | | | | 2,126,783 | |
| Total | | | 1,194,796 | | | | 6.72 | | | | 22,494,164 | |
See Note 8 and Note 9 of Notes to Consolidated Financial Statements for information regarding the above plans. (e) | On December 12, 2011, we issued 5,395,683 unregistered shares of common stock to the various parties listed in the Purchase and Sale Agreement filed as exhibit 10.1 to our Current Report on Form 8-K filed on December 13, 2011. The shares were not registered under the Securities Act of 1933 in reliance on Section 4(2) of such Act and Regulation D thereunder, as transactions by an issuer not involving any public offering, and were issued for the acquisition of the remaining 30% interest in the San Juan Silver project (see Note 16 of Notes to Consolidated Financial Statements for information). We did not issue any unregistered securities in 2010. However, we did issue 604,555 and 631,832 shares of common stock on April 1 and July 1, 2010, respectively, as payment of the quarterly dividend on our formerly outstanding 6.5% Mandatory Convertible Preferred Stock. During 2009, we issued unregistered securities as follows:
|
| a. | On February 10, 2009, we issued 42,621 unregistered shares of our 12% Convertible Preferred Stock to our various lenders listed in the Fourth Amendment to our Credit Agreement filed as exhibit 10.5 to our Current Report on Form 8-K filed on February 4, 2009. The shares were not registered under the Securities Act of 1933 in reliance on Section 4(2) of such Act and Regulation D thereunder, as transactions by an issuer not involving any public offering, and issued as a fee to the lenders for the deferral of principal payments under the Fourth Amendment. |
| b. | On June 4, 2009, we issued unregistered equity securities in a private placement pursuant to Section 4(2) of the Securities Act of 1933 Act and Regulation D thereunder as transactions by an issuer not involving any public offering. The securities consist of 17,391,302 shares of our common stock and Series 4 Warrants to purchase 12,173,913 shares of our common stock. The Series 4 Warrants had an exercise price of $3.68 per share, subject to certain adjustments. They became exercisable on December 7, 2009 and remained exercisable during the 181 day period following that date. The proceeds from the issuance were used to repay a portion of the prior outstanding balance on our amended and restated credit facility. |
We did not issue any unregistered securities in 2012. On December 12, 2011, we issued 5,395,683 unregistered shares of common stock to the various parties listed in the Purchase and Sale Agreement filed as exhibit 10.1 to our Current Report on Form 8-K filed on December 13, 2011. The shares were not registered under the Securities Act of 1933 in reliance on Section 4(2) of such Act and Regulation D thereunder, as transactions by an issuer not involving any public offering, and were issued for the acquisition of the remaining 30% interest in the San Juan Silver project (see Note 16 (f) | Comparison of Five-Year Cumulative Total Shareholder Return—December 2006 through December 2011(1) of Notes to Consolidated Financial Statements for information). We did not issue any unregistered securities in 2010; however, we did issue 604,555 and 631,832 shares of common stock on April 1 and July 1, 2010, respectively, as payment of the quarterly dividend on our formerly outstanding 6.5% Mandatory Convertible Preferred Stock.:
|
Hecla Mining Company,The following performance graph compares the performance of our common stock during the period beginning December 31, 2007 and ending December 31, 2012 to the S&P 500, the S&P 500 Gold Index, a peer group for the year ending December 31, 2012 ("New Peer Group"), and Customa peer group for the year ending December 31, 2011. The New Peer Group(2,3)
| | Hecla Mining | | | S&P 500 | | | | | | | | | Group 3 | |
| December 2006 | | $ | 100.00 | | | $ | 100.00 | | | $ | 100.00 | | | $ | 100.00 | | | $ | 100.00 | |
| December 2007 | | $ | 122.06 | | | $ | 105.49 | | | $ | 109.15 | | | $ | 104.26 | | | $ | 101.42 | |
| December 2008 | | $ | 36.55 | | | $ | 66.46 | | | $ | 91.88 | | | $ | 69.89 | | | $ | 71.03 | |
| December 2009 | | $ | 80.68 | | | $ | 84.05 | | | $ | 107.75 | | | $ | 139.59 | | | $ | 142.94 | |
| December 2010 | | $ | 147.00 | | | $ | 96.71 | | | $ | 141.11 | | | $ | 213.19 | | | $ | 220.23 | |
| December 2011 | | $ | 68.49 | | | $ | 98.75 | | | $ | 140.15 | | | $ | 164.62 | | | $ | 176.50 | |
(1) | Total shareholder return assuming $100 invested on December 31, 2006 and reinvestment of dividends on quarterly basis. |
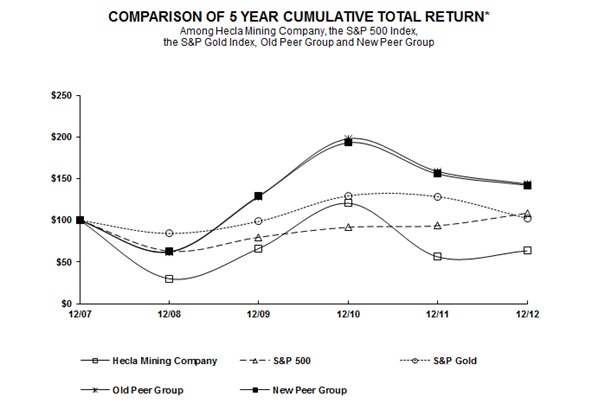
(2) | Centerra Gold, Inc., Coeur d’Alene Mines Corp., Eldorado Gold Corp., Golden Star Resources Ltd., IAMGOLD Corporation, New Gold Incorporation, Pan American Silver Corp., Stillwater Mining Company. |
| Date | | Hecla Mining | | | S&P 500 | | | S&P 500 Gold Index | | | 2011 Old Peer Group | | | 2012 New Peer Group | |
| December 2007 | | $ | 100.00 | | | $ | 100.00 | | | $ | 100.00 | | | $ | 100.00 | | | $ | 100.00 | |
| December 2008 | | $ | 29.95 | | | $ | 63.00 | | | $ | 84.18 | | | $ | 61.88 | | | $ | 62.29 | |
| December 2009 | | $ | 66.10 | | | $ | 79.67 | | | $ | 98.72 | | | $ | 128.43 | | | $ | 129.03 | |
| December 2010 | | $ | 120.43 | | | $ | 91.67 | | | $ | 129.29 | | | $ | 197.87 | | | $ | 192.98 | |
| December 2011 | | $ | 56.11 | | | $ | 93.61 | | | $ | 128.40 | | | $ | 158.58 | | | $ | 155.61 | |
| December 2012 | | $ | 63.29 | | | $ | 108.59 | | | $ | 102.20 | | | $ | 143.52 | | | $ | 141.99 | |
(3) | Alamos Gold Inc., Allied Nevada Gold Corp., Centerra Gold, Inc., Coeur d’Alene Mines Corp., Eldorado Gold Corp., Golden Star Resources Ltd., IAMGOLD Corporation, New Gold Incorporation, Pan American Silver Corp., Stillwater Mining Company. The changes in our 2011 peer group compared to the 2010 peer group were to add Alamos Gold Inc. and Allied Nevada Gold Corp. This change was made to include additional companies that we have determined to be within an acceptable revenue range. Also, one company previously included in our peer group was removed as a result of its stock no longer being registered on an exchange. |
The stock performance information above is “furnished” and shall not be deemed to be “soliciting material” or subject to Rule 14A, shall not be deemed “filed” for purposes of Section 18 of the Exchange Act or otherwise subject to the liabilities of that section, and shall not be deemed incorporated by reference in any filing under the Securities Act of 1933, as amended, or the Exchange Act, whether made before or after the date of this report and irrespective of any general incorporation by reference language in any such filing, except to the extent that it specifically incorporates the information by reference.
On May 8, 2012, we announced that our Board of Directors approved a stock repurchase program ("the program"). Under the program, we are authorized to repurchase up to 20 million shares of our outstanding common stock from time to time in open market or privately negotiated transactions. See Note 9 of Notes to Consolidated Financial Statements for more information. All of the shares in the table below were purchased under the program. The following table provides information about purchases we made during the quarter ended December 31, 2012 of equity securities that are registered by us pursuant to Section 12 of the Exchange Act:
| Period | | Total number of shares purchased | | | Average price paid per share | | | Total number of shares purchased as part of publicly announced programs | | | Maximum number of shares that may yet to be purchased under the program as of 12/31/2012 | |
| 10/1/2012 | - | 10/31/2012 | | — | | | N/A | | | N/A | | | | |
| 11/1/2012 | - | 11/30/2012 | | 100,000 | | | $ | 5.64 | | | 100,000 | | | | |
| 12/1/2012 | - | 12/31/2012 | | 190,300 | | | $ | 5.69 | | | 190,300 | | | | |
| Total | | 290,300 | | | $ | 5.67 | | | 290,300 | | | 19,649,700 | |
Item 6. Selected Financial Data The following table (in thousands, except per share amounts, common shares issued, shareholders of record, and employees) sets forth selected historical consolidated financial data as of and for each of the years ended December 31, 20072008 through 2011,2012, and is derived from our audited financial statements. The data set forth below should be read in conjunction with, and is qualified in its entirety by, our Consolidated Financial Statements and the Notes thereto.
28
| | | 2012 (7) | | | 2011 | | | 2010 | | | 2009 | | | 2008 (4) | |
| Sales of products | | $ | 321,143 | | | $ | 477,634 | | | $ | 418,813 | | | $ | 312,548 | | | $ | 204,665 | |
| Net income (loss) from continuing operations | | $ | 14,954 | | | $ | 151,164 | | | $ | 48,983 | | | $ | 67,826 | | | $ | (37,173 | ) |
Loss from discontinued operations, net of tax (5) | | $ | — | | | $ | — | | | $ | — | | | $ | — | | | $ | (17,395 | ) |
Loss on disposal of discontinued operations, net of tax (5) | | $ | — | | | $ | — | | | $ | — | | | $ | — | | | $ | (11,995 | ) |
| Net income (loss) | | $ | 14,954 | | | $ | 151,164 | | | $ | 48,983 | | | $ | 67,826 | | | $ | (66,563 | ) |
Preferred stock dividends (2,3) | | $ | (552 | ) | | $ | (552 | ) | | $ | (13,633 | ) | | $ | (13,633 | ) | | $ | (13,633 | ) |
| Income (loss) applicable to common shareholders | | $ | 14,402 | | | $ | 150,612 | | | $ | 35,350 | | | $ | 54,193 | | | $ | (80,196 | ) |
| Basic income (loss) per common share | | $ | 0.05 | | | $ | 0.54 | | | $ | 0.14 | | | $ | 0.24 | | | $ | (0.57 | ) |
| Diluted income (loss) per common share | | $ | 0.05 | | | $ | 0.51 | | | $ | 0.13 | | | $ | 0.23 | | | $ | (0.57 | ) |
| Total assets | | $ | 1,378,290 | | | $ | 1,396,090 | | | $ | 1,382,493 | | | $ | 1,046,784 | | | $ | 988,791 | |
Accrued reclamation & closure costs (6) | | $ | 113,215 | | | $ | 153,811 | | | $ | 318,797 | | | $ | 131,201 | | | $ | 121,347 | |
| Noncurrent portion of debt and capital leases | | $ | 11,935 | | | $ | 6,265 | | | $ | 3,792 | | | $ | 3,281 | | | $ | 113,649 | |
Cash dividends paid per common share(1) | | $ | 0.06 | | | $ | 0.02 | | | $ | — | | | $ | — | | | $ | — | |
Cash dividends paid per Series B preferred share (2) | | $ | 3.50 | | | $ | 3.50 | | | $ | 7.00 | | | $ | — | | | $ | 3.50 | |
Cash dividends paid per 6.5% Mandatory Convertible Preferred share (3) | | $ | — | | | $ | 1.62 | | | $ | 1.69 | | | $ | — | | | $ | 3.48 | |
| Common shares issued and outstanding | | | 285,209,848 | | | | 285,289,924 | | | | 258,485,666 | | | | 238,335,526 | | | | 180,461,371 | |
| 6.5% Mandatory Convertible Preferred shares issued and outstanding | | | — | | | | — | | | | 2,012,500 | | | | 2,012,500 | | | | 2,012,500 | |
| Series B Preferred shares issued and outstanding | | | 157,816 | | | | 157,816 | | | | 157,816 | | | | 157,816 | | | | 157,816 | |
| Shareholders of record | | | 6,630 | | | | 6,943 | | | | 7,388 | | | | 7,647 | | | | 7,936 | |
| Employees | | | 735 | | | | 735 | | | | 686 | | | | 656 | | | | 742 | |
| | 2011 (4) | | | 2010 (4) | | | 2009 (4) | | | 2008 (4) | | | 2007 (4) | |
| Sales of products | $ | 477,634 | | | $ | 418,813 | | | $ | 312,548 | | | $ | 204,665 | | | $ | 157,640 | |
| Net income (loss) from continuing operations | $ | 151,164 | | | $ | 48,983 | | | $ | 67,826 | | | $ | (37,173 | ) | | $ | 68,157 | |
Loss from discontinued operations, net of tax (5) | $ | — | | | $ | — | | | $ | — | | | $ | (17,395 | ) | | $ | (14,960 | ) |
| Loss on disposal of discontinued operations, net of tax (5) | $ | — | | | $ | — | | | $ | — | | | $ | (11,995 | ) | | $ | — | |
| Net income (loss) | $ | 151,164 | | | $ | 48,983 | | | $ | 67,826 | | | $ | (66,563 | ) | | $ | 53,197 | |
Preferred stock dividends (2,3) | $ | (552 | ) | | $ | (13,633 | ) | | $ | (13,633 | ) | | $ | (13,633 | ) | | $ | (1,024 | ) |
| Income (loss) applicable to common shareholders | $ | 150,612 | | | $ | 35,350 | | | $ | 54,193 | | | $ | (80,196 | ) | | $ | 52,173 | |
| Basic income (loss) per common share | $ | 0.54 | | | $ | 0.14 | | | $ | 0.24 | | | $ | (0.57 | ) | | $ | 0.43 | |
| Diluted income (loss) per common share | $ | 0.51 | | | $ | 0.13 | | | $ | 0.23 | | | $ | (0.57 | ) | | $ | 0.43 | |
| Total assets | $ | 1,396,090 | | | $ | 1,382,493 | | | $ | 1,046,784 | | | $ | 988,791 | | | $ | 650,737 | |
Accrued reclamation & closure costs (6) | $ | 153,811 | | | $ | 318,797 | | | $ | 131,201 | | | $ | 121,347 | | | $ | 106,139 | |
| Noncurrent portion of debt and capital leases | $ | 6,265 | | | $ | 3,792 | | | $ | 3,281 | | | $ | 113,649 | | | $ | — | |
Cash dividends paid per common share(1) | $ | 0.02 | | | $ | — | | | $ | — | | | $ | — | | | $ | — | |
Cash dividends paid per Series B preferred share (2) | $ | 3.50 | | | $ | 7.00 | | | $ | — | | | $ | 3.50 | | | $ | 3.50 | |
Cash dividends paid per 6.5% Mandatory Convertible Preferred share (3) | $ | 1.62 | | | $ | 1.69 | | | $ | — | | | $ | 3.48 | | | $ | — | |
| Common shares issued and outstanding | 285,289,924 | | | 258,485,666 | | | 238,335,526 | | | 180,461,371 | | | 121,456,837 | |
| 6.5% Mandatory Convertible Preferred shares issued and outstanding | — | | | 2,012,500 | | | 2,012,500 | | | 2,012,500 | | | 2,012,500 | |
| Series B Preferred shares issued and outstanding | 157,816 | | | 157,816 | | | 157,816 | | | 157,816 | | | 157,816 | |
| Shareholders of record | 6,943 | | | 7,388 | | | 7,647 | | | 7,936 | | | 6,598 | |
| Employees | 735 | | | 686 | | | 656 | | | 742 | | | 871 | |
| (1) | In September 2011 our Board of Directors adopted a common stock dividend policy that links the amount of any declared dividend on our common stock to our average realized silver price in the preceding quarter. See Note 9 of Notes to Consolidated Financial Statements for information on the potential per share dividend amounts at different quarterly average realized price levels according to the policy. On November 8, 2011, our Board of Directors declared the first quarterly silver price-linked dividend of $0.02 per share ($5.6 million total), based on the average realized silver price in the third quarter of 2011 of $37.02 per ounce, which was paid in December 2011. On February 17, 2012, our Board of Directors declared a silver price-linked common stock dividend, pursuant to the policy described above, of $0.01 per share based on the average realized silver price of $31.61 per ounce in the fourth quarter of 2011. In addition, inand February 2012, our Board of Directors adopted a common stock dividend policy that includeshas two components: (1) a dividend that links the amount of dividends on our common stock to our average quarterly realized silver price in the preceding quarter, and (2) a minimum annual dividend of $0.01 per share of common stock, in each case, payable quarterly, when declared, and declared adeclared. See Note 9 of Notes to Consolidated Financial Statements for more information on potential dividend amounts under the first component of $0.0025 per share pursuant to that policy. Therefore, the aggregatepolicy at various silver prices. The following table summarizes the common stock dividenddividends declared by our Board of Directors was $0.0125 per share, for a total of approximately $3.6 million expected to be paid inunder the first quarter of 2012. The declaration and payment of common stock dividends is at the sole discretion of our Board of Directors.policy described above: |
| | | (A) | | | (B) | | | (A+B) | | | | | |
| Declaration date | | Silver-price-linked component per share | | | Minimum annual component per share | | | Total dividend per share | | | Total dividend amount (in millions) | | Month of payment |
| November 8, 2011 | | $ | 0.02 | | | $ | — | | | $ | 0.02 | | | $ | 5.6 | | December 2011 |
| February 17, 2012 | | $ | 0.01 | | | $ | 0.0025 | | | $ | 0.0125 | | | $ | 3.6 | | March 2012 |
| May 8, 2012 | | $ | 0.02 | | | $ | 0.0025 | | | $ | 0.0225 | | | $ | 6.4 | | June 2012 |
| August 7, 2012 | | $ | — | | | $ | 0.0025 | | | $ | 0.0025 | | | $ | 0.7 | | September 2012 |
| November 2, 2012 | | $ | 0.02 | | | $ | 0.0025 | | | $ | 0.0225 | | | $ | 6.4 | | December 2012 |
| February 25, 2013 | | $ | — | | | $ | 0.0025 | | | $ | 0.0025 | | | $ | 0.7 | | anticipated in March 2013 |
Because the average realized silver price for the second and fourth quarters of 2012 was $27.05 and $29.20 per ounce, respectively, below the minimum threshold of $30 according to the policy, no silver-price-linked component was declared or paid. However, on February 25, 2013, our Board of Directors declared a special common stock dividend of $0.01 per share, in addition to the minimum dividend of $0.0025 per share, for an aggregate dividend of $3.6 million payable in March 2013. Prior to 2011, no dividends had been declared on our common stock since 1990. We cannot pay dividends on our common stock if we fail to pay dividends on our Series B Preferred Stock. The declaration and payment of common stock dividends, whether pursuant to the policy or in addition thereto, is at the sole discretion of our Board of Directors, and there can be no assurance that we will continue to declare and pay common stock dividends in the future.
| (2) | During 2007, $0.6 million in Series B preferred dividends were declared and paid. During 2008, $0.4 million in Series B preferred dividends were declared and paid, while $0.1 million in dividends for the fourth quarter of 2008 were deferred. Series B preferred dividends for the first three quarters of 2009, which totaled $0.6$0.4 million, were also deferred. In December 2009, we declared all dividends in arrears on our Series B preferred stock of $0.6 million and the scheduled $0.1 million dividend for the fourth quarter of 2009. These dividends were paid in cash in January 2010. Therefore, dividends declared on our Series B preferred shares of $0.7 million were included in the determination of income applicable to common shareholders for 2009 with no cash paid for Series B preferred dividends during 2009. We declared and paid all quarterly dividends on our Series B preferred shares for 2010, 2011 and 20112012 totaling $0.6 million for each of those years. |
| (3) | Cumulative undeclared, unpaid 6.5% Mandatory Convertible Preferred Stock dividends for the period from issuancefrom December 18, 2007 (the date of issuance) to December 31, 2007 totaled $0.5 million, and are reported in determining income applicable to common shareholders for the year ended December 31, 2007. The $0.5 million in cumulative undeclared dividends were paid in April 2008. During 2008, $9.8 million in 6.5% Mandatory Convertible Preferred dividends were declared and paid. $6.5 million of the dividends declared in 2008 were paid in cash, and are included in the amount reported as cash dividends paid per 6.5% Mandatory Convertible Preferred Share, and $3.3 million of the dividends declared in 2008 were paid in our Common Stock. 6.5% Mandatory Convertible Preferred Stock dividends for the fourth quarter of 2008 totaling $3.3 million were deferred. Dividends on our 6.5% Mandatory Convertible Preferred Stock totaling $9.8$13.1 million for the fourth quarter of 2008 and the first three quarters of 2009 were deferred. In December 2009, we declared the $13.1 million in dividends in arrears on our 6.5% Mandatory Convertible Preferred Stock and the scheduled $3.3 million dividend for the fourth quarter of 2009. These dividends were paid in shares of our common stock in January 2010. Therefore, dividends declared on our 6.5% Mandatory Convertible Preferred Stock of $13.1 million were included in the determination of income applicable to common shareholders for 2009 with no cash paid for 6.5% Mandatory Convertible Preferred Stock dividends in 2009. We declared and paid all quarterly dividends on our 6.5% Mandatory Convertible Preferred Stock totaling $13.1 million for 2010. Dividends declared for the first and second quarters of 2010 were paid in shares of our common stock and dividends for the third and fourth quarters of 2010 were paid in cash. The cash dividend declared for the fourth quarter of 2010, which was paid in January 2011, represents the last dividend to be paid on the 6.5% Mandatory Convertible Preferred Stock, which automatically converted to shares of our common stock on January 1, 2011. |
| (4) | On April 16, 2008, we completed the acquisition of all of the equity of two Rio Tinto subsidiaries holding a 70.3% interest in the Greens Creek mine for approximately $758.5 million. The acquisition givesgave various of our various subsidiaries control of 100% of the Greens Creek mine. Our operating results reflect our 100% ownership of Greens Creek after April 16, 2008 and our 29.7% ownership of Greens Creek prior to that date. |
| (5) | On July 8, 2008, we completed the sale of all of the outstanding capital stock of El Callao Gold Mining Company and Drake-Bering Holdings B.V., our wholly owned subsidiaries which together owned our business and operations in Venezuela, the “La Camorra unit.” The results of the Venezuelan operations have been reported in discontinued operations for all periods presented. |
| (6) | In the fourth quarter of 2010, we recorded an accrual of $193.2 million to increase our liability for environmental obligations in Idaho’sIdaho's Coeur d’Alened'Alene Basin pursuant to negotiations with the Plaintiffs in the Coeur d’Alened'Alene Basin environmental litigation and the State of Idaho on the financial terms of settlement of the litigation and related claims. The settlement was finalized in September 2011. For additional discussion, see |
| (7) | Coeur d’Alene River Basin Environmental ClaimsAs a result of an order from MSHA to remove built-up cementitious material from the Silver Shaft, production was temporarily suspended at the Lucky Friday unit during all of 2012. Limited production resumed in early 2013. See Item 7. Management's Discussion and Analysis of Financial Condition and Results of Operations, The Lucky Friday Segment in Note 7 of Notes to the Consolidated Financial Statements.for more information.
|
Item 7. Management’s Discussion and Analysis of Financial Condition and Results of Operations Established in 1891 in northern Idaho’s Silver Valley, we believe we are the oldest still-operating precious metals mining company in the United States still operating and the largest silver producer in the U.S. Our corporate offices are in Coeur d’Alene, Idaho and Vancouver, British Columbia. Our production profile includes:
silver, gold, lead, and zinc contained in concentrates shipped to various smelters; and
Our operating properties comprise our two business segments for financial reporting purposes: the Greens Creek operating unit on Admiralty Island in Alaska and the Lucky Friday operating unit in Idaho. Since both of our mines are located in the U.S., we believe they have low political risk, and less economic risk than mines located in other parts of the world. Our exploration interests are located in the United States and Mexico, jurisdictions with low and relatively moderate political and economic risk, in the United States and Mexico, respectively, and are located in historically successful mining districts. Our operating and strategic framework is based on expanding our production and locating and developing new resource potential. In 2011,2012, we
Attained record revenueGenerated positive cash flows from operations of $477.6$69.0 million and gross profit of $265.0 million, surpassing 2010’s previous record levels as a result of higher metals prices. These results were in spite of challenges facedthe temporary suspension of production at the Lucky Friday mine relating to multiple accidents occurring during the year,2012, as discussed furtherin the Lucky Friday Segment section below.
Finalized settlement of the Coeur d'Alene Basin environmental litigation and related claims. See Note 7 of Notes to Consolidated Financial Statements for further discussion
Completed the work to address the order from MSHA to remove built-up cementitious material from the Silver Shaft (discussed below) and other orders, resulting in MSHA's approval to commence production at the Lucky Friday mine in early 2013.
Committed a record level of capital investment at our existing operations, with capital expenditures in 2011, including(including non-cash capital lease additions, totalingadditions) of approximately $103.2$129.9 million, including $60.1$62.2 million at Greens Creek and $56.0 million at Lucky Friday, which includes $28.2 million for the work to rehabilitate and $41.7 million at Greens Creek. We advanced work on construction of an internal shaft atimprove the Lucky Friday unit.Silver Shaft.
Had unrelated incidents at the Lucky Friday mine, resulting in two fatalities, a number of injuries, and the temporary halt of production.
Increased overall proven and probable silver reserves at December 31, 20112012 compared to their levels at the same time last year,2011, with higher silver reserves at Lucky Friday due to results from drilling.inclusion of additional areas into the mine plan brought about by additional drilling and higher metals prices used for planning. The increase in silver reserves at Lucky Friday was partially offset by a slight decrease in silver reserves at Greens Creek in 20112012 due to depletion of the deposit through production.production, partially offset by an increase in reserves through development drilling and as a result of higher metals prices used for planning.
AcquiredContinued our investment in other mining properties and companies through our acquisition of the remaining 30% interestMonte Cristo property in the San JuanNevada and investments in Dolly Varden Silver exploration a pre-development project at the Creede Mining District in Colorado in December 2011. We completed work to earn-in to a 70% interest in the project earlier in the year. See Note 16 of Notes to Consolidated Financial Statements for more information.
Corporation and Canamex Resources Corp.
Increased our exploration and pre-development spending during the year by 45% in comparison58% and 130% compared to 2011 and 2010, respectively, drilling targets at each of our four land packages in Alaska, Idaho, Colorado, and Mexico, and advancing pre-development projects at the historic Equity and Bulldog mines in Creede, Colorado, and the Star mine in Idaho's Silver Valley.Valley, and the San Sebastian mine in Mexico.
Paid common stock dividends totaling $17.1 million, or $0.06 per share, under the our recently-adopted common dividend policy. See Note 9 of Notes to Consolidated Financial Statements.
Reduced our balances for accrued reclamation and closure costs by $40.6 million, primarily as a result of making the scheduled $25.0 million payment pursuant to the terms of settlement of the Coeur d'Alene Basin litigation and advancement of reclamation work at the Grouse Creek site (a non-operating property located in Idaho).
Achieved the above milestones utilizing cash flows generated from operations with no external financing required, while maintaining a cash balance of $191.0 million and substantially no debt as of December 31, 2012.
Silver prices continued on a positive trend over the last three years,to be relatively strong, with the price climbing froman annual averages of $14.65 in 2009 and $20.16 in 2010, to an average of $31.15 for 2012. Although this is down from the average price of $35.11 per ounce for 2011.2011, the two year trend is still positive compared to the average price of $20.16 for 2010. The price of gold, a significant by-product at our Greens Creek mine, followed a similar trend. Thehas continued on an upward trend over the last three years, with the annual average gold price increasedincreasing from $973 in 2009 to $1,225 in 2010 and to $1,569 in 2011.2011, and to $1,669 in 2012. Average prices of our important base metals by-products, lead and zinc, increased by 24%12% in 2011 compared 2010, and 31%, respectively, in 2010 compared 2009, and then decreased by 14% during 2012. The prices of zinc remained substantially level during 2011.2011, but then decreased by 12% during 2012. Lead and zinc represent important by-products at both of our operations. The positive performance in precious metals prices allowed us to achieve the milestones discussed above in spite of lower mill throughputthe temporary suspension of production at both Greens Creek and Lucky Friday during all of 2012, which resulted in decreased production of all four metals we producesilver, lead, and zinc in 20112012 compared to 2010.2011.
We reported diluted income per share of $0.51 in 2011 compared to $0.13 in 2010. Gross profit from operations improved to $265.0 million in 2011 from $194.8 million in 2010 primarily as a result of higher realized prices for all four metals we sell. Exploration and pre-development costs were 45% higher in 2011 due to increased drilling and other exploration activities at each of our land packages and pre-development work done to access historical workings and establish underground drill platforms at the Equity mine near Creede, Colorado, and at the Star mine in Idaho's Silver Valley to further evaluate potential mine re-opening. Provision for closed operations and environmental matters decreased by $191.4 million in 2011due primarily to an increase in our estimated liability for environmental obligations in Idaho’s Coeur d’Alene Basin recorded in the fourth quarter of 2010 to reflect the terms of the settlement later finalized. We recognized a $38.0 million gain on base metal derivatives contracts in 2011 compared to a $20.8 million loss in 2010. In 2011, we recorded an $82.0 million income tax provision compared to a $123.5 million benefit recorded in 2010, with $88.1 million of the 2010 benefit resulting from a decreased valuation allowance on deferred tax assets. We removed substantially all of the valuation allowance in the fourth quarter of 2010, with the exception of certain amounts related to foreign net operating loss carryforwards, as high levels of cash flows from operations and metals prices led us to conclude that our deferred tax assets are more likely than not realizable through estimated future profitability. See Note 5 of Notes to Consolidated Financial Statements for further discussion.The factors driving metals prices are beyond our control and are difficult to predict. As noted above, prices have been highly volatile in the last three years and could be so in the future. Average prices in 20112012 compared to those in 20102011 and 20092010 are illustrated in the Results of Operations section below. Moreover, variations in the metal grades of ore mined are impacted by geology and mine planning efficiencies and operations, potentially creating constraints on metals produced. Ore transportation and smelting schedules also impact the timing of sales and final settlement. See the Results of Operations section below for a discussion of the factors impacting income applicable to common shareholders for the three years ended December 31,
We intend to achieve our long-term strategy of increasing production and expanding our proven and probable reserves through development and exploration, as well as by future acquisitions. Our strategic plan requires that we manage several pervasive challenges and risks inherent in conducting mining, development, exploration and metal sales at multiple locations. One such risk involves metals prices, over which we have no control except through derivative and other contracts. As discussed in the Critical Accounting Estimates section below, metals prices are influenced by a number of factors beyond our control. Average market prices of silver, gold, zinc and lead in 2011 all2012 were higherlower than their levels in 2010,2011, while gold prices were higher, as illustrated by the table in Results of Operations below. We believe current global economic and industrial trends could result in continued demand growth for the metals we produce. However, prices have been volatile over the last five years and there can be no assurance that higher prices will continue. We make our strategic plans in the context of significant uncertainty about future revenues,operational capacity, which may impact new opportunities that require many years and substantial cost from discovery to production. We approach this challenge by investing in exploration and capital in districts with an established history of success, and in managing our operations in a manner that seeks to mitigate the effects of lower prices.known mineralization. We significantly increased our exploration and pre-development activity in 20112012 compared to 2011 and 2010, and we anticipate a further increase in the coming year at or near our operating mines at Greens Creek and Lucky Friday, as well as at our exploration projects in the past-producing mining districts in Colorado and Mexico.
As further discussed in the Financial Liquidity and Capital ResourcesLucky Friday Segment section below, we believe our cash, cash equivalents, investments, projected cash from operations, and availability of financing, if needed, will be adequate to meet our obligations during the next twelve months, including obligations relating to growth opportunities. One such opportunity is the construction of an internal shaft at the Lucky Friday mine (“#4 Shaft”), which, we believe, will significantly increase production and extend the life of the mine. The #4 Shaft project will involve significant additional capital costs during the periods leading up to its expected completion date by the end of 2015. As discussed in the Lucky Friday Segment section below, the requirement to remove loose material from the Silver Shaft will temporarily suspend work on the #4 Shaft project.2016. Although we believe that our current capital resources will allow us to continue work oncomplete the #4 Shaft when use of the Silver Shaft is restored, and complete the project, there are a number of factors that could affect its completion.
Volatility in global financial markets poses a significant challenge to our ability to access credit and equity markets, should we need to do so, and to predict sales prices for our products. Our stock price, although volatile, has rebounded from its lowest levelsAs discussed in 2008. We eliminated our debt in 2009 partly by increasing our sharesNote 9 ofNotes to Consolidated Financials Statements, we have established a common stock outstanding by 32% during 2009dividend policy which includes a component that is linked to our realized silver price. We utilize forward contracts to manage the potential impacts on our revenues of future declines in zinc and issuing warrants at exercise prices ranging from $2.50 to $3.68 per share. Our shares of common stock outstanding increased by an additional 9%lead prices. In addition, we have in 2010 primarily as a result of exercises of warrants issued in 2008 and 2009, and by an additional 10% in 2011 primarily as a result of the conversion of our 6.5% Mandatory Convertible Preferred Stock in January 2011. We have also entered intoplace a three-year $100$150 million revolving credit agreement under which there are no outstanding borrowings as of December 31, 2011, yetthe filing date of this annual report.
We strive to achieve excellent mine safety and health performance. We seek to implement this goal by: training employees in safe work practices; establishing, following and improving safety standards; investigating accidents, incidents and losses to avoid recurrence; involving employees in the establishment of safety standards; and participating in the National Mining Association's CORESafety program. We attempt to implement reasonable best practices with respect to mine safety and emergency preparedness. See Part I, Item 1A. Risk Factors and the Lucky Friday Segment section below for information on accidents and other events that recently impacted operations at our abilityLucky Friday unit. We work with MSHA to retainaddress issues outlined in the facility depends in part on financial thresholds driven by the pricesinvestigations of products we sell.these incidents and continue to evaluate our safety practices.
Another challenge is the risk associated with environmental litigation and ongoing reclamation activities. As described in Risk Factors and Note 7 of Notes to Consolidated Financial Statements, it is possible that our estimate of these liabilities (and our ability to estimate liabilities in general) may change in the future, affecting our strategic plans. As discussed in Note 7 of Notes to Consolidated Financial Statements, weWe finalized the terms of settlement with the Plaintiffs in the Coeur d'Alene Basin environmental litigation in 2011, which has assisted our planning efforts by decreasing uncertainty regarding our liability and our liquidity needs relating to our most significant environmental matter. However, we are involved in other environmental legal matters, and there can be no assurance that the estimate of our environmental liabilities, liquidity needs, or strategic plans will not be significantly impacted as a result of these matters or new matters that may arise. In addition, proposed measures to address climate change and green house gas emissions could have an adverse impact on our operations and financial performance in the future (see Item 1A. Risk Factors – Legal, Market and Regulatory Risks - We face substantial governmental regulation and environmental risk). We intend to continue to strive to ensure that our activities are conducted in compliance with applicable laws and regulations and to attempt to settle the environmental litigation.Reserve estimation is a major risk inherent in mining. Our reserve estimates, which drive our mining and investment plans and many of our costs, may change based on economic factors and actual production experience. Until ore is actually mined and processed, the volumes and grades of our reserves must be considered as estimates. Our reserves are depleted as we mine. Reserves can also change as a result of changes in metals prices and costs, as well as economic and operating assumptions.
We strive to achieve excellent mine safety and health performance. We seek to implement this goal by: training employees in safe work practices; openly communicating with employees; establishing, following and improving safety standards; investigating accidents, incidents and losses to avoid recurrence; and involving employees in the establishment of safety standards. We attempt to implement reasonable best practices with respect to mine safety and emergency preparedness. In spite of these efforts, two fatal accidents and another incident involving injury to seven employees occurred at our Lucky Friday mine during 2011. At the end of 2011, MSHA began a special impact inspection at the Lucky Friday mine which resulted in an order to remove loose material from the Silver Shaft, the primary access way from surface at the Lucky Friday mine, even though such shaft was not involved in the rock burst or any of the other incidents which occurred in 2011. Underground access will be limited as the Silver Shaft work is completed, and we anticipate that production will be suspended at the Lucky Friday mine until early 2013 as a result. See the Lucky Friday Segment section below for more information. We continue to evaluate our safety practices and work with MSHA to address issues outlined in the investigations of these incidents.As a result of industry-wide fatal accidents in recent years, primarily at underground coal mines, there has been an increase in mining regulation in the United States. This increase has taken the form of vigorous enforcement of existing laws and regulations, and the adoption of new safety and training regulations, primarily by MSHA.mine regulation. In addition, under the Dodd-Frank Wall Street Reform and Consumer Protection Act, the Securities and Exchange CommissionSEC was directed to issue new rules regarding the disclosure of mine safety data. These changes may have a significant negative effect on our future operating costs,costs. Moreover, because of the incidents in 2011 at the form of increased costsLucky Friday mine, we expect additional regulatory scrutiny, and our ability to achieve and maintain compliance with MSHA regulations will be a challenge for monitoringus; yet, it is very important to our operations and administration offinancial performance. See Part I, Item 1A. Risk Factors - Recent accidents and by regulatory agencies. other events at our Lucky Friday mine could have additional adverse consequences to us and We face substantial governmental regulation and environmental risk.
For the year ended December 31, 2011,2012, we reported income applicable to common shareholders of $150.6$14.4 million compared to $150.6 million in 2011 and $35.4 million in 2010 and $54.2 million in 2009.2010. The following factors had a positivenegative impact on results for the year ended December 31, 20112012 compared to 20102011 and 2009:2010: IncreasedDecreased gross profit at our Greens Creek and Lucky Friday units to $143.5 million in 2012 compared to $265.0 million in 2011 compared to 2010 and 2009.$194.8 million in 2010. See the Greens Creek Segment and Lucky Friday Segment sections below for further discussion of operating results.
ProvisionThe temporary halt in production and suspension-related costs of $25.3 million incurred at our Lucky Friday unit in 2012 related to maintenance of surface facilities and mine workings and refurbishing the mill in preparation for closed operations and environmental matters of $9.7 million in 2011 comparedthe return to $201.1 million in 2010 and $7.7 million in 2009. In the fourth quarter of 2010, we recorded an accrual of $193.2 million to increase our liabilityproduction. See The Lucky Friday Segment section for environmental obligations in Idaho’s Coeur d’Alene Basin pursuant to negotiations with the Plaintiffs in the Coeur d’Alene Basin environmental litigation and the State of Idahomore information on the financial termstemporary suspension of settlement of the litigation and related claims. The settlement was finalized in September 2011. For additional discussion, see Coeur d’Alene River Basin Environmental Claims in Note 7 of Notes to the Consolidated Financial Statements.production during 2012.
Net gainmark-to-market losses on base metal forward contracts of $38.0$10.5 million in 20112012 and $20.8 million in 2010 compared to a net lossgain of $20.8$38.0 million in 2010. There was no comparable gain or loss reported in 2009, as the forward contract program was initiated in June 2010.2011. These gains and losses are related to financially-settled forward contracts on forecasted zinc and lead production as part of a risk management program. See Item 7A. QuantitativeThe losses in 2012 and Qualitative Disclosures About Market Risk - Commodity-Price Risk Management for more information on our derivatives contracts.
Interest expense decreased to $2.8 million2010 resulted from increases in 2011 and $2.2 million in 2010 from $11.3 million in 2009 due to repayment in 2009 of debt incurred for the acquisition of the remaining 70.3% ownership interest in Greens Creek. See Note 6 of Notes to the Consolidated Financial Statements for more information on our debt facilities.
Debt-related fees in 2009 representing $4.3 million in expense recognized in the first quarter of 2009 for preferred stock issued pursuant to our credit agreement and $1.7 million in professional fees incurred in 2009 related to compliance with our amended and restated credit agreement. See Note 6 and Note 9 of Notes to Consolidated Financial Statements for more information.
In the second quarter of 2009 we recognized a $3.0 million loss on impairment of shares of Rusoro stock received in the 2008 sale of our discontinued Venezuelan operations compared to a $0.7 million impairment loss recognized on the Rusoro stock recognized during the second quarter of 2010 and a $0.1 million impairment recognized in the fourth quarter of 2011 related to stock held in another mining company.
Higher average prices for all four metals produced at our operations in 2011 compared to 2010 and 2009. The following table summarizes average market prices and our realized prices for silver, gold, lead and zinc for the years ended December 31, 2011, 2010 and 2009:
| | | | Average for the year ended December 31, | |
| | | | 2011 | | | 2010 | | | 2009 | |
| Silver — | London PM Fix ($/ounce) | | $ | 35.11 | | | $ | 20.16 | | | $ | 14.65 | |
| | Realized price per ounce | | $ | 35.30 | | | $ | 22.70 | | | $ | 15.63 | |
| Gold — | London PM Fix ($/ounce) | | $ | 1,569 | | | $ | 1,225 | | | $ | 973 | |
| | Realized price per ounce | | $ | 1,592 | | | $ | 1,271 | | | $ | 1,017 | |
| Lead — | LME Final Cash Buyer ($/pound) | | $ | 1.09 | | | $ | 0.97 | | | $ | 0.78 | |
| | Realized price per pound | | $ | 1.05 | | | $ | 0.98 | | | $ | 0.88 | |
| Zinc — | LME Final Cash Buyer ($/pound) | | $ | 1.00 | | | $ | 0.98 | | | $ | 0.75 | |
| | Realized price per pound | | $ | 1.00 | | | $ | 0.96 | | | $ | 0.90 | |
Concentrate sales are generally recorded as revenues at the time of shipment at forward prices for the estimated month of settlement, which differ from average market prices. Due to the time elapsed between shipment of concentrates and final settlement with the smelters, we must estimate the prices at which sales of our metals will be settled. Previously recorded sales are adjusted to estimated settlement metal prices each period through final settlement. For 2011, we recorded net negative adjustments to provisional settlements of $9.8 million compared to net positive price adjustments to provisional settlements of $14.9 million and $25.6 million in 2010 and 2009, respectively. The price adjustments related to zinc and lead contained in our concentrate shipments were offset by gains and losses on forward contracts for those metals (see Note 10 of Notes to Consolidated Financial Statements for more information). The gains and losses on these contracts are included in revenues and impact the realized prices for lead and zinc. We recognized overall net gains on the contracts of $7.1 million in 2011 and net losses of $3.0 million in 2010. Because the forward contracts program was not initiated until April 2010, there were no comparable gains or losses in 2009. Realized prices are calculated by dividing gross revenues for each metal by the payable quantities of each metal included in concentrate and doré shipped during the period. The differences between our realized metal prices and average market prices are due primarily to the aforementioned gains and losses on forward contracts (for lead and zinc) and price adjustments resulting from the difference between metal prices upon transfer of title of concentrates to the buyer and metal prices at the timeend of final settlement, which are included in our revenues.Other significant variances affectingthose periods, with the comparison of our income applicable to common shareholders for 2011 to results for 2010 and 2009 were as follows:
Income tax provisiongains in 2011 of $82.0 million compared to income tax benefits in 2010 and 2009 of $123.5 million and $7.7 million, respectively. The 2011 provision is primarily due to the utilization of deferred tax assets as a result of increased profits. The benefits recognized in 2010 and 2009 are the result of valuation allowance adjustments to our deferred tax asset balances. These adjustments are included in the aggregate income tax benefit (provision)decreasing prices for each respective period. Our deferred tax asset balances are recorded net of an offsetting valuation allowance to the extent that we estimate that the assets are not realizable through future taxable income. In the fourth quarter of 2010, we removed substantially all of the valuation allowance on our deferred tax assets. Significant evidence in 2010, including record cash flows from operations and higher metals prices, led us to conclude that our deferred tax assets are more likely than not realizable due to estimated future profitability. See Note 5 of Notes to Consolidated Financial Statements for further discussion.
those metals.Exploration and pre-development expense increased significantly to $49.7 million in 2012 from $31.4 million in 2011 fromand $21.6 million in 2010 and $9.2 million in 2009 as we continue extensive exploration work at our Greens Creek unit, on our land package near Durango, Mexico, at our San Juan Silver project in the Creede district of Colorado, and in the North Idaho's Coeur d'Alene Mining District near our Lucky Friday unit. "Pre-development expense" is defined as costs incurred in the exploration stage that may ultimately benefit production, such as underground ramp development, which are expensed due to the lack of proven and probable reserves. Establishing proven and probable reserves would indicate future recovery of these expenses. We have advanced pre-development projects during 2011 and 2012 at the Equity and Bulldog mines in the Creede district and at the Star mine in the Coeur d'Alene district which have given us access to historic workings and underground drill platforms. We have also initiated pre-development work at the San Sebastian mine in Mexico.
Lower average prices for the silver, zinc, and lead produced at our operations in 2012 compared to 2011. However, gold prices increased in 2012 compared to the prior year. Average prices for all four metals were higher in 2011 compared to their levels in 2010.
| | | | Average price for the year ended December 31, | |
| | | | 2012 | | | 2011 | | | 2010 | |
| Silver — | London PM Fix ($/ounce) | | $ | 31.15 | | | $ | 35.11 | | | $ | 20.16 | |
| | Realized price per ounce | | $ | 32.11 | | | $ | 35.30 | | | $ | 22.70 | |
| Gold — | London PM Fix ($/ounce) | | $ | 1,669 | | | $ | 1,569 | | | $ | 1,225 | |
| | Realized price per ounce | | $ | 1,687 | | | $ | 1,592 | | | $ | 1,271 | |
| Lead — | LME Final Cash Buyer ($/pound) | | $ | 0.94 | | | $ | 1.09 | | | $ | 0.97 | |
| | Realized price per pound | | $ | 0.96 | | | $ | 1.05 | | | $ | 0.98 | |
| Zinc — | LME Final Cash Buyer ($/pound) | | $ | 0.88 | | | $ | 1.00 | | | $ | 0.98 | |
| | Realized price per pound | | $ | 0.90 | | | $ | 1.00 | | | $ | 0.96 | |
The termination
Average realized prices differ from average market prices because concentrate sales are generally recorded as revenues at the time of an employee benefit plan resulting in a non-cash gainshipment at forward prices for the estimated month of $9.0 million recognized insettlement, which differ from average market prices. Due to the first quartertime elapsed between shipment of 2009.
The saleconcentrates and final settlement with the smelters, we must estimate the prices at which sales of our Velardeña millmetals will be settled. Previously recorded sales are adjusted to estimated settlement metal prices each period through final settlement. For 2012, we recorded net positive adjustments to provisional settlements of $5.2 million compared to net negative price adjustments to provisional settlements of $9.8 million in Mexico2011 and positive adjustments of $14.9 million in March 2009 generating a pre-tax gain of $6.2 million2010. The price adjustments related to zinc and lead contained in our concentrate shipments were largely offset by gains and losses on forward contracts for those metals (see Note 1710 of Notes to Consolidated Financial Statementsfor more information). The gains and losses on these contracts are included in revenues and impact the realized prices for lead and zinc. We recognized overall net losses on the contracts of $1.3 million in 2012, net gains of $7.1 million in 2011, and net losses of $3.0 million in 2010. Realized prices are calculated by dividing gross revenues for each metal (which include the price adjustments and gains and losses on the forwards contracts discussed above) by the payable quantities of each metal included in concentrate and doré shipped during the period.
The saleOther significant variances affecting the comparison of our investmentincome applicable to common shareholders for 2012 to results for 2011 and 2010 were as follows:
Provision for closed operations and environmental matters decreased to $4.7 million in Aquiline Resources Inc. stock for proceeds2012 from $9.7 million in 2011 and a pre-tax gain of approximately $4.1$201.1 million in 2010. In the fourth quarter of 2009.2010, we recorded an accrual of $193.2 million to increase our liability for environmental obligations in Idaho’s Coeur d’Alene Basin pursuant to negotiations with the Plaintiffs in the Coeur d’Alene Basin environmental litigation and the State of Idaho on the financial terms of settlement of the litigation and related claims. The settlement was finalized in September 2011. In addition, in 2012, we reached a $3.0 million settlement with an insurance company for our claim for reimbursement of past costs related to the Coeur d'Alene Basin, and we reduced provision for closed operations and environmental matters by that amount in the third quarter of 2012.
Income tax provision of $8.9 million in 2012 compared to $82.0 million in 2011, while we recognized an income tax benefit of $123.5 million in 2010. The lower provision in 2012 compared to 2011 is the result of reduced profits. The benefit recognized in 2010 is the result of a valuation allowance adjustment to our deferred tax asset balances, which is included in the aggregate income tax benefit for that period. Our deferred tax asset balances are recorded net of an offsetting valuation allowance to the extent that we estimate that the assets are not realizable through future taxable income. In the fourth quarter of 2010, we removed substantially all of the valuation allowance on our deferred tax assets. Significant evidence in 2010, including record cash flows from operations and higher metals prices, led us to conclude that our deferred tax assets are more likely than not realizable due to estimated future profitability.
Below is a comparison of the operating results and key production statistics of our Greens Creek segment.| | | Years Ended December 31, | |
| Dollars are in thousands (except per ounce and per ton amounts) | | Years Ended December 31, |
| | | 2011 | | 2010 | | 2009 | 2012 | | 2011 | | 2010 |
| Sales | | $ | 342,906 | | $ | 313,318 | | $ | 229,318 | | $ | 320,895 | | $ | 342,906 | | $ | 313,318 | |
| Cost of sales and other direct production costs | | (113,393 | ) | | (116,824 | ) | | (103,670 | ) | (134,105 | ) | | (113,393 | ) | | (116,824 | ) |
| Depreciation, depletion and amortization | | (41,013 | ) | | (51,671 | ) | | (52,909 | ) | (43,522 | ) | | (41,013 | ) | | (51,671 | ) |
| Gross Profit | | $ | 188,500 | | | $ | 144,823 | | | $ | 72,739 | | $ | 143,268 | | | $ | 188,500 | | | $ | 144,823 | |
| | | | | | | | | | | | |
| Tons of ore milled | | 772,069 | | 800,397 | | 790,871 | | 789,569 | | 772,069 | | 800,397 | |
| Production: | | | | | | | | | | | |
| Silver (ounces) | | 6,498,337 | | 7,206,973 | | 7,459,170 | | 6,394,235 | | 6,498,337 | | 7,206,973 | |
| Gold (ounces) | | 56,818 | | 68,838 | | 67,278 | | 55,496 | | 56,818 | | 68,838 | |
| Zinc (tons) | | 66,050 | | 74,496 | | 70,379 | | 64,249 | | 66,050 | | 74,496 | |
| Lead (tons) | | 21,055 | | 25,336 | | 22,253 | | 21,074 | | 21,055 | | 25,336 | |
| Payable metal quantities sold: | | | | | | | | | | | |
| Silver (ounces) | | 5,314,232 | | 6,223,967 | | 6,482,439 | | 5,430,252 | | 5,314,232 | | 6,223,967 | |
| Gold (ounces) | | 43,942 | | 57,386 | | 54,801 | | 43,133 | | 43,942 | | 57,386 | |
| Zinc (tons) | | 48,436 | | 56,001 | | 52,928 | | 50,895 | | 48,436 | | 56,001 | |
| Lead (tons) | | 16,067 | | 20,221 | | 16,749 | | 15,733 | | 16,067 | | 20,221 | |
| Ore grades: | | | | | | | | | | | |
| Silver ounces per ton | | 11.49 | | 12.30 | | 13.01 | | 11.13 | | 11.49 | | 12.30 | |
| Gold ounces per ton | | 0.12 | | 0.13 | | 0.13 | | 0.12 | | 0.12 | | 0.13 | |
| Zinc percent | | 9.81 | | 10.66 | | 10.13 | | 9.35 | | 9.81 | | 10.66 | |
| Lead percent | | 3.52 | | 4.09 | | 3.64 | | 3.49 | | 3.52 | | 4.09 | |
| Mining cost per ton | | $ | 49.31 | | $ | 43.00 | | $ | 42.33 | | $ | 64.05 | | $ | 49.31 | | $ | 43.00 | |
| Milling cost per ton | | $ | 30.69 | | $ | 24.23 | | $ | 23.22 | | $ | 29.35 | | $ | 30.69 | | $ | 24.23 | |
Total cash cost per silver ounce (1) | | $ | (1.29 | ) | | $ | (3.90 | ) | | $ | 0.35 | | $ | 2.70 | | $ | (1.29 | ) | | $ | (3.90 | ) |
| (1) | A reconciliation of this non-GAAP measure to cost of sales and other direct production costs and depreciation, depletion and amortization, the most comparable GAAP measure, can be found in Reconciliation of Total Cash Costs to Costs (non-GAAP) of Sales and Other Direct Production Costs and Depreciation, Depletion and Amortization (GAAP). |
The increase$45.2 million decrease in gross profit for 20112012 compared to 2010 and 20092011 was primarily the result of the following factors: Higherlower average marketprices for silver, zinc and realizedlead, partially offset by higher gold prices in 20112012. Average prices for all four metals producedsilver and gold were higher in 2012 by 55% and 36%, respectively, compared to their levels in 2010. The impact of higher precious metal prices was offset by lower average zinc and lead prices and higher mining and milling costs, as discussed further below, when comparing gross profit for 2012 to 2010. Results for 2012 were also impacted by marginally lower silver, zinc, lead, and gold production. Gross profit at Greens Creek compared to 2010 and 2009, as further discussed in Results of Operations above.
Lower depreciation, depletion and amortization expense in 2011 of $10.7 million and $11.9, respectively, compared to 2010 and 2009 as a result of lower metals production due to lower ore volume and ore grades for all four metals. The ore volume decreases are primarily due to the lack of availability of higher-volume long-hole stopes, while the ore grade variances are due to differences in the sequencing of production from the various mine areas pursuant to the overall mine plan.
Mine license taxes decreased in 2011was also impacted by $3.4 million compared to 2010 and increased by $0.6 million compared to 2009. The lower taxes in 2011 compared to 2010 is a result of $2.5 million refund from the state of Alaska relating to prior year's returns.
These factors were partially offset by:Negativepositive price adjustments to revenues of $4.9 million in 2012 compared to negative prices adjustments of $6.7 million net of base metal forward contract gains, duringin 2011 compared toand positive price adjustments of $12.8 million and $22.2 million in 2010 and 2009, respectively.2010. Price adjustments to revenues result from changes in metals prices between transfer of title of concentrates to buyers and final settlements during the period. The impact of negativepositive price adjustments for lead and zinc in 2011 was substantiallypartially offset by a net gainsloss of $1.3 million on forward contracts related to concentrates shipped during 2012 compared to a gain of $6.2 million on financially-settled forward contracts. Positive price adjustments for leadin 2011 and zinc in 2010 were substantially offset by net lossesa loss of $2.1 million on financially-settled forward contracts. The base metal forward contract program was initiated in April 2010 and there were no comparable gains or losses impacting 2009.
2010.
ProductionMining costs per ton of ore milled forincreased in 2012 by 30% and 49% compared to 2011 and 2010, respectively. Milling costs per ton decreased slightly in 2012 by 4% compared to 2011 and increased by 19%21% compared to 2010. The higher mining costs were due primarily to increased use of contract miners at Greens Creek, which is more expensive than internal labor; however, the cost of internal labor also increased during 2012. The increase in mining costs in 2012 is also due to higher maintenance costs. Milling costs are down in 2012 compared to 2011 because we generated less power on-site in 2012 due to higher availability of less expensive hydroelectric power, the result of higher precipitation levels in Southeastern Alaska. The increase in milling costs in 2012 compared to 2010 whereas,is primarily the result of an increase in the cost of diesel fuel from $2.66 in 2010 remained within 3% of their 2009 levels. The higher coststo $3.66 in 2011 are mainly attributable to lower ore volume and higher power costs due to increased reliance in 2011 on more expensive diesel-generated power resulting from lower utility availability.2012.
The Greens Creek operation is partially powered by diesel generators, and production costs have historically been significantly affected by fluctuations in fuel prices and utility power availability. Infrastructure has been installed thatInstalled infrastructure allows hydroelectric power to be supplied to Greens Creek by AEL&PAlaska Electric Light and Power (AEL&P) via a submarine cable from North Douglas Island, near Juneau, to Admiralty Island, where Greens Creek is located. This project has reduced production costs at Greens Creek to the extent power has been available. During 2009 and 2010, the mine began receiving an increased proportion of its power needs from AEL&P, and we have continued to receive hydroelectric power, with reduced availability in 2011 compared to the previous two years. Fuel costs represented approximately 13% of total production costs at Greens Creek in 2011 compared to 6% in 2010 and 8% in 2009. Mining and milling costs per ton increased in 2011 by 15% and 27%, respectively, compared to the same period in 2010 and by 16% and 32%, respectively, for the same period in 2009. The increases were driven primarily by lower ore volume and higher power costs. We generated more power on-site&P; however, in 2011, due to lower availability ofprecipitation, less expensive hydroelectric power was available. During 2012, the mine again received an increased proportion of its power needs from AEL&P. When weather conditions are not favorable to maintain lake water levels, the mine relies on diesel generated power. Fuel costs represented approximately $6.8 million (6% of total production costs) at Greens Creek in 2012 compared to $12.7 million (13% of production costs) in 2011 and $5.1 million (6% of production costs) in 2010. The cost of hydroelectric power was $6.8 million (6% of production costs) in 2012, $3.9 million (4% of production costs) in 2011, and $6.2 million (7% of production costs) in 2010.
The chart below illustrates the factors contributing to the variances in total cash costs per silver ounce for 2012 compared to 2011 and 2010:
Mining and milling cost per ounce increased in 2012 compared to 2011 and 2010 due to increased use of contract miners, higher maintenance costs in the first half of 2012, and the effect of lower silver production on cost per ounce, partially offset by lower power costs.
Other cash costs per ounce for 2012 were higher compared to 2011 and 2010 due to the effect of lower silver production and higher labor costs, partially offset by lower mine license tax.
Treatment costs were slightly lower in 2012 compared to 2011 as a result of lower precipitation levelszinc concentrate production and lower zinc and lead prices. Treatment costs include a price participation component that fluctuates with changes in Southeastern Alaska. Diesel fuel expense at Greens Creek increased by $7.7 million in 2011base metal prices. In 2012, treatment costs were higher compared to the same period in 2010 and by $6.1 million compared to the same period in 2009. The result is due to an increase in fuel consumption of 97%base treatment charges. In addition, we incurred additional refining charges for shipments sent to China.
By-product credits were lower in 2012 compared to 2011 due to lower lower zinc and 15%lead prices, lower zinc production due to lower ore grades, and lower gold production. By-product credits were lower in 2012 compared to 2010 and 2009, respectively, as well as an increase in the cost of diesel.
The $2.61 increase in total cash cost per silver ounce in 2011 compared to 2010 is primarily due to production costs, treatment and freight costs, and production taxes that increased by $2.55, $1.70, and $0.03 per ounce, respectively, partially offset by higher by-product credits of $1.65 per ounce. The increase in by-product credits is due to higher prices, in spite of lower ore grades, for all four metals. The $4.25 decrease in total cash cost per silver ounce in 2010 compared to 2009 is primarily due to by-product credits that increased by $8.10 per ounce, due to higher zinc gold, and lead prices and lower production partially offset by higher treatment and freight costs, production costs, and production taxes of $2.36, $0.91, and $0.57 per ounce, respectively. The higher treatment and freight costs in 2010 arefor both metals due primarily to increased price participation charges by smelters resulting from higher metals prices.lower ore grades.
The difference between what we report as "production" and "payable metal quantities sold" is due essentially to the difference between the quantities of metals contained in the concentrate we produce versus the portion of those metals actually payablepaid for by our smelter customers according to the terms of the smelter contracts.contracts (not all of the metals contained in our concentrate shipments are physically recovered through the smelting process). Differences can also arise from inventory changes incidental to shipping schedules.
While valuerevenue from zinc, lead and gold by-products is significant, we believe that identification of silver as the primary product of the Greens Creek unit is appropriate because: silver has historically accounted for a higher proportion of revenue than any other metal and is expected to do so in the future;
we have historically presented Greens Creek as a producer primarily of silver, based on the original analysis that justified putting the project into production, and believe that consistency in disclosure is important to our investors regardless of the relationships of metals prices and production from year to year;
metallurgical treatment maximizes silver recovery;
the Greens Creek deposit is a massive sulfide deposit containing an unusually high proportion of silver; and
in most of its working areas, Greens Creek utilizes selective mining methods in which silver is the metal targeted for highest recovery.
We periodically review our proven and probable reservesrevenues to ensure that reporting of primary products and by-products is appropriate. Because we consider zinc, lead and gold to be by-products of our silver production, within our cost per ounce calculations, the values of these metals offset operating costs.costs within our cost per ounce calculations.
In the fourth quarter of 2012, we updated our asset retirement obligation ("ARO") at Greens Creek to reflect a preliminary revised reclamation and closure plan having estimated undiscounted costs of approximately $73.9 million, an increase from the $53.4 million in the previous plan. See Note 4 of Notes to Consolidated Financial Statements for more information on the ARO update. We expect to again update our ARO and revise our closure plan in 2013 for a tailings capacity expansion at Greens Creek which is currently under consideration by the government agencies. Adjustments to the ARO liability are recorded with corresponding changes to the ARO asset balance, which is included in properties, plants, equipment, and mineral interests, net on our Consolidated Balance Sheets. As a result, we do not anticipate future updates in the ARO for Greens Creek to have a material impact on our annual results of operations. As part of the revised closure plan, we may be required to increase our current $30 million reclamation bond for Greens Creek. Although we do not know the amount of such increase, it likely will be a material amount, and there can be no assurance that this bonding capacity will be available to us at that time.
The Lucky Friday Segment
The following is a comparison of the operating results and key production statistics of our Lucky Friday segment (dollars are in thousands, except per ounce and per ton amounts):| | | Years Ended December 31, | | |
| Dollars are in thousands (except per ounce and per ton amounts) | | | Years Ended December 31, |
| | | 2011 | | | 2010 | | | 2009 | | | 2012 | | | 2011 | | 2010 |
| Sales | | $ | 134,728 | | $ | 105,495 | | $ | 83,230 | | | $ | 248 | | | $ | 134,728 | | | $ | 105,495 | |
| Cost of sales and other direct production costs | | (52,180 | ) | | (47,159 | ) | | (44,972 | ) | | | — | | | | (52,180 | ) | | | (47,159 | ) |
| Depreciation, depletion and amortization | | (6,053 | ) | | (8,340 | ) | | (9,928 | ) | | | — | | | | (6,053 | ) | | | (8,340 | ) |
| Gross profit | | $ | 76,495 | | | $ | 49,996 | | $ | 28,330 | | | $ | 248 | | | $ | 76,495 | | | $ | 49,996 | |
| | | | | | | | | | | | | | | | | |
| Tons of ore milled | | 298,672 | | 351,074 | | 346,395 | | | | — | | | | 298,672 | | | | 351,074 | |
| Production: | | | | | | | | | | | | | | | | |
| Silver (ounces) | | 2,985,339 | | 3,359,379 | | 3,530,490 | | | | — | | | | 2,985,339 | | | | 3,359,379 | |
| Lead (tons) | | 18,095 | | 21,619 | | 22,010 | | | | — | | | | 18,095 | | | | 21,619 | |
| Zinc (tons) | | 7,305 | | 9,286 | | 10,616 | | | | — | | | | 7,305 | | | | 9,286 | |
| Payable metal quantities sold: | | | | | | | | | | | | | | | | |
| Silver (ounces) | | 2,805,402 | | 3,136,205 | | 3,316,034 | | | | — | | | | 2,805,402 | | | | 3,136,205 | |
| Lead (tons) | | 16,983 | | 20,213 | | 20,461 | | | | — | | | | 16,983 | | | | 20,213 | |
| Zinc (tons) | | 5,465 | | 6,850 | | 7,794 | | | | — | | | | 5,465 | | | | 6,850 | |
| Ore grades: | | | | | | | | | | | | | | | | |
| Silver ounces per ton | | 10.69 | | 10.25 | | 10.86 | | | | — | | | | 10.69 | | | | 10.25 | |
| Lead percent | | 6.51 | | 6.60 | | 6.82 | | | | — | | | | 6.51 | | | | 6.60 | |
| Zinc percent | | 2.82 | | 3.04 | | 3.46 | | | | — | | | | 2.82 | | | | 3.04 | |
| Mining cost per ton | | $ | 60.76 | | $ | 54.27 | | $ | 58.56 | | | $ | — | | | $ | 60.76 | | | $ | 54.27 | |
| Milling cost per ton | | $ | 16.96 | | $ | 14.74 | | $ | 14.98 | | | $ | — | | | $ | 16.96 | | | $ | 14.74 | |
Total cash cost per silver ounce (1) | | $ | 6.47 | | $ | 3.76 | | $ | 5.21 | | | $ | — | | | $ | 6.47 | | | $ | 3.76 | |
| (1) | A reconciliation of this non-GAAP measure to cost of sales and other direct production costs and depreciation, depletion and amortization, the most comparable GAAP measure, can be found below in Reconciliation of Total Cash Costs (non-GAAP) to Costs of Sales and Other Direct Production Costs and Depreciation, Depletion and Amortization (GAAP). |
The increasedecrease in gross profit for 2012 compared to 2011 and 2010 resulted from the suspension of production at the Lucky Friday mine during 2012, as discussed below. Gross profit for 2011 increased compared to 2010 and 2009 is primarily due to higher average market and realized prices for all metals produced at the Lucky Friday (further discussed in Results of Operations above), partially offset by higher costcosts of sales and other direct production costs due primarily to increased employee profit sharing and taxes resulting from increased profitability.
At the end of 2011, MSHA began a special impact inspection at the Lucky Friday mine which resulted in an order to remove built-up cementitious material from the Silver Shaft, as further discussed in Item 2. Property Descriptions, Operating Properties, The Lucky Friday Unit. The Silver Shaft is an approximately one-mile deep, 18-foot diameter, concrete-lined shaft from surface. It is the primary access to the Lucky Friday mine's underground workings. In response to the MSHA order, we submitted a plan to MSHA and received approval to remove the built-up cementitious material, and that work commenced in the first quarter of 2012. The plan also included removal of unused utilities, construction of a water ring to prevent ice from forming in the winter, the installation of a metal brattice, repair of shaft steel, and installation of a new power cable, all of which should improve the shaft's functionality and possibly improve the shaft's hoisting capacity. Production was temporarily suspended during all of 2012 as the Silver Shaft rehabilitation work was performed. During the suspension of production, the smelter contracts related to treatment of Lucky Friday concentrates were suspended based on force majeure. The shaft restoration project and other related work has been completed, with limited production at the Lucky Friday recommencing in early 2013. We anticipate a ramp-up in mine output during the first half of the year as additional production areas come on line, with a return to full production levels expected in mid-2013. However, the timing of the return to full production at the Lucky Friday mine may ultimately vary from our current estimates. Once the Silver Shaft rehabilitation work was completed down to the 4900 level, we commenced construction of a haulage way bypass around an area impacted by a rock burst in December 2011, and completed the bypass in early 2013. Completion of work on the Silver Shaft to the 4900 level also enabled planning and other preliminary work to resume on the #4 Shaft project (discussed below), and we resumed sinking of #4 Shaft in early 2013 upon completion of the Silver Shaft work. Care and maintenance costs incurred at the Lucky Friday during the suspension of production totaled $25.3 million, including $6.3 million in depreciation, depletion, and amortization, in 2012. These costs are included in a separate line item under Other operating expenses on the Consolidated Statement of Operations and Comprehensive Income.
Depreciation, depletion, and amortization expense at Lucky Friday of $6.3 million for 2012 was included in Lucky Friday suspension-related costs under Other operating expenses on the Consolidated Statement of Operations and Comprehensive Income.Depreciation, depletion, and amortization expense for 2011 was 27% lower than in 2010 and 39% lower than in 2009 due to reduced units-of-production depreciation. The majority of the decrease was incidental to an extension of expected mine life at Lucky Friday, resulting in the book value of units-of-production assets being depreciated over a longer duration. The extension of the expected mine life is primarily due to the positive economics of the #4 Shaft project which, when completed, will provide deeper access beyond the current workings (see below for further discussion of the #4 Shaft project). In addition, production was lower in 2011 compared the previous two years,year, primarily due to down-time related to the accidents discussed below.
Mining and milling costs per ton increased in 2011 by 12% and 15%, respectively, compared to 2010 and by 4% and 13%, respectively, compared to 2009 primarily due to lower production and higher costs of fuel, consumable underground materials, reagents, and maintenance supplies. The $2.71 increasechart below illustrates the factors contributing to the variances in total cash costcosts per silver ounce for 2011 and 2010: 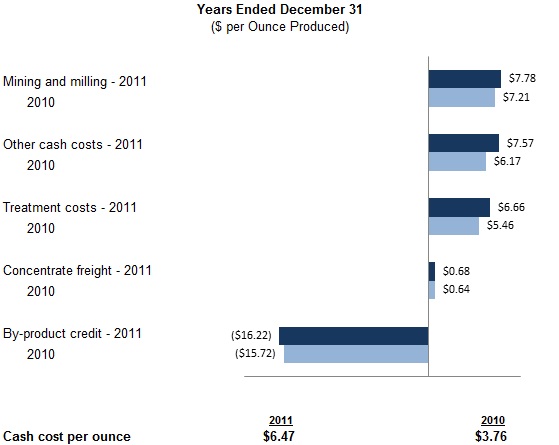
Mining and milling costs per ounce increased in 2011 compared to 2010 is due primarilyto the higher cost of consumables and supplies. The higher other cash costs per ounce in 2011 are mainly due to increased profit sharing, as a result of higher silver prices and profits. Treatment costs increased in 2011 due to higher profit sharing and otherlead prices, as treatment costs by $1.76 per ounce, higher treatment and freight costs by $1.24 per ounce, and higher production costs by $0.21 per ounce, partially offset by higherinclude a price participation component that fluctuates with changes in base metal prices. The increase in by-product credits by $0.50 per ounce resulting fromin 2011 is also attributable to the higher lead and zinc prices. The $1.45 decrease in total cash cost per silver ounce in 2010 compared to 2009 is due primarily to higher by-product credits by $2.95 per ounce resulting from higher lead and zinc prices, partially offset by higher employee profit sharing,lower lead and zinc production expensed site infrastructure, and treatment and freight costs by $0.72, $0.34, $0.33, and $0.13 per ounce, respectively. in 2011 compared to 2010.
The difference between what we report as “production” and “payable metal quantities sold” is due to the difference between the quantities of metals contained in the concentrates we produce versus the portion of those metals actually payablepaid for by our smelter customers according to the terms of the smelter contracts.contracts (not all of the metals contained in our concentrate shipments are physically recovered through the smelting process). The decrease in payable quantities sold in 2011 compared to 2010 and 2009 is attributable to a decrease in production due mainly to various down-time periods related to the accidents discussed below.
While valuerevenue from lead and zinc is significant at the Lucky Friday, we believe that identification of silver as the primary product, with zinclead and leadzinc as by-products, is appropriate because:
silver has historically accounted for a higher proportion of revenue than any other metal and is expected to do so in the future;
the Lucky Friday unit is situated in a mining district long associated with silver production; and
the Lucky Friday unit generally utilizes selective mining methods to target silver production.
We periodically review our proven and probable reservesrevenues to ensure that reporting of primary products and by-products is appropriate. Because we consider zinclead and leadzinc to be by-products of our silver production, within our cost per ounce calculations, the values of these metals offset operating costs.costs within our cost per ounce calculations.
On April 15, 2011, a fall of ground, which caused a fatality, occurred at the Lucky Friday mine, leading us to immediately halt all operations other than the rescue and recovery efforts at the mine. Operations resumed approximately 10 days after the accident occurred. The accident involved a localized fall of ground at 6150 feet below surface in an area known as the West 15 Stope. MSHA had representatives on-site at the Lucky Friday periodically from April 16, 2011 through June 2011. In addition to our decision to immediately halt mining operations pending rescue and recovery efforts, MSHA issued orders to Hecla Limited under Sections 103(j) and (k) of the Federal Mine Safety & Health Act of 1977 (“Mine Safety Act'), prohibiting all activity in the West 15 Stope except to the extent necessary for rescue and recovery operations or to prevent or eliminate an imminent danger. Subsequent to the recovery efforts and reopening of other portions of the mine, MSHA issued orders under Section 103(k) of the Mine Safety Act prohibiting all activity in Stopes 12 and 15, pending MSHA's determination that it is safe to resume normal mining operations in those areas. Operations resumed in Stope 12 in June 2011, and in Stope 15 in July 2011 with MSHA approval, and MSHA has completed their investigation of the accident. On November 17, 2011, an accident occurred as part of the construction of the #4 Shaft (discussed below), resulting in the fatality of an employee of the #4 Shaft contractor. The accident was caused by the collapse of under-foot material during construction of an underground rock bin. Mining operations at the Lucky Friday mine were immediately suspended on the day of the accident, and MSHA subsequently issued an order under Section 103(j) of the Mine Safety Act, prohibiting activity in the area impacted by the accident except to the extent necessary for investigation purposes. The #4 Shaft construction activity resumed in November 2011 with MSHA's approval.On December 14, 2011, a rock burst resulting from natural seismic activity approximately 5900 feet below surface resulted in non-life-threatening injuries to seven employees. The employees were working on installation of a steel liner to enhance a primary access way damaged by a previous rock burst occurring on November 16, 2011. That rock burst was caused by mine blasting at the end of a shift, and no employees were impacted at the time of the rock burst. We evacuated the mine and halted operations on December 14, and MSHA subsequently issued an order under Section 103(k) closing the mine, which is currently in effect. In December 2011, we determined that a new haulage way to bypass the area impacted by the rock burst is required. Once construction of the bypass has started, we expect it will take approximately two months to complete. At the end of 2011, MSHA began a special impact inspection at the Lucky Friday mine which resulted in an order to remove loose material from the Silver Shaft, even though the Silver Shaft was not involved in the rock burst or any of the other incidents which occurred in 2011. The Silver Shaft is an approximately one-mile deep, 18-foot diameter, concrete-lined shaft from surface and the primary access to the Lucky Friday mine's underground workings. In response, we submitted a plan to MSHA and received approval to remove the loose cementitious material. In addition, the plan includes removal of unused utilities, construction of a water ring to prevent ice from forming in the winter, the installation of a metal brattice, repair of shaft steel, and installation of a new power cable, all of which should improve the shaft's functionality and possibly improving the shaft's hoisting capacity. We currently anticipate that the Silver Shaft work will be completed in late 2012, with production at the Lucky Friday temporarily suspended until early 2013. During this period, the smelter contracts related to treatment of Lucky Friday concentrates have been suspended based on force majeure. We anticipate that we will be able to commence construction of the haulage way bypass around the rock burst area (discussed in the preceding paragraph) once the Silver Shaft cleanup has been completed down to the 4900 level and resume work on the #4 Shaft project in early 2013 once the Silver Shaft work is completed.Work continued during 2011 on the #4 Shaft project, an internal shaft at the Lucky Friday mine, which,will, upon its completion, will provide deeper access in order to expand the mine's operational life. We commenced engineering and construction activities on #4 Shaft in late 2009,2008, and our Board of Directors gave its final approval of the project in August 2011. Construction of the #4 Shaft as currently designed is expected to cost a total of approximately $200 million, including approximately $90$92 million already spent as of December 31, 2011,2012, with completion expected in late 2015.2016. As discussed above, the #4 Shaft construction will besinking activities were temporarily suspended until cleanup work in the Silver Shaft is completed. Once construction of #4 Shaft resumes, wewas completed in early 2013. We believe that our current capital resources will allow us to complete the project. However, there are a number of factors that could affect completion of the project, including: (i) a significant decline in metals prices, (ii) a reduction in available cash or credit, whether arising from decreased cash flow or other uses of available cash, (iii) increased regulatory burden, or (iii)(iv) a significant increase in operating or capital costs.
Many of the employees at our Lucky Friday unit are represented by a union. The collective bargaining agreement with the union expires on April 30, 2016. See Item 1. Business, Employees and Item 1A. Risk Factors, Our business depends on finding skilled miners and maintaining good relations with our employees for more information on the status of employment levels and relations at the Lucky Friday unit.
In addition to the variances discussed in the Results of Operations section above, other significant variances affecting 2012 results compared to 2011 results were as follows: Higher general and administrative expense in 2012 by $2.7 million primarily due to increased workforce costs.
Lower other operating expense by $3.2 million, primarily as a result of $2.0 million in donations to the Hecla Charitable Foundation in 2011 (see Note 15 of Notes to the Condensed Consolidated Financial Statements).
Other significant variances affecting 2011 results compared to 2010 results were as follows:
An increase in other operating expense of $2.3 million in 2011 was primarily due to an increase in pension plan actuarial liabilities. See Note 8 of Notes to Condensed Consolidation Financial Statements for more information.
Decrease in provision for closed operations and environmental matters in 2011 by $191.4 million due primarily to a provision of $193.2 million recorded in the fourth quarter of 2010 to increase our liability for environmental obligations in Idaho’s Coeur d’Alene Basin pursuant to negotiations with the Plaintiffs in the Coeur d’Alene Basin environmental litigation and the State of Idaho on the financial terms of settlement of the litigation and related claims. The settlement was finalized in September 2011.
Mark-to-market gains on financially-settled forward contracts for forecasted lead and zinc sales totaled $38 million in 2011 compared to mark-to-market losses of $20.8 million in 2010.
Interest expense increased by $0.7 million in 2011 due to the accrual of pre-lodging interest associated with the proposed terms of potential settlement with the Plaintiffs in the Coeur d'Alene Basin environmental litigation that took place in the second quarter of 2011. The pre-lodging interest period ended with lodging of the Consent Decree with the Court in June 2011. See Note 4 of Notes to the Condensed Consolidated Financial Statements for more information.
Income tax provisions totaled $82 million in 2011 compared to an income tax benefit of $123.5 million in 2010. The higher current-year provisions are the result of increased pre-tax income and release of valuation allowances on our deferred tax assets in 2010. See Note 5 of Notes to the Condensed Consolidated Financial Statements for more information.
Other significant variances affecting our 2010 results compared to 2009 results were as follows:A gain of $6.2 million in 2009 on the sale of our mill in Mexico, with no similar event in 2010.
Termination of an employee benefit plan in 2009 with a gain of $9.0 million, with no similar event in 2010.
Other operating expense included cash donations totaling $1.5 million in 2010 to the Hecla Charitable Foundation for its charitable work, including supporting the communities in which Hecla has employees and interests. This was offset by a decrease in pension benefit costs recognized resulting from an increase in the expected returns calculated for plan assets due to higher plan asset values.
Higher provision for closed operations and environmental matters in 2010 by $193.4 million. The principal cause of the increase was a $193.2 million increase in our accrual for environmental obligations related to the Coeur d’Alene Basin, compared to $4.0 million in 2009. The increase in 2010 was pursuant to negotiations with the Plaintiffs in the Coeur d’Alene Basin environmental litigation and the State of Idaho on the financial terms of potential settlement of the litigation and related claims. For further discussion, see Note 7 to Notes to Consolidated Financial Statements.
Interest expense and debt-related fees were $15.1 million lower in 2010 as a result of payoff in 2009 of corporate debt, offset partly by increased capital leases in 2010.
Mark-to-market losses on financially-settled forward contracts for forecasted lead and zinc sales totaling $20.8 million in 2010. The program commenced in April 2010, and hence, no such activity was reported in 2009.
An income tax benefit of $123.5 million compared to an income tax benefit of $7.7 million in 2009. The 2010 income tax benefit is primarily related to deferred tax asset valuation allowance adjustments of $88.1 million partially offset by current income tax provision and amortization of deferred tax assets. See Note 5 to Notes to Consolidated Financial Statements for further discussion.
Our defined benefit pension plans, while affording a significant benefit to our employees, also represent a significant liability. During 2011,2012, the funded status of our plans changed from a liability of $6.5$22.8 million at the first of the year to $22.8a liability of $30.9 million at the end of the year. The increased liability was attributable to decreasedservice costs, interest costs, and amortization of actuarial losses, totaling $15 million, that exceeded returns on plan assets the effect of decreased interest rates on future benefits, and higher service cost attributable to a higher employee count. Unrecognized losses recorded in accumulated other comprehensive income, which will be amortized over future years, increased by $13 million during the year, and weour contributions, totaling $6.9 million. We expect to contribute $1.1$1.3 million to the Hecla planplans in 2012.2013. While the economic variables which will determine future cash requirements are uncertain, we expect contributions to increase in future years.years under current plan provisions, and we periodically examine the plans for affordability and competitiveness. See Note 8 of Notes to Consolidated Financial Statements for more information.
Our net deferred tax asset at December 31, 20112012 totaled $115.8 million, or 8% of total assets, a decrease of $71.6 million from the previous year-end balance of $187.4 million.assets. The largest componentcomponents of the deferred tax asset isare derived from deferred reclamation of which the majority will be realized in the next two years, assuming adequate taxable income. The next largest component derives fromand the tax effect of past net operating losses carried forward to be applied against current income to determine cash income tax liability. The majority of the deferred tax asset for deferred reclamation will be realized within the next two years, assuming adequate taxable income. Each reporting period, we assess our deferred tax assets with long-range forecasts to provide reasonable assurance that they will be realized through future earnings. As a result of such modeling, in 2010 we removed a substantial portion of the valuation allowance on our deferred tax assets following analysis of our operational plans and increased prices, resulting in a tax benefit of $88.1 million. At December 31, 2011,2012, with the exception of $0.3 million relating to net operating loss carry forwards forcarryforwards in states where we currently have no activity and $2.3$2.8 million for foreign tax credits, we retained no valuation allowance on U.S. deferred tax assets. A $20.3$19.9 million valuation allowance remains on losses in foreign jurisdictions. As discussed in Note 5 of Notes to Consolidated Financial Statements, our effective tax rate was 35%37% for 2011,2012, based on our review of statutory rates and permanent book/tax differences. We currently expect the effective tax rate for 20122013 to be approximately 40%, with the increase from 2011 attributable to the loss of percentage depletion related to the Lucky Friday mine as a result of the temporary suspension of production there.36%.
Reconciliation of Total Cash Costs (non-GAAP) to Cost of Sales and Other Direct Production Costs and Depreciation, Depletion and Amortization (GAAP) The tables below present reconciliations between non-GAAP total cash costs to cost of sales and other direct production costs and depreciation, depletion and amortization (GAAP) for our operations at the Greens Creek and Lucky Friday units for the years ended December 31, 2012, 2011 2010 and 20092010 (in thousands, except costs per ounce). Total cash costs include all direct and indirect operating cash costs related directly to the physical activities of producing metals, including mining, processing and other plant costs, third-party refining expense, on-site general and administrative costs, royalties and mining production taxes, net of by-product revenues earned from all metals other than the primary metal produced at each unit. Total cash costs provide management and investors an indication of net cash flow, after consideration of the realized price received for production sold. Management also uses this measurement for the comparative monitoring of performance of our mining operations period-to-period from a cash flow perspective. “Total cash cost per ounce” is a measure developed by precious metals companies in an effort to provide a comparable standard;uniform standard for comparison purposes; however, there can be no assurance that our reporting of this non-GAAP measure is similar to that reported by other mining companies. Cost of sales and other direct production costs and depreciation, depletion and amortization, is the most comparable financial measure calculated in accordance with GAAP to total cash costs. The sum of the cost of sales and other direct production costs and depreciation, depletion and amortization for our operating units in the tables below is presented in our Consolidated Statement of Operations and Comprehensive Income (Loss).
| | Total, All Properties |
| | Year ended December 31, |
| | 2012 | | 2011 | | 2010 |
| Total cash costs | $ | 17,262 | | | $ | 10,934 | | | $ | (15,435 | ) |
| Divided by silver ounces produced | 6,394 | | | 9,483 | | | 10,566 | |
| Total cash cost per silver ounce produced | $ | 2.70 | | | $ | 1.15 | | | $ | (1.46 | ) |
| Reconciliation to GAAP: | | | | | |
| Total cash costs | $ | 17,262 | | | $ | 10,934 | | | $ | (15,435 | ) |
| Depreciation, depletion and amortization | 43,522 | | | 47,066 | | | 60,011 | |
| Treatment costs | (73,355 | ) | | (99,019 | ) | | (92,144 | ) |
| By-product credits | 190,916 | | | 254,372 | | | 267,272 | |
| Change in product inventory | (1,381 | ) | | (4,805 | ) | | 3,660 | |
Suspension-related costs 1 | — | | | 4,135 | | | — | |
| Reclamation and other costs | 663 | | | (44 | ) | | 630 | |
| Cost of sales and other direct production costs and depreciation, depletion and amortization (GAAP) | $ | 177,627 | | | $ | 212,639 | | | $ | 223,994 | |
| | | Total, All Properties |
| | | Year ended December 31, |
| | | 2011 | | 2010 | | 2009 |
| Total cash costs | | $ | 10,934 | | | $ | (15,435 | ) | | $ | 20,958 | |
| Divided by silver ounces produced | | 9,483 | | | 10,566 | | | 10,989 | |
| Total cash cost per ounce produced | | $ | 1.15 | | | $ | (1.46 | ) | | $ | 1.91 | |
| Reconciliation to GAAP: | | | | | | |
| Total cash costs | | $ | 10,934 | | | $ | (15,435 | ) | | $ | 20,958 | |
| Depreciation, depletion and amortization | | 47,066 | | | 60,011 | | | 62,837 | |
| Treatment costs | | (99,019 | ) | | (92,144 | ) | | (80,830 | ) |
| By-product credits | | 254,372 | | | 267,272 | | | 206,608 | |
| Change in product inventory | | (4,805 | ) | | 3,660 | | | 310 | |
Suspension-related costs 1 | | 4,135 | | | — | | | — | |
| Reclamation and other costs | | (44 | ) | | 630 | | | 1,596 | |
| Cost of sales and other direct production costs and depreciation, depletion and amortization (GAAP) | | $ | 212,639 | | | $ | 223,994 | | | $ | 211,479 | |
| | | Greens Creek Unit |
| | | Year ended December 31, |
| | | 2011 | | 2010 | | 2009 |
| Total cash costs | | $ | (8,387 | ) | | $ | (28,073 | ) | | $ | 2,582 | |
| Divided by silver ounces produced | | 6,498 | | | 7,207 | | | 7,459 | |
| Total cash cost per ounce produced | | $ | (1.29 | ) | | $ | (3.90 | ) | | $ | 0.35 | |
| Reconciliation to GAAP: | | | | | | |
| Total cash costs | | $ | (8,387 | ) | | $ | (28,073 | ) | | $ | 2,582 | |
| Depreciation, depletion and amortization | | 41,013 | | | 51,671 | | | 52,909 | |
| Treatment costs | | (79,134 | ) | | (73,817 | ) | | (62,037 | ) |
| By-product credits | | 205,961 | | | 214,462 | | | 161,537 | |
| Change in product inventory | | (4,966 | ) | | 3,685 | | | 14 | |
| Reclamation and other costs | | (81 | ) | | 567 | | | 1,574 | |
| Cost of sales and other direct production costs and depreciation, depletion and amortization (GAAP) | | $ | 154,406 | | | $ | 168,495 | | | $ | 156,579 | |
| | | Lucky Friday Unit | | Greens Creek Unit |
| | | Year ended December 31, | | Year ended December 31, |
| | | 2011 | | 2010 | | 2009 | | 2012 | | 2011 | | 2010 |
| Total cash costs | | $ | 19,321 | | $ | 12,638 | | $ | 18,376 | | | $ | 17,262 | | | $ | (8,387 | ) | | $ | (28,073 | ) |
| Divided by silver ounces produced | | 2,985 | | | 3,359 | | | 3,530 | | | | 6,394 | | | | 6,498 | | | | 7,207 | |
| Total cash cost per ounce produced | | $ | 6.47 | | | $ | 3.76 | | | $ | 5.21 | | |
| Total cash cost per silver ounce produced | | | $ | 2.70 | | | $ | (1.29 | ) | | $ | (3.90 | ) |
| Reconciliation to GAAP: | | | | | | | | | | | | | | | |
| Total cash costs | | $ | 19,321 | | $ | 12,638 | | $ | 18,376 | | | $ | 17,262 | | | $ | (8,387 | ) | | $ | (28,073 | ) |
| Depreciation, depletion and amortization | | 6,053 | | 8,340 | | 9,928 | | | | 43,522 | | | | 41,013 | | | | 51,671 | |
| Treatment costs | | (19,885 | ) | | (18,327 | ) | | (18,793 | ) | | | (73,355 | ) | | | (79,134 | ) | | | (73,817 | ) |
| By-product credits | | 48,411 | | 52,810 | | 45,071 | | | | 190,916 | | | | 205,961 | | | | 214,462 | |
| Change in product inventory | | 161 | | (25 | ) | | 296 | | | | (1,381 | ) | | | (4,966 | ) | | | 3,685 | |
Suspension-related costs 1 | | 4,135 | | — | | — | | |
| Reclamation and other costs | | 37 | | | 63 | | | 22 | | | | 663 | | | | (81 | ) | | | 567 | |
| Cost of sales and other direct production costs and depreciation, depletion and amortization (GAAP) | | $ | 58,233 | | | $ | 55,499 | | | $ | 54,900 | | | $ | 177,627 | | | $ | 154,406 | | | $ | 168,495 | |
| | | Lucky Friday Unit |
| | | Year ended December 31, |
| | | 2012 | | 2011 | | 2010 |
| Total cash costs | | $ | — | | | $ | 19,321 | | | $ | 12,638 | |
| Divided by silver ounces produced | | | — | | | | 2,985 | | | | 3,359 | |
| Total cash cost per silver ounce produced | | $ | — | | | $ | 6.47 | | | $ | 3.76 | |
| Reconciliation to GAAP: | | | | | | | | | | | | |
| Total cash costs | | $ | — | | | $ | 19,321 | | | $ | 12,638 | |
| Depreciation, depletion and amortization | | | — | | | | 6,053 | | | | 8,340 | |
| Treatment costs | | | — | | | | (19,885 | ) | | | (18,327 | ) |
| By-product credits | | | — | | | | 48,411 | | | | 52,810 | |
| Change in product inventory | | | — | | | | 161 | | | | (25 | ) |
Suspension-related costs 1 | | | — | | | | 4,135 | | | | — | |
| Reclamation and other costs | | | — | | | | 37 | | | | 63 | |
| Cost of sales and other direct production costs and depreciation, depletion and amortization (GAAP) | | $ | — | | | $ | 58,233 | | | $ | 55,499 | |
1 Various accidents and other events resulted in temporary suspensions of production at the Lucky Friday unit during 2011.2011 and throughout 2012. See the Lucky Friday Segment section for further discussion of these events.discussion. Care-and-maintenance, mine rehabilitation, investigation, and other costs incurred during the suspension periods not related to production have been excluded from total cash costs and the calculation of total cash cost per silver ounce produced.
Financial Liquidity and Capital Resources
Our liquid assets include (in millions): | | | December 31, 2011 | | | December 31, 2010 | | | December 31, 2009 | | | December 31, 2012 | | | December 31, 2011 | | | December 31, 2010 | |
| Cash and cash equivalents held in U.S. dollars | | $ | 266.4 | | | $ | 283.1 | | | $ | 104.6 | | | $ | 190.5 | | | $ | 266.4 | | | $ | 283.1 | |
| Cash and cash equivalents held in foreign currency | | | 0.1 | | | | 0.5 | | | | 0.1 | | | | 0.4 | | | | 0.1 | | | | 0.5 | |
| Marketable equity securities, current | | | — | | | | 1.5 | | | | 1.1 | | | | — | | | | — | | | | 1.5 | |
| Marketable equity securities, non-current | | | 3.9 | | | | 1.2 | | | | 2.2 | | | | 9.6 | | | | 3.9 | | | | 1.2 | |
| Total cash, cash equivalents and investments | | $ | 270.4 | | | $ | 286.3 | | | $ | 108.0 | | | $ | 200.5 | | | $ | 270.4 | | | $ | 286.3 | |
Cash and cash equivalents held in U.S. dollars decreased by $16.7 million in 2011,2012, as discussed below. Cash held in foreign currencies represent nominal balances in Canadian dollars and Mexican pesos. The value of current marketable securities decreased by $1.5 million due to the sale of securities during the first quarter of 2011, while non-current marketable equity securities increased by $2.7$5.7 million due primarily to investments in junior mining companies in the purchasesecond half of mining company securities in March 2011.2012. In 2011, we settled Hecla Limited's negotiations with representatives of the United States, the State of Idaho and the Coeur d'Alene Tribe regarding settlement of the Coeur d'Alene Basin environmental litigation and related claims culminated inpursuant to a comprehensive settlement reflected in a final and binding Consent Decree entered by the Court on September 8, 2011. As a resultPayments of entryapproximately $168 million and $25 million (and related interest) were made in October 2011 and 2012, respectively, pursuant to the terms of the Consent Decree, Hecla Limited made payments totaling approximately $168 million to the Plaintiffs in early October 2011, thereby decreasing our cash and cash equivalents accordingly.Decree. Hecla Limited remains obligated under the Consent Decree to make payments totaling $70.5 million, plus interested, over the following payments: $25 millionnext year-and-a-half. See Note 4 of cash by October 8, 2012;
$15 million of cash by October 8, 2013; and
Approximately $55.4 million by August 2014, as quarterly payments of the proceeds from the exercise of any outstanding Series 1 and Series 3 warrants (which have an exercise price of between $2.44 and $2.49 per share) during the quarter, with the remaining balance, if any, due in August 2014, regardless of whether any of the remaining warrants are exercised.
Notes to Consolidated Financial Statements for more information.
The foregoing payments require third party surety for#4 Shaft project, which Hecla Limited pays an annual maintenance fee which will decrease as payments are made accordingis discussed further in the Lucky Friday Segment section above, is expected to the foregoing schedule. The first annual maintenance feeinvolve capital expenditures of $0.6approximately $200 million, was paid in October 2011. The $25including approximately $92 million and $15 million payments accrue interest from the entry of the Consent Decree until payment at the Superfund rate (0.69% for 2011, 0.74% for 2012). In addition to the foregoing payments, Hecla Limited is obligated to provide the Plaintiffs with a limited amount of land it currently owns to be used as a repository waste site. We entered into a $380 million credit facility in April of 2008 for the acquisition of the companies owning 70.3% of the joint venture operating the Greens Creek mine. We fully repaid the facility with a final payment of $38.3 million from available cash in October 2009. We also entered into senior-secured revolving credit facility in October 2009, which was amended in October 2011 to increase the facility to $100 million. The facility is available for general corporate purposes and, based on our current cash position and business plan, we do not currently anticipate drawingthat has been spent on the facilityproject as of December 31, 2012.
Pursuant to our common stock dividend policy described in the near term. See Note 68 of Notes to Consolidated Financial Statements, our Board of Directors declared and paid common dividends totaling $17.1 million in 2012, and declared a dividend totaling $3.6 million in February 2013, payable in March 2013. Our dividend policy has a silver-price-linked component which ties the amount of declared common stock dividends to our realized silver price for information on how the covenants inpreceding quarter. Another component of our credit facility may impactcommon stock dividend policy anticipates paying an annual minimum dividend. The declaration and payment of common stock dividends is at the sole discretion of our liquidityBoard of Directors, and capital resourcesthere can be no assurance that we will continue to declare and pay common stock dividends in the future. WeAssuming no change from the current number of common shares outstanding, aggregate cash dividends under this policy would total approximately $3.6 million per quarter if average realized silver prices are between $30 and $35 per ounce and $6.4 million per quarter if silver prices are between $35 and $40 per ounce, if declared by the Board of Directors. On May 8, 2012, we announced that our Board of Directors approved a stock repurchase program. Under the program, we are authorized to repurchase up to 20 million shares of our outstanding common stock from time to time in open market or privately negotiated transactions, depending on prevailing market conditions and other factors. The repurchase program may engagebe modified, suspended or discontinued by us at any time. As of December 31, 2012, 350,300 shares have been repurchased under the program, at an average price of $5.54 per share, leaving 19.65 million shares that may yet be purchased under the program as of year end. The closing price of our common stock at February 21, 2013, was $4.90 per share.
As discussed in other transactions, such as additional acquisition opportunitiesThe Greens Creek Segment section above, we anticipate that in 2013 we will complete development of a revised plan for reclamation and closure of the Greens Creek mine at the end of its life. Although revision of the plan has not been completed, preliminary work has led us to believe that it will result in a significant increase in estimated closure costs, which will require us to provide increased bond coverage. In the fourth quarter of 2012, we updated our asset retirement obligation at Greens Creek to reflect a preliminary revised reclamation and closure plan having estimated undiscounted costs of approximately $73.9 million. The previous estimated closure plan of $53.4 million is covered by an unsecured bond requiring no restriction of cash balances. However, it is currently unknown whether, and to what extent, bonding for the revised plan will be secured by cash or capital projects, which could require additional equity issuances or financing. There can be no assurances that such financingif it will be available to us.in the amount required.
As a result of our current cash balance, the performance of our operations, current metals prices, and full availability of our $100$150 million revolving credit agreement, we believe our cash, cash equivalents, investments, projected cash from operations, and availability of financing if needed will be adequate to meet our obligations during the next twelve12 months, including the required environmental settlement payments previously discussed, anticipated capital costs related to rehabilitation of the Silver Shaft and care-and-maintenance costs incurred at Lucky Friday as that work is completed, capital outlays for the #4 Shaft project, potential repurchases of our common stock under the program described above, and payment of potential common stock dividends, (eachif declared by our Board of these items are discussed further below).Directors. We currently estimate that a total of approximately $140$152 million will be incurredspent on capital expenditures for equipment, infrastructure, and development at our Lucky Friday and Greens Creek units in 2012, including capital costs for anticipated work on the Lucky Friday Silver Shaft, as discussed further below.2013. We also estimate that exploration and pre-development expenditures will total approximately $40$52 million in 2012; however, these2013. However, capital, exploration, and pre-development expenditures may increasechange based upon the success of programs that are currently ongoing. To increase production and mine life at the Lucky Friday mine, we continued the #4 Shaft project during 2011. Work on the project thus far has included: detailed shaft design, excavation of the hoist room and off-shaft development to access shaft facilities, installation of the hoist and head works, placement and receipt of orders for major equipment purchases,our financial position, metals prices, and other construction activities. The #4 Shaft project, as currently designed, is expected to involve development down to the 8800 foot level and capital expenditures of approximately $200 million, which includes approximately $90 million that has been spent on the project as of December 31, 2011.considerations. Our ability to finance this projectfund the activities described above will depend on our operationaloperating performance, metals prices, our ability to estimate capital costs, sources of liquidity available to us, and other factors. #4 Shaft construction has been temporarily suspended until work to be performed on the Silver Shaft (discussed further below) is completed. Once construction resumes, we believe that our available cash, revolving credit agreement, cash from operations, and access to equity and financial markets will allow us to proceed with the #4 Shaft despite the required payments under the Consent Decree which settled the Coeur d'Alene Basin environmental litigation and other obligations. We may also mitigate market risk from time to time with selective base metal derivative contract programs. However, a sustained downturn in metals prices or significant increasesincrease in operational or capital costs, other uses of cash, or other factors beyond our control could compel us to defer development below 7800 feet.impact our plans.At the end of 2011, MSHA began a special impact inspection of the Lucky Friday mine, and as a result MSHA issued an order closing down the Silver Shaft, the primary access from surface at the Lucky Friday, until we remove loose material from the shaft. As discussed further in the Lucky Friday Segment section above, we anticipate that production will be suspended until early 2013 as the Silver Shaft work and planned construction of a haulage way to bypass an area damaged by a rock burst is completed. Work on the Silver Shaft is expected to include removal of the loose cementitious material, removal of unused utilities, construction of a water ring to prevent ice from forming in the winter, the installation of a metal brattice, repair of shaft steel, and installation of a new power cable, all of which should improve the shaft's functionality and possibly improving the shaft's hoisting capacity. In addition to work on the Silver Shaft, other significant surface and underground capital programs are being planned for 2012. Final plans are not complete, but we expect to spend up to $50 million on all of these projects, including approximately $10 million to remove the loose cementitious material, $20 million for shaft improvements and $20 million on other capital projects. We expect to incur non-capitalized expenses of $17.5 million for the care and maintenance of the mine, based on the assumption that the mine will be on standby for the remainder of 2012 as this work is completed. We believe that our available cash and other financial resources will allow us to complete the Silver Shaft work and sustain temporary care-and-maintenance of the Lucky Friday mine until production resumes in early 2013.
In September 2011, our Board of Directors adopted a common stock dividend policy that links the anticipated amount of any declared dividend on our common stock to our average realized silver price in the preceding quarter. See Note 9 of Notes to Consolidated Financial Statements for information on the potential per share dividend amounts at different quarterly average realized price levels according to the policy. On November 8, 2011, our Board of Directors declared the first quarterly silver price-linked dividend of $0.02 per share ($5.6 million total), based on the average realized silver price in the third quarter of 2011 of $37.02 per ounce, which was paid in December 2011. On February 17, 2012, our Board of Directors declared a silver price-linked common stock dividend, pursuant to the policy described above, of $0.01 per share based on the average realized silver price of $31.61 per ounce in the fourth quarter of 2011. In addition, in February 2012, our Board of Directors adopted a common stock dividend policy that includes a minimum annual dividend of $0.01 per share of common stock, payable quarterly when declared, and declared a dividend of $0.0025 per share pursuant to that policy. Therefore, the aggregate common stock dividend declared by our Board of Directors was $0.0125 per share, for a total of approximately $3.6 million expected to be paid in the first quarter of 2012. The declaration and payment of common stock dividends is at the sole discretion of our Board of Directors.| | | Year Ended December 31, |
| | | 2012 | | | 2011 | | 2010 |
| Cash provided by operating activities (in millions) | | $ | 69.0 | | | $ | 69.9 | | | $ | 197.8 | |
On January 1,Cash provided by operating activities decreased by $0.9 million in 2012 compared to 2011 alldue to lower income, adjusted for non-cash items, due primarily to the suspension of production at our Lucky Friday unit during 2012 (see the outstanding shares of our 6.5% Mandatory Convertible Preferred Stock were converted to shares of our common stock, and we paid the final quarterly dividend on that series of preferred stock in January 2011 (see Note 9Lucky Friday Segment of Notes to Consolidated Financial Statementssection above for more information). We are no longer requiredThe variance in income was offset by working capital and other asset and liability changes that decreased cash flow by $34.1 million in 2012 compared to pay quarterly dividends of approximately $3.3a $162.4 million as adecrease in 2011. The larger decrease in 2011 is primarily the result of the conversion.approximately $168 million litigation settlement payment discussed further below.| | | Year Ended December 31, | |
| | | 2011 | | | 2010 | | | 2009 | |
| Cash provided by operating activities (in millions) | | $ | 69.9 | | | $ | 197.8 | | | $ | 119.2 | |
Cash provided by operating activities decreased by $127.9 million in 2011 compared to 2010 due to working capital and other asset and liability changes. This is partially offset by higher income, as adjusted for non-cash items, due to higher prices for all four metals produced at our operations. Working capital and other asset and liability changes decreased cash flow by $162.4 million in 2011, compared to a $8.1 million increase in 2010. The $170.5 million difference is due to decreases in accrued reclamation and closure costs, accounts payable, accrued taxes, and other non-current liabilities and increased inventory, partially offset by lower accounts receivable and higher accrued payroll and related benefits. The decrease in accrued reclamation and closure costs is due primarily to approximately $168 million paid to the Plaintiffs in October 2011 according to the termsas part of the Coeur d'Alene Basin litigation settlement. Accounts payable also decreased due to payment of the final quarterly dividend on the 6.5% Mandatory Convertible Preferred Stock in January 2011, and a reduction in payables related to settled base metal forward contracts. Accrued tax balances decreased during the year due to pre-payments of tax in excess of our estimated liability for the year and the refund of Alaska mine license tax related to the amendment of tax returns for previous years. Other non-current liabilities decreased as a result of a reduction in accruals for long-term incentive compensation. The decrease in accounts receivable and increase in inventory balances is due to the timing of concentrate shipments at our Greens Creek unit. Accrued payroll and related benefits balances increased due to the addition of personnel during the year and higher accruals for short-term incentive compensation. CashAt current prices, we would expect cash provided by operating activities increased by $78.6for 2013 to be comparable to or higher than levels for 2012.
| | | Year Ended December 31, |
| | | 2012 | | | 2011 | | 2010 |
| Cash used in investing activities (in millions) | | $ | 118.0 | | | $ | 79.8 | | | $ | 64.8 | |
Capital expenditures, excluding non-cash capital lease additions, for 2012 totaled $113.1 million, in 2010 compared to 2009 due to higher income, as adjusted for non-cash items. The improved results are primarily due to higher prices for all four metals producedincluding $54.3 million at our operations. Working capitalLucky Friday and other asset and liability changes increased cash flow by $8.1$50.4 million in 2010,at Greens Creek, compared to a $12.2total of $87.5 million decrease in 2009. The $20.32011. 2012 capital expenditures at Lucky Friday included approximately $26.4 million difference is duespent on rehabilitation of the Silver Shaft, compared to an increase$35.8 million spent on the #4 Shaft project in accounts payable and accrued liability and accrued taxes balances and lower trade accounts receivable, other current and noncurrent asset, and inventory balances, partially offset by lower payroll-related accruals and higher cash reductions to accrued reclamation and closure costs. The increase in accounts payable is due to increased activity at our operating units and2011. Shaft sinking activities on the accrual of dividends#4 Shaft were temporarily suspended during 2012 as work on the Silver Shaft was being completed, as further discussed in the fourth quarter of 2010 on our 6.5% Mandatory Convertible Preferred Stock, whichLucky Friday Segment section above. Capital expenditures were paidhigher at Greens Creek in cash in January 2011. We recorded increased accruals for income and production taxes2012 compared to 2011 primarily as a result of higher profitability atincreased mine development. There was substantially no change to our operations. The smaller increaserestricted cash balances in accounts receivable and2012 compared to a $6.2 million net decrease in inventory balances is due to the timing of concentrate shipments at our Greens Creek unit. Other current and noncurrent asset balances decreased due to the timing of payment of prepaid expenditures. The lower accrued payroll and related benefits balance is due mainly to the payment of 2009 incentive compensation2011. We acquired stock in other mining companies for approximately $5.8 million in 2012, with no comparable investment made in the first quarter of 2010. previous year.
The cash decrease in our reclamation accruals is due to the payment of $5.3 million related to past response costs at the Bunker Hill Superfund Site, and increased reclamation work performed at our Grouse Creek site in 2010.
| | | Year Ended December 31, | |
| | | 2011 | | | 2010 | | | 2009 | |
| Cash used in investing activities (in millions) | | $ | 79.8 | | | $ | 64.8 | | | $ | 12.1 | |
We spenttotal $87.5 million spent on capital projects in 2011, includingwhich included $49.4 million at Lucky Friday and $36.8 million at Greens Creek, which,was, in the aggregate, was $20.1 million higher than total capital expenditures of $67.4 million in 2010. 2010 capital expenditures included $50.9 million spent for projects at Lucky Friday and $16.5 million for Greens Creek. The increase in capital spending was due, in part, to advancement of various surface infrastructure projects at Greens Creek. Our restricted cash balances for environmental bonds were reduced by $9.4 million in 2011 versus $1.5 million in 2010. Sales of investments yielded $1.4 million in 2011 compared to $1.1 million in 2010.
We expect total capital expenditures to be approximately $145 million in 2013.
| | | Year Ended December 31, |
| | | 2012 | | 2011 | | 2010 |
| Cash provided by (used in) financing activities (in millions) | | $ | (26.5 | ) | | $ | (7.2 | ) | | $ | 45.9 | |
Capital expenditures for 2010 totaled $67.42012 cash used in financing activities included $17.2 million paid in common stock dividends, under the policy described above, and $0.6 million in 2010dividends to holders of our Series B Preferred Stock compared to $27.7$5.6 million and $3.8 million, respectively, in common and preferred dividends paid in 2011. We also purchased shares of our common stock for $2.1 million in 2009. The increase was due, in part,2012, with $1.9 million of that amount related to the deferralour stock repurchase program discussed above. Repayments of projects in 2009 as a result of cost-reduction efforts in response to the impact of the global economic crisis. We received $8.0capital leases totaled $5.9 million in proceeds2012, with the increase from 2011 resulting primarily from additions of equipment acquired under capital leases at Greens Creek during the sale of the Velardeña mill in Mexico in the first quarter of 2009 (see Note 17year. of Notes to Consolidated Financial Statements for more information on the sale). Our restricted cash balances for environmental bonds were reduced by $3.5 million in 2009, and proceeds from sales of investments totaled $4.1 million in 2009.| | | Year Ended December 31, |
| | | 2011 | | 2010 | | | 2009 |
| Cash provided by (used in) financing activities (in millions) | | $ | (7.2 | ) | | $ | 45.9 | | | $ | (38.9 | ) |
Cash provided by financing activities for 2011 included $5.8 million in proceeds from the exercise of warrants and stock options compared to $53.1 million in 2010 (see Note 9 of Notes to Consolidated Financial Statements for more information). We paid cash dividends on our commonpreferred stock of $5.6 million in 2011 related to the silver price-linked dividend adopted in September 2011 (discussed above). Cash dividends on preferred stock totaled $3.8 million in 2011 compared to $4.5 million in 2010.2010, with $3.3 million of the 2011 preferred stock dividends representedrepresenting the last dividend on our 6.5% Mandatory Convertible Preferred Stock, which converted to shares of our common stock in January 2011. Repayments on our capital leases were $2.9 million in 2011 versus $1.8 million in 2010. In addition, we acquired treasury shares of our common stock having a value of $0.5 million in 2011 and $0.7 million in 2010 as a result of cashless employee stock option exercises.
Our financing activities in 2009 included sales of common stock and warrants, which yielded $128.3 million cash, net of related issuance costs. Net proceeds from the stock and warrant sales were applied to repayments of our debt facility totaling $161.7 million and payments totaling $3.0 million pursuant to our interest rate swap.
Contractual Obligations and Contingent Liabilities and Commitments The table below presents our fixed, non-cancelable contractual obligations and commitments primarily related to our outstanding purchase orders, certain capital expenditures, our credit facility (as modified by amendments), and lease arrangements as of December 31, 20112012 (in thousands): | | | Payments Due By Period | |
| | | | | | 1-3 years | | | 3-5 years | | | | | | Total | |
| | $ | 10,761 | | | $ | — | | | $ | — | | | $ | — | | | $ | 10,761 | |
| | | 825 | | | | 1,444 | | | | — | | | | — | | | | 2,269 | |
Contractual obligations (3) | | | 9,440 | | | | — | | | | — | | | | — | | | | 9,440 | |
Capital lease commitments (4) | | | 4,190 | | | | 5,240 | | | | 1,324 | | | | — | | | | 10,754 | |
Operating lease commitments (5) | | | 2,691 | | | | 4,158 | | | | 721 | | | | 1,010 | | | | 8,580 | |
Coeur d'Alene Basin litigation settlement (6) | | | 25,000 | | | | 70,400 | | | | — | | | | — | | | | 95,400 | |
Surety maintenance fees (6) | | | 495 | | | | 577 | | | | — | | | | | | | | 1,072 | |
Supplemental executive retirement plan (7) | | | 330 | | | | 667 | | | | 714 | | | | 2,564 | | | | 4,275 | |
| Total contractual cash obligations | | $ | 53,732 | | | $ | 82,486 | | | $ | 2,759 | | | $ | 3,574 | | | $ | 142,551 | |
| | | Payments Due By Period | |
| | | Less than 1 year | | | 1-3 years | | | 3-5 years | | | After 5 years | | | Total | |
Purchase obligations (1) | | $ | 5,785 | | | $ | — | | | $ | — | | | $ | — | | | $ | 5,785 | |
Commitment fees (2) | | | 1,238 | | | | 1,960 | | | | — | | | | — | | | | 3,198 | |
Contractual obligations (3) | | | 3,895 | | | | — | | | | — | | | | — | | | | 3,895 | |
Capital lease commitments (4) | | | 6,049 | | | | 10,439 | | | | 1,931 | | | | — | | | | 18,419 | |
Operating lease commitments (5) | | | 3,087 | | | | 4,548 | | | | 2,494 | | | | 3,848 | | | | 13,977 | |
Coeur d'Alene Basin litigation settlement (6) | | | 15,000 | | | | 55,499 | | | | — | | | | — | | | | 70,499 | |
Surety maintenance fees (6) | | | 371 | | | | 218 | | | | — | | | | — | | | | 589 | |
Defined benefit pension plans (7) | | | 1,000 | | | | — | | | | — | | | | — | | | | 1,000 | |
Supplemental executive retirement plan (7) | | | 322 | | | | 643 | | | | 676 | | | | 2,437 | | | | 4,078 | |
| Total contractual cash obligations | | $ | 36,747 | | | $ | 73,307 | | | $ | 5,101 | | | $ | 6,285 | | | $ | 121,440 | |
| (1) | Consist of open purchase orders of approximately $10.5$4.5 million at the Greens Creek unit and $0.2$1.2 million at the Lucky Friday unit. Included in these amounts are approximately $9.9$4.1 million and $0.1$0.9 million related to various capital projects at the Greens Creek and Lucky Friday units, respectively. |
| (2) | In October 2009, we entered into a $60 million revolving credit agreement, which was amended in March 2010, July 2010, and December 2010. It was amended again in October 2011several times to increase the revolvingamount available under the credit agreement to $100$150 million. We are required to pay a standby fee, dependent on our leverage ratio, of between 0.825% and 1.05% per annum on undrawn amounts under the revolving credit agreement. There was no amount drawn under the revolving credit agreement as of December 31, 2011,2012, and the amounts above assume no amounts will be drawn during the agreement's term. For more information on our credit facility, see Note 6 of Notes to Consolidated Financial Statements. |
| (3) | As of December 31, 2012, we were committed to approximately $3.4 million for various capital projects. Total contractual obligations at December 31, 2012 also include approximately $0.5 million for commitments relating to non-capital items. |
(3) | As of December 31, 2011, we were committed to approximately $9.3 million for various capital projects at the Greens Creek and Lucky Friday units. Total contractual obligations at December 31, 2011 also include approximately $0.1 million for commitments relating to non-capital items at Greens Creek. |
| (4) | Includes scheduled capital lease payments of $7.7$15.0 million and $3.0$3.4 million (including interest), respectively, for equipment at our Greens Creek and Lucky Friday units. These leases have fixed payment terms and contain bargain purchase options at the end of the lease periods. See Note 6 of Notes to Consolidated Financial Statements for more information. |
| (5) | We enter into operating leases in the normal course of business. Substantially all lease agreements have fixed payment terms based on the passage of time. Some lease agreements provide us with the option to renew the lease or purchase the leased property. Our future operating lease obligations would change if we exercised these renewal options and if we entered into additional operating lease arrangements. |
| (6) | On September 8, 2011, a Consent Decree settling the Coeur d'Alene Basin environmental litigation and related claims was entered by the U.S. District Court in Idaho. As of December 31, 2011,2012, our remaining obligation under the terms of the settlement include (i) $25 million in cash by October 8, 2012, (ii) $15 million in cash by October 8, 2013 and (iii)(ii) approximately $55.4$55.5 million by August 2014, asin the form of quarterly payments of the proceeds from the exercise of any outstanding Series 1 and Series 3 warrants during the quarter, with the remaining balance, if any, due in August 2014. These payments are secured by a third party surety for which Hecla Limited pays an annual maintenance fee of 0.556% of the remaining obligation balance. |
| (7) | We expect to contribute approximately $1.1 million to our othersponsor defined benefit pension plans in 2012.covering substantially all U.S. employees and provide certain post-retirement benefits for qualifying retired employees, along with a supplemental executive retirement plan. These amounts represent our estimate of the future funding requirements for these plans. See Note 8 of Notes to Consolidated Financial Statements for more information. |
We record liabilities for costs associated with mine closure, reclamation of land and other environmental matters. At December 31, 2011,2012, our liabilities for these matters totaled $153.8$113.2 million, including $95.4$70.5 million for the net present value of Hecla Limited's liabilityfuture payments relating to the Coeur d'Alene River Basin in North Idaho.litigation settlement. On September 8, 2011 a Consent Decree settling the Coeur d'Alene Basin environmental litigation and related claims was entered by the U.S. District Court in Idaho. See the Financial Liquidity and Capital Resources section above for more information on the financial terms of the settlement. Future expenditures related to closure, reclamation and environmental expenditures at our other sites are difficult to estimate, although we anticipate we will incur expenditures relating to these obligations over the next 30 years. For additional information relating to our environmental obligations, see Note 74 of Notes to Consolidated Financial Statements.
Off-Balance Sheet Arrangements At December 31, 2011,2012, we had no existing off-balance sheet arrangements, as defined under SEC regulations, that have or are reasonably likely to have a current or future effect on our financial condition, revenues or expenses, results of operations, liquidity, capital expenditures or capital resources that is material to investors.
Critical Accounting Estimates Our significant accounting policies are described in Note 1 of Notes to Consolidated Financial Statements. As described in Note 1, we are required to make estimates and assumptions that affect the reported amounts and related disclosures of assets, liabilities, revenue, and expenses. Our estimates are based on our experience and our interpretation of economic, political, regulatory, and other factors that affect our business prospects. Actual results may differ significantly from our estimates. We believe that our most critical accounting estimates are related to future metals prices; obligations for environmental, reclamation, and closure matters; mineral reserves; and accounting for business combinations, as they require us to make assumptions that were highly uncertain at the time the accounting estimates were made and changes in them are reasonably likely to occur from period to period. Management has discussed the development and selection of these critical accounting estimates with the Audit Committee of our boardBoard of directors,Directors, and the Audit Committee has reviewed the disclosures presented below. In addition, there are other items within our financial statements that require estimation, but are not deemed to be critical. However, changes in estimates used in these and other items could have a material impact on our financial statements.
Metals prices are key components in estimates that determine the valuation of some of our significant assets and liabilities, including properties, plants and equipment, deferred tax assets, and certain accounts receivable. Metals prices are also an important component in the estimation of reserves. As shown under Part I, Item 1A. - Risk Factors, metals prices have historically been volatile. While average prices for all four metals we produce performed favorably for the five consecutive years prior to 2008, there was a reduction in the average prices for zinc and lead in 2008 compared to 2007, and average prices for silver, zinc and lead were lower in 2009 compared to 2008. Average prices for all four metals rebounded in 2010 and were higher than their levels in both 2009 and 2008, and average prices for all four metals were higher in 2011 compared to 2010. Silver demand arises from investment demand, particularly in Exchange-Traded Funds, and industrial and consumer demand. Investment demand for silver and gold has been relatively strong over the past three years and is influenced by various factors, including: the value of the U.S. Dollar and other currencies, expanding U.S. budget deficits, widening availability of exchange-traded commodity funds, interest rate levels, the health of credit markets, and inflationary expectations. Uncertainty towards a globalUncertain economic recoveryconditions could result in continued investment demand for precious metals. Industrial demand for silver is closely linked to world Gross Domestic Product growth and industrial fabrication levels, as it is difficult to substitute silver in industrial fabrication.growth. Consumer demand is driven significantly by demand for jewelry and similar retail products. We believe that global economic conditions are improving, though slowly and unevenly, and that industrial trends, including urbanization and growth of the middle class in countries such as China and India, will result in continued consumer and industrial demand growth for silver. However, there can be no assurance whether these trends will continue or to how they will impact prices of the metals we produce. We are also impacted by fluctuations in prices for zinc, lead, and gold, which are also tied to economic conditions and the amount of available supply. We have recorded in the past impairments to our asset carrying value because of low prices, and we can offer no assurance that prices will either remain at their current levels or increase.
Processes supporting valuation of our assets and liabilities that are most significantly affected by prices include analysesanalysis of asset carrying values, depreciation, reserves, and deferred income taxes. On at least an annual basis - and more frequently if circumstances warrant - we examine our depreciation rates, reserve estimates, and the valuation allowances on our deferred tax assets. We examine the carrying values of our assets as changes in facts and circumstances warrant. In our analysesanalysis of carrying values and deferred taxes, we apply several pricing views to our forecasting model, including current prices, analyst price estimates, forward-curve prices, and historical prices (see Mineral Reserves, below, regarding prices used for reserve estimates). Using applicable accounting guidance and our viewestimates of future metals markets,prices, we use the average of the various methods to determine whether the values of our assets are fairly stated, and to determine the level of valuation allowances, if any, on our deferred tax assets. In addition, estimates of future metals prices are used in the valuation of certain assets in the determination of the purchase price allocations for our acquisitions (see Business Combinations below).
Sales of all metals products sold directly to smelters are recorded as revenues when title and risk of loss transfer to the smelter (generally at the time of shipment) at estimated forward metals prices for the estimated month of settlement. Due to the time elapsed between the time of shipment to the smelter and final settlement with the smelter, we must estimate the prices at which sales of our metals will be settled. Previously recorded sales and trade accounts receivable are adjusted to estimated settlement metals prices until final settlement by the smelter. Changes in metals prices between shipment and final settlement result in changes to revenues and accounts receivable previously recorded upon shipment. As a result, our trade accounts receivable balances are subject to changes in metals prices until final settlement occurs. For more information, see part N. Revenue Recognition of Note 1 of Notes to Consolidated Financial Statements. We utilize financially-settled forward contracts to manage our exposure to changes in prices for zinc and lead. See Item 7A. Quantitative and Qualitative Disclosures About Market Risk - Commodity-Price Risk Management below for more information on our contract programs. These contracts do not qualify for hedge accounting and are therefore marked-to-market though earnings each period. Changes in zinc and lead prices between the dates that the contracts are entered into and their settlements will result in changes to the fair value asset or liability associated with the contracts, with a corresponding gain or loss recognized in earnings.
Obligations for Environmental, Reclamation and Closure Matters The most significant liability on our balance sheet is for accrued reclamation and closure costs. InOf our $113.2 million total accrued reclamation and closure cost balance as of December 31, 2012, approximately $70.8 million is fixed by the past we have conducted considerable remediation work at sites interms of the United States for which remediation requirements were not yet fully determined, nor had they been agreedCoeur d'Alene Basin litigation settlement, with much of the remaining balance subject to by us and various regulatory agencies with oversight over the properties.uncertainty. We have estimated our liabilities under appropriate accounting guidance, and on at least an annual basis - and more frequently if warranted - management reviews our liabilities with our Audit Committee. However, the ranges of liability proposed by the plaintiffs in environmental proceedings in the past have considerably exceededcould exceed the liabilities we had recognized (and may do so in the future). While the recent settlement of the Basin litigation has resolved and fixed our largest and most significant environmental risk, other risks remain unresolved.recognized. If substantial damages were awarded, claims were settled, or remediation costs incurred in excess of our accruals, our financial results or condition could be materially adversely affected.
Critical estimates are inherent in the process of determining our reserves. Our reserves are affected largely by our assessment of future metals prices, as well as by engineering and geological estimates of ore grade, accessibility and production cost. Metals prices are estimated at long-term averages, as described in Item 2. — Property Descriptions. Our assessment of reserves occurs at least annually, and periodically utilizes external audits. Reserves are a key component in valuation of our properties, plants and equipment. ReserveOur estimates of reserves, mineralized material, and other resources at our operations are used in determining appropriate rates of units-of-production depreciation, with net book value of many assets depreciated over remainingthe estimated reserves.mine lives. Reserves, mineralized material, and other resources included in our mine plans are also a key component in forecasts, with which we compare future cash flows to current asset values to ensure that carrying values are reported appropriately. ReservesEstimates of reserves, mineralized material, and other resources also play a key role in the valuation of certain assets in the determination of the purchase price allocations for acquisitions (see Business Combinations below). Reserves are a culmination of many estimates and are not guarantees that we will recover the indicated quantities of metals. Business Combinations
We are required to allocate the purchase price of acquired companies to the tangible and intangible assets acquired and liabilities assumed based on their estimated fair values at acquisition date. The valuation of assets acquired and liabilities assumed requires management to make significant estimates and assumptions, especially with respect to long-lived assets, including estimates of future metals prices and mineral reserves, as discussed above. In some cases, we use third-party appraisers to determine the fair values and lives of property and other identifiable assets.
New Accounting Pronouncements In June 2011, the Financial Accounting Standards Board ("FASB") issued Accounting Standards Update ("ASU") 2011-05, which, among other things, amended Subtopic 220 with respect to the presentation of other comprehensive income and its components in the financial statements. The update amended Subtopic 220 so that a Securities and Exchange CommissionSEC filer may present other comprehensive income either in a single continuous statement or in two separate but consecutive statements. theThe filer is also required to present on the face of the financial statements reclassification adjustments for items that are reclassified from other comprehensive income to net income in the statements where the components of net income and the components of other comprehensive income are presented. The amendments in this update apply to both annual and interim periods beginning after December 15, 2011, with the exception of the amendment regarding presentation of reclassification adjustments, which has been deferred to a later date. Adoption of this guidance isdid not anticipated to have a material impact on our consolidated financial statements.
In May 2011, the FASB issued ASU 2011-04, which amends Subtopic 820 to clarify the application of existing common fair value measurement and disclosure requirements. ASU 2011-04 provides clarification for the following:
1. the application of the highest and best use of valuation premise concepts;
2. measuring the fair value of an instrument classified in shareholders' equity; and
3. disclosures about fair value measurements.
The amendments in this update becomebecame effective for interim and annual periods beginning after December 15, 2011. Adoption of this guidance isdid not anticipated to have a material impact on our consolidated financial statements.
In December of 2011, the FASB issued ASU 2011-11, Disclosures about Offsetting Assets and Liabilities, which enhances disclosure requirements regarding an entity's financial instruments and derivative instruments that are offset or subject to a master netting arrangement. This information about offsetting and related netting arrangements will enable users of financial statements to understand the effect of those arrangements on the entity's financial position, including the effect of rights of setoff. The amendments are required for annual reporting periods beginning after January 1, 2013, and interim periods within those annual periods. We are evaluating the impact of this guidance, but do not anticipate it will have a material impact on our consolidated financial statements.
Forward-Looking Statements The foregoing discussion and analysis, as well as certain information contained elsewhere in this Form 10-K, contain forward-looking statements within the meaning of Section 27A of the Securities Act of 1933, as amended, and Section 21E of the Securities Exchange Act of 1934, as amended, and are intended to be covered by the safe harbor created thereby. See the discussion in Special Note on Forward-Looking Statements included prior to Part I, Item 1.
Item 7A. Quantitative and Qualitative Disclosures about Market Risk The following discussion about our risk-management activities includes forward-looking statements that involve risk and uncertainties, as well as summarizes the financial instruments held by us at December 31, 2011,2012, which are sensitive to changes in interest rates and commodity prices and are not held for trading purposes. Actual results could differ materially from those projected in the forward-looking statements. In the normal course of business, we also face risks that are either non-financial or non-quantifiable (see Part I, Item 1A. – Risk Factors).
Commodity-Price Risk Management
At times, we may use commodity forward sales commitments, commodity swap contracts and commodity put and call option contracts to manage our exposure to fluctuation in the prices of certain metals whichthat we produce. Contract positions are designed to ensure that we will receive a defined minimum price for certain quantities of our production, thereby partially offsetting our exposure to price fluctuations. These instruments do, however, expose us to (i) credit risk in the event of non-performance by counterparties for contracts in which the contract price exceeds the spot price of a commodity and (ii) price risk to the extent that the spot price exceeds the contract price for quantities of our production contained under contract positions. In April 2010, we began utilizingWe use financially-settled forward contracts to sell lead and zinc at fixed prices for settlement at approximately the same time that our unsettled concentrate sales contracts will settle. The settlement of each concentrate lot is based on the average spot price of the metal during the month of settlement, which may differ from the prices used to record the sale when the sale takes place. The objective of the contracts is to manage the exposure to changes in prices of zinc and lead contained in our concentrate shipments between the time of sale and final settlement. These contracts do not qualify for hedge accounting and are marked-to-market through earnings each period. We recognized a $7.2$1.3 million net gainloss on the contracts during 2011,2012, which is included in sales of products. The net gainslosses recognized on the contracts offset price adjustments on our provisional concentrate sales related to changes to lead and zinc prices between the time of sale and final settlement.In addition, in May 2010, weWe also began utilizinguse financially-settled forward contracts to manage the exposure of changes in prices of zinc and lead contained in our forecasted future concentrate shipments. These contracts also do not qualify for hedge accounting and are marked-to-market through earnings each period. We recognized a $38.0$10.5 million net gainloss on the contracts, net of $13.4which includes $18.4 million in lossesgains realized on settled contracts during 2011.2012. The net gainslosses on these contracts are included as a separate line item under other income (expense), as they relate to forecasted future shipments, as opposed to sales that have already taken place but are subject to final pricing. The gainslosses recognized during 20112012 are the result of decreasingincreasing lead and zinc prices during the end of 2011. However, thisthe year. This program is designed to mitigate the impact of potential future declines in lead and zinc prices from the price levels established in the contracts (see average price information below).The following table summarizes the quantities of base metals committed under forward sales contracts at December 31, 2011:2012:
| | | Metric tonnes under contract | | | Average price per pound | | Pounds under contract (in thousands) | | Average price per pound |
| | | Zinc | | | Lead | | | Zinc | | | Lead | | Zinc | | Lead | | Zinc | | Lead |
| Contracts on provisional sales | | | | | | | | | | | | | | | | | | | |
| 2012 settlements | | | 9,600 | | | | 2,600 | | | $ | 0.86 | | | $ | 0.89 | | |
| 2013 settlements | | 14,991 | | 6,945 | | $ | 0.95 | | $ | 1.00 | |
| | | | | | | | | | | | | | | | | | | | | | | | |
| Contracts on forecasted sales | | | | | | | | | | | | | | | | | | | | | | | |
| 2012 settlements | | | 20,500 | | | | 15,900 | | | $ | 1.12 | | | $ | 1.12 | | |
| 2013 settlements | | | 8,275 | | | | 11,150 | | | $ | 1.14 | | | $ | 1.17 | | 35,935 | | 32,794 | | $ | 0.96 | | $ | 1.11 | |
| 2014 settlements | | 30,203 | | 33,069 | | $ | 0.98 | | $ | 1.03 | |
| 2015 settlements | | 3,307 | | 23,534 | | $ | 1.01 | | $ | 1.06 | |
As further discussed in Note 18 Item 7. Management’s Discussion and Analysis of Note to Consolidated Financial StatementsCondition and Results of Operations, The Lucky Friday Segment, , production at the Lucky Friday mine will bewas temporarily suspended due to the requirement to remove loosebuilt-up cementitious material from the Silver Shaft. As a result, during the first quarter of 2012, we liquidated forward contracts related to forecasted Lucky Friday base metal sales for total net proceeds of $3.1 million.
Provisional Sales
Sales of all metals products sold directly to smelters, including by-product metals, are recorded as revenues when title and risk of loss transfers to the smelter (generally at the time of shipment) at forward prices for the estimated month of settlement. Due to the time elapsed between shipment to the smelter and the final settlement with the smelter we must estimate the prices at which sales of our metals will be settled. Previously recorded sales are adjusted to estimated settlement metals prices until final settlement by the smelter. Changes in metals prices between shipment and final settlement will result in changes to revenues previously recorded upon shipment. Metals prices can and often do fluctuate widely and are affected by numerous factors beyond our control (see Item 1A - Risk Factors - A substantial or extended decline in metals prices would have a material adverse effect on us for more information). At December 31, 2011,2012, metals contained in concentrates and exposed to future price changes totaled approximately 1.20.8 million ounces of silver, 5,0083,912 ounces of gold, 11,29312,189 tons of zinc, and 3,4933,887 tons of lead. If the price for each metal were to change by one percent, the change in the total value of the concentrates sold would be approximately $0.7$0.6 million. However, as noted in Commodity-Price Risk Management above, in April 2010 we initiatedutilize a program designed to mitigate the risk of negative price adjustments with limited mark-to-market financially-settled forward contracts for our zinc and lead sales.
Item 8. Financial Statements and Supplementary Data Our Consolidated Financial Statements are included herein beginning on page F-1. Financial statement schedules are omitted as they are not applicable or the information required is included in the Consolidated Financial Statements. The following table sets forth supplementary financial data (in thousands, except per share amounts) for each quarter of the years ended December 31, 20112012 and 2010,2011, derived from our unaudited financial statements. The data set forth below should be read in conjunction with and is qualified in its entirety by reference to our Consolidated Financial Statements. | | | | | | | | | | | Total |
| 2011 | | | | | | | | | | |
| Sales of products | | $ | 102,867 | | | $ | 120,543 | | | $ | 117,860 | | | $ | 136,364 | | | $ | 477,634 | |
| Gross profit | | $ | 49,826 | | | $ | 67,805 | | | $ | 67,791 | | | $ | 79,573 | | | $ | 264,995 | |
| | $ | 18,569 | | | $ | 55,921 | | | $ | 33,317 | | | $ | 43,357 | | | $ | 151,164 | |
| Preferred stock dividends | | $ | (138 | ) | | $ | (138 | ) | | $ | (138 | ) | | $ | (138 | ) | | $ | (552 | ) |
| Income applicable to common shareholders | | $ | 18,431 | | | $ | 55,783 | | | $ | 33,179 | | | $ | 43,219 | | | $ | 150,612 | |
| Basic income per common share | | $ | 0.07 | | | $ | 0.20 | | | $ | 0.12 | | | $ | 0.16 | | | $ | 0.54 | |
| Diluted income per common share | | $ | 0.06 | | | $ | 0.19 | | | $ | 0.11 | | | $ | 0.15 | | | $ | 0.51 | |
| | | | | | | | | | | |
| 2010 | | | | | | | | | | |
| Sales of products | | $ | 134,460 | | | $ | 115,847 | | | $ | 88,631 | | | $ | 79,875 | | | $ | 418,813 | |
| Gross profit | | $ | 74,693 | | | $ | 54,524 | | | $ | 38,066 | | | $ | 27,536 | | | $ | 194,819 | |
| Net income (loss) | | $ | (9,736 | ) | | $ | 19,791 | | | $ | 17,084 | | | $ | 21,844 | | | $ | 48,983 | |
| Preferred stock dividends | | $ | (3,408 | ) | | $ | (3,408 | ) | | $ | (3,409 | ) | | $ | (3,408 | ) | | $ | (13,633 | ) |
| Income (loss) applicable to common shareholders | | $ | (13,144 | ) | | $ | 16,383 | | | $ | 13,675 | | | $ | 18,436 | | | $ | 35,350 | |
| Basic income (loss) per common share | | $ | (0.05 | ) | | $ | 0.06 | | | $ | 0.06 | | | $ | 0.08 | | | $ | 0.14 | |
| Diluted income (loss) per common share | | $ | (0.05 | ) | | $ | 0.06 | | | $ | 0.05 | | | $ | 0.07 | | | $ | 0.13 | |
| | Fourth Quarter | | Third Quarter | | Second Quarter | | First Quarter | | Total |
| 2012 | | | | | | | | | |
| Sales of products | $ | 81,100 | | | $ | 81,871 | | | $ | 67,019 | | | $ | 91,153 | | | $ | 321,143 | |
| Gross profit | $ | 34,037 | | | $ | 37,309 | | | $ | 23,968 | | | $ | 48,202 | | | $ | 143,516 | |
Net income (loss) 1 | $ | 743 | | | $ | (885 | ) | | $ | 2,524 | | | $ | 12,572 | | | $ | 14,954 | |
| Preferred stock dividends | $ | (138 | ) | | $ | (138 | ) | | $ | (138 | ) | | $ | (138 | ) | | $ | (552 | ) |
| Income (loss) applicable to common shareholders | $ | 605 | | | $ | (1,023 | ) | | $ | 2,386 | | | $ | 12,434 | | | $ | 14,402 | |
| Basic income per common share | $ | — | | | $ | — | | | $ | 0.01 | | | $ | 0.04 | | | $ | 0.05 | |
| Diluted income per common share | $ | — | | | $ | — | | | $ | 0.01 | | | $ | 0.04 | | | $ | 0.05 | |
| | | | | | | | | | |
| 2011 | | | | | | | | | |
| Sales of products | $ | 102,867 | | | $ | 120,543 | | | $ | 117,860 | | | $ | 136,364 | | | $ | 477,634 | |
| Gross profit | $ | 49,826 | | | $ | 67,805 | | | $ | 67,791 | | | $ | 79,573 | | | $ | 264,995 | |
| Net income (loss) | $ | 18,569 | | | $ | 55,921 | | | $ | 33,317 | | | $ | 43,357 | | | $ | 151,164 | |
| Preferred stock dividends | $ | (138 | ) | | $ | (138 | ) | | $ | (138 | ) | | $ | (138 | ) | | $ | (552 | ) |
| Income (loss) applicable to common shareholders | $ | 18,431 | | | $ | 55,783 | | | $ | 33,179 | | | $ | 43,219 | | | $ | 150,612 | |
| Basic income (loss) per common share | $ | 0.07 | | | $ | 0.20 | | | $ | 0.12 | | | $ | 0.16 | | | $ | 0.54 | |
| Diluted income (loss) per common share | $ | 0.06 | | | $ | 0.19 | | | $ | 0.11 | | | $ | 0.15 | | | $ | 0.51 | |
| | 1) | In the fourth quarter of 2011,During 2012, we experienced periodsa temporary suspension of down timeproduction at our Lucky Friday unit, related to various accidents and other events, which resulted in reduced revenue and net income for the quarter.in 2012 compared to 2011. For additional information, see Part II, Item 7. Management's Discussion and Analysis of Financial Condition and Results of Operations - The Lucky Friday Segment.
|
Item 9. Changes in and Disagreements with Accountants on Accounting and Financial Disclosures
Item 9A. Controls and Procedures
Disclosure Controls and Procedures An evaluation was performed under the supervision and with the participation of our management, including the Chief Executive Officer (“CEO”) and Chief Financial Officer (“CFO”), of the effectiveness of the design and operation of our disclosure controls and procedures. Based on that evaluation, our CEO and CFO concluded that our disclosure controls and procedures were effective as of December 31, 2011,2012, in ensuring them in a timely manner that material information required to be disclosed in this report has been properly recorded, processed, summarized and reported.
Management’s Annual Report on Internal Control over Financial Reporting
Management is responsible for establishing and maintaining adequate internal control over our financial reporting, which is designed to provide reasonable assurance regarding the reliability of financial reporting and the preparation of financial statements for external purposes in accordance with generally accepted accounting principles in the United States of America.
Because of its inherent limitations, any system of internal control over financial reporting, no matter how well designed, may not prevent or detect misstatements due to the possibility that a control can be circumvented or overridden or that misstatements due to error or fraud may occur that are not detected. Also, because of changes in conditions, internal control effectiveness may vary over time. Management assessed the effectiveness of our internal control over financial reporting as of December 31, 2011,2012, using criteria established in Internal Control-Integrated Framework issued by the Committee of Sponsoring Organizations of the Treadway Commission (“COSO”) and concluded that we have maintained effective internal control over financial reporting as of December 31, 2011,2012, based on these criteria. An evaluation was performed under the supervision and with the participation of management, including the CEO and CFO, of the effectiveness of the design and operation of our disclosure controls and procedures as required by Exchange Act Rules 13a-15(e) and 15(d)-15(e) as of the end of the reporting period covered by this report. Based on that evaluation, our CEO and CFO concluded that our disclosure controls and procedures, including controls and procedures designed to ensure that information required to be disclosed by us is accumulated and communicated to our management (including our CEO and CFO), were effective as of December 31, 2011,2012, in ensuring thenthem in a timely manner that material information required to be disclosed in this report has been properly recorded, processed, summarized and reported. Our internal control over financial reporting as of December 31, 20112012 has been audited by BDO USA, LLP, an independent registered public accounting firm, as stated in the attestation report which is included herein.
Changes in Internal Control over Financial Reporting There have been no changes in our internal controls over financial reporting during the quarter ended December 31, 2011,2012, that have materially affected, or are reasonably likely to materially affect, our internal controls over financial reporting.
Report of Independent Registered Public Accounting Firm Board of Directors and Shareholders
We have audited Hecla Mining Company's internal control over financial reporting as of December 31, 2011,2012, based on criteria established in Internal Control - Integrated Framework issued by the Committee of Sponsoring Organizations of the Treadway Commission (the COSO criteria). Hecla Mining Company's management is responsible for maintaining effective internal control over financial reporting and for its assessment of the effectiveness of internal control over financial reporting, included in the accompanying Item 9A, Management's Annual Report on Internal Control Over Financial Reporting.Reporting. Our responsibility is to express an opinion on the company's internal control over financial reporting based on our audit.
We conducted our audit in accordance with the standards of the Public Company Accounting Oversight Board (United States). Those standards require that we plan and perform the audit to obtain reasonable assurance about whether effective internal control over financial reporting was maintained in all material respects. Our audit included obtaining an understanding of internal control over financial reporting, assessing the risk that a material weakness exists, and testing and evaluating the design and operating effectiveness of internal control based on the assessed risk. Our audit also included performing such other procedures as we considered necessary in the circumstances. We believe that our audit provides a reasonable basis for our opinion.
A company's internal control over financial reporting is a process designed to provide reasonable assurance regarding the reliability of financial reporting and the preparation of financial statements for external purposes in accordance with generally accepted accounting principles. A company's internal control over financial reporting includes those policies and procedures that (1) pertain to the maintenance of records that, in reasonable detail, accurately and fairly reflect the transactions and dispositions of the assets of the company; (2) provide reasonable assurance that transactions are recorded as necessary to permit preparation of financial statements in accordance with generally accepted accounting principles, and that receipts and expenditures of the company are being made only in accordance with authorizations of management and directors of the company; and (3) provide reasonable assurance regarding prevention or timely detection of unauthorized acquisition, use, or disposition of the company's assets that could have a material effect on the financial statements.
Because of its inherent limitations, internal control over financial reporting may not prevent or detect misstatements. Also, projections of any evaluation of effectiveness to future periods are subject to the risk that controls may become inadequate because of changes in conditions, or that the degree of compliance with the policies or procedures may deteriorate.
In our opinion, Hecla Mining Company maintained, in all material respects, effective internal control over financial reporting as of December 31, 2011,2012, based on the COSO criteria.
We also have audited, in accordance with the standards of the Public Company Accounting Oversight Board (United States), the consolidated balance sheets of Hecla Mining Company as of December 31, 20112012 and 2010,2011, and the related consolidated statements of operations and comprehensive income, shareholder'sstockholders' equity, and cash flows for each of the three years in the period ended December 31, 20112012 and our report dated February 21, 201225, 2013 expressed an unqualified opinion thereon.
February 21, 201225, 2013
Item 9B. Other Information None.
Item 10. Directors and Executive Officers of the Registrant In accordance with our Certificate of Incorporation, our Board of Directors is divided into three classes. The terms of office of the directors in each class expire at different times. The directors are elected for three-year terms. The Effective Dates listed below for each director is their current term of office. All officers are elected for a term, which ordinarily expires on the date of the meeting of the Board of Directors immediately following the Annual Meeting of Shareholders. The positions and ages listed below are as of the date of our next Annual Meeting of Shareholders in May 2012.2013. There are no arrangements or understandings between any of the directors or officers and any other person(s) pursuant to which such officers were elected.
| | | | | | Effective Dates |
| Phillips S. Baker, Jr. | 5253 | | | | | |
| James A. Sabala | 5758 | | | Senior Vice President and Chief Financial Officer | | 5/1112 — 5/1213 |
| Lawrence P. Radford | 5152 | | | Vice President - Operations | | 10/115/12 — 5/1213 |
| Dr. Dean W.A. McDonald | 5456 | | | Vice President – Exploration | | 5/1112 — 5/1213 |
| Don Poirier | 5354 | | | Vice President – Corporate Development | | 5/1112 — 5/1213 |
| David C. Sienko | 4344 | | | Vice President and General Counsel | | 5/1112 — 5/1213 |
| John H. Bowles | 6667 | | | | | 5/0912 — 5/1215 |
| Ted Crumley | 6768 | | | Director and Chairman of the Board (1,4) | | 5/10 — 5/13 |
| George R. Nethercutt, Jr. | 6768 | | | | | 5/0912 — 5/1215 |
| Terry V. Rogers | 6566 | | | | | 5/10 — 5/13 |
| Charles B. Stanley | 5354 | | | | | 5/10 — 5/13 |
| Dr. Anthony P. Taylor | 7071 | | | | | 5/11 — 5/14 |
(1) Member of Executive Committee
(2) Member of Audit Committee
(3) Member of Corporate Governance and Directors Nominating Committee
(4) Member of Compensation Committee
(5) Member of Health, Safety, Environmental and Technical Committee
Phillips S. Baker, Jr., has been our Chief Executive Officer since May 2003; President since November 2001; and a director since November 2001. Prior to that, Mr. Baker was our Chief Financial Officer from May 2001 to June 2003; Chief Operating Officer from November 2001 to May 2003; and Vice President from May 2001 to November 2001. Prior to joining us, Mr. Baker served as Vice President and Chief Financial Officer of Battle Mountain Gold Company (a gold mining company) from March 1998 to January 2001. Mr. Baker served as a director of Questar Corporation (a U.S. natural gas-focused exploration and production, interstate pipeline and local distribution company) from February 2004 to June 2010, and has served as a director for QEP Resources, Inc. (a leading independent natural gas and oil exploration and production company) since May 2010.
James A. Sabala was appointed Chief Financial Officer in May 2008 and Senior Vice President in March 2008. Prior to his employment with Hecla, Mr. Sabala was Executive Vice President – Chief Financial Officer of Coeur d’Alene Mines Corporation (a mining company) from 2003 to February 2008. Mr. Sabala also served as Vice President – Chief Financial Officer of Stillwater Mining Company (a mining company) from 1998 to 2002.
Lawrence P. Radford was appointed Vice President – Operations, in October 2011. Prior to his appointment, Mr. Radford was Vice President of South American Operations for Kinross Gold Corporation at its South America operation (a gold mining operation) from April 2010 to September 2011. Mr. Radford held various other positions at Kinross from June 2007 to March 2010. He was General Manager for Barrick Gold Corporation at its Cowal operation (a gold mining operation) in West Wyalong, NSW, Australia from January 2006 to May 2007. Mr. Radford also held various positions with Barrick from 1990 to December 2005. Prior to that, he was Planning and Project Engineer for Nerco Delamar Company (a mining company) from 1988 to 1989 and Mining Engineer for Coeur d'Alene Mines Corporation from 1984 to 1988.
Dr. Dean W.A. McDonald was appointed Vice President – Exploration in August 2006. Dr. McDonald has also been our Vice President – Exploration of our Canadian subsidiary, Hecla Canada Ltd., since January 2007. Prior to joining Hecla, Dr. McDonald was Vice President Exploration and Business Development for Committee Bay Resource Ltd. (a Canadian-based exploration and development company) from 2003 to August 2006 and Exploration Manager at Miramar Mining Company/Northern Orion Explorations (an exploration company) from 1996 to 2003. Don Poirier was appointed Vice President – Corporate Development in July 2007. Mr. Poirier has also been our Vice President – Corporate Development of our Canadian subsidiary, Hecla Canada Ltd. since January 2007. Prior to joining Hecla, Mr. Poirier was a mining analyst with Blackmont Capital (capital market specialists) from September 2002 to June 2007. Mr. Poirier held other mining analyst positions from 1988 to 2002. David C. Sienko was appointed Vice President and General Counsel in January 2010. Prior to his appointment, Mr. Sienko was a partner of, and practicedwith the law withfirm K&L Gates LLP (a law firm) and its predecessor,(formerly Bell, Boyd & Lloyd LLP,LLP) from 2004 to January 2010, where he specialized in counseling public and private entities on compliance with securities, laws and trading market rules, mergers and acquisitions, and corporate governance. Mr. Sienko was also an associate at Bell, Boyd & Lloyd, LLP, from 2000 to 2004 and at Locke Lord LLP (a law firm) from 1998 to 2000, as well as an attorney with the Division of Enforcement at the U.S. Securities and Exchange Commission from 1995 to 1998. John H. Bowles was elected by the shareholders to Hecla’sHecla's Board of Directors in May 2006. Mr. Bowles was a partner in the Audit and Assurance Group of PricewaterhouseCoopers LLP (an accounting firm) from April 1976 until his retirement in June 2006. He concentrated his practice on public companies operating in the mining industry. Mr. Bowles has been a Director of Mercator Minerals LTD. (a leading copper, molybdenum and silver producing company) since April 2011, Director of HudBay Minerals Inc. (a zinc, copper, gold and silver mining company) from May 2006 to March 2009, as well as a Director of Boss Power Corp. (a mineral exploration company) since September 2007. He holds Fellowships in both the British Columbia Institute of Chartered Accountants and the Canadian Institute of Mining and Metallurgy. Mr. Bowles has beenwas also the Treasurer of Mining Suppliers Association of British Columbia (an association of providers of equipment, products and related services to the British Columbia mining industry) sincefrom May 1999.1999 to May 2012. He has been Director Emeritus of Ducks Unlimited Canada (a national, private, non-profit wetland conservation organization), since March 1996. Ted Crumley has served as a director since 1995 and became Chairman of the Board in May 2006. Mr. Crumley served as the Executive Vice President and Chief Financial Officer of OfficeMax Incorporated (a distributor of office products) from January 2005 until his retirement in December 2005, and as Senior Vice President from November 2004 to January 2005. Prior to that, Mr. Crumley was Senior Vice President and Chief Financial Officer of Boise Cascade Corporation (a wood and paper company), from 1994 to 2004. George R. Nethercutt, Jr., was appointed to Hecla’sHecla's Board of Directors in February 2005. Mr. Nethercutt has served as a principal of Nethercutt Consulting LLC (a strategic planning and consulting firm), since January 2007. Prior to that, Mr. Nethercutt was a principal of Lundquist, Nethercutt & Griles, LLC (a strategic planning and consulting firm) from February 2005 to January 2007. Mr. Nethercutt has also been a board member for the Washington Policy Center (a premiere public policy organization providing high quality analysis on issues relating to the free market and government regulation) since January 2005. In September 2010, Mr. Nethercutt was appointed Of Counsel with the law firm of Lee & Hayes PLLC. Mr. Nethercutt serves as a board member of ARCADIS Corporation (an international company providing consultancy, engineering and management services), the Board of Chancellors for the Juvenile Diabetes Research Foundation International (a charity and advocate of juvenile diabetes research worldwide), and served as U.S. Chairman of the Permanent Joint Board on Defense –- U.S./Canada from April 2005 to December 2009. He is the founder and Chairman of the George Nethercutt Foundation (a charitable non-profit educational foundation) formed in February 2007. From 1995 to 2005, Mr. Nethercutt served in the U.S. House of Representatives, including House Appropriations subcommittees on Interior, Agriculture and Defense and the Science Committees subcommittee on Energy. He has been a member of the Washington State Bar Association since 1972.
Charles B. Stanley was elected to Hecla’s Board of Directors in May 2007. Mr. Stanley has been the Chief Executive Officer, President and Director of QEP Resources, Inc. (an independent(a natural gas and oil exploration and production company) since May 2010.2010, and Chairman of QEP's board of directors since May 2012. He served as Chief Operating Officer of Questar Corporation (a U.S. natural gas-focused exploration and production, interstate pipeline and local distribution company) from March 2008 to June 2010, and also as its Executive Vice President and Director from February 2002 to June 2010.
Terry V. Rogers was elected to Hecla’s Board of Directors in May 2007. Mr. Rogers was the Senior Vice President and Chief Operating Officer of Cameco Corporation (the world’s largest uranium(uranium producer) from February 2003 until his retirement in June 2007. Mr. Rogers also served as President of Kumtor Operating Company (a gold producing company and a division of Cameco Corporation) from 1999 to 2003. He has also served as a Director for Centerra Gold Inc. (a gold mining company) since February 2003. Dr. Anthony P. Taylor has served as a director since May 2002 upon election by preferred shareholders. The payment of the dividends in arrears in July 2005 resulted in the elimination of this director position. At such time he was then appointed to the Board of Directors when the number of director positions was increased from seven to nine.2002. Dr. Taylor has been the President, CEO and Director of Selex Resources Ltd. (a private Ontario Corporation engaged in mineral exploration) since January 2012. He previously served as Executive Chairman and Director of Crown Gold Corporation (a public Canadian minerals exploration company) sincefrom August 2010. He previously served as2010 to August 2012, and President, CEO and a Director of Gold Summit Corporation (a public Canadian minerals exploration company) from October 2003 to August 2010. Dr. Taylor is also the President and CEO of Selex Resources Ltd. (a private Ontario Corporation engaged in mineral exploration). He has served as President and Director of Caughlin Preschool Corporation (a private Nevada corporation that operates a preschool) since October 2001, and was a director of Greencastle Resources Corporation (an exploration company) from December 2003 to June 2008. Prior to that, Dr. Taylor was President, Chief Executive Officer and Director of Millennium Mining Corporation (a private Nevada minerals exploration company) from January 2000 to October 2003.2001. Information with respect to our directors is set forth under the caption “Proposal 1 - Election of Directors” in our proxy statement to be filed pursuant to Regulation 14A for the annual meeting scheduled to be held on May 24, 201216, 2013 (the Proxy Statement), which information is incorporated herein by reference. Reference is made to the information set forth in the first paragraph under the caption “Audit Committee Report – Membership and Role of the Audit Committee,” and under the caption “Corporate Governance” in the Proxy Statement to be filed pursuant to Regulation 14A, which information is incorporated herein by reference. Reference is made to the information set forth under the caption “Section 16(a) Beneficial Ownership Reporting Compliance” in the Proxy Statement to be filed pursuant to Regulation 14A, which information is incorporated herein by reference. Reference is made to the information set forth under the caption “Available Information” in Item 1 for information about the Company’s Code of Business Conduct and Ethics, which information is incorporated herein by reference. There have been no material changes to the procedures by which shareholders may recommend director nominees. Item 11. Executive Compensation Reference is made to the information set forth under the caption “Compensation of Non-Management Directors;” the caption “Compensation Discussion and Analysis;” the caption “Compensation Committee Interlocks and Insider Participation;” the caption “Compensation Committee Report,” the caption “Compensation Tables;” the first paragraph under the caption “Board of Directors and Committee Information;” and under the caption “Other Benefits” in the Proxy Statement to be filed pursuant to Regulation 14A, which information is incorporated herein by reference.
Item 12. Security Ownership of Certain Beneficial Owners and Management and Related Stockholder Matters Reference is made to the information set forth under the caption “Security Ownership of Certain Beneficial Owners and Management” and the caption “Equity Compensation Plan Information” in the Proxy Statement to be filed pursuant to Regulation 14A, which information is incorporated herein by reference.
Item 13. Certain Relationships and Related Transactions Reference is made to the information set forth in the Proxy Statement to be filed pursuant to Regulation 14A, which information is incorporated herein by reference.
Item 14. Principal Accounting Fees and Services Reference is made to the information set forth under the caption “Audit Fees – Audit and Non-Audit Fees” in the Proxy Statement to be filed pursuant to Regulation 14A, which information is incorporated herein by reference. Reference is made to the information set forth under the caption “Audit Fees – Policy on Audit Committee Pre-Approval of Audit and Non-Audit Services of Independent Auditor” in the Proxy Statement to be filed pursuant to Regulation 14A, which information is incorporated herein by reference.
Item 15. Exhibits, Financial Statement Schedules and Reports on Form 8-K
| | (a) | (1) | Financial Statements |
See Index to Financial Statements on Page F-1
| | (a) | (2) | Financial Statement Schedules |
See Exhibit Index following the Financial Statements
Pursuant to the requirements of Section 13 or 15(d) of the Securities Exchange Act of 1934, the registrant has duly caused this report to be signed on its behalf by the undersigned, thereunto duly authorized. | | HECLA MINING COMPANY | |
| | | | |
| | By: | /s/ Phillips S. Baker, Jr. | |
| | | Phillips S. Baker, Jr., President, | |
| | | Chief Executive Officer and Director | |
| | | | |
| | Date: | February 21, 201225, 2013 | |
| | | |
| | | |
Pursuant to the requirements of the Securities Exchange Act of 1934, this report has been signed below by the following persons on behalf of the registrant and in the capacities and on the dates indicated.
/s/ Phillips S. Baker, Jr. | | 2/21/201225/2013 | | /s/ Ted Crumley | | 2/21/201225/2013 |
President, Chief Executive Officer and Director (principal executive officer) | | Date | | | | Date |
| | | | | | | |
| /s/ James A. Sabala | | 2/21/201225/2013 | | /s/ Charles B. Stanley | | 2/21/201225/2013 |
Senior Vice President and Chief Financial Officer (principal financial and accounting officer) | | Date | | | | Date |
| | | | | | | |
| /s/ John H. Bowles | | 2/21/201225/2013 | | /s/ George R. Nethercutt, Jr. | | 2/21/201225/2013 |
| | Date | | George R. Nethercutt, Jr. | | Date |
| | | | | | | |
| /s/ Terry V. Rogers | | 2/21/201225/2013 | | /s/ Anthony P. Taylor | | 2/21/201225/2013 |
| | Date | | | | Date |
Index to Consolidated Financial Statements
| | Page |
| Consolidated Financial Statements | |
| Report of Independent Registered Public Accounting Firm | F-2 |
Consolidated Balance Sheets at December 31, 20112012 and 20102011 | F-3 |
Consolidated Statements of Operations and Comprehensive Income for the Years Ended December 31, 2012, 2011 2010 and 20092010 | F-4 |
Consolidated Statements of Cash Flows for the Years Ended December 31, 2012, 2011 2010 and 20092010 | F-5 |
Consolidated Statements of Changes in Shareholders’ Equity for the Years Ended December 31, 2012, 2011 2010 and 20092010 | F-6 |
| Notes to Consolidated Financial Statements | F-7 |
Report of Independent Registered Public Accounting Firm
Board of Directors and Shareholders
We have audited the accompanying consolidated balance sheets of Hecla Mining Company as of December 31, 20112012 and 20102011 and the related consolidated statements of operationsincome and comprehensive income, shareholders'stockholders' equity, and cash flows for each of the three years in the period ended December 31, 2011.2012. These financial statements are the responsibility of the Company's management. Our responsibility is to express an opinion on these financial statements based on our audits.
We conducted our audits in accordance with the standards of the Public Company Accounting Oversight Board (United States). Those standards require that we plan and perform the audit to obtain reasonable assurance about whether the financial statements are free of material misstatement. An audit also includes examining, on a test basis, evidence supporting the amounts and disclosures in the financial statements, assessing the accounting principles used and significant estimates made by management, as well as evaluating the overall financial statement presentation. We believe that our audits provide a reasonable basis for our opinion.
In our opinion, the consolidated financial statements referred to above present fairly, in all material respects, the financial position of Hecla Mining Company at December 31, 20112012 and 2010,2011, and the results of its operations and its cash flows for each of the three years in the period ended December 31, 20112012, in conformity with accounting principles generally accepted in the United States of America.
We also have audited, in accordance with the standards of the Public Company Accounting Oversight Board (United States), Hecla Mining Company's internal control over financial reporting as of December 31, 2011,2012, based on criteria established in Internal Control - Integrated Framework issued by the Committee of Sponsoring Organizations of the Treadway Commission (COSO) and our report dated February 21, 201225, 2013 expressed an unqualified opinion thereon.
February 21, 201225, 2013
Hecla Mining Company and Subsidiaries Consolidated Balance Sheets (In thousands, except share and per share data)
| | | December 31, | |
| | | 2012 | | | 2011 | |
| ASSETS | |
| Current assets: | | | | | | |
| Cash and cash equivalents | | $ | 190,984 | | | $ | 266,463 | |
| Accounts receivable: | | | | | | | | |
| Trade | | | 17,555 | | | | 10,996 | |
| Other, net | | | 7,466 | | | | 9,313 | |
| Inventories: | | | | | | | | |
Concentrates, doré, stockpiled ore, and metals in transit and in-process | | | 15,073 | | | | 13,692 | |
| Materials and supplies | | | 13,564 | | | | 12,503 | |
| Current deferred income taxes | | | 29,398 | | | | 27,810 | |
| Other current assets | | | 8,858 | | | | 21,967 | |
| Total current assets | | | 282,898 | | | | 362,744 | |
| Non-current investments | | | 9,614 | | | | 3,923 | |
| Non-current restricted cash and investments | | | 871 | | | | 866 | |
| Properties, plants, equipment and mineral interests, net | | | 996,659 | | | | 923,212 | |
| Non-current deferred income taxes | | | 86,365 | | | | 88,028 | |
| Other non-current assets | | | 1,883 | | | | 17,317 | |
| Total assets | | $ | 1,378,290 | | | $ | 1,396,090 | |
| LIABILITIES | |
| Current liabilities: | | | | | | | | |
| Accounts payable and accrued liabilities | | $ | 43,162 | | | $ | 37,831 | |
| Accrued payroll and related benefits | | | 10,760 | | | | 12,878 | |
| Accrued taxes | | | 12,321 | | | | 10,354 | |
| Current portion of capital leases | | | 5,564 | | | | 4,005 | |
| Current portion of accrued reclamation and closure costs | | | 19,845 | | | | 42,248 | |
| Other current liabilities | | | 3,335 | | | | — | |
| Total current liabilities | | | 94,987 | | | | 107,316 | |
| Long-term capital leases | | | 11,935 | | | | 6,265 | |
| Accrued reclamation and closure costs | | | 93,370 | | | | 111,563 | |
| Other non-current liabilities | | | 40,047 | | | | 30,833 | |
| Total liabilities | | | 240,339 | | | | 255,977 | |
| Commitments and contingencies (Notes 2, 3, 4, 6, 7, 8, and 10) | | | | | | | | |
| SHAREHOLDERS’ EQUITY | |
| | | | | | | | | |
| Preferred stock, 5,000,000 shares authorized: | | | | | | | | |
| Series B preferred stock, $0.25 par value, 157,816 shares issued and outstanding, liquidation preference — $7,891 | | | 39 | | | | 39 | |
| Common stock, $0.25 par value, authorized 500,000,000 shares; issued and outstanding 2012 — 285,209,848 shares and 2011 — 285,289,924 shares | | | 71,499 | | | | 71,420 | |
| Capital surplus | | | 1,218,283 | | | | 1,215,229 | |
| Accumulated deficit | | | (123,288 | ) | | | (120,557 | ) |
| Accumulated other comprehensive loss, net | | | (23,918 | ) | | | (23,498 | ) |
| Less treasury stock, at cost; 2012 — 788,288 shares and 2011 — 392,645 shares | | | (4,664 | ) | | | (2,520 | ) |
| Total shareholders’ equity | | | 1,137,951 | | | | 1,140,113 | |
| Total liabilities and shareholders’ equity | | $ | 1,378,290 | | | $ | 1,396,090 | |
| | | December 31, | |
| | | 2011 | | | 2010 | |
| ASSETS | |
| Current assets: | | | | | | |
| Cash and cash equivalents | | $ | 266,463 | | | $ | 283,606 | |
| Investments | | | — | | | | 1,474 | |
| Accounts receivable: | | | | | | | | |
| Trade | | | 10,996 | | | | 36,295 | |
| Other, net | | | 9,313 | | | | 545 | |
| Inventories: | | | | | | | | |
| Concentrates, doré, stockpiled ore, and metals in transit and in-process | | | 13,692 | | | | 8,886 | |
| Materials and supplies | | | 12,503 | | | | 10,245 | |
| Current deferred income taxes | | | 27,810 | | | | 87,287 | |
| Other current assets | | | 21,967 | | | | 3,683 | |
| Total current assets | | | 362,744 | | | | 432,021 | |
| Non-current investments | | | 3,923 | | | | 1,194 | |
| Non-current restricted cash and investments | | | 866 | | | | 10,314 | |
| Properties, plants, equipment and mineral interests, net | | | 923,212 | | | | 833,288 | |
| Non-current deferred income taxes | | | 88,028 | | | | 100,072 | |
| Other non-current assets | | | 17,317 | | | | 5,604 | |
| Total assets | | $ | 1,396,090 | | | $ | 1,382,493 | |
| LIABILITIES | |
| Current liabilities: | | | | | | | | |
| Accounts payable and accrued liabilities | | $ | 37,831 | | | $ | 31,725 | |
| Accrued payroll and related benefits | | | 12,878 | | | | 10,789 | |
| Accrued taxes | | | 10,354 | | | | 16,042 | |
| Current portion of capital leases | | | 4,005 | | | | 2,481 | |
| Current portion of accrued reclamation and closure costs | | | 42,248 | | | | 175,484 | |
| Current derivative contract liabilities | | | — | | | | 20,016 | |
| Total current liabilities | | | 107,316 | | | | 256,537 | |
| Long-term capital leases | | | 6,265 | | | | 3,792 | |
| Accrued reclamation and closure costs | | | 111,563 | | | | 143,313 | |
| Other non-current liabilities | | | 30,833 | | | | 16,598 | |
| Total liabilities | | | 255,977 | | | | 420,240 | |
| Commitments and contingencies (Notes 2, 3, 4, 6, 7, 8, 10 and 18) | | | | | | | | |
| SHAREHOLDERS’ EQUITY | |
| | | | | | | | | |
| Preferred stock, 5,000,000 shares authorized: | | | | | | | | |
| Series B preferred stock, $0.25 par value, 157,816 shares issued and outstanding, liquidation preference — $7,891 | | | 39 | | | | 39 | |
| 6.5% Mandatory Convertible Preferred stock, $0.25 par value, shares issued and outstanding, 2011 — 0 and 2010 — 2,012,500, liquidation preference 2011 — $0 and 2010 — $201,250 | | | — | | | | 504 | |
| Common stock, $0.25 par value, authorized 500,000,000 shares; issued and outstanding 2011 — 285,289,924 shares and 2010 — 258,485,666 shares | | | 71,420 | | | | 64,704 | |
| Capital surplus | | | 1,215,229 | | | | 1,179,751 | |
| Accumulated deficit | | | (120,557 | ) | | | (265,577 | ) |
| Accumulated other comprehensive loss, net | | | (23,498 | ) | | | (15,117 | ) |
| Less treasury stock, at cost; 2011 — 392,645 shares and 2010 — 335,957 shares | | | (2,520 | ) | | | (2,051 | ) |
| Total shareholders’ equity | | | 1,140,113 | | | | 962,253 | |
| Total liabilities and shareholders’ equity | | $ | 1,396,090 | | | $ | 1,382,493 | |
The accompanying notes are an integral part of the consolidated financial statements.
Hecla Mining Company and Subsidiaries
Consolidated Statements of Operations and Comprehensive Income
(Dollars and shares in thousands, except per share amounts)
| | | Year Ended December 31, |
| | | 2012 | | | 2011 | | | 2010 |
| Sales of products | | $ | 321,143 | | | $ | 477,634 | | | $ | 418,813 | |
| Cost of sales and other direct production costs | | | 134,105 | | | | 165,573 | | | | 163,983 | |
| Depreciation, depletion and amortization | | | 43,522 | | | | 47,066 | | | | 60,011 | |
| Total cost of sales | | | 177,627 | | | | 212,639 | | | | 223,994 | |
| Gross profit | | | 143,516 | | | | 264,995 | | | | 194,819 | |
| Other operating expenses: | | | | | | | | | | | | |
| General and administrative | | | 21,253 | | | | 18,540 | | | | 18,219 | |
| Exploration | | | 31,822 | | | | 26,959 | | | | 21,605 | |
| Pre-development | | | 17,916 | | | | 4,446 | | | | — | |
| Other operating expense | | | 4,423 | | | | 7,658 | | | | 5,334 | |
| Loss on disposition of property, plants, equipment and mineral interests | | | 275 | | | | — | | | | 80 | |
| Lucky Friday suspension-related costs | | | 25,309 | | | | — | | | | — | |
| Provision for closed operations and environmental matters | | | 4,652 | | | | 9,747 | | | | 201,136 | |
| Total other operating expense | | | 105,650 | | | | 67,350 | | | | 246,374 | |
| Income (loss) from operations | | | 37,866 | | | | 197,645 | | | | (51,555 | ) |
| Other income (expense): | | | | | | | | | | | | |
| Gain (loss) on derivative contracts | | | (10,457 | ) | | | 37,988 | | | | (20,758 | ) |
| Net gain on sale of investments | | | — | | | | 611 | | | | 588 | |
| Loss on impairment of investments | | | (1,171 | ) | | | (140 | ) | | | (739 | ) |
| Interest and other income (expense) | | | 22 | | | | (87 | ) | | | 126 | |
| Interest expense | | | (2,427 | ) | | | (2,875 | ) | | | (2,211 | ) |
| Total other income (expense): | | | (14,033 | ) | | | 35,497 | | | | (22,994 | ) |
| Income (loss) before income taxes | | | 23,833 | | | | 233,142 | | | | (74,549 | ) |
| Income tax benefit (provision) | | | (8,879 | ) | | | (81,978 | ) | | | 123,532 | |
| Net income | | | 14,954 | | | | 151,164 | | | | 48,983 | |
| Preferred stock dividends | | | (552 | ) | | | (552 | ) | | | (13,633 | ) |
| Income applicable to common shareholders | | $ | 14,402 | | | $ | 150,612 | | | $ | 35,350 | |
| | | | | | | | | | | | | |
| Comprehensive income: | | | | | | | | | | | | |
| Net income | | $ | 14,954 | | | $ | 151,164 | | | $ | 48,983 | |
| Unrealized gain (loss) and amortization of prior service on pension plans | | | (1,644 | ) | | | (7,754 | ) | | | (1,653 | ) |
| Unrealized holding gains (losses) on investments | | | 53 | | | | (767 | ) | | | (21 | ) |
| Reclassification of impairment of investments included in net income | | | 1,171 | | | | 140 | | | | 739 | |
| Total change in accumulated other comprehensive loss, net | | $ | (420 | ) | | $ | (8,381 | ) | | $ | (935 | ) |
| Comprehensive income | | $ | 14,534 | | | $ | 142,783 | | | $ | 48,048 | |
| Basic income per common share after preferred dividends | | $ | 0.05 | | | $ | 0.54 | | | $ | 0.14 | |
| Diluted income per common share after preferred dividends | | $ | 0.05 | | | $ | 0.51 | | | $ | 0.13 | |
| Weighted average number of common shares outstanding – basic | | | 285,375 | | | | 280,956 | | | | 251,146 | |
| Weighted average number of common shares outstanding – diluted | | | 297,566 | | | | 297,033 | | | | 269,601 | |
The accompanying notes are an integral part of the consolidated financial statements.
Hecla Mining Company and Subsidiaries Consolidated Statements of Operations and Comprehensive IncomeCash Flows (Dollars and shares in thousands, except per share amounts)In thousands)
| | | Year Ended December 31, |
| | | 2011 | | | 2010 | | | 2009 |
| Sales of products | | $ | 477,634 | | | $ | 418,813 | | | $ | 312,548 | |
| Cost of sales and other direct production costs | | | 165,573 | | | | 163,983 | | | | 148,642 | |
| Depreciation, depletion and amortization | | | 47,066 | | | | 60,011 | | | | 62,837 | |
| Total cost of sales | | | 212,639 | | | | 223,994 | | | | 211,479 | |
| Gross profit | | | 264,995 | | | | 194,819 | | | | 101,069 | |
| Other operating expenses: | | | | | | | | | | | | |
| General and administrative | | | 18,540 | | | | 18,219 | | | | 18,624 | |
| Exploration | | | 26,959 | | | | 21,605 | | | | 9,247 | |
| Pre-development | | | 4,446 | | | | — | | | | — | |
| Other operating expense | | | 7,658 | | | | 5,334 | | | | 5,389 | |
| Loss (gain) on disposition of property, plants, equipment and mineral interests | | | — | | | | 80 | | | | (6,234 | ) |
| Termination of employee benefit plan | | | — | | | | — | | | | (8,950 | ) |
| Provision for closed operations and environmental matters | | | 9,747 | | | | 201,136 | | | | 7,721 | |
| Total other operating expense | | | 67,350 | | | | 246,374 | | | | 25,797 | |
| Income (loss) from operations | | | 197,645 | | | | (51,555 | ) | | | 75,272 | |
| Other income (expense): | | | | | | | | | | | | |
| Gain (loss) on derivative contracts | | | 37,988 | | | | (20,758 | ) | | | — | |
| Net gain on sale of investments | | | 611 | | | | 588 | | | | 4,070 | |
| Loss on impairment of investments | | | (140 | ) | | | (739 | ) | | | (3,018 | ) |
| Interest and other income (expense) | | | (87 | ) | | | 126 | | | | 1,121 | |
| Debt-related fees | | | — | | | | — | | | | (5,973 | ) |
| Interest expense | | | (2,875 | ) | | | (2,211 | ) | | | (11,326 | ) |
| Total other income (expense): | | | 35,497 | | | | (22,994 | ) | | | (15,126 | ) |
| Income (loss) before income taxes | | | 233,142 | | | | (74,549 | ) | | | 60,146 | |
| Income tax benefit (provision) | | | (81,978 | ) | | | 123,532 | | | | 7,680 | |
| Net income | | | 151,164 | | | | 48,983 | | | | 67,826 | |
| Preferred stock dividends | | | (552 | ) | | | (13,633 | ) | | | (13,633 | ) |
| Income applicable to common shareholders | | $ | 150,612 | | | $ | 35,350 | | | $ | 54,193 | |
| | | | | | | | | | | | | |
| Comprehensive income: | | | | | | | | | | | | |
| Net income | | $ | 151,164 | | | $ | 48,983 | | | $ | 67,826 | |
| Unrealized gain (loss) and amortization of prior service on pension plans | | | (7,754 | ) | | | (1,653 | ) | | | 6,006 | |
| Change in fair value of derivative contracts | | | — | | | | — | | | | 1,967 | |
| Unrealized holding gains (losses) on investments | | | (767 | ) | | | (21 | ) | | | 3,498 | |
| Reclassification of net gain on sale or impairment of investments included in net income | | | 140 | | | | 739 | | | | (632 | ) |
| Comprehensive income | | $ | 142,783 | | | $ | 48,048 | | | $ | 78,665 | |
| Basic income per common share after preferred dividends | | $ | 0.54 | | | $ | 0.14 | | | $ | 0.24 | |
| Diluted income per common share after preferred dividends | | $ | 0.51 | | | $ | 0.13 | | | $ | 0.23 | |
| Weighted average number of common shares outstanding – basic | | | 280,956 | | | | 251,146 | | | | 224,933 | |
| Weighted average number of common shares outstanding – diluted | | | 297,033 | | | | 269,601 | | | | 233,618 | |
| | | Year Ended December 31, |
| | | 2012 | | 2011 | | 2010 |
| Operating activities: | | | | | | |
| Net income | | $ | 14,954 | | | $ | 151,164 | | | $ | 48,983 | |
| Non-cash elements included in net income: | | | | | | | | | | | | |
| Depreciation, depletion and amortization | | | 50,113 | | | | 47,348 | | | | 60,235 | |
| Net gain on sale of investments | | | — | | | | (611 | ) | | | (588 | ) |
| Loss on impairment of investments | | | 1,171 | | | | 140 | | | | 739 | |
| Loss on disposition of properties, plants, equipment and mineral interests | | | 275 | | | | — | | | | 80 | |
| Provision for reclamation and closure costs | | | 1,106 | | | | 7,004 | | | | 196,262 | |
| Deferred income taxes | | | 546 | | | | 76,944 | | | | (141,707 | ) |
| Stock compensation | | | 3,101 | | | | 2,073 | | | | 3,446 | |
| Amortization of loan origination fees | | | 460 | | | | 598 | | | | 621 | |
| Amortization of intangible asset | | | — | | | | — | | | | 1,380 | |
| (Gain) loss on derivative contracts | | | 29,627 | | | | (53,545 | ) | | | 20,795 | |
| Other non-cash items | | | 1,765 | | | | 1,209 | | | | (495 | ) |
| Change in assets and liabilities: | | | | | | | | | | | | |
| Accounts receivable | | | (4,713 | ) | | | 16,531 | | | | (9,404 | ) |
| Inventories | | | (2,442 | ) | | | (7,064 | ) | | | 2,335 | |
| Other current and non-current assets | | | 610 | | | | 2,164 | | | | 3,279 | |
| Accounts payable and accrued liabilities | | | 4,927 | | | | 1,466 | | | | 10,896 | |
| Accrued payroll and related benefits | | | (2,118 | ) | | | 2,090 | | | | (3,376 | ) |
| Accrued taxes | | | 1,967 | | | | (5,688 | ) | | | 9,802 | |
| Accrued reclamation and closure costs and other non-current liabilities | | | (32,333 | ) | | | (171,932 | ) | | | (5,474 | ) |
| Net cash provided by operating activities | | | 69,016 | | | | 69,891 | | | | 197,809 | |
| Investing activities: | | | | | | | | | | | | |
| Additions to properties, plants, equipment and mineral interests | | | (113,096 | ) | | | (87,546 | ) | | | (67,414 | ) |
| Proceeds from sale of investments | | | — | | | | 1,366 | | | | 1,138 | |
| Proceeds from disposition of properties, plants and equipment | | | 886 | | | | 113 | | | | 29 | |
| Redemptions of restricted cash and investment balances | | | — | | | | 9,448 | | | | 1,459 | |
| Increases in restricted cash and investment balances | | | (5 | ) | | | (3,200 | ) | | | — | |
| Purchases of investments | | | (5,823 | ) | | | — | | | | — | |
| Net cash used by investing activities | | | (118,038 | ) | | | (79,819 | ) | | | (64,788 | ) |
| Financing activities: | | | | | | | | | | | | |
| Proceeds from exercise of warrants and stock options | | | — | | | | 5,786 | | | | 53,093 | |
| Dividends paid to common shareholders | | | (17,121 | ) | | | (5,592 | ) | | | — | |
| Dividend paid to preferred shareholders | | | (552 | ) | | | (3,822 | ) | | | (4,513 | ) |
| Loan origination fees paid | | | (750 | ) | | | (180 | ) | | | (200 | ) |
| Acquisition of treasury shares | | | (2,144 | ) | | | (469 | ) | | | (693 | ) |
| Repayments of capital leases | | | (5,890 | ) | | | (2,938 | ) | | | (1,780 | ) |
| Net cash provided by (used in) financing activities | | | (26,457 | ) | | | (7,215 | ) | | | 45,907 | |
| Net increase (decrease) in cash and cash equivalents | | | (75,479 | ) | | | (17,143 | ) | | | 178,928 | |
| Cash and cash equivalents at beginning of year | | | 266,463 | | | | 283,606 | | | | 104,678 | |
| Cash and cash equivalents at end of year | | $ | 190,984 | | | $ | 266,463 | | | $ | 283,606 | |
| Supplemental disclosure of cash flow information: | | | | | | | | | | | | |
| Cash paid during year for: | | | | | | | | | | | | |
| Interest | | $ | 1,968 | | | $ | 1,683 | | | $ | 584 | |
| Income tax payments | | $ | 3 | | | $ | 17,874 | | | $ | 11,075 | |
| Significant non-cash investing and financing activities: | | | | | | | | | | | | |
| Stock issued for acquisition of assets | | $ | — | | | $ | 33,831 | | | $ | — | |
| Capital leases acquired | | $ | 13,119 | | | $ | 6,935 | | | $ | 3,212 | |
| Accounts payable change relating to capital additions | | $ | 3,727 | | | $ | 8,687 | | | $ | 3,488 | |
| Preferred stock dividends paid in common stock | | $ | — | | | $ | — | | | $ | 22,891 | |
See Notes 2 and 9 for additional non-cash investing and financing activities.
The accompanying notes are an integral part of the consolidated financial statements.
Hecla Mining Company and Subsidiaries
Consolidated Statements of Changes in Shareholders’ Equity
For the Years Ended December 31, 2012, 2011 and 2010
(Dollars in thousands)
| | | Series B Preferred Stock | | | Series C Mandatory Convertible Preferred Stock | | | Common Stock | | | Additional Paid-In Capital | | | Accumulated Deficit | | | Accumulated Other Comprehensive Loss, net | | | Treasury Stock | | | Total | |
| Balances, January 1, 2010 | | $ | 39 | | | $ | 504 | | | $ | 59,604 | | | $ | 1,121,076 | | | $ | (300,915 | ) | | $ | (14,183 | ) | | $ | (640 | ) | | $ | 865,485 | |
| Net income | | | | | | | | | | | | | | | | | | | 48,983 | | | | | | | | | | | | 48,983 | |
| Options granted | | | | | | | | | | | | | | | 1,121 | | | | | | | | | | | | | | | | 1,121 | |
| Options exercised (696,000 shares) | | | | | | | | | | | 174 | | | | 3,743 | | | | | | | | | | | | (718 | ) | | | 3,199 | |
| Stock issued to directors (82,000 shares) | | | | | | | | | | | 20 | | | | 410 | | | | | | | | | | | | | | | | 430 | |
| Series B deferred dividends declared | | | | | | | | | | | | | | | | | | | (552 | ) | | | | | | | | | | | (552 | ) |
| 6.5% Mandatory Convertible Preferred Stock dividends declared | | | | | | | | | | | | | | | | | | | (13,093 | ) | | | | | | | | | | | (13,093 | ) |
| Restricted stock units granted | | | | | | | | | | | | | | | 1,895 | | | | | | | | | | | | | | | | 1,895 | |
| Restricted stock unit distributions (480,000 shares) | | | | | | | | | | | 120 | | | | (120 | ) | | | | | | | | | | | (693 | ) | | | (693 | ) |
| Bonuses paid through stock issuances (1,046,000 shares) | | | | | | | | | | | 262 | | | | (262 | ) | | | | | | | | | | | | | | | — | |
| Warrants exercised (14,215,000 shares) | | | | | | | | | | | 3,553 | | | | 46,341 | | | | | | | | | | | | | | | | 49,894 | |
| 6.5% Mandatory Convertible Preferred Stock dividends paid in common stock (3,886,000 shares) | | | | | | | | | | | 971 | | | | 5,547 | | | | | | | | | | | | | | | | 6,518 | |
| Other comprehensive income | | | | | | | | | | | | | | | | | | | | | | | (934 | ) | | | | | | | (934 | ) |
| Balances, December 31, 2010 | | | 39 | | | | 504 | | | | 64,704 | | | | 1,179,751 | | | | (265,577 | ) | | | (15,117 | ) | | | (2,051 | ) | | | 962,253 | |
| Net income | | | | | | | | | | | | | | | | | | | 151,164 | | | | | | | | | | | | 151,164 | |
| Options exercised (78,000 shares) | | | | | | | | | | | 19 | | | | 460 | | | | | | | | | | | | | | | | 479 | |
| Stock issued to directors (43,000 shares) | | | | | | | | | | | 11 | | | | 331 | | | | | | | | | | | | | | | | 342 | |
| Series B Preferred Stock dividends declared | | | | | | | | | | | | | | | | | | | (552 | ) | | | | | | | | | | | (552 | ) |
| Common stock dividends declared ($0.02 per common share) | | | | | | | | | | | | | | | | | | | (5,592 | ) | | | | | | | | | | | (5,592 | ) |
| Restricted stock units granted | | | | | | | | | | | | | | | 1,671 | | | | | | | | | | | | | | | | 1,671 | |
| Restricted stock unit distributions (321,000 shares) | | | | | | | | | | | 80 | | | | (80 | ) | | | | | | | | | | | (469 | ) | | | (469 | ) |
| 6.5% Mandatory Convertible Preferred Stock dividends paid in common stock (18,872,000 shares) | | | | | | | (504 | | | | 4,719 | | | | (4,215 | ) | | | | | | | | | | | | | | | — | |
| Bonuses and other compensation paid through stock issuances (8,000 shares) | | | | | | | | | | | 2 | | | | 58 | | | | | | | | | | | | | | | | 60 | |
| Warrants exercised (2,147,000 shares) | | | | | | | | | | | 536 | | | | 4,771 | | | | | | | | | | | | | | | | 5,307 | |
| Common stock issued for assets purchased (5,396,000 shares) | | | | | | | | | | | 1,349 | | | | 32,482 | | | | | | | | | | | | | | | | 33,831 | |
| Other comprehensive loss | | | | | | | | | | | | | | | | | | | | | | | (8,381 | ) | | | | | | | (8,381 | ) |
| Balances, December 31, 2011 | | | 39 | | | | — | | | | 71,420 | | | | 1,215,229 | | | | (120,557 | ) | | | (23,498 | ) | | | (2,520 | ) | | | 1,140,113 | |
| Net income | | | | | | | | | | | | | | | | | | | 14,954 | | | | | | | | | | | | 14,954 | |
| Stock issued to directors (78,000 shares) | | | | | | | | | | | 19 | | | | 336 | | | | | | | | | | | | | | | | 355 | |
| Series B Preferred Stock dividends declared | | | | | | | | | | | | | | | | | | | (552 | ) | | | | | | | | | | | (552 | ) |
| Common stock dividends declared (3,000 shares, $0.06 per common share) | | | | | | | | | | | 1 | | | | 11 | | | | (17,133 | ) | | | | | | | | | | | (17,121 | ) |
| Restricted stock units granted | | | | | | | | | | | | | | | 2,746 | | | | | | | | | | | | | | | | 2,746 | |
| Restricted stock unit distributions (235,000 shares) | | | | | | | | | | | 59 | | | | (39 | ) | | | | | | | | | | | (203 | ) | | | (183 | ) |
| Repurchase of common shares (350,000 shares) | | | | | | | | | | | | | | | | | | | | | | | | | | | (1,941 | ) | | | (1,941 | ) |
| Other comprehensive loss | | | | | | | | | | | | | | | | | | | | | | | (420 | ) | | | | | | | (420 | ) |
| Balances, December 31, 2012 | | $ | 39 | | | $ | — | | | $ | 71,499 | | | $ | 1,218,283 | | | $ | (123,288 | ) | | $ | (23,918 | ) | | $ | (4,664 | ) | | $ | 1,137,951 | |
The accompanying notes are an integral part of the consolidated financial statements.
Hecla Mining Company and Subsidiaries Consolidated Statements of Cash Flows| | | Year Ended December 31, |
| | | 2011 | | | 2010 | | | 2009 |
| Operating activities: | | | | | | | | |
| Net income | | $ | 151,164 | | | $ | 48,983 | | | $ | 67,826 | |
| Non-cash elements included in net income: | | | | | | | | | | | | |
| Depreciation, depletion and amortization | | | 47,348 | | | | 60,235 | | | | 63,061 | |
| Net gain on sale of investments | | | (611 | ) | | | (588 | ) | | | (4,070 | ) |
| Loss on impairment of investments | | | 140 | | | | 739 | | | | 3,018 | |
| Loss (gain) on disposition of properties, plants, equipment and mineral interests | | | — | | | | 80 | | | | (6,234 | ) |
| Provision for reclamation and closure costs | | | 7,004 | | | | 196,262 | | | | 5,172 | |
| Deferred income taxes | | | 76,944 | | | | (141,707 | ) | | | (7,100 | ) |
| Stock compensation | | | 2,073 | | | | 3,446 | | | | 2,746 | |
| Preferred shares issued for debt-related fees | | | — | | | | — | | | | 4,262 | |
| Amortization of loan origination fees | | | 598 | | | | 621 | | | | 3,993 | |
| Amortization of intangible asset | | | — | | | | 1,380 | | | | 1,388 | |
| Gain on termination of employee benefit plan | | | — | | | | — | | | | (8,950 | ) |
| (Gain) loss on derivative contracts | | | (53,545 | ) | | | 20,795 | | | | 2,139 | |
| Other non-cash items | | | 1,209 | | | | (495 | ) | | | (55 | ) |
| Change in assets and liabilities: | | | | | | | | | | | | |
| Accounts receivable | | | 16,531 | | | | (9,404 | ) | | | (18,117 | ) |
| Inventories | | | (7,064 | ) | | | 2,335 | | | | (135 | ) |
| Other current and noncurrent assets | | | 2,164 | | | | 3,279 | | | | (1,526 | ) |
| Accounts payable and accrued liabilities | | | 1,466 | | | | 10,896 | | | | (3,663 | ) |
| Accrued payroll and related benefits | | | 2,090 | | | | (3,376 | ) | | | 6,015 | |
| Accrued taxes | | | (5,688 | ) | | | 9,802 | | | | 4,866 | |
| Accrued reclamation and closure costs | | | (172,855 | ) | | | (8,666 | ) | | | 1,540 | |
| Other non-current liabilities | | | 923 | | | | 3,192 | | | | 2,989 | |
| Net cash provided by operating activities | | | 69,891 | | | | 197,809 | | | | 119,165 | |
| Investing activities: | | | | | | | | | | | | |
| Additions to properties, plants, equipment and mineral interests | | | (87,546 | ) | | | (67,414 | ) | | | (27,704 | ) |
| Proceeds from sale of investments | | | 1,366 | | | | 1,138 | | | | 4,091 | |
| Proceeds from disposition of properties, plants and equipment | | | 113 | | | | 29 | | | | 8,023 | |
| Redemptions of restricted cash and investment balances | | | 9,448 | | | | 1,459 | | | | 3,487 | |
| Increases in restricted cash and investment balances | | | (3,200 | ) | | | — | | | | — | |
| Net cash used by investing activities | | | (79,819 | ) | | | (64,788 | ) | | | (12,103 | ) |
| Financing activities: | | | | | | | | | | | | |
| Proceeds from exercise of warrants and stock options | | | 5,786 | | | | 53,093 | | | | — | |
| Proceeds from issuance of common stock and warrants, net of related expense | | | — | | | | — | | | | 128,334 | |
| Dividends paid to common shareholders | | | (5,592 | ) | | | — | | | | — | |
| Dividend paid to preferred shareholders | | | (3,822 | ) | | | (4,513 | ) | | | — | |
| Loan origination fees paid | | | (180 | ) | | | (200 | ) | | | (1,467 | ) |
| Payments on interest rate swap | | | — | | | | — | | | | (3,013 | ) |
| Treasury share purchase | | | (469 | ) | | | (693 | ) | | | — | |
| Repayments of debt and capital leases | | | (2,938 | ) | | | (1,780 | ) | | | (162,708 | ) |
| Net cash provided by (used in) financing activities | | | (7,215 | ) | | | 45,907 | | | | (38,854 | ) |
| Net increase (decrease) in cash and cash equivalents | | | (17,143 | ) | | | 178,928 | | | | 68,208 | |
| Cash and cash equivalents at beginning of year | | | 283,606 | | | | 104,678 | | | | 36,470 | |
| Cash and cash equivalents at end of year | | $ | 266,463 | | | $ | 283,606 | | | $ | 104,678 | |
| Supplemental disclosure of cash flow information: | | | | | | | | | | | | |
| Cash paid during year for: | | | | | | | | | | | | |
| Interest, net of amount capitalized | | $ | 1,683 | | | $ | 584 | | | $ | 6,683 | |
| Income tax payments | | $ | 17,874 | | | $ | 11,075 | | | $ | 1,025 | |
| Significant non-cash investing and financing activities: | | | | | | | | | | | | |
| Stock issued for acquisition of assets | | $ | 33,831 | | | $ | — | | | $ | — | |
| Capital leases acquired | | $ | 6,935 | | | $ | 3,212 | | | $ | 5,682 | |
| Equity securities received from dispositions of assets | | $ | — | | | $ | — | | | $ | 299 | |
| Accounts payable change relating to capital additions | | $ | 8,687 | | | $ | 3,488 | | | $ | (4,190 | ) |
| Preferred stock dividends paid in common stock | | $ | — | | | $ | 22,891 | | | $ | — | |
See Notes 2 and 9 for additional non-cash investing and financing activities.The accompanying notes are an integral part of the consolidated financial statements.Hecla Mining Company and SubsidiariesConsolidated Statements of Changes in Shareholders’ EquityFor the Years Ended December 31, 2011, 2010 and 2009| | | | | | | | | | | | | | | | | | | | | | | | Total | |
| Balances, January 1, 2009 | | $ | 39 | | | $ | 504 | | | $ | 45,115 | | | $ | 981,161 | | | $ | (351,700 | ) | | $ | (25,022 | ) | | $ | (640 | ) | | $ | 649,457 | |
| Net income | | | | | | | | | | | | | | | | | | | 67,826 | | | | | | | | | | | | 67,826 | |
| Options granted | | | | | | | | | | | | | | | 1,068 | | | | | | | | | | | | | | | | 1,068 | |
| Options exercised (10,000 shares) | | | | | | | | | | | 3 | | | | 33 | | | | | | | | | | | | | | | | 36 | |
| Stock issued to directors (23,000 shares) | | | | | | | | | | | 6 | | | | 78 | | | | | | | | | | | | | | | | 84 | |
| Series B deferred dividends declared | | | | | | | | | | | | | | | | | | | (690 | ) | | | | | | | | | | | (690 | ) |
| 6.5% Mandatory Convertible Preferred Stock dividends declared | | | | | | | | | | | | | | | 16,351 | | | | (16,351 | ) | | | | | | | | | | | — | |
| Restricted stock units granted | | | | | | | | | | | | | | | 1,573 | | | | | | | | | | | | | | | | 1,573 | |
| Restricted stock unit distributions (152,000 shares) | | | | | | | | | | | 39 | | | | (39 | ) | | | | | | | | | | | | | | | — | |
| Bonuses paid through stock issuances (925,000 shares) | | | | | | | | | | | 230 | | | | 1,932 | | | | | | | | | | | | | | | | 2,162 | |
| Common stock and warrant private placement issuance (17,391,000 shares) | | | | | | | | | | | 4,348 | | | | 53,213 | | | | | | | | | | | | | | | | 57,561 | |
| Common stock and warrant public offering (36,800,000 shares) | | | | | | | | | | | 9,200 | | | | 61,751 | | | | | | | | | | | | | | | | 70,951 | |
| Warrants exercised (24,000 shares) | | | | | | | | | | | 6 | | | | 53 | | | | | | | | | | | | | | | | 59 | |
| Conversion of 12% Convertible Preferred Stock to common stock (2,629,000 shares) | | | | | | | | | | | 657 | | | | 3,902 | | | | | | | | | | | | | | | | 4,559 | |
| Other comprehensive income | | | | | | | | | | | | | | | | | | | | | | | 10,839 | | | | | | | | 10,839 | |
| Balances, December 31, 2009 | | | 39 | | | | 504 | | | | 59,604 | | | | 1,121,076 | | | | (300,915 | ) | | | (14,183 | ) | | | (640 | ) | | | 865,485 | |
| Net income | | | | | | | | | | | | | | | | | | | 48,983 | | | | | | | | | | | | 48,983 | |
| Options granted | | | | | | | | | | | | | | | 1,121 | | | | | | | | | | | | | | | | 1,121 | |
| Options exercised (696,000 shares) | | | | | | | | | | | 174 | | | | 3,743 | | | | | | | | | | | | (718 | ) | | | 3,199 | |
| Stock issued to directors (82,000 shares) | | | | | | | | | | | 20 | | | | 410 | | | | | | | | | | | | | | | | 430 | |
| Series B Preferred Stock dividends declared | | | | | | | | | | | | | | | | | | | (552 | ) | | | | | | | | | | | (552 | ) |
| 6.5% Mandatory Convertible Preferred Stock dividends declared | | | | | | | | | | | | | | | | | | | (13,093 | ) | | | | | | | | | | | (13,093 | ) |
| Restricted stock units granted | | | | | | | | | | | | | | | 1,895 | | | | | | | | | | | | | | | | 1,895 | |
| Restricted stock unit distributions (480,000 shares) | | | | | | | | | | | 120 | | | | (120 | ) | | | | | | | | | | | (693 | ) | | | (693 | ) |
| Bonuses and other compensation paid through stock issuances (1,046,000 shares) | | | | | | | | | | | 262 | | | | (262 | ) | | | | | | | | | | | | | | | — | |
| Warrants exercised (14,215,000 shares) | | | | | | | | | | | 3,553 | | | | 46,341 | | | | | | | | | | | | | | | | 49,894 | |
| 6.5% Mandatory Convertible Preferred Stock dividends paid in common stock (3,886,000 shares) | | | | | | | | | | | 971 | | | | 5,547 | | | | | | | | | | | | | | | | 6,518 | |
| Other comprehensive loss | | | | | | | | | | | | | | | | | | | | | | | (934 | ) | | | | | | | (934 | ) |
| Balances, December 31, 2010 | | | 39 | | | | 504 | | | | 64,704 | | | | 1,179,751 | | | | (265,577 | ) | | | (15,117 | ) | | | (2,051 | ) | | | 962,253 | |
| Net income | | | | | | | | | | | | | | | | | | | 151,164 | | | | | | | | | | | | 151,164 | |
| Options exercised (78,000 shares) | | | | | | | | | | | 19 | | | | 460 | | | | | | | | | | | | | | | | 479 | |
| Stock issued to directors (43,000 shares) | | | | | | | | | | | 11 | | | | 331 | | | | | | | | | | | | | | | | 342 | |
| Series B Preferred Stock dividends declared | | | | | | | | | | | | | | | | | | | (552 | ) | | | | | | | | | | | (552 | ) |
| Common stock dividends declared | | | | | | | | | | | | | | | | | | | (5,592 | ) | | | | | | | | | | | (5,592 | ) |
| Restricted stock units granted | | | | | | | | | | | | | | | 1,671 | | | | | | | | | | | | | | | | 1,671 | |
| Conversion of 6.5% Mandatory Convertible Preferred Stock to common stock (18,872,000) shares | | | | | | | (504 | ) | | | 4,719 | | | | (4,215 | ) | | | | | | | | | | | | | | | — | |
| Restricted stock unit distributions (321,000 shares) | | | | | | | | | | | 80 | | | | (80 | ) | | | | | | | | | | | (469 | ) | | | (469 | ) |
| Common stock issued for assets purchased (5,396,000 shares) | | | | | | | | | | | 1,349 | | | | 32,482 | | | | | | | | | | | | | | | | 33,831 | |
| Warrants exercised (2,147,000 shares) | | | | | | | | | | | 536 | | | | 4,771 | | | | | | | | | | | | | | | | 5,307 | |
| Bonuses and other compensation paid through stock issuances (8,000 shares) | | | | | | | | | | | 2 | | | | 58 | | | | | | | | | | | | | | | | 60 | |
| Other comprehensive loss | | | | | | | | | | | | | | | | | | | | | | | (8,381 | ) | | | | | | | (8,381 | ) |
| Balances, December 31, 2011 | | $ | 39 | | | $ | — | | | $ | 71,420 | | | $ | 1,215,229 | | | $ | (120,557 | ) | | $ | (23,498 | ) | | $ | (2,520 | ) | | $ | 1,140,113 | |
The accompanying notes are an integral part of the consolidated financial statements.Hecla Mining Company and SubsidiariesNotes to Consolidated Financial Statements
Note 1: Summary of Significant Accounting Policies A. Principles of Consolidation — Our Consolidated Financial Statements have been prepared in accordance with accounting principles generally accepted in the United States of America, and include our accounts, our wholly-owned subsidiaries’ accounts and a proportionate share of the accounts of the joint ventures in which we participate. All significant inter-company balances and transactions have been eliminated in consolidation.
B. Assumptions and Use of Estimates — Preparing financial statements requires management to make estimates and assumptions that affect the reported amounts and related disclosure of assets, liabilities, revenue and expenses at the date of the consolidated financial statements and reporting periods. We consider our most critical accounting estimates to be future metals prices, obligations for environmental, reclamation and closure matters, mineral reserves, and valuation of business combinations. Other significant areas requiring the use of management assumptions and estimates relate to reserves for contingencies and litigation; asset impairments, including long-lived assets and investments; valuation of deferred tax assets; inventory net realizable value; and post-employment, post-retirement and other employee benefit assets and liabilities;.liabilities. We have based our estimates on historical experience and on various other assumptions that we believe to be reasonable. Accordingly, actual results may differ materially from these estimates under different assumptions or conditions.
C. Cash and Cash Equivalents — Cash and cash equivalents consist of all cash balances and highly liquid investments with a remaining maturity of three months or less when purchased and are carried at fair value. Cash and cash equivalents are invested in money market funds, certificates of deposit, U.S. government and federal agency securities, municipal securities and corporate bonds.
D. Investments and Securities Held for Sale — We determine the appropriate classification of our investments at the time of purchase and re-evaluate such determinations at each reporting date. Short-term investments include certificates of deposit and held-to-maturity securities, based on our intent and ability to hold the securities to maturity. Marketable equity securities are categorized as available for sale and carried at fair market value.
Realized gains and losses on the sale of securities are recognized on a specific identification basis. Unrealized gains and losses are included as a component of accumulated other comprehensive income (loss), unless an other than temporary impairment in value has occurred, which would then be charged to current period net income (loss). Unrealized gains and losses originally included in accumulated other comprehensive income are reclassified to current period net income (loss) when the sale or determination of an other than temporary impairment of securities occurs.
E. Inventories — Inventories are stated at the lower of average costs incurred or estimated net realizable value. Major types of inventories include materials and supplies and metals product inventory, which is determined by the stage at which the ore is in the production process (stockpiled ore and finished goods). Inventories are valued at the lower of full cost of production or net realizable value based on current metals prices.
Stockpiled ore inventory represents ore that has been mined, hauled to the surface, and is available for further processing. Stockpiles are measured by estimating the number of tons added and removed from the stockpile, the number of contained metal ounces or pounds (based on assay data) and the estimated metallurgical recovery rates (based on the expected processing method). Costs are allocated to a stockpile based on relative values of material stockpiled and processed using current mining costs incurred up to the point of stockpiling the ore, including applicable overhead, depreciation, depletion and amortization relating to mining operations, and removed at each stockpile’s average cost per recoverable unit.
Finished goods inventory includes dorédoré and concentrates at our operations, dor??doréin transit to refiners and bullion in our accounts at refineries. Inventories are valued at the lower of full cost of production or net realizable value based on current metals prices.
F. Restricted Cash — Restricted cash and investments primarily represent investments in money market funds and bonds of U.S. government agencies and are restricted primarily for reclamation funding or surety bonds. Restricted cash balances are carried at fair value.
G. Properties, Plants and Equipment – Costs are capitalized when it has been determined an ore body can be economically developed as a result of establishing proven and probable reserves.developed. The development stage begins at new projects when our management and/or Board of Directors makes the decision to bring a mine into commercial production, and ends when the production stage, or exploitation of reserves, begins. Expenditures incurred during the development and production stages for new facilities or new assets or expenditures that extend the useful lives of existing facilities and major mine development expenditures are capitalized, including primary development costs such as costs of building access ways, shaft sinking, lateral development, drift development, ramps and infrastructure developments.
Costs for exploration, pre-development, secondary development at operating mines, and maintenance and repairs on capitalized property, plant and equipment are charged to operations as incurred. Exploration costs include those relating to activities carried out (a) in search of previously unidentified mineral deposits, (b) at undeveloped concessions, or (c) at operating mines already containing proven and probable reserves, where a determination remains pending as to whether new target deposits outside of the existing reserve areas can be economically developed. Pre-development activities involve costs incurred in the exploration stage that may ultimately benefit production, such as underground ramp development, which are expensed due to the lack of evidence of economic development, which is necessary to demonstrate future recoverability of these expenses. Secondary development costs are incurred for preparation of an ore body for production in a specific ore block, stope or work area, providing a relatively short-lived benefit only to the mine area they relate to, and not to the ore body as a whole.
Drilling and related costs are either classified as exploration or secondary development, as defined above, and charged to operations as incurred, or capitalized, based on the following criteria: • | Whether the costs are incurred to further define mineralization at and adjacent to existing reserve areas or intended to assist with mine planning within a reserve area; |
Whether the costs are incurred to further define mineralization at and adjacent to existing reserve areas or intended to assist with mine planning within a reserve area;
• | Whether the drilling costs relate to an ore body that has been determined to be commercially mineable, and a decision has been made to put the ore body into commercial production; and |
Whether the drilling costs relate to an ore body that has been determined to be commercially mineable, and a decision has been made to put the ore body into commercial production; and
• | Whether, at the time that the cost is incurred, the expenditure: (a) embodies a probable future benefit that involves a capacity, singly or in combination, with other assets to contribute directly or indirectly to future net cash inflows, (b) we can obtain the benefit and control others’ access to it, and (c) the transaction or event giving rise to our right to or control of the benefit has already occurred. |
Whether, at the time that the cost is incurred, the expenditure: (a) embodies a probable future benefit that involves a capacity, singly or in combination, with other assets to contribute directly or indirectly to future net cash inflows, (b) we can obtain the benefit and control others’ access to it, and (c) the transaction or event giving rise to our right to or control of the benefit has already occurred.
If all of these criteria are met, drilling and related costs are capitalized. Drilling costs not meeting all of these criteria are expensed as incurred. The following factors are considered in determining whether or not the criteria listed above have been met, and capitalization of drilling costs is appropriate: • | Completion of a favorable economic study and mine plan for the ore body targeted; |
Completion of a favorable economic study and mine plan for the ore body targeted;
• | Authorization of development of the ore body by management and/or the Board of Directors; and |
Authorization of development of the ore body by management and/or the Board of Directors; and
• | All permitting and/or contractual requirements necessary for us to have the right to or control of the future benefit from the targeted ore body have been met. |
All permitting and/or contractual requirements necessary for us to have the right to or control of the future benefit from the targeted ore body have been met.
Drilling and related costs of approximately $3.6$5.0 million, $3.6 million, and $1.6$3.6 million respectively, for the years ended December 31, 2012, 2011 and 2010, and 2009respectively, met our criteria for capitalization listed above, at our properties that are in the production stage.
When assets are retired or sold, the costs and related allowances for depreciation and amortization are eliminated from the accounts and any resulting gain or loss is reflected in current period net income (loss). Idle facilities placed on standby basis are carried at the lower of net carrying value or estimated net realizable value. The net carrying values of idle facilities on standby are written-down to salvage value upon reaching the end of the economic mine life and being placed on standby basis.life. Therefore, with the exception of depreciation recorded on mobile equipment used in ongoing exploration and reclamation efforts at such properties, we do not record depreciation on idle facilities when they are not in operation.
Included in property, plant and equipment on our consolidated financial statements are mineral interests, which are tangible assets that include acquired undeveloped mineral interests and royalty interests. Undeveloped mineral interests include: (i) other mineralized material and other resources which isare measured, indicated or inferred with insufficient drill spacing or quality to qualify as proven and probable reserves; and (ii) inferred material not immediately adjacent to existing proven and probable reserves but accessible within the immediate mine infrastructure. Residual values for undeveloped mineral interests represents the expected fair value of the interests at the time we plan to convert, develop, further explore or dispose of the interests and are evaluated at least annually. H. Depreciation, Depletion and Amortization — Capitalized costs are depreciated or depleted using the straight-line method or unit-of-production method at rates sufficient to depreciate such costs over the shorter of estimated productive lives of such facilities or the useful life of the individual assets. Productive lives range from 1 to 2226 years, but do not exceed the useful life of the individual asset. Determination of expected useful lives for amortization calculations are made on a property-by-property or asset-by-asset basis at least annually. Our estimates for mineral reserves, mineralized material, and other resources are a key component in determining our units of production depreciation rates. Our estimates of proven and probable ore reserves, mineralized material, and other resources may change, possibly in the near term, resulting in changes to depreciation, depletion and amortization rates in future reporting periods. Undeveloped mineral interests are not amortized until such time as they are converted tothere is proven and probable reserves. At that time, the basis of the mineral interest is amortized on a units-of-production basis. Pursuant to our policy on impairment of long-lived assets (discussed further below), if it is determined that an undeveloped mineral interest cannot be economically converted to proven and probable reserves, the basis of the mineral interest is reduced to its net realizable value and an impairment loss is recorded to expense in the period in which it is determined to be impaired.
I. Impairment of Long-lived Assets — Management reviews and evaluates the net carrying value of all facilities, including idle facilities, for impairment upon the occurrence of other events or changes in circumstances that indicate that the related carrying amounts may not be recoverable. We estimate the net realizable value of each property based on the estimated undiscounted future cash flows that will be generated from operations at each property, the estimated salvage value of the surface plant and equipment, and the value associated with property interests. Although management has made a reasonable estimate of factors based on current conditions and information, assumptions underlying future cash flows are subject to significant risks and uncertainties. Estimates of undiscounted future cash flows are dependent upon estimates of metals to be recovered from proven and probable ore reserves, and to some extent, identified resources beyond proven and probable reserves, future production and capital costs and estimated metals prices (considering current and historical prices, forward pricing curves and related factors) over the estimated remaining mine life. It is reasonably possible that changes could occur in the near term that could adversely affect our estimate of future cash flows to be generated from our operating properties. If undiscounted cash flows including an asset’s fair value are less than the carrying value of a property, an impairment loss is recognized. J. Proven and Probable Ore Reserves — At least annually, management reviews the reserves used to estimate the quantities and grades of ore at our mines which we believe can be recovered and sold economically. Management’s calculations of proven and probable ore reserves are based on engineering and geological estimates, including future metals prices and operating costs. From time to time, management obtains external audits of reserves. A partial third-party audit of our 2009 reserve model at the Lucky Friday unit was completed in January 2010, and a partial audit of 20092012 reserves at Greens Creek was concluded during 2010.2012. Reserve estimates will change as existing reserves are depleted through production and as production costs and/or metals prices change. A significant drop in metals prices may reduce reserves by making some portion of such ore uneconomic to develop and produce. Changes in reserves may also reflect that actual grades of ore processed may be different from stated reserve grades because of variation in grades in areas mined, mining dilution and other factors. Our reserve estimates may change based on actual production experience. It is reasonably possible that certain of our estimates of proven and probable ore reserves will change in the near term, which could result in a change to estimated future cash flows, associated carrying values of the asset and amortization rates in future reporting periods, among other things. Declines in the market prices of metals, increased production or capital costs, reduction in the grade or tonnage of the deposit or an increase in the dilution of the ore or reduced recovery rates may render ore reserves uneconomic to exploit. If our realized price for the metals we produce were to decline substantially below the levels set for calculation of reserves for an extended period, there could be material delays in the development of new projects, net losses, reduced cash flow, restatements or reductions in reserves and asset write-downs in the applicable accounting periods. Reserves should not be interpreted as assurances of mine life or of the profitability of current or future operations. No assurance can be given that the estimate of the amount of metal or the indicated level of recovery of these metals will be realized. K. Pension Plans and Other Post-retirement Benefits — We maintain pension plans covering substantially all U.S. employees and provide certain post-retirement benefits for qualifying retired employees. Pension benefits generally depend on length and level of service and age upon retirement. Substantially all benefits are paid through pension trusts. We contributed approximately $0.3 million related to our unfunded supplemental executive retirement plan duringin years 2012, 2011 and 2010, and expect to contribute $0.3 million related to this plan in 2012.2013. We did not contribute to our other pension plans during 2011, and 2010, and expect to contributebut contributed approximately $1.1 million to the Hecla pension plan in 2012.2012 and expect to contribute $1.0 million to our defined benefit plans in 2013.
Regulations regarding employers’ accounting for defined benefit pension and other post-retirement plans among other things, require us to: • | Recognize the funded status of our defined benefit plans in our consolidated financial statements; and |
• | Recognize as a component of other comprehensive income (loss) the actuarial gains and losses and prior service costs and credits that arise during the period but are not immediately recognized as components of net periodic benefit cost. |
Recognize the funded status of our defined benefit plans in our consolidated financial statements; and
Recognize as a component of other comprehensive income (loss) the actuarial gains and losses and prior service costs and credits that arise during the period but are not immediately recognized as components of net periodic benefit cost.
L. Income and Production Taxes — We provide for federal, state and foreign income taxes currently payable, as well as those deferred due to timing differences between reporting income and expenses for financial statement purposes versus tax purposes. Federal, state and foreign tax benefits are recorded as a reduction of income taxes, when applicable. We record deferred tax liabilities and assets for expected future tax consequences of temporary differences between the financial statement carrying amounts and the tax bases of those assets and liabilities, as well as operating loss and tax credit carryforwards, using enacted tax rates in effect in the years in which the differences are expected to reverse.
We evaluate uncertain tax positions in a two-step process, whereby (1)(i) it is determined whether it is more likely than not that the tax positions will be sustained based on the technical merits of the position and (2)(ii) for those tax positions that meet the more-likely-than-not recognition threshold, the largest amount of tax benefit that is greater than 50% likely of being realized upon ultimate settlement with the related tax authority would be recognized.
We classify mine license taxes incurred in the states of Alaska and Idaho as other direct production costs reported in our gross profits. Our costs for mine license taxes for the years ended December 31, 2012, December 31, 2011, and December 31, 2010 and December 31, 2009 were $5.7 million, $6.4 million, $9.6 million, and $5.3$9.6 million, respectively. Approximately 98% or more of the taxes accrued in all three periods were for the State of Alaska. For additional information, see Note 5 — Income Taxes. M. Reclamation and Remediation Costs (Asset Retirement Obligations) — At our operating properties, we record a liability for the present value of our estimated environmental remediation costs, and the related asset created with it, in the period in which the liability is incurred. The liability is accreted and the asset is depreciated over the life of the related assets. Adjustments for changes resulting from the passage of time and changes to either the timing or amount of the original present value estimate underlying the obligation are made in the period incurred. At our non-operating properties, we accrue costs associated with environmental remediation obligations when it is probable that such costs will be incurred and they are reasonably estimable. Accruals for estimated losses from environmental remediation obligations have historically been recognized no later than completion of the remedial feasibility study for such facility and are charged to current earnings to provision for closed operations and environmental matters. Costs of future expenditures for environmental remediation are not discounted to their present value unless subject to a contractually obligated fixed payment schedule. Such costs are based on management’s current estimate of amounts to be incurred when the remediation work is performed, within current laws and regulations. Future closure, reclamation and environmental-related expenditures are difficult to estimate in many circumstances, due to the early stage nature of investigations, and uncertainties associated with defining the nature and extent of environmental contamination, and the application of laws and regulations by regulatory authorities, and changes in reclamation or remediation technology. We periodically review accrued liabilities for such reclamation and remediation costs as evidence becomes available indicating that our liabilities have potentially changed. Changes in estimates at our non-operating properties are reflected in current period net income (loss). Accruals for closure costs, reclamation and environmental matters for operating and non-operating properties totaled $153.8$113.2 million at December 31, 2011,2012, and we anticipate that the majority of these expenditures relating to these accruals will be made over the next threetwo years. It is reasonably possible the ultimate cost of reclamation and remediation could change in the future, and that changes to these estimates could have a material effect on future operating results as new information becomes known. N. Revenue Recognition and Smelter Accounts Receivable — Sales of all metals products sold directly to smelters, including by-product metals, are recorded as revenues and accounts receivable when title and risk of loss transfer to the smelter (generally at the time of shipment) at estimated forward prices for the anticipated month of settlement. Due to the time elapsed from shipment to the smelter and the final settlement with the smelter, we must estimate the prices at which sales of our metals will be settled. Previously recorded sales and accounts receivable are adjusted to estimated settlement metals prices until final settlement by the smelter.
Sales and accounts receivable for concentrate shipments to smelters are recorded net of charges by the smelters for treatment, refining, smelting losses, and other charges negotiated by us with the smelters. Charges are estimated by us upon shipment of concentrates based on contractual terms, and actual charges do not vary materially from our estimates. Costs charged by smelters include fixed treatment and refining costs per ton of concentrate, and also include price escalators which allow the smelters to participate in the increase of lead and zinc prices above a negotiated baseline. Changes in metals prices between shipment and final settlement will result in adjustments to revenues and accounts receivable related to sales of concentrate previously recorded upon shipment. Our concentrate sales and accounts receivable are based on a provisional sales priceprices containing an embedded derivative that is required to be separated from the host contract for accounting purposes. The host contract is the receivable from the sale of the concentrates at the forward price at the time of the sale. The embedded derivative, which does not qualify for hedge accounting, is adjusted to market through earnings each period prior to final settlement.
At December 31, 2011,2012, metals contained in concentrates and exposed to future price changes totaled 1.20.8 million ounces of silver, 5,0083,912 ounces of gold, 11,29312,189 tons of zinc, and 3,4933,887 tons of lead. However, as discussed in P. Risk Management Contracts below, we began utilizingutilize a program in 2010 to mitigate the risk of negative price adjustments with limited mark-to-market financially settled forward contracts for our zinc and lead sales.
Sales of metals in products tolled by refiners and sold directly by us, rather than sold to smelters, are recorded at contractual amounts when title and risk of loss transfer to the buyer. We sell finished metals after refining, as well as doré produced at our locations. Sales from our Greens Creek and Lucky Friday units include significant value from by-product metals mined along with net values of each unit’s primary metal. We periodically review our proven and probable reserves to ensure that reporting of primary products and by-products is appropriate. Within our cost per ounce calculations, because we consider zinc, lead, and gold to be by-products of our silver production, the values of these metals offset operating costs. While value from zinc, lead, and gold is significant at Greens Creek, and value from lead and zinc is significant at Lucky Friday, we believe identification of silver as the primary product, with the other metals we produce as by-product credits, is appropriate because i)(i) silver has historically accounted for a higher proportion of revenue than any other metal and is expected to do so in the future, ii)(ii) our operations are situated in mining districts associated with silver production or have deposits containing unusually high portions of silver, iii)(iii) our operations generally utilize selective mining methods to target silver and metallurgical treatment that maximize silver recovery, and iv)(iv) we have historically presented our operations as primary producers of silver, based on the original analyses that justified putting them into production, and believe that consistency in disclosure is important to our investors regardless of the relationships of metals prices and production from year to year.
Sales of metals in products tolled by refiners and sold directly by us, rather than sold to smelters, are recorded at contractual amounts when title and risk of loss transfer to the buyer. We sell finished metals after refining, as well as doré produced at our locations.
Changes in the market price of metals significantly affect our revenues, profitability, and cash flow. Metals prices can and often do fluctuate widely and are affected by numerous factors beyond our control, such as political and economic conditions, demand, forward selling by producers, aggregation by metals speculators and others, expectations for inflation, central bank sales, custom smelter activities, the relative exchange rate of the U.S. dollar, purchases and lending, investor sentiment, and global mine production levels. The aggregate effect of these factors is impossible to predict. Because our revenue is derived from the sale of silver, gold, lead, and zinc, our earnings are directly related to the prices of these metals. O. Foreign Currency — The functional currency for our operations located in the U.S., Mexico and Canada was the U.S. dollar for all periods presented. Accordingly, for the San Sebastian unit in Mexico and our Canadian office, we have translated our monetary assets and liabilities at the period-end exchange rate, and non-monetary assets and liabilities at historical rates, with income and expenses translated at the average exchange rate for the current period. All translation gains and losses have been included in the current period net income (loss). For the years ended December 31, 2012, 2011 andDecember 31, 2010, we recognized total net foreign exchange losses of $0.1 million, $0.2 million and $37,000, respectively . For the year ended December 31, 2009, we recognized a total net foreign exchange gain of $0.1 million.respectively. P. Risk Management Contracts — We use derivative financial instruments as part of an overall risk-management strategy that is used as a means of managing exposure to base metals prices and interest rates. We do not hold or issue derivative financial instruments for speculative trading purposes. We measure derivative contracts as assets or liabilities based on their fair value. Gains or losses resulting from changes in the fair value of derivatives in each period are recorded either in current earnings or other comprehensive income (“OCI”), depending on the use of the derivative, whether it qualifies for hedge accounting and whether that hedge is effective. Amounts deferred in OCI are reclassified to sales of products (for metals price-related contracts) or interest expense (for interest rate-related contracts) when the hedged transaction has occurred. Ineffective portions of any change in fair value of a derivative are recorded in current period other operating income (expense). In the second quarter of 2010 we began utilizing two financially-settled forward contract programs to manage the exposure to changes in prices of zinc and lead contained in 1)(i) our concentrate shipments between the time of sale and final settlement and 2)(ii) our forecasted future concentrate shipments. The contracts under these programs do not qualify for hedge accounting, and are marked-to-market through earnings each period. See Note 10 for additional information on base metal derivative contracts, including open positions as of December 31, 2011.2012. In May 2008, we entered into an interest rate swap agreement that had the economic effect of modifying the LIBOR-based variable interest obligations associated with our term credit facility. In October 2009, we repaid the remaining outstanding balance on our term facility. As a result, we determined hedge accounting for the swap to be inappropriate as of September 30, 2009, and wrote-off the remaining $0.8 million accumulated unrealized loss and recorded a $38,000 mark-to-market adjustment for the fair value of the swap through interest expense in the third quarter of 2009. In October 2009, we paid $0.7 million to settle the remaining fair value liability associated with the swap. For additional information regarding our credit facilities and interest rate swap, see Note 6 and Note 10.
Q. Stock Based Compensation — The fair value of the equity instruments granted to employees are estimated on the date of grant using the Black-Scholes pricing model (see Note 9 for information on the methodologies and assumptions used). We recognized stock-based compensation expense of approximately $3.1 million, $2.1 million, $3.4 million, and $2.7$3.4 million, respectively, during 2012, 2011 2010 and 2009,2010, which was recorded to general and administrative expenses, exploration and cost of sales and other direct production costs. As of December 31, 2011,2012, the majority of the instruments outstanding were fully vested. For additional information on our employee stock option and unit compensation, see Note 9. R. Pre-Development Expense — Costs incurred in the exploration stage that may ultimately benefit production, such as underground ramp development, are expensed due to the lack of proven and probable reserves, which are necessary to demonstrate future recoverability of these expenses. S. Legal Costs – Legal costs incurred in connection with a potential loss contingency are accrued and recorded to expense as incurred.T.S. Basic and Diluted Income (Loss) Per Common Share — We calculate basic earnings per share on the basis of the weighted average number of common shares outstanding during the period. Diluted earnings per share is calculated using weighted average number of common shares outstanding during the period plus the effect of potential dilutive common shares during the period using the treasury stock and if-converted methods.Potential dilutive common shares include outstanding stock options, unvested restricted stock awards, stock units, warrants and convertible preferred stock for periods in which we have reported net income. For periods in which we reported net losses, potential dilutive common shares are excluded, as their conversion and exercise would be anti-dilutive. See Note 13 for additional information. U.T. Comprehensive Income (Loss) — In addition to net income (loss), comprehensive income (loss) includes certain changes in equity during a period, such as adjustments to minimum pension liabilities, adjustments to recognize the over-funded or underfunded status of our defined benefit pension plans, the effective portion of changes in fair value of derivative instruments that qualify for hedge accounting, and cumulative unrecognized changes in the fair value of available for sale investments, net of tax, if applicable.
V.U. Fair Value Measurements — We disclose the following information for each class of assets and liabilities that are measured at fair value:| | a. | the fair value measurement; |
| | b. | the level within the fair value hierarchy in which the fair value measurements in their entirety fall, segregating fair value measurements using quoted prices in active markets for identical assets or liabilities (Level 1), significant other observable inputs (Level 2), and significant unobservable inputs (Level 3); |
| | c. | for fair value measurements using significant unobservable inputs (Level 3), a reconciliation of the beginning and ending balances, separately presenting changes during the period attributable to the following: |
| | 1) (1) | total gains or losses for the period (realized and unrealized), segregating those gains or losses included in earnings, and a description of where those gains or losses included in earnings are reported in the statement of operations; |
| | 2)(2) | the amount of these gains or losses attributable to the change in unrealized gains or losses relating to those assets or liabilities still held at the reporting period date and a description of where those unrealized gains or losses are reported; |
| | 3)(3) | purchases, sales, issuances, and settlements (net); and |
| | 4)(4) | transfers into and/or out of Level 3. |
| | d. | Thethe amount of the total gains or losses for the period in (c)(1) included in earnings that are attributable to the change in unrealized gains or losses relating to those assets and liabilities still held at the reporting date and a description of where those unrealized gains or losses are reported in the statement of operations; and |
| | e. | Inin annual periods only, the valuation technique(s) used to measure fair value and a discussion of changes in valuation techniques, if any, during the period. |
W.V. New Accounting Pronouncements — In June 2011, the Financial Accounting Standards Board ("FASB") issued Accounting Standards Update ("ASU") 2011-05, which, among other things, amended Subtopic 220 with respect to the presentation of other comprehensive income and its components in the financial statements. The update amended Subtopic 220 so that a Securities and Exchange CommissionSEC filer may present other comprehensive income either in a single continuous statement or in two separate but consecutive statements. The filer is also required to present on the face of the financial statements reclassification adjustments for items that are reclassified from other comprehensive income to net income in the statements where the components of net income and the components of other comprehensive income are presented. The amendments in this update apply to both annual and interim periods beginning after December 15, 2011, with the exception of the amendment regarding presentation of reclassification adjustments, which has been deferred to a later date. Adoption of this update isguidance did not anticipated to have a material impact on our consolidated financial statements.
In May 2011, the FASB issued ASU 2011-04, which amends Subtopic 820 to clarify the application of existing common fair value measurement and disclosure requirements. ASU 2011-04 provides clarification for the following:
1.the application of the highest and best use of valuation premise concepts;
2. measuring the fair value of an instrument classified in shareholders' equity; and
3. disclosures about fair value measurements.
In January 2010, the FASB issued ASU 2010-06, which amends Subtopic 820-10 to require new disclosures on fair value measurements as follows:
1.The amounts of and reasons for significant transfers in and out of Levels 1 and 2.
F-12
2. Separate information about purchases, sales, issuances, and settlements in Level 3 fair value measurements.
ASU 2010-06 also provides amendments to Subtopic 820-10 that clarify existing fair value measurement disclosures as follows:
1. A reporting entity should provide fair value measurement disclosures for each class of assets and liabilities. A class is often a subset of assets or liabilities within a line item in the statement of financial position.
2. A reporting entity should provide disclosures about the valuation techniques and inputs used to measure fair value for both recurring and nonrecurring fair value measurements. Those disclosures are required for fair value measurements that fallThe amendments in either Level 2 or Level 3.
ASU 2010-06 also includes conforming amendments to the guidance on employers’ disclosures about post-retirement benefit plan assets (Subtopic 715-20), changes the terminology in Subtopic 715-20 from major categories of assets to classes of assets, and provides a cross reference to the guidance in Subtopic 820-10 on how to determine appropriate classes to present fair value disclosures.The new disclosures and clarifications of existing disclosures discussed above arethis update became effective for interim and annual periods beginning after December 15, 2011, except for the disclosures about fair value measurements. Those disclosures are effective for fiscal years beginning after December 31, 2010.2011. Adoption of this guidance has not, and is not expected to have a material impact on our consolidated financial statements.During February 2010, the FASB issued ASU 2010-08, which corrected existing guidance for various topics. The update became generally effective for the first reporting period (including interim periods) beginning after issuance. These conditions did not have a material impact on our consolidated financial statements.
In December of 2011, the FASB issued ASU 2011-11, Disclosures about Offsetting Assets and Liabilities, which enhances disclosure requirements regarding an entity's financial instruments and derivative instruments that are offset or subject to a master netting arrangement. This information about offsetting and related netting arrangements will enable users of financial statements to understand the effect of those arrangements on the entity's financial position, including the effect of rights of setoff. The amendments are required for annual reporting periods beginning after January 1, 2013, and interim periods within those annual periods. We are evaluating the impact of this guidance, but do not anticipate it will have a material impact on our consolidated financial statements. Note 2. Cash, Investments, and Restricted Cash
Our cash is maintained in various financial institutions, with a large majority of our cash balances at December 31, 20112012 invested in either U.S. government paper (treasury or agency) or U.S. government or treasury money market funds which are not insured by the Federal Deposit Insurance Corporation (“FDIC”). A small portion of our cash balances are held in bank accounts insured by the FDIC for either unlimited amounts (for non-interest-bearing accounts) or up to $250,000 per institution (for interest-bearing accounts). Some of these balancesOn December 31, 2012, the unlimited insurance coverage for noninterest-bearing accounts provided under the Dodd-Frank Wall Street Reform and Consumer Protection Act expired. Deposits that were in interest-bearingpreviously insured for unlimited amounts are now aggregated with our interest bearing accounts and exceeded the $250,000 federally insured limit applicable for those institutions.up to $250,000. We have not experienced losses on cash balances exceeding the federally insured limits, but there can be no assurance that we will not experience such losses in the future.
Investments
Investments
No current investments were held at December 31, 2011. At December 31, 2010, the fair value of our current investments was $1.5 million, with a cost basis of approximately $0.8 million. This investment was sold in February2012 and 2011, for proceeds of $1.4 million, resulting in a pre-tax gain of approximately $0.6 million.At December 31, 2011 and 2010, the fair value of our non-current investments was $3.9$9.6 million and $1.2$3.9 million, respectively. Marketable equity securities are carried at fair market value, as they are classified as “available-for-sale.” The basis of our non-current investments, representing equity securities, was approximately $3.5$8.1 million and $0.2$3.5 million, respectively, at December 31, 20112012 and 2010.2011. During the fourth quarterquarters of 2012 and 2011, we recognized a$1.2 million and $0.1 million losslosses, respectively, in current earnings on impairmentimpairments of equity shares, as we determined the impairmentimpairments to be other-than-temporary.In January 20102012, we acquired common stock in other mining companies for a total cost of $5.8 million. In February 2011 we sold stock having a cost basis of approximately $0.6$0.8 million for proceeds of $1.1$1.4 million, resulting in a pre-tax gain of approximately $0.5$0.6 million. At December 31, 2011,2012, total unrealized gains of $0.4$1.6 million for investments held having a net gain position and total unrealized losses of $47 thousand$137,000 for non-current investments held having a net loss position were included in accumulated other comprehensive income (loss). Restricted Cash and Investments Various laws and permits require that financial assurances be in place for certain environmental and reclamation obligations and other potential liabilities. Restricted investments primarily represent investments in money market funds and certificates of deposit. These investments (which included current and non-current balances) are restricted primarily for reclamation funding or surety bonds and were $0.9 million at December 31, 2011,2012, and $10.3$0.9 million at December 31, 2010.2011.
Note 3: Properties, Plants, Equipment and Mineral Interests, and Lease Commitments Properties, Plants, Equipment and Mineral Interests Our major components of properties, plants, equipment, and mineral interests are (in thousands): | | | December 31, | |
| | | 2011 | | | 2010 | |
| Mining properties, including asset retirement obligations | | $ | 286,873 | | | $ | 276,869 | |
| Development costs | | | 123,772 | | | | 114,071 | |
| Plants and equipment | | | 383,045 | | | | 351,146 | |
| Land | | | 11,188 | | | | 10,301 | |
| Mineral interests | | | 383,491 | | | | 358,857 | |
| Construction in progress | | | 125,045 | | | | 65,346 | |
| | | | 1,313,414 | | | | 1,176,590 | |
| Less accumulated depreciation, depletion and amortization | | | 390,202 | | | | 343,302 | |
| Net carrying value | | $ | 923,212 | | | $ | 833,288 | |
| | | December 31, | |
| | | 2012 | | | 2011 | |
| Mining properties, including asset retirement obligations | | $ | 294,573 | | | $ | 286,873 | |
| Development costs | | | 151,504 | | | | 123,772 | |
| Plants and equipment | | | 419,377 | | | | 383,045 | |
| Land | | | 15,788 | | | | 11,188 | |
| Mineral interests | | | 375,028 | | | | 383,491 | |
| Construction in progress | | | 176,925 | | | | 125,045 | |
| | | | 1,433,195 | | | | 1,313,414 | |
| Less accumulated depreciation, depletion and amortization | | | 436,536 | | | | 390,202 | |
| Net carrying value | | $ | 996,659 | | | $ | 923,212 | |
During 2011,2012, we incurred total capital expenditures, excluding additions acquired under capital leases and adjustments to asset retirement obligations, of approximately $130.1$116.8 million, which included $58.1$54.7 million at the Lucky Friday unit, $36.8and $50.4 million at the Greens Creek unit, andunit. During 2011 we had capital expenditures of $33.8 million forrelated to the acquisition of the remaining 30% interest in the San Juan Silver project (see Note 16 for more information) .
Capital Leases
During 20112012 and 20102011 we entered into lease agreements for equipment at our Greens Creek and Lucky Friday units which we have determined to be capital leases. As of December 31, 20112012 and 2010,2011, we have recorded $15.8$28.9 million and $8.9$15.8 million, respectively, for the gross amount of assets acquired under the capital leases and $5.7$5.3 million and $3.1$5.7 million, respectively, in accumulated depreciation, classified as plants and equipment in Properties, plants, equipment and mineral interests. See Note 6 for information on future obligations related to our capital leases.
Operating Leases
We enter into operating leases during the normal course of business. During the years ended December 31, 2012, 2011 2010 and 2009,2010, we incurred expenses of $3.0$3.1 million, $3.0 million and $2.4$3.0 million, respectively, for these leases. At December 31, 2011,2012, future obligations under our non-cancelable operating leases were as follows (in thousands): | | | |
| 2012 | | $ | 2,691 | |
| 2013 | | | 2,082 | |
| 2014 | | | 2,076 | |
| 2015 | | | 374 | |
| 2016 | | | 347 | |
| Thereafter | | | 1,010 | |
| Total | | $ | 8,580 | |
| | Year ending December 31, | | | | |
| | 2013 | | $ | 3,087 | | |
| | 2014 | | | 3,114 | | |
| | 2015 | | | 1,434 | | |
| | 2016 | | | 1,438 | | |
| | 2017 | | | 1,056 | | |
| | Thereafter | | | 3,848 | | |
| | Total | | $ | 13,977 | | |
Note 4: Environmental and Reclamation Activities
The liabilities accrued for our reclamation and closure costs at December 31, 20112012 and 2010,2011, were as follows (in thousands): | | | 2011 | | | 2010 | | 2012 | | 2011 |
| Operating properties: | | | | | | | | | |
| Greens Creek | | $ | 36,123 | | | $ | 35,267 | | | $ | 32,856 | | | $ | 36,123 | |
| Lucky Friday | | | 1,520 | | | | 1,130 | | | | 1,469 | | | | 1,520 | |
| Non-operating properties: | | | | | | | | | | | | | |
| San Sebastian | | | 218 | | | | 218 | | | | 200 | | | | 218 | |
| Grouse Creek | | | 13,262 | | | | 13,651 | | | | 2,484 | | | | 13,262 | |
| Coeur d’Alene Basin | | | 95,081 | | | | 262,153 | | | | 70,786 | | | | 95,081 | |
| Republic | | | 3,538 | | | | 3,800 | | | | 3,538 | | | | 3,538 | |
| All other sites | | | 4,069 | | | | 2,578 | | | | 1,882 | | | | 4,069 | |
| Total | | | 153,811 | | | | 318,797 | | | | 113,215 | | | | 153,811 | |
| Reclamation and closure costs, current | | | (42,248 | ) | | | (175,484 | ) | | | (19,845 | ) | | | (42,248 | ) |
| Reclamation and closure costs, long-term | | $ | 111,563 | | | $ | 143,313 | | | $ | 93,370 | | | $ | 111,563 | |
The activity in our accrued reclamation and closure cost liability for the years ended December 31, 2012, 2011 2010 and 2009,2010, was as follows (in thousands): Balance at January 1, 2009 | | $ | 121,347 | |
| Accruals for estimated costs | | | 5,980 | |
| Revision of estimated cash flows due to changes in reclamation plans | | | 3,347 | |
| Receipt of settlement payment for shared reclamation costs incurred | | | 3,150 | |
| Payment of reclamation obligations | | | (2,623 | ) |
| Balance at December 31, 2009 | | | 131,201 | |
| Accruals for estimated costs | | | 196,067 | |
| Payment of reclamation obligations | | | (8,471 | ) |
| Balance at December 31, 2010 | | | 318,797 | |
| Accruals for estimated costs | | | 7,869 | |
| Payment of reclamation obligations | | | (172,855 | ) |
| Balance at December 31, 2011 | | $ | 153,811 | |
| Balance at January 1, 2010 | | $ | 131,201 | |
| Accruals for estimated costs | | | 196,067 | |
| Payment of reclamation obligations | | | (8,471 | ) |
| Balance at December 31, 2010 | | | 318,797 | |
| Accruals for estimated costs | | | 7,869 | |
| Payment of reclamation obligations | | | (172,855 | ) |
| Balance at December 31, 2011 | | | 153,811 | |
| Accruals for estimated costs | | | 4,325 | |
| Revision of estimated cash flows due to changes in reclamation plans | | | (3,738 | ) |
| Payment of reclamation obligations | | | (41,183 | ) |
| Balance at December 31, 2012 | | $ | 113,215 | |
During the fourth quarter of 2010, we recorded an additional $193.2 million provision for remediation of the Coeur d'Alene Basin based on an understanding reached among the United States, the Coeur d’Alene Indian Tribe (“Plaintiffs”), and the State of Idaho, bringing our accrual to $262.2 million as of December 31, 2010. On September 8, 2011, a Consent Decree (the “Consent Decree”) settling environmental litigation and related claims involving Hecla Limited pertaining to historic releases of mining wastes in the Coeur d'Alene Basin was approved and entered by the U.S. District Court in Idaho. The Consent Decree resolved all existing claims of the Plaintiffs against Hecla Limited and its affiliates under the Comprehensive Environmental Response, Compensation and Liability Act of 1980 (“CERCLA”) (and certain other statutes) for past response costs, future environmental remediation costs, and natural resource damages related to historic releases of mining wastes in the Coeur d'Alene River Basin. The Consent Decree also resolved all remaining obligations of Hecla Limited under the 1994 Consent Decree relating to the “Box,” a rectangular 21-square-mile site located near Kellogg, Idaho within the Bunker Hill Superfund site. The Consent Decree contains comprehensive terms of settlement, including financial terms which require that Hecla Limited pay, in the aggregate, $264.4 million to the Plaintiffs over approximately three years. In early October 2011, Hecla Limited made payments totalingyears following the settlement. Payments of approximately $168 million and $25 million (and related interest) were made in October 2011 and 2012, respectively, pursuant to the Plaintiffs,terms of the Consent Decree. Hecla Limited remains obligated under the Consent Decree to make the following payments:
$15 million of cash by October 8, 2013; and delivered surety bonds providing security for
Approximately $55.5 million by August 2014, in the form of quarterly payments of the proceeds from the exercise of any outstanding Series 1 and Series 3 warrants (which have an exercise price of between $2.41 and $2.52 per share) during the quarter, with the remaining $96.4 millionbalance, if any, due overin August 2014, regardless of whether any of the next three years. Subsequently,remaining warrants are exercised.
The payments require third party surety for which Hecla Limited
pays an annual maintenance fee which will decrease as payments are made according to the foregoing schedule. Annual maintenance fees of $0.6 million and $0.4 million were paid
an additional approximately $1million, leaving its remainingin October 2011 and 2012, respectively. The $15 million payment
obligationsaccrues interest from the entry of the Consent Decree until payment at
$95.4 million. See the
Settlement of Bunker Hill Superfund Site Claims section of Note 7 for more information.rate (ranging from 0.69% to 0.78%). In March 2010, Hecla Limited received an invoice for $5.3 million from the EPA to cover response costs incurred by the EPA in performing work required by the Bunker Hill Superfund Site Consent Decree. Prior to this invoice, Hecla Limited determined its potential range of liability for these costs of between $2.7 and $6.8 million, and accrued $2.7 million (the minimum of this range), as we believed no amount within the range was more likely than any other. Upon receiving the EPA’s March invoice, Hecla Limited increased its accrual to $5.3 million in the first quarter of 2010, and resolved the claim with payment of the invoice amount in May 2010. See the Settlement of Bunker Hill Superfund Site Claims of Note 7, for more information. In December 2009 Hecla Limited received $3.3 million plus interest for settlement of a claim by us against ASARCO through their bankruptcy proceeding. The claim was for costs incurred by us for ASARCO’s share of such costs under cost sharing agreements relating to the Bunker Hill Superfund site. Prior to receipt of the claim settlement, our accrued reclamation and closure cost liability was recorded net of approximately $3.2 million of the ASARCO claim amount. Therefore, receipt of the claim settlement resulted in a $3.2 million increase to our accrued reclamation and closure liability balance, with the remaining $0.1 million recorded as a decrease to accounts receivable.
Asset Retirement Obligations
Below is a reconciliation as of December 31, 20112012 and 20102011 (in thousands), of the asset retirement obligations relating to our operating properties, which are included in our total accrued reclamation and closure costs of $153.8$113.2 million and $318.8$153.8 million, respectively, discussed above. The estimated reclamation and abandonment costs were discounted using credit adjusted, risk-free interest rates ranging from 6% to 7%8% from the time we incurred the obligation to the time we expect to pay the retirement obligation.
| | | 2012 | | | 2011 | |
| Balance January 1 | | $ | 37,643 | | | $ | 36,397 | |
| Changes in obligations due to changes in reclamation plans | | | (3,720 | ) | | | 387 | |
| Accretion expense | | | 1,128 | | | | 1,119 | |
| Payment of reclamation obligations | | | (726 | ) | | | (260 | ) |
| Balance at December 31 | | $ | 34,325 | | | $ | 37,643 | |
The ARO for our Greens Creek mine of $36.1 million as of December 31, 2011 reflected a plan for reclamation and closure of the mine at the end of its life having estimated undiscounted costs of approximately $53.4 million. In April 2012, the United States Forest Service issued a draft Environmental Impact Statement in connection with our proposal to increase tailings capacity at the Greens Creek mine. As part of that process and our regular (every 5 years) renewal of our Waste Management Permit with the State of Alaska, we have initiated work on an update of our reclamation and closure plan having estimated undiscounted closure costs of approximately $73.9 million. The expected increase in closure costs results primarily from the possible inclusion of long term water treatment on an increased scale compared to what was included as part of our prior permit renewals. This increase in scale is the result of new interpretations of model data by the State that were not included in our prior permit renewals. Although the revised closure plan is not final, we believe that we had sufficient information to make a reasonable estimate of the change in the fair value of the ARO as of December 31, 2012. In spite of the anticipated increase in undiscounted costs discussed above, the ARO liability for Greens Creek was reduced by $4.4 million to a balance of $32.9 million as of December 31, 2012, on a discounted basis, as a result of the update in the fourth quarter of 2012. The ARO decrease is the result of (i) a large portion of the anticipated increase in overall undiscounted costs being related to long-term water treatment, which is scheduled to take place in years far out into the future, (ii) the effect of discounting the ARO layers associated with various plan updates using different discount rates, and (iii) a delay in the timing of some of the costs included in the previous reclamation and closure plan. We expect to again update our ARO and revise our closure plan in 2013 for tailings capacity expansion at Greens Creek. Adjustments to the ARO liability are recorded with corresponding increases to the ARO asset balance, which is included in properties, plants, equipment, and mineral interests, net on our Consolidated Balance Sheets. As a result, we do not anticipate future updates in the ARO for Greens Creek to have a material impact on our annual results of operations. However, as part of the revised closure plan, we may be required to increase our current $30 million reclamation bond for Greens Creek. Although we do not know the amount of such increase, it likely will be a material amount, and there can be no assurance that this bonding capacity will be available to us at that time. | | | 2011 | | | 2010 | |
| Balance January 1 | | $ | 36,397 | | | $ | 36,364 | |
| Changes in obligations due to changes in reclamation plans | | | 387 | | | | — | |
| Accretion expense | | | 1,119 | | | | 627 | |
| Payment of reclamation obligations | | | (260 | ) | | | (594 | ) |
| Balance at December 31 | | $ | 37,643 | | | $ | 36,397 | |
Major components of our income tax provision (benefit) for the years ended December 31, 2012, 2011 2010 and 20092010 are as follows (in thousands): | | | 2011 | | | 2010 | | | 2009 | |
| Current: | | | | | | | | | |
| Federal | | $ | 3,823 | | | $ | 10,063 | | | $ | (1,277 | ) |
| State | | | 752 | | | | 6,694 | | | | 33 | |
| Foreign | | | 459 | | | | 459 | | | | 664 | |
| Total current income tax provision | | | 5,034 | | | | 17,216 | | | | (580 | ) |
| Federal and state deferred income tax (benefit) provision | | | 76,944 | | | | (140,748 | ) | | | (7,100 | ) |
| Total income tax (benefit) provision | | $ | 81,978 | | | $ | (123,532 | ) | | $ | (7,680 | ) |
| | | 2012 | | | 2011 | | | 2010 | |
| Current: | | | | | | | | | |
| Federal | | $ | 7,411 | | | $ | 3,823 | | | $ | 10,063 | |
| State | | | (325 | ) | | | 752 | | | | 6,694 | |
| Foreign | | | 459 | | | | 459 | | | | 459 | |
| Total current income tax provision | | | 7,545 | | | | 5,034 | | | | 17,216 | |
| Federal and state deferred income tax (benefit) provision | | | 1,334 | | | | 76,944 | | | | (140,748 | ) |
| Total income tax (benefit) provision | | $ | 8,879 | | | $ | 81,978 | | | $ | (123,532 | ) |
Domestic and foreign components of income (loss) from operations before income taxes for the years ended December 31, 2012, 2011 2010 and 2009,2010, are as follows (in thousands):
| | | 2011 | | | 2010 | | | 2009 | |
| Domestic | | $ | 244,833 | | | $ | (66,348 | ) | | $ | 59,779 | |
| Foreign | | | (11,691 | ) | | | (8,201 | ) | | | 367 | |
| Total | | $ | 233,142 | | | $ | (74,549 | ) | | $ | 60,146 | |
| | | 2012 | | | 2011 | | | 2010 | |
| Domestic | | $ | 37,025 | | | $ | 244,833 | | | $ | (66,348 | ) |
| Foreign | | | (13,192 | ) | | | (11,691 | ) | | | (8,201 | ) |
| Total | | $ | 23,833 | | | $ | 233,142 | | | $ | (74,549 | ) |
The annual tax provision (benefit) is different from the amount that would be provided by applying the statutory federal income tax rate to our pretax income (loss). The reasons for the difference are (in thousands):
| | | 2011 | | | 2010 | | | 2009 | | | 2012 | | | 2011 | | | 2010 | |
| Computed “statutory” (benefit) provision | | $ | 81,600 | | | | 35 | % | | $ | (26,092 | ) | | | (35 | )% | | $ | 21,051 | | | | 35 | % | | $ | 8,342 | | | | 35 | % | | $ | 81,600 | | | | 35 | % | | $ | (26,092 | ) | | | (35 | )% |
| Percentage depletion | | | (13,751 | ) | | | (6 | ) | | | (8,858 | ) | | | (12 | ) | | | (7,953 | ) | | | (16 | ) | | | (5,575 | ) | | | (24 | ) | | | (13,751 | ) | | | (6 | ) | | | (8,858 | ) | | | (12 | ) |
| Net increase (utilization) of U.S. and foreign tax loss carryforwards | | | 3,822 | | | | 2 | | | | 2,713 | | | | 3 | | | | (13,098 | ) | | | (19 | ) | | | 3,837 | | | | 16 | | | | 3,822 | | | | 2 | | | | 2,713 | | | | 3 | |
| Change in valuation allowance other than utilization | | | — | | | | — | | | | (88,069 | ) | | | (118 | ) | | | (7,100 | ) | | | (12 | ) | | | — | | | | — | | | | — | | | | — | | | | (88,069 | ) | | | (118 | ) |
| Tax loss carryback from change in tax law | | | — | | | | — | | | | — | | | | — | | | | (1,989 | ) | | | (3 | ) | |
| State taxes, net of federal taxes | | | 10,890 | | | | 5 | | | | (4,717 | ) | | | (6 | ) | | | 33 | | | | — | | | | 1,110 | | | | 5 | | | | 10,890 | | | | 5 | | | | (4,717 | ) | | | (6 | ) |
| Effect of U.S. AMT, foreign taxes other | | | (583 | ) | | | (1 | ) | | | 1,491 | | | | 2 | | | | 1,376 | | | | 2 | | | | 1,165 | | | | 5 | | | | (583 | ) | | | (1 | ) | | | 1,491 | | | | 2 | |
| | | $ | 81,978 | | | | 35 | % | | $ | (123,532 | ) | | | (166 | )% | | $ | (7,680 | ) | | | (13 | )% | | $ | 8,879 | | | | 37 | % | | $ | 81,978 | | | | 35 | | | $ | (123,532 | ) | | | (13 | )% |
We evaluated the positive and negative evidence available to determine the amount of valuation allowance required on our deferred tax assets. At December 31, 20112012 and 2010,2011, the balances of our valuation allowances were $23 million, and $19 million, respectively, primarily for foreign net operating loss carryforwards. For the year ended December 31, 2011, the U.S. federal and state2012, deferred tax assets were reduced byremained constant, on a net basis, with utilization matching additions. The individual components of approximately $71 million.our net deferred tax assets are reflected in the table below. For the year ended December 31, 2010,2011, the U.S. federal and state deferred tax assets for tax loss carryforwards were reduced by utilization from current taxable income of approximately $77$71 million. Also, during the fourth quarter of 2010, due to increased gross profits and a favorable outlook for metal prices supporting future taxable income and our assessment that our deferred tax assets were more likely than not recoverable, we recorded a reduction in valuation allowance on U.S. deferred assets of $88 million. The amount of the deferred tax asset considered recoverable, however, could be reduced in the near term if estimates of future taxable income are reduced. The valuation allowance on losses in foreign jurisdictions and foreign tax credits increased by $3.7 million in 2011.
The components of the net deferred tax asset were as follows (in thousands):
| | | December 31, | | December 31, | |
| | | 2011 | | 2010 | | 2012 | | | 2011 | |
| Deferred tax assets: | | | | | | | | | | |
| Accrued reclamation costs | | $ | 62,225 | | | $ | 129,687 | | | $ | 45,653 | | | $ | 62,225 | |
| Deferred exploration | | | 18,585 | | | | 14,596 | | | | 32,396 | | | | 18,585 | |
| Foreign net operating losses | | | 20,234 | | | | 16,850 | | | | 20,247 | | | | 20,234 | |
| Federal net operating losses | | | 47,875 | | | | 36,744 | | | | 44,146 | | | | 47,875 | |
| State net operating losses | | | 2,445 | | | | 924 | | | | 668 | | | | 2,445 | |
| AMT credit carryforwards | | | 15,210 | | | | 10,879 | | | | 24,603 | | | | 15,210 | |
| Unrealized loss on derivatives contracts | | | — | | | | 8,459 | | |
| Pension and benefit obligation | | | 9,940 | | | | 3,198 | | | | 12,488 | | | | 9,940 | |
| Miscellaneous | | | 16,002 | | | | 14,132 | | | | 17,437 | | | | 16,002 | |
| Total deferred tax assets | | | 192,516 | | | | 235,469 | | | | 197,638 | | | | 192,516 | |
| Valuation allowance | | | (22,895 | ) | | | (19,073 | ) | | | (23,030 | ) | | | (22,895 | ) |
| Total deferred tax assets | | | 169,621 | | | | 216,396 | | | | 174,608 | | | | 169,621 | |
| Deferred tax liabilities: | | | | | | | | | | | | | | |
| Unrealized gain on derivatives contracts | | | (13,293 | ) | | | — | | | | (1,262 | ) | | | (13,293 | ) |
| Properties, plants and equipment | | | (40,490 | ) | | | (29,037 | ) | | | (57,583 | ) | | | (40,490 | ) |
| Total deferred tax liabilities | | | (53,783 | ) | | | (29,037 | ) | | | (58,845 | ) | | | (53,783 | ) |
| Net deferred tax asset | | $ | 115,838 | | | $ | 187,359 | | | $ | 115,763 | | | $ | 115,838 | |
We plan to permanently reinvest earnings from foreign subsidiaries. For the years 2012, 2011 2010 and 20092010, we had no unremitted foreign earnings. Foreign net operating losses carried forward are shown above as a deferred tax asset, with a corresponding valuation allowance as discussed below.
We recorded a valuation allowance to reflect the estimated amount of deferred tax assets, which may not be realized principally due to the expiration of foreign net operating losses and foreign tax credit carryforwards. The changes in the valuation allowance for the years ended December 31, 2012, 2011 2010 and 2009,2010, are as follows (in thousands): | | | 2011 | | | 2010 | | | 2009 | |
| Balance at beginning of year | | $ | (19,073 | ) | | $ | (104,429 | ) | | $ | (138,848 | ) |
| Increase related to non-utilization of net operating loss carryforwards and non-recognition of deferred tax assets due to uncertainty of recovery | | | (3,822 | ) | | | (2,713 | ) | | | — | |
| Decrease related to net recognition of deferred tax assets | | | — | | | | 88,069 | | | | 7,100 | |
| Decrease related to utilization and expiration of deferred tax assets | | | — | | | | — | | | | 27,319 | |
| Balance at end of year | | $ | (22,895 | ) | | $ | (19,073 | ) | | $ | (104,429 | ) |
| | | | 2012 | | | | 2011 | | | | 2010 | |
| Balance at beginning of year | | $ | (22,895 | ) | | $ | (19,073 | ) | | $ | (104,429 | ) |
| Increase related to non-utilization of net operating loss carryforwards and non-recognition of deferred tax assets due to uncertainty of recovery | | | (3,837 | ) | | | (3,822 | ) | | | (2,713 | ) |
| Decrease related to net recognition of deferred tax assets | | | — | | | | — | | | | 88,069 | |
| Decrease related to utilization and expiration of deferred tax assets, other | | | 3,702 | | | | — | | | | — | |
| Balance at end of year | | $ | (23,030 | ) | | $ | (22,895 | ) | | $ | (19,073 | ) |
As of December 31, 2011,2012, for U.S. income tax purposes, we have federal and state net operating loss carryforwards of $137$146 million and $54$25 million, respectively. These net operating loss carryforwards have a 20 year expiration period, the earliest of which could expire in 2020. We have foreign net operating loss carryforwards of approximately $68 million, which expire between 20112013 and 2031.2032. We have approximately $15$25 million in alternative minimum tax credit carryforwards which do not expire and are eligible to reduce future U.S. tax liabilities. Our utilization of U.S. net operating loss carryforwards may be subject to annual limitations if there is a change in control as defined under Internal Revenue Code Section 382.
In addition, at December 31, 20112012 and 20102011 we had $20$19 million and $19$20 million, respectively, of additional federal net operating loss carryovers relating to excess tax benefits from the exercise of employee stock options and the vesting of restricted stock awards. These amounts are not reflected in our deferred tax asset for net operating loss carryovers. We recognize the excess tax benefits from the exercise of employee stock options and the vesting of restricted stock awards in the period in which these tax benefits reduce income taxes payable, after net operating loss carryforwards are fully utilized. The Company and/or its subsidiariesWe file income tax returns in the U.S. federal jurisdiction, various state and foreign jurisdictions. We are no longer subject to income tax examinations by U.S. federal and state tax authorities for years prior to 1996, or examinations by foreign tax authorities for years prior to 2005.2006. We currently have no tax years under examination.The CompanyWe had no unrecognized tax benefits as of December 31, 2011or 2012 or December 31, 2010, and there was no change in unrecognized tax benefits during the current year.2011. Due to the net operating loss carryover provision, coupled with the lack of any unrecognized tax benefits, the Company haswe have not provided for any interest or penalties associated with any uncertain tax positions. If interest and penalties were to be assessed, our policy is to charge interest to interest expense, and penalties to other operating expense. It is not anticipated that there will be any significant changes to unrecognized tax benefits within the next 12 months.
At December 31, 2011, we recorded a net receivable for federal and state income taxes of approximately $8.0 million, which is included in Accounts receivable: Other, net on our consolidated balance sheets.Note 6: Credit Facilities and Capital Leases On April 16, 2008, our existing revolving credit agreement was amended and restated in connection with our acquisition of the companies owning 70.3% of the joint venture operating the Greens Creek mine. The amended and restated agreement involved a $380 million facility, consisting of a $140 million three-year term facility originally maturing on March 31, 2011, which was fully drawn upon closing of the Greens Creek transaction, and a $240 million bridge facility, which originally was scheduled to mature in October 2008. We utilized $220 million from the bridge facility at the time of closing the Greens Creek transaction, and used the remaining $20 million balance for general corporate purposes in September 2008.The first term facility principal payment of $18.3 million was paid on September 30, 2008. We applied $162.9 million in proceeds from the public offering of 34.4 million shares of our common stock against the bridge loan principal balance during the third quarter of 2008. On October 16, 2008, we repaid an additional $37.1 million of the bridge facility balance and reached an agreement with our bank syndicate to extend the remaining $40 million outstanding bridge facility balance until February 16, 2009. In December 2008, we reached an agreement with the bank syndicate to move the $18.3 million term facility principal payment originally scheduled for December 31, 2008 to February 13, 2009, and repayment of the $40 million bridge facility balance was due on February 13, 2009 as a result of the amendment. On February 3, 2009, we again amended the terms of the credit agreement to defer all scheduled term facility principal payments due in 2009, totaling $66.7 million, to 2010 and 2011.On February 4, 2009, we entered into an agreement to sell 32 million units comprised of one share of common stock and one-half Series 3 Warrant to purchase one share of common stock in an underwritten public offering for proceeds of approximately $65.6 million. On February 6, 2009, the underwriters exercised their over-allotment option in connection with the original offering, resulting in the issuance and sale of 4.8 million additional units for additional proceeds of approximately $9.8 million. We applied $40 million of the total proceeds to the retirement of our outstanding bridge loan facility balance on February 10, 2009. In accordance with the credit facilities, we also reduced our term loan by approximately $8 million in February 2009.
On June 4, 2009, we completed the sale in a private placement of 17.4 million shares of our common stock and Series 4 Warrants to purchase 12.2 million shares of our common stock for gross proceeds of $60 million (see Note 9 for more information). $57.2 million of the proceeds were applied against the outstanding term facility balance in June 2009.On June 29, 2009, we made an $18.2 million prepayment of our term facility principal balance under an additional amendment. We repaid the remaining $38.3 million term facility balance on October 14, 2009.Prior to its repayment in October 2009, our then-outstanding term facility balance was subject to an interest rate swap and had an interest rate of 9.38%. The interest rate applicable margins did not change as a result of the February 3 and June 29, 2009 amendments to the agreement. During 2009 we incurred interest expense totaling $11.3 million, including amortization of loan origination fees and net expense incurred for the interest rate swap, for the term facility prior to our repayment of the outstanding balance in October 2009. The bridge facility had an interest rate of either LIBOR plus 6.00% or an alternative base rate plus 5.00%. During the first quarter of 2009, we incurred interest expense totaling $2.3 million, including amortization of loan origination fees, for the bridge facility prior to our repayment of the outstanding balance in February 2009. Total interest expense incurred for our credit facilities for 2009 included $4.0 million for the amortization of loan origination fees and net expense of $2.7 million related to interest rate swap adjustments.The February 3, 2009 amendment to the credit agreement also required us to pay an additional fee to our lenders upon effectiveness of the amendment, and on each subsequent July 1 and January 1, by issuing to the lenders an aggregate amount of a new Series of 12% Convertible Preferred Stock (discussed further in Note 9) equal to 3.75% of the aggregate principal amount of the term facility outstanding on February 10, 2009 and on each July 1 and January 1 thereafter until the term facility was paid off in full. Pursuant to this requirement, 42,621 shares of 12% Convertible Preferred Stock valued at $4.3 million were issued to the lenders in February 2009. However, the June 2009 amendment to our credit agreement waived, through September 15, 2009, the 3.75% semiannual fee paid in 12% Convertible Preferred Stock. The fee waiver was extended for an additional month in September 2009, until October 15, 2009, and we repaid the remaining outstanding balance on the term facility on October 14, 2009. In July 2009, 13,700 of the 12% Convertible Preferred Shares were converted to common stock, with the remaining 28,921 shares converted in October 2009.
We have a $100$150 million senior secured revolving credit facility, which is collateralized by the shares of common stock held in our material subsidiaries and by our joint venture interests in the Greens Creek mine, all of our rights and interests in the joint venture agreement, and all of our rights and interests in the assets of the joint venture. This credit facility originated fromwith a $60 million senior secured revolving credit agreement entered into in October 2009. The agreement was2009 that has been amended in December 2010several times to extend the term of the agreement, reduce the commitment fee rate and interest rate spreads, allow the issuance of secured and unsecured debt and investments to governmental authorities as payment of obligations owed to such authorities, and to allow the release of certain liens and security interests granted to the lenders to secure the credit facility. The agreement was again amended on October 10, 2011 to increase the secured revolving credit facility to $100 million.its current form. Amounts borrowed under the credit agreement are available for general corporate purposes. The interest rate on outstanding loans under the agreement is between 2.75%3.00% and 3.5%3.75% above the LIBOR or an alternative base rate plus an applicable margin of between 1.75%2.00% and 2.5%2.75%. We are required to pay a standby fee of between 0.825% and 1.05% per annum on undrawn amounts under the revolving credit agreement. The credit facility is effective until September 30, 2014. WeAugust 1, 2015. In 2012, we incurred $0.6$0.5 million in interest expense in 2011 for the amortization of loan origination fees and $0.6$1.0 million in interest expense for commitment fees relating to the credit agreement.
The credit agreement includes various covenants and other limitations related to our various financial ratios and indebtedness and investments, as well as other information and reporting requirements, including the following limitations:
• | Leverage ratio (calculated as total debt divided by EBITDA) of not more than 3.0:1. |
• | Interest coverage ratio (calculated as EBITDA divided by interest expense) of not less than 3.0:1. |
• | Current ratio (calculated as current assets divided by current liabilities) of not less than 1.10:1. |
• | Tangible net worth of greater than $500 million. |
F- 27
Interest coverage ratio (calculated as EBITDA divided by interest expense) of not less than 3.0:1.Current ratio (calculated as current assets divided by current liabilities) of not less than 1.10:1. Tangible net worth of greater than $500 million.
We were in compliance with all covenants under the amended credit agreement as of December 31, 2011.2012. We have not drawn funds on the current revolving credit facility as of the filing date of this Form 10-K.
WeSince 2009, we have entered into five 48-monthvarious lease agreements in 2010 and 2009 for equipment at our Greens Creek and Lucky Friday units, which we have determined to be capital leases. At December 31, 2011,2012, the total liability balance associated with capital leases, including purchase option amounts, was $17.5 million, with $5.6 million of the liability classified as current and $11.9 million classified as non-current. At December 31, 2011, the total liability balance associated with capital leases was $10.3 million, with $4.0 million of the liability classified as current and $6.3 million classified as non-current. At December 31, 2010, the total liability balance associated with capital leases was $6.3 million, with $2.5 million of the liability classified as current and $3.8 million classified as non-current. The annual maturities of capital lease commitments, including interest, as of December 31, 20112012 are: | | | |
| 2012 | | $ | 4,190 | |
| 2013 | | | 2,734 | |
| 2014 | | | 2,506 | |
| 2015 | | | 1,303 | |
| 2016 | | | 21 | |
| Total | | | 10,754 | |
| Less: imputed interest | | | (692 | ) |
| Net capital lease obligation | | $ | 10,062 | |
| | Year ending December 31, | | | | |
| | 2013 | | $ | 6,049 | | |
| | 2014 | | | 5,821 | | |
| | 2015 | | | 4,618 | | |
| | 2016 | | | 1,931 | | |
| | Total | | | 18,419 | | |
| | Less: imputed interest | | | (920 | ) | |
| | Net capital lease obligation | | $ | 17,499 | | |
Note 7: Commitments and Contingencies
Bunker Hill Superfund Site and Related Environmental ClaimsSettlement of Bunker Hill Superfund Site ClaimsOn September 8, 2011, a Consent Decree (the “Consent Decree”) settling previously disclosed environmental litigation and related claims involving Hecla Limited pertaining to historic releases of mining wastes in the Coeur d'Alene Basin was approved and entered by the U.S. District Court in Idaho. The Consent Decree resolved all existing claims of the United States, the Coeur d'Alene Indian Tribe, and the State of Idaho (“Plaintiffs”) against Hecla Limited and its affiliates under the Comprehensive Environmental Response, Compensation and Liability Act of 1980 (“CERCLA”) (and certain other statutes) for past response costs, future environmental remediation costs, and natural resource damages related to historic releases of mining wastes in the Coeur d'Alene River Basin. The Consent Decree also resolved all remaining obligations of Hecla Limited under the 1994 Consent Decree relating to the “Box,” a rectangular 21-square-mile site located near Kellogg, Idaho within the Bunker Hill Superfund site. The Consent Decree contains comprehensive terms of settlement, including financial terms which require that Hecla Limited pay, in the aggregate, $264.4 million to the Plaintiffs over approximately three years. In early October 2011, Hecla Limited made payments totaling approximately $168 million to the Plaintiffs, and delivered surety bonds providing security for the remaining $96.4 million due over the next three years. Subsequently, Hecla Limited paid an additional approximately $1 million, leaving its remaining payment obligations at $95.4 million.In light of the approximately $168 million already paid under the Consent Decree in October 2011, and the subsequent payment of approximately $1 million in warrant proceeds received as of December 31, 2011, Hecla Limited remains obligated under the Consent Decree to make the following payments:• | $25 million of cash by October 8, 2012; |
• | $15 million of cash by October 8, 2013; and |
• | approximately $55.4 million by August 2014, as quarterly payments of the proceeds from the exercise of any outstanding Series 1 and Series 3 warrants (which have an exercise price of between $2.44 and $2.49 per share) during the quarter, with the remaining balance, if any, due in August 2014. |
As noted above, these payments are secured by a third party surety for which Hecla Limited pays an annual maintenance fee. Further, the $25 million and $15 million payments accrue interest from September 8, 2011 until payment at the Superfund rate (0.69% for 2011, 0.74% for 2012). Finally, in addition to the foregoing payments, Hecla Limited is obligated to provide a limited amount of land it currently owns to be used as a waste repository site.As a result of the foregoing developments, we have accrued a total of $95.1 million as of December 31, 2011 for the net present value of all of Hecla Limited's future payments due under the Consent Decree.In 1991, Hecla Limited initiated litigation in the Idaho District Court, County of Kootenai, against a number of insurance companies that provided comprehensive general liability insurance coverage to Hecla Limited and its predecessors. Hecla Limited believes the insurance companies had a duty to defend and indemnify Hecla Limited under their policies of insurance for all liabilities and claims asserted against it by the EPA and the Tribe under CERCLA related to the Box and the Basin. In 1992, the Idaho State District Court ruled that the primary insurance companies had a duty to defend Hecla Limited in the Tribe's lawsuit. During 1995 and 1996, Hecla Limited entered into settlement agreements with a number of the insurance carriers named in the litigation. Prior to 2009, Hecla Limited received a total of approximately $7.2 million under the terms of the settlement agreements. Thirty percent (30%) of these settlements were paid to reimburse the U.S. Government for past costs under the Box Decree. Litigation is still pending against one insurer and the trial was suspended until the underlying environmental claims against Hecla Limited were resolved or settled. Now that the Consent Decree has been entered, we expect to move towards resolution of Hecla Limited's insurance claims in the next few months, either through settlement or trial. As of December 31, 2011, Hecla Limited has not recorded a receivable or reduced its accrual for obligations under the Consent Decree to reflect the receipt of any potential insurance proceeds, and there can be no assurances that Hecla Limited will collect any proceeds as a result of these claims.Rio Grande Silver Guaranty
On February 21, 2008, ourOur wholly-owned subsidiary, Rio Grande Silver Inc. (“Rio”), entered into an agreementis party to a joint venture with Emerald Mining & Leasing, LLC (“EML”) and Golden 8 Mining, LLC (“G8”)certain other parties with respect to acquire the right to earn-in to a 70% interest in the San Juan Silver Joint Venture, which holds a land package in the Creede Mining District of Colorado. On October 24, 2008, Rio entered into an amendmentColorado that is adjacent to the agreement which delayed the incurrence of qualifying expenses to be paidother land held by Rio pursuant to the original agreement. In December 2011, Rio acquired EML's and G8's full ownership percentage of a certain portion of the San Juan Silver Joint Venture. A new joint venture agreement was established between those parties pertaining to the remaining portion of the land package in the Creede District, andRio. Rio holds a 70% interest in the new joint venture agreement.venture. In connection with the 2008 agreement,joint venture, we are required to guarantee certain environmental remediation-related obligations of EML to a third party up to a maximum liability to us of $2.5 million. As of December 31, 2011,2012, we have not been required to make any payments pursuant to the guaranty. We may be required to make payments in the future, limited to the $2.5 million maximum liability, should EML fail to meet its obligations to the third party. However, to the extent that any payments are made by us under the guaranty, EML, in addition to other parties, named in the amended agreement, have jointly and severally agreed to reimburse and indemnify us for any such payments. We have not recorded a liability relating to the guaranty as of December 31, 2011.2012.
Lucky Friday Water Permit Exceedances
Over the last several years, the Lucky Friday unit has experienced several regulatory issues relating to its water discharge permits and water management more generally.
In late 2008 and during 2009, Hecla Limited experienced a number of alleged water permit exceedances for water discharges at its Lucky Friday unit. The 2008These alleged violations resulted in Hecla Limited entering into a Consent Agreement and Final Order (“CAFO”) and a Compliance Order with the EPA in April 2009, which included an extended compliance timeline. In connection with the CAFO, Hecla Limited agreed to pay anthe maximum administrative penalty to the EPA of $177,500 to settle any liability for such alleged exceedances. The
In 2009, additional alleged violationspermit exceedances for water discharges at the Lucky Friday unit occurred. In 2010, alleged unpermitted discharges of waste water occurred at the Lucky Friday unit. These alleged permit exceedances and some, but not all of the alleged unpermitted discharges were the subject of a December 2010 letterNotice of Violation (“2010 NOV”) from the EPA informing Hecla Limited that the EPA iswas prepared to seek civil penalties for these alleged violations, as well as for alleged unpermitted discharges of waste water in 2010 at the Lucky Friday unit.violations. In the same letter,2010 NOV, the EPA invited Hecla Limited to discuss these matters with them prior to filing a complaint. In April 2011, Hecla Limited received an additional request for information from the EPA on the alleged unpermitted discharges in 2010. Hecla Limited disputes certain of the EPA's assertions, but has beguninitiated negotiations with the EPA in an attempt to resolve the matter, which includesincluding performing additional water quality monitoring to better understand the quality and source of the alleged unpermitted discharge. We doThere has not believebeen any resolution of the 2010 NOV.
In October 2012, the Lucky Friday had a weekly water sample which, when tested, exceeded the permit concentration limit for lead (but not the associated load limit). Also in October 2012, heavy rains resulted in alleged impacted storm water being discharged to a nearby river for which in February 2013, the EPA issued a NOV and request for information to Hecla Limited ("2013 NOV"). In the 2013 NOV, the EPA alleges that the outcomeOctober 2012 storm water incident was a violation of this claim will have a material adverse effect on our results from operations or financial position.Hecla Limited's separate storm water permit.
In November 2012, the Lucky Friday had a weekly water sample which, when tested, exceeded certain permit limits for zinc. Although they have not yet formally done so, it is possible that the EPA could issue a NOV for the 2012 permit exceedances. In addition, since the 2010 NOV is still unresolved, we believe it is likely that the EPA will refer the 2012 incidents, 2013 NOV, the 2010 NOV, and possibly some additional alleged unpermitted discharges from 2010 that were not included in the 2010 NOV, to the U.S. Department of Justice (“DOJ”) to file a civil complaint against Hecla Limited. There is the potential for larger civil penalties in the context of a DOJ complaint than in administrative actions by the EPA such as the 2009 CAFO.
Hecla Limited strives to maintain its water discharges and water management generally at the Lucky Friday unit in full compliance with the permit, butits permits and applicable laws, however we cannot provide assurances that it will be able to fully comply with the permit limits and other regulatory requirements regarding water management in the future.
While we believe we may face some liability for the above water issues, we do not believe that any such liability will have a material adverse effect on our results from operations or financial position. Johnny M Mine Area near San Mateo, McKinley County, New Mexico
In May 2011, the EPA made a formal request to Hecla Mining Company for information regarding the Johnny M Mine Area near San Mateo, McKinley County, New Mexico, and asserted that Hecla Mining Company may be responsible under CERCLA for environmental remediation and past costs the EPA has incurred at the site. Mining at the Johnny M was conducted for a limited period of time by a predecessor of our subsidiary, Hecla Limited. In August 2012, Hecla Limited and the EPA entered into a Settlement Agreement and Administrative Order on Consent for Removal Action (“Consent Decree”), pursuant to which Hecla Limited agreed to pay (i) $1.1 million to the EPA for its past response costs at the site and (ii) any future response costs at the site, in exchange for a covenant not to sue by the EPA. The Consent Decree also describes additional work at the site to be conducted by Hecla Limited. Hecla Limited paid the $1.1 million to the EPA for its past response costs in the fourth quarter of 2012, and our consolidated financial statements as of December 31, 2012 include an accrual balance by Hecla Limited of $0.3 million for investigation and planning costs. We cannot with any degree of certainty estimate the amount of any additional liability Hecla Limited may face at the site until, at a minimum, the amount and type of remediation required have been determined.
Carpenter Snow Creek Site, Cascade County, Montana
In July 2010, the EPA made a formal request to Hecla Mining Company for information regarding the Carpenter Snow Creek Superfund Site located in Cascade County, Montana. The Carpenter Snow Creek Site is located in a historic mining district, and in the early 1980s Hecla Limited leased 6 mining claims and performed limited exploration activities at the site. Hecla Limited terminated the mining lease in 1988.
In June 2011, the EPA informed Hecla Limited that it believes Hecla Limited, among several other viable companies, may be liable for cleanup of the site or for costs incurred by the EPA in cleaning up the site. The EPA stated in the June 2011 letter that it has incurred approximately $4.5 million in response costs and estimated that total remediation costs may exceed $100 million. Because Hecla Limited had very limited activity at the site, we do not believe that the outcome of the claim will
have a material adverse effect on our results from operations or financial position. We have not recorded a liability relating to the site as of December 31, 2012.
States of South Dakota and Colorado Superfund Sites Related to CoCa Mines, Inc.
In 1991, Hecla Limited acquired all of the outstanding common stock of CoCa Mines, Inc. (“CoCa”). Coca is alleged to have engaged in exploration at the Gilt Edge Mine in South Dakota as well as in the area adjacent to the Nelson Tunnel property in Creede, Colorado.
Gilt Edge Mine Superfund Site
In August 2008, the EPA made a formal request to CoCa for information regarding the Gilt Edge Mine Site located in Lawrence County, South Dakota, and asserted that CoCa may be liable for environmental cleanup at the site. The Gilt Edge Mine Site was explored and/or mined beginning in the 1890s. In the early 1980s, CoCa was involved in a joint venture that conducted a limited program of exploration work at the site. This joint venture terminated in 1984, and by 1985 CoCa had divested itself of any interest in the property.
In July 2010 the United States informed CoCa that it intends to pursue CoCa and several other potentially responsible parties on a joint and several basis for liability for past and future response costs at Gilt Edge under CERCLA. Currently, the United States alleges that CoCa is liable based on participation in the joint venture, and that CoCa has succeeded to the liabilities of its predecessor at the site, Congdon & Carey, which may have held certain property interests at the site.
As of January 2010, the EPA had allegedly incurred approximately $91 million in response costs to implement remedial measures at the Gilt Edge site, and estimated future response costs of $72 million. Hecla Limited did not acquire CoCa until 1991, well after CoCa discontinued its involvement with the Gilt Edge site. In addition, CoCa is and always has been a separate corporate entity from Hecla Limited.
In August 2010, CoCa initiated negotiations with the United States in order to reach a settlement of its liabilities at the site that accounts for CoCa's limited financial resources. In late September 2010, in connection with these negotiations, CoCa received a request from the Department of Justice for additional information regarding its finances. CoCa provided written responses and additional information in January 2011. In April 2011, CoCa, and its parent Hecla Limited, received additional information requests related to Gilt Edge, and both entities responded to the EPA in July 2011. We believe that Hecla Limited is not liable for any cleanup at the site, and if CoCa might be liable, it has limited assets with which to satisfy any such liability. Settlement negotiations with the EPA commenced in 2010 and are ongoing.ongoing, but there can be no assurance such negotiations will be successful.
Nelson Tunnel/Commodore Waste Rock Pile Superfund Site
In August 2009, the EPA made a formal request to CoCa for information regarding the Nelson Tunnel/Commodore Waste Rock Pile Superfund Site in Creede, Colorado. A timely response was provided and the EPA later arranged to copy additional documents. CoCa was involved in exploration and mining activities in Creede during the 1970s and the 1980s. No formal claim for response costs under CERCLA has been made against CoCa for this site. Hecla Limited did not acquire CoCa until 1991, well after CoCa discontinued its historical activities in the vicinity of the site. In addition, CoCa is and always has been a separate corporate entity from Hecla Limited. Therefore, we believe that Hecla Limited is not liable for any cleanup, and if CoCa might be liable, it has limited assets with which to satisfy any such liability. Barker-Hughesville Site, Cascade and Judith Basin Counties, MontanaIn April 2011, a complaint was filed against Hecla Mining Company and several other mining companies in Federal District Court in Montana by ASARCO, LLC, seeking contribution and cost recovery relating to the alleged payment by ASARCO of approximately $9 million to the State of Montana and the United States in connection with ASARCO's CERCLA liabilities at the Block P Mine and Mill Site, which is part of the Barker-Hughesville Mining District, which is a Superfund site in Montana. The complaint was amended in September 2011 to name Hecla Limited rather than Hecla Mining Company as one of the defendants to the lawsuit. We have begun investigating the basis for ASARCO's claims and believe Hecla Limited had very limited involvement at the site in the early 1980s. We do not believe that the outcome of this claim will have a material adverse effect on our results from operations or financial position, and have made an immaterial accrual for potential liability on this matter.Johnny M Mine Area near San Mateo, McKinley County, New MexicoIn May 2011, the EPA made a formal request to Hecla Mining Company for information regarding the Johnny M Mine Area near San Mateo, McKinley County, New Mexico, and asserted that Hecla Mining Company may be responsible under CERCLA for environmental cleanup at the site and costs the EPA has incurred at the site. Mining at the Johnny M was conducted for a limited period of time by Ranchers Exploration and Development Corporation, a predecessor of our subsidiary, Hecla Limited. In June 2011, Hecla Limited responded to the EPA's request and discussions are ongoing. In February 2012, a subsidiary of Hecla Limited acquired a parcel of land that is adjacent to the Johnny M site and which was occupied by one or more individuals and animals that were part of a livestock business located on the property. EPA has alleged that this property may contain hazardous substances released from the Johnny M site. The land was purchased for $1.875 million and Hecla also received a release from liability from the landowners. While we believe it is probable that Hecla Limited will have some amount of liability relating to the Johnny M Site, we cannot with any degree of certainty estimate the amount of such liability. Estimating the amount of such liability is not possible at this point in time for several reasons, including (but not limited to) that neither the EPA nor Hecla Limited have completed investigations of the site, the amount and type of remediation required have not yet been determined, and the existence of other potentially responsible parties has not yet been determined. Although we cannot estimate the amount of any liability relating to the Johnny M site we may face, our consolidated financial statements for the year ending December 31, 2011 which are included in this Annual Report include an accrual by Hecla Limited of $2.04 million for liabilities that are probable or have already been incurred. This amount includes the $1.875 million to purchase the adjacent property and obtain a release from the landowners, and $165,000 for estimated investigation and planning costs.Carpenter Snow Creek Site, Cascade County, MontanaIn July 2010, the EPA made a formal request to Hecla Mining Company for information regarding the Carpenter Snow Creek Superfund Site located in Cascade County, Montana. The Carpenter Snow Creek Site is located in a historic mining district, and in the early 1980s Hecla Limited leased 6 mining claims and performed limited exploration activities at the site. Hecla Limited terminated the mining lease in 1988.In June 2011, the EPA informed Hecla Limited that it believes Hecla Limited, among several other viable companies, may be liable for cleanup of the site or for costs incurred by the EPA in cleaning up the site. The EPA stated in the June 2011 letter that it has incurred approximately $4.5 million in response costs and estimated that total remediation costs may exceed $100 million. Because Hecla Limited had very limited activity at the site, we do not believe that the outcome of the claim will have a material adverse effect on our results from operations or financial position. We have not recorded a liability relating to the site as of December 31, 2011.
Other Commitments
Our contractual obligations as of December 31, 20112012 included approximately $9.3$3.4 million for commitments relating to capital items, along with $.01$0.5 million for various non-capital costs, at Lucky Friday and Greens Creek.costs. In addition, our commitments relating to open purchase orders at December 31, 20112012 included approximately $9.9$4.1 million and $0.1$0.9 million, respectively, for various capital items at the Greens Creek and Lucky Friday units, and approximately $0.6$0.5 million and $0.1$0.3 million, respectively, for various non-capital costs. We also have total commitments of approximately $10.8$18.4 million relating to scheduled payments on capital leases, including interest, primarily for equipment at our Greens Creek and Lucky Friday units (see Note 6 for more information).
We had letters of credit for approximately $0.6$1.2 million outstanding as of December 31, 20112012 for reclamation and workers' compensation insurance bonding. The remaining payments under the terms of the Consent Decree require third party surety for which Hecla Limited pays an annual maintenance fee. The first annual maintenance fee of $0.6 million was paid in October 2011.
On February 1, 2012, a purported Hecla stockholder filed a putative class action lawsuit in U.S. District Court for the District of Idaho against Hecla and certain of our officers, one of whom is also a director. The complaint, purportedly brought on behalf of all purchasers of Hecla common stock from October 26, 2010 through and including January 11, 2012, asserts claims under Sections 10(b) and 20(a) of the Securities Exchange Act of 1934 and Rule 10b-5 promulgated thereunder and seeks, among other things, damages and costs and expenses. Specifically, the complaint alleges that Hecla, under the authority and control of the individual defendants, made certain false and misleading statements and allegedly omitted certain material information.information related to operational issues at the Lucky Friday mine. The complaint alleges that these actions artificially inflated the market price of Hecla common stock during the class period, thus purportedly harming investors.investors who purchased shares during that time. A second suit was filed on February 14, 2012, alleging virtually identical claims. These complaints have been consolidated into a single case, a lead plaintiff and lead counsel has been appointed by the Court (Bricklayers of Western Pennsylvania Pension Plan, et al. v. Hecla Mining Company et al., Case No. 12-0042 (D. Idaho)), and a consolidated amended complaint was filed on October 16, 2012. In January 2013, we filed a motion to dismiss the complaint. We cannot predict the outcome of such proceedingsthis lawsuit or an estimate of damages if any.plaintiffs were to prevail. We believe that these claims are without merit and intend to defend them vigorously.
Related to the above described class action lawsuit, Hecla is named as a nominal defendant in two pending shareholder derivative lawsuits which name as defendants certain Hecla executives and members of Hecla's Board of Directors. The cases are: In Re Hecla Mining Company Derivative Shareholder Litigation, Case No. 2:12-cv-00097 (D. Idaho) and In Re Hecla Mining Inc. [sic] Shareholder Derivative Litigation, Case No. 12-1506 (Kootenai Cnty. Dist. Ct.). In general terms, these lawsuits allege breaches of fiduciary duties by the individual defendants and seek damages, purportedly on behalf of Hecla. In January 2013, a consolidated amended complaint was filed in each of these lawsuits. In February 2013, we filed a motion to dismiss each of these complaints. A third derivative case, South, et al. v. Baker, et al., Case No. 7294-VCL (Del. Ch. Ct.), was dismissed with prejudice by the Delaware Court of Chancery on September 25, 2012. In addition, the Board of Directors has received two letters on behalf of purported shareholders demanding that Hecla commence litigation against certain executives and directors on substantially similar grounds. Hecla's board has concluded the actions requested by both demands would be contrary to the Company's best interest given the pendency of other, related litigation against the Company. In March 2012, Hecla Limited received notice of a complaint filed against it by the United Steel Workers, Local 5114, with the Federal Mine Safety and Health Review Commission for compensation for bargaining unit workers at the Lucky Friday mine idled as a result of the previously-announced, temporary suspension of production at the mine. The complaint alleges the bargaining unit workers are entitled to compensation under Section 111 of Federal Mine Safety and Health Act of 1977 from November 16, 2011 - the date an order was issued by the Mine Safety Health Administration (“MSHA”) to Hecla Limited - until such time as the order is terminated. We submitted a motion for summary decision to the administrative law judge within the Federal Mine Safety and Health Review Commission which was denied in December 2012. Currently we are awaiting further proceedings. We believe the claim is without merit, and that all wages due under Section 111, which was an immaterial amount, have already been paid. We may face a liability as a result of the union's claim in the range of $0 to $10 million; however, we have not recorded a liability relating to the claim as of December 31, 2012.
We are subject to other legal proceedings and claims not disclosed above which have arisen in the ordinary course of our business and have not been finally adjudicated.arise from time to time. These can include, but are not limited to, legal proceedings and/or claims pertaining to environmental or safety matters. For example, in April 2011, a fatal accident occurred at the Lucky Friday Mine which was investigated by Hecla and the Mine Safety Health Administration (“MSHA”).MSHA. In November 2011, an accident occurred as part of the construction of #4 Shaft which resulted in the fatality of one contractor employee. In an unrelated incident, in December 2011, a rock burst occurred in a primary access way at the Lucky Friday and injured seven employees, with no fatalities as a result of that incident.none fatally. At the end of 2011, MSHA began a special impact investigation at the Lucky Friday mine which resulted in an order to remove loosebuilt-up cementitious material from the Silver Shaft, the primary access way from the surface at the Lucky Friday mine. As a result of MSHA's investigations related to these events, Hecla Limited has been issued monetary penalties (none of which are material, individually or in the aggregate), and may be issuedface additional enforcement actions, as well asincluding additional monetary penalties (including monetary) from MSHA or other governmental agencies. Although there can be no assurance as to the ultimate disposition of these other matters, we believe the outcome of these other proceedingsthey will not have a material adverse effect on our results from operations or financial position.
Note 8: Employee Benefit PlansPensions and Other Post-retirement Plans
We sponsor defined benefit pension plans covering substantially all U.S. employees and
we provide certain post-retirement benefits for qualifying retired employees. The following tables provide a reconciliation of the changes in the plans’ benefit obligations and fair value of assets over the two-year period ended December 31,
2011,2012, and the funded status as of
December 31, 2012 and December 31, 2011
and 2010 (in thousands):
| | | Pension Benefits | | Other Benefits | | Pension Benefits | | | Other Benefits | |
| | | 2011 | | 2010 | | 2011 | | 2010 | | 2012 | | | 2011 | | | 2012 | | | 2011 | |
| Change in benefit obligation: | | | | | | | | | | | | | | | | | | | | |
| Benefit obligation at beginning of year | | $ | 76,925 | | | $ | 66,813 | | | $ | 1,430 | | | $ | 1,295 | | | $ | 87,895 | | | $ | 76,925 | | | $ | 65 | | | $ | 68 | |
| Service cost | | | 3,877 | | | | 2,203 | | | | 54 | | | | 46 | | | | 3,974 | | | | 3,877 | | | | — | | | | — | |
| Interest cost | | | 4,114 | | | | 3,724 | | | | 77 | | | | 73 | | | | 4,069 | | | | 4,114 | | | | 3 | | | | 3 | |
| Participants' contributions | | | | 29 | | | | — | | | | — | | | | — | |
| Amendments | | | 396 | | | | — | | | | — | | | | — | | | | — | | | | 396 | | | | — | | | | — | |
| Actuarial loss | | | 6,476 | | | | 7,907 | | | | 127 | | | | 40 | | | | 7,450 | | | | 6,476 | | | | 7 | | | | 4 | |
| Benefits paid | | | (3,893 | ) | | | (3,722 | ) | | | (17 | ) | | | (24 | ) | | | (4,050 | ) | | | (3,893 | ) | | | (12 | ) | | | (10 | ) |
| Benefit obligation at end of year | | | 87,895 | | | | 76,925 | | | | 1,671 | | | | 1,430 | | | | 99,367 | | | | 87,895 | | | | 63 | | | | 65 | |
| Change in fair value of plan assets: | | | | | | | | | | | | | | | | | | | | | | | | | | | | |
| Fair value of plan assets at beginning of year | | | 70,462 | | | | 64,889 | | | | — | | | | — | | | | 65,082 | | | | 70,462 | | | | — | | | | — | |
| Actual return (loss) on plan assets | | | (1,818 | ) | | | 8,976 | | | | — | | | | — | | | | 6,007 | | | | (1,818 | | | | — | | | | — | |
| Employer contributions | | | 331 | | | | 319 | | | | 17 | | | | 24 | | | | 1,447 | | | | 331 | | | | 12 | | | | 10 | |
| Participants' contributions | | | | 29 | | | | — | | | | — | | | | — | |
| Benefits paid | | | (3,893 | ) | | | (3,722 | ) | | | (17 | ) | | | (24 | ) | | | (4,050 | ) | | | (3,893 | ) | | | (12 | ) | | | (10 | ) |
| Fair value of plan assets at end of year | | | 65,082 | | | | 70,462 | | | | — | | | | — | | | | 68,515 | | | | 65,082 | | | | — | | | | — | |
| Funded status at end of year | | $ | (22,813 | ) | | $ | (6,463 | ) | | $ | (1,671 | ) | | $ | (1,430 | ) | | $ | (30,852 | ) | | $ | (22,813 | ) | | $ | (63 | ) | | $ | (65 | ) |
F- 33We also sponsor post-retirement term life insurance benefits for substantially all retirees who retire from active service. The accumulated post-retirement benefit obligation under all such plans totaled $1.9 million at December 31, 2012 and $1.6 million at December 31, 2011. We are indemnified by insurance carriers for all retiree term life coverage.
The following table provides the amounts recognized in the consolidated balance sheets as of December 31, 20112012 and 2010December 31, 2011 (in thousands):
| | | Pension Benefits | | Other Benefits |
| | | 2011 | | 2010 | | 2011 | | 2010 |
| Other non-current assets: | | | | | | | | |
| Prepaid benefit costs | | $ | — | | | $ | 1,438 | | | $ | — | | | $ | — | |
| Current liabilities: | | | | | | | | | | | | | | | | |
| Accrued benefit liability | | | (330 | ) | | | (323 | ) | | | (52 | ) | | | (54 | ) |
| Other non- current liabilities: | | | | | | | | | | | | | | | | |
| Accrued benefit liability | | | (22,484 | ) | | | (7,577 | ) | | | (1,620 | ) | | | (1,375 | ) |
| Accumulated other comprehensive (income) loss | | | 30,747 | | | | 17,859 | | | | (269 | ) | | | (395 | ) |
| Net amount recognized | | $ | 7,933 | | | $ | 11,397 | | | $ | (1,941 | ) | | $ | (1,824 | ) |
| | | Pension Benefits | | | Other Benefits | |
| | | 2012 | | | 2011 | | | 2012 | | | 2011 | |
| Current liabilities: | | | | | | | | | | | | |
| Accrued benefit liability | | $ | (322 | ) | | $ | (330 | ) | | $ | (3 | ) | | $ | (3 | ) |
| Other non- current liabilities: | | | | | | | | | | | | | | | | |
| Accrued benefit liability | | | (30,530 | ) | | | (22,484 | ) | | | (60 | ) | | | (62 | ) |
| Accumulated other comprehensive (income) loss | | | 33,545 | | | | 30,747 | | | | (305 | ) | | | (340 | ) |
| Net amount recognized | | $ | 2,693 | | | $ | 7,933 | | | $ | (368 | ) | | $ | (405 | ) |
The benefit obligation and prepaid benefit costs were calculated by applying the following weighted average assumptions:
| | | Pension Benefits | | | Other Benefits | |
| | | 2011 | | | 2010 | | | 2011 | | | 2010 | |
| Discount rate: net periodic pension cost | | | 5.50 | % | | | 5.75 | % | | | — | % | | | — | % |
| Discount rate: projected benefit obligation | | | 4.75 | % | | | 5.50 | % | | | 4.75 | % | | | 5.50 | % |
| Expected rate of return on plan assets | | | 8.00 | % | | | 8.00 | % | | | — | % | | | — | % |
| Rate of compensation increase | | | 4.00 | % | | | 4.00 | % | | | — | % | | | — | % |
| | | Pension Benefits | | | Other Benefits | |
| | | 2012 | | | 2011 | | | 2012 | | | 2011 | |
| Discount rate: net periodic pension cost | | | 4.75 | % | | | 5.50 | % | | | — | | | | — | |
| Discount rate: projected benefit obligation | | | 4.00 | % | | | 4.75 | % | | | 4.00 | % | | | 4.75 | % |
| Expected rate of return on plan assets | | | 7.20 | % | | | 8.00 | % | | | — | | | | — | |
| Rate of compensation increase | | | 4.00 | % | | | 4.00 | % | | | — | | | | — | |
The above assumptions were calculated based on information as of December 31, 2011and 2010,2012 and December 31, 2011, the measurement dates for the plans. The discount rate is generally based on the rates of return availableyield curve for investment-grade corporate bonds as ofpublished by the measurement date from high-quality fixed income investments, which in past years we have used Moody’s AA bond index as a guide to setting the discount rate.U.S. Treasury Department. The expected rate of return on plan assets is based upon consideration of the plan’s current asset mix, historical long-term return rates and the plan’s historical performance. Our current expected rate on plan assets of 8.0%7.2% is based on historical returns over the past ten years.
Net periodic pension cost for the plans consisted of the following in 2012, 2011, 2010 and 20092010 (in thousands):
| | | Pension Benefits | | | Other Benefits | |
| | | 2011 | | | 2010 | | | 2009 | | | 2011 | | | 2010 | | | 2009 | |
| Service cost | | $ | 3,877 | | | $ | 2,203 | | | $ | 2,269 | | | $ | 54 | | | $ | 46 | | | $ | 15 | |
| Interest cost | | | 4,114 | | | | 3,724 | | | | 3,661 | | | | 77 | | | | 73 | | | | 55 | |
| Expected return on plan assets | | | (5,481 | ) | | | (5,041 | ) | | | (4,673 | ) | | | — | | | | — | | | | — | |
| Amortization of prior service cost | | | 403 | | | | 602 | | | | 602 | | | | 45 | | | | 53 | | | | (3 | ) |
| Amortization of net gain (loss) from earlier periods | | | 880 | | | | 867 | | | | 1,232 | | | | (43 | ) | | | (46 | ) | | | (43 | ) |
| Net periodic pension cost | | $ | 3,793 | | | $ | 2,355 | | | $ | 3,091 | | | $ | 133 | | | $ | 126 | | | $ | 24 | |
| | | Pension Benefits | | | Other Benefits | |
| | | 2012 | | | 2011 | | | 2010 | | | 2012 | | | 2011 | | | 2010 | |
| Service cost | | $ | 3,974 | | | $ | 3,877 | | | $ | 2,203 | | | $ | — | | | $ | — | | | $ | — | |
| Interest cost | | | 4,068 | | | | 4,114 | | | | 3,724 | | | | 3 | | | | 4 | | | | 4 | |
| Expected return on plan assets | | | (4,581 | ) | | | (5,481 | ) | | | (5,041 | ) | | | — | | | | — | | | | — | |
| Amortization of prior service cost | | | 401 | | | | 403 | | | | 602 | | | | — | | | | — | | | | — | |
| Amortization of net gain (loss) from earlier periods | | | 2,826 | | | | 880 | | | | 867 | | | | (28 | ) | | | (31 | ) | | | (33 | ) |
| Net periodic pension cost | | $ | 6,688 | | | $ | 3,793 | | | $ | 2,355 | | | $ | (25 | ) | | $ | (27 | ) | | $ | (29 | ) |
The allocations of investments at December 31, 20112012 and 2010,December 31, 2011, the measurement dates of the plan, by asset category in the Hecla Mining Company Retirement Plan and the Lucky Friday Pension Plan are as follows:
| | | Hecla | | | Lucky Friday | |
| | | 2011 | | | 2010 | | | 2011 | | | 2010 | |
| Interest-bearing cash | | | 1 | % | | | 3 | % | | | 1 | % | | | 3 | % |
| Equity securities | | | 35 | % | | | 34 | % | | | 35 | % | | | 34 | % |
| Debt securities | | | 43 | % | | | 39 | % | | | 44 | % | | | 39 | % |
| Real estate | | | 13 | % | | | 10 | % | | | 12 | % | | | 10 | % |
| Precious metals and other | | | 8 | % | | | 14 | % | | | 8 | % | | | 14 | % |
| Total | | | 100 | % | | | 100 | % | | | 100 | % | | | 100 | % |
| | | Hecla | | | Lucky Friday | |
| | | 2012 | | | 2011 | | | 2012 | | | 2011 | |
| Cash | | | 1 | % | | | 1 | % | | | 1 | % | | | 1 | % |
| Large cap U.S. equities | | | 11 | % | | | 13 | % | | | 9 | % | | | 12 | % |
| Small cap U.S. equities | | | 4 | % | | | 4 | % | | | 5 | % | | | 4 | % |
| Non-U.S. equities | | | 10 | % | | | 9 | % | | | 10 | % | | | 9 | % |
| Fixed income | | | 33 | % | | | 37 | % | | | 34 | % | | | 38 | % |
| Real estate | | | 18 | % | | | 13 | % | | | 17 | % | | | 13 | % |
| Absolute return hedge funds | | | 13 | % | | | 13 | % | | | 14 | % | | | 13 | % |
| Real return | | | 10 | % | | | 10 | % | | | 10 | % | | | 10 | % |
| Total | | | 100 | % | | | 100 | % | | | 100 | % | | | 100 | % |
The "Precious metals and other" asset category in the table above includes our common stock in the amounts of $2.6$2.9 million and $5.2$2.6 million at December 31, 20112012 and 2010, the measurement dates of the plan, respectively.December 31, 2011. These investments represent approximately 4% and 7% of the total combined assets of these plans at both December 31, 20112012 and 2010, respectively.December 31, 2011.
Our statement of investment policy and objectives lays outdelineates the responsibilities of the board, the management investment committee, the investment manager(s), and investment adviser/consultant, and provides guidelines on investment and investment management. Investment objectives are established for each of the asset categories included in the pension plans with comparisons of performance against appropriate benchmarks. Our policy calls for each portion of the investments to be supervised by a qualified investment manager.managers. The investment managers are monitored on an ongoing basis by our outside consultant, with formal reporting to us and the consultant performed each quarter. The policy sets forth the following allocation of assets:
| | | Target | | | Minimum | | | Maximum | |
| Large cap U.S. equities | | | 10 | % | | | 7 | % | | | 13 | % |
| Small cap U.S. equities | | | 5 | % | | | 4 | % | | | 6 | % |
| Non-U.S. equities | | | 10 | % | | | 8 | % | | | 12 | % |
| Fixed income | | | 35 | % | | | 29 | % | | | 43 | % |
| Real estate | | | 15 | % | | | 12 | % | | | 18 | % |
| Absolute return hedge funds | | | 15 | % | | | 12 | % | | | 18 | % |
| Real return | | | 10 | % | | | 8 | % | | | 12 | % |
Our statement of investment policy and objectives specifies over the long termaspires to achieve the assumed long term rate of return on plan assets established by the plan’s actuary plus one percent. Accounting guidance has established a hierarchy of assets that are measured at fair value on a recurring basis. The three levels included in the hierarchy are: Level 1: quoted prices in active markets for identical assets or liabilities Level 2: significant other observable inputs Level 3: significant unobservable inputs The fair values by asset category in each plan, along with their hierarchy levels, are as follows as of December 31, 20112012 (in thousands):
| | | Hecla | | | Lucky Friday | |
| | | Level 1 | | | Level 2 | | | Level 3 | | | Total | | | Level 1 | | | Level 2 | | | Level 3 | | | Total | |
| Interest-bearing cash | | $ | 609 | | | $ | — | | | $ | — | | | $ | 609 | | | $ | 166 | | | $ | — | | | $ | — | | | $ | 166 | |
| Common stock | | | 2,071 | | | | — | | | | — | | | | 2,071 | | | | 527 | | | | — | | | | — | | | | 527 | |
| Closely held instruments | | | — | | | | 2,777 | | | | 13,300 | | | | 16,077 | | | | — | | | | 738 | | | | 3,566 | | | | 4,304 | |
| Partnership/joint venture interests | | | — | | | | 1,836 | | | | — | | | | 1,836 | | | | — | | | | 523 | | | | — | | | | 523 | |
| Common collective funds | | | — | | | | 8,028 | | | | — | | | | 8,028 | | | | — | | | | 2,049 | | | | — | | | | 2,049 | |
| Mutual funds | | | 22,667 | | | | — | | | | — | | | | 22,667 | | | | 6,225 | | | | — | | | | — | | | | 6,225 | |
| Total fair value | | $ | 25,347 | | | $ | 12,641 | | | $ | 13,300 | | | $ | 51,288 | | | $ | 6,918 | | | $ | 3,310 | | | $ | 3,566 | | | $ | 13,794 | |
| | | Hecla | | | Lucky Friday | |
| | | Level 1 | | | Level 2 | | | Level 3 | | | Total | | | Level 1 | | | Level 2 | | | Level 3 | | | Total | |
| Interest-bearing cash | | $ | 683 | | | $ | — | | | $ | — | | | $ | 683 | | | $ | 198 | | | $ | — | | | $ | — | | | $ | 198 | |
| Common stock | | | 2,309 | | | | — | | | | — | | | | 2,309 | | | | 588 | | | | — | | | | — | | | | 588 | |
| Real estate | | | — | | | | — | | | | 9,611 | | | | 9,611 | | | | — | | | | — | | | | 2,513 | | | | 2,513 | |
| Collective investment funds | | | — | | | | 10,095 | | | | 7,251 | | | | 17,346 | | | | — | | | | 2,469 | | | | 1,978 | | | | 4,447 | |
| Mutual funds | | | 24,183 | | | | — | | | | — | | | | 24,183 | | | | 6,637 | | | | — | | | | — | | | | 6,637 | |
| Total fair value | | $ | 27,175 | | | $ | 10,095 | | | $ | 16,862 | | | $ | 54,132 | | | $ | 7,423 | | | $ | 2,469 | | | $ | 4,491 | | | $ | 14,383 | |
The following is a reconciliationroll-forward of assets in levelLevel 3 of the fair value hierarchy (in thousands):
| | | Hecla | | | Lucky Friday | |
| Beginning balance at December 31, 2011 | | $ | 13,300 | | | $ | 3,566 | |
| Net unrealized gains on assets held at the reporting date | | | 838 | | | | 187 | |
| Purchases | | | 2,724 | | | | 738 | |
| Ending balance at December 31, 2012 | | $ | 16,862 | | | $ | 4,491 | |
Of the $21.4 million in plan assets classified as Level 3, $12.1 million was invested in real estate, while $8.2 million was invested in collective investment funds.
| | | Hecla | | | Lucky Friday | |
| Beginning balance at December 31, 2010 | | $ | 12,508 | | | $ | 3,356 | |
| Net unrealized gains on assets held at the reporting date | | | 391 | | | | 104 | |
| Purchases | | | 401 | | | | 106 | |
| Ending balance at December 31, 2011 | | $ | 13,300 | | | $ | 3,566 | |
The fair values by asset category in each plan, along with their hierarchy levels, arewere as follows as of December 31, 20102011 (in thousands): | | | Hecla | | | Lucky Friday | | | Hecla | | | Lucky Friday | |
| | | Level 1 | | | Level 2 | | | Level 3 | | | Total | | | Level 1 | | | Level 2 | | | Level 3 | | | Total | | | Level 1 | | | Level 2 | | | Level 3 | | | Total | | | Level 1 | | | Level 2 | | | Level 3 | | | Total | |
| Interest-bearing cash | | $ | 1,495 | | | $ | — | | | $ | — | | | $ | 1,495 | | | $ | 466 | | | $ | — | | | $ | — | | | $ | 466 | | | $ | 609 | | | $ | — | | | $ | — | | | $ | 609 | | | $ | 166 | | | $ | — | | | $ | — | | | $ | 166 | |
| Common stock | | | 4,460 | | | | — | | | | — | | | | 4,460 | | | | 1,135 | | | | — | | | | — | | | | 1,135 | | | | 2,071 | | | | — | | | | — | | | | 2,071 | | | | 527 | | | | — | | | | — | | | | 527 | |
| Closely held instruments | | | — | | | | 3,660 | | | | 12,508 | | | | 16,168 | | | | — | | | | 994 | | | | 3,356 | | | | 4,350 | | |
| Partnership/joint venture interests | | | — | | | | 3,360 | | | | — | | | | 3,360 | | | | — | | | | 935 | | | | — | | | | 935 | | |
| Real estate | | | | — | | | | — | | | | 6,497 | | | | 6,497 | | | | — | | | | — | | | | 1,709 | | | | 1,709 | |
| Common collective funds | | | — | | | | 4,305 | | | | — | | | | 4,305 | | | | — | | | | 1,109 | | | | — | | | | 1,109 | | | | — | | | | 12,641 | | | | 6,803 | | | | 19,444 | | | | — | | | | 3,310 | | | | 1,857 | | | | 5,167 | |
| Mutual funds | | | 25,882 | | | | — | | | | — | | | | 25,882 | | | | 6,797 | | | | — | | | | — | | | | 6,797 | | | | 22,667 | | | | — | | | | — | | | | 22,667 | | | | 6,225 | | | | — | | | | — | | | | 6,225 | |
| Total fair value | | $ | 31,837 | | | $ | 11,325 | | | $ | 12,508 | | | $ | 55,670 | | | $ | 8,398 | | | $ | 3,038 | | | $ | 3,356 | | | $ | 14,792 | | | $ | 25,347 | | | $ | 12,641 | | | $ | 13,300 | | | $ | 51,288 | | | $ | 6,918 | | | $ | 3,310 | | | $ | 3,566 | | | $ | 13,794 | |
The following is a reconciliationroll-forward of assets in levelLevel 3 of the fair value hierarchy (in thousands): | | | Hecla | | | Lucky Friday | |
| Beginning balance at December 31, 2009 | | $ | 11,027 | | | $ | 2,947 | |
| Net unrealized gains on assets held at the reporting date | | | 1,237 | | | | 330 | |
| Purchases | | | 244 | | | | 79 | |
| Ending balance at December 31, 2010 | | $ | 12,508 | | | $ | 3,356 | |
| | | Hecla | | | Lucky Friday | |
| Beginning balance at December 31, 2010 | | $ | 12,508 | | | $ | 3,356 | |
| Net unrealized gains on assets held at the reporting date | | | 391 | | | | 104 | |
| Purchases | | | 401 | | | | 106 | |
| Ending balance at December 31, 2011 | | $ | 13,300 | | | $ | 3,566 | |
Of the $16.9 million reported as level 3 assets above, $8.2 million was comprised of real estate funds, while the remainder was invested in common collective funds.
Generally, investments are valued based on information provided by fund managers to our trustee as reviewed by management and its investment advisers. Mutual funds and equities are valued based on available exchange data. Commingled equity funds consist of publicly-traded investments. Fair value for real estate and private equity partnerships is primarily based on valuation methodologies that include third-party appraisals, comparable transactions, and discounted cash flow valuation models.
Future benefit payments, which reflect expected future service as appropriate, are estimates of what will be paid in the following years (in thousands): | | | | | | |
| 2012 | | $ | 4,474 | | | $ | 52 | |
| 2013 | | | 4,748 | | | | 57 | |
| 2014 | | | 4,905 | | | | 63 | |
| 2015 | | | 5,041 | | | | 65 | |
| 2016 | | | 5,343 | | | | 71 | |
| Years 2017-2021 | | | 32,141 | | | | 418 | |
| Year Ending December 31, | | Pension Plans | | | Other Post- Employment Benefit Plans | |
| 2013 | | $ | 4,769 | | | $ | 3 | |
| 2014 | | | 4,951 | | | | 8 | |
| 2015 | | | 5,083 | | | | 6 | |
| 2016 | | | 5,320 | | | | 8 | |
| 2017 | | | 5,601 | | | | 7 | |
| Years 2018-2022 | | | 34,011 | | | | 26 | |
We expect to contribute approximately $1.1$1.0 million to the Heclaour funded pension planplans and $0.3 million related to our unfunded supplemental executive retirement plan during 2012. We do not expect to contribute to the Lucky Friday pension plan during 2012.2013.
The following table describes plans for which accumulated benefit obligations ("ABO") were in excess of plan assets, and for which plan assets exceeded ABO (in thousands).
| | | December 31, 2011 | | December 31, 2010 | December 31, 2012 | | December 31, 2011 | |
| | | ABO Exceeds Plan Assets | | Plan Assets Exceed ABO | | ABO Exceeds Plan Assets | | Plan Assets Exceed ABO | ABO Exceeds Plan Assets | | Plan Assets Exceed ABO | | ABO Exceeds Plan Assets | | Plan Assets Exceed ABO | |
| Projected benefit obligation | | $ | 87,895 | | | $ | — | | | $ | 22,655 | | | $ | 54,269 | | | $ | 99,367 | | | $ | — | | | $ | 87,895 | | | $ | — | |
| Accumulated benefit obligation | | | 81,018 | | | | — | | | | 20,578 | | | | 48,857 | | | | 92,590 | | | | — | | | | 81,018 | | | | — | |
| Fair value of plan assets | | | 65,082 | | | | — | | | | 14,755 | | | | 55,707 | | | | 68,515 | | | | — | | | | 65,082 | | | | — | |
For the pension plans and other benefit plans, the following amounts are included in "Accumulated other comprehensive loss, net" on our balance sheet as of December 31, 2011,2012, that have not yet been recognized as components of net periodic benefit cost (in thousands): | | | | | | | |
| Unamortized net (gain)/loss | | $ | 28,450 | | | $ | (488 | ) |
| Unamortized prior service cost | | | 2,297 | | | | 219 | |
F- 39| | | Pension Benefits | | | Other Benefits | |
| Unamortized net (gain)/loss | | $ | 31,649 | | | $ | 305 | |
| Unamortized prior service cost | | | 1,896 | | | | — | |
The amounts in "Accumulated other comprehensive loss, net" expected to be recognized as components of net periodic benefit cost during 20122013 are (in thousands): | | | | | | | | | Pension Benefits | | | Other Benefits | |
| Amortization of net (gain)/loss | | $ | 2,826 | | | $ | (30 | ) | | $ | 3,103 | | | $ | 25 | |
| Amortization of prior service cost | | | 401 | | | | 44 | | | | 390 | | | | — | |
During 2012, weWe do not expect to have any of the plans’ assets returned.returned during 2013.Capital Accumulation Plans Our employees’ Capital Accumulation (401(k)) Plan is available to all U.S. salaried and certain hourly employees and applies immediately upon employment. Employees may contribute from 1% to 50% of their annual compensation to the plan.plan (subject to statutory limits). We make a matching contribution of 100% of an employee’s contribution up to but not exceeding, 6% of the employee’s earnings. Our matching contributions were approximately $2.5 million in 2012, $2.2 million in 2011, and $2.1 million in 2010, and $2.0 million in 2009.2010. We also maintain an employees’ 401(k) plan, which is available to all hourly employees at the Lucky Friday unit after completion of six months of service. Employees may contribute from 2% to 50% of their compensation to the plan.plan (subject to statutory limits). We make a matching contribution of 35% of an employee’s contribution up to but not exceeding, 5% of the employee’s earnings. In May 2010, union contract negotiations resulted in a change to the matching contribution of 35%. Starting after May 10, 2010 the matching contribution is 55% of an employee’s contribution up to, but not exceeding, 5% of the employee’s earnings. Our contributions were approximately $407,000 in 2012, $246,000 in 2011, and $229,000 in 2010, and $147,000 in 2009.2010.
Note 9: Shareholders’ Equity In May 2010 our shareholders votedWe are authorized to approve an amendment to our Certificate of Incorporation increasing the number of authorized shares of our common stock from 400,000,000 toissue 500,000,000 shares of common stock, $0.25 par value per share, of which 285,682,569285,998,136 shares of common stock were issued as of December 31, 2011.2012. All of our currently outstanding shares of common stock are listed on the New York Stock Exchange under the symbol “HL”.Subject to the rights of the holders of any outstanding shares of preferred stock, each share of common stock is entitled to: (i) one vote on all matters presented to the stockholders, with no cumulative voting rights; (ii) receive such dividends as may be declared by the Board of Directors out of funds legally available therefore;therefor; and (iii) in the event of our liquidation or dissolution, share ratably in any distribution of our assets.
Dividends
In September 2011 and February 2012, our Board of Directors adopted a common stock dividend policy that has two components: (1) a dividend that links the amount of any declared dividenddividends on our common stock to our average quarterly realized silver price in the preceding quarter. Thequarter, and (2) a minimum annual dividend of $0.01 per share of common stock, in each case, payable quarterly, when declared. For illustrative purposes only, the table below summarizes potential per share dividend amounts at different quarterly average realized price levels according to the first component of the policy:
Quarterly average realized silver price per ounce | | Quarterly dividend per share | | Annual dividend per share |
| $30 | | $0.01 | | $0.04 | |
| $35 | | $0.02 | | $0.08 | |
| $40 | | $0.03 | | $0.12 | |
| $45 | | $0.04 | | $0.16 | |
| $50 | | $0.05 | | $0.20 | |
| $55 | | $0.06 | | $0.24 | |
| $60 | | $0.07 | | $0.28 | |
| | Quarterly average realized silver price per ounce | | Quarterly dividend per share | | Annual dividend per share | |
| | $ 30 | | $0.01 | | $0.04 | |
| | $ 35 | | $0.02 | | $0.08 | |
| | $ 40 | | $0.03 | | $0.12 | |
| | $ 45 | | $0.04 | | $0.16 | |
| | $ 50 | | $0.05 | | $0.20 | |
| | $ 55 | | $0.06 | | $0.24 | |
| | $ 60 | | $0.07 | | $0.28 | |
On November 8, 2011,The following table summarizes the common stock dividends declared by our Board of Directors declaredunder the first quarterly silver price-linked dividend of $0.02 per share ($5.6 million total), based onpolicy described above:
| Declaration date | | (A) Silver-price- linked component per share | | (B) Minimum annual component per share | | (A+B) Total dividend per share | | Total dividend amount (in millions) | | Month of payment |
| November 8, 2011 | | $0.02 | | $0 | | $0.02 | | $5.6 | | December 2011 |
| February 17, 2012 | | $0.01 | | $0.0025 | | $0.0125 | | $3.6 | | March 2012 |
| May 8, 2012 | | $0.02 | | $0.0025 | | $0.0225 | | $6.4 | | June 2012 |
| August 7, 2012 | | $— | | $0.0025 | | $0.0025 | | $0.7 | | September 2012 |
| November 2, 2012 | | $0.02 | | $0.0025 | | $0.0225 | | $6.4 | | December 2012 |
| February 25, 2013 | | $— | | $0.0025 | | $0.0025 | | $0.7 | | anticipated in March 2013 |
Because the average realized silver price inprices for the third quartersecond and fourth quarters of 20112012 were $27.05 and $29.20 per ounce, respectively, below the minimum threshold of $37.02 per ounce. On$30 according to the policy, no silver-price-linked component was declared or paid. However, on February 17, 2012,25, 2013, our Board of Directors declared a silver price-linkedspecial common stock dividend, pursuant to the policy described above, of $0.01 per share based on the average realized silver price of $31.61 per ounce in the fourth quarter of 2011. In addition, in February 2012, our Board of Directors adopted a common stock dividend policy that includes a minimum annual dividend of $0.01 per share, of common stock, payable quarterly when declared, and declared ain addition to the minimum dividend of $0.0025 per share, pursuantfor an aggregate dividend of $3.6 million payable in March 2013. Prior to that policy. Therefore, the aggregate2011, no dividends had been declared on our common stock dividend declared by our Board of Directors was $0.0125 per share, for a total of approximately $3.6 million expected to be paid in the first quarter of 2012. since 1990. The declaration and payment of common stock dividends is at the sole discretion of our Board of Directors.
Registration StatementsCommon Stock Repurchase ProgramIn FebruaryOn May 8, 2012, we announced that our Board of 2010,Directors approved a stock repurchase program. Under the program, we filed a shelf registration statement on form S-3ASR with the U.S. Securities and Exchange Commission, allowing usare authorized to sell common and preferredrepurchase up to 20 million shares warrants, and debt securities upon the additional issuance of prospectus supplements. Net proceeds of any securities sold would be used for general corporate purposes unless indicated otherwise in an applicable prospectus supplement. We have issued no securities pursuant to this statement.Private Placement OfferingOn June 2, 2009, we entered into a definitive agreement to sell securities in a private placement for gross proceeds of approximately $60 million, which closed on June 4, 2009. The securities in the sale included:• | Approximately 17.4 million shares of our common stock. |
• | Series 4 warrants to purchase up to approximately 12.2 million shares of our common stock at an exercise price of $3.68 per share, subject to certain adjustments. The Series 4 warrants became exercisable on December 7, 2009, and all of these warrants have been exercised as of December 31, 2011. |
The units, includingour outstanding common stock from time to time in open market or privately negotiated transactions, depending on prevailing market conditions and warrants, were pricedother factors. The repurchase program may be modified, suspended or discontinued by us at $3.45any time. As of December 31, 2012, 350,300 shares have been repurchased under the program, at an average price of $5.54 per unit, resulting in gross proceedsshare, leaving 19.65 million shares that may yet be purchased under the program. The closing price of approximately $60 million. Net proceeds to us were approximately $57.6 million after related expenses (including placement fees). In arriving at the relative values of theour common stock and warrants, we used the Black-Scholes option pricing model with a risk-free interest rate of 1.99%, stock price at closing on the date before issuance of $3.33, volatility of 131%, dividend yield of 0%, and terms equal to the terms of the warrants. The relative values of our stock and warrants, in thousands, were:February 21, 2013, was $4.90 per share.| | | Shares | | | Value | |
| Common Stock | | | 17,391,302 | | | $ | 43,393 | |
| Series 4 warrants to purchase Common Stock | | | 12,173,913 | | | | 14,168 | |
| Total | | | | | | $ | 57,561 | |
Status of Warrants
In December 2008, we issued 10.2 million shares of common stock, Series 1 warrants to purchase 8.1 million shares of common stock, and Series 2 warrants to purchase 7.7 million shares of common stock. The Series 2 warrants expired in February 2009. In February 2009, we issued 36.8 million shares of common stock and Series 3 warrants to purchase 18.4 million shares of common stock. Each of these issuances were made pursuant to a shelf registration statement filed in September 2007, which became ineffective subsequent to the issuance in February 2009. The following table summarizes certain information about our stock purchase warrants at December 31, 2011:2012:
| Warrants Outstanding | Warrants | | Exercise Price | | Expiration Date |
| | | | | | |
| Series 1 warrants | 5,200,519 | | $ | 2.41 | | June 2014 |
| Series 1 warrants | 460,976 | | 2.52 | | June 2014 |
| Series 3 warrants | 16,671,128 | | 2.46 | | August 2014 |
| | | | | | |
| Total warrants outstanding | 22,332,623 | | | | |
| | Warrants | | | Exercise Price | | Expiration Date |
| | | | | | | | |
| Series 1 warrants | | | 5,200,519 | | | $ | 2.44 | | June 2014 |
| Series 1 warrants | | | 460,976 | | | | 2.55 | | June 2014 |
| Series 3 warrants | | | 16,671,128 | | | | 2.49 | | August 2014 |
| | | | | | | | | | |
| Total warrants outstanding | | | 22,332,623 | | | | | | |
During 2011, warrants to purchase approximately 2.1 million shares of our common stock were exercised, resulting in net proceeds to us of approximately $5.3 million. No warrants were exercised during 2012. Under the financial terms of the Consent Decree settling the Coeur d'Alene Basin litigation, the proceeds from the exercise of our outstanding warrants are towill be paid to the Plaintiffs within 30 days after the end of the quarter when exercised. ProceedsAs such, proceeds from Series 1 and Series 3 warrant exercises totaling approximately $10.5$0.7 million including the $5.3and $9.8 million in proceeds from exercises during 2011, were paid over to the Plaintiffs in 2012 and 2011, under the terms of the Consent Decree (see Note 7 for more information).respectively.
Preferred Stock
Our Chartercertificate of incorporation authorizes us to issue 5,000,000 shares of preferred stock, par value $0.25 per share. The preferred stock is issuable in series with such voting rights, if any, designations, powers, preferences and other rights and such qualifications, limitations and restrictions as may be determined by our Board of Directors. The Board may fix the number of shares constituting each series and increase or decrease the number of shares of any series. As of December 31, 2011,2012, 157,816 shares of Series B Preferred Stock were outstanding. Our Series B Preferred Stock is listed on the New York Stock Exchange under the symbol “HL PB.” On January 1, 2011, all 2,012,500 outstanding shares of our 6.5% Mandatory Convertible Preferred Stock were automatically converted to shares of our common stock at a conversion rate of 9.3773 shares of Common Stock for each share of 6.5% Mandatory Convertible Preferred Stock. We issued approximately 18.9 million shares of common stock in connection with the mandatory conversion. In connection with the Fourth Amendment of our credit agreement in February 2009, we established a new series of 12% Convertible Preferred Stock. Pursuant to the amended and restated credit agreement, 42,621 shares of the 12% Convertible Preferred Stock were issued to the lenders in February 2009 and valued at $4.3 million at the time of issuance. In addition, we agreed to issue to the lenders an aggregate amount of 12% Convertible Preferred Stock equal to 3.75% of the aggregate principal amount of the term facility outstanding on each subsequent July 1 and January 1 that the term loan was outstanding until the term facility was paid in full. However, we entered into a Fifth Amendment of our credit agreement in June 2009 which waived, through September 15, 2009, the 3.75% semiannual fee to be paid in the 12% Convertible Preferred Stock. The fee waiver was extended in September 2009 for an additional month, until October 15, 2009, and we repaid the remaining outstanding principal balance on the credit facility on October 14, 2009. See Note 6 for more information on our credit facilities.RankingIn July of 2009, certain holders of 12% Convertible Preferred Stock converted 13,700 shares of their preferred stock into 828,326 shares of Common Stock. In October of 2009, the holders of the remaining 12% Convertible Preferred Stock converted their remaining 28,921 preferred shares into 1,801,171 shares of Common Stock pursuant to the Certificate of Designations, and there are no longer any shares of 12% Convertible Preferred Stock outstanding.The Series B Preferred Stock ranks senior to our common stock and any shares of Series A Junior Participating Preferred shares (none of which have ever been issued) with respect to payment of dividends, and amounts upon liquidation, dissolution or winding up. While any shares of Series B Preferred Stock are outstanding, we may not authorize the creation or issue of any class or series of stock that ranks senior to the Series B Preferred Stock as to dividends or upon liquidation, dissolution or winding up without the consent of the holders of 66 2/3% of the outstanding shares of Series B Preferred Stock and any other series of preferred stock ranking on a parity with respect to the Series B Preferred Stock as to dividends and upon liquidation, dissolution or winding up, voting as a single class without regard to series.
Series B preferred stockholders are entitled to receive, when, as and if declared by the Board of Directors out of our assets legally available therefor, cumulative cash dividends at the rate per annum of $3.50 per share of Series B Preferred Stock. Dividends on the Series B Preferred Stock are payable quarterly in arrears on October 1, January 1, April 1 and July 1 of each year (and, in the case of any undeclared and unpaid dividends, at such additional times and for such interim periods, if any, as determined by the Board of Directors), at such annual rate. Dividends are cumulative from the date of the original issuance of the Series B Preferred Stock, whether or not in any dividend period or periods we have assets legally available for the payment of such dividends. Accumulations of dividends on shares of Series B Preferred Stock do not bear interest. We declared and paid our regular quarterly dividend of $0.875 per share on the outstanding Preferred B shares through the third quarter of 2008. Dividends on our 6.5% Mandatory Convertible Preferred Stock were payable on a cumulative basis when, as, and if declared by our board of directors, at an annual rate of 6.5% per share on the liquidation preference of $100 per share in cash, common stock, or a combination thereof, on January 1, April 1, July 1, and October 1 of each year to, and including, January 1, 2011. We declared and paid our quarterly dividends on the 6.5% Mandatory Convertible Preferred Stock through the third quarter of 2008. On August 29, 2008 the Board of Directors declared that the regular quarterly dividend on the outstanding 6.5% Mandatory Convertible Preferred Stock in the amount of $1.625 per share would be paid in common stock of Hecla, for a total amount of approximately $3.27 million in Hecla Common Stockcommon stock (with cash for fractional shares). The value of the shares of Common Stockcommon stock issued as dividends was calculated at 97% of the average of the closing prices of Hecla’s Common Stockour common stock over the five consecutive trading day period ending on the second trading day immediately preceding the dividend payment date.
On December 5, 2008 the Board of Directors announced that in the interest of cash conservation, quarterly payment of dividends to the holders of both the Hecla Series B Preferred Stock and the 6.5% Mandatory Convertible Preferred Stock would be deferred. On December 1, 2009, we announced that our Board of Directors elected to declare and pay all dividends in arrears and the dividend scheduled for the fourth quarter of 2009 for each of our outstanding series of preferred stock. In January 2010, the $0.7 million in dividends declared and unpaid on our Series B Preferred Stock was paid in cash, and the dividends declared and unpaid on our 6.5% Mandatory Convertible Preferred stock were paid in common stock, for a total amount of approximately $16.4 million in our common stock (with cash for fractional shares). We continued to declare and pay quarterly dividends on our Series B and 6.5% Mandatory Convertible Preferred Stock in 2010. Each quarterly dividend declared for the Series B Preferred Stock through 2010 was paid in cash, for a total of $0.6 million in cash dividends declared in 2010, or $3.50 per share. Dividends declared for the first and second quarters of 2010 for the 6.5% Mandatory Convertible Preferred Stock were paid in shares of common stock (with cash for fractional shares). The value of the shares of common stock issued as dividends was calculated at 97% of the average of the closing prices of our common stock over the five consecutive trading day period ending on the second day immediately preceding the dividend payment date. Dividends declared for the third and fourth quarters of 2010 for the 6.5% Mandatory Convertible Preferred Stock were paid in cash, for a total $6.5 million in cash dividends declared in 2010, or $3.25 per share. The fourth quarter dividend, which was the final dividend to be paid on the 6.5% Mandatory Convertible Preferred Stock as a result of its mandatory conversion to common stock, was paid in cash in January 2011. All quarterly dividends on our Series B Preferred Stock for 2011 and 2012 were declared and paid in cash. Redemption
The Series B Preferred Stock is redeemable at our option, in whole or in part, at $50 per share, plus, all dividends undeclared and unpaid on the Series B Preferred Stock up to the date fixed for redemption. The Series B preferred stockholders are entitled to receive, in the event that we are liquidated, dissolved or wound up, whether voluntary or involuntary, $50 per share of Series B Preferred Stock plus an amount per share equal to all dividends undeclared and unpaid thereon to the date of final distribution to such holders (the “Liquidation Preference”), and no more. Until the Series B preferred stockholders have been paid the Liquidation Preference in full, no payment will be made to any holder of Junior Stock upon our liquidation, dissolution or winding up. The term “Junior Stock” means our common stock and any other class of our capital stock issued and outstanding that ranks junior as to the payment of dividends or amounts payable upon liquidation, dissolution and winding up to the Series B Preferred Stock. As of December 31, 2011and 2010,2012 and 2011, our Series B Preferred Stock had a liquidation preference of $7.9 million.
Voting Rights
As of December 31, 2010, our 6.5% Mandatory Convertible Preferred Stock had a liquidation preference of $201.3 million, or $100 per share plus an amount per share equal to all dividends undeclared and unpaid thereon to the date of final distribution to such holders, and no more. However, as discussed above, all shares of 6.5% Mandatory Convertible Preferred Stock outstanding at December 31, 2010 converted to common stock on January 1, 2011.
Except in certain circumstances and as otherwise from time to time required by applicable law, the Series B preferred stockholders have no voting rights and their consent is not required for taking any corporate action. When and if the Series B preferred stockholders are entitled to vote, each holder will be entitled to one vote per share. Each share of Series B Preferred Stock is convertible, in whole or in part at the option of the holders thereof, into shares of common stock at a conversion price of $15.55 per share of common stock (equivalent to a conversion rate of 3.2154 shares of common stock for each share of Series B Preferred Stock). The right to convert shares of Series B Preferred Stock called for redemption will terminate at the close of business on the day preceding a redemption date (unless we default in payment of the redemption price).
Each share of our 6.5% Mandatory Convertible Preferred Stock automatically converted on January 1, 2011, into 9.3773 shares of our Common Stock, representing approximately 18.9 million common shares. Stock Award Plans
We use stock-based compensation plans to aid us in attracting, retaining and motivating our employees, as well as to provide us with the ability to provide incentives more directly linked to increases in stockholder value. These plans provide for the grant of options to purchase shares of our common stock and the issuance of restricted share units of our common stock. Stock-based compensation expense amounts recognized for the years ended December 31, 2012, 2011 2010 and 20092010 were approximately $3.1 million, $2.1 million, $3.4 million, and $2.7$3.4 million, respectively. Over the next twelve months, we expect to recognize approximately $1.5$2.0 million in additional compensation expense as the remaining options and units vest. Stock Incentive Plans
Our 1995 Stock Incentive Plan, as amended in 2004, authorized the issuance of up to 11.0 million shares of our common stock pursuant to the grant or exercise of awards under the plan. During 2009, 514,238 options to acquire shares expired under the 1995 plan, and such options became available for re-grant under the 1995 plan. However, the 1995 plan terminated in May 2010. During the second quarter of 2010, our shareholders voted to approve the adoption of our 2010 Stock Incentive Plan and to reserve up to 20,000,000 shares of common stock for issuance under the plan. The Board of Directors committee that administers the 2010 plan has broad authority to fix the terms and conditions of individual agreements with participants, including the duration of the award and any vesting requirements. AtAs of December 31, 2011,2012, there were 19,696,32019,605,740 shares available for future grant under the 2010 plan.
In 1995, we adopted the Hecla Mining Company Stock Plan for non-employee Directors (the “Directors’ Stock Plan”), which may be terminated by our Board of Directors at any time. Each non-employee director is to be credited on May 30 of each year with that number of shares determined by dividing $24,000 by the average closing price for our common stock on the New York Stock Exchange for the prior calendar year. All credited shares are held in trust for the benefit of each director until delivered to the director. Delivery of the shares from the trust occurs upon the earliest of: (1) death or disability; (2) retirement; (3) a cessation of the director’s service for any other reason; or (4) a change in control. The shares of our common stock credited to non-employee directors pursuant to the Directors’ Stock Plan may not be sold until at least six months following the date they are delivered. A maximum of one million shares of common stock may be granted pursuant to the Directors’ Stock Plan. During 2012, 2011 and 2010, respectively, 18,492, 22,884 and 2009, respectively, 22,884, 48,825 and 22,568 shares were credited to the non-employee directors. During 2012, 2011 and 2010, $80,000, $194,000 and 2009, $194,000, $168,000, and $84,000, respectively, were charged to operations associated with the Directors’ Stock Plan. At December 31, 2011,2012, there were 671,061622,685 shares available for grant in the future under the plan. In addition to the foregoing, commencing in 2010, in May of each year each non-employee director is also granted andan additional $24,000 worth of our common stock under our 2010 Stock Incentive Plan on the same terms as noted above (for a total of $48,000 in annual stock grants under the two plans). For 2012, 2011 and 2010, respectively, 59,484, 19,752 and 33,068 shares were credited to the non-employee directors, and $275,000, $147,000 and $263,000, respectively, were charged to operations associated with the 2010 Stock Incentive Plan.
Status of Stock Options
The fair value of the options granted during the yearsyear ended December 31, 2010 and 2009 were estimated on the date of grant using the Black-Scholes option-pricing model with the weighted average assumptions given below: | | | 2010 | | 2009 |
| Weighted average fair value of options granted | | $ | 3.18 | | | $ | 3.42 | |
| Expected stock price volatility | | | 92.00 | % | | | 90.00 | % |
| Risk-free interest rate | | | 1.43 | % | | | 1.99 | % |
| Expected life of options | | 2.9 years | | 2.7 years |
| | | 2010 | |
| Weighted average fair value of options granted | | $ | 3.18 | |
| Expected stock price volatility | | | 92.00 | % |
| Risk-free interest rate | | | 1.43 | % |
| Expected life of options (years) | | | 2.9 | |
Options were not granted during the yearyears ended December 31, 2012 and 2011.
We estimate forfeiture and volatility using historical information. The risk-free interest rate is based on the implied yield available on U.S. Treasury zero-coupon issues over the equivalent lives of the options. The expected life of the options represents the estimated period of time until exercise and is based on historical experience of similar awards, giving consideration to the contractual terms and vesting schedules. Prior to 2011, we had not paid dividends on common stock since 1990. Therefore, no assumption of dividend payment was made in the models used in the valuations of options granted in 2010 and 2009.2010.
During 2010, and 2009, respectively, options to acquire 352,517 and 559,685 shares were granted to our officers and key employees, with no options granted during 2011.2011 and 2012. Of the options granted in 2010, and 2009, 322,854 and 559,685, respectively, were granted without vesting requirements. The aggregate intrinsic value of options outstanding and exercisable as of December 31, 20112012 before applicable income taxes was $0.6$0.9 million, based on our closing stock price of $5.23$5.83 per common share at December 31, 2011.2012. All options outstanding were fully vested at December 31, 2011.2012. Transactions concerning stock options pursuant to our stock option plans are summarized as follows: | | Shares Subject to Options | | |
| Outstanding, December 31, 2010 | 1,269,668 | | $ | 6.68 | |
| Exercised | (74,872) | | $ | 6.40 | |
| Outstanding, December 31, 2011 | 1,194,796 | | $ | 6.72 | |
| | | Shares Subject to Options | | | Weighted Average Exercise Price | |
| Outstanding, December 31, 2011 | | | 1,194,796 | | | $ | 6.72 | |
| Expired | | | (256,388 | ) | | $ | 8.56 | |
| Outstanding, December 31, 2012 | | | 938,408 | | | $ | 6.23 | |
All of the outstanding options above were exercisable at December 31, 2011.2012. The weighted average remaining contractual term of options outstanding and exercisable at December 31, 20112012 was two years.one year.
There were no options exercised during 2012. The aggregate intrinsic values of options exercised during the years ended December 31, 2011 2010, and 20092010 were approximately $0.6 million and $1.5 million, and $22,000, respectively. We received cash proceeds of $0.5 million for options exercised in 2011 and $3.4 million for options exercised in 2010, and $36,000 for options exercised in 2009.2010. Restricted Stock Units
Unvested restricted stock units, for which the board of directors has approved grants to employees, are summarized as follows:
| | | Shares | | | Weighted Average Grant Date Fair Value per Share | |
| Unvested, January 1, 2012 | | | 561,276 | | | $ | 6.39 | |
| Granted | | | 723,669 | | | $ | 4.51 | |
| Canceled | | | (16,461 | ) | | $ | 7.29 | |
| Distributed | | | (231,338 | ) | | $ | 6.65 | |
| Unvested, December 31, 2012 | | | 1,037,146 | | | $ | 5.11 | |
| | Shares | | |
| Unvested, January 1, 2011 | 388,501 | | $ | 4.94 | |
| Granted | 498,576 | | $ | 6.98 | |
| Canceled | (10,975) | | $ | 7.29 | |
| Distributed | (314,826) | | $ | 5.50 | |
| Unvested, December 31, 2011 | 561,276 | | $ | 6.39 | |
Of the 561,2761,037,146 units unvested at December 31, 2011, 248,0102012, 202,662 will vest in June 2012 and 161,5912013, 180,732 will vest in March 2014.2014, and 145,952 will vest in June 2015 and June 2016, respectively. Remaining units will be distributable based on predetermined dates as elected by the participants, unless participants forfeit their units through termination of employment in advance of vesting. We have recognized approximately $1.5$2.0 million in compensation expense since grant date, and will record an additional $2.2$3.3 million in compensation expense over the remaining vesting period related to these units. 54,870 stock units vested in 2012 and 314,826 stock units in aggregate, vested in January and May 2011 and were distributed or deferred as elected by the recipients under the provisions of the deferred compensation plan. We recognized approximately $0.2 million and $0.5 million in compensation expense related to these units in 2011.2012 and 2011, respectively. In connection with the vesting of restricted stock units, employees usually, at their election, choose to satisfy their tax withholding obligations through net share settlement, pursuant to which the Company withholds the number of shares necessary to satisfy such withholding obligations. As a result, in 20112012 we repurchased 56,68845,341 shares for $0.5$0.2 million, or approximately $8.28$4.47 per share.
Note 10: Derivative Instruments
At times, we use commodity forward sales commitments, commodity swap contracts and commodity put and call option contracts to manage our exposure to fluctuation in the prices of certain metals which we produce. Contract positions are designed to ensure that we will receive a defined minimum price for certain quantities of our production, thereby partially offsetting our exposure to fluctuations in the market. These instruments do, however, expose us to other risks, including the amount by which the contract price exceeds the spot price of a commodity, and nonperformance by the counterparties to these agreements. In April 2010, we began utilizingWe utilize financially-settled forward contracts to sell lead and zinc at fixed prices for settlement at approximately the same time that our unsettled concentrate sales contracts will settle. The settlement of each concentrate contract is based on the average spot price of the metal during the month of settlement, which may differ from the prices used to record the sale when the sale takes place. The objective of the contracts is to manage the exposure to changes in prices of zinc and lead contained in our concentrate shipments between the time of sale and final settlement. These contracts do not qualify for hedge accounting and are marked-to-market through earnings each period. At December 31, 2011,2012, we recorded a current asset of $0.3$2.3 million, which is included in other current assets, for the fair value of the contracts. We recognized a $7.2$1.3 million net gainloss on the contracts during 2011,2012, which is included in sales of products. The net gainloss recognized on the contracts offset price adjustments on our provisional concentrate sales related to changes to lead and zinc prices between the time of sale and final settlement.In addition, in May 2010 we began utilizingutilize financially-settled forward contracts to manage the exposure of changes in prices of zinc and lead contained in our forecasted future concentrate shipments. These contracts also do not qualify for hedge accounting and are marked-to-market through earnings each period. At December 31, 2011,2012, we recorded a current asset of $17.7$5.6 million, which is included in other current assets, and a non-current assetliability of $14.7$2.5 million, which is included in other non-current assets,liabilities, for the fair value of the contracts.contracts The current asset balance is net of approximately $0.7$1.0 million for contracts that were in a fair value liability position at December 31, 2011.2012. The non-current liability balance is net of approximately $0.1 million for contracts that were in a fair value asset position at December 31, 2012. We recognized a $38.0$10.5 million net gainloss on the contracts, net of $13.4which includes $18.4 million in lossesgains realized on settled contracts, during 2011.2012. The net gainloss on these contracts is included as a separate line item under other income (expense), as they relate to forecasted future shipments, as opposed to sales that have already taken place but are subject to final pricing. The gainslosses recognized during 20112012 are the result of decreasingincreasing lead and zinc prices during the end of 2011.2012. However, this program is designed to mitigate the impact of potential future declines in lead and zinc prices from the price levels established in the contracts (see average price information below). The following tables summarize the quantities of base metals committed under forward sales contracts at December 31, 20112012 and December 31, 2010:
| | Metric tonnes under contract | | | Average price per pound | |
| | | Zinc | | | Lead | | | Zinc | | | Lead | |
| Contracts on provisional sales | | | | | | | | | | | | |
| 2012 settlements | | | 9,600 | | | | 2,600 | | | $ | 0.86 | | | $ | 0.89 | |
| | | | | | | | | | | | | | | | | |
| Contracts on forecasted sales | | | | | | | | | | | | | | | | |
| 2012 settlements | | | 20,500 | | | | 15,900 | | | $ | 1.12 | | | $ | 1.12 | |
| 2013 settlements | | | 8,275 | | | | 11,150 | | | $ | 1.14 | | | $ | 1.17 | |
| | Metric tonnes under contract | | | Average price per pound | |
| | | Zinc | | | Lead | | | Zinc | | | Lead | |
| Contracts on provisional sales | | | | | | | | | | | | |
| 2011 settlements | | | 11,575 | | | | 3,925 | | | $ | 1.05 | | | $ | 1.11 | |
| | | | | | | | | | | | | | | | | |
| Contracts on forecasted sales | | | | | | | | | | | | | | | | |
| 2011 settlements | | | 19,475 | | | | 15,550 | | | $ | 0.96 | | | $ | 0.96 | |
| 2012 settlements | | | 21,475 | | | | 15,000 | | | $ | 1.11 | | | $ | 1.11 | |
| December 31, 2012 | | Pounds under contract (in thousands) | | | Average price per pound | |
| | | Zinc | | | Lead | | | Zinc | | | Lead | |
| Contracts on provisional sales | | | | | | | | | | | | |
| 2013 settlements | | | 14,991 | | | | 6,945 | | | $ | 0.95 | | | $ | 1.00 | |
| | | | | | | | | | | | | | | | | |
| Contracts on forecasted sales | | | | | | | | | | | | | | | | |
| 2013 settlements | | | 35,935 | | | | 32,794 | | | $ | 0.96 | | | $ | 1.11 | |
| 2014 settlements | | | 30,203 | | | | 33,069 | | | $ | 0.98 | | | $ | 1.03 | |
| 2015 settlements | | | 3,307 | | | | 23,534 | | | $ | 1.01 | | | $ | 1.06 | |
| December 31, 2011 | | Pounds under contract (in thousands) | | | Average price per pound | |
| | | Zinc | | | Lead | | | Zinc | | | Lead | |
| Contracts on provisional sales | | | | | | | | | | | | |
| 2012 settlements | | | 21,164 | | | | 5,732 | | | $ | 0.86 | | | $ | 0.89 | |
| | | | | | | | | | | | | | | | | |
| Contracts on forecasted sales | | | | | | | | | | | | | | | | |
| 2012 settlements | | | 45,195 | | | | 35,053 | | | $ | 1.12 | | | $ | 1.12 | |
| 2013 settlements | | | 18,243 | | | | 24,582 | | | $ | 1.14 | | | $ | 1.17 | |
As further discussed in Note 18, production at the Lucky Friday mine will bewas temporarily suspended due to the requirement to remove loosebuilt-up cementitious material from the Silver Shaft. As a result, during the first quarter of 2012, we liquidated forward contracts related to forecasted Lucky Friday base metal sales for total net proceeds of $3.1 million.
Our concentrate sales are based on a provisional sales price containing an embedded derivative that is required to be separated from the host contract for accounting purposes. The host contract is the receivable from the sale of the concentrates at the forward price at the time of the sale. The embedded derivative, which does not qualify for hedge accounting, is adjusted to market through earnings each period prior to final settlement. In May 2008, we entered into an interest rate swap that had the economic effect of modifying the variable interest obligation associated with our term credit facility in place at that time to be fixed until the scheduled maturity date. In February 2009, we reached an agreement to amend the terms of our credit facilities to defer all scheduled term facility principal payments due in 2009, totaling $66.7 million, to 2010 and 2011. On June 8, 2009, we repaid $57.1 million of the outstanding term credit facility balance using proceeds from a private placement equity offering (see Note 9 for more information), and on June 29, 2009, we repaid an additional $18.2 million of the outstanding term facility balance as a part of another amendment to our term credit facility (see Note 6). As a result of these credit facility amendments and repayments, the hedging relationship was de-designated and a new hedging relationship was re-designated in each case. A final retrospective hedge effectiveness assessment was performed on the prior hedging relationships at the date of each de-designation, and only a May 5, 2008 hedging relationship was determined to be ineffective for the first quarter ended March 31, 2009. Consequently, the change in fair value of the swap of $0.2 million between December 31, 2008 and February 3, 2009 was recorded as a gain on the income statement. The amount of unrealized loss included in accumulated other comprehensive income relating to the prior hedge was recognized in the income statement in the third quarter of 2009, as the remaining term facility balance was repaid in October 2009.The following table summarizes the effect of our interest rate swap on our balance sheet and statement of operations as of and for the year ended December 31, 2009 (in thousands):
Loss reclassified from accumulated other comprehensive loss to interest expense | $ | 1,967 | |
| Loss recognized in interest expense related to the ineffective portion | 213 | |
We recognized net losses related to the interest rate swap, including losses reclassified from accumulated other comprehensive loss and losses related to the ineffective portion of the swap, of $2.7 million for the year ended December 31, 2009, which were included in interest expense.Note 11: Business Segments and Significant Customers We discover, acquire, develop, produce, and market concentrates and doré containing silver, gold, lead and zinc. Our products consist of both metal concentrates, which we sell to custom smelters, and unrefined bullion bars (doré(doré), which may be sold as dorédoré or further refined before sale to precious metals traders. We are currently organized and managed by two segments, which represent our operating units: the Greens Creek unit and the Lucky Friday unit. General corporate activities not associated with operating units and their various exploration activities, as well as discontinued operations and idle properties, are presented as “other.” Interest expense, interest income and income taxes are considered general corporate items, and are not allocated to our segments. Sales of metal concentrates and metal products are made principally to custom smelters and metals traders. The percentage of sales contributed by each segment is reflected in the following table: | | | Year Ended December 31, |
| | | 2011 | | 2010 | | 2009 |
| Greens Creek | | | 71.8 | % | | | 74.8 | % | | | 73.4 | % |
| Lucky Friday | | | 28.2 | % | | | 25.2 | % | | | 26.6 | % |
| | | | 100 | % | | | 100 | % | | | 100 | % |
| | | Year Ended December 31, | |
| | | 2012 | | | 2011 | | | 2010 | |
| Greens Creek | | | 100.0 | % | | | 71.8 | % | | | 74.8 | % |
| Lucky Friday | | | — | | | | 28.2 | % | | | 25.2 | % |
| | | | 100 | % | | | 100 | % | | | 100 | % |
The tables below present information about reportable segments as of and for the years ended December 31, 2012, 2011 2010 and 20092010 (in thousands).
| | | 2012 | | | 2011 | | | 2010 | |
| Net sales to unaffiliated customers: | | | | | | | | | |
| Greens Creek | | $ | 320,895 | | | $ | 342,906 | | | $ | 313,318 | |
| Lucky Friday | | | 248 | | | | 134,728 | | | | 105,495 | |
| | | $ | 321,143 | | | $ | 477,634 | | | $ | 418,813 | |
| Income (loss) from operations: | | | | | | | | | | | | |
| Greens Creek | | $ | 138,245 | | | $ | 181,116 | | | $ | 138,973 | |
| Lucky Friday | | | (25,179 | ) | | | 75,608 | | | | 48,639 | |
| Other | | | (75,200 | ) | | | (59,079 | ) | | | (239,167 | ) |
| | | $ | 37,866 | | | $ | 197,645 | | | $ | (51,555 | ) |
| Capital additions (including non-cash additions): | | | | | | | | | | | | |
| Greens Creek | | $ | 62,184 | | | $ | 41,657 | | | $ | 18,280 | |
| Lucky Friday | | | 55,998 | | | | 60,454 | | | | 54,370 | |
| Other | | | 11,760 | | | | 35,274 | | | | 2,089 | |
| | | $ | 129,942 | | | $ | 137,385 | | | $ | 74,739 | |
| Depreciation, depletion and amortization: | | | | | | | | | |
| Greens Creek | | $ | 43,522 | | | $ | 41,013 | | | $ | 51,671 | |
| Lucky Friday | | | — | | | | 6,053 | | | | 8,340 | |
| | | $ | 43,522 | | | $ | 47,066 | | | $ | 60,011 | |
| Other significant non-cash items: | | | | | | | | | | | | |
| Greens Creek | | $ | 4,037 | | | $ | 2,326 | | | $ | 17,829 | |
| Lucky Friday | | | 92 | | | | 14 | | | | 5,053 | |
| Other | | | 33,922 | | | | 31,470 | | | | 57,651 | |
| | | $ | 38,051 | | | $ | 33,810 | | | $ | 80,533 | |
| Identifiable assets: | | | | | | | | | | | | |
| Greens Creek | | $ | 741,666 | | | $ | 729,289 | | | $ | 740,573 | |
| Lucky Friday | | | 226,196 | | | | 213,285 | | | | 170,928 | |
| Other | | | 410,428 | | | | 453,516 | | | | 470,992 | |
| | | $ | 1,378,290 | | | $ | 1,396,090 | | | $ | 1,382,493 | |
| | | 2011 | | | 2010 | | | 2009 |
| Net sales from continuing operations to unaffiliated customers: | | | | | | | | |
| Greens Creek | | $ | 342,906 | | | $ | 313,318 | | | $ | 229,318 | |
| Lucky Friday | | | 134,728 | | | | 105,495 | | | | 83,230 | |
| | | $ | 477,634 | | | $ | 418,813 | | | $ | 312,548 | |
| Income (loss) from operations: | | | | | | | | | | | | |
| Greens Creek | | $ | 181,116 | | | $ | 138,973 | | | $ | 79,329 | |
| Lucky Friday | | | 75,608 | �� | | | 48,639 | | | | 27,146 | |
| Other | | | (59,079 | ) | | | (239,167 | ) | | | (31,203 | ) |
| | | $ | 197,645 | | | $ | (51,555 | ) | | $ | 75,272 | |
| Capital additions (including non-cash additions): | | | | | | | | | | | | |
| Greens Creek | | $ | 41,657 | | | $ | 18,280 | | | $ | 17,520 | |
| Lucky Friday | | | 60,454 | | | | 54,370 | | | | 15,990 | |
| Other | | | 35,274 | | | | 2,089 | | | | 30 | |
| | | $ | 137,385 | | | $ | 74,739 | | | $ | 33,540 | |
Depreciation, depletion and amortization from continuing operations: | | | | | | | | |
| Greens Creek | | $ | 41,013 | | | $ | 51,671 | | | $ | 52,909 | |
| Lucky Friday | | | 6,053 | | | | 8,340 | | | | 9,928 | |
| | | $ | 47,066 | | | $ | 60,011 | | | $ | 62,837 | |
| Other significant non-cash items from continuing operations: | | | | | | | | | | | | |
| Greens Creek | | $ | 2,326 | | | $ | 17,829 | | | $ | 2,974 | |
| Lucky Friday | | | 14 | | | | 5,053 | | | | 22 | |
| Other | | | 31,470 | | | | 57,651 | | | | (6,687 | ) |
| | | $ | 33,810 | | | $ | 80,533 | | | $ | (3,691 | ) |
| Identifiable assets: | | | | | | | | | | | | |
| Greens Creek | | $ | 729,289 | | | $ | 740,573 | | | $ | 771,433 | |
| Lucky Friday | | | 213,285 | | | | 170,928 | | | | 116,797 | |
| Other | | | 453,516 | | | | 470,992 | | | | 158,554 | |
| | | $ | 1,396,090 | | | $ | 1,382,493 | | | $ | 1,046,784 | |
The following is sales information by geographic area based on the location of smelters (for concentrate shipmentsshipments) and the location of parent company forcompanies (for doré sales from continuing operations to metal traders,metals traders) for the years ended December 31, 2012, 2011 and 2010 (in thousands): | | | 2011 | | | 2010 | | | 2009 | | | 2012 | | | 2011 | | | 2010 | |
| United States | | $ | 24,409 | | | $ | 24,708 | | | $ | 19,127 | | | $ | 25,438 | | | $ | 24,409 | | | $ | 24,708 | |
| Canada | | | 240,569 | | | | 124,862 | | | | 136,248 | | | | 34,441 | | | | 240,569 | | | | 124,862 | |
| Mexico | | | — | | | | 16,258 | | | | 20,413 | | | | — | | | | — | | | | 16,258 | |
| Japan | | | 60,963 | | | | 62,740 | | | | 43,356 | | | | 70,371 | | | | 60,963 | | | | 62,740 | |
| Korea | | | 92,919 | | | | 94,114 | | | | 77,492 | | | | 120,106 | | | | 92,919 | | | | 94,114 | |
| China | | | 51,635 | | | | 73,257 | | | | 15,912 | | | | 72,133 | | | | 51,635 | | | | 73,257 | |
| Belgium | | | — | | | | 25,907 | | | | — | | | | — | | | | — | | | | 25,907 | |
| Total, excluding gains/losses on forward contracts | | $ | 470,495 | | | $ | 421,846 | | | $ | 312,548 | | | $ | 322,489 | | | $ | 470,495 | | | $ | 421,846 | |
Sales of products for the year ended December 31, 20112012 also include a net gainloss of $7.1$1.3 million on financially-settled forward contracts for lead and zinc contained in our concentrate sales. 2011 sales included a net gain of $7.1 million and 2010 sales included a net loss of $3.0 million on the contracts. See Note 10 for more information. The following are our long-lived assets by geographic area as of December 31, 2012 and 2011 (in thousands): | | | 2011 | | | 2010 | |
| United States | | $ | 923,040 | | | $ | 833,186 | |
| Canada | | | 99 | | | | 10 | |
| Mexico | | | 73 | | | | 92 | |
| | | $ | 923,212 | | | $ | 833,288 | |
| | | 2012 | | | 2011 | |
| United States | | $ | 996,405 | | | $ | 923,040 | |
| Canada | | | 198 | | | | 99 | |
| Mexico | | | 56 | | | | 73 | |
| | | $ | 996,659 | | | $ | 923,212 | |
Sales from continuing operations to significant metals customers as a percentage of total sales were as follows for the years ended December 31, 2012, 2011 2010 and 2009:2010:
| | | Year Ended December 31, | | Year Ended December 31, | |
| | | 2011 | | 2010 | | 2009 | | 2012 | | | 2011 | | | 2010 | |
| Teck Metals Ltd. | | | 51.1 | % | | | 29.6 | % | | | 43.6 | % | | | 10.7 | % | | | 51.1 | % | | | 29.6 | % |
| Korea Zinc | | | 18.4 | % | | | 20.7 | % | | | 23.4 | % | | | 37.2 | % | | | 18.4 | % | | | 20.7 | % |
| Trafigura AG | | | 12.4 | % | | | 17.4 | % | | | — | | | | 22.4 | % | | | 12.4 | % | | | 17.4 | % |
| MS Zinc | | | | 12.3 | % | | | 6.9 | % | | | 7.0 | % |
Note 12: Fair Value Measurement The table below sets forth our assets and liabilities (in thousands) that were accounted for at fair value on a recurring basis and the fair value calculation input hierarchy level that we have determined applies to each asset and liability category. See Note 8 for information on the fair values of our defined benefit pension plan assets.
| | | | | | | | |
| Assets: | | | | | | | |
| | | | | | | | |
| Cash and cash equivalents: | | | | | | | |
| Money market funds and other bank deposits | | $ | 266,463 | | | $ | 283,606 | | Level 1 |
| | | | | | | | | | |
| Available for sale securities: | | | | | | | | | |
| Equity securities – mining industry | | | 3,923 | | | | 2,668 | | Level 1 |
| | | | | | | | | | |
| Trade accounts receivable: | | | | | | | | | |
| Receivables from provisional concentrate sales | | | 10,996 | | | | 36,295 | | Level 2 |
| | | | | | | | | | |
| Derivative contracts: | | | | | | | | | |
| Base metal forward contracts | | | 32,750 | | | | — | | Level 2 |
| | | | | | | | | | |
| Restricted cash balances: | | | | | | | | | |
| Certificates of deposit and other bank deposits | | | 866 | | | | 10,314 | | Level 1 |
| | | | | | | | | | |
| Total assets | | $ | 314,998 | | | $ | 332,883 | | |
| | | | | | | | | | |
| Liabilities: | | | | | | | | | |
| | | | | | | | | | |
| Derivative contracts: | | | | | | | | | |
| Base metal forward contracts | | $ | — | | | $ | 21,260 | | Level 2 |
| | | Balance at December 31, 2012 | | | Balance at December 31, 2011 | | Input Hierarchy Level |
| Assets: | | | | | | | |
| | | | | | | | |
| Cash and cash equivalents: | | | | | | | |
| Money market funds and other bank deposits | | $ | 190,984 | | | $ | 266,463 | | Level 1 |
| | | | | | | | | | |
| Available for sale securities: | | | | | | | | | |
| Equity securities – mining industry | | | 9,614 | | | | 3,923 | | Level 1 |
| | | | | | | | | | |
| Trade accounts receivable: | | | | | | | | | |
| Receivables from provisional concentrate sales | | | 17,555 | | | | 10,996 | | Level 2 |
| | | | | | | | | | |
| Derivative contracts: | | | | | | | | | |
| Base metal forward contracts | | | 5,606 | | | | 32,750 | | Level 2 |
| | | | | | | | | | |
| Restricted cash balances: | | | | | | | | | |
| Certificates of deposit and other bank deposits | | | 871 | | | | 866 | | Level 1 |
| | | | | | | | | | |
| Total assets | | $ | 224,630 | | | $ | 314,998 | | |
| | | | | | | | | | |
| Liabilities: | | | | | | | | | |
| | | | | | | | | | |
| Derivative contracts: | | | | | | | | | |
| Base metal forward contracts | | $ | 2,483 | | | $ | — | | Level 2 |
Cash and cash equivalents consist primarily of money market funds and are valued at cost, which approximates fair value.
Current and non-current restricted cash balances consist primarily of certificates of deposit and U.S. Treasury securities and are valued at cost, which approximates fair value.
Our current and non-current investments consist of marketable equity securities which are valued using quoted market prices for each security multiplied by the number shares held by us.
Trade accounts receivable consist of amounts due to us for shipments of concentrates and dorédoré sold to smelters and refiners. Revenues and the corresponding accounts receivable for sales of metals products are recorded when title and risk of loss transfer to the customer (generally at the time of shipment). Sales of concentrates are recorded using estimated forward prices for the anticipated month of settlement applied to our estimate of payable metal quantities contained in each shipment. Sales are recorded net of estimated treatment and refining charges, which are also impacted by changes in metals prices and quantities of contained metals. We must estimate the prices at which sales of our concentrates will be settled due to the time elapsed between shipment and final settlement with the smelter. Receivables for previously recorded concentrate sales are adjusted to reflect estimated settlement metals prices at the end of each period until final settlement by the smelter. We obtain the forward metals prices used each period from a pricing service. Changes in metal prices between shipment and final settlement will result in changes to revenues previously recorded upon shipment. The embedded derivative contained in our concentrate sales is adjusted to fair market value through earnings each period prior to final settlement.
During the second quarter of 2010, we began utilizing financially-settled forward contracts to manage the exposure of changes in prices of zinc and lead contained in our concentrate shipments that have not reached final settlement. We also began utilizing financially-settled forward contracts in the second quarter of 2010 to manage the exposure of changes in prices of zinc and lead contained in our forecasted future concentrate shipments (see Note 10 for more information). These contracts do not qualify for hedge accounting, and are marked-to-market through earnings each period. The fair value of each contract represents the difference between the forward metal price for the contract settlement period as of the measurement date and the contract settlement metal price, multiplied by the quantity of metal involved in the contract.
Note 13: Income (Loss) per Common Share
We calculate basic earnings per share using, as the denominator, the weighted average number of common shares outstanding during the period. Diluted earnings per share uses, as its denominator, the weighted average number of common shares outstanding during the period plus the effect of potential dilutive common shares during the period using the treasury stock method for options, warrants, and restricted stock units, and if-converted method for convertible preferred shares. Potential dilutive common shares include outstanding stock options, restricted stock awards, stock units, warrants and convertible preferred stock for periods in which we have reported net income. For periods in which we reported net losses, potential dilutive common shares are excluded, as their conversion and exercise would not reduce earnings per share. Under the if-converted method, preferred shares would not dilute earnings per share in any of the periods presented. A total of 157,814 shares of preferred stock were outstanding at December 31, 2011.2012. The following table represents net income (loss) per common share – basic and diluted (in thousands, except earnings per share):
| | | Year ended December 31, | | Year ended December 31, | |
| | | 2011 | | | 2010 | | | 2009 | | 2012 | | | 2011 | | | 2010 | |
| Numerator | | | | | | | | | | | | | | | | | |
| Net income | | $ | 151,164 | | | $ | 48,983 | | | $ | 67,826 | | | $ | 14,954 | | | $ | 151,164 | | | $ | 48,983 | |
| Preferred stock dividends | | | (552 | ) | | | (13,633 | ) | | | (13,633 | ) | | | (552 | ) | | | (552 | ) | | | (13,633 | ) |
| Net income (loss) applicable to common shares | | $ | 150,612 | | | $ | 35,350 | | | $ | 54,193 | | |
| Net income applicable to common shares | | | $ | 14,402 | | | $ | 150,612 | | | $ | 35,350 | |
| | | | | | | | | | | | | | | | | | | | | | | | |
| Denominator | | | | | | | | | | | | | | | | | | | | | | | |
| Basic weighted average common shares | | | 280,956 | | | | 251,146 | | | | 224,933 | | | | 285,375 | | | | 280,956 | | | | 251,146 | |
| Dilutive stock options, restricted stock, and warrants | | | 16,077 | | | | 18,455 | | | | 8,685 | | | | 12,191 | | | | 16,077 | | | | 18,455 | |
| Diluted weighted average common shares | | | 297,033 | | | | 269,601 | | | | 233,618 | | | | 297,566 | | | | 297,033 | | | | 269,601 | |
| | | | | | | | | | | | | | | | | | | | | | | | |
| Basic earnings per common share | | $ | 0.54 | | | $ | 0.14 | | | $ | 0.24 | | | $ | 0.05 | | | $ | 0.54 | | | $ | 0.14 | |
| Diluted earnings per common share | | $ | 0.51 | | | $ | 0.13 | | | $ | 0.23 | | | $ | 0.05 | | | $ | 0.51 | | | $ | 0.13 | |
For the years ended December 31, 2012, 2011 2010 and 2009,2010, we excluded options and warrants whose exercise prices exceeded the average prices of our stock during the periods, as their exercises would not have reduced earnings per share. The following options and warrants were excluded:
| | | Year ended December 31, | |
| | | 2011 | | 2010 | | 2009 | |
| Stock options | | | 552,388 | | | | 596,388 | | | | 1,022,240 | | |
| Warrants to purchase common shares | | | — | | | | — | | | | 12,173,913 | | |
| Total potential dilutive common shares | | | 552,388 | | | | 596,388 | | | | 13,196,153 | | |
| | | Year ended December 31, | |
| | | 2012 | | | 2011 | | | 2010 | |
| Stock options | | | 570,005 | | | | 552,388 | | | | 596,388 | |
Note 14: Other Comprehensive Income (Loss)
The following table lists the beginning balance, yearly activity and ending balance of each component of "Accumulated other comprehensive loss, net" (in thousands):
| | | Unrealized Gains (Losses) On Securities | | | Adjustments For Pension Plans | | | Total Accumulated Other Comprehensive Loss, Net | |
| Balance January 1, 2010 | | $ | 744 | | | $ | (14,927 | ) | | $ | (14,183 | ) |
| 2010 change | | | 718 | | | | (1,652 | ) | | | (934 | ) |
| Balance December 31, 2010 | | | 1,462 | | | | (16,579 | ) | | | (15,117 | ) |
| 2011 change | | | (627 | ) | | | (7,754 | ) | | | (8,381 | ) |
| Balance December 31, 2011 | | | 835 | | | | (24,333 | ) | | | (23,498 | ) |
| 2012 change | | | 1,224 | | | | (1,644 | ) | | | (420 | ) |
| Balance December 31, 2012 | | $ | 2,059 | | | $ | (25,977 | ) | | $ | (23,918 | ) |
| | | | | | | | | | | | | |
| Balance January 1, 2009 | | $ | (2,122 | ) | | $ | (20,933 | ) | | $ | (1,967 | ) | | $ | (25,022 | ) |
| 2009 change | | | 2,866 | | | | 6,006 | | | | 1,967 | | | | 10,839 | |
| Balance December 31, 2009 | | | 744 | | | | (14,927 | ) | | | — | | | | (14,183 | ) |
| 2010 change | | | 718 | | | | (1,652 | ) | | | — | | | | (934 | ) |
| Balance December 31, 2010 | | | 1,462 | | | | (16,579 | ) | | | — | | | | (15,117 | ) |
| 2011 change | | | (627 | ) | | | (7,754 | ) | | | — | | | | (8,381 | ) |
| Balance December 31, 2011 | | $ | 835 | | | $ | (24,333 | ) | | $ | — | | | $ | (23,498 | ) |
The $7.8$1.6 million change in adjustments for pension plans for 20112012 is net of $5.3$1.1 million for the income tax effect of such adjustments. The $0.6$1.2 million change in unrealized gains (losses) on securities is net of $0.4$1.2 million for the reclassification to current earnings of impairment of an equity security, as we deemed the impairment to be other-than-temporary. The 2012 change in unrealized gains (losses) on securities is also net of $0.3 million for the income tax effect of such adjustments, with some securities owned by our Mexican subsidiary. The $2.0 million activity in changes in derivatives contracts is related to an interest rate swap utilized to modify the variable interest obligations associated with our term credit facility, the balance of which was repaid in October 2009.See Note 2 for more information on our marketable securities and Note 8 for more information on our employee benefit plans. Note 15: Related Party Transactions During 2008, we established the Hecla Charitable Foundation to operate exclusively for charitable and educational purposes, with a particular emphasis in those communities in which we have employees or operations and donated 550,000 shares of our common stock, valued at $5.1 million. Cash contributions totaling $2.0 million and $1.5 million were made by Hecla to the Hecla Charitable Foundation during 2011 and 2010, respectively, with no cash contributions made during 2009.respectively. The Hecla Charitable Foundation was established by Hecla as a not-for-profit organization which has obtained 501(c)(3) status from the Internal Revenue Service. Its financial statements are not consolidated by Hecla. San Juan Silver Mining Joint Venture 30% Acquisition
On December 12, 2011, we announced that our wholly-owned subsidiary, Rio Grande Silver Inc. (“Rio”), entered into a Purchase Sale Agreement with Emerald Mining & Leasing, LLC ("EML"), Golden 8 Mining, LLC ("G8"), and AgX Resources, Inc. ("AgX"), (EML, G8, and AgX are collectively referred to as the "Sellers"). Under the terms of the Agreement, Rio purchased the sellers'Sellers' remaining 30% undivided interest in certain properties that had been governed by a Joint Venture Agreement ("2008 JVA") entered into between EML, G8, and Rio on February 21, 2008, in return for the issuance of 5,395,683 shares of Hecla common stock valued at $30 million.$33.8 million on the date that the transaction was completed. The number of common shares issued 5,395,683, was based on 90% of the volume-weighted average price of Hecla Mining Companyour common shares on the New York Stock Exchange for the 20 trading days immediately preceding and including December 2, 2011. The shares had a value of approximately $33.8 million on the date that the transaction was completed.
The original 2008 JVA between EML, G8, and Rio was terminated and a new Joint Venture Agreement for the exploration, evaluation and possible development and mining of mineral resources on certain properties in Mineral County, Colorado was entered into. EML, G8, and Rio will manage and operate under the name San Juan Silver Mining Joint Venture, (the "Venture"), and Rio will be the initial operator.
Note 17: Sale of the Velardeña Mill
On March 9, 2009, we completed the sale of our processing facility located in Velardeña, Mexico to ECU Silver Mining Inc. (“ECU”) for $8 million in cash and 750,000 shares of ECU common stock, valued at $0.3 million at the time of the transaction. Ore produced from the San Sebastian and Don Sergio mines at our San Sebastian unit was processed at the Velardeña mill. Processing of economic ore was completed during the fourth quarter of 2005, and the mill was placed on care and maintenance at that time. The mill had a book value of approximately $3 million at the time of the sale. We recognized a pre-tax gain of approximately $6.2 million during the first quarter of 2009 as a result of the sale. The gain includes $1.0 million related to the elimination of the asset retirement obligation associated with the mill.Note 18: Subsequent EventsAt the end of 2011, MSHA began a special impact inspection at the Lucky Friday mine which resulted in an order to remove loose material from the Silver Shaft. In response, Hecla submitted a plan to MSHA and received approval to remove the loose cementitious material. In addition, the plan includes removal of unused utilities, construction of a water ring to prevent ice from forming in the winter, the installation of a metal brattice, repair of shaft steel, and installation of a new power cable, all of which should improve the shaft's functionality and possibly improving the shaft's hoisting capacity.
Lucky Friday utilizes two shafts: the Silver Shaft and the #2 shaft. Cessation of production through the Silver Shaft requires that we suspend production because we no longer have a secondary escape-way. As a result, approximately 121 employees were temporarily laid off, approximately 25 of whom have accepted temporary positions at our other locations.We currently anticipate that the Silver Shaft work will be completed in late 2012, with production at the Lucky Friday temporarily suspended until early 2013. The smelter contracts related to treatment of Lucky Friday concentrates have been suspended during the care-and-maintenance period based on force majeure. Once the Silver Shaft work is completed down to the 4900 foot level, we expect to commence work on a haulage way bypassing an area at the 5900 level impacted by a rock burst in December 2011. We anticipate that we will be able to resume construction of the #4 Shaft in early 2013 once the Silver Shaft work is completed.The shutdown did not materially affect our financial statements as of December 31, 2011. In addition to work on the Silver Shaft, other significant surface and underground capital programs are being planned. Final plans are not yet complete, but we expect to spend up to $50 million on all of these projects, including approximately $10 million to remove the loose cementitious material, $20 million for shaft improvements and $20 million on other capital projects. We expect to incur non-capitalized expenses of $17.5 million, based on the assumption that the mine will be on standby for the remainder of 2012 as this work is completed.
On February 1, 2012, a purported Hecla stockholder filed a putative class action lawsuit in U.S. District Court for the District of Idaho against Hecla and certain of our officers, one of whom is also a director. The complaint, purportedly brought on behalf of all purchasers of Hecla common stock from October 26, 2010 through and including January 11, 2012, asserts claims under Sections 10(b) and 20(a) of the Securities Exchange Act of 1934 and Rule 10b-5 promulgated thereunder and seeks, among other things, damages and costs and expenses. Specifically, the complaint alleges that Hecla, under the authority and control of the individual defendants, made certain false and misleading statements and allegedly omitted certain material information. The complaint alleges that these actions artificially inflated the market price of Hecla common stock during the class period, thus purportedly harming investors. A second suit was filed on February 14, 2012, alleging virtually identical claims. We cannot predict the outcome of such proceedings or an estimate of damages, if any. We believe that these claims are without merit and intend to defend against them vigorously.
Hecla Mining Company and Wholly Owned Subsidiaries Form 10-K – December 31, 20112012
| Certificate of Incorporation of the Registrant as amended to date. Filed as exhibit 3.1 to Registrant’s Form 10-Q for the quarter ended June 30, 2010 (File No. 1-8491), and incorporated herein by reference. |
| | |
| 3.2 | Bylaws of the Registrant as amended to date. Filed as exhibit 3.1 to Registrant’s Current Report on Form 8-K filed on December 6, 2007 (File No. 1-8491), and incorporated herein by reference. |
| | |
| 4.1(a) | Certificate of Designations, Preferences and Rights of Series A Junior Participating Preferred Stock of the Registrant. Filed as exhibit 3.1 to Registrant’s Form 10-Q for the quarter ended June 30, 2010 (File No. 1-8491), and incorporated herein by reference. |
| | |
| 4.1(b) | Certificate of Designations, Preferences and Rights of Series B Cumulative Convertible Preferred Stock of the Registrant. Filed as exhibit 3.1 to Registrant’s Form 10-Q for the quarter ended June 30, 2010 (File No. 1-8491), and incorporated herein by reference. |
| | |
| 4.2(a) | Form of Series 1 Common Stock Purchase Warrant. Filed as exhibit 4.1 to Registrant’s Current Report on Form 8-K filed on December 11, 2008 (File No. 1-8491), and incorporated herein by reference. |
| | |
| 4.2(b) | Form of Series 3 Common Stock Purchase Warrant. Filed as exhibit 4.1 to Registrant’s Current Report on Form 8-K filed on February 9, 2009 (File No. 1-8491), and incorporated herein by reference. |
| | |
| 10.1(a) | Second Amended and Restated Credit Agreement effective October 14, 2009, by and among Hecla Mining Company, as Parent, Hecla Alaska LLC, Hecla Greens Creek Mining Company and Hecla Juneau Mining Company, as Borrowers, The Bank of Nova Scotia, as the Administrative Agent for the Lenders, and various Lenders. Filed as exhibit 10.1 to Registrant’s Current Report on Form 8-K on October 15, 2009 (File No. 1-8491), and incorporated herein by reference. |
| | |
| 10.1(b) | First Amendment to Second Amended and Restated Credit Agreement, dated March 12, 2010, by and among Hecla Alaska LLC, Hecla Greens Creek Mining Company and Hecla Juneau Mining Company, as Borrowers, and Hecla Mining Company, as Parent, and The Bank of Nova Scotia and ING Capital LLC, as Lenders. Filed as exhibit 10.1 to Registrant’s Current Report on Form 8-K filed on March 18, 2010 (File No. 1-8491), and incorporated herein by reference. |
| | |
| 10.1(c) | Second Amendment to Second Amended and Restated Credit Agreement, dated as of July 14, 2010, by and among Hecla Alaska LLC, Hecla Greens Creek Mining Company and Hecla Juneau Mining Company, as Borrower, and Hecla Mining Company, as Parent, and The Bank of Nova Scotia and ING Capital LLC, as Lenders. Filed as exhibit 10.1 to Registrant’s Current Report on Form 8-K on July 28, 2010 (File No. 1-8491), and incorporated herein by reference. |
| | |
| 10.1(d) | Third Amendment to Second Amended and Restated Credit Agreement, dated as of December 22, 2010, by and among Hecla Alaska LLC, Hecla Greens Creek Mining Company and Hecla Juneau Mining Company, as Borrowers, and Hecla Mining Company, as Parent, and The Bank of Nova Scotia and ING Capital LLC, as Lenders. Filed as exhibit 10.1(d) to Registrant's Annual Report on Form 10-K on February 25, 2011 (file No. 1-8491), and incorporated herein by reference. |
| | |
| 10.1(e) | Fourth Amendment to Second Amended and Restated Credit Agreement, dated as of May 20, 2011, by and among Hecla Alaska LLC, Hecla Greens Creek Mining Company and Hecla Juneau Mining Company, as Borrowers, and Hecla Mining Company, as Parent, and The Bank of Nova Scotia and ING Capital LLC, as Lenders. *Filed as exhibit 10.1(e) to Registrant's Form 10-K for the period ended December 31, 2011 (File No. 1-8491), and incorporated herein by reference. |
| | |
| 10.1(f) | Limited Waiver and Fifth Amendment to Second Amended and Restated Credit Agreement, dated as of October 10, 2011, by and among Hecla Alaska LLC, Hecla Greens Creek Mining Company and Hecla Juneau Mining Company, as Borrowers, and Hecla Mining Company, as Parent, and The Bank of Nova Scotia and ING Capital LLC, as Lenders. * |
| |
10.2 | Construction contract between Hecla Limited (Lucky Friday Unit) and Cementation USA Inc. Filed as exhibit 10.110.1(f) to Registrant's Current Report onRegistrants' Form 8-K on November 30,10-K for the period ended December 31, 2011 (File No. 1-8491), and incorporated herein by reference. |
| | |
10.310.1(g) | PurchaseSixth Amendment to Second Amended and SaleRestated Credit Agreement, dated November 21, 2011,May 4, 2012, by and among EmeraldHecla Alaska LLC, Hecla Greens Creek Mining & Leasing,Company and Hecla Juneau Mining Company, as Borrower, and Hecla Mining Company, as Parent, and The Bank of Nova Scotia and ING Capital LLC, AgX Resources, LLC, and Golden 8 Mining, LLC, and Rio Grande Silver, Inc.as Lenders. Filed as exhibit 10.110.1(g) to Registrant's Current ReportForm 10-Q on Form 8-K on December 13, 2011August 7, 2012 (File No. 1-8491), and incorporated herein by reference. |
10.4 | Consent Decree. Filed as exhibit 10.1 to Registrant's Current Report on Form 8-K filed on June 14, 2011(File No. 1-8491), and incorporated herein by reference. |
| | |
10.510.1(h) | Seventh Amendment to Second Amended and Restated Credit Agreement, dated August 1, 2012, by and among Hecla Alaska LLC, Hecla Greens Creek Mining Company and Hecla Juneau Mining Company, as Borrower, and Hecla Mining Company, as Parent, and The Bank of Nova Scotia and ING Capital LLC, as Lenders. Filed as exhibit 10.1(h) to Registrant's Form 10-Q on August 7, 2012 (File No. 1-8491), and incorporated herein by reference. |
| 10.2 | Employment Agreement dated June 1, 2007, between Registrant and Phillips S. Baker, Jr. (Registrant has substantially identical agreements with each of Messrs. James A. Sabala, Dean W. McDonald and Don Poirier). Identical Employment Agreements were also entered into between the Registrant and Don Poirier on July 9, 2007, James A. Sabala on March 26, 2008, as well as David C. Sienko on January 29, 2010. Filed as exhibit 10.1 to Registrant’sRegistrant's Quarterly Report on Form 10-Q for the quarter ended June 30, 2007 (File No. 1-8491), and incorporated herein by reference. (1) |
| | |
10.610.3 | Form of Indemnification Agreement dated November 8, 2006, between Registrant and Phillips S. Baker, Jr., Ronald W. Clayton, Dean McDonald, Ted Crumley, John H. Bowles, David J. Christensen, George R. Nethercutt, Jr., and Anthony P. Taylor. Identical Indemnification Agreements were entered into between the Registrant and Charles B. Stanley and Terry V. Rogers on May 4, 2007, Don Poirier on July 9, 2007, James A. Sabala on March 26, 2008, David C. Sienko on January 29, 2010, and Lawrence P. Radford on October 19, 2011. Filed as exhibit 10.7 to Registrant’s Quarterly Report on Form 10-Q for the quarter ended September 30, 2006 (File No. 1-8491), and incorporated herein by reference. (1) |
| | |
10.710.4 | Hecla Mining Company Executive and Senior Management Long-Term Performance Payment Plan. Filed as exhibit 10.16(a) to Registrant’s Form 10-K for the period ended December 31, 2008 (File No. 1-8491), and incorporated herein by reference. (1) |
| | |
10.810.5 | Hecla Mining Company Performance Pay Compensation Plan. Filed as Exhibit 10.5(a) to Registrant’s Form 10-K for the period ended December 31, 2004 (File No. 1-8491), and incorporated herein by reference. (1) |
| | |
10.910.6 | Hecla Mining Company Stock Plan for Non-employee Directors, as amended. Filed as exhibit 10.4(c) to Registrant’s Annual Report on Form 10-K for the year ended December 31, 2007 (File No. 1-8491), and incorporated herein by reference. (1)* |
| | |
10.1010.7 | Hecla Mining Company Key Employee Deferred Compensation Plan, as amended. Filed as exhibit 10.16(e) to Registrant’s Form 10-K for the year ended December 31, 2008 (File No. 1-8491), and incorporated herein by reference. (1) |
| | |
10.1110.8 | Hecla Mining Company 2010 Stock Incentive Plan. Filed as exhibit 10.1 to Registrant's Annual Report on Form 10-K for the year ended December 31, 2010 (File No. 1-8491) and incorporated herein by reference. (1) |
| | |
10.1210.9 | Hecla Mining Company Retirement Plan for Employees and Supplemental Retirement and Death Benefit Plan. Filed as exhibit 10.17(a) to Registrant’s Form 10-K for the year ended December 31, 2008 (File No. 1-8491), and incorporated herein by reference. (1) |
| | |
10.1310.10 | Supplemental Excess Retirement Master Plan Documents. Filed as exhibit 10.5(b) to Registrant’s Annual Report on Form 10-K/A-1 for the year ended December 31, 1994 (File No. 1-8491), and incorporated herein by reference. (1) |
10.14 | |
| 10.11 | Hecla Mining Company Nonqualified Plans Master Trust Agreement. Filed as exhibit 10.5(c) to Registrant’s Annual Report on Form 10-K/A-1 for the year ended December 31, 1994 (File No. 1-8491), and incorporated herein by reference. (1) |
| | |
| 21 | List of subsidiaries of Registrant.* |
| | |
| 23.1 | Consent of BDO USA, LLP.* |
| | |
| 23.2 | Consent of AMEC E&C Services, Inc.* |
| |
23.3 | Consent of Scott Wilson Roscoe Postle Associates, Inc.* |
| | |
| 31.1 | Certification pursuant to Section 302 of the Sarbanes-Oxley Act of 2002.* |
| | |
| 31.2 | Certification pursuant to Section 302 of the Sarbanes-Oxley Act of 2002.* |
| | |
| 32.1 | Certification pursuant to Section 906 of the Sarbanes-Oxley Act of 2002.* |
| | |
| 32.2 | Certification pursuant to Section 906 of the Sarbanes-Oxley Act of 2002.* |
| | |
| 95 | Mine safety information listed in Section 1503 of the Dodd-Frank Act. * |
| | |
| 101.INS | XBRL Instance. ** |
| | |
| 101.SCH | XBRL Taxonomy Extension Schema.** |
| | |
| 101.CAL | XBRL Taxonomy Extension Calculation.** |
| | |
| 101.DEF | XBRL Taxonomy Extension Definition.** |
| | |
| 101.LAB | XBRL Taxonomy Extension Labels.** |
| | |
| 101.PRE | XBRL Taxonomy Extension Presentation.** |
| | (1) | Indicates a management contract or compensatory plan or arrangement. |
** XBRL information is furnished and not filed or a part of a registration statement or prospectus for purposes of Sections 11 or 12 of the Securities and Exchange Act of 1933, as amended, is deemed not filed for purposes of Section 18 of the Securities and Exchange Act of 1934, as amended, and otherwise is not subject to liability under these sections.
F- 64
F-41