UNITED STATES
SECURITIES AND EXCHANGE COMMISSION
Washington, D.C. 20549
(Mark One)
| x | ANNUAL REPORT UNDER SECTION 13 OR 15(d) OF THE SECURITIES EXCHANGE ACT OF 1934 |
For the Fiscal Year Ended January 31, 20122013
| o | TRANSITION REPORT UNDER SECTION 13 OR 15(d) OF THE SECURITIES EXCHANGE ACT OF 1934 |
For the transition period from _______________ to ________________
Commission File Number 000-52055
RED METAL RESOURCES LTD.
(Exact name of registrant as specified in its charter)
| Nevada | | 20-2138504 |
(State or other jurisdiction of incorporation or organization) | | (I.R.S. Employer Identification No.) |
195 Park Avenue Thunder Bay, Ontario P7B 1B9
(Address of principal executive offices)
Registrant’s telephone number, including area code: (807) 345-7384
Securities registered pursuant to Section 12(b) of the Act:
| Title of each class | | Name of each exchange on which each is registered |
| N/A | | N/A |
Securities registered pursuant to Section 12(g) of the Act: Common Stock, $0.001 par value
Indicate by check mark if the registrant is a well-known seasoned issuer, as defined in Rule 405 of the Securities Act. Yes [ ] No [X]
Indicate by check mark if the registrant is not required to file reports pursuant to Section 13 or Section 15(d) of the Act. Yes [ ] No [X]
Indicate by check mark whether the registrant (1) has filed all reports required to be filed by Section 13 or 15(d) of the Securities Exchange Act of 1934 during the preceding 12 months (or for such shorter period that the registrant was required to file such reports); and (2) has been subject to such filing requirements for the past 90 days. Yes [ x ] No [ ]
Indicate by check mark whether the registrant has submitted electronically and posted on its corporate Web site, if any, every Interactive Data File required to be submitted and posted pursuant to Rule 405 of Regulation S-T (§ 229.405 of this chapter) during the preceding 12 months (or for such shorter period that the registrant was required to submit and post such files). Yes [ X ] No [ ] .
Indicate by check mark if disclosure of delinquent filers pursuant to Item 405 of Regulation S-K is not contained herein, and will not be contained, to the best of registrant’s knowledge, in definitive proxy or information statements incorporated by reference in Part III of this Form 10-K or any amendment to this Form 10-K. [ ]
Indicate by check mark whether the registrant is a large accelerated filer, an accelerated filer, a non-accelerated filer, or a smaller reporting company.
| Large accelerated filer [ ] | | Accelerated filer [ ] |
| Non-accelerated filer [ ] | | Smaller reporting company [X] |
| (Do not check if a smaller reporting company) | | |
Indicate by check mark whether the issuer is a shell company (as defined in Rule 12b-2 of the Exchange Act). Yes [ ] No [X]
State the aggregate market value of the voting and non-voting common equity held by non-affiliates computed by reference to the price at which the common equity was last sold, or the average bid and asked price of such common equity, as of the last business day of the registrant’s most recently completed second fiscal quarter. As of July 29, 2011,2012, the aggregate market value of the voting and non-voting common equity held by non-affiliates computed by reference to the average bid and asked price of the common equity was $2,270,581.$2,793,881.
Indicate the number of shares outstanding of each of the registrant’s classes of common stock, as of the latest practicable date. The number of shares of the registrant’s common stock, $0.001 par value per share, outstanding as of March 21, 2012April 17, 2013 was 17,689,634.17,956,969.
GLOSSARY OF SELECTED MINING AND TECHNICAL TERMS | 1 |
| | | |
NOTE ABOUT FORWARD-LOOKING STATEMENTS | 2 |
| | | |
| 23 |
| | |
GENERAL | 2 |
UNPROVED MINERAL PROPERTIES | General | 3 |
| Unproved mineral properties | 4 |
COMPETITION | Competition | 23 |
| Raw materials | 23 |
| Dependence on major customers | 23 |
| Patents/Trademarks/Licenses/Franchises/Concessions/Royalty Agreements/Labor Contracts | 23 |
| Costs and effects of compliance with environmental laws | 24 |
RAW MATERIALS | Expenditures on research and development | 24 |
DEPENDENCE ON MAJOR CUSTOMERS | 25 |
PATENTS/TRADEMARKS/LICENSES/FRANCHISES/CONCESSIONS/ROYALTY AGREEMENTS/LABOR CONTRACTSNumber of total employees and number of full-time employees | 25 |
COSTS AND EFFECTS OF COMPLIANCE WITH ENVIRONMENTAL LAWS | 25 |
EXPENDITURES ON RESEARCH AND DEVELOPMENT | 25 |
NUMBER OF TOTAL EMPLOYEES AND NUMBER OF FULL-TIME EMPLOYEES | 2524 |
| | | |
| 2624 |
| | | |
| 30 |
| | | |
| 30 |
| | | |
| 30 |
| | | |
| 30 |
| | | |
| 30 |
| | |
| 31 |
| | |
ITEM 6: SELECTED FINANCIAL DATA. | 32 |
| |
| 3231 |
| | | |
| 4038 |
| | | |
| 4038 |
| | | |
INDEX TO FINANCIAL STATEMENTS | 40Index to Financial Statements | 38 |
| | | |
| 4139 |
| | | |
| 4139 |
| | | |
| 4240 |
| | | |
| 40 |
| | |
| 42 |
| | |
ITEM 11: EXECUTIVE COMPENSATION | 44 |
| |
| 4644 |
| | | |
| 4644 |
| | |
DIRECTOR INDEPENDENCE | 46 |
TRANSACTIONS WITH RELATED PERSONS | 46Director independence | 44 |
| Transactions with related persons | 45 |
| | | |
| 4847 |
| | | |
| 4948 |
GLOSSARY OF SELECTED MINING AND TECHNICAL TERMS
The following is a glossary of selected mining terms used in the United States and Canada and referenced in this Annual Report on Form 10-K that may be technical in nature:10-K:
Table 1. Glossary
| Term | Definition |
| Ag | Silver |
| Airborne survey | A survey made from an aircraft to obtain photographs, or measure magnetic properties, radioactivity, etc. |
| Assay | A chemical test performed on a sample of ores or minerals to determine the amount of valuable metals contained. |
| Au | Gold |
| Bulk sample | A large sample of mineralized rock, frequently hundreds of tonnes, selected in such a manner as to be representative of the potential mineral deposit (orebody) being sampled and used to determine metallurgical characteristics. |
| By-product | A secondary metal or mineral product recovered in the milling process. |
| Core | The long cylindrical piece of rock, about an inch in diameter, brought to surface by diamond drilling |
| Core sample | One or several pieces of whole or split parts of core selected as a sample for analysis or assay. |
| Cross-cut | A horizontal opening driven from a shaft and (or near) right angles to the strike of a vein or other orebody. The term is also used to signify that a drill hole is crossing the mineralization at or near right angles to it. |
| Cu | Copper |
| Cut-off grade | The lowest grade of mineralized rock that qualifies as ore grade in a given deposit, and is also used as the lowest grade below which the mineralized rock currently cannot be profitably exploited. Cut-off grades vary between deposits depending upon the amenability of ore to gold extraction and upon costs of production. |
| Diorite | An intrusive igneous rock composed chiefly of sodic plagioclase, hornblende, biotite or pyroxene. |
| Drift | A horizontal or nearly horizontal underground opening driven along a vein to gain access to the deposit. |
| Exploration | Prospecting, sampling, mapping, diamond drilling and other work involved in searching for or defining a mineral deposit. |
| Face | The end of a drift, cross-cut or stope in which work is taking place. |
| Fault | A break in the Earth'searth's crust caused by tectonic forces which have moved the rock on one side with respect to the other. |
| Grade | Term used to indicate the concentration of an economically desirable mineral or element in its host rock as a function of its relative mass. With gold or silver, this term may be expressed as grams per tonne (g/t) or ounces per tonne (opt or oz/t). |
| Gram | 0.0321507 troy ounces |
| g/t | Grams per metric tonne |
| Hydrothermal | Processes associated with heated or superheated water, especially mineralization or alteration. |
| Km | Kilometre(s). Equal to 0.62 miles. |
| Leaching | The separation, selective removal or dissolving-out of soluble constituents from a rock or ore body by the natural actions of percolating solutions. |
| M | Metre(s). Equal to 3.28 feet. |
| Metamorphic | Affected by physical, chemical, and structural processes imposed by depth in the earth’s crust. |
| Mine | An excavation on or beneath the surface of the ground from which mineral matter of value is extracted. |
| Net Smelter Return (“NSR”) | A payment made by a producer of metals based on the value of the gross metal production from the property, less deduction of certain limited costs including smelting, refining, transportation and insurance costs. |
| Orebody | A term used to denote the mineralization contained within an economic mineral deposit. |
| Outcrop | An exposure of rock or mineral deposit that can be seen on the surface, that is, not covered by soil or water. |
| Oxidation | A chemical reaction caused by exposure to oxygen that results in a change in the chemical composition of a mineral. |
| Oz | Ounce. A measure of weight in gold and other precious metals, correctly troy ounces, which weigh 31.1 grams as distinct from an imperial ounce which weigh 28.4 grams. |
| Shaft | A vertical passageway to an underground mine for moving personnel, equipment, supplies and material including ore and waste rock. |
| Strike | The direction, or bearing from true north, of a vein or rock formation measure on a horizontal surface. |
| Stringer | A narrow vein or irregular filament of a mineral or minerals traversing a rock mass. |
| Sulphides | A group of minerals which contains sulfur and other metallic elementelements such as copper and zinc. Gold is usually associated with sulphide enrichment in mineral deposits. |
| Tailings | Material rejected from a mill after most of the recoverable valuable minerals have been extracted. |
| Vein | A fissure, fault or crack in a rock filled by minerals that have travelled upwards from some deep source. |
| Zone | An area of distinct mineralization. |
NOTE ABOUT FORWARD-LOOKING STATEMENTS
This Annual Report on Form 10-K contains “forward-looking statements”. These forward-looking statements are based on our current expectations, assumptions, estimates and projections about our business and our industry. Words such as “believe,” “anticipate,” “expect,” “intend,” “plan,” “may,” and other similar expressions identify forward-looking statements. In addition, any statements that refer to expectations, projections or other characterizations of future events or circumstances are forward-looking statements. These forward-looking statements are subject to certain risks and uncertainties that could cause actual results to differ materially from those reflected in the forward-looking statements. Factors that might cause such a difference include, but are not limited to, those discussed in the sections of this annual report titled “Risk Factors”, “Business” and “Management’s Discussion and Analysis of Financial Condition and Results of Operations”, as well as the following:
| | · | general economic conditions, because they may affect our ability to raise money |
| | · | our ability to raise enough money to continue our operations |
| | · | changes in regulatory requirements that adversely affect our business |
| | · | changes in the prices for minerals that adversely affect our business |
| | · | political changes in Chile, which could affect our interests there |
| | · | other uncertainties, all of which are difficult to predict and many of which are beyond our control |
You are cautioned not to place undue reliance on these forward-looking statements, which relate only to events as of the date on which the statements are made. We undertake no obligation to publicly revise these forward-looking statements to reflect events or circumstances that arise after the date of this annual report. You should refer to and carefully review the information in future documents we file with the Securities and Exchange Commission.
General
Red Metal Resources Ltd. was incorporated in Nevada on January 10, 2005 as Red Lake Exploration, Inc. We changed our name to Red Metal Resources Ltd. on August 27, 2008.
On August 21, 2007, we formed Minera Polymet Limitada, a limited liability company, under the laws of the Republic of Chile. We own 99% of Polymet, which holds our Chilean mineral property interests. Under Chilean law, a resident of Chile must be a shareholder in a limitada. To meet this requirement, 1% of Polymet is owned by a Chilean resident, an experienced manager who has organized an office and other resources for us to use and is Polymet’s legal representative in Chile. Polymet’s office is located in Vallenar, III Region of Atacama, Chile. When we refer to “Red Metal”, the “company”, “we”, “us” or “our” in this report, we mean Red Metal Resources Ltd. together with Minera Polymet Limitada.
Our resident agent’s office is at 711 S. Carson Street, Suite 4, Carson City, Nevada, 89701. Our business office is at 195 Park Avenue, Thunder Bay, Ontario, Canada, P7B 1B9. Our telephone number is (807) 345-7384; our email address is info@redmetalresources.comadmin@redmetalresources.com; and our web address is www.redmetalresources.com. Information on our web site is not a part of this annual report.
We are a start-up exploration stage company without operations. We are in the business of acquiring and exploring mineral claims. All of our claims are located in the III Region of Atacama, Chile. We have not determined whether our claims contain mineral reserves that are economically recoverable. We have not produced revenues from our principal business and are considered an exploration stage company as defined by “Accounting and Reporting by Development Stage Enterprises.”
Our ability to realize a return on our investment in mineral claims depends upon whether we maintain the legal ownership of the claims. Title to mineral claims involves risks inherent in the process of determining the validity of claims and the ambiguous transfer history characteristic of many mineral claims. To the best of our knowledge, and after consultation with an attorney knowledgeable in the practice of mining, we believe that we have taken the steps necessary to ensure that we have good title to our mineral claims. We have had our contracts and deeds notarized, recorded in the registry of mines and published in the mining bulletin and we review the mining bulletin regularly to determine whether other parties have staked claims over our ground. We have discovered no such claims.
Chile’s mining and land tenure policies were established to secure the property rights of both domestic and foreign investors to stimulate development of mining in Chile. The government of Chile owns all mineral resources, but exploration and exploitation of these resources are permitted through exploration and mining concessions. A mineral concession must pass through three stages to become a permanent mining concession, namely, pedimento, manifestacion and mensura.
A pedimento is an initial exploration claim. It can be placed on any area, whereas the survey to establish a permanent mensura claim can only be completed on free areas where no other mensuras exist. A pedimento is valid for a maximum of two years. At the end of this period it may either be reduced in size by at least 50% and renewed for an additional two years or entered into the manifestacion process to establish a permanent mensura claim. New pedimentos can overlap existing pedimentos, but the pedimento with the earliest filing date takes precedence providing the claim holder maintains the pedimento in accordance with the mining code and the applicable regulations.
Manifestacion is the process by which a pedimento is converted to a permanent mining claim. At any stage during its two-year life, the holder of a pedimento can submit a manifestacion application, which is valid for 220 days. To begin the manifestacion process, the owner must request a survey (mensura) within 220 days. After the survey request is accepted, the owner has approximately 12 months to have the claim surveyed by a government-licensed surveyor, inspected and approved by the national mining service, and affirmed as a mensura (equivalent to a patented claim) by a judge. Thereafter, an abstract describing the claim is published in Chile’s official mining bulletin (published weekly) and 30 days later the claim is inscribed in the appropriate mining registry.
A mensura is a permanent property right that does not expire so long as the annual fees (patentes) are paid in a timely manner. Failure to pay the patentes for an extended period can result in the claim being listed for sale at auction, where a third party can acquire a claim for the payment of the back taxes owed and a penalty.
In Chile, we have both pedimento and mensura claims. We cannot guarantee that any of our pedimento claims will convert to mensura claims. Some of our pedimentos are still in the registration process and some are in the manifestacion stage. We may decide, for geologic, economic or other reasons, not to complete a registration or manifestacion or to abandon a claim after it is registered. Some of our pedimentos may have been staked over other owners’ claims as permitted by the Chilean mining code. Our pedimento rights in these claims will not crystallize unless the owners of the underlying claims fail to pay their taxes or otherwise forfeit their interests in their claims. Our purpose in over-staking is to claim free ground around others’ claims and to have the first right to forfeited claims if we want them. Over-staking is easier and less costly than staking available ground around claims and ensures that all available ground is covered that might otherwise be missed.
We have a close working relationship with Minera Farellon Limitada (“Minera Farellon”), a Chilean company owned equally by Kevin Mitchell, Polymet’s legal representative in Chile, and Richard Jeffs, the father of our president, who holds more than 5% of our shares of common stock (see Table 24 below)22). Minera Farellon investigates potential claims and often ties them up, by staking new claims, optioning or buying others’ claims, all at its own cost. This gives us an opportunity to review the claims to decide whether they are of interest to us. If we are interested, then we either proceed to acquire an interest in the property directly from the owner, or, if Minera Farellon has already obtained an interest, we take an option to acquire its interest. Minera Farellon, which is located in the city of Vallenar, also provides some of our logistical support in Vallenar under a month-to-month contract, which enables us to limit our operating expenses to those needed from time to time.
Unproved mineral properties
Due to a lack of operating capital, during the fiscal year ended January 31, 2013, we conducted no material exploratory operations on any of our properties. Until we are able to raise operating capital, which we cannot assure that we can do, we will not be able to initiate new exploration efforts or continue the exploration efforts we have begun. On February 11, 2013 we reported that we entered into a memorandum of understanding with Geoactiva Spa. ("Geoactiva") pursuant to which Geoactiva expressed an intention to acquire our Perth property, subject to the results of a due diligence investigation. See the section below titled, “Memorandum of Understanding with Geoactiva Spa”. The memorandum of understanding gives us confidence there is an opportunity to raise funds by selling some of our properties or by entering into joint venture agreements to develop some of our properties. We have fourthree active properties which we have assembled since the beginning of 2007— the Farellon, Perth, Mateo, and Veta Negra.Mateo. These properties consist of both mining and exploration claims and are grouped into two district areas – Carrizal Alto area properties and Vallenar area properties.
Active properties
| Table 2: Active properties | | |
| Property | Percentage, type of claim | Hectares |
| Gross area | Net areaa |
| Carrizal Alto area |
| Farellon | | | | |
| Farellon 1 – 8 claim | 100%, mensura | 66 | | |
| Farellon 3 claim | 100%, pedimento | 300 | | |
| Cecil 1 – 49 claim | 100%, mensura | 230 | | |
| Cecil 1 – 40 and Burghley 1 – 60 claims | 100%, mensura in process | 500 | | |
| | | 1,096 | | 1,096 |
| Perth | | | | |
| Perth 1 al 36 claim | 100%, mensura | 109 | | |
| Lancelot I 1 al 30 claim | 100%, mensura in process | 300 | | |
| Lancelot II 1 al 20 claim | 100%, mensura in process | 200 | | |
| Rey Arturo 1 al 30 claim | 100%, mensura in process | 300 | | |
| Merlin I 1 al 10 claim | 100%, mensura in process | 60 | | |
| Merlin I 1 al 24 claim | 100%, mensura in process | 240 | | |
| Galahad I 1 al 10 claim | 100%, mensura in process | 50 | | |
| Galahad IA 1 al 46 claim | 100%, mensura in process | 230 | | |
| Percival III 1 al 30 claim | 100%, mensura in process | 300 | | |
| Tristan II 1 al 30 claim | 100%, mensura in process | 300 | | |
| Tristan IIA 1 al 5 claim | 100%, mensura in process | 15 | | |
| Camelot claim | 100%, manifestacion | 300 | | |
| | | 2,404 | | |
| Overlapped claims (see Figure 4) | | (121) | | 2,283 |
Vallenar area |
Mateo | | | | |
Margarita claim | 100%, mensura | 56 | | |
Che 1 & 2 claims | 100%, mensura | 76 | | |
Irene & Irene II claims | 100% ,mensura | 60 | | |
Mateo 1, 2, 3, 9,10,12, 13, 14 claims | 100%, manifestacion | 2,100 | | |
| Mateo 4 and 5 claims | 100%, pedimento | 600 | | |
| | | 2,892 | | |
| Overlapped claims (see Figure 6) | | (469) | | 2,423 |
| | | | | |
| Veta Negra | | | | |
| Veta Negra 1 al 7 claim | Option to purchase, mensura | 28 | | |
| Exon 1 al 4 claim | Option to purchase, mensura | 16 | | |
| Trixy (19 claims) | 100%, manifestacion | 2,900 | | |
| Pibe | Option to purchase, mensura in process | 200 | | |
| | | 3,144 | | |
| Overlapped claims (see Figure 8) | | (238) | | 2,906 |
| | | | | |
| | | | | 8,708 |
a Some pedimentos and manifestacions overlap other claims. The net area is the total of the hectares we have in each property (i.e. net of our overlapped claims). |
| Table 2: Active properties | | | | |
| Property | Percentage, type of claim | | Hectares | |
| | Gross area | | | Net areaa | |
| Carrizal Alto area | |
| Farellon | | | | | | | |
| Farellon 1 – 8 claim | 100%, mensura | | | 66 | | | | |
| Farellon 3 claim | 100%, manifestacion | | | 300 | | | | |
| Cecil 1 – 49 claim | 100%, mensura | | | 230 | | | | |
| Teresita claim | 100%, mensura | | | 1 | | | | |
| Azucar 6 – 25 claim | 100%, mensura | | | 88 | | | | |
| Stamford 61 – 101 claim | 100%, mensura | | | 165 | | | | |
| Kahuna 1 – 40 claim | 100%, mensura | | | 200 | | | | |
| | | | | 1,050 | | | | 1,050 | |
| Perth | | | | | | | | | |
| Perth 1 al 36 claim | 100%, mensura | | | 109 | | | | | |
| Lancelot I 1 al 30 claim | 100%, mensura in process | | | 300 | | | | | |
| Lancelot II 1 al 20 claim | 100%, mensura in process | | | 200 | | | | | |
| Rey Arturo 1 al 30 claim | 100%, mensura in process | | | 300 | | | | | |
| Merlin I 1 al 10 claim | 100%, mensura in process | | | 60 | | | | | |
| Merlin I 1 al 24 claim | 100%, mensura in process | | | 240 | | | | | |
| Galahad I 1 al 10 claim | 100%, mensura in process | | | 50 | | | | | |
| Galahad IA 1 al 46 claim | 100%, mensura in process | | | 230 | | | | | |
| Percival III 1 al 30 claim | 100%, mensura in process | | | 300 | | | | | |
| Tristan II 1 al 30 claim | 100%, mensura in process | | | 300 | | | | | |
| Tristan IIA 1 al 5 claim | 100%, mensura in process | | | 15 | | | | | |
| Camelot claim | 100%, manifestacion | | | 300 | | | | | |
| | | | | 2,404 | | | | | |
Overlapped claims a | | | | (121 | ) | | | 2,283 | |
| Vallenar area | |
| Mateo | | | | | | | | | |
| Margarita claim | 100%, mensura | | | 56 | | | | | |
| Che 1 & 2 claims | 100%, mensura | | | 76 | | | | | |
| Irene & Irene II claims | 100% ,mensura | | | 60 | | | | | |
| Mateo 1, 2, 3, 9,10,12, 13, 14 claims | 100%, mensura in process | | | 2,100 | | | | | |
| Mateo 4 and 5 claims | 100%, pedimento | | | 600 | | | | | |
| | | | | 2,892 | | | | | |
Overlapped claims a | | | | (469 | ) | | | 2,423 | |
| | | | | | | | | | |
| | | | | | | | | 5,756 | |
a Some pedimentos and manifestacions overlap other claims. The net area is the total of the hectares we have in each property (i.e. net of our overlapped claims). | |
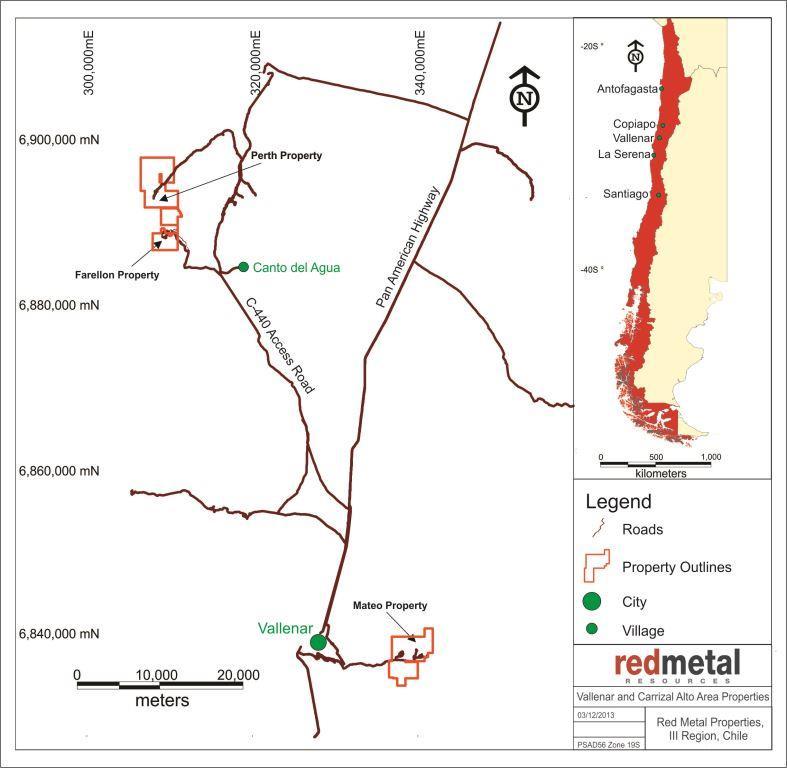
Our active properties as of the date of this filing are set out in Table 2.Figure 1. These properties are accessible by road from Vallenar as illustrated in Figure 1.1 below.
Figure 1: Location and access to active properties.
Farellon property
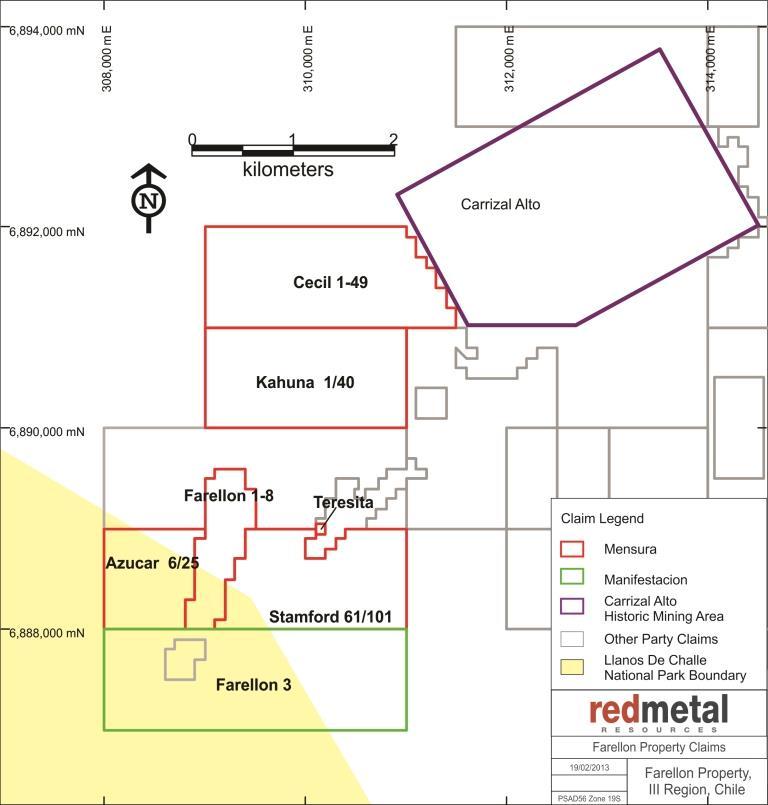
The Farellon property consists of two groups of claims—the Farellon claims and the Cecil and Burghley claims—which are not contiguous but lie within the historical Carrizal Alto mining district southwest of the Carrizal Alto mine. Table 3 describes the claims and Figure 2 illustrates them.
| Table 3: Farellon property | | | | | |
| | | Type | |
| Claim | | Mensura (ha) | | Pedimento (ha) | |
| Farellon 1 – 8 | | 66 | | | |
| Cecil 1 – 49 | | 230 | | | |
| Cecil 1 – 40 | | 200 | | | |
| Burghley 1 – 60 | | 300 | | | |
| Farellon 3 | | | | | 300 | |
| | | 796 | | | 300 | |
6

Table 3: Farellon property | | | | |
| | | | Type | |
| Claim | | | Mensura (ha) | | | | Manifestacion (ha) | | | | Pedimento (ha) | |
| Farellon 1 – 8 | | | 66 | | | | | | | | | |
| Cecil 1 – 49 | | | 230 | | | | | | | | | |
| Teresita | | | 1 | | | | | | | | | |
| Azucar 6 – 25 | | | 88 | | | | | | | | | |
| Stamford 61 – 101 | | | 165 | | | | | | | | | |
| Kahuna 1 – 40 | | | 200 | | | | | | | | | |
| Farellon 3 | | | | | | | 300 | | | | | |
| | | | 750 | | | | 300 | | | | | |
Figure 2: Farellon property
The Farellon 1 – 8 is the first mineral claim that we acquired in Chile. It covers 66 hectares and is centered about 309,150 east and 6,888,800 south UTM PSAD56 Zone 19 in Province of Huasco, Commune of Huasco, III Region of Atacama, Chile.
We acquired the claim on April 25, 2008, for $550,000 and owe a royalty equal to 1.5% of the net proceeds that we receive from the processor to a maximum of $600,000 with a monthly minimum of $1,000 when we start exploiting the minerals extractextracted from the claim. We can pay any unpaid balance of the royalty at any time. We have not yet exploited the claim.
On September 17, 2008, we bought the Cecil 1 – 49, Cecil 1 – 40 and Burghley 1 – 60 claims for $20,000. $27,676. On December 1, 2009, we initiated the manifestacion process when we applied to convert the Cecil 1 – 40 and Burghley 1 – 60 exploration claims to mining claims. In January 2013 we abandoned the manifestacion process for the Cecil 1-40 and Burghley 1-60 claims due to the fact that several mensuras underlying the claims covered the most prospective ground as outlined in our prospecting and mapping program completed in April 2012.
The Cecil and Burghley claims cover 730claim covers 230 hectares and areis centered at 311,500310,250 east and 6,890,0006,891,500 south UTM PSAD56 Zone 19 and lielies approximately 1.7 kilometers north of the Farellon 1 – 8 border. The claims coverclaim covers a 1.8-kilometre700 metre strike length of a mineralized vein interpreted to be part of the same mineralizing system as the Farellon 1 – 8 vein. An investigation completed during the Farellon 1 – 8 acquisition uncovered a broad regional reconnaissance sampling program completed in 1996 showing results from the areas covered by the Cecil and Burghley claims.claim. Results from the 1996 sampling show copper and gold grades similar to grades returned from the Farellon vein, indicating that the Cecil and Burghley claimsclaim could have similar mineralized bodies. On December 1, 2009, we initiated the manifestacion process when we applied to convert the Cecil 1 – 40 and Burghley 1 – 60 exploration (pedimento) claims to mining (mensura) claims.
Between July 2010 and November 2011 we registered seven pedimento, Farellon 3-9,3 through 9, at a cost of $2,408 to cover 1,800 hectares of ground around our Farellon 1 – 8 claim. In January 2013 we allowed the Farellon 4-9 are not included4 through 9 pedimentos to lapse due to underlying claims. In February 2013 we commenced the manifestacion process with the Farellon 3 pedimento.
On August 21, 2012, we acquired four mineral claims – Azucar 6-25, Kahuna 1-40, Stamford 61-101, and Teresita – through the government auction for a total price of $19,784. The Azucar claim is the most prospective of these claims as it covers a 1,200 metre strike length of a mineralized vein interpreted to be part of the same mineralizing system as the Farellon 1 – 8 vein. Three parallel veins have also been identified on the map until we confirm that underlying ground is open for staking. As permitted by Chilean law, Farellon 4-9 are currently overlapping other pedimentos.Azucar claim during the 2012 mapping and prospecting program and can be seen on Figure 3.
Location and means of access. The Farellon property is approximately 40 kilometers west of the Pan-American Highway, about 1 hour and 15 minutes by vehicle from the town of Vallenar which has a population of 40,000 and modern facilities. High-tension power lines and a fiber-optic communications line run along the highway and both power and rail are connected to the Cerro Colorado iron ore mine only 20 kilometers from the Farellon property. The area is serviced from Copiapó, a city of 70,000 with daily air and bus services to Santiago and other centers.
The Farellon property can be accessed by driving approximately 20 kilometers north on the Pan-American Highway from Vallenar then turning northwest towards Canto del Agua. From Canto del Agua, the Farellon property is approximately 10 kilometers along a well-maintained gravel road. There are numerous gravel roads in the area, so a guide is necessary to access the property the first time. All of the roads are well maintained and can support large machinery necessary to transport drills, backhoes and bulldozers. Water is readily available in Canto del Agua and could probably be found on the Farellon property where all of the historic drill holes intersected water.
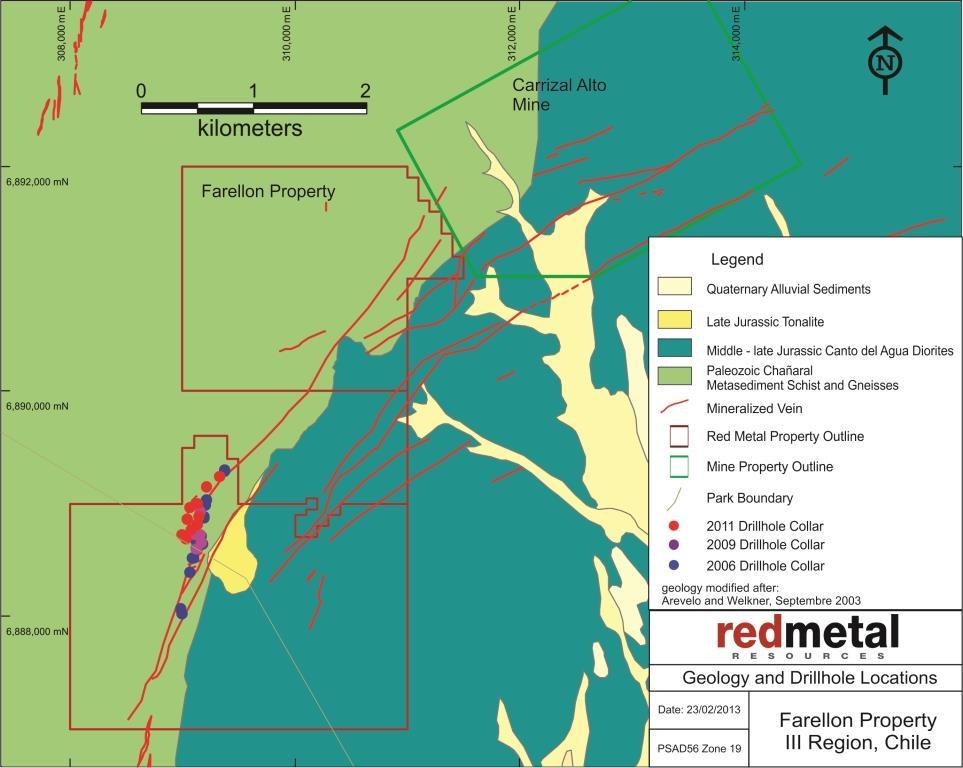
Exploration history .The Farellon property is in the Carrizal Alto mining district and lies 5 kilometers along strike south of the center of the historic Carrizal Alto copper-gold mine. Veins of the Farellon property were exploited as part of the Carrizal Alto mines. We have located no hard data summarizing all of the past mining activity, but tailings, slag dumps and the size of the shafts and some of the shallow surface workings are evidence of extensive historical mining.
Mine workings of various sizes are all along the Farellon property, but only one modern exploration program has been completed. In 1996, the Farellon and two other veins, the Fortuna and the Theresa, were explored by an Australian junior mining company under the name Minera Stamford S.A. Their exploration included a large mapping and surface sampling program followed by a 34-hole RC drilling program. Of these 34 drill holes, 23 were drilled on the Farellon 1 – 8 claim. The RC drilling program on the Farellon claim consistently intersected oxide and sulphide facies mineralization along a 2 kilometer-long zone covering the Farellon claim and strike extents to the south. Mineralization is 2 to 35 meters wide with an average width of 5 meters. The mineralized zone consists of one or more discrete veins and, in places, stockwork veining and mineralization. While drilling covered the length of the property, gaps up to 350 meters are untested and infill drilling is required to confirm an economic ore body. Table 4 presents the significant intersections from the 23 holes drilled on the Farellon claim in the 1996 drilling.
| Table 4: Farellon historic significant intersections (1996) | |
| Drill hole | | | | Significant intervals (m) | | | | Assay results | |
| FAR–96 | | | | From | | | | To | | | Length | | | Gold (g/t) | | | Copper (%) | | | Cobalt (%) | |
| | 06 | | | | 49 | | | | 54 | | | | 5 | | | | 0.15 | | | | 0.73 | | | | 0.01 | |
| | 07 | | | | 25 | | | | 34 | | | | 9 | | | | 0.38 | | | | 1.05 | | | | 0.02 | |
| | 09 | | | | 57 | | | | 84 | | | | 27 | | | | 0.51 | | | | 0.91 | | | | 0.03 | |
| | 010 | | | | 31 | | | | 36 | | | | 5 | | | | 1.00 | | | | 0.68 | | | | 0.04 | |
| | 011 | | | | 20 | | | | 26 | | | | 6 | | | | 0.67 | | | | 0.46 | | | | 0.02 | |
| | 013 | | | | 86 | | | | 93 | | | | 7 | | | | 0.87 | | | | 1.68 | | | | 0.04 | |
| | 014 | | | | 77 | | | | 83 | | | | 6 | | | | 0.66 | | | | 0.85 | | | | 0.06 | |
| | 015 | | | | 59 | | | | 79 | | | | 20 | | | | 0.99 | | | | 0.98 | | | | 0.06 | |
| | | | | | 99 | | | | 109 | | | | 10 | | | | 0.18 | | | | 1.02 | | | | 0.03 | |
| | 016 | | | | 24 | | | | 26 | | | | 2 | | | | 0.95 | | | | 1.57 | | | | 0.02 | |
| | | | | | 64 | | | | 70 | | | | 6 | | | | 0.73 | | | | 0.81 | | | | 0.07 | |
| | 020 | | | | 14 | | | | 16 | | | | 2 | | | | 0.46 | | | | 1.85 | | | | 0.05 | |
| | | | | | 39 | | | | 43 | | | | 4 | | | | 0.75 | | | | 0.90 | | | | 0.03 | |
| | 021 | | | | 22 | | | | 25 | | | | 3 | | | | 4.17 | | | | 5.29 | | | | 0.11 | |
| | 022 | | | | 29 | | | | 39 | | | | 10 | | | | 1.53 | | | | 1.31 | | | | 0.04 | |
| | | | | | 100 | | | | 108 | | | | 8 | | | | 3.72 | | | | 2.49 | | | | 0.06 | |
| | | | | | 50 | | | | 53 | | | | 3 | | | | 0.48 | | | | 1.10 | | | | 0.06 | |
| | 023 | | | | 59 | | | | 64 | | | | 5 | | | | 0.28 | | | | 0.78 | | | | 0.03 | |
| | | | | | 132 | | | | 147 | | | | 15 | | | | 0.60 | | | | 1.42 | | | | 0.03 | |
| | 024 | | | | 33 | | | | 36 | | | | 3 | | | | 0.94 | | | | 2.89 | | | | 0.06 | |
| | 025 | | | | 65 | | | | 85 | | | | 20 | | | | 0.97 | | | | 1.22 | | | | 0.02 | |
| | 028 | | | | 55 | | | | 58 | | | | 3 | | | | 0.12 | | | | 0.52 | | | | 0.06 | |
| | 029 | | | | 30 | | | | 34 | | | | 4 | | | | 0.18 | | | | 1.15 | | | | 0.07 | |
| | | | | | 82 | | | | 87 | | | | 5 | | | | 0.09 | | | | 0.96 | | | | 0.01 | |
| Table 4: Farellon historic significant intersections (1996) |
Drill hole FAR–96 | Significant intervals (m) | | Assay results |
| From | To | Length | | Gold (g/t) | Copper (%) | Cobalt (%) |
| 06 | 49 | 54 | | 5 | | | 0.15 | 0.73 | 0.01 |
| 07 | 25 | 34 | | 9 | | | 0.38 | 1.05 | 0.02 |
| 09 | 57 | 84 | | 27 | | | 0.51 | 0.91 | 0.03 |
| 010 | 31 | 36 | | 5 | | | 1.00 | 0.68 | 0.04 |
| 011 | 20 | 26 | | 6 | | | 0.67 | 0.46 | 0.02 |
| 013 | 86 | 93 | | 7 | | | 0.87 | 1.68 | 0.04 |
| 014 | 77 | 83 | | 6 | | | 0.66 | 0.85 | 0.06 |
| 015 | 59 | 79 | | 20 | | | 0.99 | 0.98 | 0.06 |
| 99 | 109 | | 10 | | | 0.18 | 1.02 | 0.03 |
| 016 | 24 | 26 | | 2 | | | 0.95 | 1.57 | 0.02 |
| 64 | 70 | | 6 | | | 0.73 | 0.81 | 0.07 |
| 020 | 14 | 16 | | 2 | | | 0.46 | 1.85 | 0.05 |
| 39 | 43 | | 4 | | | 0.75 | 0.90 | 0.03 |
| 021 | 22 | 25 | | 3 | | | 4.17 | 5.29 | 0.11 |
| 022 | 29 | 39 | | 10 | | | 1.53 | 1.31 | 0.04 |
| 100 | 108 | | 8 | | | 3.72 | 2.49 | 0.06 |
| 023 | 50 | 53 | | 3 | | | 0.48 | 1.10 | 0.06 |
| 59 | 64 | | 5 | | | 0.28 | 0.78 | 0.03 |
| 132 | 147 | | 15 | | | 0.60 | 1.42 | 0.03 |
| 024 | 33 | 36 | | 3 | | | 0.94 | 2.89 | 0.06 |
| 025 | 65 | 85 | | 20 | | | 0.97 | 1.22 | 0.02 |
| 028 | 55 | 58 | | 3 | | | 0.12 | 0.52 | 0.06 |
| 029 | 30 | 34 | | 4 | | | 0.18 | 1.15 | 0.07 |
| 82 | 87 | | 5 | | | 0.09 | 0.96 | 0.01 |
Geology .Geology. The Farellon area has two major lithological units: Paleozoic metamorphic sediments consisting of schists, phyllites and quartzites; and the Franja Central diorites. The metamorphosed sediments outcrop in the western part of the property and have been metamorphosed to lower greenschist facies and then extensively overprinted by hydrothermal alteration. Hydrothermal alteration is directly associated with the shear zone. The diorite underlies the eastern part of the project area and has been extensively intruded by northeasterly trending intermediate mafic dykes. At the Farellon property, a small stock-like felsic body named Pan de Azucar intrudes the diorite. The intrusive relationship between the diorite and metamorphic sediments always appear to be tectonic. Within the property and at the main Carrizal Alto workings to the north, the major mineralization is intimately related to the south-southwest trending mylonitic sheared contact between the metamorphic sediments and the diorite. The shear is considered a splay of the main Atacama Fault Zone and dips 30º to 65º west. This contact parallels the regional geological trend and coincides with a major lineament which extends for hundreds of kilometers. The sheared contact is 50 meters to 200 meters wide over the 1.7-kilometre strike length of the Farellon property. Veins are typically 3 to 15 meters wide, striking south-southwest and dipping approximately 65 degrees to the northwest.
Mineralization . The Farellon property lies within the Candelaria iron oxide-copper-gold (IOCG) belt of Chile. Ore bodies in the belt occur in veins, breccias, stringer bodies and layer parallel replacement bodies and are typically associated with north-south trending faults related to the Atacama Fault Zone. All IOCG deposits have a strong association with iron oxides in the form of hematite or magnetite. In the Candelaria region, larger ore bodies are located where the fault zones intersect a lithological contact with significant rheological contrast such as a sedimentary and volcanic intrusive contact.
Economic IOCG deposits are generally polymetallic and can include iron, copper, gold, zinc, lead, uranium and cobalt among others. The Farellon property historically has been exploited for copper and to a lesser extent, gold. Cobalt mineralization was observed during the 1996–97 exploration work, but we have found no records of cobalt extraction.
Drilling (2009)(Fall 2009). In September 2009 we completed a 725-metre RC drilling program on the Farellon property. Table 5 summarizes the results of our drilling.
The drilling program was designed to confirm historic drilling results and test mineralization down dip of previous drilling. Of the five holes drilled, three holes—FAR–09–A, B and E—tested historic intersections FAR–96–09, 021 and 022 summarized in Table 3; and two—FAR–09–C and D—tested depth extents of the previously known mineralization. Results of the drilling show grades and widths of mineralization consistent with historic exploration results and have given us valuable geological information showing the possibility of a shallow, 30-degree dip of the mineralization.
| Table 5: Farellon drilling results (2009) |
Drill hole FAR – 09 | Assay interval (m) | | Assay grade |
| | From | To | Core length | | Gold (ppm) | Copper (%) |
| A | | 31 | 34 | 3.0 | | 0.81 | 1.99 |
| | 79 | 109 | 30.0 | | 0.18 | 0.62 |
| including | 97 | 106 | 9.0 | | 0.44 | 1.63 |
| B | | 56 | 96 | 40.0 | | 0.27 | 0.55 |
| including | 56 | 63 | 7.0 | | 0.22 | 0.66 |
| | 74 | 96 | 22.0 | | 0.42 | 0.79 |
| including | 75 | 86 | 11.0 | | 0.67 | 1.35 |
| C | | 73 | 103 | 30.0 | | 0.79 | 0.55 |
| including | 77 | 82 | 5.0 | | 4.16 | 2.57 |
| D | | 95 | 134 | 39.0 | | 0.11 | 0.58 |
| including | 95 | 103 | 8.0 | | 0.33 | 2.02 |
| E | | 25 | 30 | 5.0 | | 0.54 | 1.35 |
| 65 | 68 | 3.0 | | 0.58 | 1.46 |
| Table 5: Farellon drilling results (2009) | |
| | Drill hole | | Assay interval (m) | | | Assay grade | |
| | FAR – 09 | | | | From | | | To | | | Core length | | | Gold (ppm) | | | Copper (%) | |
| | | | | | | 31 | | | | 34 | | | | 3.0 | | | | 0.81 | | | | 1.99 | |
| | | A | | | | | 79 | | | | 109 | | | | 30.0 | | | | 0.18 | | | | 0.62 | |
| | | | | including | | | 97 | | | | 106 | | | | 9.0 | | | | 0.44 | | | | 1.63 | |
| | | | | | | | 56 | | | | 96 | | | | 40.0 | | | | 0.27 | | | | 0.55 | |
| | | | | including | | | 56 | | | | 63 | | | | 7.0 | | | | 0.22 | | | | 0.66 | |
| | | B | | | | | 74 | | | | 96 | | | | 22.0 | | | | 0.42 | | | | 0.79 | |
| | | | | including | | | 75 | | | | 86 | | | | 11.0 | | | | 0.67 | | | | 1.35 | |
| | | C | | | | | 73 | | | | 103 | | | | 30.0 | | | | 0.79 | | | | 0.55 | |
| | | | | including | | | 77 | | | | 82 | | | | 5.0 | | | | 4.16 | | | | 2.57 | |
| | | D | | | | | 95 | | | | 134 | | | | 39.0 | | | | 0.11 | | | | 0.58 | |
| | | | | including | | | 95 | | | | 103 | | | | 8.0 | | | | 0.33 | | | | 2.02 | |
| | | E | | | | | 25 | | | | 30 | | | | 5.0 | | | | 0.54 | | | | 1.35 | |
| | | | | | | | 65 | | | | 68 | | | | 3.0 | | | | 0.58 | | | | 1.46 | |
We commissioned Micon International Limited (“Micon”) to prepare a technical report that complies with Canadian National Instrument 43-101 summarizing the information obtained from this drilling program. Micon concluded that our drilling confirmed the general location and tenure of the mineralization identified during the 1996 drilling program and noted some minor disparities between historical 1996 gold and copper assays and the recent 2009 gold and copper assays in two of the drill holes—FAR–09–A and E. In FAR–09–E. Micon recommended that we investigate these disparities during the next phase of drilling.
The drilling identified that the copper and gold mineralization exhibited a direct correlation in both location and relative intensity and provided useful information for outlining the relative location and spacing of drill holes in our next exploration programs.
All of our 2009 drill holes intersected oxide facies mineralization with only minor amounts of sulphides observed in drill hole FAR–09–D. When we have established the general trend of the mineralization we can conduct some drilling to identify the oxide-sulphide interface.
Following the 2009 drilling program, Micon recommended that we conduct a two-phase drilling program. The first phase would consist of approximately 1,200 meters of diamond drilling to assist in defining the structural controls on the mineralization, which could have been misinterpreted in the past due to the limited geological information obtained from the historic RC drilling, and the depth and nature of the sulphide mineralization.
QA/QC, sampling procedures and analytical methods. We conducted sampling on one-meter intervals, which is generally the industry-standard sampling practice for RC drilling. Sampling started at the collar of the hole and proceeded to the toe or bottom of the drill hole on one-meter increments. Generally, the sample recovery was good to excellent for the 2009 drilling commenced in Julyprogram. Table 5 summarizes significant assay results. They are reported as drill lengths as we have not established the width of the mineralized zone.
Drilling (Summer 2011). During June through September 2011 we conducted a combined RC/diamond drill program on the Farellon property. The program was designed to continue to expand on the results of the 2009 drill program, as well as to continue confirming historical results along the strike. During this program we completed 11 drillholes for a total of 2,233m with the goal not only of better defining structural controls on mineralization but to examine the continuity of mineralization along strike and at depth. The target of the program was to outline a 700m mineralized strike length down to 200m vertical depth with approximate 75m intercept spacing, and to infill gaps 300m further to the North to increase intercepts to 150m150 m spacing.
Many of the existing intercepts in this area were from the 1996/97 drill program where no geological information can be located for these drill holes. By infilling the area with drilling at 75 meter pierce points the aim was to increase confidence in the continuity and increase knowledge of the nature and structural controls on mineralization to aid further exploration planning. 2011 drill results confirmed that mineralization is still present downdip of past drilling intercepts and still open at depth. Infill drilling confirmedcontinued to confirm the continuity of the mineralization is stilland aided in the development of economic grade and now starts the process of having consistent 75m spacing between drillholes.
a 3D model that will be used for any future drill planning.
2011 drilling confirmed the overall regional shear structural controls on mineralization occurring within the oblique fault contact between overlying Paleozoic Metasediments and underlying Jurassic intermediate intrusives. Supergene mineralization seems to occur within local faults not immediately within the lithological fault contact – possibly fault splays emanating off the main regional structure. In the 2011 drillholes, supergene copper-gold mineralization was intersected 50-150m downhole with abundant carbonate and iron oxide precipitation.
Hypogene mineralization occurred below 150m hosted in quartz and carbonate veins which appear closer to the main shear fault zone contact. Approximately within 20m downhole of intersected hypogene mineralized veins the lithological contact was encountered, passing through to the underlying intrusive package. The 2011 drill program was generally positive in better defining structural controls on mineralization and proving continuity of mineralization along strike and at depth. However, more drilling is needed to continue to expand on the mineralized zone along strike and at depth, and prove up infill targets for an initial resource estimation.
In spring of 2012 we commissioned Micon to complete a second 43-101 technical report. Micon now recommends that we conduct a much larger phase of exploration consisting of 5,000 meters of diamond drilling and 10,000 meters of RC drilling, and geophysical surveys and geological mapping. A geophysics survey using both magnetics and induced polarization will help to identify further mineralized structures on the property that may not have been noticed in the historic mapping. A phase two drill program would be at defined spacing to outline the continuity of mineralization leading to a 3D model andan initial resource estimation. The depth of the drilling would be dependent on the results of the phase one drilling program. The estimated cost of this phase is $1.9 million.
QA/QC, sampling procedures and analytical methods. We conducted sampling on one-meter intervals, which is generally the industry-standard sampling practice for RC drilling. Sampling started at the collar of the hole and proceeded to the toe or bottom of the drill hole on one-meter increments. Generally, the sample recovery was good to excellent for the 2009 drilling program. Table 5 summarizes significant assay results. They are reported as drill lengths as we have not established the width of the mineralized zone.
Drilling (2011)Table Of Contents. During June through September 2011 we conducted a combined RC/diamond drill program on the Farellon property. The program was designed to continue to expand on the results of the 2009 drill program, as well as to continue confirming historical results along the strike. During this program we completed 11 drillholes for a total of 2,233m. Significant results of assays from the 2011 drill program are presented in the Table 6 below.
Table 6: Farellon drilling results (2011)
| Drill Hole ID | Assay interval (m) | Assay grade |
| From | To | Length | Copper % | Gold g/t |
| FAR-11-001 | 36 | 49 | 13 | 2.51 | 0.35 |
| FAR-11-001 | 78 | 85 | 7 | 0.43 | 0.04 |
| FAR-11-002 | No Significant Intersections . Zone faulted off |
| FAR-11-003 | 150 | 155 | 5 | 0.40 | 0.28 |
| FAR-11-003 | 177 | 182 | 5 | 0.44 | 0.15 |
| FAR-11-004 | 141 | 145 | 4 | 0.73 | 0.01 |
| FAR-11-005 | 124 | 133 | 9 | 0.84 | 0.26 |
| FAR-11-006 | 80 | 112 | 32 | 1.35 | 0.99 |
| FAR-11-007 | 56 | 74 | 18 | 0.50 | 0.40 |
| FAR-11-008 | 98 | 102 | 4 | 0.85 | 0.26 |
| FAR-11-009 | 202 | 211.55 | 9.55 | 0.95 | 0.42 |
| FAR-11-010 | 179.13 | 183 | 3.87 | 0.50 | 0.39 |
| FAR-11-011 | 54 | 56 | 2 | 0.97 | 0.48 |
| | | Assay interval (m) | | | Assay grade | |
| Drill Hole ID | | From | | | To | | | Length | | | Copper % | | | Gold g/t | |
| FAR-11-001 | | | 36 | | | | 49 | | | | 13 | | | | 2.51 | | | | 0.35 | |
| FAR-11-001 | | | 78 | | | | 85 | | | | 7 | | | | 0.43 | | | | 0.04 | |
| FAR-11-002 | | No Significant Intersections . Zone faulted off | |
| FAR-11-003 | | | 150 | | | | 155 | | | | 5 | | | | 0.40 | | | | 0.28 | |
| FAR-11-003 | | | 177 | | | | 182 | | | | 5 | | | | 0.44 | | | | 0.15 | |
| FAR-11-004 | | | 141 | | | | 145 | | | | 4 | | | | 0.73 | | | | 0.01 | |
| FAR-11-005 | | | 124 | | | | 133 | | | | 9 | | | | 0.84 | | | | 0.26 | |
| FAR-11-006 | | | 80 | | | | 112 | | | | 32 | | | | 1.35 | | | | 0.99 | |
| FAR-11-007 | | | 56 | | | | 74 | | | | 18 | | | | 0.50 | | | | 0.40 | |
| FAR-11-008 | | | 98 | | | | 102 | | | | 4 | | | | 0.85 | | | | 0.26 | |
| FAR-11-009 | | | 202 | | | | 211.55 | | | | 9.55 | | | | 0.95 | | | | 0.42 | |
| FAR-11-010 | | | 179.13 | | | | 183 | | | | 3.87 | | | | 0.50 | | | | 0.39 | |
| FAR-11-011 | | | 54 | | | | 56 | | | | 2 | | | | 0.97 | | | | 0.48 | |
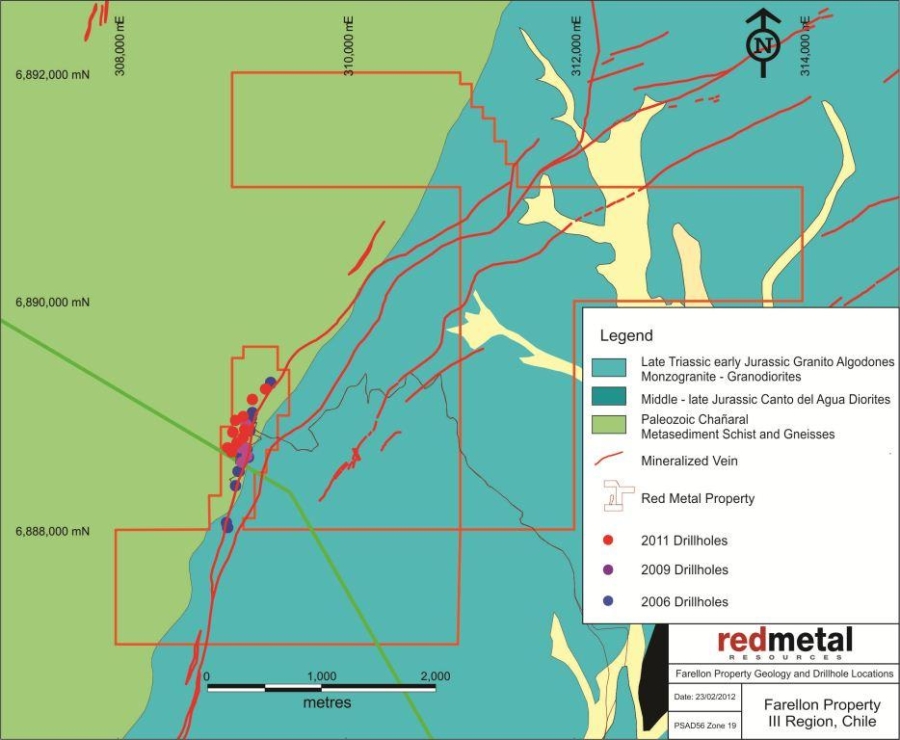
Figure 3 below illustrates the Farellon geology and the 2006, 2009 and 2011 drillhole collar locations as well as surface traces of mineralized vein systems:
Figure 3: Farellon property geology
QA/QC, sampling procedures and analytical methods. Samples were taken at intervals between 0.5 and 2 metres. Sampling started at the collar of the hole and proceeded to the toe or bottom of the drill hole. Samples were taken at two metre intervals outside the previously identified main zone of interest. Through the main zone of interest samples were taken at one metre intervals. Generally, the sample recovery was good to excellent for the 2011 drilling program. Table 56 above summarizes significant assay results. They are reported as drill lengths as we have not established the width of the mineralized zone.
Our quality assurance, quality control (QA/QC) protocol consists of the addition of standards, blanks and laboratory duplicates to the sample stream. We inserted these into the sample series using the same number sequence as the samples themselves. One of the QA/QC check samples is inserted every 25 samples and it alternates between standards, blanks and laboratory duplicates.
perth propertySpring 2012 mapping program: In April of 2012 we completed a detailed mapping, prospecting and rock sampling program over the Farellon Property. This program was designed to extend the known mineralized zone to the north and the south and to identify the best potential to expand on the known mineralized zone. As a result of the mapping program, new ground was acquired at public auction in August 2012 to cover the strike extent of the mineralized veins.
Perth Property
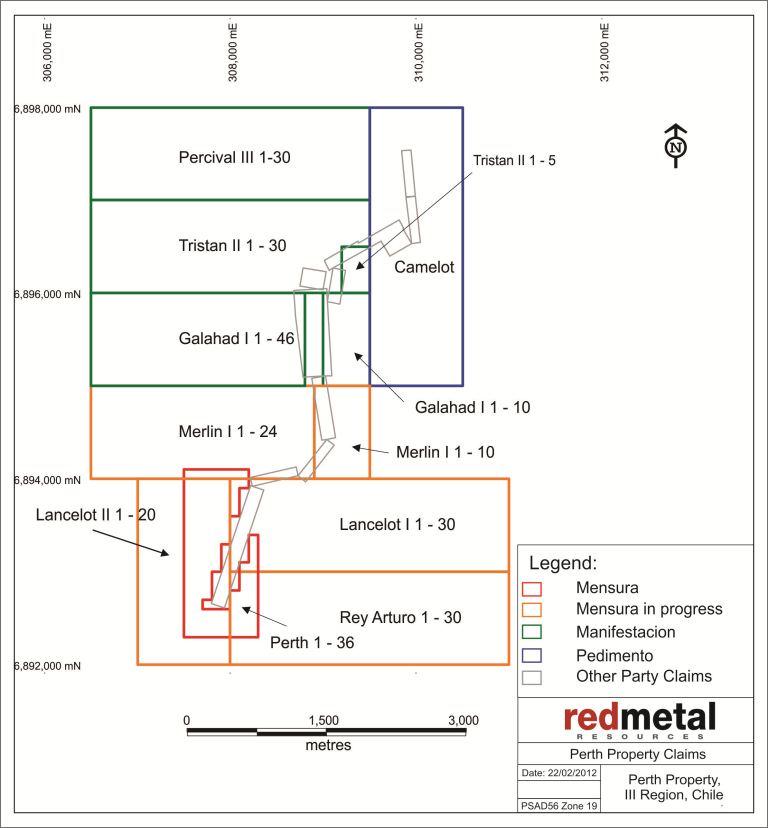
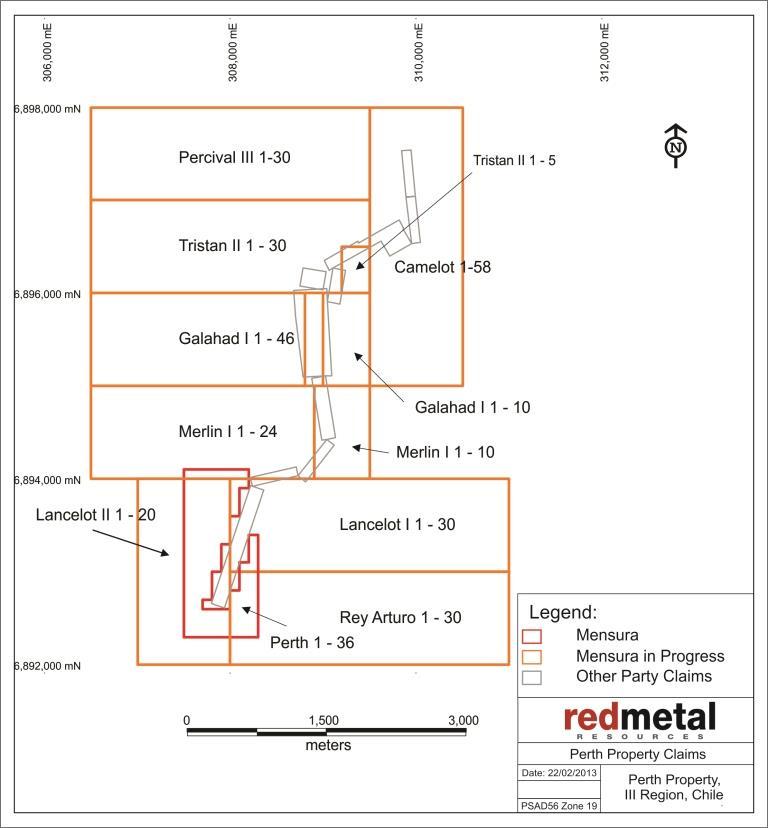
On March 10, 2011, we purchased for $35,000 a group of 12 claims (the Perth)“Perth”) as described in Table 7 and illustrated in Figure 4.
Table 7: Perth property
ClaimTable 7: Perth property | | | | |
| | | Type | |
| Claim | | | Mensura /Mensura in process (ha) | | | | Manifestacion (ha) | |
| Perth 1 al 36 claim | | | 109 | | | | | |
| Lancelot I 1 al 30 claim | | | 300 | | | | | |
| Lancelot II 1 al 20 claim | | | 200 | | | | | |
| Rey Arturo 1 al 30 claim | | | 300 | | | | | |
| Merlin I 1 al 10 claim | | | 60 | | | | | |
| Merlin I 1 al 24 claim | | | 240 | | | | | |
| Galahad I 1 al 10 claim | | | 50 | | | | | |
| Galahad I 1 al 46 claim | | | 230 | | | | | |
| Percival III 1 al 30 claim | | | 300 | | | | | |
| Tristan II 1 al 30 claim | | | 300 | | | | | |
| Tristan IIA 1 al 5 claim | | | 15 | | | | | |
| Camelot | | | | | | | 300 | |
| | | 2,104a | | | | 300a | |
|
aSome claims overlap others, reducing our net area to 2,283 hectares. See Figure 4.
Figure 4. The Perth property
Figure 4. The Perth property
The Perth property is adjacent to the west side of the historic Carrizal Alto mine and lies approximately 3.5 kilometers north of our Farellon project. It is a 45 minute drive from Vallenar city, with major road access, power and water supply close by. The project lies on a similar geologic contact as the Farellon and Carrizal Alto properties.
Location and means of access. The Perth property is centered about 308,750 east and 6,895,000 south UTM PSAD56 Zone 19 approximately 75 km northwest of the city of Vallenar with the highest point at approximately 925 meters above sea level. The property is accessible by road from Vallenar. The Perth Caliza Property is accessed by taking the Pan American Highway north from Vallenar for 20 kilometres, then turning west onto the road to Canto del Agua a distance of 35 kilometres. Then take the Cardones Canyon road for 15 kilometres, turn southwest towards Cerro Cachina Grande along a secondary gravel road for 14 kilometres to the property.
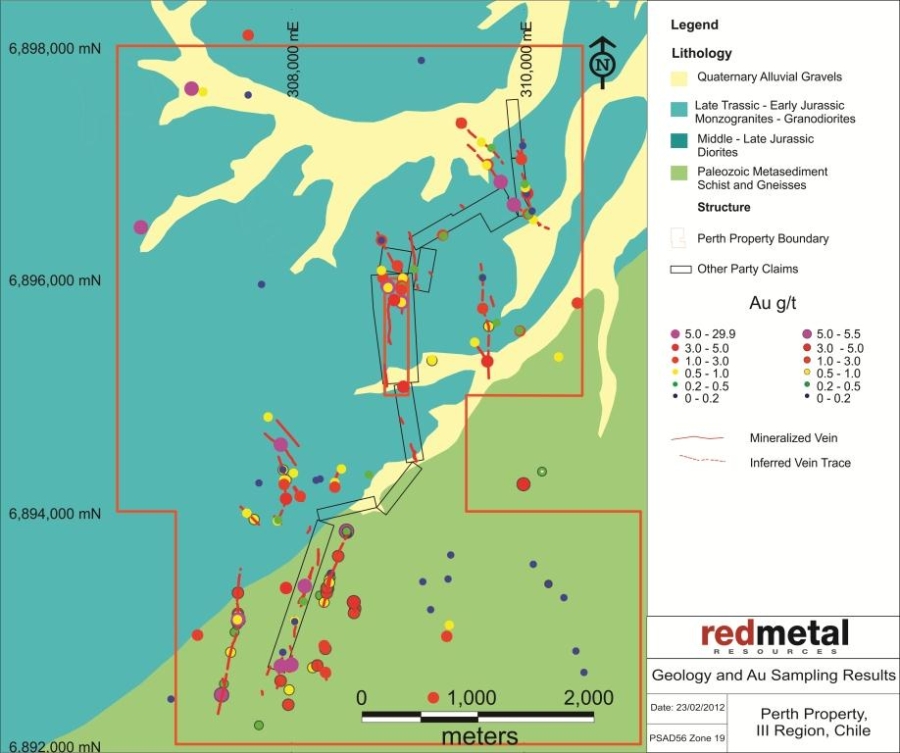
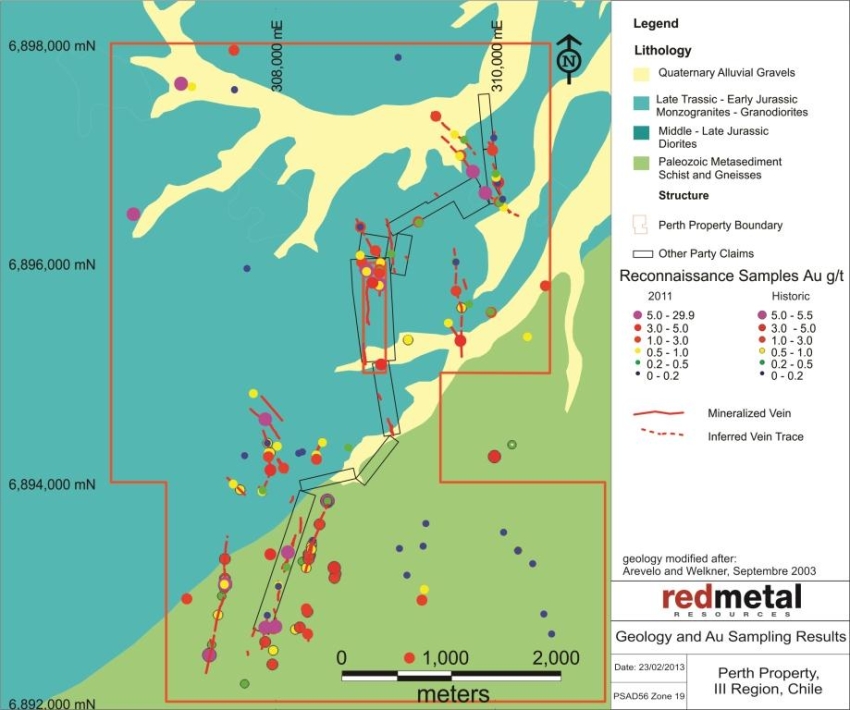
Exploration history. Exploration programs on the Perth property have historically been limited to surface sampling and mapping programs completed in 2007 and 2008. Mapping identified 12 individual veins on surface, significantSignificant results from historic channel samples across the veins are showshown in Table 8. Numerous artisanal mine workings on the property have previously been exploited for both copper and gold; however, no records of grade or tonnage can be located.
| Table 8: Perth historic significant intersections | |
| SAMPLE | | | Au g/t | | | Cu % | | | Co% | | | Length of Sample (m) | |
| | 521617 | | | | 2.5 | | | | 0.39 | | | | 0.03 | | | | 1.0 | |
| | 521796 | | | | 2.5 | | | | 0.21 | | | | 0.00 | | | | 1.0 | |
| | 521629 | | | | 2.8 | | | | 0.76 | | | | 0.19 | | | | 3.5 | |
| | 56905 | | | | 3.1 | | | | 1.00 | | | | 0.19 | | | | 1.0 | |
| | 521610 | | | | 3.5 | | | | 0.30 | | | | 0.02 | | | | 0.5 | |
| | 521622 | | | | 4.5 | | | | 1.72 | | | | 0.02 | | | | 1.0 | |
| | 521788 | | | | 4.5 | | | | 0.19 | | | | 0.00 | | | | 2.0 | |
| | 56858 | | | | 5.0 | | | | 0.42 | | | | 0.16 | | | | 1.0 | |
| | 521789 | | | | 5.5 | | | | 0.29 | | | | 0.00 | | | | 2.0 | |
| | 521628 | | | | 6.2 | | | | 0.59 | | | | 0.14 | | | | 1.3 | |
| | 521609 | | | | 10.7 | | | | 0.35 | | | | 0.07 | | | | 1.0 | |
GeologyGeology. The Perth property overlies the contact between Paleozoic metamorphic sediments and a Cretaceous tonalitic batholith. A swarm of north northeast trending fault related copper gold bearing quartz veins crosscuts the property. Surface mapping and sampling records show twelve veins identified so far on the south end of the property. The veins average two metres wide but have been measured up to six metres wide.
In spring of 2011 we completed a reconnaissance mapping and sampling program on the Perth property. Geological mapping during the program identified four major areas where mineralization in veins appear to be concentrated. Sampling consisted of 129 reconnaissance samples taken of vein material where veins outcropped at surface. Significant results are summarized in Table 9 below.
Table 9: Perth 2011 significant reconnaissance samples | |
| SAMPLE | | | Au g/t | | | Cu % | |
| | 0003 | | | | 7.47 | | | | 1.73 | |
| | 0010 | | | | 7.37 | | | | 3.63 | |
| | 0016 | | | | 8.86 | | | | 2.29 | |
| | 0017 | | | | 29.93 | | | | 1.1 | |
| | 0033 | | | | 21.66 | | | | 2.85 | |
| | 0042 | | | | 0.9 | | | | 7.74 | |
| | 0077 | | | | 10.2 | | | | 2.43 | |
| | 0078 | | | | 8.39 | | | | 3.78 | |
| | 0097 | | | | 4.42 | | | | 0.14 | |
| | 0098 | | | | 10.27 | | | | 0.51 | |
| | 0099 | | | | 3.61 | | | | 0.19 | |
| | 0100 | | | | 6.37 | | | | 0.22 | |
| | 0110 | | | | 22.58 | | | | 1.51 | |
| | 0121 | | | | 11.12 | | | | 3.9 | |
Figure 5 below illustrates the Perth geology as well as the 2007historic and 2011 reconnaissance sample gold g/t assay results:
Figure 5 Perth Property Geology
TerminationMemorandum of Perth property joint venture earn-in agreementUnderstanding with Geoactiva Spa.
On March 14, 2011,February 11, 2013, we entered into ana Memorandum of Understanding (“MOU”) with Geoactiva Spa. The MOU confirmed Geoactiva’s intention to acquire 100% of the Perth mineral claims through the execution of a mining option purchase agreement on(the “Option Agreement”). Terms of the MOU are summarized below:
1. Option price. In order to maintain the option to purchase and to acquire the Perth property, with Revonergy Inc. Revonergy Inc. paid $35,000 on signingGeoactiva must pay us the agreement, which allowed Revonergy to earn a 35% interesttotal amount of $1,000,000 USD in the following instalments:
| | | |
| | Payment Price US$ | |
| Upon execution of Option Agreement (“Execution date”) | | | 37,500 | |
| 6 months after Execution date | | | 37,500 | |
| 12 months after Execution date | | | 50,000 | |
| 18 months after Execution date | | | 50,000 | |
| 24 months after Execution date | | | 100,000 | |
| 30 months after Execution date | | | 100,000 | |
| 36 months after Execution date | | | 125,000 | |
| 42 months after Execution date | | | 250,000 | |
| 48 months after Execution date | | | 250,000 | |
| Total | | | 1,000,000 | |
All of the above payments shall be made only if Geoactiva wishes to keep the Option Agreement in force and finally to exercise the option to purchase.
Upon exercise of the Option Agreement and once the commercial production begins, Geoactiva will pay us NSR of 1.5% from the sale of gold, copper, and cobalt extracted from the Perth property if it spent a minimumproperty. At any time after the exercise of $1,450,000 on a three phasethe Option Agreement and Geoactiva’s fulfilment of the investment commitment of $3,500,000 in exploration program,expenditure, Geoactiva may purchase 100% NSR as follows:
| · | Successful completion of a Phase I exploration program costing at least $115,000 one year from signing |
Gold: paying US $5 per inferred ounce of gold, according to the definition of Inferred Mineral Resource in the CIM Definition Standards on Mineral Resources and Mineral Reserves
Copper: US $0.005 per inferred ounce of copper, according to the definition of Inferred Mineral Resource in the CIM Definition Standards on Mineral Resources and Mineral Reserves
Cobalt: If Geoactiva acquires the NSR with respect to gold, copper, or both, the NSR relating to cobalt will be terminated
Upon execution of the Option Agreement, Geoactiva will incur exploration expenditures, as follows:
| | · | Successful completion of a Phase II exploration program costing at least $300,000 two years | |
| | US$ | |
Within 12 months from signingexecution date | | | 500,000 | |
| 12-24 months from execution date | | | 1,000,000 | |
| 24-36 months from execution date | | | 1,000,000 | |
| 36-48 months from execution date | | | 1,000,000 | |
| Total | | | 3,500,000 | |
| · | Successful completion of a Phase III exploration program costing at least $1,000,000 and that can justify completing a preliminary feasibility study three years from signing |
If Geoactiva fails to incur the required exploration expenditures during a specific period it may fulfill its obligations by paying us the outstanding amount in cash.
Revonergy failed2. Due diligence. Geoactiva had 60 days (“Due Diligence Period”) from February 11, 2013, to complete Phase Iconduct the legal, technical, and other background review of the exploration program withinPerth property. On April 5, 2013, we extended the term specified, thereforeDue Diligence Period until May 11, 2013. At any time during the agreement has terminated.Due Diligence Period, Geoactiva may communicate in writing of its decision to execute the Option Agreement. During the Due Diligence period and until the execution of the Option Agreement, we agreed to provide exclusivity rights to Geoactiva and refrain from any negotiations with third parties.
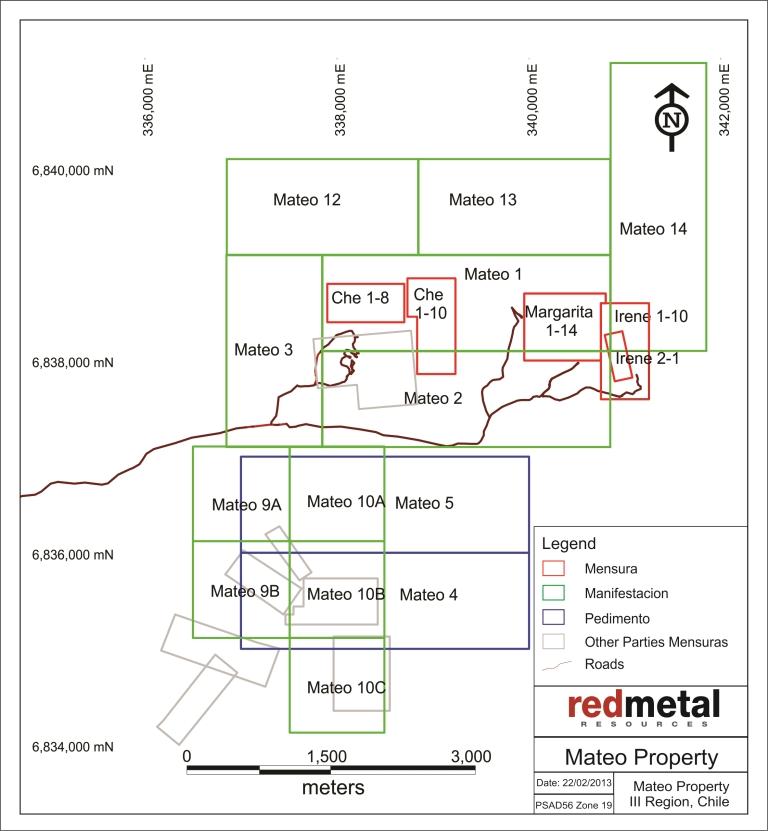
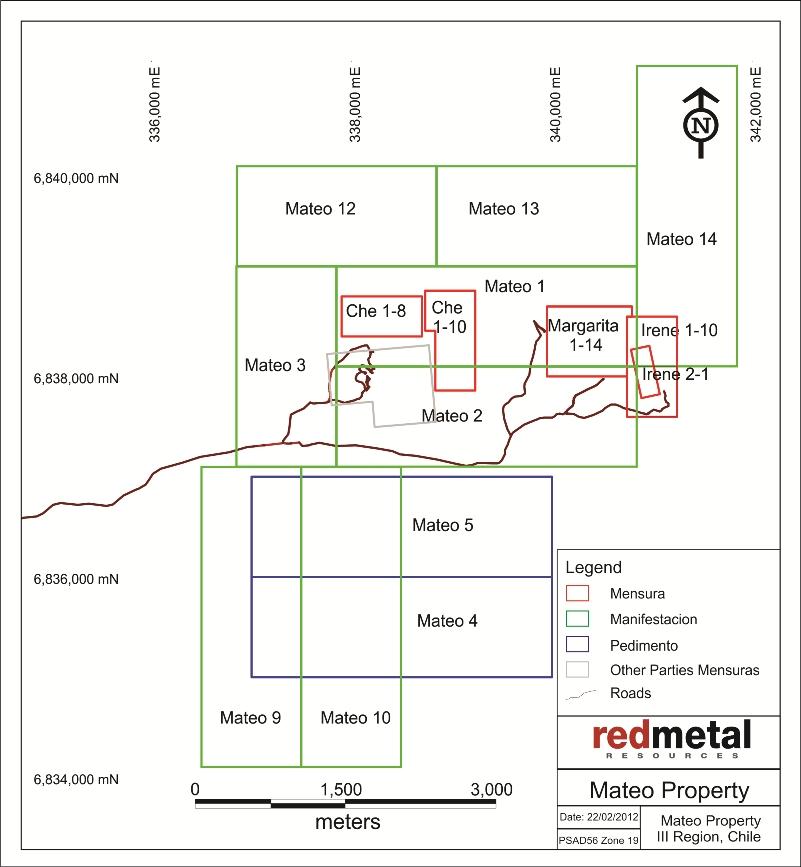
mateo propertyMateo Property
We have assembled a group of claims: the Che Uno and Che Dos, the Margarita, and the Irene Uno and Irene Dos mining claims, and the Mateo exploration claims as described in Table 910 and illustrated in Figure 6. The Mateo exploration claims overlap the Che, Margarita and Irene claims to secure the areas around the claims. Some of them may overlap others’ prior claims. We will acquire rights to these overlapped prior claims only if the owners forfeit their rights, and we will exercise our rights only if we want the property. We acquired all of these claims for the same geological reasons and consider them one property, which we call the Mateo property.
| Table 10: Mateo property | |
| Claim | | Type | |
| | Mensura (ha) | | | Mensura in processa (ha) | | | Pedimentoa (ha) | |
| Che Uno 1 – 8 | | | 32 | | | | | | | |
| Che Dos 1 – 10 | | | 44 | | | | | | | |
| Margarita 1 – 14 | | | 56 | | | | | | | |
| Irene Uno 1 – 2 | | | 10 | | | | | | | |
| Irene Dos 1 – 10 | | | 50 | | | | | | | |
Mateo 1, 2, 3, 9,10,12, 13, 14 | | | | | | | 2,100 | | | | |
| Mateo 4 | | | | | | | | | | | 300 | |
| Mateo 5 | | | | | | | | | | | 300 | |
| | | | 192 | | | | 2,100 | | | | 600 | |
| | |
a Some of the claims are staked over the mensuras to claim the ground surrounding them. See Figure 6.
| Table 9: Mateo property |
| Claim | Type |
Mensura (ha) | Manifestaciona (ha) | Pedimentoa (ha) |
| Che Uno 1 – 8 | 32 | | |
| Che Dos 1 – 10 | 44 | | |
| Margarita 1 – 14 | 56 | | |
| Irene Uno 1 – 2 | 10 | | |
| Irene Dos 1 – 10 | 50 | | |
| Mateo 1 | | 300 | |
| Mateo 2 | | 300 | |
| Mateo 3 | | 200 | |
| Mateo 4 | | | 300 |
| Mateo 5 | | | 300 |
| Mateo 9 | | 300 | |
| Mateo 10 | | 300 | |
| Mateo 12 | | 200 | |
| Mateo 13 | | 200 | |
| Mateo 14 | | 300 | |
| | 192 | 2,100 | 600 |
a Some of the claims are staked over the mensuras to claim the ground surrounding them. See Figure 6. |
Figure 6: Mateo property
che uno and che dos claims
On October 10, 2008 Minera Farellon Limitada granted us the option to purchase the Che Uno and Dos claims. The Che claims cover 76 hectares centered about 339,002 east and 6,838,450 south UTM PSAD56 Zone 19. They are in the northwest corner of the Mateo property. On April 12, 2011 we completed the acquisition of the Che claims by paying approximately $20,000 to Minera Farellon.
We continue to owe a royalty equal to 1% of the net proceeds that we receive from the processor to a maximum of $100,000 with no monthly minimum when we start exploiting the minerals we extract from the claim. We have not yet exploited the claim.
margarita claim
We bought the Margarita mining claim on November 27, 2008 through a public auction and at January 31, 2012 had spentfor a total of $17,528 (including legal and registration costs) for this claim.$15,984. The Margarita claim covers 56 hectares centered around 340,353 east and 6,838,347 south UTM PSAD56 Zone 19 located within the northeast corner of the Mateo claim.
irene uno and irene dos claims
On September 7, 2010, we entered into a purchase agreement with Minera Farellon to buy the Irene Uno and Irene Dos mining claims. Under the terms of the agreement, as amended, we paid $45,174 (equivalent of 21 million Chilean pesos) on May 10, 2011 to exercise the option and purchase the Irene claims. The Irene claims cover 60 hectares centered about 341,002 east and 6,838,101 south UTM PSAD56 Zone 19, are located within the northeast corner of the Mateo property, and share their western border with the Margarita claim.
mateo claims
The Mateo claims consist of eight manifestacionesmensura in process — Mateo 1 –3, 9-10,through 3, 9,10, and 12 –through 14, and two pedimentos — Mateo 4 and 5, covering 2,220 hectares, which we staked between November 2008 and November 2011. The claims are centered about 337,675 east and 6,837,600 south UTM PSAD56 Zone 19 and cover a five-kilometer strike length of intensely altered volcanics with significant massive sulphide mineralization.
Location and means of access. The Mateo property is centered about 337,675 east and 6,837,600 south UTM PSAD56 Zone 19 approximately 10 kilometers east of Vallenar with the highest point at approximately 1,050 meters above sea level. A well-used road leads from the city of Vallenar and crosses through the middle of the west half of the properties and along the southern border of the east half of the properties. Many unmarked dirt roads in the area provide reliable access to most areas of Mateo.
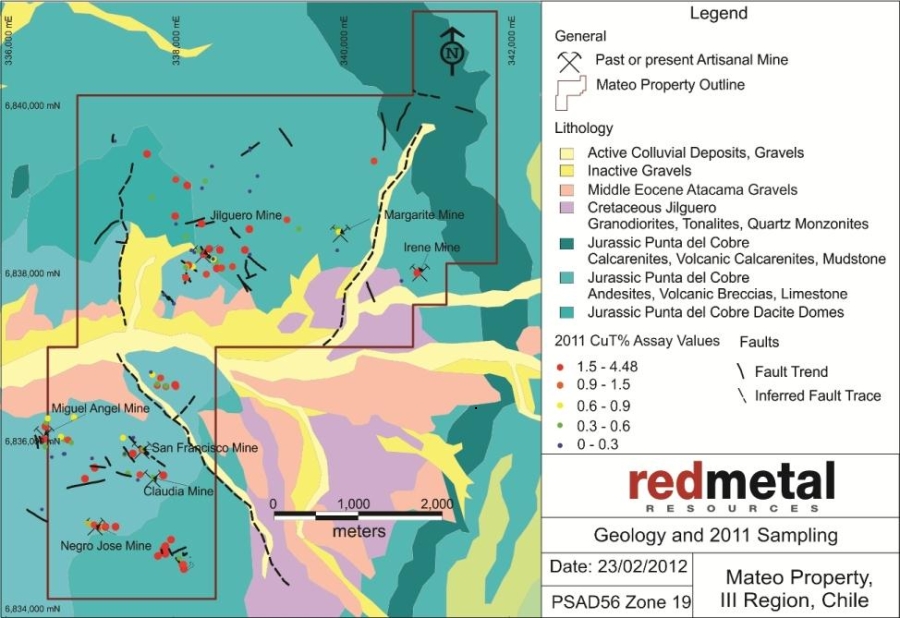
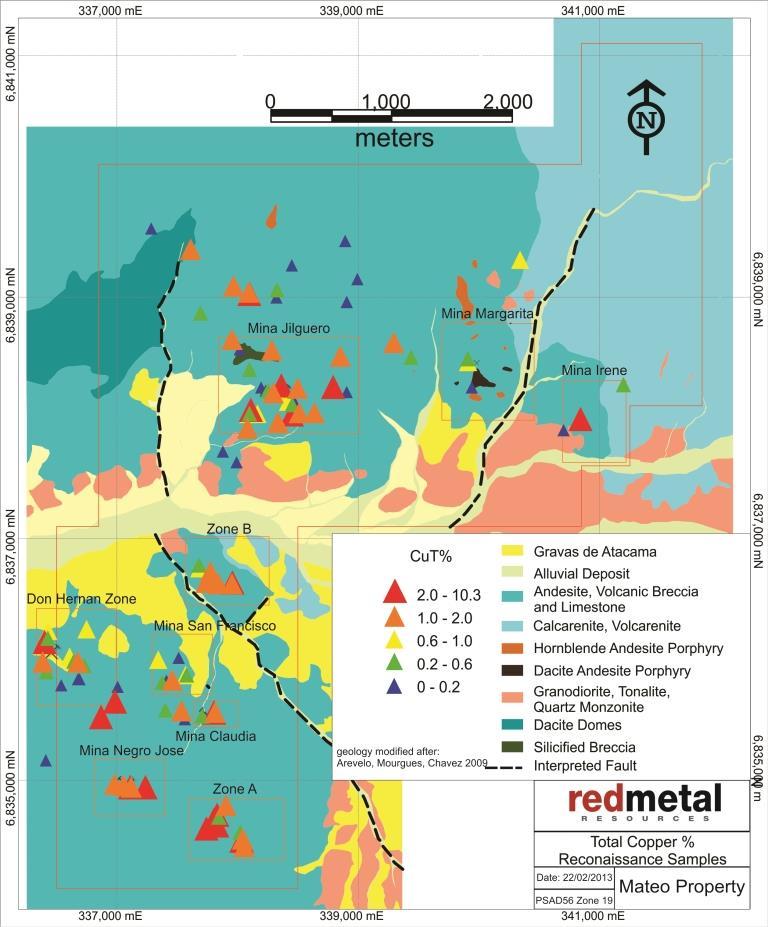
Description. The Mateo property is a copper-gold-silver project that lies in the Candelaria IOCG belt in the Chilean Coastal Cordillera. The Mateo property has undergone limited modern exploration including surface and underground RC drilling and artisanal mining on three separate mine sites, the Irene, Margarita and Santa Theresa mines. We have reviewed all available records of work completed to date, including some records of the mining activity. Our interpretation of the work completed to date indicates the potential for an economic ore body in mineralized mantos and skarn-style mineralization associated with IOCG deposits.
Exploration history. Historical work includes several drill programs completed by different Chilean private and public companies. Records exist from eight drillholes completed in 1994 on the Irene mine and include two full reports written by ENAMI (the Chilean national mining company) with interpretation of mineralization and recommendations for further exploration and mining work.
The Irene mine was investigated by ENAMI in 1994. Work completed during this time included surface RC drilling, including 490 meters in four RC drillholes, and underground diamond drilling, including 220 meters in four drillholes. We obtained ENAMI’s reports of mining activities from 1994 through 1997. Approximately 11,875 tonnes of rock were mined in that time averaging 4.3% copper, 61.9 grams per tonne silver, and 1.01 grams per tonne gold. During the period from June 2009 to December 2010 the vendor of the Irene, Minera Farellon, conducted small scale mining activities on a different area of the Irene claims and mined 1,705 tonnes grading 1.39% Cu, 1.39g/t Ag, 0.29g/t Au in sulphides and 1,477 tonnes grading 1.98% Cu in oxides. The difference in grade between the historic work and the recent work is not an indication that further high grade material will not be found on the Mateo property and further modeling and exploration work needs to be completed to determine the best place to drill.
A private Chilean company, Minera Taurus, drilled 16 RC holes on the east end of the Irene claim, but we have no record from this drilling. An unknown company built a portal 250 meters long and approximately three meters wide by three meters high. The portal leads to three mined-out chimneys connected to the surface providing ventilation channels. On a recent property visit with ENAMI’s geologists, we found an extension of the mineralized zone at the base of the tunnel below showing the potential for mineral resources.
Geology. Geologically, the Mateo property is located within the brittle-ductile north-south-trending Atacama Fault System that is known to host many of the major deposits in the Candelaria IOCG belt. Known mineralization is hosted in an andesitic volcaniclastic sequence assigned to the Bandurrias Formation. Widespread iron oxide and potassic alteration indicates an IOCG mineralizing system further supported by significant amounts of economic grade mineralization.
Exploration (2011). During August through October 2011 we carried out an in-depth geological mapping and sampling program on the Mateo property. The Mateo property has very diverse mineralization styles through the property which includes mantos, veins, breccias and porphyries with significant gold and copper. A total of 138 reconnaissance samples were collected over the property. The highest assay values returned from reconnaissance samples were 21g/t Au and 10.3% Cu but more common values were between 1-3g/t Au and 1-3% Cu. Table 1011 summarizes the significant assay results.
Table 10:11: Mateo significant intersections
| Sample | | | Cu% | | | Au g/t | |
| | 201272 | | | | 7.37 | | | | 1.12 | |
| | 202871 | | | | 2.63 | | | | 1.14 | |
| | 202852 | | | | 7.11 | | | | 1.18 | |
| | 202849 | | | | 10.3 | | | | 1.73 | |
| | 201220 | | | | 4.29 | | | | 2.07 | |
| | 201277 | | | | 9.39 | | | | 2.42 | |
| | 202850 | | | | 2.58 | | | | 2.46 | |
| | 202810 | | | | 2.44 | | | | 2.49 | |
| | 202882 | | | | 2.57 | | | | 3.08 | |
| | 202812 | | | | 0.50 | | | | 3.10 | |
| | 202815 | | | | 0.62 | | | | 3.57 | |
| | 202880 | | | | 1.46 | | | | 5.70 | |
| | 202826 | | | | 5.30 | | | | 6.85 | |
| | 201217 | | | | 3.46 | | | | 10.11 | |
| | 202813 | | | | 0.69 | | | | 21.72 | |
The detailed mapping identified nine significant mineralized zones where further work is recommended.
Figure 7 below illustrates the local Mateo geology including a thematic map of 2011 reconnaissance sample locations and corresponding percent copper assay ranges.
Figure 7: Mateo property geology
2011 Ground Magnetic Survey
During the month September 2011, we engaged Quantec International Project Services Ltd. to complete a ground magnetic survey on the Mateo Property. The ground magnetic survey consisted of 70 survey lines with an E-WEW orientation, and two control lines with a N-SNS orientation. The survey lines were separated by 100m, and data was collected at 10 m10m intervals on all lines. A total of 218.49 km218.49km of magnetic data was collected. The survey outlined areas of high and low magnetic response. Areas of high magnetic response indicated the presence of elevated levels of magnetic minerals such as magnetite, pyrotite and hematite whereas areas of low magnetic response may be caused by alteration processes such as magnetite destruction or may simply indicate rock types that never had magnetic minerals.
This ground magnetic survey demarcated the northern and western extent with a large, high magnetic anomaly with a southwest to northeast orientation. This magnetic high may correlate with the Jilguero Intermediate Intrusive formation which is only partially exposed on the property and underlies the Jurassic Punta Del Cobre volcanics, and mixed sedimentary sequence.
Two possible correlations with geology are drawn when looking at the magnetic geophysical response. Firstly, all artisanal mines, reconnaissance samples and documented surface mineralization isare exposed on the Western edge of the magnetic high in an area where magnetic high-low gradients are greatest transitioning from high to low. Secondly, magnetic highs appear to persist away from the main magnetic high body in a NW direction. Although these persisting magnetic highs are only small stringers in appearance they possibly correlate to dominant NW trending faults on the property that are often mineralized. Visual correlations between magnetic high/low contrasts and geology seem strong enough to suggest further exploration including sampling and drilling along the steepest gradient of magnetic high/low dropoff.
veta negra
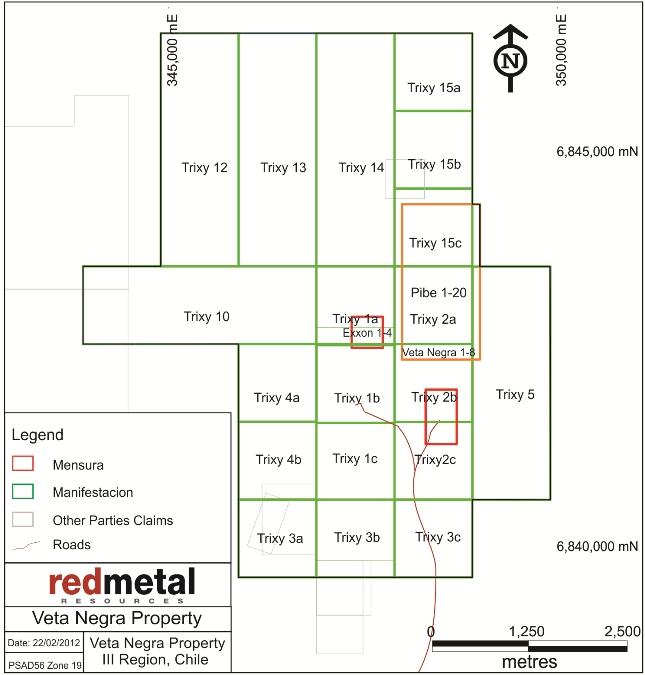
The Veta Negra property is made up of 19 Trixy exploration claims and three mining claims.
Table 11: Veta Negra property.
| Claim | Mensura (ha) | Manifestaciona (ha) |
| Veta Negra 1-7 | 28 | |
| Exxon 1-4 | 16 | |
| Pibe 1-20 | 200 | |
| Trixy 1 (a,b,c) | | 300 |
| Trixy 2 (a,b,c) | | 300 |
| Trixy 3 (a,b,c) | | 300 |
| Trixy 4 (a,b) | | 200 |
| Trixy 5 | | 300 |
| Trixy 10 | | 300 |
| Trixy 12 | | 300 |
| Trixy 13 | | 300 |
| Trixy 14 | | 300 |
| Trixy 15(a,b,c) | | 300 |
| | 244 | 2,900 |
a Figure 8 below illustrates the Veta Negra claims. |
Figure 8: Veta Negra property
pibe claims
On November 25, 2011, we entered into an option to purchase agreement with Manuel Antonio Cortez Araya to purchase the Pibe 1 - 20 mining claims. The Pibe claims are located in Sierra la Chinchilla, community of Vallenar, Province of Huasco, Region of Atacama; they cover 200 hectares with UTM coordinates: East 348,500,000, North 6,843,300,000. The option to purchase has a term of 36 months, requiring us to make semi-annual payments totaling $500,000. We made our first payment of $40,000 on December 12, 2011.
The claims are also a subject to a 1.5% royalty on the net proceeds that we receive from the processor to a maximum of $1,000,000 with no monthly minimum. The payments are due once exploitation begins. We have not yet exploited the claim.
veta negra and exon claims
On June 30, 2011, we entered into an agreement with Minera Farellon to acquire its options to purchase the Veta Negra and Exon mining claims and the Trixy exploration claims for $107,500. Under the terms of the option, we agreed to transfer our interest in several generative claims with the net book value of $4,504. The claims are subject to a 1.5% royalty on the net sales of minerals extracted to a total of $500,000. The royalty payments are due monthly once exploitation begins. At January 31, 2012, we paid $10,000 in option payments and capitalized an additional $8,480 as cost of transferred generative claims.
Location and means of access
The Veta Negra property is accessed from Vallenar by driving the Relincho, San Antonio, Los Morteros road east out of Vallenar along the Quebrada Jilgeuro Canyon to the 21km marker (before one reaches the village of San Antonio), there is black spray paint on rocks by the side of the road indicating the way to the Veta Negra and Exon mines at the UTM coordinates: East 338,097, North 6,839,203 at an altitude of 1,079 m above sea level. At this point turn north and drive for approximately 4 km until arriving at the Veta Negra artisanal mine.
The Veta Negra property is located approximately 25km from the Empresa Nacional de Mineria (ENAMI) crushing and processing facility.
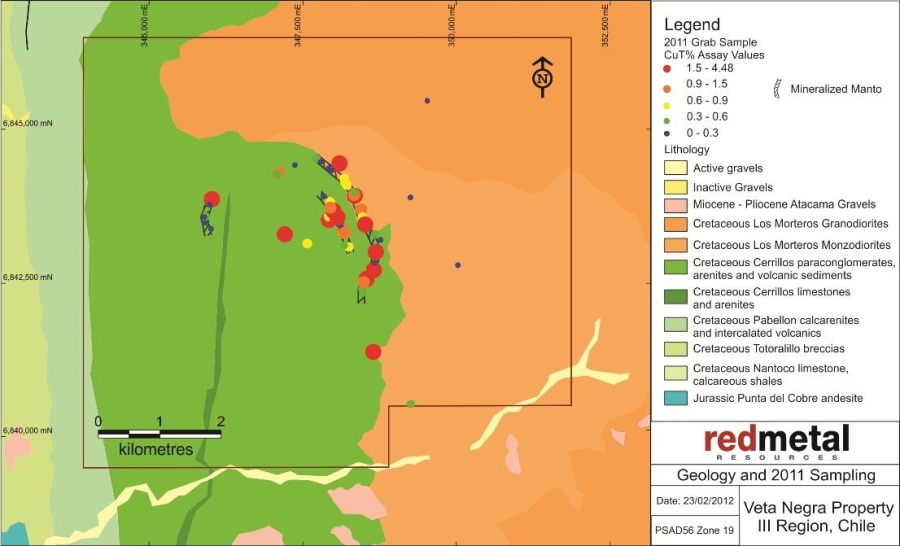
Description
The Veta Negra property is a copper-gold project that lies in the Candelaria IOCG belt in the Chilean Coastal Cordillera. The Mateo property has undergone limited modern exploration, in the form of near surface artisanal mining. Mineralization occurs in tabular mantos or veins which trend approximately North-South through the property. There are 3 recognized mantos of approximately 4-6m in thickness, the longest of which extends for 2km on surface. The depth to which these mantos extend is unknown at this time. Supergene copper and gold mineralization within these mantos is very conspicuous as chrysocolla, malachite, atacamite, chalcocite, and minor cuprite. Sampling and mapping has been undertaken throughout the property
Exploration history
The Veta Negra property has been artisanally mined on the two mining concessions on the property, the Veta Negra 1-8 and Exxon 1-4 concessions. Many small pits and excavations on the property that do not have records of tonnage or grade are evident all along the surface traces of the exposed mantos.
Geology
The mineralization on the Veta Negra property is hosted in the middle Cretaceous Cerrillos formation composed of brecciated, flow, tuff, microcrystalline andesite, arenites and conglomerates. Abundant copper oxide mineralization is found on surface in distinct veins or ‘mantos’ deposited at the upper contact of a black altered andesite and an overlying vesicular iron oxidized andesite (some vesicular volcanics in the area exhibit hornfel metamorphic facies).
Primary structures on the Veta Negra property are made up of regional scale Cretaceous extension faults which predominantly dip to the East at 30-50 degrees. These faults likely provided accommodation space and fluid pathways along contacts of the Cerrillos volcanic units. There is also evidence of anticline structures which are not fully understood and later dip slip fault offsets seen where the mantos exhibit minor offset along strike.
Younger upper Cretaceous – Eocene intermediate composition Granodiorites and Monzonites are found in the Eastern and Northern region of the Veta Negra claim in contact with the Cerrillos volcanics to the South and West. These later units may have provided the hydrothermal heat and fluid source to produce mineralization which could have been injected into the faulted Cerrillos volcanics.
Beyond the claim boundaries to the West lies the lower Cretaceous Pabellon and Totoralillo bioclastic carbonates, volcanic and conglomerate formations. Beyond these formations – a few kilometers still - lies the Jurassic - lower Cretaceous Punta Del Cobre or Bandurrias formation composed of Dacites, andesites and carbonates.
Exploration (2011)
During June and July 2011 we carried out a preliminary exploration program on theour former Veta Negra property. As a result of the program we discovered a defined and continuous copper mineralized manto continuing on from the main manto previously known to exist. At the conclusion of this program three mantos were traced on surface, one manto, the East Manto, was traced for 1.9km on surface before becoming buried by surface rock, a second manto, the West Manto, was traced for a one kilometer strike length and a third manto, the Far West Manto, was traced for a 500 metre strike length.
DuringAfter reviewing exploration results and considering the acquisition costs we decided to terminate the active development of this program, 65 reconnaissance samples were collected along the strike lengthproperty, writing off $81,233 in acquisition costs. However, we are still considering certain sections of these three mantos. Table 12 summarizes the significant assay results.
Table 12: Results from reconnaissance samples
| Sample ID | Easting | Northing | Au g/t | Cu % | Manto |
| 200903 | 348488 | 6842508 | 0.16 | 1.01 | East Manto |
| 200932 | 348335 | 6843938 | 0.08 | 1.03 | East Manto |
| 200925 | 348440 | 6843689 | 0.43 | 1.08 | East Manto |
| 200913 | 348690 | 6842997 | 0.33 | 1.62 | East Manto |
| 200928 | 348522 | 6843441 | 0.19 | 1.68 | East Manto |
| 200943 | 348093 | 6844433 | 0.17 | 1.9 | East Manto |
| 200931 | 348349 | 6843900 | 0.2 | 1.91 | East Manto |
| 200905 | 348653 | 6842700 | 0.93 | 2.69 | East Manto |
| 200904 | 348545 | 6842549 | 0.20 | 3.56 | East Manto |
| 200958 | 347107 | 6844288 | 0 | 1.19 | undefined |
| 200957 | 347206 | 6843278 | 0.15 | 2.13 | undefined |
| 200908 | 348644 | 6841365 | 0.33 | 4.48 | undefined |
| 200961 | 346021 | 6843847 | 0.07 | 1.87 | Far West Manto |
| 200939 | 347947 | 6843726 | 0.35 | 1.11 | West Manto |
| 200921 | 348146 | 6843366 | 0.59 | 1.25 | West Manto |
| 200924 | 348183 | 6843307 | 0.19 | 1.3 | West Manto |
| 200937 | 348068 | 6843553 | 0.92 | 1.75 | West Manto |
| 200911 | 347927 | 6843510 | 0.14 | 1.84 | West Manto |
| 200938 | 348004 | 6843660 | 0.09 | 2.09 | West Manto |
Below Figure 9 illustrates the Veta Negra geology and the 2011 reconnaissance sample percent copper assay ranges:
Figure 9: Veta Negra Geologyas part of our generative claims as described below.
Generative claims
As an exploration company, from time to time we will stake, purchase or option claims to allow ourselves the time and access to fully consider the geological potential of the claims. This allows us to generate new properties in areas that have not been explored. We have conducted groundwork on numerous generative claims of interest to us in the areas of our active properties. We have acquired several of these claims, have options to acquire others, and have staked claims in the same areas. We continue to compile data on and review other claims and discuss terms with various owners.
Abandoned claims
During the year ended January 31, 2013, we wrote off the former Veta Negra property, abandoned several claims within the Farellon property and wrote off certain generative claims, which resulted in a write off of acquisition costs of $83,159.
During the year ended January 31, 2012, we wrote off certain mineral claims with a paid cost of $15,471 and capitalized non-cash expenditures of $2,433 as we decided not to pursue exploration of the claims. We did not write off any acquisition costs during the year ended January 31, 2011.
Competition
The mineral exploration business is an extremely competitive industry. We are competing with many other exploration companies looking for minerals. We are one of the smallest exploration companies and a very small participant in the mineral exploration business. Being a junior mineral exploration company, we compete with other similar companies for financing and joint venture partners, and for resources such as professional geologists, camp staff, helicopters and mineral exploration contractors and supplies. We do not represent a competitive presence in the industry.
Raw materials
The raw materials for our exploration programs include camp equipment, hand exploration tools, sample bags, first aid supplies, groceries and propane. All of these types of materials are readily available from a variety of local suppliers.
Dependence on major customers
We have no customers. Our first customer likely will be ENAMI, which refines and smelts copper from the ore that it buys from Chile’s small- and medium-scale miners. ENAMI is located in Vallenar. We could also deliversell our ore to the Dos Amigos heap leach facility located approximately fifty kilometers south of Vallenar in Domeyko.
Patents/Trademarks/Licenses/Franchises/Concessions/Royalty agreements/Agreements/Labor Contracts
We have no intellectual property such as patents or trademarks, and, other than the royalties that we must pay if we begin to exploit our Chilean properties, no royalty agreements or labor contracts.
Government controls and regulations
We are not required to obtain permits or submit operational plans in order to conduct exploration on our properties. The mining business, however, is subject to various levels of government controls and regulations, which are supplemented and revised from time to time. We cannot predict what additional legislation or revisions might be proposed that could affect our business or when any proposals, if enacted, might become effective. Such changes, however, could require more operating capital and expenditures and could prevent or delay some of our operations.
The various levels of government controls and regulations address, among other things, the environmental impact of mining and mineral processing operations. For mining and processing, legislation and regulations in various jurisdictions establish performance standards, air and water quality emission standards and other design or operational requirements for various components of operations, including health and safety standards. Legislation and regulations also establish requirements for decommissioning, reclaiming and rehabilitating mining properties following the cessation of operations, and may require that some former mining properties be managed for long periods of time. As we are not mining or processing, and are unlikely to for some years, we have not investigated these regulations.
None of the exploration work that we have completed to date requires an environmental permit. We must repair any damage done to the land during exploration. Some of our claims are within the boundaries of a national park. According to the Mining Code of Chile, we will have to get written authorization from the government to mine or complete any exploration work within the park boundaries. We submitted an application to the government in December 2011 to explore within the park boundaries. We expectreceived a response to be givenour application requesting we complete an answerenvironmental study on the area we are applying to work in. As part of this study we will have to hire an environmental consultant to investigate if any significant archeological remains exist in the area we intend to work in. Mapping and prospecting work completed north of the park boundary on the Farellon property has shown potential to expand the mineralized zone to the north where exploitation would not fall within the park boundaries. The Company has decided to focus exploration north of the park boundary to determine the potential of the entire mineralized area to host an economic deposit before pursuing the application in April.to work within the park boundary any further.
If our operations in Chile become profitable, any earnings that we remit abroad will be subject to Chilean withholding tax.
We believe that we are in substantial compliance with all material government controls and regulations at each of our mineral claims.
Costs and effects of compliance with environmental laws
We have incurred no costs to date for compliance with environmental laws for our exploration programs on any of our claims.
Expenditures on research and development
We have incurred no research or development costs since our inception on January 10, 2005.
Number of total employees and number of full-time employees
Red Metal does not have any employees. Caitlin Jeffs, and Michael Thompson, both of whom are directors and officers, and John da Costa, who is an officer, allare directors and officers, provide their services to the company as independent consultants. Polymet retains the services of Kevin Mitchell, who is Polymet’s legal representative and manager in Chile, and two administrative employees, and one assistant geologist.employees. We contract for the services of geologists, prospectors and other consultants as we require them to conduct our exploration programs.
In addition to the factors discussed elsewhere in this annual report, the following risks and uncertainties could materially adversely affect our business, financial condition and results of operations. Additional risks and uncertainties not presently known to us or that we currently deem immaterial also may impair our business operations and financial condition.
During the fiscal years ended January 31, 20112013 and 2012 we earned no royaltysignificant revenue while our operating expenses totalled $2,928,188$1,108,226 and $672,618,$2,928,188, respectively. If we do not find sources of financing as and when we need them, we may be required to cease our operations.
Mineral exploration and development are very expensive. During the fiscal year that ended on January 31, 2013, we earned $7,804 in geological consulting revenue while our operating expenses totalled $1,108,226. During the fiscal year that ended on January 31, 2012, we earned no royalty revenue while our operating expenses totalled $2,928,188. During the fiscal year that ended on January 31, 2011 we earned no royalty revenue while our operating expenses totalled $672,618. This resulted in a total accumulated loss of $5,985,007$7,085,429 since inception. As of January 31, 20122013 we had cash of $24,467.$3,151. Since our inception, we have sold our securities and borrowed money to fund our operations. Our ability to continue our operations, including exploring and developing our properties, will depend on our ability to generate operating revenue, obtain additional financing, or enter into joint venture agreements. Until we earn enough revenue to support our operations, which may never happen, we will continue to be dependent on loans and sales of our equity or debt securities to continue our development and exploration activities. If we do not find sources of financing as and when we need them, we may be required to severely curtail, or even to cease, our operations.
Our auditors have expressed substantial doubt about our ability to continue as a going concern; as a result we could have difficulty finding additional financing.
Our financial statements have been prepared assuming that we will continue as a going concern. Except for approximately $16,000$23,500 of royalty and consulting income, that we received during the 2009 fiscal year from Minera Farellón, we have not generated any revenue since inception and have accumulated losses. As a result, our auditors have expressed substantial doubt about our ability to continue as a going concern. Our ability to continue our operations depends on our ability to complete equity or debt financings as we need capital or generate profitable operations. Such financings may not be available or may not be available on reasonable terms. Our financial statements do not include any adjustments that could result from the outcome of this uncertainty.
Unfavorable economic conditions may have had a material adverse effect on us since raising capital to continue our operations could beis more difficult.
The recent creditfinancial crisis which began in 2007 and related turmoil in the global financial systemcontinues today has had an adverse impact on our business and financial position, since we must rely on sales of our securities and a similar financial crisisloans to continue our operations. We have found that there is less capital available to us and less appetite for risk by investors. Furthermore, we have found that locating other mineral exploration companies with available funds who are willing to engage in risky ventures such as the future may also impact us. Depending uponexploration of our properties has become very difficult since the ultimate severity and duration of any economic downturn, the resulting effects on Red Metal could be materially adverse if it isdownturn. If we are unable to raise the workingadditional capital, requiredwe may not be able to carry out its business plan.develop our properties or continue our operations.
Our business was formed in January 2005 and our operations, to date, have earned only minimal revenues. Due to the high costs of acquiring and exploring claims, we may never be profitable. We expect to continue to incur operating losses during the next 12 months.
We were incorporated on January 10, 2005, and to date have been involved primarily in organizational activities, acquiring and exploring mineral claims and obtaining financing. We have earned minimal revenues and we are not profitable. Whether we will be successful as a mining company must be considered in light of the costs, difficulties, complications and delays associated with our proposed exploration programs. These potential problems include, but are not limited to, finding claims with mineral deposits that can be cost-effectively mined, the costs associated with acquiring the properties and the unavailability of human or equipment resources. We have a very short history and have had no more than minimal operations until April 25, 2008 when we acquired the mining claims known as Farellon Alto 1 – 8 in Chile. We cannot assure you that we will ever generate significant revenue from our operations or realize a profit. We expect to continue to incur operating losses during the next 12 months.
We owe approximately $1.64 million to related parties. It is our intention to issue shares of our common stock to pay a portion of this debt, which will result in substantial dilution to our existing shareholders. 26
As of January 31, 2013, we owed approximately $1.64 million to related parties for loans and for services rendered to us. We do not have the cash resources to pay this debt therefore we are planning to partially pay these individuals by issuing shares of our common stock to them. Because the market value of our common stock is very low, the number of shares that we issue will be significant and will result in substantial dilution to our current shareholders in the book value of their common stock.If we register the shares of common stock we issue to pay part of our related party debt, the price of our common stock could decline.
If we register the common stock we issue as a payment for part of our related party debt, the shares could be sold without restriction, which could have the effect of driving down the price of our common stock in the market.
Our joint development and operating arrangements may not be successful.
We have in the past, and may in the future, enter into joint venture arrangements in order to share the risks and costs of developing and operating properties. In a typical joint venture arrangement, the partners own a proportionate share of the assets, are entitled to indemnification from each other and are only responsible for any future liabilities in proportion to their interestinterests in the joint venture. If a party fails to perform its obligations under a joint venture agreement, we could incur liabilities and losses in excess of our pro-rata share of the joint venture. We make investments in exploration and development projects that may have to be written off in the event we do not proceed to a commercially viable mining operation.
Our joint venture agreements may not always be successful. For example, on March 14, 2011, our subsidiary, Minera Polymet, granted to Revonergy Inc. the right to earn a 50% joint venture interest in the Perth property. However, Revonergy decided not to exercise that right and the agreement has been terminated.
In some instances members of the board of directors or an officer may be liable for losses incurred by holders of our common stock. If a shareholder were to prevail in such an action in the U.S., it may be difficult for the shareholder to enforce the judgment against any of our directors or officers, who are not U.S. residents.
In certain instances, such as trading securities based on material non-public information, a director or officer may incur liability to shareholders for losses sustained by the shareholders as a result of the director’s or officer’s illegal or negligent activity. However, all of our directors and officers live and maintain a substantial portion of their assets outside the U.S. As a result it may be difficult or impossible to effect service of process within the U.S. upon these directors and officers or to enforce in the courts any judgment obtained here against them predicated upon any civil liability provisions of the U.S. federal securities laws.
Foreign courts may not entertain original actions predicated solely upon U.S. federal securities laws against these directors;directors or officers and judgments predicated upon any civil liability provisions of the U.S. federal securities laws may not be directly enforceable in foreign countries.
As a result of the foregoing, it may be difficult or impossible for a shareholder to recover from any of these directors or officers if, in fact, the shareholder is damaged as a result of the negligent or illegal activity of an officer or director.
Mineral exploration is highly speculative and risky; we might not find mineral deposits that can be extracted cost effectively on our claims.
Exploration for mineral deposits is a speculative venture involving substantial risk. Problems such as unusual and unexpected rock formations often result in unsuccessful exploration efforts. We cannot assure you that our claims contain mineral deposits that can be extracted cost effectively.
Mineral exploration is hazardous. We could incur liability or damages as we conduct our business due to the dangers inherent in mineral exploration.
The search for minerals is hazardous. We could become liable for hazards such as pollution, cave-ins and other hazards against which we cannot insure or against which we may elect not to insure. We have no insurance for these kinds of hazards, nor do we expect to get such insurance for the foreseeable future. If we were to suffer from such a hazard, the costs of rectifying it could exceed our asset value and require that we liquidate our assets.
We have no known mineral reserves and if we cannot find any, we may have to cease operations.
It is unknown whether our properties contain viable mineral reserves. If we do not find a viable mineral reserve, or if we cannot exploit the mineral reserve, either because we do not have the money to do it or because it will not be economically feasible to do it, we may have to cease operations and you may lose your investment. Mineral exploration is a highly speculative endeavor. It involves many risks and is often non-productive. Even if mineral reserves are discovered on our properties, our production capabilities will be subject to further risks and uncertainties including:
| (i) | Costs of bringing the property into production including exploration work, preparation of production feasibility studies, and construction of production facilities, all of which we have not budgeted for; |
| (ii) | Availability and costs of financing; |
| (iii) | Ongoing costs of production; and |
| (iv) | Environmental compliance regulations and restraints. |
In the future we may be required to comply with government regulations affecting mineral exploration and exploitation, which could adversely affect our business, the results of our operations and our financial condition.
The mining business is subject to various levels of government control and regulation, which are supplemented and revised from time to time. We cannot predict what legislation or revisions might be proposed that could affect our business or when any such proposals, if enacted, might become effective. Our exploration activities are subject to laws and regulations governing worker safety, and, if we explore within the national park that is part of our Farellon property, protection of endangered and other special status species as well as protection of significant archeological remains, if there are any, will likely require compliance with additional laws and regulations. The cost of complying with these regulations has not been burdensome to date, but if we mine our properties and process more than 5,000 tonnes of ore monthly, we will be required to submit an environmental impact study for review and approval by the federal environmental agency. We anticipate that the cost of such a study will be significant. If the study were to show too great an adverse impact on the environment, we might be unable to develop the property or we might have to engage in expensive remedial measures during or after developing the property, which could make production unprofitable. This requirement could materially adversely affect our business, the results of our operations and our financial condition if we were to proceed to mine a property or process ore on the property. We have no immediate or intermediate plans to process ore on any of our properties.
If we do not comply with applicable environmental and health and safety laws and regulations, we could be fined, enjoined from continuing our operations, and suffer other penalties. Although we make every attempt to comply with these laws and regulations, we cannot assure you that we have fully complied or will always fully comply with them.
We might not be able to market any minerals that we find on our mineral claims due to market factors that are beyond our control.
Even if we discover minerals that can be extracted cost-effectively, we may not be able to find a ready market for our minerals. Many factors beyond our control affect the marketability of minerals. These factors include market fluctuations, the proximity and capacity of natural resource markets and processing equipment, government regulations, including regulations relating to prices, taxes, royalties, land tenure, land use, importing and exporting minerals and environmental protection. We cannot accurately predict the effect of these factors, but any combination of these factors could result in an inadequate return on invested capital.
We are not certain that we can successfully compete in the mineral exploration business. We do not represent a significant presence in this industry.
The mineral exploration business is an extremely competitive industry. We are competing with many other exploration companies looking for minerals. We are one of the smallest exploration companies and we do not represent a significant presence in the mineral exploration business. Being a junior mineral exploration company, we compete with other similar companies for financing and joint venture partners, and for resources such as professional geologists, camp staff, helicopters and mineral exploration contractors and supplies. We may not have the means to compete successfully for these resources.
We conduct operations in a foreign jurisdiction, and are subject to certain risks that may limit or disrupt our business operations.
Our head office is in Canada and our mining operations are in Chile. Mining investments are subject to the risks normally associated with the conduct of any business in foreign countries including uncertain political and economic environments; wars, terrorism and civil disturbances; changes in laws or policies, including those relating to imports, exports, duties and currency; cancellation or renegotiation of contracts; royalty and tax increases or other claims by government entities, including retroactive claims; risk of expropriation and nationalization; delays in obtaining or the inability to obtain or maintain necessary governmental permits; currency fluctuations; restrictions on the ability of local operating companies to sell gold, copper or other minerals offshore for U.S. dollars, and on the ability of such companies to hold U.S. dollars or other foreign currencies in offshore bank accounts; import and export regulations, including restrictions on the export of gold, copper or other minerals; limitations on the repatriation of earnings; and increased financing costs.
These risks could limit or disrupt our exploration programs, cause us to lose our interests in our mineral claims, restrict the movement of funds, cause us to spend more than we expected, deprive us of contract rights or result in our operations being nationalized or expropriated without fair compensation, and could materially adversely affect our financial position or the results of our operations. If a dispute arises from our activities in Chile, we could be subject to the exclusive jurisdiction of courts outside North America, which could adversely affect the outcome of the dispute.
While we take the steps we believe are necessary to maintain legal ownership of our claims, title to mineral claims may be invalidated for a number of reasons, including errors in the transfer history or our acquisition of a claim we believed, after appropriate due diligence investigation, to be valid, but in fact, wasn’t. If ownership of our claims was ultimately determined to be invalid, our business and prospects would likely be materially and adversely affected.
Our ability to realize a return on our investment in mineral claims depends upon whether we maintain the legal ownership of the claims. Title to mineral claims involves risks inherent in the process of determining the validity of claims and the ambiguous transfer history characteristic of many mineral claims. We take a number of steps to protect the legal ownership of our claims, including having our contracts and deeds notarized, recording these documents with the registry of mines and publishing them in the mining bulletin. We also review the mining bulletin regularly to determine whether other parties have staked claims over our ground. However, none of these steps guarantees that another party could not challenge our right to a claim. Any such challenge could be costly to defend and, if we lost our claim, our business and prospects would likely be materially and adversely affected.
We cannot guarantee that any of our pedimento claims will convert to mensura claims.
Some of our exploration claims (pedimentos) are still in the registration process. We cannot guarantee that any of our pedimento claims will convert to mining claims (mensuras). Some of our pedimentos may have been staked over other owners’ claims, as permitted by the Chilean mining code. The pedimento with the earliest filing date takes precedence providing the claim holder maintains its claim in accordance with the mining code and the applicable regulations. Our pedimento rights in these claims will not crystallize unless the owners of the underlying claims fail to pay their taxes or otherwise forfeit their interests in their claims. We will exercise any right that we acquire through forfeiture only if the ground remains of interest to us.
We sometimes hold a significant portion of our cash in United States dollars, which could weaken our purchasing power in other currencies and limit our ability to conduct our exploration programs.
Currency fluctuations could affect the costs of our operations and affect our operating results and cash flows. Gold and copper are sold throughout the world based principally on the U.S. dollar price, but most of our operating expenses are incurred in local currencies, such as the Canadian dollar and the Chilean peso. The appreciation of other currencies against the U.S. dollar can increase the costs of our operations.
We sometimes hold a significant portion of our cash in U.S. dollars. Currency exchange rate fluctuations can result in conversion gains and losses and diminish the value of our U.S. dollars. If the U.S. dollar declined significantly against the Canadian dollar or the Chilean peso, our U.S.-dollar purchasing power in Canadian dollars and Chilean pesos would also significantly decline and we would not be able to affordthat could make it more difficult to conduct our mineral exploration programs.business operations. We have not entered into derivative instruments to offset the impact of foreign exchange fluctuations.
Because our directors are not independent they can make and control corporate decisions that may be disadvantageous to other common shareholders.
Our securities are not listed on a national securities exchange or quoted on an inter-dealer quotation system that requires that directors be independent. Using the definition of “independent” in Section 803Rule 5605 of theNasdaq’s Rules, of the NYSE Amex, we have determined that none of our directors are independent. Our directors have a significant influence in determining the outcome of all corporate transactions or other matters, including mergers, consolidations, and the sale of all or substantially all of our assets. They also have the power to prevent or cause a change in control. The interests of our directors may differ from the interests of the other stockholders and thus result in corporate decisions that are disadvantageous to other shareholders.
We do not expect to declare or pay dividends in the foreseeable future.
We have never paid cash dividends on our common stock and have no plans to do so in the foreseeable future. We intend to retain any earnings to develop, carry on, and expand our business.
“Penny “Penny stock” rules may make buying or selling our common stock difficult, and severely limit its marketability and liquidity.
TradingBecause our securities are considered a penny stock, shareholders will be more limited in their ability to sell their shares. The SEC has adopted rules that regulate broker-dealer practices in connection with transactions in penny stocks. Penny stocks are generally equity securities with a price of less than $5.00, other than securities registered on certain national securities exchanges or quoted on the Nasdaq system, provided that current price and volume information with respect to transactions in such securities is provided by the exchange or quotation system. Because our securities constitute “penny stocks” within the meaning of the rules, the rules apply to us and to our securities. The rules may further affect the ability of owners of shares to sell our securities in any market that might develop for them. As long as the trading price of our common stockshares is less than $5.00 per share, the common shares will be subject to regulations adoptedRule 15g-9 under the Exchange Act. The penny stock rules require a broker-dealer, prior to a transaction in a penny stock, to deliver a standardized risk disclosure document prepared by the SEC, commonly knownthat:
| · | contains a description of the nature and level of risk in the market for penny stocks in both public offerings and secondary trading; |
| · | contains a description of the broker’s or dealer’s duties to the customer and of the rights and remedies available to the customer with respect to a violation to such duties or other requirements of securities laws; |
| · | contains a brief, clear, narrative description of a dealer market, including bid and ask prices for penny stocks and the significance of the spread between the bid and ask price; |
| · | contains a toll-free telephone number for inquiries on disciplinary actions; |
| · | defines significant terms in the disclosure document or in the conduct of trading in penny stocks; and |
| · | contains such other information and is in such form, including language, type, size and format, as the SEC shall require by rule or regulation. |
The broker-dealer also must provide, prior to effecting any transaction in a penny stock, the “penny stock” rules. The additional burdens imposed upon broker-dealers bycustomer with: (a) bid and offer quotations for the penny stock; (b) the compensation of the broker-dealer and its salesperson in the transaction; (c) the number of shares to which such bid and ask prices apply, or other comparable information relating to the depth and liquidity of the market for such shares; and (d) a monthly account statement showing the market value of each penny stock held in the customer’s account. In addition, the penny stock rules could discourage broker-dealersrequire that prior to a transaction in a penny stock not otherwise exempt from participating in transactions involving shares of our common stock, which could severely limit its marketability and liquidity. Underthose rules; the broker-dealer must make a special written determination that the penny stock rules, broker-dealers participating in penny-stock transactions must first deliver to their customeris a suitable investment for the purchaser and receive the purchaser’s written acknowledgment of the receipt of a risk disclosure document describing the risks associated withstatement, a written agreement to transactions involving penny stocks, the broker-dealer’s duties in selling the stock, the customer’s rights and remedies,a signed and certain market and other information. The broker-dealer must determinedated copy of a written suitably statement. These disclosure requirements may have the customer’s suitability for penny- stock transactions based on the customer’s financial situation, investment experience and objectives. Broker-dealers must also disclose these restrictions in writing to the customer, obtain specific written consent from the customer, and provide monthly account statements to the customer. The effect of these restrictions can decrease broker-dealers’ willingness to make areducing the trading activity in the secondary market infor our shares of common stock, decrease the liquidity of our common stock, and increase transaction costs for sales and purchases of our common stock as compared to other securities.shares.
As a smaller reporting company we are not required to provide this information.
Our executive offices are located at 195 Park Avenue, Thunder Bay, Ontario, Canada, P7B 1B9. Our president, Caitlin Jeffs, provides this space free of charge although she is under no obligation to do so. We also have a field and administrative office in Vallenar, Chile, which we rent fromon a month to month basis at the rate of 550,000 Chilean pesos (approximately $1,000) per month. We believe that these properties are suitable and adequate for our business operations.
We have assembled interests in fourthree mineral properties in Chile—the Farellon, Perth, Mateo, and Veta Negra—Mateo,—which we have described above in Item 1.1 above.
We are not a party to any pending legal proceedings and, to the best of our knowledge, none of our propertyproperties or assets are the subject of any pending legal proceedings.
Not applicable.
Our common stock was quoted under the symbol RMES on the Pink Sheets from November 19, 2009 to November 21, 2010, and on the OTC Bulletin Board since September 21, 2010. From September 16, 2008 to November 19, 2009 our common stock was quoted on the OTC Bulletin Board under the symbol RMET. From January 16, 2007 to September 16, 2008, our symbol was RLKX. Table 1312 presents the range of high and low bid quotes of our common stock for each quarter for the last two fiscal years as reported by the Pink OTC Markets. The bid prices represent inter-dealer quotations, without adjustments for retail mark-ups, markdowns or commissions and may not necessarily represent actual transactions.
Table 13: High and low bids
| Table 12: High and low bids | | | | | | | |
| | | High | | | Low | | | High | | | Low | |
| Fiscal year ended January 31, 2013 | | | | | | | |
| First quarter | | | $ | 0.61 | | | $ | 0.38 | |
| Second quarter | | | $ | 0.38 | | | $ | 0.25 | |
| Third quarter | | | $ | 0.25 | | | $ | 0.11 | |
| Fourth quarter | | | $ | 0.17 | | | $ | 0.014 | |
| Fiscal year ended January 31, 2012 | | | | | | | | | | | | | | |
| First quarter | | $ | 0.45 | | | $ | 0.25 | | | $ | 0.45 | | | $ | 0.25 | |
| Second quarter | | $ | 0.45 | | | $ | 0.37 | | | $ | 0.45 | | | $ | 0.37 | |
| Third quarter | | $ | 0.58 | | | $ | 0.36 | | | $ | 0.58 | | | $ | 0.36 | |
| Fourth quarter | | $ | 0.52 | | | $ | 0.42 | | | $ | 0.52 | | | $ | 0.42 | |
| Fiscal year ended January 31, 2011 | | | | | | | | | |
| First quarter | | $ | 0.50 | | | $ | 0.20 | | |
| Second quarter | | $ | 0.50 | | | $ | 0.40 | | |
| Third quarter | | $ | 0.50 | | | $ | 0.20 | | |
| Fourth quarter | | $ | 0.40 | | | $ | 0.25 | | |
As of March 13, 2012April 17, 2013, we had approximately 7433 shareholders of record which includes the number of shareholdersaccording to a shareholder’s list provided to us by our transfer agent as well as the holders included on the securities position report provided to us by Depositary Trust & Clearing Corporation.agent. This number does not include an indeterminate number of shareholders whose shares are held by brokers in street name. Our transfer agent is Empire Stock Transfer, 1859 Whitney Mesa Dr. Henderson, Nevada, 89014 and their phone number is 702-818-5898.
Dividends
We have not paid any cash dividends on our common stock since our inception and do not anticipate paying any cash dividends in the foreseeable future. We plan to retain our earnings, if any, to provide funds for the expansion of our business.
Securities Authorized for Issuance under Equity Compensation Plans
Table 1413 provides information as of January 31, 2012,2013, regarding the compensation plan (2011(Amended and Restated Red Metal Resources Ltd. 2011 Equity Incentive Plan) under which equity securities of Red Metal are authorized for issuance.
Table 14.13. Equity compensation plans
| Plan category | Number of securities to be issued upon exercise of outstanding options, warrants and rights (a) | Weighted-average exercise price of outstanding options, warrants and rights (b) | Number of securities remaining available for future issuance under equity compensation plans (excluding securities reflected in column (a)) (c) | | Number of securities to be issued upon exercise of outstanding options, warrants and rights (a) | | | Weighted-average exercise price of outstanding options, warrants and rights (b) | | | Number of securities remaining available for future issuance under equity compensation plans (excluding securities reflected in column (a)) (c) | |
| Equity compensation plans not approved by security holders | 1,040,000 | $0.50 | 560,000 | |
Equity compensation plans approved by security holders | | | | 1,040,000 | | | $ | 0.50 | | | | 560,000 | |
Recent Issuances of Unregistered Securities
On January 19, 2010, two-year warrants were issued to investors to purchase 250,000 shares of Red Metal’s common stock at an exercise price of $0.30. DuringWe did not issue any unregistered securities during the last quarter of our fiscal year, these holders exercised their warrants resulting in the issuance of 200,000 shares of our common stock on November 28, 2011 and 50,000 shares of our common stock on January 26, 2012, and net proceeds of approximately $75,000.year.
We sold these securities to non-US persons in offshore transactions, relying on the registration exemption in Rule 903 of Regulation S promulgated under the Securities Act of 1933, as amended. We did not engage in any directed selling efforts in the United States, and each investor represented to us that the investor was not a U.S. person and was not acquiring the stock for the account or benefit of a U.S. person.
As a smaller reporting company we are not required to provide this information.
Overview
Red Metal is a mineral exploration company engaged in locating, and eventually developing, mineral resources in Chile. Our business strategy is to identify, acquire and explore prospective mineral claims with a view to either developing them ourselves or, more likely, finding a joint venture partner with the mining experience and financial means to undertake the development. All of our claims are in the Candelaria IOCG belt in the Chilean Coastal Cordillera.
We have no revenue-generatinggenerated only minimal revenue from operations and are dependent upon the equity markets for our working capital. Despite the current market volatility, prices of copper and gold overall are moving in a positive direction and we are optimistic that we can raise equity capital under these market conditions. We completed an offering of 6,723,333 units on April 7, 2011 at $0.30 per unit. Each unit consisted of one share of our common stock and one warrant for the purchase of one share of common stock exercisable at $0.50 per share for two years. We have since reduced the exercise price of the warrants to $0.10 per share and extended the term to April 7, 2014. We realized net cash proceeds of $1,862,462 from this offering and the payment of $130,000 in debt.
On September 2, 2011, we adopted the Red Metal Resources Ltd. 2011 Equity Incentive Plan and reserved 1,600,000 shares of our common stock for awards under the Plan. On the same day we issued options to purchase 1,040,000 shares of our common stock to directors, officers, employees and consultants who provide services to Red Metal. The options have an exercise price of $0.50 per share and a term of 2 years.
Consistent with our historical practices, we continue to monitor our costs in Chile by reviewing our mineral claims to determine whether they possess the geological indicators to economically justify the capital to maintain or explore them. Currently, we have fourthree employees in Chile and engage part time assistants during our exploration programs. Most of our support — such as vehicles, office and equipment — is supplied under short-term contracts. The only long-term commitments that we have are for royalty payments on fourtwo of our mineral claims – Farellon Che, Veta Negra and Pibe.Che. These royalties are payable once exploitation begins. Two of the above claims – Veta Negra and Pibe – have option payments payable during the next three years under the option to purchase contracts.
Please refer to the section ‘Unproved Mineral Properties’ under Item 1 of this report for a detailed description of our unproved mineral assets and associated exploration campaigns.
The cost and timing of all planned exploration programs are subject to the availability of qualified mining personnel, such as consulting geologists and geo-technicians, and drillers and drilling equipment. Although Chile has a well-trained and qualified mining workforce from which to draw and few early-stage companies such as Red Metal are competing for the available resources, if we are unable to find the personnel and equipment that we need when we need them and at the prices that we have estimated today, we might have to revise or postpone our plans.
Planned Issuance of Common Stock As of January 31, 2013 we owed approximately $1.64 million to related parties for loans and services that have been provided to us. We do not have the funds to pay this debt therefore we are planning to partially pay the debt with shares of our common stock. We anticipate that, because of the low price of our common stock, we will issue a substantial number of shares for this purpose, although no final terms have been agreed upon by the company and these individuals. The issuance of these shares will likely result in substantial dilution to the book value of our common stock held by our existing shareholders. Furthermore, if we were to register these shares, they could be sold without restriction, which could have the effect of driving down the price of our common stock in the market.
Results of operations
summary of financial condition
Table 1514 summarizes and compares our financial condition at January 31, 2012 to the year-ended January 31, 2011.2013 and 2012.
Table 15:14: Comparison of financial condition
| | | January 31, 2012 | | | January 31, 2011 | | | January 31, 2013 | | | January 31, 2012 | |
| Working capital deficit | | $ | (1,401,135 | ) | | $ | (866,179 | ) | | $ | (2,083,112 | ) | | $ | (1,401,135 | ) |
| Current assets | | $ | 69,623 | | | $ | 46,227 | | | $ | 4,142 | | | $ | 69,623 | |
| Unproved mineral properties | | $ | 796,828 | | | $ | 662,029 | | | $ | 852,611 | | | $ | 796,828 | |
| Total liabilities | | $ | 1,470,758 | | | $ | 912,406 | | | $ | 2,087,254 | | | $ | 1,470,758 | |
| Common stock and additional paid in capital | | $ | 5,483,934 | | | $ | 2,923,517 | | | $ | 5,976,058 | | | $ | 5,483,934 | |
| Deficit | | $ | (5,985,007 | ) | | $ | (3,056,819 | ) | | $ | (7,085,429 | ) | | $ | (5,985,007 | ) |
comparison of prior quarterly results
Table 1615 and Table 1716 present selected financial information for each of the past eight quarters.
Table 15: Summary of quarterly results (2013)
| | | April 30, 2012 | | | July 31, 2012 | | | October 31, 2012 | | | January 31, 2013 | |
| Revenue | | $ | 7,804 | | | $ | – | | | $ | – | | | $ | – | |
| Net loss | | $ | (397,663 | ) | | $ | (296,728 | ) | | $ | (250,578 | ) | | $ | (155, 453 | ) |
| Basic and diluted loss per share | | $ | (0.02 | ) | | $ | (0.02 | ) | | $ | (0.01 | ) | | $ | (0.01 | ) |
Table 16: Summary of quarterly results (2012)
| | | April 30, 2011 | | | July 31, 2011 | | | October 31, 2011 | | | January 31, 2012 | |
| Revenue | | | – | | | | – | | | | – | | | | – | |
| Net loss | | $ | (285,276 | ) | | $ | (782,841 | ) | | $ | (1,285,535 | ) | | $ | (574,536 | ) |
| Basic and diluted loss per share | | $ | (0.02 | ) | | $ | (0.05 | ) | | $ | (0.08 | ) | | $ | (0.03 | ) |
Table 17: Summary of quarterly results (2011)
| | | April 30, 2010 | | | July 31, 2010 | | | October 31, 2010 | | | January 31, 2011 | | | April 30, 2011 | | | July 31, 2011 | | | October 31, 2011 | | | January 31, 2012 | |
| Revenue | | | – | | | | – | | | | – | | | | – | | | $ | – | | | $ | – | | | $ | – | | | $ | – | |
| Net loss | | $ | (196,851 | ) | | $ | (118,279 | ) | | $ | (154,436 | ) | | $ | (203,052 | ) | | $ | (285,276 | ) | | $ | (782,841 | ) | | $ | (1,285,535 | ) | | $ | (574,536 | ) |
| Basic and diluted loss per share | | $ | (0.02 | ) | | $ | (0.01 | ) | | $ | (0.02 | ) | | $ | (0.02 | ) | | $ | (0.02 | ) | | $ | (0.05 | ) | | $ | (0.08 | ) | | $ | (0.03 | ) |
During the quarters ended July 31, 2011, October 31, 2011, and January 31, 2012, we experienced substantially higherour operating expenses were mainly due toassociated with the drilling program on the Farellon property and exploration campaigns on other properties, including associated travel and geological consulting expenses which we incurred between May and September 2011, and subsequent data analysis. During the quarter ended October 31, 2011, we granted 1,040,000 stock options to certain directors, employees, and consultants that resulted in a non-cash expense of $527,318 (after adjustment taken on January 31, 2012), increasing our net loss. During the quarter ended January 31, 2012, we beganexperienced higher legal costs as we explored the due diligence review to potentially listpossibility of listing our shares on the TSX Venture Exchange thatExchange. During the quarter ended April 30, 2012, we prepared an updated NI 43-101 report on our Farellon property, which resulted in higher legal costs.increased exploration expenses, and we continued with the due diligence review related to listing our common stock on the TSX Venture Exchange, which resulted in increased professional and regulatory fees. During the quarter ended July 31, 2012, we kept our exploration and due diligence activities at a moderate level, which resulted in a decrease in our net loss for the quarter. During the quarters ended October 31, 2012 and January 31, 2013, we continued maintaining our operations at a lower level; excluding the written down unproved mineral claims, our net loss for the quarter ended October 31, 2012 was $174,345; net loss for the quarter ended January 31, 2013 amounted to $155,453.
Selected Financial Results
years ended januaryJanuary 31, 20122013 and januaryJanuary 31, 20112012
Our operating resultsexpenses for the years ended January 31, 20122013 and 20112012 and the changes in our operating results between those periods are summarized in Table 18.
Table 18:17: Changes in operating results
| | | Year ended January 31, | | | Changes between the years ended January 31, | | | Year ended January 31, | | | Changes between the years ended January 31, | |
| | | 2012 | | | 2011 | | | 2012 and 2011 | | | 2013 | | | 2012 | | | 2013 and 2012 | |
| Operating Expenses: | | | | | | | | | | | | | | | | | | |
| Administration | | $ | 44,056 | | | $ | 87,382 | | | $ | (43,326 | ) | | $ | 40,355 | | | $ | 44,056 | | | | (3,701 | ) |
| Advertising and promotion | | | 202,125 | | | | 111,835 | | | | 90,290 | | | | 39,840 | | | | 202,125 | | | | (162,285 | ) |
| Amortization | | | | 4,489 | | | | 3,107 | | | | 1,382 | |
| Automobile | | | 30,769 | | | | 24,124 | | | | 6,645 | | | | 7,166 | | | | 27,662 | | | | (20,496 | ) |
| Bank charges | | | 6,374 | | | | 5,554 | | | | 820 | | | | 6,346 | | | | 6,374 | | | | (28 | ) |
| Consulting fees | | | 318,914 | | | | 173,738 | | | | 145,176 | | | | 232,068 | | | | 318,914 | | | | (86,846 | ) |
| Interest on current debt | | | 104,314 | | | | 37,466 | | | | 66,848 | | | | 165,387 | | | | 104,314 | | | | 61,073 | |
| IVA Expense | | | 33,780 | | | | – | | | | 33,780 | | | | 4,640 | | | | 33,780 | | | | (29,140 | ) |
| Mineral exploration costs | | | 1,156,868 | | | | 22,193 | | | | 1,134,675 | | | | 231,852 | | | | 1,156,868 | | | | (925,016 | ) |
| Office | | | 25,631 | | | | 8,084 | | | | 17,547 | | | | 21,189 | | | | 25,631 | | | | (4,442 | ) |
| Professional development | | | - | | | | 5,116 | | | | (5,116 | ) | |
| Professional fees | | | 225,858 | | | | 111,878 | | | | 113,980 | | | | 105,468 | | | | 225,858 | | | | (120,390 | ) |
| Rent | | | 13,582 | | | | 12,980 | | | | 602 | | | | 13,579 | | | | 13,582 | | | | (3 | ) |
| Regulatory | | | 28,433 | | | | 15,000 | | | | 13,433 | | | | 39,651 | | | | 28,433 | | | | 11,218 | |
| Travel and entertainment | | | 96,014 | | | | 50,455 | | | | 45,559 | | | | 32,223 | | | | 96,014 | | | | (63,791 | ) |
| Salaries, wages and benefits | | | 84,029 | | | | 6,487 | | | | 77,542 | | | | 81,148 | | | | 84,029 | | | | (2,881 | ) |
| Stock based compensation | | | 527,318 | | | | – | | | | 527,318 | | | | - | | | | 527,318 | | | | (527,318 | ) |
| Foreign exchange loss | | | 14,653 | | | | 326 | | | | 14,327 | | | | (334 | ) | | | 14,653 | | | | (14,987 | ) |
| Write-down of unproved mineral properties | | | 15,470 | | | | – | | | | 15,470 | | | | 83,159 | | | | 15,470 | | | | 67,689 | |
| Net loss | | $ | 2,928,188 | | | $ | 672,618 | | | $ | 2,255,570 | | |
| Net operating expenses | | | $ | 1,108,226 | | | $ | 2,928,188 | | | $ | (1,819,962 | ) |
Operating expenses. Our operating expenses increaseddecreased by $2,255,570,$1,819,962, or 335%62%, from $672,618 for the year ended January 31, 2011 to $2,928,188 for the year ended January 31, 2012.2012 to $1,108,226 for the year ended January 31, 2013.
The most significant year-to-date changes were:
We restructured our administrative operations, which resulted in savings of $43,326 forDuring the year ended January 31, 2012, compared to the year ended January 31, 2011
We completed awe carried out an active drilling program on our Farellon property and accomplished exploration campaigns on our Mateo and Veta Negra properties, which resulted in an increase of$1,134,675, or 5,112%,$1,156,868 in mineral exploration expenses for the year ended January 31, 2012.
expenses. During the year ended January 31, 20122013, we hired four assistant geotechnicians and additional office staff to keep up with the increased workload. Thismaintained our exploration activities at a lower level that resulted in an increasea decrease of $77,542,$925,016 or 1,195%,80% in salary and wage expense formineral exploration expenses.
Due to the reduction in our mineral exploration activities during the fiscal year ended January 31, 2012.
Our2013, we significantly decreased our advertising and travel budget which resulted in decreases of $162,285 or 80% and $63,791 or 66% in advertising and promotion, and travel and entertainment expenses, increased from $50,455 to $96,014, or 90%, for the year ended January 31, 2012. This increase was mainly associated with travel time incurred by consulting geologists during the drilling programs that were undertaken during the period. These travel expenditures were budgeted under the exploration campaign.
Due to higher accounting and financial advisory requirements we incurred $318,914 in consulting fees during the year ended January 31, 2012, an increase of $145,176, or 84% over the prior year.respectively.
During the year ended January 31, 2012, we completed a private equity financing and prepared and filed a registration statement on form S-1, which resulted in an increaseprofessional and legal fees of $225,858. During the year ended January 31, 2013, we did not incur similar expenses, which resulted in a decrease in our professional and legal fees of $113,980,$120,390, or 102%, for the period, and an increase in regulatory fees of $13,433, or 90%53%.
During the year ended January 31, 2012,2013, we expensed $33,780restructured our accounting and financial advisory operations which resulted in Chilean value added tax charged on most operationsa reduction of $86,846 or 27% in Chile.
To continue with our operational plans and to raise awareness of the drilling programs we increased our advertising and promotion costs during the year ended January 31, 2012 by $90,290, or 81%.consulting expenses.
During the year ended January 31, 2013, we wrote down $83,159 in mineral property acquisition costs after we determined the costs of maintaining our Veta Negra property exceeded its fair value. The property consisted of the Veta Negra, Exon and Pibe mining claims and several smaller exploration claims. During the year ended January 31, 2012, we expensed $104,314wrote down $15,470 after we abandoned several exploration claims included in interest on current debt, an increase of $66,848, or 178%. This increase was associated with larger outstanding payables, mainly to related parties.the Mateo property.
On September 2, 2011 we adopted the Red Metal Resources Ltd. 2011 Equity Incentive Plan and granted 1,040,000 options to our officers, directors, and consultants. We recorded $527,318 in employee stock option expense associated with these grants. We had no such expense during the year ended January 31, 2011.2013.
Net loss. We had a net loss of $1,100,422 for the year ended January 31, 2013, compared to a net loss of $2,928,188 for the year ended January 31, 2012, compared to a net loss of $672,618 for the year ended January 31, 2011.2012. The increasedecrease in net loss during the periods was due to the expensemainly associated with the conclusion of our drilling programand mapping programs on our Farellon property as well as the exploration programs on ourand Mateo and Veta Negra properties, which resulted in increaseda decrease in mineral exploration travel,and automobile costs, Chilean value added taxes,expenses. Reduced advertising activity, restructured consulting services, and increased salaries and wages;the absence of stock based compensation inalso contributed to the form of employee stock option grants that we issued in September 2011; and an increaseoverall decrease in our advertising and promotion activities in order to raise awareness of our exploration activities and seek additional external financing, which resulted in increased advertising costs as well as increased consulting, professional and regulatory fees.costs.
Liquidity
going concern
The consolidated financial statements included in this annual report have been prepared on a going concern basis, which implies that we will continue to realize our assets and discharge our liabilities in the normal course of business. We have not generated any significant revenues from mineral sales since inception, have never paid any dividends and are unlikely to pay dividends or generate significant earnings in the immediate or foreseeable future. Our continuation as a going concern depends upon the continued financial support of our shareholders, our ability to obtain necessary debt or equity financing to continue operations, and the attainment of profitable operations. Our ability to achieve and maintain profitability and positive cash flow depends upon our ability to locate profitable mineral claims, generate revenue from mineral production and control our production costs. Based upon our current plans, we expect to incur operating losses in future periods, which we plan to mitigate by controlling our operating costs and sharing mineral exploration expenses through joint venture agreements.agreements, if possible. At January 31, 2012,2013, we had a working capital deficit of $1,401,135$2,083,112 and accumulated losses of $5,985,007$7,085,429 since inception. These factors raise substantial doubt about our ability to continue as a going concern. We cannot assure you that we will be able to generate significant revenues in the future. Our consolidated financial statements do not give effect to any adjustments that would be necessary should we be unable to continue as a going concern and therefore be required to realize our assets and discharge our liabilities in other than the normal course of business and at amounts different from those reflected in our financial statements.
internal and external sources of liquidity
To date we have funded our operations by selling our securities and borrowing funds, and, to a minor extent, from mining royalties.
Sources and uses of cash
years ended januaryJanuary 31, 20122013 and 20112012
Table 1918 summarizes our sources and uses of cash for the years ended January 31, 20122013 and 2011.2012.
Table 19:18: Summary of sources and uses of cash
| | | January 31, | | | January 31, | |
| | | 2012 | | | 2011 | | | 2013 | | | 2012 | |
| Net cash provided by financing activities | | $ | 2,145,606 | | | $ | 244,890 | | | $ | 344,692 | | | $ | 2,145,606 | |
| Net cash used in operating activities | | | (1,944,032 | ) | | | (212,200 | ) | | | (204,769 | ) | | | (1,944,032 | ) |
| Net cash used in investing activities | | | (170,089 | ) | | | (18,548 | ) | | | (138,942 | ) | | | (170,089 | ) |
| Effect of foreign currency exchange | | | (15,673 | ) | | | (13,438 | ) | | | (22,385 | ) | | | (15,673 | ) |
| Net increase (decrease) in cash | | $ | 15,812 | | | $ | 704 | | | $ | (21,316 | ) | | $ | 15,812 | |
Net cash provided by financing activities.
During the year ended January 31, 2013, we issued 767,335 shares of our common stock to four subscribers for $270,301; borrowed $57,000 from a shareholder; borrowed $22,000 US and $52,000 Cdn (approximately $51,944 US) from our director; and repaid a $56,553 loan including accrued interest to a company owned by a significant shareholder.
During the year ended January 31, 2012, as part of the private offering completed on April 7, 2011, we issued 6,290,000 units at $0.30 per unit for cash proceeds of $1,828,100,$1,828,099, net of $58,900 in commissions paid to agents, and 433,333 units at $0.30 per unit in payment of $130,000 in debt. Each unit consistsconsisted of one share of our common stock and a two-year warrant exercisable for one share of our common stock at $0.50 per share. On April 5, 2013, we extended the term of these warrants for an additional year, to April 7, 2014, and lowered the exercise price to $0.10. We received $24,999$25,000 on exercise of a warrant for 83,333 shares at $0.30 per share. See Non-cash financing transactions below.
During the year ended January 31, 2012 we borrowed $101,000 from significant shareholders; $62,389 Cdn (approximately $62,220 US) from a company controlled by two directors; $55,000 Cdn (approximately $54,715) from a director; and $78,500 US and $10,000 Cdn (approximately $10,454 US) from our CFO. We also repaid $14,382 in loans including accrued interest and recognized foreign exchange adjustment on $50,000 Cdn that we borrowed during the year ended January 31, 2011 from our CEO. See Non-cash financing transactions below.
During the year ended January 31, 2011, we issued 540,000 shares of our common stock to three subscribers for $135,000, borrowed $50,000 from a company owned by a significant shareholder; and borrowed $10,000 US and $50,000 Cdn (approximately $49,890 US) from our director.
Non-cash financing transactions. During the year ended January 31, 2012, as part of the private offering completed on April 7, 2011, the Company’s CEO converted loans in the amount of $50,000 into 166,666 units and the Company’s CFO converted loans in the amount of $80,000 into 266,667 units. In addition, a significant shareholder elected to convert $50,000 loan to exercise of a warrant for the purchase of 166,667 shares of common stock at an exercise price of $0.30 per share.share through the cancellation of a loan in the amount of $50,000.
During the year ended January 31, 2011,2013, we did not have any non-cash financing transactions.
Net cash used in operating activities.
During the year ended January 31, 2013, we used net cash of $204,769 in operating activities. We used $1,100,422 to cover operating costs. This use of cash was offset by a decrease of $44,165 in prepaids; net increases in accounts payable of $95,343 and accrued liabilities of $20,425; accounts payable to related parties of $595,243 for administration, consulting, advertising and promotion, mineral exploration, and travel expenses; and accrued interest on our notes payable to related parties of $22,829.
During the year ended January 31, 2012, we used net cash of $1,944,032 in operating activities. We used $2,928,188 to cover operating costs and increased prepaids and other receivables by $7,584. As part of our operating costs we recorded a non-cash employee stock based compensation expense of $527,318. These uses of cash were offset by increases in trade accounts payable and accrued liabilities by $10,018 and $31,380, respectively; accounts payable to related parties of $395,451 and accrued interest on our notes payable to related parties of $8,996.
Net cash used in investing activities.
During the year ended January 31, 2011,2013, we used net cashspent $138,942 on acquisition of $212,200 in operating activities. We used $672,618mineral claims, options to cover operating costs, increased prepaidsacquire mineral claims, and other receivables by $20,397, and decreased our accrued liabilities by $495. These uses of cash were offset by net increases in accounts payable of $67,123,on property taxes associated with of legal fees incurred in preparing and filing our form 10 and the amendments to it; accounts payable to related parties of $410,429 for administration, consulting, advertising and promotion, mineral exploration, and travel expenses; and accrued interest on our notes payable to related parties of $3,758.
Net cash used in investing activities.claims.
During the year ended January 31, 2012, we spent $150,269 on acquisition of mineral claims, options to acquire mineral claims, and on property taxes associated with our mineral claims.
During We also spent $19,820 on the year ended January 31, 2011, we spent $18,548 on acquisitionpurchase of mineral claims and on property taxes associated with our mineral claims.equipment.
Since inception through January 31, 2012,2013, we have invested $1,177,038$1,315,980 in acquiring our mineral claims and $19,820 for acquisition of other capital assets.
Capital resources
Our ability to acquire and explore our Chilean claims is subject to our ability to obtain the necessary funding. We expect to raise funds through loans from private or affiliated persons and sales of our debt or equity securities. We have no committed sources of capital. If we are unable to raise funds as and when we need them, we may be required to curtail, or even to cease, our operations.
On April 7, 2011, we completed a private equity financing pursuant to which we received net cash proceeds after commissions, legal and closing fees of $1,862,462 and we paid $130,000 in debt. We paid the placement agent a cash commission of $58,900 and issued a warrant to purchase 196,333 shares of our common stock. The securities offered were not registered under the Securities Act of 1933 and may not be offered or sold in the United States absent registration or an applicable exemption from the registration requirements. On May 13, 2011, we filed a registration statement on form S-1 to register 4,623,333 shares of our common stock, and 4,819,666 shares of our common stock underlying warrants which were a part of the above private equity financing.
Contingencies and commitments
We had no contingencies at January 31, 2012.2013.
WeAs of the date of the filing of this report we have the following long-term contractual obligations and commitments:
Our commitments under the Farellon, Che, Veta Negra and Pibe contracts are the only contractual obligations that we have. Table 20 summarizes contractual obligations and commitments as of January 31, 2012 for the next five fiscal years.
Table 20: Contractual Obligations
| | | | | | Payments due by period | |
| | | Less than 1 year | | | 1 – 3 years | | | 3 – 5 years | | | More than 5 years * | | | Total | |
| Option payments | | $ | 147,500 | | | $ | 410,000 | | | $ | - | | | $ | - | | | $ | 557,500 | |
| Royalty payments | | | | | | | | | | | - | | | | 2,220,000 | | | | 2,220,000 | |
| Total | | $ | 147,500 | | | $ | 410,000 | | | $ | - | | | $ | 2,200,000 | | | $ | 2,777,500 | |
*The royalty payments are due once exploitation begins. | · | Farellon royalty. We are committed to paying the vendor a royalty equal to 1.5% on the net sales of minerals extracted from the Farellon claims up to a total of $600,000. The royalty payments are due monthly once exploitation begins and are subject to minimum payments of $1,000 per month. We have no obligation to pay the royalty if we do not commence exploitation. |
Farellon royalty. We are committed to paying the vendor a royalty equal to 1.5% on the net sales of minerals extracted from the Farellon claims up to a total of $600,000. The royalty payments are due monthly once exploitation begins and are subject to minimum payments of $1,000 per month. We have no obligation to pay the royalty if we do not commence exploitation. As of the date of this report we have not commenced exploitation.
| · | Che royalty. We are committed to paying a royalty equal to 1% of the net sales of minerals extracted from the claims to a maximum of $100,000 to the former owner. The royalty payments are due monthly once exploitation begins, and are not subject to minimum payments. |
Che royalty. We are committed to paying a royalty equal to 1% of the net sales of minerals extracted from the claims to a maximum of $100,000 to the former owner. The royalty payments are due monthly once exploitation begins, and are not subject to minimum payments.
Veta Negra option. On June 30, 2011, Minera Farellon agreed to sell us its option to purchase the Veta Negra and Exon claims for the total cash payment of $107,500 ($17,500 payable to Minera Farellon to exercise the option, and $90,000 payable to the vendors). As of the date of this report, we must pay $97,500 payable in two installments over 14 months to exercise the option. If we complete acquisition of the property we are committed to paying the vendor a royalty equal to 1.5% of the net sales of minerals extracted from the claims to a total maximum of $500,000. The royalty can also be bought for $500,000 at any time. The royalty payments are due monthly once exploitation begins, and are not subject to minimum payments.
Pibe option. On November 25, 2011 we entered into an option agreement to purchase the Pibe 1 - 20 mining claims for the total cash payment of $500,000. Under the option agreement we paid $40,000 on December 12, 2011 and must pay $460,000 in six installments over 36 months to exercise the option. If we complete acquisition of the property we are committed to paying the vendor a royalty equal to 1.5% of the net sales of minerals extracted from the claims to a total maximum of $1,000,000. The payments are due once exploitation begins. We have not yet exploited the claim.
| · | Mineral property taxes payable of approximately $48,000 per annum. |
Equity financing
To generate working capital, between January 31, 2010February 1, 2011 and February 29, 2012April 14, 2013 we issued 7,513,3337,740,668 shares of our common stock and warrants for the purchase of 7,459,6667,187,001 shares to raise $2,072,462$2,303,401 under Regulations S and D promulgated under the Securities Act of 1933.
Based on our operating plan, we anticipate incurring operating losses in the foreseeable future and will require additional equity capital to support our operations and develop our business plan. If we succeed in completing future equity financing, the issuance of additional shares will result in dilution to our existing shareholders.
Debt financing
OnBetween February 22, 2010,1, 2011 and January 31, 2013, we borrowed US $50,000a total of $307,889 from related parties. Of this amount, $63,930 has been repaid. Information about these transactions is included in the section of this report titled “Certain Relationships and issued a demand promissory note payable to the lender for the principal sum together with interest at 6% per annum. See Related-party transactions below.Related Transactions, and Director Independence”.
On March 2, 2011, we borrowed US $11,000 and issued a demand promissory note payable to the lender for the principal sum together with interest at 8% per annum. See Related-party transactions below.
On August 25, 2011, we borrowed US $30,000 and issued a demand promissory note payable to the lender for the principal sum together with interest at 8% per annum. See Related-party transactions below.
On September 19, 2011, we borrowed Cdn $62,389 (equivalent to US $62,220) and issued a demand promissory note payable to the lender for the principal sum together with interest at 8% per annum. See Related-party transactions below.
On October 25, 2011, we borrowed US $10,000 and issued a demand promissory note payable to the lender for the principal sum together with interest at 8% per annum. See Related-party transactions below.
On December 9, 2011, we borrowed Cdn $25,000 (equivalent to US $24,871) and issued a demand promissory note payable to the lender for the principal sum together with interest at 8% per annum. See Related-party transactions below.
On January 12, 2012, we borrowed Cdn $30,000 (equivalent to US $29,845) and issued a demand promissory note payable to the lender for the principal sum together with interest at 8% per annum. See Related-party transactions below.
On January 30, 2012, we borrowed US $8,500 and issued a demand promissory note payable to the lender for the principal sum together with interest at 8% per annum. See Related-party transactions below.
Challenges and risks
We do not anticipate generating any revenue over the next twelve months. We plan to fund our operations through any combination of equity or debt financing from the sale of our securities, private loans, joint ventures or through the sale of part interest in our mineral properties. Although we have succeeded in raising funds as we have needed them, we cannot assure you that this will continue in the future. Many things, such as the continued general downturn, worldwide, of the economy or a significant decrease in the price of minerals, could affect the willingness of potential investors to invest in risky ventures such as ours. In addition to theour planned Perth joint venture earn-in agreement, we may consider entering into a joint venture partnership with a more seniorother resource companycompanies to complete a mineral exploration program on other properties in Chile. If we enter into a joint venture arrangement, we would likely have to assign a percentage of our interest in our mineral claims to our joint venture partner in exchange for the funding.
As at January 31, 2013, we owed approximately $1.64 million to related parties for loans and services that have been provided to us. We do not have the funds to pay this debt therefore we are planning to partially pay this debt with shares of our common stock. We anticipate that, because of the low price of our common stock, we will issue a substantial number of shares for this purpose, although no final terms have been agreed upon by the company and these individuals. The issuance of these shares will likely result in substantial dilution to the book value of our common stock held by our existing shareholders. Furthermore, if we were to register these shares, they could be sold without restriction, which could have the effect of driving down the price of our common stock in the market.
Investments in and expenditures on mineral interests
Realization of our investments in mineral properties depends upon our maintaining legal ownership, producing from the properties or gainfully disposing of them.
Title to mineral claims involves risks inherent in the difficulties of determining the validity of claims as well as the potential for problems arising from the ambiguous conveyancing history characteristic of many mineral claims. Our contracts and deeds have been notarized, recorded in the registry of mines and published in the mining bulletin. We review the mining bulletin regularly to discover whether other parties have staked claims over our ground. We have discovered no such claims. To the best of our knowledge, we have taken the steps necessary to ensure that we have good title to our mineral claims.
Foreign exchange
We are subject to foreign exchange risk for transactions denominated in foreign currencies. Foreign currency risk arises from the fluctuation of foreign exchange rates and the degree of volatility of these rates relative to the United States dollar. We do not believe that we have any material risk due to foreign currency exchange.
Trends, events or uncertainties that may impact results of operations or liquidity
The economicfinancial crisis which began in the United States2007 and the resulting economic uncertainty and market instability may make it harder for us to raise capital as and when we need it and have made it difficult for us to assess thecontinues today has had an adverse impact of the crisis on our operations or liquiditybusiness and financial position, since we must rely on sales of our securities and loans to determine ifcontinue our operations. We have found that there is less capital available to us and less appetite for risk by investors. Furthermore, we have found that locating other mineral exploration companies with available funds who are willing to engage in risky ventures such as the prices we will receive onexploration of our properties has become very difficult since the sale of minerals will exceed the cost of mineral exploitation.economic downturn. If we are unable to raise cash,additional capital, we may not be requiredable to ceasedevelop our properties or continue our operations. Other than as discussed in this report, we know of no other trends, events or uncertainties that have or are reasonably likely to have a material impact on our short-term or long-term liquidity.
Off-balance sheet arrangements
We have no off-balance sheet arrangements and no non-consolidated, special-purpose entities.
Related-party transactions
Related-party transactions are disclosed in Item 13 on page 4544 of this annual report.
Critical Accounting Estimates
The preparation of financial statements in conformity with U.S. Generally Accepted Accounting Principles requires management to make estimates and assumptions that affect certain of the reported amounts of assets and liabilities, disclosure of contingent assets and liabilities at the date of the financial statements and the reported amounts of revenues and expenses during the year. The Companycompany regularly evaluates estimates and assumptions. The Companycompany bases its estimates and assumptions on current facts, historical experience and various other factors it believes to be reasonable under the circumstances, the results of which form the basis for making judgments about the carrying values of assets and liabilities and the accrual of costs and expenses that are not readily apparent from other sources. The actual results experienced by the Companycompany may differ materially and adversely from the Company’scompany’s estimates. To the extent there are material differences between the estimates and the actual results, future results of operations will be affected. The most significant estimates with regard to these financial statements relate to carrying values of unproven mineral properties, determination of fair values of stock-based transactions, and deferred income tax rates.
Reclassifications
Certain comparative amounts in the accompanying consolidated financial statements have been reclassified to conform to the current year’s presentation. These reclassifications had no effect on the consolidated results of operations or financial position for any year presented.
Financial instruments
Our financial instruments include cash, accounts receivable, accounts payable, accrued liabilities, accrued professional fees and accrued mineral property costs. The fair value of these financial instruments approximates their carrying values due to their short maturities.
Recently Adopted Accounting Guidance
The Companycompany has reviewed recently issued accounting pronouncements and plans to adopt those that are applicable to it. We do not expect the adoption of these pronouncements to have a material impact on our financial position, results of operations or cash flows.
ITEM 7A: QUANTITATIVE AND QUALITATIVE DISCLOSURES ABOUT MARKET RISK
As a smaller reporting company we are not required to provide this information.
| Index to Financial Statements | |
| | | |
| | | Page No. | |
| Financial Statements | | | |
| Report of Independent Registered Public Accounting Firm | | | F-1 | |
Consolidated Balance Sheets as of January 31, 20122013 and January 31, 20112012 | | | F-2 | |
Consolidated Statements of Operations for the years ended January 31, 20122013 and 2011,2012, and the period from inception (January 10, 2005) | | | F-3 | |
Consolidated Statement of Stockholders’ DeficitEquity (Deficit) for the period from January 10, 2005 (inception) to January 31, 20122013 | | | F-4 | |
Consolidated Statements of Cash Flows for the years ended January 31, 20122013 and 2011,2012, and the period from inception (January 10, 2005) | | | F-5 | |
| Notes to Consolidated Financial Statements | | | F-6 | |
REPORT OF INDEPENDENT REGISTERED PUBLIC ACCOUNTING FIRM
To the Stockholders and Board of Directors of Red Metal Resources, Ltd:Ltd.:
We have audited the accompanying consolidated balance sheets of Red Metal Resources Ltd. (the “Company”) (an exploration stage company) as at January 31, 20122013 and January 31, 20112012 and the related consolidated statements of operations, stockholders’ deficit and cash flows for the years then ended and the cumulative period from January 10, 2005 (inception) to January 31, 2012.2013. These consolidated financial statements are the responsibility of the Company's management. Our responsibility is to express an opinion on these consolidated financial statements based on our audits.
We conducted our audits in accordance with the standards of the Public Company Accounting Oversight Board (United States). Those standards require that we plan and perform an audit to obtain reasonable assurance whether the consolidated financial statements are free of material misstatement. The Company is not required to have, nor were we engaged to perform, an audit of its internal control over financial reporting. Our audits included consideration of internal control over financial reporting as a basis for designing audit procedures that are appropriate in the circumstances, but not for the purpose of expressing an opinion on the effectiveness of the Company’s internal control over financial reporting. Accordingly, we express no such opinion. An audit also includes examining, on a test basis, evidence supporting the amounts and disclosures in the consolidated financial statements. An audit also includes assessing the accounting principles used and significant estimates made by management, as well as evaluating the overall consolidated financial statement presentation. We believe that our audits provide a reasonable basis for our opinion.
In our opinion, based on our audits and the report of other auditors, these consolidated financial statements present fairly, in all material respects, the financial position of the Company as at January 31, 20122013 and January 31, 20112012 and the results of its operations and its cash flows for the years then ended and for the period from January 10, 2005 (inception) to January 31, 2012,2013, in conformity with accounting principles generally accepted in the United States of America.
The accompanying consolidated financial statements have been prepared assuming that the Company will continue as a going concern. As discussed in Note 1 to the consolidated financial statements, the Company has not generated significant revenues since inception, has incurred losses in developing its business, and further losses are anticipated. The Company requires additional funds to meet its obligations and the costs of its operations. These factors raise substantial doubt about the Company’s ability to continue as a going concern. Management’s plans in this regard are described in Note 1. The consolidated financial statements do not include any adjustments that might result from the outcome of this uncertainty.
/s/DMCL
DALE MATHESON CARR-HILTON LABONTE LLP
CHARTERED ACCOUNTANTS
Vancouver, Canada
March 19, 2012April 17, 2013

(AN EXPLORATION STAGE COMPANY)
CONSOLIDATED BALANCE SHEETS
| | | January 31, 2012 | | | January 31, 2011 | |
| | | | | | | |
| ASSETS |
| Current assets | | | | | | |
| | | | | | | |
| Cash | | $ | 24,467 | | | $ | 8,655 | |
| Prepaids and other receivables | | | 45,156 | | | | 37,572 | |
| Total current assets | | | 69,623 | | | | 46,227 | |
| | | | | | | | | |
| Equipment | | | 16,713 | | | | - | |
| Unproved mineral properties | | | 796,828 | | | | 662,029 | |
| Total assets | | $ | 883,164 | | | $ | 708,256 | |
| | | | | | | | | |
| LIABILITIES AND STOCKHOLDERS' DEFICIT |
| Current liabilities | | | | | | | | |
| | | | | | | | | |
| Accounts payable | | $ | 206,675 | | | $ | 196,657 | |
| Accrued liabilities | | | 121,701 | | | | 91,990 | |
| Due to related parties | | | 905,562 | | | | 510,111 | |
| Notes payable to related party | | | 236,820 | | | | 113,648 | |
| Total liabilities | | | 1,470,758 | | | | 912,406 | |
| | | | | | | | | |
| Stockholders' deficit | | | | | | | | |
| | | | | | | | | |
Common stock, $0.001 par value, authorized 500,000,000, 17,189,634 and 10,216,301 issued and outstanding at January 31, 2012 and January 31, 2011 | | | 17,190 | | | | 10,217 | |
| Additional paid in capital | | | 5,466,744 | | | | 2,913,300 | |
| Deficit accumulated during the exploration stage | | | (5,985,007 | ) | | | (3,056,819 | ) |
| Accumulated other comprehensive loss | | | (86,521 | ) | | | (70,848 | ) |
| Total stockholders' deficit | | | (587,594 | ) | | | (204,150 | ) |
| Total liabilities and stockholders' deficit | | $ | 883,164 | | | $ | 708,256 | �� |
| | | January 31, 2013 | | | January 31, 2012 | |
| | | | | | | |
| ASSETS | |
| Current assets | | | | | | |
| | | | | | | |
| Cash | | $ | 3,151 | | | $ | 24,467 | |
| Prepaids and other receivables | | | 991 | | | | 45,156 | |
| Total current assets | | | 4,142 | | | | 69,623 | |
| | | | | | | | | |
| Equipment, net | | | 12,224 | | | | 16,713 | |
| Unproved mineral properties | | | 852,611 | | | | 796,828 | |
| Total assets | | $ | 868,977 | | | $ | 883,164 | |
| | | | | | | | | |
| LIABILITIES AND STOCKHOLDERS' DEFICIT | |
| Current liabilities | | | | | | | | |
| | | | | | | | | |
| Accounts payable | | $ | 302,018 | | | $ | 206,675 | |
| Accrued liabilities | | | 142,126 | | | | 121,701 | |
| Due to related parties | | | 1,308,982 | | | | 905,562 | |
| Notes payable to related party | | | 334,128 | | | | 236,820 | |
| Total liabilities | | | 2,087,254 | | | | 1,470,758 | |
| | | | | | | | | |
| Stockholders' deficit | | | | | | | | |
| | | | | | | | | |
Common stock, $0.001 par value, authorized 500,000,000, 17,956,969 and 17,189,634 issued and outstanding at January 31, 2013 and 2012 | | | 17,957 | | | | 17,190 | |
| Additional paid in capital | | | 5,958,101 | | | | 5,466,744 | |
| Deficit accumulated during the exploration stage | | | (7,085,429 | ) | | | (5,985,007 | ) |
| Accumulated other comprehensive loss | | | (108,906 | ) | | | (86,521 | ) |
| Total stockholders' deficit | | | (1,218,277 | ) | | | (587,594 | ) |
| Total liabilities and stockholders' deficit | | $ | 868,977 | | | $ | 883,164 | |
The accompanying notes are an integral part of these consolidated financial statements
(AN EXPLORATION STAGE COMPANY)
CONSOLIDATED STATEMENTS OF OPERATIONS
| | | Year ended | | | From January 10, | |
| | | January 31 | | | 2005 (Inception) | |
| | | 2012 | | | 2011 | | | to January 31, 2012 | |
| Revenue | | | | | | | | | |
| | | | | | | | | | |
| Royalties | | $ | - | | | $ | - | | | $ | 15,658 | |
| | | | | | | | | | | | | |
| Operating expenses | | | | | | | | | | | | |
| | | | | | | | | | | | | |
| Administration | | | 44,056 | | | | 87,382 | | | | 319,196 | |
| Advertising and promotion | | | 202,125 | | | | 111,835 | | | | 527,235 | |
| Automobile | | | 30,769 | | | | 24,124 | | | | 96,488 | |
| Bank charges | | | 6,374 | | | | 5,554 | | | | 22,986 | |
| Consulting fees | | | 318,914 | | | | 173,738 | | | | 785,262 | |
| Interest on current debt | | | 104,314 | | | | 37,466 | | | | 213,108 | |
| IVA expense | | | 33,780 | | | | - | | | | 33,780 | |
| Mineral exploration costs | | | 1,156,868 | | | | 22,193 | | | | 1,905,250 | |
| Office | | | 25,631 | | | | 8,084 | | | | 52,937 | |
| Professional development | | | - | | | | 5,116 | | | | 5,116 | |
| Professional fees | | | 225,858 | | | | 111,878 | | | | 694,137 | |
| Rent | | | 13,582 | | | | 12,980 | | | | 55,275 | |
| Regulatory | | | 28,433 | | | | 15,000 | | | | 77,079 | |
| Travel and entertainment | | | 96,014 | | | | 50,455 | | | | 292,680 | |
| Salaries, wages and benefits | | | 84,029 | | | | 6,487 | | | | 136,711 | |
| Stock based compensation | | | 527,318 | | | | - | | | | 527,318 | |
| Foreign exchange loss | | | 14,653 | | | | 326 | | | | 14,951 | |
| Write-down of unproved mineral properties | | | 15,470 | | | | - | | | | 241,156 | |
| Total operating expenses | | | 2,928,188 | | | | 672,618 | | | | 6,000,665 | |
| | | | | | | | | | | | | |
| Net loss | | $ | (2,928,188 | ) | | $ | (672,618 | ) | | $ | (5,985,007 | ) |
| | | | | | | | | | | | | |
| | | | | | | | | | | | | |
| Net loss per share - basic and diluted | | $ | (0.19 | ) | | $ | (0.07 | ) | | | | |
| | | | | | | | | | | | | |
Weighted average number of shares outstanding - basic and diluted | | | 15,759,661 | | | | 10,099,524 | | | | | |
| | | | | | From January 10, 2005 (Inception) | |
| | | 2013 | | | 2012 | | | to January 31, 2013 | |
| Revenue | | | | | | | | | |
| | | | | | | | | | |
| Royalties | | $ | - | | | $ | - | | | $ | 15,658 | |
| Geological services | | | 7,804 | | | | - | | | | 7,804 | |
| | | | 7,804 | | | | - | | | | 23,462 | |
| Operating expenses | | | | | | | | | | | | |
| Administration | | | 40,355 | | | | 44,056 | | | | 359,551 | |
| Advertising and promotion | | | 39,840 | | | | 202,125 | | | | 567,075 | |
| Amortization | | | 4,489 | | | | 3,107 | | | | 7,596 | |
| Automobile | | | 7,166 | | | | 27,662 | | | | 100,547 | |
| Bank charges | | | 6,346 | | | | 6,374 | | | | 29,332 | |
| Consulting fees | | | 232,068 | | | | 318,914 | | | | 1,017,330 | |
| Interest on current debt | | | 165,387 | | | | 104,314 | | | | 378,495 | |
| IVA expense | | | 4,640 | | | | 33,780 | | | | 38,420 | |
| Mineral exploration costs | | | 231,852 | | | | 1,156,868 | | | | 2,137,106 | |
| Office | | | 21,189 | | | | 25,631 | | | | 74,126 | |
| Professional development | | | - | | | | - | | | | 5,116 | |
| Professional fees | | | 105,468 | | | | 225,858 | | | | 799,605 | |
| Rent | | | 13,579 | | | | 13,582 | | | | 68,850 | |
| Regulatory | | | 39,651 | | | | 28,433 | | | | 116,730 | |
| Travel and entertainment | | | 32,223 | | | | 96,014 | | | | 324,903 | |
| Salaries, wages and benefits | | | 81,148 | | | | 84,029 | | | | 217,859 | |
| Stock based compensation | | | - | | | | 527,318 | | | | 527,318 | |
| Foreign exchange loss | | | (334 | ) | | | 14,653 | | | | 14,618 | |
| Write-down of unproved mineral properties | | | 83,159 | | | | 15,470 | | | | 324,314 | |
| | | | 1,108,226 | | | | 2,928,188 | | | | 7,108,891 | |
| | | | | | | | | | | | | |
| Net loss | | $ | (1,100,422 | ) | | $ | (2,928,188 | ) | | $ | (7,085,429 | ) |
| | | | | | | | | | | | | |
| | | | | | | | | | | | | |
| Net loss per share - basic and diluted | | $ | (0.06 | ) | | $ | (0.19 | ) | | | | |
| | | | | | | | | | | | | |
Weighted average number of shares outstanding - basic and diluted | | | 17,865,307 | | | | 15,759,661 | | | | | |
The accompanying notes are an integral part of these consolidated financial statements
RED METAL RESOURCES LTD. (AN EXPLORATION STAGE COMPANY) CONSOLIDATED STATEMENT OF STOCKHOLDERS' DEFICITEQUITY (DEFICIT)
FOR THE PERIOD FROM JANUARY 10, 2005 (INCEPTION) TO JANUARY 31, 2012
| | | Common Stock Issued | | | | | | Accumulated | | | | |
| | | | | | Amount | | | | | | | | | | | | Total | |
| Balance at January 10, 2005 (Inception) | | | - | | | $ | - | | | $ | - | | | $ | - | | | $ | - | | | $ | - | |
| | | | | | | | | | | | | | | | | | | | | | | | | |
| Net loss | | | - | | | | - | | | | - | | | | (825 | ) | | | - | | | | (825 | ) |
| | | | | | | | | | | | | | | | | | | | | | | | | |
| Balance at January 31, 2005 | | | - | | | | - | | | | - | | | | (825 | ) | | | - | | | | (825 | ) |
| | | | | | | | | | | | | | | | | | | | | | | | | |
| Common stock issued for cash | | | 5,525,000 | | | | 5,525 | | | | 53,725 | | | | - | | | | - | | | | 59,250 | |
| Common stock adjustment | | | 45 | | | | - | | | | - | | | | - | | | | - | | | | - | |
| Donated services | | | - | | | | - | | | | 3,000 | | | | - | | | | - | | | | 3,000 | |
| Net loss | | | - | | | | - | | | | - | | | | (12,363 | ) | | | - | | | | (12,363 | ) |
| | | | | | | | | | | | | | | | | | | | | | | | | |
| Balance at January 31, 2006 | | | 5,525,045 | | | | 5,525 | | | | 56,725 | | | | (13,188 | ) | | | - | | | | 49,062 | |
| | | | | | | | | | | | | | | | | | | | | | | | | |
| Donated services | | | - | | | | - | | | | 9,000 | | | | - | | | | - | | | | 9,000 | |
| Net loss | | | - | | | | - | | | | - | | | | (43,885 | ) | | | - | | | | (43,885 | ) |
| | | | | | | | | | | | | | | | | | | | | | | | | |
| Balance at January 31, 2007 | | | 5,525,045 | | | | 5,525 | | | | 65,725 | | | | (57,073 | ) | | | - | | | | 14,177 | |
| | | | | | | | | | | | | | | | | | | | | | | | | |
| Donated services | | | - | | | | - | | | | 2,250 | | | | - | | | | - | | | | 2,250 | |
| Return of common stock to treasury | | | (1,750,000 | ) | | | (1,750 | ) | | | 1,749 | | | | - | | | | - | | | | (1 | ) |
| Common stock issued for cash | | | 23,810 | | | | 24 | | | | 99,976 | | | | - | | | | - | | | | 100,000 | |
| Net loss | | | - | | | | - | | | | - | | | | (232,499 | ) | | | - | | | | (232,499 | ) |
| | | | | | | | | | | | | | | | | | | | | | | | | |
| Balance at January 31, 2008 | | | 3,798,855 | | | | 3,799 | | | | 169,700 | | | | (289,572 | ) | | | - | | | | (116,073 | ) |
| | | | | | | | | | | | | | | | | | | | | | | | | |
| Common stock issued for cash | | | 357,147 | | | | 357 | | | | 1,299,643 | | | | - | | | | - | | | | 1,300,000 | |
| Net loss | | | - | | | | - | | | | - | | | | (1,383,884 | ) | | | - | | | | (1,383,884 | ) |
| Foreign currency exchange loss | | | - | | | | - | | | | - | | | | - | | | | (21,594 | ) | | | (21,594 | ) |
| | | | | | | | | | | | | | | | | | | | | | | | | |
| Balance at January 31, 2009 | | | 4,156,002 | | | | 4,156 | | | | 1,469,343 | | | | (1,673,456 | ) | | | (21,594 | ) | | | (221,551 | ) |
| | | | | | | | | | | | | | | | | | | | | | | | | |
| Common stock issued for cash | | | 1,678,572 | | | | 1,678 | | | | 160,822 | | | | - | | | | - | | | �� | 162,500 | |
| Common stock issued for debt | | | 3,841,727 | | | | 3,843 | | | | 1,148,675 | | | | - | | | | - | | | | 1,152,518 | |
| Net loss | | | - | | | | - | | | | - | | | | (710,745 | ) | | | - | | | | (710,745 | ) |
| Foreign currency exchange loss | | | - | | | | - | | | | - | | | | - | | | | (35,816 | ) | | | (35,816 | ) |
| | | | | | | | | | | | | | | | | | | | | | | | | |
| Balance at January 31, 2010 | | | 9,676,301 | | | | 9,677 | | | | 2,778,840 | | | | (2,384,201 | ) | | | (57,410 | ) | | | 346,906 | |
| | | | | | | | | | | | | | | | | | | | | | | | | |
| Common stock issued for cash | | | 540,000 | | | | 540 | | | | 134,460 | | | | - | | | | - | | | | 135,000 | |
| Net loss for the year ended January 31, 2011 | | | - | | | | - | | | | - | | | | (672,618 | ) | | | - | | | | (672,618 | ) |
| Foreign currency exchange loss | | | - | | | | - | | | | - | | | | - | | | | (13,438 | ) | | | (13,438 | ) |
| | | | | | | | | | | | | | | | | | | | | | | | | |
| Balance at January 31, 2011 | | | 10,216,301 | | | | 10,217 | | | | 2,913,300 | | | | (3,056,819 | ) | | | (70,848 | ) | | | (204,150 | ) |
| | | | | | | | | | | | | | | | | | | | | | | | | |
| Common stock issued for cash | | | 6,290,000 | | | | 6,290 | | | | 1,821,810 | | | | - | | | | - | | | | 1,828,100 | |
| Common stock issued for debt | | | 433,333 | | | | 433 | | | | 129,567 | | | | - | | | | - | | | | 130,000 | |
| Warrants exercised for cash | | | 83,333 | | | | 83 | | | | 24,916 | | | | - | | | | - | | | | 24,999 | |
| Warrants exercised for debt | | | 166,667 | | | | 167 | | | | 49,833 | | | | - | | | | - | | | | 50,000 | |
| Stock options | | | - | | | | - | | | | 527,318 | | | | - | | | | - | | | | 527,318 | |
| Net loss for the year ended January 31, 2012 | | | - | | | | - | | | | - | | | | (2,928,188 | ) | | | - | | | | (2,928,188 | ) |
| Foreign currency exchange loss | | | - | | | | - | | | | - | | | | - | | | | (15,673 | ) | | | (15,673 | ) |
| | | | | | | | | | | | | | | | | | | | | | | | | |
| Balance at January 31, 2012 | | | 17,189,634 | | | $ | 17,190 | | | $ | 5,466,744 | | | $ | (5,985,007 | ) | | $ | (86,521 | ) | | $ | (587,594 | ) |
The accompanying notes are an integral part of these consolidated financial statements
(AN EXPLORATION STAGE COMPANY)
CONSOLIDATED STATEMENTS OF CASH FLOWS
| | | For the year | | | From January 10, | |
| | | Ended January 31, | | | 2005 (Inception) | |
| | | 2012 | | | 2011 | | | to January 31, 2012 | |
| Cash flows used in operating activities: | | | | | | | | | |
| Net loss | | $ | (2,928,188 | ) | | $ | (672,618 | ) | | $ | (5,985,007 | ) |
| Adjustments to reconcile net loss to net cash used in operating activities: | | | | | | | | | |
| Donated services and rent | | | - | | | | - | | | | 14,250 | |
| Write-down of unproved mineral properties | | | 15,470 | | | | - | | | | 241,156 | |
| Amortization | | | 3,107 | | | | - | | | | 3,107 | |
| Stock based compensation | | | 527,318 | | | | - | | | | 527,318 | |
| | | | | | | | | | | | | |
| Changes in operating assets and liabilities: | | | | | | | | | | | | |
| Prepaids and other receivables | | | (7,584 | ) | | | (20,397 | ) | | | (45,156 | ) |
| Accounts payable | | | 10,018 | | | | 67,123 | | | | 206,675 | |
| Accrued liabilities | | | 31,380 | | | | (495 | ) | | | 262,425 | |
| Due to related parties | | | 395,451 | | | | 410,429 | | | | 1,243,586 | |
| Accrued interest on notes payable to related party | | | 8,996 | | | | 3,758 | | | | 82,746 | |
| | | | | | | | | | | | | |
| Net cash used in operating activities | | | (1,944,032 | ) | | | (212,200 | ) | | | (3,448,900 | ) |
| | | | | | | | | | | | | |
| Cash flows used in investing activities: | | | | | | | | | | | | |
| Purchase of fixed assets | | | (19,820 | ) | | | - | | | | (19,820 | ) |
| Acquisition of unproved mineral properties | | | (150,269 | ) | | | (18,548 | ) | | | (1,177,038 | ) |
| | | | | | | | | | | | | |
| Net cash used in investing activities | | | (170,089 | ) | | | (18,548 | ) | | | (1,196,858 | ) |
| | | | | | | | | | | | | |
| Cash flows provided by financing activities: | | | | | | | | | | | | |
| Cash received on issuance of notes payable to related party | | | 306,889 | | | | 109,890 | | | | 1,161,279 | |
| Repayment of related party notes, including accrued interest | | | (14,382 | ) | | | | | | | (14,382 | ) |
| Proceeds from issuance of common stock | | | 1,853,099 | | | | 135,000 | | | | 3,609,849 | |
| Net cash provided by financing activities | | | 2,145,606 | | | | 244,890 | | | | 4,756,746 | |
| | | | | | | | | | | | | |
| Effects of foreign currency exchange | | | (15,673 | ) | | | (13,438 | ) | | | (86,521 | ) |
| | | | | | | | | | | | | |
| Increase in cash | | | 15,812 | | | | 704 | | | | 24,467 | |
| | | | | | | | | | | | | |
| Cash, beginning | | | 8,655 | | | | 7,951 | | | | - | |
| | | | | | | | | | | | | |
| Cash, ending | | $ | 24,467 | | | $ | 8,655 | | | $ | 24,467 | |
| | | | | | | | | | | | | |
| Supplemental disclosures: | | | | | | | | | | | | |
| Cash paid for: | | | | | | | | | | | | |
| Income tax | | $ | - | | | $ | - | | | $ | - | |
| Interest | | $ | (1,778 | ) | | $ | - | | | $ | - | |
| | | Common Stock Issued | | | | | | | | | Accumulated | | | | |
| | | | | | Amount | | | | | | | | | | | | Total | |
| Balance at January 10, 2005 (Inception) | | | - | | | $ | - | | | $ | - | | | $ | - | | | $ | - | | | $ | - | |
| | | | | | | | | | | | | | | | | | | | | | | | | |
| Net loss | | | - | | | | - | | | | - | | | | (825 | ) | | | - | | | | (825 | ) |
| | | | | | | | | | | | | | | | | | | | | | | | | |
| Balance at January 31, 2005 | | | - | | | | - | | | | - | | | | (825 | ) | | | - | | | | (825 | ) |
| | | | | | | | | | | | | | | | | | | | | | | | | |
| Common stock issued for cash | | | 5,525,000 | | | | 5,525 | | | | 53,725 | | | | - | | | | - | | | | 59,250 | |
| Common stock adjustment | | | 45 | | | | - | | | | - | | | | - | | | | - | | | | - | |
| Donated services | | | - | | | | - | | | | 3,000 | | | | - | | | | - | | | | 3,000 | |
| Net loss | | | - | | | | - | | | | - | | | | (12,363 | ) | | | - | | | | (12,363 | ) |
| | | | | | | | | | | | | | | | | | | | | | | | | |
| Balance at January 31, 2006 | | | 5,525,045 | | | | 5,525 | | | | 56,725 | | | | (13,188 | ) | | | - | | | | 49,062 | |
| | | | | | | | | | | | | | | | | | | | | | | | | |
| Donated services | | | - | | | | - | | | | 9,000 | | | | - | | | | - | | | | 9,000 | |
| Net loss | | | - | | | | - | | | | - | | | | (43,885 | ) | | | - | | | | (43,885 | ) |
| | | | | | | | | | | | | | | | | | | | | | | | | |
| Balance at January 31, 2007 | | | 5,525,045 | | | | 5,525 | | | | 65,725 | | | | (57,073 | ) | | | - | | | | 14,177 | |
| | | | | | | | | | | | | | | | | | | | | | | | | |
| Donated services | | | - | | | | - | | | | 2,250 | | | | - | | | | - | | | | 2,250 | |
| Return of common stock to treasury | | | (1,750,000 | ) | | | (1,750 | ) | | | 1,749 | | | | - | | | | - | | | | (1 | ) |
| Common stock issued for cash | | | 23,810 | | | | 24 | | | | 99,976 | | | | - | | | | - | | | | 100,000 | |
| Net loss | | | - | | | | - | | | | - | | | | (232,499 | ) | | | - | | | | (232,499 | ) |
| | | | | | | | | | | | | | | | | | | | | | | | | |
| Balance at January 31, 2008 | | | 3,798,855 | | | | 3,799 | | | | 169,700 | | | | (289,572 | ) | | | - | | | | (116,073 | ) |
| | | | | | | | | | | | | | | | | | | | | | | | | |
| Common stock issued for cash | | | 357,147 | | | | 357 | | | | 1,299,643 | | | | - | | | | - | | | | 1,300,000 | |
| Net loss | | | - | | | | - | | | | - | | | | (1,383,884 | ) | | | - | | | | (1,383,884 | ) |
| Foreign currency exchange loss | | | - | | | | - | | | | - | | | | - | | | | (21,594 | ) | | | (21,594 | ) |
| | | | | | | | | | | | | | | | | | | | | | | | | |
| Balance at January 31, 2009 | | | 4,156,002 | | | | 4,156 | | | | 1,469,343 | | | | (1,673,456 | ) | | | (21,594 | ) | | | (221,551 | ) |
| | | | | | | | | | | | | | | | | | | | | | | | | |
| Common stock issued for cash | | | 1,678,572 | | | | 1,678 | | | | 160,822 | | | | - | | | | - | | | | 162,500 | |
| Common stock issued for debt | | | 3,841,727 | | | | 3,843 | | | | 1,148,675 | | | | - | | | | - | | | | 1,152,518 | |
| Net loss | | | - | | | | - | | | | - | | | | (710,745 | ) | | | - | | | | (710,745 | ) |
| Foreign currency exchange loss | | | - | | | | - | | | | - | | | | - | | | | (35,816 | ) | | | (35,816 | ) |
| | | | | | | | | | | | | | | | | | | | | | | | | |
| Balance at January 31, 2010 | | | 9,676,301 | | | | 9,677 | | | | 2,778,840 | | | | (2,384,201 | ) | | | (57,410 | ) | | | 346,906 | |
| | | | | | | | | | | | | | | | | | | | | | | | | |
| Common stock issued for cash | | | 540,000 | | | | 540 | | | | 134,460 | | | | - | | | | - | | | | 135,000 | |
| Net loss for the year ended January 31, 2011 | | | - | | | | - | | | | - | | | | (672,618 | ) | | | - | | | | (672,618 | ) |
| Foreign currency exchange loss | | | - | | | | - | | | | - | | | | - | | | | (13,438 | ) | | | (13,438 | ) |
| | | | | | | | | | | | | | | | | | | | | | | | | |
| Balance at January 31, 2011 | | | 10,216,301 | | | | 10,217 | | | | 2,913,300 | | | | (3,056,819 | ) | | | (70,848 | ) | | | (204,150 | ) |
| | | | | | | | | | | | | | | | | | | | | | | | | |
| Common stock issued for cash | | | 6,290,000 | | | | 6,290 | | | | 1,821,810 | | | | - | | | | - | | | | 1,828,100 | |
| Common stock issued for debt | | | 433,333 | | | | 433 | | | | 129,567 | | | | - | | | | - | | | | 130,000 | |
| Warrants exercised for cash | | | 83,333 | | | | 83 | | | | 24,916 | | | | - | | | | - | | | | 24,999 | |
| Warrants exercised for debt | | | 166,667 | | | | 167 | | | | 49,833 | | | | - | | | | - | | | | 50,000 | |
| Stock options | | | - | | | | - | | | | 527,318 | | | | - | | | | - | | | | 527,318 | |
| Net loss for the year ended January 31, 2012 | | | - | | | | - | | | | - | | | | (2,928,188 | ) | | | - | | | | (2,928,188 | ) |
| Foreign currency exchange loss | | | - | | | | - | | | | - | | | | - | | | | (15,673 | ) | | | (15,673 | ) |
| | | | | | | | | | | | | | | | | | | | | | | | | |
| Balance at January 31, 2012 | | | 17,189,634 | | | | 17,190 | | | | 5,466,744 | | | | (5,985,007 | ) | | | (86,521 | ) | | | (587,594 | ) |
| | | | | | | | | | | | | | | | | | | | | | | | | |
| Warrants exercised for cash | | | 500,000 | | | | 500 | | | | 149,500 | | | | - | | | | - | | | | 150,000 | |
| Common stock issued for cash | | | 267,335 | | | | 267 | | | | 120,034 | | | | - | | | | - | | | | 120,301 | |
| Extinguishment of related party debt | | | - | | | | - | | | | 191,823 | | | | - | | | | - | | | | 191,823 | |
| Donated services | | | - | | | | - | | | | 30,000 | | | | - | | | | - | | | | 30,000 | |
| Net loss for the year ended January 31, 2013 | | | - | | | | - | | | | - | | | | (1,100,422 | ) | | | - | | | | (1,100,422 | ) |
| Foreign currency exchange loss | | | - | | | | - | | | | - | | | | - | | | | (22,385 | ) | | | (22,385 | ) |
| | | | | | | | | | | | | | | | | | | | | | | | | |
| Balance at January 31, 2013 | | | 17,956,969 | | | $ | 17,957 | | | $ | 5,958,101 | | | $ | (7,085,429 | ) | | $ | (108,906 | ) | | $ | (1,218,277 | ) |
The accompanying notes are an integral part of these consolidated financial statements
RED METAL RESOURCES LTD.(AN EXPLORATION STAGE COMPANY)CONSOLIDATED STATEMENTS OF CASH FLOWS
| | | For the Year Ended Janaury 31, | | | From January 10, 2005 (Inception) | |
| | | 2013 | | | 2012 | | | to January 31, 2013 | |
| Cash flows used in operating activities: | | | | | | | | | |
| Net loss | | $ | (1,100,422 | ) | | $ | (2,928,188 | ) | | $ | (7,085,429 | ) |
| Adjustments to reconcile net loss to net cash used in operating activities: | | | | | | | | | |
| Donated services and rent | | | 30,000 | | | | - | | | | 44,250 | |
| Write-down of unproved mineral properties | | | 83,159 | | | | 15,470 | | | | 324,315 | |
| Amortization | | | 4,489 | | | | 3,107 | | | | 7,596 | |
| Stock based compensation | | | - | | | | 527,318 | | | | 527,318 | |
| | | | | | | | | | | | | |
| Changes in operating assets and liabilities: | | | | | | | | | | | | |
| Prepaids and other receivables | | | 44,165 | | | | (7,584 | ) | | | (991 | ) |
| Accounts payable | | | 95,343 | | | | 10,018 | | | | 302,018 | |
| Accrued liabilities | | | 20,425 | | | | 31,380 | | | | 282,850 | |
| Due to related parties | | | 595,243 | | | | 395,451 | | | | 1,838,829 | |
| Accrued interest on notes payable to related party | | | 22,829 | | | | 8,996 | | | | 105,575 | |
| | | | | | | | | | | | | |
| Net cash used in operating activities | | | (204,769 | ) | | | (1,944,032 | ) | | | (3,653,669 | ) |
| | | | | | | | | | | | | |
| Cash flows used in investing activities: | | | | | | | | | | | | |
| Purchase of equipment | | | - | | | | (19,820 | ) | | | (19,820 | ) |
| Acquisition of unproved mineral properties | | | (138,942 | ) | | | (150,269 | ) | | | (1,315,980 | ) |
| | | | | | | | | | | | | |
| Net cash used in investing activities | | | (138,942 | ) | | | (170,089 | ) | | | (1,335,800 | ) |
| | | | | | | | | | | | | |
| Cash flows provided by financing activities: | | | | | | | | | | | | |
| Cash received on issuance of notes payable to related party | | | 131,032 | | | | 306,889 | | | | 1,292,311 | |
| Repayment of related party notes, including accrued interest | | | (56,553 | ) | | | (14,382 | ) | | | (70,935 | ) |
| Proceeds from issuance of common stock | | | 270,301 | | | | 1,853,099 | | | | 3,880,150 | |
| | | | | | | | | | | | | |
| Net cash provided by financing activities | | | 344,780 | | | | 2,145,606 | | | | 5,101,526 | |
| | | | | | | | | | | | | |
| Effects of foreign currency exchange | | | (22,385 | ) | | | (15,673 | ) | | | (108,906 | ) |
| | | | | | | | | | | | | |
| Increase (decrease) in cash | | | (21,316 | ) | | | 15,812 | | | | 3,151 | |
| | | | | | | | | | | | | |
| Cash, beginning | | | 24,467 | | | | 8,655 | | | | - | |
| | | | | | | | | | | | | |
| Cash, ending | | $ | 3,151 | | | $ | 24,467 | | | $ | 3,151 | |
| | | | | | | | | | | | | |
| Supplemental disclosures: | | | | | | | | | | | | |
| Cash paid for: | | | | | | | | | | | | |
| Income tax | | $ | - | | | $ | - | | | $ | - | |
| Interest | | $ | (6,553 | ) | | $ | (1,778 | ) | | $ | (8,331 | ) |
The accompanying notes are an integral part of these consolidated financial statements
RED METAL RESOURCES LTD.
(AN EXPLORATION STAGE COMPANY)
NOTES TO THE CONSOLIDATED FINANCIAL STATEMENTS
JANUARY 31, 20122013
NOTE 1 – ORGANIZATION AND BASIS OF PRESENTATION
Nature of Operations
Red Metal Resources Ltd. (the “Company”) was incorporated on January 10, 2005, under the laws of the State of Nevada. On August 21, 2007, the Company acquired a 99% interest in Minera Polymet Limitada (“Polymet”), a limited liability company formed on August 21, 2007, under the laws of the Republic of Chile. The Company is involved in acquiring and exploring mineral properties in Chile. The Company has not determined whether its properties contain mineral reserves that are economically recoverable.
The Company’s consolidated financial statements are prepared on a going concern basis in accordance with US generally accepted accounting principles (“GAAP”) which contemplates the realization of assets and discharge liabilities and commitments in the normal course of business. The Company is in the exploration stage. It has not generated only minimal operating revenues to date, and has accumulated losses of $5,985,007$7,085,429 since inception. The Company has funded its operations through the issuance of capital stock and debt. Management plans to raise additional funds through equity and/or debt financings.financings, and by entering into joint venture agreements. There is no certainty that further funding will be available as needed. These factors raise substantial doubt about the ability of the Company to continue operating as a going concern. The Company’s ability to continue its operations as a going concern, realize the carrying value of its assets, and discharge its liabilities in the normal course of business is dependent upon its ability to raise new capital sufficient to fund its commitments and ongoing losses, and ultimately on generating profitable operations.
NOTE 2 –- SUMMARY OF SIGNIFICANT ACCOUNTING POLICIES
Basis of Presentation
These consolidated financial statements and related notes are presented in accordance with US GAAP, and are expressed in United States dollars. The Company has not produced revenues from its principal business and is an exploration stage company as defined by “Accounting and Reporting by Development Stage Enterprises.” These financial statements include the accounts of the Company and its wholly owned subsidiary, Polymet. All intercompany transactions and balances have been eliminated.
Reclassifications
Certain comparative amounts in the accompanying consolidated financial statements have been reclassified to conform to the current year’s presentation. These reclassifications had no effect on the consolidated results of operations or financial position for any year presented.
Accounting Estimates
The preparation of financial statements in conformity with US GAAP requires management to make estimates and assumptions that affect certain of the reported amounts of assets and liabilities, disclosure of contingent assets and liabilities at the date of the financial statements and the reported amounts of revenues and expenses during the year. The Company regularly evaluates estimates and assumptions. The Company bases its estimates and assumptions on current facts, historical experience and various other factors it believes to be reasonable under the circumstances, the results of which form the basis for making judgments about the carrying values of assets and liabilities and the accrual of costs and expenses that are not readily apparent from other sources. The actual results experienced by the Company may differ materially and adversely from the Company’s estimates. To the extent there are material differences between the estimates and the actual results, future results of operations will be affected. The most significant estimates with regard to these financial statements relate to carrying values of unproved mineral properties, asset retirement obligations, fair value of stock based transactions, and future deferred income tax rates.
Asset Retirement Obligations
The Company records the fair value of an asset retirement obligation as a liability in the period in which it incurs an obligation associated with the retirement of tangible long-lived assets that result from the acquisition, construction, development and/or normal use of the assets. The estimated fair value of the asset retirement obligation is based on the current cost escalated at an inflation rate and discounted at a credit adjusted risk-free rate. This liability is capitalized as part of the cost of the related asset and amortized over its useful life. The liability accretes until the Company settles the obligation. To date the Company has not incurred any measurable asset retirement obligations.
Long Lived Assets
The carrying value of intangible assets and other long-lived assets is reviewed on a regular basis for the existence of facts or circumstances that may suggest impairment. The Company recognizes impairment when the sum of the expected undiscounted future cash flows is less than the carrying amount of the asset. Impairment losses, if any, are measured as the excess of the carrying amount of the asset over its estimated fair value.
Fair Value of Financial Instruments
The estimated fair values for financial instruments are determined at discrete points in time based on relevant market information. These estimates involve uncertainties and cannot be determined with precision. The estimated fair value of cash, other receivables, amounts due to related parties and accounts payable approximates their carrying value due to their short-term nature.
Foreign Currency Translation and Transaction
The functional currency for the Company’s foreign subsidiary is the Chilean peso. The Company translates assets and liabilities to US dollars using year-end exchange rates, translates unproved mineral properties using historical exchange rates, and translates revenues and expenses using average exchange rates during the period. Exchange gains and losses arising from the translation of foreign entity financial statements are included as a component of other comprehensive loss.
Transactions denominated in currencies other than the functional currency of the legal entity are re-measured to the functional currency of the legal entity at the year-end exchange rates. Any associated transactional currency re-measurement gains and losses are recognized in current operations.
Revenue Recognition
The Company records revenues and royalties from the sale of minerals when persuasive evidence of an arrangement exists, the minerals have been delivered to the customer and the risk of ownership or title has been transferred, and collectability is reasonably assured.
Income Taxes
Income taxes are determined using the liability method. Deferred tax assets and liabilities are recognized for the future tax consequences attributable to differences between the financial statement carrying amounts of assets and liabilities and their respective tax basis. Deferred tax assets and liabilities are measured using the enacted tax rates expected to apply to taxable income in the years in which those temporary differences are expected to be recovered or settled. The effect on deferred tax assets and liabilities of a change in tax rates is recognized in income in the period that includes that date of enactment. In addition, a valuation allowance is established to reduce any deferred tax asset for which it is determined that it is more likely than not that some portion of the deferred tax asset will not be realized.
The Company accounts for uncertainty in income taxes by applying a two-step method. First, it evaluates whether a tax position has met a more likely than not recognition threshold, and second, it measures that tax position to determine the amount of benefit, if any, to be recognized in the financial statements. The application of this method did not have a material effect on the Company's financial statements.
Loss per Share
The Company presents both basic and diluted loss per share (“LPS”) on the face of the statements of operations. Basic LPS is computed by dividing net loss available to common shareholders by the weighted average number of shares outstanding during the year. Diluted LPS gives effect to all dilutive potential common shares outstanding during the period including convertible debt, stock options, and warrants, using the treasury stock method. Diluted LPS excludes all dilutive potential shares if their effect is anti-dilutive.
Mineral Properties
Realization of the Company's investment in and expenditures on mineral properties is dependent upon the establishment of legal ownership, the attainment of successful production from the properties or from the proceeds of their disposal.
Title to mineral properties involves certain inherent risks due to the difficulties of determining the validity of certain claims as well as the potential for problems arising from the frequently ambiguous conveyancing history characteristics of many mineral properties. To the best of its knowledge the Company believes all of its unproved mineral interests are in good standing and that it has title to all of these mineral interests.
The Company classifies its mineral rights as tangible assets and accordingly acquisition costs are capitalized as mineral property costs. Mineral exploration costs are expensed as incurred until commercially mineable deposits are determined to exist within a particular property.
Stock Options and Other Share-Based Compensation
For equity awards, such as stock options, total compensation cost is based on the grant date fair value and for liability awards, such as stock appreciation rights, total compensation cost is based on the settlement value. The company recognizes stock-based compensation expense for all awards over the service period required to earn the award, which is the shorter of the vesting period or the time period an employee becomes eligible to retain the award at retirement.
Recently Adopted Accounting Guidance
The Company has reviewed recently issued accounting pronouncements and plans to adopt those that are applicable to it. It does not expect the adoption of these pronouncements to have a material impact on its financial position, results of operations or cash flows.
NOTE 3 – RELATED-PARTY TRANSACTIONS
The following amounts were due to related parties at January 31, 2012 and January 31, 2011:as at:
| | | January 31, 2012 | | | January 31, 2011 | |
| | | | | | | |
| Due to a company owned by an officer | | $ | 190,608 | | | $ | 228,330 | |
| Due to a company controlled by directors | | | 658,950 | | | | 207,742 | |
| Due to a company controlled by a major shareholder | | | 51,957 | | | | 63,692 | |
| Due to an officer of Chilean subsidiary | | | 4,047 | | | | 10,347 | |
| Total due to related parties (a) | | $ | 905,562 | | | $ | 510,111 | |
| | | | | | | | | |
| Note payable to a related party (b) | | $ | 56,164 | | | $ | 52,902 | |
| Note payable to a director (c) | | | 55,129 | | | | 60,746 | |
| Note payable to an chief financial officer (c) | | | 8,502 | | | | - | |
| Note payable to a major shareholder (c) | | | 53,115 | | | | - | |
| Note payable to a company controlled by directors (c) | | | 63,910 | | | | - | |
| Total notes payable to related parties | | $ | 236,820 | | | $ | 113,648 | |
| | | January 31, 2013 | | | January 31, 2012 | |
| | | | | | | |
| Due to a company owned by an officer (a) | | $ | 269,097 | | | $ | 190,608 | |
| Due to a company controlled by directors (b) | | | 894,377 | | | | 658,950 | |
| Due to a company controlled by a major shareholder (a) | | | 94,588 | | | | 51,957 | |
| Due to a major shareholders (a) | | | 50,920 | | | | - | |
| Due to an officer of Chilean subsidiary (a) | | | - | | | | 4,047 | |
| Total due to related parties | | $ | 1,308,982 | | | $ | 905,562 | |
| | | | | | | | | |
| Note payable to a former related party (c) | | $ | - | | | $ | 56,164 | |
| Note payable to a director (d) | | | 136,532 | | | | 55,129 | |
| Note payable to a chief financial officer (d) | | | 9,210 | | | | 8,502 | |
| Note payable to a major shareholder (d) | | | 118,797 | | | | 53,115 | |
| Note payable to a company controlled by directors (d) | | | 69,589 | | | | 63,910 | |
| Total notes payable to related parties | | $ | 334,128 | | | $ | 236,820 | |
(a) Amounts due to related parties are unsecured, are due on demand and bear no interest.
(b) Amount is unsecured, due on demand, and bears simple interest at 10%(b)(c) The note payable iswas due on demand, unsecured and bearsbore interest at 6% per annum. The principle of $50,000 and accumulated interest of $6,553 were paid in full on March 13, 2012.
(c)(d) The notes payable to related parties are due on demand, unsecured and bear interest at 8% per annum.
Transactions with Related Parties
During the years ended January 31, 20122013 and 2011,2012, the Company incurred the following direct expenses with related parties:
| | | January 31, 2012 | | | January 31, 2011 | |
| | | | | | | |
| Consulting fees and other business expenses paid to a company owned by the Chief Financial Officer | | $ | 298,797 | | | $ | 181,384 | |
| Advertising and promotion, mineral exploration and other business expenses paid to a company controlled by two directors | | $ | 667,796 | | | $ | 142,547 | |
| Administration and business expenses paid to a company controlled by a major shareholder. | | $ | 48,990 | | | $ | 63,208 | |
| Administration expenses paid to an officer of the Company’s Chilean subsidiary. | | $ | 47,315 | | | $ | 26,221 | |
| | | $ | 1,062,898 | | | $ | 413,360 | |
| | | January 31, 2013 | | | January 31, 2012 | |
| | | | | | | |
| Consulting fees and other business expenses paid to a company owned by the Chief Financial Officer | | $ | 163,071 | | | $ | 298,397 | |
| Consulting fees donated by a company owned by the Chief Financial Officer | | | 30,000 | | | | - | |
| Investor relations and mineral exploration and other business expenses paid to a company controlled by two directors | | | 359,338 | | | | 665,945 | |
| Administration and rental fees paid to a company controlled by a major shareholder | | | 17,530 | | | | 48,990 | |
| Administration expenses paid to an officer of the Company’s Chilean subsidiary | | | - | | | | 47,315 | |
| | | $ | 569,939 | | | $ | 1,060,647 | |
These transactions were in the normal course of operations and were measured at the exchange amount, which is the amount of consideration established and agreed to by the related parties. In addition to direct expenses, the Company has also agreed to reimburse certain related parties for expenses they incurred on the Company’s behalf, including advertising, travel, and office expenses.
During the year ended January 31, 2013, the Company recorded $30,000 in donated consulting services.
During the year ended January 31, 2013, debt owing by the Company to related parties of $191,823 was forgiven. The gain on the extinguishment of debt was recorded in additional paid-in capital.
NOTE 4 – UNPROVED MINERAL PROPERTIES
| | | January 31,2012 | | | January 31, 2011 | |
| | | | | | | |
| Unproved mineral properties, beginning | | $ | 662,029 | | | $ | 643,481 | |
| Acquisition | | | 150,269 | | | | 18,548 | |
| Unproved mineral properties written down | | | (15,470 | ) | | | - | |
| Unproved mineral properties, ending | | $ | 796,828 | | | $ | 662,029 | |
Farellon Property| Mineral Claims | | Balance, January 31, 2012 | | | Additions | | | Property Taxes Paid / Accrued | | | Impairment | | | Balance, January 31, 2013 | |
| Farellon Project | | | | | | | | | | | | | | | |
Farellon Alto 1-8(1) | | $ | 552,976 | | | $ | 13,142 | | | $ | 14,116 | | | $ | - | | | $ | 580,234 | |
| Cecil | | | 41,746 | | | | - | | | | 12,330 | | | | - | | | | 54,076 | |
| | | | 594,722 | | | | 13,142 | | | | 26,446 | | | | - | | | | 634,310 | |
| Perth Project | | | | | | | | | | | | | | | | | | | | |
| Perth | | | 19,371 | | | | 20,031 | | | | 35,944 | | | | - | | | | 75,346 | |
| | | | | | | | | | | | | | | | | | | | | |
| Mateo Project | | | | | | | | | | | | | | | | | | | | |
| Margarita | | | 18,195 | | | | - | | | | 904 | | | | - | | | | 19,099 | |
Che (2) | | | 23,895 | | | | - | | | | 1,184 | | | | - | | | | 25,079 | |
| Irene | | | 47,174 | | | | - | | | | 968 | | | | - | | | | 48,142 | |
| Mateo | | | 33,065 | | | | 15,634 | | | | 1,936 | | | | - | | | | 50,635 | |
| | | | 122,329 | | | | 15,634 | | | | 4,992 | | | | - | | | | 142,955 | |
Veta Negra Project(3) | | | | | | | | | | | | | | | | | | | | |
| Veta Negra | | | 18,480 | | | | 9,247 | | | | 10,129 | | | | (37,856 | ) | | | - | |
| Pibe | | | 40,000 | | | | - | | | | 3,377 | | | | (43,377 | ) | | | - | |
| | | | 58,480 | | | | 9,247 | | | | 13,506 | | | | (81,233 | ) | | | - | |
| | | | | | | | | | | | | | | | | | | | | |
| Generative Claims | | | 1,926 | | | | - | | | | - | | | | (1,926 | ) | | | - | |
| | | | | | | | | | | | | | | | | | | | | |
| Total Costs | | $ | 796,828 | | | $ | 58,054 | | | $ | 80,888 | | | | (83,159 | ) | | $ | 852,611 | |
Farellon Alto Uno al Ocho Mineral ClaimOn April 25, 2008, the Company acquired the Farellon Alto Uno al Ocho mining claim located in the Commune of Freirina, Province of Huasco, III Region of Atacama, Chile for $550,000. F - 9
(1) The claim is subject to a 1.5% royalty on the net sales of minerals extracted from the property to a total of $600,000. The royalty payments are due monthly once exploitation begins, and are subject to minimum payments of $1,000 per month. The Company has no obligation to pay the royalty if it does not commence exploitation. The Company had spent a total of $552,976 on the acquisition of this claim at January 31, 2012, and $550,844 at January 31, 2011.
Cecil Mineral Claims
On September 17, 2008, the Company acquired the Cecil mining claims for $20,000. The claims are located near the Farellon property in commune of Freirina, Province of Huasco, III Region of Atacama, Chile. At January 31, 2012, the Company had spent a total of $38,650 on the acquisition of these claims and accrued $3,096 in unpaid property taxes. At January 31, 2011, the Company had spent a total of $32,803 on the acquisition of these claims and accrued $3,096 in unpaid property taxes.
Perth Property
Perth Claims
On March 10, 2011, the Company purchased the Perth mining claims for $35,000. The properties are located in Sierra Pan de Azucar in commune of Freirina, Province of Huasco, III Region of Atacama, Chile. At January 31, 2012, the Company had spent $54,371 in acquisition costs for this property, which were offset against a joint venture payment of $35,000 received on March 14, 2011. The joint venture has been terminated.
Mateo Property
Margarita Claim
On November 27, 2008, the Company purchased the Margarita mining claim for $16,072. At January 31, 2012, the Company had spent $17,528 on the acquisition of this claim and accrued $667 in unpaid property taxes. At January 31, 2011, the Company had spent $17,078 on the acquisition of this claim and accrued $667 in unpaid property taxes.
Che Claims
On October 10, 2008, the Company acquired an option to purchase the Che Uno and Che Dos mining claims. The Company exercised its option on April 12, 2011 by paying $20,000 to the vendor. (2) The claims are subject to a 1% royalty on the net sales of minerals extracted from the property to a total of $100,000. The royalty payments are due monthly once exploitation begins and are not subject to minimum payments. The Company has no obligation to pay the royalty if it does not commence exploitation. At January 31, 2012, the Company had spent a total of $22,631 on the acquisition of these
(3) See abandoned claims and accrued $1,264 in unpaid property taxes. At January 31, 2011, the Company had spent a total of $1,313 on the acquisition of these claims and accrued $1,264 in unpaid property taxes. below.
Mateo Exploration ClaimsAbandoned claims
At
During the year ended January 31, 2012,2013, the Company had spent a total of $28,368 onabandoned the acquisition of these claims and accrued $4,698 in unpaid property taxes and other costs. At January 31, 2011 the Company had spent a total of $6,833 on the acquisition of these claims and accrued $8,304 in unpaid property taxes and other costs.
Irene Claims
On September 7, 2010 the Company entered into a purchase agreement with a related company to acquire the Irene claims. Under the terms of the agreement, as amended, the Company paid $45,174 (equivalent of 21 million Chilean pesos) on May 10, 2011 to exercise the option and purchase the Irene claims. At January 31, 2012, the Company had spent $47,174 in acquisition costs for these claims. At January 31, 2011, the Company capitalized $838 in the acquisition of these claims.
Veta Negra Propertyproperty and wrote off $81,233 in mineral property costs.
The project consisted of Veta Negra, Claims
On June 30, 2011, the Company entered into an agreement with a related company to acquire its options to purchase theExon and Pibe mining claims as well as several exploration claims. Veta Negra and Exon mining claims and the Trixy exploration claims forwere a total of $107,500, payable in installments until February 2013 and its interest in several generative claims with the net book value of $4,504. The claims are subject to semi-annual option payments totaling $107,500 and a 1.5% royalty on the net sales of minerals extracted to a total of $500,000. The royalty payments are due monthly once exploitation begins. At January 31, 2012, the Company paid $10,000 inPibe claim was a subject to semi-annual option payments and capitalized an additional $8,480 as cost of transferred generative claims and property taxes.
Pibe Claim
On November 25, 2011, the Company entered into an option to purchase agreement with unrelated vendor to acquire the Pibe 1 - 20 mining claims. The Pibe claims are located in Sierra la Chinchilla, community of Vallenar, Province of Huasco, Region of Atacama and cover 200 hectares. The option to purchase contract has a term of 36 month with semi-annual payments totaling $500,000. The claims are subject to$500,000 and a 1.5% royalty on the net sales of minerals extracted to a total of $1,000,000 with no monthly minimum. The payments are due once exploitation begins. At January 31, 2012$1,000,000.
In addition, the Company paid $40,000 in acquisition costs for the Pibe claims.
Other Property Costs
At January 31, 2012 and January 31, 2011, the Company had spent or accrued a total of $1,925 and $5,209 for otherabandoned several generative claims.
As at January 31, 2012, the Company did not capitalize any Chilean value added tax (“IVA”) as part of unproved mineral claims. $98,200 of IVA is included in mineral exploration costs. As at January 31, 2011, the Company capitalized $33,780 in IVA as part of the unproved mineral claims. The Company wrote off the capitalized IVA during the year due to uncertainty of recoverability. This VAT is recoverable from future VAT payable.
Abandoned claims
During the year ended January 31, 2012, the Company abandoned mineral claims with a paid cost of $15,470$1,926 as it decided not to pursue exploration of the claims. During the year ended January 31, 2011, the Company did not abandon any mineral claims.
NOTE 5 – COMMON STOCK
On April 12, 2012, the Company issued 267,335 units at a price of $0.45 per unit for cash of $120,301. Each unit consists of one common share and one share purchase warrant. Each share purchase warrant is exercisable at $0.65 for two years. A value of $nil was attributed to these warrants.
On March 5, 2012, warrants to purchase 400,000 shares of common stock were exercised at $0.30 per share. The Company received $120,000 for this exercise.
On February 7, 2012, warrants to purchase 100,000 shares of common stock were exercised at $0.30 per share. The Company received $30,000 for this exercise.
On April 7, 2011, the Company issued 6,723,333 units at a price of $0.30 per unit for a total of $2,017,000. Each unit consists of one share of common stock and one common share purchase warrant. The warrants have an exercise price of $0.50 per share and are exercisable for a period of two years. The warrants contain a call provision which allows the Company to call the warrants upon the occurrence of certain conditions. The net proceeds to the Company from the offering were $1,862,462 after legal fees of $95,638 and agent commissions of $58,900. The net proceeds included cash proceeds of $1,828,100 and converted loans in the amount of $130,000. Also, 196,333 common share purchase warrants were issued to agents in connection with this financing. A fair value of $73,263 was assigned to these warrants calculated using the Black-Scholes option pricingprice model using the following assumptions:
| | | April 7, 2011 | |
| | | |
| Risk-free interest rate | | | 0.81 | % |
| Expected life of options (years) | | | 2 years | |
| Expected annualized volatility | | | 246 | % |
| Expected dividend rate | | | - | % |
During the year ended January 31, 2012, the Company issued 250,000 shares of common stock with the exercise of 250,000 warrants for cash proceeds of $24,999.
As part of the warrants exercised above, a $50,000 loan was converted into 166,667 shares.
On April 20, 2010, the Company engaged in a private offering of units pursuant to which it issued 100,000 units at $0.25 per unit for cash of $25,000. Each unit consists of one common share and one share purchase warrant. Each share purchase warrant is exercisable at $0.30 for two years.
On April 14, 2010, the Company engaged in a private offering of units pursuant to which it issued 40,000 units at $0.25 per unit for cash of $10,000. Each unit consisted of one common share and one share purchase warrant. Each share purchase warrant is exercisable at $0.30 for two years.
On March 29, 2010, the Company engaged in a private offering of units pursuant to which it issued 200,000 units at $0.25 per unit for cash of $50,000. Each unit consisted of one common share and one share purchase warrant. Each share purchase warrant is exercisable at $0.30 for two years.
On March 23, 2010, the Company engaged in a private offering of units pursuant to which it issued 200,000 units at $0.25 per unit for cash of $50,000. Each unit consisted of one common share and one share purchase warrant. Each share purchase warrant is exercisable at $0.30 for two years.
Warrants
| | | January 31, 2012 | | | January 31, 2011 | | |
| Warrants, beginning | | | 790,000 | | | | 607,147 | | |
| Warrants | | | January 31, 2013 | | | January 31, 2012 | |
| Balance, January 31, 2012 | | | | 7,459,666 | | | | 790,000 | |
| Granted | | | 6,919,666 | | | | 540,000 | | | | 267,335 | | | | 6,919,666 | |
| Exercised | | | (250,000 | ) | | | - | | | | (500,000 | ) | | | (250,000 | ) |
| Expired | | | - | | | | (357,147 | ) | | | (40,000 | ) | | | - | |
| Warrants, ending | | | 7,459,666 | | | | 790,000 | | |
| Balance, January 31, 2013 | | | | 7,187,001 | | | | 7,459,666 | |
The weighted average life and weighted average exercise price of the warrants at January 31, 20122013, is 1.110.22 years and $0.49,$0.51, respectively.
Options
There were no options issued during the year ended January 31, 2013.
On September 2, 2011, the Company adopted the Red Metal Resources Ltd. 2011 Equity Incentive Plan (the “Plan”) and reserved 1,600,000 shares of the Company’s common stock for awards under the Plan. The Plan will terminate 10 years from the date of adoption. On September 2, 2011, the Company’s board of directors granted 1,040,000 options to purchase the Company’s common stock to certain officers, directors, and consultants, including 230,000 options granted to each of the Company’s Chief Executive Officer, Chief Financial Officer, and Vice President of Exploration. The options are exercisable at $0.50 for a term of two years and vest upon grant.
The Company recorded $527,318 as employee stock-based expense, which was calculated using the following assumptions under the Black-Scholes option-pricing model:
| | | September 2, 2011 | |
| | | |
| Risk-free interest rate | | | 0.20 | % |
| Expected life of options (years) | | | 2 years | |
| Expected annualized volatility | | | 246 | % |
| Expected dividend rate | | | - | % |
The weighted average life and weighted average exercise price of the warrants1,040,000 options outstanding at January 31, 20122013, is 1.840.58 years and $0.50, respectively.respectively
NOTE 6 – INCOME TAXES
The provision for income taxes differs from the amount that would have resulted in applying the combined federal statutory tax rate as follows:
| | | January 31, 2012 | | | January 31, 2011 | | | January 31, 2013 | | | January 31, 2012 | |
| Loss before discontinued operations and non-controlling interest | | $ | (2,928,189 | ) | | $ | (672,618 | ) | | $ | (1,100,422 | ) | | $ | (2,928,189 | ) |
| Statutory income tax rate | | | 34 | % | | | 34 | % | | | 34 | % | | | 34 | % |
| Expected in tax recovery at statutory income tax rates | | | (995,584 | ) | | | (228,690 | ) | | $ | (374,143 | ) | | $ | (995,584 | ) |
| Non-deductible expenses | | | 196,535 | | | | (32,530 | ) | | | 157,142 | | | | 196,535 | |
| Difference in foreign tax rates | | | 253,546 | | | | 44,099 | | | | 19,433 | | | | 253,546 | |
| Change in valuation allowance | | | 545,503 | | | | 217,121 | | | | 197,568 | | | | 545,503 | |
| Income tax recovery | | $ | - | | | $ | - | | | $ | - | | | $ | - | |
Temporary differences that give rise to the following deferred income tax assets and liabilities at are:
| | | January 31, 2012 | | | January 31, 2011 | | | January 31, 2013 | | | January 31, 2012 | |
| Deferred income tax assets | | | | | | | | | | | | |
| Federal loss carryforwards | | $ | 824,272 | | | $ | 532,315 | | | $ | 1,002,407 | | | $ | 824,272 | |
| Foreign loss carryforwards | | | 471,928 | | | | 221,012 | | | | 477,224 | | | | 471,928 | |
| Mineral properties | | | 40,997 | | | | 38,366 | | | | 55,134 | | | | 40,997 | |
| | | | 1,337,197 | | | | 791,693 | | | | 1,534,765 | | | | 1,337,197 | |
| Valuation allowance | | | (1,337,197 | ) | | | (791,693 | ) | | | (1,534,765 | ) | | | (1,337,197 | ) |
| | | $ | - | | | $ | - | | | $ | - | | | $ | - | |
The Company has $2,424,329$2,948,256 of United States federal net operating loss carry forwards that may be offset against future taxable income. These losses expire as follows:
| 2026 | | $ | 1,188 | | | $ | 1,188 | |
| 2027 | | | 14,932 | | | | 14,932 | |
| 2028 | | | 231,644 | | | | 231,644 | |
| 2029 | | | 430,210 | | | | 430,210 | |
| 2030 | | | 378,766 | | | | 378,766 | |
| 2031 | | | 508,891 | | | | 508,891 | |
| 2032 | | | 858,698 | | | | 858,698 | |
| 2033 | | | | 523,927 | |
| | | $ | 2,424,329 | | | $ | 2,948,256 | |
The Company also has $2,821,624$3,314,282 of Chilean tax losses. The Chilean tax losses can be carried forward indefinitely.
NOTE 7 – CHILEAN VALUE ADDED TAX / IMPUESTO AL VALOR AGREGADO ("IVA")
During the year ended January 31, 2013, the Company recorded $4,640 (2011 - $131,980) in Chilean Value Added Tax, which was included in operating costs. This IVA is recoverable from future IVA payable. During the years ended January 31, 2013 and January 31, 2012, the Company received $0 in IVA tax recovered.
NOTE 78 – SUBSEQUENT EVENTS
SubsequentOn February 11, 2013, the Company entered into a Memorandum of Understanding whereby a third party intends to year end, 500,000 warrants were exercised at $0.30 for proceedsacquire 100% of $150,000.the Company’s interest in the Perth claims through the execution of a mining option purchase agreement. The third party has 60 days from February 11, 2013 to conduct its due diligence on the Perth Property. On April 5, 2013, the Company extended the Due Diligence period until May 11, 2013. The option agreement has a term of 48 months with semi-annual payments totaling $1,000,000 and accumulated expenditures to be incurred totalling $3,500,000. The claims are subject to a 1.5% royalty on the sales of minerals extracted.
Subsequent to January 31, 2013, the Company repriced 6,919,666 warrants from $0.50 to $0.10 and extended the expiration date from April 7, 2013 to April 7, 2014.
Not applicable.
Report on Controls and Procedures
We carried out an evaluation, under the supervision and with the participation of our management, including our chief executive officer and our chief financial officer, of the effectiveness of the design and operation of our disclosure controls and procedures as of the end of the period covered by this report. The evaluation was undertaken in consultation with our accounting personnel. Based on that evaluation, our chief executive officer and our chief financial officer concluded that our disclosure controls and procedures are effective to ensure that information required to be disclosed by us in the reports that we file or submit under the Securities Exchange Act of 1934 is recorded, processed, summarized and reported within the time periods specified in the Securities and Exchange Commission’s rules and forms.
Report on Internal Control over Financial Reporting
Our chief executive officer and our chief financial officer are responsible for establishing and maintaining internal control over financial reporting. Internal control over financial reporting is defined in Rule 13a-15(f) and 15d-15(f) promulgated under the Securities Exchange Act of 1934 as a process designed by, or under the supervision of, our principal executive and principal financial officers and effected by our board of directors, management and other personnel, to provide reasonable assurance regarding the reliability of financial reporting and the preparation of financial statements for external purposes in accordance with generally accepted accounting principles and includes those policies and procedures that:
| | · | pertain to the maintenance of records that in reasonable detail accurately and fairly reflect the transactions and dispositions of our assets; |
| | · | provide reasonable assurance that transactions are recorded as necessary to permit preparation of financial statements in accordance with generally accepted accounting principles, and that our receipts and expenditures are being made only in accordance with authorizations of management and our directors; and |
| | · | provide reasonable assurance regarding prevention or timely detection of unauthorized acquisition, use or disposition of our assets that could have a material effect on the financial statements. |
Because of its inherent limitations, our internal control over financial reporting may not prevent or detect misstatements. Therefore, even those systems determined to be effective can provide only reasonable assurance with respect to financial statement preparation and presentation. Projections of any evaluation of effectiveness to future periods are subject to the risk that controls may become inadequate because of changes in conditions, or that the degree of compliance with the policies or procedures may deteriorate.
Our chief executive officer and our chief financial officer assessed the effectiveness of our internal control over financial reporting as of January 31, 2012.2013. In making this assessment, management used the criteria set forth by the Committee of Sponsoring Organizations of the Treadway Commission (COSO) in Internal Control—Integrated Framework
Based on our assessment, our chief executive officer and our chief financial officer determined that, as of January 31, 2012,2013, our internal control over financial reporting is effective.
Changes in Internal Control over Financial Reporting
There have been no changes in our internal control over financial reporting (as such term is defined in Rules 13a-15(f) and 15d-15 (f) under the Exchange Act) during the fourth quarter of the last fiscal year that have materially affected, or are reasonably likely to materially affect, our internal control over financial reporting.
Not applicable.
Table 2119 contains certain information regarding our directors, executive officers and key personnel. There is a family relationship between Caitlin Jeffs and Michael Thompson. Directors serve for one year and until their successors are duly elected and qualified. In Chile, Polymet has one legal representative, which is similar to a director, and a manager, which is similar to a president.
Table 2119: Directors and officers
| Name | | Age | | Position |
| Caitlin Jeffs | 36 | | 37 | | Director, chief executive officer, president and secretary |
| Michael Thompson | 42 | | 43 | | Director and vice president of exploration |
| John Da Costa | 47 | Chief | 48 | | Director, chief financial officer and treasurer |
| Kevin Mitchell | 51 | | 52 | | Legal representative and manager of Polymet |
Caitlin Jeffs, P. Geo. Ms. Jeffs has been a director since October 2007 and our president, chief executive officer and secretary since April 21, 2008. She has more than seven years of experience as an exploration geologist. Ms. Jeffs graduated from the University of British Columbia in 2002 with an honors bachelor of science in geology. She is a professional geologist on the register of the Association of Professional Geoscientists of Ontario. She worked for Placer Dome (CLA) Ltd. in Canada from February 2003 until May 2006 where she worked as both a project geologist managing drill programs for the exploration department at Placer Dome’s Musselwhite Mine in Northwestern Ontario and then as part of the generative team evaluating potential projects in Northwestern Ontario. Placer Dome (since acquired by Barrick Gold Corp. and Gold Corp.) was a major mining company with operations in North America, Australia, Africa and South America. None of these companies is related to Red Metal. Ms. Jeffs was a self-employed consulting geologist from May 2006 to April 2007. She is one of the founders and the general manager of Fladgate Exploration Consulting Corporation, a firm of consulting geologists in Ontario, Canada, which provides its services to Red Metal. Since July 2012, Ms. Jeffs has been a director of Kesselrun Resources Ltd., a resource exploration company listed on the TSX Venture Exchange and focused on gold exploration in Ontario, Canada. She was a director of Trilogy Metals Inc., a resource exploration company listed on the TSX Venture Exchange, from July 2006 to May 2007. She lives with Michael Thompson as a family.
Michael Thompson, P. Geo. Mr. Thompson has been a director since October 2007 and our vice-president of exploration since April 2008. He has more than ten years of experience as an exploration geologist. Mr. Thompson graduated from the University of Toronto in 1997 with an honors bachelor of science in geology. He is a professional geologist on the register of the Association of Professional Geoscientists of Ontario. He worked in Canada for Teck Resources Ltd. from 1999 until 2002 as a project geologist managing exploration projects in Northwestern Ontario. From January 2003 until May 2006 he worked for Placer Dome (CLA) Ltd. as both a project geologist managing drill programs for the exploration department at Placer Dome’s Musselwhite Mine in Northwestern Ontario and then as part of the generative team evaluating potential projects in Northwestern Ontario. Teck Resources and Placer Dome (since acquired by Barrick Gold Corp. and Gold Corp.) are major mining companies with operations in North America, Australia, Africa and South America. None of these former employers is related to Red Metal. Mr. Thompson was a self-employed consulting geologist from May 2006 to April 2007. He is a founderone of the founders and the president of Fladgate Exploration Consulting Corporation, a firm of consulting geologists in Ontario, Canada, which provides its services to Red Metal. Since July 2012 Mr. Thompson has been President, CEO and a director of Kesselrun Resources Ltd., a resource exploration company listed on the TSX Venture Exchange and focused on gold exploration in Ontario, Canada Since October 2011 Mr. Thompson is a director of Fairmont Resources Inc., a resource exploration company listed on the TSX Venture Exchange. He lives with Caitlin Jeffs as a family.
We believe that the extensive education and experience that Ms. Jeffs and Mr. Thompson have as geologists make them uniquely qualified to serve as directors of our company. Their knowledge of mining and geology provides them with the tools necessary to set goals for our business and to determine how those goals can be achieved.
John Dada Costa. Mr. Dada Costa has been a director since May 2012 and our chief financial officer and treasurer since May 13, 2008. Mr. Dada Costa has more than twenty years of experience providing bookkeeping and accounting services for both private and public companies and is the founder and president of Da Costa Management Corp., a company that has provided management and accounting services to public and private companies since August 2003. Red Metal is a client of Da Costa Management Corp. Currently, Mr. Dada Costa is also a director and the chief executivefinancial officer (since February 2006) and secretary of Poly Shield Technologies Inc., a publicly traded U.S. company, engaged in marketing of cost effective, energy efficient and durability solutions, and a director and the chief financial officer and secretary (since May 2002) of GlobeTrac Inc.Kesselrun Resources Ltd., a public US company.Canadian reporting company listed on the TSX Venture Exchange . Mr. Dada Costa holdholds a number of executive positions in the following companies: the treasurer of Rock City Energy Corp., a non-reporting public company, a position he has hold sinceheld from August 2006 until December 2011; and a director (from March 2004 – to July 2007) and chief executive officer and president (from July 2006 – to July 2007) and; the chief financial officer (from April 2005 – to July 2007) of Trilogy Metals Inc. a resource exploration company listed on the TSX Venture Exchange. GlobeTrac sold, marketed, distributedExchange; and installed global wireless trackingfrom October 2010 to May 2011, Mr. da Costa served as a director of Live Current Media Inc., a company that operated a number of e-commerce websites that was previously reporting under the Exchange Act. Mr. da Costa’s experience in accounting and telematics equipment in Europe until November 2004 when it wound down its operations. GlobeTrac’s only business now is receivingas a director, chief financial officer and accounting for royalties and commissions receivable from the suppliersecretary of the telematics equipment. GlobeTrac’s business objective isa publicly traded U.S. company led us to locate and completeconclude that he should be a merger with or acquire a viable business.director.
Biographical information: Significant employee
Kevin Mitchell. Mr. Mitchell has been the legal representative and manager of Minera Polymet Limitada since it was formed in August 2007. He is a Canadian who has lived in Chile for more than twenty years. He has owned and operated a heavy equipment company for all of that time, mainly servicing the mining industry. Since February 2007 he has been the legal representative and manager of Minera Farellon Limitada, a Chilean company that investigates potential projects, conducts due diligence reviews, and provides logistical support.
During the past ten years none of our directors or executive officers was involved in any legal proceedings described in subparagraph (f) of Item 401 of Regulation S-K.
Directors’ compensation
Director’s compensation is described below in the Executive Compensation section.
Section 16(a) Beneficial Ownership Reporting Compliance
Section 16(a) of the Securities Exchange Act of 1934, as amended, and the rules thereunder require our officers and directors, and persons who own more than 10% of our common stock, to file reports of ownership and changes in ownership with the Securities and Exchange Commission and to furnish us with copies. To our knowledge, based solely upon review of the copies of such reports received or written representations from the reporting persons, we believe that during the period covered by this annual report, our directors, executive officers and persons who own more than 10% of our common stock complied with all Section 16(a) filing requirements with the exception of SusanCaitlin Jeffs, a holder of more than 10% of our common stock, who filed awas late in filing two Form 4 on January 18, 20124s reporting the exercise of a warrant to purchase 200,000 shares of common stock that occurred on October 25, 2011.two transactions.
Code of Ethics
We have adopted a code of ethics that applies to our principal executive officer, principal financial officer, principal accounting officer or controller, or persons performing similar functions. Our code of ethics will be provided to any person without charge, upon request. Requests should be in writing and addressed to Caitlin Jeffs, c/o Red Metal Resources Ltd., 195 Park Avenue, Thunder Bay, Ontario P7B 1B9.
Corporate Governance
Our board of directors does not have an audit committee, a compensation committee or a nominating committee. We believe this is appropriate given the small size of our company and the stage of our development.
We have not adopted any procedures by which our security holders may recommend nominees to our board of directors and that has not changed during the last fiscal year.
None of the members of our board of directorsOur chief financial officer and director qualifies as an “audit committee financial expert”, as defined by Item 407 of Regulation S-K promulgated under the Securities Act of 1933 and the Securities Exchange Act of 1934. Our chief financial officer has the attributes of an audit committee financial expert. We believe that Mr. Dada Costa’s experience in preparing, analyzing and evaluating financial statements, as well as his knowledge of public company reporting, will provide us with the guidance we need until we are able to expand our board to include independent directors who have the knowledge and experience to serve on an audit committee.
Table 2220 summarizes all compensation for the 20122013 and 20112012 fiscal years received by our chief executive officer, our two most highly compensated executive officers who earned more than $100,000 and up to two additional individuals for whom disclosure would have been provided but for the fact that the individual was not serving as an executive officer at the end of the last completed fiscal year (collectively, the “Named Executive Officers”).
| Table 22: Summary Compensation Table |
| | Year | Salary ($) | Bonus ($) | Stock Awards ($) | Option Awards ($) | Non-Equity Incentive Plan Compen-sation ($) | Nonquali-fied Deferred Compen-sation Earnings ($) | All Other Compen-sation ($) | Total ($) |
| | | | | | | | | | |
| Caitlin Jeffs, chief executive officer, president and secretary | 2012 2011 | -- -- | -- -- | -- -- | 116,618a -- | -- -- | -- -- | -- -- | 116,618 -- |
| | | | | | | | | | |
| Michael Thompson, vice president | 2012 | -- | -- | -- | 116,618 a | -- | -- | -- | 116,618 |
| | 2011 | -- | -- | -- | -- | -- | -- | -- | -- |
| | | | | | | | | | |
| Joao Da Costa, chief financial officer | 2012 2011 | -- -- | -- -- | -- -- | 116,618 a -- | -- -- | -- -- | -- -- | 116,618 -- |
| Table 20: Summary Compensation Table | |
| | Year | | Salary ($) | | | Bonus ($) | | | Stock Awards ($) | | | Option Awards ($) | | | Non-Equity Incentive Plan Compensation ($) | | | Non-Qualified Deferred Compensation Earnings ($) | | | All Other Compen-sation ($) | | | Total ($) | |
| | | | | | | | | | | | | | | | | | | | | | | | | | |
Caitlin Jeffs, chief executive officer, president | 2013 | | | -- | | | | -- | | | | -- | | | | - | | | | -- | | | | -- | | | | -- | | | | -- | |
| and secretary | 2012 | | | -- | | | | -- | | | | -- | | | | 116,618 | a | | | -- | | | | -- | | | | -- | | | | 116,618 | |
| | | | | | | | | | | | | | | | | | | | | | | | | | | | | | | | | | |
Michael Thompson, vice president | 2013 | | | -- | | | | -- | | | | -- | | | | - | | | | -- | | | | -- | | | | -- | | | | -- | |
| | 2012 | | | -- | | | | -- | | | | -- | | | | 116,618 | a | | | -- | | | | -- | | | | -- | | | | 116,618 | |
| | | | | | | | | | | | | | | | | | | | | | | | | | | | | | | | | | |
| John da Costa, chief | 2013 | | | -- | | | | -- | | | | -- | | | | - | | | | -- | | | | -- | | | | -- | | | | -- | |
| financial officer | 2012 | | | -- | | | | -- | | | | -- | | | | 116,618 | a | | | -- | | | | -- | | | | -- | | | | 116,618 | |
a For information on the assumptions used to compute this amount, see Note 5 to our audited financial statements for the fiscal year ended January 31, 2012.
Equity Awards
On September 2, 2011 we adopted Red Metal Resources 2011 Equity Incentive Plan. The purpose of the Plan is to benefit the company by enabling us to attract, retain and motivate officers, directors, employees and consultants by providing them with the opportunity, through grants of options to purchase our common stock, to acquire an increased proprietary interest in the company. Table 2321 provides information regarding the outstanding equity awards held by our executive officers as of January 31, 2012.2013.
Table 23:21: Equity Awards at Fiscal Year End
| Name | Number of securities underlying unexercised options (exercisable) | Number of securities underlying unexercised options (unexercisable) | Equity Incentive Plan Awards: Number of securities underlying unexercised unearned options | Option exercise price | Option expiration date | | Number of securities underlying unexercised options (exercisable) | | | Number of securities underlying unexercised options (unexercisable) | | | Equity Incentive Plan Awards: Number of securities underlying unexercised unearned options | | | Option exercise price | | Option expiration date |
| | | | | | | | | | | | | | | |
| Caitlin Jeffs | 230,000 | 0 | $0.50 | September 2, 2013 | | | 230,000 | | | | -- | | | | -- | | | $ | 0.50 | | September 2, 2013 |
| Michael Thompson | 230,000 | 0 | $0.50 | September 2, 2013 | | | 230,000 | | | | -- | | | | -- | | | $ | 0.50 | | September 2, 2013 |
| Joao Da Costa | 230,000 | 0 | $0.50 | September 2, 2013 | | | 230,000 | | | | -- | | | | -- | | | $ | 0.50 | | September 2, 2013 |
We have no plans that provide for the payment of retirement benefits, or benefits that will be paid primarily following retirement, including but not limited to tax-qualified defined benefit plans, supplemental executive retirement plans, tax-qualified defined contribution plans and nonqualified defined contribution plans.
We have no contracts, agreements, plans or arrangements, written or unwritten, that provide for payment to a Named Executive Officer at, following, or in connection with the resignation, retirement or other termination of a Named Executive Officer, or a change in control of our company or a change in the Named Executive Officer's responsibilities following a change in control. We have no employment agreements with our Named Executive Officers.
In the past we have not paid compensation to our Named Executive Officers, although we have paid and continue to pay fees to entities controlled by our Named Executive Officers for services rendered to us. See Item 13, “Certain Relationships and Related Transactions, and Director Independence”. During the fiscal year ended January 31, 2012, we determined to grant options to purchase our common stock to our Named Executive Officers as compensation for the services they render to us in our day-to-day operations. Grants of options allow us to conserve cash at the same time as they increase the proprietary interest of our Named Executive Officers in the company, thereby aligning their interests with those of our stockholders. In the future, we may pay cash compensation to our Named Executive Officers and we may pay bonuses of cash or securities as a way of rewarding exceptional performance. We did not pay bonuses during the fiscal year ended January 31, 2012.2013.
We do not have a compensation committee. Both Caitlin Jeffs, and Michael Thompson whoand John da Costa, all of whom are executive officers as well as directors, participated in deliberations of the board of directors concerning executive officer compensation.
Director Compensation
We have not paid compensation to our directors.
Table 2422 presents, as of March 13, 2012,April 1, 2013, information regarding the beneficial ownership of our common stock with respect to each of our executive officers, each of our directors, each person known by us to own beneficially more than 5% of the common stock, and all of our directors and executive officers as a group. Beneficial ownership is determined under the rules of the Securities and Exchange Commission and generally includes voting or investment power over securities. Each individual or entity named has sole investment and voting power with respect to the shares of common stock indicated as beneficially owned by them, subject to community property laws, where applicable, except where otherwise noted.
Shares of common stock subject to options or warrants that are currently exercisable or exercisable within 60 days from March 13, 2012April 1, 2013, are considered outstanding and beneficially owned by the person holding the options or warrants for the purpose of computing the percentage ownership of that person but are not treated as outstanding for the purpose of computing the percentage ownership of any other person.
| Table 24: Security ownership | |
| Table 22: Security ownership | | Table 22: Security ownership | |
| Class of security | Name and address of beneficial owner | Number of shares beneficially owned | Percentage of common stock | Name and address of beneficial owner | | Number of shares beneficially owned | | | Percentage of common stock | |
| Common stock | Caitlin Jeffsa | 2,005,242 b | 11.46 | Caitlin Jeffsa | | | 2,010,242 | b | | | 11.00 | |
| Common stock | Michael Thompsona | 399,524 c | 2.28 | Michael Thompsona | | | 399,524 | c | | | 2.19 | |
| Common stock | Fladgate Exploration Consulting Corp.d | 830,087 | 4.83 | Fladgate Exploration Consulting Corp.d | | | 330,087 | | | | 1.84 | |
| Common stock | John Da Costae | 1,240,358f | 7.01 | John da Costae | | | 1,240,358 | f | | | 6.72 | |
| | All officers and directors as a group | 4,475,211 | 25.58 | All officers and directors as a group | | | 3,980,211 | | | | 21.75 | |
| | | | | | | | | | | | | |
| Common stock | Richard N. Jeffsg,h | 4,472,119 i | 24.81 | Richard N. Jeffsg,h | | | 4,472,119 | i | | | 23.80 | |
| Common stock | Susan Jeffsg,h | 2,246,670j | 12.47 | Susan Jeffsg,h | | | 2,246,670 | j | | | 11.96 | |
| Common stock | Robert Andjelick,h | 5,000,000 l | 25.39 | Robert Andjelick,h | | | 5,000,000 | l | | | 24.44 | |
aThe address for Caitlin Jeffs and Michael Thompson is 195 Park Avenue, Thunder Bay, Ontario P7B 1B9. bThis sum includes warrants exercisable for 83,333 shares and options to purchase 230,000 shares. cThis sum includes warrants exercisable for 83,333 shares and options to purchase 230,000 shares. dFladgate Exploration Consulting Corporation is controlled by Caitlin Jeffs and Michael Thompson. eThe address for John Da Costa is 610-1100 Melville Street, Vancouver, British Columbia V6E 4A6. fThis sum includes 296,667 shares held by DaCosta Management Corp., a company owned by John Da Costa, warrants exercisable for 266,667 shares and options to purchase 230,000 shares. gThe address for Richard N. Jeffs and Susan Jeffs is 49 Pont Street, London, United Kingdom SW1X 0BD. h5% shareholder. iThis sum includes warrants exercisable for 833,334 shares. jThis sum includes warrants exercisable for 833,333 shares. kThe address for Robert Andjelic is PO Box 69, Millarville, AB T0L 1K0. lThis sum includes warrants exercisable for 2,500,000 shares. | |
aThe address for Caitlin Jeffs and Michael Thompson is 195 Park Avenue, Thunder Bay, ON, Canada P7B 1B9.
bThis sum includes warrants exercisable for 83,333 shares and options to purchase 230,000 shares.
cThis sum includes warrants exercisable for 83,333 shares and options to purchase 230,000 shares.
dFladgate Exploration Consulting Corporation is controlled by Caitlin Jeffs and Michael Thompson.
eThe address for John da Costa is 810-789 West Pender Street, Vancouver, BC, Canada V6C 1H2.
fThis sum includes 296,667 shares held by DaCosta Management Corp., a company owned by John Da Costa, warrants exercisable for 266,667 shares and options to purchase 230,000 shares.
gThe address for Richard N. Jeffs and Susan Jeffs is 49 Pont Street, London, United Kingdom SW1X 0BD.
h5% shareholder.
iThis sum includes warrants exercisable for 833,334 shares.
jThis sum includes warrants exercisable for 833,333 shares.
kThe address for Robert Andjelic is PO Box 69, Millarville, AB, Canada T0L 1K0.
lThis sum includes warrants exercisable for 2,500,000 shares.
Director independence
Using the definition of “independent” in Section 803Rule 5605 of the Rules of the NYSE Amex,The Nasdaq Stock Market, we have determined that none of our directors is independent.
Transactions with related persons
Since February 1, 2010,2011, the directors, executive officers, or holders of more than 5% of our common stock, or members of their immediate families, as described below, have completed transactions with us in which they had direct or indirect material interests that exceeded the lesser of $120,000 or 1% of the average of our total assets at year end for the last two completed fiscal years.
Amounts due to related parties
Table 2523 describes amounts due to related parties that were incurred during the fiscal years ended January 31, 20112012 and January 31, 2012,2013, and through February 29, 2012.
March 31, 2013.
Table 25:23: Due to related parties
| | | Period ended | | | Fiscal years ended January 31, | |
| | | | | | | |
| | | February 29, 2012 | | | 2012 | | | 2011 | |
Due to Da Costa Management Corp.a | | $ | 208,237 | | | $ | 190,608 | | | $ | 228,330 | |
Due to Fladgate Exploration Consulting Corporationb | | $ | 703,404 | | | $ | 658,950 | | | $ | 207,742 | |
Due to Minera Farellon Limitadac | | $ | 55,648 | | | $ | 51,957 | | | $ | 63,692 | |
Due to Kevin Mitchelld | | $ | 4,127 | | | $ | 4,047 | | | $ | 10,347 | |
a During the period from February 1, 2012 to February 29, 2012 we paid or accrued a total of $25,409 in consulting and other business expenses paid on our behalf to Da Costa Management Corp. During the years ended January 31, 2012 and 2011, we paid or accrued a total of $298,797 and $181,384, respectively in consulting and other business expenses paid on our behalf to Da Costa Management Corp.
b During the period from February 1, 2012 to February 29, 2012 we paid or accrued a total of $38,509 in administration, mineral exploration, and investor relations services as well as other business expenses paid on our behalf to Fladgate Exploration Consulting Corporation, a company controlled by our directors. During the year ended January 31, 2012, we paid or accrued a total of $667,796 in advertising and promotion, mineral exploration and associated travel, and other business expenses to the same company. During the year ended January 31, 2011, we paid or accrued a total of $142,547 in advertising and promotion, mineral exploration and associated travel, and other business expenses to the same company.
c During the period from February 1, 2012 to February 29, 2012 we paid or accrued a total of $2,279 in administration, automobile and rental expenses to Minera Farellon Limitada, a company owned by Kevin Mitchell, and Richard Jeffs, the father of our president. During the years ended January 31, 2012 and 2011, we paid or accrued a total of $48,990 and $63,208 in administration, automobile, rental, and other business expenses to the same company.
d During the period from February 1, 2012 to February 29, 2012 we paid or accrued a total of $2,296 in administration expense to Kevin Mitchell, an officer of Chilean subsidiary. During the years ended January 31, 2012 and 2011, we paid or accrued $47,315 and $26,221, respectively, in administration expenses to the same officer.
|
| | | Period ended | | | Fiscal years ended January 31, | |
| | | March 31, 2013 | | | 2013 | | | 2012 | |
Due to Da Costa Management Corp.a | | $ | 269,097 | | | $ | 269,097 | | | $ | 190,608 | |
Due to Fladgate Exploration Consulting Corporationb | | $ | 897,987 | | | $ | 894,377 | | | $ | 658,950 | |
Due to Minera Farellon Limitadac | | $ | 130,645 | | | $ | 94,558 | | | $ | 51,957 | |
| Due to Richard Jeffs | | $ | 50,920 | | | $ | 50,920 | | | $ | - | |
a During the period from February 1, 2013 to March 31, 2013 we recorded a total of $20,000 in consulting fees donated by Da Costa Management Corp. During the years ended January 31, 2013 and 2012, we paid or accrued a total of $188,118 and $288,430, respectively in consulting fees to Da Costa Management Corp. In addition to direct consulting fees we also reimbursed Da Costa Management Corp. for certain business related expenses they paid on our behalf.
b During the period from February 1, 2013 to March 31, 2013 we did not incur mineral exploration services with Fladgate Exploration Consulting Corporation, a company controlled by our directors. During the year ended January 31, 2013 and January 31, 2012, we paid or accrued a total of $196,203 and $484,614 in mineral exploration and administrative services to the same company. In addition to direct consulting fees we also reimbursed Fladgate Exploration Consulting Corporation for certain business related expenses they paid on our behalf.
c During the period from February 1, 2013 to March 31, 2013 we paid or accrued a total of $2,000 rental expenses to Minera Farellon Limitada, a company owned by Kevin Mitchell, and Richard Jeffs. During the years ended January 31, 2013 and 2012, we paid or accrued a total of $13,579 and $19,780 for administration and rental expenses to Minera Farellon Limitada.
Notes payable to related party
Table 2624 describes the promissory notes payable to related parties including accrued interest as at January 31, 2013 and 2012, and 2011, and through February 29, 2012March 31, 2013.
Table 2624: Notes payable to related parties
| | | | | | Fiscal years ended January 31, | |
| | | 31, 2013 | | | 2013 | | | 2012 | |
| | | | | | | | | | |
Note payable to the company owned by Richard Jeffs a | | $ | - | | | $ | - | | | $ | 56,164 | |
Note payable to Richard Jeffs a | | $ | 120,338 | | | $ | 118,797 | | | $ | 53,115 | |
Note payable to Fladgate Exploration Consulting Corporation b | | $ | 69,334 | | | $ | 69,589 | | | $ | 63,910 | |
Notes payable to Caitlin Jeffs b | | $ | 156,278 | | | $ | 136,532 | | | $ | 55,129 | |
Notes payable to John da Costac | | $ | 9,329 | | | $ | 9,210 | | | $ | 8,502 | |
| Total notes payable to related parties | | $ | 355,279 | | | $ | 334,128 | | | $ | 236,820 | |
| | | | | | Fiscal years ended January 31, | |
| | | Period ended February 29, 2012 | | | 2012 | | | 2011 | |
| | | | | | | | | | |
Note payable to the company owned by Richard Jeffs a | | $ | 56,432 | | | $ | 56,164 | | | $ | 52,902 | |
Note payable to Richard Jeffs a | | $ | 53,452 | | | $ | 53,115 | | | $ | – | |
Note payable to Fladgate Exploration Consulting Corporation b | | $ | 64,728 | | | $ | 63,910 | | | $ | – | |
Notes payable to Caitlin Jeffs b | | $ | 55,835 | | | $ | 55,129 | | | $ | 60,746 | |
Notes payable to John da Costac | | $ | 8,556 | | | $ | 8,502 | | | $ | – | |
| | | | | | | | | | | | | |
| Total notes payable to related parties | | $ | 239,003 | | | $ | 236,820 | | | $ | 113,648 | |
a Principle amount of the note payable to the company owned by Richard Jeffs was s $50,000; it was re-paid during the year ended January 31, 2012. Principle amount of the notes payable to Richard Jeffs is $108,000; these notes are payable on demand, unsecured and bear interest at 8% per annum compounded monthly. Interest of $12,338 had accrued as at March 31, 2013. The largest aggregate amount of principal outstanding to Richard Jeffs and the company owned by him during the period for which disclosure is provided was $108,000.
ab The principle amounts of the notes payable to Caitlin Jeffs are $146,914; they are payable on demand, unsecured and bear interest at 8% per annum compounded monthly. Interest of $9,364 had accrued as at March 31, 2013. Principle amount of the note payable to Fladgate Exploration Consulting Corporation is $61,364; it is payable on demand, unsecured and bears interest at 8% per annum compounded monthly. Interest of $7,970 had accrued as at March 31, 2013. The largest aggregate amount of principal outstanding to Caitlin Jeffs and Fladgate Exploration Consulting Corporation during the period for which disclosure is provided was approximately $208,278. c The principle amount of the note payable to John da Costa is $8,500 US, it is payable on demand, unsecured and bears interest at 8% per annum compounded monthly. Interest of $829 had accrued as at March 31, 2013. The largest amount of principal outstanding to John da Costa during the period for which disclosure is provided was $8,500. Principle amount of the note payable to the company owned by Richard Jeffs is $50,000; it is payable on demand, unsecured and bears interest at 6% per annum compounded monthly. Interest of $6,432 had accrued as at February 29, 2012. Principle amount of the notes payable to Richard Jeffs is $51,000; these notes are payable on demand, unsecured and bear interest at 8% per annum compounded monthly. Interest of $3,452 had accrued as at February 29, 2012. The largest aggregate amount of principal outstanding to Richard Jeffs and the company owned by him during the period for which disclosure is provided was $101,000. b The principle amounts of the notes payable to Caitlin Jeffs are $55,000 Cdn, they are payable on demand, unsecured and bear interest at 8% per annum compounded monthly. Interest of $768 had accrued as at February 29, 2012. Principle amount of the note payable to Fladgate Exploration Consulting Corporation is $62,389 Cdn; it is payable on demand, unsecured and bears interest at 8% per annum compounded monthly. Interest of $2,262 Cdn had accrued as at February 29, 2012. The largest aggregate amount of principal outstanding to Caitlin Jeffs during the period for which disclosure is provided was approximately $117,389 Cdn (approximately 117,530 US).
c The principle amount of the note payable to John da Costa is $8,500 US, it is payable on demand, unsecured and bears interest at 8% per annum compounded monthly. Interest of $56 had accrued as at February 29, 2012. The largest aggregate amount of principle outstanding to John da Costa during the period for which disclosure is provided was approximately $80,454 US.
|
Transactions with directors and officers
We have completed a number of transactions with our directors and officers:
On April 7, 2011, under the private equity financing, we issued 83,333 units at $0.30 per unit to Caitlin Jeffs and 83,333 units at $0.30 per unit to Michael Thompson. Each unit consists of one common share and one warrant entitling the holder to purchase one share of common stock for $0.50 per share. The warrants were due to expire on April 7, 2013.2013 but the term has been extended to April 7, 2014 and the exercise price has been reduced to $0.10 per share.
On April 7, 2011, under the private equity financing, we issued 266,667 units at $0.30 per unit to John da Costa. Each unit consists of one common share and one warrant entitling the holder to purchase one share of common stock for $0.50 per share. The warrants were due to expire on April 7, 2013.2013 but the term has been extended to April 7, 2014 and the exercise price has been reduced to $0.10 per share.
On September 2, 2011, under the Equity Incentive Plan we granted to John da Costa, Caitlin Jeffs and Michael Thompson 230,000 options each to purchase the Company’s common stock. The options are exercisable at $0.50 for a term of two years.
Transactions with other related parties
On April 12, 2011, we paid Minera Farellon Limitada 10,000,000 pesos (approximately $20,000) to acquire the Che mining claims. On August 12, 2011, we paid 4,741,000 pesos (approximately $10,000 US) to acquire an option to purchase the Veta Negra and Exon mining claims.
On April 7, 2011, under a private equity financing, we issued 2,500,000 units at $0.30 per unit to Robert Andjelic. Each unit consists of one common share and one warrant entitling the holder to purchase one share of common stock for $0.50 per share. The warrants were due to expire on April 7, 2013.2013 but the term has been extended to April 7, 2014 and the exercise price has been reduced to $0.10 per share. On the same date, we entered into the Board Observer Agreement with Mr. Andjelic. Subject to certain exceptions, Mr. Andjelic has the right to attend in a non-voting capacity any meeting of the board, to receive all notices of board meetings and other information distributed to the members of the board, and to receive copies of actions taken by written consent.
We have completed a number of transactions with relatives of our president:
On April 7, 2011, under the private equity financing, we issued 833,334 units at $0.30 per unit to Richard Jeffs. Each unit consists of one common share and one warrant entitling the holder to purchase one share of common stock for $0.50 per share. The warrants were due to expire on April 7, 2013.2013 but the term has been extended to April 7, 2014 and the exercise price has been reduced to $0.10 per share.
On April 7, 2011, under the private equity financing, we issued 833,333 units at $0.30 per unit to Susan Jeffs. Each unit consists of one common share and one warrant entitling the holder to purchase one share of common stock for $0.50 per share. The warrants were due to expire on April 7, 2013 but the term has been extended to April 7, 2014 and the exercise price has been reduced to $0.10 per share.
On October 25, 2011 Susan Jeffs exercised her warrant to purchase 200,000 units of our common stock at a price of $0.30 per share. The shares were issued on November 28, 2011.
(1) Audit Fees and Related Fees
The aggregate fees billed and accrued for each of the last two fiscal years for professional services rendered by our principal accountant for the audit of our annual consolidated financial statements and for the review of our financial statements or for services that are normally provided by the accountant in connection with statutory and regulatory filings or engagements for those fiscal years were:
2013 - $29,751 – Dale Matheson Carr-Hilton Labonte LLP
2012 - $23,984 – Dale Matheson Carr-Hilton Labonte LLP
2011 - $31,966 – Dale Matheson Carr-Hilton Labonte LLP
(2) Audit-Related Fees
The aggregate fees billed in each of the last two fiscal years for assurance and related services by the principal accountants that are reasonably related to the performance of the audit or review of our financial statements and are not reported in the preceding paragraph:
20122013 - $0 – Dale Matheson Carr-Hilton Labonte LLP
20112012 - $0 – Dale Matheson Carr-Hilton Labonte LLP
(3) Tax Fees
The aggregate fees billed in each of the last two fiscal years for professional services rendered by the principal accountant for tax compliance, tax advice, and tax planning was:
2013 - $2,402 – Dale Matheson Carr-Hilton Labonte LLP
2012 - $5,832 – Dale Matheson Carr-Hilton Labonte LLP
2011 - $2,755 – Dale Matheson Carr-Hilton Labonte LLP
(4) All Other Fees
The aggregate fees billed in each of the last two fiscal years for the products and services provided by the principal accountant, other than the services reported in paragraphs (1), (2) and (3) was:
2013 - $0 – Dale Matheson Carr-Hilton Labonte LLP
2012 - $0 – Dale Matheson Carr-Hilton Labonte LLP
2011 - $0 – Dale Matheson Carr-Hilton Labonte LLP
We do not have an audit committee. Our board of directors pre-approves all audit and permissible non-audit services provided by the independent auditors. These services may include audit services, audit-related services, tax services and other services.
See the index to financial statements on page 40.38.
The following table sets out the exhibits either filed herewith or incorporated by reference.
| Exhibit | Description |
| 3.1 | Articles of Incorporation1 |
| 3.2 | By-laws1 |
| 10.1 | Securities Purchase Agreement dated as April 7, 20112 |
| 10.2 | Registration Rights Agreement pursuant to the Securities Purchase Agreement dated April 7, 20112 |
| 10.3 | Form of Warrant dated April 7, 20112 |
| 10.4 | Red Metal Resources Ltd. 2011 Equity Incentive Plan3 |
10.5 | Contract for the option to purchase mining holdings (Pibe) dated November 25, 2011 between Manuel Antonio Cortes Araya and Minera Polymet Limitada6
|
10.6 | Form of the Loan Agreement and Promissory Note issued for the debt financing with related parties 6,7
|
16 | Letter re change in certifying accountant4
|
| 21 | List of significant subsidiaries of Red Metal Resources Ltd.54 |
| 23 | Consent of Dale Matheson Carr-Hilton Labonte LLP 65 |
| 31.1 | Certification of chief executive officer and president pursuant to Rule 13a-14(a)/15d-14(a) 65 |
| 31.2 | Certification of chief financial officer pursuant to Rule 13a-14(a)/15d-14(a) 65 |
| 32 | Certification pursuant to 18 U.S.C. Section 135065 |
| 101 | The following financial statements formatted in Extensive Business Reporting Language (XBRL): (i) consolidated statements of operations, (ii) consolidated statements of cash flows, (iii) consolidated balance sheet, (iv) consolidated statement of changes in stockholders’ equity, and (v) the notes to the consolidated financial statements. 9 |
1 Incorporated by reference from the registrant’s report on Form SB-2 filed with the Securities and Exchange Commission on May 22, 2006 as file number 333-134-363
2 Incorporated by reference from the registrant’s registration statement on Form S-1 filed with the Securities and Exchange Commission on May 16, 2011
3 Incorporated by reference from the registrant's registration statement on Form S-8 filed with the Securities and Exchange Commission on September 23, 2011.
4 Incorporated by reference from the registrant’s report on Form 10 filed with the Securities and Exchange Commission on February 12, 2010
5 Incorporated by reference from the registrant’s report on Form 10 filed with the Securities and Exchange Commission on February 12, 2010
6 Filed herewith
7 Denotes a management contract
|
1 Incorporated by reference from the registrant’s report on Form SB-2 filed with the Securities and Exchange Commission on May 22, 2006 as file number 333-134-363
2 Incorporated by reference from the registrant’s registration statement on Form S-1 filed with the Securities and Exchange Commission on May 16, 2011
3 Incorporated by reference from the registrant's registration statement on Form S-8 filed with the Securities and Exchange Commission on September 23, 2011.
4 Incorporated by reference from the registrant’s report on Form 10 filed with the Securities and Exchange Commission on February 12, 2010
5 Filed herewith
SIGNATURES
In accordance with Section 13 or 15(d) of the Exchange Act, the registrant caused this report to be signed on its behalf by the undersigned, thereunto duly authorized.
Dated: MarchApril 22, 20122013
| | | RED METAL RESOURCES LTD. | |
| | | | | |
| | | By: | /s/ Caitlin Jeffs | |
| | | | Caitlin Jeffs, Chief Executive Officer | |
| | | By: | /s/ John Dada Costa | |
| | | | John Dada Costa, Chief Financial Officer | |
Pursuant to the requirements of the Securities Exchange Act of 1934, this report has been signed below by the following persons on behalf of the Registrant and in the capacities and on the dates indicated
| Signature | | Title | | Date |
| | | | | |
| /s/ Caitlin Jeffs | | Chief Executive Officer, (Principle Executive Officer) President, Secretary and director | | MarchApril 22, 20122013 |
| Caitlin Jeffs | | President, Secretary and director | | |
| | | | | |
/s/ John Dada Costa | | Chief Financial Officer and director (Principle Financial and Accounting Officer) | | MarchApril 22, 20122013 |
John Dada Costa | | | | |
| | | | | |
| /s/ Michael Thompson | | Director | | MarchApril 22, 20122013 |
| Michael Thompson | | | | |
5049