UNITED STATES
SECURITIES AND EXCHANGE COMMISSION
WASHINGTON, D.C. 20549
Form 10-K
☒ Annual Report pursuant to Section 13 or 15(d) of the Securities Exchange Act of 1934 For the fiscal year ended August 31, 2015 ☐ Transition Report pursuant to Section 13 or 15(d) of the Securities Exchange Act of 1934 For the transition period fromto
|
FACTSET RESEARCHRESEARCH SYSTEMS INC.
(Exact name of registrantRegistrant as specified in its charter)
![]()
Delaware (State or other jurisdiction of incorporation or organization) | 13-3362547 (I.R.S. Employer Identification No.) | ||
601 Merritt 7, Norwalk, Connecticut 06851
(Address of principal executive office, including zip code)
Registrant’s telephone number, including area code:(203) 810-1000
Securities registered pursuant to Section 12(b) of the Act:Common Stock, par value $0.01 per share
Name of each exchange on which registered:New York Stock Exchange and TheThe NASDAQ Stock Market LLC
Securities registered pursuant to Section 12(g) of the Act:None
Indicate by check mark if the registrant is a well-known seasoned issuer, as defined in Rule 405 of the Securities Act.Yes Act.
ýYes ☒ No o☐
Indicate by check mark if the registrant is not required to file reports pursuant to Section 13 or Section 15(d) of the Act.Yes Act.
oYes ☐ No ý☒
Indicate by check mark whether the registrant (1) has filed all reports required to be filed by Section 13 or 15(d) of the Securities Exchange Act of 1934 during the preceding 12 months (or for such shorter period that the registrant was required to file such reports), and (2) has been subject to such filing requirements for the past 90 days. Yes ý☒ No o☐
Indicate by check mark whether the registrant has submitted electronically and posted on its corporate Web site, if any, every Interactive Data File required to be submitted and posted pursuant to Rule 405 of Regulation S-T (§232.405 of this chapter) during the preceding 12 months (or for such shorter period that the registrant was required to submit and post such files). Yes ý☒ No ¨☐
Indicate by check mark if disclosure of delinquent filers pursuant to Item 405 of Regulation S-K (§229.405 of this chapter) is not contained herein, and will not be contained, to the best of registrant's knowledge, in definitive proxy or information statements incorporated by reference in Part III of this Form 10-K or any amendment to this Form 10-K. ¨
Indicate by check mark whether the registrant is a large accelerated filer, an accelerated filer, a non-accelerated filer or a smaller reporting company. See definition of “large accelerated filer,” “accelerated filer” and “smaller reporting company” in Rule 12b-2 of the Exchange Act.
Large accelerated filer | Accelerated filer | ||
Non-Accelerated filer | Smaller Reporting Company |
Indicate by check mark whether the registrant is a shell company (as defined in Exchange Act Rule 12b-2)12b-2 of the Act). Yes o☐ No ý☒
The aggregate market value of the registrant’s common stock held by non-affiliates of the registrant based upon the closing price of a share of the registrant’s common stock on February 29, 2012,27, 2015, the last business day of the registrant’s most recently completed second fiscal quarter, as reported by the New York Stock Exchange on that date, was $3,598,639,975.
The number of shares outstanding of the registrant’s common stock, as of October 22, 2012,20, 2015, was 44,259,635.
DOCUMENTS INCORPORATED BY REFERENCE
Portions of the registrant’s definitive Proxy Statement dated October 30, 2012,2015, for the Fiscal 20122015 Annual Meeting of Stockholders to be held on December 18, 2012,15, 2015, are incorporated by reference into Part III of this Annual Report on Form 10-K where indicated.
FACTSET RESEARCH SYSTEMS INC.
FORM 10-K
For The Fiscal Year Ended August 31, 2012
| PART I | |||||
ITEM 1. | Business | 4 | |||
ITEM 1A. | Risk Factors | 14 | |||
ITEM 1B. | Unresolved Staff Comments | 17 | |||
ITEM 2. | Properties | 17 | |||
ITEM 3. | Legal Proceedings | 18 | |||
ITEM 4. | Mine Safety Disclosures | 18 | |||
PART II | |||||
ITEM 5. | Market for Registrant’s Common Equity, Related Stockholder Matters and Issuer Purchases of Equity Securities | 19 | |||
ITEM 6. | Selected Financial Data | 21 | |||
ITEM 7. | Management’s Discussion and Analysis of Financial Condition and Results of | 22 | |||
ITEM 7A. | Quantitative and Qualitative Disclosures About Market Risk | 42 | |||
ITEM 8. | Financial Statements and Supplementary Data | 44 | |||
ITEM 9. | Changes in and Disagreements with Accountants on Accounting and Financial Disclosure | 85 | |||
ITEM 9A. | Controls and Procedures | 85 | |||
ITEM 9B. | Other Information | 85 | |||
PART III | |||||
ITEM 10. | Directors, Executive Officers and Corporate Governance | 86 | |||
ITEM 11. | Executive Compensation | 86 | |||
ITEM 12. | Security Ownership of Certain Beneficial Owners and Management and Related Stockholder Matters | 86 | |||
ITEM 13. | Certain Relationships and Related Transactions, | 86 | |||
ITEM 14. | Principal Accounting Fees and Services | 86 | |||
PART IV | |||||
ITEM 15. | Exhibits, | 87 | |||
Signatures | 89 | ||||
Overview
FactSet Research Systems Inc. (the “Company” or “FactSet”) is a provider of integrated financial information and analytical applications to the global investment community. FactSet combines content regarding companies and securities from major markets all over the globe into a single online platform of information and analytics. By consolidating content from hundreds of databases with powerful analytics, FactSet supports the investment process from initial research to published results for buy and sell-side professionals. These professionals include portfolio managers, research and performance analysts, risk managers, marketing professionals, sell-side equity research professionals, investment bankers and fixed income professionals. The Company’s applications provide users access to company analysis,and industry analyses, multicompany comparisons, industry analysis, company screening, portfolio analysis, predictive risk measurements, alphatesting, portfolio optimization and simulation, real-time news and quotes and tools to value and analyze fixed income securities and portfolios. With Microsoft® Office integration, wireless access and customizable options, FactSet offers a complete financial workflow solution. The Company’s revenues are derived from subscriptions to services, such as workstations, content and financial applications.
Corporate History
FactSet was founded in 1978 and has been publicly held since 1996. The Company is dual listed on the New York Stock Exchange and the NASDAQ Stock Market under the symbol “FDS.” Fiscal 2012 was2015 marked the Company’s 3437th year of operation, its 32nd35th consecutive year of revenue growth and its 1619th consecutive year of positive earnings growth as a public company. In
Today, FactSet continues to uphold its key corporate values: having an intelligent workforce; offering exceptional client service; embracing long-term growth strategies; being a thought leader; providing a friendly work environment; performing community service; innovating within the past 12 months,financial industry; and embracing global diversity. As of August 31, 2015, FactSet has become fastera market capitalization of $6.5 billion, up 22.6% over last year. The Company currently has 38 office locations in 21 countries employing 7,360 individuals. In March 2015, FactSet was ranked #48 on Fortune’s “100 Best Companies to Work For,” marking the Company’s seventh appearance on the list in the last eight years. FactSet was also recognized as one of the UK’s “Best Workplaces” by the Great Place to Work® Institute UK for the seventh consecutive year, listed in Crain’s “Chicago’s Best Places to Work” for the third year in a row and more relevantincluded in the “2015 Best Places to a broader rangeWork in France” list for the fourth consecutive year. In addition, in July 2015 the Company was awarded the Best Research and Analytics tool at the 2015 Systems in the City Awards.
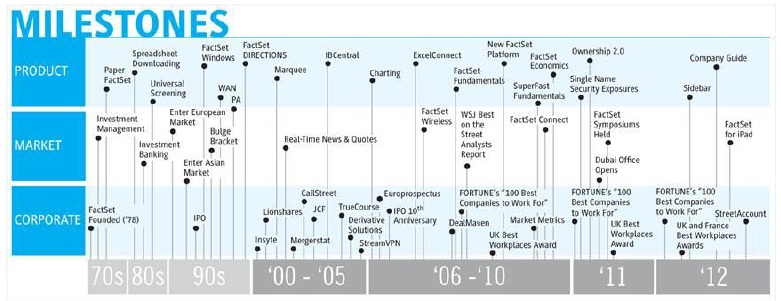
The following timeline depicts the Company’s history with the financial information services industry since its founding:

Management Changes
FactSet’s Chairman and Chief Executive Officer, Philip A. Hadley, stepped down as CEO effective July 1, 2015. He remains an employee of usersFactSet and serves as the Company continuesChairman of its Board of Directors. During Mr. Hadley’s tenure as CEO, the Company’s annual revenue growth rate exceeded 14%, diluted EPS grew from $0.49 to dedicate itself$5.71 per share and over $2 billion was returned to building tools to support a variety of user workflows from traditional Asset Management clients to Wealth Managers, Mergers & Acquisitions, Advisory, Sales & Trading, Hedge Funds and Private Equity/Venture Capital. FactSet is on the desktops of many of the largest and most successful financial companiesstockholders in the world. Its unique applications free global professionals from havingform of cash dividends and share repurchases. FactSet’s President, F. Philip Snow, was named CEO, effective July 1, 2015. Mr. Snow, age 51, was also elected to gather and collate financial and economic data, which allows them more time to analyze the data and increase their productivity.
On January 21, 2015, FactSet hired Scott Miller as |
Lastly, in June 2015, FactSet hired Edward Baker-Greene, its first-ever Chief Human Resources Officer, to oversee and grow its critically important employee talent pool.
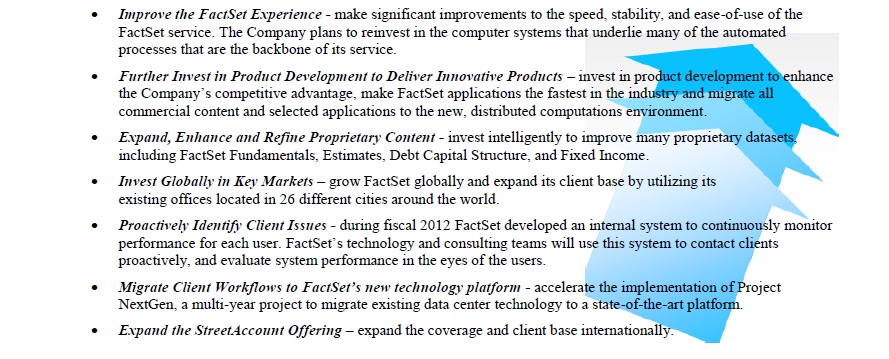
Business Strategy
FactSet’s business strategy is to be a leading provider of integrated financial information and analytical applications to the global investment community by consolidating data content with powerful analytics on a single platform, while providing superior individual desktop client service. FactSet is a growing, global company that is increasingSince its founding, the Company has used its dedicated workforce, technological proficiency and unwavering commitment to client service to drive revenue and earnings per share growth as well increase its international reach, headcount, and ultimately, its competitive edge.
In 2015, FactSet engaged in numerous strategic initiatives aimed at building and strengthening key pillars supporting its plans for future growth including its scalability, its rich pool of talent and the pursuit of innovation.
Scale
Operating the business at scale is about optimization, not duplication, of efforts. FactSet is highly focused on wisely allocating its resources to drive the greatest results across its segments. A few years ago, the Company embarked on Project NextGen, a multi-phase initiative designed to transition away from large mainframe computers to a more distributed environment powered by a vast array of smaller, faster and more cost-effective machines. The result is a more modern look and feel, a dramatic increase in the speed of the user experience and a robust platform that will allow FactSet to build innovative, cutting-edge products that meet our clients’ needs today and tomorrow.
The early years of FactSet’s evolution saw significant attention paid towards building a great product and establishing a loyal client following. Though these goals will always remain core priorities for the Company, saw evidencein looking towards the future, there is a strong need to increase focus on the infrastructure that supports the business. In fiscal 2015, FactSet brought greater definition to these integral components of thisthe business through the realignment of its product management and strategy teams. These efforts have enabled the Company to better scale its operations for future growth in fiscal 2012 as FactSet added 484 employeeswhile simultaneously enhancing its world-class product offerings and increasedservices.
Dedication to Client Service and Support
Client service is a key component of the number of office locations around the world from 24 to 26.


 |

As a metric to define the Company’s dedication to client service, FactSet consultants and went on 43,000approximately 46,000 client visits during fiscal 2012,2015. This client-focused dedication helpedFactSet's increase its client retention rate to more than 95% of ASV and 94% when expressed as a percentage of clients, an increase from 93% as of the end of fiscal 2014.
The Employee Base
FactSet continues its commitment to recruit, develop and maintain a talented employee workforce as the Company believes that its future success depends on the retention of skilled personnel. FactSet has been successful in recruiting qualified employees by offering competitive compensation, benefits, equity participation and work environment practices.In June 2015, FactSet named its first-ever Chief Human Resources Officer (“CHRO”), as part of a strategic initiative to increase the investment in both its existing talent pool and the high caliber talent the Company aims to attract to remain competitive. Reporting directly to the Chief Executive Officer (“CEO”), the CHRO will lead an agenda to maintain an ideal cultural balance for the Company’s employees globally and manage how FactSet will invest in career development.
As of August 31, 2015, employee headcount was 7,360 up 10.9% from 34,500a year ago. Of this total, 2,238 employees were located in the U.S., 832 in Europe and 4,290 in the Asia Pacific region. In the past 12 months, FactSet added 344 net new employees involved with content collection, 252 net new engineering and product development employees and 124 net new consultants, as the Company continues to focus on servicing its existing client base, expanding its content and improving its applications. Approximately 54% of the Company’s employees are involved with content collection, 24% work in product development, software and systems engineering, another 19% conduct sales and consulting services and the remaining 3% provide administrative support. FactSet believes that its current relations with employees are good, Company management keeps employees informed of decisions and encourages and implements employee suggestions whenever practicable. As of August 31, 2015, approximately 142 FactSet employees within certain French subsidiaries were represented by a mandatory works council. No other employees are represented by a collective bargaining agreement.
FactSet is proud to have received the following accolades in fiscal 2011. Consultants2015:
● | Ranked #48 on Fortune’s “100 Best Companies to Work For.” |
● | Recognized as one of the UK’s “Best Workplaces.” |
● | Included in the “2015 Best Places to Work in France.” |
● | Named as one of the “20 Great Workplaces in Technology” by Great Place to Work® |
● | Named as one of the “100 Best Workplaces for Millennials” in the U.S. by Fortune. |
● | Listed in Crain’s “Chicago’s Best Places to Work.” |
Innovation
FactSet’s focus is turning information into intelligence. Clients rely on timely, accurate data from inputs around the world answered 250,000globe to make informed decisions about current exposures, daily trades and portfolio allocations, among other things. FactSet has a market-leading research management solution (“RMS”), which allows clients to easily integrate financial metrics to enhance their workflow and leverage powerful charts, market data and analytics. The Company has also developed the Multi-Asset Class (MAC) Risk Model to enable portfolio managers, advisors and investors to analyze the implications of potential trades, indicate predictive risks and assess the impact of any shock on their portfolios. FactSet Geographical Revenue Exposure (GeoRev), a recently released innovative data set, enhances the way a user can view company revenues by displaying them by geographic country and regional categories.
In 2015, FactSet introduced unique product innovations and applications across its segments which have improved the speed, usability and discoverability of its workstation. In addition to making the application more intuitive, new site-wide search functionality was released in fiscal 2015 and allows users to discover reports and applications. To support desk calls, which resultsdata integrity, FactSet released FactSet Portfolio Services to offer turnkey integration, robust and transparent data reconciliation and standardized custom reporting options across regions and asset classes. In addition, the Company introduced several new data sets to its proprietary content, including As-Reported Financials and FactSet ETF Data Analytics.
Acquisitions are also part of FactSet’s strategy. FactSet’s acquisition in building strong client relationships.

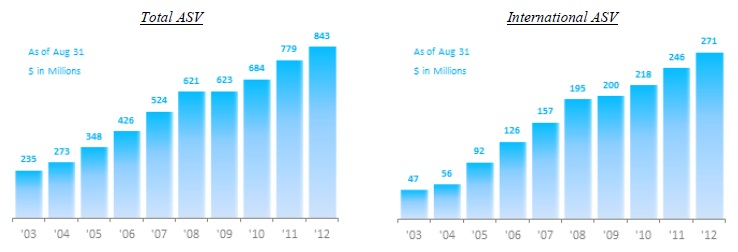
Client Subscription Growth
Annual subscription value at any given point in time represents the forward-looking revenues for the next twelve months from all subscription services currently being supplied to clients. At August 31, 2012,2015, ASV was $843 million,$1.058 billion, up 7%9.2% organically from a year ago. Of this total, 81% is derived from investment management clients and the remainder from the sell-side firms who perform M&A advisory work and equity research. The $64 million increase in ASV during fiscal 20122015 was driven by broad-based global growth across geographical segments, continued usefrom both the buy and sell-side, as FactSet experienced accelerated demand for its fixed income portfolio products, portfolio analytics suite of products, sales of equity attribution and MAC risk models.
During fiscal 2015, FactSet advanced applications suchadded 183 net new clients (excluding 50 new clients acquired from the acquisition of Code Red), increasing the number of clients by 6.7% over the prior year. The number of new client additions is an important metric for FactSet as Portfolio Analysis (“PA”), expanded deploymentnew clients typically come on with modest deployments and often experience substantial growth in subsequent years. In terms of proprietary data,users, 7,609 net new users were added during fiscal 2015, the highest year over year growth total ever. FactSet saw healthy progression in the number of clients and users increased usage of FactSet in Excel byat both buyits buy-side and sell-side users,clients as growth in the Market Metrics Local Market Share suite of products, a high annual client retention rate,initial public offering (“IPO”)and M&A marketplaces helped boost the annual price increase for the majority of the Company’s investment management clients and the acquisition of StreetAccount in June 2012, which at the time of acquisition, had annual subscriptions of $11.4 million. These growth drivers were partially offset by a cancellation of an earnings estimates feed to TheMarkets.com as a result of its acquisition by Standard & Poor’s Capital IQ and a decline in ASV from investment banking clients in 2015. In addition, FactSet released a new user interface with an emphasis on ease of use and search which contributed to the net user increase.
The following provides a snap shot view of FactSet’s ASV growth over the past 12 months as the banks continued their reduction in spending and hiring.
|
| ||
Financial Information on Geographic Areas
Operating segments are defined as components of an enterprise that engage in business activities from which they may earn revenues and incur expenses, whose operating results are regularly reviewed by the enterprise’s chief operating decision maker (“CODM”) to make decisions about resources to be allocated to the segment and assess its performance, and for which discrete financial information is available. FactSet’s CODM is its Chief Executive Officer, who is responsible for making decisions about resources allocated amongst the operating segments based on actual results.
FactSet’s operations are organized into three reportable segments based on geographic operations:business activities: the U.S., Europe and Asia Pacific. These reportable segments are aligned with howThis alignment reflects the Company, including its chief operating decision maker, managesCompany’s approach to managing the business and transacting in the demographicvarious markets in which FactSet serves. Financial information, including revenues, operating income and long-lived assets related to the Company’s operations in each geographic area are presented in Note 6, Segment Information, in the Notes to the Company’s Consolidated Financial Statements included in Item 8 below. FactSet believes this alignment helps it better manage the business and view the markets the Company serves which are centered onby providing integrated global financial and economic information. Sales, consulting, data collection, product development and software engineering are the primary functional groups within the U.S., Europe and Asia Pacific segments that provide global financial and economic information to investment managers, investment banks and other financial services professionals. The U.S. segment services finance professionals including financial institutions throughout North America,the Americas, while the European and Asia Pacific segments service investment professionals located throughout Europe and Asia.the Asia Pacific region, respectively. Financial information, including revenues, operating income and long-lived assets related to the Company’s operations in each geographic area are presented in Note 7,Segment Information,in the Notes to the Company’s Consolidated Financial Statements included in Item 8.
The European segment is headquartered in London, England and maintains office locationsoffices in France, Germany, Italy, Ireland, Latvia, Luxembourg, the Netherlands, DubaiSpain, South Africa, Sweden and Italy.Dubai. The Asia Pacific segment is headquartered in Tokyo, Japan with office locations in Australia, Hong Kong, AustraliaSingapore and Mumbai, India. The data content collection centers located in India and the Philippines benefit all of the Company’s operating segments. Segment revenues reflect direct sales to clients based in their respective geographic locations. There are no intersegment or intercompany sales of the FactSet service.services. Each segment records compensation expense, including stock-based compensation, data collection costs, amortization of intangible assets, depreciation of furniture and fixtures, amortization of leasehold improvements, communication costs, professional fees, rent expense, travel, marketing, office and other direct expenses. Expenditures associated with the Company’s data centers, third party data costs and corporate headquarters charges are recorded by the U.S. segment and are not allocated to the other segments. The content collection centers located in India and the Philippines benefit all of the Company’s operating segments and thus the expenses incurred at these locations are allocated to each segment based on a percentage of revenues.
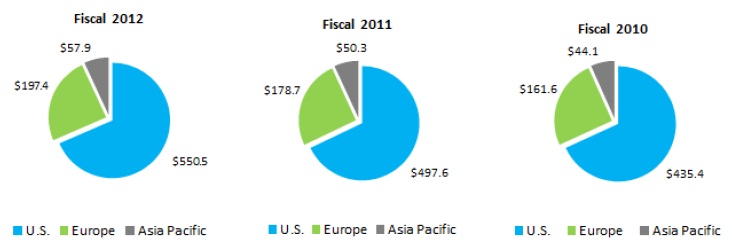
The following charts depict revenues related to each of the three Company’s reportable segments.
|
Products and Services
FactSet offers smart, streamlined workspaces designed for investment managers, investment bankers, hedge funds managers, quantitative researchers and other professionals. Each personalized solution offers standard features such as wireless connectivity, seamless integration of real-time market data, content choices from hundreds of data sets, Microsoft® Office integration and financial screening capabilities. Customizable FactSet workspaces include the following:
Investment Managers
FactSet addresses the challenges unique to investment managers in its integrated platform. With FactSet, a user gains a sophisticated solution that can be customized with the exact data and analytics needed to support the firm's workflow while reducing training, technology, content, and deployment costs. The use of FactSet by investment managers can help them outperform the benchmark, ensure positive investment performance, efficiently find relevant news and information, help decide what to buy, hold or sell, and see performance trends and assess risk. The comprehensive FactSet platform enables investment managers to manipulate data to an unprecedented degree and present data in an infinite variety of formats.
Global Banking & Brokerage Professionals
FactSet enables investment banking professionals to gain in-depth company and industry insight with its integrated data and powerful analytical solutions designed specifically for a banker's workflow. From the beginning of research strategy to the end of the pitch, users can access the tools and information they need to identify new opportunities and track the companies and industries that are important to them and their clients. Key functionality includes the ability for an investment banker to leverage FactSet’s databases to find public and private market opportunities, filings, evaluate transactions, analyze industry trends, monitor market-moving news, and value companies. Sell-side professionals can also generate new buyer lists and investment and deal ideas, gain insight into the global deal market from M&A transactions, corporate activism, governance, connections between people and perform analyses more efficiently with industry-leading integration with Microsoft® Office.
Hedge Funds
FactSetoffers solutions for alternative investments, including long/short positions, equity options and futures that allow users to view historical valuations, search millions of filings and transcripts, leverage the MAC risk model and access global economic data. Fund managers can track important events that may affect fund performance in real time for more than 850indicators in 38 countries and regions, with access toevent details minutes after they are released. In addition to analyzing portfolio risk, users can also view predictive risk characteristics, study exposures, and identify systematic sources of relative performance.
Wealth Managers
Using FactSet solutions can allow a wealth manager to stay on top of clients’ portfolios, streamline communication and internal research, create account review documents and analyze multiple asset classes. Managers can also integrate client holdings to track performancealongside real-time market data, and compare portfolios against thousands of global benchmarks, mutual funds, and ETFs. FactSet’s interactive account review documents aid in preparing client-friendly reports that reflect performance, characteristics, and composition of individual accounts as well as overall client or prospect relationships.
Private Equity& Venture Capital
Private equity and venture capital firms can access screening technology and links between funds and their portfolio companies to assist in uncovering new targets which are in line with their investment theory. FactSet solutions offer everything from high-level company snapshot reports to tools that create presentation and deal-ready books. Users can also leverage FactSet StreetAccount to view industry-specific news and metrics and track market receptivity and performance for the latest public offerings.
Researchers & Analysts
FactSet solutions provide the information to enhance research analysts’ workflows and provide differentiated ideas and opportunities to their clients. Users can gain country- and regional-level insight with a broad range of macroeconomic, index, interest rate, and other country-level data including overnight summaries, political highlights and trading updates. FactSet’s RMS tools allow the user to easily create, store, and disseminate ideas across their respective firms. Data can be exported and linked using Microsoft® Excel, Word and PowerPoint.
Consultants& Advisors
FactSet’s classification data helps consultants and advisors perform in-depth valuation and peer group analysis with industry-leading classification data that uncovers the multiple sectors. Users can also identify M&A targets, undertake commercial due diligence and understand industry structure and trends. Information on global sector and product-based classification systems, supply chain relationships, geographic revenue sources, fundamentals, private equity and venture capital data, debt capital structure, ownership, governance and activism can people can be accessed directly using software already in place.
Plan Sponsors and Pension Funds
Fund managers can use solutions specifically designed for selecting, analyzing, and incorporating external managers into an overall plan. For both direct and indirect investment, a user can aggregate portfolios, examine asset classes and styles, and analyze securities on a single platform. Managers can also decompose plan-level performance into asset allocation and manager selection effects using FactSet’s Macro Attribution reports. Presentation-ready documents can be created complete with qualitative information and quantitative analytics.
In addition, FactSet’s product and service offerings are customizable to meet the needs of many more professionals within the corporate, legal, governmental and academic fields who are involved in hedge funds, private equity, sell-side research, equity sales, trading, consulting, investor relations, law firms and academic institutions.
Proprietary Content Collection
In order to better satisfy the needs of clients, improve the Company’s competitive advantage and reduce dependency on third-party data providers, FactSet has invested in the procurement of proprietary content. This investment includes the expansion of the Company’s content collection group through several acquisitions including LionShares, Mergerstat, CallStreet, JCF, TrueCourse, europrospectus.com, a copy of the Worldscope database from Thomson, StreetAccount and Revere Data.
In addition to these strategic purchases, FactSet has set up a data collection infrastructure through the creation of content centers for data collection in India and the Philippines, the leasing and expansion of office space and the hiring of new employees. This infrastructure is the foundation of FactSet’s content group which as of August 31, 2015 has grown to 3,975 employees, or 54% of the total employee population. The critical goals for FactSet content each year are to find ways to differentiate its data from that of competitors along with increasing the timeliness, accuracy and completeness of the data and depth of coverage. During fiscal 2015, FactSet made several key enhancements to its proprietary content with the introduction of the following new data sets:
As-Reported Financials
As-Reported Financials is a new data set within the FactSet Fundamentals product line. As-Reported Financials data is available in income statement, balance sheet and cash flow reports via the Company tab in the FactSet workstation. As-Reported Financials allows users to easily view all as-reported reports in one place within the FactSet workstation, benefit from transparency with virtually 100% data auditability and view data in the format that it is presented by each company.
FactSet’s ETF Data & Analytics
FactSet ETF Data & Analytics provides comprehensive reference and analytics data across the universe of exchange-traded products. FactSet ETF Reference allows users to complete exchange-traded fund (“ETF”) due diligence using FactSet’s library of fund-specific data points and information on ETF structure, trading and benchmark indexes. Users can also search across asset classes using a horizontal classification system to understand each ETF’s exposure on a granular level and retrieve exchange listings data, including exchange names, tickers, exchange codes and listing currencies to monitor trades on multiple exchanges in different currencies.
FactSet ETF Analytics data enables users to make valid and reliable comparisons for critical statistics across the universe of ETFs using standardized methodology and consistent snapshots in time, access important portfolio data for equities, fixed income and commodities derived directly from underlying holdings and leverage proprietary ratings and scores to gather objective measures of fund efficiency, risk, tradability and fit relative to benchmarks.
FactSet Geographic Revenue Exposure
FactSet Geographic Revenue Exposure (“GeoRev”) is a comprehensive database that correlates geographic revenue to a proprietary normalized four-level geographic classification structure containing more than 280 countries, areas, regions and super-regions. With GeoRev in Portfolio Analytics, active managers can construct developed market portfolios to gain exposure to emerging markets. Risk managers are able to identify quickly companies whose revenues are dependent upon countries exposed to geopolitical risks, a natural disaster or a health epidemic, for example. The GeoRev data set covers 18,000 global securities with history starting with 2003 for U.S. firms and 2006 for international companies. The data set provides information to investors interested in measuring the multi-dimensional nature of geographic exposure risk for a company, portfolio or benchmark.
Continued proprietary database enhancements and the creation of new data sets are a testament to FactSet’s commitment to increase user satisfaction and exceed client expectations. The Company provides workflow and productivity solutions, and by expanding its proprietary data content sets, FactSet is best positioned to solve its clients problems in many areas of the market.
ThirdParty Data Content
FactSet aggregates third party content from more than 220 data suppliers, 100 news sources and 80 exchanges into its own dedicated online service which the client accesses to perform their analyses. FactSet carries content from premier providers such as Thomson Reuters, Standard & Poor’s, Axioma, Inc., Interactive Data Corporation, LLC, Dow Jones & Company Inc., Northfield Information Services, Inc., Barclays Capital, Intex Solutions, Inc., Bureau van Dijk, ProQuote Limited, MSCI Barra, SIX Financial Information USA Inc., Morningstar, Inc., Russell Investments, Bank of America Merrill Lynch, NYSE Euronext, London Stock Exchange, Tokyo Stock Exchange, NASDAQ OMX, Australian Securities Exchange and Toyo Keizai. Content fees billed to the Company may be on a fixed or royalty (per client) basis.
FactSet seeks to maintain contractual relationships with a minimum of two content providers for each major type of financial data, though certain data sets on which FactSet relies have a limited number of suppliers. The Company makes every effort, when reasonable, to locate alternative sources to ensure that FactSet is not dependent on any one third party data supplier. The Company has entered into third party content agreements with varying lengths, which in some cases can be terminated on one year’s notice at predefined dates, and in other cases on shorter notice. No single vendor or data supplier represented more than 10% of FactSet's total data expenses in any fiscal year presented.
Data Centers
FactSet’s business is dependent on its ability to rapidly and efficiently process substantial volumes of data and transactions rapidly and efficiently on its computer-based networks and systems. The Company’s global technology infrastructure supports its operations and is designed to facilitate the reliable and efficient processing and delivery of data and analytics to its clients. FactSet’s data centers contain multiple layers of redundancy to enhance system performance, including maintaining, processing and storing data at multiple data centers. User connections are load balanced between data centers and, incenters. In the event of a site failure, equipment problem or regionallocalized disaster, the remaining centers havecenter has the capacity to handle the additional load. FactSet continues to be focused on maintaining a global technicaltechnological infrastructure that allows the Company to support its growing business.
FactSet is evolvinglaunched its multi-phase project, Project NextGen, a few years ago to evolve away from large mainframe computers to a more distributed environment powered by a vast array of smaller, faster, and more cost-effective machines. As part of a multi-phase project to be executed over several years, FactSet converted all databases and released several applications on this new platform during fiscal 2012. In addition to investing in the future via this NextGen initiative, themachines.The Company continued to ensure that its existing mainframe architecture functions at the highest level. During fiscal 2012, FactSet upgraded the remaining 20% of its mainframe server environment in order to optimize speed and consistency for both client batch and interactive workloads.
FactSet continues to invest aggressively in its people in order to recruit, develop and retain a talented employee workforce. The Company believes that its future success depends in part on its continued ability to hire, assimilate and retain qualified personnel. One of FactSet’s top priorities is to maintain competitive compensation, benefits, equity participation and work environment practices and policies in order to attract and retain qualified personnel. To date, FactSet believes that it has been successful in recruiting qualified employees. FactSet has not experienced any work stoppages and believes its employee relations are good. None of the Company’s employees are represented by a collective bargaining arrangement.

Research and Product DevelopmentDevelopment Costs
A key aspect of the Company’s growth strategy is to enhance its existing products and applications by making them faster and the data within them more reliable. FactSet strives to rapidly adopt new technology that can improve its products and services. Research and product development costs relate to the salary and benefits for the Company’s product development, and software engineering and technical support staff which equaled approximately 25% and, 23% of FactSet’s workforce during fiscal 2012 and 2011, respectively. These research and product developmentas such, these costs are expensed when incurred within cost of services as employee compensation. The Company plans to continueexpects to allocate a similar percentage of its workforce in future years in order to continue to develop new products and enhancements, respond quickly to market changes and to meet the needs of its clients efficiently.
 |
Fiscal 2012 was a strong year for promotingCompetition
FactSet is part of the FactSet brand, from traditional advertising,financial information services industry, which provides accurate financial information and software solutions to client events,the global investment community. According to industry reports, global spend on market data sourcing. The FactSet symposia were important marketing efforts during fiscal 2012. Over 320 industry professionals from around the world, including 270 FactSet clients, attended the U.S. and European symposia held during the third quarter of fiscal 2012. The European eventanalysis grew by more than 10%4.1% to $26.5 billion in 2015 compared to the 2011 event,prior year. This extremely competitive market is comprised of both large, well-capitalized companies and forsmaller, niche firms including market data suppliers, news and information providers and many of the first time evercontent providers that supply the Company with financial information included in the FactSet workstation. The largest competitors to FactSet are Bloomberg L.P., Thomson Reuters Inc. and Standard & Poor’s Capital IQ. Bloomberg’s market share grew to 32.0%, up from 31.7% a year ago while Thomson Reuters’ was approximately 25.9%, down slightly from the prior year. Standard & Poor’s Capital IQ market share is believed to be between 3% and 5%, comparable to that of FactSet. Other competitors and competitive products include online database suppliers and integrators and their applications, such as, MSCI Inc., Morningstar Inc., Markit Ltd., SunGard, Dealogic PLC, Interactive Data Corporation, Dow Jones & Company, Inc., BlackRock Solutions, The Yield Book, Inc., RIMES Technologies Corporation and Wilshire Associates Inc. Many of these firms offer products or services which are similar to those sold out a month beforeby the registration close date. The U.S. symposium was also a success,Company. FactSet’s development of its own robust sets of proprietary content combined with 99% of attendees stating they would return next yearits news and would recommend others to attend.quotes offering have resulted in more direct competition with the largest financial data providers.
Despite competing products and services, FactSet enjoys high barriers to entry and believes it would be difficult for another vendor to replicate quickly the following:
Intellectual Property and other Proprietary Rights
FactSet has registered trademarks and copyrights for many of its products and services and will continue to evaluate the registration of additional trademarks and copyrights as appropriate. FactSet enters into confidentiality agreements with its employees, clients, data suppliers and vendors. The Company seeks to protect its software, documentation and other written materials under trade secret and copyright laws. While FactSet does not believe it is dependent on any one of its intellectual property rights, the Company does rely on the combination of intellectual property rights and other measures to protect its proprietary rights. Despite these efforts, existing intellectual property laws may afford only limited protection.
Government Regulation
The Company integrates content from premier providers such as Thomson Reuters, Standard & Poor’s, Axioma, Inc., FTSE, Interactive Data Corporation, Dow Jones & Company Inc., Northfield Information Services, Inc., Barclays Capital, Intex Solutions, Inc., Bureau van Dijk, ProQuote Limited, MSCI Barra, APT, IHS Global Insight Inc., Morningstar, Inc., Lipper Inc., Russell Investmentsis subject to reporting requirements, disclosure obligations and Toyo Keizai.other recordkeeping requirements per the Securities and Exchange Commission (“SEC”) and the various local authorities that regulate each location in which FactSet combines the data from these commercial databases into its own dedicated online service which the client accesses to perform their analyses. Content fees billed to the Company may be on a fixed or royalty (per client) basis.
Corporate Information, including Internet Address
FactSet was founded as a Delaware corporation in 1978, and its principal executive offices are in Norwalk, Connecticut. The mailing address of the CompanyCompany’s headquarters is subject to reporting requirements, disclosure obligations601 Merritt 7, Norwalk, Connecticut 06851, and other recordkeeping requirements per the Securities and Exchange Commission (“SEC”)its telephone number at that location is (203) 810-1000. The Company’s website address iswww.factset.com.
Available Information
Through theInvestor Relations section of the Company’s website (http://investor.factset.com), FactSet makes available the following filings as soon as practicable after they are electronically filed with, or furnished to, the SEC: the Company’s Annual Report on Form 10-K, Quarterly Reports on Form 10-Q, Current Reports on Form 8-K, Proxy Statements for the annual stockholder meetings, and any amendments to those reports filed or furnished pursuant to Section 13(a) or 15(d) of the Securities Exchange Act of 1934, as amended. All such filings are available free of charge.
FactSet broadcasts live its quarterly earnings calls via its investor relations web site. Additionally, the Company provides notifications of news or announcements regarding its financial performance, including SEC filings, investor events, press and earnings releases, and blogs as part of its investor relations web site. The contents of these web sites are not intended to be incorporated by reference into this report or in any other report or document the Company files and any reference to these web sites are intended to be inactive textual references only.
In addition, the Company’s Code of Ethical Conduct for Financial Managers and Code of Business Conduct and Ethics are posted in theInvestor Relations section of the Company’s website and the same information is available in print to any stockholder who submits a written request to the Company’s Investor Relations department at its corporate headquarters. Any amendments to or waivers of such code required to be publicly disclosed by the applicable exchange rules or the SEC will be posted on the Company’s website. The charters of each of the committees of the Company’s Board of Directors are available on theInvestor Relationssection of the Company’s website and the same information is available in print, free of charge, to any stockholder who submits a written request to the Company’s Investor Relations department at its corporate headquarters.
FactSet was founded as a Delaware corporation in 1978, and its principal executive offices are in Norwalk, Connecticut. The mailing address of the Company’s headquarters is 601 Merritt 7, Norwalk, Connecticut 06851, and its telephone number at that location is (203) 810-1000. The Company’s website address is www.factset.com.
The following table shows the Company’s executive officers as of August 31, 2012:
| Name of Officer | Age | Office Held with the Company | Officer Since |
| Philip A. Hadley | 50 | Chairman of the Board of Directors, Chief Executive Officer | 2000 |
| Peter G. Walsh | 47 | Executive Vice President, Chief Operating Officer | 2005 |
| Michael D. Frankenfield | 47 | Executive Vice President, Director of Global Sales | 2001 |
| Maurizio Nicolelli | 44 | Senior Vice President, Principal Financial Officer | 2009 |
| Kieran M. Kennedy | 47 | Senior Vice President, Director of Sales Operations | 2002 |
Name of Officer | Age | Office Held with the Company | Officer Since |
F. Philip Snow | 51 | Chief Executive Officer | 2014 |
Mark J. Hale | 42 | Executive Vice President, Chief Operating Officer | 2015 |
Scott G. Miller | 47 | Executive Vice President, Global Director of Sales | 2015 |
Maurizio Nicolelli | 47 | Senior Vice President, Chief Financial Officer | 2009 |
Edward Baker-Greene | 52 | Senior Vice President, Chief Human Resources Officer | 2015 |
Rachel R. Stern | 50 | Senior Vice President, Strategic Resources and General Counsel | 2009 |
F. Philip A. Hadley, Chairman of the Board of Directors,Snow – Chief Executive Officer and Director.. Mr. HadleySnow was named Chairman and Chief Executive Officer effective July 1, 2015. Prior to that, Mr. Snow held the title of FactSet on September 5, 2000. Mr. Hadley joinedPresident. He began his career at FactSet in 19851996 as a Consultant. From 1986Consultant, and in 1998 moved to 1989, Mr. Hadley was the Company’s Vice President, Sales. From 1989Asia Pacific region to hold positions in Tokyo and Sydney. After moving back to the U.S. in 2000, Mr. Hadley wasSnow held various Sales leadership roles before assuming the role of Senior Vice President, and Director of U.S. Investment Management Sales and Marketing. Prior to joining the Company,in 2013. Mr. Hadley was employed by Cargill Corporation. He currently serves as a member of the board of advisors of Kum & Go. Mr. HadleySnow received a B.B.A.B.A. in AccountingChemistry from the University of Iowa, has earnedCalifornia at Berkeley and a Masters of International Management from the right to useThunderbird School of Global Management. He holds the Chartered Financial Analyst designation and is a member of the CFA Institute.
Peter G. Walsh, MarkJ. Hale –Executive Vice President,Chief Operating Officer. Mr. WalshHale joined the Company in 19961995 as Vice President, Planninga software engineer. During his 20-year tenure at FactSet, Mr. Hale has held several positions of increasing responsibility including Head of Software Engineering, and Control within the Company’s Finance group. Mr. Walsh held the position ofmost recently, Senior Vice President, Director of Finance from 1999 until 2001. From late 2001 to February 2005,Content Operations. Mr. Walsh occupied the position of Vice President, Regional Sales Manager of the U.S. Southeast Region. On March 1, 2005 he assumed the position of Chief Financial Officer and Treasurer. On October 1, 2009, Mr. Walsh was promoted to his current position as the Company’s Chief Operating Officer, where he is responsible for product development, content collection and software and systems engineering. Prior to joining FactSet, Mr. Walsh held several positions at Arthur Anderson & Co. Mr. WalshHale received a B.S. in AccountingElectrical and Computer Engineering from Fairfield University, has earnedCarnegie Mellon University.
ScottG. Miller – Executive Vice President,Global Director of Sales.Mr. Miller joined FactSet in January 2015.Previously, Mr. Miller was employed by Bloomberg L.P., where he had executive responsibility for enterprise accounts. Mr. Miller was a founding executive and Global Chief Operating Officer of Bloomberg’s Enterprise Solutions Group, responsible for the rightstrategy and execution of that group’s major initiatives and day-to-day management. Mr. Miller spent 10 years in sales leadership roles within Bloomberg’s Financial Products Group, including Head of Sales, Americas; Regional Sales Manager, Americas; Regional Sales Manager, EMEA; and National Sales Manager, EMEA. From 1995 to use the Chartered Financial Analyst designation1998, Mr. Miller worked in fixed income sales at Bank of Montreal in London. He started his career in 1992 at Nesbitt Thomson in Montreal, Canada and is a membergraduate of the CFA Institute.St. Francis Xavier University.
Michael D. Frankenfield, Executive Vice President and Director of Global Sales. Mr. Frankenfield joined the Company in 1989 within the Consulting Services Group. From 1990 to 1994, Mr. Frankenfield held the position of Vice President, Sales. From 1995 to 2000 Mr. Frankenfield was Director of Investment Banking Sales with the Company. From 2000 until 2005, Mr. Frankenfield was Director of Sales and Marketing and from September 2005 until August 2009, he was the Director of Investment Management Services. In August 2009, he was promoted to his current position as Director of Global Sales. Mr. Frankenfield received a B.A. in Economics and International Relations from the University of Pennsylvania, has earned the right to use the Chartered Financial Analyst designation and is a member of the CFA Institute.
Kieran M. Kennedy,Edward Baker-Greene – Senior Vice President,Chief Human Resources Officer.Mr. Baker-Greene joined FactSet in June 2015 from Voya Financial, formerly ING, U.S., where he was Head of Human Resources for Retirement Solutions, Operations, and Information Technology. Previously, Mr. Baker-Greene worked at Fidelity Investments for 13 years. At Fidelity, he was a part of the Personal and Workplace Investing division, where he held roles in business and human resources capacities, including Senior Vice President/Managing Director, of Sales Operations.Relationship Management. Mr. Kennedy joined the Company in 1990 within the Consulting Services Group. From 1993 to 1997,Baker-Greene began his professional career as a lawyer focusing first on employment law and subsequently recruiting, talent management, and human capital management. Mr. Kennedy held the position of Sales and Consulting Manager for the West Coast. Mr. Kennedy was Director of Consulting from 1997 until he assumed the position as Director of Investment Banking and Brokerage Services in 2002. In August 2009, he assumed his current position as Director of Sales Operations. Prior to joining FactSet, Mr. Kennedy held a Currency Trading position at Goldman Sachs & Co. Mr. KennedyBaker-Greene received a B.A. from Tufts University and a law degree from the University of Virginia School of Law.
Rachel R. Stern –Senior Vice President, Strategic Resources and General Counsel.Ms. Stern joined FactSet in Economics2001 as General Counsel. In addition to the Legal Department at FactSet, she is responsible for Investor Relations; Facilities and Real Estate Planning; and Third-Party Content and Strategic Partnerships. Ms. Stern is admitted to practice in New York, and Washington D.C., and as House Counsel in Connecticut. Ms. Stern received a B.A. from Syracuse University.Yale University, an M.A. from the University of London and a J.D. from the University of Pennsylvania.
Additional Information
Additional information with respect to the Company’s business is included in the following pages and is incorporated herein by reference:
Page(s) | ||||
Five-Year Summary of Selected Financial Data | ||||
Management’s Discussion and Analysis of Financial Condition and Results of Operations | ||||
Quantitative and Qualitative Disclosures about Market Risk | ||||
Note 1 to Consolidated Financial Statements entitledOrganization and Nature of Business | ||||
Note | ||||
ITEM 1A. RISK FACTORS
Set forth below and elsewhere in this report and in other documents FactSet files with the SEC are risks and uncertainties that could cause actual results to differ materially from those expressed by the forward-looking statements contained in this report. Investors should carefully consider the risks described below before making an investment decision. In assessing these risks, investors should also refer to the other information contained or incorporated by reference in this Annual Report on Form 10-K filed with the SEC, including the Company’s consolidated financial statements and related notes thereto. FactSet’s operating results are subject to quarterly and annual fluctuations as a result of numerous factors. As a consequence, operating results for a particular future period are difficult to predict, and, therefore, prior results are not necessarily indicative of results to be expected in future periods.
Risk factors which could cause future financial performance to differ materially from the expectations as expressed in any of FactSet’s forward-looking statements made by or on the Company’s behalf include, without limitation:
FactSet must ensure the protection and privacy of client data
Many of FactSet’s products, as well as its internal systems and processes, involve the storage and transmission of proprietary information and sensitive or confidential data, including client portfolios. FactSet relies on a complex network of internal controls to protect the privacy of client data. If FactSet fails to maintain the adequacy of its internal controls, including any failure to implement required new or improved controls, or if FactSet experiences difficulties in their implementation, misappropriation of client data by an employee or an external third party could occur, which could damage the Company’s reputation and ultimately its business. Breaches of Company security measures could expose FactSet, its clients or the individuals affected to a risk of loss or misuse of this information, potentially resulting in litigation and liability for the Company, as well as the loss of existing or potential clients and damage to the Company brand and reputation.
FactSet must continue to introduce new products and enhancements tomaintain its technological position
The market for FactSet is characterized by rapid technological change, changes in client demands and evolving industry standards which can render existing products obsolete and unmarketable. As a result, the Company’s future success will continue to depend upon its ability to develop new products and enhancements that address the future needs of its target markets and to respond to their changing standards and practices. FactSet may not be successful in developing, introducing, marketing and licensing the Company’s new products and enhancements on a timely and cost effective basis, and they may not adequately meet the requirements of the marketplace or achieve market acceptance. In addition, clients may delay purchases in anticipation of new products or enhancements.
FactSet must hire and retain key qualified personnel
The Company’s business is based on successfully attracting and retaining talented employees. Competition for talent, including engineering personnel, in the industry in which the Company competes is strong. If the Company is less successful in its recruiting efforts, or if it is unable to retain key employees, its ability to develop and deliver successful products and services may be adversely affected. FactSet needs technical resources such as product development engineers to develop new products and enhance existing products. The Company relies upon sales personnel to sell its products and services and maintain healthy business relationships. FactSet’s failure to attract and retain talented employees could have a material adverse effect on the Company’s business.
A decline in equity returns and/or fixed income may impact the buying power of FactSet’s investment management clients
Major equity indices (e.g., Dow Jones Industrials, Russell 1000, MSCI EAFE, S&P 500 and NASDAQ Composite) and the global economy have experienced increased levels of volatility.
Approximately 81%82.5% of the Company’s annual subscription value is derived from its investment management clients. The prosperity of these clients is tied to equity assets under management. An equity market decline not only depresses assets under management but could cause a significant increase in redemption requests to move money out of equities and into other asset classes. Moreover, extended declines in the equity markets may reduce new fund or client creation, resulting in lower demand for services from investment managers.
Uncertainty, consolidation and business failures in the global investment banking industry may cause FactSet to lose additional clients and users
FactSet’s sell-side clients whothat perform M&A advisory work, capital markets services and equity research, account for approximately 19%17.5% of its revenues. A significant portion of these revenues relate to services deployed by large, bulge bracket banks. The continuedWhile improvements have been observed in the current fiscal year, the global investment banking industry continues to experience uncertainty and consolidation, which directly impacts the number of prospective clients and users within the sector. A lack of available credit continues towould impact many of the large banking clients due to the amount of leverage deployed in past operations. Clients could encounter similar problems. A lack of confidence in the global banking system could cause declines in merger and acquisitions funded by debt. Additional uncertainty,Uncertainty, consolidation and business failures in the global investment banking sector could adversely affect the Company’s financial results and future growth.
Volatility in the financial markets may delay the spending pattern of clients and reduce future ASV growth
Sales cycles for FactSet canmay fluctuate and be extended in times where the financial markets are volatile. The decision to purchase the FactSet service offering often requires prospective clientsmanagement-level sponsorship which often leads FactSet to provide management-level sponsorship. As a result, FactSet often engagesengage in relatively lengthy sales efforts. Purchases (and incremental ASV) may therefore be delayed during the client decision process becauseas uncertainties in the financial markets canmay cause clients to remain cautious about capital and data content expenditures, particularly in uncertain economic environments. The cycle associated with the purchase of the Company’s service offerings typically depends upon the size of the client, and is subject to a number of significant risks that have impacted ASV growth and over which FactSet has little or no control, including broader financial market volatility, adverse economic conditions, clients' budgeting constraints, internal selection procedures, and changes in client personnel.
Competition in FactSet’s industry may cause price reductions or loss of market share
FactSet continues to experience intense competition across all markets for its products. Itsproducts with competitors rangeranging in size from smaller, highly specialized, single-product businesses to multi-billion dollar companies to small, single-product businesses that are highly specialized.companies. While the Company believes the breadth and depth of its suite of products and applications offer benefits to its clients that are a competitive advantage, its competitors may offer price incentives to acquireattract new business. Competitive pricing pressures did not have a material impact on the Company’s results of operations during fiscal 20122015 or in any other fiscal year presented. However, future competitive pricing pressures may result in decreased sales volumes and price reductions, resulting in lower revenues. Weak economic conditions canmay also result in clients’clients seeking to utilize lower-cost information that is available from alternative sources. Thesources.The impact of cost-cutting pressures across the industries FactSet serves could lower demand for its services. In recent years, FactSet has seen clients intensify their focus on containing or reducing costs as a result of the more challenging market conditions. Clients within the financial services industry that strive to reduce their operating costs may seek to reduce their spending on financial market data and related services. If clients elect to reduce their spending with FactSet, the Company’s results of operations could be materially adversely affected. Clients may use other strategies to reduce their overall spending on financial market data services by consolidating their spending with fewer vendors, by selecting vendors with lower-cost offerings or by self-sourcing their needs for financial market data. If clients elect to consolidate their spending on financial market data services with other vendors and not FactSet, the Company’s results of operations could be adversely affected.
Increased accessibility to free or relatively inexpensive information sources may reduce demand for FactSet
In recent years,
Each year, more and more free or relatively inexpensive information has becomebecomes available, particularly through the Internet, and this trend may continue. The availability of free or relatively inexpensive information may reduce demand for FactSet. Weak economic conditions also can result in clients seeking to utilize lower-cost information that is available from alternative sources. While the Company believes its service offering is distinguished by such factors as customization, timeliness, accuracy, ease-of-use, completeness and other added value factors, if users choose to obtain the information they need from public or other sources, FactSet’s business, financial condition, and results of operations could be adversely affected.
Exposure to fluctuations in currency exchange rates that could negatively impact financial results and cash flows
The FactSet brandCompany faces exposure to adverse movements in foreign currency exchange rates as 70% of FactSet’s employees and reputation48% of its leased office space are key assetslocated outside the U.S. These exposures may change over time as business practices evolve, and competitive advantages of the Company and its business may be affected by how FactSet is perceived in the marketplace
A prolonged or recurring outage at FactSet’s data centers could result in reduced service and the loss of clients
FactSet’s clients rely on the Company for the delivery of time-sensitive, up-to-date data. FactSet’s business is dependent on its ability to rapidly and efficiently process substantial volumes of data and transactions on its computer-based networks and systems. The Company’s computer operations and those of its suppliers and clients are vulnerable to interruption by fire, natural disaster, power loss, telecommunications failures, terrorist attacks, acts of war, internet failures, computer viruses and other events beyond the Company’s reasonable control. FactSet maintains back-up facilities for each of its major data centers to minimize the risk that any such event will disrupt operations. However,operations, however, a loss of the Company’s services may induce its clients to seek alternative data suppliers and any such losses or damages incurred by FactSet could have a material adverse effect on its business. Although the Company seeks to minimize these risks through security measures, controls and back-up data centers, there can be no assurance that such efforts will be successful or effective.
Increases in FactSet’s cost structure related to hiring, benefit costs, salary levels, variable compensation, and other factors may reduce growth in operating income. If the Company is unable to manage operating costs as anticipated or operating costs are higher than expected, FactSet’s operating results may fluctuate significantly. FactSet has made significant investments in its employee base in recent years. FactSet also made adjustments to employee salaries to remain competitive, and benefit costs have also increased. If employee compensation expenses exceed the Company’s expectations and cannot be adjusted accordingly, FactSet’s profitability may be reduced and results of operations and financial position may be adversely affected.
FactSet is a provider of global financial and economic information on companies worldwide.companiesworldwide, aggregating third party content from more than 220 data suppliers, 100 news sources and 80 exchanges. Clients have access to the data and content found within thesethe FactSet databases, which they can combine and utilize in nearly all of the Company’s applications. Theseapplications.These databases are important to the Company’s operations becauseas they provide its clients with key information such as company fundamentals, estimates, global equity ownership, M&A data, events and transcripts, earnings and other equity and fixed income data. FactSet aggregates third-party content from more than 85 data suppliers and over 100 news sources and exchanges. The Company has entered into third-partythird party content agreements with varying lengths, from as long as five years to as short as on an ad-hoc basis. The agreementswhich in some cases can be terminated on one year’s notice at predefined dates, and in other cases on shorter notice.
FactSet seeks to maintain contractual relationships with a minimum of two content providers for each major type of financial data, though certain data sets on which FactSet relies on have a limited number of suppliers, although thesuppliers. The Company makes every effort, when reasonable, to assure that, where reasonable,locate alternative sources are available.to ensure FactSet is not dependent on any one third party data supplier. These datasetsdata sets include, without limitation, (1) Equity Pricing from exchanges such as NASDAQ, (2) Global Exchange Indices, (3) S&P CUSIP distribution, (4) S&P Ratings and (5) Moody’s Investor Service Corporate Ratings. However, FactSet is not dependent on any one third-partythird party data supplier and no single vendor or data supplier represented more than 10% of FactSet's total data expenses in order to meet the needs of its clients.any fiscal year presented. The Company combines the data from commercial databases into its own dedicated single online service, which the client accesses to perform their analysis. The failure of FactSet to be able to maintain these relationships or the failure of its suppliers to deliver accurate data and in a timely manner could adversely affect the Company’s business.
Third parties may claimFactSet infringes upon their intellectual property rights
FactSet may receive notice from others claiming that the Company has infringed upon their intellectual property rights. Responding to these claims may require the Company to enter into royalty and licensing agreements on less favorable terms, enter into settlements, require FactSet to stop selling or to redesign affected products, or to pay damages or to satisfy indemnification commitments with the Company’s clients or vendors under contractual provisions of various license arrangements. If FactSet is required to enter into such agreements or take such actions, its operating margins may decline as a result. FactSet has made and expects to continue incurring expenditures to acquire the use of technology and intellectual property rights as part of its strategy to manage this risk.
Changes in securities laws and regulations may increase expenses or may harm demand
Many of FactSet’s business
Adverse resolution of litigation or governmental investigations may harm FactSet’s operating results
FactSet is party to lawsuits in the financial industry’s spending, whichnormal course of business. Litigation can be expensive, lengthy and disruptive to normal business operations. Moreover, the results of complex legal proceedings are difficult to predict. Unfavorable resolution of lawsuits or governmental investigations could have a material adverse effect on the Company’s revenues. Further, such disruptions could cause further instabilitybusiness, operating results or financial condition. For additional information regarding legal matters, see Item 3,Legal Proceedings, contained in the financial markets or the spendingPart I of FactSet’s clients and prospects upon which the Company depends on.
Resolution of ongoing and other probable audits by tax authorities
FactSet is subject to income taxes in both the U.S. and numerous foreign jurisdictions. Significant judgment is required in determining its worldwide provision for income taxes. In the ordinary course of business, there are many transactions and calculations where the ultimate tax determination is uncertain. The Company’s provision for income taxes, tax liability or effective tax rates in the future could be adversely affected by numerous factors including, but not limited to, income before income taxes being lower than anticipated in countries with lower statutory tax rates and higher than anticipated in countries with higher statutory tax rates, changes in the valuation of deferred tax assets and liabilities and changes in tax laws, regulations, accounting principles or interpretations thereof. FactSet is subject to the continuous examination of its income tax returns by the Internal Revenue Service and other tax authorities. Although FactSet believes its tax estimates are reasonable, the final determination of tax audits and any related litigation could be materially different than that which is reflected in historical income tax provisions and accruals. There can be no assurance that the outcomes from these continuous examinations will not have an adverse effect on the Company’s results of operations, including its provision for income taxes and tax liability.taxes.
FactSet is party to lawsuits in the normal course of business. Litigation can be expensive, lengthy, and disruptive to normal business operations. Moreover, the results of complex legal proceedings are difficult to predict. Unfavorable resolution of lawsuits or governmental investigations could have a material adverse effect on the Company’s business, operating results or financial condition. For additional information regarding legal matters, see Item 3, Legal Proceedings, contained in Part I of this report.
None.
ITEM 2. PROPERTIES
At August 31, 2012,2015, the Company leases approximately 193,000202,000 square feet of office space at its headquarters in Norwalk, Connecticut. In addition, FactSet leases office space for its U.S. reportable segment in New York, New York; Boston, Massachusetts; Chicago, Illinois; San Mateo,Francisco, California; Austin, Texas; Jackson, Wyoming; Atlanta, Georgia; Tuscaloosa, Alabama; Newark, Ridgewood and Piscataway, New Jersey; Manchester, New Hampshire; Reston, Virginia, Youngstown, Ohio, and Reston, Virginia.Toronto, Canada. The Company’s European segment operates in leased office space in London, England; Paris and Avon, France; Amsterdam, the Netherlands; Frankfurt, Germany; Dubai, United Arab Emirates; Milan, Italy; and Milan, Italy.Riga, Latvia. Office space in Tokyo, Japan; Hong Kong; Singapore; Mumbai, India; and Sydney, Australia are leased by FactSet for its Asia Pacific operating segment. The data content collection centers located in Hyderabad, India and Manila, the Philippines benefit all of the Company’sCompanies operating segments. The leases expire on various dates through March 2021.2031. Total minimum rental payments associated with the leases are recorded as rent expense (a component of selling, general and administrative expenses) on a straight-line basis over the periods of the respective non-cancelable lease terms.
Including new lease agreements executed during fiscal 2015, the Company’s worldwide leased office space increased to approximately 909,000 square feet at August 31, 2015, up 72,000 square feet or 8.6% from August 31, 2014. The Company believes that itsthe amount of leased office space as of August 31, 2015 is adequate for its current needs and that additional space is available for lease to meet any future needs.
● | Boston, Massachusetts:A new lease amendment was signed to extend and expand the Company’s existing office space in Boston by 4,809 rentable square feet. At the time of signing, the renewal resulted in incremental future minimum rental payments of $6.6 million through June 2022. | |
● |
- A new lease amendment was entered into during November 2014 to renew the Company’s existing office space in Hyderabad. At the time of signing, the renewal resulted in incremental future minimum rental payments of $2.2 million over the non-cancelable lease term through November 2019. - A new lease agreement was entered into during |
● |
|
● |
| |
● | Norwalk, Connecticut:A new lease amendment was signed to extend and expand the Company’s office space at its headquarters in Norwalk by 9,587 rentable square feet. At the time of signing, the renewal resulted in incremental future minimum rental payments of $0.9 million through December 2019. | |
● | London, England:A new lease agreement was entered into |
At August 31, 2012,2015, the Company’s lease commitments for office space provide for the following future minimum rental payments under non-cancelable operating leases with remaining terms in excess of one year (in thousands):
Years Ended August 31, | Minimum Lease Payments | |||
2016 | $ | 22,695 | ||
2017 | 28,002 | |||
2018 | 27,373 | |||
2019 | 25,974 | |||
2020 | 20,129 | |||
Thereafter | 145,929 | |||
Total | $ | 270,102 | ||
| Years Ended August 31, | Minimum Lease Payments | ||
| 2013 | $ 27,592 | ||
| 2014 | 26,122 | ||
| 2015 | 21,771 | ||
| 2016 | 15,705 | ||
| 2017 | 14,441 | ||
| Thereafter | 35,540 | ||
| Total | $ 141,171 | ||
From time to time, FactSet is subjectissubject to legal proceedings, claims and litigation arising in the ordinary course of business, including intellectual property litigation.
Not applicable.
Part II
ITEM 5. MARKET FOR REGISTRANT’S COMMON EQUITY,RELATED STOCKHOLDER MATTERS AND ISSUER PURCHASES OF EQUITY SECURITIES
(a) | Market Information, Holders and Dividends |
Market Information -FactSet common stock is listed on the New York Stock Exchange and the NASDAQ Stock Market under the symbol “FDS.”FDS. The following table sets forth, for each fiscal period indicated, the high and low sales prices per share of the Company’s common stock as reported on the New York Stock Exchange.
| FIRST | SECOND | THIRD | FOURTH | |||||||||||||
| 2012 | ||||||||||||||||
| High | $ | 106.06 | $ | 95.52 | $ | 109.20 | $ | 108.00 | ||||||||
| Low | $ | 80.93 | $ | 85.45 | $ | 85.38 | $ | 88.56 | ||||||||
| 2011 | ||||||||||||||||
| High | $ | 90.82 | $ | 108.32 | $ | 112.40 | $ | 111.00 | ||||||||
| Low | $ | 74.17 | $ | 89.77 | $ | 96.49 | $ | 78.25 | ||||||||
Holders of Record–As of | |||||||||||||||||||||||||||||||||||||||||||||||||||||||||||||||||||||||||||||||||||||||||||||||||||||||||||||||||||||||||||||||||||||||||
Dividends -In fiscal 2012,2015, the Company’s Board of Directors declared the following dividends:
| Declaration Date | Dividends Per Share of Common Stock | Type | Record Date | Total Amount (in thousands) | Payment Date | ||||||
| August 8, 2012 | $ | 0.31 | Regular (cash) | August 31, 2012 | $ | 13,727 | September 18, 2012 | ||||
May 8, 2012(1) | $ | 0.31 | Regular (cash) | May 31, 2012 | $ | 13,893 | June 19, 2012 | ||||
| February 14, 2012 | $ | 0.27 | Regular (cash) | February 29, 2012 | $ | 12,085 | March 20, 2012 | ||||
| November 10, 2011 | $ | 0.27 | Regular (cash) | November 30, 2011 | $ | 12,181 | December 20, 2011 | ||||
Declaration Date | Dividends Per | Type | Record Date | Total Amount | Payment Date | ||||||
August 10, 2015 | $ | 0.44 | Regular (cash) | August 31, 2015 | $ | 18,179 | September 15, 2015 | ||||
May 12, 2015(1) | $ | 0.44 | Regular (cash) | May 29, 2015 | $ | 18,274 | June 16, 2015 | ||||
February 11, 2015 | $ | 0.39 | Regular (cash) | February 27, 2015 | $ | 16,236 | March 17, 2015 | ||||
November 12, 2014 | $ | 0.39 | Regular (cash) | November 28, 2014 | $ | 16,216 | December 16, 2014 | ||||
(1) | On May |
All of the above cash dividends were paid from existing cash resources. Future dividend payments will depend on the Company’s earnings, capital requirements, financial condition and other factors considered relevant by the CompanyFactSet and is subject to final determination by the Company’s Board of Directors.
(b) | Recent Sales of Unregistered Securities |
There were no sales of unregistered equity securities in fiscal 2015.
(c) | Issuer Purchases of Equity Securities |
The following table provides a month-to-month summary of the share repurchase activity under the current stock repurchase program during the three months ended August 31, 2012:2015 (in thousands, except per share data):
| Period | Total number of shares purchased | Average price paid per share | Total number of shares purchased as part of publicly announced plans or programs | Maximum number of shares (or approximate dollar value) that may yet be purchased under the plans or programs (in thousands)(1) | ||||||||||||
| June 2012 | 430,000 | $ | 93.15 | 430,000 | $ | 215,527 | ||||||||||
| July 2012 | 280,000 | $ | 92.01 | 280,000 | $ | 189,765 | ||||||||||
| August 2012 | - | - | - | $ | 189,765 | |||||||||||
| 710,000 | $ | 92.70 | 710,000 | |||||||||||||
Period | Total number | Average | Total number of shares purchased as part of publicly announced plans or programs | Maximum number of shares (or approximate dollar value) that may yet be purchased under the plans or programs(1) | ||||||||||||
June 2015 | 157,811 | $ | 164.02 | 157,811 | $ | 186,222 | ||||||||||
July 2015 | 271,572 | $ | 162.55 | 271,572 | $ | 142,678 | ||||||||||
August 2015 | 50,000 | $ | 168.76 | 50,000 | $ | 134,240 | ||||||||||
| 479,383 | $ | 163.68 | 479,383 | |||||||||||||
(1) | Repurchases |
Securities Authorized for Issuance under Equity Compensation Plans
Stock Performance Graph
The annual changes for the five-year period shown in the graph below are based on the assumption that $100 had been invested in FactSet common stock, the Standard & Poor’s 500 Index, the NYSE Composite Index and the Dow Jones U.S. Financial Services Index on August 31, 2007,2010, and that all quarterly dividends were reinvested at the average of the closing stock prices at the beginning and end of the quarter. The total cumulative dollar returns shown on the graph represent the value that such investments would have had on August 31, 2012.2015. Stockholder returns over the indicated period are based on historical data and should not be considered indicative of future stockholder returns.
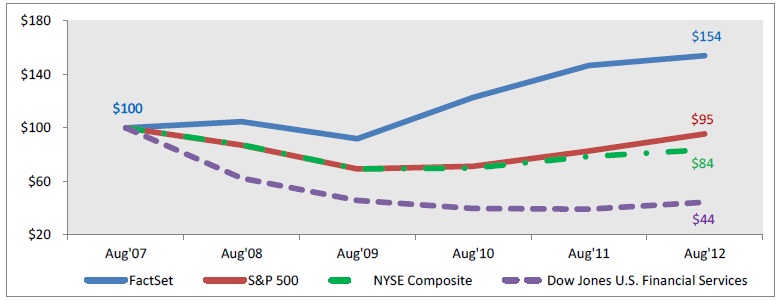
| For the Years Ended August 31, | |||||||||||||||||||
| 2012 | 2011 | 2010 | 2009 | 2008 | 2007 | ||||||||||||||
| FactSet Research Systems Inc. | $154 | $147 | $123 | $ 92 | $105 | $100 | |||||||||||||
| S&P 500 Index | $ 95 | $ 83 | $ 71 | $ 69 | $ 87 | $100 | |||||||||||||
| NYSE Composite Index | $ 84 | $ 78 | $ 70 | $ 69 | $ 87 | $100 | |||||||||||||
| Dow Jones U.S. Financial Services Index | $ 44 | $ 39 | $ 40 | $ 46 | $ 62 | $100 | |||||||||||||
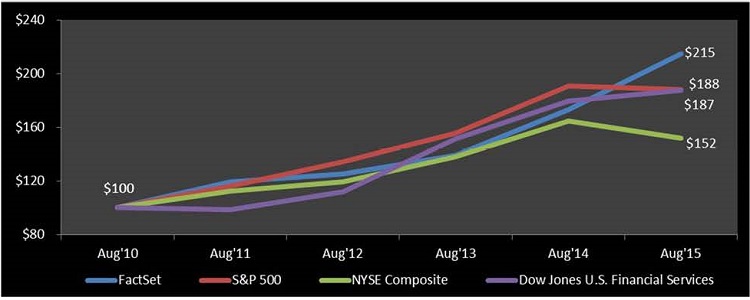
For the Years Ended August 31, | ||||||||||||||||||||||||
2015 | 2014 | 2013 | 2012 | 2011 | 2010 | |||||||||||||||||||
FactSet Research Systems Inc. | $ | 215 | $ | 173 | $ | 139 | $ | 125 | $ | 120 | $ | 100 | ||||||||||||
S&P 500 Index | $ | 188 | $ | 191 | $ | 156 | $ | 134 | $ | 116 | $ | 100 | ||||||||||||
NYSE Composite Index | $ | 152 | $ | 165 | $ | 138 | $ | 120 | $ | 112 | $ | 100 | ||||||||||||
Dow Jones U.S. Financial Services Index | $ | 187 | $ | 180 | $ | 151 | $ | 112 | $ | 99 | $ | 100 | ||||||||||||
The information contained in the above graph shall not been deemed to be soliciting material or filed or incorporated by reference in future filings with the SEC, or subject to the liabilities of Section 18 of the Securities Exchange Act of 1934, except to the extent that FactSet specificallyincorporates it by reference into a document filed under the Securities Actof 1933 or the Securities Exchange Act of 1934.
ITEM 6. SELECTED FINANCIAL DATA
The following selected financial data has been derived from FactSet’s consolidated financial statements.This financial data should be read in conjunction with Item 7,Management’s Discussion and Analysis of Financial Condition and Results of Operations and Item 8,Financial Statements and Supplementary Data, of this Annual Report on Form 10-K.
Consolidated Statements of Income Data
| (in thousands, except per share data) | Years Ended August 31, | |||||||||||||||||
| 2012 | 2011 | 2010 | 2009 | 2008 | ||||||||||||||
| Revenues | $ | 805,793 | $ | 726,510 | $ | 641,059 | $ | 622,023 | $ | 575,519 | ||||||||
| Operating income | 272,990 | 238,335 | (1) | 221,634 | 211,030 | 183,887 | (6) | |||||||||||
| Provision for income taxes | 85,896 | 67,912 | (2) | 71,970 | (4) | 67,172 | (5) | 64,030 | ||||||||||
| Net income | 188,809 | 171,046 | (3) | 150,211 | (4) | 144,950 | (5) | 125,017 | ||||||||||
| Diluted earnings per common share | $ | 4.12 | $ | 3.61 | (3) | $ | 3.13 | (4) | $ | 2.97 | (5) | $ | 2.50 | |||||
| Weighted average common shares (diluted) | 45,810 | 47,355 | 48,004 | 48,789 | 50,080 | |||||||||||||
| Cash dividends declared per common share | $ | 1.16 | $ | 1.00 | $ | 0.86 | $ | 0.76 | $ | 0.60 | ||||||||
| (in thousands) | August 31, | |||||||||||||||||
| 2012 | 2011 | 2010 | 2009 | 2008 | ||||||||||||||
| Cash and cash equivalents | $ | 189,044 | $ | 181,685 | $ | 195,741 | $ | 216,320 | $ | 143,018 | ||||||||
| Accounts receivable, net of reserves | 74,251 | 75,004 | 59,693 | 62,854 | 74,859 | |||||||||||||
| Goodwill and intangible assets, net | 289,162 | 274,575 | 274,170 | 227,705 | 246,113 | |||||||||||||
| Total assets | 694,143 | 657,440 | 644,608 | 633,952 | 587,274 | |||||||||||||
| Non-current liabilities | 28,703 | 32,829 | 32,926 | 33,760 | 29,177 | |||||||||||||
| Total stockholders’ equity | $ | 552,264 | $ | 515,188 | $ | 502,406 | $ | 500,829 | $ | 465,471 | ||||||||
(in thousands, except per share data) | Years Ended August 31, | ||||||||||||||||
2015 | 2014 | 2013 | 2012 | 2011 | |||||||||||||
Revenues | $ | 1,006,768 | $ | 920,335 | $ | 858,112 | $ | 805,793 | $ | 726,510 | |||||||
Operating income | 331,918 | (1) | 302,219 | 269,419 | (4) | 272,990 | 238,335 | (7) | |||||||||
Provision for income taxes | 92,703 | 91,921 | 72,273 | 85,896 | 67,912 | ||||||||||||
Net income | 241,051 | (2) | 211,543 | 198,637 | (5) | 188,809 | 171,046 | (8) | |||||||||
Diluted earnings per common share | $ | 5.71 | (3) | $ | 4.92 | $ | 4.45 | (6) | $ | 4.12 | $ | 3.61 | (9) | ||||
Weighted average common shares (diluted) | 42,235 | 42,970 | 44,624 | 45,810 | 47,355 | ||||||||||||
Cash dividends declared per common share | $ | 1.66 | $ | 1.48 | $ | 1.32 | $ | 1.16 | $ | 1.00 | |||||||
Consolidated Balance Sheet Data | |||||||||||||||||
(in thousands) | August 31, | ||||||||||||||||
2015 | 2014 | 2013 | 2012 | 2011 | |||||||||||||
Cash and cash equivalents | $ | 158,914 | $ | 116,378 | $ | 196,627 | $ | 189,044 | $ | 181,685 | |||||||
Accounts receivable, net of reserves | 95,064 | 90,354 | 73,290 | 74,251 | 75,004 | ||||||||||||
Goodwill and intangible assets, net | 348,339 | 327,463 | 280,796 | 289,162 | 274,575 | ||||||||||||
Total assets | 736,671 | 663,212 | 690,197 | 694,143 | 657,440 | ||||||||||||
Non-current liabilities | 65,307 | 24,839 | 30,165 | 28,703 | 32,829 | ||||||||||||
Total stockholders’ equity | $ | 531,584 | $ | 511,082 | $ | 541,779 | $ | 552,264 | $ | 515,188 | |||||||
(1) | Operating income in fiscal 2015 includes a pre-tax charges of $3.0 million related to the vesting of performance-based equity instruments and $3.2 million primarily from changes in the senior leadership responsible for the Company’s salesforce. |
(2) | Fiscal 2015 net income includes $2.1 million (after-tax) of incremental expenses related to the vesting of performance-based equity instruments, $2.2 million (after-tax) related to the changes in the senior leadership responsible for the Company’s salesforce and income tax benefits of $8.8 million primarily from the reenactment of the U.S. Federal R&D Tax Credit in December 2014, finalizing prior year tax returns and other discrete items. |
(3) | Diluted EPS for fiscal 2015 includes the net effect of a $0.21 increase in diluted EPS from the reenactment of the U.S. Federal R&D tax credit, finalizing prior year tax returns and other discrete items partially offset by a $0.05 decrease from the vesting of performance-based equity instruments and a $0.05 decrease from the changes in the senior leadership responsible for the Company’s salesforce. |
(4) | Operating income for fiscal 2013 includes pre-tax charges totaling $18.3 million related to the vesting of performance-based stock options granted in connection with the acquisitions of Market Metrics and StreetAccount. |
(5) | Fiscal 2013 net income includes $12.9 million (after-tax) of incremental expenses related to the vesting of performance-based stock options granted in connection with the acquisitions of Market Metrics and StreetAccount and income tax benefits of $7.2 million primarily from the reenactment of the U.S. Federal R&D tax credit in January 2013 and finalizing prior year tax returns. |
(6) | Diluted EPS for fiscal 2013 includes the net effect of a $0.29 decrease for the vesting of performance-based options partially offset by a $0.16 increase in diluted EPS from the reenactment of the U.S. Federal R&D tax credit and finalizing prior year tax returns. |
(7) | Fiscal 2011 operating income includes a pre-tax charge of $7.9 million related to an increase in the estimated number of performance-based stock options that will vest. The revised estimate reflects a higher performance level than previously estimated and accordingly, increased the number of performance-based options that will vest and be expensed. |
(8) | Net income for fiscal 2011 includes $5.4 million (after-tax) of incremental expenses related to an increase in the estimated number of performance-based stock options that will vest and income tax benefits of $6.3 million primarily from |
(9) | Included in fiscal 2011 diluted EPS were income tax benefits of |
Management’s Discussion and Analysis of Financial Condition and Results of Operations (“MD&A”) is designed to provide a reader of our financial statements with a narrative from the perspective of our management on our financial condition, results of operations, liquidity and certain other factors that may affect our future results. Our MD&A is presented in the following sections:
● | Executive Overview |
● | Results of Operations |
● | Liquidity |
● | Capital Resources |
● | Foreign Currency |
● | Off-Balance Sheet Arrangements |
● | Share Repurchase Program |
● | Contractual Obligations |
● | Dividends |
● | Significant Accounting Policies |
● | Critical Accounting Estimates |
● | New Accounting Pronouncements |
● | Market Trends |
● | Management Changes |
● | Forward-Looking Factors |
The MD&A should be read in conjunction with the Consolidated Financial Statements and related Notes included in Item 8,Financial Statements and Supplementary Data, of this Annual Report on Form 10-K.
Executive Overview
FactSet is a provider of integrated financial information and analytical applications to the global investment community. We combine content regarding companies and securities from major markets all over the globe into a single online platform of information and analytics. By consolidating content from hundreds of databases with powerful analytics, FactSet supports the investment process from initial research to published results for buy and sell-side professionals. These professionals include portfolio managers, research and performance analysts, risk managers, marketing professionals, sell-side equity research professionals, investment bankers and fixed income professionals. Our applications provide users access to company analysis,and industry analyses, multicompany comparisons, industry analysis, company screening, portfolio analysis, predictive risk measurements, alphatesting, portfolio optimization and simulation, real-time news and quotes and tools to value and analyze fixed income securities and portfolios. With Microsoft® Office integration, wireless access and customizable options, we offer a complete financial workflow solution. Our revenues are derived from month-to-month subscriptions to services, databases and financial applications. We generate 81%Investment management (buy-side) clients account for 82.5% of our revenues from investment management clients andannual subscription value (“ASV”), with the remainder is from investment banking firms who(sell-side) that perform Mergers & Acquisitions (“M&A&A”) advisory work, capital markets services and equity research.
2015 Year in Review
Fiscal 2015 was a successful year for FactSet as we once again attained record levels of revenue, operating income, net income and diluted earnings per share. This fiscal year marked our 37th year of operation, our 35th consecutive year of revenue growth and our 19th consecutive year of earnings growth as a public company. Our record results demonstrate the continued success of the FactSet brand. We grew organic ASV by $88.4 million compared to $64.6 million a year ago, which resulted in an organic ASV growth rate of 9.2%, up from 7.3% last year. Our ASV growth rate of 9.2% helped us surpass the $1 billion milestone in total ASV and end the year at $1.058 billion. The acceleration in ASV to 9.2% was also our highest rate of growth in over three years, while our 13.0% diluted earnings per share increase in the fourth quarter of fiscal 2015 represented our 21st consecutive quarter of double-digit adjusted EPS growth. In addition, clients and users reached record highs of 2,976 and 62,205, respectively, in fiscal 2015, including a quarterly record of 3,210 users during the fourth quarter.
Growth in each Key Metric
Growth during fiscal 2015 was driven by delivering comprehensive workflow solutions to our clients, improvements in the functionality of our product line including portfolio analytics, enhancements to our technological infrastructure, expansion of our proprietary data and a continued focus on client service. As a result, each of the following key operating metrics experienced growth over the past 12 months ($ in millions, except client and user counts):
Key Metric | 2015 | 2014 | Change | ||||||||||
ASV | $ | 1,057.8 | $ | 963.6 | 9.8%(1) | ||||||||
Revenues | $ | 1,006.8 | $ | 920.3 | 9.4% | ||||||||
Diluted EPS | $ | 5.71 | $ | 4.92 | 16.1% | ||||||||
Free Cash Flow(2) | $ | 280.8 | $ | 247.3 | 13.5% | ||||||||
Clients | 2,976 | 2,743 | 8.5% | ||||||||||
Users | 62,205 | 54,596 | 13.9% | ||||||||||
(1) | ASV grew 9.2% organically year over year. |
(2) | We define free cash flow as cash provided by operating activities, which includes the cash cost for taxes and changes in working capital, less capital expenditures. |
Additionally, our annual client retention was greater than 95% of ASV as of August 31, 2015, consistent with last year. However, when expressed as a percentage of clients, our annual retention rate was 94%, up from 93% a year ago.
Returning Value to Stockholders
On May 12, 2015, our Board of Directors approved a 12.8% increase in the regular quarterly dividend, beginning with the dividend payment in June 2015 of $0.44 per share, or $1.76 per share per annum. In addition, we repurchased 1.7 million shares for $252.8 million under the existing share repurchase program during fiscal 2015. With our dividends and share repurchases we have returned $322.8 million in the aggregate to stockholders over the past 12 months.
Capital Expenditures
Capital expenditures were $25.7 million during fiscal 2015, up from $17.7 million a year ago. Approximately $13.8 million, or 54%, of our capital expenditures during fiscal 2015 were for purchases of computer equipment. This expense included more servers for our existing data centers, purchasing laptop computers and peripherals for employees, upgrading existing computer systems and improving telecommunication equipment.The remaining 46% of our capital expenditures were used to build out our offices primarily in New York, New York, Austin, Texas and Manila, the Philippines during fiscal 2015.
Product Developments to Enhance our Workflow Solutions
At FactSet, we are dedicated to building tools to support the workflows of our traditional Asset Management and Investment Banking base, as well as to extend our core competency to encompass Wealth Managers, Sales & Trading, Private Equity and Hedge Funds. In fiscal 2015, we introduced unique product innovations and applications across our segments which have improved the speed, usability and discoverability of our workstation. In addition to making the application more intuitive, we also released new site-wide search functionality which allows users to discover reports and applications. In support of data integrity, we released FactSet Portfolio Services to offer robust and transparent data reconciliations and standardized custom reporting options across regions and asset classes. FactSet Geographical Revenue Exposure (GeoRev), a recently released data set, enhances the way a user can view company revenues by geographic country and regional categories.
Content and Technology
Our product capabilities and goals are not possible without investments in content. We are focused on metrics that measure the impact of our content used by our clients; timeliness, accuracy, completeness, coverage and usage. Highlights of fiscal 2015 enhancements to our proprietary content are as follows:
FactSet Enterprise Data Governance
As a major publisher of financial content, FactSet continues to optimize its data governance model by employing enterprise level standards for entity and security reference data. Leveraging these enterprise standards enables us to connect effectively all of its proprietary and third party content through a consistent reference data framework. This integration allows our client base to leverage FactSet content across multiple workflows via the creation of highly connected “smart data” sets. Users are able to extend analytics and alpha generation by identifying intelligent correlations amongst connected data points, uncover complex relationships amongst entities, securities, people and funds (hierarchies, supply chains, board relationships) and leverage data connectivity to drive risk and regulatory reporting (aggregation, conflict of interest, counterparty discovery).
FactSet Revere
During fiscal 2015, FactSet continued to invest in the Revere content product lines with enhancements includingFactSet Revere Hierarchy,a unique industry classification system that categorizes companies based on both their primary and secondary lines of business;FactSet Revere Segment Revenue (“SegRev”), which links a company’s as-reported business segment revenue and product categories to the FactSet Revere Hierarchy;FactSet Supply Chain Relationships, content that enables users to understand the performance and risk of a company by accessing its key customers, suppliers, competitors and partners; andFactSet Revere Business Industry Classification System (“FactSet RBICS”), which leverages the granularity of the FactSet Revere Hierarchy to classify companies by their primarily line of business. The database has 12 anchor sectors and is six levels deep with increasingly detailed layers of micro-industry groups.
FactSet Fundamentals
In fiscal 2015, we added banks to the Industry Metrics offering and metrics to the Oil & Gas and Metals & Mining offerings, bringing the key performance indicator coverage to seven industries, 5,600 active companies and 750 metrics. We also added over 2,600 companies to coverage for the standardized product, bringing the active universe to over 47,000 and the overall universe to 79,000.
FactSet CallStreet(Events and Transcripts)
This offering continues to provide high quality transcripts while maintaining industry standard timeliness metrics for raw and corrected earnings call transcripts for over 80% of the CallStreet universe. Coverage of transcripts and events grew 9% and 5%, respectively, during fiscal 2015.
FactSet Ownership
In fiscal 2015 this data set expanded to include fixed income funds. Fund holders of fixed income securities can be used in conjunction with other FactSet Ownership standard data feeds. With history starting from September 2013, the fixed income securities and funds included are global in scope, and both active and terminated securities and funds are included.
FactSet Infrastructure
The foundation to our product, content and technology goals is the focus on our infrastructure. We have invested a significant amount of resources in the evolution of our computing resources, storage capabilities, security posture and ability to scale. Part of this investment includes Project NextGen, which has helped us transition from large mainframe computers to a more distributed environment powered by a vast array of smaller, faster and more cost-effective machines. This new architecture will allow us to be more agile and respond to the market quickly going forward, as well as enabling us to build new products and features.
Continued Focus on Client Service
Client service is a vital component of our business model. We support our powerful information and analytical applications with a team of financial data and modeling experts. Client service is performed each and every day via email, text, instant messaging, or phone. Client touches are a key metric by which we measure the success of our service. According to our fiscal 2015 global client satisfaction survey, 97% of respondents were satisfied or very satisfied with FactSet’s support, consistent with the prior year. The depth of our knowledge, the data behind the models and the complex mathematics behind the answers each create an opportunity for us to forge close working relationships with our user community.
Our reward for investing in a consulting group comprised of approximately 1,400 individuals is client loyalty, as evidenced by an annual client retention rate of greater than 95% of ASV as of August 31, 2015. Our consulting teams have been trained to listen to our clients’ needs and transfer this knowledge directly to the product development teams, helping us transform suggestions into new or enhanced product offerings. Educating our clients is also an important component of our service. Not only do we teach our users the nuances of our software and content offerings, but FactSet personnel are often thought-leaders in a particular area of financial modeling in our rapidly evolving industry. As a result, clients look to FactSet as a trusted partner to stay on the cutting edge of financial modeling and analysis. During fiscal 2015, nearly 1,900 clients attended live or online FactSet training sessions; more than 6,000 investment bankers were trained on how to use our systems; clients completed 29,000 eLearning courses in our online library; and clients referenced our online help and reference library over 700,000 times.
Employees
Our industry-leading customer care is largely due to the talent of our employee population. As of August 31, 2012, we employed 5,735 employees,2015, employee headcount was 7,360, up 9% or 484 employees10.9% from a year ago. Of theseour total employees, 1,8402,238 were located in the U.S., 607832 in Europe and 3,2884,290 in Asia Pacific. Approximately 53%54% of our employees arewere involved with content collection, 25%24% work in product development, software and systems engineering, another 18%19% conduct sales and consulting services and the remaining 4% provide3% provided administrative support.
● | Ranked |
● | Named as one of the |
● | Recognized as one of |
● | Included in the “2015 Best Places to Work in France.” |
● | Named |
● | Listed in |
Results of Operations
For an understanding of the significant factors that influenced our performance during the past three fiscal years, the following discussion should be read in conjunction with the Consolidated Financial Statements and the Notes to Consolidated Financial Statements presented in this Annual Report on Form 10-K.
(in thousands, except per share data) Years Ended August 31, | 2012 | 2011 | Change | 2011 | 2010 | Change | ||||||||||||||||||
| Revenues | $ | 805,793 | $ | 726,510 | 10.9 | % | $ | 726,510 | $ | 641,059 | 13.3 | % | ||||||||||||
| Cost of services | 275,537 | 244,623 | 12.6 | % | 244,623 | 206,550 | 18.4 | % | ||||||||||||||||
| Selling, general and administrative | 257,266 | 243,552 | 5.6 | % | 243,552 | 212,875 | 14.4 | % | ||||||||||||||||
| Operating income | 272,990 | 238,335 | 14.5 | % | 238,335 | 221,634 | 7.5 | % | ||||||||||||||||
| Net income | $ | 188,809 | $ | 171,046 | 10.4 | % | $ | 171,046 | $ | 150,211 | 13.9 | % | ||||||||||||
| Diluted earnings per common share | $ | 4.12 | $ | 3.61 | 14.1 | % | $ | 3.61 | $ | 3.13 | 15.3 | % | ||||||||||||
| Diluted weighted average common shares | 45,810 | 47,355 | 47,355 | 48,004 | ||||||||||||||||||||
(in thousands, except per share data) Years Ended August 31, | 2015 | 2014 | Change | 2014 | 2013 | Change | ||||||||||||||||||
Revenues | $ | 1,006,768 | $ | 920,335 | 9.4% |
| $ | 920,335 | $ | 858,112 | 7.3% |
| ||||||||||||
Cost of services | 405,339 | 353,686 | 14.6% |
| 353,686 | 306,379 | 15.4% |
| ||||||||||||||||
Selling, general and administrative | 269,511 | 264,430 | 1.9% |
| 264,430 | 282,314 | (6.3)% |
| ||||||||||||||||
Operating income | 331,918 | 302,219 | 9.8% |
| 302,219 | 269,419 | 12.2% |
| ||||||||||||||||
Net income | $ | 241,051 | $ | 211,543 | 13.9% |
| $ | 211,543 | $ | 198,637 | 6.5% |
| ||||||||||||
Diluted earnings per common share | $ | 5.71 | $ | 4.92 | 16.1% |
| $ | 4.92 | $ | 4.45 | 10.6% |
| ||||||||||||
Diluted weighted average common shares | 42,235 | 42,970 | 42,970 | 44,624 | ||||||||||||||||||||
Revenues
Fiscal 20122015 compared to Fiscal 2011
Revenues in fiscal 20122015 were $805.8$1,006.8 million, up 10.9%9.4% compared to the prior year. Included in this total was $1.8 million from the acquisition of StreetAccount on June 29, 2012.fiscal 2014. Our revenue growth drivers during fiscal 20122015 were broad-based growth across all geographies, continued use of our advanced applications such as Portfolio Analysis, growthincreases in the number ofASV, clients and users, new features and enhancements toaccelerated demand for our competitive product suite, expanded deployment of our proprietary data, annual price increases, the ability to access FactSet for the iPad and the iPhone, increased usage of FactSet in Excel by both buy and sell-side users, growth in our Market Metrics business and an annual client retention rate that is greater than 95% of ASV and 92% in terms of clients. These revenue drivers were partially offset by TheMarkets.com cancellation of an earnings estimates feed from us.
(in thousands) Years Ended August 31, | 2012 | 2011 | 2010 | |||||||||
| U.S. | $ | 550,474 | $ | 497,564 | $ | 435,351 | ||||||
| % of revenues | 68.3 | % | 68.5 | % | 67.9 | % | ||||||
| Europe | $ | 197,404 | $ | 178,693 | $ | 161,649 | ||||||
| Asia Pacific | 57,915 | 50,253 | 44,059 | |||||||||
| International | $ | 255,319 | $ | 228,946 | $ | 205,708 | ||||||
| % of revenues | 31.7 | % | 31.5 | % | 32.1 | % | ||||||
| Consolidated | $ | 805,793 | $ | 726,510 | $ | 641,059 | ||||||
Annual Subscription Value
As of August 31, 2015, ASV was $1.058 billion, up 15.2%9.2% organically from a year ago. The foreign currency impact attributable to the change in the value of the Japanese Yen compared to the U.S. dollar increased revenues by $0.5 million in fiscal 2012. Holding currencies constant, Asia Pacific revenue growth year over year was 14.2%, primarily due to growth in our global content offering, the expansion of our real-time news and quotes that services the needs of a global investor, our ability to sell additional services to existing clients and new client and user growth over the last 12 months. In March 2012, we issued our annual price increase for the majority of our non-U.S. investment management clients resulting in incremental revenue of $1.4 million during fiscal 2012. Revenues from international operations accounted for 31.7% of our consolidated revenues during 2012, up from 31.5% in the year ago quarter.
($ in millions) As of August 31, | 2012 | 2011 | 2010 | 2009 | 2008 | 2007 | 2006 | 2005 | 2004 | |||||||||||||||||||||||||||
| Total ASV | $ | 843 | * | $ | 779 | $ | 684 | ** | $ | 623 | $ | 621 | $ | 517 | $ | 423 | $ | 348 | $ | 273 | ||||||||||||||||
| International ASV | $ | 271 | $ | 246 | $ | 218 | $ | 200 | $ | 195 | $ | 157 | $ | 126 | $ | 92 | $ | 56 | ||||||||||||||||||
($ in millions) | |||||||||||||||||
As of August 31, | Total ASV | % Organic Growth | Non-U.S. ASV | % of Total ASV Non-U.S. | |||||||||||||
2015 | $ | 1,058 | (1) | 9.2 | % | $ | 343 | 32.4 | % | ||||||||
2014 | $ | 964 | (2) | 7.3 | % | $ | 312 | 32.4 | % | ||||||||
2013 | $ | 888 | 5.9 | % | $ | 282 | 31.8 | % | |||||||||
2012 | $ | 843 | (3) | 6.8 | % | $ | 271 | 32.1 | % | ||||||||
2011 | $ | 779 | 13.6 | % | $ | 246 | 31.6 | % | |||||||||
2010 | $ | 684 | (4) | 7.3 | % | $ | 218 | 31.9 | % | ||||||||
2009 | $ | 623 | 0.8 | % | $ | 200 | 32.1 | % | |||||||||
2008 | $ | 621 | 17.6 | % | $ | 195 | 31.4 | % | |||||||||
2007 | $ | 517 | 21.9 | % | $ | 157 | 30.4 | % | |||||||||
2006 | $ | 423 | 18.5 | % | $ | 126 | 29.8 | % | |||||||||
(1) | Includes $10 millionfrom acquisitions completed in fiscal 2015, including Code Red. |
(2) | Includes |
(3) | Includes |
(4) | Includes $16 million from the acquisition of Market |
We believe that our organic ASV growth of 9.2% in fiscal 2015 and 7.3% in fiscal 2014 highlight the strength of our subscription business model. We continue to focus on expanding the business by providing superior analytical applications, premier global content and unmatched client service. The 9.2% increase in organic ASV during fiscal 2015 relates to broad-based global growth from both the buy and sell-side. We have seen accelerated demand for our fixed income portfolio products, PAsuite of products, sales of equity attribution and multi asset class risk models. Our stable of value-added products in the equity and fixed income analytics suite provided the company with strong sales in our European and Asia Pacific segments. Organic ASV growth of 9.2% excludes $10 million of ASV from acquisitions completed during fiscal 2015 and a $3.9 million detriment from foreign currency.
ASV from our U.S. operations was $572$714.8 million, up $288.7% organically from a year ago. International ASV totaled $343.1 million as of August 31, 2015, up 10.2% organically from a year ago excluding acquired StreetAccount ASV. ASV from international operations increased $25 million since the beginning of the fiscal year and totaled $271 million at August 31, 2012, representing 32%represented 32.4% of our Company-wide total. Organic ASV growth rates from buy and sell-side clients rose to 9.0% and 9.8%, respectively. The percentage of our total ASV derived from investment managementbuy-side clients increaseddecreased slightly from 79%82.6% a year ago to 81%82.5% at August 31, 2012.
Growth in the Number of Users and Clients of FactSet
During fiscal 2015, we added 183 net new clients (which excludes 50 new clients acquired from the acquisition of Code Red in February 2015), increasing the number of clients by 6.7% over the prior year. Including the 50 new clients from Code Red, our total client count was 2,976 as of August 31, 2015. The addition of new clients is important to us as we anticipate that it lays the groundwork to provide additional services in the future, consistent with our strategy of increasing sales of workstations, applications and content at our existing clients.Annual client retention as of August 31, 2015 was greater than 95% of ASV and 94% when expressed as a percentage of clients, an increase from 93% as of the end of fiscal 2014. We believe these statistics underscore the power of our business model, as the large majority of our clients maintain their subscriptions to FactSet throughout each year.At August 31, 2015, our largest individual client accounted for 2% of total subscriptions and annual subscriptions from our ten largest clients did not surpass 15% of total client subscriptions, consistent with the prior year.
At August 31, 2015, there were 62,205 professionals using FactSet, an increase of 7,609 users from a year ago. During the last twelve months, our investment management clients added 4,203 net new users, while our investment banking clients added 3,406 net new users. Our user count within the fourth quarter of fiscal 2015 alone increased by 3,210 users compared to 2,113 in the year ago fourth quarter, marking it our largest ever quarterly increase. Significant additions came from both our investment management and banking clients. The fourth quarter typically includes new users from both the buy and sell-side, as our larger clients bring in new hire classes and this quarter we saw sizable new hire classes at our banking clients. Growth during 2015 in both the IPO and M&A markets has also helped improve business for our banking clients. In addition, during the just completed fiscal year, we released a new user interface that emphasizes ease of use and search, which we believe contributed to our net user increase in ASVfiscal 2015.
Growth within Portfolio Analytics
Our PA suite of products, including our Fixed Income in PA product, continues to be well received within our client base and was a source of revenue growth during fiscal 2012 was driven by broad-based growth across geographical segments, continued use2015. Our clients have recognized the value of FactSet advancedthese applications such asand their capabilities in analyzing securities and portfolios. The PA expanded deploymentsuite includes separate products and covers a range of proprietary data, growth in theworkflows around portfolios. The number of clients and users increased usagesubscribing to PA, Fixed Income in PA, Style, Performance and Risk (“SPAR”), Risk and Portfolio Publishing continued to grow as this suite is comprehensive and includes highly desired applications for portfolio attribution, risk, quantitative analysis, portfolio publishing and returns based, style analysis. Clients continue to find value in our ability to serve as a single solution for their analytics, risk and publishing needs, over a variety of FactSet in Excel by both buyasset classes, which enables them to analyze securities and sell-side users, growthportfolios based on a variety of asset classes.
Increased Demand for Portfolio Services Solutions
Our solutions in the Market Metrics Local Market Share suitePortfolio Services space continued to do well. Our services offer turnkey integration, robust and transparent reconciliation and standardized and custom reporting options. Our team of products, a high annual client retention rate, annual price increases for the majorityspecialists monitors and remedies issues as they occur during all stages of the Company’s investment managementclient’s workflow, from data extraction to analytical enrichment, through report generation and data delivery. As clients look for areas to outsource services around data integration, enrichment, quality control and process monitoring, they are turning more and more to our managed services in this space.
Expansion of our Proprietary Content
Our proprietary content also continues to be a strong product line for us as well as a growing opportunity for us to expand our data feed business. We continue to be successful in licensing proprietary FactSet data, especially FactSet Fundamentals and FactSet Estimates, as our global content sales team pursues expanding the distribution of our content. This type of data is licensed in feed form and includes As-Reported Financials, ETF Data & Analytics, Enterprise Data Governance, CallStreet and Ownership. Data feeds are consumed by a wide range of clients, including existing large FactSet clients and some outside of our core client base that do not manage money or provide sell-side services. In addition, StreetAccount, our condensed news product, sells strongly across all FactSet user types and continues to be in demand due to the acquisitionability of StreetAccount in June 2012, which atour clients to receive up-to-the-minute news offered both through and outside the FactSet workstation.
Research Management Solutions (RMS)
On February 6, 2015, we acquired Code Red whose primary line of business is to provide research management technologies to the investment community, including endowments and foundations, institutional asset managers, sovereign wealth funds, pensions, and hedge funds. With the addition of Code Red to FactSet's existing research management solution, we now offer an RMS for all our clients' workflows. At the time of acquisition, Code Red had annual subscriptions of $11.4$9.3 million. These growthFor fiscal 2015, the acquisition of Code Red added incremental revenue of $5.2 million. Together with our Internal Research Notes product, our RMS solutions continued to grow, particularly in the fourth quarter, as clients now have a choice between our hosted and local solutions.
Effects of Foreign Currency
The positive revenue drivers disclosed above were partially offset by the impact of foreign currency, including a cancellationweaker Japanese Yen, British Pound Sterling and Euro. Foreign currency movements reduced revenues by $3.4 million during fiscal 2015 compared to a reduction of an earnings estimates feed$1.2 million in fiscal 2014.
Fiscal 2014 compared to TheMarkets.com asFiscal 2013
Revenues in fiscal 2014 were $920.3 million, up 7.3% compared to fiscal 2013. Revenue growth drivers during fiscal 2014 were the addition of 200 new clients and 3,628 users, a result7.3% increase in organic ASV, continued growth in our Portfolio Analytics suite of its acquisition by Standard & Poor’s Capital IQproducts, rising sales of our wealth management workflow solution, expansion of proprietary content, stabilization within sell-side client base and incremental revenues from the acquisitions of Revere and Matrix. Organic ASV growth of 7.3% excludes $12 million of ASV acquired from Revere and Matrix during fiscal 2014 and a decline$0.8 million detriment from foreign currency.
Revenues by Geographic Region
(in thousands) Years Ended August 31, | 2015 | 2014 | 2013 | |||||||||
U.S. | $ | 678,774 | $ | 624,642 | $ | 586,865 | ||||||
% of revenues | 67.4 | % | 67.9 | % | 68.4 | % | ||||||
Europe | $ | 251,522 | $ | 227,395 | $ | 208,827 | ||||||
Asia Pacific | 76,472 | 68,298 | 62,420 | |||||||||
International | $ | 327,994 | $ | 295,693 | $ | 271,247 | ||||||
% of revenues | 32.6 | % | 32.1 | % | 31.6 | % | ||||||
Consolidated | $ | 1,006,768 | $ | 920,335 | $ | 858,112 | ||||||
Fiscal 2015 compared to Fiscal 2014
Revenues from our U.S. segment increased 8.7% to $678.8 million in ASV from investment banking clientsfiscal 2015 compared to $624.6 million a year ago. Our fiscal 2015 U.S. revenue growth rate of 8.7% reflects increases in the past 12 months asnumber of users and clients of FactSet within the banksU.S., a rise in sales of our PA suite of products, continued their reduction in spendingdemand for our proprietary content, $5.2 million of incremental revenue from the acquisition of Code Red and hiring. As noted earlier, in January 2012, we issued annual price increases fora strong performance by our U.S. investment management clients resultingsales team. Our U.S. buy-side sales team has seen sustained demand for our fixed income portfolio products, multi-asset class risk and stress testing, attribution and publishing products. Revenues from our U.S. operations accounted for 67.4% of our consolidated revenues during fiscal 2015, down from 67.9% a year ago, as our international ASV growth rate surpassed our U.S. ASV growth rate by 150 basis points.
International revenues increased 10.9% to $328.0 million during fiscal 2015. Excluding negative foreign currency effects of $3.4 million, the year over year international revenue growth rate was 12.1%, which was comprised of 11.0% for Europe and 15.5% for Asia Pacific.Revenues from international operations accounted for 32.6% of our consolidated revenues during fiscal 2015, up from 32.1% a year ago.
European revenues advanced 10.6% year over year which was attributable to increases in client and user counts, continued growth in ASV from European sell-side clients and robust sales of PA subscriptions, partially offset by the negative effects of foreign currency. Foreign currency exchange rate fluctuations reduced our European growth rate by 40 basis points. The Asia Pacific revenue growth rate of $1012.0% was primarily due to net new user and client growth, increased PA subscriptions and our proficiency in selling additional services to existing clients, partially offset by negative foreign currency impact attributable to the change in the value of the Japanese Yen compared to the U.S. dollar. Foreign currency exchange rate fluctuations reduced our Asia Pacific growth rate by 350 basis points.
Fiscal 2014 compared to Fiscal 2013
Revenues from our U.S. segment increased 6.4% to $624.6 million in fiscal 2014 compared to $586.9 million in fiscal 2013. Revenue growth was driven by the addition of users and clients, sales of our PA suite of products, growth in March 2012, we issued annual price increasesour wealth management solutions, increased demand for our non-U.S. investment management clients increasing ASVproprietary content, and increment revenue from the Revere acquisition, which increased our U.S. growth rate by $3 million.
Operating Expenses
(in thousands) Years Ended August 31, | 2012 | 2011 | 2010 | |||||||||
| Cost of services | $ | 275,537 | $ | 244,623 | $ | 206,550 | ||||||
| Selling, general and administrative | 257,266 | 243,552 | 212,875 | |||||||||
| Total operating expenses | $ | 532,803 | $ | 488,175 | * | $ | 419,425 | |||||
| Operating income | $ | 272,990 | $ | 238,335 | $ | 221,634 | ||||||
| Operating Margin | 33.9 | % | 32.8 | % * | 34.6 | % | ||||||
(in thousands) Years Ended August 31, | 2015 | 2014 | 2013 | ||||||
Cost of services | $ | 405,339 | $ | 353,686 | $ | 306,379 | |||
Selling, general and administrative (“SG&A”) | 269,511 | 264,430 | 282,314 | ||||||
Total operating expenses | $ | 674,850 | (1) | $ | 618,116 | $ | 588,693 | (2) | |
Operating income | $ | 331,918 | $ | 302,219 | $ | 269,419 | |||
Operating Margin | 33.0 | % | 32.8 | % | 31.4 | % | |||
(1) | Total operating expenses in fiscal 2015include an incremental $3.0 million from the vesting ofperformance-based equity instruments and $3.2 million related tochanges in the senior leadership responsible for the Company’s salesforce. Of this total, $3.8 million was reported within SG&A expenses with the remainder in cost of services. |
(2) | Total operating expenses in fiscal 2013 includean incremental $18.3million from the vesting of performance-based stock options granted in connection with the acquisition of Market Metrics andStreetAccount. Of this total charge, $16.4 million was reported within SG&A expenses. |
Cost of Services
Fiscal 20122015 compared to Fiscal 2011
Cost of services increased 12.6%14.6% to $275.5$405.3 million as compared to $244.6 million in the same period a year ago. CostExpressed as a percentage of revenues, cost of services was 40.3% in fiscal 2015, an increase of 190 basis points from a year ago. The increase was driven by higher employee compensation, including stock-based compensation, partially offset by lower computer depreciation.
Employee compensation, including stock-based compensation, when expressed as a percentage of revenues, was 34.2%increased 210 basis points during fiscal 2012,2015due to new classes of consultants, engineers and product developers hired in the past 12 months, new additions at our proprietary content collection locations, the addition of 32 employees from the Code Red acquisition, an increase in variable compensation and annual base salary increases. Over the last 12 months, we have added 344 net new employees involved with content collection, 252 net new engineering and product development employees and 124 net new consultants, as we continue to focus on servicing our existing client base, expanding our content and improving our applications. In addition, of the total incremental $6.2 million expense recorded in fiscal 2015 from the vesting of performance-based equity instruments and changes in the senior leadership responsible for the Company’s salesforce, $2.4 million was reported within cost of services. Expenses associated with the operation of the Code Red business increased cost of services by $3.5 million during fiscal 2015 due to compensation paid to the acquired workforce, including stock-based compensation from equity based awards granted, amortization of acquired intangible assets and computer-related expenses.
Partially offsetting the growth in cost of services during fiscal 2015 was a reduction in computer depreciation expense, which decreased 20 basis points in fiscal 2015 compared to a year ago. This decrease was primarily due to the continued use of fully depreciated equipment and our transition to more efficient and cost-effective servers in our data centers.
Fiscal 2014 compared to Fiscal 2013
Cost of services increased 15.4% to $353.7 million in fiscal 2014 as compared to fiscal 2013. Expressed as a percentage of revenues, cost of services was 38.4% in fiscal 2014, an increase of 50270 basis points over the prior year duefrom fiscal 2013. The increase was driven by higher employee compensation, expense associated with new hires in consulting, engineeringadditional third party data costs and content as well as an uptick in dataincremental costs from the Revere and Matrix acquisitions, partially offset by lower computer depreciation, a decline in intangible assets amortization expense and a prior year stock-based compensation charge.
Employee compensation, including stock-based compensation, expressed as a percentage of revenues, increased 115300 basis points during fiscal 2012 compared2014.Excluding compensation attributable to the same period a year ago from new hiresacquired Revere and Matrix workforces, the increase in software engineeringemployee compensation was 250 basis points largely due to increased employee headcount and consulting, increased headcount in our proprietary content collection operations located in India and the Philippines andannual employee base salary increases year over year. Over the last 12 monthsincreases. In fiscal 2014, we have increased our headcount at our facilities in India and the Philippines by 215. At August 31, 2012, approximately 53% of our employees were involved with content collection. In addition to the hiring of employees at our primary content collection sites, we grew by approximately 210hired 202 net new engineeringsoftware engineers and product development employees and 3070 net new consultants, indedicated to the past year, as we continue to improvedevelopment, enhancement and support of our applications and service our existing client base. Higher compensation was partially offset by lower stock-based compensation expense in fiscal 2012 as the year ago period included a pre-tax charge of $7.9 million related to an increase in the estimated number of performance-based options scheduled to vest (approximately $1.9 million of the total pre-tax charge of $7.9 million was recorded within cost of services). Dataproducts. Third party data costs when expressed as a percentage of revenues increased 1510 basis points during fiscal 2014. Many of our data contracts are driven by our user and client count, so as we continue to grow in these metrics, so do our data-related costs. User count rose by 7% while clients grew 10% in fiscal 2014, thus driving up our third party data costs. Expenses associated with the operations of Revere and Matrix increased the cost of services, when expressed as a percentage of revenues, by 80 basis points during fiscal 2014 due to compensation paid to the acquired workforce, stock-based compensation from equity-based awards granted, incremental third party data costs and amortization of acquired intangible assets.
Partially offsetting the growth in cost of services during fiscal 2014 was a reduction in computer-related expenses. Computer-related expenses, including computer depreciation and maintenance costs, decreased 30 basis points in fiscal 2012 compared to the same period a year ago due to our growing user base, the continued expansion of our third party data set offerings and incremental Market Metrics data collection costs. As the result of us adding 155 clients and 1,400 users in the past 12 months, we incurred incremental variable fees payable to data vendors based on deployment of their content over the FactSet platform.
Selling, General and the use of fully depreciated servers. The cost per server and related maintenance continues to decline as we have become more efficient in our data centers. Amortization of intangible assets declined 25 basis points from a year ago as additional intangible assets became fully amortized during 2012, while revenues increased over the same period by 11%. Amortization expense from intangible assets acquired from the StreetAccount acquisition in June 2012 was not material to fiscal 2012.
Fiscal 20112015 compared to Fiscal 2010
SG&A expenses increased 18%1.9% to $244.6$269.5 million during fiscal 2015 as compared to $264.4 million in fiscal 2011 as compared to $206.6 million in fiscal 2010. Cost of services expressed as a percentage of revenues was 33.7% during fiscal 2011, an increase of 150 basis points from 2010. The increase year over year was driven by higher employee compensation, including performance-based stock option expense, partially offset by lower levels of third party data costs, computer-related expenses and communication costs.
Employee compensation, including stock-based compensation, when expressed as a percentage of revenues, decreased 150130 basis points in fiscal 2012 due to decreased variable compensation and lower stock option expense due to a charge for vesting of performance options last year. Approximately $6.0 million of the total pre-tax stock-based compensation charge of $7.9 million was recorded within SG&A during fiscal 2011. In the past 12 months, the majorityhigher percentage of our hiringemployee base working in a cost of services capacity versus SG&A. Of our total employee headcount increase in fiscal 2015, 84% was within our software engineering, content collection and product development teams, which isare all included within cost of services. As such, SG&A expenses, expressed as a percentage of revenues, hasemployee compensation declined compared to the growth in cost of services. T&EOccupancy costs, when expressed as a percentage of revenues, decreased 5060 basis points, in the fiscal 2012 compared to the same period in fiscal 2011 primarily due to lower interoffice travel and a prior year internal sales conference that did not reoccur in fiscal 2012. Occupancy costs, including rent and depreciation of furniture and fixtures, expressed as a percentageleasehold improvements becoming fully depreciated, lower rent expense from the strengthening of revenues, decreased 30 basis points in fiscal 2012 due to more efficient use of existing leased office spacethe U.S. dollar and the timing of acquiring new real estate space. However, lowercertain occupancy costs, in fiscal 2012such as rent, are temporary and are being driven by the timing of acquiring new space and favorable currency rates.
Fiscal 20112014 compared to Fiscal 2010
SG&A expenses decreased 6.3% to $264.4 million during fiscal 2014 as compared to $282.3 million in fiscal 2011 were up 14% from fiscal 2010.2013. Expressed as a percentage of revenues, SG&A expenses rose 30decreased 420 basis points to 33.5% in28.7% for fiscal 2011 from higher T&E expenses, increased2014 due to lower employee compensation, including stock-based compensation from performance-based stock options and a full year of expense from the acquisition of Market Metrics partially offset by hedging gainshigher employee travel and a decrease in marketing costs.
Employee compensation expense reflects the incremental charge from performance-based stock options. Of the total pre-tax charge of $7.9 million related to an increase in the estimated number of performance-based options that will vest, $6.0 million was recorded within SG&A. Market Metrics was acquired on June 1, 2010 resulting in incremental SG&A expenses in 2011 as compared to 2010, primarily within employee compensation, office expenses and T&E.
Partially offsetting the overall decrease in SG&A expenses was higher T&E expense, which rose by 20 basis points when expressed as a percentage of revenues. The primary drivers for this increase were more client visits by our salesforce, higher plane and hotel prices and increased interoffice travel due to the prior year launch of the new FactSet and the related costs to market the new release.
Operating Income and Operating Margin
Fiscal 20122015 compared to Fiscal 2011
Operating income advanced 14.5%increased 9.8% to $273.0$331.9 million for the twelve months ended August 31, 2012in fiscal 2015 compared to the prior year. Our operating margin duringfor fiscal 20122015 was 33.9%33.0%, up 110 basis points from 32.8% a year agoago. Operating margin in fiscal 2015 was negatively impacted by a $3.2 million pre-tax charge related to changes in the senior leadership of our sales teams and a $3.0 million pre-tax charge primarily related to the vesting of performance-based equity instruments. Operating income in fiscal 2014 included $3.0 million of pre-tax charges related to vesting of performance-based equity instruments and the settlement of a legal claim. Excluding these charges, our fiscal 2015 adjusted operating margin was 33.6% compared to the fiscal 2014 adjusted operating margin of 33.2%. Revenue growth of 9.4% and net foreign currency benefits totaling of $11.2 million aided our current year operating margin expansion.
Fiscal 2014 compared to Fiscal 2013
Operating income increased 12.2% to $302.2 million in fiscal 2014 compared to fiscal 2013. Our operating margin for fiscal 2014 was 32.8%, up from 31.4% in fiscal 2013. Operating income reported in fiscal 2013 includes a Market Metrics and StreetAccount performance-based stock option charge of $18.3 million ($1.9 million within cost of services and $16.4 million in SG&A), which reduced our operating margin by 210 basis points. The fiscal 2014 operating margin was 70 basis points lower than the fiscal 2013 adjusted operating margin of 33.5% (as calculated by adding back the $18.3 million stock-based compensation charge), due to lower stock-basedhigher T&E expenses, a rise in third-party data costs, incremental employee compensation expense, a reduction T&E spending, more efficient occupancy costswithin cost of services and a decline in computer depreciationimpact from our Revere and Matrix acquisitions, which lowered the amortization of intangible assets.fiscal 2014 operating margin by 80 basis points. These reductions in expenses were partially offset by highera 7.3% increase in revenues, a reduction in computer-related expenses and lower SG&A employee compensation due to expanding the number of employees in all areas throughout the world, including within our content operations, engineering, product development and consulting groups. The continued investment in our personnel resulted in employee count growth of 9% year over year and was driven by hiring in our India and Philippines operations, as well as the hiring of consultants and software engineers in each geographic region. The impact from foreign currency increased fiscal 2012 operating income by $1.3 million compared to a $0.1 million decrease in operating income during fiscal 2011.compensation.
Operating Income by Segment
(in thousands) Years Ended August 31, | 2012 | 2011 | 2010 | |||||||||
| U.S. | $ | 149,968 | $ | 135,327 | $ | 124,976 | ||||||
| Europe | 95,417 | 79,637 | 72,239 | |||||||||
| Asia Pacific | 27,605 | 23,371 | 24,419 | |||||||||
| Consolidated | $ | 272,990 | $ | 238,335 | $ | 221,634 | ||||||
(in thousands) Years Ended August 31, | 2015 | 2014 | 2013 | |||||||||
U.S. | $ | 172,980 | $ | 165,004 | $ | 138,706 | ||||||
Europe | 116,310 | 100,937 | 100,187 | |||||||||
Asia Pacific | 42,628 | 36,278 | 30,526 | |||||||||
Consolidated | $ | 331,918 | $ | 302,219 | $ | 269,419 | ||||||
Our reportableoperating segments are aligned with how we including our chief operating decision maker, manage the business and the demographic markets in which we serve. Our internal financial reporting structure is based on three reportable segments;segments, U.S., Europe and Asia Pacific, which we believe helps us better manage the business and view the markets we serve. Sales, consulting, data collection, product development and software engineering are the primary functional groups within each segment. Each segment records compensation expense, including stock-based compensation, data collection costs, amortization of intangible assets, depreciation of furniture and fixtures, amortization of leasehold improvements, communication costs, professional fees, rent expense, travel, marketing, office and other direct expenses. Expenditures associated with the Company’sour data centers, third party data costs and corporate headquarters charges are recorded by the U.S. segment and are not allocated to the other segments.
Fiscal 20122015 compared to Fiscal 2011
Operating income from our U.S. business increased 11%advanced 4.8% to $150.0$173.0 million during fiscal 20122015 compared to $135.3$165.0 million a year ago. The increase in operating income wasis primarily dueattributable to $52.9$54.1 million of incremental revenues lower interoffice travel, a prior year internal U.S. sales conference that did not reoccur in fiscal 2012, lower computer depreciation and a declinedecrease in intangible asset amortization expensecomputer depreciation partially offset by highera rise in employee compensation within cost of services and an increase in data costs. Ourexpense. U.S. revenue growth of 10.6% in the U.S. reflects strong client and user count growth, the expanded deployment of our proprietary content, an increasewas driven by increases in the number of users and clients of FactSet within the U.S., a rise in sales of our PA users, annual price increases,suite of products, continued demand for our proprietary content, $5.2 million of incremental revenues from Market Metrics and $1.8 million in revenuesrevenue from the acquisition of StreetAccount.Code Red and a strong performance by our U.S. investment management sales team. Excluding the acquired Code Red workforce, U.S. employee headcount increased 7.0% over the prior year, leading to higher employee compensation costs during fiscal 2015. Computer-related expenses decreased due to the transition to more efficient and cost-effective servers in our data centers in addition to the continued use of fully depreciated servers.
European operating income increased 15.2% during fiscal 2015 to $116.3 million due to revenue growth of 10.6% and the effects of favorable foreign currency fluctuations on our expense base partially offset by increases in employee compensation, third-party data costs and occupancy expenses. The higher employee compensation costs were due to a 17.5% increase in headcount over the prior year. The increase in occupancy costs, which includes rent expense, was due to an increase in leased space, in London. Finally, the increased third-party data costs were due to the increased number of users year over yearas many of our data contracts are driven by our user and client count.
Asia Pacific operating incomeincreased 17.5% to $42.6 million compared to $36.3million a year ago. The increase was due to incremental revenues of $8.2 million and the effects of favorable foreign currency fluctuations on our expense base, partially offset by higher employee compensation. The higher employee compensation costs were due an 11.0% increase in headcount from the prior year.
Fiscal 2014 compared to Fiscal 2013
Operating income from our U.S. business rose 19.0% to $165.0 million during fiscal 2014 compared to $138.7 million in fiscal 2013. The increase in operating income is attributable to $37.8 million of incremental revenues, a decrease in computer-related expenses, including computer depreciation and a fiscal 2013 pre-tax charge of $18.3 million related to the vesting of performance-based stock options, which did not recur in fiscal 2014. Of the total pre-tax stock-based compensation charge of $18.3 million, $18.1 million was recorded within the U.S. segment as it related to primarily U.S.-based businesses. Operating income growth was partially offset by increases in employee compensation within cost of services, a rise in T&E expenses, incremental legal fees, and additional expenses from the Revere acquisition. U.S. revenue growth was driven by an increase in the number of clients and users of FactSet, the continued use of our advanced applications such as PA and growth in sales of wealth management. Excluding the acquired Revere workforce, U.S. employee headcount increased 7% over the prior year6.8% in fiscal 2014 leading to higher employee compensation costscosts. Computer-related expenses decreased due to the transition to more efficient and cost-effective servers in our data centers in addition to the continued use of fully depreciated servers. Additional expenses from the acquisition of Revere lowered U.S. operating income by $1.0 million for fiscal 2012.
European operating income increased 20% to $95.4 millionadvanced 70 basis points during fiscal 2012 compared2014 to $100.9 million due to revenue growth of 8.9% partially offset by increases in employee compensation and the same period a year ago. The increase inimpact of the Matrix acquisition. Additional expenses from the acquisition of Matrix lowered European operating income is due to an $18.7 million increase in revenues, lower employee variable compensation expense, a reduction in T&E spending and lower amortization expense as previously acquired intangible assets become fully amortized. European revenues advanced 10.5% to $197.4 million due to our broader selection of global proprietary content, an annual price increase for the majority of our non-U.S. investment management clients in March 2012, increases in user and client counts and clients licensing our advanced applications.by $2.1 million.
Asia Pacific operating income increased 18%18.8% to $27.6$36.3 million compared to $30.5 million in fiscal 2013 due to incremental revenues of $5.9 million partially offset by higher employee compensation. The Asia Pacific revenues growth of 9.4% during fiscal 2012 compared2014 was driven by our ability to $23.4 million in the same period a year ago. The increase in Asia Pacific operating income was from $7.7 million of incremental revenues year over year and a more disciplined approach to controlling operating expenses, including T&E. Asia Pacific revenue growth year over year of 15.2% was due to growth insell our global content, offering, the expansion into new markets within Asia, sales of our real-time news and quotes that services the needs of a global investor, our ability to sell additional services to existing clients, and new client and user growth over the last 12 months.
Income Taxes, Net Income and Diluted Earnings per Share
(in thousands, except per share data) Years Ended August 31, | 2012 | 2011 | 2010 | |||||||||
| Other income | $ | 1,715 | $ | 623 | $ | 547 | ||||||
| Provision for income taxes* | $ | 85,896 | $ | 67,912 | $ | 71,970 | ||||||
| Net income | $ | 188,809 | $ | 171,046 | $ | 150,211 | ||||||
| Diluted earnings per common share | $ | 4.12 | $ | 3.61 | $ | 3.13 | ||||||
| Effective Tax Rate* | 31.3 | % | 28.4 | % | 32.4 | % | ||||||
(in thousands, except per share data) Years Ended August 31, | 2015 | 2014 | 2013 | ||||||||
Provision for income taxes | $ | 92,703 | (1) | $ | 91,921 | $ | 72,273 | (2) | |||
Net income | $ | 241,051 | $ | 211,543 | $ | 198,637 | |||||
Diluted earnings per common share | $ | 5.71 | $ | 4.92 | $ | 4.45 | |||||
Effective Tax Rate | 27.8 | % | (1) | 30.3 | % | 26.7 | % | (2) | |||
(1) | Included in thefiscal 2015 provision for income taxes were income tax benefits of $8.8 million primarily fromfinalizing prior year tax returns, the reenactment of the U.S. Federal R&D tax credit inDecember 2014,and other discrete items. |
(2) | Included in the fiscal 2013 provision for income taxes were income tax benefits of $7.2 million primarily from the reenactment of the U.S. Federal R&D tax credit in January 2013 and finalizing prior year tax returns. |
Income Taxes
Fiscal 2015 compared to Fiscal 2014
The fiscal 2015 provision for income taxes during fiscal 2011 werewas $92.7 million, up from $91.9 million a year ago. The 0.9% increase was due to a 10.0% increase in pre-tax income tax benefits of $6.3 million fromoffset by the finalization of the fiscal 2010 tax return and the reenactment of the U.S. Federal R&D tax credit in December 2010. Our effective tax rate is based on current enacted tax laws and as such, prior to the second quarter of fiscal 2011, it did not reflect the R&D tax credit in any months of fiscal 2011 as the R&D credit expired on December 31, 2009.2014. The reenactment of the credit was retroactive to January 1, 20102014 and resulted in an actualextended through the end of the 2014 calendar year. Prior to the reenactment of the tax credit, we had not been permitted to factor it into our effective tax rate because it was not enacted tax law. The reenactment resulted in a discrete income tax benefit of 28.4% for the full$5.1 million during fiscal 2011 year.
Fiscal 20122014 compared to Fiscal 2011
The fiscal 2012 due to our $15 million purchase of short-term certificates of deposit in October 2011. These deposits have maturities of less than one year and resulted in interest income of $1.1 million during fiscal 2012. Excluding our returns on the short-term certificates of deposit, our average annualized return on cash and cash equivalents remained relatively flat at 32 basis points during fiscal 2012, compared to 33 basis points in fiscal 2011. At no time during fiscal 2012 and 2011 did a component of our cash, cash equivalents and investments portfolio experience a decline in value due to a ratings change, default or increase in counterparty credit risk.
Net Income and Diluted Earnings per Share
Fiscal 20112015 compared to Fiscal 2010
Net income increased R&D activity which increased our related R&D tax credit and a rise in our domestic production activities (Section 199) deduction.
Fiscal 2014 compared to vest. Drivers of netFiscal 2013
Net income increased 6.5% to $211.5 million and diluted earnings per share growthincreased 10.6% to $4.92 during fiscal 2014 as compared to fiscal 2013. Drivers of the increase included a 7.3% rise in revenues, lower stock-based compensation as a result of the fiscal 2012 were higher levels2013 after-tax charge of revenue, lower T&E, decreased computer depreciation and amortization of intangible assets$12.9 million and a reduction3.7% decrease in the diluted weighted average shares outstanding from share repurchases. These increases were partially offset by higher compensation and a higher annual effective tax rate due tofrom the expiration of the U.S. Federal R&D tax credit.
Liquidity
The table below, for the periods indicated, provides selected cash flow information (in thousands):
Years Ended August 31, | 2015 | 2014 | 2013 | |||||||||
Net cash provided by operating activities | $ | 306,442 | $ | 265,023 | $ | 269,809 | ||||||
Capital expenditures(1) | (25,682 | ) | (17,743 | ) | (18,517 | ) | ||||||
Free cash flow(2) | $ | 280,760 | $ | 247,280 | $ | 251,292 | ||||||
Net cash used in investing activities | $ | (64,877 | ) | $ | (70,708 | ) | $ | (20,412 | ) | |||
Net cash used in financing activities | $ | (187,326 | ) | $ | (276,729 | ) | $ | (238,408 | ) | |||
Cash and cash equivalents at end of year (August 31) | $ | 158,914 | $ | 116,378 | $ | 196,627 | ||||||
(1) | Included in net cash used in investing activities during each fiscal year reported. |
(2) | We define free cash flow as cash provided by operating activities, which includes the cash cost for taxes and changes in working capital, less capital expenditures. The presentation of free cash flow is not intended to be considered in isolation or as a substitute for the financial information prepared and presented in accordance with GAAP. We use free cash flow, a non-GAAP measure, both in presenting our results to stockholders and the investment community, and in our internal evaluation and management of the business. Management believes that this financial measure and the information we provide are useful to investors because it permits investors to view our performance using the same metric that we use to gauge progress in achieving our goals. Free cash flow is also an indication of cash flow that may be available to fund further investments in future growth initiatives. |
Fiscal 20112015 compared to Fiscal 2010
Cash and cash equivalents aggregated to $171.0$158.9 million or 22% of our total assets at August 31, 2015, compared with $116.4 million or 18% of our total assets August 31, 2014. Our cash and cash equivalents increased $42.5 million during fiscal 2015 due to cash provided by operations of $306.4 million, $71.5 million in proceeds from the exercise of employee stock options, $35.0 million in proceeds from long-term debt and $28.9 million in tax benefits from share-based payment arrangements. These cash inflows are partially offset by $34.8 million in cash paid to acquire businesses, $252.8 million in share repurchases, dividend payments of $66.6 million, capital expenditures of $25.7 million and diluted earnings per share increased 15%purchases of investments, net of proceeds, of $4.4 million.
Free cash flow for fiscal 2015 was $280.8 million, exceeding net income by 16%. Free cash flow generated during fiscal 2015 was attributable to $3.61$241.1 million of net income, $37.6 million of positive working capital changes and $27.8 million in fiscal 2011 compared to fiscal 2010. As mentioned above, fiscal 2011 includednon-cash expenses less $25.7 million in capital expenditures.Working capital improvements were derived from lower income tax benefitspayments and increased accounts payable and accrued expenses due to the timing of $0.13 per diluted sharepayments partially offset by a pre-tax chargerise in accounts receivable compared to the prior year. The rise in accounts receivable was due to our year over year revenue growth. Our accounts receivable balance as of August 31, 2015 rose by only 5.2% compared to the year ago period, while revenue growth grew by 9.4% year over year. This fact pattern was primarily due to a decrease in our days sales outstanding (“DSO”), which was lowered to 33 days as of August 31, 2015 compared to 34 days as of August 31, 2014.
Net cash used in investing activities was $64.9 million during fiscal 2015, a decrease of $5.8 million over the prior year due to a $12.1 million decrease in cash used in business acquisitions and a $1.7 million increase in proceeds from sales of short-term investments, net of purchases, partially offset by a $7.9 million increase in cash used for capital expenditures.
Net cash used in financing activities was $187.3 million during fiscal 2015. Of this total, $252.8 million related to the repurchase of 1.7 million shares under the existing share repurchase program and $66.6 million was for the payment of regular quarterly dividends. Partially offsetting these uses of cash were proceeds received from employee stock plans totaling $71.5 million, related tax benefits of $28.9 million and long-term debt of $35.0 million. Net cash used in financing activities was $89.4 million lower in the current year due to a $36.3 million increase in proceeds from employee stock option exercises and its related income tax benefits, proceeds from long-term debt of $35.0 million and a decrease in share repurchases of $23.6 million. These positive cash movements were partially offset by an incremental $5.5 million in dividend payments due to the 12.8% increase in our regular quarterly dividend, beginning in May 2015.
We expect that for at least the next 12 months, our operating expenses will continue to constitute a significant use of our cash. Additionally, to fund our acquisition of Portware, LLC (“Portware”), announced on September 22, 2015, and closed on October 16, 2015, we entered into an amendment (the “Second Amendment”) dated as of September 21, 2015, amending and expanding the existing credit agreement dated February 6, 2015 and borrowed an additional $265.0 million on October 16, 2015. The maturity date on all outstanding loan amounts is September 21, 2018. For more information on the Portware acquisition, seeNote 21,Subsequent Events,in the Notes to the Company’s Consolidated Financial Statements included in Item 8.
As of August 31, 2015, our total cash and cash equivalents worldwide was $158.9 million with $35.0 million in outstanding borrowings. Approximately $35.5 million of our total available cash and cash equivalents is held in bank accounts located within the U.S., $93.2 million in Europe (predominantly within the UK and France) and the remaining $30.2 million is held in Asia Pacific. We believe our liquidity (including cash on hand, cash from operating activities and other cash flows that we expect to generate) within each geographic segment will be sufficient to meet our short-term and longer-term operating requirements, as they occur, including working capital needs, capital expenditures, dividend payments, stock repurchases and financing activities. In addition, we expect existing foreign cash, cash equivalent and cash flows from operations to continue to be sufficient to fund our foreign operating activities and cash commitments for investing activities, such as capital expenditures, for at least the next 12 months and thereafter for the foreseeable future.
Fiscal 2014 compared to Fiscal 2013
Cash and cash equivalents aggregated to $116.4 million or $0.11 per diluted share. Drivers18% of our total assets at August 31, 2014, compared with $196.6 million or 28% of our total assets August 31, 2013. Our cash and cash equivalents decreased $80.2 million during fiscal 2014 due to $46.9 million in cash used to acquire Revere and Matrix, $279.8 million in share repurchases, dividend payments of $61.0 million, capital expenditures of $17.7 million, and purchases of investments, net of proceeds, of $6.1 million. These cash outflows are partially offset by cash provided by operations of $265.0 million, $52.2 million in proceeds from the exercise of employee stock options, $12.0 million in tax benefits from share-based payment arrangements and $2.2 million from the effects of foreign currency.
Free cash flow for fiscal 2014 was $247.3 million, exceeding net income by 17%. Free cash flow generated during fiscal 2014 was attributable to $211.5 million of net income, $9.2 million of positive working capital changes and diluted earnings per share growth$44.3 million in non-cash expenses less $17.7 million in capital expenditures.Working capital improvements were higher levels of revenue,derived from lower data costs, decreased computer-related expenses, a lower effectiveincome tax rate and a reduction in the diluted weighted average shares outstandingpayments partially offset by higher compensation, including incremental performance-baseda rise in accounts receivable compared to the prior year.Employee stock option expense,exercises, which reduced our tax payments, improved current year working capital. However, our days sales outstanding (“DSO”) as of August 31, 2014 rose to 34 days, up from a record low of 30 days a year ago primarily due to timing of large client payments in the prior year period.
Net cash used in investing activities of $70.7 million, an increase of $50.3 million over fiscal 2013, is due to the acquisitions of Revere and Matrix for $46.9 million and a $4.8 million increase in cash utilized to purchase additional T&E spend. It remainsshort-term certificates of deposit.
Net cash used in financing activities was $276.7 million during fiscal 2014. Of this total, $275.4 million related to the repurchase of 2.5 million shares under the existing share repurchase program and $61.0 million was for the payment of quarterly dividends. Partially offsetting the use of cash were proceeds received from employee stock plans totaling $52.2 million and related tax benefits of $12.0 million. Net cash used in financing activities was $38.3 million higher in the current year because of an $85.7 million reduction in proceeds from employee stock option exercises and an incremental $5.0 million in dividend repayments due to the 11% increase in our philosophyregular quarterly dividend. These increases were partially offset by a decrease in share repurchases of $52.3 million. Proceeds from employee stock exercises and its related income tax benefits were lower in the current year because the number of employee stock options exercised decreased by 1.5 million shares.
Capital Resources
Capital Expenditures
Capital expenditures were $25.7 million during fiscal 2015, up from $17.7 million a year ago. Approximately $13.8 million, or 54%, of our capital expenditures during fiscal 2015 were for purchase of computer equipment, including more servers for our existing data centers, purchasing laptop computers and peripherals for employees, upgrading existing computer systems and improving telecommunication equipment.The remaining 46% of our capital expenditures were used to expandbuild out our offices primarily in New York, Texas and the Philippines during fiscal 2015.
Capital expenditures were $17.7 million during fiscal 2014, down from $18.5 million in fiscal 2013. Approximately $13.8 million or 78% of capital expenditures during fiscal 2014 related to the purchase of computer equipment including more servers for our existing data centers, purchasing laptop computers and peripherals for employees, upgrading existing computer systems in our data collection centers in India and the Philippines and improving telecommunication equipment.The remaining 22% of capital expenditures was used primarily to build out our San Francisco office during fiscal 2014.
Capital Needs
Long-Term Debt
On February 6, 2015, we entered into a Credit Agreement (the “Credit Agreement”) between FactSet, as the borrower, and Bank of America, N.A., as the lender (the “Lender”). At that date, the Credit Agreement provided for a $35.0 million revolving credit facility (the “Revolving Credit Facility”), under which we could request borrowings until its maturity date of February 6, 2018. The Credit Agreement also allowed us to arrange for additional borrowings for an aggregate amount of up to $265.0 million provided that any such request for additional borrowings was in a minimum amount of $25.0 million.
For purposes of funding our acquisition of Code Red on February 6, 2015, we borrowed $35.0 million in the form of a Eurodollar rate loan (the “Loan”) under the Revolving Credit Facility. The proceeds of the Loan made under the Credit Agreement could be used for permitted acquisitions and general corporate purposes. There are no prepayment penalties if we elect to prepay the Loan prior to its scheduled maturity date. The principal balance is payable in full on the maturity date. The $35.0 million we borrowed under the Loan bears interest on the outstanding principal amount at a rate equal to the Eurodollar rate plus 0.50% and is reported as long-term debt within our Consolidated Balance Sheet at August 31, 2015. The Eurodollar rate is defined in the Credit Agreement as the rate per annum equal to one-month LIBOR. Interest on the Loan is payable quarterly in arrears and on the maturity date. During fiscal 2015 we paid approximately $0.1 million in interest on our outstanding Loan amount.
On September 21, 2015, we amended the Credit Agreement to borrow an additional $265.0 million (the “Second Amendment”) in order to fund our acquisition of Portware, which was announced on September 22, 2015, and closed on October 16, 2015. The maturity date on all outstanding loan amounts (which total $300.0 million as of October 30, 2015) is September 21, 2018. The Second Amendment also allows FactSet, subject to certain requirements, to arrange for additional borrowings with the Lender for an aggregate amount of up to $400.0 million, provided that any such request for additional borrowings must be in a minimum amount of $25.0 million.
As of August 31, 2015, we owed no commitment fees since we borrowed the then-full amount of the Revolving Credit Facility on February 6, 2015. Other fees incurred, such as legal costs to draft and review the Credit Agreement, totaled less than $0.1 million and were capitalized as loan origination fees. These loan origination fees are being amortized to interest expense over the term of the Loan using the effective interest method and totaled less than $0.1 million in fiscal 2015.
The Credit Agreement contains covenants restricting certain FactSet activities, which are usual and customary for this type of loan. In addition, the Credit Agreement requires that we maintain a consolidated leverage ratio, as measured by total funded debt/EBITDA below a specified level as of the end of each fiscal quarter. We were in compliance with all of the covenants of the Credit Agreement as of August 31, 2015.
As of August 31, 2015, the fair value of our long-term by investingdebt was $35.0 million, which we believe approximates carrying amount as the terms and interest rates approximate market rates given its floating interest rate basis.
Letters of Credit
From time to time, we are required to obtain letters of credit in the ordinary course of business. Approximately $1.0 million of standby letters of credit have been issued in connection with our employeescurrent leased office space as of August 31, 2015. These standby letters of credit contain covenants that, among other things, require us to retain our position as a premium providermaintain minimum levels of financial informationconsolidated net worth and analytical tools.
Foreign Currency
Foreign Currency Exposure
Certain wholly owned subsidiaries within the European and Asia Pacific segments operate under a functional currency different from the U.S. dollar. The financial statements of these foreign subsidiaries are translated into U.S. dollars using period-end rates of exchange for assets and liabilities and average rates for the period for revenues and expenses. Translation gains and losses that arise from translating assets, liabilities, revenues and expenses of foreign operations are recorded in accumulated other comprehensive loss as a component of stockholders’ equity.
Our non-U.S. dollar denominated revenues expected to be recognized over the next twelve months are estimated to be $17$30.7 million while our non-U.S. dollar denominated expenses are $163estimated to be $205.4 million, which translates into a net foreign currency exposure of $146 million per year.$174.7 million. Our foreign currency exchange exposure is related to our operating expense base in countries outside the U.S., where approximately 68%70% of our employees are located.located as of August 31, 2015. During fiscal 2012,2015, foreign currency movements increased operating income by $1.3 million. In fiscal 2011,$11.2 million as compared to a $1.7 million decrease to operating income decreased by $0.1 million fromduring fiscal 2014.
Foreign Currency Hedges
As of August 31, 2015, we maintained the impact of foreign currency fluctuations.
● | Indian Rupee- foreign currency forward contracts to hedge approximately 75% of our Indian Rupee exposure through the second quarter of fiscal 2018. |
● | British PoundSterling-foreign currency forward contracts |
● | Euro -foreign currency forward contracts to hedge approximately 50% of our Euro exposure through the fourth quarter of fiscal 2016. |
As of our net Euro exposure through the end of the second quarter of fiscal 2013. At August 31, 20122015, the gross notional principal and fair value of foreign exchange contracts to purchase Indian Rupees with U.S. dollars was $36.3 million and ($2.4) million, respectively. At August 31, 2012, theRs. 4.0 billion. The gross notional principal and fairvalue of foreign exchange contracts to purchase British Pound Sterling with U.S. dollars was £10.5 million. The gross notional value of foreign exchange contracts to purchase Euros with U.S. dollars were €8.1 million and $0.1 million, respectively. At August 31, 2012, therewas €18.1 million. There were no other outstanding foreign exchange forward contracts.contracts as of August 31, 2015. A loss on derivatives for during fiscal 2012 of $1.0$0.6 million was recorded into operating income in our Consolidated Statements of Incomeduring fiscal 2015, compared to a gainloss of $4.2$0.3 million a year ago.
| Years Ended August 31, | 2012 | 2011 | 2010 | |||||||||
| Net cash provided by operating activities | $ | 231,965 | $ | 207,136 | $ | 211,080 | ||||||
Capital expenditures (1) | (22,520 | ) | (29,343 | ) | (20,768 | ) | ||||||
Free cash flow (2) | $ | 209,444 | $ | 177,793 | $ | 190,312 | ||||||
| Net cash used in investing activities | $ | (58,849 | ) | $ | (29,343 | ) | $ | (75,948 | ) | |||
| Net cash used in financing activities | $ | (158,718 | ) | $ | (199,123 | ) | $ | (151,568 | ) | |||
| Cash and cash equivalents at end of year (August 31) | $ | 189,044 | $ | 181,685 | $ | 195,741 | ||||||
We expect that for at least the next 12 months, our operating expenses will continue to constitute a significant use of our cash. As of August 31, 2012, our total cash and cash equivalents was $189.0 million with no outstanding borrowings. We believe our liquidity (including cash on hand, cash from operating activities and other cash flows that we expect to generate) will be sufficient to meet our short-term and longer-term operating requirements, as they occur, including working capital needs, capital expenditures, dividend payments, stock repurchases and financing activities. Refer to the section, Contractual Obligations, Off-Balance Sheet Arrangementsfor the table summarizing our significant contractual obligations as of August 31, 2012 and the corresponding effect that these obligations will have on our liquidity and cash flows in future periods.
At August 31, 2011 our DSO was 35 days, up from 31 days a year ago, but down from 37 days at August 31, 2009. Accrued compensation decreased from $48.6 million at August 31, 2010 to $41.5 million at August 31, 2011 based on the timing of accrued payroll in the U.S.
Share Repurchase Program
On May 8, 2012,December 15, 2014, our Board of Directors approved a $200$300 million expansion of the existing share repurchase program. Including the expansion, $189.8 million remains authorized for future share repurchases at August 31, 2012. Repurchases will be made from time to time in the open market and privately negotiated transactions, subject to market conditions. No minimum number of shares to be repurchased has been fixed. There is no timeframe to complete the repurchase program and it is expected that share repurchases will be paid usingfrom existing and future cash generated by operations.
During fiscal 2015, we repurchased 1.7 million shares for $252.8 million under the existing share repurchase program by an additional $200 million. During fiscal 2011, we repurchased 2.3as compared to 2.5 million shares for $216.6$275.4 million under the program.during fiscal 2014. Including the expansion, $142$134.2 million remainedremains authorized for future share repurchases as of August 31, 2011.
Contractual Obligations
Fluctuations in our operating results, the degree of success of our accounts receivable collection efforts, the timing of tax and other payments as well as necessary capital expenditures to support growth of our operations will impact our liquidity and cash flows in future periods. The effect of our contractual obligations on our liquidity and capital resources in future periods should be considered in conjunction with the factors mentioned here.
The following table summarizes our significant contractual obligations as of August 31, 20122015 and the corresponding effect that these obligations will have on our liquidity and cash flows in future periods (in thousands)millions):
| Payments due by period | ||||||||||||||||||||
| 2013 | 2014-2015 | 2016-2017 | 2018 and thereafter | Total | ||||||||||||||||
Operating lease obligations (1) | $ | 27,592 | $ | 47,892 | $ | 30,147 | $ | 35,540 | $ | 141,171 | ||||||||||
Purchase commitments (2) | 48,620 | 3,531 | - | - | 52,151 | |||||||||||||||
| Deferred rent and other non-current liabilities | 20,646 | - | - | - | 20,646 | |||||||||||||||
| Total by period | $ | 96,858 | $ | 51,423 | $ | 30,147 | $ | 35,540 | $ | 213,968 | ||||||||||
Non-current taxes payable and deferred taxes (3) | 8,057 | |||||||||||||||||||
| Total contractual obligations | $ | 222,025 | ||||||||||||||||||
Payments due by period | ||||||||||||||||||||
2016 | 2017-2018 | 2019-2020 | 2021 and thereafter | Total | ||||||||||||||||
Operating lease obligations(1) | $ | 22.7 | $ | 55.4 | $ | 46.1 | $ | 145.9 | $ | 270.1 | ||||||||||
Purchase commitments(2) | 60.7 | 3.8 | 0.7 | — | 65.2 | |||||||||||||||
Loan outstanding(3) | — | — | 35.0 | — | 35.0 | |||||||||||||||
Total contractual obligations by period(4) | $ | 83.4 | $ | 59.2 | $ | 81.8 | $ | 145.9 | $ | 370.3 | ||||||||||
(1) | Operating lease amounts include future minimum lease payments under all our non-cancelable operating leases with an initial term in excess of one year. For more information on our operating leases, see Note |
(2) | Purchase |
(3) | Represents the amount due under the Company’s Loan under its Revolving Credit Facility entered into on February 6, 2015. |
(4) | Non-current income taxes payable of |
Purchase orders do not necessarily reflect a binding commitment but are merely indicative of authorizations and intention to conclude purchases in the future. For the purpose of this tabular disclosure, purchase obligations for goods and services are defined as agreements that are enforceable and legally binding on us and that specify all significant terms, including: fixed or minimum quantities to be purchased; fixed, minimum or variable price provisions; and the approximate timing of the transaction. It is expected that all the contractual obligations noted in the table will be funded from existing cash and cash flows from operations. Expected timing pertaining to the contractual obligations included in the table above has been estimated based on information currently available. The amounts paid and the timing of those payments may differ based on when the goods and services provided by our vendors to whom we are contractually obligated are actually received as well as due to changes to agreed uponagreed-upon amounts for any of our obligations.
As disclosed earlier in theCapital Resources section of this MD&A, we borrowed $35.0 million in the form of a Eurodollar rate loan to fund the acquisition ofCode Red in February 2015. The $35.0 million loan matures on September 21, 2018, and there are no prepayment penalties in the event that we elect to prepay the loan prior to its scheduled maturity date. The amount borrowed bears interest on the outstanding principal amount at a rate equal to the Eurodollar rate plus 0.50% and is reported as long-term debt within our Consolidated Balance Sheet at August 31, 2015.
Dividends
On May 8, 2012,12, 2015, our Board of Directors approved a 15%12.8% increase in the regular quarterly dividend, beginning with ourthe dividend payment onin June 19, 2012 of $0.312015 which was $0.44 per share, or $1.24$1.76 per share per annum. This is the seventh10th consecutive year that our annual dividend has been increased by more than 10%, resulting in a five year annual dividend growth rate of 21%14%.
During fiscal years 20122015 and 2011,2014, our Board of Directors declared the following dividends:
| Declaration Date | Dividends Per Share of Common Stock | Type | Record Date | Total $ Amount (in thousands) | Payment Date | ||||||
| August 8, 2012 | $ | 0.31 | Regular (cash) | August 31, 2012 | $ | 13,727 | September 18, 2012 | ||||
| May 8, 2012 | $ | 0.31 | Regular (cash) | May 31, 2012 | $ | 13,893 | June 19, 2012 | ||||
| February 14, 2012 | $ | 0.27 | Regular (cash) | February 29, 2012 | $ | 12,085 | March 20, 2012 | ||||
| November 10, 2011 | $ | 0.27 | Regular (cash) | November 30, 2011 | $ | 12,181 | December 20, 2011 | ||||
| August 11, 2011 | $ | 0.27 | Regular (cash) | August, 31 2011 | $ | 12,165 | September 20, 2011 | ||||
| May 9, 2011 | $ | 0.27 | Regular (cash) | May 31, 2011 | $ | 12,374 | June 21, 2011 | ||||
| February 9, 2011 | $ | 0.23 | Regular (cash) | February 28, 2011 | $ | 10,612 | March 15, 2011 | ||||
| November 10, 2010 | $ | 0.23 | Regular (cash) | November 30, 2010 | $ | 10,660 | December 21, 2010 | ||||
Declaration Date | Dividends Per | Type | Record Date | Total $ Amount | Payment Date | ||||||
August 10, 2015 | $ | 0.44 | Regular (cash) | August 31, 2015 | $ | 18,179 | September 15, 2015 | ||||
May 12, 2015 | $ | 0.44 | Regular (cash) | May 29, 2015 | $ | 18,274 | June 16, 2015 | ||||
February 11, 2015 | $ | 0.39 | Regular (cash) | February 27, 2015 | $ | 16,236 | March 17, 2015 | ||||
November 12, 2014 | $ | 0.39 | Regular (cash) | November 28, 2014 | $ | 16,216 | December 16, 2014 | ||||
August 14, 2014 | $ | 0.39 | Regular (cash) | August 29, 2014 | $ | 16,299 | September 16, 2014 | ||||
May 5, 2014 | $ | 0.39 | Regular (cash) | May 30, 2014 | $ | 16,386 | June 17, 2014 | ||||
February 11, 2014 | $ | 0.35 | Regular (cash) | February 28, 2014 | $ | 14,827 | March 18, 2014 | ||||
November 14, 2013 | $ | 0.35 | Regular (cash) | November 29, 2013 | $ | 15,046 | December 17, 2013 | ||||
All of the above cash dividends were paid from existing cash resources. Future cash dividends will depend on our earnings, capital requirements, financial condition and other factors considered relevant by us and is subject to final determination by our Board of Directors.
SignificantAccounting Policies
We describe our significant accounting policies in Note 2, 3,Summary of SignificantAccounting Policies, of the Notes to our Consolidated Financial Statements included in Item 8 below.
Critical AccountingEstimates
We consider an accounting estimate to be critical if: (i) the accounting estimate requires us to make assumptions about matters that were highly uncertain at the time the accounting estimate was made, and (ii) changes in the estimate that are reasonably likely to occur from period to period, or use of different estimates that we reasonably could have used in the current period, would have a material impact on our financial condition or results of operations. Management has discussed the development and selection of these critical accounting estimates with the Audit Committee of our Board of Directors. In addition, there are other items within our consolidated financial statements that require estimation, but are not deemed critical as defined above. Changes in estimates used in these and other items could have a material impact on our financial statements.
Accounts receivable are unsecured and are derived from revenues earned from clients located around the globe. We perform ongoing credit evaluations of our clients and do not require collateral. We maintain reserves for potential write-offs and these losses have historically been within expectations. Aged client receivables are analyzed each month and our collection efforts are directed accordingly. We review recent history of client receivable write-offs, analyze trends in aged client receivables and general market conditions to estimate our accounts receivable reserve. At August 31, 2012 and 2011, the receivable reserve was $1.8 and $2.0 million, respectively.
We record acquisitions using the purchase method of accounting. All of the assets acquired, liabilities assumed, contractual contingencies and contingent consideration are recognized at their fair value on the acquisition date. The application of the purchase method of accounting for business combinations requires management to make significant estimates and assumptions in the determination of the fair value of assets acquired and liabilities assumed in order to properly allocate purchase price consideration between assets that are depreciated and amortized from goodwill. Our estimates are based on historical experience, information obtained from the management of the acquired companies and when appropriate, includes assistance from independent third-partythird party appraisal firms. Our significant assumptions and estimates can include, but are not limited to, the cash flows that an asset is expected to generate in the future, the appropriate weighted-average cost of capital, and the cost savings expected to be derived from acquiring an asset. These estimates are inherently uncertain and unpredictable. In addition, unanticipated events and circumstances may occur which may affect the accuracy or validity of such estimates.
Performance-based Equity Awards
We have an employee stock-based compensation plan, which allows for the issuance of performance-based equity awards to employees. Accounting guidance requires the measurement and recognition of compensation expense for all performance-based equity awards made to employees based on the estimated fair values of the awards that are expected to vest. At the end of each reporting period, management must make assumptions regarding the likelihood of achieving our performance targets becausetargetsbecause the number of stock options that vest will be predicated on us achieving these levels.
July 2012 Performance-based Option Grant Review
In October 2009,July 2012, we granted 900,665241,546 performance-based employee stock options. 100% of these performance-based stock options, which are expectedeligible to vest because we achieved organic ASV and diluted earnings per sharein 20% tranches depending upon future StreetAccount user growth of more than 10% on a compounded annual basis for the two years endedthrough August 31, 2011. This reflected2017. During the fourth quarter of fiscal 2013, the first growth target as outlined within the terms of the grant was achieved, thus 20% or 48,314 options vested on August 31, 2013. The second 20% tranche vested on August 31, 2014 as a higher performance level than previously estimated and accordingly increased the numberresult of options that will vest, which required us to record an incremental $5.8 millionaccelerated expansion of stock-based compensationStreet Account users during fiscal 2011. The $5.8 million2014. During the fourth quarter of additional stock-based compensation representedfiscal 2015, the cumulative adjustment to changethird growth target was achieved, thus the vesting percentage from 60% to 100% asthird 20% tranche vested on August 31, 2015. As of August 31, 2011.
Vesting Percentage | Total Unamortized Stock-based Compensation Expense at August 31, 2012 | Cumulative Catch-up Adjustment* | Average Remaining Quarterly Expense to be Recognized | ||||||||||
| 0% | $ | 0 | $ | 0 | $ | 0 | |||||||
| 20% | $ | 2,726 | $ | 914 | $ | 164 | |||||||
| 60% | $ | 8,178 | $ | 2,742 | $ | 492 | |||||||
| 100% | $ | 13,630 | $ | 4,570 | $ | 820 | |||||||
Vesting Percentage | Cumulative Catch-up Adjustment* | Remaining Expense to be Recognized | |||||||
| 0% | $ | (84 | ) | $ | 0 | ||||
| 20% | $ | 0 | $ | 1,516 | |||||
| 40% | $ | 136 | $ | 3,064 | |||||
| 60% | $ | 200 | $ | 4,600 | |||||
| 80% | $ | 257 | $ | 6,143 | |||||
| 100% | $ | 330 | $ | 7,670 | |||||
Vesting Percentage | Cumulative Catch-up Adjustment* | Remaining Expense to be Recognized | ||||||
Fourth 20% tranche(current expectation) | $ | 0 | $ | 619 | ||||
Fifth 20% tranche | $ | 1,216 | $ | 1,003 | ||||
* Amounts represent the cumulative catch-up adjustment to be recorded if there was a change in the vesting percentage as of August 31, 2012.
November 2012 Annual Employee Performance-based Stock Options Granted
Vesting Percentage | Cumulative Catch-up Adjustment* | Remaining Expense to be Recognized | |||||||
| 0% | $ | 0 | $ | 0 | |||||
| 50% | $ | 3,380 | $ | 4,370 | |||||
| 100% | $ | 8,474 | $ | 7,026 | |||||
In November 2012, we granted 1,011,510 performance-based employee stock options. The number of performance-based options that would become eligible to vest was based upon the Company achieving performance levels for both organic ASV and diluted earnings per share during the two fiscal years ended August 31, 2014. Based upon the actual growth in organic ASV and diluted EPS through August 31, 2014, 20%, or 185,014 (net of options forfeited through the end of fiscal 2014), of the previously granted shares became eligible to vest on August 31, 2014. The remaining 80% of the performance-based options previously granted were recorded as forfeitures in the fourth quarter of fiscal 2014.As of the end of fiscal 2015, total unamortized stock-based compensation expense of $0.9 million will be recognized over the remaining vesting period of 2.1 years in connection with this grant.
February 2015 Performance-based Option Grant Review
In connection with our acquisition of Code Red during the second quarter of fiscal 2015, we granted 137,522 performance-based stock options. These performance-based options are eligible to vest four years from date of grant if certain Code Red ASV and operating margin targets are achieved over the measurement period. The option holders must also remain employed by FactSet to be eligible to vest. Of the total grant, 68,761 performance-based options are eligible for vesting based on achieving the growth targets over a four year measurement period ending February 28, 2019 and the remaining 68,761 options are eligible to cliff vest based on a two year measurement period ending February 28, 2017. As of August 31, 2015, total unamortized stock-based compensation of $2.1 million will be recognized as expense over the remaining vesting period of 3.4 years. A change, up or down, in the actual financial performance levels achieved by Code Red in future fiscal years could result in the following changes to the current estimate of the vesting percentage and related expense (in thousands):
Vesting Percentage | Cumulative Catch-up Adjustment* | Remaining Expense to be Recognized | ||||||
| 0% | $ | (338 | ) | $ | 0 | |||
| 10% | $ | (253 | ) | $ | 516 | |||
40%(current expectation) | $ | 0 | $ | 2,063 | ||||
| 70% | $ | 253 | $ | 3,609 | ||||
| 100% | $ | 506 | $ | 5,156 | ||||
* Amounts represent the cumulative catch-up adjustment to be recorded if there was a change in the vesting percentage as of August 31, 2012.
Other Performance-based Option Grants
In connection with the acquisitions of Matrix and July 2011,Revere, we granted 21,102 restricted165,949 and 36,695 performance-based stock units which entitleoptions, respectively, during fiscal 2014. The performance-based options granted in connection with the holder to sharesacquisition of common stock as the awardsMatrix will vest over time. A restricted stock unit is a promise to deliver sharesonly if ASV and operating margin targets related to the employee atMatrix business are met during a future date if certain vesting conditions are met. Our restricted stock units are performance-basedfive year measurement period ending December 23, 2018, and cliff vest 25% when ASVthe option holders remain employed by FactSet. As of August 31, 2015 we do not believe these targets are probable of being achieved, and as such, no stock-based compensation expense is expected to be realized in connection with these options. Of the 36,695 performance-based stock options granted in connection with the Revere acquisition, 18,553 options became eligible to vest based upon the achievement of certain ASV and operating margins during a six year period. Restricted stock units are amortized to expense based on a graded-vesting attribution approach over the vesting period. A changemeasurement period ending August 31, 2015. This results in the forecasted ASV growth in fiscal 2013 could result in a change in the expected vesting period of these restricted stock units, requiring us to accelerate the recognition of the remaining unamortized stock-based compensation expense of $0.1$0.4 million to be recognized over the remaining vesting period of 3.0 years. Of the remaining 18,142 performance-based options previously granted, 6,184 were recorded as forfeitures in the fourth quarter of fiscal 2015 while the remaining 11,958 vest 80% after four years if the measurement criterion is achieved over the four year period ending August 31, 2017.
Accrued Compensation
We make significant estimates in determining our accrued compensation. Approximately 15% of our total employee compensation is variable and discretionary. We conduct a final review of Company and departmental individual performance each year end to determine the amount of discretionary employee compensation. We also review compensation throughout the year to determine how overall performance tracks against management’s expectations. Management takes these and other factors, including historical performance, into account in reviewing accrued compensation estimates quarterly and adjusting accrual rates as appropriate. The amount of the variable employee compensation recorded within accrued compensation was $38.6 million and $37.3 million as of August 31, 2012.
Long-lived Assets
Long-lived assets, comprised of property, equipment and leasehold improvements are evaluated for impairment whenever events or changes in circumstances indicate that the carrying value may not be recoverable. Factors that may cause an impairment review include significant changes in technology that make current computer-related assets that we use in our operations obsolete or less useful and significant changes in the way we use these assets in our operations. When evaluating long-lived assets for potential impairment, we first compare the carrying value of the asset to the asset’s estimated future cash flows (undiscounted and without interest charges). If the estimated future cash flows are less than the carrying value of the asset, we calculate an impairment loss. The impairment loss calculation compares the carrying value of the asset to the asset’s estimated fair value, which may be based on estimated future cash flows (discounted and with interest charges). We recognize an impairment loss if the amount of the asset’s carrying value exceeds the asset’s estimated fair value. If we recognize an impairment loss, the adjusted carrying amount of the asset becomes its new cost basis. The new cost basis will be depreciated (amortized) over the remaining useful life of that asset. Using the impairment evaluation methodology described herein, there have been no long-lived asset impairment charges for each of the last three years. The carrying value of long-lived assets as of August 31, 2012,2015 and 2014 was $76.5 million.
Our impairment loss calculations contain uncertainties because they require management to make assumptions and to apply judgment to estimate future cash flows and asset fair values, including forecasting useful lives of the assets and selecting the discount rate that reflects the risk inherent in future cash flows. We have not made any material changes in our impairment loss assessment methodology during the past three fiscal years. We do not believe there is a reasonable likelihood that there will be a material change in the estimates or assumptions we use to calculate long-lived asset impairment losses. However, if actual results are not consistent with our estimates and assumptions used in estimating future cash flows and asset fair values, we may be exposed to losses that could be material.
Goodwill
We evaluateare required to test goodwill at the reporting unit leveland other intangible assets for impairment annually, or more frequently if impairment indicators occur. The impairment test requires management to make judgments in connection with identifying reporting units, assigning assets and whenever events or changes in circumstances indicateliabilities to reporting units, assigning goodwill and other indefinite-lived intangible assets to reporting units and determining the carryingfair value of the goodwill may not be recoverable. We complete our impairment evaluation by performing internal valuation analyses and consider other publicly available market information. We determined that there wereeach reporting unit. FactSet has three reporting units, during fiscal years 2012, 2011 and 2010, which are consistent with the operating segments reported becauseas there is no discrete financial information available for the subsidiaries within each operating segment. OurThe reporting units evaluated for potential impairment during fiscal years 2012, 2011 and 2010 were the U.S., Europe and Asia Pacific, which reflects the level of internal reporting we use to manage our business and operations.
We performedcomplete our annual goodwill impairment test duringevaluation by performing internal valuation analyses and consider other publicly available market information. Goodwill is tested for impairment based on the fourth quarter of fiscal years 2012, 2011 and 2010 and determined that there were no reporting units that were deemed at risk and there had been no impairment. The carryingpresent value of goodwill as of August 31, 2012 and 2011 was $245.8 million and $228.3 million, respectively.
We performed our annual goodwill impairment test during the fourth quarter of fiscal 2015, consistent with previous years, at which time it was determined that there were no indications of impairment, with the fair value of each of the Company’s reporting units significantly exceeding carrying value.The carrying value of goodwill as of August 31, 2015 and 2014 was $308.3 million and $285.6 million, respectively.
Intangible assets consist of certain acquired content databases, client relationships, software technology, non-compete agreements and trade names resulting from previous acquisitions and depending on the nature of the intangible asset, are amortized on either a straight-line or an accelerated basis using estimated useful lives ranging between two and twenty years. The remaining useful lives of intangible assets subject to amortization are evaluated quarterly to determine whether events and circumstances warrant a revision to the remaining period of amortization. If the estimate of the remaining useful life is changed, the remaining carrying amount of the intangible asset is amortized prospectively over that revised remaining useful life. There were no adjustments to the useful lives of intangible assets subject to amortization during any of the periods presented. These intangible assets have no assigned residual values as of August 31, 2015 and 2014. Intangible assets are reviewed for impairment whenever events or changes in circumstances indicate that the carrying amount of such assets may not be recoverable. Determination of recoverability is based on an estimate of undiscounted future cash flows resulting from the use of the asset and its eventual disposition. Measurement of any impairment loss for intangible assets that management expects to hold and use is based on the amount the carrying value exceeds the fair value of the asset. No impairment of intangible assets has been identified during any of the periods presented. The carrying value of intangible assets as of August 31, 2015 and 2014 was $40.1 million and $41.9 million, respectively. Our ongoing consideration of the recoverability could result in impairment charges in the future, which could adversely affect our results of operations.
Estimated Tax Provision and Tax Contingencies
We are subject to income taxes in the U.S. and numerous foreign jurisdictions. Our tax provision is an estimate based on our understanding of laws in Federal, state and foreign tax jurisdictions. These laws can be complicated and are difficult to apply to any business including ours. The tax laws also require us to allocate our taxable income to many jurisdictions based on subjective allocation methodologies and information collection processes. Our effective tax rates differ from the statutory rate primarily due to the impact of state taxes, foreign operations, R&D and other tax credits, tax audit settlements, incentive-stock options and domestic production activitiesdeductions. Our annual effective tax rate was 27.8%, 30.3% and 26.7% in fiscal 2015, 2014 and 2013, respectively.
We recognize the benefit of an income tax position only if it is more likely than not that the tax position will be sustained upon tax examination, based solely on the technical merits of the tax position as of the reporting date. Otherwise, no benefit can be recognized. The tax benefits recognized are measured based on the largest benefit that has a greater than 50% likelihood of being realized upon ultimate settlement. We will classify the liability for unrecognized tax benefits as current to the extent that we anticipate payment (or receipt) of cash within one year. Additionally, we accrue interest on all tax exposures for which reserves have been established consistent with jurisdictional tax laws. Interest is classified as income tax expense in the financial statements.
As of August 31, 2015, we have gross unrecognized tax benefits totaling $6.8 million, including $1.3 million of accrued interest, recorded as non-current taxes payable in the Consolidated Balance Sheet. Unrecognized tax benefits represent tax positions taken on tax returns but not yet recognized in the consolidated financial statementsstatements. When applicable, we adjust the previously recorded tax expense to reflect examination results when the position is effectively settled. If recognized, the unrecognized tax benefits and related interest would be recorded as a benefit to tax expense on the Consolidated Statement of Income. Audits by multiple tax authorities are currently ongoing. Significant judgment is required in evaluating our uncertain tax positions and determining our provision for income taxes. For this reason, we regularly engage in discussions and negotiations with tax authorities regarding tax matters in various jurisdictions. Although we believe our reserves are reasonable, no assurance can be given that the final outcome of these matters will not be different from that which is reflected in our historical income tax provisions and accruals. We adjust these reserves in light of changing facts and circumstances, such as the closing of a tax audit or the refinement of an estimate. To the extent that the final outcome of these matters is different than the amounts recorded, such differences will affect the provision for income taxes in the period in which such determination is made. The provision for income taxes includes the effect of reserve provisions and changes to reserves that are considered appropriate, as well as the related net interest.
Our provision for income taxes is subject to volatility and could be adversely impacted by numerous factors such as changes in tax laws, regulations, or accounting principles, including accounting for uncertain tax positions or interpretations of them. Significant judgment is required to determine recognition and measurement. Further, as a result of certain ongoing employment and capital investment actions and commitments, our income in certain countries is subject to reduced tax rates and in some cases is wholly exempt from tax. Our failure to meet these commitments could adversely affect our provision for income taxes. In addition, we are subject to the continuous examination of our income tax returns by the Internal Revenue Service and other tax authorities. We regularly assess the likelihood of adverse outcomes resulting from these examinations to determine the adequacy of our provision for income taxes. There can be no assurance that the outcomes from these continuous examinations will not have an adverse impact on our operating results and financial condition.
New Accounting Pronouncements
See Note 3,Summary of Significant Accounting Policies, in the Notes to the Company’s Consolidated Financial Statements included in Item 8 for a full description of recent accounting pronouncements, including the expected dates of adoption, which we include here by reference.
Management Changes
Our Chairman and CEO, Philip Hadley, stepped down as CEO effective July 1, 2015. He remains an employee of FactSet and continues to serve as our Chairman of the Board of Directors. Mr. Hadley, age 53, has served as our CEO since September 2000. Our President, 19-year FactSet veteran Philip Snow, was named CEO, effective July 1, 2015. Mr. Snow, age 51, was also elected to our Board of Directors, effective March 16, 2015.
In addition, on January 21, 2015, we hired Scott Miller as our new Executive Vice President, Global Director of Sales. Mr. Miller succeeded Michael Frankenfield and reports directly to Mr. Snow. Mr. Frankenfield, who has been with FactSet since 1989 and had been in his current role since 2009, remains with us as a Vice Chairman and works in a senior executive sales advisory position. In addition, on March 16, 2015, we appointed Mark Hale as our new Executive Vice President, Chief Operating Officer. Mr. Hale succeeded Peter Walsh and reports directly to Mr. Snow. Mr. Walsh, who has been with FactSet since 1999 and had been in his current role since 2009, remains with us focusing on various discrete projects.
Lastly, in June 2015, we hired Edward Baker-Greene, our first-ever Chief Human Resources Officer, to oversee and grow our critically important employee talent pool.
Market Trends
In the ordinary course of business, we are exposed to financial risks involving foreign currency and interest rate fluctuations. Major equity indices (e.g., Dow Jones Industrials, Russell 1000, MSCI EAFE, S&P 500 and NASDAQ Composite) continue to experience volatility. Approximately 81%82.5% of our annual subscription valueASV is derived from our investment management clients. The prosperity of these clients is tied to equity assets under management. An equity market decline not only depresses assets under management but could cause a significant increase in redemption requests to move money out of equities and into other asset classes. Moreover, extended declines in the equity markets may reduce new fund or client creation, resulting in lower demand for services from investment managers.
Our investment banking clients whothat perform M&A advisory work, provide capital markets services and equity research, account for approximately 19%17.5% of our annual subscription value.ASV. A significant portion of these revenues relate to services deployed by large, bulge bracket banks. Credit continues to impact many of the large banking clients due to the amount of leverage deployed in past operations. Clients could encounter similar problems. A lack of confidence in the global banking system could cause declines in merger and acquisitions funded by debt. Additional uncertainty, consolidation and business failures in the global investment banking sector could adversely affect our financial results and future growth.
We service equity research and M&A departments.departments, capital markets and equity research. These are low risk businesses that do not deploy leverage and will likely continue to operate far into the future and should represent a larger percentage of the overall revenues of our clients. Regardless, the size of banks in general is shrinking as they deleverage their balance sheets and adjust their expense bases to future revenue opportunities. Our revenues may decline if banks including those involved in recent merger activity significantly reduce headcount in the areas of corporate M&A, capital markets and equity research to compensate for the issues created by other departments.
Forward-Looking Factors
Forward-Looking Statements
In addition to current and historical information, this Annual Report on Form 10-K, including Management’s Discussion and Analysis of Financial Condition and Results of Operations, contains forward-looking statements regarding future events and our future results that are based on management’s current expectations, estimates, forecast and projections about the industries in which we operate and the beliefs and assumptions of our management. All statements, other than statements of historical facts, are statements that could be deemed to be forward-looking statements. These include statements about our strategy for growth, product development, market position, subscriptions and expected expenditures and financial results. Forward-looking statements may be identified by words like “expects,” “anticipates,” “plans,” “intends,” “projects,” “should,” “indicates,” “continues,” “ASV,” “subscriptions,” “believes,” “estimates,” “may” and similar expressions. In addition, any statements that refer to projections of our future financial performance, our anticipated growth, trends in our business and other characterizations of future events or circumstances are forward-looking statements. Readers are cautioned that these forward-looking statements are only predictions and not guarantees of future performance and involve a number of risks, uncertainties and assumptions. Therefore, actual results may differ materially from what is expressed or forecasted in such forward-looking statements. We will publicly update forward-looking statements as a result of new information or future events in accordance with applicable Securities and Exchange Commission regulations.
We intend that all forward-looking statements we make will be subject to safe harbor protection of the federal securities laws as found in Section 27A of the Securities Act of 1933 and Section 21E of the Securities Exchange Act of 1934.
Business Outlook
The following forward-looking statements reflect our expectations as of September 25, 2012.October 16, 2015. Given the number of risk factors, uncertainties and assumptions discussed below, actual results may differ materially. We do not intend to update our forward-looking statements until our next quarterly results announcement, other than in publicly available statements.
First Quarter Fiscal 20132016 Expectations
- | Revenues are expected to range between |
- | Operating margin is expected to range between |
- |
The annual effective tax rate is expected to range between |
- | Diluted EPS should range between $1.44 and $1.46. |
- | The lapse in the U.S. Federal R&D tax credit on December 31, 2014, reduced each end of the diluted EPS range by $0.02 compared to the recently completed fourth quarter. If the U.S. Federal R&D tax credit is re-enacted by November 30, 2015, diluted EPS would range between $1.49 and $1.51. We would also recognize an income tax benefit of $0.14 per share if the R&D tax credit could be retroactively applied to previous periods. |
Dividend Payment
On August 10, 2015, we declared a regular quarterly dividend of $0.44 per share. The cash dividend of $18.2 million was paid on September 15, 2015, to common stockholders of record on August 31, 2015 using our existing cash generated by operations.
ITEM 7A. QUANTITATIVE AND QUALITATIVE DISCLOSURES ABOUT MARKET RISK
In the normal course of business, we are exposed to foreign currency exchange risk and interest rate risk that could impact our financial position and results of operations.
Foreign Currency Exchange Risk
We are exposed to market risk from changesconduct business outside the U.S. in foreign currency exchange rates, which could affect operating results, financial position and cash flows. We manage our exposure to foreign currency exchange risk through our regular operating and financing activities and, when appropriate, throughseveral currencies including the use of derivative financial instruments. These derivative financial instruments are utilized to hedge currency exposures as well as to reduce earnings volatility resulting from shifts in market rates. We only enter into foreign currency forward contracts to manage foreign currency exposures. Our foreign currency market exposures include the Euro, British Pound Sterling, Euro, Japanese Yen, Indian Rupee and PhilippinesPhilippine Peso. The fair market valuesfinancial statements of allthese foreign subsidiaries are translated into U.S. dollars using period-end rates of exchange for assets and liabilities and average rates for the period for revenues and expenses. Our non-U.S. dollar denominated revenues expected to be recognized over the next twelve months are estimated to be $30.7 million while our derivative contracts change withnon-U.S. dollar denominated expenses are estimated to be $205.4 million, which translates into a net foreign currency exposure of $174.7 million. To the extent that our international activities recorded in local currencies increase in the future, our exposure to fluctuations in currency exchange rates and are designed so that any changes in their values are offset by changes inwill correspondingly increase. To manage the valuesexposures related to the effects of the underlying exposures. Derivative financial instruments are held solely as risk management tools and not for trading or speculative purposes.
As of August 31, 2015, we maintained the following foreign currency forward contracts to hedge our foreign currency exposure:
● | Indian Rupee- foreign currency forward contracts to hedge approximately 75% of our Indian Rupee exposure through the second quarter of fiscal 2018. |
● | British PoundSterling-foreign currency forward contracts to hedge approximately 50% of our British Pound Sterling exposure through the second quarter of fiscal 2016. |
● | Euro -foreign currency forward contracts to hedge approximately 50% of our Euro exposure through the fourth quarter of fiscal 2016. |
As of August 31, 2015, the gross notional value of foreign exchange contracts to purchase Indian Rupees with U.S. dollars was Rs.4.0 billion. The gross notional value of foreign exchange contracts to purchase British Pound Sterling with U.S. dollars was £10.5 million. The gross notional value of foreign exchange contracts to purchase Euros with U.S. dollars was €18.1 million.
There were no other outstanding foreign exchange forward contracts at August 31, 2015. A loss on derivatives of $0.6 million was recorded into operating income in fiscal 2015, compared to a loss of $0.3 million a year ago. The gains and losses on foreign currency forward contracts mitigate the variability in operating expenses associated with currency movements. These transactions are designated and accounted for as cash flow hedges in accordance with applicable accounting guidance.The changes in fair value for these foreign currency forward contracts are initially reported as a component of accumulated other comprehensive loss and subsequently reclassified into operating expenses when the hedged exposure affects earnings. The related cash flow impacts of all of our derivative activities are reflected as cash flows from operating activities.
A sensitivity analysis was performed based on the estimated fair value of all foreign currency forward contracts outstanding at August 31, 2015. If the U.S. dollar had been 10% weaker, the fair value of outstanding foreign currency forward contracts would have increased by $8.6 million, which would have had an immaterial impact on our consolidated balance sheet. Such a change in fair value of our financial instruments would be substantially offset by changes in our expense base. Had we not had any hedges in place as of August 31, 2015, a hypothetical 10% weaker U.S. dollar against all foreign currencies from the quoted foreign currency exchange rates at August 31, 2015, would result in a decrease in operating income by $15.2 million over the next twelve months. A hypothetical 10% weaker U.S. dollar against all foreign currencies at August 31, 2015 would increase the fair value of total assets by $28.4 million and equity by $25.6 million.
Interest Rate Risk
The fair market value of our cash and investments at August 31, 20122015 was $203.0$182.4 million. Our cash and cash equivalents consist of demand deposits and money market funds with original maturities of three months or less at the date of acquisition and are reported at fair value. Our investments consist of certificates of deposits with original maturities greater than three months, but less than one year and, as such, are classified as investments (short-term) on our consolidated balance sheet. It is anticipated that the fair market value of our cash and investments will continue to be immaterially affected by fluctuations in interest rates. Preservation of principal is the primary goal of our cash and investment policy. Pursuant to our established investment guidelines, we try to achieve high levels of credit quality, liquidity and diversification. Our investment guidelines do not permit us to invest in puts, calls, strips, short sales, straddles, options, commodities, precious metals, futures or investments on margin. Because we have a restrictive investment policy, our financial exposure to fluctuations in interest rates is expected to remain low. We do not believe that the value or liquidity of our cash and investments have been significantly impacted by current market events. Current market events have not required us to modify materially or change our financial risk management strategies with respect to our exposures to foreign currency exchange risk and interest rate risk.
In the normal courseAs of business, we are exposed to foreign currency exchange risk and interest rate risk that could impact our financial position and results of operations.
ITEM 8. FINANCIAL STATEMENTS AND SUPPLEMENTARY DATA
Page | ||
Consolidated Financial Statements: | ||
Management’s Statement of Responsibility for Financial Statements | 45 | |
Management’s Report on Internal Control over Financial Reporting | 45 | |
Reports of Independent Registered Public Accounting | 46-48 | |
Consolidated Statements of Income for the years ended August 31, | 49 | |
Consolidated Statements of Comprehensive Income for the years ended August 31, 2015, 2014 and 2013 | 50 | |
Consolidated Balance Sheets at August 31, | 51 | |
Consolidated Statements of Cash Flows for the years ended August 31, | 52 | |
Consolidated Statements of Changes in Stockholders’ Equity for the years ended August 31, | 53 | |
Notes to the Consolidated Financial Statements | 54 | |
Financial Statement Schedule: | ||
Schedule II – Valuation and Qualifying Accounts | 87 |
FactSet’s consolidated financial statements are prepared by management, which is responsible for their fairness, integrity and objectivity. The accompanying consolidated financial statements have been prepared in conformity with accounting principles generally accepted in the United States of America and include amounts based on management’s estimates and judgments. All financial information in this Annual Report on Form 10-K has been presented on a basis consistent with the information included in the accompanying financial statements.
FactSet’s policies and practices reflect corporate governance initiatives that are compliant with the listing requirements of the New York Stock Exchange, the NASDAQ Stock Market and the corporate governance requirements of the Sarbanes-Oxley Act of 2002. Management, with oversight by the Company’s Board of Directors, has established and maintains a strong ethical climate so that its affairs are conducted to the highest standards of personal and corporate conduct
FactSet maintains accounting systems, including internal accounting controls, designed to provide reasonable assurance of the reliability of financial records and the protection of assets. The concept of reasonable assurance is based on recognition that the cost of a system should not exceed the related benefits. The effectiveness of those systems depends primarily upon the careful selection of financial and other managers, clear delegation of authority and assignment of accountability, inculcation of high business ethics and conflict-of-interest standards, policies and procedures for coordinating the management of corporate resources, and the leadership and commitment of top management. In compliance with the Sarbanes-Oxley Act of 2002, FactSet assessed its internal control over financial reporting as of August 31, 2015 and issued a report (see below).
The Audit Committee of the Board of Directors, which consists solely of independent non-employee directors, is responsible for overseeing the functioning of the accounting system and related controls and the preparation of annual financial statements. The Audit Committee periodically meets with management and the independent accountants to review and evaluate their accounting, auditing and financial reporting activities and responsibilities, including management’s assessment of internal control over financial reporting. The independent registered public accounting firm has full and free access to the Audit Committee and met with the committee, with and without management present.
Management’s Report on Internal Control overover Financial Reporting
Management is responsible for establishing and maintaining adequate internal control over financial reporting as defined in Rules 13a-15(f) and 15d-15(f) under the Exchange Act. Under the supervision and with the participation of the Company’s management, including its principal executive officer and principal financial officer, the Company conducted an evaluation of the effectiveness of its internalfor FactSet. Internal control over financial reporting based on criteria establishedis a process designed to provide reasonable assurance regarding the reliability of financial reporting and the preparation of financial statements for external purposes in the framework in accordance with generally accepted accounting principles. Internal Control—Integrated Framework issued by the Committee of Sponsoring Organizations of the Treadway Commission. Based on this evaluation, the Company’s management concluded that its internal control over financial reporting was effectiveincludes those policies and procedures that (i) pertain to the maintenance of records that in reasonable detail accurately and fairly reflect the transactions and dispositions of the assets of the Company; (ii) provide reasonable assurance that transactions are recorded as necessary to permit preparation of August 31, 2012. PricewaterhouseCoopers LLP, an independent registered publicfinancial statements in accordance with generally accepted accounting firm, has auditedprinciples and that receipts and expenditures of the effectivenessCompany are being made only in accordance with authorizations of FactSet’s internal control over financial reportingmanagement and has issueddirectors of the Company; and (iii) provide reasonable assurance regarding prevention or timely detection of unauthorized acquisition, use, or disposition of the Company’s assets that could have a reportmaterial effect on the Company’s internal control over financial reporting as of August 31, 2012, which is included in their report on the following page.
Because of its inherent limitations, internal control over financial reporting may not prevent or detect misstatements. Also, projections of any evaluation of effectiveness to future periods are subject to the risk that controls may become inadequate because of changes in conditions or that the degree of compliance with the policies or procedures may deteriorate.
Management (with the Board of Directors and Stockholders of FactSet Research Systems Inc.
/s/F.PHILIPSNOW | /s/MAURIZIONICOLELLI |
F. Philip Snow | Maurizio Nicolelli |
Chief Executive Officer | Senior Vice President, Chief Financial Officer |
October 30, 2015 | October 30, 2015 |
Report of Independent Registered Public Accounting Firm
The Board of Directors and Stockholders of FactSet Research Systems Inc.
We have audited the accompanying Management's Report on Internal Control Over Financial Reporting.consolidated balance sheets of FactSet Research Systems Inc. as of August 31, 2015 and 2014, and the related consolidated statements of income, comprehensive income, stockholders' equity and cash flows for each of the two years in the period ended August 31, 2015. Our audits also included the financial statement schedule listed in the Index at Item 8. These financial statements and schedule are the responsibility of the Company's management. Our responsibility is to express opinionsan opinion on these financial statements on the financial statementand schedule and on the Company's internal control over financial reporting based on our integrated audits.
We conducted our audits in accordance with the standards of the Public Company Accounting Oversight Board (United States). Those standards require that we plan and perform the auditsaudit to obtain reasonable assurance about whether the financial statements are free of material misstatementmisstatement. An audit includes examining, on a test basis, evidence supporting the amounts and disclosures in the financial statements. An audit also includes assessing the accounting principles used and significant estimates made by management, as well as evaluating the overall financial statement presentation. We believe that our audits provide a reasonable basis for our opinion.
In our opinion, the financial statements referred to above present fairly, in all material respects, the consolidated financial position of FactSet Research Systems Inc. at August 31, 2015 and 2014, and the consolidated results of its operations and its cash flows for each of the two years in the period ended August 31, 2015, in conformity with U.S. generally accepted accounting principles. Also, in our opinion, the related financial statement schedule, when considered in relation to the basic financial statements taken as a whole, presents fairly in all material respects the information set forth therein.
We also have audited, in accordance with the standards of the Public Company Accounting Oversight Board (United States), FactSet Research Systems Inc.'s internal control over financial reporting as of August 31, 2015, based on criteria established in Internal Control-Integrated Framework issued by the Committee of Sponsoring Organizations of the Treadway Commission (2013 framework), and our report dated October 30, 2015 expressed an unqualified opinion thereon.
/s/ ERNST& YOUNG LLP
Stamford, Connecticut
October 30, 2015
Report of Independent Registered Public Accounting Firm
The Board of Directors and Stockholders of FactSet Research Systems Inc.
We have audited FactSet Research Systems Inc.’s internal control over financial reporting as of August 31, 2015, based on criteria established in Internal Control—Integrated Framework issued by the Committee of Sponsoring Organizations of the Treadway Commission (2013 framework) (the COSO criteria). FactSet Research Systems Inc.’s management is responsible for maintaining effective internal control over financial reporting, and for its assessment of the effectiveness of internal control over financial reporting included in the accompanying Management’s Report on Internal Control over Financial Reporting. Our responsibility is to express an opinion on the company’s internal control over financial reporting based on our audit.
We conducted our audit in accordance with the standards of the Public Company Accounting Oversight Board (United States). Those standards require that we plan and perform the audit to obtain reasonable assurance about whether effective internal control over financial reporting was maintained in all material respects. Our audits of the financial statements included examining, on a test basis, evidence supporting the amounts and disclosures in the financial statements, assessing the accounting principles used and significant estimates made by management, and evaluating the overall financial statement presentation. Our audit of internal control over financial reporting included obtaining an understanding of internal control over financial reporting, assessing the risk that a material weakness exists, and testing and evaluating the design and operating effectiveness of internal control based on the assessed risk. Our audits also includedrisk, and performing such other procedures as we considered necessary in the circumstances. We believe that our audits provideaudit provides a reasonable basis for our opinions.
A company’s internal control over financial reporting is a process designed to provide reasonable assurance regarding the reliability of financial reporting and the preparation of financial statements for external purposes in accordance with generally accepted accounting principles. A company’s internal control over financial reporting includes those policies and procedures that (i)(1) pertain to the maintenance of records that, in reasonable detail, accurately and fairly reflect the transactions and dispositions of the assets of the company; (ii)(2) provide reasonable assurance that transactions are recorded as necessary to permit preparation of financial statements in accordance with generally accepted accounting principles, and that receipts and expenditures of the company are being made only in accordance with authorizations of management and directors of the company; and (iii)(3) provide reasonable assurance regarding prevention or timely detection of unauthorized acquisition, use, or disposition of the company’s assets that could have a material effect on the financial statements.
Because of its inherent limitations, internal control over financial reporting may not prevent or detect misstatements. Also, projections of any evaluation of effectiveness to future periods are subject to the risk that controls may become inadequate because of changes in conditions, or that the degree of compliance with the policies or procedures may deteriorate.
In our opinion, FactSet Research Systems Inc. maintained, in all material respects, effective internal control over financial reporting as of August 31, 2015, based on the COSO criteria.
We also have audited, in accordance with the standards of the Public Company Accounting Oversight Board (United States), the consolidated balance sheets of FactSet Research Systems Inc. as of August 31, 2015 and 2014, and the related consolidated statements of income, comprehensive income, stockholders’ equity and cash flows for each of the two years in the period ended August 31, 2015 of FactSet Research Systems Inc. and our report dated October 30, 2015 expressed an unqualified opinion thereon.
/s/ ERNST& YOUNG LLP
Stamford, Connecticut
October 30, 2015
Report of IndependentRegistered Public Accounting Firm
The Board of Directors and Stockholders of FactSet Research Systems Inc.
In our opinion, the consolidated statements of income and comprehensive income, of shareholders’ equity and of cash flows for the year ended August 31, 2013 present fairly, in all material respects, the results of operations and cash flows of FactSet Research Systems Inc. and its subsidiaries (the “Company”) for the year ended August 31, 2013, in conformity with accounting principles generally accepted in the United States of America. In addition, in our opinion, the financial statement schedule for the year ended August 31, 2013 presents fairly, in all material respects, the information set forth therein when read in conjunction with the related consolidated financial statements. These financial statements and financial statement schedule are the responsibility of the Company's management. Our responsibility is to express an opinion on these financial statements and financial statement schedule based on our audit. We conducted our audit of these statements in accordance with the standards of the Public Company Accounting Oversight Board (United States). Those standards require that we plan and perform the audit to obtain reasonable assurance about whether the financial statements are free of material misstatement. An audit includes examining, on a test basis, evidence supporting the amounts and disclosures in the financial statements, assessing the accounting principles used and significant estimates made by management, and evaluating the overall financial statement presentation. We believe that our audit provides a reasonable basis for our opinion.
/s/ PRICEWATERHOUSECOOPERSPRICEWATERHOUSECOOPERS LLP
Stamford, Connecticut
October 30, 2013
(In thousands, except per share data)
| Years Ended August 31, | 2012 | 2011 | 2010 | |||||||||
| Revenues | $ | 805,793 | $ | 726,510 | $ | 641,059 | ||||||
| Operating expenses | ||||||||||||
| Cost of services | 275,537 | 244,623 | 206,550 | |||||||||
| Selling, general and administrative | 257,266 | 243,552 | 212,875 | |||||||||
| Total operating expenses | 532,803 | 488,175 | 419,425 | |||||||||
| Operating income | 272,990 | 238,335 | 221,634 | |||||||||
| Other income | 1,715 | 623 | 547 | |||||||||
| Income before income taxes | 274,705 | 238,958 | 222,181 | |||||||||
| Provision for income taxes | 85,896 | 67,912 | 71,970 | |||||||||
| Net income | $ | 188,809 | $ | 171,046 | $ | 150,211 | ||||||
| Basic earnings per common share | $ | 4.22 | $ | 3.72 | $ | 3.22 | ||||||
| Diluted earnings per common share | $ | 4.12 | $ | 3.61 | $ | 3.13 | ||||||
| Weighted average common shares (Basic) | 44,784 | 45,953 | 46,698 | |||||||||
| Weighted average common shares (Diluted) | 45,810 | 47,355 | 48,004 | |||||||||
Years Ended August 31, | 2015 | 2014 | 2013 | |||||||||
Revenues | $ | 1,006,768 | $ | 920,335 | $ | 858,112 | ||||||
Operating expenses | ||||||||||||
Cost of services | 405,339 | 353,686 | 306,379 | |||||||||
Selling, general and administrative | 269,511 | 264,430 | 282,314 | |||||||||
Total operating expenses | 674,850 | 618,116 | 588,693 | |||||||||
Operating income | 331,918 | 302,219 | 269,419 | |||||||||
Other income | 1,836 | 1,245 | 1,491 | |||||||||
Income before income taxes | 333,754 | 303,464 | 270,910 | |||||||||
Provision for income taxes | 92,703 | 91,921 | 72,273 | |||||||||
Net income | $ | 241,051 | $ | 211,543 | $ | 198,637 | ||||||
Basic earnings per common share | $ | 5.80 | $ | 4.98 | $ | 4.53 | ||||||
Diluted earnings per common share | $ | 5.71 | $ | 4.92 | $ | 4.45 | ||||||
Weighted average common shares (Basic) | 41,572 | 42,436 | 43,890 | |||||||||
Weighted average common shares (Diluted) | 42,235 | 42,970 | 44,624 | |||||||||
The accompanying notes are an integral part of these consolidated financial statements.
(In thousands, except share data)
| At August 31, | 2012 | 2011 | ||||||
| CURRENT ASSETS | ||||||||
| Cash and cash equivalents | $ | 189,044 | $ | 181,685 | ||||
| Investments | 13,919 | - | ||||||
| Accounts receivable, net of reserves of $1,830 and $1,955 at August 31, 2012 and 2011, respectively | 74,251 | 75,004 | ||||||
| Prepaid taxes | 2,485 | - | ||||||
| Deferred taxes | 5,085 | 4,008 | ||||||
| Prepaid expenses and other current assets | 14,341 | 12,473 | ||||||
| Total current assets | 299,125 | 273,170 | ||||||
| LONG-TERM ASSETS | ||||||||
| Property, equipment and leasehold improvements, at cost | 189,546 | 173,990 | ||||||
| Less accumulated depreciation and amortization | (113,016 | ) | (92,370 | ) | ||||
| Property, equipment and leasehold improvements, net | 76,530 | 81,620 | ||||||
| Goodwill | 245,791 | 228,265 | ||||||
| Intangible assets, net | 43,371 | 46,310 | ||||||
| Deferred taxes | 23,113 | 20,166 | ||||||
| Other assets | 6,213 | 7,909 | ||||||
| TOTAL ASSETS | $ | 694,143 | $ | 657,440 | ||||
CURRENT LIABILITIES | ||||||||
| Accounts payable and accrued expenses | $ | 27,680 | $ | 24,603 | ||||
| Accrued compensation | 41,274 | 41,536 | ||||||
| Deferred fees | 30,495 | 28,252 | ||||||
| Taxes payable | - | 2,867 | ||||||
| Dividends payable | 13,727 | 12,165 | ||||||
| Total current liabilities | 113,176 | 109,423 | ||||||
| NON-CURRENT LIABILITIES | ||||||||
| Deferred taxes | 2,593 | �� | 3,712 | |||||
| Taxes payable | 5,464 | 7,204 | ||||||
| Deferred rent and other non-current liabilities | 20,646 | 21,913 | ||||||
| TOTAL LIABILITIES | $ | 141,879 | $ | 142,252 | ||||
| Commitments and contingencies (See Note 17) | ||||||||
| STOCKHOLDERS’ EQUITY | ||||||||
| Preferred stock, $.01 par value, 10,000,000 shares authorized, none issued | $ | – | $ | – | ||||
| Common stock, $.01 par value, 150,000,000 shares authorized, 45,599,754 and 61,427,391 shares issued; 44,279,214 and 45,055,219 shares outstanding at August 31, 2012 and 2011, respectively | 456 | 614 | ||||||
| Additional paid-in capital | 137,569 | 432,538 | ||||||
| Treasury stock, at cost: 1,320,540 and 16,372,172 shares at August 31, 2012 and 2011, respectively | (122,749 | ) | (824,382 | ) | ||||
| Retained earnings | 559,714 | 912,078 | ||||||
| Accumulated other comprehensive loss | (22,726 | ) | (5,660 | ) | ||||
| TOTAL STOCKHOLDERS’ EQUITY | 552,264 | 515,188 | ||||||
| TOTAL LIABILITIES AND STOCKHOLDERS’ EQUITY | $ | 694,143 | $ | 657,440 | ||||
Years Ended August 31, | 2015 | 2014 | 2013 | |||||||||
Net income | $ | 241,051 | $ | 211,543 | $ | 198,637 | ||||||
Other comprehensive (loss) income, net of tax | ||||||||||||
Net unrealized (loss) gain on cash flow hedges* | (868 | ) | 5,357 | (3,296 | ) | |||||||
Foreign currency translation adjustments | (25,263 | ) | 7,895 | (5,151 | ) | |||||||
Other comprehensive (loss) income | (26,131 | ) | 13,252 | (8,447 | ) | |||||||
Comprehensive income | $ | 214,920 | $ | 224,795 | $ | 190,190 | ||||||
* The unrealized (loss) gain on cash flow hedges disclosed above was net of tax benefit (expense) of $512, ($3,193) and $1,965 for the fiscal years ended August 31, 2015, 2014 and 2013, respectively.
The accompanying notes are an integral part of these consolidated financial statements.
(In thousands)
| Years Ended August 31, | 2012 | 2011 | 2010 | |||||||||
| CASH FLOWS FROM OPERATING ACTIVITIES | ||||||||||||
| Net income | $ | 188,809 | $ | 171,046 | $ | 150,211 | ||||||
| Adjustments to reconcile net income to net cash provided by operating activities | ||||||||||||
| Depreciation and amortization | 33,779 | 36,847 | 37,343 | |||||||||
| Stock-based compensation expense | 21,982 | 25,773 | 14,065 | |||||||||
| Deferred income taxes | (3,760 | ) | (1,806 | ) | (5,827 | ) | ||||||
| Gain on sale of assets | - | (22 | ) | (80 | ) | |||||||
| Tax benefits from share-based payment arrangements | (11,159 | ) | (18,331 | ) | (24,492 | ) | ||||||
| Changes in assets and liabilities, net of effects of acquisitions | ||||||||||||
| Accounts receivable, net of reserves | 2,083 | (15,311 | ) | 3,883 | ||||||||
| Accounts payable and accrued expenses | 9 | 715 | (1,308 | ) | ||||||||
| Accrued compensation | 519 | (7,882 | ) | 7,440 | ||||||||
| Deferred fees | (2,573 | ) | 3,219 | (7,759 | ) | |||||||
| Taxes payable, net of prepaid taxes | 4,209 | 20,387 | 35,781 | |||||||||
| Prepaid expenses and other assets | (445 | ) | (6,579 | ) | 281 | |||||||
| Deferred rent and other non-current liabilities | (905 | ) | (483 | ) | (359 | ) | ||||||
| Other working capital accounts, net | (583 | ) | (437 | ) | 1,901 | |||||||
| Net cash provided by operating activities | 231,965 | 207,136 | 211,080 | |||||||||
| CASH FLOWS FROM INVESTING ACTIVITIES | ||||||||||||
| Acquisition of businesses, net of cash acquired | (21,329 | ) | — | (55,180 | ) | |||||||
| Purchases of investments | (15,000 | ) | — | — | ||||||||
| Purchases of property, equipment and leasehold improvements, net of proceeds from dispositions | (22,520 | ) | (29,343 | ) | (20,768 | ) | ||||||
| Net cash used in investing activities | (58,849 | ) | (29,343 | ) | (75,948 | ) | ||||||
| CASH FLOWS FROM FINANCING ACTIVITIES | ||||||||||||
| Dividend payments | (49,983 | ) | (43,949 | ) | (38,494 | ) | ||||||
| Repurchase of common stock | (153,641 | ) | (216,584 | ) | (192,816 | ) | ||||||
| Proceeds from employee stock plans | 33,747 | 43,079 | 55,250 | |||||||||
| Tax benefits from share-based payment arrangements | 11,159 | 18,331 | 24,492 | |||||||||
| Net cash used in financing activities | (158,718 | ) | (199,123 | ) | (151,568 | ) | ||||||
| Effect of exchange rate changes on cash and cash equivalents | (7,039 | ) | 7,274 | (4,143 | ) | |||||||
| Net increase (decrease) in cash and cash equivalents | 7,359 | (14,056 | ) | (20,579 | ) | |||||||
| Cash and cash equivalents at beginning of year | 181,685 | 195,741 | 216,320 | |||||||||
| Cash and cash equivalents at end of year | $ | 189,044 | $ | 181,685 | $ | 195,741 | ||||||
| Supplemental Disclosure of Cash Flow Information | ||||||||||||
| Cash paid during the year for income taxes | $ | 73,219 | $ | 36,869 | $ | 38,450 | ||||||
| Supplemental Disclosure of Non-Cash Transactions | ||||||||||||
| Dividends declared, not paid | $ | 13,727 | $ | 12,165 | $ | 10,586 | ||||||
| Stock issued for acquisition of business | $ | 3,974 | $ | — | $ | — | ||||||
At August 31, | 2015 | 2014 | ||||||
CURRENT ASSETS | ||||||||
Cash and cash equivalents | $ | 158,914 | $ | 116,378 | ||||
Investments | 23,497 | 20,008 | ||||||
Accounts receivable, net of reserves of $1,580 and $1,662at August 31, 2015 and 2014, respectively | 95,064 | 90,354 | ||||||
Prepaid taxes | 4,808 | 6,532 | ||||||
Deferred taxes | 2,105 | 1,841 | ||||||
Prepaid expenses and other current assets | 19,786 | 14,662 | ||||||
Total current assets | 304,174 | 249,775 | ||||||
LONG-TERM ASSETS | ||||||||
Property, equipment and leasehold improvements, at cost | 213,279 | 201,713 | ||||||
Less accumulated depreciation and amortization | (154,015 | ) | (144,072 | ) | ||||
Property, equipment and leasehold improvements, net | 59,264 | 57,641 | ||||||
Goodwill | 308,287 | 285,608 | ||||||
Intangible assets, net | 40,052 | 41,855 | ||||||
Deferred taxes | 20,599 | 22,377 | ||||||
Other assets | 4,295 | 5,956 | ||||||
TOTAL ASSETS | $ | 736,671 | $ | 663,212 | ||||
CURRENT LIABILITIES | ||||||||
Accounts payable and accrued expenses | $ | 33,880 | $ | 26,971 | ||||
Accrued compensation | 44,916 | 42,481 | ||||||
Deferred fees | 38,488 | 36,504 | ||||||
Deferred taxes | 562 | — | ||||||
Taxes payable | 3,755 | 5,036 | ||||||
Dividends payable | 18,179 | 16,299 | ||||||
Total current liabilities | 139,780 | 127,291 | ||||||
NON-CURRENT LIABILITIES | ||||||||
Long-term debt | 35,000 | — | ||||||
Deferred taxes | 1,697 | 2,921 | ||||||
Taxes payable | 6,776 | 5,501 | ||||||
Deferred rent and other non-current liabilities | 21,834 | 16,417 | ||||||
TOTAL LIABILITIES | $ | 205,087 | $ | 152,130 | ||||
Commitments and contingencies (See Note 18) | ||||||||
STOCKHOLDERS’ EQUITY | ||||||||
Preferred stock, $.01 par value, 10,000,000 shares authorized, none issued | $ | — | $ | — | ||||
Common stock, $.01 par value, 150,000,000 shares authorized, 50,328,423 and 49,110,218 shares issued; 41,316,902 and 41,792,802 shares outstanding at August 31, 2015 and 2014, respectively | 503 | 491 | ||||||
Additional paid-in capital | 542,355 | 413,754 | ||||||
Treasury stock, at cost: 9,011,521 and 7,317,416 shares at August 31, 2015 and 2014, respectively | (988,873 | ) | (734,746 | ) | ||||
Retained earnings | 1,021,651 | 849,504 | ||||||
Accumulated other comprehensive loss | (44,052 | ) | (17,921 | ) | ||||
TOTAL STOCKHOLDERS’ EQUITY | 531,584 | 511,082 | ||||||
TOTAL LIABILITIES AND STOCKHOLDERS’ EQUITY | $ | 736,671 | $ | 663,212 | ||||
The accompanying notes are an integral part of these consolidated financial statements.
Consolidated Statements of Changes in Stockholders’ Equity
(In thousands)
| Years Ended August 31, | 2012 | 2011 | 2010 | |||||||||
| COMMON STOCK | ||||||||||||
| Balance, beginning of year | $ | 614 | $ | 601 | $ | 581 | ||||||
| Common stock issued for employee stock plans | 9 | 13 | 20 | |||||||||
| Retirement of treasury stock (See Note 12) | (167 | ) | — | — | ||||||||
| Balance, end of year | $ | 456 | $ | 614 | $ | 601 | ||||||
| ADDITIONAL PAID-IN CAPITAL | ||||||||||||
| Balance, beginning of year | $ | 432,538 | $ | 344,144 | $ | 248,840 | ||||||
| Common stock issued for employee stock plans | 33,383 | 44,290 | 56,747 | |||||||||
| Stock-based compensation expense | 21,982 | 25,773 | 14,065 | |||||||||
| Tax benefits from share-based payment arrangements | 11,159 | 18,331 | 24,492 | |||||||||
| Stock issued for acquisition of business (See Note 7) | (11 | ) | — | — | ||||||||
| Retirement of treasury stock (See Note 12) | (361,482 | ) | — | — | ||||||||
| Balance, end of year | $ | 137,569 | $ | 432,538 | $ | 344,144 | ||||||
| TREASURY STOCK | ||||||||||||
| Balance, beginning of year | $ | (824,382 | ) | $ | (607,798 | ) | $ | (414,995 | ) | |||
| Repurchase of common stock | (153,641 | ) | (216,584 | ) | (192,803 | ) | ||||||
| Stock issued for acquisition of business (See Note 7) | 3,985 | — | — | |||||||||
| Purchase of common stock upon restricted stock vesting (See Note 14) | 354 | — | — | |||||||||
| Retirement of treasury stock (See Note 12) | 850,935 | — | — | |||||||||
| Balance, end of year | $ | (122,749 | ) | $ | (824,382 | ) | $ | (607,798 | ) | |||
| RETAINED EARNINGS | ||||||||||||
| Balance, beginning of year | $ | 912,078 | $ | 786,844 | $ | 676,626 | ||||||
| Net income | 188,809 | 171,046 | 150,211 | |||||||||
| Dividends | (51,887 | ) | (45,812 | ) | (39,993 | ) | ||||||
| Retirement of treasury stock (See Note 12) | (489,286 | ) | — | — | ||||||||
| Balance, end of year | $ | 559,714 | $ | 912,078 | $ | 786,844 | ||||||
| ACCUMULATED OTHER COMPREHENSIVE LOSS | ||||||||||||
| Balance, beginning of year | $ | (5,660 | ) | $ | (21,385 | ) | $ | (10,223 | ) | |||
| Foreign currency translation adjustments | (14,925 | ) | 14,897 | (10,073 | ) | |||||||
| Net unrealized (loss) gain on cash flow hedges, net of tax | (2,141 | ) | 828 | (1,089 | ) | |||||||
| Balance, end of year | $ | (22,726 | ) | $ | (5,660 | ) | $ | (21,385 | ) | |||
| TOTAL STOCKHOLDERS’ EQUITY | ||||||||||||
| Balance, beginning of year | $ | 515,188 | $ | 502,406 | $ | 500,829 | ||||||
| Net income | 188,809 | 171,046 | 150,211 | |||||||||
| Common stock issued for employee stock plans | 33,392 | 44,303 | 56,767 | |||||||||
| Purchase of common stock upon restricted stock vesting (See Note 14) | 354 | — | — | |||||||||
| Stock-based compensation expense | 21,982 | 25,773 | 14,065 | |||||||||
| Tax benefits from share-based payment arrangements | 11,159 | 18,331 | 24,492 | |||||||||
| Repurchase of common stock | (153,641 | ) | (216,584 | ) | (192,803 | ) | ||||||
| Foreign currency translation adjustments | (14,925 | ) | 14,897 | (10,073 | ) | |||||||
| Stock issued for acquisition of business (See Note 7) | 3,974 | — | — | |||||||||
| Net unrealized (loss) gain on cash flow hedges, net of tax | (2,141 | ) | 828 | (1,089 | ) | |||||||
| Dividends | (51,887 | ) | (45,812 | ) | (39,993 | ) | ||||||
| Balance, end of year | $ | 552,264 | $ | 515,188 | $ | 502,406 | ||||||
Years Ended August 31, | 2015 | 2014 | 2013 | |||||||||
CASH FLOWS FROM OPERATING ACTIVITIES | ||||||||||||
Net income | $ | 241,051 | $ | 211,543 | $ | 198,637 | ||||||
Adjustments to reconcile net income to net cash provided by operating activities | ||||||||||||
Depreciation and amortization | 31,349 | 34,435 | 35,779 | |||||||||
Stock-based compensation expense | 26,371 | 22,891 | 39,951 | |||||||||
Deferred income taxes | (969 | ) | (1,028 | ) | 3,175 | |||||||
Gain on sale of assets | (34 | ) | (62 | ) | (26 | ) | ||||||
Tax benefits from share-based payment arrangements | (28,948 | ) | (11,955 | ) | (25,225 | ) | ||||||
Changes in assets and liabilities, net of effects of acquisitions | ||||||||||||
Accounts receivable, net of reserves | (4,300 | ) | (13,299 | ) | 859 | |||||||
Accounts payable and accrued expenses | 8,123 | (2,903 | ) | 3,355 | ||||||||
Accrued compensation | 3,516 | 1,953 | (776 | ) | ||||||||
Deferred fees | 53 | 3,594 | (1,107 | ) | ||||||||
Taxes payable, net of prepaid taxes | 30,437 | 23,309 | 13,498 | |||||||||
Prepaid expenses and other assets | (4,523 | ) | (1,535 | ) | 2,105 | |||||||
Deferred rent and other non-current liabilities | 4,322 | (1,672 | ) | (2,846 | ) | |||||||
Other working capital accounts, net | (6 | ) | (248 | ) | 2,430 | |||||||
Net cash provided by operating activities | 306,442 | 265,023 | 269,809 | |||||||||
CASH FLOWS FROM INVESTING ACTIVITIES | ||||||||||||
Acquisition of businesses, net of cash acquired | (34,758 | ) | (46,873 | ) | (705 | ) | ||||||
Purchases of investments | (24,264 | ) | (20,415 | ) | (15,613 | ) | ||||||
Proceeds from sales of investments | 19,827 | 14,323 | 14,423 | |||||||||
Purchases of property, equipment and leasehold improvements, net of proceeds from dispositions | (25,682 | ) | (17,743 | ) | (18,517 | ) | ||||||
Net cash used in investing activities | (64,877 | ) | (70,708 | ) | (20,412 | ) | ||||||
CASH FLOWS FROM FINANCING ACTIVITIES | ||||||||||||
Dividend payments | (66,551 | ) | (61,007 | ) | (56,002 | ) | ||||||
Repurchase of common stock | (256,217 | ) | (279,829 | ) | (332,168 | ) | ||||||
Proceeds from debt | 35,000 | — | — | |||||||||
Debt issuance costs | (32 | ) | — | — | ||||||||
Proceeds from employee stock plans | 71,526 | 52,152 | 124,537 | |||||||||
Tax benefits from share-based payment arrangements | 28,948 | 11,955 | 25,225 | |||||||||
Net cash used in financing activities | (187,326 | ) | (276,729 | ) | (238,408 | ) | ||||||
Effect of exchange rate changes on cash and cash equivalents | (11,703 | ) | 2,165 | (3,406 | ) | |||||||
Net increase (decrease) in cash and cash equivalents | 42,536 | (80,249 | ) | 7,583 | ||||||||
Cash and cash equivalents at beginning of year | 116,378 | 196,627 | 189,044 | |||||||||
Cash and cash equivalents at end of year | $ | 158,914 | $ | 116,378 | $ | 196,627 | ||||||
Supplemental Disclosure of Cash Flow Information | ||||||||||||
Cash paid during the year for income taxes, net of refunds | $ | 64,750 | $ | 67,152 | $ | 53,153 | ||||||
Supplemental Disclosure of Non-Cash Transactions | ||||||||||||
Dividends declared, not paid | $ | 18,179 | $ | 16,299 | $ | 15,164 | ||||||
Stock issued for acquisition of business | $ | 2,991 | $ | — | $ | — | ||||||
The accompanying notes are an integral part of these consolidated financial statements.
Consolidated Statements of Changes in Stockholders’ Equity
(In thousands)
Years Ended August 31, | 2015 | 2014 | 2013 | |||||||||
COMMON STOCK | ||||||||||||
Balance, beginning of year | $ | 491 | $ | 481 | $ | 456 | ||||||
Common stock issued for employee stock plans | 12 | 10 | 25 | |||||||||
Balance, end of year | $ | 503 | $ | 491 | $ | 481 | ||||||
ADDITIONAL PAID-IN CAPITAL | ||||||||||||
Balance, beginning of year | $ | 413,754 | $ | 326,869 | $ | 137,569 | ||||||
Common stock issued for employee stock plans | 72,381 | 52,039 | 124,124 | |||||||||
Stock-based compensation expense | 26,371 | 22,891 | 39,951 | |||||||||
Tax benefits from share-based payment arrangements | 28,948 | 11,955 | 25,225 | |||||||||
Stock issued for acquisition of business | 901 | — | — | |||||||||
Balance, end of year | $ | 542,355 | $ | 413,754 | $ | 326,869 | ||||||
TREASURY STOCK | ||||||||||||
Balance, beginning of year | $ | (734,746 | ) | $ | (454,917 | ) | $ | (122,749 | ) | |||
Repurchases of common stock | (253,076 | ) | (275,415 | ) | (327,454 | ) | ||||||
Stock issued for acquisition of business | 2,090 | — | — | |||||||||
Purchases of common stock upon restricted stock vesting | (3,141 | ) | (4,414 | ) | (4,714 | ) | ||||||
Balance, end of year | $ | (988,873 | ) | $ | (734,746 | ) | $ | (454,917 | ) | |||
RETAINED EARNINGS | ||||||||||||
Balance, beginning of year | $ | 849,504 | $ | 700,519 | $ | 559,714 | ||||||
Net income | 241,051 | 211,543 | 198,637 | |||||||||
Dividends | (68,904 | ) | (62,558 | ) | (57,832 | ) | ||||||
Retirement of treasury stock | — | — | — | |||||||||
Balance, end of year | $ | 1,021,651 | $ | 849,504 | $ | 700,519 | ||||||
ACCUMULATED OTHER COMPREHENSIVELOSS | ||||||||||||
Balance, beginning of year | $ | (17,921 | ) | $ | (31,173 | ) | $ | (22,726 | ) | |||
Foreign currency translation adjustments | (25,263 | ) | 7,895 | (5,151 | ) | |||||||
Net unrealized (loss) gain on cash flow hedges, net of tax | (868 | ) | 5,357 | (3,296 | ) | |||||||
Balance, end of year | $ | (44,052 | ) | $ | (17,921 | ) | $ | (31,173 | ) | |||
TOTAL STOCKHOLDERS’ EQUITY | ||||||||||||
Balance, beginning of year | $ | 511,082 | $ | 541,779 | $ | 552,264 | ||||||
Net income | 241,051 | 211,543 | 198,637 | |||||||||
Common stock issued for employee stock plans | 72,393 | 52,049 | 124,149 | |||||||||
Purchases of common stock upon restricted stock vesting | (3,141 | ) | (4,414 | ) | (4,714 | ) | ||||||
Stock-based compensation expense | 26,371 | 22,891 | 39,951 | |||||||||
Tax benefits from share-based payment arrangements | 28,948 | 11,955 | 25,225 | |||||||||
Repurchases of common stock | (253,076 | ) | (275,415 | ) | (327,454 | ) | ||||||
Foreign currency translation adjustments | (25,263 | ) | 7,895 | (5,151 | ) | |||||||
Stock issued for acquisition of business | 2,991 | — | — | |||||||||
Net unrealized (loss) gain on cash flow hedges, net of tax | (868 | ) | 5,357 | (3,296 | ) | |||||||
Dividends | (68,904 | ) | (62,558 | ) | (57,832 | ) | ||||||
Balance, end of year | $ | 531,584 | $ | 511,082 | $ | 541,779 | ||||||
The accompanying notes are an integral part of these consolidated financial statements.
Notes to the Consolidated Financial Statements
1. ORGANIZATION AND NATURE OF BUSINESS
FactSet Research Systems Inc. (the “Company” or “FactSet”) is a provider of integrated financial information and analytical applications to the global investment community. FactSet combines content regarding companies and securities from major markets all over the globe into a single online platform of information and analytics. By consolidating content from hundreds of databases with powerful analytics, FactSet supports the investment process from initial research to published results for buy and sell-side professionals. These professionals include portfolio managers, research and performance analysts, risk managers, marketing professionals, sell-side equity research professionals, investment bankers and fixed income professionals. The Company’s applications provide users access to company analysis,and industry analyses, multicompany comparisons, industry analysis, company screening, portfolio analysis, predictive risk measurements, alphatesting, portfolio optimization and simulation, real-time news and quotes and tools to value and analyze fixed income securities and portfolios. WithMicrosoft® Office integration, wireless access and customizable options, FactSet offers a complete financial workflow solution. The Company’s revenues are derived from subscriptions to services such as workstations, content and applications.
2. SUMMARYBASIS OF SIGNIFICANT ACCOUNTING POLICIES
FactSet conducts business globally and is managed on a geographic basis. The accompanying consolidated financial statements include the accounts of the Company and its wholly owned subsidiaries. All intercompany activity and balances have been eliminated from the consolidated financial statements. Certain reclassifications have been made to amounts for prior years in order to conform to the current year’s presentation.
The Company’s consolidated financial statements are prepared in accordance with U.S. generally accepted accounting principles. The preparation of consolidated financial statements and related disclosures in conformity with accounting principles generally accepted in the U.S. requires management to make estimates and assumptions that affect the reported amounts of assets and liabilities and disclosure of contingent assets and liabilities at the date of the financial statements and the reported amounts of revenues and expenses during the reporting period. Significant estimates have been made in areas that include receivable reserves, accrued compensation, allocation of purchase price to acquired assets and liabilities, acquired,stock-based compensation, income taxes, stock-basedaccrued compensation, valuation of goodwill, and useful lives and valuation of fixed and intangible assets. The Company bases its estimates on historical experience and on various other assumptions that are believed to be reasonable, the results of which form the basis for making judgments about the carrying values of assets and liabilities. Actual results could differ from those estimates.
3.SUMMARY OF SIGNIFICANTACCOUNTING POLICIES
The significant accounting policies of the Company and its subsidiaries are summarized below.
Revenue Recognition
The Company’s revenues are derived from month-to-month subscriptions to services such as workstations (also referred to as users), content and applications. The majority of clients are invoiced monthly to reflect the actual services provided. The remaining clients are invoiced quarterly, annually or biannually in advance. Subscription revenue is earned each month as the service is rendered to clients on a monthly basis. FactSet recognizes revenue when the client subscribes to FactSet services, the service has been rendered and earned during the month, the amount of the subscription is fixed or determinable based on established rates quoted on an annualized basis and collectability is reasonably assured. A provision for billing adjustments and cancellation of services is estimated and accounted for as a reduction ofto revenue, with a corresponding reduction to accounts receivable.
Accounts Receivable and Deferred Fees
Amounts that have been earned but not yet paid are reflected on the Consolidated Balance Sheets as accounts receivable, net of reserves. Amounts invoiced in advance or client payments that are in excess of earned subscription revenues are reflected on the Consolidated Balance Sheets as deferred fees. As of August 31, 2015, the amount of accounts receivable that was unbilled totaled $4.0 million, which was billed in fiscal 2016.
The Company calculates its receivable reserve through analyzing aged client receivables, reviewing the recent history of client receivable write-offs and understanding general market and economic conditions. In accordance with this policy, a receivable reserve of $1.6 million and $1.7 million was recorded as of August 31, 2015 and 2014, respectively, in the Consolidated Balance Sheets as a reduction to accounts receivable.
Cost of Services
Cost of services is comprised of compensation for Company employees within the content collection, consulting, product development, software and systems engineering groups in addition to data costs, computer maintenance and depreciation expenses, amortization of identifiable intangible assets, computer maintenance and depreciation expenses and client-related communication costs.
Selling, General and Administrative
Selling, general and administrative expenses include compensation for the sales and various other support and administrative departments in addition to travel and entertainment expenses, marketing costs, rent, amortization of leasehold improvements, depreciation of furniture and fixtures, office expenses, professional fees and other miscellaneous expenses.
Earnings per Share
Basic earnings per share (“EPS”) is computed by dividing net income by the number of weighted average common shares outstanding during the period. Diluted earnings per share is computed by dividing net income by the number of weighted average common shares outstanding during the period increased by the dilutive effect of potential common shares outstanding during the period. The number of potential common shares outstanding has been determined in accordance with the treasury stock method to the extent they are dilutive. Common share equivalents consist of common shares issuable upon the exercise of outstanding share-based compensation awards, including employee stock options and restricted stock. Under the treasury stock method, the exercise price paid by the optionee, future stock-based compensation expense that the Company has not yet recognized and the amount of tax benefits that would be recorded in additional paid-in capital (“APIC”) when the award becomes deductible are assumed to be used to repurchase shares.
Comprehensive Income (Loss)
The Company discloses comprehensive income (loss) in accordance with applicable standards for the reporting and display of comprehensive income (loss) in a set of financial statements. Comprehensive income (loss) is defined as the change in net assets of a business enterprise during a period from transactions generated from non-owner sources. It includes all changes in equity during a period except those resulting from investments by owners and distributions to owners.
Fair Value Measures
Fair value is defined as the price that would be received from selling an asset or paid to transfer a liability (i.e., the “exit price”) in an orderly transaction between market participants at the measurement date. In determining fair value, the use of various valuation methodologies, including market, income and cost approaches is permissible. The Company considers the principal or most advantageous market in which it would transact and considers assumptions that market participants would use when pricing the asset or liability. The accounting guidance for fair value measurements establishes a fair value hierarchy that requires an entity to maximize the use of observable inputs and minimize the use of unobservable inputs when measuring fair value. There are three levels of inputs that may be used to measure fair value based on the reliability of inputs. A financial instrument’s categorization within the fair value hierarchy is based upon the lowest level of input that is significant to the fair value measurement. The Company’s cash equivalents are classified as Level 1 while the Company’s derivative instruments (foreign exchange forward contracts) and certificates of deposit are classified as Level 2. There were no Level 3 assets or liabilities held by FactSet as of August 31, 20122015 or 2011.
Cash and Cash Equivalents
Cash and cash equivalents consist of demand deposits and corporate money market funds with original maturities of three months or less at the date of acquisition and are reported at fair value. The Company’s corporate money market funds are traded in an active market and the net asset value of each fund on the last day of the quarter is used to determine its fair value.
Investments
Investments consist of certificates of deposits with original maturities greater than three months, but less than one year and, as such, are classified as investments (short-term) on the Consolidated Balance Sheets. During fiscal 2012, the Company purchased $15.0 millionThese certificates of deposit are held for investment and are not debt securities. The Company’s investments are associated with its purchase of certificates of depositdeposits in India with maturity dates up tomaturities of less than twelve months from purchase date. The impactthe date of foreign currency reducedpurchase. Interest income earned from the carrying value by $2.2certificates of deposit during fiscal 2015, 2014 and 2013 were $2.0 million, as these deposits are held in Indian Rupees.
Property, Equipment and Leasehold Improvements
Property, equipment and leasehold improvements are stated at cost, less accumulated depreciation and amortization. Computers and related equipment are depreciated on a straight-line basis over estimated useful lives of three years. Furniture and fixtures are depreciated on a straight-line basis over their estimated useful lives of seven years. Leasehold improvements are amortized on a straight-line basis over the terms of the related leases or estimated useful lives of the improvements, whichever period is shorter. Repairs and maintenance expenditures, which are not considered leasehold improvements and do not extend the useful life of the property and equipment, are expensed as incurred.
The Company performs a test for impairment whenever events or changes in circumstances indicate that the carrying amount of an individual asset or asset group may not be recoverable. Should projected undiscounted future cash flows be less than the carrying amount of the asset or asset group, an impairment charge reducing the carrying amount to fair value is required. Fair value is determined based on the most appropriate valuation technique, including discounted cash flows.
Goodwill
Goodwill has resulted from the acquisitions of the Insyte, LionShares, Mergerstat, CallStreet, JCF, TrueCourse, Derivative Solutions, AlphaMetrics, Global Filings, DealMaven, Thomson Fundamentals, Market Metrics, StreetAccount, Revere, Matrix, ETF.com and StreetAccountCode Red businesses. Goodwill resulting from the acquisitions of LionShares, Mergerstat, TrueCourse, Derivative Solutions, Market Metrics, StreetAccount, Revere and StreetAccountMatrix are income tax-deductible based on the structure of the acquisition. On an ongoing basis, theThe Company evaluatesis required to test goodwill at the reporting unit level for indications of potential impairment.impairment annually, or more frequently if impairment indicators occur. Goodwill is tested for impairment based on the present value of discounted cash flows, and, if impaired, written down to fair value.value based on discounted cash flows. FactSet has determined that there were three reporting units, during fiscal years 2012, 2011 and 2010, which are consistent with the operating segments reported becauseas there is no discrete financial information available for the subsidiaries within each operating segment. The Company’s reporting units evaluated for potential impairment were the U.S., Europe and Asia Pacific, which reflectsreflect the level of internal reporting the Company uses to manage its business and operations. The Company performed anits annual goodwill impairment test during the fourth quarter of fiscal 2015, consistent with the timing of previous years, 2012, 2011 and 2010 andat which time it was determined that there were no indications of impairment, with the fair value of each of the Company’s reporting units that were deemed at risk and there had been no impairment.
Intangible Assets
FactSet’s identifiable intangible assets consist of certain acquired content databases, client relationships, software technology, non-compete agreements and trade names resulting from acquisitions, which have been fully integrated into the acquisitions of Insyte (data central application), LionShares (global equity ownership data), Mergerstat (M&A data), CallStreet (events and transcripts), JCF (earnings and other estimates), TrueCourse (takeover defense intelligence), Derivative Solutions (fixed income), AlphaMetrics (research and performance evaluation networking tool), Global Filings (equity and fixed income prospectuses), DealMaven (investment banking workflow tool), Thomson Fundamentals (financial data), Market Metrics (market research data on advisor-sold investments and insurance products), and StreetAccount (financial news) and dependingCompany’s operations. Depending on the nature of the intangible asset, the identifiable intangible assets are amortized on either a straight-line or an accelerated basis using estimated useful lives ranging between two and twenty years. The remaining useful lives of intangible assets subject to amortization are evaluated quarterly to determine whether events and circumstances warrant a revision to the remaining period of amortization. If the estimate of the remaining useful life is changed, the remaining carrying amount of the intangible asset is amortized prospectively over that revised remaining useful life. These intangible assets have no assigned residual values. Intangible assets are reviewed for impairment whenever events or changes in circumstances indicate that the carrying amount of such assets may not be recoverable. Determination of recoverability is based on an estimate of undiscounted future cash flows resulting from the use of the asset and its eventual disposition. Measurement of any impairment loss for intangible assets that management expects to hold and use is based on the amount the carrying value exceeds the fair value of the asset. No impairment of intangible assets has been identified during any of the periodsfiscal years presented.
FactSet enters into foreign currency forward contracts to reduce the effects of foreign currency fluctuations. In designing a specific hedging approach, FactSet considers several factors, including offsetting exposures, significance of exposures, forecasting risk and potential effectiveness of the hedge. These transactions are designated and accounted for as cash flow hedges in accordance with applicable accounting guidance. The changes in fair value for these foreign currency forward contracts are initially reported as a component of accumulated other comprehensive loss and subsequently reclassified into operating expenses when the hedged exposure affects earnings. The gains and losses on foreign currency forward contracts mitigate the variability in operating expenses associated with currency movements. All derivatives are assessed for effectiveness at each reporting period.
Accrued liabilities include estimates relating to employee compensation, operating expenses and tax liabilities. Approximately 15-20%15% of the Company’s employee incentive compensation programs are discretionary. At the end of each fiscal year, FactSet conducts a final review of both Company and departmental individual performance within each fiscal year enddepartment to determine the amount of discretionary employee compensation. The Company also reviews compensation throughout the year to determine how overall performance tracks against management’s expectations. Management takes these and other factors, including historical performance, into account in reviewing accrued compensation estimates quarterly and adjusting accrual rates as appropriate. The amount of the variable employee compensation recorded within accrued compensation as of August 31, 20122015 and 2011, were $35.92014, was $38.6 million and $37.2$37.3 million, respectively.
Derivative Instruments
FactSet conducts business outside the U.S. in several currencies including the Indian Rupee, Philippine Peso, British Pound Sterling, Euro and Japanese Yen. As such, it is exposed to movements in foreign currency exchange rates compared to the U.S. dollar. The Company accountsutilizes derivative instruments (foreign currency forward contracts) to manage the exposures related to the effects of foreign exchange rate fluctuations and reduce the volatility of earnings and cash flows associated with changes in foreign currency. The Company does not enter into foreign exchange forward contracts for repurchased common stock undertrading or speculative purposes. In designing a specific hedging approach, FactSet considers several factors, including offsetting exposures, significance of exposures, forecasting risk and potential effectiveness of the cost methodhedge. These transactions are designated and includes such treasury stockaccounted for as cash flow hedges in accordance with applicable accounting guidance.The changes in fair value for these foreign currency forward contracts are initially reported as a component of itsaccumulated other comprehensive loss (“AOCL”) and subsequently reclassified into operating expenses when the hedged exposure affects earnings. The gains and losses on foreign currency forward contracts mitigate the variability in operating expenses associated with currency movements. All derivatives are assessed for effectiveness at each reporting period.
Foreign Currency Translation
Certain wholly owned subsidiaries within the European and Asia Pacific segments operate under a functional currency different from the U.S. dollar, such as the British Pound Sterling, Euro, Japanese Yen, Indian Rupee and Philippine Peso. The financial statements of these foreign subsidiaries are translated into U.S. dollars using period-end rates of exchange for assets and liabilities, and average rates for the period for revenues and expenses. Translation gains and losses that arise from translating assets, liabilities, revenues and expenses of foreign operations are recorded in AOCL as a component of stockholders’ equity. At the time treasury stock retirement is approved by FactSet’s Board of Directors, the Company’s accounting policy is to deduct its par value from common stock, reduce additional paid-in capital (“APIC”) by the amount recorded in APIC when the stock was originally issuedThe accumulated foreign currency translation loss totaled $43.7 million and any remaining excess of cost as a deduction from retained earnings.
Income and Deferred Taxes
Income tax expense is based on taxable income determined in accordance with currentcurrently enacted laws and tax rates. Deferred income taxes are recorded for the temporary differences between the financial statement and tax bases of assets and liabilities using currently enacted tax rates.
Stock-Based Compensation
Accounting guidance requires the measurement and recognition of compensation expense for all share-based payment awards made to employees and directors including stock options, restricted stock and common shares acquired under employee stock purchases based on estimated fair values of the share awards that are scheduled to vest during the period. FactSet uses the straight-line attribution method for all awards with graded vesting features and service conditions only. Under this method, the amount of compensation expense that is recognized on any date is at least equal to the vested portion of the award on that date. For all stock-based awards with performance conditions, the graded vesting attribution method is used by the Company to determine the monthly stock-based compensation expense over the applicable vesting periods.
As stock-based compensation expense recognized is based on awards ultimately expected to vest, it has been reduced for estimated forfeitures. Forfeitures are estimated at the time of grant and revised, if necessary, in subsequent periods if actual forfeitures differ from those estimates. Forfeitures wereare estimated based primarily on historical experience. Windfall tax benefits, defined as tax deductions that exceed recorded stock-based compensation, are classified as cash inflows from financing activities.
Performance-based stock options require management to make assumptions regarding the likelihood of achieving Company performance targets on a quarterly basis. Thebasis.The number of performance-based options that vest will be predicated on the Company achieving certain performance levels. A change in the financial performance levels the Company achieves could result in changes to FactSet’s current estimate of the vesting percentage and related stock-based compensation.
Treasury Stock
The Company accounts for repurchased common stock under the cost method and includes such treasury stock as a component of its stockholders’ equity. At the time treasury stock retirement is approved by FactSet’s Board of Directors, the Company’s accounting policy is to time,deduct its par value from common stock, reduce APIC by the Company is subject to legal proceedings, claims,amount recorded in APIC when the stock was originally issued and litigation arising in the ordinary courseany remaining excess of business, including intellectual property litigation. FactSet accrues liabilities for contingencies when management believes thatcost as a loss is probable and the amounts can be reasonably estimated, while contingent gains are recognized only when realized. Legal costs for services rendered in the course of these proceedings are charged to expense as they are incurred.
Operating Leases
The Company conducts all of its operations in leased facilities which have minimum lease obligations under non-cancelable operating leases. Certain of these leases contain rent escalations based on specified percentages. Most of the leases contain renewal options and require payments for taxes, insurance and maintenance. Rent expense is charged to operations as incurred except for escalating rents, which are charged to operations on a straight-line basis over the life of the lease. Leaselease.Lease incentives, relating to allowances provided by landlords, are amortized over the term of the lease as a reduction of rent expense. Costs associated with acquiring a subtenant, including broker commissions and tenant allowances, are amortized over the sublease term as a reduction of sublease income.
Business Combinations
The Company records acquisitions using the purchase method of accounting. All of the assets acquired, liabilities assumed, contractual contingencies and contingent consideration are recognized at their fair value on the acquisition date. The application of the purchase method of accounting for business combinations requires management to make significant estimates and assumptions in the determination of the fair value of assets acquired and liabilities assumed in order to properly allocate purchase price consideration between assets that are depreciated and amortized from goodwill. The excess of the fair value of purchase consideration over the fair values of these identifiable assets and liabilities is recorded as goodwill. Acquisition-related expenses and restructuring costs are recognized separately from the business combination and are expensed as incurred.
Concentrations of Risk
Cash and cash equivalents are maintained with several financial institutions. Deposits held with banks may exceed the amount of insurance provided on such deposits. Generally, these deposits may be redeemed upon demand and are maintained with financial institutions with reputable credit and therefore bear minimal credit risk. The Company seeks to mitigate its credit risks by spreading such risks across multiple counterparties and monitoring the risk profiles of these counterparties.
New Accounting Standards or Updates Recently Adopted Accounting Guidance
Except for the new accounting standard updates disclosed below, the new updates issued by the Financial Accounting Standards Board (“FASB”) on disclosure requirements related to fair value measurements. The guidance requiresduring the disclosure of roll-forward activities on purchases, sales, issuance, and settlements of the assets and liabilities measured using significant unobservable inputs (Level 3 fair value measurements). Adoption of this new guidancelast three fiscal years did not have an impact on the Company’s consolidated financial statements.
Reporting of Amounts Reclassified out of Accumulated Other Comprehensive Income
In February 2013, the FASB issued an accounting standard update to require reclassification adjustments from other comprehensive income to be presented either in the financial statements or in the notes to the financial statements. This accounting standard update became effective for FactSet beginning in the first quarter of fiscal 2014 and the additional information has been disclosed in Note 6,Other Comprehensive (Loss) Income and Accumulated Other Comprehensive Loss.
Cumulative Translation Adjustments
In March 2013, the FASB issued an accounting standard update requiring an entity to release into net income the entire amount of a cumulative translation adjustment related to its investment in a foreign entity when as a parent it either sells a part or all of its investment in a foreign entity or no longer holds a controlling financial interest in a subsidiary or group of assets within a foreign entity. This accounting standard update was adopted by FactSet beginning in the first quarter of fiscal 2014 and did not have an impact on the Company’s consolidated financial statements.
Recent Accounting Standards or Updates Not Yet Effective
Reporting Discontinued Operations
In April 2014, the FASB issued an accounting standard update that changes the criteria for reporting discontinued operations. Under the accounting standard update, a disposal of a component of an entity or a group of components of an entity is required to be reported in discontinued operations if the disposal represents a strategic shift that has, or will have, a major effect on an entity's operations and financial results when either it qualifies as held for sale, disposed of by sale, or disposed of other than by sale. This accounting standard update will be effective for FactSet beginning in the first quarter of fiscal 2016.The Company does not believe this new accounting standard update will have a material impact on its consolidated financial statements.
Revenue Recognition
In May 2014, the FASB issued an accounting standard update which provides clarified principles for recognizing revenue arising from contracts with clients and supersedes most current revenue recognition guidance, including industry-specific guidance. The core principle of the revenue model is that an entity recognizes revenue to depict the transfer of promised goods or services to clients in an amount that reflects the consideration to which the entity expects to be entitled in exchange for those goods or services. In applying the revenue model to contracts within its scope, an entity will identify the contract with a client, identify the performance obligations in the contract, determine the transaction price, allocate the transaction price to the performance obligations in the contract and recognize revenue when (or as) the entity satisfies a performance obligation. This accounting standard update will be effective for FactSet beginning in the first quarter of fiscal 2019, with early adoption in fiscal 2018 permitted. The Company is currently evaluating the impact of this accounting standard update on its consolidated financial statements.
Going Concern
In August 2014, the FASB onissued an accounting standard update that requires management to evaluate and disclose whether there are conditions and events that raise substantial doubt about an entity’s ability to continue as a going concern within one year after financial statements are issued. The evaluation and disclosure requirements relatedwill be required to fair value measurements.be made for both annual and interim reporting periods, if applicable, along with an evaluation as to whether management’s plans alleviate that doubt. This accounting standard update will be effective for FactSet beginning in the first quarter of fiscal 2017. The guidance is the result of joint efforts byCompany does not believe this new accounting standard update will have a material impact on its consolidated financial statements.
Income Statement Presentation – Extraordinary and Unusual Items
In January 2015, the FASB issued an accounting standard update that eliminates from GAAP the concept of extraordinary items. This accounting standard update will be effective for FactSet beginning in the first quarter of fiscal 2017. The standard primarily involves presentation and International Accounting Standards Boarddisclosure and, therefore, is not expected to develop a single, converged fair value framework on how to measure fair value and what disclosures to provide about fair value measurements. The most significant change in disclosures is an expansion of the information required for Level 3 measurements based on unobservable inputs. The adoption did not have a material impact on the Company’s financial condition, results of operations or its cash flows.
Simplification Guidance on Debt Issuance Costs
In April 2015, the FASB issued an accounting standard update which changes the presentation of debt issuance costs in the applicable financial statements. Under the accounting standard update, an entity should present such costs in the balance sheet as a direct deduction from the related debt liability rather than as an asset. Amortization of the costs is reported as interest expense. This accounting standard update will be effective for FactSet beginning in the first quarter of fiscal 2017. The Company does not believe this new accounting standard update will have a material impact on its consolidated financial statements.
In August 2015, the FASB issued an accounting standard update to amend the previous guidance issued in April 2015 and address debt issuance costs related to line-of-credit arrangements. The accounting standard update allows an entity to present debt issuance costs related to a line-of-credit as an asset and subsequently amortize the deferred debt issuance costs ratably over the term of the line-of-credit arrangement, regardless of whether there are any outstanding borrowings on the arrangement. This accounting standard update did not impact the effective date of the previously issued guidance and the Company does not believe it will have a material impact on its consolidated financial statements.
Customers’ Accounting for Cloud Computing Costs
In April 2015, the FASB issued an accounting standard update to provide guidance on a customer’s accounting for cloud computing costs. Under the accounting standard update, a customer must determine whether a cloud computing arrangement contains a software license. If so, the customer would account for the fees related to the software license element in a manner consistent with how the accounting for software licenses is accounted for under previously issued guidance. If the arrangement does not contain a software license, the customer would account for the arrangement as a service contract. This guidance will be effective for FactSet beginning in the first quarter of fiscal 2017. The Company does not believe this new accounting standard update will have a material impact on its consolidated financial statements.
No other new accounting pronouncements issued or effective during fiscal 2012as of August 31, 2015 have had or are expected to have an impact on the Company’s consolidated financial statements.
4. FAIR VALUE MEASURES
Fair value is defined as the price that would be received from selling an asset or paid to transfer a liability (i.e., the “exit price”) in an orderly transaction between market participants at the measurement date. WhenIn determining the fair value, measurements for assetsthe use of various valuation methodologies, including market, income and liabilities required or permitted to be recorded at fair value, thecost approaches is permissible. The Company considers the principal or most advantageous market in which it would transact and considers assumptions that market participants would use when pricing the asset or liability.
Fair Value Hierarchy
The accounting guidance for fair value measurements establishes a fair value hierarchy that requires an entity to maximize the use of observable inputs and minimize the use of unobservable inputs when measuring fair value. There are three levels of inputs that may be used to measure fair value based on the reliability of inputs. A financial instrument’s categorization within the fair value hierarchy is based upon the lowest level of input that is significant to the fair value measurement. The Company’s assessment of the significance of a particular input to the fair value measurement requires judgment and may affect their placement within the fair value hierarchy levels. FactSet has categorized its cash equivalents, investments and derivatives within the hierarchy as follows:
Level 1 -applies to assets or liabilities for which there are quoted prices in active markets for identical assets or liabilities. These Level 1 assets and liabilities include FactSet’s corporate money market funds that are classified as cash equivalents.
Level 2 -applies to assets or liabilities for which there are inputs other than quoted prices that are observable for the asset or liability such as quoted prices for similar assets or liabilities in active markets; quoted prices for identical assets or liabilities in markets with insufficient volume or infrequent transactions (less active markets); or model-derived valuations in which significant inputs are observable or can be derived principally from, or corroborated by, observable market data. The Company’s certificates of deposit and derivative instruments are classified as Level 2.
Level 3 -applies to assets or liabilities for which there are unobservable inputs to the valuation methodology that are significant to the measurement of the fair value of the assets or liabilities. There were no Level 3 assets or liabilities held by FactSet as of August 31, 20122015 or 2011.2014.
(a) Assets and Liabilities Measured at Fair Value on a Recurring Basis
The following tables shows by level within the fair value hierarchy the Company’s assets and liabilities that are measured at fair value on a recurring basis at August 31, 20122015 and 20112014 (in thousands):
Fair Value Measurements at Reporting Date Using | ||||||||||||||||
| August 31, 2012 | Level 1 | Level 2 | Level 3 | Total | ||||||||||||
| Assets | ||||||||||||||||
Corporate money market funds (1) | $ | 160,169 | $ | - | $ | - | $ | 160,169 | ||||||||
Certificates of deposit (2) | - | 13,919 | - | 13,919 | ||||||||||||
| Total assets measured at fair value | $ | 160,169 | $ | 13,919 | $ | - | $ | 174,088 | ||||||||
| Liabilities | ||||||||||||||||
Derivative instruments (3) | $ | - | $ | 2,374 | $ | - | $ | 2,374 | ||||||||
| Total liabilities measured at fair value | $ | - | $ | 2,374 | $ | - | $ | 2,374 | ||||||||
Fair Value Measurements at Reporting Date Using | ||||||||||||||||
| August 31, 2011 | Level 1 | Level 2 | Level 3 | Total | ||||||||||||
| Assets | ||||||||||||||||
Corporate money market funds (1) | $ | 161,168 | $ | - | $ | - | $ | 161,168 | ||||||||
Derivative instruments (3) | - | 897 | - | 897 | ||||||||||||
| Total assets measured at fair value | $ | 161,168 | $ | 897 | $ | - | $ | 162,065 | ||||||||
Fair Value Measurements at Reporting Date Using | ||||||||||||||||
August 31, 2015 | Level 1 | Level 2 | Level 3 | Total | ||||||||||||
Assets | ||||||||||||||||
Corporate money market funds(1) | $ | 89,443 | $ | — | $ | — | $ | 89,443 | ||||||||
Certificates of deposit(2) | — | 23,497 | — | 23,497 | ||||||||||||
Derivative instruments(3) | — | 1,035 | — | 1,035 | ||||||||||||
Total assets measured at fair value | $ | 89,443 | $ | 24,532 | $ | — | $ | 113,975 | ||||||||
Liabilities | ||||||||||||||||
Derivative instruments(3) | $ | — | $ | 1,602 | $ | — | $ | 1,602 | ||||||||
Total liabilities measured at fair value | $ | — | $ | 1,602 | $ | — | $ | 1,602 | ||||||||
Fair Value Measurements at Reporting Date Using | ||||||||||||||||
August 31, 2014 | Level 1 | Level 2 | Level 3 | Total | ||||||||||||
Assets | ||||||||||||||||
Corporate money market funds(1) | $ | 75,363 | $ | — | $ | — | $ | 75,363 | ||||||||
Certificates of deposit(2) | — | 20,008 | — | 20,008 | ||||||||||||
Derivative instruments(3) | — | 1,406 | — | 1,406 | ||||||||||||
Total assets measured at fair value | $ | 75,363 | $ | 21,414 | $ | — | $ | 96,777 | ||||||||
Liabilities | ||||||||||||||||
Derivative instruments(3) | $ | — | $ | 591 | $ | — | $ | 591 | ||||||||
Total liabilities measured at fair value | $ | — | $ | 591 | $ | — | $ | 591 | ||||||||
(1) | The Company’s corporate money market funds are traded in an active market and the net asset value of each fund on the last day of the quarter is used to determine its fair value. As such, the Company’s corporate money market funds are classified as Level 1 and included in cash and cash equivalents on the consolidated balance sheet. |
(2) | The Company’s |
(3) | The Company utilizes the income approach to measure fair value for its derivative instruments |
The Company did not have any transfers between Level 1 and Level 2 fair value measurements during the periods presented.
Fair Value Measurements at Reporting Date Using | ||||||||||||||||
| August 31, 2012 | Level 1 | Level 2 | Level 3 | Total | ||||||||||||
| Cash and cash equivalents | $ | 160,169 | $ | - | $ | - | $ | 160,169 | ||||||||
| Investments (short-term) | - | 13,919 | - | 13,919 | ||||||||||||
| Total assets measured at fair value | $ | 160,169 | $ | 13,919 | $ | - | $ | 174,088 | ||||||||
| Accounts payable and accrued liabilities (derivative liabilities) | $ | - | $ | 2,374 | $ | - | $ | 2,374 | ||||||||
| Total liabilities measured at fair value | $ | - | $ | 2,374 | $ | - | $ | 2,374 | ||||||||
Fair Value Measurements at Reporting Date Using | ||||||||||||||||
| August 31, 2011 | Level 1 | Level 2 | Level 3 | Total | ||||||||||||
| Cash and cash equivalents | $ | 161,168 | $ | - | $ | - | $ | 161,168 | ||||||||
| Prepaid expenses and other current assets (derivative assets) | - | 897 | - | 897 | ||||||||||||
| Total assets measured at fair value | $ | 161,168 | $ | 897 | $ | - | $ | 162,065 | ||||||||
(b) Assets and Liabilities Measured at Fair Value on a Non-recurring Basis
Certain assets, including goodwill and intangible assets, and liabilities, are measured at fair value on a non-recurring basis; that is, the assets and liabilities are not measured at fair value on an ongoing basis but are subject to fair value adjustments in certain circumstances such as when they are deemed to be other-than-temporarily impaired. The fair values of these non-financial assets and liabilities are determined based on valuation techniques using the best information available, and may include quoted market prices, market comparables, and discounted cash flow projections. An impairment charge is recorded when the cost exceeds its fair value, and this condition is determined to be other-than-temporary.based upon the results of such valuations. During fiscal 2012,2015 and 2014, no fair value adjustments or material fair value measurements were required for the Company’s non-financial assets or liabilities.
(c)Assets and cash equivalents consistLiabilities Measured at Fair Value for Disclosure Purposes only
As of demand deposits and corporate money market funds with maturities of three months or less at the date of acquisition and are reported at fair value.
Amortized Cost | Gross Unrealized Gain | Fair Value | ||||||||||
| Cash on hand | $ | 28,875 | $ | - | $ | 28,875 | ||||||
| Corporate money market funds | 160,169 | - | 160,169 | |||||||||
| Total cash and cash equivalents | $ | 189,044 | $ | - | $ | 189,044 | ||||||
Amortized Cost | Gross Unrealized Gain | Fair Value | ||||||||||
| Cash on hand | $ | 20,517 | $ | - | $ | 20,517 | ||||||
| Corporate money market funds | 161,168 | - | 161,168 | |||||||||
| Total cash and cash equivalents | $ | 181,685 | $ | - | $ | 181,685 | ||||||
5.DERIVATIVE INSTRUMENTS
Cash Flow Hedges
FactSet conducts business outside the U.S. in several currencies including the British Pound Sterling, Euro, Japanese Yen, Indian Rupee and Philippine Peso. As such, it is exposed to movements in foreign currency exchange rates compared to the U.S. dollar. ToThe Company utilizes derivative instruments (foreign currency forward contracts) to manage the exposures related to the effects of foreign exchange rate fluctuations the Company utilizes derivative instruments (foreign currency forward contracts). The Company’s primary objective in holding derivatives is toand reduce the volatility of earnings and cash flows associated with changes in foreign currency. The Company does not enter into foreign exchange forward contracts for trading or speculative purposes.
As of August 31, 2015, FactSet maintained the following foreign currency forward contracts to hedge its Indian Rupee, British Pound Sterling and Euro exposure:
● |
|
● |
|
● | Euro -foreign currency forward contracts to hedge approximately |
The following is a summary of all hedging positions and corresponding fair values (in thousands):
| Gross Notional Value | Fair Value Asset (Liability) | |||||||||||||||
| Currency Hedged (in USD) | Aug 31, 2012 | Aug 31, 2011 | Aug 31, 2012 | Aug 31, 2011 | ||||||||||||
| Euro | $ | 10,160 | $ | 8,422 | $ | 60 | $ | 916 | ||||||||
| Indian Rupee | 36,286 | - | (2,434 | ) | - | |||||||||||
| Japanese Yen | - | 196 | - | (19 | ) | |||||||||||
| Total | $ | 46,446 | $ | 8,618 | $ | (2,374 | ) | $ | 897 | |||||||
Gross Notional Value | Fair Value Asset (Liability) | |||||||||||||||
Currency Hedged (in U.S. dollars) | Aug 31, 2015 | Aug 31, 2014 | Aug 31, 2015 | Aug 31, 2014 | ||||||||||||
Indian Rupee | $ | 56,320 | $ | 38,479 | $ | (990 | ) | $ | 700 | |||||||
Philippine Peso | — | 6,500 | — | 115 | ||||||||||||
Euro | 20,263 | — | 143 | — | ||||||||||||
British Pound Sterling | 15,831 | — | 280 | — | ||||||||||||
Total | $ | 92,414 | $ | 44,979 | $ | (567 | ) | $ | 815 | |||||||
As of August 31, 2015, the gross notional value of foreign exchange contracts to purchase Indian Rupees with U.S. dollars was Rs. 4.0 billion. The gross notional value of foreign exchange contracts to purchase Euros with U.S. dollars was €18.1 million. The gross notional value of foreign exchange contracts to purchase British Pound Sterling with U.S. dollars was £10.5 million.
Counterparty Credit Risk
As a result of the use of derivative instruments, the Company is exposed to counterparty credit risk. FactSet has incorporated counterparty risk into the fair value of its derivative assets and its own credit risk into the value of the Company’s derivative liabilities. FactSet calculates credit risk from observable data related to credit default swaps (“CDS”) as quoted by publicly available information. Counterparty risk is represented by CDS spreads related to the senior secured debt of the respective bank with whom FactSet has executed these derivative transactions. Because CDS spread information is not available for FactSet, the Company’s credit risk is determined based on using a simple average of CDS spreads for peer companies.
Fair Value of Derivative Instruments
The following tables provide a summary of the fair value amounts of derivative instruments and gains and losses on derivative instruments (in thousands):
| Designation of Derivatives | Balance Sheet Location | Aug 31, 2012 | Aug 31, 2011 | ||||||
| Derivatives designated as hedging instruments | Assets: Foreign Currency Forward Contracts | ||||||||
| Prepaid expenses and other current assets | $ | - | $ | 897 | |||||
| Liabilities: Foreign Currency Forward Contracts | |||||||||
| Accounts payable and accrued expenses | $ | 2,374 | $ | - |
Designation of Derivatives | Balance Sheet Location | Aug 31, 2015 | Aug 31, 2014 | ||||||
Derivatives designated as hedging instruments | Assets: Foreign Currency Forward Contracts | ||||||||
Prepaid expenses and other current assets | $ | 1,035 | $ | 114 | |||||
Other assets | $ | — | 1,292 | ||||||
Liabilities: Foreign Currency Forward Contracts | |||||||||
Accounts payable and accrued expenses | $ | — | $ | 591 | |||||
Deferred rent and other non-current liabilities | $ | 1,602 | $ | — | |||||
All derivatives were designated as hedging instruments as of August 31, 20122015 and 2011,2014, respectively.
Derivatives in Cash Flow Hedging Relationships
The following table provides the pre-tax effect of derivative instruments in cash flow hedging relationships for the twelve monthseach of the three fiscal years ended August 31, 2012 and 2011 (in thousands):
(Loss) Gain Recognized in AOCL on Derivatives (Effective Portion) | Location of (Loss) Gain Reclassified from AOCL into Income | (Loss) Gain Reclassified from AOCL into Income (Effective Portion) | ||||||||||||||
| Derivatives in Cash Flow Hedging Relationships | 2012 | 2011 | (Effective Portion) | 2012 | 2011 | |||||||||||
| Foreign currency forward contracts | $ | (3,172 | ) | $ | 5,010 | SG&A | $ | (1,031) | $ | 4,182 | ||||||
(Loss) Gain Recognized in AOCL on Derivatives | Location of Loss | (Loss) Reclassified | |||||||||||||||||||||||
Derivatives in Cash Flow Hedging Relationships | 2015 | 2014 | 2013 | Reclassified from AOCL into Income(Effective Portion) | 2015 | 2014 | 2013 | ||||||||||||||||||
Foreign currency forward contracts | $ | (1,939 | ) | $ | 8,294 | $ | (6,258 | ) | SG&A | $ | (559 | ) | $ | (260 | ) | $ | (1,000 | ) | |||||||
No amount of ineffectiveness was recorded in the Consolidated Statements of Income for these designated cash flow hedges and all components of each derivative’s gain or loss was included in the assessment of hedge effectiveness.
Offsetting of Derivative Instruments
FactSet’s master netting and other similar arrangements with its respective counterparties allow for net settlement under certain conditions. As of August 31, 2015 and 2014, respectively, information related to these offsetting arrangements was as follows (in thousands):
Derivatives Offset in Consolidated Balance Sheets | ||||||||||||
August 31, 2015 | Gross Derivative Amounts | Gross Derivative Amounts Offset in Balance Sheet | Net Amounts | |||||||||
Fair value of assets | $ | 1,040 | $ | (5 | ) | $ | 1,035 | |||||
Fair value of liabilities | (1,607 | ) | 5 | (1,602 | ) | |||||||
Total | $ | (567 | ) | $ | — | $ | (567 | ) | ||||
Derivatives Offset in Consolidated Balance Sheets | ||||||||||||
August 31, 2014 | Gross Derivative Amounts | Gross Derivative Amounts Offset in Balance Sheet | Net Amounts | |||||||||
Fair value of assets | $ | 1,406 | $ | — | $ | 1,406 | ||||||
Fair value of liabilities | (626 | ) | 35 | (591 | ) | |||||||
Total | $ | 780 | $ | 35 | $ | 815 | ||||||
Twelve Months Ended August 31, | ||||||||
| 2012 | 2011 | |||||||
| Beginning balance, net of tax | $ | 590 | $ | (238 | ) | |||
| Changes in fair value | (3,172 | ) | 5,010 | |||||
| Realized loss (gain) reclassified to earnings | 1,031 | (4,182 | ) | |||||
| Ending balance, net of tax | $ | (1,551 | ) | $ | 590 | |||
6. OTHER COMPREHENSIVE(LOSS) INCOMEAND ACCUMULATED OTHER COMPREHENSIVE LOSS
The components of other comprehensive (loss) income during the fiscal years ended August 31, 2015, 2014, and 2013 are as follows (in thousands):
August 31, 2015 | August 31, 2014 | August 31, 2013 | ||||||||||||||||||||||
Pre-tax | Net of tax | Pre-tax | Net of tax | Pre-tax | Net of tax | |||||||||||||||||||
Foreign currency translation adjustments | $ | (25,263 | ) | $ | (25,263 | ) | $ | 7,895 | $ | 7,895 | $ | (5,151 | ) | $ | (5,151 | ) | ||||||||
Realized loss on cash flow hedges reclassified to earnings(1) | 559 | 352 | 260 | 164 | 1,000 | 622 | ||||||||||||||||||
Unrealized (loss) gain on cash flow hedges recognized in AOCL | (1,939 | ) | (1,220 | ) | 8,294 | 5,193 | (6,258 | ) | (3,918 | ) | ||||||||||||||
Other comprehensive (loss) income | $ | (26,643 | ) | $ | (26,131 | ) | $ | 16,449 | $ | 13,252 | $ | (10,409 | ) | $ | (8,447 | ) | ||||||||
(1) | Reclassified to Selling, General and Administrative Expenses |
The components of AOCL are as follows (in thousands):
August 31, 2015 | August 31, 2014 | |||||||
Accumulated unrealized (losses) gains on cash flow hedges, net of tax | $ | (358 | ) | $ | 510 | |||
Accumulated foreign currency translation adjustments | (43,694 | ) | (18,431 | ) | ||||
Total accumulated other comprehensive loss | $ | (44,052 | ) | $ | (17,921 | ) | ||
7. SEGMENT INFORMATION
Operating segments are defined as components of an enterprise that engage in business activities from which itthey may earn revenues and incur expenses, whose operating results are regularly reviewed by the enterprise’s chief operating decision maker (“CODM”) to make decisions about resources to be allocated to the segment and assess its performance, and for which discrete financial information is available. FactSet’s CODM is its Chief Executive Officer, who is responsible for making decisions about resources allocated amongst the operating segments based on actual results.
FactSet’s reportableoperating segments are aligned with how the Company, including its CODM, manages the business and the demographic markets in which FactSet serves. The Company’s internal financial reporting structure is based on three reportable segments; U.S., Europe and Asia Pacific. FactSet believes this alignment helps it better manage the business and view the markets the Company serves, which are centered on providing integrated global financial and economic information. Sales, consulting, data collection, product development and software engineering are the primary functional groups within the U.S., Europe and Asia Pacific segments that provide global financial and economic information to investment managers, investment banks and other financial services professionals. The U.S. segment services finance professionals including financial institutions throughout North America,the Americas, while the European and Asia Pacific segments service investment professionals located throughout Europe and Asia, respectively.The accounting policies of the segments are the same as those described in the Note 2, 3,Summary of Significant Accounting Policies.
The European segment is headquartered in London, England and maintains office locations in France, Germany, Italy, Ireland, Latvia, Luxembourg, the Netherlands, DubaiSpain, South Africa, Sweden and Italy.Dubai. The Asia Pacific segment is headquartered in Tokyo, Japan with office locations in Australia, Hong Kong, AustraliaSingapore and Mumbai, India. Segment revenues reflect direct sales to clients based in their respective geographic locations. There are no intersegment or intercompany sales of the FactSet service.services. Each segment records compensation expense, including stock-based compensation, data collection costs, amortization of intangible assets, depreciation of furniture and fixtures, amortization of leasehold improvements, communication costs, professional fees, rent expense, travel, marketing, office and other direct expenses. Expenditures associated with the Company’s data centers, third party data costs and corporate headquarters charges are recorded by the U.S. segment and are not allocated to the other segments. The content collection centers located in India and the Philippines benefit all of the Company’s operating segments and thus the expenses incurred at these locations are allocated to each segment based on a percentage of revenues. Of the total $246$308.3 million of goodwill reported by the Company at August 31, 2012, 68%2015, 69% was recorded in the U.S. segment, 30% in the European segment and the remaining 2%1% in the Asia Pacific segment.
The following reflects the results of operations of the segments consistent with the Company’s management system. These results are used, in part, by management, both in evaluating the performance of, and in allocating resources to, each of the segments (in thousands).
| Year Ended August 31, 2012 | U.S. | Europe | Asia Pacific | Total | ||||||||||||
| Revenues from clients | $ | 550,474 | $ | 197,404 | $ | 57,915 | $ | 805,793 | ||||||||
| Segment operating profit | 149,968 | 95,417 | 27,605 | 272,990 | ||||||||||||
| Total assets | 377,320 | 266,967 | 49,856 | 694,143 | ||||||||||||
| Depreciation and amortization | 25,061 | 4,922 | 3,796 | 33,779 | ||||||||||||
| Stock-based compensation | 20,180 | 1,680 | 122 | 21,982 | ||||||||||||
| Capital expenditures | 20,408 | 488 | 1,624 | 22,520 | ||||||||||||
| Year Ended August 31, 2011 | U.S. | Europe | Asia Pacific | Total | ||||||||||||
| Revenues from clients | $ | 497,564 | $ | 178,693 | $ | 50,253 | $ | 726,510 | ||||||||
| Segment operating profit | 135,327 | 79,637 | 23,371 | 238,335 | ||||||||||||
| Total assets | 353,205 | 274,139 | 30,096 | 657,440 | ||||||||||||
| Depreciation and amortization | 27,463 | 6,092 | 3,292 | 36,847 | ||||||||||||
| Stock-based compensation | 23,091 | 2,364 | 318 | 25,773 | ||||||||||||
| Capital expenditures | 20,588 | 2,770 | 5,985 | 29,343 | ||||||||||||
Year Ended August 31, 2010 | U.S. | Europe | Asia Pacific | Total | ||||||||||||
| Revenues from clients | $ | 435,351 | $ | 161,649 | $ | 44,059 | $ | 641,059 | ||||||||
| Segment operating profit | 124,976 | 72,239 | 24,419 | 221,634 | ||||||||||||
| Total assets | 401,684 | 216,171 | 26,753 | 644,608 | ||||||||||||
| Depreciation and amortization | 28,866 | 6,466 | 2,011 | 37,343 | ||||||||||||
| Stock-based compensation | 12,471 | 1,424 | 170 | 14,065 | ||||||||||||
| Capital expenditures | 13,890 | 684 | 6,194 | 20,768 | ||||||||||||
Year Ended August 31, 2015 | U.S. | Europe | Asia Pacific | Total | ||||||||||||
Revenues from clients | $ | 678,774 | $ | 251,522 | $ | 76,472 | $ | 1,006,768 | ||||||||
Segment operating profit | 172,980 | 116,310 | 42,628 | 331,918 | ||||||||||||
Total assets | 427,990 | 239,689 | 68,992 | 736,671 | ||||||||||||
Depreciation and amortization | 23,645 | 5,135 | 2,569 | 31,349 | ||||||||||||
Stock-based compensation | 23,006 | 2,991 | 374 | 26,371 | ||||||||||||
Capital expenditures | 22,459 | 460 | 2,763 | 25,682 | ||||||||||||
Year Ended August 31, 2014 | U.S. | Europe | Asia Pacific | Total | ||||||||||||
Revenues from clients | $ | 624,642 | $ | 227,395 | $ | 68,298 | $ | 920,335 | ||||||||
Segment operating profit | 165,004 | 100,937 | 36,278 | 302,219 | ||||||||||||
Total assets | 362,255 | 239,654 | 61,303 | 663,212 | ||||||||||||
Depreciation and amortization | 25,574 | 5,656 | 3,205 | 34,435 | ||||||||||||
Stock-based compensation | 20,288 | 2,231 | 372 | 22,891 | ||||||||||||
Capital expenditures | 16,047 | 647 | 1,049 | 17,743 | ||||||||||||
Year Ended August 31, 2013 | U.S. | Europe | Asia Pacific | Total | ||||||||||||
Revenues from clients | $ | 586,865 | $ | 208,827 | $ | 62,420 | $ | 858,112 | ||||||||
Segment operating profit | 138,706 | 100,187 | 30,526 | 269,419 | ||||||||||||
Total assets | 444,406 | 193,202 | 52,589 | 690,197 | ||||||||||||
Depreciation and amortization | 27,757 | 4,027 | 3,995 | 35,779 | ||||||||||||
Stock-based compensation | 37,307 | 2,264 | 380 | 39,951 | ||||||||||||
Capital expenditures | 13,649 | 1,276 | 3,592 | 18,517 | ||||||||||||
GEOGRAPHIC INFORMATION -The following table sets forth information for those countries that are 10% or more of revenues (in thousands).:
| Years Ended August 31, | 2012 | 2011 | 2010 | |||||||||
Revenues* | ||||||||||||
| United States | $ | 550,474 | $ | 497,564 | $ | 435,351 | ||||||
| United Kingdom | 114,435 | 104,698 | 94,749 | |||||||||
| All other European countries | 82,969 | 73,995 | 66,900 | |||||||||
| Asia Pacific | 57,915 | 50,253 | 44,059 | |||||||||
| Total revenues | $ | 805,793 | $ | 726,510 | $ | 641,059 | ||||||
Years Ended August 31, | 2015 | 2014 | 2013 | |||||||||
Revenues(1) | ||||||||||||
United States | $ | 678,774 | $ | 624,642 | $ | 586,865 | ||||||
United Kingdom | 144,769 | 131,848 | 121,072 | |||||||||
All other European countries | 106,753 | 95,547 | 87,755 | |||||||||
Asia Pacific | 76,472 | 68,298 | 62,420 | |||||||||
Total revenues | $ | 1,006,768 | $ | 920,335 | $ | 858,112 | ||||||
(1) | Revenues are attributed to countries based on the location of the client. |
The following table sets forth long-lived assets by geographic area (in thousands):
At August 31, | 2015 | 2014 | 2013 | |||||||||
Long-lived Assets(1) | ||||||||||||
United States | $ | 49,923 | $ | 46,294 | $ | 51,184 | ||||||
United Kingdom | 3,655 | 4,669 | 4,806 | |||||||||
All other European countries | 1,322 | 2,267 | 3,051 | |||||||||
Asia Pacific | 4,364 | 4,411 | 6,330 | |||||||||
Total long-lived assets | $ | 59,264 | $ | 57,641 | $ | 65,371 | ||||||
(1) | Long-lived assets consist of property, equipment and leasehold improvements, net of accumulated depreciation and amortization and exclude goodwill, intangible assets, deferred taxes and other assets. |
| At August 31, | 2012 | 2011 | 2010 | |||||||||
Long-lived Assets** | ||||||||||||
| United States | $ | 60,288 | $ | 60,092 | $ | 62,275 | ||||||
| United Kingdom | 5,466 | 6,863 | 7,457 | |||||||||
| All other European countries | 2,951 | 4,075 | 2,283 | |||||||||
| Philippines | 3,420 | 4,181 | 2,413 | |||||||||
| India | 2,921 | 4,453 | 3,283 | |||||||||
| All other Asia Pacific countries | 1,484 | 1,956 | 1,784 | |||||||||
| Total long-lived assets | $ | 76,530 | $ | 81,620 | $ | 79,495 | ||||||
8. BUSINESS COMBINATIONS
Code Red, Inc.
On June 29, 2012,February 6, 2015, FactSet acquired StreetAccount LLCCode Red, Inc. (“SA”Code Red”) to complementfor $36.0 million. At the Company's news offering with distilled and crucial market moving information for buy-side and sell-side institutions. Founded in 2003, SA is known for its timely and informative news summaries and provides investment professionals with an efficient method for managing news flow. The SA service includes real-time company updates, portfolio and sector filtering, email alerts, and market summaries. Content is written by financial professionals and can be customized for portfolio, index, sector, market, time of day (i.e., Overnight Summaries),acquisition, Code Red employed 32 individuals and category (i.e., Top Stories, Market Summaries, Economic, M&A). As of the date of acquisition, SA had annual subscriptions of $11.4 million and employed 49 individuals. The acquisition of SA did not have an impact on FactSet’s fourth quarter diluted earnings per share.
The total purchase price of the acquisitionCode Red is as follows (in thousands):
| Cash consideration | $ | 21,632 | ||
| Fair value of FactSet stock issued | 3,974 | |||
| Working capital | 753 | |||
| Total purchase price | $ | 26,359 |
Cash consideration | $ | 32,962 | ||
Fair value of FactSet stock issued | 2,991 | |||
Total purchase price | $ | 35,953 |
The purchase price is dependent on the final working capital adjustment to be finalized in the first quarter of fiscal 2013. The total purchase price was allocated to StreetAccount’sCode Red’s net tangible and intangible assets based upon their estimated fair value as of the date of acquisition.
| Tangible assets acquired | $ | 3,598 | ||
| Amortizable intangible assets: | ||||
| Client relationships | 2,822 | |||
| Software technology | 2,332 | |||
| Data content | 613 | |||
| Non-compete agreements | 404 | |||
| Trade name | 186 | |||
| Goodwill | 21,991 | |||
| Total assets acquired | 31,946 | |||
| Liabilities assumed | (5,587 | ) | ||
| Net assets acquired | $ | 26,359 |
Tangible assets acquired | $ | 3,090 | ||
Amortizable intangible assets | ||||
Software technology | 4,728 | |||
Client relationships | 3,089 | |||
Non-compete agreements | 277 | |||
Trade name | 127 | |||
Goodwill | 29,627 | |||
Total assets acquired | $ | 40,938 | ||
Liabilities assumed | (4,985 | ) | ||
Net assets acquired | $ | 35,953 |
Intangible assets of $6.4$8.2 million have been allocated to amortizable intangible assets consisting of software technology, amortized over six years using a straight-line amortization method; client relationships, amortized over seven years using an accelerated amortization method; software technology,non-compete agreements, amortized over fivefour years using a straight-line amortization method; data content,and trade name, amortized over three years using a straight-line amortization method; non-compete agreements, amortized over four years using an accelerated amortization method; and trade name, amortized over two years using a straight-line amortization method.
Goodwill totaling $22.0$29.6 million represents the excess of the purchase price over the fair value of the net tangible and intangible assets acquired. Goodwill will not be amortized, but tested for impairment at least annually. Goodwill generated from the StreetAcountCode Red acquisition is included in the U.S. segment and is not deductible for income tax purposes. The results of operations of Code Red have been included in the Company’s Consolidated Statements of Income since the completion of the acquisition on February 6, 2015 and the results did not have a material impact as of August 31, 2015. Pro forma information has not been presented because the effect of this acquisition was not material to the Company’s consolidated financial results.
Matrix Data Limited
During the second quarter of fiscal 2014, FactSet acquired Matrix Data Limited (“Matrix”) for a total purchase price of $31.8 million. Matrix’ primary line of business is providing intelligence to the UK financial services industry and covering market share of mutual fund distribution. Matrix has developed customer, channel and market benchmarking solutions that help clients optimize product distribution and improve marketing effectiveness to drive revenue growth. At the time of acquisition, Matrix had annual subscriptions of $7 million. The acquisition of Matrix allows FactSet to expand its current U.S. advisor-sold investments and insurance products to the UK, with the potential to ultimately expand this coverage throughout continental Europe. The opportunity for FactSet to develop an international presence and complement its existing U.S. product offerings contributed to a purchase price in excess of fair value of the Matrix net tangible and intangible assets, leading to the recognition of goodwill in connection with the acquisition.
The purchase price was allocated to Matrix’ net tangible and intangible assets based upon their estimated fair value as of the date of acquisition. Allocation of the purchase price to the assets acquired and liabilities assumed was finalized during the third quarter of fiscal 2014. There were no material adjustments between the preliminary and final allocation of purchase price.
The final Matrix purchase price of $31.8 million was allocated as follows (in thousands):
Tangible assets acquired | $ | 7,459 | ||
Amortizable intangible assets | ||||
Data content | 3,408 | |||
Client relationships | 2,816 | |||
Software technology | 1,708 | |||
Trade name | 670 | |||
Non-compete agreements | 147 | |||
Goodwill | 25,531 | |||
Total assets acquired | $ | 41,739 | ||
Liabilities assumed | (9,941 | ) | ||
Net assets acquired | $ | 31,798 |
Intangible assets of $8.7 million have been allocated to amortizable intangible assets consisting of data content, amortized over four years using a straight-line amortization method; client relationships, amortized over eight years using an accelerated amortization method; software technology, amortized over five years using a straight-line amortization method; non-compete agreements, amortized over three years using a straight-line amortization method; and trade name, amortized over four years using a straight-line amortization method.
Goodwill totaling $25.5 million represents the excess of the purchase price over the fair value of the net tangible and intangible assets acquired. Goodwill generated from the Matrix acquisition is included in the European segment and is deductible for income tax purposes. The results of the operations of StreetAccountMatrix have been included in the Company’s Consolidated Statement of Income since the completion of the acquisition on June 29, 2012 and did not have a material impact on the fourth quarterconsolidated fiscal 2012. Pro2014 financial results, and as such, pro forma information has not been presented becausepresented.
Revere Data
On September 1, 2013, FactSet paid $15.3 million in cash to acquire the effectassets of this acquisition was not material onRevere Data, LLC (“Revere”) to complement the Company’s fiscal 2012 consolidated financial results.
The total purchase price of the acquisition is as follows (in thousands):
| Cash consideration | $ | 57,100 | ||
| Working capital | 632 | |||
| Total purchase price | $ | 57,732 |
| Tangible assets acquired | $ | 4,587 | ||
| Amortizable intangible assets: | ||||
| Data content | 8,070 | |||
| Client relationships | 6,990 | |||
| Non-compete agreements | 1,750 | |||
| Trade name | 380 | |||
| Goodwill | 46,130 | |||
| Total assets acquired | 67,907 | |||
| Liabilities assumed | (10,175 | ) | ||
| Net assets acquired | $ | 57,732 |
Tangible assets acquired | $ | 544 | ||
Amortizable intangible assets | ||||
Data content | 2,799 | |||
Client relationships | 827 | |||
Non-compete agreements | 162 | |||
Trade name | 293 | |||
Goodwill | 11,612 | |||
Total assets acquired | $ | 16,237 | ||
Liabilities assumed | (949 | ) | ||
Net assets acquired | $ | 15,288 |
Intangible assets of $17.2$4.1 million washave been allocated to amortizable intangible assets consisting of data content, amortized over five years using a straight-line amortization method; client relationships, amortized over nineseven years using an accelerated amortization method; non-compete agreements, amortized over fivetwo years using a straight-line amortization method; and trade name, amortized over threefour years using a straight-line amortization method.
Goodwill totaling $46.1$11.6 million represents the excess of the purchase price over the fair value of the net tangible and intangible assets acquired. Goodwill will not be amortized and will be tested for impairment at least annually. Goodwill generated from the Market MetricsRevere acquisition is included in the U.S. segment and is deductible for income tax purposes. The results of the operations of Market MetricsRevere have been included in the Company’s Consolidated Statement of Income since the completion of the acquisition on JuneSeptember 1, 20102013 and did not have a material impact on the fiscal 2010 fourth quarter.2014 results. Pro forma information has not been presented because the effecteffects of this acquisition waswere not material onto the Company’s consolidated financial results.
9. GOODWILL
Changes in the carrying amount of goodwill by segment for fiscal years ended August 31, 20122015 and 20112014 are as follows (in thousands):
| U.S. | Europe | Asia Pacific | Total | |||||||||||||
| Balance at August 31, 2010 | $ | 145,826 | $ | 72,278 | $ | 3,887 | $ | 221,991 | ||||||||
| Goodwill acquired during the period | — | — | — | — | ||||||||||||
| Foreign currency translations | — | 5,894 | 380 | 6,274 | ||||||||||||
| Balance at August 31, 2011 | $ | 145,826 | $ | 78,172 | $ | 4,267 | $ | 228,265 | ||||||||
| Goodwill acquired during the period | 21,991 | — | — | 21,991 | ||||||||||||
| Foreign currency translations | — | (4,366 | ) | (99 | ) | (4,465 | ) | |||||||||
| Balance at August 31, 2012 | $ | 167,817 | $ | 73,806 | $ | 4,168 | $ | 245,791 | ||||||||
U.S. | Europe | Asia Pacific | Total | |||||||||||||
Balance at August 31, 2013 | $ | 167,822 | $ | 73,424 | $ | 3,327 | $ | 244,573 | ||||||||
Goodwill acquired during the period | 11,612 | 25,531 | — | 37,143 | ||||||||||||
Foreign currency translations | — | 4,077 | (185 | ) | 3,892 | |||||||||||
Balance at August 31, 2014 | $ | 179,434 | $ | 103,032 | $ | 3,142 | $ | 285,608 | ||||||||
Goodwill acquired during the period | 32,435 | — | — | 32,435 | ||||||||||||
Foreign currency translations | — | (9,307 | ) | (449 | ) | (9,756 | ) | |||||||||
Balance at August 31, 2015 | $ | 211,869 | $ | 93,725 | $ | 2,693 | $ | 308,287 | ||||||||
Goodwill is not amortized as it has an estimated infiniteindefinite life. On an ongoing basis,At least annually, the Company evaluatesis required to test goodwill at the reporting unit level for indications of potential impairment. Goodwill is tested for impairment based on the present value of discounted cash flows, and, if impaired, written down to fair value based on discounted cash flows. The Company has three reporting units, which are consistent with the operating segments reported becauseas there is no discrete financial information available for the subsidiaries within each operating segment. The Company’s reporting units evaluated for potential impairment were the U.S., Europe and Asia Pacific, which reflects the level of internal reporting the Company uses to manage its business and operations. The Company performed anits annual goodwill impairment test during the fourth quarter of fiscal 2015, consistent with the timing of previous years, 2012, 2011 and 2010,at which time it was determined that there were no reporting units that were deemed at risk. Theindications of impairment, with the fair value of each of the Company’s reporting units significantly exceededexceeding carrying value, thus there had been no impairment. The measurement period for purchase price allocations ends as soon as information on the facts and circumstances becomes available, but will not exceed 12 months.
10.INTANGIBLE ASSETS
FactSet’s identifiable intangible assets consist of acquired content databases, client relationships, software technology, non-compete agreements and trade names resulting from previous acquisitions, which have been fully integrated into the Company’s operations. The weighted average useful life of the Company’s acquired intangible assets at August 31, 20122015 was 11.611.1 years.
The gross carrying amounts and accumulated amortization totals related to the Company’s identifiable intangible assets are as follows (in thousands):
| At August 31, 2012 | Gross Carrying Amount | Accumulated Amortization | Net Carrying Amount | |||||||||
| Data content | $ | 49,120 | $ | 18,521 | $ | 30,599 | ||||||
| Client relationships | 22,841 | 14,089 | 8,752 | |||||||||
| Software technology | 20,892 | 18,482 | 2,410 | |||||||||
| Non-compete agreements | 2,154 | 810 | 1,344 | |||||||||
| Trade names | 758 | 492 | 266 | |||||||||
| Total | $ | 95,765 | $ | 52,394 | $ | 43,371 | ||||||
| At August 31, 2011 | Gross Carrying Amount | Accumulated Amortization | Net Carrying Amount | |||||||||
| Data content | $ | 52,438 | $ | 16,849 | $ | 35,589 | ||||||
| Client relationships | 21,088 | 12,782 | 8,306 | |||||||||
| Software technology | 19,093 | 18,222 | 871 | |||||||||
| Non-compete agreements | 1,750 | 437 | 1,313 | |||||||||
| Trade names | 572 | 341 | 231 | |||||||||
| Total | $ | 94,941 | $ | 48,631 | $ | 46,310 | ||||||
At August 31, 2015 | Gross Carrying Amount | Accumulated Amortization | Net Carrying Amount | |||||||||
Data content | $ | 39,911 | $ | 16,667 | $ | 23,244 | ||||||
Client relationships | 27,873 | 18,241 | 9,632 | |||||||||
Software technology | 21,203 | 15,042 | 6,161 | |||||||||
Non-compete agreements | 1,058 | 637 | 421 | |||||||||
Trade names | 1,614 | 1,020 | 594 | |||||||||
Total | $ | 91,659 | $ | 51,607 | $ | 40,052 | ||||||
At August 31, 2014 | Gross Carrying Amount | Accumulated Amortization | Net Carrying Amount | |||||||||
Data content | $ | 56,974 | $ | 27,644 | $ | 29,320 | ||||||
Client relationships | 25,821 | 17,443 | 8,378 | |||||||||
Software technology | 22,881 | 20,089 | 2,792 | |||||||||
Non-compete agreements | 2,465 | 1,881 | 584 | |||||||||
Trade names | 1,729 | 958 | 771 | |||||||||
Total | $ | 109,870 | $ | 68,015 | $ | 41,855 | ||||||
During fiscal 2012, $6.42015, $9.1 million of intangible assets were acquired with a weighted average useful life of 5.5 years as a result6.3 years.
The details of the acquisition of StreetAccount on June 29, 2012.
Weighted Average Amortization Period (years) | Acquisition Cost | ||||
| Client relationships | 7.0 | $ | 2,822 | ||
| Software Technology | 5.0 | 2,332 | |||
| Data content | 3.0 | 613 | |||
| Non-compete agreements | 4.0 | 404 | |||
| Trade name | 2.0 | 186 | |||
| Total | 5.5 | $ | 6,357 | ||
Code Red Preliminary Intangible Assets Allocation | Amortization Period (years) | Acquisition Cost | ||||||
Software technology | 6.0 | $ | 4,728 | |||||
Client relationships | 7.0 | 3,089 | ||||||
Non-compete agreements | 4.0 | 277 | ||||||
Trade name | 3.0 | 127 | ||||||
Total | 6.3 | $ | 8,221 | |||||
Amortization expense recorded for intangible assets during fiscal years 2012, 20112015, 2014 and 20102013 was $7.5$8.2 million, $8.4$8.5 million and $8.5$7.1 million, respectively. As of August 31, 2012,2015, estimated intangible asset amortization expense for each of the next five years and thereafter are as follows (in thousands):
Fiscal Year | Estimated Amortization Expense | ||||
| 2013 | $ | 7,078 | |||
| 2014 | 5,974 | ||||
| 2015 | 5,050 | ||||
| 2016 | 3,404 | ||||
| 2017 | 3,269 | ||||
| Thereafter | 18,596 | ||||
| Total | $ | 43,371 | |||
Fiscal Year | Estimated Amortization Expense | |||
2016 | $ | 7,031 | ||
2017 | 6,949 | |||
2018 | 5,816 | |||
2019 | 4,492 | |||
2020 | 3,461 | |||
Thereafter | 12,303 | |||
Total | $ | 40,052 | ||
11. PROPERTY, EQUIPMENT AND LEASEHOLD IMPROVEMENTS
Property, equipment and leasehold improvements consist of the following (in thousands):
| At August 31, | 2012 | 2011 | ||||
| Leasehold improvements | $ | 88,327 | $ | 83,478 | ||
| Computers and related equipment | 74,370 | 65,934 | ||||
| Furniture and fixtures | 26,849 | 24,578 | ||||
| Subtotal | $ | 189,546 | $ | 173,990 | ||
| Less accumulated depreciation and amortization | (113,016) | (92,370) | ||||
| Property, equipment and leasehold improvements, net | $ | 76,530 | $ | 81,620 | ||
At August 31, | 2015 | 2014 | ||||||
Leasehold improvements | $ | 92,427 | $ | 90,487 | ||||
Computers and related equipment | 87,732 | 81,853 | ||||||
Furniture and fixtures | 33,120 | 29,373 | ||||||
Subtotal | $ | 213,279 | $ | 201,713 | ||||
Less accumulated depreciation and amortization | (154,015 | ) | (144,072 | ) | ||||
Property, equipment and leasehold improvements, net | $ | 59,264 | $ | 57,641 | ||||
Depreciation expense was $26.1$23.1 million, $27.9$25.9 million and $28.8$28.4 million for fiscal years 2012, 20112015, 2014 and 2010,2013, respectively.
12. COMMON STOCK AND EARNINGS PER SHARE
On May 8, 2012,12, 2015, FactSet’s Board of Directors approved a 15%12.8% increase in the regular quarterly dividend beginning with the Company’s dividend payment in June 2012 of $0.31from $0.39 to $0.44 per share, or $1.24$1.76 per share per annum.
Shares of common stock outstanding were as follows (in thousands):
| Years Ended August 31, | 2012 | 2011 | 2010 | |||||||||
| Balance, beginning of year | 45,055 | 46,024 | 46,740 | |||||||||
| Common stock issued for employee stock plans | 825 | 1,283 | 2,068 | |||||||||
| Stock issued for acquisition of business | 43 | 0 | 0 | |||||||||
| Repurchase of common stock | (1,644 | ) | (2,252 | ) | (2,784 | ) | ||||||
| Balance, end of year | 44,279 | 45,055 | 46,024 | |||||||||
Years Ended August 31, | 2015 | 2014 | 2013 | |||||||||
Balance, beginning of year (September 1) | 41,793 | 43,324 | 44,279 | |||||||||
Common stock issued for employee stock plans | 1,213 | 959 | 2,459 | |||||||||
Repurchases of common stock | (1,689 | ) | (2,490 | ) | (3,414 | ) | ||||||
Balance, end of year (August 31) | 41,317 | 41,793 | 43,324 | |||||||||
A reconciliation of the weighted average shares outstanding used in the basic and diluted earnings per share computations is as follows (in thousands, except per share data):
| Net Income (Numerator) | Weighted Average Common Shares (Denominator) | Per Share Amount | ||||||||||||||||||||||||||||||||||
Years Ended August 31, | 2015 | 2014 | 2013 | 2015 | 2014 | 2013 | 2015 | 2014 | 2013 | |||||||||||||||||||||||||||
Basic EPS | ||||||||||||||||||||||||||||||||||||
Income available to common stockholders | $ | 241,051 | $ | 211,543 | $ | 198,637 | 41,572 | 42,436 | 43,890 | $ | 5.80 | $ | 4.98 | $ | 4.53 | |||||||||||||||||||||
Diluted EPS | ||||||||||||||||||||||||||||||||||||
Dilutive effect of stock options and restricted stock | 663 | 534 | 734 | |||||||||||||||||||||||||||||||||
Income available to common stockholders | $ | 241,051 | $ | 211,543 | $ | 198,637 | 42,235 | 42,970 | 44,624 | $ | 5.71 | $ | 4.92 | $ | 4.45 | |||||||||||||||||||||
Net Income (Numerator) | Weighted Average Common Shares (Denominator) | Per Share Amount | ||||||||||||||||||||||||||||||||||
| Years Ended August 31, | 2012 | 2011 | 2010 | 2012 | 2011 | 2010 | 2012 | 2011 | 2010 | |||||||||||||||||||||||||||
| Basic EPS | ||||||||||||||||||||||||||||||||||||
| Income available to common stockholders | $ | 188,809 | $ | 171,046 | $ | 150,211 | 44,784 | 45,953 | 46,698 | $ | 4.22 | $ | 3.72 | $ | 3.22 | |||||||||||||||||||||
| Diluted EPS | ||||||||||||||||||||||||||||||||||||
| Dilutive effect of stock options and restricted stock | 1,026 | 1,402 | 1,306 | |||||||||||||||||||||||||||||||||
| Income available to common stockholders plus assumed conversions | $ | 188,809 | $ | 171,046 | $ | 150,211 | 45,810 | 47,355 | 48,004 | $ | 4.12 | $ | 3.61 | $ | 3.13 | |||||||||||||||||||||
Dilutive potential common shares consist of stock options and unvested restricted stock. There were 383,05888,090 stock options excluded from the fiscal 20122015 calculation of diluted earnings per share compared to 2,670 stock options excluded from the fiscal 2011 calculation because their inclusion would have been anti-dilutive. NoThere were no stock options excluded from the fiscal 2014 calculation of diluted earnings per share while 6,408 stock options were excluded from the fiscal 2010 calculation of diluted earnings per share. There were 30,456 restricted stock awards excluded from the calculation of diluted earnings per share in fiscal 2012 as compared to 11,284 in fiscal 2011 and zero in fiscal 2010.
As of August 31, 2012, 20112015, 2014, 2013, 478,945, 380,653 and 2010, 1,710,017, 1,672,975 and 1,692,743,1,202,685, respectively, performance-based stock option grantsoptions were excluded from the calculation of diluted earnings per share.Performance-based stock options are omitted from the calculation of diluted earnings per share until the performance criteria have been met.
13.STOCKHOLDERS’ EQUITY
Preferred Stock
At August 31, 20122015 and 2011,2014, there were 10,000,000 shares of preferred stock ($.01 par value per share) authorized, of which no shares were issued and outstanding. FactSet’s Board of Directors may from time to time authorize the issuance of one or more series of preferred stock and, in connection with the creation of such series, determine the characteristics of each such series including, without limitation, the preference and relative, participating, optional or other special rights, and the qualifications, limitations or restrictions of the series.
Common Stock
At the fiscal 2011 Annual Meeting of Stockholders (the “Meeting”) of FactSet held on December 13, 2011, the stockholders of FactSet voted onAugust 31, 2015 and approved an amendment to the Company’s Restated Certificate of Incorporation to increase the number of authorized2014, there were 150,000,000 shares of common stock ($.01 par value $0.01,per share) authorized, of FactSet from 100,000,000 to 150,000,000 shares. Such amendment to FactSet’s Restated Certificate of Incorporation had previously been approved on October 24, 2011, by the Company’s Board of Directors. On December 16, 2011, a Certificate of Amendment was filed with the Secretary of State of Delaware to effect, as of such date, the foregoing amendment of the Company’s Restated Certificate of Incorporation.which 50,328,423 and 49,110,218 shares were issued, respectively. The newly authorized shares of common stock are issuable for any proper corporate purpose, including future stock splits, stock dividends, acquisitions, raising equity capital or to adopt additional employee benefit plans. These additional shares provide the Company the flexibility to issue shares for future corporate needs without potential expense or delay incident to obtaining stockholder approval for any particular issuance.
Treasury Stock
At August 31, 2011, FactSet retired 16,658,7412015 and 2014, there were 9,011,521 and 7,317,416 shares of treasury stock. These retiredstock (at cost) outstanding, respectively. As a result, 41,316,902 and 41,792,802 shares are now included in the Company’s pool of authorized but unissued shares. The retired treasury stock was initially recorded using the cost method and had a carrying value of $850.9 million at December 31, 2011. The Company’s accounting policy upon the formal retirement of treasury stock is to deduct its par value fromFactSet common stock ($0.2 million), reduce APIC by the amount recorded in APIC when the stock was originally issued ($361.4 million)were outstanding at August 31, 2015 and any remaining excess of cost as a deduction from retained earnings ($489.3 million).
Share Repurchase Program
On May 8, 2012,December 15, 2014, the Company’s Board of Directors approved a $200$300.0 million expansion toof the existing share repurchase program. During fiscal 2012,2015, the Company repurchased 1.6 million1,689,337 shares for $153$252.8 million under the existing share repurchase program leaving $190$134.2 million authorized for future share repurchases atas of August 31, 2012. 2015. During fiscal 2014, the Company repurchased 2,489,993 shares for $275.4 million. At August 31, 2014, $87.0 million remained authorized for future share repurchases.
Repurchases will be made from time to time in the open market and privately negotiated transactions, subject to market conditions. No minimum number of shares to be repurchased has been fixed. There is no timeframe to complete the share repurchase program and it is expected that share repurchases will be paid for using existing and future cash generated by operations.
Restricted Stock
Restricted stock awards entitle the holder to shares of common stock as the awards vest over time. During fiscal 2012, FactSet did not grant restricted stock awards as compared to 154,281 granted during fiscal 2011. Approximately 14,2582015, 94,870 of the previously granted restricted stock awards vested during fiscal 2012 and arewere included in the common stock outstanding as of August 31, 2012.
Dividends
The Company’s Board of Directors declared the following dividends during the periods presented:
Declaration Date | Dividends Per | Type | Record Date | Total $ Amount | Payment Date | ||||||
August 10, 2015 | $ | 0.44 | Regular (cash) | August 31, 2015 | $ | 18,179 | September 15, 2015 | ||||
May 12, 2015 | $ | 0.44 | Regular (cash) | May 29, 2015 | $ | 18,274 | June 16, 2015 | ||||
February 11, 2015 | $ | 0.39 | Regular (cash) | February 27, 2015 | $ | 16,236 | March 17, 2015 | ||||
November 12, 2014 | $ | 0.39 | Regular (cash) | November 28, 2014 | $ | 16,216 | December 16, 2014 | ||||
August 14, 2014 | $ | 0.39 | Regular (cash) | August 29, 2014 | $ | 16,299 | September 16, 2014 | ||||
May 5, 2014 | $ | 0.39 | Regular (cash) | May 30, 2014 | $ | 16,386 | June 17, 2014 | ||||
February 11, 2014 | $ | 0.35 | Regular (cash) | February 28, 2014 | $ | 14,827 | March 18, 2014 | ||||
November 14, 2013 | $ | 0.35 | Regular (cash) | November 29, 2013 | $ | 15,046 | December 17, 2013 | ||||
August 15, 2013 | $ | 0.35 | Regular (cash) | August 31, 2013 | $ | 15,164 | September 17, 2013 | ||||
May 14, 2013 | $ | 0.35 | Regular (cash) | May 31, 2013 | $ | 15,413 | June 18, 2013 | ||||
February 21, 2013 | $ | 0.31 | Regular (cash) | February 28, 2013 | $ | 13,510 | March 19, 2013 | ||||
November 15, 2012 | $ | 0.31 | Regular (cash) | November 30, 2012 | $ | 13,746 | December 18, 2012 | ||||
| Declaration Date | Dividends Per Share of Common Stock | Type | Record Date | Total $ Amount (in thousands) | Payment Date | ||||||
| August 8, 2012 | $ | 0.31 | Regular (cash) | August 31, 2012 | $ | 13,727 | September 18, 2012 | ||||
| May 8, 2012 | $ | 0.31 | Regular (cash) | May 31, 2012 | $ | 13,893 | June 19, 2012 | ||||
| February 14, 2012 | $ | 0.27 | Regular (cash) | February 29, 2012 | $ | 12,085 | March 20, 2012 | ||||
| November 10, 2011 | $ | 0.27 | Regular (cash) | November 30, 2011 | $ | 12,181 | December 20, 2011 | ||||
| August 11, 2011 | $ | 0.27 | Regular (cash) | August, 31 2011 | $ | 12,165 | September 20, 2011 | ||||
| May 9, 2011 | $ | 0.27 | Regular (cash) | May 31, 2011 | $ | 12,374 | June 21, 2011 | ||||
| February 9, 2011 | $ | 0.23 | Regular (cash) | February 28, 2011 | $ | 10,612 | March 15, 2011 | ||||
| November 10, 2010 | $ | 0.23 | Regular (cash) | November 30, 2010 | $ | 10,660 | December 21, 2010 | ||||
| August 10, 2010 | $ | 0.23 | Regular (cash) | August, 31 2010 | $ | 10,586 | September 21, 2010 | ||||
| May 14, 2010 | $ | 0.23 | Regular (cash) | May 28, 2010 | $ | 10,655 | June 15, 2010 | ||||
| February 9, 2010 | $ | 0.20 | Regular (cash) | February 26, 2010 | $ | 9,329 | March 16, 2010 | ||||
| November 10, 2009 | $ | 0.20 | Regular (cash) | November 30, 2009 | $ | 9,423 | December 15, 2009 | ||||
All of the above cash dividends were paid from existing cash resources. Future dividend payments will depend on the Company’s earnings, capital requirements, financial condition and other factors considered relevant by the Company and is subject to final determination by the Company’s Board of Directors.
| At August 31, | 2012 | 2011 | 2010 | |||||||||
| Net income | $ | 188,809 | $ | 171,046 | $ | 150,211 | ||||||
| Other comprehensive income, net of tax: | ||||||||||||
| Net unrealized (loss) gain on cash flow hedges | (2,141 | ) | 828 | (1,089 | ) | |||||||
| Foreign currency translation adjustments | (14,925 | ) | 14,897 | (10,073 | ) | |||||||
| Comprehensive income | $ | 171,743 | $ | 186,771 | $ | 139,049 | ||||||
| At August 31, | 2012 | 2011 | 2010 | |||||||||
| Accumulated unrealized (loss) gain on cash flow hedges, net of tax | $ | (1,551 | ) | $ | 590 | $ | (238 | ) | ||||
| Accumulated foreign currency translation adjustments | (21,175 | ) | (6,250 | ) | (21,147 | ) | ||||||
| Total accumulated other comprehensive loss | $ | (22,726 | ) | $ | (5,660 | ) | $ | (21,385 | ) | |||
14. STOCK OPTION AND RETIREMENT PLANS
Stock Options
The FactSet Research Systems Inc. 2004 Stock Option Plans
Stock Option Activity
In fiscal years 2012, 20112015, 2014 and 2010,2013, stock options to purchase 1,468,513; 998,038;828,652, 391,478 and 2,069,3361,674,966 shares of common stock, respectively, at prices which ranged from $63.09 to $103.30 were granted to existing employees and non-employee directors of the Company. These options have a weighted average grant date exercise price of $141.79, $106.73 and $92.21 for fiscal years 2015, 2014 and 2013, respectively.
A summary of stock option activity is as follows:
(in thousands, except per share data) | Number Outstanding | Weighted Average Exercise Price Per Share | ||||||
Balance at August 31, 2012 | 6,083 | $ | 64.76 | |||||
Granted – non performance-based | 645 | 92.22 | ||||||
Granted – performance-based | 1,011 | 92.22 | ||||||
Granted – non-employee Directors grant | 19 | 91.06 | ||||||
Exercised | (2,286 | ) | 52.25 | |||||
Forfeited(1) | (743 | ) | 93.84 | |||||
Balance at August 31, 2013 | 4,729 | $ | 75.95 | |||||
Granted – non performance-based | 174 | 103.36 | ||||||
Granted – performance-based | 203 | 109.56 | ||||||
Granted – non-employee Directors grant | 14 | 107.65 | ||||||
Exercised | (789 | ) | 57.56 | |||||
Forfeited(2) | (849 | ) | 91.98 | |||||
Balance at August 31, 2014 | 3,482 | $ | 79.67 | |||||
Granted – non performance-based | 677 | 140.49 | ||||||
Granted – performance-based | 138 | 148.52 | ||||||
Granted – non-employee Directors grant | 14 | 138.48 | ||||||
Exercised | (1,060 | ) | 63.03 | |||||
Forfeited | (134 | ) | 106.01 | |||||
Balance at August 31, 2015 | 3,117 | $ | 100.71 | |||||
(1) | In November 2011,FactSet granted 665,551 performance-based employee stock options. None of these performance-based stock options granted vested because FactSet did not achieve certain performance levels during the two fiscal years ended August 31, 2013. As such, these stock options were recorded as forfeitures in August 2013. |
(2) | In November 2012, FactSet granted 1,011,510 performance-based employee stock options. Based upon the actual growth in both organic ASV and diluted EPS during the two fiscal years ended August 31, 2014, 20% of the shares became eligible to vest on August 31, 2014 and the remainingwere recorded as forfeitures inAugust2014. |
Stock Options Outstanding and Exercisable
| 2012 | 2011 | 2010 | ||||||||||||
| At August 31, | Number of Shares | Weighted Average Exercise Price Per Share | Number of Shares | Weighted Average Exercise Price Per Share | Number of Shares | Weighted Average Exercise Price Per Share | ||||||||
| Outstanding at fiscal year end | 6,083 | $ | 64.76 | 6,132 | $ | 57.28 | 6,451 | $ 47.73 | ||||||
| Exercisable at fiscal year end | 2,858 | $ | 48.44 | 2,643 | $ | 38.99 | 3,331 | $ 34.49 | ||||||
The following table summarizes ranges of outstanding and exercisable options as of August 31, 20122015 (in thousands, except per share data):
| Outstanding | Exercisable | |||||||||||||||||||||||||||||||
| Range of Exercise Prices Per Share | Number Outstanding | Weighted Average Remaining Years of Contractual Life | Weighted Average Exercise Price Per Share | Aggregate Intrinsic Value | Number Exercisable | Weighted Average Exercise Price Per Share | Aggregate Intrinsic Value | |||||||||||||||||||||||||
| $ | 14.97 | – | $39.99 | 1,048 | 2.08 | $ | 28.47 | $ | 66,865 | 977 | $ | 27.94 | $ | 62,882 | ||||||||||||||||||
| $ | 40.00 | – | $59.99 | 936 | 1.52 | $ | 49.56 | $ | 39,985 | 910 | $ | 49.72 | $ | 38,719 | ||||||||||||||||||
| $ | 60.00 | – | $66.46 | 1,585 | 3.77 | $ | 65.55 | $ | 42,347 | 799 | $ | 66.03 | $ | 20,952 | ||||||||||||||||||
| $ | 66.47 | – | $89.99 | 994 | 4.81 | $ | 71.12 | $ | 21,033 | 157 | $ | 74.30 | $ | 2,816 | ||||||||||||||||||
| $ | 90.00 | – | $103.30 | 1,520 | 9.24 | $ | 94.17 | $ | (2,887 | ) | 15 | $ | 98.88 | $ | (102 | ) | ||||||||||||||||
| 6,083 | 4.67 | $ | 64.76 | $ | 167,343 | 2,858 | $ | 48.44 | $ | 125,267 | ||||||||||||||||||||||
Outstanding | Exercisable | |||||||||||||||||||||||||||
Range of Exercise Prices Per Share | Number Outstanding | Weighted Average | Weighted | Aggregate Intrinsic Value | Number Exercisable | Weighted Average Exercise Price Per Share | Aggregate | |||||||||||||||||||||
| $35.80 – $63.09 | 255 | 1.0 | $ | 54.62 | $ | 26,340 | 255 | $ | 54.62 | $ | 26,340 | |||||||||||||||||
$66.46 – $66.81 | 351 | 1.2 | $ | 66.47 | $ | 32,098 | 351 | $ | 66.47 | $ | 32,098 | |||||||||||||||||
$87.26 – $90.92 | 372 | 5.6 | $ | 90.14 | $ | 25,213 | 169 | $ | 89.44 | $ | 11,574 | |||||||||||||||||
$91.06 – $92.22 | 654 | 7.1 | $ | 92.19 | $ | 42,986 | 336 | $ | 92.20 | $ | 22,083 | |||||||||||||||||
$94.84 – $96.10 | 326 | 6.0 | $ | 94.88 | $ | 20,550 | 227 | $ | 94.85 | $ | 14,317 | |||||||||||||||||
$102.01 – $110.31 | 358 | 8.2 | $ | 106.88 | $ | 18,273 | 14 | $ | 107.64 | $ | 704 | |||||||||||||||||
$131.31 – $139.02 | 484 | 9.1 | $ | 131.91 | $ | 12,586 | — | $ | — | $ | — | |||||||||||||||||
$148.52 – $166.74 | 317 | 9.6 | $ | 157.21 | $ | 225 | — | $ | — | $ | — | |||||||||||||||||
Total Fiscal 2015 | 3,117 | 6.3 | $ | 100.71 | $ | 178,271 | 1,352 | $ | 78.70 | $ | 107,116 | |||||||||||||||||
Prior Year Amounts | August 31, 2014 | August 31, 2013 | ||||||||||||||
Number of Shares | Weighted Average Exercise Price Per Share | Number of Shares | Weighted Average Exercise Price Per Share | |||||||||||||
Outstanding at fiscal year end | 3,482 | $ | 79.67 | 4,729 | $ | 75.95 | ||||||||||
Exercisable at fiscal year end | 1,899 | $ | 68.78 | 1,925 | $ | 59.70 | ||||||||||
The aggregate intrinsic value of in-the-money stock options exercisable at August 31, 20122015 and 20112014 was $125.4$107.1 million and $129.3$111.3 million, respectively. Aggregate intrinsic value represents the difference between the Company’s closing stock price of $92.27$157.92 at August 31, 20122015 and the exercise price multiplied by the number of options exercisable as of that date. The weighted average remaining contractual life of stock options exercisable at August 31, 2015 and 2014 was 3.9 years and 3.4 years, respectively. The total pre-tax intrinsic value of stock options exercised during fiscal 2012, 20112015, 2014 and 20102013 was $43.0$92.7 million, $71.3$44.0 million, and $83.5$99.1 million, respectively.
Number Outstanding | Weighted Average Exercise Price Per Share | |||||||
| Balance at August 31, 2009 | 7,553 | $ | 39.51 | |||||
| Granted – non performance-based | 329 | 63.42 | ||||||
| Granted – performance-based | 1,721 | 66.91 | ||||||
| Granted – non-employee Directors grant | 19 | 66.81 | ||||||
| Exercised | (1,980 | ) | 25.77 | |||||
| Forfeited* | (1,191 | ) | 64.47 | |||||
| Balance at August 31, 2010 | 6,451 | $ | 47.73 | |||||
| Granted – non performance-based | 91 | 89.45 | ||||||
| Granted – performance-based | 892 | 89.39 | ||||||
| Granted – non-employee Directors grant | 15 | 95.05 | ||||||
| Exercised | (1,209 | ) | 32.08 | |||||
| Forfeited | (108 | ) | 66.55 | |||||
| Balance at August 31, 2011 | 6,132 | $ | 57.28 | |||||
| Granted – non performance-based | 540 | 93.96 | ||||||
| Granted – performance-based | 907 | 93.80 | ||||||
| Granted – non-employee Directors grant | 21 | 87.26 | ||||||
| Exercised | (731 | ) | 35.96 | |||||
| Forfeited** | (786 | ) | 87.37 | |||||
| Balance at August 31, 2012 | 6,083 | $ | 64.76 | |||||
Performance-based Stock Options
Performance-based stock options require management to make assumptions regarding the likelihood of achieving Company performance targets. The number of performance-based options that vest will be predicated on the Company achieving performance levels for both organic ASV and diluted earnings per share during the two fiscal yearsmeasurement period subsequent to the date of grant. Dependent on the financial performance levels attained by FactSet, during the two subsequent fiscal years, 0%, 20%, 60% or 100%a percentage of the performance-based stock options will vest to the grantees of those stock options. However, there is no current guarantee that such options will vest in whole or in part.
Vesting Percentage | Total Unamortized Stock-based Compensation Expense at August 31, 2012 | Cumulative Catch-up Adjustment* | Average Remaining Quarterly Expense to be Recognized | ||||||||||
| 0% | $ | 0 | $ | 0 | $ | 0 | |||||||
| 20% | $ | 2,726 | $ | 914 | $ | 164 | |||||||
| 60% | $ | 8,178 | $ | 2,742 | $ | 492 | |||||||
| 100% | $ | 13,630 | $ | 4,570 | $ | 820 | |||||||
July 2012 Performance-based Option Grant Review
In July 2012, FactSet granted 241,546 performance-based employee stock options. The number of performance-based options, thatwhich are eligible to vest is dependentin 20% tranches depending upon future StreetAccount user growth through August 31, 2017. The five year performance measurement period is basedDuring the fourth quarter of fiscal 2013, the first growth target as outlined within the terms of the grant was achieved, thus 20% or 48,314 options vested on growing usage of FactSet and StreetAccount. At August 31, 2012, FactSet estimated2013. The second 20% tranche vested on August 31, 2014 as a result of accelerated expansion of Street Account users during fiscal 2014. During the fourth quarter of fiscal 2015,the third growth target was achieved, thus the third 20% tranche vested on August 31, 2015. As of August 31, 2015, the Company estimates that the fourth 20% or 48,309 of the performance-based stock optionstranche will vest based on forecasted StreetAccount user growth, which resultsby August 31, 2017, resulting in unamortized stock-based compensation expense of $1.5$0.6 million to be recognized over the remaining vesting period of approximately 3.02.0 years. A change, up or down, in the actual financial performance levels achieved by the Company due to unforeseen significant StreetAccount growth in future fiscal years could result in the following changes to the current estimate of the vesting percentage and related expense (in thousands):
Vesting Percentage | Cumulative Catch-up Adjustment* | Remaining Expense to be Recognized | |||||||
| 0% | $ | (84 | ) | $ | 0 | ||||
| 20% | $ | 0 | $ | 1,516 | |||||
| 40% | $ | 136 | $ | 3,064 | |||||
| 60% | $ | 200 | $ | 4,600 | |||||
| 80% | $ | 257 | $ | 6,143 | |||||
| 100% | $ | 330 | $ | 7,670 | |||||
Vesting Percentage | Cumulative Catch-up Adjustment* | Remaining Expense to be Recognized | ||||||
Fourth 20% (current expectation) | $ | 0 | $ | 619 | ||||
Fifth 20% | $ | 1,216 | $ | 1,003 | ||||
* Amounts represent the cumulative catch-up adjustment to be recorded if there was a change in the vesting percentage as of August 31, 2012.2015.
November 2012 Annual Employee Performance-based Stock Options Granted
Vesting Percentage | Cumulative Catch-up Adjustment* | Remaining Expense to be Recognized | |||||||
| 0% | $ | 0 | $ | 0 | |||||
| 50% | $ | 3,380 | $ | 4,370 | |||||
| 100% | $ | 8,474 | $ | 7,026 | |||||
In November 2012, FactSet granted 1,011,510 performance-based employee stock options. The number of performance-based options that would become eligible to vest was based upon the Company achieving performance levels for both organic ASV and diluted earnings per share during the two fiscal years ended August 31, 2014. Based upon the actual growth in organic ASV and diluted EPS through August 31, 2014, 20%, or 185,014 (net of options forfeited through the end of fiscal 2014), of the previously granted shares became eligible to vest on August 31, 2014. The remaining 80% of the performance-based options previously granted were recorded as forfeitures in the fourth quarter of fiscal 2014. As of the end of fiscal 2015, total unamortized stock-based compensation expense of $0.9 million will be recognized over the remaining vesting period of 2.1 years in connection with this grant.
February 2015 Performance-based Option Grant Review
In connection with the acquisition of Code Red during the second quarter of fiscal 2015, FactSet granted 137,522 performance-based stock options. These performance-based options are eligible to vest four years from date of grant if certain Code Red ASV and operating margin targets are achieved over the measurement period. The option holders must also remain employed by FactSet to be eligible to vest. Of the total grant, 68,761 performance-based options are eligible for vesting based on achieving the growth targets over a four year measurement period ending February 28, 2019 and the remaining 68,761 options are eligible to cliff vest based on a two year measurement period ending February 28, 2017. As of August 31, 2015, total unamortized stock-based compensation of $2.1 million will be recognized as expense over the remaining vesting period of 3.4 years. A change, up or down, in the actual financial performance levels achieved by Code Red in future fiscal years could result in the following changes to the current estimate of the vesting percentage and related expense (in thousands):
Vesting Percentage | Cumulative Catch-up Adjustment* | Remaining Expense to be Recognized | ||||||
0% | $ | (338 | ) | $ | 0 | |||
10% | $ | (253 | ) | $ | 516 | |||
40% (current expectation) | $ | 0 | $ | 2,063 | ||||
70% | $ | 253 | $ | 3,609 | ||||
100% | $ | 506 | $ | 5,156 | ||||
* Amounts represent the cumulative catch-up adjustment to be recorded if there was a change in the vesting percentage as of August 31, 2012.
Other Performance-based Option Grants
In connection with the acquisitions of Matrix and Revere, FactSet granted 165,949 and 36,695 performance-based stock options, respectively, during fiscal 2014. The performance-based options granted in connection with the acquisition of Matrix will vest only if ASV and operating margin targets related to the Matrix business are met during a five year measurement period ending December 23, 2018, and the option holders remain employed by FactSet. As of August 31, 2015 FactSet does not believe these targets are probable of being achieved, and as such, no stock-based compensation expense is expected to be realized in connection with these options. Of the 36,695 performance-based stock options granted in connection with the Revere acquisition, 18,553 options became eligible to vest based upon the achievement of certain ASV and operating margins during the measurement period ending August 31, 2015. This results in unamortized stock-based compensation expense of $0.4 million to be recognized over the remaining vesting period of 3.0 years. Of the remaining 18,142 performance-based options previously granted, 6,184 were recorded as forfeitures in the fourth quarter of fiscal 2015 while the remaining 11,958 vest 80% after four years if the measurement criterion is achieved over the four year period ending August 31, 2017.
Restricted Stock and Stock Unit Awards
The Company’s optionOption Plan plans permit the issuance of restricted stock and restricted stock units. Restricted stock awards are subject to continued employment over a specified period. A summary of restricted stock award activity is as follows (in thousands, except per award data):
Number Outstanding | Weighted Average Grant Date Fair Value Per Award | |||||||
| Balance at August 31, 2010 | 261 | $ | 61.65 | |||||
| Granted (restricted stock and stock units) | 154 | $ | 87.55 | |||||
| Vested | - | $ | - | |||||
| Canceled/forfeited | (8 | ) | $ | 69.41 | ||||
| Balance at August 31, 2011 | 407 | $ | 71.31 | |||||
| Granted (restricted stock and stock units) | - | $ | - | |||||
| Vested* | (14 | ) | $ | 69.02 | ||||
| Canceled/forfeited | (10 | ) | $ | 77.13 | ||||
| Balance at August 31, 2012 | 383 | $ | 71.34 | |||||
* Between June 2010Restricted Stock and July 2011,Stock Unit Awards Activity
In fiscal years 2015, 2014 and 2013, FactSet granted 21,102 restricted stock units which entitled the holder to shares of common stock as the awards vest. A restricted stock unit is a promise to deliver shares to the employee at a future date if certain vesting conditions are met. These restricted stock units are performance-based54,862, 204,124 and cliff vest 25% when certain ASV targets are met. Of the total 21,102 units granted, 14,258 units vested during the fourth quarter of fiscal 2012 because FactSet achieved three of the four ASV growth targets. As of August 31, 2012, the Company estimated that the remaining 25% will vest based on forecasted ASV growth, resulting in unamortized stock-based compensation expense of $0.1 million.
As of August 31, 2012,2015, a total of 313,407 shares of restricted stock and restricted stock units were unvested and outstanding, which results in unamortized stock-based compensation expense of $5.2$20.5 million is to be amortized torecognized as stock-based compensation expense over the remaining vesting period of 3.2 years.
A summary of restricted stock awards with a fair value of $95.24, which entitle the holder to shares of common stockaward activity is as the awards vest over time. The Company’s restricted stock awards cliff vest 60% after three years and the remaining 40% after five years. Restricted stock grants are amortized to expense over the vesting period using the straight-line attribution method and are not entitled to dividends declared on the underlying shares while the restricted stock is unvested. As of August 31, 2012, unamortized stock-based compensation expense of less than $0.1 million is to be amortized ratably to compensation expense over the remaining vesting period of 3.4 years.
(in thousands, except per award data) | Number Outstanding | Weighted Average Grant Date Fair Value Per Award | ||||||
Balance at August 31, 2012 | 383 | $ | 71.34 | |||||
Granted (restricted stock and stock units) | 132 | 85.80 | ||||||
Vested(1) | (150 | ) | 62.34 | |||||
Canceled/forfeited | (7 | ) | 81.38 | |||||
Balance at August 31, 2013 | 358 | $ | 80.43 | |||||
Granted (restricted stock and stock units) | 204 | 101.95 | ||||||
Vested(2) | (135 | ) | 84.48 | |||||
Canceled/forfeited | (59 | ) | 86.39 | |||||
Balance at August 31, 2014 | 368 | $ | 89.77 | |||||
Granted (restricted stock and stock units) | 55 | 138.23 | ||||||
Vested(3) | (95 | ) | 70.94 | |||||
Canceled/forfeited | (15 | ) | 101.04 | |||||
Balance at August 31, 2015 | 313 | $ | 103.34 | |||||
(1) | Of the total 149,741 restricted stock awards that vested during fiscal 2013, 87,758 related to awards granted on October 23, 2009. These restricted stock awards cliff vested 60% after three years (on October 23, 2012) and 40% after five years (on October 23, 2014). An additional 55,572 awards that vested in fiscal 2013 related to awards granted on February 9, 2010 which cliff vested 100% after three years (on February 9, 2013). The remaining 6,411 restricted stock awards that vested were previously granted between June 2010 and July 2011 and vesting occurred when certain ASV targets were met in fiscal 2013. |
(2) | The 135,205 restricted stock awards that vested during fiscal 2014 were comprised of: 62,544 of awards granted on November 8, 2010, which cliff vested 60% after three years (on November 8, 2013) with the remaining 40% cliff vesting after five years (on November 8, 2015); 29,087 of awards granted on April 14, 2011, which vested 100% after three years on April 14, 2014; 26,344 restricted stock awards that were granted on April 8, 2013, which cliff vest 20% annually upon the anniversary date of the grant; and 17,230 awards relating to restricted stock granted on February 9, 2010 which cliff vested 50% after four years (on February 9, 2014). |
(3) | The94,870 restricted stock awards that vested during fiscal 2015 were comprised of:53,495 of awards granted onOctober 23, 2014,whichcliff vested 60% after three years (on October 23, 2012) and 40% after five years (on October 23, 2014);14,683 restricted stock awards that were granted on April 8, 2013, which cliff vest 20% annually upon the anniversary date of the grant;17,228 awards relating to restricted stock granted on February 9, 2010; and 9,464restricted stock awards that were previously granted betweenNovember 2013 and November 2014. |
Share-based Awards Available for Grant
A summary of share-based awards available for grant is as follows (in thousands):
Share-based Awards Available for Grant under the Employee Stock Option Plan | Share-based Awards Available for Grant under the Non-Employee Stock Option Plan | |||||||
Balance at August 31, 2012 | 4,340 | 126 | ||||||
Granted – non performance-based options | (645 | ) | — | |||||
Granted – performance-based options | (1,011 | ) | — | |||||
Granted – non-employee Directors grant | — | (19 | ) | |||||
Restricted stock awards granted(1) | (329 | ) | — | |||||
Share-based awards canceled/forfeited(2) | 761 | — | ||||||
Balance at August 31, 2013 | 3,116 | 107 | ||||||
Granted – non performance-based options | (174 | ) | — | |||||
Granted – performance-based options | (203 | ) | — | |||||
Granted – non-employee Directors grant | — | (14 | ) | |||||
Restricted stock awards granted(1) | (510 | ) | — | |||||
Share-based awards canceled/forfeited(2) | 993 | 9 | ||||||
Balance at August 31, 2014 | 3,222 | 102 | ||||||
Granted – non performance-based options | (677 | ) | — | |||||
Granted – performance-based options | (138 | ) | — | |||||
Granted – non-employee Directors grant | — | (14 | ) | |||||
Restricted stock awards granted(1) | (137 | ) | — | |||||
Share-based awards canceled/forfeited(2) | 171 | — | ||||||
Balance at August 31, 2015 | 2,441 | 88 | ||||||
(1) | Each restricted stock award granted is equivalent to 2.5 shares granted under the Company’sOption Plan. |
(2) | Under the Company’sOptionPlan, for each restricted stock award canceled/forfeited, an equivalent of 2.5 shares is added back to the available share-based awards balance. |
Share-based Awards Available for Grant under Employee Stock Option Plans | Share-based Awards Available for Grant under Non-Employee Stock Option Plans | |||||||
| Balance at August 31, 2009 | 4,124 | 181 | ||||||
| Granted – non performance-based options | (329 | ) | - | |||||
| Granted – performance-based options | (1,721 | ) | - | |||||
| Granted – non-employee Directors grant | - | (19 | ) | |||||
| Restricted stock awards granted* | (667 | ) | - | |||||
| Share-based awards canceled/forfeited | 1,204 | - | ||||||
| Share-based awards expired** | (395 | ) | - | |||||
| Balance at August 31, 2010 | 2,216 | 162 | ||||||
| Amendment to the 2004 Stock Option and Award Plan to increase the number of shares available for issuance*** | 4,000 | - | ||||||
| Granted – non performance-based options | (91 | ) | - | |||||
| Granted – performance-based options | (892 | ) | - | |||||
| Granted – non-employee Directors grant | - | (15 | ) | |||||
| Restricted stock awards granted* | (386 | ) | - | |||||
| Share-based awards canceled/forfeited | 130 | - | ||||||
| Balance at August 31, 2011 | 4,977 | 147 | ||||||
| Granted – non performance-based options | (540 | ) | - | |||||
| Granted – performance-based options | (907 | ) | - | |||||
| Granted – non-employee Directors grant | - | (21 | ) | |||||
| Restricted stock awards granted* | - | - | ||||||
| Share-based awards canceled/forfeited | 810 | - | ||||||
| Balance at August 31, 2012 | 4,340 | 126 | ||||||
Employee Stock Purchase Plan
At the Company’s Option Plans, an equivalent2014 Annual Meeting of 2.5 shares were deducted from the available share-based awards balance.
Shares of FactSet common stock may be purchased by eligible employees under the Purchase Plan in three-month intervals at a purchase price equal to at least 85% of the lesser of the fair market value of the Company’s common stock on either the first day or the last day of each three-month offering period. Employee purchases may not exceed 10% of their gross compensation during an offering period.
During fiscal 2012,2015, employees purchased 85,48763,265 shares at a weighted average price of $75.20 as compared to 75,71874,889 shares at a weighted average price of $75.36 in fiscal 20112014 and 91,42975,281 shares at a weighted average price of $53.84 in fiscal 2010.2013. At August 31, 2012, 195,0512015, 481,616 shares were reserved for future issuance under the Purchase Plan.
401(k) Plan
The Company established a 401(k) Plan (the “401(k) Plan”) in fiscal 1993. The 401(k) Plan is a defined contribution plan covering all full-time, U.S. employees of the Company and is subject to the provisions of the Employee Retirement Income Security Act of 1974 and the Internal Revenue Code of 1986. Each year, participants may contribute up to 60% of their eligible annual compensation, subject to annual limitations established by the Internal Revenue Code. The Company matches up to 4% of employees’ earnings, capped at the IRS annual maximum. Company matching contributions are subject to a five year graduated vesting schedule. All full-time, U.S. employees are eligible for the matching contribution by the Company. The Company contributed $6.7$8.6 million, $5.9$7.7 million, and $5.5$7.5 million in matching contributions to employee 401(k) accounts during fiscal 2012, 20112015, 2014 and 2010,2013, respectively.
15.STOCK-BASED COMPENSATION
The Company recognized total stock-based compensation expense of $22.0$26.4 million, $25.8$22.9 million and $14.1$40.0 million in fiscal 2012, 2011,2015, 2014, and 2010,2013, respectively. Included in fiscal 2011 was a pre-tax stock-based compensation charge of $7.9 million from an increase in the estimated number of performance-based options that will vest due to accelerating levels of ASV and diluted EPS than previously expected. The revised estimate reflects a higher performance level than previously estimated and accordingly, increased the number of performance-based options that will vest and be expensed.
Employee Stock Option Fair Value Determinations
The Company utilizes the lattice-binomial option-pricing model (“binomial model”) to estimate the fair value of new employee stock option grants. The Company’s determination of fair value of stock option awards on the date of grant using the binomial model is affected by the Company’s stock price as well as assumptions regarding a number of variables. These variables include, but are not limited to the Company’s expected stock price volatility over the term of the awards, interest rates, option forfeitures and employee stock option exercise behaviors.
Q1 2015 |
462,913 non performance-based employee stock options were granted at a weighted average exercise price of |
Q2 2015 | 25,075 non performance-based employee stock options and 137,522 performance-based employee stock options were granted at a weighted average exercise price of |
Q3 2015 |
61,210 non performance-based employee stock options were granted at a weighted average exercise price of |
Q4 2015 |
128,090 non performance-based employee stock options were granted at a weighted average exercise price of | ||
Q1 2014 | 35,508 non performance-based employee stock options and 36,695 performance-based employee stock options were granted at a weighted average exercise price of $109.49 and a weighted average estimated fair value of $31.78 per share. | |
Q2 2014 | 138,902 non performance-based employee stock options and 165,949 performance-based employee stock options were granted at a weighted average exercise price of $106.03 and a weighted average estimated fair value of $29.14 per share. | |
Q3 2014 | There were no employee stock options granted during the third quarter of fiscal 2014. | |
Q4 2014 | There were no employee stock options granted during the fourth quarter of fiscal 2014. | |
Q1 2013 | 635,308 non performance-based employee stock options and 1,011,510 performance-based employee stock options were granted at a weighted average exercise price of $92.22 and a weighted average estimated fair value of $26.87 per share. | |
Q2 2013 | 9,367 non performance-based employee stock options were granted at a weighted average exercise price of $92.55 and a weighted average estimated fair value of $26.69 per share. | |
Q3 2013 | There were no employee stock options granted during the third quarter of fiscal 2013. | |
Q4 2013 | There were no employee stock options granted during the fourth quarter of fiscal 2013. |
The weighted average estimated fair value of employee stock options granted during fiscal 2012, 20112015, 2014 and 20102013 was determined using the binomial model with the following weighted average assumptions:
| 2012 | 2011 | 2010 | ||||||||||||||||
| Term structure of risk-free interest rate | 0.13% | - | 2.41 % | 0.18% | - | 1.88 % | 0.15% | - | 3.30 % | |||||||||
| Expected life (years) | 7.6 | - | 9.1 | 4.0 | - | 6.5 | 4.0 | - | 6.7 | |||||||||
| Term structure of volatility | 29% | - | 36 % | 23% | - | 35 % | 27% | - | 36 % | |||||||||
| Dividend yield | 1.16% | 1.25% | 1.51% | |||||||||||||||
| Weighted average estimated fair value | $32.34 | $24.78 | $20.22 | |||||||||||||||
| Weighted average exercise price | $93.86 | $89.39 | $66.35 | |||||||||||||||
| Fair value as a percentage of exercise price | 34.5% | 27.7% | 30.5% | |||||||||||||||
| 2015 | 2014 | 2013 | |||||||||||||
Term structure of risk-free interest rate | 0.01% | - | 2.3% | 0.01% | - | 2.6% | 0.16% | - | 1.91% | ||||||
Expected life (years) | 5.8 | - | 9.4 | 7.6 | - | 7.8 | 7.6 | - | 7.8 | ||||||
Term structure of volatility | 20% | - | 31% | 23% | - | 33% | 24% | - | 33% | ||||||
Dividend yield | 1.32% | 1.35% | 1.30% | ||||||||||||
Weighted average estimated fair value | $41.87 | $29.64 | $26.87 | ||||||||||||
Weighted average exercise price | $141.84 | $106.69 | $92.22 | ||||||||||||
Fair value as a percentage of exercise price | 29.5% | 27.8% | 29.1% | ||||||||||||
The risk-free interest rate assumption for periods within the contractual life of the option is based on the U.S. Treasury yield curve in effect at the time of grant. Expected volatility is based on a combination of historical volatility of the Company’s stock and implied volatilities of publicly traded options to buy FactSet common stock with contractual terms closest to the expected life of options granted to employees. The approach to utilize a mix of historical and implied volatility was based upon the availability of actively traded options on the Company’s stock and the Company’s assessment that a combination of implied volatility and historical volatility is best representative of future stock price trends. The Company uses historical data to estimate option exercises and employee termination within the valuation model. The dividend yield assumption is based on the Company’s history and expectation of dividend payouts. The expected life of employee stock options represents the weighted average period the stock options are expected to remain outstanding and is a derived output of the binomial model. The binomial model estimates employees exercise behavior is based on the option’s remaining vested life and the extent to which the option is in-the-money. The binomial model estimates the probability of exercise as a function of these two variables based on the entire history of exercises and cancellations of all past option grants made by the Company.
Non-Employee Director Stock Option Grants
The 2008 Non-Employee Directors’ Stock Option Plan (the “Directors’ Plan”) was ratified by the Company’s stockholders on December 16, 2008 and provides for the grant of share-based awards, including stock options, to non-employee directors of FactSet. A total of 250,000 shares of FactSet common stock have been reserved for issuance under the Directors’ Plan. The expiration date of the Directors’ Plan is December 1, 2018. The shares of common stock to be issued may be either authorized and unissued shares or shares held by the Company in its treasury. The Directors’ Plan provides for annual equity grants for each non-employee director and allows the Company greater flexibility to change the vesting schedule per option grant, modify the number of options granted on an annual basis and adjust the term of the grants.
The Company utilizes the Black-Scholes model to estimate the fair value of new non-employee Director stock option grants. The Company’s determination of fair value of share-based payment awards on the date of grant is affected by the Company’s stock price as well as assumptions regarding a number of variables. These variables include, but are not limited to the Company’s expected stock price volatility over the term of the awards, interest rates, option forfeitures and employee stock option exercise behaviors.
Fiscal 2012
On January 13, 2012,15, 2015, FactSet granted 20,97613,842 stock options to the Company’s non-employee Directors including a one-time new Director grant of 5,244 stock options for Robin A. Abrams, who was elected to FactSet’s Board of Directors on December 13, 2011. All of the options granted on January 13, 2012 haveat a weighted average estimated fair value of $24.79$28.18 per share, using the Black-Scholes option-pricing model with the following weighted average assumptions:
Risk-free interest rate | % | |||
Expected life (years) | ||||
Expected volatility | % | |||
Dividend yield | % |
Fiscal 2011
On January 14, 2011, 14,51415, 2014, FactSet granted 14,424 stock options were granted to the Company’s non-employee Directors withat a weighted average estimated fair value of $26.87$27.04 per share, using the Black-Scholes option-pricing model with the following weighted average assumptions:
Risk-free interest rate | % | |||
Expected life (years) | ||||
Expected volatility | % | |||
Dividend yield | % |
Fiscal 2010
On January 15, 2010, 18,5102013, FactSet granted 18,781 stock options were granted to the Company’s non-employee Directors withat a weighted average estimated fair value of $21.06$24.23 per share, using the Black-Scholes option-pricing model with the following weighted average assumptions:
Risk-free interest rate | % | |||
Expected life (years) | ||||
Expected volatility | % | |||
Dividend yield | % |
The risk-free interest rate assumption for periods within the contractual life of the option is based on the U.S. Treasury yield curve in effect at the time of grant. Expected volatility is based on the historical volatility of the Company’s stock. The Company uses historical data to estimate option exercises and non-employee director terminations within the valuation model. The dividend yield assumption is based on the Company’s history and expectation of dividend payouts.
Restricted StockFair Value Determinations
Restricted stock granted to employees entitle the holder to shares of common stock as the award vests over time, but not to dividends declared on the underlying shares while the restricted stock is unvested. The grant date fair value of restricted stock awards are measured by reducing the grant date price of FactSet’s share by the present value of the dividends expected to be paid on the underlying stock during the requisite service period, discounted at the appropriate risk-free interest rate. Restricted stock awards are amortized to expense over the vesting period.
Fiscal 2015 |
– | 9,384 restricted stock units with a fair value of $127.88 were |
– | 841 shares of restricted stock with a fair value of |
– | 15,070 shares of restricted stock with a fair value of |
– | 1,724 restricted stock units with a fair value of |
– |
21,294 shares of restricted stock with a fair value of |
– |
397 shares of restricted stock with a fair value of |
– | 448 shares of restricted stock with a fair value of |
– | 5,704 shares of restricted stock |
Fiscal 2014 |
– | 7,744 restricted stock units with a fair value of |
– | 153,972 shares of restricted stock with a fair value of $102.22 were granted on November 1, |
– | 30,144 shares of restricted stock with a fair value of $102.84 were granted on December 23, 2013. |
– | 12,264 restricted stock units with a fair value of $95.45 were granted on February 3, 2014. |
Fiscal 2013 |
– | 131,702 restricted stock units granted on April 8, 2013 with a fair value of $85.80. |
Employee Stock Purchase Plan Fair Value Determinations
During fiscal 2012,2015, employees purchased 85,48763,265 shares at a weighted average price of $75.20 as$122.76 compared to 75,71874,889 shares at a weighted average price of $75.36$89.28 in fiscal 20112014 and 91,42975,281 shares at a weighted average price of $53.84$80.77 in fiscal 2010. At August 31, 2012, 195,051 shares were reserved for future issuance under the Purchase Plan.2013. Stock-based compensation expense recorded during fiscal 2012, 2011,2015, 2014, and 20102013 relating to the employee stock purchase plan was $1.5 million, $1.3 million $1.1and $1.2 million, and $1.0 million, respectively.
The Company uses the Black-Scholes model to calculate the estimated fair value for the employee stock purchase plan. The weighted average estimated fair value of employee stock purchase plan grants during fiscal years 2012, 20112015, 2014 and 20102013 were $16.09, $15.99,$24.05, $17.76 and $11.21$15.79 per share, respectively, with the following weighted average assumptions:
| 2012 | 2011 | 2010 | ||||||||||
| Risk-free interest rate | 0.06 | % | 0.10 | % | 0.12 | % | ||||||
| Expected life (months) | 3 | 3 | 3 | |||||||||
| Expected volatility | 14.8 | % | 11.9 | % | 13.8 | % | ||||||
| Dividend yield | 1.26 | % | 1.04 | % | 1.33 | % | ||||||
2015 | 2014 | 2013 | ||||||||||
Risk-free interest rate | 0.03 | % | 0.04 | % | 0.07 | % | ||||||
Expected life (months) | 3 | 3 | 3 | |||||||||
Expected volatility | 16.3 | % | 9.8 | % | 9.8 | % | ||||||
Dividend yield | 1.15 | % | 1.38 | % | 1.38 | % | ||||||
Accuracy of Fair Value Estimates
The Company is responsible for determining the assumptions used in estimating the fair value of its share-based payment awards. The Company’s determination of fair value of share-based payment awards on the date of grant using an option-pricing model is affected by the Company’s stock price as well as assumptions regarding a number of highly complex and subjective variables. These variables include, but are not limited to the Company’s expected stock price volatility over the term of the awards, interest rates, option forfeiture rates and actual and projected employee stock option exercise behaviors. Option-pricing models were developed for use in estimating the value of traded options that have no vesting or hedging restrictions and are fully transferable.
16. INCOME TAXES
Income tax expense is based on taxable income determined in accordance with current enacted laws and tax rates. Deferred income taxes are recorded for the temporary differences between the financial statement and tax bases of assets and liabilities using currently enacted tax rates.
Provision for Income Taxes
The provision for income taxes by geographic operations is as follows (in thousands):
| Years Ended August 31, | 2012 | 2011 | 2010 | |||||||||
| U.S. operations | $ | 229,772 | $ | 198,688 | $ | 182,038 | ||||||
| Non-U.S. operations | 44,933 | 40,270 | 40,143 | |||||||||
| Income before income taxes | $ | 274,705 | $ | 238,958 | $ | 222,181 | ||||||
| U.S. operations | $ | 76,020 | $ | 58,125 | $ | 62,554 | ||||||
| Non-U.S. operations | 9,876 | 9,787 | 9,416 | |||||||||
| Total provision for income taxes | $ | 85,896 | $ | 67,912 | * | $ | 71,970 | ** | ||||
| Effective tax rate | 31.3 | % | 28.4 | % * | 32.4 | % ** | ||||||
Years Ended August 31, | 2015 | 2014 | 2013 | |||||||||
U.S. operations | $ | 263,411 | $ | 242,839 | $ | 220,778 | ||||||
Non-U.S. operations | 70,343 | 60,625 | 50,132 | |||||||||
Income before income taxes | $ | 333,754 | $ | 303,464 | $ | 270,910 | ||||||
U.S. operations | $ | 88,147 | $ | 81,998 | $ | 61,328 | ||||||
Non-U.S. operations | 4,556 | 9,923 | 10,945 | |||||||||
Total provision for income taxes | $ | 92,703 | $ | 91,921 | $ | 72,273 | ||||||
Effective tax rate | 27.8 | % | 30.3 | % | 26.7 | % | ||||||
The components of the provision for income taxes consist of the following (in thousands):
Years Ended August 31, | 2015 | 2014 | 2013 | |||||||||
Current | ||||||||||||
U.S. federal | $ | 82,885 | $ | 77,368 | $ | 52,625 | ||||||
U.S. state and local | 4,419 | 3,972 | 3,309 | |||||||||
Non-U.S. | 6,368 | 10,350 | 11,188 | |||||||||
Total current taxes | $ | 93,672 | 91,690 | $ | 67,122 | |||||||
Deferred | ||||||||||||
U.S. federal | $ | 720 | $ | 547 | $ | 5,036 | ||||||
U.S. state and local | 123 | 111 | 358 | |||||||||
Non-U.S. | (1,812 | ) | (427 | ) | (243 | ) | ||||||
Total deferred taxes | $ | (969 | ) | $ | 231 | $ | 5,151 | |||||
Total provision for income taxes | $ | 92,703 | $ | 91,921 | $ | 72,273 | ||||||
| Years Ended August 31, | 2012 | 2011 | 2010 | |||||||||
| Current | ||||||||||||
| U.S. federal | $ | 73,272 | $ | 53,925 | $ | 63,712 | ||||||
| U.S. state and local | 4,305 | 4,833 | 4,839 | |||||||||
| Non-U.S. | 10,224 | 10,728 | 10,151 | |||||||||
| Total current taxes | $ | 87,801 | $ | 69,486 | $ | 78,702 | ||||||
| Deferred | ||||||||||||
| U.S. federal | $ | 1,405 | $ | 606 | $ | 5,718 | ||||||
| U.S. state and local | 152 | 27 | 279 | |||||||||
| Non-U.S. | 348 | 941 | 735 | |||||||||
| Total deferred taxes | $ | 1,905 | $ | 1,574 | $ | 6,732 | ||||||
| Total provision for income taxes | $ | 85,896 | $ | 67,912 | $ | 71,970 | ||||||
The provision for income taxes differs from the amount of income tax determined by applying the U.S. statutory federal income tax rate to income before income taxes as a result of the following factors (expressed as a percentage of income before income taxes):
| Years Ended August 31, | 2012 | 2011 | 2010 | |||||||||
| Tax at federal U.S. statutory tax rate | 35.0 | % | 35.0 | % | 35.0 | % | ||||||
| Increase (decrease) in taxes resulting from: | ||||||||||||
| State and local taxes, net of U.S. federal income tax benefit | 2.1 | 2.2 | 2.1 | |||||||||
| Foreign income at other than U.S. rates | (1.9 | ) | (1.7 | ) | (1.8 | ) | ||||||
| Domestic production activities (Section 199) deduction | (2.6 | ) | (2.1 | ) | (1.9 | ) | ||||||
| Income tax benefit from R&D tax credits | (0.8 | ) | (4.9 | ) | (0.6 | ) | ||||||
| Income tax benefits from foreign tax credits | (0.5 | ) | (0.7 | ) | (0.5 | ) | ||||||
| Other, net | 0.0 | 0.6 | 0.1 | |||||||||
| Effective tax rate | 31.3 | % | 28.4 | % | 32.4 | % | ||||||
Years Ended August 31, | 2015 | 2014 | 2013 | |||||||||
Tax at U.S. Federal statutory tax rate | 35.0 | % | 35.0 | % | 35.0 | % | ||||||
Increase (decrease) in taxes resulting from: | ||||||||||||
State and local taxes, net of U.S. federal income tax benefit | 1.6 | 1.8 | 2.0 | |||||||||
Foreign income at other than U.S. rates | (3.0 | ) | (2.9 | ) | (2.5 | ) | ||||||
Domestic production activities deduction | (2.2 | ) | (2.1 | ) | (2.6 | ) | ||||||
Income tax benefits from R&D tax credits | (2.7 | ) | (1.1 | ) | (4.1 | ) | ||||||
Income tax benefits from foreign tax credits | (0.3 | ) | (0.4 | ) | (1.2 | ) | ||||||
Other, net | (0.6 | ) | 0.0 | 0.1 | ||||||||
Effective tax rate | 27.8 | % | (1) | 30.3 | % | 26.7 | %(2) | |||||
(1) | The fiscal 2015 effective tax rate of 27.8% includesincome tax benefits of $8.8 million primarily from the reenactment of the U.S. FederalR&D Tax Credit (the “U.S. Federal R&D tax credit”) in December 2014,finalizing prior year tax returns and other discrete items. |
(2) | The fiscal 2013 effective tax rate of 26.7% includes income tax benefits of $7.2 millionprimarily fromthe reenactment of the U.S. Federal R&D tax credit in January 2013 andfinalizing prior year tax returns. |
Deferred Tax Assets and Liabilities
The significant components of deferred tax assets that are recorded in the Consolidated Balance Sheets were as follows (in thousands):
| At August 31, | 2012 | 2011 | ||||||
| Deferred tax assets | ||||||||
| Current | ||||||||
| Receivable reserve | $ | 687 | $ | 736 | ||||
| Deferred rent | 3,175 | 3,272 | ||||||
| Deferred fees | 1,223 | - | ||||||
| Net current deferred taxes | $ | 5,085 | $ | 4,008 | ||||
| Non-current | ||||||||
| Depreciation on property, equipment and leasehold improvements | $ | 2,498 | $ | 2,427 | ||||
| Deferred rent | 2,782 | 2,793 | ||||||
| Stock-based compensation | 23,395 | 18,096 | ||||||
| Purchased intangible assets, including acquired technology | (6,801 | ) | (5,295 | ) | ||||
| Other | 1,239 | 2,145 | ||||||
| Net non-current deferred taxes | $ | 23,113 | $ | 20,166 | ||||
| Total deferred tax assets | $ | 28,198 | $ | 24,174 | ||||
At August 31, | 2015 | 2014 | ||||||
Current | ||||||||
Receivable reserve | $ | 541 | $ | 597 | ||||
Deferred rent | 794 | 1,067 | ||||||
Other | 770 | 177 | ||||||
Net current deferred tax assets | $ | 2,105 | $ | 1,841 | ||||
Non-current | ||||||||
Depreciation on property, equipment and leasehold improvements | $ | 10,880 | $ | 9,831 | ||||
Deferred rent | 5,108 | 3,572 | ||||||
Stock-based compensation | 17,562 | 18,160 | ||||||
Purchased intangible assets, including acquired technology | (17,533 | ) | (10,750 | ) | ||||
Other | 4,582 | 1,564 | ||||||
Net non-current deferred tax assets | $ | 20,599 | $ | 22,377 | ||||
Total deferred tax assets | $ | 22,704 | $ | 24,218 | ||||
The significant components of deferred tax liabilities that are recorded in the Consolidated Balance Sheets were as follows (in thousands):
| At August 31, | 2012 | 2011 | ||||||
| Deferred tax liabilities (non-current) | ||||||||
| Purchased intangible assets, including acquired technology | $ | 2,936 | $ | 3,712 | ||||
| Stock-based compensation | (343 | ) | - | |||||
| Total deferred tax liabilities (non-current) | $ | 2,593 | $ | 3,712 | ||||
At August 31, | 2015 | 2014 | ||||||
Current | ||||||||
Other | $ | 562 | $ | — | ||||
Net current deferred tax liabilities | $ | 562 | $ | — | ||||
Non-current | ||||||||
Purchased intangible assets, including acquired technology | $ | 1,886 | $ | 3,478 | ||||
Stock-based compensation | — | (860 | ) | |||||
Other | (189 | ) | 303 | |||||
Net non-current deferred tax liabilities | $ | 1,697 | $ | 2,921 | ||||
Total deferred taxliabilities | $ | 2,259 | $ | 2,921 | ||||
A provision has not been made for additional U.S. Federal taxes as of August 31, 2012 onall undistributed earnings of foreign subsidiaries except for France, because the Company intendsare considered to reinvest these fundsbe invested indefinitely to support foreign growth opportunities.or will be repatriated free of additional tax. The amount of such undistributed earnings of these foreign subsidiaries included in consolidated retained earnings was immaterial at August 31, 20122015 and 2011. It is not practicable to estimate2014. As such, the unrecognized deferred tax liability on thesethose undistributed earnings.earnings was immaterial. These earnings could become subject to additional tax if they are remitted as dividends, loaned to FactSet, or upon sale of the subsidiary’s stock.
Unrecognized Tax Positions
Applicable accounting guidance prescribes a comprehensive model for the financial statement recognition, measurement, classification and disclosure of uncertain tax positions that a company has taken or expects to take on a tax return. A company can recognize the financial effect of an income tax position only if it is more likely than not (greater than 50%) that the tax position will prevail upon tax examination, based solely on the technical merits of the tax position. Otherwise, no benefit or expense can be recognized in the consolidated financial statements. The tax benefits recognized are measured based on the largest benefit that has a greater than fifty percent likelihood of being realized upon ultimate settlement. Additionally, companies are required to accrue interest and related penalties, if applicable, on all tax exposures for which reserves have been established consistent with jurisdictional tax laws.
As of August 31, 2012,2015, the Company had gross unrecognized tax benefits totaling $5.5$6.8 million, including $1.0$1.3 million of accrued interest, recorded as non-current taxes payable in the consolidated balance sheet. Approximately $1.0 million of these unrecognized tax benefits would have affected the current year effective tax rate if realized as of August 31, 2015. As of August 31, 2014, the Company had gross unrecognized tax benefits totaling $5.5 million, including $1.1 million of accrued interest, recorded as non-current taxes payable in the consolidated balance sheet. The Company recognizes interest and penalty charges related to unrecognized tax benefits as income tax expense, which is consistent with the recognition in prior reporting periods. The Company recognized interest charges of $0.2 million, $0.1 million and less than $0.1 million during the fiscal years ended August 31, 2015, 2014 and 2013, respectively.
Unrecognized tax benefits represent tax positions taken on tax returns but not yet recognized in the consolidated financial statements. When applicable, the Company adjusts the previously recorded tax expense to reflect examination results when the position is effectivelyultimately settled. The Company regularly engages in discussions and negotiations with tax authorities regarding tax matters in various jurisdictions. It is reasonably possible that certain federal, foreign, and state tax matters may be concluded in the next 12 months. However, FactSet has no reason to believe that such audits will result in the payment of additional taxes and/or penalties that would have a material adverse effect on the Company’s results of operations or financial position, beyond current estimates. Any changes in accounting estimates resulting from new developments with respect to uncertain tax positions will be recorded as appropriate. The Company does not currently anticipate that the total amounts of unrecognized tax benefits will significantly change within the next 12 months.
The following table summarizes the changes in the balance of gross unrecognized tax benefits from August 31, 2009 to August 31, 2012 (in thousands):
| Unrecognized income tax benefits at August 31, 2009 | $ | 6,437 | ||
| Additions based on tax positions related to the current year | 1,301 | |||
| Additions for tax positions of prior years | 469 | |||
| Statute of limitations lapse | (861 | ) | ||
| Unrecognized income tax benefits at August 31, 2010 | $ | 7,346 | ||
| Additions based on tax positions related to the current year | 1,258 | |||
| Additions for tax positions of prior years | 1,493 | |||
| Statute of limitations lapse | (964 | ) | ||
| Reductions from settlements with taxing authorities | (1,929 | ) | ||
| $ | 7,204 | |||
| Additions based on tax positions related to the current year | 691 | |||
| Additions for tax positions of prior years | 470 | |||
| Statute of limitations lapse | (613 | ) | ||
| Reductions from settlements with taxing authorities | (2,288 | ) | ||
| Unrecognized income tax benefits at August 31, 2012 | $ | 5,464 |
Unrecognized income tax benefits at August 31, 2012 | $ | 5,464 | ||
Additions based on tax positions related to the current year | 1,372 | |||
Additions for tax positions of prior years | 986 | |||
Statute of limitations lapse | (1,103 | ) | ||
Reductions from settlements with taxing authorities | (1,284 | ) | ||
Unrecognized income tax benefits at August 31, 2013 | $ | 5,435 | ||
Additions based on tax positions related to the current year | 921 | |||
Additions for tax positions of prior years | 628 | |||
Statute of limitations lapse | (717 | ) | ||
Reductions from settlements with taxing authorities | (766 | ) | ||
Unrecognized income tax benefits at August 31, 2014 | $ | 5,501 | ||
Additions based on tax positions related to the current year | 962 | |||
Additions for tax positions of prior years | 1,122 | |||
Statute of limitations lapse | (809 | ) | ||
Unrecognized income tax benefits at August 31, 2015 | $ | 6,776 |
In the normal course of business, the Company’s tax filings are subject to audit by federal, state and foreign tax authorities. At August 31, 2012,2015, the Company remained subject to examination in the following major tax jurisdictions for the tax years as indicated below:
Major Tax Jurisdictions | Open Tax Years | |
U.S. | ||
Federal | 2013 through | |
State (various) | 2010 through | |
Europe | ||
United Kingdom | 2013 through | |
France | 2012 through |
17. DEBT
FactSet’s debt obligations consisted of the following (in thousands):
At August 31, | 2015 | 2014 | ||||||
2015 Revolving Credit Facility(maturity date of September 21, 2018) | $ | 35,000 | $ | — | ||||
Total Outstanding Debt at fiscal year-end | $ | 35,000 | $ | — | ||||
On February 6, 2015, the Company entered into a Credit Agreement (the “Credit Agreement”) between FactSet, as the borrower, and Bank of America, N.A., as the lender (the “Lender”). At that date, the Credit Agreement provided for a $35.0 million revolving credit facility (the “Revolving Credit Facility”), under which the Company could request borrowings. The Credit Agreement also allowed FactSet to arrange for additional borrowings for an aggregate amount of up to $265.0 million provided that any such request for additional borrowings was in a minimum amount of $25.0 million.
For purposes of funding its acquisition of Code Red on February 6, 2015, FactSet borrowed $35.0 million in the form of a Eurodollar rate loan (the “Loan”) under the Revolving Credit Facility. The proceeds of the Loan made under the Credit Agreement could be used for permitted acquisitions and general corporate purposes. There are no prepayment penalties if the Company elects to prepay the Loan prior to its scheduled maturity date. The principal balance is payable in full on the maturity date. The $35.0 million borrowed under the Loan bears interest on the outstanding principal amount at a rate equal to the Eurodollar rate plus 0.50% and is reported as long-term debt within the Consolidated Balance Sheet at August 31, 2015. The Eurodollar rate is defined in the Credit Agreement as the rate per annum equal to one-month LIBOR. Interest on the Loan is payable quarterly in arrears and on the maturity date. During fiscal 2015 the Company paid approximately $0.1 million in interest on its outstanding Loan amount.
On September 21, 2015, the Company amended the Credit Agreement to borrow an additional $265.0 million (the “Second Amendment) in order to fund FactSet’s acquisition of Portware, LLC (“Portware”) which was announced on September 22, 2015, and closed on October 16, 2015. The maturity date on all outstanding loan amounts (which total $300.0 million as of October 30, 2015) is September 21, 2018. The Second Amendment also allows FactSet, subject to certain requirements, to arrange for additional borrowings with the Lender for an aggregate amount of up to $400.0 million, provided that any such request for additional borrowings must be in a minimum amount of $25.0 million. For more information on the Portware acquisition, seeNote 21,Subsequent Events.
As of August 31, 2015, no commitment fee was owed by FactSet since it borrowed the then-full amount of the Revolving Credit Facility on February 6, 2015. Other fees incurred by the Company, such as legal costs to draft and review the Credit Agreement, totaled less than $0.1 million and were capitalized as loan origination fees. These loan origination fees are being amortized into interest expense over the term of the Loan (three years) using the effective interest method and totaled less than $0.1 million in fiscal 2015.
The Credit Agreement contains covenants restricting certain FactSet activities, which are usual and customary for this type of loan.In addition, the Credit Agreement requires that FactSet must maintain a consolidated leverage ratio, as measured by total funded debt/EBITDA below a specified level as of the end of each fiscal quarter. The Company was in compliance with all of the covenants of the Credit Agreement as of August 31, 2015.
18.COMMITMENTS AND CONTINGENCIES
Commitments represent obligations, such as those for future purchases of goods or services that are not yet recorded on the balance sheet as liabilities. FactSet records liabilities for commitments when incurred (i.e., when the goods or services are received).
Lease Commitments
At August 31, 2012,2015, the Company leases approximately 193,000202,000 square feet of office space at its headquarters in Norwalk, Connecticut. In addition, FactSet leases office space for its U.S. reportable segment in New York, New York; Boston, Massachusetts; Chicago, Illinois; San Mateo,Francisco, California; Austin, Texas; Jackson, Wyoming; Atlanta, Georgia; Tuscaloosa, Alabama; Newark, Ridgewood and Piscataway, New Jersey; Manchester, New Hampshire; Reston, Virginia, Youngstown, Ohio, and Reston, Virginia.Toronto, Canada. The Company’s European segment operates in leased office space in London, England; Paris and Avon, France; Amsterdam, the Netherlands; Frankfurt, Germany; Dubai, United Arab Emirates; Milan, Italy; and Milan, Italy.Riga, Latvia. Office space in Tokyo, Japan; Hong Kong; Singapore; Mumbai, India; and Sydney, Australia are leased by FactSet for its Asia Pacific operating segment. The data content collection centers located in Hyderabad, India and Manila, the Philippines benefit all of the Companies operating segments. The leases expire on various dates through March 2021.2031. Total minimum rental payments associated with the leases are recorded as rent expense (a component of selling, general and administrative expenses) on a straight-line basis over the periods of the respective non-cancelable lease terms. The Company believes that its leased office space is adequate for its current needs and that additional space is available for lease to meet any future needs.
|
Approximately $4.3$1.0 million of standby letters of credit have been issued during the ordinary course of business in connection with the Company’s current leased office space as of August 31, 2012.2015. These standby letters of credit contain covenants that, among other things, require FactSet to maintain minimum levels of consolidated net worth and certain leverage and fixed charge ratios. As of August 31, 20122015 and 2011,2014, FactSet was in compliance with all covenants contained in the standby letters of credit.
In fiscal 2015, FactSet entered into the following new lease agreements:
● | Boston, Massachusetts:A new lease amendment was signed to extend and expand the Company’s existing office space in Boston by 4,809 rentable square feet. At the time of signing, the renewal resulted in incremental future minimum rental payments of $6.6 million through June 2022. | |
● | Hyderabad, India: -A new lease amendment was entered into during November 2014 to renew the Company’s existing office space in Hyderabad. At the time of signing, the renewal resulted in incremental future minimum rental payments of $2.2 million over the non-cancelable lease term through November 2019. -A new lease agreement was entered into during April 2015 for 43,830 square feet of new office space in Hyderabad. At the time of signing, the new lease agreement resulted in incremental future minimum rental payments of $1.8 million over the lease term through September 2020. | |
● | Manila, Philippines:A new lease agreement was entered into during April 2015 for 13,043 square feet of new office space in Manila. At the time of signing, the new lease agreement resulted in incremental future minimum rental payments of $1.5 million over the non-cancelable lease term through June 2020. | |
● | New York, New York:A new lease amendment was signed to extend and expand the Company’s existing office space in New York by 19,979 rentable square feet. At the time of signing, the renewal resulted in incremental future minimum rental payments of $21.2 million through August 2031. The amendment included approximately $1.9 million in tenant allowances. | |
● | Norwalk, Connecticut:A new lease amendment was signed to extend and expand the Company’s existing office space in Norwalk by 9,587 rentable square feet. At the time of signing, the renewal resulted in incremental future minimum rental payments of $0.9 million through December 2019. | |
● | London, England:A new lease agreement was entered into in July 2015 for 15,051 square feet of new office space in London. At the time of signing, the new lease agreement resulted in incremental future minimum rental payments of $21.1 million over the non-cancelable lease term through March 2031. |
At August 31, 2012,2015, the Company’s lease commitments for office space provide for the following future minimum rental payments under non-cancelable operating leases with remaining terms in excess of one year (in thousands):
| Years Ended August 31, | Minimum Lease Payments | |||
| 2013 | $ | 27,592 | ||
| 2014 | 26,122 | |||
| 2015 | 21,771 | |||
| 2016 | 15,705 | |||
| 2017 | 14,441 | |||
| Thereafter | 35,540 | |||
| Total | $ | 141,171 | ||
Years Ended August 31, | Minimum Lease Payments | |||
2016 | $ | 22,695 | ||
2017 | 28,002 | |||
2018 | 27,373 | |||
2019 | 25,974 | |||
2020 | 20,129 | |||
Thereafter | 145,929 | |||
Total | $ | 270,102 | ||
Purchase Commitments with Suppliers
Purchase obligations represent paymentpayments due in future periods in respect of commitments to the Company’s various data vendors as well as commitments to purchase goods and services such as telecommunication and computer maintenance services. These purchase commitments are agreements that are enforceable and legally binding on FactSet and that specify all significant terms, including: fixed or minimum quantities to be purchased; fixed, minimum or variable price provisions; and the approximate timing of the transaction. As of August 31, 20122015 and 2011,2014, the Company had total purchase commitments with suppliers of $52.2$65.2 million and $47.8$53.3 million, respectively.
Contingencies
Legal Matters
FactSet accrues non income-tax liabilities for contingencies when management believes that a loss is probable and the amounts can be reasonably estimated, while contingent gains are recognized only when realized. The Company is subjectissubject to legal proceedings, claims, and litigation arising in the ordinary course of business, including intellectual property litigation. These matters are subject to inherent uncertainties and management’s view of these matters may change in the future. Basedlitigation.Based on currentlyinformation available, information as of August 31, 2012, FactSet’s management does not believe that the ultimate outcome of these unresolved matters against the Company,, individually or in the aggregate, is likely to have a material adverse effect on the Company's consolidatedCompany'sconsolidated financial position, its results of operations or its cash flowsflows.
.
Uncertain income tax positions are accounted for in accordance with applicable accounting guidance (see Note 16). FactSet is currently under audit by multiple tax authorities. The Company has reserved for potential adjustments to its provision for income taxes that may result from examinations by, or any negotiated agreements with, these tax authorities, and the Company believes that the final outcome of these examinations or agreements will not have a material effect on its results of operations. If events occur which indicate payment of these amounts is unnecessary, the reversal of the liabilities would result in the recognition of tax benefits in the period FactSet determines the liabilities are no longer necessary. If the Company’s estimates of the federal, state, and foreign income tax liabilities are less than the ultimate assessment, a further charge to expense would result.
Indemnifications
As permitted or required under Delaware law and to the maximum extent allowable under that law, FactSet has certain obligations to indemnify its current and former officers and directors for certain events or occurrences while the officer or director is, or was serving, at FactSet’s request in such capacity. These indemnification obligations are valid as long as the director or officer acted in good faith and in a manner the person reasonably believed to be in or not opposed to the best interests of the Company, and with respect to any criminal action or proceeding, had no reasonable cause to believe his or her conduct was unlawful. The maximum potential amount of future payments FactSet could be required to make under these indemnification obligations is unlimited; however, FactSet has a director and officer insurance policy that it believes mitigates FactSet's exposure and enablesmay enable FactSet to recover a portion of any future amounts paid. The Company believes the estimated fair value of these indemnification obligations is minimal.
19.RISKS AND CONCENTRATIONS OF CREDIT RISK
Financial Risk Management
Foreign Currency Exchange Risk
The Company is exposed to changes in foreign currency exchange rates, which could affect its operating results, financial position and cash flows. The Company’s primary foreign currency market exposures include the Euro, British Pound Sterling, Euro, Japanese Yen, Indian Rupee and PhilippinesPhilippine Peso. The Company’s non-U.S. dollar denominated revenues expected to be recognized over the next twelve months are estimated to be $17 million while its non-U.S. dollar denominated expenses are $163 million, which translates into a net foreign currency exposure of $146 million per year. To the extent that FactSet’s international activities recorded in local currencies increase in the future, its exposure to fluctuations in currency exchange rates will correspondingly increase. FactSet manages its exposure to foreign currency exchange risk through its regular operating and financing activities and, when appropriate, through the use of derivative financial instruments. These derivative financial instruments are utilized to hedge currency exposures as well as to reduce earnings volatility resulting from shifts in market rates. FactSet only enters into foreign currency forward contracts to manage foreign currency exposures. The fair market values of all the Company’s derivative contracts change with fluctuations in currency rates and are designed so that any changes in their values are offset by changes in the values of the underlying exposures. See Note 5, to the Consolidated Financial StatementsDerivative Instruments, for additional analysis of the Company’s foreign currency exchange rate risk.
Interest Rate Risk
The fair market value of the Company’s cash and investments at August 31, 20122015 was $203$182.4 million. FactSet’s cash and cash equivalents consist of demand deposits and money market funds with original maturities of three months or less at the date of acquisitionfewer and are reported at fair value. The Company’s investments consist of certificates of deposits with original maturities greater than three months, but less than one year and, as such, are reported as short-term investments. It is anticipated that the fair market value of the Company’s portfolio will continue to be immaterially affected by fluctuations in interest rates. Because FactSet has a restrictive investment policy, its financial exposure to fluctuations in interest rates is expected to remain low. The Company does not believe that the value or liquidity of its cash and investments have been significantly impacted by the recent credit crisis.
As of August 31, 2015, the fair value of the Company’s long-term debt was $35.0 million, which approximated its carrying amount given its floating interest rate basis and was determined based on quoted market prices for debt with a similar maturity. The debt bears interest on the outstanding principal amount at a rate equal to 0.50% plus the Eurodollar rate, which is defined in the agreement as the rate per annum equal to one-month LIBOR.It is anticipated that the fair market value of the Company’s debt will continue to be immaterially affected by fluctuations in interest rates and FactSet does not believe that the value of its debt has been significantly impacted by current market events.
Current market events have not required the Company to modify materially or change its financial risk management strategies with respect to its exposures to foreign currency exchange risk and interest rate risk.
Concentrations of Credit Risk
Cash equivalents
Cash and cash equivalents are primarily maintained with severaltwo financial institutions. Deposits held with banks may exceed the amount of insurance provided on such deposits. These deposits may be redeemed upon demand and are maintained with financial institutions with reputable credit and therefore bear minimal credit risk. The Company seeks to mitigate its credit risks by spreading such risks across multiple counterparties and monitoring the risk profiles of these counterparties.
Accounts Receivable
Accounts receivable are unsecured and are derived from revenues earned from clients located around the globe. FactSet performs ongoing credit evaluations of its clients and does not require collateral from its clients. The Company maintains reserves for potential write-offs and these losses have historically been within expectations. No single client represented 10% or more of FactSet's total revenues in any fiscal year presented.As ofAt August 31, 2012 and 2011, respectively,2015, the Company’s largest individual client accounted for 2% of total subscriptions. In both years,subscriptions and annual subscriptions from the ten largest clients did not surpass 16%15% of total subscriptions.subscriptions, consistent with August 31, 2014. At August 31, 2015 and 2014, the receivable reserve was $1.6 million and $1.7 million, respectively.
Derivative Instruments
As a result of the use of derivative instruments, the Company is exposed to counterparty credit risk. FactSet has incorporated counterparty risk into the fair value of its derivative assets and its own credit risk into the value of the Company’s derivative liabilities. FactSet calculates credit risk from observable data related to credit default swapsCDS as quoted by publicly available information. Counterparty risk is represented by CDS spreads related to the senior secured debt of the respective bank with whom FactSet has executed these derivative transactions. Because CDS spread information is not available for FactSet, the Company’s credit risk is determined based on using a simple average of CDS spreads for peer companies as determined by FactSet. To mitigate counterparty credit risk, FactSet enters into contracts with large financial institutions and regularly review credit exposure balances as well as the creditworthiness of the counterparties.
Data Content Providers
Certain datasetsdata sets that FactSet relies on have a limited number of suppliers, although the Company makes every effort to assure that, where reasonable, alternative sources are available. However, FactSet is not dependent on any one third-partythird party data supplier in order to meet the needs of its clients. FactSet combines the data from these commercial databases into its own dedicated single online service, which the client accesses to perform their analysis. No single vendor or data supplier represented 10% or more of FactSet's total data expenses in any fiscal year presented.
20. UNAUDITED QUARTERLY FINANCIAL DATA
The following table presents selected unaudited financial information for each of the eight quartersquarterly periods in the periodyears ended August 31, 2012.2015 and 2014. The results for any quarter are not necessarily indicative of future quarterly results and, accordingly, period-to-period comparisons should not be relied upon as an indication of future performance (in thousands, except per share data).
Fiscal 2015 | First Quarter | Second Quarter | Third Quarter | Fourth Quarter | ||||||||||||
Revenues | $ | 242,676 | $ | 247,792 | $ | 254,522 | $ | 261,779 | ||||||||
Cost of services | 97,543 | 99,516 | 100,686 | 107,595 | ||||||||||||
Selling, general and administrative | 64,873 | 67,628 | 68,480 | 68,531 | ||||||||||||
Operating income | 80,260 | 80,648 | 85,356 | 85,653 | ||||||||||||
Net income | 55,860 | 61,598 | 61,409 | 62,184 | ||||||||||||
Diluted earnings per common share(1) | $ | 1.32 | $ | 1.46 | $ | 1.45 | $ | 1.48 | ||||||||
Weighted average common shares (diluted) | 42,340 | 42,306 | 42,297 | 41,995 | ||||||||||||
(1) | Diluted earnings per common share is calculated independently for each of the periods presented. Accordingly, the sum of the quarterly earnings per share amounts may not equal the total for thefiscalyear. |
Fiscal 2014 | First Quarter | Second Quarter | Third Quarter | Fourth Quarter | ||||||||||||
Revenues | $ | 222,975 | $ | 226,934 | $ | 231,761 | $ | 238,664 | ||||||||
Cost of services | 83,250 | 87,254 | 90,661 | 92,521 | ||||||||||||
Selling, general and administrative | 64,985 | 64,626 | 68,063 | 66,757 | ||||||||||||
Operating income | 74,740 | 75,054 | 73,037 | 79,386 | ||||||||||||
Net income | 52,178 | 52,426 | 51,532 | 55,407 | ||||||||||||
Diluted earnings per common share(1) | $ | 1.19 | $ | 1.22 | $ | 1.21 | $ | 1.31 | ||||||||
Weighted average common shares (diluted) | 43,773 | 43,107 | 42,615 | 42,386 | ||||||||||||
(1) | Diluted earnings per common share is calculated independently for each of the periods presented. Accordingly, the sum of the quarterly earnings per share amounts may not equal the total for thefiscalyear. |
21. SUBSEQUENT EVENTS
As previously announced, on September 21, 2015, FactSet agreed to acquire (the “Acquisition”) all of the issued and outstanding membership interests of Portware pursuant to a Securities Purchase Agreement by and among FactSet, Long Ridge Equity Partners I, LP, Long Ridge Offshore Subsidiary Holdings, LLC, Portware Investors Parallel Holdings LLC, Portware, Long Ridge Portware Holdings, Inc. and the Individual Sellers (as defined therein). On October 16, 2015, the Company completed the Acquisition for $265.0 million in cash, less certain adjustments set forth in the Securities Purchase Agreement, including, among others, a customary working capital adjustment. FactSet funded the Acquisition by borrowing $265.0 million on October 16, 2015 under its existing revolving credit facility, which it had amended on September 21, 2015.
With the acquisition of Portware, FactSet will offer a platform that will increase value to global asset managers by expanding its capabilities to include multi-asset trade automation. Revenue from Portware will be recognized based on geographic business activities in accordance with how the Company’s operating segments are currently aligned. The Company expects the majority of the purchase price to be allocated to goodwill and acquired intangible assets. The pro forma financials that may be required in connection with the Acquisition have not been included as the valuation of certain assets and liabilities is ongoing as of the date of this Form 10-K.
| Fiscal 2012 | First Quarter | Second Quarter | Third Quarter | Fourth Quarter | ||||||||||||
| Revenues | $ | 196,448 | $ | 199,371 | $ | 202,311 | $ | 207,663 | ||||||||
| Cost of services | 66,833 | 67,531 | 68,878 | 72,295 | ||||||||||||
| Selling, general and administrative | 62,862 | 64,723 | 64,939 | 64,741 | ||||||||||||
| Operating income | 66,753 | 67,117 | 68,494 | 70,627 | ||||||||||||
| Net income | 45,544 | 46,746 | 47,980 | 48,539 | ||||||||||||
| Diluted earnings per common share | $ | 0.99 | $ | 1.02 | $ | 1.05 | $ | 1.08 | ||||||||
| Weighted average common shares (diluted) | 46,103 | 45,707 | 45,736 | 45,152 | ||||||||||||
| Fiscal 2011 | First Quarter | Second Quarter | Third Quarter | Fourth Quarter | ||||||||||||
| Revenues | $ | 173,289 | $ | 177,635 | $ | 183,647 | $ | 191,939 | ||||||||
| Cost of services | 56,785 | 60,137 | 62,224 | 65,477 | ||||||||||||
| Selling, general and administrative | 57,075 | 59,405 | 59,600 | 67,472 | ||||||||||||
| Operating income | 59,429 | 58,093 | 61,823 | 58,990 | ||||||||||||
| Net income | 41,601 | 45,254 | 43,311 | 40,880 | ||||||||||||
| Diluted earnings per common share | $ | 0.88 | $ | 0.95 | $ | 0.92 | $ | 0.88 | ||||||||
| Weighted average common shares (diluted) | 47,487 | 47,427 | 47,154 | 46,595 | ||||||||||||
ITEM 9. CHANGES IN AND DISAGREEMENTS WITH ACCOUNTANTS ON ACCOUNTING AND
FINANCIAL DISCLOSURE
None.
Evaluation of Disclosure Controls and Procedures
Under the supervision and with the participation of the Company’s management, including the principal executive officer and principal financial officer, the Company has evaluated the effectiveness of its disclosure controls and procedures pursuant to Rules 13a-15(e) and 15d-15(e) under the Securities Exchange Act of 1934, as of the end of the annual period covered by this report. Based on that evaluation, the principal executive officer and principal financial officer have concluded that the Company’s disclosure controls and procedures as defined in Rules 13a-15(e) and 15d-15(e) under the Securities Exchange Act of 1934, as amended, (the “Exchange Act”) are effective to ensure that information required to be disclosed by the Company in reports that it files or submits under the Exchange Act is recorded, processed, summarized and reported within the time periods specified in Securities and Exchange Commission rules and forms and is accumulated and communicated to the Company’s management, including its principal executive officer and principal financial officer, as appropriate to allow timely decisions regarding required disclosure.
Changes in Internal Control over Financial Reporting
There have been no changes in the Company’s internal control over financial reporting (as such term is defined in Rules 13a-15(f) and 15d-15(f) under the Exchange Act) during the fourth quarter of fiscal 20122015 that hashave materially affected, or isare reasonably likely to materially affect, the Company’s internal control over financial reporting.
See Management’s Report on Internal Control over Financial Reporting under Item 8 on page 50.
Report of Independent Registered Public Accounting Firm
See Report of Independent Registered Public Accounting Firm under Item 8 on page 51.
ITEM 9B. OTHER INFORMATION
None.
The information required by this item relating to our directors and nominees, regarding compliance with Section 16(a) of the Securities Act of 1934, and regarding our Audit Committee is included under the captions “Corporate Governance” and “Security Ownership of Certain Beneficial Owners and Management” and contained in the definitive Proxy Statement dated October 30, 2012,2015, all of which information is incorporated herein by reference.
Pursuant to General Instruction G(3) of Form 10-K, the information required by this item relating to our executive officers is included under the caption “Executive Officers” of the Company’s definitive Proxy Statement dated October 30, 2012,2015, all of which information is incorporated herein by reference.
We have adopted a code of ethics that applies to our principal executive officer and all members of our finance department, including the principal financial officer and principal accounting officer. This code of ethics, which consists of the “Code of Ethical Conduct for Financial Managers,” is posted on our website, along with the charters of committees of our committee charters.Board of Directors. The Internet address for our Website iswww.factset.com, and the code of ethics may be found in the “Investor Relations” section under “Corporate Governance.” All employees, officers and directors are also subject to our “Code of Business Conduct and Ethics,” also posted on the “Corporate Governance” page of our website and the same information is available in print free of charge to any stockholder who submits a written request to the Company’s Investor Relations department at its corporate headquarters at 601 Merritt 7, Norwalk, Connecticut 06851.
We intend to satisfy any disclosure requirement under Item 5.05 of Form 8-K regarding an amendment to, or waiver from, a provision of this code of ethics by posting such information on our website, at the address and general location specified above.
The information required by this item relating to our executive compensation is included under the caption “Executive Compensation” contained in the definitive Proxy Statement dated October 30, 2012,2015, all of which information is incorporated herein by reference.
ITEM 12. SECURITY OWNERSHIP OF CERTAIN BENEFICIAL OWNERS AND MANAGEMENTAND RELATED STOCKHOLDER MATTERS
The information required by this item relating to security ownership of certain beneficial owners and management is included under the caption “Security Ownership of Certain Beneficial Owners and Management” and the information required by this item relating to securities authorized for issuance under equity compensation plans is included under the caption “Equity Compensation Plan Information,” in the definitive Proxy Statement dated October 30, 2012,2015, all of which information is incorporated herein by reference.
The information required by this item relating to review, approval or ratification of transactions with related persons is included under the caption “Certain Relationships and Related Transactions” and the information required by this item relating to director independence is included under the captionscaption “Corporate Governance” and “Director Compensation,” contained in the definitive Proxy Statement dated October 30, 2012,2015, all of which information is incorporated herein by reference.
The information required by this item is included under the captionscaption “Proposal 2: Ratification of Independent Registered Public Accounting Firm” in the definitive Proxy Statement dated October 30, 2012,2015, all of which information is incorporated herein by reference.
1. | Consolidated Financial Statements |
The Index to Consolidated Financial Statements under Item 8 on page 4944 is incorporated herein by reference as the list of financial statements required as part of this report.
2. | Financial Statement Schedule |
Schedule II – Valuation and Qualifying Accounts
Years Ended August 31, 2012, 2011,2015, 2014, and 20102013 (in thousands):
Receivable reserve and billing adjustments* | Balance at Beginning of Year | Charged to Expense/ Against Revenue | Write-offs, Net of Recoveries | Balance at End of Year | ||||||||||||
| 2012 | $ | 1,955 | $ | 1,863 | $ | 1,988 | $ | 1,830 | ||||||||
| 2011 | $ | 1,862 | $ | 1,748 | $ | 1,655 | $ | 1,955 | ||||||||
| 2010 | $ | 1,712 | $ | 2,903 | $ | 2,753 | $ | 1,862 | ||||||||
Receivable reserveand billing adjustments(1) | Balance at Beginning of Year | Charged to Expense/ Against Revenue | Write-offs, Net of Recoveries | Balance at End of Year | ||||||||||||
2015 | $ | 1,662 | $ | 2.268 | $ | 2,350 | $ | 1,580 | ||||||||
2014 | $ | 1,644 | $ | 2,135 | $ | 2,117 | $ | 1,662 | ||||||||
2013 | $ | 1,830 | $ | 1,580 | $ | 1,766 | $ | 1,644 | ||||||||
��
(1) | Additions to the receivable reserve for doubtful accounts are charged to bad debt expense. Additions to the receivable reserve for billing adjustments are charged against revenues. |
Additional financial statement schedules have been omitted since they are either not required, not applicable, or the information is otherwise included.
3. | Exhibits |
EXHIBIT NUMBER | DESCRIPTION | ||
3.1 | Restated Certificate of Incorporation | ||
3.2 | Amendment to the Restated Certificate of Incorporation | ||
3.3 | Second Amendment to the Restated Certificate of Incorporation | ||
3.4 | |||
Amended and Restated By-laws of FactSet Research Systems Inc. | |||
4 | Form of Common Stock | ||
10.1 | Severance Agreement dated September 20, 1999 between FactSet Research Systems Inc. and Peter G. Walsh | ||
10.2 | The FactSet Research Systems Inc. | ||
10.3 | The FactSet Research Systems Inc. 2000 Stock Option Plan | ||
10.4 | The FactSet Research Systems Inc. 2004 Stock Option and Award Plan, as Amended and Restated | ||
10.5 | The FactSet Research Systems Inc. 1998 Non-Employee Directors’ Stock Option Plan | ||
10.6 | The FactSet Research Systems Inc. 2008 Non-Employee Directors’ Stock Option Plan | ||
10.7 | |||
The FactSet Research Systems Inc. 2008 Employee Stock Purchase Plan, | |||
21 | Subsidiaries of | ||
23.1 | Consent of | ||
23.2 | Consent of PricewaterhouseCoopers LLP | ||
31.1 | Section 302 Certification of Principal Executive Officer | ||
31.2 | Section 302 Certification of Principal Financial Officer | ||
32.1 | Section 906 Certification of Principal Executive Officer | ||
32.2 | Section 906 Certification of Principal Financial Officer | ||
101.INS* | XBRL Instance Document | ||
101.SCH* | XBRL Taxonomy Extension Schema | ||
101.CAL* | XBRL Taxonomy Extension Calculation Linkbase | ||
101.DEF* | XBRL Taxonomy Extension Definition Linkbase Document | ||
101.LAB* | XBRL Taxonomy Extension Label Linkbase | ||
101.PRE* | XBRL Taxonomy Extension Presentation Linkbase | ||
(1) | Incorporated by reference to the Company’s Registration Statement on Form S-1 (File No. 333-04238). |
(2) | Incorporated by reference to the Company’s annual report on Form 10-K for fiscal year 2001. |
(3) | Incorporated by reference to the Company’s periodic report on Form 8-K, filed on December 16, 2011. |
(4) | Incorporated by reference to the Company’s |
(5) | Incorporated by reference to the Company’s Registration Statement on Form S-8 (File No. 333-22319). |
(6) | Incorporated by reference to the Company’s Registration Statement on Form S-8 (File No. 333-56870). |
(7) | Incorporated by reference to the Company’s Registration Statement on Form S-8 (File No. 333-171667). |
(8) | Incorporated by reference to the Company’s Registration Statement on Form S-8 (File No. 333-59839). |
(9) | Incorporated by reference to the Company’s Registration Statement on Form S-8 (File No. |
Pursuant to the requirements of Section 13 or 15(d) of the Securities Exchange Act of 1934, the Registrant has duly caused this Report on Form 10-K to be signed on its behalf by the undersigned, thereunto duly authorized.
FACTSET RESEARCH SYSTEMS | |||
(Registrant) | |||
Date: October 30, | /s/ F. PHILIP | SNOW | |
F. Philip | Snow | ||
Chief Executive Officer | |||
Pursuant to the requirements of the Securities Exchange Act of 1934, this reportReport has been signed below by the following persons on behalf of the registrantRegistrant and in the capacities and on the dates indicated.
Name | Title | Date | ||
/ | Chief Executive Officer and Director | October 30, | ||
| F. Philip | (Principal Executive Officer) | |||
/s/ | Senior Vice President, | October 30, | ||
| Maurizio Nicolelli | (Principal Financial Officer) | |||
/s/ | Vice President, | October 30, | ||
| Matthew J. McNulty | (Principal Accounting Officer) | |||
/ | Chairman | October 30, | ||
/ | Lead Independent Director | October 30, | ||
| James J. McGonigle | ||||
/ | Director | October 30, | ||
| Robin A. Abrams | ||||
/ | Director | October 30, | ||
| Scott A. Billeadeau | ||||
/ | Director | October 30, | ||
| Joseph E. Laird, Jr. | ||||
/ | Director | October 30, | ||
| Walter F. Siebecker | ||||
/s/ JOSEPH R | Director | October 30, | ||
| Joseph R. Zimmel | ||||
89