


UNITED STATES
SECURITIES AND EXCHANGE COMMISSION
Washington, D.C. 20549
FORM 10-K
(X(X)ANNUAL REPORT PURSUANT TO SECTION 13 OR 15(d) OF THE SECURITIES EXCHANGE ACT OF 1934 FOR THE FISCAL YEAR ENDED SEPTEMBER 29, 201227, 2014
( ) TRANSITION REPORT PURSUANT TO SECTION 13 OR 15 (d) OF THE SECURITIES EXCHANGE ACT OF 1934 FOR THE TRANSITION PERIOD FROM TO
Commission File No. 0-14616
J & J SNACK FOODS CORP.
(Exact name of registrant as specified in its charter)
New Jersey | 22-1935537 | |
(State or other jurisdiction of | (I.R.S. Employer Identification No.) | |
incorporation or organization) | | |
6000 Central Highway | 08109 | |
Pennsauken, New Jersey | (Zip Code) | |
| |
Registrant's telephone number, including area code: (856) 665-9533
Securities Registered Pursuant to Section 12(b) of the Act:
Title of Each Class | Name of Each Exchange on Which Registered |
Common Stock, no par value | The NASDAQ Global Select Exchange |
Securities Registered Pursuant to Section 12(g) of the Act: None
Indicate by check mark if the registrant is a well-known seasoned issuer, as defined in Rule 405 of the Securities Act. Yes X No __
Indicate by check mark if the registrant is not required to file reports pursuant to Section 13 or 15(d) of the Act. Yes ___ No X
Indicate by check mark whether the registrant (1) has filed all reports required to be filed by Section 13 or 15(d) of the Securities Exchange Act of 1934 during the preceding 12 months (or such shorter period that the registrant was required to file such reports), and (2) has been subject to such filing requirements for the past 90 days. YesX No ___
Indicate by check mark whether the registrant has submitted electronically and posted on its corporate Web site, if any, every Interactive Data File required to be submitted and posted pursuant to Rule 405 of Regulation S-T (§(§232.405 of this chapter) during the preceding 12 months (or for such shorter period that the registrant was required to submit and post such files). Yes X No ___
Indicate by check mark if disclosure of delinquent filers pursuant to Item 405 of Regulation S-K (229.405 of this chapter) is not containedcontained herein, and will not be contained, to the best of Registrant's knowledge, in definitive proxy or information statements incorporated by reference in Part III of this Form 10-K or any amendment to this Form 10-K. X
Indicate by check mark whether the registrant is a large accelerated filer, an accelerated filer, a non-accelerated filer, or a smaller reporting company. See the definitions of “large accelerated filer,” “accelerated filer,” “non-accelerated filer” and “smaller reporting company” in Rule 12b-2 of the Exchange Act. (Check one):
Large accelerated filer (X) Accelerated filer ( )
Non-accelerated filer ( ) Smaller reporting company ( )
(Do not check if a smaller reporting company)
Indicate by check mark whether the registrant is a shell company (as defined in Rule 12b-2 of the Exchange Act). Yes Yes___ No X
As of November 16, 2012,4, 2014, the latest practicable date, 18,749,35318,666,865 shares of the Registrant’s common stock were issued and outstanding. The aggregate market value of shares held by non-affiliates of the Registrant on such date was $764,966,763$1,406,222,825 based on the last sale price on March 23, 201228, 2014 of $51.38$94.64 per share. March 23, 201228, 2014 was the last business day of the registrant’s most recently completed second fiscal quarter.
DOCUMENTS INCORPORATED BY REFERENCE
Portions of the registrant’s definitive proxy statement for its Annual Meeting of Shareholders scheduled for February 7, 201317, 2015 are incorporated by reference into Part III of this report.
J & J SNACK FOODS CORP.
2014 FORM 10-K ANNUAL REPORT
TABLE OF CONTENTS
| Page | ||
| PART I | ||
Item 1 | Business | 1 |
Item 1A | Risk Factors | 6 |
Item 1B | Unresolved Staff Comments | 8 |
Item 2 | Properties | 8 |
Item 3 | Legal Proceedings | 9 |
Item 4 | Mine Safety Disclosures | 9 |
PART II | ||
Item 5 | Market For Registrant’s Common Equity, RelatedStockholder Matters And Issuer Purchases Of Equity Securities | 10 |
Item 6 | Selected Financial Data | 12 |
Item 7 | Management’s Discussion And Analysis OfFinancial Condition And Results Of Operations | 12 |
Item 7A | Quantitative And Qualitative DisclosuresAbout Market Risk | |
Item 8 | Financial Statements And Supplementary Data | 24 |
Item 9 | Changes In And Disagreements With AccountantsOn Accounting And Financial Disclosure | |
Item 9A | Controls and Procedures | 24 |
Item 9B | Other Information | 25 |
PART III | ||
Item 10 | Directors, Executive Officers and CorporateGovernance | |
Item 11 | Executive Compensation | 26 |
Item 12 | Security Ownership Of Certain BeneficialOwners And Management And Related Stockholder Matters | |
Item 13 | Certain Relationships And Related Transactions,and Director Independence | |
Item 14 | Principal Accountant Fees and Service | 27 |
PART IV | ||
Item 15 | Exhibits, Financial Statement Schedules | 28 |
In addition to historical information, this document and analysis contains forward-looking statements. The forward-looking statements contained herein are subject to certain risks and uncertainties that could cause actual results to differ materially from those projected in the forward-looking statements. Important factors that might cause such a difference include, but are not limited to, those discussed in the “Management’s Discussion and Analysis of Financial Condition and Results of Operations.” Readers are cautioned not to place undue reliance on these forward-looking statements, which reflect management’s analysis only as of the date hereof. We undertake no obligation to publicly revise or update these forward-looking statements to reflect events or circumstances that arise after the date hereof.
Part I
Item 1. Business
BusinessGeneral
J & J Snack Foods Corp. (the “Company” or “J & J”) manufactures nutritional snack foods and distributes frozen beverages which it markets nationally to the food service and retail supermarket industries. The Company’s principal snack food products are soft pretzels marketed primarily under the brand namenames SUPERPRETZEL and BAVARIAN BAKERY, frozen juice treats and desserts marketed primarily under the LUIGI’S, WHOLE FRUIT, ICEE, PHILLY SWIRL and MINUTE MAID* brand names.names, churros marketed primarily under the TIO PEPE’S and CALIFORNIA CHURROS brand names and bakery products sold primarily under the READI-BAKE, COUNTRY HOME, MARY B’S AND DADDY RAY’S brand names as well as for private label and contract packing. J & J believes it is the largest manufacturer of soft pretzels in the United States, Mexico and Canada. Other snack food products include churros (an Hispanic pastry), funnel cake sold under THE FUNNEL CAKE FACTORY brand and dough enrobed handheld products sold under the PATIO brand and bakery products.other smaller brands as well. The Company’s principal frozen beverage products are the ICEE brand frozen carbonated beverage and the SLUSH PUPPIE brand frozen uncarbonatednon- carbonated beverage.
The Company’s Food Service and Frozen Beverages sales are made primarily to food service customers including snack bar and food stand locations in leading chain, department, discount, warehouse club and convenience stores; malls and shopping centers; fast food outlets; stadiums and sports arenas; leisure and theme parks; movie theatres; independent retailers; and schools, colleges and other institutions. The Company’s retail supermarket customers are primarily supermarket chains.
*Minute Maid is a registered trademark of the Coca-Cola Company
The Company was incorporated in 1971 under the laws of the State of New Jersey.
The Company has made acquisitions in 2012 and in prior years as described in “Management’s Discussion and Analysis of Financial Condition and Results of Operations” and our consolidated financial statements and related notes thereto.
The Company operates in three business segments: Food Service, Retail Supermarkets and Frozen Beverages. These segments are described below.
The Chief Operating Decision Maker for Food Service and Retail Supermarkets and the Chief Operating Decision Maker for Frozen Beverages monthly review detailed operating income statements and sales reports in order to assess performance and allocate resources to each individual segment. Sales is considered to be the one and only key variable monitored by the Chief Operating Decision Makers and management when determining each segment’s and the company’s financial condition and operating performance. In addition, the Chief Operating Decision Makers review and evaluate depreciation, capital spending and assets of each segment on a quarterly basis to monitor cash flow and asset needs of each segment (see Item 7 – Management’s Discussion and Analysis of Financial Condition and Results of Operations and Item 8 – Financial Statements and Supplementary Data for financial information about segments).
Food Service
The primary products sold by the food service segment are soft pretzels, frozen juice treats and desserts, churros, dough enrobed handheld products and baked goods. Our customers in the food service segment include snack bars and food stands in chain, department and discount stores; malls and shopping centers; casual dining restaurants; fast food outlets; stadiums and sports arenas; leisure and theme parks; convenience stores; movie theatres; warehouse club stores; schools, colleges and other institutions.
Retail Supermarkets The primary products sold to the retail supermarket channel are soft pretzel products – including SUPERPRETZEL, frozen juice treats and desserts including LUIGI’S Real Italian Ice, MINUTE MAID Juice Bars and Soft Frozen Lemonade, WHOLE FRUIT frozen fruit bars and sorbet, PHILLY SWIRL cups and sticks, ICEE Squeeze-Up Tubes and dough enrobed handheld products including PATIO burritos. Within the retail supermarket channel, our frozen and prepackaged products are purchased by the consumer for consumption at home. Frozen Beverages We sell frozen beverages to the food service industry primarily under the names ICEE, SLUSH PUPPIE and PARROT ICE Products Soft Pretzels The Company’s soft pretzels are sold under many brand names; some of which are: SUPERPRETZEL, PRETZEL FILLERS, PRETZELFILS, GOURMET TWISTS, MR. TWISTER, SOFT PRETZEL BITES, SOFTSTIX, SOFT PRETZEL BUNS, TEXAS TWIST, Soft pretzels are sold in the Food Service and Retail Supermarket segments. Soft pretzel sales amounted to Certain of the Company’s soft pretzels qualify under USDA regulations as the nutritional equivalent of bread for purposes of the USDA school lunch program, thereby enabling a participating school to obtain partial reimbursement of the cost of the Company’s soft pretzels from the USDA. The Company’s soft pretzels are manufactured according to a proprietary formula. Soft pretzels, ranging in size from one to ten ounces in weight, are shaped and formed by the Company’s twister machines. These soft pretzel tying machines are automated, high-speed machines for twisting dough into the traditional pretzel shape. Additionally, we make soft pretzels which are extruded or shaped by hand. Soft pretzels, after processing, are primarily quick-frozen in either raw or baked form and packaged for delivery. The Company’s principal marketing program in the Food Service segment includes supplying ovens, mobile merchandisers, display cases, warmers and similar merchandising equipment to the retailer to prepare and promote the sale of soft pretzels. Some of this equipment is proprietary, including Frozen Juice Treats and Desserts The Company’s frozen juice treats and desserts are marketed primarily under the LUIGI’S, WHOLE FRUIT, PHILLY SWIRL, ICEE and MINUTE MAID brand names. Frozen juice treats and desserts are sold in the Food Service and Retail Supermarkets segments. Frozen juice treats and dessert sales were The Company’s school food service MINUTE MAID and WHOLE FRUIT frozen juice bars and cups The balance of the Company’s frozen juice treats and desserts products are manufactured from water, sweeteners and fruit juice concentrates in various flavors and packaging including cups, tubes, sticks, M-paks *MINUTE MAID is a registered trademark of the Coca-Cola Company1 and ARCTIC BLAST in the United States, Mexico and Canada. We also provide repair and maintenance service to customers for customers’ owned equipment.Products CINNAPRETZEL*BAVARIAN BAKERY,SUPERPRETZEL BAVARIAN, NEW YORK PRETZEL, KIM & SCOTT’S GOURMET PRETZELS and SERIOUSLY TWISTED!; and, to a lesser extent, under private labels.18%22% of the Company’s revenue in fiscal year 2012,2014, 21% in 2013 and 18% in 2011, and 19% in 2010.2012.combination warmercombinationwarmer and display cases that reconstitute frozenreconstitutefrozen soft pretzels while displaying them, thus eliminating the need for an oven. The Company retains ownership of the equipment placed in customer locations, and as a result, customers are not required to make an investment in equipment.13%12% of the Company’s revenue in 2012, 14% of the Company’s revenue in 2011 and 14% in fiscal year 2010.2014, 11% in 2013 and 13% in 2012.are manufactured from an apple or pineapple juice concentrate to which water, sweeteners, coloring (in some cases) and flavorings are added. The juice bars and cups contain three to four ounces ofof100% apple or pineapple juice with no added sugar and 100% of the daily US FDA value of vitamin C. The juice bars are produced in various flavors and are packaged in a sealed push-up paper container referred to as the Milliken M-pak, which the Company believes has certain sanitary and safety advantages.pints and tubs.pints. Several of the products contain ice cream and WHOLE FRUIT contains pieces of fruit.
Churros
The Company’s churros are sold primarily under the TIO PEPE’S and CALIFORNIA CHURROS brand names. Churros are sold to the Food Service and Retail Supermarkets segments. Churro sales were 6% of the Company’s sales in fiscal year 2014, 7% in fiscal year 2013 and 6% in the fiscal year 2012, 6% in fiscal year 2011 and 5% in 2010.2012. Churros are Hispanic pastries in stick form which the Company produces in several sizes according to a proprietary formula. The churros are deep fried, frozen and packaged. At food service point-of-sale they are reheated and topped with a cinnamon sugar mixture. The Company also sells fruit and crème-filled churros. The
Handheld Products
The Company's dough enrobed handheld products are marketed under the PATIO, HAND FULLS, HOLLY RIDGE BAKERY, VILLA TALIANO,SUPREME STUFFERS, SWEET STUFFERS, and TOP PICKS brand names and under private labels. Handheld products are sold to the Food Service and Retail Supermarket segments. Handheld product sales amounted to 6%5% of the Company'sCompany’s sales in 2012fiscal year 2014 and 2%6% in 2011.
Bakery Products
The Company’s bakery products are marketed under the MRS. GOODCOOKIE, READI-BAKE, COUNTRY HOME, MARY B’S, DADDY RAY’S and JANA’S brand names, and under private labels. Bakery products include primarily biscuits, fig and fruit bars, cookies, breads, rolls, crumb, muffins and donuts. Bakery products are sold to the Food Service segment. Bakery products sales amounted to 32%31% of the Company’s sales in fiscal year 2012,2014, 32% in 2011fiscal year 2013 and 34%32% in 2010.
Frozen Beverages
The Company markets frozen beverages primarily under
Frozen beverage sales amounted to 16%14% of revenue in fiscal 2012, 18%year 2014, 15% in 20112013 and 18%16% in 2010.
Under the Company’s principal marketing program for frozen carbonated beverages, it installs frozen beverage dispensers for its ICEE and ARCTIC BLAST brandsbrand at customer locations and thereafter services the machines, arranges to supply customers with ingredients required for production of the frozen beverages, and supports customer retail sales efforts with in-store promotions and point-of-sale materials. In most cases, the Company retains ownership of its dispensers, and as a result, customers are not required to make an investment in equipment or arrange for the ingredients and supplies necessary to produce and market the frozen beverages. The Company sells frozen non-carbonated beverages under the SLUSH PUPPIE and PARROT ICE brands through a distributor network and through its own distribution network. The Company also provides repair and maintenance service to customers for customers’ owned equipment and sells equipment in its Frozen Beverages segment, revenue from which amounted to 7%9% of sales in 2012,2014, 8% in 2013 and 7% of sales in 2011 and 8% of the Company sales in fiscal year 2010. The Company sells frozen uncarbonated beverages under the SLUSH PUPPIE and PARROT ICE brands through a distributor network and through its own distribution network.
Each new frozen carbonated customer location requires a frozen beverage dispenser supplied by the Company or by the customer. Company-supplied frozen carbonated dispensers are purchased from outside vendors, built new or rebuilt by the Company.
The Company provides managed service and/or products to approximately 87,00098,000 Company-owned and customer-owned dispensers.
The Company has the rights to market and distribute frozen beverages under the name ICEE to the entire continental United States (except for portions of nine
Other Products
Other products sold by the Company include soft drinks, funnel cakes sold under the FUNNEL CAKE FACTORY brand name and smaller amounts of various other food products. These products are sold in the Food Service and Frozen Beverages segments.
Customers
The Company sells its products to two principal channels: food service and retail supermarkets. The primary products sold to the food service channel are soft pretzels, frozen beverages, frozen juice treats and desserts, churros, dough enrobed handheld products and baked goods. The primary products sold to the retail supermarket channel are soft pretzels, frozen juice treats and desserts and dough enrobed handheld products.
We have several large customers that account for a significant portion of our sales. Our top ten customers accounted for 41%, 43% and 42%41% of our sales during fiscal years 2012, 20112014, 2013 and 2010,2012, respectively, with our largest customer accounting for 8% of our sales in 2012,2014, 8% of our sales in 20112013 and 8% in 2010.2012. Three of the ten customers are food distributors who sell our product to many end users. The loss of one or more of our large customers could adversely affect our results of operations. These customers typically do not enter into long-term contracts and make purchase decisions based on a combination of price, product quality, consumer demand and customer service performance. If our sales to one or more of these customers are reduced, this reduction may adversely affect our business. If receivables from one or more of these customers become uncollectible, our operating income would be adversely impacted.
The Food Service and the Frozen Beverages segments sell primarily to food service channels. The Retail Supermarkets segment sells primarily to the retail supermarket channel.
The Company’s customers in the food service segment include snack bars and food stands in chain, department and mass merchandising stores, malls and shopping centers, fast food outlets, casual dining restaurants, stadiums and sports arenas, leisure and theme parks, convenience stores, movie theatres, warehouse club stores, schools, colleges and other institutions, and independent retailers. Machines and machine parts are sold to other food and beverage companies.
The Company sells its products to an estimated 85-90% of supermarkets in the United States. Products sold to retail supermarket customers are primarily soft pretzel products, including SUPERPRETZEL, frozen juice treats and desserts including LUIGI’S Real Italian Ice, MINUTE MAID Juice Bars and Soft Frozen Lemonade, WHOLE FRUIT frozen fruit bars, WHOLE FRUIT Sorbet, PHILLY SWIRL cups and sticks, MARY B’S biscuits and dumplings, DADDY RAY’S fig and fruit bars, ICEE Squeeze-Up Tubes, PATIO burritos and TIO PEPE’S Churros. Within the retail supermarket industry, the Company’s frozen and prepackaged products are purchased by the consumer for consumption at home.
Marketing and Distribution
The Company has developed a national marketing program for its products. For Food Service and Frozen Beverages segments’ customers, this marketing program includes providing ovens, mobile merchandisers, display cases, warmers, frozen beverage dispensers and other merchandising equipment for the individual customer’s requirements and point-of-sale materials as well as participating in trade shows and in-store demonstrations. The Company’s ongoing advertising and promotional campaigns for its Retail Supermarket segment’s products include trade shows, newspaper advertisements with coupons, in-store demonstrations and consumer advertising campaigns.
The Company develops and introduces new products on a routine basis. The Company evaluates the success of new product introductions on the basis of sales levels, which are reviewed no less frequently than monthly by the Company’s Chief Operating Decision Makers.
The Company’s products are sold through a network of about 200100 food brokers, and over 1,000 independent sales distributors and the Company’s own direct sales force. For its snack food products, the Company maintains warehouse and distribution facilities in Pennsauken, Bellmawr and Bridgeport, New Jersey; Vernon (Los Angeles) and Colton, California; Brooklyn, New York; Scranton, Pittsburgh, Hatfield and Lancaster, Pennsylvania; Carrollton (Dallas), Texas; Atlanta, Georgia; Moscow Mills (St. Louis), Missouri; Pensacola and Tampa, Florida; Solon, Ohio; Weston, Oregon; and Holly Ridge, North Carolina. Frozen beverages are distributed from 142141 Company managed warehouse and distribution facilities located in 44 states, Mexico and Canada, which allow the Company to directly service its customers in the surrounding areas. The Company’s products are shipped in refrigerated and other vehicles from the Company’s manufacturing and warehouse facilities on a fleet of Company operated tractor-trailers, trucks and vans, as well as by independent carriers.
Seasonality
The Company’s sales are seasonal because frozen beverage sales and frozen juice treats and desserts sales are generally higher during the warmer months.
Trademarks and Patents
The Company has numerous trademarks, the most important of which are SUPERPRETZEL, TEXAS TWIST, NEW YORK PRETZEL, BAVARIAN BAKERY, MR. TWISTER, SOFT PRETZEL BITES, SOFTSTIX, PRETZEL FILLERS and PRETZELFILS for its pretzel products; FROSTAR, SHAPE-UPS, MAMA TISH’S, FRUIT-A-FREEZE, WHOLE FRUIT, PHILLY SWIRL and LUIGI’S for its frozen juice treats and desserts; TIO PEPE’S and CALIFORNIA CHURROS for its churros; ARCTIC BLAST, SLUSH PUPPIE and PARROT ICE for its frozen beverages; FUNNEL CAKE FACTORY for its funnel cake products, PATIO for its handheld burritos and MRS. GOODCOOKIE, READI-BAKE, COUNTRY HOME, CAMDEN CREEK, MARY B’S, JANA’S and DADDY RAY’S for its bakery products.
The Company markets frozen beverages under the trademark ICEE in all of the continental United States, except for portions of nine states, and in Mexico and
The trademarks, when renewed and continuously used, have an indefinite term and are considered important to the Company as a means of identifying its products. The Company considers its trademarks important to the success of its business.
The Company has numerous patents related to the manufacturing and marketing of its product.
Supplies
The Company’s manufactured products are produced from raw materials which are readily available from numerous sources. With the exception of the Company’s soft pretzel twisting equipment, churros and funnel cake production equipment, which are made for J & J by independent third parties, and certain specialized packaging equipment, the Company’s manufacturing equipment is readily available from various sources. Syrup for frozen beverages is purchased primarily from The Coca-Cola Company, Dr Pepper/Seven Up, Inc., the Pepsi Cola Company, and Jogue, Inc. Cups, straws and lids are readily available from various suppliers. Parts for frozen beverage dispensing machines are purchased from several sources. Frozen beverage dispensers are purchased primarily from IMI Cornelius, Inc. and FBD Partnership.
Competition
Snack food and bakery products markets are highly competitive. The Company’s principal products compete against similar and different food products manufactured and sold by numerous other companies, some of which are substantially larger and have greater resources than the Company. As the soft pretzel, frozen juice treat and dessert, bakery products and related markets grow, additional competitors and new competing products may enter the markets. Competitive factors in these markets include product quality, customer service, taste, price, identity and brand name awareness, method of distribution and sales promotions.
The Company believes it is the only national distributor of soft pretzels. However, there are numerous regional and local manufacturers of food service and retail supermarket soft pretzels as well as several chains of retail pretzel stores.
In Frozen Beverages the Company competes directly with other frozen beverage companies. These include several companies which have the right to use the ICEE name in portions of nine states. There are many other regional
The Company competes with large soft drink manufacturers for counter and floor space for its frozen beverage dispensing machines at retail locations and with products which are more widely known than the ICEE, SLUSH PUPPIE and PARROT ICE and ARCTIC BLAST frozen beverages.
The Company competes with a number of other companies in the frozen juice treat and dessert and bakery products markets.
Risks Associated with Foreign Operations
Foreign operations generally involve greater risk than doing business in the United States. Foreign economies differ favorably or unfavorably from the United States’ economy in such respects as the level of inflation and debt, which may result in fluctuations in the value of the country’s currency and real property. Sales of our foreign operations were $19,491,000, $18,025,000$23,633,000, $23,161,000 and $14,301,000$19,491,000 in fiscal years 2012, 20112014, 2013 and 2010,2012, respectively. At September 29, 2012,27, 2014, the total assets of our foreign operations were approximately $16.3$28 million or 2.7%3.9% of total assets. At September 24, 2011,28, 2013, the total assets of our foreign operations were approximately $13.7$24 million or 2.5%3.7% of total assets.
Employees
The Company has approximately 3,200about 3,400 full and part time employees as of September 29, 2012. Certain27, 2014. About 900 production and distribution employees atthroughout the Pennsauken and Bellmawr, New Jersey plantsCompany are covered by a collective bargaining agreement which expires in September 2013. Certain production and distribution employees at the Bridgeport, New Jersey plant are covered by a collective bargaining agreement which expires February 2, 2013.
The Company considers its employee relations to be good.
Available Information
The Company’s internet address is www.jjsnack.com.iswww.jjsnack.com. On the investor relations section of its website, the Company provides free access to its annual report on Form 10-K, quarterly reports on Form 10-Q, current reports on Form 8-K and any amendments to these reports, as soon as reasonably practicable after such material is electronically filed with, or furnished to, the Securities and Exchange Commission (“SEC”). The information on the website listed above is not and should not be considered part of this annual report on Form 10-K and is not incorporated by reference in this document.
Item 1A. Risk Factors
You should carefully consider the risks described below, together with all of the other information included in this report, in considering our business and prospects. The risks and uncertainties described below are not the only ones facing us. Additional risks and uncertainties not presently known to us or that we currently deem insignificant may also impair our business operations. Following is a discussion of known potentially significant risks which could result in harm to our business, financial condition or results of operations.
Risks of Shortages or Increased Cost of Raw Materials
We are exposed to the market risks arising from adverse changes in commodity prices, affecting the cost of our raw materials and energy. The raw materials and energy which we use for the production and distribution of our products are largely commodities that are subject to price volatility and fluctuations in availability caused by changes in global supply and demand, weather conditions, agricultural uncertainty or governmental controls. We purchase these materials and energy mainly in the open market. Our procurement practices are intended to reduce the risk of future price increases, but also may potentially limit the ability to benefit from possible price decreases. If commodity price changes result in increases in raw materials and energy costs, we may not be able to increase our prices to offset these increased costs without suffering reduced volume, revenue and operating income.
General Risks of the Food Industry
Food processors are subject to the risks of adverse changes in general economic conditions; evolving consumer preferences and nutritional and health-related concerns; changes in food distribution channels; federal, state and localandlocal food processing controls or other mandates; consumer product liability claims; and risks of product tampering. The increased buying power of large supermarket chains, other retail outlets and wholesale food vendors could result in greater resistance to price increases and could alter the pattern of customer inventory levels and access to shelf space.
Environmental Risks
The disposal of solid and liquid waste material resulting from the preparation and processing of foods areis subject to various federal, state and local laws and regulations relating to the protection of the environment. Such laws and regulations have an important effect on the food processing industry as a whole, requiring substantially all firms in the industry to incur material expenditures for modification of existing processing facilities and for construction of upgraded or new waste treatment facilities.
We cannot predict what environmental legislation or regulations will be enacted in the future, how existing or future laws or regulations will be administered or interpreted or what environmental conditions may be found to exist. Enactment of more stringent laws or regulations or more strict interpretation of existing laws and regulations may require additional expenditures by us, some of which could be material.
Risks Resulting from Several Large Customers
We have several large customers that account for a significant portion of our sales. Our top ten customers accounted for 41%, 43% and 42%41% of our sales during fiscal years 2012, 20112014, 2013 and 2010,2012, respectively, with our largest customer accounting for 8% of our sales in 2012,2014, 8% of our sales in 20112013 and 8% in 2010.2012. Three of the ten customers are food distributors who sell our product to many end users. The loss of one or more of our large customers could adversely affect our results of operations. These customers typically do not enter into long-term contracts and make purchase decisions based on a combination of price, product quality, consumer demand and customer service performance. If our sales to one or more of these customers are reduced, this reduction may adversely affect our business. If receivables from one or more of these customers become uncollectible, our operating income would be adversely impacted.
Competition
Our businesses operate in highly competitive markets. We compete against national and regional manufacturers and distributors on the basis of price, quality, product variety and effective distribution. Many of our major competitors in the market are larger and have greater financial and marketing resources than we do. Increased competition and anticipated actions by our competitors could lead to downward pressure on prices and/or a decline in our market share, either of which could adversely affect our results. See “Competition” in Item 1 for more information about our competitors.
Risks Relating to Manufacturing
Our ability to purchase, manufacture and distribute products is critical to our success. Damage or disruption to our manufacturing or distribution capabilities due to weather, natural disaster, fire or explosion, terrorism, pandemic, political upheaval, strikes or other reasons could impair our ability to manufacture or distribute our products.
Our Certificate of Incorporation may inhibit a change in control that you may favor
Our Certificate of Incorporation contains provisions that may delay, deter or inhibit a future acquisition of JofJ & J Snack Foods Corp. not approved by our Board of Directors. This could occur even if our shareholders are offered an attractive value for their shares or if a substantial number or even a majority of our shareholders believe the takeover is in their best interest. These provisions are intended to encourage any person interested in acquiring us to negotiate with and obtain the approval of our Board of Directors in connection with the transaction. Provisions that could delay, deter or inhibit a future acquisition include the following:
-- | a classified Board of Directors; |
| -- | the requirement that our shareholders may only |
| -- | limitations on share holdings and voting of |
| -- | special Director voting rights; and |
| -- | the ability of the Board of Directors to consider |
Risks Relating to the Control by Gerald B. Shreiber
Gerald B. Shreiber is the founder of the Company and the current beneficial owner of 20% of its outstanding stock. Our Certificate of Incorporation provides that he has three votes on the Board of Directors (subject to certain adjustments). Therefore, he and one other director have voting control of the Board. The performance of this Company is greatly impacted by his leadership and decisions. His voting control reduces the restrictions on his actions. His retirement, disability or death may have a significant impact on our future operations.
Risk Related to Product Changes
Risks Related to Change in the Business
Risks Associated with Foreign Operations
Seasonality and Quarterly Fluctuations
Our sales are affected by the seasonal demand for our products. Demand is greater during the summer months primarily as a result of the warm weather demand for our ICEE and frozen juice treats and desserts products. Because of seasonal fluctuations, there can be no assurance that the results of any particular quarter will be indicative of results for the full year or for future years.
Item 1B. Unresolved Staff Comments
We have no unresolved SEC staff comments to report.
Item 2. Properties
The Company’s primary east coast manufacturing facility is located in Pennsauken, New Jersey in a 70,000 square foot building on a two-acre lot. Soft pretzels are manufactured at this Company-owned facility which also serves as the Company’s corporate headquarters. This facility operates at approximately 65%55% of capacity. The Company owns a 128,000 square foot building adjacent to this manufacturing facility which contains a large freezer for warehousing and distribution purposes. The warehouse has a utilization rate of 80-90% depending on product demand. The Company leases, through January 2022, 16,000 square feet of office and warehouse space located next to the Pennsauken, New Jersey plant and owns a 43,000 square foot office and warehouse building in the same complex.
The Company owns a 150,000 square foot building on eight acres in Bellmawr, New Jersey. The facility is used by the Company to manufacture some of its products including funnel cake, pretzels and churros. The facility operates at about 70% of capacity.
The Company’s primary west coast manufacturing facility is located in Vernon (Los Angeles), California. It consists of a 137,000 square foot facility in which soft pretzels, churros and various lines of baked goods are produced and warehoused. Included in the 137,000 square foot facility is a 30,000 square foot freezer used for warehousing and distribution purposes which was constructed in 1996.purposes. The facility is leased through November 2030. The Company leases an additional 80,000 square feet of office and warehouse space, adjacent to its manufacturing facility, through November 2030. The manufacturing facility operates at approximately 45%50% of capacity.
The Company leases a 22,000 square foot soft pretzel manufacturing facility located in Brooklyn, New York. The lease runs through September 2016. The facility operates at about 60% of capacity.
The Company leases through June 2015 a 45,000 square foot churros manufacturing facility located in Colton, California which operates at approximately 75%55% of capacity.
The Company leases an 85,000 square foot bakery manufacturing facility located in Atlanta, Georgia. The lease runs through December 2020. The facility operates at about 50% of capacity.
The Company owns a 46,000 square foot frozen juice treat and dessert manufacturing facility and a 42,000 square foot dry storage warehouse located on six acres in Scranton, Pennsylvania. The manufacturing facility operates at approximately 65% of capacity.
The Company leases a 29,600 square foot soft pretzel manufacturing facility located in Hatfield, Pennsylvania.
The Company leases a 48,000 square foot soft pretzel manufacturing facility located in Carrollton, Texas. The lease runs through April 2019. The facility operates at approximately 70% offull capacity. The Company leases an additional property containing a 6,500 square foot storage freezer across the street from the manufacturing facility, which lease expires May 2016.
The Company leases an 18,000 square foot soft pretzel manufacturing facility located in Chambersburg, Pennsylvania. The lease runs through September 2013 with options to extend the term.2016. The facility operates at approximately 60%30% of capacity.
The Company’s fresh bakery products manufacturing facility and offices are located in Bridgeport, New Jersey
The Company owns a 165,000 square foot fig and fruit bar manufacturing facility located on 9-1/2 acres in Moscow Mills (St. Louis), Missouri. The facility operates at about 50%55% of capacity.
The Company leases a building in Pensacola, Florida for the manufacturing, packing and warehousing of dumplings. The building is approximately 14,000 square feet and the lease runs through December 2013.2017. The manufacturing facility operates at approximately 75% of capacity.
The Company owns an 84,000 square foot handheld products manufacturing facility in Holly Ridge, North Carolina which operates at about 40% of capacity.
The Company leases a 70,000 square foot handheld products manufacturing facility in Weston, Oregon which operates at about 35%75% of capacity. The facility is leased through May 13, 2021.
The Company leases a 39,000 square foot frozen juice treat and dessert manufacturing facility in Tampa, Florida which operates at about 70% of capacity. The facility is leased through August 2016.
The Company also leases approximately 142140 warehouse and distribution facilities in 44 states, Mexico and Canada.
Item 3. Legal Proceedings
The Company has no material pending legal proceedings, other than ordinary routine litigation incidental to the business, to which the Company or any of its subsidiaries is a party or of which any of their property is subject.
Item 4. Mine Safety Disclosures
Not Applicable
PART II
Item 5. Market For Registrant’s Common Equity, Related Stockholder Matters And Issuer Purchases Of EquitySecurities
The Company’s common stock is traded on the NASDAQ Global Select Market under the symbol “JJSF.” The following table sets forth the high and low sale price quotations as reported by NASDAQ and dividend information for the common stock for each quarter of the years ended September 24, 201128, 2013 and September 29, 2012.
| High | Low | Dividend Declared | ||||||||||
| Fiscal 2011 | ||||||||||||
| First quarter | $ | 49.88 | $ | 41.27 | $ | 0.1175 | ||||||
| Second quarter | 50.25 | 41.91 | 0.1175 | |||||||||
| Third quarter | 53.44 | 45.55 | 0.1175 | |||||||||
| Fourth quarter | 55.58 | 43.25 | 0.1175 | |||||||||
| Fiscal 2012 | ||||||||||||
| First quarter | $ | 54.53 | $ | 45.12 | $ | 0.1300 | ||||||
| Second quarter | 54.17 | 46.73 | 0.1300 | |||||||||
| Third quarter | 58.15 | 48.57 | 0.1300 | |||||||||
| Fourth quarter | 59.80 | 51.91 | 0.1300 | |||||||||
Common Stock Market Price | ||||||||||||
Dividend | ||||||||||||
High | Low | Declared | ||||||||||
Fiscal 2013 | ||||||||||||
First quarter | $ | 65.60 | $ | 55.96 | $ | 0.1600 | ||||||
Second quarter | 77.33 | 61.52 | 0.1600 | |||||||||
Third quarter | 80.85 | 72.80 | 0.1600 | |||||||||
Fourth quarter | 84.48 | 74.63 | 0.1600 | |||||||||
Fiscal 2014 | ||||||||||||
First quarter | $ | 90.79 | $ | 78.13 | $ | 0.3200 | ||||||
Second quarter | 97.80 | 84.30 | 0.3200 | |||||||||
Third quarter | 100.00 | 90.25 | 0.3200 | |||||||||
Fourth quarter | 97.50 | 88.95 | 0.3200 | |||||||||
As of October 26, 2012, there were 6,755September 27, 2014, we had approximately 12,000 beneficial shareholders.
In our fiscal year ended September 29,27, 2014, we purchased and retired 81,685 shares of our common stock at a cost of $7,504,729. In our third quarter, we purchased and retired 64,041 shares at a cost of $5,903,157. In our fourth quarter, we purchased and retired 17,644 shares at a cost of $1,601,572.
In our fiscal year ended September 28, 2013, we purchased and retired 204,397 shares of our common stock at a cost of $14,500,215.
In our fiscal year ended September 28, 2012, we purchased and retired 142,038 shares of our common stock at a cost of $8,167,125. All of the shares were purchased in the fourth quarter. Subsequent to September 29, 2012 and through October 31, 2012, we purchased and retired 48,255 shares of our common stock at a cost of $2,762,602.
On November 8, 2012 the Company’s Board of directors authorized the purchase and retirement of an additional 500,000 shares of the Company’s common stock.stock; 262,173 shares remain to be purchased under that authorization.
For information on the Company’s Equity Compensation Plans, please see Item 12 herein.
Stock Performance Graph

The selected financial data for the last five years was derived from our audited consolidated financial statements. The following selected financial data should be read in conjunction with “Management’s Discussion and Analysis of Financial Condition and Results of Operations” and our consolidated financial statements and related notes thereto, especially as the information pertains to fiscal 2010, 20112012, 2013 and 2012.
| Fiscal year ended in September (In thousands except per share data) | ||||||||||||||||||||
| 2012 | 2011 | 2010 | 2009 | 2008 | ||||||||||||||||
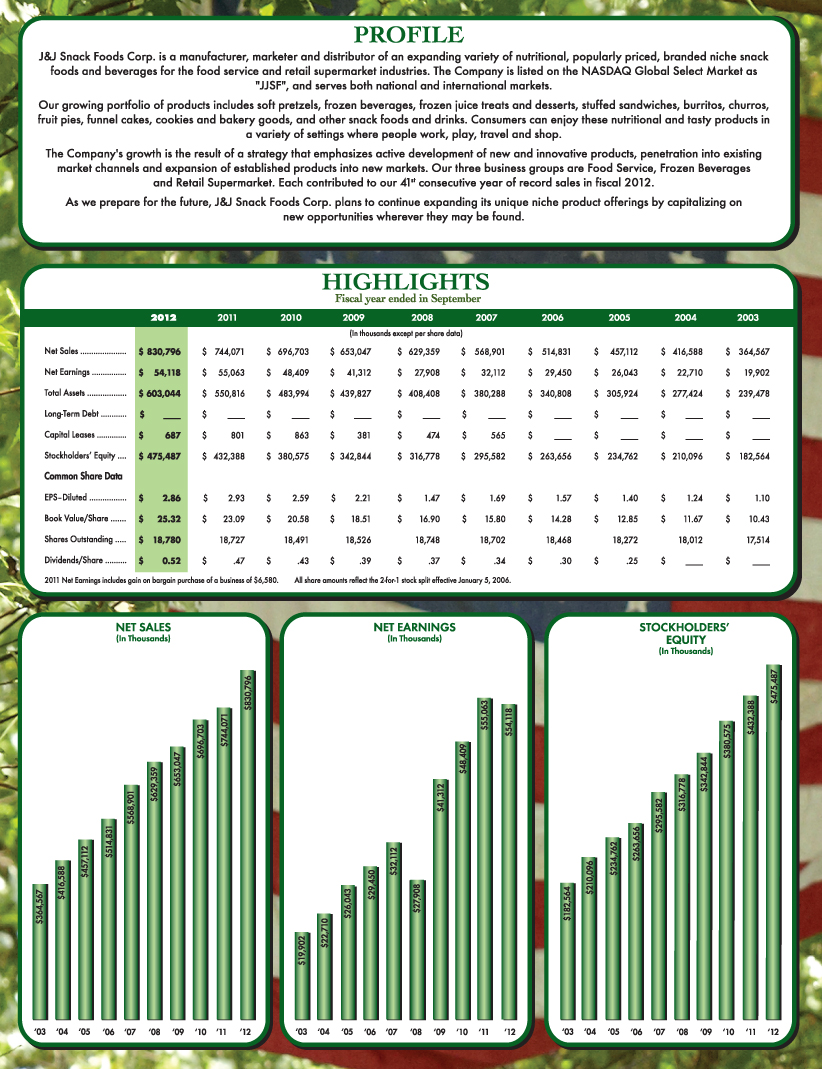
| Net Sales | $ | 830,796 | $ | 744,071 | $ | 696,703 | $ | 653,047 | $ | 629,359 | ||||||||||
| Net Earnings | $ | 54,118 | $ | 55,063 | $ | 48,409 | $ | 41,312 | $ | 27,908 | ||||||||||
| Total Assets | $ | 603,044 | $ | 550,816 | $ | 483,994 | $ | 439,827 | $ | 408,408 | ||||||||||
| Long-Term Debt | $ | - | $ | - | $ | - | $ | - | $ | - | ||||||||||
| Capital Lease Obligations | $ | 687 | $ | 801 | $ | 863 | $ | 381 | $ | 474 | ||||||||||
| Stockholders' Equity | $ | 475,487 | $ | 432,388 | $ | 380,575 | $ | 342,844 | $ | 316,778 | ||||||||||
| Common Share Data | ||||||||||||||||||||
| Earnings Per Diluted Share | $ | 2.86 | $ | 2.93 | $ | 2.59 | $ | 2.21 | $ | 1.47 | ||||||||||
| Earnings Per Basic Share | $ | 2.87 | $ | 2.95 | $ | 2.61 | $ | 2.23 | $ | 1.49 | ||||||||||
| Book Value Per Share | $ | 25.32 | $ | 23.09 | $ | 20.58 | $ | 18.51 | $ | 16.90 | ||||||||||
| Common Shares Outstanding At Year End | 18,780 | 18,727 | 18,491 | 18,526 | 18,748 | |||||||||||||||
| Cash Dividends Declared Per Common Share | $ | 0.52 | $ | 0.47 | $ | 0.43 | $ | 0.39 | $ | 0.37 | ||||||||||
| Fiscal year ended in September | ||||||||||||||||||||
| (In thousands except per share data) | ||||||||||||||||||||
2014 | 2013 | 2012 | 2011 | 2010 | ||||||||||||||||
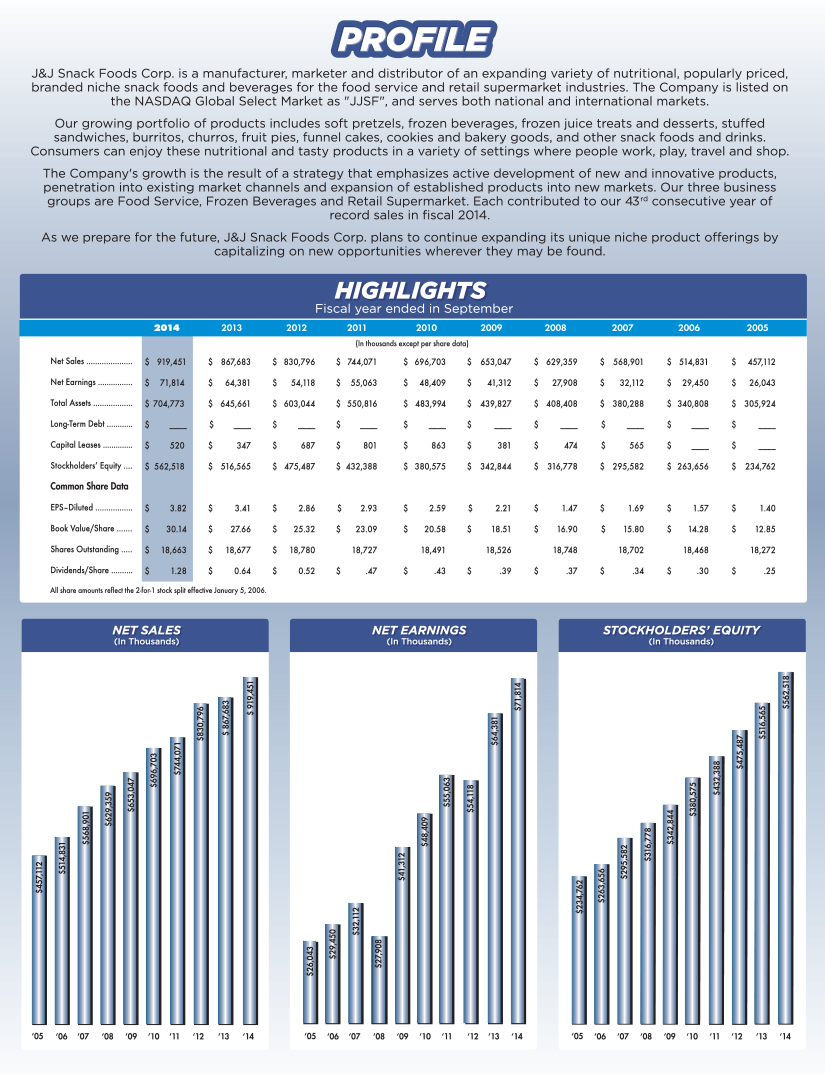
Net Sales | $ | 919,451 | $ | 867,683 | $ | 830,796 | $ | 744,071 | $ | 696,703 | ||||||||||
Net Earnings | $ | 71,814 | $ | 64,381 | $ | 54,118 | $ | 55,063 | $ | 48,409 | ||||||||||
Total Assets | $ | 704,773 | $ | 645,661 | $ | 603,044 | $ | 550,816 | $ | 483,994 | ||||||||||
Long-Term Debt | $ | - | $ | - | $ | - | $ | - | $ | - | ||||||||||
Capital Lease Obligations | $ | 520 | $ | 347 | $ | 687 | $ | 801 | $ | 863 | ||||||||||
Stockholders' Equity | $ | 562,518 | $ | 516,565 | $ | 475,487 | $ | 432,388 | $ | 380,575 | ||||||||||
Common Share Data | ||||||||||||||||||||
Earnings Per Diluted Share | $ | 3.82 | $ | 3.41 | $ | 2.86 | $ | 2.93 | $ | 2.59 | ||||||||||
Earnings Per Basic Share | $ | 3.85 | $ | 3.43 | $ | 2.87 | $ | 2.95 | $ | 2.61 | ||||||||||
Book Value Per Share | $ | 30.14 | $ | 27.66 | $ | 25.32 | $ | 23.09 | $ | 20.58 | ||||||||||
Common Shares Outstanding At Year End | 18,663 | 18,677 | 18,780 | 18,727 | 18,491 | |||||||||||||||
Cash Dividends Declared Per Common Share | $ | 1.28 | $ | 0.64 | $ | 0.52 | $ | 0.47 | $ | 0.43 | ||||||||||
Item 7. Management’s Discussion And Analysis Of Financial Condition And Results Of Operations
In addition to historical information, this document and analysis contains forward-looking statements. The forward-looking statements contained herein are subject to certain risks and uncertainties that could cause actual results to differ materially from those projected in the forward-looking statements. Important factors that might cause such a difference include, but are not limited to, those discussed in the “Management’s Discussion and Analysis of Financial Condition and Results of Operations.” Readers are cautioned not to place undue reliance on these forward-looking statements, which reflect management’s analysis only as of the date hereof. We undertake no obligation to publicly revise or update these forward-looking statements to reflect events or circumstances that arise after the date hereof.
Critical Accounting Policies, Judgments and Estimates
We prepare our financial statements in conformity with accounting principles generally accepted in the United States of America. The preparation of such financial statements requires management to make estimates and assumptions that affect the reported amounts of assets and liabilities and disclosures of contingent assets and liabilities at the date of those financial statements and the reported amounts of revenues and expenses during the reporting period. Actual results could differ from those estimates.
The Company discloses its significant accounting policies in the accompanying notes to its audited consolidated financial statements.
Judgments and estimates of uncertainties are required in applying the Company’s accounting policies in certain areas. Following are some of the areas requiring significant judgments and estimates: revenue recognition, accounts receivable, cash flow and valuation assumptions in performing asset impairment tests of long-lived and intangible assets, estimates of the value and useful lives of intangible assets and insurance reserves.
There are numerous critical assumptions that may influence accounting estimates in these and other areas. We base our critical assumptions on historical experience, third-party data and various other estimates we believe to be reasonable. A description of the aforementioned policies follows:
Revenue Recognition - We recognize revenue from our products when the products are shipped to our customers. Repair and maintenance equipment service revenue is recorded when it is performed provided the customer terms are that the customer is to be charged on a time and material basis or on a straight-line basis over the term of the contract when the customer has signed a service contract. Revenue is recognized only where persuasive evidence of an arrangement exists, our price is fixed or estimable and collectability is reasonably assured. We record offsets to revenue for allowances, end-user pricing adjustments, trade spending, coupon redemption costs and returned product. Customers generally do not have the right to return product unless it is damaged or defective. Off-invoice allowances are deducted directly from the amount invoiced to our customer when our products are shipped to the customer. Offsets to revenue for allowances, end-user pricing adjustments and trade spending are recorded primarily as a reduction of accounts receivable based on our estimates of liability which are based on customer programs and historical experience. These offsets to revenue are based primarily on the quantity of product purchased over specific time periods. For our Retail Supermarket and Frozen Beverages segments, we accrue for the liability based on products sold multiplied by per product offsets. Offsets to revenue for our Food Service segment are calculated in a similar manner for offsets owed to our direct customers; however, because shipments to end-users are unknown to us until reported by our direct customers or by the end-users, there is a greater degree of uncertainty as to the accuracy of the amounts accrued for end-user offsets. Additional uncertainty may occur as customers take deductions when they make payments to us. This creates complexities because our customers do not always provide reasons for the deductions taken. Additionally, customers may take deductions to which they are not entitled and the length of time customers take deductions to which they are entitled can vary from two weeks to well over a year. Because of the aforementioned uncertainties, the process to determine these estimates requires judgment. We feel that due to constant monitoring of the process, including but not limited to comparing actual results to estimates made on a monthly basis, these estimates are reasonable in all material respects. Our recorded liability for allowances, end-user pricing adjustments and trade spending was approximately $12$11.5 million at both September 29, 201227, 2014 and $10 million at September 24, 2011.28, 2013.
Accounts Receivable - We record accounts receivable at the time revenue is recognized. Bad debt expense is recorded in marketing and administrative expenses. The amount of the allowance for doubtful accounts is based on our estimate of the accounts receivable amount that is uncollectable. It is comprised of a general reserve based on historical experience and amounts for specific customers’ accounts receivable balances that we believe are at risk due to our knowledge of facts regarding the customer(s). We continually monitor our estimate of the allowance for doubtful accounts and adjust it monthly. We usually have approximately 1015 customers with accounts receivable balances of between $1 million to $10 million. Failure of these customers, and others with lesser balances, to pay us the amounts owed, could have a material impact on our consolidated financial statements.
Accounts receivable due from any of our customers is subject to risk. Our total bad debt expense was $276,000, $423,000$161,000 and $493,000$276, 000 for the fiscal years 2014 and 2012, 2011 and 2010, respectively. We had a credit to expense of $70,000 in fiscal year 2013. At September 29, 201227, 2014 and September 24, 2011,28, 2013, our accounts receivables were $76,414,000$99,972,000 and $75,000,000$87,545,000 net of an allowance for doubtful accounts of $685,000$450,000 and $653,000.
Asset Impairment – We have three reporting units with goodwill totaling $76,899,000$86,442,000 as of September 29, 2012.27, 2014. Goodwill is evaluated annually by the Company for impairment. We perform impairment tests for our reporting units, which is also the operating segment level, with recorded goodwill utilizing primarily the discounted cash flow method. This methodology used to estimate the fair value of the total Company and its reporting units requires inputs and assumptions (i.e. revenue growth, operating profit margins, capital spending requirements and discount rates) that reflect current market conditions. The estimated fair value of each reporting unit is compared to the carrying value of the reporting unit. If the carrying value of the reporting unit exceeds its fair value, the goodwill of the reporting unit is potentially impaired, and the Company then determines the implied fair value of goodwill, which is compared to the carrying value of goodwill to determine if impairment exists. Our tests at September 29, 201227, 2014 show that the fair value of each of our reporting units with goodwill exceeded its carrying value. Therefore no further analysis was required. The inputs and assumptions used involve considerable management judgment and are based upon assumptions about expected future operating performance. Assumptions used in these forecasts are consistent with internal planning. The actual performance of the reporting units could differ from management’s estimates due to changes in business conditions, operating performance, economic conditions, competition and consumer preferences.
Licenses and rights, customer relationships and non compete agreements are being amortized by the straight-line method over periods ranging from 3 to 20 years and amortization expense is reflected throughout operating expenses. Long-lived assets, including fixed assets and amortizing intangibles, are reviewed for impairment as events or changes in circumstances occur indicating that the carrying amount of theofthe asset may not be recoverable. Indefinite lived intangibles are reviewed annually for impairment. Cash flow and sales analyses are used to assess impairment. The estimates of future cash flows and sales involve considerable management judgment and are based upon assumptions about expected future operating performance. Assumptions used in these forecasts are consistent with internal planning. The actual cash flows and sales could differ from management’s estimates due to changes in business conditions, operating performance, economic conditions, competition and consumer preferences.
Useful Lives of Intangible Assets - Most of our trade names which have carrying value have been assigned an indefinite life and are not amortized because we plan to receive the benefit from them indefinitely. If we decide to curtail or eliminate the use of any of the trade names or if sales that are generated from any particular trade name do not support the carrying value of the trade name, then we would record impairment or assign an estimated useful life and amortize over the remaining useful life. Rights such as prepaid licenses and non compete agreements are amortized over contractual periods. The useful lives of customer relationships are based on the discounted cash flows expected to be received from sales to the customers adjusted for an attrition rate. The loss of a major customer or declining sales in general could create an impairment charge.
Insurance Reserves - We have a self-insured medical plan which covers approximately 1,3001,400 of our employees. We record a liability for incurred but not yet reported or paid claims based on our historical experience of claims payments and a calculated lag time period. We maintain a spreadsheet that includes claims payments made each month according to the date the claim was incurred. This enables us to have an historical record of claims incurred but not yet paid at any point in the past. We then compare our accrued liability to the more recent claims incurred but not yet paid amounts and adjust our recorded liability up or down accordingly. Our recorded liability at September 29, 201227, 2014 and September 24, 201128, 2013 was $1,332,000$1,853,000 and $1,427,000,$1,516,000, respectively. Considering that we have stop loss coverage of $200,000 for each individual plan subscriber, the general consistency of claims payments and the short time lag, we believe that there is not a material exposure for this liability. Because of the foregoing, we do not engage a third party actuary to assist in this analysis.
We self-insure, up to loss limits, worker’s compensation and automobile liability claims. Accruals for claims under our self-insurance program are recorded on a claims-incurred basis. Under this program, the estimated liability for claims incurred but unpaid in fiscal years 20122014 and 20112013 was $1,800,000$2,700,000 and $1,100,000,$3,200,000, respectively. Our total recorded liability for all years’ claims incurred but not yet paid was $6,200,000$8,100,000 and $5,700,000$8,500,000 at September 29, 201227, 2014 and September 24, 2011,28, 2013, respectively. We estimate the liability based on total incurred claims and paid claims adjusting for loss development factors which account for the development of open claims over time. We estimate the amounts we expect to pay for some insurance years by multiplying incurred losses by a loss development factor which is based on insurance industry averages and the age of the incurred claims; our estimated liability is then the differencethedifference between the amounts we expect to pay and the amounts we have already paid for those years. Loss development factors that we use range from 1.0 to 2.0. However, for some years, the estimated liability is the difference between the amounts we have already paid for that year and the maximum we could pay under the program in effect for that particular year because the calculated amount we expect to pay is higher than the maximum. For other years, where there are few claims open, the estimated liability we record is the amount the insurance company has reserved for those claims. We evaluate our estimated liability on a continuing basis and adjust it accordingly. Due to the multi-year length of these insurance programs, there is exposure to claims coming in lower or higher than anticipated; however, due to constant monitoring and stop loss coverage of $350,000 on individual claims, we believe our exposure is not material. Because of the foregoing, we do not engage a third party actuary to assist in this analysis. In connection with these self-insurance agreements, we customarily enter into letters of credit arrangements with our insurers. At each of September 29, 201227, 2014 and September 24, 2011,28, 2013, we had outstanding letters of credit totaling $8,175,000.
Refer to Note A to the accompanying consolidated financial statements for additional information on our accounting policies.
RESULTS OF OPERATIONS
Fiscal 2012 (532014 (52 weeks) Compared to Fiscal 20112013 (52 weeks)
Net sales increased $86,725,000,$51,768,000, or 12%6%, to $830,796,000$919,451,000 in fiscal 20122014 from $744,071,000$867,683,000 in fiscal 2011. Excluding sales from the extra week in 2012, sales increased approximately 10% from 2011 to 2012.
Excluding sales from the acquisitionsacquisition of the frozen handheld business of ConAgra FoodsNew York Pretzel in October 2013 and PHILLY SWIRL in May 2011 and Kim & Scott’s Gourmet Pretzels in June 2012 in the twelve months post acquisitions and the extra week in 2012,2014, sales increased approximately 5%4% for the year.year.
We have three reportable segments, as disclosed in the accompanying notes to the consolidated financial statements: Food Service, Retail Supermarkets and Frozen Beverages.
The Chief Operating Decision Maker for Food Service and Retail Supermarkets and the Chief Operating Decision Maker for Frozen Beverages monthly review detailed operating income statements and sales reports in order to assess performance and allocate resources to each individual segment. Sales is considered to be the one and only key variable monitored by the Chief Operating Decision Makers and management when determining each segment’s and the company’s financial condition and operating performance. In addition, the Chief Operating Decision Makers review and evaluate depreciation, capital spending and assets of each segment on a quarterly basis to monitor cash flow and asset needs of each segment.
FOOD SERVICE
Sales to food service customers increased $57,700,000$31,139,000 or 12%6%, to $521,262,000$591,898,000 in fiscal 2012.2014. Excluding New York Pretzel sales, from the extra week in 2012, sales increased approximately 10% from 2011 to 2012. Excluding handhelds and Kim & Scott’s sales in the twelve months post acquisitions and the extra week in 2012, sales increased approximately 6%5% for the year. Soft pretzel sales to the food service market increased 14% to $118,014,000$164,680,000 for the year aided by increased sales to restaurant chains, warehouse club stores, school food service and throughout our customer base. Increased sales to one customer accounted for approximately 25%1/4 of the pretzel sales increase. Excluding Kim & Scott’sNew York Pretzel sales, food service soft pretzel sales increased 12%11% for the year. Frozen juice bar and ices sales increased $4,073,000$5,057,000 or 8%10%, to $53,813,000$53,888,000 for the year primarily as the result of higher sales to warehouse club stores, school food service accounts and throughout our customer base. Increased sales to one customer accounted for about 85%approximately 50% of the frozen juicesjuice bar and ices sales increase. Churro sales to food service customers increased 11% to $45,974,000 in 2012 with sales increasing generally throughout our customer base,were essentially unchanged at $55,929,000 for the year with sales to international customers accountingone restaurant chain down $4,063,000 for about 1/3 of the year. Excluding the decrease in sales increase.to that restaurant chain, which were $6.8 million for the year and to which we expect no sales in 2015, sales were up $3.9 million, or 9%. Sales of bakery products increased $24,904,000,$6,773,000, or 10%2%, for the year as sales increases and decreases were spread throughout our customer base. Handheld sales to food service customers were $27,818,000down 8% to $24,248,000 in 2012. Funnel cake and related funnel cake product sales decreased by $8,564,000 to $8,033,000 with lower sales to three2014 as two customers accountingaccounted for all of the decrease.decrease in sales. Sales of new products in the first twelve months since their introduction were approximately $15.2$10 million for the year. Price increases accounted for approximately $16.1$7 million of sales for the year and net volume increases, including new product sales as defined above and sales resulting from the acquisitionsacquisition of Kim & Scott’s and the handheld business,New York Pretzel, accounted for approximately $41.6$24 million of sales for the year. Operating income in our Food Service segment increased from $46,171,000$65,907,000 in 20112013 to $49,770,000$73,731,000 in 2012 primarily as a result of2014. Operating income benefited from increased sales volume, and price increases which offset higherand lower ingredient and packaging costcosts. Additionally, liability insurance costs were about $1.5 million lower this year; last year’s costs were higher than usual because of increases in insurance company estimates for actual claims incurred but not paid. Operating income was impacted in 2014 by $913,000 of about $9 million and the negative impactshutdown costs of the sharp decline in funnel cake sales.
RETAIL SUPERMARKETS
Sales of products to retail supermarkets increased $18,769,000$10,305,000 or 21%10% to $109,868,000$112,644,000 in fiscal year 2012.2014. Excluding PHILLY SWIRL sales, from the extra week in 2012, sales increased approximately 18% from 2011 to 2012. Excluding handheld sales and Kim & Scott’s sales in the twelve months post acquisitions and the extra week in 2012, sales increaseddecreased approximately 2% for the year. Soft pretzel sales to retail supermarkets were $33,842,000$34,830,000 compared to $32,044,000$34,597,000 in 20112013 on a unit volume increase of 2%1%. Sales of frozen juices and ices increased $1,733,000$11,327,000 or 3%24% to $53,673,000$59,404,000. Without PHILLY SWIRL sales, sales of frozen juices and ices were down $1,967,000, or 4%, on flat volume.volume with sales increases and decreases spread across our customer base. Coupon redemption costs, a reduction of sales, decreased 16%increased 3% or about $635,000$126,000 for the year. Handheld sales to retail supermarket customers were $24,358,000decreased 5% to $21,354,000 in 2012.2014 as two customers accounted for all of the decrease in sales. Sales of products in the first twelve months since their introduction were approximately $7.0 million$700,000 in fiscal year 2012.2014. Price increases accounted for approximately $3.7$1.2 million of sales for the year and net volume increases, including new product sales as defined above and handheld sales and Kim & Scott’sPHILLY SWIRL’s sales and net of decreasedincreased coupon costs, accounted for approximately $15.0$9 million ofin sales for the year. Operating income in our Retail Supermarkets segment increased from $11,830,000$8,594,000 in 20112013 to $13,316,000$11,201,000 in 20122014 due primarily due to operating income generated by handheld saleslower trade spending, manufacturing cost savings and lower coupon expense.
FROZEN BEVERAGES
Frozen beverage and related product sales increased 5% to $199,666,000$214,909,000 in fiscal 2012. Excluding sales from the extra week in 2012, sales increased approximately 4% from 2011 to 2012.2014. Beverage sales alone increased 2%1% to $135,436,000$133,283,000 for the year with increases and decreases throughout our customer base. Domestic gallonGallon sales were flatdown 1% in our base ICEE business.business, but excluding significant decreases at three customers, gallon sales were up 3%. Service revenue increased 15%13% to $49,115,000$59,805,000 for the year with increases and decreases spread across our customer base.two customers accounting for the entire increase. Sales of beverage machines, which tend to fluctuate from year to year while following no specific trend, increased from $11,362,000$17,376,000 in 20112013 to $13,136,000$20,224,000 in 2012.2014. The estimated number of Company owned frozen beverage dispensers was 42,50048,000 and 40,80044,700 at September 29, 201227, 2014 and September 24, 2011,28, 2013, respectively. Operating income in our Frozen Beverage segment increaseddecreased from $18,582,000$22,903,000 in 20112013 to $21,881,000$21,916,000 in 20122014 as a result of increaseddecreased gallon sales as discussed above and controlled expenses. Higher gasolinehigher than usual group medical and insurance liability costs of approximately $900,000 impacted the year’s operating income.
CONSOLIDATED
Other than as commented upon above by segment, there are no material specific reasons for the reported sales increases or decreases. Sales levels can be impacted by the appeal of our products to our customers and consumers and their changing tastes, competitive and pricing pressures, sales execution, marketing programs, seasonal weather, customer stability and general economic conditions.
Gross profit as a percentage of sales decreasedincreased to 30.11%31.28% in 20122014 from 30.88%30.35% in 2011. Higher ingredient2013 primarily due to higher volume in our food service segment, lower trade spending and packagingmanufacturing cost savings in our retail supermarkets segment and lower ingredients costs. Additionally, this year benefited from lower liability insurance costs of about $1.5 million compared to last year of approximately $10 millionyear.
Total operating expenses increased $14,831,000 to $180,729,000 in fiscal 2014 and the lower gross profit margin of handheld sales were primarily responsible for the decreased gross profit percentage. Without this handhelds impact, gross profit as a percentage of sales would have been roughly the same for 2011 and 2012. Ingredient and packaging costs can be extremely volatile and may be significantly different from what we are presently expecting and therefore we cannot project the impact of ingredient and packaging costs on our business going forward; however, there has been a very significant increase in the market cost of flour and packaging as well as other lesser used ingredients over the past six months which we anticipate will result in higher costs over some portions of our fiscal year 2013.
Operating income increased $8,384,000$9,444,000 or 11%10% to $84,967,000$106,848,000 in fiscal year 20122014 as a result of the aforementioned items.
Investment income increased by $351,000$981,000 to $1,392,000$4,473,000 due to increased investments in marketable securities.
The effective income tax rate increased 2.78 percentage pointsdecreased to 37%35.4% from 35%36.1% last year. Adjusting outyear because actual liability for last year’s taxes was less than estimated due to lower effective state tax rates and higher domestic production activities deduction and the effect of the gain on bargain purchase of a business,estimate for this year’s taxes was lowered accordingly. We expect the effective income tax rate in 2011 was 37%for 2015 to be between 36% and 36.5%.
Net earnings decreased $945,000increased $7,433,000 or 2%12%, in fiscal 20122014 to $54,118,000,$71,814,000, or $2.86$3.82 per diluted share as a result of the aforementioned items. Without the benefit of the gain on bargain purchase of a business in 2011, net earnings were $48,483,000 in 2011 compared to $54,118,000 this year.
There are many factors which can impact our net earnings from year to year and in the long run, among which are the supply and cost of raw materials and labor, insurance costs, factors impacting sales as noted above, the continuing consolidation of our customers, our ability to manage our manufacturing, marketing and distribution activities, our ability to make and integrate acquisitions and changes in tax laws and interest rates.
RESULTS OF OPERATIONS
Fiscal 20112013 (52 weeks) Compared to Fiscal 2010 (522012 (53 weeks)
Net sales increased $47,368,000,$36,887,000, or 7%4%, to $744,071,000$867,683,000 in fiscal 20112013 from $696,703,000$830,796,000 in fiscal 2010.
Excluding sales from the acquisition of Parrot Ice in February 2010, California ChurrosKim & Scott’s Gourmet Pretzels in June 20102012 in the twelve months post acquisition and the frozen handheld business of ConAgra Foodsextra week in May 2011,2012, sales increased 3%approximately 6% for the year.year.
We have three reportable segments, as disclosed in the accompanying notes to the consolidated financial statements: Food Service, Retail Supermarkets and Frozen Beverages.
The Chief Operating Decision Maker for Food Service and Retail Supermarkets and the Chief Operating Decision Maker for Frozen Beverages monthly review detailed operating income statements and sales reports in order to assess performance and allocate resources to each individual segment. Sales is considered to be the one and only key variable monitored by the Chief Operating Decision Makers and management when determining each segment’s and the company’s financial condition and operating performance. In addition, the Chief Operating Decision Makers review and evaluate depreciation, capital spending and assets of each segment on a quarterly basis to monitor cash flow and asset needs of each segment.
FOOD SERVICE
Sales to food service customers increased $25,756,000$39,497,000 or 6%8%, to $463,562,000$560,759,000 in fiscal 2011.2013. Excluding sales from the acquisition of California Churros and handheld sales, food serviceextra week in 2012, sales increased 2%approximately 10% from 2012 to 2013. Excluding Kim & Scott’s sales in the twelve months post acquisition and the extra week in 2012, sales increased approximately 9% for the year. Soft pretzel sales to the food service market increased 3%23% to $103,943,000$145,026,000 for the year aided by increased sales to restaurant chains, inwarehouse club stores and throughout our customer base. Increased sales to two customers accounted for approximately 1/3 of the fourth quarter.pretzel sales increase. Excluding Kim & Scott’s sales, food service soft pretzel sales increased 20% for the year. Frozen juice bar and ices sales increased $2,467,000decreased $4,982,000 or 5%9%, to $49,740,000$48,831,000 for the year primarily as the result of higherlower sales to warehouse club stores due we believe to weather and school food service accounts.accounts due to changes in USDA school food programs. We believe the impact of the changes in the USDA school food programs on our frozen juice and ices sales has bottomed out. Churro sales to food service customers increased 31%22% to $41,583,000$56,099,000 in 2011. Without2013 with sales from California Churros, churroto one restaurant chain accounting for all of the sales for the year would have been up about 2%.increase. Sales of bakery products excluding biscuit and dumpling sales and fruit and fig bar sales, increased $9,190,000,$8,591,000, or 5%3%, for the year due primarily to increasedas sales to private label customersincreases and to school food service. Biscuit and dumpling sales increased 4% to $34,774,000. Sales of fig and fruit bars decreased 11% to $28,363,000 due primarily to lower sales acrossdecreases were spread throughout our customer base resulting from decreased demand.base. Handheld sales to food service customers were $8,865,000down 5% to $26,488,000 in 2011. Funnel cake and related funnel cake product sales decreased by $6,207,000 to $16,597,000 with sales to one customer down $9,570,000 or 75%.2013 as two customers accounted for all of the decrease in sales. Sales of new products in the first twelve months since their introduction were approximately $12.5$11.2 million for the year. Price increases accounted for approximately $10.5$11.6 million of sales for the year and net volume increases, including new product sales as defined above and sales resulting from the acquisitionsacquisition of California Churros and handheld sales,Kim & Scott’s, accounted for approximately $15.3$27.9 million of sales for the year. Operating income in our Food Service segment decreasedincreased from $50,220,000$49,770,000 in 20102012 to $46,171,000$65,907,000 in 2011 primarily as a result of higher ingredients2013. Operating income benefited from increased sales volume, price increases and lower ingredient and packaging costs of about $16approximately $2 million. Operating income was impacted by a product write down of $500,000 and by a $2.1 million increase in liability insurance expense from last year. The increase in insurance expense is due to an increase in claims and increased freight and distribution costs caused by higher freight rates and the integration of the handhelds business, which were partially offset by the benefit of higher pricing.
RETAIL SUPERMARKETS
Sales of products to retail supermarkets increased $14,980,000decreased $7,529,000 or 20%7% to $91,099,000$102,339,000 in fiscal year 2011.2013. Excluding handheld sales from the extra week in 2012, sales increased 7%decreased approximately 5% from 2012 to 2013. Excluding Kim & Scott’s sales in the twelve months post acquisition and the extra week in 2012, sales decreased approximately 5% for the year. Soft pretzel sales to retail supermarkets were $32,044,000$34,597,000 compared to $30,463,000$33,842,000 in 20102012 on a unit volume increase of 2%. Sales of frozen juices and ices increased $3,652,000decreased $5,596,000 or 8%10% to $51,940,000$48,077,000 on a unit volume increasedecrease of about 9%. Frozen juices and ices sales were impacted by cold weather throughout the second half of the year. Coupon redemption costs, a reduction of sales, increased 13%14% or about $458,000$459,000 for the year. Handheld sales to retail supermarket customers were $9,424,000decreased 8% to $22,528,000 in 2011.2013 as two customers accounted for all of the decrease in sales. Sales of products in the first twelve months since their introduction were approximately $4.5$1.4 million in fiscal year 2011.2013. Price increases accounted for approximately $3.1$2.9 million of sales for the year and net volume increases,decreases, including new product sales as defined above and handheldKim & Scott’s sales and net of decreasedincreased coupon costs, accounted forreduced sales by approximately $12.0$10.4 million of sales for the year. Operating income in our Retail Supermarkets segment decreased from $13,316,000 in 2012 to $8,594,000 in 2013 with 84% of the decrease, or $3,982,000, coming in the fourth quarter. The fourth quarter was impacted by sharply lower sales of frozen juices and ices, which were down 26%, and by increased from $11,281,000 in 2010trade spending needed to $11,830,000 in 2011. Operating income benefited by lower advertising expensegenerate those sales. We believe that the impact of approximately $800,000 and higher volume and pricing, whichcold weather on frozen novelties’ sales was partially offset by higher product costs related to ingredient and packaging cost increases.
FROZEN BEVERAGES
Frozen beverage and related product sales increased 4%2% to $189,410,000$204,585,000 in fiscal 2011.2013. Excluding sales from the extra week in 2012, sales increased approximately 4% from 2012 to 2013. Beverage sales alone increased 4%decreased 2% to $133,372,000$132,274,000 for the year with a 31% increase in sales in Mexico accounting for over 50% of the increase. Domestic gallonincreases and decreases throughout our customer base. Gallon sales were flatdown 4% in our base ICEE business. Service revenue increased 5%8% to $42,608,000$52,813,000 for the year with increases and decreases spread across our customer base. Sales of beverage machines, which tend to fluctuate from year to year while following no specific trend, decreasedincreased from $11,964,000$13,136,000 in 20102012 to $11,362,000$17,376,000 in 2011.2013. The estimated number of Company owned frozen beverage dispensers was 40,80044,700 and 38,60042,500 at September 24, 201128, 2013 and September 25, 2010,29, 2012, respectively. Operating income in our Frozen Beverage segment increased from $15,661,000$21,881,000 in 20102012 to $18,582,000$22,903,000 in 20112013 as a result of increased volumeservice revenue and machine sales as discussed above and controlled expenses. Higher gasoline costs of approximately $1.4 million impacted the year’s operating income.
CONSOLIDATED
Other than as commented upon above by segment, there are no material specific reasons for the reported sales increases or decreases. Sales levels can be impacted by the appeal of our products to our customers and consumers and their changing tastes, competitive and pricing pressures, sales execution, marketing programs, seasonal weather, customer stability and general economic conditions.
Gross profit as a percentage of sales decreasedincreased to 30.88%30.35% in 20112013 from 32.69%30.11% in 2010. Higher2012 primarily due to higher volume in our food service segment, and the margin also benefitted by lower ingredient and packaging costs of about $2.3 million. Gross profit was impacted by about $2.1 million of increased liability insurance expense compared to last year and a product write down of approximately $18 million and the mid single digit gross profit margin of handheld sales were primarily responsible for the decreased gross profit percentage.$500,000 related to a new product that was not successful. Ingredient and packaging costs can be extremely volatile and may be significantly different from what we are presently expecting and therefore we cannot project the impact of ingredient and packaging costs on our business going forward; however, there has been a very significant increase in the market cost of ingredient and packaging costs over the past eighteen months which we anticipate will result in higher costs over some portions of our fiscal year 2012. The impact of these higher costs and increased costs in operational areas may result in lower net earnings in 2012 than in 2011.
Total operating expenses increased $2,543,000$680,000 to $153,191,000$165,898,000 in fiscal 20112013 but as a percentage of sales decreased a full.77 percentage pointpoints to 21%19% of sales. Marketing expenses decreased .86.65 percentage points toand remained at 9% of sales becauseas a result of reduced advertisinghigher sales and lower expenses of which about $800,000 resulted from a management and sales meeting held in our retail supermarket segment and controlled spending elsewhere.2012 which did not reoccur in 2013. Distribution expenses increased .24 percentage points to 8%as a percent of sales due to higher fuel costs and freight rates.were 7.49% in both years. Administrative expenses decreased .18 percentage pointswere 3.16% and were 3%3.15% of sales in both years.2013 and 2012, respectively. Other general expenseincome of $524,000$651,000 this year compared to other general expense of $2,087,000$458,000 in 2010.2012. Included in other general income in 2013 is $805,000 of settlement income related to prior acquisitions. Included in other general expense in 20102012 is $1.6 million for an unclaimed property assessment and $577,000$404,000 of acquisition costs. Included in other general expense in 2011 is $546,000costs and costs of acquisition costs.
Operating income decreased $579,000increased $12,437,000 or 1%15% to $76,583,000$97,404,000 in fiscal year 20112013 as a result of the aforementioned items.
Investment income increased by $2,100,000 to $3,492,000 due to increased investments in marketable securities. We invested $80 million in the bargain purchase of a business of $6,580,000first quarter and $30 million in the third quarter resultedin mutual funds that seek current income with an emphasis on maintaining low volatility and overall moderate duration. We estimate the annual yield from the fair valuethese funds to approximate 3.5 – 3.75%. US Government Agency debt of the identifiable assets acquired$23.0 million held at September 29, 2012 which was yielding 2.0% was called in the handhelds acquisition exceeding the purchase price.
The effective income tax rate decreased 3.51 percentage points to 35%36% from 38%37% last year. Adjusting outyear because actual liability for last year’s taxes was less than estimated and the effect of the gain on bargain purchase of a business, the effective tax rate in 2011 is 37%.
Net earnings increased $6,654,000$10,263,000 or 14%19%, in fiscal 20112013 to $55,063,000,$64,381,000, or $2.93$3.41 per diluted share as a result of the aforementioned items. Without the benefit of the gain on bargain purchase of a business, net earnings were $48,483,000 compared to $48,409,000 last year.
There are many factors which can impact our net earnings from year to year and in the long run, among which are the supply and cost of raw materials and labor, insurance costs, factors impacting sales as noted above, the continuing consolidation of our customers, our ability to manage our manufacturing, marketing and distribution activities, our ability to make and integrate acquisitions and changes in tax laws and interest rates.
ACQUISITIONS
On June 10, 2010 we acquired the assets of California Churros, Inc., a manufacturer and seller of premium brand churros selling its products under the brand CALIFORNIA CHURROS. Headquartered and with its manufacturing facility in Colton, CA, California Churros had sales of approximately $2.5 million in our 2010 fiscal year.
In May 2011, we acquired the frozen handheld business of ConAgra Foods. This business had sales of approximately $50 million over the prior twelve months to food service and retail supermarket customers and sales of $18.3 million in our 2011 fiscal year from the acquisition date.
In June 2012, we acquired the assets of Kim & Scott’s Gourmet Pretzels, Inc., a manufacturer and seller of a premium brand soft pretzel. This business had sales of approximately $8 million over the prior twelve months to food service and retail supermarket customers, and had sales of approximately $1.8 million in our 2012 fiscal year from the acquisition date.
In October 2013, we acquired the assets of New York Pretzel, a manufacturer and distributor of soft pretzels selling primarily in the northeast to foodservice and retail locations. Of the purchase price of $11.8 million, $849,000 was allocated to intangible assets, $7,716,000 was allocated to goodwill and $3,049,000 was allocated to property, plant and equipment. This business had sales of about $4.3 million in our 2014 fiscal year included in the food service segment.
In May 2014, we acquired the stock of Philly’s Famous Water Ice, Inc. (PHILLY SWIRL). PHILLY SWIRL, located in Tampa, FL, produces frozen novelty products sold primarily to retail supermarket locations throughout the United States and to Canada with annual sales approximating $25 million. The allocation of the purchase price of $17.4 million is $4.0 million to working capital, $1.2 million to property, plant and equipment, $11.1 million to intangible assets, $1.8 million to goodwill, $4.0 million to deferred tax assets and $95,000 to other assets and $4.8 million to deferred tax liabilities. Sales of PHILLY SWIRL from the acquisition date to September 27, 2014 were $12.6 million and are included in the retail supermarket segment.
These acquisitions were accounted for under the purchase method of accounting, and their operations are included in the accompanying consolidated financial statements from their respective acquisition dates.
LIQUIDITY AND CAPITAL RESOURCES
Although there are many factors that could impact our operating cash flow, most notably net earnings, we believe that our future operating cash flow, along with our borrowing capacity, our current cash and cash equivalent balances and our investment securities is sufficient to fund future growth and expansion. See Note C to these financial statements for a discussion of our investment securities.
Fluctuations in the value of the Mexican and Canadian currencies and the resulting translation of the net assets of our Mexican and Canadian subsidiaries caused an increase of $929,000 in accumulated other comprehensive loss in 2014, an increase of $571,000 in accumulated other comprehensive loss in 2013 and a decrease of $782,000 in accumulated other comprehensive loss in 2012, an increase of $1,060,000 in 2011 and a decrease of $577,000 in 2010.2012. In 2012,2014, sales of the two subsidiaries were $19,491,000$23,633,000 as compared to $18,025,000$23,161,000 in 20112013 and $14,301,000$19,491,000 in 2010.
In our fiscal year ended September 29,27, 2014, we purchased and retired 81,685 shares of our common stock at a cost of $7,504,729. In our third quarter, we purchased and retired 64,041 shares at a cost of $5,903,157. In our fourth quarter, we purchased and retired 17,644 shares at a cost of $1,601,572.
In our fiscal year ended September 28, 2013, we purchased and retired 204,397 shares of our common stock at a cost of $14,500,215.
In our fiscal year ended September 28, 2012, we purchased and retired 142,038 shares of our common stock at a cost of $8,167,125. All of the shares were purchased in the fourth quarter. Subsequent to September 29, 2012 and through October 31,2012, we purchased and retired 48,255 shares of our common stock at a cost of $2,762,602. On November 8, 2012 the Company’s Board of directors authorized the purchase and retirement of an additional 500,000 shares of the Company’s common stock.
In November 2011, we entered into an amendment and modification to an amended and restated loan agreement with our existing banks which provides for up to a $50,000,000 revolving credit facility repayable in November 2016. The agreement contains restrictive covenants and requires commitment fees in accordance with standard banking practice. There were no outstanding balances under the facility at September 29, 201227, 2014 or under the prior facility at September 24, 2011.28, 2013. The significant financial covenants are:
. | Tangible net worth must initially be more than $294 million. | |
| . | Total funded indebtedness divided by earnings beforeinterest expense, income taxes, depreciation and amortization shall not be greater than 2.25 to 1. |
We were in compliance with the financial covenants described above at September 29, 2012.
We self-insure, up to loss limits, certain insurable risks such as worker's compensation and automobile liability claims. Accruals for claims under our self-insurance program are recorded on a claims-incurred basis. Under this program, the estimated liability for claims incurred but unpaid in fiscal years 20122014 and 20112013 was $1,800,000$2,700,000 and $1,100,000,$3,200,000, respectively. In connection with certain self-insurance agreements, we customarily enter into letters of credit arrangements with our insurers. At each of September 29, 201227, 2014 and September 24, 2011,28, 2013, we had outstanding letters of credit totaling $8,175,000.
The following table presents our contractual cash flow commitments on long-term debt, operating leases and purchase commitments for raw materials and packaging. See Notes to the consolidated financial statements for additional information on our long-term debt and operating leases.
| Payments Due by Period (in thousands) | ||||||||||||||||||||
| Total | Less Than 1 Year | 1-3 Years | 4-5 Years | After 5 Years | ||||||||||||||||
Longterm debt, including current maturities | $ | - | $ | - | $ | - | $ | - | $ | - | ||||||||||
| Capital lease obligations | 687 | 340 | 277 | 70 | - | |||||||||||||||
| Purchase commitments | 55,000 | 55,000 | - | - | - | |||||||||||||||
| Operating leases | 46,058 | 8,090 | 12,778 | 7,506 | 17,684 | |||||||||||||||
| Total | $ | 101,745 | $ | 63,430 | $ | 13,055 | $ | 7,576 | $ | 17,684 | ||||||||||
| Payments Due by Period | ||||||||||||||||||||
| (in thousands) | ||||||||||||||||||||
Less | ||||||||||||||||||||
Than | 1-3 | 4-5 | After | |||||||||||||||||
Total | 1 Year | Years | Years | 5 Years | ||||||||||||||||
Long-term debt,includingcurrent maturities | $ | - | $ | - | $ | - | $ | - | $ | - | ||||||||||
Capital lease obligations | 521 | 146 | 238 | 135 | 2 | |||||||||||||||
Purchase commitments | 60,000 | 55,000 | 5,000 | $ | - | $ | - | |||||||||||||
Operating leases | 51,185 | 10,647 | 16,817 | 10,049 | 13,672 | |||||||||||||||
Total | $ | 111,706 | $ | 65,793 | $ | 22,055 | $ | 10,184 | $ | 13,674 | ||||||||||
The purchase commitments do not exceed our projected requirements over the related terms and are in the normal course of business.
Fiscal 20122014 Compared to Fiscal 2011
Cash and cash equivalents and marketable securities held to maturity and available for sale increased $25,425,000,$14,612,000, or 16%7%, to $180,410,000$221,877,000 from a year ago for reasons described below.
Accounts receivables, net increased $1,414,000,$12,427,000, or 2%14%, to $76,414,000$99,972,000 in 20122014. The increase this year is primarily due to increasedhigher sales levels in the last month of our fourth quarter which was offset by improved collections.year. Inventories increased $6,300,000$4,298,000 or 10%6% to $69,761,000$76,083,000 in 20122014 due to higher unit costs of inventory and increasedan increase in parts inventory requirements due to increased sales.
Prepaid expenses and other decreasedincreased to $2,220,000$3,695,000 from $4,196,000$3,284,000 last year because of estimated federal income tax payments made in 2011 which resulted in prepaid income taxes of $1,814,000 at September 2011.
Net property, plant and equipment increased $16,894,000$10,365,000 to $141,544,000$157,529,000 because purchases of property, plant and equipment for the improvement and expansion of our manufacturing capabilities and frozen carbonated beverage business exceeded depreciation on existing assets and because of the addition of $724,000 in fixed assetswe acquired in the Kim & Scott’s acquisition. Included in purchases$4.3 million of property, plant and equipment in 2012 is approximately $6.5 million for a building addition at our manufacturing facility in Moscow Mills, MOthe New York Pretzel and $7.5 million for pretzel lines added at our facilities in Bellmawr, NJ and Carrollton, TX.
Goodwill increased to $86,442,000 from $76,899,000 because of $6,829,000goodwill acquired in the Kim & Scott’s acquisition.
Other intangible assets, less accumulated amortization decreased $3,541,000increased $6,977,000 to $48,464,000$50,989,000 due to intangible assets of $436,000$11,909,000 acquired in the Kim & Scott’s acquisitionNew York Pretzel and PHILLY SWIRL acquisitions offset by amortization of $4,932,000 during the year.
Marketable securities available for sale and held to maturity increased by $20,453,000 to $130,117,000 as we invested an additional $20 million into mutual funds designed to generate current income while maintaining a separate purchase of a $500,000 intangible asset, net of amortization expense of $4,477,000.
Accounts payable and accrued liabilitiesPayables increased $5,057,000$9,062,000 to $59,968,000 due to increased levels of business in September and higher purchase costsOctober 2014 and timing of ingredientspayments.
Accrued insurance liability increased $624,000 to $10,578,000 due to increases in estimates for incurred but not yet paid claims under our group insurance and packaging, and because of an accruedinsurance liability of $962,000 for income taxes that existed on September 2012 compared to none at September 2011.
Accrued compensation expense increased 2%4% to $13,151,000$14,286,000 due to an increase in our employee base and a general increase in the level of pay rates.
Dividends payable doubled to $5,972,000 as our quarterly dividend payment increased to $.32/share from $.16/share.
Deferred income tax liabilities increased by $3,824,000 to $44,874,000 which related primarily to amortization of goodwill and other intangible assets and depreciation of property, plant and equipment.
Other long-term liabilities at September 29, 201227, 2014 include $825,000$315,000 of gross unrecognized tax benefits which decreased from $973,000$438,000 a year ago due to reductions for tax positions of prior years.
Common stock decreased $2,006,000$1,895,000 to $43,011,000$32,621,000 in 20122014 because repurchases of our common stock of $8,167,000$7,505,000 exceeded increases totaling $6,161,000$5,610,000 from the exercise of incentive and nonqualified stock options, stock issued under our stock purchase plan for employees, stock issued under our deferred stock plan and share-based compensation expense.
Net cash provided by operating activities increased $8,969,000$19,994,000 to $89,425,000$106,542,000 in 20122014 primarily because of an increase of accounts receivablereceivables in 2014 of $605,000 in 2012$8,913,000 compared to an increase of $5,231,000$11,148,000 in 2011 and2013, an increase in deferred income taxesaccounts payable and accrued liabilities of $3,108,000$6,831,000 in 20122014 compared to an increase of $6,108,000$579,000 in 2011. Additionally,2013 and an increase in prepaid expenses and other of $182,000 in 2014 compared to an increase of $1,067,000 in 2013, higher net earnings in 2011 included a gain on bargain purchase of a business$7,433,000 and higher depreciation and amortization of $6,580,000 which did not contribute to cash provided by operating activities.$3,541,000.
Net cash used in investing activities decreased $54,587,000$34,725,000 to $9,318,000$86,112,000 in 20122014 from $63,905,000$120,837,000 in 20112013 primarily because net proceeds from redemption and sales of marketable securities of $41,294,000 in 2012 compared to net purchases of marketable securities of $25,725,000 in 2011. This change of $67,019,000decreased by $66,247,000 which was partially offset by higher spending of $13,676,000 onpayments for purchases of property, plant and equipment.
Net cash used in financing activities of $13,800,000$22,360,000 in 2012 compared2013 increased to net cash used by financing activities$25,435,000 in 2014 primarily because of $3,407,000 in 2011. The increase was caused primarily by $8,167,000 of payments to repurchase common stock and increased dividend payments of $1,009,000.
In 2012,2014, the major variables in determining our net increase in cash and cash equivalents and marketable securities were our net earnings, depreciation and amortization of fixed assets, increase in accounts receivable and accounts payable, purchases of companies, purchases of property, plant and equipment, purchases of companies, payments of cash dividend and the repurchase of common stock. Other variables which in the past have had a significant impact on our change in cash and cash equivalents are proceeds from borrowings and payments of long-term debt. As discussed in results of operations, our net earnings may be influenced by many factors. Depreciation and amortization of fixed assets is primarily determined by past purchases of property, plant and equipment although it could be impacted by a significant acquisition. Purchases of property, plant and equipment are primarily determined by our ongoing normal manufacturing and marketing requirements but could be increased significantly for manufacturing expansion requirements or large frozen beverage customer needs. From time to time, we have repurchased common stock and we anticipate that we will do so again in the future. We are actively seeking acquisitions that could be a significant use of cash. Although the balance of ourwe have no long-term debt is $0 at September 29, 2012,27, 2014, we may borrow in the future depending on our needs.
Fiscal 20112013 Compared to Fiscal 2010
Cash and cash equivalents and marketable securities held to maturity and available for sale increased $38,539,000,$26,855,000, or 33%15%, to $154,985,000$207,265,000 from a year ago for reasons described below.
Accounts receivables, net increased $5,125,000,$11,131,000, or 7%15%, to $75,000,000$87,545,000 in 20112013. On a days’ outstanding basis, the balance a year ago was at an unusually low level; the increase this year is partly due to primarily increased sales levels in our fourth quarter which resulted primarily froma bounceback and partly due to the handhelds acquisition.composition of the receivables. Inventories increased $12,831,000$2,024,000 or 25%3% to $63,461,000$71,785,000 in 20112013 primarily due to higher unit costs of inventory and inventory of handhelds which accounted for over 60% of the increase.
Prepaid expenses and other decreasedincreased to $4,196,000$3,284,000 from $6,067,000$2,220,000 last year because of higher estimated federal income tax payments made in 2010 prior to the enactment of the law extending bonus depreciation.
Net property, plant and equipment increased $14,558,000$5,620,000 to $124,650,000$147,164,000 because purchases of fixed assetsproperty, plant and equipment for the improvement and expansion of our manufacturing capabilities and frozen carbonated beverage business exceeded depreciation on existing assets,assets. Included in purchases of property, plant and becauseequipment in 2013 is approximately $5.4 million for equipment additions at our manufacturing facility in Moscow Mills, MO which essentially completes the multi-year expansion of that facility.
Goodwill remained the addition of $11,036,000 in fixed assets acquired in the handhelds acquisition.
Other intangible assets, less accumulated amortization decreased $3,279,000$4,452,000 to $52,005,000$44,012,000 due entirely to intangible assets of $1,532,000 acquired in the handhelds acquisition net of amortization expense of $4,811,000.
Marketable securities available for sale and accrued liabilitiesheld to maturity increased $3,904,000by $83,708,000 to $109,920,000 as we invested $110 million into mutual funds designed to generate current income while maintaining a low volatility and overall moderate duration.
Accrued insurance liability increased $2,130,000 due to increased levels of businessincreases in insurance company estimates for incurred but not yet paid claims under our insurance liability programs for prior years and higher purchase costs of ingredients and packaging.
Accrued compensation expense increased 5%4% to $12,859,000$13,671,000 due to an increase in our employee base and a general increase in the level of pay rates.
Deferred income tax liabilities increased by $10,649,000$309,000 to $41,050,000$45,183,000 which related primarily to amortization of goodwill and other intangible assets and depreciation of property, plant and equipment and deferred taxes of $4,137,000 resulting from the gain on bargain purchase of a business.
Other long-term liabilities at September 24, 201127, 2014 include $973,000$438,000 of gross unrecognized tax benefits which decreased from $1,249,000$541,000 a year ago due to reductions for tax positions of prior years.
Common stock increased $6,564,000decreased $8,495,000 to $45,017,000$34,516,000 in 20112013 because repurchases of our common stock of $14,500,000 exceeded increases totaling $6,564,000$6,005,000 from the exercise of incentive and nonqualified stock options, stock issued under our stock purchase plan for employees, stock issued under our deferred stock plan and share-based compensation expense.
Net cash provided by operating activities increased $12,448,000decreased $2,877,000 to $80,456,000$86,548,000 in 20112013 primarily because of a decrease in prepaid expenses and other of $1,870,000 compared to an increase in prepaid expense and other of $4,101,000 in 2010, an increase of accounts receivablereceivables in 2013 of $5,231,000 in 2011$11,148,000 compared to an increase of $8,629,000$605,000 in 20102012 and an increase in deferred income taxesaccounts payable and accrued liabilities of $6,108,000$578,000 in 20112013 compared to an increase of $3,219,000$5,248,000 in 2010.
Net cash used in investing activities increased $22,450,000$111,519,000 to $63,905,000$120,837,000 in 20112013 from $41,455,000$9,318,000 in 20102012 primarily because net purchases of marketable securities of $25,725,000$85,934,000 in 20112013 compared to net proceeds from marketable securities of $16,866,000$41,294,000 in 2010. This change of $42,591,000 was partially offset by lower spending of $16,379,000 and $4,407,000 on the purchase of companies and property, plant and equipment, respectively.
Net cash used in financing activities of $3,407,000$22,360,000 in 20112013 compared to net cash used by financing activities of $12,609,000$13,800,000 in 2010.2012. The decreaseincrease was caused primarily by a decreaseincreased payments of $7,768,000 in payments$6,333,000 to repurchase common stock.
In 2011,2013, the major variables in determining our net increase in cash and cash equivalents and marketable securities were our net earnings, depreciation and amortization of fixed assets, increase in accounts receivable, purchases of property, plant and equipment, purchases of companies, payments of cash dividend and the repurchase of common stock. Other variables which in the past have had a significant impact on our change in cash and cash equivalents are proceeds from borrowings and payments of long-term debt.debt and purchases of companies. As discussed in results of operations, our net earnings may be influenced by many factors. Depreciation and amortization of fixed assets is primarily determined by past purchases of property, plant and equipment although it could be impacted by a significant acquisition. Purchases of property, plant and equipment are primarily determined by our ongoing normal manufacturing and marketing requirements but could be increased significantly for manufacturing expansion requirements or large frozen beverage customer needs. From time to time, we have repurchased common stock and we anticipate that we will do so again in the future. We are actively seeking acquisitions that could be a significant use of cash. Although the balance of ourwe have no long-term debt is $0 at September 24, 2011,27, 2014, we may borrow in the future depending on our needs.
Item 7A. Quantitative And Qualitative Disclosures About Market Risk
The following is the Company’s quantitative and qualitative analysis of its financial market risk:
Interest Rate Sensitivity
The Company has in the past entered into interest rate swaps to limit its exposure to interest rate risk and may do so in the future if the Board of Directors feels that such non-trading purpose is in the best interest of the Company and its shareholders. As of September 29, 2012,27, 2014, the Company had no interest rate swap contracts.
Interest Rate Risk
At September 29, 2012,27, 2014, the Company had no long-term debt obligations.
Purchasing Risk
The Company’s most significant raw material requirements include flour, shortening, corn syrup, sugar, juice, cheese, chocolate, and a variety of nuts. The Company attempts to minimize the effect of future price fluctuations related to the purchase of raw materials primarily through forward purchasing to cover future manufacturing requirements, generally for periods from 1 to 12 months. Future contracts are not used in combination with forward purchasing of these raw materials. The Company’s procurement practices are intended to reduce the risk of future price increases, but also may potentially limit the ability to benefit from possible price decreases.
Foreign Exchange Rate Risk
The Company has not entered into any forward exchange contracts to hedge its foreign currency rate risk as of September 29, 2012,27, 2014, because it does not believe its foreign exchange exposure is significant.
Item 8. Financial Statements And Supplementary Data
The financial statements of the Company are filed under this Item 8, beginning on page F-1 of this report.
Item 9. Changes In And Disagreements With Accountants On Accounting And Financial Disclosure
None.
None.
Disclosure Controls and Procedures
We carried out an evaluation under the supervision and with the participation of our management, including our chief executive officer and chief financial officer, of the effectiveness of the design and operation of our disclosure controls and procedures, as such term is defined under Rule 13a-15(e) promulgated under the Securities Exchange Act of 1934 (the "Exchange Act"), as amended for financial reporting, as of September 29, 2012.27, 2014. Based on that evaluation, our chief executive officer and chief financial officer concluded that these controls and procedures are effective to ensure that information required to be disclosed by the Company in reports that it files or submits under the Exchange Act is recorded, processed, summarized, and reported as specified in Securities and Exchange Commission rules and forms. There were no changes in these controls or procedures identified in connection with the evaluation of such controls or procedures that occurred during our last fiscal quarter, or in other factors that have materially affected, or are reasonably likely to materially affect these controls or procedures. There were no changes in the Company’s internal controls over financial reporting that occurred during our last fiscal quarter.
Our disclosure controls and procedures are designed to provide reasonable assurance that information required to be disclosed by us in the reports that we file or submit under the Exchange Act is recorded, processed, summarized, and reported, within the time periods specified in the rules and forms of the Securities and Exchange Commission. These disclosure controls and procedures include, among other things, controls and procedures designed to provide reasonable assurance that information required to be disclosed by us in the reports that we file under the Exchange Act is accumulated and communicated to our management, including our chief executive officer and chief financial officer, as appropriate to allow timely decisions regarding required disclosure.
Management’s Report on Internal Control over Financial Reporting
Our management is responsible for establishing and maintaining adequate internal control over financial reporting. Internal control over financial reporting is defined in Rule 13a-15(f) and 15d-15(f) under the Exchange Act as a process designed by, or under the supervision of, the chief executive officer and chief financial officer and effected by the board of directors and management to provide reasonable assurance regarding the reliability of financial reporting and the preparation of financial statements for external purposes in accordance with generally accepted accounting principles and includes those policies and procedures that:
● | Pertain to the maintenance of records that in reasonable detail accurately and fairly reflect the transactions and dispositions of our assets; |
● | Provide reasonable assurance that transactions arerecorded as necessary to permit preparation of financial statements in accordance with generally accepted accounting principles, and that receipts and expenditures of the company are being made only in accordance with authorizations of our management and board of directors; |
● | Provide reasonable assurance regarding prevention or timely detection of unauthorized acquisition, use or disposition of our assets that could have a material effect on the financial statements. |
Because of its inherent limitations, internal control over financial reporting may not prevent or detect misstatements. Projections of any evaluation of effectiveness to future periods are subject to the risks that controls may become inadequate because of changes in conditions, or that the degree of compliance with the policies or procedures may deteriorate.
Our management assessed the effectiveness of our internal control over financial reporting as of September 29, 2012.27, 2014. In making this assessment, our management used the criteria set forth by the Committee of Sponsoring Organizations of the Treadway Commission (COSO) in Internal Control-Integrated Framework.
Based on our assessment, our management believes that, as of September 29, 2012,27, 2014, our internal control over financial reporting is effective. There have been no changes that occurred during our fourth quarter that have materially affected, or are reasonably likely to materially affect, our internal control over financial reporting.
Our independent registered public accounting firm, Grant Thornton LLP, audited our internal control over financial reporting as of September 29, 2012.27, 2014. Their report, dated November 27, 2012,25, 2014, expressed an unqualified opinion on our internal control over financial reporting. That report appears in Item 15 of Part IV of this Annual Report on Form 10-K and is incorporated by reference to this Item 9A.
Item 9B. Other Information
There was no information required on Form 8-K during the quarter that was not reported.
PART III
Item 10. Directors, Executive Officers and CorporateGovernance
Portions of the information concerning directors and executive officers, appearing under the captions “Information Concerning Nominees For Election To Board” and “Information Concerning Continuing Directors And Executive Officers” and information concerning Section 16(a) Compliance appearing under the caption “Compliance with Section 16(a) of the Securities Exchange Act of 1934” in the Company’s Proxy Statement filed with the Securities and Exchange Commission in connection with the Annual Meeting of Shareholders to be held on February 7, 17, 2015 (“2013 (“2012 Proxy Statement”) is incorporated herein by reference.
Portions of the information concerning the Audit Committee, the requirement for an Audit Committee Financial Expert and the Nominating Committee in the Company’s 20122014 Proxy Statement filed with the Securities and Exchange Commission in connection with the Annual Meeting of Shareholders to be held on February 7, 201317, 2015 is incorporated herein by reference.
The Company has adopted a Code of Ethics pursuant to Section 406 of the Sarbanes-Oxley Act of 2002, which applies to the Company’s principal executive officer and senior financial officer. The Company has also adopted a Code of Business Conduct and Ethics which applies to all employees. The Company will furnish any person, without charge, a copy of the Code of Ethics upon written request to J & J Snack Foods Corp., 6000 Central Highway, Pennsauken, New Jersey 08109, Attn: Dennis Moore. A copy of the Code of Ethics can also be found on our website at www.jjsnack.com.www.jjsnack.com. Any waiver of any provision of the Code of Ethics granted to the principal executive officer or senior financial officer may only be granted by a majority of the Company’s disinterested directors. If a waiver is granted, information concerning the waiver will be posted on our website www.jjsnack.com for a period of 12 months.
Item 11. Executive Compensation
Information concerning executive compensation appearing in the Company’s 20122014 Proxy Statement under the caption “Management Remuneration” is incorporated herein by reference.
The following is a list of the executive officers of the Company and their principal past occupations or employment. All such persons serve at the pleasure of the Board of Directors and have been elected to serve until the Annual Meeting of Shareholders on February 7, 201317, 2015 or until their successors are duly elected.
| Name | Age | Position | ||||||||
Gerald B. Shreiber | 72 | Chairman of the Board, | ||||||||
President, Chief | ||||||||||
Officer and Director | ||||||||||
Dennis G. Moore | 58 | Senior Vice President, | ||||||||
Financial Officer, Secretary, | ||||||||||
Treasurer and Director | ||||||||||
Robert M. Radano | 65 | Senior Vice President, | ||||||||
Sales and Chief Operating | ||||||||||
Officer | ||||||||||
Dan Fachner | 54 | President of The ICEE Company | ||||||||
Subsidiary | ||||||||||
Gerard G. Law | 40 | Senior Vice President and | ||||||||
Assistant to the President | ||||||||||
Robert J. Pape | 57 | Senior Vice President Sales | ||||||||
Gerald B. Shreiber is the founder of the Company and has served as its Chairman of the Board, President, and Chief Executive Officer since its inception in 1971. His term as a director expires in 2015.
Dennis G. Moore joined the Company in 1984. He served in various controllership functions prior to becoming the Chief Financial Officer in June 1992. His term as a director expires in 2017.
Robert M. Radano joined the Company in 1972 and in May 1996 was named Chief Operating Officer of the Company. Prior to becoming Chief Operating Officer, he was Senior Vice President, Sales responsible for national food service sales of J & J.
Dan Fachner has been an employee of The ICEE Company,ICEE-USA Corp., which was acquired by the Company in May 1987, since 1979. He was named Senior Vice President of The ICEE Company in April 1994 and became President in May 1997.
Gerard G. Law joined the Company in 1992. He served in various manufacturing and sales management capacities prior to becoming Senior Vice President, Western Operations in 2009. He was named to his present position in 2011 in which he has responsibility for marketing, research and development and overseeing a number of the manufacturing facilities of J & J.
Robert J. Pape joined the Company in 1998. He served in various sales and sales management capacities prior to becoming Senior Vice President Sales in 2010.
Item 12. Security Ownership Of Certain Beneficial Owners AndManagement And Related Stockholder Matters
Information concerning the security ownership of certain beneficial owners and management appearing in the Company’s 20122014 Proxy Statement under the caption “Security Ownership of Certain Beneficial Owners and Management” is incorporated herein by reference.
The following table details information regarding the Company’s existing equity compensation plans as of September 29, 2012.
| ( a ) | ( b ) | ( c ) | ||||||||||
| Plan Category | Number of securities to be issued upon exercise of outstanding options, warrants and rights | Weighted-average exercise price of outstandng options, warrants and rights | Number of Securities Remaining available for future issuance under equity compensation plans (excluding securities reflected in column (a) ) | |||||||||
Equity compensation plans approved by security holders | 576,328 | $ | 45.09 | 1,195,000 | ||||||||
Equity compensation plans not approved by security holders | - | - | - | |||||||||
| Total | 576,328 | $ | 45.09 | 1,195,000 | ||||||||
( a ) | ( b ) | ( c ) | ||||||||||
Number of | ||||||||||||
Securities | ||||||||||||
Remaining | ||||||||||||
available for | ||||||||||||
future | ||||||||||||
Number of | Weighted- | issuance under | ||||||||||
securities to | average | equity | ||||||||||
be issued upon | exercise | compensation | ||||||||||
exercise of | price of | plans | ||||||||||
outstanding | outstandng | (excluding | ||||||||||
options, | options, | securities | ||||||||||
warrants and | warrants and | reflected in | ||||||||||
Plan Category | rights | rights | column (a) ) | |||||||||
Equity compensation plans approvedby security holders | 552,000 | $ | 57.71 | 1,030,000 | ||||||||
Equity compensation plans notapproved by security holders | - | - | - | |||||||||
Total | 552,000 | $ | 57.71 | 1,030,000 | ||||||||
Item 13. Certain Relationships And Related Transactions, andDirector Independence
Information concerning the Certain Relationships and Related Transactions, and Director Independence in the Company’s 20122014 Proxy Statement is incorporated herein by reference.
Item 14. Principal Accounting Fees And Services
Information concerning the Principal Accountant Fees and Services in the Company’s 20122014 Proxy Statement is incorporated herein by reference.
PART IV
Item 15. Exhibits, Financial Statement Schedules
(a) The following documents are filed as part of thisReport:
(1) Financial Statements
The financial statements filed as part of this report are listed on the Index to Consolidated Financial Statements and Financial Statements Schedule on page F-1.
(2) Financial Statement Schedule – Page S-1
Schedule II – Valuation and Qualifying Accounts
All other schedules are omitted either because they are not applicable or because the information required is contained in the financial statements or notes thereto.
(b) Exhibits
3.1 Amended and Restated Certificate of Incorporation filed February 28, 1990 (Incorporated by reference from the Company’s Form 10-Q dated May 4, 1990).
3.2 Revised Bylaws adopted November 19, 2013 (Incorporated by reference from the Company’s Form 10-K dated November 26, 2013).
4.3Amended and Restated Loan Agreement dated December 1, 2006 by and among J & J Snack FoodsCorp. and Certain of its Subsidiaries andCitizens Bank of Pennsylvania, as Agent(Incorporated by reference from the Company’s Form 10-K dated December 6, 2006).
4.4 First Amendment and Modification to Amendment and Restated Loan Agreement (Incorporated by reference from the Company’s Form 10-K dated December 7, 2011).
10.2* J & J Snack Foods Corp. Stock Option Plan(Incorporated by reference from the Company’sDefinitive Proxy Statement dated December 21,2011).
10.7 Lease dated August 29, 1995 between J & J Snack Foods Corp. and 5353 Downey Associated Ltd. for the lease of the Vernon, CA facility (Incorporated by reference from the Company’s Form 10-K dated December 21, 1995).
10.8* J & J Snack Foods Corp. Employee Stock Purchase Plan (Incorporated by reference from the Company’s Form S-8 dated May 16, 1996).
10.11 Amendment No. 1 to Lease dated August 29, 1995between J & J Snack Foods Corp. and 5353 Downey Associated Ltd. for the lease of the Vernon, CA facility (Incorporated by reference from the Company’s Form 10-K dated December 18, 2002).
10.14Leases and amendments to leases between Liberty Venture I, LP and J & J Snack Foods Corp. for the three buildings located in Bridgeport, New Jersey (Incorporated by reference from the Company’s Form 10-K dated December 8, 2009).
10.15Amendment No. 2 to Lease dated August 29, 1995between J & J Snack Foods Corp. and 5353 Downey Associated Ltd. for the lease of the Vernon, CA facility (Incorporated by reference from the Company's Form 10-K dated December 6, 2010).
10.16 Amendment to Lease dated January 1, 1996 between Country Home Bakers, LLC and Borck Associates Limited Partnership for the lease of the Atlanta, GA facility (Incorporated by reference from the Company's Form 10-k dated December 6, 2011).
(b) Exhibits14.1 Code of Ethics Pursuant to Section 406 of the
21.1** Subsidiaries of J & J Snack Foods Corp.
23.1** Consent of Independent Registered Public Accounting Firm.
31.1** Certification Pursuant to Section 302 of theSarbanes-Oxley Act of 2002.
31.2** Certification Pursuant to Section 302 of theSarbanes-Oxley Act of 2002.
32.1** Certification Pursuant to 18 U.S.C. Section 1350, As Adopted Pursuant To Section 906 Of The Sarbanes-Oxley Act of 2002.
32.2** Certification Pursuant to 18 U.S.C. Section 1350, As Adopted Pursuant To Section 906 Of The Sarbanes-Oxley Act of 2002.
101** The following financial information from J&J Snack Foods Corp.'s Form 10-K for the year ended September 27, 2014, formatted in XBRL (eXtensible Business Reporting Language):
(i) | Consolidated Balance Sheets, |
(ii) |
Consolidated Statements of Earnings, |
(iii) |
Consolidated Statements of |
(iv) | Consolidated Statements of Cash Flows, |
(v) | Consolidated Statement of Changes in Stockholders' Equity and |
(vi) | The Notes to the Consolidated Financial Statements |
*Compensatory Plan
**Filed Herewith
SIGNATURES
Pursuant to the requirements of Section 13(a) or 15(d) of the Securities Exchange Act of 1934, the Registrant has duly caused report to be signed on its behalf by the undersigned, thereunto duly authorized.
J & J SNACK FOODS CORP. | |||
| November 25, 2014 | By | /s/ Gerald B. Shreiber | |
Gerald B. Shreiber | |||
Chairman of the Board, | |||
President, Chief Executive | |||
Officer and Director | |||
(Principal Executive Officer) | |||
Pursuant to the requirements of the Securities Exchange Act of 1934, this report has been signed below by the following persons on behalf of the Registrant and in the capacities and on the dates indicated. | |||
| November 25, 2014 | /s/ Gerald B. Shreiber | ||
| Gerald B. Shreiber, | |||
Chairman of the Board, | |||
| President, Chief Executive | |||
| Officer and Director | |||
| (Principal Executive Officer) | |||
| November | |||
| 25, 2014 | /s/ Dennis G. Moore | ||
Dennis G. Moore, Senior Vice | |||
President, Chief | |||
Officer and Director | |||
(Principal Financial Officer) | |||
(Principal | |||
| November | /s/ | ||
| Sidney R. Brown, Director | |||
| Stanley | |||
| Peter G. Stanley, Director | |||
| November | /s/ | Vincent A. Melchiorre | |
J & J SNACK FOODS CORP.
INDEX TO CONSOLIDATED FINANCIAL STATEMENTS
AND FINANCIAL STATEMENT SCHEDULE
Financial Statements: | |
Report of Independent Registered Public AccountingFirm | F-2 |
Consolidated Balance Sheets as of September | F-3 |
Consolidated Statements of Earnings for the fiscal yearsended September 27, 2014, September 28, 2013 and September 29, 2012 | F-4 |
Consolidated Statements of Comprehensive Incomefor the fiscal years ended September 27, 2014,September 28, 2013 and September 29, 2012 | F-5 |
Consolidated Statement of Changes in Stockholders’ Equityfor the fiscal years ended September | |
Consolidated Statements of Cash Flows for the fiscal yearsended September 27, 2014, September 28, 2013 and September 29, 2012 | |
| F-7 | |
Notes to Consolidated Financial Statements | F-8 |
Financial Statement Schedule: | |
Schedule II – Valuation and Qualifying Accounts | S-1 |
Report of Independent Registered Public Accounting Firm
Shareholders and Board of Directors
J&J Snack Foods Corp. and Subsidiaries
We have audited the accompanying consolidated balance sheets of J&J Snack Foods Corp. and Subsidiaries as of September 29, 201227, 2014 and September 24, 2011,28, 2013, and the related consolidated statements of earnings, comprehensive income, changes in stockholders’ equity, and cash flows for each of the three fiscal years in the period ended September 29, 2012 (5327, 2014 (52 weeks, 52 weeks, and 5253 weeks, respectively). Our audits of the basic consolidated financial statements included the consolidated financial statement schedule, listed in the index appearing under Item 15. We have also audited J&J Snack Foods Corp. and Subsidiaries’ internal control over financial reporting as of September 29, 2012,27, 2014, based on criteria established inInternal Control-Integrated Control IntegratedFramework (1992), issued by the Committee of Sponsoring Organizations of the Treadway Commission (COSO). J&J Snack Foods Corp. and Subsidiaries’ management is responsible for these consolidated financial statements and financial statement schedule, for maintaining effective internal control over financial reporting, and for its assessment of the effectiveness of internal control over financial reporting, included in the accompanying Management’s Report on Internal Control over Financial Reporting. Our responsibility is to express an opinion on these consolidated financial statements and financial statement schedule and an opinion on J&J Snack Foods Corp. and Subsidiaries’ internal control over financial reporting based on our audits.
We conducted our audits in accordance with the standards of the Public Company Accounting Oversight Board (United States). Those standards require that we plan and perform the audits to obtain reasonable assurance about whether the financial statements are free of material misstatement and whether effective internal control over financial reporting was maintained in all material respects. Our audits of the consolidated financial statements included examining, on a test basis, evidence supporting the amounts and disclosures in the financial statements, assessing the accounting principles used and significant estimates made by management, and evaluating the overall financial statement presentation. Our audit of internal control over financial reporting included obtaining an understanding of internal control over financial reporting, assessing the risk that a material weakness exists, and testing and evaluating the design and operating effectiveness of internal control based on the assessed risk. Our audits also included performing such other procedures as we considered necessary in the circumstances. We believe that our audits provide a reasonable basis for our opinions.
A company’s internal control over financial reporting is a process designed to provide reasonable assurance regarding the reliability of financial reporting and the preparation of financial statements for external purposes in accordance with generally accepted accounting principles. A company’s internal control over financial reporting includes those policies and procedures that (1) pertain to the maintenance of records that, in reasonable detail, accurately and fairly reflect the transactions and dispositions of the assets of the company;company; (2) provide reasonable assurance that transactions are recorded as necessary to permit preparation of financial statements in accordance with generally accepted accounting principles, and that receipts and expenditures of the company are being made only in accordance with authorizations of management and directors of the company;company; and (3) provide reasonable assurance regarding prevention or timely detection of unauthorized acquisition, use, or disposition of the company’s assets that could have a material effect on the financial statements.
Because of its inherent limitations, internal control over financial reporting may not prevent or detect misstatements. Also, projections of any evaluation of effectiveness to future periods are subject to the risk that controls may become inadequate because of changes in conditions, or that the degree of compliance with the policies or procedures may deteriorate.
In our opinion, the consolidated financial statements referred to above present fairly, in all material respects, the consolidated financial position of J&J Snack Foods Corp. and Subsidiaries as of September 29, 201227, 2014 and September 24, 2011,28, 2013, and the consolidated results of itstheir operations and itstheir consolidated cash flows for each of the three fiscal years in the period ended September 29, 2012 (5327, 2014 (52 weeks, 52 weeks, and 5253 weeks, respectively) in conformity with accounting principles generally accepted in the United States of America. Also, in our opinion, the related consolidated financial statement schedule, when considered in relation to the basic consolidated financial statements taken as a whole, presents fairly, in all material respects, the information set forth therein. In our opinion, J&J Snack Foods Corp. and Subsidiaries maintained, in all material respects, effective internal control over financial reporting as of September 29, 2012,27, 2014, based on criteria established inInternal Control-Integrated Control IntegratedFramework, (1992)issued by COSO.
/s/ Grant Thornton LLP
Philadelphia, Pennsylvania
November 25, 2014
J & J SNACK FOODS CORP. AND SUBSIDIARIES
CONSOLIDATED BALANCE SHEETS
(in thousands, except share amounts)
September 29, 2012 | September 24, 2011 | |||||||
| Assets | ||||||||
| Current assets | ||||||||
| Cash and cash equivalents | $ | 154,198 | $ | 87,479 | ||||
Marketable securities held to maturity | 1,214 | 25,506 | ||||||
| Accounts receivable, net | 76,414 | 75,000 | ||||||
| Inventories, net | 69,761 | 63,461 | ||||||
| Prepaid expenses and other | 2,220 | 4,196 | ||||||
| Deferred income taxes | 4,261 | 4,208 | ||||||
| Total current assets | 308,068 | 259,850 | ||||||
| Property, plant and equipment, at cost | 483,873 | 446,856 | ||||||
Less accumulated depreciation and amortization | 342,329 | 322,206 | ||||||
| 141,544 | 124,650 | |||||||
| Other assets | ||||||||
| Goodwill | 76,899 | 70,070 | ||||||
| Other intangible assets, net | 48,464 | 52,005 | ||||||
| Marketable securities held to maturity | 24,998 | 42,000 | ||||||
| Other | 3,071 | 2,241 | ||||||
| 153,432 | 166,316 | |||||||
| $ | 603,044 | $ | 550,816 | |||||
| Liability and Stockholders' Equity | ||||||||
| Current Liabilities | ||||||||
| Current obligations under capital leases | $ | 340 | $ | 278 | ||||
| Accounts payable | 59,649 | 55,918 | ||||||
| Accrued liabilities | 5,919 | 4,593 | ||||||
| Accrued compensation expense | 13,151 | 12,859 | ||||||
| Dividends payable | 2,446 | 2,200 | ||||||
| Total current liabilities | 81,505 | 75,848 | ||||||
| Long-term obligations under capital leases | 347 | 523 | ||||||
| Deferred income taxes | 44,874 | 41,050 | ||||||
| Other long-term liabilities | 831 | 1,007 | ||||||
| Stockholders' Equity | ||||||||
Preferred stock, $1 par value; authorized 10,000,000 shares; none issued | - | - | ||||||
Common stock, no par value; authorized, 50,000,000 shares; issued and outstanding 18,780,000 and 18,727,000 respectively | 43,011 | 45,017 | ||||||
| Accumulated other comprehensive loss | (3,132 | ) | (3,914 | ) | ||||
| Retained Earnings | 435,608 | 391,285 | ||||||
| 475,487 | 432,388 | |||||||
| $ | 603,044 | $ | 550,816 | |||||
September 27, | September 28, | |||||||
2014 | 2013 | |||||||
Assets | ||||||||
Current assets | ||||||||
Cash and cash equivalents | $ | 91,760 | $ | 97,345 | ||||
Marketable securitiesheld to maturity | - | 256 | ||||||
Accounts receivable, net | 99,972 | 87,545 | ||||||
Inventories, net | 76,083 | 71,785 | ||||||
Prepaid expenses and other | 3,695 | 3,284 | ||||||
Deferred income taxes | 4,096 | 4,502 | ||||||
Total current assets | 275,606 | 264,717 | ||||||
Property, plant and equipment, at cost | 538,081 | 510,442 | ||||||
Less accumulated depreciationand amortization | 380,552 | 363,278 | ||||||
Property, plant and equipment, net | 157,529 | 147,164 | ||||||
Other assets | ||||||||
Goodwill | 86,442 | 76,899 | ||||||
Other intangible assets, net | 50,989 | 44,012 | ||||||
Marketable securities held to maturity | 2,000 | 2,000 | ||||||
Marketable securities available for sale | 128,117 | 107,664 | ||||||
Other | 4,090 | 3,205 | ||||||
Total other assets | 271,638 | 233,780 | ||||||
Total Assets | $ | 704,773 | $ | 645,661 | ||||
Liabilities and Stockholder's Equity | ||||||||
Current Liabilities | ||||||||
Current obligations under capital leases | $ | 146 | $ | 211 | ||||
Accounts payable | 59,968 | 50,906 | ||||||
Accrued insurance liability | 10,578 | 9,954 | ||||||
Accrued income taxes | - | 1,740 | ||||||
Accrued liabilities | 5,007 | 3,769 | ||||||
Accrued compensation expense | 14,286 | 13,671 | ||||||
Dividends payable | 5,972 | 2,988 | ||||||
Total current liabilities | 95,957 | 83,239 | ||||||
Long-term obligations under capital leases | 374 | 136 | ||||||
Deferred income taxes | 44,785 | 45,183 | ||||||
Other long-term liabilities | 1,139 | 538 | ||||||
Stockholders' Equity | ||||||||
Preferred stock, $1 par value; authorized10,000,000 shares; none issued | - | - | ||||||
Common stock, no par value; authorized,50,000,000 shares; issued and outstanding18,663,000 and 18,677,000 respectively | 32,621 | 34,516 | ||||||
Accumulated other comprehensive loss | (5,988 | ) | (5,930 | ) | ||||
Retained Earnings | 535,885 | 487,979 | ||||||
Total stockholders' equity | 562,518 | 516,565 | ||||||
Total Liabilities and Stockholder's Equity | $ | 704,773 | $ | 645,661 | ||||
The accompanying notes are an integral part of these statements.
J & J SNACK FOODS CORP. AND SUBSIDIARIES
CONSOLIDATED STATEMENTS OF EARNINGS
(in thousands, except per share information)
| Fiscal Year Ended | ||||||||||||
September 29, 2012 | September 24, 2011 | September 25, 2010 | ||||||||||
| (53 weeks) | (52 weeks) | (52 weeks) | ||||||||||
| Net Sales | $ | 830,796 | $ | 744,071 | $ | 696,703 | ||||||
Cost of goods sold (1) | 580,611 | 514,297 | 468,923 | |||||||||
| Gross Profit | 250,185 | 229,774 | 227,780 | |||||||||
| Operating expenses | ||||||||||||
Marketing (2) | 76,318 | 70,637 | 72,103 | |||||||||
Distribution (3) | 62,250 | 57,462 | 52,146 | |||||||||
Administrative (4) | 26,192 | 24,568 | 24,282 | |||||||||
| Other general expense | 458 | 524 | 2,087 | |||||||||
| 165,218 | 153,191 | 150,618 | ||||||||||
| Operating Income | 84,967 | 76,583 | 77,162 | |||||||||
| Other income (expenses) | ||||||||||||
Gain on bargain purchase of a business | - | 6,580 | - | |||||||||
| Investment income | 1,392 | 1,041 | 1,114 | |||||||||
| Interest expense & other | (73 | ) | (138 | ) | (179 | ) | ||||||
Earnings before income taxes | 86,286 | 84,066 | 78,097 | |||||||||
| Income taxes | 32,168 | 29,003 | 29,688 | |||||||||
| NET EARNINGS | $ | 54,118 | $ | 55,063 | $ | 48,409 | ||||||
| Earnings per diluted share | $ | 2.86 | $ | 2.93 | $ | 2.59 | ||||||
Weighted average number of diluted shares | 18,917 | 18,789 | 18,703 | |||||||||
| Earnings per basic share | $ | 2.87 | $ | 2.95 | $ | 2.61 | ||||||
Weighted average number of basic shares | 18,854 | 18,672 | 18,528 | |||||||||
| (1) Includes share-based compensation expense of $270 for the year ended September 29, 2012, $157 for the year ended September 24, 2011 and $182 for the year ended September 25, 2010. | ||||||||||||
| (2) Includes share-based compensation expense of $403 for the year ended September 29, 2012, $347 for the year ended September 24, 2011 and $448 for the year ended September 25, 2010. | ||||||||||||
| (3) Includes share-based compensation expense of $27 for the year ended September 29, 2012, $18 for the year ended September 24, 2011 and $21 for the year ended September 25, 2010. | ||||||||||||
| (4) Includes share-based compensation expense of $546 for the year ended September 29, 2012, $396 for the year ended September 24, 2011 and $597 for the year ended September 25, 2010. | ||||||||||||
Fiscal Year Ended | ||||||||||||
September 27, | September 28, | September 29, | ||||||||||
2014 | 2013 | 2012 | ||||||||||
(52 weeks) | (52 weeks) | (53 weeks) | ||||||||||
Net Sales | $ | 919,451 | $ | 867,683 | $ | 830,796 | ||||||
Cost of goods sold(1) | 631,874 | 604,381 | 580,611 | |||||||||
Gross Profit | 287,577 | 263,302 | 250,185 | |||||||||
Operating expenses | ||||||||||||
Marketing (2) | 78,632 | 74,076 | 76,318 | |||||||||
Distribution(3) | 71,159 | 65,025 | 62,250 | |||||||||
Administrative(4) | 29,784 | 27,448 | 26,192 | |||||||||
Other general expense (income) | 1,154 | (651 | ) | 458 | ||||||||
Total operating expenses | 180,729 | 165,898 | 165,218 | |||||||||
Operating Income | 106,848 | 97,404 | 84,967 | |||||||||
Other income (expenses) | ||||||||||||
Investment income | 4,473 | 3,492 | 1,392 | |||||||||
Interest expense & other | (115 | ) | (106 | ) | (73 | ) | ||||||
Earnings beforeincome taxes | 111,206 | 100,790 | 86,286 | |||||||||
Income taxes | 39,392 | 36,409 | 32,168 | |||||||||
NET EARNINGS | $ | 71,814 | $ | 64,381 | $ | 54,118 | ||||||
Earnings per diluted share | $ | 3.82 | $ | 3.41 | $ | 2.86 | ||||||
Weighted average numberof diluted shares | 18,807 | 18,878 | 18,917 | |||||||||
Earnings per basic share | $ | 3.85 | $ | 3.43 | $ | 2.87 | ||||||
Weighted average number ofbasic shares | 18,677 | 18,785 | 18,854 | |||||||||
(1) | Includes share-based compensation expense of $466 for the year ended September 27, 2014, $463 for the year ended September 28, 2013 and $270 for the year ended September 29, 2012. |
(2) | Includes share-based compensation expense of $673 for the year ended September 27, 2014, $635 for the year ended September 28, 2013 and $403 for the year ended September 29, 2012. |
(3) | Includes share-based compensation expense of $42 for the year ended September 27, 2014, $30 for the year ended September 28, 2013 and $27 for the year ended September 29, 2012. |
(4) | Includes share-based compensation expense of $895 for the year ended September 27, 2014, $742 for the year ended September 28, 2013 and $546 for the year ended September 29, 2012. |
The accompanying notes are an integral part of these statements.
J&J SNACK FOODS CORP. AND SUBSIDIARIES
CONSOLIDATED STATEMENTS OF COMPREHENSIVE INCOME
(in thousands)
Fiscal Year Ended | ||||||||||||
September 27, | September 28, | Sepember 29, | ||||||||||
2014 | 2013 | 2012 | ||||||||||
(52 weeks) | (52 weeks) | (53 weeks) | ||||||||||
Net Earnings | $ | 71,814 | $ | 64,381 | $ | 54,118 | ||||||
Foreign currency translation adjustments | (929 | ) | (571 | ) | 782 | |||||||
Unrealized holding gain (loss) on marketable securities | 505 | (2,227 | ) | - | ||||||||
Amount reclassified from accumulated othercomprehensive income | 366 | - | - | |||||||||
Total Other Comprehensive (Loss) Income, net of tax | (58 | ) | (2,798 | ) | 782 | |||||||
Comprehensive Income | $ | 71,756 | $ | 61,583 | $ | 54,900 | ||||||
The accompanying notes are an integral part of these statements.
J & J SNACK FOODS CORP. AND SUBSIDIARIES
CONSOLIDATED STATEMENT OF CHANGES IN STOCKHOLDERS' EQUITY
(in thousands)
| Common Stock | Accumulated Other Comprehensive | Retained | Comprehensive | |||||||||||||||||||||
| Shares | Amount | Loss | Earnings | Total | Income | |||||||||||||||||||
| Balance at September 27, 2009 | 18,526 | $ | 41,777 | $ | (3,431 | ) | $ | 304,498 | $ | 342,844 | ||||||||||||||
Issuance of common stock upon exercise of stock options | 142 | 2,325 | - | - | 2,325 | |||||||||||||||||||
Issuance of common stock for employee stock purchase plan | 22 | 726 | - | - | 726 | |||||||||||||||||||
Foreign currency translation adjustment | - | - | 577 | - | 577 | $ | 577 | |||||||||||||||||
Issuance of common stock under deferred stock plan | 5 | 280 | - | - | 280 | |||||||||||||||||||
| Dividends declared | - | - | - | (7,931 | ) | (7,931 | ) | |||||||||||||||||
| Share-based compensation | - | 1,113 | - | - | 1,113 | |||||||||||||||||||
| Repurchase of common stock | (204 | ) | (7,768 | ) | - | - | (7,768 | ) | ||||||||||||||||
| Net earnings | - | - | - | 48,409 | 48,409 | 48,409 | ||||||||||||||||||
| Comprehensive income | - | - | - | - | - | $ | 48,986 | |||||||||||||||||
| Balance at September 25, 2010 | 18,491 | $ | 38,453 | $ | (2,854 | ) | $ | 344,976 | $ | 380,575 | ||||||||||||||
Issuance of common stock upon exercise of stock options | 214 | 4,608 | - | - | 4,608 | |||||||||||||||||||
Issuance of common stock for employee stock purchase plan | 20 | 769 | - | - | 769 | |||||||||||||||||||
Foreign currency translation adjustment | - | - | (1,060 | ) | - | (1,060 | ) | $ | (1,060 | ) | ||||||||||||||
Issuance of common stock to directors | 2 | 75 | - | - | 75 | |||||||||||||||||||
| Dividends declared | - | - | (8,754 | ) | (8,754 | ) | ||||||||||||||||||
| Share-based compensation | - | 1,112 | - | - | 1,112 | |||||||||||||||||||
| Repurchase of common stock | - | - | - | - | - | |||||||||||||||||||
| Net earnings | - | - | - | 55,063 | 55,063 | 55,063 | ||||||||||||||||||
| Comprehensive income | - | - | - | - | - | $ | 54,003 | |||||||||||||||||
| Balance at September 24, 2011 | 18,727 | $ | 45,017 | $ | (3,914 | ) | $ | 391,285 | $ | 432,388 | ||||||||||||||
Issuance of common stock upon exercise of stock options | 105 | 3,332 | - | - | 3,332 | |||||||||||||||||||
Issuance of common stock for employee stock purchase plan | 20 | 896 | - | - | 896 | |||||||||||||||||||
Foreign currency translation adjustment | - | - | 782 | - | 782 | $ | 782 | |||||||||||||||||
Issuance of common stock under deferred stock plan | 70 | 687 | - | - | 687 | |||||||||||||||||||
| Dividends declared | - | - | - | (9,795 | ) | (9,795 | ) | |||||||||||||||||
| Share-based compensation | - | 1,246 | - | - | 1,246 | |||||||||||||||||||
| Repurchase of common stock | (142 | ) | (8,167 | ) | - | - | (8,167 | ) | ||||||||||||||||
| Net earnings | - | - | - | 54,118 | 54,118 | 54,118 | ||||||||||||||||||
| Comprehensive income | - | - | - | - | - | $ | 54,900 | |||||||||||||||||
| Balance at September 29, 2012 | 18,780 | $ | 43,011 | $ | (3,132 | ) | $ | 435,608 | $ | 475,487 | ||||||||||||||
Accumulated | ||||||||||||||||||||
Other | ||||||||||||||||||||
Common Stock | Comprehensive | Retained | ||||||||||||||||||
Shares | Amount | Loss | Earnings | Total | ||||||||||||||||
Balance at September 25, 2011 | 18,727 | $ | 45,017 | $ | (3,914 | ) | $ | 391,285 | $ | 432,388 | ||||||||||
Issuance of common stock uponexercise of stock options | 105 | 3,332 | - | - | 3,332 | |||||||||||||||
Issuance of common stock foremployee stock purchase plan | 20 | 896 | - | - | 896 | |||||||||||||||
Foreign currency translationadjustment | - | - | 782 | - | 782 | |||||||||||||||
Issuance of common stock underdeferred stock plan | 70 | 687 | - | - | 687 | |||||||||||||||
Dividends declared | - | - | - | (9,795 | ) | (9,795 | ) | |||||||||||||
Share-based compensation | - | 1,246 | - | - | 1,246 | |||||||||||||||
Repurchase of common stock | (142 | ) | (8,167 | ) | - | - | (8,167 | ) | ||||||||||||
Net earnings | - | - | - | 54,118 | 54,118 | |||||||||||||||
Balance at September 29, 2012 | 18,780 | $ | 43,011 | $ | (3,132 | ) | $ | 435,608 | $ | 475,487 | ||||||||||
Issuance of common stock uponexercise of stock options | 80 | 2,905 | - | - | 2,905 | |||||||||||||||
Issuance of common stock foremployee stock purchase plan | 20 | 1,043 | - | - | 1,043 | |||||||||||||||
Foreign currency translationadjustment | - | - | (571 | ) | - | (571 | ) | |||||||||||||
Unrealized holding loss onmarketable securities | - | - | (2,227 | ) | - | (2,227 | ) | |||||||||||||
Issuance of common stock underdeferred stock plan | 1 | 103 | - | - | 103 | |||||||||||||||
Dividends declared | - | - | - | (12,010 | ) | (12,010 | ) | |||||||||||||
Share-based compensation | - | 1,954 | - | - | 1,954 | |||||||||||||||
Repurchase of common stock | (204 | ) | (14,500 | ) | - | - | (14,500 | ) | ||||||||||||
Net earnings | - | - | - | 64,381 | 64,381 | |||||||||||||||
Balance at September 28, 2013 | 18,677 | $ | 34,516 | $ | (5,930 | ) | $ | 487,979 | $ | 516,565 | ||||||||||
Issuance of common stock uponexercise of stock options | 52 | 2,227 | - | - | 2,227 | |||||||||||||||
Issuance of common stock foremployee stock purchase plan | 16 | 1,102 | - | - | 1,102 | |||||||||||||||
Foreign currency translationadjustment | - | - | (929 | ) | - | (929 | ) | |||||||||||||
Unrealized holding gain onmarketable securities | - | - | 871 | - | 871 | |||||||||||||||
Issuance of common stock underdeferred stock plan | - | 34 | - | - | 34 | |||||||||||||||
Dividends declared | - | - | - | (23,908 | ) | (23,908 | ) | |||||||||||||
Share-based compensation | - | 2,247 | - | - | 2,247 | |||||||||||||||
Repurchase of common stock | (82 | ) | (7,505 | ) | - | - | (7,505 | ) | ||||||||||||
Net earnings | - | - | - | 71,814 | 71,814 | |||||||||||||||
Balance at September 27, 2014 | 18,663 | $ | 32,621 | $ | (5,988 | ) | $ | 535,885 | $ | 562,518 | ||||||||||
The accompanying notes are an integral part of this statement
J & J SNACK FOODS CORP. AND SUBSIDIARIES
CONSOLIDATED STATEMENTS OF CASH FLOWS
(in thousands)
| Fiscal Year Ended | ||||||||||||
September 29, 2012 | September 24, 2011 | September 25, 2010 | ||||||||||
| (53 weeks) | (52 weeks) | (52 weeks) | ||||||||||
| Operating activities: | ||||||||||||
| Net earnings | $ | 54,118 | $ | 55,063 | $ | 48,409 | ||||||
Adjustments to reconcile net earnings to net cash provided by operating activities: | ||||||||||||
| Depreciation of fixed assets | 26,175 | 25,046 | 24,498 | |||||||||
| Amortization of intangibles and deferred costs | 4,762 | 5,188 | 5,354 | |||||||||
| (Gains)losses from disposals and impairment of property & equipment | (146 | ) | 52 | (14 | ) | |||||||
| Share-based compensation | 1,246 | 918 | 1,248 | |||||||||
| Gain on bargain purchase of a business | - | (6,580 | ) | - | ||||||||
| Deferred income taxes | 3,108 | 6,108 | 3,219 | |||||||||
Changes in assets and liabilities, net of effects from purchase of companies: | ||||||||||||
| Increase in accounts receivable | (605 | ) | (5,231 | ) | (8,629 | ) | ||||||
| Increase in inventories | (6,463 | ) | (6,262 | ) | (4,422 | ) | ||||||
| Decrease(increase) in prepaid expenses and other | 1,982 | 1,870 | (4,101 | ) | ||||||||
| Increase in accounts payable and accrued liabilities | 5,248 | 4,284 | 2,446 | |||||||||
| Net cash provided by operating activities | 89,425 | 80,456 | 68,008 | |||||||||
| Investing activities: | ||||||||||||
| Payments for purchases of companies, net of cash acquired | (7,900 | ) | (8,806 | ) | (25,185 | ) | ||||||
| Purchases of property, plant and equipment | (42,800 | ) | (29,124 | ) | (33,531 | ) | ||||||
| Purchases of marketable securities | (68,450 | ) | (63,293 | ) | (50,496 | ) | ||||||
| Proceeds from redemption and sales of marketable securities | 109,744 | 37,568 | 67,362 | |||||||||
| Proceeds from disposal of property and equipment | 1,038 | 394 | 407 | |||||||||
| Other | (950 | ) | (644 | ) | (12 | ) | ||||||
| Net cash used in investing activities | (9,318 | ) | (63,905 | ) | (41,455 | ) | ||||||
| Financing activities: | ||||||||||||
| Payments to repurchase common stock | (8,167 | ) | - | (7,768 | ) | |||||||
| Proceeds from issuance of common stock | 4,228 | 5,377 | 3,051 | |||||||||
| Payments on capitalized lease obligations | (312 | ) | (244 | ) | (143 | ) | ||||||
| Payment of cash dividend | (9,549 | ) | (8,540 | ) | (7,749 | ) | ||||||
| Net cash used in financing activities | (13,800 | ) | (3,407 | ) | (12,609 | ) | ||||||
| Effect of exchange rates on cash and cash equivalents | 412 | (330 | ) | 378 | ||||||||
| Net increase in cash and cash equivalents | 66,719 | 12,814 | 14,322 | |||||||||
| Cash and cash equivalents at beginning of year | 87,479 | 74,665 | 60,343 | |||||||||
| Cash and cash equivalents at end of year | $ | 154,198 | $ | 87,479 | $ | 74,665 | ||||||
Fiscal Year Ended | ||||||||||||
September 27, | September 28, | September 29, | ||||||||||
2014 | 2013 | 2012 | ||||||||||
(52 weeks) | (52 weeks) | (53 weeks) | ||||||||||
Operating activities: | ||||||||||||
Net earnings | $ | 71,814 | $ | 64,381 | $ | 54,118 | ||||||
Adjustments to reconcile net earnings to net cash provided byoperating activities: | ||||||||||||
Depreciation of fixed assets | 31,660 | 28,801 | 26,175 | |||||||||
Amortization of intangibles and deferred costs | 5,433 | 4,751 | 4,762 | |||||||||
(Gains)losses from disposals and impairment of property & equipment | (119 | ) | 126 | (146 | ) | |||||||
Share-based compensation | 2,076 | 1,870 | 1,246 | |||||||||
Deferred income taxes | (8 | ) | 74 | 3,108 | ||||||||
Loss on sale of marketable securities | 361 | - | - | |||||||||
Changes in assets and liabilities, net of effects from purchaseof companies: | ||||||||||||
Increase in accounts receivable, net | (8,913 | ) | (11,148 | ) | (605 | ) | ||||||
Increase in inventories | (2,411 | ) | (1,819 | ) | (6,463 | ) | ||||||
(Increase) decrease in prepaid expenses and other | (182 | ) | (1,067 | ) | 1,982 | |||||||
Increase in accounts payable and accrued liabilities | 6,831 | 579 | 5,248 | |||||||||
Net cash provided by operating activities | 106,542 | 86,548 | 89,425 | |||||||||
Investing activities: | ||||||||||||
Payments for purchases of companies, net of cash acquired | (28,360 | ) | - | (7,900 | ) | |||||||
Purchases of property, plant and equipment | (38,831 | ) | (35,821 | ) | (42,800 | ) | ||||||
Purchases of marketable securities | (26,932 | ) | (111,241 | ) | (68,450 | ) | ||||||
Proceeds from redemption and sales of marketable securities | 7,245 | 25,307 | 109,744 | |||||||||
Proceeds from disposal of property and equipment | 1,572 | 1,199 | 1,038 | |||||||||
Other | (806 | ) | (281 | ) | (950 | ) | ||||||
Net cash used in investing activities | (86,112 | ) | (120,837 | ) | (9,318 | ) | ||||||
Financing activities: | ||||||||||||
Payments to repurchase common stock | (7,505 | ) | (14,500 | ) | (8,167 | ) | ||||||
Proceeds from issuance of common stock | 3,320 | 3,948 | 4,228 | |||||||||
Payments on capitalized lease obligations | (326 | ) | (340 | ) | (312 | ) | ||||||
Payment of cash dividend | (20,924 | ) | (11,468 | ) | (9,549 | ) | ||||||
Net cash used in financing activities | (25,435 | ) | (22,360 | ) | (13,800 | ) | ||||||
Effect of exchange rates on cash and cash equivalents | (580 | ) | (204 | ) | 412 | |||||||
Net (decrease) increase in cash and cash equivalents | (5,585 | ) | (56,853 | ) | 66,719 | |||||||
Cash and cash equivalents at beginning of year | 97,345 | 154,198 | 87,479 | |||||||||
Cash and cash equivalents at end of year | $ | 91,760 | $ | 97,345 | $ | 154,198 | ||||||
The accompanying notes are an integral part of these statements.
J & J SNACK FOODS CORP. AND SUBSIDIARIES
NOTES TO CONSOLIDATED FINANCIAL STATEMENTS
NOTE A – SUMMARY OF SIGNIFICANT ACCOUNTING POLICIES
J & J Snack Foods Corp. and Subsidiaries (the Company) manufactures, markets and distributes a variety of nutritional snack foods and beverages to the food service and retail supermarket industries. A summary of the significant accounting policies consistently applied in the preparation of the accompanying consolidated financial statements follows.
1. Principles of Consolidation
The consolidated financial statements include the accounts of J & J Snack Foods Corp. and its wholly-owned subsidiaries. Intercompany balances and transactions have been eliminated in the consolidated financial statements.
2. Revenue Recognition
We recognize revenue from our products when the products are shipped to our customers. Repair and maintenance equipment service revenue is recorded when it is performed provided the customer terms are that the customer is to be charged on a time and material basis or on a straight-line basis over the term of the contract when the customer has signed a service contract. Revenue is recognized only where persuasive evidence of an arrangement exists, our price is fixed or estimable and collectability is reasonably assured. We record offsets to revenue for allowances, end-user pricing adjustments, trade spending, coupon redemption costs and returned product. Customers generally do not have the right to return product unless it is damaged or defective. Our recorded liability for allowances, end-user pricing adjustments and trade spending was approximately $12$11.5 million at both September 29, 201227, 2014 and $10 million at September 24, 2011.
All amounts billed to customers related to shipping and handling are classified as revenues. Our product costs include amounts for shipping and handling, therefore, we charge our customers shipping and handling fees at the time the products are shipped or when services are performed. The cost of shipping products to the customer is recognized at the time the products are shipped to the customer and our policy is to classify them as Distribution expenses. The cost of shipping products to the customer classified as Distribution expenses was $62,250,000, $57,462,000$71,159,000, $65,025,000 and $52,146,000$62,250,000 for the fiscal years ended 2014, 2013 and 2012, 2011 and 2010, respectively.
During the years ended September 27, 2014, September 28, 2013 and September 29, 2012, September 24, 2011 and September 25, 2010, we sold $20,324,000, $18,711,000,$22,826,000, $22,836,000 and $16,185,000,$20,324,000, respectively, of repair and maintenance service contracts in our frozen beverage business. At September 29, 201227, 2014 and September 24, 2011,28, 2013, deferred income on repair and maintenance service contracts was $1,398,000$1,577,000 and $1,383,000,$1,454,000, respectively, of which $6,000$67,000 and $34,000$45,000 is included in other long-term liabilities as of September 29, 201227, 2014 and September 24, 2011,28, 2013, respectively and the balance is reflected as short-term and included in accrued liabilities on the consolidated balance sheet. Repair and maintenance service contract income of $20,309,000, $18,744,000$22,748,000, $22,780,000 and $16,192,000$20,309,000 was recognized for the fiscal years ended 2014, 2013 and 2012, 2011 and 2010, respectively.
3. Foreign Currency
Assets and liabilities in foreign currencies are translated into U.S. dollars at the rate of exchange prevailing at the balance sheet date. Revenues and expenses are translated at the average rate of exchange for the period. The cumulative translation adjustment is recorded as a separate component of stockholders’ equity and changes to such are included in comprehensive income.
4. Use of Estimates
In preparing financial statements in conformity with accounting principles generally accepted in the United States of America, management is required to make estimates and assumptions that affect the reported amounts of assets and liabilities, the disclosure of contingent assets and liabilities at the date of the financial statements, and the reported amounts of revenues and expenses during the reporting period. Actual results could differ from those estimates.
5. Cash Equivalents
Cash equivalents are short-term, highly liquid investments with original maturities of three months or less.
J & J SNACK FOODS CORP. AND SUBSIDIARIES
NOTES TO CONSOLIDATED FINANCIAL STATEMENTS(continued)
NOTE A – SUMMARY OF SIGNIFICANT ACCOUNTING POLICIES(continued)
6. Concentrations of Credit Risk andCash, Accounts Receivable,
We maintain cash balances at financial institutions located in various states. OurWe have cash balances at two banks totalling approximately $67 million that is in bank accounts which are insured by the Federal Deposit Insurance Corporation with no limit under existing law through December 31, 2012.
Financial instruments that could potentially subject us to concentrations of credit risk are trade accounts receivable; however, such risks are limited due to the large number of customers comprising our customer base and their dispersion across geographic regions. We usually have approximately 1015 customers with accounts receivable balances of between $1 million and $7$10 million.
We have several large customers that account for a significant portion of our sales. Our top ten customers accounted for 41%, 43% and 42%41% of our sales during fiscal years 2012, 20112014, 2013 and 2010,2012, respectively, with our largest customer accounting for 8% of our sales in 2012,2014, 8% of our sales in 20112013 and 8% in 2010.2012. Three of the ten customers are food distributors who sell our product to many end users.
About 25% of our employees are covered by collective bargaining agreements with one agreement covering about 5% of our employees expiring in 2015.
None of our vendors supplied more than 10% of our ingredients and packaging in 2014, 2013 or 2012.
The majority of our accounts receivable are due from trade customers. Credit is extended based on evaluation of our customers’ financial condition and collateral is not required. Accounts receivable payment terms vary and are stated in the financial statements at amounts due from customers net of an allowance for doubtful accounts. At September 27, 2014 and September 28, 2013, our accounts receivables were $99,972,000 and $87,545,000 net of an allowance for doubtful accounts of $450,000 and $854,000. Accounts receivable outstanding longer than the payment terms are considered past due. We determine our allowance by considering a number of factors, including the length of time trade accounts receivable are past due, our previous loss history, customers’ current ability to pay their obligations to us, and the condition of the general economy and the industry as a whole. We write off accounts receivable when they become uncollectible, and payments subsequently received on such receivables are credited to the allowance for doubtful accounts.
7. Inventories
Inventories are valued at the lower of cost (determined by the first-in, first-out or weighted-average method) or market. We recognize abnormal amounts of idle facilities, freight, handling costs, and spoilage as charges of the current period. Additionally, we allocate fixed production overheadsoverhead to inventories based on the normal capacity of our production facilities. We calculate normal capacity as the production expected to be achieved over a number of periods or seasons under normal circumstances, taking into account the loss of capacity resulting from planned maintenance. This requires us to use judgment to determine when production is outside the range of expected variation in production (either abnormally low or abnormally high). In periods of abnormally low production (for example, periods in which there is significantly lower demand, labor and material shortages exist, or there is unplanned equipment downtime) the amount of fixed overhead allocated to each unit of production is not increased. However, in periods of abnormally high production the amount of fixed overhead allocated to each unit of production is decreased to assure inventories are not measured above cost.
We review for slow moving and obsolete inventory and a reserve is established for the value of inventory that we estimate will not be used. At September 29, 201227, 2014 and September 24, 2011,28, 2013, our reserve for inventory was $3,883,000$3,982,000 and $4,615,000,$4,449,000, respectively.
J & J SNACK FOODS CORP. AND SUBSIDIARIES
NOTES TO CONSOLIDATED FINANCIAL STATEMENTS(continued)
NOTE A – SUMMARY OF SIGNIFICANT ACCOUNTING POLICIES(continued)
8. Investment Securities
We classify our investment securities in one of three categories: held to maturity, trading, or available for sale. Our investment portfolio at September 29, 2012,27, 2014, consists solely of investments classified as held to maturity.maturity and available for sale. The mutual funds in our available for sale portfolio do not have contractual maturities; however, we classify them as long term assets as it is our intent to hold them for a period of over one year, although we may sell some or all of them depending on presently unanticipated needs for liquidity or market conditions. See Note C for further information on our holdings of investment securities.
9. Depreciation and Amortization
Depreciation of equipment and buildings is provided for by the straight-line method over the assets’ estimated useful lives. We review our equipment and buildings to ensure that they provide economic benefit and are not impaired.
Amortization of improvements is provided for by the straight-line method over the term of the lease or the assets’ estimated useful lives, whichever is shorter. Licenses and rights, customer relationships and non compete agreements are being amortized by the straight-line method over periods ranging from 32 to 20 years and amortization expense is reflected throughout operating expenses.
Long-lived assets, including fixed assets and amortizing intangibles, are reviewed for impairment as events or changes in circumstances occur indicating that the carrying amount of theofthe asset may not be recoverable. Indefinite lived intangibles are reviewed annually for impairment. Cash flow and sales analyses are used to assess impairment. The estimates of future cash flows and sales involve considerable management judgment and are based upon assumptions about expected future operating performance. Assumptions used in these forecasts are consistent with internal planning. The actual cash flows and sales could differ from management’s estimates due to changes in business conditions, operating performance, economic conditions, competition and consumer preferences.
10. Fair Value of Financial Instruments
The carrying value of our short-term financial instruments, such as accounts receivables and accounts payable, approximate their fair values, based on the short-term maturities of these instruments.
11. Income Taxes
We account for our income taxes under the liability method. Under the liability method, deferred tax assets and liabilities are determined based on the difference between the financial statement and tax bases of assets and liabilities as measured by the enacted tax rates that will be in effect when these differences reverse. Deferred tax expense is the result of changes in deferred tax assets and liabilities.
Additionally, we recognize a liability for income taxes and associated penalties and interest for tax positions taken or expected to be taken in a tax return which are more likely than not to be overturned by taxing authorities (“uncertain tax positions”). We have not recognized a tax benefit in our financial statements for these uncertain tax positions.
J & J SNACK FOODS CORP. AND SUBSIDIARIES
NOTES TO CONSOLIDATED FINANCIAL STATEMENTS(continued)
NOTE A – SUMMARY OF SIGNIFICANT ACCOUNTING POLICIES(continued)
As of September 29, 201227, 2014 and September 24, 2011,28, 2013, the total amount of gross unrecognized tax benefits is $541,000$315,000 and $638,000,$438,000, respectively, all of which would impact our effective tax rate over time, if recognized. We recognize interest and penalties related to income tax matters as a part of the provision for income taxes. The Company had $284,000$180,000 and $335,000$224,000 of accrued interest and penalties as of September 29, 201227, 2014 and September 24, 2011,28, 2013, respectively. We recognized $10,000, $8,000$11,000 and $7,000$10,000 of penalties and interest in the years ended September 28, 2013 and September 29, 2012, respectively, and none in the year ended September 24, 2011 and September 25, 2010 respectively.27, 2014. A reconciliation of the beginning and ending amount of unrecognized tax benefits is as follows:
| (in thousands) | ||||
| Balance at September 24, 2011 | $ | 638 | ||
Additions based on tax positions related to the current year | 73 | |||
| Reductions for tax positions of prior years | (170 | ) | ||
| Settlements | - | |||
| Balance at September 29, 2012 | $ | 541 | ||
(in thousands) | ||||
Balance at September 28, 2013 | $ | 438 | ||
Additions based on tax positionsrelated to the current year | - | |||
Reductions for tax positions of prior years | (123 | ) | ||
Settlements | - | |||
Balance at September 27, 2014 | $ | 315 | ||
In addition to our federal tax return and tax returns for Mexico and Canada, we file tax returns in all states that have a corporate income tax. Virtually all the returns noted above are open for examination for three to four years.
12. Earnings Per Common Share
Basic earnings per common share (EPS) excludes dilution and is computed by dividing income available to common shareholders by the weighted average common shares outstanding during the period. Diluted EPS takes into consideration the potential dilution that could occur if securities (stock options) or other contracts to issue common stock were exercised and converted into common stock.
Our calculation of EPS is as follows:
| Fiscal Year Ended September 29, 2012 | ||||||||||||
Income (Numerator) | Shares (Denominator) | Per Share Amount | ||||||||||
| (in thousands, except per share amounts) | ||||||||||||
| Earnings Per Basic Share | ||||||||||||
Net Income available to common stockholders | $ | 54,118 | 18,854 | $ | 2.87 | |||||||
| Effect of Dilutive Securities | ||||||||||||
| Options | - | 63 | $ | (0.01 | ) | |||||||
| Earnings Per Diluted Share | ||||||||||||
Net Income available to common stockholders plus assumed conversions | $ | 54,118 | 18,917 | $ | 2.86 | |||||||
| Fiscal Year Ended September 27, 2014 | ||||||||||||
Income | Shares | Per Share | ||||||||||
(Numerator) | (Denominator) | Amount | ||||||||||
(in thousands, except per share amounts) | ||||||||||||
Earnings Per Basic Share | ||||||||||||
Net Income availableto common stockholders | $ | 71,814 | 18,677 | $ | 3.85 | |||||||
Effect of Dilutive Securities | ||||||||||||
Options | - | 130 | (0.03 | ) | ||||||||
Earnings Per Diluted Share | ||||||||||||
Net Income available tocommon stockholders plusassumed conversions | $ | 71,814 | 18,807 | $ | 3.82 | |||||||
J & J SNACK FOODS CORP. AND SUBSIDIARIES
NOTES TO CONSOLIDATED FINANCIAL STATEMENTS(continued)
NOTE A – SUMMARY OF SIGNIFICANT ACCOUNTING POLICIES(continued)
No anti-dilutive shares have been excluded in the computation of2014 diluted EPS.
| Fiscal Year Ended September 28, 2013 | ||||||||||||
Income | Shares | Per Share | ||||||||||
(Numerator) | (Denominator) | Amount | ||||||||||
(in thousands, except per share amounts) | ||||||||||||
Earnings Per Basic Share | ||||||||||||
Net Income availableto common stockholders | $ | 64,381 | 18,785 | $ | 3.43 | |||||||
Effect of Dilutive Securities | ||||||||||||
Options | - | 93 | (0.02 | ) | ||||||||
Earnings Per Diluted Share | ||||||||||||
Net Income available tocommon stockholders plusassumed conversions | $ | 64,381 | 18,878 | $ | 3.41 | |||||||
No anti-dilutive shares have been excluded in the computation of2013 diluted EPS.
| Fiscal Year Ended September 29, 2012 | ||||||||||||
Income | Shares | Per Share | ||||||||||
(Numerator) | (Denominator) | Amount | ||||||||||
(in thousands, except per share amounts) | ||||||||||||
Earnings Per Basic Share | ||||||||||||
Net Income availableto common stockholders | $ | 54,118 | 18,854 | $ | 2.87 | |||||||
Effect of Dilutive Securities | ||||||||||||
Options | - | 63 | (0.01 | ) | ||||||||
Earnings Per Diluted Share | ||||||||||||
Net Income available tocommon stockholders plusassumed conversions | $ | 54,118 | 18,917 | $ | 2.86 | |||||||
162,142 anti-dilutive shares have been excluded in the computation of2012 diluted EPS because the options' exercise price is greater than the average market price of the common stock.
| Fiscal Year Ended September 24, 2011 | ||||||||||||
Income (Numerator) | Shares (Denominator) | Per Share Amount | ||||||||||
| (in thousand, except per share amounts) | ||||||||||||
| Earnings Per Basic Share | ||||||||||||
Net Income available to common stockholders | $ | 55,063 | 18,672 | $ | 2.95 | |||||||
| Effect of Dilutive Securities | ||||||||||||
| Options | - | 117 | $ | (0.02 | ) | |||||||
| Earnings Per Diluted Share | ||||||||||||
Net Income available to common stockholders plus assumed conversions | $ | 55,063 | 18,789 | $ | 2.93 | |||||||
| Fiscal Year Ended September 25, 2010 | ||||||||||||
Income (Numerator) | Shares (Denominator) | Per Share Amount | ||||||||||
| (in thousands, except per share amounts) | ||||||||||||
| Earnings Per Basic Share | ||||||||||||
Net Income available to common stockholders | $ | 48,409 | 18,528 | $ | 2.61 | |||||||
| Effect of Dilutive Securities | ||||||||||||
| Options | - | 175 | $ | (0.02 | ) | |||||||
| Earnings Per Diluted Share | ||||||||||||
Net Income available to common stockholders plus assumed conversions | $ | 48,409 | 18,703 | $ | 2.59 | |||||||
110,910 anti-dilutive shares have been excluded in the computation of 2010 diluted EPS because the options' exercise price is greater than the average market price of the common stock.
NOTES TO CONSOLIDATED FINANCIAL STATEMENTS (continued)
NOTE A – SUMMARY OF SIGNIFICANT ACCOUNTING POLICIES - (continued)
13. Accounting for Stock-Based Compensation
At September 29, 2012,27, 2014, the Company has three stock-based employee compensation plans. Share-based compensation was recognized as follows:
| Fiscal year ended | ||||||||||||
September 29, 2012 | September 24, 2011 | September 25, 2010 | ||||||||||
| (in thousands, except per share amounts) | ||||||||||||
| Stock options | $ | 684 | $ | 288 | $ | 592 | ||||||
| Stock purchase plan | 256 | 203 | 184 | |||||||||
| Deferred stock issued to outside directors | - | 46 | 138 | |||||||||
| Restricted stock issued to an employee | 1 | - | 28 | |||||||||
| $ | 941 | $ | 537 | $ | 942 | |||||||
| Per diluted share | $ | 0.05 | $ | 0.03 | $ | 0.05 | ||||||
| The above compensation is net of tax benefits | $ | 305 | $ | 381 | $ | 306 | ||||||
Fiscal year ended | ||||||||||||
September 27, | September 28, | September 29, | ||||||||||
2014 | 2013 | 2012 | ||||||||||
(in thousands, except per share amounts) | ||||||||||||
Stock options | $ | 1,262 | $ | 795 | $ | 684 | ||||||
Stock purchase plan | 329 | 363 | 256 | |||||||||
Stock issued to outside directors | - | 47 | - | |||||||||
Stock issued to employees | 17 | 18 | 1 | |||||||||
Total share-based compensation | $ | 1,608 | $ | 1,223 | $ | 941 | ||||||
Per diluted share | $ | 0.09 | $ | 0.06 | $ | 0.05 | ||||||
The above compensation is net of tax benefits | $ | 468 | $ | 647 | $ | 305 | ||||||
At September 29, 2012,27, 2014, the Company has unrecognized compensation expense of approximately $3.2$1.7 million to be recognized over the next three fiscal years.
The fair value of each option grant is estimated on the date of grant using the Black-Scholes options-pricing model with the following weighted average assumptions used for grants in fiscal 2012, 20112014, 2013 and 2010:2012: expected volatility of 20.6% for fiscal year 2014, 25.7% for fiscal year 2013 and 28.3% for fiscal year 2012, 28.6% for fiscal year 2011 and 29.0% for fiscal year 2010:2012: weighted average risk-free interest rates of .81%1.6%, 1.56%2.5 % and 2.21%.8%;dividend rate of .9%, .9%.8% and 1.2%.9% and expected lives ranging betweenrangingbetween 5 and 10 years for all years. An expected forfeiture rate of 20% was used for 2014, 20% was used for 2013 and 18% was used for 2012 and 13% was used for fiscal years 2011 and 2010.
Expected volatility is based on the historical volatility of the price of our common shares over the past 52 to 5455 months for 5 year options and 10 years for 10 year options. We use historical information to estimate expected life and forfeitures within the valuation model. The expected term of awards represents the period of time that options granted are expected to be outstanding. The risk-free rate for periods within the expected life of the option is based on the U.S. Treasury yield curve in effect at the time of grant. Compensation cost is recognized using a straight-line method over the vesting or service period and is net of estimated forfeitures.
14. Advertising Costs
Advertising costs are expensed as incurred. Total advertising expense was $2,571,000, $1,919,000$3,487,000, $3,069,000 and $2,751,000$2,571,000 for the fiscal years 2014, 2013 and 2012, 2011 and 2010, respectively.
15. Commodity Price Risk Management
Our most significant raw material requirements include flour, packaging, shortening, corn syrup, sugar, juice, cheese, chocolate, and a variety of nuts. We attempt to minimize the effect of future price fluctuations related to the purchase of raw materials primarily through forward purchasing to cover future manufacturing requirements, generally for periods from 1 to 12 months. As of September 29, 2012,27, 2014, we have approximately $55$60 million of such commitments. Futures contracts are not used in combination with forward purchasing of these raw materials. Our procurement practices are intended to reduce the risk of future price increases, but also may potentially limit the ability to benefit from possible price decreases. Our policy is to recognize estimated losses on purchase commitments when they occur. At each of the last three fiscal year ends, we did not have any material losses on our purchase commitments.
J & J SNACK FOODS CORP. AND SUBSIDIARIES
NOTES TO CONSOLIDATED FINANCIAL STATEMENTS(continued)
NOTE A – SUMMARY OF SIGNIFICANT ACCOUNTING POLICIES(continued)
16.Research and Development Costs
Research and development costs are expensed as incurred. Total research and development expense was $501,000, $941,000$499,000, $478,000 and $866,000$501,000 for the fiscal years 2014, 2013 and 2012, 2011 and 2010, respectively.
17. Recent Accounting Pronouncements
In January 2010,February 2013, the FASB issued guidance that amends existing disclosure requirements of fair value measurements adding required disclosureswhich requires us to provide information about items transferring into andthe amounts reclassified out of Levels 1 and 2accumulated other comprehensive income by component. In addition, we are required to present, either on the face of the statement where net income is presented or in the fair value hierarchy; adding separatenotes, significant amounts reclassified out of accumulated other comprehensive income by the respective line items of net income but only if the amount reclassified is required under U.S. GAAP to be reclassified to net income in its entirety in the same reporting period. For other amounts not required under U.S. GAAP to be reclassified in their entirety to net income, we are required to cross-reference to other disclosures required under U.S. GAAP that provide additional detail about purchases, sales, issuances, and settlements relative to Level 3 measurements; and clarifying, among other things, the existing fair value disclosures about the level of disaggregation.those amounts. This guidance was effective for our fiscal year beginning September 26, 2010, except for the requirement to provide Level 3 activity of purchases, sales, issuances, and settlements on a gross basis, which was effective for our fiscal year beginning September 25, 2011. Since this standard impacts disclosure requirements only, its adoption has not had any impact on the Company’s consolidated results of operations or financial condition.
In June 2011,May 2014, the FASB issued guidance on revenue recognition which gives ussays that we should recognize revenue to depict the optiontransfer of promised goods or services to presentcustomers in an amount that reflects the total of comprehensive income, the components of net income, and the components of other comprehensive income eitherconsideration which we expect to be entitled in a single continuous statement of comprehensive incomeexchange for those goods or in two separate but consecutive statements. In both options, we are required to present each component of other comprehensive income along with a total for other comprehensive income, and a total amount for comprehensive income.services. This guidance eliminates the option to present the components of other comprehensive income as part of the statement of changes in stockholders' equity. The amendments in this guidance do not change the items that must be reported in other comprehensive income or when an item of other comprehensive income must be reclassified to net income. This guidance will beis effective for our fiscal year 2013, andending September 2018. Early application is not expected topermitted. We will assess the impact this guidance will have a material impact on our consolidated financial statements.
In December 2010, the FASB issued guidance related to goodwill impairment testing for reporting entities with a zero or negative carrying amount. Under the amended guidance, we must consider whether it is more likely than not that a goodwill impairment exists for reporting units with a zero or negative carrying amount. If it is more likely than not that a goodwill impairment exists, the second step of the goodwill impairment test must be performed to measure the amount of the goodwill impairment loss, if any. This guidance was effective for our fiscal year 2012 and has not had a material impact on our financial statements.
Certain prior year financial statement amounts have been reclassified to be consistent with the presentation for the current year.
NOTE B – ACQUISITIONS
| California Churros | Other | |||||||
| (in thousands) | ||||||||
| Working Capital | $ | 1,075 | $ | - | ||||
| Property, plant & equipment | 2,373 | 1,135 | ||||||
| Trade Names | 4,024 | - | ||||||
| Customer Relationships | 6,737 | - | ||||||
| Covenant not to Compete | 35 | 50 | ||||||
| Goodwill | 9,756 | - | ||||||
| $ | 24,000 | $ | 1,185 | |||||
| (in thousands) | ||||
| Working Capital | $ | 6,955 | ||
| Property, plant & equipment | 11,036 | |||
| Trade Names | 1,325 | |||
| Customer Relationships | 207 | |||
| Deferred tax liability | (4,137 | ) | ||
| Net Assets Acquired | 15,386 | |||
| Purchase Price | 8,806 | |||
| Gain on bargain purchase | $ | 6,580 | ||
In June 2012, we acquired the assets of Kim & Scott’s Gourmet Pretzels, Inc., a manufacturer and seller of a premium brand soft pretzel. This business had sales of approximately $8 million over the prior twelve months to food service and retail supermarket customers, and had sales of approximately $1.8 million in our 2012 fiscal year from the acquisition date.
| (in thousands) | ||||
| Working Capital | $ | (89 | ) | |
| Property, plant & equipment | 724 | |||
| Trade Names | 126 | |||
| Customers Relationships | 235 | |||
| Non Compete Agreement | 75 | |||
| Goodwill | 6,829 | |||
| Purchase Price | $ | 7,900 | ||
Acquisition costs of $155,000 for the Kim & Scott’s acquisition are included in other general expense in the consolidated statements of earnings for the year ended September 29, 2012.
In October 2013, we acquired the assets of New York Pretzel, a manufacturer and distributor of soft pretzels selling primarily in the northeast to foodservice and retail locations. Of the purchase price of $11.8 million, $849,000 was allocated to intangible assets, $7,716,000 was allocated to goodwill and $3,049,000 was allocated to property, plant and equipment. This business had sales of about $4.3 million in our 2014 fiscal year included in the food service segment.
In May 2014, we acquired the stock of Philly’s Famous Water Ice, Inc. (PHILLY SWIRL). PHILLY SWIRL, located in Tampa, FL, produces frozen novelty products sold primarily to retail supermarket locations throughout the United States and to Canada with annual sales approximating $25 million. The allocation of the purchase price of $17.4 million is $4.0 million to working capital, $1.2 million to property, plant and equipment, $11.1 million to intangible assets, $1.8 million to goodwill, $4.0 million to deferred tax assets and $95,000 to other assets and $4.8 million to deferred tax liabilities. Sales of PHILLY SWIRL from the acquisition date to September 27, 2014 were $12.6 million and are included in the retail supermarket segment.
Acquisition costs of $269,000 for the New York Pretzel and PHILLY SWIRL acquisitions are included in other general expense in the consolidated statements of earnings for the year ended September 27, 2014.
J & J SNACK FOODS CORP. AND SUBSIDIARIES
NOTES TO CONSOLIDATED FINANCIAL STATEMENTS(continued)
NOTE B – ACQUISITIONS(continued)
The goodwill and intangible assets acquired in the business combinations are recorded at fair value. To measure fair value for such assets, we use techniques including discounted expected future cash flows (Level 3 input).
NOTE C – INVESTMENT SECURITIES
We have classified our investment securities as marketable securities held to maturity.maturity and available for sale. The FASB defines fair value as the price that would be received from selling an asset or paid to transfer a liability in an orderly transaction between market participants. As such, fair value is a market-based measurement that should be determined based on assumptions that market participants would use in pricing an asset or liability. As a basis for considering such assumptions, the FASB has established three levels of inputs that may be used to measure fair value:
Level 1 | Observable |
Level 2 | Observable inputs, other than Level 1 inputs in active markets, that are observable either directly or indirectly; and |
Level 3 | Unobservable inputs for which there is little or no market data, which require the reporting entity to develop its own assumptions. |
Our marketable securities held to maturity and available for sale values are derived solely from level 1 inputs.
The amortized cost, unrealized gains and losses, and fair market values of our investment securities held to maturity at September 29, 201227, 2014 are summarized as follows:
Gross | Gross | Fair | ||||||||||||||
Amortized | Unrealized | Unrealized | Market | |||||||||||||
Cost | Gains | Losses | Value | |||||||||||||
| (in thousands) | |||||||||||||||
US Government Agency Debt | $ | 2,000 | $ | - | $ | 13 | $ | 1,987 | ||||||||
Total investment securitiesheld to maturity | $ | 2,000 | $ | - | $ | 13 | $ | 1,987 | ||||||||
The amortized cost, unrealized gains and losses, and fair market values of our investment securities available for sale at September 27, 2014 are summarized as follows:
Gross | Gross | Fair | ||||||||||||||
Amortized | Unrealized | Unrealized | Market | |||||||||||||
Cost | Gains | Losses | Value | |||||||||||||
(in thousands) | ||||||||||||||||
Mutual Funds | $ | 129,473 | $ | 760 | $ | 2,116 | $ | 128,117 | ||||||||
Total investment securitiesavailable for sale | $ | 129,473 | $ | 760 | $ | 2,116 | $ | 128,117 | ||||||||
The mutual funds are primarily fixed income funds that seek current income with an emphasis on maintaining low volatility and overall moderate duration. The funds do not have contractual maturities; however, we classify them as long term assets as it is our intent to hold them for a period of over one year, although we may sell some or all of them depending on presently unanticipated needs for liquidity or market conditions. The unrealized losses of $2,116,000 are spread over 29 funds with a total fair market value of $107,861,000. Of the funds with unrealized losses at September 27, 2014, 20 funds with a total fair market value of $71,806,000 and unrealized losses of $1,685,000 also had unrealized losses at September 27, 2013.
Amortized Cost | Gross Unrealized | Gross Unrealized | Fair Market | |||||||||||||
| (in thousands) | ||||||||||||||||
| US Government Agency Debt | $ | 24,998 | $ | 126 | $ | - | $ | 25,124 | ||||||||
| Certificates of Deposit | 1,214 | - | - | 1,214 | ||||||||||||
| $ | 26,212 | $ | 126 | $ | - | $ | 26,338 | |||||||||
J & J SNACK FOODS CORP. AND SUBSIDIARIES
NOTES TO CONSOLIDATED FINANCIAL STATEMENTS(continued)
NOTE C – INVESTMENT SECURITIES(continued)
The amortized cost, unrealized gains and losses, and fair market values of our investment securities held to maturity at September 24, 201128, 2013 are summarized as follows:
Amortized Cost | Gross Unrealized | Gross Unrealized | Fair Market | |||||||||||||
| (in thousands) | ||||||||||||||||
| US Government Agency Debt | $ | 42,000 | $ | 52 | $ | 62 | $ | 41,990 | ||||||||
| FDIC Backed Corporate Debt | 8,015 | 18 | - | 8,033 | ||||||||||||
| Certificates of Deposit | 17,491 | 1 | - | 17,492 | ||||||||||||
| $ | 67,506 | $ | 71 | $ | 62 | $ | 67,515 | |||||||||
Gross | Gross | Fair | ||||||||||||||
Amortized | Unrealized | Unrealized | Market | |||||||||||||
Cost | Gains | Losses | Value | |||||||||||||
| (in thousands) | |||||||||||||||
US Government Agency Debt | $ | 2,000 | $ | - | $ | 50 | $ | 1,950 | ||||||||
Certificates of Deposit | 256 | - | - | 256 | ||||||||||||
Total investment securitiesheld to maturity | $ | 2,256 | $ | - | $ | 50 | $ | 2,206 | ||||||||
All of the certificates of deposit are within the FDIC limits for insurance coverage.
The amortized cost, unrealized gains and losses, and fair market values of our investment securities available for sale at September 28, 2013 are summarized as follows:
Gross | Gross | Fair | ||||||||||||||
Amortized | Unrealized | Unrealized | Market | |||||||||||||
Cost | Gains | Losses | Value | |||||||||||||
| (in thousands) | ||||||||||||||||
Mutual Funds | $ | 109,891 | $ | 254 | $ | 2,481 | $ | 107,664 | ||||||||
| Total investment securities available for sale | $ | 109,891 | $ | 254 | $ | 2,481 | $ | 107,664 | ||||||||
The amortized cost and fair value of the Company’s held to maturity securities by contractual maturity at September 29, 201227, 2014 and September 24, 201128, 2013 are summarized as follows:
| September 29, 2012 | September 24, 2011 | |||||||||||||||
Amortized Cost | Fair Market | Amortized Cost | Fair Market | |||||||||||||
| (in thousands) | ||||||||||||||||
| Due in one year or less | $ | 1,214 | $ | 1,214 | $ | 25,506 | $ | 25,525 | ||||||||
Due after one year through five years | - | - | 6,000 | 6,014 | ||||||||||||
Due after five years through ten years | 24,998 | 25,124 | 36,000 | 35,976 | ||||||||||||
Total held to maturity securities | $ | 26,212 | $ | 26,338 | $ | 67,506 | $ | 67,515 | ||||||||
| Less current portion | 1,214 | 1,214 | 25,506 | 25,525 | ||||||||||||
Long term held to maturity securities | $ | 24,998 | $ | 25,124 | $ | 42,000 | $ | 41,990 | ||||||||
September 27, 2014 | September 28, 2013 | |||||||||||||||
Fair | Fair | |||||||||||||||
Amortized | Market | Amortized | Market | |||||||||||||
Cost | Value | Cost | Value | |||||||||||||
| (in thousands) | ||||||||||||||||
Due in one year or less | $ | - | $ | - | $ | 256 | $ | 256 | ||||||||
Due after one year throughfive years | - | - | - | - | ||||||||||||
Due after five years throughten years | 2,000 | 1,987 | 2,000 | 1,950 | ||||||||||||
Total held to maturitysecurities | $ | 2,000 | $ | 1,987 | $ | 2,256 | $ | 2,206 | ||||||||
Less current portion | - | - | 256 | 256 | ||||||||||||
Long term held to maturitysecurities | $ | 2,000 | $ | 1,987 | $ | 2,000 | $ | 1,950 | ||||||||
Proceeds from the sale and redemption of marketable securities were $109,744,000, $37,568,000$7,245,000, $25,307,000 and $67,362,000$109,744,000 in the years ended September 27, 2014, September 28, 2013 and September 29, 2012, September 24, 2011respectively; with losses of $361,000 and September 25, 2010, respectively, with$108,000 recorded in 2014 and 2013 and no gain or loss recorded.recorded in 2012. We use the specific identification method to determine the cost of securities sold.
NOTE D – INVENTORIES
Inventories consist of the following:
September 29, 2012 | September 24, 2011 | |||||||
| (in thousands) | ||||||||
| Finished goods | $ | 32,439 | $ | 28,770 | ||||
| Raw materials | 14,584 | 13,160 | ||||||
| Packaging materials | 5,985 | 5,791 | ||||||
| Equipment parts and other | 16,753 | 15,740 | ||||||
| $ | 69,761 | $ | 63,461 | |||||
September 27, | September 28, | |||||||
2014 | 2013 | |||||||
(in thousands) | ||||||||
Finished goods | $ | 33,189 | $ | 33,013 | ||||
Raw materials | 15,632 | 14,489 | ||||||
Packaging materials | 6,107 | 5,937 | ||||||
Equipment parts and other | 21,155 | 18,346 | ||||||
Total Inventories | $ | 76,083 | $ | 71,785 | ||||
Inventory is presented net of an allowance for obsolescence of $3,883,000$3,982,000 and $4,615,000$4,449,000 as of fiscal year ends 20122014 and 2011,2013, respectively.
J & J SNACK FOODS CORP. AND SUBSIDIARIES
NOTES TO CONSOLIDATED FINANCIAL STATEMENTS(continued)
NOTE E – PROPERTY, PLANT AND EQUIPMENT
Property, plant and equipment consist of the following:
September 29, 2012 | September 24, 2011 | Estimated Useful Lives | |||||||||||
| (in thousands) | (years) | ||||||||||||
| Land | $ | 2,496 | $ | 2,496 | - | ||||||||
| Buildings | 26,741 | 15,766 | 15 | - | 39.5 | ||||||||
Plant machinery and equipment | 172,529 | 158,408 | 5 | - | 20 | ||||||||
| Marketing equipment | 233,612 | 223,490 | 5 | - | 7 | ||||||||
Transportation equipment | 4,879 | 4,264 | 5 | ||||||||||
| Office equipment | 14,987 | 13,650 | 3 | - | 5 | ||||||||
| Improvements | 22,889 | 21,054 | 5 | - | 20 | ||||||||
Construction in progress | 5,740 | 7,728 | - | ||||||||||
| $ | 483,873 | $ | 446,856 | ||||||||||
September 27, | September 28, | Estimated | ||||||||||
2014 | 2013 | Useful Lives | ||||||||||
(in thousands) | (in years) | |||||||||||
Land | $ | 2,496 | $ | 2,496 | - | |||||||
Buildings | 26,741 | 26,741 | 15-39.5 | |||||||||
Plant machineryand equipment | 195,566 | 179,331 | 5-20 | |||||||||
Marketing equipment | 256,389 | 244,770 | 5-7 | |||||||||
Transportationequipment | 6,913 | 5,953 | 5 | |||||||||
Office equipment | 18,556 | 16,282 | 3-5 | |||||||||
Improvements | 26,635 | 24,917 | 5-20 | |||||||||
Construction inProgress | 4,785 | 9,952 | - | |||||||||
Total property, plantand equipment | $ | 538,081 | $ | 510,442 | ||||||||
Depreciation expense was $26,175,000, $25,046,000$31,660,000, $28,801,000 and $24,498,000$26,175,000 for fiscal years 2014, 2013 and 2012, 2011 and 2010, respectively.
.
Our three reporting units, which are also reportable segments, are Food Service, Retail Supermarket and Frozen Beverages.
J & J SNACK FOODS CORP. AND SUBSIDIARIES
NOTES TO CONSOLIDATED FINANCIAL STATEMENTS(continued)
NOTE F – GOODWILL AND INTANGIBLE ASSETS(continued)
The carrying amount of acquired intangible assets for the reportable segments are as follows:
| September 29, 2012 | September 24, 2011 | |||||||||||||||
Gross Carrying | Accumulated Amortization | Gross Carrying | Accumulated Amortization | |||||||||||||
| (in thousands) | ||||||||||||||||
| FOOD SERVICE | ||||||||||||||||
Indefinite lived intangible assets | ||||||||||||||||
| Trade Names | $ | 12,880 | $ | - | $ | 12,880 | $ | - | ||||||||
| Amortized intangible assets | ||||||||||||||||
| Non compete agreements | 545 | 456 | 470 | 425 | ||||||||||||
| Customer relationships | 40,187 | 22,582 | 40,024 | 18,993 | ||||||||||||
| License and rights | 3,606 | 2,519 | 3,606 | 2,425 | ||||||||||||
| $ | 57,218 | $ | 25,557 | $ | 56,980 | $ | 21,843 | |||||||||
| RETAIL SUPERMARKETS | ||||||||||||||||
Indefinite lived intangible assets | ||||||||||||||||
| Trade Names | $ | 4,006 | $ | - | $ | 3,380 | $ | - | ||||||||
| Amortized Intangible Assets | ||||||||||||||||
| Customer relationships | 279 | 31 | 207 | 8 | ||||||||||||
| $ | 4,285 | $ | 31 | $ | 3,587 | $ | 8 | |||||||||
| FROZEN BEVERAGES | ||||||||||||||||
Indefinite lived intangible assets | ||||||||||||||||
| Trade Names | $ | 9,315 | $ | - | $ | 9,315 | $ | - | ||||||||
| Amortized intangible assets | ||||||||||||||||
| Non compete agreements | 198 | 198 | 198 | 189 | ||||||||||||
| Customer relationships | 6,478 | 4,201 | 6,478 | 3,540 | ||||||||||||
| Licenses and rights | 1,601 | 644 | 1,601 | 574 | ||||||||||||
| $ | 17,592 | $ | 5,043 | $ | 17,592 | $ | 4,303 | |||||||||
| CONSOLIDATED | $ | 79,095 | $ | 30,631 | $ | 78,159 | $ | 26,154 | ||||||||
September 27, 2014 | September 28, 2013 | |||||||||||||||
Gross | Gross | |||||||||||||||
Carrying | Accumulated | Carrying | Accumulated | |||||||||||||
Amount | Amortization | Amount | Amortization | |||||||||||||
(in thousands) | ||||||||||||||||
FOOD SERVICE | ||||||||||||||||
Indefinite lived intangibleassets | ||||||||||||||||
Trade Names | $ | 13,072 | $ | - | $ | 12,880 | $ | - | ||||||||
Amortized intangible assets | ||||||||||||||||
Non compete agreements | 592 | 509 | 545 | 478 | ||||||||||||
Customer relationships | 40,797 | 29,914 | 40,187 | 26,187 | ||||||||||||
License and rights | 3,606 | 2,708 | 3,606 | 2,614 | ||||||||||||
TOTAL FOOD SERVICE | $ | 58,067 | $ | 33,131 | $ | 57,218 | $ | 29,279 | ||||||||
RETAIL SUPERMARKETS | ||||||||||||||||
Indefinite lived intangibleassets | ||||||||||||||||
Trade Names | $ | 7,206 | $ | - | $ | 4,006 | $ | - | ||||||||
Amortized Intangible Assets | ||||||||||||||||
Non compete agreements | 160 | 34 | - | - | ||||||||||||
Customer relationships | 7,979 | 420 | 279 | 62 | ||||||||||||
TOTAL RETAIL SUPERMARKETS | $ | 15,345 | $ | 454 | $ | 4,285 | $ | 62 | ||||||||
FROZEN BEVERAGES | ||||||||||||||||
Indefinite lived intangibleassets | ||||||||||||||||
Trade Names | $ | 9,315 | $ | - | $ | 9,315 | $ | - | ||||||||
Amortized intangible assets | ||||||||||||||||
Non compete agreements | 198 | 198 | 198 | 198 | ||||||||||||
Customer relationships | 6,478 | 5,448 | 6,478 | 4,830 | ||||||||||||
Licenses and rights | 1,601 | 784 | 1,601 | 714 | ||||||||||||
TOTAL FROZEN BEVERAGES | $ | 17,592 | $ | 6,430 | $ | 17,592 | $ | 5,742 | ||||||||
CONSOLIDATED | $ | 91,004 | $ | 40,015 | $ | 79,095 | $ | 35,083 | ||||||||
The gross carrying amount of intangible assets is determined by applying a discounted cash flow model to the future sales and earnings associated with each intangible asset or is set by contract cost. The amortization period used for definite lived intangible assets is set by contract period or by the period over which the bulk of the discounted cash flow is expected to be generated. We currently believe that we will receive the benefit from the use of the trade names classified as indefinite lived intangible assets indefinitely and they are therefore not amortized.
Licenses and rights, customer relationships and non compete agreements are being amortized by the straight-line method over periods ranging from 32 to 20 years and amortization expense is reflected throughout operating expenses.
J & J SNACK FOODS CORP. AND SUBSIDIARIES
NOTES TO CONSOLIDATED FINANCIAL STATEMENTS(continued)
NOTE F – GOODWILL AND INTANGIBLE ASSETS(continued)
Amortizing intangibles are reviewed for impairment as events or changes in circumstances occur indicating that the carrying amount of theofthe asset may not be recoverable. Indefinite lived intangibles are reviewed annually for impairment. Cash flow and sales analyses are used to assess impairment. The estimates of future cash flows and sales involve considerable management judgment and are based upon assumptions about expected future operating performance.performance which include Level 3 inputs such as annual growth rates and discount rates. Assumptions used in these forecasts are consistent with internal planning. The actual cash flows and sales could differ from management’s estimates due to changes in business conditions, operating performance, economic conditions, competition and consumer preferences.
There were no intangible assets acquired in fiscal year 2013.
Intangible assets of $676,000 and $856,000$849,000 were acquired in the food service and retail supermarket segments, respectively,segment in the handheldsNew York Pretzel acquisition in fiscal year 2011.
Aggregate amortization expense of intangible assets for the fiscal years 2014, 2013 and 2012 2011was $4,932,000, $4,452,000 and 2010 was $4,477,000, $4,811,000 and $4,687,000, respectively.
Estimated amortization expense for the next five fiscal years is approximately $4,500,000$5,400,000 in 2013, $4,400,000 in 2014 and 2015, $4,200,000$5,100,000 in 2016, $2,600,000 in 2017, $1,800,000 in 2018 and $1,700,000$1,600,000 in 2017.2019. The weighted average amortization period of the intangible assets is 10.1 years.
Goodwill
The carrying amounts of goodwill for the reportable segments are as follows:
Food Service | Retail Supermarkets | Frozen Beverages | Total | |||||||||||||
Balance at September 29, 2012 | $ | 39,115 | $ | 1,844 | $ | 35,940 | $ | 76,899 | ||||||||
Balance at September 24, 2011 | $ | 34,130 | $ | - | $ | 35,940 | $ | 70,070 | ||||||||
Food | Retail | Frozen | ||||||||||||||
Service | Supermarkets | Beverages | Total | |||||||||||||
(in thousands) | ||||||||||||||||
Balance atSeptember 27, 2014 | $ | 46,832 | $ | 3,670 | $ | 35,940 | $ | 86,442 | ||||||||
Balance atSeptember 28, 2013 | $ | 39,115 | $ | 1,844 | $ | 35,940 | $ | 76,899 | ||||||||
The carrying value of goodwill is determined based on the excess of the purchase price of acquisitions over the estimated fair value of tangible and intangible net assets. Goodwill is not amortized but is evaluated annually by management for impairment. Our impairment analysis for 20122014, 2013 and 20102012 was based on a combination of the income approach, which estimates the fair value of discounted cash flows, and the market approach, which estimates the fair value based on comparable market prices. Under the income approach the Company used a discounted cash flow which requires Level 3 inputs such as: annual growth rates, discount rates based upon the weighted average cost of capital and terminal values based upon ourcurrent stock market multiples. Our impairment analysis for 2011 was a qualitative assessment in which we have considered historical net cash provided by operating activities and purchases of property, plant and equipment, their relationship to the carrying value of goodwill, recent fair value calculations of our reporting units and our assessment of the likelihood, based on an assessment of what we know about our Company’s products and markets, costs and general economic conditions, that the relationship of cash flow to the carrying value of goodwill will change significantly in the foreseeable future. There were no impairment charges in 2012, 20112014, 2013 or 2010.
No goodwill was acquired in fiscal year 2013.
Goodwill of $6,829,000$7,716,000 was acquired in the Kim and Scott’sNew York Pretzel acquisition in fiscal year 2012the three months ended December 28, 2013, all of which was allocated $4,985,000 to the food service segment and $1,844,000segment. Goodwill of $1,826,000 was acquired in the PHILLY SWIRL acquisition in the three months ended June 28,2014, all of which was allocated to the retail supermarketssupermarket segment.
J & J SNACK FOODS CORP. AND SUBSIDIARIES
NOTES TO CONSOLIDATED FINANCIAL STATEMENTS(continued)
NOTE G – LONG-TERM DEBT
In November 2011, we entered into an amended and restated loan agreement with our existing banks which provides for up to a $50,000,000 revolving credit facility repayable in November 2016, with the availability of repayments without penalty. The agreement contains restrictive covenants and requires commitment fees in accordance with standard banking practice. As of September 29, 2012,27, 2014 and September 28, 2013, there were no outstanding balances under the facility andfacility. We were in compliance with the restrictive covenants at September 24, 2011, there were no outstanding balances under the prior facility.
NOTE H – OBLIGATIONS UNDER CAPITAL LEASES
Obligations under capital leases consist of the following:
September 27, | September 28, | |||||||
2014 | 2013 | |||||||
| (in thousands) | |||||||
Capital lease obligations, withinterest at 6.25%, payable inmonthly installments of $6,030,through March 2015 | $ | 36 | $ | 103 | ||||
Capital lease obligations, withinterest at 4.46%, payable inmonthly installments of $1,598,through December 2018 | 74 | - | ||||||
Capital lease obligations, withinterest at 4.88%, payable inmonthly installments of $1,544,through October 2019 | 83 | - | ||||||
Capital lease obligations, withinterest at 5.86%, payable inmonthly installments of $1,544,through September 2019 | 80 | - | ||||||
Capital lease obligations, withinterest at 2.30%, payable inmonthly installments of $1,555,through October 2018 | 73 | - | ||||||
Capital lease obligations, withinterest at 2.30%, payable inmonthly installments of $1,555,through November 2018 | 74 | - | ||||||
Capital lease obligations, withinterest at 7.6%, payable inmonthly installments of $3,162,through November 2017 | 100 | 130 | ||||||
Capital lease obligations, withinterest at 5.8%, payable inmonthly installments of $14,625,through May 2014 | - | 114 | ||||||
Total capital lease obligations | 521 | 347 | ||||||
Less current portion | 146 | 211 | ||||||
Long term portion of capitallease obligations | $ | 374 | $ | 136 | ||||
September 29, 2012 | September 24, 2011 | |||||||
| (in thousands) | ||||||||
Capital lease obligations, with interest at 6.25%, payable in monthly installments of $6,030, through March 2015 | $ | 167 | $ | - | ||||
Capital lease obligations, with interest at 7.6%, payable in monthly installments of $3,162, through November 2017 | 157 | 182 | ||||||
Capital lease obligations, with interest at 5.8%, payable in monthly installments of $14,625, through May 2014 | 277 | 432 | ||||||
Capital lease obligations, with interest at 2.6%, payable in monthly installments in $8,700, through August 2013 | 86 | 187 | ||||||
| 687 | 801 | |||||||
| Less current portion | 340 | 278 | ||||||
| $ | 347 | $ | 523 | |||||
J & J SNACK FOODS CORP. AND SUBSIDIARIES
NOTES TO CONSOLIDATED FINANCIAL STATEMENTS (continued)
NOTE I – INCOME TAXES
Income tax expense (benefit) is as follows:
Fiscal year ended | ||||||||||||
September 29, 2012 | September 24, 2011 | September 25, 2010 | ||||||||||
(in thousands) | ||||||||||||
| Current | ||||||||||||
| U.S. Federal | $ | 21,573 | $ | 17,065 | $ | 21,020 | ||||||
| Foreign | 1,408 | 950 | 970 | |||||||||
| State | 5,416 | 4,871 | 4,484 | |||||||||
| 28,397 | 22,886 | 26,474 | ||||||||||
| Deferred | ||||||||||||
| U.S. Federal | $ | 3,124 | $ | 3,988 | $ | 2,692 | ||||||
| Foreign | (14 | ) | 409 | (48 | ) | |||||||
| State | 661 | 1,720 | 570 | |||||||||
| 3,771 | 6,117 | 3,214 | ||||||||||
| $ | 32,168 | $ | 29,003 | $ | 29,688 | |||||||
| Fiscal year ended | |||||||||||
September 27, | September 28, | September 29, | ||||||||||
2014 | 2013 | 2012 | ||||||||||
| (in thousands) | |||||||||||
Current | ||||||||||||
U.S. Federal | $ | 31,506 | $ | 26,492 | $ | 21,573 | ||||||
Foreign | 2,008 | 2,289 | 1,408 | |||||||||
State | 6,693 | 7,560 | 5,416 | |||||||||
Total current expense | 40,207 | 36,341 | 28,397 | |||||||||
Deferred | ||||||||||||
U.S. Federal | $ | (217 | ) | $ | 64 | $ | 3,124 | |||||
Foreign | (58 | ) | (10 | ) | (14 | ) | ||||||
State | (540 | ) | 14 | 661 | ||||||||
Total deferred (benefit) expense | (815 | ) | 68 | 3,771 | ||||||||
Total expense | $ | 39,392 | $ | 36,409 | $ | 32,168 | ||||||
The 2014 deferred tax benefit does not equal the change in net deferred tax liabilities as a result of deferred taxes recorded in connection with the PHILLY SWIRL acquisition described more fully in Note B.
The provisions for income taxes differ from the amounts computed by applying the statutory federal income tax rate of approximately 35% to earnings before income taxes for the following reasons:
Fiscal year ended | ||||||||||||
September 27, | September 28, | September 29, | ||||||||||
2014 | 2013 | 2012 | ||||||||||
(in thousands) | ||||||||||||
Income taxes at federal statutory rates | $ | 38,922 | $ | 35,277 | $ | 30,200 | ||||||
Increase (decrease)in taxes resulting from: | ||||||||||||
State income taxes, net of federal income tax benefit | 4,281 | 4,346 | 3,777 | |||||||||
Domestic production activities deduction | (2,100 | ) | (1,540 | ) | (1,553 | ) | ||||||
Reduction of gross unrecognized tax benefits | (161 | ) | (346 | ) | (307 | ) | ||||||
Other, net | (1,550 | ) | (1,328 | ) | 51 | |||||||
Income tax expense | $ | 39,392 | $ | 36,409 | $ | 32,168 | ||||||
| Fiscal year ended | ||||||||||||
September 29, 2012 | September 24, 2011 | September 25, 2010 | ||||||||||
| (in thousands) | ||||||||||||
| Income taxes at statutory rates | $ | 30,200 | $ | 29,423 | $ | 27,334 | ||||||
| Increase (decrease) in taxes resulting from: | ||||||||||||
| State income taxes, net of federal income tax benefit | 3,777 | 3,279 | 3,403 | |||||||||
| Domestic production activities deduction | (1,553 | ) | (1,500 | ) | (850 | ) | ||||||
| Gain on bargain purchase | - | (2,303 | ) | - | ||||||||
| Other, net | (256 | ) | 104 | (199 | ) | |||||||
| $ | 32,168 | $ | 29,003 | $ | 29,688 | |||||||
J & J SNACK FOODS CORP. AND SUBSIDIARIES
NOTES TO CONSOLIDATED FINANCIAL STATEMENTS (continued)
NOTE I – INCOME TAXES(continued)
Deferred tax assets and liabilities consist of the following:
September 29, 2012 | September 24, 2011 | |||||||
| (in thousands) | ||||||||
| Deferred tax assets | ||||||||
| Vacation accrual | $ | 1,422 | $ | 1,390 | ||||
| Insurance accrual | 2,722 | 2,591 | ||||||
| Deferred income | 13 | 34 | ||||||
| Allowances | 2,130 | 2,074 | ||||||
| Inventory capitalization | 709 | 653 | ||||||
| Share-based compensation | 794 | 1,301 | ||||||
| Unclaimed Property | - | 632 | ||||||
| Other, net | 11 | 19 | ||||||
| 7,801 | 8,694 | |||||||
| Deferred tax liabilities | ||||||||
Amortization of goodwill and other intangible assets | 19,030 | 17,418 | ||||||
Depreciation of property and equipment | 29,360 | 28,090 | ||||||
| Other, net | 24 | 28 | ||||||
| 48,414 | 45,536 | |||||||
| $ | 40,613 | $ | 36,842 | |||||
September 27, | September 28, | |||||||
2014 | 2013 | |||||||
(in thousands) | ||||||||
Deferred tax assets | ||||||||
Vacation accrual | $ | 1,456 | $ | 1,445 | ||||
Insurance accrual | 3,383 | 3,306 | ||||||
Deferred income | 53 | 32 | ||||||
Allowances | 1,895 | 2,348 | ||||||
Inventory capitalization | 745 | 709 | ||||||
Share-based compensation | 1,216 | 1,023 | ||||||
Net Operating Loss | 1,956 | - | ||||||
Total deferred tax assets | 10,704 | 8,863 | ||||||
Deferred tax liabilities | ||||||||
Amortization of goodwilland other intangibleassets | 24,528 | 20,283 | ||||||
Depreciation of propertyand equipment | 26,865 | 29,261 | ||||||
Total deferred tax liabilities | 51,393 | 49,544 | ||||||
Total deferred tax liabilities, net | $ | 40,689 | $ | 40,681 | ||||
As of September 27, 2014, we have federal net operating loss carry forwards of approximately $5 million from the PHILLY SWIRL acquisition. These carry forwards are subject to an annual limitation under Code Section 382 of approximately $378,000 and will expire in 2033. We have determined there are no limitations to the total use of this asset and accordingly, have not recorded a valuation allowance for this deferred tax asset.
We have undistributed earnings of our Mexican and Canadian subsidiaries that are considered to be indefinitely reinvested and accordingly no provision for US federal and state income taxes has been provided thereon.
NOTE J - COMMITMENTS
1. Lease Commitments
The following is a summary of approximate future minimum rental commitments for non-cancelable operating leases with terms of more than one year as of September 29, 2012:
Plants and Offices | Equipment | Total | ||||||||||
| (in thousands) | ||||||||||||
| 2013 | $ | 5,086 | $ | 3,004 | $ | 8,090 | ||||||
| 2014 | 4,687 | 2,219 | 6,906 | |||||||||
| 2015 | 4,438 | 1,434 | 5,872 | |||||||||
| 2016 | 3,093 | 1,081 | 4,174 | |||||||||
| 2017 | 2,630 | 702 | 3,332 | �� | ||||||||
| 2018 and thereafter | 17,684 | - | 17,684 | |||||||||
| $ | 37,618 | $ | 8,440 | $ | 46,058 | |||||||
Plants and | ||||||||||||
Offices | Equipment | Total | ||||||||||
| (in thousands) | ||||||||||||
2015 | $ | 5,462 | $ | 5,185 | $ | 10,647 | ||||||
2016 | 4,253 | 4,809 | 9,062 | |||||||||
2017 | 3,546 | 4,209 | 7,755 | |||||||||
2018 | 3,020 | 2,874 | 5,894 | |||||||||
2019 | 2,463 | 1,692 | 4,155 | |||||||||
2020 and thereafter | 13,495 | 177 | 13,672 | |||||||||
Total minimal rental commitments | $ | 32,239 | $ | 18,946 | $ | 51,185 | ||||||
Total rent expense was $13,215,000, $14,076,000$15,163,000, $13,575,000 and $13,099,000$13,215,000 for fiscal years 2014, 2013 and 2012, 2011 and 2010, respectively.
J & J SNACK FOODS CORP. AND SUBSIDIARIES
NOTES TO CONSOLIDATED FINANCIAL STATEMENTS(continued)
NOTE J - COMMITMENTS(continued)
2. Other Commitments
We are a party to litigation which has arisen in the normal course of business which management currently believes will not have a material adverse effect on our financial condition or results of operations.
We self-insure, up to loss limits, certain insurable risks such as worker’s compensation and automobile liability claims. Accruals for claims under our self-insurance program are recorded on a claims incurred basis. Our total recorded liability for all years’ claims incurred but not yet paid was $6,200,000$8,100,000 and $5,700,000$8,500,000 at September 29, 201227, 2014 and September 24, 2011,28, 2013, respectively. In connection with certain self-insurance agreements, we customarily enter into letters of credit arrangements with our insurers. At each of September 29, 201227, 2014 and September 24, 2011,28, 2013, we had outstanding letters of credit totaling $8,175,000.
We have a self-insured medical plan which covers approximately 1,3001,400 of our employees. We record a liability for incurred buybut not yet reported or paid claims based on our historical experience of claims payments and a calculated lag time period. Our recorded liability at September 29, 201227, 2014 and September 24, 201128, 2013 was $1,332,000$1,853,000 and $1,427,000,$1,516,000, respectively.
NOTE K - CAPITAL STOCK
In our fiscal year ended September 29,27, 2014, we purchased and retired 81,685 shares of our common stock at a cost of $7,504,729. In our third quarter, we purchased and retired 64,041 shares at a cost of $5,903,157. In our fourth quarter, we purchased and retired 17,644 shares at a cost of $1,601,572.
In our fiscal year ended September 28, 2013, we purchased and retired 204,397 shares of our common stock at a cost of $14,500,215.
In our fiscal year ended September 28, 2012, we purchased and retired 142,038 shares of our common stock at a cost of $8,167,125. All of the shares were purchased in the fourth quarter. Subsequent to September 29, 2012 and through October 31, 2012, we purchased and retired 48,255 shares of our common stock at a cost of $2,762,602. On November 8, 2012 the Company’s Board of directors authorized the purchase and retirement of an additional 500,000 shares of the Company’s common stock.
NOTE L – STOCK OPTIONS
We have a Stock Option Plan (the “Plan”). Pursuant to the Plan, stock options may be granted to officers and our key employees which qualify as incentive stock options as well as stock options which are nonqualified. The exercise price of incentive stock options is at least the fair market value of the common stock on the date of grant. The exercise price for nonqualified options is determined by a committee of the Board of Directors. The options are generally exercisable after three years and expire no later than ten years from date of grant. There were 800,000 shares reserved under the Plan; options for 636,000504,000 shares remain unissued as of September 29, 2012.27, 2014. There are options that were issued under an option plan that has since expired that are still outstanding.
We have an Employee Stock Purchase Plan (“ESPP”) whereby employees purchase stock by making contributions through payroll deductions for six month periods. The purchase price of the stock is 85% of the lower of the market price of the stock at the beginning of the six-month period or the end of the six-month period. In fiscal years 2012, 20112014, 2013 and 20102012 employees purchased 20,318, 19,70815,650, 19,804 and 22,14320,318 shares at average purchase prices of $44.11, $39.04$70.40, $52.61 and $32.70,$44.11, respectively. ESPP expense of $256,000, $203,000$329,000, $363,000 and $184,000$256,000 was recognized for fiscal years 2014, 2013 and 2012, 2011 and 2010, respectively.
J & J SNACK FOODS CORP. AND SUBSIDIARIES
NOTES TO CONSOLIDATED FINANCIAL STATEMENTS (continued)
NOTE L – STOCK OPTIONS(continued)
A summary of the status of our stock option plans as of fiscal years 2012, 20112014, 2013 and 20102012 and the changes during the years ended on those dates is represented below:
| Incentive Stock Options | Nonqualified Stock Options | |||||||||||||||
Stock Options | Weighted- Average | Stock Options | Weighted- Average | |||||||||||||
| Balance, September 27, 2009 | 428,944 | $ | 26.45 | 306,354 | $ | 19.55 | ||||||||||
| Granted | 101,330 | 36.77 | 20,000 | 41.75 | ||||||||||||
| Exercised | (92,760 | ) | 16.40 | (72,354 | ) | 10.12 | ||||||||||
| Cancelled | (19,505 | ) | 33.47 | (10,000 | ) | 38.81 | ||||||||||
| Balance, September 25, 2010 | 418,009 | 30.86 | 244,000 | 23.38 | ||||||||||||
| Granted | 101,200 | 50.93 | 45,315 | 49.57 | ||||||||||||
| Exercised | (186,039 | ) | 23.52 | (62,000 | ) | 10.30 | ||||||||||
| Cancelled | (10,050 | ) | 36.77 | - | - | |||||||||||
| Balance, September 24, 2011 | 323,120 | 41.18 | 227,315 | 32.17 | ||||||||||||
| Granted | 118,210 | 57.87 | 45,932 | 57.70 | ||||||||||||
| Exercised | (71,350 | ) | 39.03 | (62,000 | ) | 19.77 | ||||||||||
| Cancelled | (14,300 | ) | 41.13 | - | - | |||||||||||
| Balance, September 29, 2012 | 355,680 | $ | 47.16 | 211,247 | $ | 41.36 | ||||||||||
Exercisable Options September 29, 2012 | 47,686 | 100,000 | ||||||||||||||
Incentive Stock Options | Nonqualified Stock Options | |||||||||||||||
Weighted- | Weighted- | |||||||||||||||
Stock | Average | Stock | Average | |||||||||||||
Options | Exercise | Options | Exercise | |||||||||||||
Outstanding | Price | Outstanding | Price | |||||||||||||
Balance, September 25, 2011 | 323,120 | $ | 41.18 | 227,315 | $ | 32.17 | ||||||||||
Granted | 118,210 | 57.87 | 45,932 | 57.70 | ||||||||||||
Exercised | (71,350 | ) | 39.03 | (62,000 | ) | 19.77 | ||||||||||
Canceled | (14,300 | ) | 41.13 | - | - | |||||||||||
Balance, September 29, 2012 | 355,680 | 47.16 | 211,247 | 41.36 | ||||||||||||
Granted | 1,600 | 63.13 | 20,000 | 80.79 | ||||||||||||
Exercised | (84,628 | ) | 34.58 | - | - | |||||||||||
Canceled | (12,800 | ) | 51.01 | - | - | |||||||||||
Balance, September 28, 2013 | 259,852 | 51.17 | 231,247 | 44.77 | ||||||||||||
Granted | 83,440 | 82.07 | 38,132 | 88.26 | ||||||||||||
Exercised | (39,097 | ) | 42.42 | (20,000 | ) | 20.43 | ||||||||||
Canceled | (8,550 | ) | 58.68 | - | - | |||||||||||
Balance, September 27, 2014 | 295,645 | $ | 60.83 | 249,379 | $ | 53.38 | ||||||||||
Exercisable OptionsSeptember 27, 2014 | 105,145 | $ | 47.22 | 145,315 | $ | 39.08 | ||||||||||
The weighted-average fair value of incentive options granted during fiscal years ended September 27, 2014, September 28, 2013 and September 29, 2012 September 24, 2011was $15.24, $13.76 and September 25, 2010 was $13.43, $12.52 and $9.12, respectively. The weighted-average fair value of non-qualified stock options granted during the fiscal years ended September 27, 2014, September 28, 2013 and September 29, 2012 September 24, 2011was $17.34, $28.30 and September 25, 2010, was $16.32, $14.95 and $17.33, respectively. The total intrinsic value of stock options exercised was $3.2$3.4 million, $7.0$2.7 million and $5.1$3.2 million in fiscal years 2014, 2013 and 2012, 2011 and 2010, respectively.
The total cash received from these option exercises was $2.4$1.5 million, $3.4$2.6 million and $1.2$2.4 million in fiscal years 2012, 20112014, 2013 and 2010,2012, respectively; and the actual tax benefit realized from the tax deductions from these option exercises was $1.0 million, $1.4 million$666,000 and $1.3$1.0 million in fiscal years 2014, 2013 and 2012, 2011 and 2010, respectively.
The following table summarizes information about incentive stock options outstanding at September 29, 2012:
Options Outstanding | Options Exercisable | |||||||||||||||||||||
Number | Weighted- | Number | ||||||||||||||||||||
Outstanding | Average | Weighted- | Exercisable | Weighted- | ||||||||||||||||||
at | Remaining | Average | at | Average | ||||||||||||||||||
Range of | September 27, | Contractual | Exercise | September 27, | Exercise | |||||||||||||||||
Exercise Prices | 2014 | Life (in years) | Price | 2014 | Price | |||||||||||||||||
| $36.71 | - | $51.14 | 105,145 | 1.4 | $ | 47.22 | 105,145 | $ | 47.22 | |||||||||||||
| $57.15 | - | $82.74 | 186,903 | 3.4 | $ | 67.90 | - | - | ||||||||||||||
| $89.37 | - | $93.17 | 3,597 | 4.5 | $ | 91.48 | - | - | ||||||||||||||
Total options | 295,645 | 105,145 | ||||||||||||||||||||
| Options Outstanding | Options Exercisable | ||||||||||||||||||
| Range of Exercise Prices | Number Outstanding at | Weighted-Average Remaining Contractual Life (years) | Weighted-Average Exercise Price | Number Exercisable at September 29, 2012 | Weighted-Average Exercise Price | ||||||||||||||
| $27.45 | - | $38.70 | 139,120 | 1.5 | $ | 35.42 | 47,686 | $ | 32.90 | ||||||||||
| $44.16 | - | $58.90 | 216,560 | 4.4 | $ | 54.71 | - | $ | - | ||||||||||
| 355,680 | 47,686 | ||||||||||||||||||
J & J SNACK FOODS CORP. AND SUBSIDIARIES
NOTES TO CONSOLIDATED FINANCIAL STATEMENTS(continued)
NOTE L – STOCK OPTIONS(continued)
The following table summarizes information about nonqualified stock options outstanding at September 29, 2012:
| Options Outstanding | Options Exercisable | ||||||||||||||||||
| Range of Exercise Prices | Number Outstanding at | Weighted-Average Remaining Contractual Life (years) | Weighted-Average Exercise Price | Number Exercisable at September 29, 2012 | Weighted-Average Exercise Price | ||||||||||||||
| $20.43 | - | $29.78 | 40,000 | 2.6 | $ | 25.10 | 40,000 | $ | 25.10 | ||||||||||
| $31.10 | - | $41.75 | 80,000 | 5.7 | $ | 35.46 | 60,000 | $ | 33.36 | ||||||||||
| $47.59 | - | $57.99 | 91,247 | 6.6 | $ | 53.67 | - | $ | - | ||||||||||
| 211,247 | 100,000 | ||||||||||||||||||
Options Outstanding | Options Exercisable | |||||||||||||||||||||
Number | Weighted- | Number | ||||||||||||||||||||
Outstanding | Average | Weighted- | Exercisable | Weighted- | ||||||||||||||||||
at | Remaining | Average | at | Average | ||||||||||||||||||
Range of | September 27, | Contractual | Exercise | September 27, | Exercise | |||||||||||||||||
Exercise Prices | 2014 | Life (in years) | Price | 2014 | Price | |||||||||||||||||
$29.78 | - | $41.75 | 100,000 | 3.2 | $ | 34.32 | 100,000 | $ | 34.32 | |||||||||||||
$47.59 | - | $57.99 | 91,247 | 4.6 | $ | 53.67 | 45,315 | 49.57 | ||||||||||||||
$80.79 | - | $94.24 | 58,132 | 7.8 | $ | 85.69 | - | - | ||||||||||||||
Total options | 249,379 | 145,315 | ||||||||||||||||||||
NOTE M – 401(k) PROFIT-SHARING PLAN
We maintain a 401(k) profit-sharing plan for our employees. Under this plan, we may make discretionary profit-sharing and matching 401(k) contributions. Contributions of $1,662,000, $1,480,000$1,686,000, $1,624,000 and $1,436,000$1,662,000 were made in fiscal years 2014, 2013 and 2012, 2011 and 2010, respectively.
NOTE N – CASH FLOW INFORMATION
The following is supplemental cash flow information:
Fiscal Year Ended | ||||||||||||
September 29, 2012 | September 24, 2011 | September 25, 2010 | ||||||||||
| (in thousands) | ||||||||||||
| Cash paid for: | ||||||||||||
| Interest | $ | 70 | $ | 36 | $ | 76 | ||||||
| Income taxes | $ | 23,864 | $ | 19,594 | $ | 31,379 | ||||||
| Non cash items: | ||||||||||||
| Capital leases | $ | 198 | $ | 182 | $ | 625 | ||||||
| Fiscal Year Ended | ||||||||||||
September 27, | September 28, | September 29, | ||||||||||
2014 | 2013 | 2012 | ||||||||||
(in thousands) | ||||||||||||
Cash paid for: | ||||||||||||
Interest | $ | 41 | $ | 50 | $ | 70 | ||||||
Income taxes | 41,318 | 35,496 | 23,864 | |||||||||
Non cash items: | ||||||||||||
Capital leases | $ | 499 | $ | - | $ | 198 | ||||||
NOTE O – SEGMENT REPORTING
We principally sell our products to the food service and retail supermarket industries. Sales and results of our frozen beverages business are monitored separately from the balance of our food service business because of different distribution and capital requirements. We maintain separate and discrete financial information for the three operating segments mentioned above which is available to our Chief Operating Decision Makers. We have applied no aggregate criteria to any of these operating segments in order to determine reportable segments. Our three reportable segments are Food Service, Retail Supermarkets and Frozen Beverages. All inter-segment net sales and expenses have been eliminated in computing net sales and operating income. These segments are described below.
Food Service
The primary products sold by the food service segment are soft pretzels, frozen juice treats and desserts, churros, dough enrobed handheld products and baked goods. Our customers in the food service segment include snack bars and food stands in chain, department and discount stores; malls and shopping centers; casual dining restaurants; fast food outlets; stadiums and sports arenas; leisure and theme parks; convenience stores; movie theatres; warehouse club stores; schools, colleges and other institutions.
J & J SNACK FOODS CORP. AND SUBSIDIARIES
NOTES TO CONSOLIDATED FINANCIAL STATEMENTS (continued)
NOTE O – SEGMENT REPORTING (continued)
Retail Supermarkets
The primary products sold to the retail supermarket channel are soft pretzel products – including SUPERPRETZEL, frozen juice treats and desserts including LUIGI’S Real Italian Ice, MINUTE MAID Juice Bars and Soft Frozen Lemonade, WHOLE FRUIT frozen fruit bars and sorbet, PHILLY SWIRL cups and sticks, ICEE Squeeze-Up Tubes and dough enrobed handheld products including PATIO burritos. Within the retail supermarket channel, our frozen and prepackaged products are purchased by the consumer for consumption at home.
Frozen Beverages
We sell frozen beverages to the food service industry primarily under the names ICEE, SLUSH PUPPIE and PARROT ICE and ARCTIC BLAST in the United States, Mexico and Canada. We also provide repair and maintenance service to customers for customers’ owned equipment.
The Chief Operating Decision Maker for Food Service andRetail Supermarkets and
J & J SNACK FOODS CORP. AND SUBSIDIARIESSUBSIDIARIES
NOTES TO CONSOLIDATED FINANCIAL STATEMENTS (continued)
NOTE O – SEGMENT REPORTING(continued)
| Fiscal year ended | ||||||||||||
September 29, 2012 | September 24, 2011 | September 25, 2010 | ||||||||||
| (in thousands) | ||||||||||||
| Sales to External Customers: | ||||||||||||
| Food Service | ||||||||||||
| Soft pretzels | $ | 118,014 | $ | 103,943 | $ | 100,694 | ||||||
| Frozen juices and ices | 53,813 | 49,740 | 47,273 | |||||||||
| Churros | 45,974 | 41,583 | 31,732 | |||||||||
| Handhelds | 27,818 | 8,865 | - | |||||||||
| Bakery | 266,192 | 241,288 | 234,032 | |||||||||
| Other | 9,451 | 18,143 | 24,075 | |||||||||
| $ | 521,262 | $ | 463,562 | $ | 437,806 | |||||||
| Retail Supermarket | ||||||||||||
| Soft pretzels | $ | 33,842 | $ | 32,044 | $ | 30,463 | ||||||
| Frozen juices and ices | 53,673 | 51,940 | 48,288 | |||||||||
| Handhelds | 24,358 | 9,424 | - | |||||||||
| Coupon redemption | (3,222 | ) | (3,857 | ) | (3,399 | ) | ||||||
| Other | 1,217 | 1,548 | 767 | |||||||||
| $ | 109,868 | $ | 91,099 | $ | 76,119 | |||||||
| Frozen Beverages | ||||||||||||
| Beverages | $ | 135,436 | $ | 133,372 | $ | 128,125 | ||||||
Repair and maintenance service | 49,115 | 42,608 | 40,410 | |||||||||
| Machines sales | 13,136 | 11,362 | 11,964 | |||||||||
| Other | 1,979 | 2,068 | 2,279 | |||||||||
| $ | 199,666 | $ | 189,410 | $ | 182,778 | |||||||
| Consolidated Sales | $ | 830,796 | $ | 744,071 | $ | 696,703 | ||||||
| Depreciation and Amortization: | ||||||||||||
| Food Service | $ | 17,287 | $ | 16,986 | $ | 17,252 | ||||||
| Retail Supermarket | 23 | 8 | - | |||||||||
| Frozen Beverages | 13,627 | 13,240 | 12,600 | |||||||||
| $ | 30,937 | $ | 30,234 | $ | 29,852 | |||||||
| Operating Income: | ||||||||||||
| Food Service | $ | 49,770 | $ | 46,171 | $ | 50,220 | ||||||
| Retail Supermarket | 13,316 | 11,830 | 11,281 | |||||||||
| Frozen Beverages | 21,881 | 18,582 | 15,661 | |||||||||
| $ | 84,967 | $ | 76,583 | $ | 77,162 | |||||||
| Capital Expenditures: | ||||||||||||
| Food Service | $ | 28,504 | $ | 14,905 | $ | 18,392 | ||||||
| Retail Supermarket | - | - | - | |||||||||
| Frozen Beverages | 14,296 | 14,219 | 15,139 | |||||||||
| $ | 42,800 | $ | 29,124 | $ | 33,531 | |||||||
| Assets: | ||||||||||||
| Food Service | $ | 453,509 | $ | 405,927 | $ | 341,285 | ||||||
| Retail Supermarket | 6,098 | 3,579 | 2,731 | |||||||||
| Frozen Beverages | 143,437 | 141,310 | 139,978 | |||||||||
| $ | 603,044 | $ | 550,816 | $ | 483,994 | |||||||
| Fiscal year ended | ||||||||||||
September 27, | September 28, | September 29, | ||||||||||
2014 | 2013 | 2012 | ||||||||||
(52 weeks) | (52 weeks) | (53 weeks) | ||||||||||
| (in thousands) | ||||||||||||
Sales to External Customers: | ||||||||||||
Food Service | ||||||||||||
Soft pretzels | $ | 164,680 | $ | 145,026 | $ | 118,014 | ||||||
Frozen juices and ices | 53,888 | 48,831 | 53,813 | |||||||||
Churros | 55,929 | 56,099 | 45,974 | |||||||||
Handhelds | 24,248 | 26,488 | 27,818 | |||||||||
Bakery | 281,556 | 274,783 | 266,192 | |||||||||
Other | 11,597 | 9,532 | 9,451 | |||||||||
Total Food Service | $ | 591,898 | $ | 560,759 | $ | 521,262 | ||||||
Retail Supermarket | ||||||||||||
Soft pretzels | $ | 34,830 | $ | 34,597 | $ | 33,842 | ||||||
Frozen juices and ices | 59,404 | 48,077 | 53,673 | |||||||||
Handhelds | 21,354 | 22,528 | 24,358 | |||||||||
Coupon redemption | (3,807 | ) | (3,681 | ) | (3,222 | ) | ||||||
Other | 863 | 818 | 1,217 | |||||||||
Total Retail Supermarket | $ | 112,644 | $ | 102,339 | $ | 109,868 | ||||||
Frozen Beverages | ||||||||||||
Beverages | $ | 133,283 | $ | 132,274 | $ | 135,436 | ||||||
Repair andmaintenance service | 59,805 | 52,813 | 49,115 | |||||||||
Machines sales | 20,224 | 17,376 | 13,136 | |||||||||
Other | 1,597 | 2,122 | 1,979 | |||||||||
Total Frozen Beverages | $ | 214,909 | $ | 204,585 | $ | 199,666 | ||||||
Consolidated Sales | $ | 919,451 | $ | 867,683 | $ | 830,796 | ||||||
Depreciation and Amortization: | ||||||||||||
Food Service | $ | 20,983 | $ | 18,999 | $ | 17,287 | ||||||
Retail Supermarket | 391 | 31 | 23 | |||||||||
Frozen Beverages | 15,719 | 14,522 | 13,627 | |||||||||
Total Depreciation and Amortization | $ | 37,093 | $ | 33,552 | $ | 30,937 | ||||||
Operating Income: | ||||||||||||
Food Service | $ | 73,731 | $ | 65,907 | $ | 49,770 | ||||||
Retail Supermarket | 11,201 | 8,594 | 13,316 | |||||||||
Frozen Beverages | 21,916 | 22,903 | 21,881 | |||||||||
Total Operating Income | $ | 106,848 | $ | 97,404 | $ | 84,967 | ||||||
Capital Expenditures: | ||||||||||||
Food Service | $ | 21,620 | $ | 19,097 | $ | 28,504 | ||||||
Retail Supermarket | - | - | - | |||||||||
Frozen Beverages | 17,211 | 16,724 | 14,296 | |||||||||
Total Capital Expenditures | $ | 38,831 | $ | 35,821 | $ | 42,800 | ||||||
Assets: | ||||||||||||
Food Service | $ | 524,272 | $ | 486,015 | $ | 453,509 | ||||||
Retail Supermarket | 18,561 | 6,067 | 6,098 | |||||||||
Frozen Beverages | 161,940 | 153,579 | 143,437 | |||||||||
Total Assets | $ | 704,773 | $ | 645,661 | $ | 603,044 | ||||||
J & J SNACK FOODS CORP. AND SUBSIDIARIESSUBSIDIARIES
NOTES TO CONSOLIDATED FINANCIAL STATEMENTS (continued)
NOTE P - QUARTERLY FINANCIAL DATA (UNAUDITED)
Changes to the components of accumulated other comprehensive loss are as follows:
Fiscal Year Ended September 27, 2014 | ||||||||||||
| (in thousands) | ||||||||||||
Unrealized | ||||||||||||
Foreign Currency | Holding Loss on | |||||||||||
Translation | Marketable | |||||||||||
Adjustments | Securities | Total | ||||||||||
Beginning Balance | $ | (3,703 | ) | $ | (2,227 | ) | $ | (5,930 | ) | |||
Other comprehensive (loss) incomebefore reclassifications | (929 | ) | 505 | (424 | ) | |||||||
Amounts reclassified fromaccumulated othercomprehensive income | - | 366 | 366 | |||||||||
Ending Balance | $ | (4,632 | ) | $ | (1,356 | ) | $ | (5,988 | ) | |||
Fiscal Year Ended September 28, 2013 | ||||||||||||
| (in thousands) | ||||||||||||
Unrealized | ||||||||||||
Foreign Currency | Holding Loss on | |||||||||||
Translation | Marketable | |||||||||||
Adjustments | Securities | Total | ||||||||||
Beginning Balance | $ | (3,132 | ) | $ | - | $ | (3,132 | ) | ||||
Other comprehensive lossbefore reclassifications | (571 | ) | (2,227 | ) | (2,798 | ) | ||||||
Amounts reclassified fromaccumulated othercomprehensive income | - | - | - | |||||||||
Ending Balance | $ | (3,703 | ) | $ | (2,227 | ) | $ | (5,930 | ) | |||
All amounts are net of tax.
| Fiscal Year Ended September 29, 2012 | ||||||||||||||||
| Net Sales | Gross Profit | Net Earnings | Net Earnings Per Diluted Share(1) | |||||||||||||
| (in thousands, except per share information) | ||||||||||||||||
| 1st Quarter | $ | 172,686 | $ | 46,406 | $ | 5,485 | $ | 0.29 | ||||||||
| 2nd Quarter | 189,554 | 53,987 | 10,423 | 0.55 | ||||||||||||
| 3rd Quarter | 226,335 | 72,507 | 18,672 | 0.99 | ||||||||||||
| 4th Quarter | 242,221 | 77,285 | 19,538 | 1.03 | ||||||||||||
| Total | $ | 830,796 | $ | 250,185 | $ | 54,118 | $ | 2.86 | ||||||||
| Fiscal Year Ended September 24, 2011 | ||||||||||||||||
| Net Sales | Gross Profit | Net Earnings | Net Earnings Per Diluted Share(1) | |||||||||||||
| (in thousands, except per share information) | ||||||||||||||||
| 1st Quarter | $ | 155,632 | $ | 46,101 | $ | 7,094 | $ | 0.38 | ||||||||
| 2nd Quarter | 162,731 | 49,022 | 8,659 | 0.46 | ||||||||||||
| 3rd Quarter | 206,328 | 67,541 | 23,326 | 1.24 | ||||||||||||
| 4th Quarter | 219,380 | 67,110 | 15,984 | 0.85 | ||||||||||||
| Total | $ | 744,071 | $ | 229,774 | $ | 55,063 | $ | 2.93 | ||||||||
(1) Total of quarterly amounts do not necessarily agree to the annual report amounts due to separate quarterly calculations of weighted average shares outstanding
NOTES TO CONSOLIDATED FINANCIAL STATEMENTS (continued)
NOTE Q - QUARTERLY FINANCIAL DATA (UNAUDITED)
Fiscal Year Ended September 27, 2014 | ||||||||||||||||
Net Earnings | ||||||||||||||||
Per | ||||||||||||||||
Gross | Net | Diluted | ||||||||||||||
Net Sales | Profit | Earnings | Share(1) | |||||||||||||
(in thousands, except per share information) | ||||||||||||||||
1st Quarter | $ | 203,523 | $ | 59,906 | $ | 12,426 | $ | 0.66 | ||||||||
2nd Quarter | 205,321 | 61,113 | 13,521 | 0.72 | ||||||||||||
3rd Quarter | 257,113 | 84,368 | 23,678 | 1.26 | ||||||||||||
4th Quarter | 253,494 | 82,190 | 22,189 | 1.18 | ||||||||||||
Total | $ | 919,451 | $ | 287,577 | $ | 71,814 | $ | 3.82 | ||||||||
Fiscal Year Ended September 28, 2013 | ||||||||||||||||
Net Earnings | ||||||||||||||||
Per | ||||||||||||||||
Gross | Net | Diluted | ||||||||||||||
Net Sales | Profit | Earnings | Share(1) | |||||||||||||
(in thousands, except per share information) | ||||||||||||||||
1st Quarter | $ | 191,408 | $ | 54,135 | $ | 10,226 | $ | 0.54 | ||||||||
2nd Quarter | 201,326 | 58,151 | 12,660 | 0.67 | ||||||||||||
3rd Quarter | 237,036 | 75,322 | 21,172 | 1.12 | ||||||||||||
4th Quarter | 237,913 | 75,694 | 20,323 | 1.08 | ||||||||||||
Total | $ | 867,683 | $ | 263,302 | $ | 64,381 | $ | 3.41 | ||||||||
(1) | Total of quarterly amounts do not necessarily agree to the annual report amounts due to separate quarterly calculations of weighted average shares outstanding. |
J & J SNACK FOODS CORP. AND SUBSIDIARIES
SCHEDULE II - VALUATION AND QUALIFYING ACCOUNTS
Opening | Charged to | Closing | ||||||||||||||||
Year | Description | Balance | Expense | Deductions | Balance | |||||||||||||
2014 | Allowance for doubtful accounts | $ | 854,000 | $ | 161,000 | $ | 565,000 | (1) | $ | 450,000 | ||||||||
2013 | Allowance for doubtful accounts | $ | 987,000 | $ | (70,000 | ) | $ | 63,000 | (1) | $ | 854,000 | |||||||
2012 | Allowance for doubtful accounts | $ | 955,000 | $ | 276,000 | $ | 244,000 | (1) | $ | 987,000 | ||||||||
2014 | Inventory Reserve | $ | 4,449,000 | $ | 2,626,000 | $ | 3,093,000 | (2) | $ | 3,982,000 | ||||||||
2013 | Inventory Reserve | $ | 3,883,000 | $ | 2,768,000 | $ | 2,202,000 | (2) | $ | 4,449,000 | ||||||||
2012 | Inventory Reserve | $ | 4,615,000 | $ | 1,291,000 | $ | 2,023,000 | (2) | $ | 3,883,000 | ||||||||
(1) | Write-offs of uncollectible accounts receivable. |
(2) | Disposals of obsolete inventory. |
| Year | Description | Opening Balance | Charged to Expense | Deductions | Closing Balance | |||||||||||||||
| 2012 | Allowance for doubtful accounts | $ | 653,000 | $ | 276,000 | $ | 244,000 | (1 | ) | $ | 685,000 | |||||||||
| 2011 | Allowance for doubtful accounts | $ | 591,000 | $ | 423,000 | $ | 361,000 | (1 | ) | $ | 653,000 | |||||||||
| 2010 | Allowance for doubtful accounts | $ | 623,000 | $ | 493,000 | $ | 525,000 | (1 | ) | $ | 591,000 | |||||||||
| 2012 | Inventory Reserve | $ | 4,615,000 | $ | 1,291,000 | $ | 2,023,000 | (2 | ) | $ | 3,883,000 | |||||||||
| 2011 | Inventory Reserve | $ | 4,189,000 | $ | 1,931,000 | $ | 1,505,000 | (2 | ) | $ | 4,615,000 | |||||||||
| 2010 | Inventory Reserve | $ | 4,209,000 | $ | 1,509,000 | $ | 1,529,000 | (2 | ) | $ | 4,189,000 | |||||||||