The Company’s portfolio of subscription-based solutions provide actionable information and analysis to healthcare organizations and payers across a range of mission-critical, constituent-related elements, including patient experience and satisfaction, community population health risks, workforce engagement, community perceptions, and physician engagement. NRC partners with clients across the continuum of healthcare services. The Company’s clients range from acute care hospitals and post-acute providers, such as home health, long term care and hospice, to numerous payer organizations. The Company believes this cross-continuum positioning is a unique and an increasingly important capability as evolving payment models drive healthcare providers and payers towards a more collaborative and interactive healthcare system.
NRC’s expertise includes the efficient capture, interpretation, transmittal and benchmarking of critical data elements from millions of healthcare consumers. Using its portfolio of solutions through internet-based business intelligence tools, the Company’s clients gain insights into best practices to drive improvements across key performance metrics. The Company’s clients are also able to access networking groups, on-line education and an extensive library of performance improvement material that can be tailored to each of their unique needs.
NRC has achieved a market leadership position through its more than 3132 years of industry innovation and experience, as well as its long-term, recurring revenue relationships (solutions that are used or required by a client each year) with many of the healthcare industry’s largest organizations. Since its founding in 1981, the Company has focused on meeting the evolving information needs of the healthcare industry through internal product development, as well as select acquisitions. The Company is a Wisconsin corporation headquartered in Lincoln, Nebraska.
Industry and Market Opportunity
According to the Kaiser Foundation, health expenditures in the United States were approximately $2.6 trillion in 2010, over ten times the $256 billion spent in 1980. In total, health spending accounted for 17.9% of the nation’s Gross Domestic Product in 2010. Addressing this growing expenditure burden continues to be a major policy priority at both federal and state levels. In addition, continued high unemployment rates and lower incomes for many Americans coupled with increased co-pays and deductibles in employer-sponsoredhealthcare plans have focused even more consumer attention on health spending and affordability. In the public sector, Medicare provides health coverage for individuals aged 65 and older, while Medicaid provides coverage for low income families and other individuals in need. Both programs are administered by the Centers for Medicare & Medicaid Services (“CMS”). With the aging of the U.S. population, Medicare enrollment has increased significantly. In addition, longer life spans and greater prevalence of chronic illnesses among both the Medicare and Medicaid populations have placed tremendous demands on the health care system.
Driven by escalating costs and a growing recognition of the challenges of chronic care and unnecessary hospitalizations, Medicare reimbursement for healthcare providers is shifting from a volume-based approach (fees paid for each element of service rendered, independent of outcome) to a more value-based model, where reimbursement is based on the value (or quality) of the healthcare service delivered. This shift has been enabled, in part, by the establishment of standardized quality-focused datasets and the requirement that providers capture and transmit these data to CMS.
An increasing percentage of Medicare reimbursement (and, in all likelihood, reimbursement from commercial payers as well) will be at risk for hospitals, based on factors such as patient readmission rates and provider adherence to certain quality-related protocols. At the same time, many hospitals and other providers are creating new models of care delivery and reimbursement to reduce cost and enable more effective delivery of care. These new models are based on sharing financial risk and managing the health and behaviors of large populations of patients and consumers. Certain of these new models are known as accountable care organizations, or ACOs, and medical homes, in which multiple provider organizations are coordinated in providing care and bearing shared financial risk in serving a defined patient population. This transformation towards population-based health management, value-based purchasing, and an increased engagement of healthcare consumers is resulting in a greater need for providers to deliver more customer-centric healthcare.
NRC believes that its current portfolio of solutions is aligned to address this evolving market opportunity. The Company provides tools and solutions to capture, interpret and improve the data required by CMS as well as enhanced capabilities that capture insights about patient health risks, behaviors and perspectives. The information and analytics provided through these solutions enable payers and providers to better tailor offerings to the populations they serve. Meanwhile, the Company’s portfolio of engagement solutions helps providers address and impact the types of behaviors that could result in reduced hospital re-admission rates—rates, resulting in a direct and measurable impact on providers’ revenue.
Finally, the Company believes that its ability to offer these insights across the entire care continuum is particularly relevant as new reimbursement models force collaboration amongst different types of providers. Bundled payments, medical home, ACOs and other models of reimbursement for population-based health management all require an understanding of healthcare both within and outside of the traditional acute care setting.
NRC’s Solutions
NRC’s portfolio of solutions address specific market needs around growth, retention, engagement and thought leadership for healthcare providers, payers and other healthcare organizations. While each distinct solution provides discernible value on a stand-alone basis, the Company believes that in combination, its solutions provide a comprehensive view of healthcare consumers both within healthcare settings and outside of those settings—creating a differentiated solution set to address the emerging needs for population-based health management.
Growth Solutions - NRC’s growth solutions are subscription-based services that include measurement of community perception (Market Insights), brand tracking (BrandArc) and advertising testing (Advoice)(AdVoice). Market Insights is the largest online U.S. healthcare survey, measuring the opinions and behaviors of 270,000 healthcare consumers in the top 250 metropolitan areasmarkets across the country annually. Market Insights is a syndicated survey that provides clients with an independent third-party source of information that is used to understand consumer preferences and optimize marketing strategies. BrandArc is a solution that enables clients to measure brand value and build brand equity in their markets. AdVoice is a solution that helps NRC’s clients evaluate and optimize advertising efficiency and consumer recall. The Company’s growth solutions have historically been marketed under the Healthcare Market Guide and Ticker brands.
Retention Solutions - NRC’s retention solutions include patient and resident experience, physician engagement and employee experience measurement and improvement tools. These solutions enable clients to comply with regulatory requirements and to improve their reimbursement under value-based purchasing models. Additionally, clients use these applications to positively impact patient experience through utilization of the Company’s prescriptive analytics to enable improvement planning and implementation of best practices. Finally, with a growing body of research linking employee and physician satisfaction levels to providerprovide quality and patient experience, NRC’s retention solutions also measure satisfaction from those constituents and integrate that data into prescriptive analytics for improvement.
The Company’s retention solutions are marketed under the NRC Picker, My InnerView (“MIV”), and NRC Picker Canada brands and are provided on a subscription basis via a cross-continuum platform that collects and measures data and then delivers business intelligence that the Company’s clients utilize to improve retention, experience and reimbursement. NRC provides these performance results and prescriptive analytics to its clients via the Company’s Catalyst improvement planning and business intelligence portal. In addition, clients have an option of more immediate feedback via the Company’s real-time mobile data collection platform.
Engagement Solutions - NRC’s engagement solutions include its health risk assessments (Payer Solutions), patient outreach and discharge call program (Illuminate)(Connect Transitions) and post-acute analytics (Outcome Concept Systems, or OCS). These solutions enable the Company’s clients to understand the health risks associated with populations of patients, analyze and address readmission risks and efficiently reach out to patients to impact their behaviors outside of the healthcare provider settings. The Company’s health risk assessment solutions enable its clients to effectively stratify and manage care for those who are most at-risk, engage individuals, increase preventative care and manage wellness programs to improve patient experience and outcomes. NRC’s patient outreach and discharge call solutions are provided to healthcare organizations on a subscription basis. TheseThrough preference-based communications and real time alerts, these solutions provide real-time, immediate feedbackenable organizations to its clientsidentify and manage high risk patients to enable improvement ofreduce readmissions, increase patient experiencesatisfaction and rate of avoidable readmissions. support safe care transitions. NRC’s post-acute analytics solutions provide business intelligence for home health and hospice providers that enable the improvement of patient experience, operational performance and clinical outcomes.
The Connect Transitions solution is provided by Customer-Connect LLC (doing business as Connect). Connect was formed in June 2013 to develop and provide patient outreach and discharge call solutions. NRC has a 49% ownership interest in Connect, NG Customer-Connect, LLC holds 25% interest and the remaining 26% is held by Illuminate Health, LLC.
The key proprietary components of NRC’s engagement solutions include a real-time electronic medical records integration platform; a portfolio of risk assessments for individual patient populations and care settings; and post-acute predictive models and algorithms based on proprietary datasets.
Thought Leadership Solutions –NRC’s thought leadership solutions include national conferences, publications and an on-line portal, and are integrated at various levels into NRC’s growth, retention and engagement solutions. NRC also offers a specific thought leadership service branded as The Governance Institute (“TGI”). TGI is a membership organization that offers subscription-based governance information solutions and educational conferences designed to improve the effectiveness of hospital and healthcare systems by continually strengthening their boards, medical leadership and management performance. TGI conducts conferences, produces publications, videos, white papers and research studies, and tracks industry trends showcasing emerging healthcare trends and best practice solutions of healthcare boards across the country.
NRC’s Competitive Strengths
The Company believes that its competitive strengths include the following:
A leading provider of patient experience solutions for healthcare providers, payers and other healthcare organizations. The Company’s history is based capturing the voice of the consumer in healthcare markets. With survey solutions that span the healthcare continuum, in 2013 and 2012 the Company was recognized by Modern Healthcare as one of the nation’s largest patient experience survey providers.providers. Its solutions build on the “Eight Dimensions of Patient-Centered Care,” a philosophy developed by noted patient advocate Harvey Picker, who believed patients’ experiences are integral to quality healthcare. NRC has extended this philosophy to include families, caregivers, employees and other stakeholders.
Premier client portfolio across the care continuum.NRC’s client portfolio encompasses leading healthcare organizations across the healthcare continuum, from acute care hospitals and post-acute providers to healthcare payers. The Company’s client base is diverse, with its top ten clients representing approximately 22%19% of total revenue for the year ended December 31, 20122013 and no single client representing more than 5% of the Company’s revenue.
Highly scalable and visible revenue model. The Company’s solutions are offered to healthcare providers, payers and other healthcare organizations primarily through subscription-based service agreements. The solutions NRC provides are also recurring in nature, which enables an ongoing relationship with its clients. This combination of subscription-based revenue, a base of ongoing client renewals and automated platforms creates a highly visible and scalable revenue model for the Company.
Comprehensive portfolio of solutions. Since NRC offers solutions encompassing growth, retention, engagement and thought leadership, its clients can engage with the Company at multiple levels and, over time, increase their commitment and spend.
Exclusive focus on healthcare.The Company focuses exclusively on healthcare and serving the unique needs of healthcare organizations across the continuum, which NRC believebelieves gives it a distinct competitive advantage compared to other survey and analytics software providers. The Company’s platform includes features and capabilities built specifically for healthcare providers, including a library of performance improvement content which can be tailored to the provider based on their specific customer feedback profile.
Experienced senior management team led by NRC’s founder.NRC’s senior management team has extensive industry and leadership experience. Michael D. Hays, the Company’s Chairman and Chief Executive Officer, founded NRC in 1981.1981. Prior to launching the Company, MikeMr. Hays served as Vice President and as a Director of SRI Research Center, Inc. (now known as the Gallup Organization). The Chief Financial Officer, Kevin Karas, CPA, has extensive financial experience having served as CFO at two previous companies, along with healthcare experience at Rehab Designs of America, Inc. and NovaCare, Inc. NRC’s President and Chief Operating Officer, Susan Henricks, has extensive leadership experience in high volume data and analytics businesses, having served asPresident of Financial Institution Services for First Data Corporation, the largest processor of credit card, debit card, and merchant transactions in the U.S. She also served as President for printing and marketing services organizations, in addition to various other leadership positions.
Competition
The healthcare information and market research services industry is highly competitive. The Company has traditionally competed with healthcare organizations’ internal marketing, market research and/or quality improvement departments which create their own performance measurement tools, and with relatively small specialty research firms which provide survey-based healthcare market research and/or performance assessment. The Company’s primary competitors among such specialty firms include Press Ganey, which NRC believes has significantly higher annual revenue than the Company, and three or four other firms that NRC believes have less annual revenue than the Company. The Company, to a certain degree, currently competes with, and anticipates that in the future it may increasingly compete with, (1) traditional market research firms which are significant providers of survey-based, general market research and (2) firms which provide services or products that complement healthcare performance assessments such as healthcare software or information systems. Although only a few of these competitors have offered specific services that compete directly with the Company’s solutions, many of these competitors have substantially greater financial, information gathering, and marketing resources than the Company and could decide to increase their resource commitments to the Company’s market. There are relatively few barriers to entry into the Company’s market, and the Company expects increased competition in its market which could adversely affect the Company’s operating results through pricing pressure, increased marketing expenditures, and market share losses, among other factors. There can be no assurance that the Company will continue to compete successfully against existing or new competitors.
The Company believes the primary competitive factors within its market include quality of service, timeliness of delivery, unique service capabilities, credibility of provider, industry experience, and price. NRC believes that its industry leadership position, exclusive focus on the healthcare industry, cross-continuum presence, comprehensive portfolio of solutions and relationships with leading healthcare payers and providers position the Company to compete in this market.
Growth Strategy
NRC believes that the value proposition of its current solutions, combined with the favorable alignment of its solutions with emerging market demand, positions the Company to benefit from multiple growth opportunities. The Company believes that it can accelerate its growth through (1) increasing sales of its existing solutions to its existing clients (or cross-selling), (2) winning additional new clients through market share growth in existing market segments, (3) developing and introducing new solutions to new and existing clients, and (4) pursuing acquisitions of, or investments in, firms providing products, solutions or technologies which complement those of the Company.
Selling additional solutions to existing clients. Less than 20%25% of the Company’s existing clients purchase more than one of its solutions. NRC’s sales organization actively identifies and pursues these cross-sell opportunities in order to accelerate the growth of the Company.
Adding new clients.NRC believes that there is an opportunity to add new clients in each of the acute care, post-acute care and health plan market segments. For example, in the acute care segment, the Company has client relationships with approximately 50% of the facilities in the U.S., leaving half of the market as an available growth opportunity. The Company’s sales organization is actively identifying and engaging new client prospects in each of the segments noted above, with a focus on featuring its comprehensive cross continuum portfolio of solutions.
Adding new solutions.The need for growth, retention and engagement solutions in the market segments that NRC serves is evolving to align with emerging healthcare regulatory and reimbursement trends. The evolving market creates an opportunity for the Company to introduce new solutions that leverage its existing core competencies. The Company believes that there is an opportunity to drive sales growth with both existing and new clients, across all of the market segments that it serves, through the introduction of new solutions. Two examples of solutions the Company recently developed and introduced are the Care Transition and Point-of-Care offerings that were successfully piloted over the past year.
Pursue Strategic Acquisitions.The Company has historically complemented its organic growth with strategic acquisitions, having completed six such transactions over the past twelve years. These transactions have added new capabilities and access to market segments that are adjacent and complementary to the Company’s existing solutions and market segments. NRC believes that additional strategic acquisition opportunities exist for the Company to complement its organic growth by further expanding its service capabilities, technology offerings and end markets.
Sales and Marketing
The Company generates the majority of its revenue from the renewal of subscription-based client service agreements, supplemented by sales of other solutions to existing clients and the addition of new clients. NRC sales activities are carried out by a direct sales organization staffed with professional, trained sales associates. As compared to the typical industry practice of compensating sales associates with relatively high base pay and a relatively small sales commission, NRC compensates its sales staff with relatively low base pay and a relatively high commission component. The Company believes this compensation structure provides incentives to its sales associates to surpass sales goals and increases the Company’s ability to attract top-quality sales associates.
In addition to prospect leads generated by direct sales associates, the Company’s integrated marketing activities facilitate its ongoing receipt of prospect request-for-proposals. NRC uses lead generation mechanisms to add generated leads to its database of current and potential client contacts. The Company also maintains an active public relations program which includes (1) an ongoing presence in leading industry trade press and in the mainstream press, (2) public speaking at strategic industry conferences, (3) fostering relationships with key industry constituencies, and (4) the annual Consumer Choice Award program recognizing top-ranking healthcare organizations.
Clients
NRC’s clients include many of the nation’s largest healthcare systems. The Company serves over 2,5002,400 acute care facilities, including over 75% of the Thomson “Top 100 Hospitals.”facilities. It also provides solutions to over 10080 payer organizationshealth plans and 9,5007,700 post-acute facilities. These clients utilize NRC’s reporting platforms that capture, self-reported customer data from over 15 million unique healthcare episodes annually.
The Company’s ten largest clients accounted for 22%19%, 20%22%, and 19%20% of the Company’s total revenue in 2013, 2012 2011 and 2010,2011, respectively. Approximately 8%7% of the Company’s revenue was derived from foreign customers in 2013, and 8% in 2012 2011, and 2010.
For financial information by geographic area, see Note 12 to the Company’s consolidated financial statements.
Intellectual Property and Other Proprietary Rights
The Company’s success depends in part upon its data collection processes, research methods, data analysis techniques and internal systems, and procedures that it has developed specifically to serve clients in the healthcare industry. The Company has no patents. Consequently, it relies on a combination of copyright and trade secret laws and associate nondisclosure agreements to protect its systems, survey instruments and procedures. There can be no assurance that the steps taken by the Company to protect its rights will be adequate to prevent misappropriation of such rights or that third parties will not independently develop functionally equivalent or superior systems or procedures. The Company believes that its systems and procedures and other proprietary rights do not infringe upon the proprietary rights of third parties. There can be no assurance, however, that third parties will not assert infringement claims against the Company in the future or that any such claims will not result in protracted and costly litigation, regardless of the merits of such claims or whether the Company is ultimately successful in defending against such claims.
Associates
As of December 31, 2012,2013, the Company employed a total of 348352 persons on a full-time basis. In addition, as of such date, the Company had 3536 part-time associates primarily in its survey operations, representing approximately 18 full-time equivalent associates. None of the Company’s associates are represented by a collective bargaining unit. The Company considers its relationship with its associates to be good.
Executive Officers of the Company
The following table sets forth certain information as of February 1, 2013,2014, regarding the executive officers of the Company:
Name | Age | Position | |||
Michael D. Hays | 59 | Chief Executive Officer | |||
Susan L. Henricks | 63 | President and Chief Operating Officer | |||
Kevin R. Karas | 56 | Senior Vice President Finance, Chief Financial Officer, Treasurer and Secretary | |||
Michael D. Hays has served as Chief Executive Officer and a director since he founded the Company in 1981. He also served as President of the Company from 1981 to 2004 and from July 2008 to July 2011. Prior to founding the Company, Mr. Hays served for seven years as a Vice President and a director of SRI Research Center, Inc. (n/k/a the Gallup Organization).
Susan L. Henricks has served as President and Chief Operating Officer of the Company since she joined the Company in July 2011. From 2008 until joining the Company, she served as Managing Partner and Co-Founder of Arbor Capital, LLC, a private equity firm focused primarily on companies in the marketing and information services, payments technology and business process outsourcing sectors. Prior to starting Arbor Capital, Ms. Henricks served as President of the Financial Institution Services business of First Data Corporation, the largest processor of credit card, debit card and merchant transactions in the U.S., from 2006 to 2008, President of RRD Direct and then the directories business of RR Donnelley, a global leader in printing and print services, from 2000 to 2006, President of Donnelley Marketing, a direct marketing services company, from 1999 to 2000, and President of First Data Enterprises, the credit card issuing business of First Data Corporation, from 1997 to 1999. Ms. Henricks also held various leadership positions with Metromail Corporation, a direct marketing services company, from 1985 to 1997, including President and CEO from 1993 to 1997.
Kevin R. Karas has served as Chief Financial Officer, Treasurer and Secretary of the Company since September 2011, and as Senior Vice President Finance since he joined the Company in December 2010. From 2005 to 2010, he served as Vice President of Finance for Lifetouch Portrait Studios, Inc., a national retail photography company. Mr. Karas also previously served as Chief Financial Officer at CARSTAR, Inc., an automobile collision repair franchise business, from 2000 to 2005, Chief Financial Officer at Rehab Designs of America, Inc., a provider of orthotic and prosthetic services, from 1993 to 2000, and as a regional Vice President of Finance and Vice President of Operations at Novacare, Inc., a provider of physical rehabilitation services, from 1988 to 1993. He began his career as a Certified Public Accountant at Ernst & Young.
Executive officers of the Company are elected by and serve at the discretion of the Company’s Board of Directors. There are no family relationships between any directors or executive officers of NRC.
Available Information
More information regarding NRC is available on theavailableonthe Company's website at www.nationalresearch.com. NRC is not including the information contained on or available through its website as part of, or incorporating such information by reference into, this Annual Report on Form 10-K. The Company's Annual ReportReports on Form 10-K, Quarterly Reports on Form 10-Q, Current Reports on Form 8-K and any amendments to those reports are made available to the public at no charge through a link appearing on the Company's website. NRC provides access to such materials through its website as soon as reasonably practicable after electronically filing such material with, or furnishing it to, the Securities and Exchange Commission. ReportsCommission.Reports and amendments posted on the Company’s website do not include access to exhibits and supplemental schedules electronically filed with the reports or amendments.
Item 1A. Risk Factors
You should carefully consider each of the risks described below, together with all of the other information contained in this Annual Report on Form 10-K, before making an investment decision with respect to our securities. If any of the following risks develop into actual events, our business, financial condition or results of operations could be materially and adversely affected and you may lose all or part of your investment.
We depend on contract renewals for a large share of our revenue and our operating results could be adversely affected.
We expect that a substantial portion of our revenue for the foreseeable future will continue to be derived from renewable service contracts. Substantially all contracts are renewable annually at the option of our clients, although a client generally has no minimum purchase commitment under a contract and the contracts are generally cancelable on short or no notice without penalty. To the extent that clients fail to renew or defer their renewals, we anticipate our results may be materially adversely affected. Our ability to secure renewals depends on, among other things, our ability to gather and analyze performance data in a consistent, high-quality, and timely fashion. In addition, the service needs of our clients are affected by accreditation requirements, enrollment in managed care plans, the level of use of satisfaction measures in healthcare organizations’ overall management and compensation programs, the size of operating budgets, clients’ operating performance, industry and economic conditions, and changes in management or ownership. As these factors are beyond our control, we cannot ensure that we will be able to maintain our renewal rates. Any material decline in renewal rates from existing levels would have an adverse effect on our revenue and a corresponding effect on our operating and net income.
Our operating results may fluctuate and this may cause our stock price to decline.
Our overall operating results may fluctuate as a result of a variety of factors, including the size and timing of orders from clients, client demand for our services (which, in turn, is affected by factors such as accreditation requirements, enrollment in managed care plans, operating budgets and clients’ operating performance), the hiring and training of additional staff, expense increases, and industry and general economic conditions. Because a significant portion of our overhead is fixed in the short-term, particularly some costs associated with owning and occupying our building and full-time personnel expenses, our results of operations may be materially adversely affected in any particular period if revenue falls below our expectations. These factors, among others, make it possible that in some future period our operating results may be below the expectations of securities analysts and investors which would have a material adverse effect on the market price of our class A common stock and/or our class B common stock.
We operate in a highly competitive market and could experience increased price pressure and expenses as a result.
The healthcare information and market research services industry is highly competitive. We have traditionally competed with healthcare organizations’ internal marketing, market research and/or quality improvement departments that create their own performance measurement tools, and with relatively small specialty research firms that provide survey-based healthcare market research and/or performance assessment. The Company’s primary competitors among such specialty firms include Press Ganey, which we believe has significantly higher annual revenue than us, and three or four other firms that we believe have lower annual revenue than us. To a certain degree, we currently compete with, and anticipate that in the future we may increasingly compete with, (1) traditional market research firms which are significant providers of survey-based, general market research, and (2) firms which provide services or products that complement healthcare performance assessments, such as healthcare software or information systems. Although only a few of these competitors have offered specific services that compete directly with our services, many of these competitors have substantially greater financial, information gathering, and marketing resources than the Company and could decide to increase their resource commitments to our market. There are relatively few barriers to entry into the Company’s market, and we expect increased competition in our market which could adversely affect our operating results through pricing pressure, increased marketing expenditures, and market share losses, among other factors. There can be no assurance that the Company will continue to compete successfully against existing or new competitors.
Because our clients are concentrated in the healthcare industry, our revenue and operating results may be adversely affected by changes in regulations, a business downturn or consolidation with respect to the healthcare industry.
Substantially all of our revenue is derived from clients in the healthcare industry. As a result, our business, financial condition and results of operations are influenced by conditions affecting this industry, including changing political, economic, competitive and regulatory influences that may affect the procurement practices and operation of healthcare providers and payers. The 2010 Federal comprehensive healthcare reform plan, which includes provisions to control healthcare costs, improve healthcare quality and expand access to affordable health insurance, could result in lower reimbursement rates and otherwise change the environment in which providers and payers operate. In addition, large private purchasers of healthcare services are placing increasing cost pressure on providers. Healthcare providers may react to these cost pressures and other uncertainties by curtailing or deferring purchases, including purchases of our services. Moreover, there has been consolidation of companies in the healthcare industry, a trend which we believe will continue to grow. Consolidation in this industry, including the potential acquisition of certain of our clients, could adversely affect aggregate client budgets for our services or could result in the termination of a client’s relationship with us. The impact of these developments on the healthcare industry is difficult to predict and could have an adverse effect on our revenue and a corresponding effect on our operating and net income.
In March 2010, President Obama signed into law the Patient Protection and Affordable Care Act and the Health Care and Education Reconciliation Act of 2010. The legislation makes extensive changes to the current system of healthcare insurance and benefits that will includeincludes changes in Medicare and Medicaid payment policies and other healthcare delivery reforms aimed at improving quality and decreasing costs, comparative effectiveness research, and independent payment advisory boards, among other provisions. These provisions could negatively impact our health care clients and could impact the services we provide our clients, the demand for the services we provide and the Company’s business. At this time, it is difficult to estimate the impact of this legislation on the Company but there can be no assurances that health care reform will not adversely impact either our operating results or the manner in which we operate our business.
We rely on a limited number of key clients and a loss of one or more of these key clients will adversely affect our operating results.
We rely on a limited number of key clients for a substantial portion of our revenue. The Company’s ten largest clients accounted for 22%19%, 20%22%, and 19%20% of the Company’s total revenue in 2013, 2012, and 2011, and 2010, respectively.
We cannot assure you that we will maintain our existing client base, maintain or increase the level of revenue or profits generated by our existing clients, or be able to attract new clients. Furthermore, the healthcare industry continues to undergo consolidation and we cannot assure you that such consolidation will not cause us to lose clients. The loss of one or more of our large clients or a significant reduction in business from such clients, regardless of the reason, may have a negative effect on our revenue and a corresponding effect on our operating and net income. See “Risk Factors— Because our clients are concentrated in the healthcare industry, our revenue and operating results may be adversely affected by changes in regulations, a business downturn or consolidation with respect to the healthcare industry.”
We face several risks relating to our ability to collect the data on which our business relies.
Our ability to provide timely and accurate performance measurement and improvement services to our clients depends on our ability to collect large quantities of high-quality data through surveys and interviews. If receptivity to our survey and interview methods by respondents declines, or, for some other reason, their willingness to complete and return surveys declines, or if we, for any reason, cannot rely on the integrity of the data we receive, then our revenue could be adversely affected with a corresponding effect on our operating and net income. We also rely on third-party panels of pre-recruited consumer households to produce Ticker in a timely manner. If we are not able to continue to use these panels, or the time period in which we use these panels is altered and we cannot find alternative panels on a timely, cost-competitive basis, we could face an increase in our costs or an inability to effectively produce Ticker.Market Insights (formerly Ticker). In either case, our operating and net income could be negatively affected.
Our principal shareholder effectively controls the Company, and holders of class A common stock are not able to independently elect directors of NRC or control any of the Company's management policies or business decisions because the holders of class A common stock have substantially less voting power than the holders of the Company's class B common stock, a majority of which is beneficially owned by our company.
The Company's outstanding stock is divided into two classes of common stock: class A common stock and class B common stock. The class B common stock has one vote per share on all matters and the class A common stock has one-one-hundredth (1/100th) of one vote per share. As of February 21, 2014, the class B common stock constitutes approximately 94% of NRC's total voting power. As a result, holders of class B common stock are able to exercise a controlling influence over the Company's business, have the power to elect its directors and indirectly control decisions such as whether to issue additional shares, declare and pay dividends or enter into significant corporate transactions. A majority of the class B common stock is owned by Michael D. Hays, our Chief Executive Officer,Officer.
As of February 21, 2014, approximately 54% of the outstanding class B common stock and approximately 26% of the outstanding class A common stock was beneficially owned by Mr. Hays, and that collectively constitutes approximately 58%52% of our outstanding common stock as of February 20, 2013.the Company's total voting power. As a result, Mr. Hays can control matters requiring shareholder approval, including the election of directors and the approval of significant corporate matters such as change of control transactions. The effects of such influence could be to delay or prevent a change of control of our companythe Company unless the terms are approved by Mr. Hays.
Our business and operating results could be adversely affected if we are unable to attract or retain key managers and other personnel.
Our future performance may depend, to a significant extent, upon the efforts and ability of our key personnel who have expertise in gathering, interpreting and marketing survey-based performance information for healthcare markets. Although client relationships are managed at many levels within our company, the loss of the services of Michael D. Hays, our Chief Executive Officer, or one or more of our other senior managers, could have a material adverse effect, at least in the short to medium term, on most significant aspects of our business, including strategic planning, product development, and sales and customer relations. As of December 31, 2012,2013, we maintained $500,000 of key officer life insurance on Mr. Hays. Our success will also depend on our ability to hire, train and retain skilled personnel in all areas of our business. Currently, we do not have employment agreements with our officers or our other key personnel. Competition for qualified personnel in our industry is intense, and many of the companies that compete with us for qualified personnel have substantially greater financial and other resources than us. Furthermore, we expect competition for qualified personnel to become more intense as competition in our industry increases. We cannot assure you that we will be able to recruit, retain and motivate a sufficient number of qualified personnel to compete successfully.
If intellectual property and other proprietary information technology were copied or independently developed by our competitors, our operating results could be negatively affected.
Our success depends in part upon our data collection process, research methods, data analysis techniques, and internal systems and procedures that we have developed specifically to serve clients in the healthcare industry. We have no patents. Consequently, we rely on a combination of copyright, trade secret laws and associate nondisclosure agreements to protect our systems, survey instruments and procedures. We cannot assure you that the steps we have taken to protect our rights will be adequate to prevent misappropriation of such rights, or that third parties will not independently develop functionally equivalent or superior systems or procedures. We believe that our systems and procedures and other proprietary rights do not infringe upon the proprietary rights of third parties. We cannot assure you, however, that third parties will not assert infringement claims against us in the future, or that any such claims will not result in protracted and costly litigation, regardless of the merits of such claims, or whether we are ultimately successful in defending against such claims.
Our business and operating results could be adversely affected if we experience business interruptions or failure of our information technology and communication systems.
Our ability to provide timely and accurate performance measurement and improvement services to our clients depends on the efficient and uninterrupted operation of our information technology and communication systems, and those of our external service providers. Our systems and those of our external service providers, could be exposed to damage or interruption from fire, natural disasters, energy loss, telecommunication failure, security breach and computer viruses. An operational failure or outage in our information technology and communication systems or those of our external service providers, could result in loss of customers, damage to customer relationships, reduced revenue and profits, refunds of customer charges and damage our reputation and may result in additional expense to repair or replace damaged equipment and recover data loss resulting from the interruption. Although we have taken steps to prevent system failures and have back-up systems and procedures to prevent or reduce disruptions, such steps may not prevent an interruption of services and our disaster recovery planning may not account for all contingencies. Additionally, our insurance may not adequately compensate us for all losses or failures that may occur. Any one of the above situations could have a material adverse effect on our business, financial condition, results of operations and reputation.
Security breaches or computer viruses could harm our business.
In connection with our client services, we receive, process, store and transmit sensitive business information electronically over the Internet. Computer viruses could spread throughout our systems and disrupt operations and service delivery. Unauthorized access to our computer systems or databases could result in the theft or publication of confidential information or the deletion or modification of records or could otherwise cause interruption in our operations. We cannot be certain that the technology protecting our networks and information will successfully prevent computer viruses, data thefts, release of confidential information or security breaches. A compromise in our data security systems that results in inappropriate disclosure of our associates', customers' or vendors' confidential information, could harm our reputation and expose us to regulatory action and claims. Changes in privacy and information security laws and standards may require we incur significant expense to ensure compliance due to increased technology investment and operational procedures. Anprocedures.An inability to prevent security breaches or computer viruses or failure to comply with privacy and information security laws could result in litigation and regulatory risk, loss of customers, damage to customer relationships, reduced revenue and profits, refunds of customer charges and damage our reputation, which could adversely affect our business, financial condition, results of operations and reputation.
Our growth strategy includes future acquisitions which involve inherent risk.
In order to expand services or technologies to existing clients and increase our client base, we may make strategic business acquisitions that we believe complement our business. Acquisitions have inherent risks which may have a material adverse effect on our business, financial condition, or results of operations, including, among other things: (1) failure to successfully integrate the purchased operations, technologies, products or services and maintain uniform standard controls, policies and procedures; (2) substantial unanticipated integration costs; (3) loss of key associates including those of the acquired business; (4) diversion of management’s attention from other operations; (5) failure to retain the customers of the acquired business; (6) failure to achieve any projected synergies and performance targets; (7) additional debt and/or assumption of known or unknown liabilities; (8) dilutive issuances of equity securities; and (9) a write-off of goodwill, software development costs, client lists, other intangibles and amortization of expenses. If we fail to successfully complete acquisitions or integrate acquired businesses, we may not achieve projected results and there may be a material adverse effect on our business, financial condition and results of operations.
Item 1B. Unresolved Staff Comments
The Company has no unresolved staff comments to report pursuant to this item.
Item 2. Properties
The Company’s headquarters is located in an owned office building in Lincoln, Nebraska, of which 62,000 square feet are used for the Company’s operations. This facility houses all the capabilities necessary for NRC’s survey programming, printing and distribution, data processing, analysis and report generation, marketing, and corporate administration. The Company’s term notes arenote is secured by this property, among other things.
The Company is leasing 2,6004,000 square feet of office space in Markham, Ontario, 5,100 square feet of office space in San Diego, California, 3,300 square feet of office space in Lincoln, Nebraska, and 8,100 square feet of office space in Seattle, Washington.
Item 3. Legal Proceedings
The Company is not subject to any material pending litigation.
Item 4. Mine Safety Disclosures
Not applicable.
PART II
Item 5. Market for the Registrant’s Common Equity, Related Stockholder Matters and Issuer Purchases of Equity Securities
In May 2013, the Company consummated a recapitalization (the “May 2013 Recapitalization”) pursuant to which the Company established two classes of common stock (class A common stock and class B common stock), issued a dividend of three shares of class A common stock for each share of the Company’s Common Stock, $0.001 par value (“Common Stock”), isthen existing common stock and reclassified each then existing share of common stock as one-half of one share of class B common stock. Following the May 2013 Recapitalization, the Company’s class A common stock and the Company’s class B common stock are traded on the NASDAQ Global Market under the symbol “NRCI.symbols “NRCIA” and “NRCIB,” respectively.
The following table sets forth the range of high and low sales prices for, and dividends declared on, the Common StockCompany’s pre-May 2013 Recapitalization common stock and the post-May 2013 Recapitalization class A common stock and class B common stock for the period from January 1, 2011,2012, through
| High | Low | Dividends Declared Per Common Share | ||||||||||
| 2011 Quarter Ended: | ||||||||||||
| March 31 | $ | 34.25 | $ | 29.01 | $ | 0.22 | ||||||
| June 30 | $ | 36.89 | $ | 33.63 | $ | 0.22 | ||||||
| September 30 | $ | 44.44 | $ | 30.96 | $ | 0.22 | ||||||
| December 31 | $ | 38.96 | $ | 28.00 | $ | 0.22 | ||||||
| 2012 Quarter Ended: | ||||||||||||
| March 31 | $ | 43.98 | $ | 36.58 | $ | 0.26 | ||||||
| June 30 | $ | 53.00 | $ | 41.00 | $ | 0.26 | ||||||
| September 30 | $ | 52.71 | $ | 46.19 | $ | 0.26 | ||||||
| December 31 | $ | 58.23 | $ | 49.51 | $ | 1.76 | ||||||
Pre –May 2013 Recapitalization (a): | High | Low | Dividends Declared Per Prior Common Share | |||||||||
2012 Quarter Ended: | ||||||||||||
March 31 | $ | 43.98 | $ | 36.58 | $ | 0.26 | ||||||
June 30 | $ | 53.00 | $ | 41.00 | $ | 0.26 | ||||||
September 30 | $ | 52.71 | $ | 46.19 | $ | 0.26 | ||||||
December 31 | $ | 58.23 | $ | 49.51 | $ | 1.76 | ||||||
2013 Quarter Ended: | ||||||||||||
March 31 | $ | 61.58 | $ | 50.00 | $ | 0.31 | ||||||
April 1 to May 22 | $ | 64.36 | $ | 53.45 | -- | |||||||
| Class A | Class B | |||||||||||||||||||||||||
Post –May 2013 Recapitalization: | High | Low | Dividends Declared Per Common Share | High | Low | Dividends Declared Per Common Share | ||||||||||||||||||||
2013 Quarter Ended: | ||||||||||||||||||||||||||
May 23 to June 30 | $ | 21.31 | $ | 12.36 | -- | $ | 46.52 | $ | 18.24 | -- | ||||||||||||||||
September 30 | $ | 18.84 | $ | 15.36 | -- | $ | 42.48 | $ | 26.61 | -- | ||||||||||||||||
December 31 | $ | 19.00 | $ | 15.69 | -- | $ | 36.88 | $ | 27.25 | -- | ||||||||||||||||
(a) Sales prices and dividends have not been adjusted to give effect to the May 2013 Recapitalization described above.
Cash dividends of $17.4$2.1 million and $5.9$17.4 million in the aggregate were declared and paid during the twelve-month periods ended December 31, 2013 and 2012, and 2011, respectively. In August 2013, the Company’s Board of Directors decided to suspend the payment of cash dividends through the year 2014. The payment and amount of future dividends, if any, is at the discretion of the Company’s Board of Directors and will depend on the Company’s future earnings, financial condition, general business conditions, alternative uses of the Company’s earnings and other factors.
On February 20, 2013,21, 2014, there were approximately 25 shareholders of record and approximately 1,015beneficial owners of the class A common stock and approximately 17 shareholders of record and approximately 1,2001,197 beneficial owners of the Common Stock.
In February 2006, the Board of Directors of the Company authorized the repurchase of 750,0002,250,000 shares of class A common stock and 375,000 shares of class B common stock (on a post-May 2013 Recapitalization basis) in the open market or in privately negotiated transactions. Unless terminated earlier by resolution of the Company’s Board of Directors, the repurchase program will expire when the Company has repurchased all shares authorized for repurchase thereunder. As of February 20, 2013,21, 2014, 610,417 shares of the Company’s prior common stock (now equivalent to 1,831,251 shares of class A common stock and 305,208 shares of class B common stock) have been purchasedrepurchased under thisthat authorization.
| Period | Total Number of Shares Purchased | Average Price Paid per Share | Total Number of Shares Purchased as Part of Publicly Announced Plans or Programs | Maximum Number of Shares that May Yet Be Purchased Under the Plans or Programs | ||||||||||||
| October 1 – October 31, 2012 | 28,194 | $ | 50.32 | 28,194 | 162,668 | |||||||||||
| November 1 – November 30, 2012 | -- | -- | -- | 162,668 | ||||||||||||
| December 1 – December 31, 2012 | 19,270 | $ | 53.88 | 19,270 | 143,398 | |||||||||||
The following graph compares the cumulative 5-year total return provided shareholders on National Research Corporation'sthe Company’s common stock relative to the cumulative total returns of the NASDAQ Composite Index and the Russell 2000 Index. An investment of $100 (with reinvestment of all dividends) is assumed to have been made in our common stock and in each of the indexes on December 31, 2007,2008 (or on May 23, 2013 for our class A common stock which was the first day it was traded), and its relative performance is tracked through December 31, 2012.
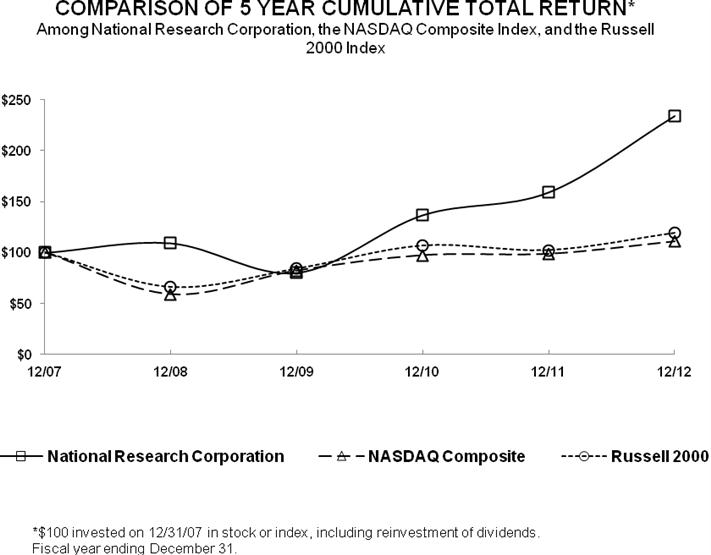
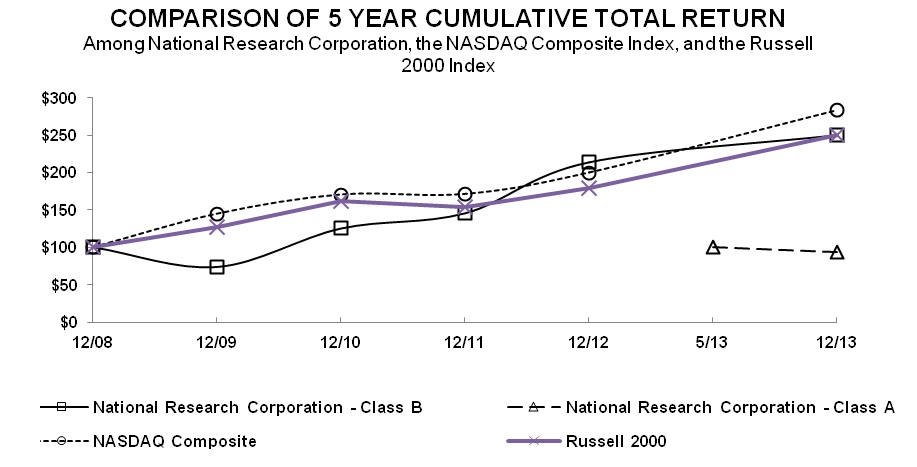
COMPARISON OF FIVE-YEAR CUMULATIVE TOTAL RETURN DATA
The stock price performance included in this graph is not necessarily indicative of future stock price performance.performance.
12/08 | 12/09 | 12/10 | 12/11 | 12/12 | 5/23/2013 | 12/13 | ||||||||||||||||||||||
National Research Corporation- Class A | --- | --- | --- | --- | --- | 100.00 | 94.10 | |||||||||||||||||||||
National Research Corporation- Class B | 100.00 | 73.46 | 125.23 | 145.69 | 214.12 | --- | 250.71 | |||||||||||||||||||||
NASDAQ Composite | 100.00 | 144.88 | 170.58 | 171.30 | 199.99 | --- | 283.39 | |||||||||||||||||||||
Russell 2000 | 100.00 | 127.17 | 161.32 | 154.59 | 179.86 | --- | 249.69 | |||||||||||||||||||||
| 12/07 | 12/08 | 12/09 | 12/10 | 12/11 | 12/12 | |||||||||||||||||||
| National Research Corporation | 100.00 | 109.39 | 80.36 | 136.99 | 159.37 | 234.23 | ||||||||||||||||||
| NASDAQ Composite | 100.00 | 59.03 | 82.25 | 97.32 | 98.63 | 110.78 | ||||||||||||||||||
| Russell 2000 | 100.00 | 66.21 | 84.20 | 106.82 | 102.36 | 119.09 |
Item 6. Selected Financial Data
The selected statement of income data for the years ended December 31, 2013, 2012, 2011, and 2010,2011, and the selected balance sheet data at December 31, 2012,2013 and 2011,2012, are derived from, and are qualified by reference to, the audited consolidated financial statements of the Company included elsewhere in this Annual Report on Form 10-K. The selected statement of income data for the yearsyear ended December 31, 2009,2010 and 2008,2009, and the balance sheet data at December 31, 2011, 2010 2009, and 2008,2009, are derived from audited consolidated financial statements not included herein. The Company acquired OCSOutcome Concept Systems on August 3, 2010, MIVand My InnerView (“MIV”) on December 19, 2009, and customer contracts of SQ Strategies on April 1, 2008. See Note 2 to the Company's consolidated financial statements.
Year Ended December 31, (a) | ||||||||||||||||||||
2013 | 2012 | 2011 | 2010 | 2009 | ||||||||||||||||
(In thousands, except per share data) | ||||||||||||||||||||
Statement of Income Data: | ||||||||||||||||||||
Revenue | $ | 92,590 | $ | 86,421 | $ | 75,767 | $ | 63,398 | $ | 57,692 | ||||||||||
Operating expenses: | ||||||||||||||||||||
Direct | 38,844 | 35,461 | 28,667 | 24,635 | 24,148 | |||||||||||||||
Selling, general and administrative | 25,208 | 23,542 | 23,300 | 20,202 | 16,016 | |||||||||||||||
Depreciation and amortization | 3,732 | 4,699 | 5,065 | 4,704 | 3,831 | |||||||||||||||
Total operating expenses | 67,784 | 63,702 | 57,032 | 49,541 | 43,995 | |||||||||||||||
Operating income | 24,806 | 22,719 | 18,735 | 13,857 | 13,697 | |||||||||||||||
Other expense | (318 | ) | (512 | ) | (575 | ) | (542 | ) | (580 | ) | ||||||||||
Income before income taxes | 24,488 | 22,207 | 18,160 | 13,315 | 13,117 | |||||||||||||||
Provision for income taxes | 9,004 | 7,139 | 6,596 | 4,816 | 4,626 | |||||||||||||||
Net income | $ | 15,484 | $ | 15,068 | $ | 11,564 | $ | 8,499 | $ | 8,491 | ||||||||||
Earnings per share common stock: | ||||||||||||||||||||
Basic Earnings per share: | ||||||||||||||||||||
Class A | $ | 0.37 | $ | 0.37 | $ | 0.29 | $ | 0.21 | $ | 0.21 | ||||||||||
Class B | $ | 2.25 | $ | 2.22 | $ | 1.73 | $ | 1.28 | $ | 1.28 | ||||||||||
Diluted Earnings per share: | ||||||||||||||||||||
Class A | $ | 0.37 | $ | 0.36 | $ | 0.28 | $ | 0.21 | $ | 0.21 | ||||||||||
Class B | $ | 2.20 | $ | 2.17 | $ | 1.69 | $ | 1.26 | $ | 1.26 | ||||||||||
| Weighted average share and share equivalents outstanding: | ||||||||||||||||||||
Class A - basic | 20,677 | 20,325 | 20,016 | 19,912 | 19,910 | |||||||||||||||
Class B - basic | 3,447 | 3,388 | 3,336 | 3,319 | 3,318 | |||||||||||||||
Class A - diluted | 21,099 | 20,854 | 20,526 | 20,207 | 20,170 | |||||||||||||||
Class B - diluted | 3,514 | 3,476 | 3,421 | 3,368 | 3,362 | |||||||||||||||
| December 31, | ||||||||||||||||||||
2013 | 2012 | 2011 | 2010 | 2009 | ||||||||||||||||
(In thousands) | ||||||||||||||||||||
Balance Sheet Data: | ||||||||||||||||||||
Working capital surplus (deficiency) | $ | 12,784 | $ | (11,483 | ) | $ | (2,262 | ) | $ | (8,809 | ) | $ | (4,432 | ) | ||||||
Total assets | 110,996 | 100,046 | 100,676 | 95,770 | 72,499 | |||||||||||||||
Total debt and capital lease obligations, including current portion | 10,546 | 12,763 | 14,912 | 16,599 | 7,719 | |||||||||||||||
Total shareholders’ equity | $ | 71,755 | $ | 56,742 | $ | 55,554 | $ | 48,584 | $ | 44,171 | ||||||||||
(a) | All share and per share data have been retroactively adjusted to give effect to the May 2013 Recapitalization as further described in Note 1 to the accompanying consolidated financial statements. |
| Year Ended December 31, | ||||||||||||||||||||
| 2012 | 2011 | 2010 | 2009 | 2008 | ||||||||||||||||
| (In thousands, except per share data) | ||||||||||||||||||||
| Statement of Income Data: | ||||||||||||||||||||
| Revenue | $ | 86,421 | $ | 75,767 | $ | 63,398 | $ | 57,692 | $ | 51,013 | ||||||||||
| Operating expenses: | ||||||||||||||||||||
| Direct | 35,461 | 28,667 | 24,635 | 24,148 | 23,611 | |||||||||||||||
| Selling, general and administrative | 23,542 | 23,300 | 20,202 | 16,016 | 12,728 | |||||||||||||||
| Depreciation and amortization | 4,699 | 5,065 | 4,704 | 3,831 | 2,685 | |||||||||||||||
| Total operating expenses | 63,702 | 57,032 | 49,541 | 43,995 | 39,024 | |||||||||||||||
| Operating income | 22,719 | 18,735 | 13,857 | 13,697 | 11,989 | |||||||||||||||
| Other expense | (512 | ) | (575 | ) | (542 | ) | (580 | ) | (6 | ) | ||||||||||
| Income before income taxes | 22,207 | 18,160 | 13,315 | 13,117 | 11,983 | |||||||||||||||
| Provision for income taxes | 7,139 | 6,596 | 4,816 | 4,626 | 4,538 | |||||||||||||||
| Net income | $ | 15,068 | $ | 11,564 | $ | 8,499 | $ | 8,491 | $ | 7,445 | ||||||||||
| Net income per share - basic | $ | 2.22 | $ | 1.73 | $ | 1.28 | $ | 1.28 | $ | 1.11 | ||||||||||
| Net income per share - diluted | $ | 2.17 | $ | 1.69 | $ | 1.26 | $ | 1.26 | $ | 1.09 | ||||||||||
| Dividends per share | $ | 2.54 | $ | 0.88 | $ | 0.76 | $ | 0.64 | $ | 0.56 | ||||||||||
| Weighted average shares outstanding – basic | 6,775 | 6,672 | 6,637 | 6,637 | 6,685 | |||||||||||||||
| Weighted average shares outstanding – diluted | 6,951 | 6,842 | 6,735 | 6,723 | 6,831 | |||||||||||||||
| December 31, | ||||||||||||||||||||
| 2012 | 2011 | 2010 | 2009 | 2008 | ||||||||||||||||
| (In thousands) | ||||||||||||||||||||
| Balance Sheet Data: | ||||||||||||||||||||
| Working capital deficiency | $ | (11,483 | ) | $ | (2,262 | ) | $ | (8,809 | ) | $ | (4,432 | ) | $ | (10,650 | ) | |||||
| Total assets | 100,046 | 100,676 | 95,770 | 72,499 | 72,145 | |||||||||||||||
| Total debt and capital lease obligations, including current portion | 12,763 | 14,912 | 16,599 | 7,719 | 12,954 | |||||||||||||||
| Total shareholders’ equity | $ | 56,742 | $ | 55,554 | $ | 48,584 | $ | 44,171 | $ | 38,598 | ||||||||||
Item 7. Management’s Discussion and Analysis of Financial Condition and Results of Operations
Overview
The Company is a leading provider of analytics and insights that facilitate revenue growth, patient, employee and customer retention and patient engagement for healthcare providers, payers and other healthcare organizations. The Company’s solutions support the improvement of business and clinical outcomes, while facilitating regulatory compliance and the shift to population-based health management for its clients. The Company’s ability to systematically capture, analyze and deliver to its clients self-reported information from patients, families and consumers is critical in today’s healthcare market. NRC believes that access to and analysis of its extensive consumer-driven information will become even more valuable in the future as healthcare providers increasingly need to more deeply understand and engage patients and consumers in an effort towards effective population-based health management.
The Company’s portfolio of subscription-based solutions provide actionable information and analysis to healthcare organizations and payers across a range of mission-critical, constituent-related elements, including patient experience and satisfaction, community population health risks, workforce engagement, community perceptions, and physician engagement. NRC partners with clients across the continuum of healthcare services. The Company’s clients range from acute care hospitals and post-acute providers, such as home health, long-term care and hospice, to numerous payer organizations. The Company believes this cross-continuum positioning is a unique and an increasingly important capability as evolving payment models drive healthcare providers and payers towards a more collaborative and interactive healthcare system.
Critical Accounting Policies and Estimates
The preparation of financial statements requires management to make estimates and assumptions that affect amounts reported therein. The most significant of these areas involving difficult or complex judgments made by management with respect to the preparation of the Company’s consolidated financial statements for fiscal year 20122013 include:
● | Revenue recognition; |
● | Valuation of goodwill and identifiable intangible assets; and |
● | Income taxes. |
Revenue Recognition
The Company derives a majority of its operating revenue from its annually renewable services, which include performance measurement and improvement services, healthcare analytics and governance education services. The Company provides these services to its clients under annual client service contracts, although such contracts are generally cancelable on short or no notice without penalty. The Company also derives some revenue from its custom and other research projects.
Services are provided under subscription-based service agreements. The Company recognizes subscription-based service revenue over the period of time the service is provided. Generally, the subscription periods are for twelve months and revenue is recognized equally over the subscription period.
Certain contracts are fixed-fee arrangements with a portion of the project fee billed in advance and the remainder billed periodically over the duration of the project. Revenue and direct expenses for services provided under these contracts are recognized under the proportional performance method. Under the proportional performance method, the Company recognizes revenue based on output measures or key milestones such as survey set-up, survey mailings, survey returns and reporting. The Company measures its progress based on the level of completion of these output measures and recognizes revenue accordingly. Management judgments and estimates must be made and used in connection with revenue recognized using the proportional performance method. If management made different judgments and estimates, then the amount and timing of revenue for any period could differ materially from the reported revenue.
The Company also derives revenue from hosting arrangements where our propriety software is offered as a service to our customers through our data processing facilities. The Company’s revenue also includes software-related revenue for software license revenue, installation services, post-contract support (maintenance) and training. Software-related revenue is recognized in accordance with the provisions of Accounting Standards Codification (“ASC”) 985-605, Software-Revenue Recognition.
Hosting arrangements to provide customers with access to the Company’s propriety software are marketed under long-term arrangements generally over periods of one to three years. Under these arrangements, the customer is not provided the contractual right to take possession of the licensed software at any time during the hosting period without significant penalty, and the customer is not provided the right to run the software on their own hardware or contract with another party unrelated to us to host the software. Upfront fees for set-upsetup services are typically billed for our hosting arrangements. However,arrangements, however, these arrangements do not qualify for separation from the ongoing hosting services due to the absence of standalone value for the set-up services. Therefore, we account for these arrangements as service contracts and recognize revenue ratably over the hosting service period when all other conditions to revenue are met. Other conditions that must be met before the commencement of revenue recognition include achieving evidence of an arrangement, determining that the collection of the revenue is probable, and determining that fees are fixed and determinable.
The Company’s software arrangements typically involve the sale of a time-based license bundled with installation services, post-contract support (“PCS”) and training. License terms range from one year to three years, and require an annual fee for bundled elements of the arrangement. PCS is also contractually provided for a period that is co-terminus with the term of the time-based license. The Company’s installation services are not considered to be essential to the functionality of the software license. The Company does not achieve vendor-specific objective evidence (“VSOE”) of the fair value of the undelivered elements of its software arrangements (primarily PCS) and, therefore, these arrangements are accounted for as a single unit of accounting with revenue recognized ratably over the minimum bundled PCS period.
The Company’s revenue arrangements (not involving software elements) with a client may include multiple elements. In assessingcombinations of performance measurement and improvement services, healthcare analytics or governance education services which may be executed at the separationsame time, or within close proximity of revenueone another (referred to as a multiple-element arrangement). Each element of a multiple-element arrangement is accounted for elementsas a separate unit of such arrangements, we first determine whetheraccounting provided each delivered element has standalone value based on whether weis sold separately by the Company or other vendors sellanother vendor; and for an arrangement that includes a general right of return relative to the services separately. We also consider whether there is sufficient evidenceundelivered elements, delivery or performance of the fair valueundelivered services are considered probable and substantially in the control of the elements in allocatingCompany. The Company’s arrangements generally do not include a general right of return related to the fees indelivered services. If these criteria are not met, the arrangement is accounted for as a single unit of accounting with revenue generally recognized equally over the subscription period or recognized under the proportional performance method.
Revenue is allocated to each element. Revenue allocated to an element is limited to revenue that is not subject to refund or otherwise represents contingent revenue.
Valuation of Goodwill and Identifiable Intangible Assets
Intangible assets include customer relationships, trade names, non-compete agreements and goodwill. Intangible assets with estimable useful lives are amortized over their respective estimated useful lives to their estimated residual values and reviewed for impairment whenever events or changes in circumstances indicate that the carrying amount of the assets may not be recoverable. The Company reviews intangible assets with indefinite lives for impairment annually as of October 1 and whenever events or changes in circumstances indicate that the carrying value of an asset may not be recoverable.
When performing the impairment assessment, the Company first assesses qualitative factors to determine whether it is necessary to recalculate the fair value of our intangible assets with indefinite lives. If the Company believes, as a result of the qualitative assessment, that it is more likely than not that the fair value of the indefinite-lived intangibles is less than their carrying amount, the Company calculates the fair value using a market approach. If the carrying value of an intangible asset with an indefinite life exceeds its fair value, then the intangible asset is written-down to their fair values. The Company did not recognize any impairmentsimpairment related to our long-livedindefinite-lived intangible assets during 2013, 2012, 2011, or 2010.
Goodwill is an asset representing the future economic benefits arising from other assets acquired in a business combination that are not individually identified and separately recognized. All of the Company’s goodwill is allocated to its reporting units, which are the same as its operating segments. Goodwill is reviewed for impairment at least annually as of October 1 and whenever events or changes in circumstances indicate that the carrying value of goodwill may not be recoverable.
The Company reviews for goodwill impairment by first assessing qualitative factors to determine whether any impairment may exist. If we believe, as a result of the qualitative assessment that it is more likely than not that the fair value of a reporting unit is less than its carrying amount, a quantitative two-step test is required; otherwise, no further testing is required. Under the first step of the quantitative test, the fair value of the reporting unit is compared with its carrying value (including goodwill). If the fair value of the reporting unit exceeds its carrying value, step two doesis not need to be performed. If the fair value of the reporting unit is less than its carrying value, an indication of goodwill impairment exists for the reporting unit and the entity must performCompany performs step two of the impairment test (measurement). Under step two, an impairment loss is recognized for any excess of the carrying amount of the reporting unit’s goodwill over the fair value of that goodwill. The fair value of goodwill is determined by allocating the fair value of the reporting unit in a manner similar to a purchase price allocation and the residual fair value after this allocation is the fair value of the reporting unit goodwill.
In instances when a step two is required, the fair value of the reporting unit is determined using an income approach and comparable market multiples. Under the income approach, there are a number of inputs used to calculate the fair value using a discounted cash flow model, including operating results, business plans, projected cash flows and a discount rate. Discount rates, growth rates and cash flow projections are the most sensitive and susceptible to change as they require significant management judgment. Discount rates are determined by using a weighted average cost of capital, which considers market and industry data. Operational managementManagement develops growth rates and cash flow projections for each reporting unit considering industry and Company-specific historical and projected information. Terminal value rate determination follows common methodology of capturing the present value of perpetual cash flow estimates beyond the last projected period assuming a constant weighted average cost of capital and low long-term growth rates. Under the market approach, the Company considers its market capitalization, comparisons to other public companies’ data, and recent transactions of similar businesses within the Company’s industry.
The Company performed a qualitative analysis as of October 1, 2012,2013, which did not indicate that it was more likely than not that the carrying values of the reporting units exceeded fair value.
Income Taxes
The Company uses the asset and liability method of accounting for income taxes. Under that method, deferred income tax assets and liabilities are recognized for the future tax consequences attributable to differences between the financial statement carrying amounts of existing assets and liabilities and their respective tax bases using enacted tax rates. The effect on deferred tax assets and liabilities of a change in tax rates is recognized in income in the period that includes the enactment date. Valuation allowances, if any, are established when necessary to reduce deferred tax assets to the amount that is more likely than not to be realized. The Company recognizes the effect of income tax positions only if those positions are more likely than not of being sustained. Recognized income tax positions are measured at the largest amount that is greater than 50% likely of being realized. Changes in recognition or measurement are reflected in the period in which the change in judgment occurs. Management judgment is required to determine the provision for income taxes and to determine whether deferred income taxes will be realized in full or in part. Such judgments include, but are not limited to, the likelihood we would realize the benefits of net operating loss carryforwards, the adequacy of valuation allowances, the election to capitalize or expense costs incurred, and the probability of outcomes of uncertain tax positions. It is possible that the various taxing authorities could challenge those judgments or positions and reach conclusions that would cause us to incur tax liabilities in excess of, or realize benefits less than, those currently recorded. In addition, changes in the geographical mix or estimated amount of annual pretax income could impact our overall effective tax rate.
Results of Operations
The following table sets forth, for the periods indicated, selected financial information derived from the Company’s consolidated financial statements, expressed as a percentage of total revenue and the percentage change in such items versus the prior comparable period (please note that all columns may not add up to 100% due to rounding). The trends illustrated in the following table may not necessarily be indicative of future results. The discussion that follows the table should be read in conjunction with the Company’s consolidated financial statements.
Percentage of Total Revenue | Percentage Increase (Decrease) | |||||||||||||||||||
2013 | 2012 | 2011 | 2013 over 2012 | 2012 over 2011 | ||||||||||||||||
Revenue | 100.0 | % | 100.0 | % | 100.0 | % | 7.1 | % | 14.1 | % | ||||||||||
Operating expenses: | ||||||||||||||||||||
Direct | 42.0 | 41.0 | 37.8 | 9.5 | 23.7 | |||||||||||||||
Selling, general and administrative | 27.2 | 27.2 | 30.8 | 7.1 | 1.0 | |||||||||||||||
Depreciation and amortization | 4.0 | 5.4 | 6.7 | (20.6 | ) | (7.2 | ) | |||||||||||||
Total operating expenses | 73.2 | 73.7 | 75.3 | 6.4 | 11.7 | |||||||||||||||
Operating income | 26.8 | % | 26.3 | % | 24.7 | % | 9.2 | % | 21.3 | % | ||||||||||
Year Ended December 31, 2013, Compared to Year Ended December 31, 2012
Revenue. Revenue increased 7.1% in 2013 to $92.6 million from $86.4 million in 2012 which was driven by a combination of continued gains in market share and vertical growth in our existing client base. Revenue from subscription-based agreements comprised 81.9% of the total revenue for the year ended December 31, 2013 compared to 76.0% of the total revenue for the year ended December 31, 2012.
Direct expenses. Direct expenses increased 9.5% to $38.8 million in 2013 from $35.5 million in 2012. Direct variable expenses are costs that vary with volumes and consist mainly of printing, postage, hourly labor, and contracted survey work. Direct fixed expenses consist mainly of salaries and benefits, and contracted services for client service, analytical, research, and information technology development functions. The increase included postage and contracted survey-related costs to service the higher volume of business, and an increase in fixed expenses of $1.8 million from additional investments in technology, research and service resources. Direct expenses increased as a percentage of revenue to 42.0% in the year ended December 31, 2013, from 41.0% during the same period of 2012. Variable expenses as percentage of revenue were 0.2% of the change due to higher survey volumes for the subscription-based products, and fixed expenses were 0.8% of the change due to investments in technology, research and service resources. The Company expects this percentage to continue at a similar rate for 2014.
Selling, general and administrative expenses.Selling, general and administrative expenses increased 7.1% to $25.2 million in 2013 from $23.5 million in 2012 mainly due to additional expense in share based compensation, increases in annual software license fees and costs from the May 2013 Recapitalization, which were partially offset by decreased incentive payments and marketing costs. Selling, general, and administrative expenses remained constant as a percentage of revenue at 27.2% for each of the years ended December 31, 2013 and 2012 due to the leveraging of selling, general and administrative expenses against increased revenue. This percentage is projected to be approximately 26% of revenue in 2014.
Depreciation and amortization. Depreciation and amortization expenses decreased 20.6% to $3.7 million in 2013 from $4.7 million in 2012. This decrease was a result of a large software development project becoming fully depreciated and intangibles associated with an acquisition becoming fully amortized. Depreciation and amortization expenses as a percentage of revenue decreased to 4.0% in 2013 from 5.4% in 2012. The Company expects this percentage to continue at a similar rate for 2014.
Provision for income taxes. The provision for income taxes totaled $9.0 million (36.8% effective tax rate) for 2013, compared to $7.1 million (32.1% effective tax rate) for 2012. The effective tax rate for the year ended December 31, 2013, is higher than the rate in the same period of 2012 primarily due to an adjustment to income taxes of $575,000 for decreases in deferred state tax rates resulting from legislative changes in 2012 and nondeductible fees associated with the May 2013 Recapitalization that are part of the annualized effective rate.
Percentage of Total Revenue Year Ended December 31, | Percentage Increase (Decrease) | |||||||||||||||||||
| 2012 | 2011 | 2010 | 2012 over 2011 | 2011 over 2010 | ||||||||||||||||
| Revenue | 100.0 | % | 100.0 | % | 100.0 | % | 14.1 | % | 19.5 | % | ||||||||||
| Operating expenses: | ||||||||||||||||||||
| Direct | 41.0 | 37.8 | 38.8 | 23.7 | 16.4 | |||||||||||||||
| Selling, general and administrative | 27.2 | 30.8 | 31.9 | 1.0 | 15.3 | |||||||||||||||
| Depreciation and amortization | 5.4 | 6.7 | 7.4 | (7.2 | ) | 7.7 | ||||||||||||||
| Total operating expenses | 73.7 | 75.3 | 78.1 | 11.7 | 15.1 | |||||||||||||||
| Operating income | 26.3 | % | 24.7 | % | 21.9 | % | 21.3 | % | 35.2 | % | ||||||||||
Year Ended December 31, 2012, Compared to Year Ended December 31, 2011
Revenue. Revenue increased 14.1% in 2012 to $86.4 million from $75.8 million in 2011. The increase was due to market share growth and vertical growth in the existing client base. Revenue from subscription-based agreements comprised 76.0% of the total revenue for the year ended December 31, 2012 compared to 63.0% of the total revenue for the year ended December 31, 2011.
Direct expenses. Direct expenses increased 23.7% to $35.5 million in 2012 from $28.7 million in 2011. Direct variable expenses are costs that vary with volumes and consist mainly of printing, postage, hourly labor, and contracted survey work. Direct fixed expenses consist mainly of salaries and benefits, and contracted services for client service, analytical, research, and information technology development functions. The increase in variable expenses of $4.1 million included increased postage, labor costs, contracted survey-related costs to service the higher volume of business and conference-related expenses. The increase in fixed expenses of $2.7 million was due to additional staffing and related expenses in information technology development and client service functions. Direct expenses increased as a percentage of revenue to 41.0% in the year ended December 31, 2012, from 37.8% during the same period of 2011. Variable expenses as percentage of revenue were 2.2% of the change due to higher survey volumes for the subscription-based products, and fixed expenses were 1.0% of the change due to investments in technology, research and service resources. The Company expects this percentage to continue at a similar rate for 2013.
Selling, general and administrative expenses. Selling,.Selling, general and administrative expenses increased 1.0% to $23.5 million in 2012 from $23.3 million in 2011. Selling, general, and administrative expenses decreased as a percentage of revenue to 27.2% for the year ended December 31, 2012, from 30.8% for the same period in 2011 due to the leveraging of selling, general and administrative expenses against increased revenue. This percentage is projected to continue at a similar rate in 2013.
Depreciation and amortization. Depreciation and amortization expenses decreased 7.2% to $4.7 million in 2012 from $5.1 million in 2011. ThisThis decrease was attributed to declining intangible asset amortization expenses. Depreciation and amortization expenses as a percentage of revenue decreased to 5.4% in 2012 from 6.7% in 2011. The Company projects depreciation expense in 2013 to approximate 4.0% of revenue.
Provision for income taxes. The provision for income taxes totaled $7.1 million (32.1% effective tax rate) for 2012, compared to $6.6 million (36.3% effective tax rate) for 2011. The effective tax rate for the year ended December 31, 2012, is lower than the rate in the same period of 2011 primarily due to an adjustment to income taxes of $661,000 for decreases in deferred state tax rates resulting from legislative changes. The Company also recorded federal tax credits of $198,000, and recognized an additional $73,000 in tax benefits over the same period in 2011 due to the expiration of the U.S. federal statute of limitations associated with certain tax positions.
Revenue. Revenue increased 19.5% in 2011 to $75.8 million from $63.4 million in 2010. This increase was due to the addition of OCS (increasing revenue by $4.5 million), market share growth, increased pricing from enhanced offerings, and vertical growth in the existing client base from successful cross-selling activities.
Inflation and changing prices have not had a material impact on revenue or net income in the last three years.
Liquidity and Capital Resources
The Company believes that its existing sources of liquidity, including cash and cash equivalents, borrowing availability, and operating cash flow will be sufficient to meet its projected needs for the foreseeable future.
The Company will make capital contributions up to $2.5 million on an as-needed basis as determined by the Board of Directors of Connect. Additionally, the Company has a future obligation to purchase the other equity units in Connect when certain targeted events have been achieved. If, at any time, Connect has at least $12.5 million of annual recurring contract value, including the NRC contracts being serviced, and the members have approved a financial statement showing a pro forma minimum 35% EBITDA margin for revenue on a going-forward basis, then within 90 days thereafter NRC is required to purchase from the other members, and the other members shall be required to sell to NRC, all of their equity units not owned by NRC. As of December 31, 2012,2013, the price at which the other members had the obligation to sell their equity units to NRC was $0.
As of December 31, 2013, our principal sources of liquidity included $8.3$22.1 million of cash and cash equivalents and up to $6.5 million of unused borrowings under our revolving credit note. Of this cash, $5.6$7.5 million was held in Canada. All of the amounts held in Canada are intended to be indefinitely reinvested in foreign operations. The amounts held outside of the U.S. are eligible for repatriation, but under current law, would be subject to U.S. federal income taxes less applicable foreign tax credits. The Company estimated at December 31, 2012,2013, that an additional tax liability of $732,000$705,000 would become due if repatriation of undistributed earnings would occur. The amount of unused borrowings actually available under the revolving credit note varies in accordance with the terms of the agreement. The Company believes that our existing sources of liquidity, including cash and cash equivalents, borrowing availability, and operating cash flow will be sufficient to meet its projected capital and debt maturity needs and dividend policy for the foreseeable future.
Working Capital
The Company had a working capital deficiencysurplus of $11.5$12.8 million on December 31, 2012,2013, compared to a $2.3$11.5 million working capital deficiency on December 31, 2011.2012. The change in the working capital balance was primarily due to an increase in the current portionrefinancing of notes payable of $10.6 million. The increase in the current portion of notes payable is due to the balloon payments on theCompany’s term notes due in JulyMay 2013, which now have the final term note payments in April 2018. Additionally, the Company has not declared cash dividends since March 2013, and has temporarily suspended dividend payments in order maximize cash for possible investment opportunities. One such investment was made in Connect in June 2013. The Company’s working capital is also significantly impacted by its large deferred revenue balances. The deferred revenue balances as of December 31, 20122013 and December 31, 2011,2012, were $13.9 million and $15.8 million, and $16.5 million, respectively.
The deferred revenue balance is primarily due to timing of initial billings on new and renewal contracts. The Company typically invoices clients for performance tracking services and custom research projects before they have been completed. Billed amounts are recorded as billings in excess of revenue earned, or deferred revenue, on the Company’s consolidated financial statements, and are recognized as income when earned. In addition, when work is performed in advance of billing, the Company records this work as revenue earned in excess of billings, or unbilled revenue. Substantially all deferred revenue and all unbilled revenue will be earned and billed respectively, within 12 months of the respective period ends.
Cash Flow Analysis
A summary of operating, investing, and financing activities are shown in the following table:
For the Year Ended December 31, | ||||||||||||
2013 | 2012 | 2011 | ||||||||||
(In thousands) | ||||||||||||
Provided by operating activities | $ | 19,315 | $ | 19,132 | $ | 18,481 | ||||||
Used in investing activities | (2,188 | ) | (2,348 | ) | (6,927 | ) | ||||||
Used in financing activities | (2,824 | ) | (16,687 | ) | (6,886 | ) | ||||||
Effect of exchange rate changes on cash | (497 | ) | 107 | (105 | ) | |||||||
Net increase in cash and cash equivalents | 13,806 | 204 | 4,563 | |||||||||
Cash and cash equivalents at end of period | $ | 22,092 | $ | 8,286 | $ | 8,082 | ||||||
| For the Year Ended December 31, | ||||||||||||
| 2012 | 2011 | 2010 | ||||||||||
| (In thousands) | ||||||||||||
| Provided by operating activities | $ | 19,132 | $ | 18,481 | $ | 14,603 | ||||||
| Used in investing activities | (2,348 | ) | (6,927 | ) | (16,980 | ) | ||||||
| (Used in) provided by financing activities | (16,687 | ) | (6,886 | ) | 3,254 | |||||||
| Effect of exchange rate changes on cash | 107 | (105 | ) | 130 | ||||||||
| Net increase in cash and cash equivalents | 204 | 4,563 | 1,007 | |||||||||
| Cash and cash equivalents at end of period | $ | 8,286 | $ | 8,082 | $ | 3,519 | ||||||
Cash Flows from Operating Activities
Cash flows from operating activities consist of net income adjusted for non-cash items including depreciation and amortization, deferred taxes, and the effect of working capital changes.
Net cash provided by operating activities was $19.3 million for the year ended December 31, 2013, which included net income of $15.5 million, plus non-cash charges (benefits) for deferred tax expense, depreciation and amortization, tax benefit from exercise of stock options, and non-cash stock compensation totaling $4.8 million. Changes in working capital decreased 2013 cash flows from operating activities by $1.0 million, primarily due to timing of billings on new or renewal contracts decreasing cash flows provided from deferred revenue and unbilled revenue offset by increases in trade accounts receivable. The cash flows decrease was partially offset by timing of payments on accounts payable and accrued expenses, wages, bonus and profit sharing.
Net cash provided by operating activities was $19.1 million for the year ended December 31, 2012, which included net income of $15.1 million, plus non-cash charges (benefits) for deferred tax expense, depreciation and amortization, tax benefit from exercise of stock options, and non-cash stock compensation totaling $5.3 million. Changes in working capital decreased 2012 cash flows from operating activities by $1.2 million, primarily due to timing of initial billings on new or renewal contracts decreasing cash flows provided from trade accounts receivable and deferred revenue and timing of payments on accounts payable and prepaid expenses, partially offset by increases and timing in payments of accrued expenses, wages, and bonus and profit sharing.
Net cash provided by operating activities was $18.5 million for the year ended December 31, 2011, which included net income of $11.6 million, plus non-cash charges (benefits) for deferred tax expense, depreciation and amortization, tax benefit from exercise of stock options and non-cash stock compensation totaling $7.2 million. Changes in working capital decreased 2011 cash flows from operating activities by $273,000, primarily due to timing of initial billings on new or renewal contracts decreasing cash flows provided from trade accounts receivable and deferred revenue, partially offset by timing of payments on accrued expenses and income taxes.
Cash Flows from Investing Activities
Net cash provided by operatingof $2.2 million was used for investing activities was $14.6 million forin the year ended December 31, 2010, which included net income2013. Purchases of $8.5 million, plus non cash charges (benefits) for deferred tax expense, depreciationproperty and amortization and non-cash stock compensation totaling $6.1equipment totaled the $2.2 million.
Net cash of $2.3 million was used for investing activities in the year ended December 31, 2012. Purchases of property and equipment totaled the $2.3 million.
Net cash of $6.9 million was used for investing activities in the year ended December 31, 2011. Earn-out payments related to the MIV acquisition approximated $4.1 million, and purchases of property and equipment totaled $2.8 million.
Cash Flows from Financing Activities
Net cash of $17.0used in financing activities was $2.8 million was used for investing activities in the year ended December 31, 2010.2013. Proceeds from the exercise of stock options and the excess tax benefit of share-based compensation provided cash of $840,000 and $755,000, respectively, partially offset by repurchases of shares for payroll tax withholdings related to share-based compensation of $55,000. Cash of $15.3 million was used for the acquisitionto pay dividends of OCS and $172,000$2.1 million. Cash was paidalso used to repay borrowings under the earn-out related to the MIV acquisition. Cashterm note totaling $2.1 million and capital lease obligations of $1.5 million was used for the purchase of property and equipment.
Net cash used in financing activities was $16.7 million in the year ended December 31, 2012. Proceeds from the exercise of stock options and the excess tax benefit of share-based compensation provided cash of $1.3 million and $2.1 million, respectively, partially offset by repurchases of shares for payroll tax withholdings related to share-based compensation of $527,000. Cash was used to pay dividends of $17.4 million, including a special dividend of $10.3 million in the fourth quarter of 2012. Cash was also used to repay borrowings under the term note totaling $2.1 million and capital lease obligations of $109,000.
Net cash used in financing activities was $6.9 million in the year ended December 31, 2011. Cash was generated from borrowings under the Company’s term note and revolving credit note totaling $4.5 million. Proceeds from the exercise of stock options and the excess tax benefit of share-based compensation provided cash of $568,000 and $407,000, respectively, partially offset by repurchases of shares for payroll tax withholdings related to share-based compensation of $146,000. Cash was used to pay dividends of $5.9 million, repay borrowings under the term note and revolving credit note totaling $6.2 million, and repay capital lease obligations of $130,000.
The effect of changes in foreign exchange rates increased (decreased) cash and cash equivalents by ($497,000), $107,000, and ($105,000), and $130,000 in the years ended December 31, 2013, 2012, and 2011, and 2010, respectively.
Capital Expenditures
Capital expenditures for the year ended December 31, 2012,2013, were $2.3$2.2 million. These expenditures consisted mainly of computer software, computer hardware, furniture and other equipment. The Company expects similar capital expenditure purchases in 20132014 consisting primarily of computer software and hardware and other equipment, to be funded through cash generated from operations.
Debt and Equity
The Company borrowed $9.0 million under ahad two term notenotes, which were used to partially finance acquisitions in 2008 and 2010. Borrowings under the acquisitionterm notes bore interest at an annual rate of MIV. In July 2010, the3.79%. The Company refinanced the existingthese two term loan with a $6.9 million fixed-ratenotes on May 9, 2013, and combined them into one new term loan.note. The new term loannote is payable in 3560 monthly installments of $80,104, with a balloon payment for the remaining principal balance and interest due on July 31, 2013.$212,468. Borrowings under the new term note bear interest at an annual rate of 3.79%3.12%. The outstanding balance of the new term note at December 31, 2012,2013, was $5.1$10.3 million.
The Company expects to refinance the term notes prior to July 31, 2013. If, however, the notes cannot be extended, the Company believes italso has adequate cash flows from operations to meet its debt and capital needs.
The term notesnote and revolving line of credit note are secured by certain of the Company’s assets, including the Company’s land, building, accounts receivable and intangible assets. The term notesnote and the revolving credit note contain various restrictions and covenants applicable to the Company, including requirements that the Company maintain certain financial ratios at prescribed levels and restrictions on the ability of the Company to consolidate or merge, create liens, incur additional indebtedness or dispose of assets. As of December 31, 2012,2013, the Company was in compliance with these restrictions and covenants.
The maximum aggregate amount available under the revolving credit note of $6.5 million is subject to a borrowing base equal to 75.0%Company has capital leases for computer equipment, office equipment, and inserting equipment. The balance of the Company’s eligible accounts receivable. Borrowings under the renewed revolving credit note bear interest at a variable annual rate, with three rate options at the discretion of management as follows: (1) 2.5% plus the daily reset one-month London Interbank Offered Rate (“LIBOR”) rate, or (2) 2.2% plus the one-, two-, three-, six- or twelve-month LIBOR rate, or (3) the bank’s Money Market Loan Rate. The rate at December 31, 2012, was 2.71%. As of December 31, 2012, the revolving credit note did not have a balance. According to borrowing base requirements, the Company had the capacity to borrow $6.5 millioncapital leases as of December 31, 2012.
Contractual Obligations
The Company had contractual obligations to make payments in the following amounts in the future as of December 31, 2012:
Contractual Obligations(1) | Total Payments | Less than One Year | One to Three Years | Three to Five Years | After Five Years | |||||||||||||||
| (In thousands) | ||||||||||||||||||||
| Operating leases | $ | 2,554 | $ | 687 | $ | 1,176 | $ | 573 | $ | 118 | ||||||||||
| Capital leases | 380 | 135 | 237 | 8 | -- | |||||||||||||||
Uncertain tax positions(2) | 224 | -- | -- | -- | -- | |||||||||||||||
| Long-term debt | 12,703 | 12,703 | -- | -- | -- | |||||||||||||||
| Total | $ | 15,861 | $ | 13,525 | $ | 1,413 | $ | 581 | $ | 118 | ||||||||||
Contractual Obligations(1) | Total Payments | Less than One Year | One to Three Years | Three to Five Years | After Five Years | |||||||||||||||
(In thousands) | ||||||||||||||||||||
Operating leases | $ | 2,582 | $ | 782 | $ | 1,260 | $ | 526 | $ | 14 | ||||||||||
Capital leases | 250 | 137 | 113 | -- | -- | |||||||||||||||
Uncertain tax positions(2) | -- | -- | -- | -- | -- | |||||||||||||||
Long-term debt | 11,017 | 2,505 | 7,649 | 863 | -- | |||||||||||||||
Total | $ | 13,849 | $ | 3,424 | $ | 9,022 | $ | 1,389 | $ | 14 | ||||||||||
(1)Amounts are inclusive of interest payments, where applicable.
(2)We have $193,000 in liabilities associated with uncertain tax positions. We are unable to reasonably estimate the expected cash settlement dates of these uncertain tax positions with the taxing authorities.
The Company generally does not make unconditional, non-cancelable purchase commitments. The Company enters into purchase orders in the normal course of business, but these purchase obligations do not exceed one year.
Shareholders’ equity increased $1.2$15.0 million to $71.8 million in 2013, from $56.7 million in 2012, from $55.6 million in 2011.2012. The increase was primarily due to net income of $15.1$15.5 million, and $8.2$1.7 million of related share-based compensation, and $1.0 million from the exercise of options partially offset by dividends paid of $17.4 million and stock re-purchases of $5.2$2.1 million. Dividends paid in 2012 include $10.3 million for a special dividend paid in the fourth quarter of 2012.
Stock Repurchase Program
In February 2006, the Board of Directors of the Company authorized the repurchase of 750,0002,250,000 shares of class A common stock and 375,000 shares of class B common stock (on a post-May 2013 Recapitalization basis) in the open market or in privately negotiated transactions. As of December 31, 2012,2013, the remaining number of shares that could be purchased under this authorization was 143,398.
Off-Balance Sheet Obligations
The Company has no significant off-balance sheet obligations other than the operating lease commitments disclosed in “Liquidity and Capital Resources.”
Recent Accounting Pronouncements
There have been no new accounting pronouncements not yet effective or adopted that have significance or potential significance to the consolidated financial statements at December 31, 2013.
Item 7A. Quantitative and Qualitative Disclosure About Market Risk
The Company’s primary market risk exposure is changes in foreign currency exchange rates and interest rates.
The Company’s Canadian subsidiary uses as its functional currency the local currency of the country in which it operates. It translates its assets and liabilities into U.S. dollars at the exchange rate in effect at the balance sheet date. It translates its revenue and expenses at the average exchange rate during the period. The Company includes translation gains and losses in accumulated other comprehensive income (loss), a component of shareholders’ equity. Foreign currency translation gains (losses) were ($822,000), $217,000, and ($201,000), in 2013, 2012, and $339,000 in 2012, 2011, and 2010, respectively. Gains and losses related to transactions denominated in a currency other than the functional currency of the countries in which the Company operates and short-term intercompany accounts are included in other income (expense) in the consolidated statements of income.
We are exposed to interest rate risk with both our fixed-rate term debt and variable rate revolving line of credit facility. Interest rate changes for borrowings under our fixed-rate term debt would impact the fair value of such debt, but do not impact earnings or cash flow. At December 31, 2012,2013, our fixed-rate term debt totaled $12.4$10.3 million. Based on a sensitivity analysis, a one percent change in market interest rates as of December 31, 2012,2013, would not have a material effect on the estimated fair value of our fixed-rate debt outstanding at December 31, 2012.
Borrowings under our revolving line of credit note bear interest at a variable annual rate, with three rate options at the discretion of management. Borrowings under the revolving line of credit note may not exceed the lesser of a calculated borrowing base or $6.5 million. There were no borrowings outstanding under our revolving credit facilitynote at December 31, 2012,2013, or at any time during 2012.2013. A sensitivity analysis assuming a hypothetical 100 basis point movement in interest rates applied to the average daily borrowings and the maximum borrowings available under the revolving line of credit facilitynote indicated that such a movement would not have a material impact on our consolidated financial position, results of operations or cash flows.
Item 8. Financial Statements and Supplementary Data
Quarterly Financial Data (Unaudited)
The following table sets forth selected financial information for each of the eight quarters in the two-year period ended December 31, 2012.2013. This unaudited information has been prepared by the Company on the same basis as the consolidated financial statements and includes all normal recurring adjustments necessary to present fairly this information when read in conjunction with the Company’s audited consolidated financial statements and the notes thereto.
(In thousands, except per share data) (1) | ||||||||||||||||||||||||||||||||
Quarter Ended | ||||||||||||||||||||||||||||||||
Dec. 31, 2013 | Sept 30, 2013 | June 30, 2013 | Mar. 31, 2013 | Dec. 31, 2012 | Sept 30, 2012 | June 30, 2012 | Mar. 31, 2012 | |||||||||||||||||||||||||
Revenue | $ | 22,923 | $ | 22,407 | $ | 22,354 | $ | 24,906 | $ | 21,996 | $ | 21,386 | $ | 20,632 | $ | 22,407 | ||||||||||||||||
Direct expenses | 9,648 | 9,452 | 9,498 | 10,246 | 9,128 | 8,769 | 8,633 | 8,931 | ||||||||||||||||||||||||
Selling, general and administrative expenses | 6,305 | 6,019 | 6,391 | 6,493 | 6,001 | 5,821 | 5,569 | 6,151 | ||||||||||||||||||||||||
Depreciation and amortization | 944 | 907 | 931 | 950 | 1,093 | 1,149 | 1,214 | 1,243 | ||||||||||||||||||||||||
Operating income | 6,026 | 6,029 | 5,534 | 7,217 | 5,774 | 5,647 | 5,216 | 6,082 | ||||||||||||||||||||||||
Other expense | (82 | ) | (81 | ) | (71 | ) | (84 | ) | (100 | ) | (155 | ) | (105 | ) | (152 | ) | ||||||||||||||||
Provision for income taxes | 2,177 | 2,135 | 2,029 | 2,663 | 1,971 | 1,915 | 1,172 | 2,081 | ||||||||||||||||||||||||
Net income | $ | 3,767 | $ | 3,813 | $ | 3,434 | $ | 4,470 | $ | 3,703 | $ | 3,577 | $ | 3,939 | $ | 3,849 | ||||||||||||||||
Earnings per share of common stock: | ||||||||||||||||||||||||||||||||
Basic earnings per share | ||||||||||||||||||||||||||||||||
Class A | $ | 0.09 | $ | 0.09 | $ | 0.08 | $ | 0.11 | $ | 0.09 | $ | 0.09 | $ | 0.10 | $ | 0.10 | ||||||||||||||||
Class B | $ | 0.55 | $ | 0.55 | $ | 0.50 | $ | 0.65 | $ | 0.54 | $ | 0.53 | $ | 0.58 | $ | 0.57 | ||||||||||||||||
Dilutive earnings per share | ||||||||||||||||||||||||||||||||
Class A | $ | 0.09 | $ | 0.09 | $ | 0.08 | $ | 0.11 | $ | 0.09 | $ | 0.09 | $ | 0.09 | $ | 0.09 | ||||||||||||||||
Class B | $ | 0.54 | $ | 0.54 | $ | 0.49 | $ | 0.64 | $ | 0.53 | $ | 0.51 | $ | 0.57 | $ | 0.56 | ||||||||||||||||
Weighted average shares outstanding – basic | ||||||||||||||||||||||||||||||||
Class A | 20,692 | 20,672 | 20,672 | 20,669 | 20,513 | 20,373 | 20,254 | 20,157 | ||||||||||||||||||||||||
Class B | 3,452 | 3,445 | 3,445 | 3,445 | 3,419 | 3,395 | 3,376 | 3,360 | ||||||||||||||||||||||||
Weighted average sharesoutstanding - diluted | ||||||||||||||||||||||||||||||||
Class A | 21,137 | 21,111 | 21,085 | 21,063 | 20,959 | 20,883 | 20,829 | 20,721 | ||||||||||||||||||||||||
Class B | 3,514 | 3,514 | 3,516 | 3,511 | 3,493 | 3,480 | 3,471 | 3,454 | ||||||||||||||||||||||||
(1) | All share and per share data have been retroactively adjusted to give effect to the May 2013 Recapitalization as further described in Note 1 to the accompanying consolidated financial statements. |
| (In thousands, except per share data) | ||||||||||||||||||||||||||||||||
| Quarter Ended | ||||||||||||||||||||||||||||||||
Dec. 31, 2012 | Sept 30, 2012 | June 30, 2012 | Mar. 31, 2012 | Dec. 31, 2011 | Sept 30, 2011 | June 30, 2011 | Mar. 31, 2011 | |||||||||||||||||||||||||
| Revenue | $ | 21,996 | $ | 21,386 | $ | 20,632 | $ | 22,407 | $ | 19,111 | $ | 18,549 | $ | 18,316 | $ | 19,791 | ||||||||||||||||
| Direct expenses | 9,128 | 8,769 | 8,633 | 8,931 | 7,178 | 7,471 | 7,260 | 6,758 | ||||||||||||||||||||||||
| Selling, general and administrative expenses | 6,001 | 5,821 | 5,569 | 6,151 | 5,648 | 5,572 | 5,990 | 6,090 | ||||||||||||||||||||||||
| Depreciation and amortization | 1,093 | 1,149 | 1,214 | 1,243 | 1,275 | 1,312 | 1,235 | 1,243 | ||||||||||||||||||||||||
| Operating income | 5,774 | 5,647 | 5,216 | 6,082 | 5,010 | 4,194 | 3,831 | 5,700 | ||||||||||||||||||||||||
| Other expense | (100 | ) | (155 | ) | (105 | ) | (152 | ) | (158 | ) | (77 | ) | (144 | ) | (196 | ) | ||||||||||||||||
| Provision for income taxes | 1,971 | 1,915 | 1,172 | 2,081 | 1,720 | 1,470 | 1,358 | 2,048 | ||||||||||||||||||||||||
| Net income | $ | 3,703 | $ | 3,577 | $ | 3,939 | $ | 3,849 | $ | 3,132 | $ | 2,647 | $ | 2,329 | $ | 3,456 | ||||||||||||||||
| Net income per share – basic | $ | 0.54 | $ | 0.53 | $ | 0.58 | $ | 0.57 | $ | 0.47 | $ | 0.40 | $ | 0.35 | $ | 0.52 | ||||||||||||||||
| Net income per share – diluted | $ | 0.53 | $ | 0.51 | $ | 0.57 | $ | 0.56 | $ | 0.46 | $ | 0.39 | $ | 0.34 | $ | 0.51 | ||||||||||||||||
| Weighted average shares outstanding – basic | 6,838 | 6,791 | 6,751 | 6,719 | 6,691 | 6,679 | 6,665 | 6,654 | ||||||||||||||||||||||||
| Weighted average shares outstanding – diluted | 6,986 | 6,961 | 6,943 | 6,907 | 6,847 | 6,850 | 6,855 | 6,809 | ||||||||||||||||||||||||
Report of Independent Registered Public Accounting Firm
The Board of Directors and Shareholders
National Research Corporation:
We have audited the accompanying consolidated balance sheets of National Research Corporation and subsidiary (the Company) as of December 31, 20122013 and 2011,2012, and the related consolidated statements of income, comprehensive income, shareholders’ equity, and cash flows for each of the years in the three-year period ended December 31, 2012.2013. In connection with our audits of the consolidated financial statements, we also have audited the financial statement schedule listed in Item 15(2) of this Form 10-K. These consolidated financial statements and financial statement schedule are the responsibility of the Company’s management. Our responsibility is to express an opinion on these consolidated financial statements and financial statement schedule based on our audits.
We conducted our audits in accordance with the standards of the Public Company Accounting Oversight Board (United States). Those standards require that we plan and perform the audit to obtain reasonable assurance about whether the financial statements are free of material misstatement. An audit includes examining, on a test basis, evidence supporting the amounts and disclosures in the financial statements. An audit also includes assessing the accounting principles used and significant estimates made by management, as well as evaluating the overall financial statement presentation. We believe that our audits provide a reasonable basis for our opinion.
In our opinion, the consolidated financial statements referred to above present fairly, in all material respects, the financial position of National Research Corporation and subsidiary as of December 31, 20122013 and 2011,2012, and the results of their operations and their cash flows for each of the years in the three-year period ended December 31, 2012,2013, in conformity with U.S. generally accepted accounting principles. Also in our opinion, the related financial statement schedule, when considered in relation to the basic consolidated financial statements taken as a whole, present fairly, in all material respects, the information set forth therein.
We also have audited, in accordance with the standards of the Public Company Accounting Oversight Board (United States), the Company’s internal control over financial reporting as of December 31, 2012,2013, based on criteria established inInternal Control – Integrated Framework (1992) issued by the Committee of Sponsoring Organizations of the Treadway Commission (COSO), and our report dated March 1, 20134, 2014 expressed an unqualified opinion on the effectiveness of the Company’s internal control over financial reporting.
/s/ KPMG LLP
Lincoln, Nebraska
March 4, 2014
NATIONAL RESEARCH CORPORATION AND SUBSIDIARY
Consolidated Balance Sheets
(In thousands, except share amounts)
| Assets | 2012 | 2011 | ||||||
| Current assets: | ||||||||
| Cash and cash equivalents | $ | 8,286 | $ | 8,082 | ||||
| Trade accounts receivable, less allowance for doubtful accounts of $244 and $289, respectively | 12,119 | 11,187 | ||||||
| Unbilled revenue | 932 | 913 | ||||||
| Prepaid expenses | 1,269 | 768 | ||||||
| Income taxes receivable | 158 | - | ||||||
| Deferred income taxes | 547 | 789 | ||||||
| Other current assets | 504 | 398 | ||||||
| Total current assets | 23,815 | 22,137 | ||||||
| Net property and equipment | 12,493 | 13,613 | ||||||
| Intangible assets, net | 5,794 | 7,073 | ||||||
| Goodwill | 57,799 | 57,730 | ||||||
| Other | 145 | 123 | ||||||
| Total assets | $ | 100,046 | $ | 100,676 | ||||
| Liabilities and Shareholders’ Equity | ||||||||
| Current liabilities: | ||||||||
| Current portion of notes payable | $ | 12,436 | $ | 1,861 | ||||
| Accounts payable | 291 | 783 | ||||||
| Accrued wages, bonus and profit sharing | 4,392 | 3,591 | ||||||
| Accrued expenses | 2,265 | 1,418 | ||||||
| Income taxes payable | - | 145 | ||||||
| Current portion of capital lease obligations | 102 | 101 | ||||||
| Deferred revenue | 15,812 | 16,500 | ||||||
| Total current liabilities | 35,298 | 24,399 | ||||||
| Notes payable, net of current portion | - | 12,625 | ||||||
| Deferred income taxes | 7,527 | 7,588 | ||||||
| Deferred revenue | 254 | 185 | ||||||
| Capital lease obligations, net of current portion | 225 | 325 | ||||||
| Total liabilities | 43,304 | 45,122 | ||||||
| Shareholders’ equity: | ||||||||
| Common stock, $0.001 par value; authorized 20,000,000 shares, issued 8,376,592 in 2012 and 8,117,849 in 2011, outstanding 6,874,992 in 2012 and 6,724,280 in 2011 | 8 | 8 | ||||||
| Additional paid-in capital | 39,514 | 31,080 | ||||||
| Retained earnings | 44,700 | 46,995 | ||||||
| Accumulated other comprehensive income, foreign currency translation adjustment | 1,124 | 907 | ||||||
| Treasury stock, at cost; 1,501,600 shares in 2012 and 1,393,569 shares in 2011 | (28,604 | ) | (23,436 | ) | ||||
| Total shareholders’ equity | 56,742 | 55,554 | ||||||
| Total liabilities and shareholders’ equity | $ | 100,046 | $ | 100,676 | ||||
Assets | 2013 | 2012 | ||||||
Current assets: | ||||||||
Cash and cash equivalents | $ | 22,092 | $ | 8,286 | ||||
Trade accounts receivable, less allowance for doubtful accounts of $183 and $244, respectively | 11,043 | 12,119 | ||||||
Unbilled revenue | 1,282 | 932 | ||||||
Prepaid expenses | 1,310 | 1,269 | ||||||
Income taxes receivable | 265 | 158 | ||||||
Deferred income taxes | 53 | 547 | ||||||
Other current assets | 429 | 504 | ||||||
Total current assets | 36,474 | 23,815 | ||||||
Net property and equipment | 11,898 | 12,493 | ||||||
Intangible assets, net | 4,840 | 5,794 | ||||||
Goodwill | 57,593 | 57,799 | ||||||
Other | 191 | 145 | ||||||
Total assets | $ | 110,996 | $ | 100,046 | ||||
Liabilities and Shareholders’ Equity | ||||||||
Current liabilities: | ||||||||
Current portion of notes payable | $ | 2,256 | $ | 12,436 | ||||
Accounts payable | 654 | 291 | ||||||
Accrued wages, bonus and profit sharing | 4,319 | 4,392 | ||||||
Accrued expenses | 2,462 | 2,265 | ||||||
Current portion of capital lease obligations | 114 | 102 | ||||||
Deferred revenue | 13,885 | 15,812 | ||||||
Total current liabilities | 23,690 | 35,298 | ||||||
Notes payable, net of current portion | 8,068 | - | ||||||
Deferred income taxes | 7,132 | 7,527 | ||||||
Deferred revenue | 243 | 254 | ||||||
Capital lease obligations, net of current portion | 108 | 225 | ||||||
Total liabilities | 39,241 | 43,304 | ||||||
Shareholders’ equity: | ||||||||
Preferred stock, $0.01 par value, authorized 2,000,000 shares, none issued | -- | -- | ||||||
Class A Common stock, $0.001 par value; authorized 60,000,000 shares, issued 25,285,029 in 2013 and 25,129,776 in 2012, outstanding 20,768,784 in 2013 and 20,624,976 in 2012 | 25 | 25 | ||||||
Class B Common stock, $0.001 par value; authorized 80,000,000 shares, issued 4,220,117 in 2013 and 4,188,296 in 2012, outstanding 3,467,410 in 2013 and 3,437,496 in 2012 | 4 | 4 | ||||||
Additional paid-in capital | 42,192 | 39,493 | ||||||
Retained earnings | 58,042 | 44,700 | ||||||
Accumulated other comprehensive income, foreign currency translation adjustment | 302 | 1,124 | ||||||
Treasury stock, at cost; 4,516,245 Class A shares, 752,707 Class B shares in 2013 and 4,504,800 Class A shares, 750,800 Class B shares in 2012 | (28,810 | ) | (28,604 | ) | ||||
Total shareholders’ equity | 71,755 | 56,742 | ||||||
Total liabilities and shareholders’ equity | $ | 110,996 | $ | 100,046 | ||||
See accompanying notes to consolidated financial statements.
NATIONAL RESEARCH CORPORATION AND SUBSIDIARY
Consolidated Statements of Income
(In thousands, except for per share amountsamounts))
| 2012 | 2011 | 2010 | ||||||||||
| Revenue | $ | 86,421 | $ | 75,767 | $ | 63,398 | ||||||
| Operating expenses: | ||||||||||||
| Direct | 35,461 | 28,667 | 24,635 | |||||||||
| Selling, general and administrative | 23,542 | 23,300 | 20,202 | |||||||||
| Depreciation and amortization | 4,699 | 5,065 | 4,704 | |||||||||
| Total operating expenses | 63,702 | 57,032 | 49,541 | |||||||||
| Operating income | 22,719 | 18,735 | 13,857 | |||||||||
| Other income (expense): | ||||||||||||
| Interest income | 32 | 13 | 6 | |||||||||
| Interest expense | (541 | ) | (629 | ) | (491 | ) | ||||||
| Other, net | (3 | ) | 41 | (57 | ) | |||||||
| Total other expense | (512 | ) | (575 | ) | (542 | ) | ||||||
| Income before income taxes | 22,207 | 18,160 | 13,315 | |||||||||
| Provision for income taxes | 7,139 | 6,596 | 4,816 | |||||||||
| Net income | $ | 15,068 | $ | 11,564 | $ | 8,499 | ||||||
| Net income per share - basic | $ | 2.22 | $ | 1.73 | $ | 1.28 | ||||||
| Net income per share - diluted | $ | 2.17 | $ | 1.69 | $ | 1.26 | ||||||
| Weighted average shares and shares equivalent outstanding - basic | 6,775 | 6,672 | 6,637 | |||||||||
| Weighted average shares and shares equivalent outstanding - diluted | 6,951 | 6,842 | 6,736 | |||||||||
2013 | 2012 | 2011 | ||||||||||
Revenue | $ | 92,590 | $ | 86,421 | $ | 75,767 | ||||||
Operating expenses: | ||||||||||||
Direct | 38,844 | 35,461 | 28,667 | |||||||||
Selling, general and administrative | 25,208 | 23,542 | 23,300 | |||||||||
Depreciation and amortization | 3,732 | 4,699 | 5,065 | |||||||||
Total operating expenses | 67,784 | 63,702 | 57,032 | |||||||||
Operating income | 24,806 | 22,719 | 18,735 | |||||||||
Other income (expense): | ||||||||||||
Interest income | 63 | 32 | 13 | |||||||||
Interest expense | (397 | ) | (541 | ) | (629 | ) | ||||||
Other, net | 16 | (3 | ) | 41 | ||||||||
Total other expense | (318 | ) | (512 | ) | (575 | ) | ||||||
Income before income taxes | 24,488 | 22,207 | 18,160 | |||||||||
Provision for income taxes | 9,004 | 7,139 | 6,596 | |||||||||
Net income | $ | 15,484 | $ | 15,068 | $ | 11,564 | ||||||
Earnings per share of common stock: | ||||||||||||
| Basic earnings per share: | ||||||||||||
Class A | $ | 0.37 | $ | 0.37 | $ | 0.29 | ||||||
Class B | $ | 2.25 | $ | 2.22 | $ | 1.73 | ||||||
Diluted earnings per share: | ||||||||||||
| Class A | $ | 0.37 | $ | 0.36 | $ | 0.28 | ||||||
Class B | $ | 2.20 | $ | 2.17 | $ | 1.69 | ||||||
Weighted average shares and share equivalents outstanding | ||||||||||||
| Class A - basic | 20,677 | 20,325 | 20,016 | |||||||||
Class B - basic | 3,447 | 3,388 | 3,336 | |||||||||
Class A - diluted | 21,099 | 20,854 | 20,526 | |||||||||
Class B - diluted | 3,514 | 3,476 | 3,421 | |||||||||
See accompanying notes to consolidated financial statements.
NATIONAL RESEARCH CORPORATION AND SUBSIDIARY
Consolidated Statements of comprehensive income
(In thousandsthousands))
| 2012 | 2011 | 2010 | ||||||||||
| Net Income | $ | 15,068 | $ | 11,564 | $ | 8,499 | ||||||
| Other comprehensive income (loss): | ||||||||||||
| Cumulative translation adjustment | $ | 217 | $ | (201 | ) | $ | 339 | |||||
| Other comprehensive income (loss) | $ | 217 | $ | (201 | ) | $ | 339 | |||||
| Comprehensive Income | $ | 15,285 | $ | 11,363 | $ | 8,838 | ||||||
2013 | 2012 | 2011 | ||||||||||
Net Income | $ | 15,484 | $ | 15,068 | $ | 11,564 | ||||||
Other comprehensive income (loss): | ||||||||||||
Cumulative translation adjustment | $ | (822 | ) | $ | 217 | $ | (201 | ) | ||||
Other comprehensive income (loss) | $ | (822 | ) | $ | 217 | $ | (201 | ) | ||||
Comprehensive Income | $ | 14,662 | $ | 15,285 | $ | 11,363 | ||||||
See accompanying notes to consolidated financial statements.
NATIONAL RESEARCH CORPORATION AND SUBSIDIARY
Consolidated Statements of Shareholders’ Equity
(In thousands except share and per share amounts)
Common Stock | Additional Paid-in Capital | Retained Earnings | Accumulated Other Comprehensive Income | Treasury Stock | Total | |||||||||||||||||||
| Balances at December 31, 2009 | $ | 8 | $ | 27,871 | $ | 37,905 | $ | 769 | $ | (22,382 | ) | $ | 44,171 | |||||||||||
| Purchase of 20,349 shares of treasury stock | -- | -- | -- | -- | (463 | ) | (463 | ) | ||||||||||||||||
| Issuance of 17,573 common shares for the exercise of stock options | -- | 274 | -- | -- | -- | 274 | ||||||||||||||||||
| Tax benefit from the exercise of options and vested restricted stock | -- | 46 | -- | -- | -- | 46 | ||||||||||||||||||
| Issuance of 9,238 restricted common shares | -- | -- | -- | -- | -- | -- | ||||||||||||||||||
| Non-cash stock compensation expense | -- | 779 | -- | -- | -- | 779 | ||||||||||||||||||
| Dividends declared of $0.76 per common share | -- | -- | (5,061 | ) | -- | -- | (5,061 | ) | ||||||||||||||||
| Other comprehensive income (loss), foreign currency translation adjustment | -- | -- | -- | 339 | -- | 339 | ||||||||||||||||||
| Net income | -- | -- | 8,499 | -- | -- | 8,499 | ||||||||||||||||||
| Balances at December 31, 2010 | $ | 8 | $ | 28,970 | $ | 41,343 | $ | 1,108 | $ | (22,845 | ) | $ | 48,584 | |||||||||||
| Purchase of 17,288 shares of treasury stock | -- | -- | -- | -- | (591 | ) | (591 | ) | ||||||||||||||||
| Issuance of 58,671 common shares for the exercise of stock options | -- | 940 | -- | -- | -- | 940 | ||||||||||||||||||
| Tax benefit from the exercise of options and vested restricted stock | -- | 407 | -- | -- | -- | 407 | ||||||||||||||||||
| Issuance of 14,323 restricted common shares, net of forfeitures | -- | -- | -- | -- | -- | -- | ||||||||||||||||||
| Non-cash stock compensation expense | -- | 763 | -- | -- | -- | 763 | ||||||||||||||||||
| Dividends declared of $0.88 per common share | -- | -- | (5,912 | ) | -- | -- | (5,912 | ) | ||||||||||||||||
| Other comprehensive income (loss), foreign currency translation adjustment | -- | -- | -- | (201 | ) | -- | (201 | ) | ||||||||||||||||
| Net income | -- | -- | 11,564 | -- | -- | 11,564 | ||||||||||||||||||
| Balances at December 31, 2011 | $ | 8 | $ | 31,080 | $ | 46,995 | $ | 907 | $ | (23,436 | ) | $ | 55,554 | |||||||||||
| Purchase of 108,031 shares of treasury stock | -- | -- | -- | -- | (5,168 | ) | (5,168 | ) | ||||||||||||||||
| Issuance of 262,101 common shares for the exercise of stock options | -- | 5,968 | -- | -- | -- | 5,968 | ||||||||||||||||||
| Tax benefit from the exercise of options and vested restricted stock | -- | 2,078 | -- | -- | -- | 2,078 | ||||||||||||||||||
| Issuance of restricted common shares, net of forfeitures (3,358) | -- | -- | -- | -- | -- | -- | ||||||||||||||||||
| Non-cash stock compensation expense | -- | 388 | -- | -- | -- | 388 | ||||||||||||||||||
| Dividends declared of $2.54 per common share | -- | -- | (17,363 | ) | -- | -- | (17,363 | ) | ||||||||||||||||
| Other comprehensive income (loss), foreign currency translation adjustment | -- | -- | -- | 217 | -- | 217 | ||||||||||||||||||
| Net income | -- | -- | 15,068 | -- | -- | 15,068 | ||||||||||||||||||
| Balances at December 31, 2012 | $ | 8 | $ | 39,514 | $ | 44,700 | $ | 1,124 | $ | (28,604 | ) | $ | 56,742 | |||||||||||
| Common Stock A | Common Stock B | Additional Paid-in Capital | Retained Earnings | Accumulated Other | Treasury Stock | Total | ||||||||||||||||||||||
Balances at December 31, 2010 | $ | 24 | $ | 4 | $ | 28,950 | $ | 41,343 | $ | 1,108 | $ | (22,845 | ) | $ | 48,584 | |||||||||||||
Purchase of 51,864 A and 8,644 B shares of treasury stock | -- | -- | -- | -- | -- | (591 | ) | (591 | ) | |||||||||||||||||||
Issuance of 176,013 A and 29,336 B common shares for the exercise of stock options | -- | -- | 940 | -- | -- | -- | 940 | |||||||||||||||||||||
Tax benefit from the exercise of options and vested restricted stock | -- | -- | 407 | -- | -- | -- | 407 | |||||||||||||||||||||
Issuance of 42,969 A and 7,162 B restricted common shares, net of forfeitures | -- | -- | -- | -- | -- | -- | -- | |||||||||||||||||||||
Non-cash stock compensation expense | -- | -- | 763 | -- | -- | -- | 763 | |||||||||||||||||||||
Dividends declared of $0.15 and $.0.88 per A and B common share, respectively | -- | -- | -- | (5,912 | ) | -- | -- | (5,912 | ) | |||||||||||||||||||
Other comprehensive loss, foreign currency translation adjustment | -- | -- | -- | -- | (201 | ) | -- | (201 | ) | |||||||||||||||||||
Net income | -- | -- | -- | 11,564 | -- | -- | 11,564 | |||||||||||||||||||||
Balances at December 31, 2011 | $ | 24 | $ | 4 | $ | 31,060 | $ | 46,995 | $ | 907 | $ | (23,436 | ) | $ | 55,554 | |||||||||||||
Purchase of 324,093 A and 54,015 B shares of treasury stock | -- | -- | -- | -- | -- | (5,168 | ) | (5,168 | ) | |||||||||||||||||||
Issuance of 786,303 class A common shares and 131,051 class B shares for the exercise of stock options | 1 | -- | 5,967 | -- | -- | -- | 5,968 | |||||||||||||||||||||
Tax benefit from the exercise of options and vested restricted stock | -- | -- | 2,078 | -- | -- | -- | 2,078 | |||||||||||||||||||||
Issuance of restricted common shares, net of forfeitures (10,074 class A and 1,679 class B) | -- | -- | -- | -- | -- | -- | -- | |||||||||||||||||||||
Non-cash stock compensation expense | -- | -- | 388 | -- | -- | -- | 388 | |||||||||||||||||||||
Dividends declared of $0.42 and $2.54 per A and B common share, respectively | -- | -- | -- | (17,363 | ) | -- | -- | (17,363 | ) | |||||||||||||||||||
Other comprehensive income, foreign currency translation adjustment | -- | -- | -- | -- | 217 | -- | 217 | |||||||||||||||||||||
Net income | -- | -- | -- | 15,068 | -- | -- | 15,068 | |||||||||||||||||||||
Balances at December 31, 2012 | $ | 25 | $ | 4 | $ | 39,493 | $ | 44,700 | $ | 1,124 | $ | (28,604 | ) | $ | 56,742 | |||||||||||||
Purchase of 11,445 shares of class A and 1908 B shares of class B treasury stock | -- | -- | -- | -- | -- | (206 | ) | (206 | ) | |||||||||||||||||||
Issuance of 155,253 class A common shares and 31,876 class B shares for the exercise of stock options | -- | -- | 990 | -- | -- | -- | 990 | |||||||||||||||||||||
Tax benefit from the exercise of options and vested restricted stock | -- | -- | 755 | -- | -- | -- | 755 | |||||||||||||||||||||
Issuance of restricted common shares, net of forfeitures | -- | -- | -- | -- | -- | -- | -- | |||||||||||||||||||||
Non-cash stock compensation expense | -- | -- | 955 | -- | -- | -- | 955 | |||||||||||||||||||||
Fractional share cashed out | -- | -- | (1 | ) | -- | -- | -- | (1 | ) | |||||||||||||||||||
Dividends declared of $0.05 and $0.31 per A and B common share, respectively | -- | -- | -- | (2,142 | ) | -- | -- | (2,142 | ) | |||||||||||||||||||
Other comprehensive loss, foreign currency translation adjustment | -- | -- | -- | -- | (822 | ) | -- | (822 | ) | |||||||||||||||||||
Net income | -- | -- | -- | 15,484 | -- | -- | 15,484 | |||||||||||||||||||||
Balances at December 31, 2013 | $ | 25 | $ | 4 | $ | 42,192 | $ | 58,042 | $ | 302 | $ | (28,810 | ) | $ | 71,755 | |||||||||||||
See accompanying notes to consolidated financial statements.
NATIONAL RESEARCH CORPORATION AND SUBSIDIARY
Consolidated Statements of Cash Flows
(In thousandsthousands))
| 2012 | 2011 | 2010 | ||||||||||
| Cash flows from operating activities: | ||||||||||||
| Net income | $ | 15,068 | $ | 11,564 | $ | 8,499 | ||||||
| Adjustments to reconcile net income to net cash provided by operating activities: | ||||||||||||
| Depreciation and amortization | 4,699 | 5,065 | 4,704 | |||||||||
| Deferred income taxes | (421 | ) | 1,297 | 614 | ||||||||
| (Gain) Loss on sale of property and equipment | 4 | (1 | ) | 1 | ||||||||
| Tax benefit from exercise of stock options | 601 | 66 | 33 | |||||||||
| Non-cash stock compensation expense | 388 | 763 | 779 | |||||||||
| Change in assets and liabilities, net of effect of acquisitions: | ||||||||||||
| Trade accounts receivable | (879 | ) | (2,064 | ) | (2,489 | ) | ||||||
| Unbilled revenue | (11 | ) | 194 | 91 | ||||||||
| Prepaid expenses | (357 | ) | 253 | 1425 | ||||||||
| Other current assets | (106 | ) | (121 | ) | 429 | |||||||
| Accounts payable | (516 | ) | 52 | (1,391 | ) | |||||||
| Accrued expenses, wages, bonus and profit sharing | 1,602 | 1,176 | 113 | |||||||||
| Income taxes payable and recoverable | (303 | ) | 1,420 | (442 | ) | |||||||
| Deferred revenue | (637 | ) | (1,183 | ) | 2,237 | |||||||
| Net cash provided by operating activities | 19,132 | 18,481 | 14,603 | |||||||||
| Cash flows from investing activities: | ||||||||||||
| Purchases of property and equipment | (2,348 | ) | (2,812 | ) | (1,539 | ) | ||||||
| Acquisitions, net of cash acquired and earn-out on acquisitions | -- | (4,115 | ) | (15,441 | ) | |||||||
| Net cash used in investing activities | (2,348 | ) | (6,927 | ) | (16,980 | ) | ||||||
| Cash flows from financing activities: | ||||||||||||
| Proceeds from notes payable | -- | 4,545 | 11,300 | |||||||||
| Payments on notes payable | (2,050 | ) | (6,218 | ) | (2,799 | ) | ||||||
| Payments on capital lease obligations | (108 | ) | (130 | ) | (43 | ) | ||||||
| Proceeds from exercise of stock options | 1,283 | 568 | 274 | |||||||||
| Excess tax benefit from share-based compensation | 2,078 | 407 | 46 | |||||||||
| Purchase of treasury stock | -- | -- | (399 | ) | ||||||||
| Repurchase of shares for payroll tax withholdings related to share-based compensation | (527 | ) | (146 | ) | (64 | ) | ||||||
| Payment of dividends on common stock | (17,363 | ) | (5,912 | ) | (5,061 | ) | ||||||
| Net cash (used in) provided by financing activities | (16,687 | ) | (6,886 | ) | 3,254 | |||||||
| Effect of exchange rate changes on cash | 107 | (105 | ) | 130 | ||||||||
| Net increase in cash and cash equivalents | 204 | 4,563 | 1,007 | |||||||||
| Cash and cash equivalents at beginning of period | 8,082 | 3,519 | 2,512 | |||||||||
| Cash and cash equivalents at end of period | $ | 8,286 | $ | 8,082 | $ | 3,519 | ||||||
| Supplemental disclosure of cash paid for: | ||||||||||||
| Interest expense, net of capitalized amounts | $ | 554 | $ | 542 | $ | 497 | ||||||
| Income taxes | $ | 5,108 | $ | 3,383 | $ | 4,549 | ||||||
2013 | 2012 | 2011 | ||||||||||
Cash flows from operating activities: | ||||||||||||
Net income | $ | 15,484 | $ | 15,068 | $ | 11,564 | ||||||
Adjustments to reconcile net income to net cash provided by operating activities: | ||||||||||||
Depreciation and amortization | 3,732 | 4,699 | 5,065 | |||||||||
Deferred income taxes | 16 | (421 | ) | 1,297 | ||||||||
(Gain) Loss on sale of property and equipment | 23 | 4 | (1 | ) | ||||||||
Tax benefit from exercise of stock options | 84 | 601 | 66 | |||||||||
Non-cash stock compensation expense | 955 | 388 | 763 | |||||||||
Change in assets and liabilities: | ||||||||||||
Trade accounts receivable | 970 | (879 | ) | (2,064 | ) | |||||||
Unbilled revenue | (386 | ) | (11 | ) | 194 | |||||||
Prepaid expenses | (166 | ) | (357 | ) | 253 | |||||||
Other current assets | 76 | (106 | ) | (121 | ) | |||||||
Accounts payable | 331 | (516 | ) | 52 | ||||||||
Accrued expenses, wages, bonus and profit sharing | 212 | 1,602 | 1,176 | |||||||||
Income taxes payable and recoverable | (100 | ) | (303 | ) | 1,420 | |||||||
Deferred revenue | (1,916 | ) | (637 | ) | (1,183 | ) | ||||||
Net cash provided by operating activities | 19,315 | 19,132 | 18,481 | |||||||||
Cash flows from investing activities: | ||||||||||||
Purchases of property and equipment | (2,188 | ) | (2,348 | ) | (2,812 | ) | ||||||
Earn-out related to acquisitions | -- | -- | (4,115 | ) | ||||||||
Net cash used in investing activities | (2,188 | ) | (2,348 | ) | (6,927 | ) | ||||||
Cash flows from financing activities: | ||||||||||||
Proceeds from notes payable | -- | -- | 4,545 | |||||||||
Payments on notes payable | (2,112 | ) | (2,050 | ) | (6,218 | ) | ||||||
Payments on capital lease obligations | (110 | ) | (108 | ) | (130 | ) | ||||||
Proceeds from exercise of stock options | 840 | 1,283 | 568 | |||||||||
Excess tax benefit from share-based compensation | 755 | 2,078 | 407 | |||||||||
Repurchase of shares for payroll tax withholdings related to share-based compensation | (55 | ) | (527 | ) | (146 | ) | ||||||
Payment of dividends on common stock | (2,142 | ) | (17,363 | ) | (5,912 | ) | ||||||
Net cash used in financing activities | (2,824 | ) | (16,687 | ) | (6,886 | ) | ||||||
Effect of exchange rate changes on cash | (497 | ) | 107 | (105 | ) | |||||||
Net increase in cash and cash equivalents | 13,806 | 204 | 4,563 | |||||||||
Cash and cash equivalents at beginning of period | 8,286 | 8,082 | 3,519 | |||||||||
Cash and cash equivalents at end of period | $ | 22,092 | $ | 8,286 | $ | 8,082 | ||||||
Supplemental disclosure of cash paid for: | ||||||||||||
Interest expense, net of capitalized amounts | $ | 368 | $ | 554 | $ | 542 | ||||||
Income taxes | $ | 8,181 | $ | 5,108 | $ | 3,383 | ||||||
Supplemental disclosures of non-cash investing and financing activities:
Capital lease obligations for property and equipment originating during the years ended December 31, 2013, 2012 and 2011 was $5,000, $9,000 and 2010 was $9,000, $115,000, and $389,000, respectively.
In connection with the Company’s equity incentive plans, certain optionees tendered to the Company previously owned shares to pay for the option strike price. The total non-cash stock options exercised was $150,000, $4.6 million $445,000 and $-0-$445,000 for the years ended December 31, 2013, 2012, and 2011, and 2010, respectively.
See accompanying notes to consolidated financial statements.
NATIONAL RESEARCH CORPORATION AND SUBSIDIARY
Notes to Consolidated Financial Statements
(1) Summary of Significant Accounting Policies
Description of Business and Basis of Presentation
National Research Corporation (“NRC” or the “Company”) is a leading provider of analytics and insights that facilitate revenue growth, patient, employee and customer retention and patient engagement for healthcare providers, payers and other healthcare organizations.organizations in the United States and Canada. The Company’s ten largest clients accounted for 22%19%, 20%22%, and 19%20% of the Company’s total revenue in 2013, 2012, and 2011, respectively.
Recapitalization
In May 2013, the Company consummated a recapitalization (the “May 2013 Recapitalization”) pursuant to which the Company established two classes of common stock (class A common stock and 2010, respectively.
Principles of Consolidation
The consolidated financial statements include the accounts of the Company, its wholly-owned subsidiary, National Research Corporation Canada, and its subsidiary.a variable interest entity, Customer-Connect LLC (“Connect”), which NRC has been deemed the primary beneficiary. All significant intercompany transactions and balances have been eliminated in consolidation.
Use of Estimates
The preparation of financial statements in conformity with accounting principles generally accepted in the United States of America requires management to make certain estimates and assumptions that affect the reported amounts of assets and liabilities at the date of the financial statements and the reported amounts of revenue and expenses during the reporting period. Actual results could differ from those estimates.
Translation of Foreign Currencies
The Company’s Canadian subsidiary uses as its functional currency the local currency of the country in which it operates. It translates its assets and liabilities into U.S. dollars at the exchange rate in effect at the balance sheet date. It translates its revenue and expenses at the average exchange rate during the period. The Company includes translation gains and losses in accumulated other comprehensive income (loss), a component of shareholders’ equity. Gains and losses related to transactions denominated in a currency other than the functional currency of the countries in which the Company operates and short-term intercompany accounts are included in other income (expense) in the consolidated statements of income. Since the undistributed earnings of the Company’s foreign subsidiaries are considered to be indefinitely reinvested, the components of accumulated other comprehensive income (loss) have not been tax effected.
Revenue Recognition
The Company derives a majority of its operating revenue from its annually renewable services, which include performance measurement and improvement services, healthcare analytics and governance education services. The Company provides these services to its clients under annual client service contracts, although such contracts are generally cancelable on short or no notice without penalty. The Company also derives some revenue from its custom and other research projects.
Services are provided under subscription-based service agreements. The Company recognizes subscription-based service revenue over the period of time the service is provided. Generally, the subscription periods are for twelve months and revenue is recognized equally over the subscription period.
Certain contracts are fixed-fee arrangements with a portion of the project fee billed in advance and the remainder billed periodically over the duration of the project. Revenue and direct expenses for services provided under these contracts are recognized under the proportional performance method. Under the proportional performance method, the Company recognizes revenue based on output measures or key milestones such as survey set-up, survey mailings, survey returns and reporting. The Company measures its progress based on the level of completion of these output measures and recognizes revenue accordingly. Management judgments and estimates must be made and used in connection with revenue recognized using the proportional performance method. If management made different judgments and estimates, then the amount and timing of revenue for any period could differ materially from the reported revenue.
The Company also derives revenue from hosting arrangements where our propriety software is offered as a service to our customers through our data processing facilities. The Company’s revenue also includes software-related revenue for software license revenue, installation services, post-contract support (maintenance) and training. Software-related revenue is recognized in accordance with the provisions of Accounting Standards Codification (“ASC”) 985-605, Software-Revenue Recognition.
Hosting arrangements to provide customers with access to the Company’s propriety software are marketed under long-term arrangements generally over periods of one to three years. Under these arrangements, the customer is not provided the contractual right to take possession of the licensed software at any time during the hosting period without significant penalty, and the customer is not provided the right to run the software on their own hardware or contract with another party unrelated to us to host the software. Upfront fees for setup services are typically billed for our hosting arrangements, however, these arrangements do not qualify for separation from the ongoing hosting services due to the absence of standalone value for the set-up services. Therefore, we account for these arrangements as service contracts and recognize revenue ratably over the hosting service period when all other conditions to revenue are met. Other conditions that must be met before the commencement of revenue recognition include achieving evidence of an arrangement, determining that the collection of the revenue is probable, and determining that fees are fixed and determinable.
The Company’s software arrangements typically involve the sale of a time-based license bundled with installation services, post-contract support (“PCS”) and training. License terms range from one year to three years, and require an annual fee for bundled elements of the arrangement. PCS is also contractually provided for a period that is co-terminus with the term of the time-based license. The Company’s installation services are not considered to be essential to the functionality of the software license. The Company does not achieve vendor-specific objective evidence (“VSOE”) of the fair value of the undelivered elements of its software arrangements (primarily PCS) and, therefore, these arrangements are accounted for as a single unit of accounting with revenue recognized ratably over the minimum bundled PCS period.
The Company’s revenue arrangements (not involving software elements) with a client may include multiple elements. In assessingcombinations of performance measurement and improvement services, healthcare analytics or governance education services which may be executed at the separationsame time, or within close proximity of revenueone another (referred to as a multiple-element arrangement). Each element of a multiple-element arrangement is accounted for elementsas a separate unit of such arrangements, we first determine whetheraccounting provided each delivered element has standalone value based on whether we,is sold separately by the Company or other vendors, sellanother vendor; and for an arrangement that includes a general right of return relative to the services separately. We also consider whether there is sufficient evidenceundelivered elements, delivery or performance of the fair valueundelivered services are considered probable and substantially in the control of the elements in allocatingCompany. The Company’s arrangements generally do not include a general right of return related to the fees indelivered services. If these criteria are not met, the arrangement is accounted for as a single unit of accounting with revenue generally recognized equally over the subscription period or recognized under the proportional performance method.
Revenue is allocated to each element. Revenue allocated to an element is limited to revenue that is not subject to refund or otherwise represent contingent revenue.
Trade Accounts Receivable
Trade accounts receivable are recorded at the invoiced amount. The allowance for doubtful accounts is the Company’s best estimate of the amount of probable credit losses in the Company’s existing accounts receivable. The Company determines the allowance based on specific account analysis and on the Company’s historical write-off experience. The Company reviews the allowance for doubtful accounts monthly. Past due balances over 90 days and over a specified amount are reviewed individually for collectability and provisions are made for accounts not specifically reviewed. Account balances are charged off against the allowance after all means of collection have been exhausted and the potential for recovery is considered remote.
Property and Equipment
Property and equipment is stated at cost. Major expenditures to purchase property or to substantially increase useful lives of property are capitalized. Maintenance, repairs and minor renewals are expensed as incurred. When assets are retired or otherwise disposed of, their costs and related accumulated depreciation are removed from the accounts and resulting gains or losses are included in income.
For costs of software developed for internal use, the Company expenses computer software costs as incurred in the preliminary project stage, which involves the conceptual formulation, evaluation and selection of technology alternatives. Costs incurred related to the design, coding, installation and testing of software during the application project stage are capitalized. Costs for training and application maintenance are expensed as incurred. The Company has capitalized approximately $636,000, $840,000$1.7 million and $900,000,$636,000 of internal and external costs incurred for the development of internal-use software for the years ended December 31, 2012, 2011,2013 and 2010,2012, respectively, with such costs classified as property and equipment.
The Company provides for depreciation and amortization of property and equipment using annual rates which are sufficient to amortize the cost of depreciable assets over their estimated useful lives. The Company uses the straight-line method of depreciation and amortization over estimated useful lives of three to ten years for furniture and equipment, three to five years for computer equipment, three to five years for capitalized software, and seven to forty years for the Company’s office building and related improvements.
Leases are categorized as operating or capital at the inception of the lease. Assets under capital lease obligations are reported at the lower of fair value or the present value of the aggregate future minimum lease payments at the beginning of the lease term. The Company depreciates capital lease assets without transfer-of-ownership or bargain-purchase-options using the straight-line method over the lease terms, excluding any lease renewals, unless the lease renewals are reasonably assured. Capital lease assets with transfer-of-ownership or bargain-purchase-options are depreciated using the straight-line method over the assets’ estimated useful lives.
Impairment of Long-Lived Assets
Long-lived assets, such as property and equipment and purchased intangible assets subject to amortization, are reviewed for impairment whenever events or changes in circumstances indicate that the carrying amount of an asset may not be recoverable. If circumstances require a long-lived asset or asset group be tested for possible impairment, the Company first compares undiscounted cash flows expected to be generated by that asset or asset group to its carrying value. If the carrying value of the long-lived asset or asset group is not recoverable on an undiscounted cash flow basis, an impairment is recognized to the extent that the carrying value exceeds its fair value. Fair value is determined through various valuation techniques including discounted cash flow models, quoted market values and third-party independent appraisals, as considered necessary. No impairments were recorded during the years ended December 31, 2013, 2012, 2011, or 2010.
Among others, management believes the following circumstances are important indicators of potential impairment of such assets and as a result may trigger an impairment review:
● | Significant underperformance in comparison to historical or projected operating results; |
● | Significant changes in the manner or use of acquired assets or the Company’s overall strategy; |
● | Significant negative trends in the Company’s industry or the overall economy; |
● | A significant decline in the market price for the Company’s common stock for a sustained period; and |
● | The Company’s market capitalization falling below the book value of the Company’s net |
Goodwill and Intangible Assets
Intangible assets include customer relationships, trade names, non-compete agreements and goodwill. Intangible assets with estimable useful lives are amortized over their respective estimated useful lives to their estimated residual values and reviewed for impairment whenever events or changes in circumstances indicate that the carrying amount of the assets may not be recoverable. The Company reviews intangible assets with indefinite lives for impairment annually as of October 1 and whenever events or changes in circumstances indicate that the carrying value of an asset may not be recoverable.
When performing the impairment assessment, the Company will first assess qualitative factors to determine whether it is necessary to recalculate the fair value of the intangible assets with indefinite lives. If the Company believes, as a result of the qualitative assessment, that it is more likely than not that the fair value of the indefinite-lived intangibles is less than their carrying amount, the Company calculates the fair value using a market approach. If the carrying value of intangible assets with indefinite lives exceeds their fair value, then the intangible assets are written-down to their fair values. The Company did not recognize any impairments related to long-lived assetsindefinite-lived intangibles during 2013, 2012 2011, or 2010.
Goodwill is an asset representing the future economic benefits arising from other assets acquired in a business combination that are not individually identified and separately recognized. All of the Company’s goodwill is allocated to its reporting units, which are the same as its operating segments. Goodwill is reviewed for impairment at least annually, as of October 1, and whenever events or changes in circumstances indicate that the carrying value of goodwill may not be recoverable.
The Company reviews for goodwill impairment by first assessing qualitative factors to determine whether any impairment may exist. If the Company believes, as a result of the qualitative assessment, that it is more likely than not that the fair value of a reporting unit is less than its carrying amount, a quantitative two-step test is required; otherwise, no further testing is required. Under the first step of the quantitative test, the fair value of the reporting unit is compared with its carrying value (including goodwill). If the fair value of the reporting unit exceeds its carrying value, step two doesis not need to be performed. If the fair value of the reporting unit is less than its carrying value, an indication of goodwill impairment exists for the reporting unit and the entity must performCompany performs step two of the impairment test (measurement). Under step two, an impairment loss is recognized for any excess of the carrying amount of the reporting unit’s goodwill over the fair value of that goodwill. The fair value of goodwill is determined by allocating the fair value of the reporting unit in a manner similar to a purchase price allocation and the residual fair value after this allocation is the fair value of the reporting unit goodwill.
In instances when a step two is required, the fair value of the reporting unit is determined using an income approach and comparable market multiples. Under the income approach, there are a number of inputs used to calculate the fair value using a discounted cash flow model, including operating results, business plans, projected cash flows and a discount rate. Discount rates, growth rates and cash flow projections are the most sensitive and susceptible to change as they require significant management judgment. Discount rates are determined by using a weighted average cost of capital, which considers market and industry data. Operational managementManagement develops growth rates and cash flow projections for each reporting unit considering industry and Company-specific historical and projected information. Terminal value rate determination follows common methodology of capturing the present value of perpetual cash flow estimates beyond the last projected period assuming a constant weighted average cost of capital and low long-term growth rates. Under the market approach, the Company considers its market capitalization, comparisons to other public companies’ data, and recent transactions of similar businesses within the Company’s industry.
The Company performed a qualitative analysis as of October 1, 20122013 which did not indicate that it was more likely than not that the carrying values of the reporting units exceeded fair value.
Segment Information
During the first quarter of 2013, due to the Company change in operating structure (or strategy), the Company condensed its eight operating segments into two operating segments that are aggregated into one reporting segment because they have similar economic characteristics and meet the other aggregation criteria guidance on segment disclosure. The two operating segments, organized by geographic area, are National Research Corporation (United States) and National Research Corporation Canada, which each offer a portfolio of solutions to address specific market needs around growth, retention, engagement and thought leadership for healthcare organizations.
Income Taxes
The Company uses the asset and liability method of accounting for income taxes. Under that method, deferred income tax assets and liabilities are recognized for the future tax consequences attributable to differences between the financial statement carrying amounts of existing assets and liabilities and their respective tax basis using enacted tax rates. The effect on deferred tax assets and liabilities of a change in tax rates is recognized in income in the period that includes the enactment date. Valuation allowances, if any, are established when necessary to reduce deferred tax assets to the amount that is more likely than not to be realized. The Company uses the deferral method of accounting for its investment tax credits related to state tax incentives. During the years ended December 31, 2013, 2012 2011 and 2010,2011, the Company recorded income tax benefits relating to these tax credits of $290,000, $289,000, and $229,000, and $251,000, respectively.
The Company recognizes the effect of income tax positions only if those positions are more likely than not of being sustained. Recognized income tax positions are measured at the largest amount that is greater than 50% likely of being realized. Changes in recognition or measurement are reflected in the period in which the change in judgment occurs.
The Company had an unrecognized tax benefit at December 31, 2013 and 2012, of $188,000 and 2011, of $224,000, and $266,000, respectively, excluding interest of $11,000$5,000 and $43,000,$11,000, respectively, and no penalties. Of this amount, $224,000$188,000 and $266,000$224,000 at December 31, 20122013 and 2011,2012, respectively, represents the net unrecognized tax benefits that, if recognized, would favorably impact the effective income tax rate. The Company accrues interest and penalties related to uncertain tax position in the statements of income as income tax expense. The Company is not subject to tax examinations for years prior to 20092010 in the U.S. and 20082009 in Canada.
Share-Based Compensation
The Company measures and recognizes compensation expense for all share-based payments. The compensation expense is recognized based on the grant-date fair value of those awards. All of the Company’s existing stock option awards and non-vested stock awards have been determined to be equity-classified awards.
Amounts recognized in the financial statements with respect to these plans:
| 2012 | 2011 | 2010 | ||||||||||
| (In thousands) | ||||||||||||
| Amounts charged against income, before income tax benefit | $ | 388 | $ | 763 | $ | 779 | ||||||
| Amount of related income tax benefit | 153 | 302 | 309 | |||||||||
| Total net income impact | $ | 235 | $ | 461 | $ | 470 | ||||||
2013 | 2012 | 2011 | ||||||||||
(In thousands) | ||||||||||||
Amounts charged against income, before income tax benefit | $ | 955 | $ | 388 | $ | 763 | ||||||
Amount of related income tax benefit | 377 | 153 | 302 | |||||||||
Total impact to net income | $ | 578 | $ | 235 | $ | 461 | ||||||
Cash and Cash Equivalents
The Company considers all highly liquid investments with original maturities of three months or less to be cash equivalents. Cash equivalents were $7.5$21.2 million and $7.9$7.5 million as of December 31, 2012,2013, and 2011,2012, respectively, consisting primarily of money market accounts and funds invested in commercial paper. At certain times, cash equivalent balances may exceed federally insured limits.
Fair Value Measurements
The Company’s valuation techniques are based on maximizing observable inputs and minimizing the use of unobservable inputs when measuring fair value. Observable inputs reflect readily obtainable data from independent sources, while unobservable inputs reflect the Company’s market assumptions. The inputs are then classified into the following hierarchy: (1) Level 1 Inputs—quoted prices in active markets for identical assets and liabilities; (2) Level 2 Inputs—observable market-based inputs other than Level 1 inputs, such as quoted prices for similar assets or liabilities in active markets, quoted prices for similar or identical assets or liabilities in markets that are not active, or other inputs that are observable or can be corroborated by observable market data; (3) Level 3 Inputs—unobservable inputs.
The following details the Company’s financial assets and liabilities within the fair value hierarchy at December 31, 20122013 and 2011:
| Level 1 | Level 2 | Level 3 | Total | |||||||||||||
| (In thousands) | ||||||||||||||||
As of December 31, 2012 | ||||||||||||||||
| Money Market Funds | $ | 5,245 | $ | -- | $ | -- | $ | 5,245 | ||||||||
| Commercial Paper | $ | 2,242 | $ | -- | $ | -- | $ | 2,242 | ||||||||
| Total | $ | 7,487 | $ | -- | $ | -- | $ | 7,487 | ||||||||
As of December 31, 2011 | ||||||||||||||||
| Money Market Funds | $ | 3,243 | $ | -- | $ | -- | $ | 3,243 | ||||||||
| Commercial Paper | $ | 4,659 | $ | -- | $ | -- | $ | 4,659 | ||||||||
| Total | $ | 7,902 | $ | -- | $ | -- | $ | 7,902 | ||||||||
Level 1 | Level 2 | Level 3 | Total | |||||||||||||
(In thousands) | ||||||||||||||||
As of December 31, 2013 | ||||||||||||||||
Money Market Funds | $ | 7,266 | $ | -- | $ | -- | $ | 7,266 | ||||||||
Commercial Paper | $ | 13,976 | $ | -- | $ | -- | $ | 13,976 | ||||||||
Total | $ | 21,242 | $ | -- | $ | -- | $ | 21,242 | ||||||||
As of December 31, 2012 | ||||||||||||||||
Money Market Funds | $ | 5,245 | $ | -- | $ | -- | $ | 5,245 | ||||||||
Commercial Paper | $ | 2,242 | $ | -- | $ | -- | $ | 2,242 | ||||||||
Total | $ | 7,487 | $ | -- | $ | -- | $ | 7,487 | ||||||||
The Company's long-term debt described in Note 6 is recorded at historical cost. The fair value of long-term debt is classified in Level 2 of the fair value hierarchy and was estimated based primarily on estimated current rates available for debt of the same remaining duration and adjusted for nonperformance and credit. The following are the carrying amount and estimated fair values of long-term debt:
December 31, 2012 | December 31, 2011 | |||||||
| (In thousands) | ||||||||
| Total carrying amount of long-term debt | $ | 12,436 | $ | 14,486 | ||||
| Estimated fair value of long-term debt | $ | 12,490 | $ | 14,498 | ||||
December 31, 2013 | December 31, 2012 | |||||||
(In thousands) | ||||||||
Total carrying amount of long-term debt | $ | 10,324 | $ | 12,436 | ||||
Estimated fair value of long-term debt | $ | 10,156 | $ | 12,490 | ||||
The Company believes that the carrying amounts of accounts receivable, accounts payable, and accrued expenses approximate their fair value. All non-financial assets that are not recognized or disclosed at fair value in the financial statements on a recurring basis, which includes goodwill and non-financial long-lived assets, are measured at fair value in certain circumstances (for example, when there is evidence of impairment). As of December 31, 20122013 and 2011,2012, there was no impairment related to property and equipment, goodwill and other intangible assets.
Contingencies
From time to time, the Company is involved in certain claims and litigation arising in the normal course of business. Management assesses the probability of loss for such contingencies and recognizes a liability when a loss is probable and estimable. At December 31, 2012,2013, the Company was not engaged in any legal proceedings that are expected, individually or in the aggregate, to have a material effect on the Company.
Earnings Per Share
Net income per share has been calculatedof class A common stock and presented for “basic” and “diluted” per share data.class B common stock is computed using the two-class method. Basic net income per share is computed by dividing net income byallocating undistributed earnings to common shares and using the weighted averageweighted-average number of common shares outstanding. outstanding during the period.
Diluted net income per share is computed by dividing net income byusing the weighted averageweighted-average number of common shares adjustedand, if dilutive, the potential common shares outstanding during the period. Potential common shares consist of the incremental common shares issuable upon the exercise of stock options and vesting of restricted stock. The dilutive effect of outstanding stock options is reflected in diluted earnings per share by application of the treasury stock method.
The liquidation rights and the rights upon the consummation of an extraordinary transaction are the same for the dilutive effectsholders of optionsclass A common stock and restrictedclass B common stock. Other than share distributions and liquidation rights, the amount of any dividend or other distribution payable on each share of class A common stock will be equal to one-sixth (1/6th) of the amount of any such dividend or other distribution payable on each share of class B common stock. As a result, the undistributed earnings for each year are allocated based on the contractual participation rights of the class A and class B common stock as if the earnings for the year had been distributed.
At December 31, 2013, 2012, 2011, and 2010,2011, the Company had 30,820, 119,56999,562, 92,460 and 384,652358,707 options of class A shares and 6,407, 15,410, and 59,785 options of class B shares, respectively, which have been excluded from the diluted net income per share computation because the exercise price exceeds the fair market value.
| 2012 | 2011 | 2010 | ||||||||||
| (In thousands) | ||||||||||||
| Common stock | 6,775 | 6,672 | 6,637 | |||||||||
| Dilutive effect of options | 164 | 158 | 87 | |||||||||
| Dilutive effect of restricted stock | 12 | 12 | 12 | |||||||||
| Weighted average shares used for dilutive per share information | 6,951 | 6,842 | 6,736 | |||||||||
2013 | 2012 | 2011 | ||||||||||||||||||||||
Class A | Class B | Class A | Class B | Class A | Class B | |||||||||||||||||||
(In thousands, except per share data) | ||||||||||||||||||||||||
Numerator for net income per share - basic: | ||||||||||||||||||||||||
Allocation of distributed earnings | $ | 1,071 | $ | 1,071 | $ | 8,681 | $ | 8,681 | $ | 2,956 | $ | 2,956 | ||||||||||||
Allocation of undistributed earnings | 6,670 | 6,672 | (1,147 | ) | (1,147 | ) | 2,826 | 2,826 | ||||||||||||||||
Net income attributable to common shareholders | $ | 7,741 | $ | 7,743 | $ | 7,534 | $ | 7,534 | $ | 5,782 | $ | 5,782 | ||||||||||||
Denominator for net income per share - basic: | ||||||||||||||||||||||||
Weighted average common shares outstanding - basic | 20,677 | 3,447 | 20,325 | 3,388 | 20,016 | 3,336 | ||||||||||||||||||
Net income per share - basic | $ | 0.37 | $ | 2.25 | $ | 0.37 | $ | 2.22 | $ | 0.29 | $ | 1.73 | ||||||||||||
Numerator for net income per share - diluted: | ||||||||||||||||||||||||
Net income attributable to common shareholders for basic computation | $ | 7,741 | $ | 7,743 | $ | 7,534 | $ | 7,534 | $ | 5,782 | $ | 5,782 | ||||||||||||
Denominator for net income per share - diluted: | ||||||||||||||||||||||||
Weighted average commonshares outstanding - basic | 20,677 | 3,447 | 20,325 | 3,388 | 20,016 | 3,336 | ||||||||||||||||||
Weighted average effect of dilutive securities: | ||||||||||||||||||||||||
Stock Options | 388 | 61 | 492 | 82 | 474 | 79 | ||||||||||||||||||
Restricted Stock | 34 | 6 | 37 | 6 | 36 | 6 | ||||||||||||||||||
Weighted average common shares outstanding - | 21,099 | 3,514 | 20,854 | 3,476 | 20,526 | 3,421 | ||||||||||||||||||
Net income per share - diluted | $ | 0.37 | $ | 2.20 | $ | 0.36 | $ | 2.17 | $ | 0.28 | $ | 1.69 | ||||||||||||
Recent Accounting Pronouncements
There arehave been no reconciling items between the Company’s reported net income and net income used in the computation of basic and diluted income per share.
(2) Variable Interest Entity
Connect was formed in June 2013 to access best practice examples,develop and commercialize the Connect programs. Connect programs provide healthcare organizations the technology to utilize competitive information for marketing purposes; Payer Solutions, which offers functional disease-specific and health status measurement tools; The Governance Institute (“TGI”), which offers subscription-based governance information and educational conferences designed to improve the effectiveness of hospital and healthcare systems by continually strengthening their healthcare boards, medical leadershipengage patients through real-time identification and management performance in the United States; My InnerView (“MIV”), which provides qualityof individual patient needs, preferences, risks, and performance improvement solutionsexperiences. The platform ensures that organizations have access to the senior care industry; Outcome Concept Systems, Inc. (“OCS”), a provider of clinical, financial and operational benchmarks and analytics to home care and hospice providers; and Illuminate, a patient outreach and discharge program designed to facilitate service and clinical recovery within the critical hours after a patient is discharged from a healthcare setting within the acute care, skilled nursing, physician and home health environments.
NRC has a future obligation to purchase the other equity units in Connect when certain targeted events have been achieved. If, at any time, there is at least $12.5 million of annual recurring contract value, including the depthNRC contracts being serviced, and knowledgethe members have approved a financial statement showing a pro forma minimum 35% EBITDA margin for revenue on a going-forward basis, then within 90 days thereafter NRC is required to purchase from the other members, and the other members shall be required to sell to NRC, all of management. Cash consideration paid at closing was $15.3 million, net of $1.0 million cash received. The following table summarizes the purchase allocation of fair value of the assets acquired and liabilities assumed at the acquisition date.
Weighted-Average Life (years) | ||||||||
| Current Assets | $ | 3,615 | ||||||
| Property and equipment | 1,632 | |||||||
| Customer relationships | 10 | 2,330 | ||||||
| Trade name | 5 | 330 | ||||||
| Non-compete Agreements | 3 | 430 | ||||||
| Goodwill | 13,502 | |||||||
| Total acquired assets | 21,839 | |||||||
| Current liabilities | 6,310 | |||||||
| Long-term liabilities | 260 | |||||||
| Total liabilities assumed | 6,570 | |||||||
| Net assets acquired | $ | 15,269 | ||||||
NRC is deemed the primary beneficiary of the variable interest entity and forhas a 49% ownership interest in Connect. An entity is considered the years then ended, include amounts acquired from, as well asprimary beneficiary of a variable interest entity if it has both the resultspower to direct the activities of operationsthe variable interest entity that most significantly impact the variable interest entity’s economic performance and an obligation to absorb losses or the right to receive benefits that could potentially be significant to the variable interest entity. Connect is thinly capitalized and relies on NRC advances and reimbursements to fund its operations. Together, NRC and NRC associates hold a majority of OCS from August 3, 2010, forward. Resultsthe voting rights on Connect board of operationsdirectors and have the ability to direct the majority of Connect operations.
Included in the Company’s consolidated financial statements for the year ended December 31, 2010, include revenue2013, was Connect’s net operating loss of $3.0 million and$837,000.The net operating incomeloss of $221,000Connect during 2013 was attributable to OCS since its acquisition. Acquisition-related costs included in selling, generalNRC. Connect had total assets of $649,000 and administrative expenses for the year endedtotal liabilities of $186,000 as of December 31, 2010, approximated $312,000. The following unaudited pro forma information for the Company has been prepared as if the acquisition of OCS had occurred on January 1, 2009. The information is based on the historical results of the separate companies and may not necessarily be indicative of the results that could have been achieved or of results that may occur in the future. The pro forma adjustments include the impact of depreciation and amortization of property and equipment and intangible assets acquired, interest expense on the acquisition debt and income tax benefits for tax effects of the foregoing adjustments to depreciation, amortization and interest expense.
December 31, 2010 | ||||
| (in thousands) | ||||
| Revenue | $ | 67,341 | ||
| Net income | $ | 7,664 | ||
| Net income per share – basic | $ | 1.15 | ||
| Net income per share – diluted | $ | 1.14 | ||
(3) Property and Equipment
At December 31, 2012,2013, and 2011,2012, property and equipment consisted of the following:
| 2012 | 2011 | |||||||
| (In thousands) | ||||||||
| Furniture and equipment | $ | 3,797 | $ | 3,667 | ||||
| Computer equipment and software | 17,647 | 15,866 | ||||||
| Building | 9,322 | 9,271 | ||||||
| Land | 425 | 425 | ||||||
| 31,191 | 29,229 | |||||||
| Less accumulated depreciation and amortization | 18,698 | 15,616 | ||||||
| Net property and equipment | $ | 12,493 | $ | 13,613 | ||||
2013 | 2012 | |||||||
(In thousands) | ||||||||
Furniture and equipment | $ | 4,015 | $ | 3,797 | ||||
Computer equipment and software | 18,569 | 17,647 | ||||||
Building | 9,322 | 9,322 | ||||||
Land | 425 | 425 | ||||||
| 32,331 | 31,191 | |||||||
Less accumulated depreciation and amortization | 20,433 | 18,698 | ||||||
Net property and equipment | $ | 11,898 | $ | 12,493 | ||||
Depreciation and amortization expense related to property and equipment, including assets under capital lease, for the years ended December 31, 2013, 2012, and 2011 and 2010 was $2.8 million, $3.4 million, and $3.5 million, and $3.4 million, respectively.
Property and equipment included the following amounts under capital lease:
| 2012 | 2011 | |||||||
| (In thousands) | ||||||||
| Furniture and equipment | $ | 514 | $ | 527 | ||||
| Computer equipment and software | 47 | 47 | ||||||
| 561 | 574 | |||||||
| Less accumulated amortization | 196 | 117 | ||||||
| Net assets under capital lease | $ | 365 | $ | 457 | ||||
2013 | 2012 | |||||||
(In thousands) | ||||||||
Furniture and equipment | $ | 519 | $ | 514 | ||||
Computer equipment and software | 47 | 47 | ||||||
| 566 | 561 | |||||||
Less accumulated amortization | 294 | 196 | ||||||
Net assets under capital lease | $ | 272 | $ | 365 | ||||
(4) Goodwill and Intangible Assets
Goodwill and intangible assets consisted of the following at December 31, 2013:
Useful Life | Gross | Accumulated Amortization | Net | |||||||||||||||
| (In years) | (In thousands) | |||||||||||||||||
Goodwill | $ | 57,593 | $ | 57,593 | ||||||||||||||
Non-amortizing intangible assets: | ||||||||||||||||||
Indefinite trade name | 1,191 | 1,191 | ||||||||||||||||
Amortizing intangible assets: | ||||||||||||||||||
Customer related | 5 | - | 15 | 10,499 | 7,334 | 3,165 | ||||||||||||
Non-compete agreements | 3 | 430 | 430 | - | ||||||||||||||
Trade names | 5 | - | 10 | 1,902 | 1,418 | 484 | ||||||||||||
Total amortizing intangible assets | 12,831 | 9,182 | 3,649 | |||||||||||||||
Total intangible assets other than goodwill | $ | 14,022 | $ | 9,182 | $ | 4,840 | ||||||||||||
Goodwill and intangible assets consisted of the following at December 31, 2012:
Useful Life |
| Accumulated Amortization |
| |||||||||||||||
(In years) | (In thousands) | |||||||||||||||||
Goodwill | $ | 57,799 | $ | 57,799 | ||||||||||||||
Non-amortizing intangible assets: | ||||||||||||||||||
Indefinite trade name | 1,191 | 1,191 | ||||||||||||||||
Amortizing intangible assets: | ||||||||||||||||||
Customer related | 5 | - | 15 | 10,521 | 6,709 | 3,812 | ||||||||||||
Non-compete agreements | 3 | 430 | 346 | 84 | ||||||||||||||
Trade names | 5 | - | 10 | 1,902 | 1,195 | 707 | ||||||||||||
Total amortizing intangible assets | 12,853 | 8,250 | 4,603 | |||||||||||||||
Total intangible assets other than goodwill | $ | 14,044 | $ | 8,250 | $ | 5,794 | ||||||||||||
Useful Life | Gross | Accumulated Amortization | Net | ||||||||||||||
| (In years) | (In thousands) | ||||||||||||||||
| Goodwill | $ | 57,799 | $ | 57,799 | |||||||||||||
| Non-amortizing intangible assets: | |||||||||||||||||
| Indefinite trade name | 1,191 | 1,191 | |||||||||||||||
| Amortizing intangible assets: | |||||||||||||||||
| Customer related | 5 | - | 15 | 10,521 | 6,709 | 3,812 | |||||||||||
| Non-competes | 3 | 430 | 346 | 84 | |||||||||||||
| Trade names | 5 | - | 10 | 1,902 | 1,195 | 707 | |||||||||||
| Total amortizing intangibles | 12,853 | 8,250 | 4,603 | ||||||||||||||
| Total intangible assets other than goodwill | $ | 14,044 | $ | 8,250 | $ | 5,794 | |||||||||||
Useful Life | Gross | Accumulated Amortization | Net | ||||||||||||||
| (In years) | (In thousands) | ||||||||||||||||
| Goodwill | $ | 57,730 | $ | 57,730 | |||||||||||||
| Non-amortizing intangible assets: | |||||||||||||||||
| Indefinite trade name | 1,191 | 1,191 | |||||||||||||||
| Amortizing intangible assets: | |||||||||||||||||
| Customer related | 5 | - | 15 | 10,513 | 5,789 | 4,724 | |||||||||||
| Non-competes | 3 | 430 | 203 | 227 | |||||||||||||
| Trade names | 5 | - | 10 | 1,902 | 971 | 931 | |||||||||||
| Total amortizing intangibles | 12,845 | 6,963 | 5,882 | ||||||||||||||
| Total intangible assets other than goodwill | $ | 14,036 | $ | 6,963 | $ | 7,073 | |||||||||||
The following represents a summary of changes in the Company’s carrying amount of goodwill for the years ended December 31, 2012,2013, and 20112012 (in thousands):
| Balance as of December 31, 2010 | $ | 55,133 | ||
| MIV contingent consideration earned | 2,550 | |||
| OCS correcting entries | 106 | |||
| Foreign currency translation | (59 | ) | ||
| Balance as of December 31, 2011 | $ | 57,730 | ||
| Foreign currency translation | 69 | |||
| Balance as of December 31, 2012 | $ | 57,799 |
Balance as of December 31, 2011 | $ | 57,730 | ||
Foreign currency translation | 69 | |||
Balance as of December 31, 2012 | $ | 57,799 | ||
Foreign currency translation | (206 | ) | ||
Balance as of December 31, 2013 | $ | 57,593 |
(5) Income Taxes
For the years ended December 31, 2013, 2012, 2011, and 2010,2011, income before income taxes consists of the following:
| 2012 | 2011 | 2010 | ||||||||||
| U.S. Operations | $ | 19,836 | $ | 16,017 | $ | 11,353 | ||||||
| Foreign Operations | 2,371 | 2,143 | 1,962 | |||||||||
| $ | 22,207 | $ | 18,160 | $ | 13,315 | |||||||
2013 | 2012 | 2011 | ||||||||||
| (In thousands) | ||||||||||||
U.S. Operations | $ | 21,882 | $ | 19,836 | $ | 16,017 | ||||||
Foreign Operations | 2,606 | 2,371 | 2,143 | |||||||||
| $ | 24,488 | $ | 22,207 | $ | 18,160 | |||||||
Income tax expense consisted of the following components:
2013 | 2012 | 2011 | ||||||||||
| (In thousands) | ||||||||||||
Federal: | ||||||||||||
Current | $ | 7,169 | $ | 5,488 | $ | 4,018 | ||||||
Deferred | 195 | 1,140 | 1,170 | |||||||||
Total | $ | 7,364 | $ | 6,628 | $ | 5,188 | ||||||
Foreign: | ||||||||||||
Current | $ | 716 | $ | 684 | $ | 606 | ||||||
Deferred | (7 | ) | (6 | ) | (1 | ) | ||||||
Total | $ | 709 | $ | 678 | $ | 605 | ||||||
State: | ||||||||||||
Current | $ | 1,020 | $ | 787 | $ | 609 | ||||||
Deferred | (89 | ) | (954 | ) | 194 | |||||||
Total | $ | 931 | $ | (167 | ) | $ | 803 | |||||
Total | $ | 9,004 | $ | 7,139 | $ | 6,596 | ||||||
| 2012 | 2011 | 2010 | ||||||||||
Federal: | ||||||||||||
| Current | $ | 5,488 | $ | 4,018 | $ | 3,450 | ||||||
| Deferred | 1,140 | 1,170 | 458 | |||||||||
| Total | $ | 6,628 | $ | 5,188 | $ | 3,908 | ||||||
Foreign: | ||||||||||||
| Current | $ | 684 | $ | 606 | $ | 477 | ||||||
| Deferred | (6 | ) | (1 | ) | 28 | |||||||
| Total | $ | 678 | $ | 605 | $ | 505 | ||||||
State: | ||||||||||||
| Current | $ | 787 | $ | 609 | $ | 275 | ||||||
| Deferred | (954 | ) | 194 | 128 | ||||||||
| Total | $ | (167 | ) | $ | 803 | $ | 403 | |||||
| Total | $ | 7,139 | $ | 6,596 | $ | 4,816 | ||||||
The difference between the Company’s income tax expense as reported in the accompanying consolidated financial statements and the income tax expense that would be calculated applying the U.S. federal income tax rate of 35% for 2013, 2012, and 2011 and 34% for 2010 on pretax income was as follows:
| 2012 | 2011 | 2010 | ||||||||||
| Expected federal income taxes | $ | 7,772 | $ | 6,356 | $ | 4,527 | ||||||
| Foreign tax rate differential | (203 | ) | (145 | ) | (59 | ) | ||||||
| U.S. tax graduated rates | 11 | (99 | ) | -- | ||||||||
| State income taxes, net of federal benefit and state tax credits | 552 | 522 | 257 | |||||||||
| Federal tax credits | (282 | ) | (132 | ) | (110 | ) | ||||||
| Uncertain tax positions | (73 | ) | 9 | 72 | ||||||||
Deferred tax adjustment due to change in state tax law | (661 | ) | -- | 138 | ||||||||
| Other | 23 | 85 | (9 | ) | ||||||||
| Total | $ | 7,139 | $ | 6,596 | $ | 4,816 | ||||||
2013 | 2012 | 2011 | ||||||||||
(In thousands) | ||||||||||||
Expected federal income taxes | $ | 8,571 | $ | 7,772 | $ | 6,356 | ||||||
Foreign tax rate differential | (226 | ) | (203 | ) | (145 | ) | ||||||
U.S. tax graduated rates | -- | 11 | (99 | ) | ||||||||
State income taxes, net of federal benefit and state tax credits | 605 | 552 | 522 | |||||||||
Federal tax credits | (217 | ) | (282 | ) | (132 | ) | ||||||
Uncertain tax positions | (43 | ) | (73 | ) | 9 | |||||||
Deferred tax adjustment due to change in state tax law | -- | (661 | ) | -- | ||||||||
Recapitalization expenses | 182 | -- | -- | |||||||||
Other | 132 | 23 | 85 | |||||||||
Total | $ | 9,004 | $ | 7,139 | $ | 6,596 | ||||||
Deferred tax assets and liabilities at December 31, 20122013 and 2011,2012, were comprised of the following:
| 2012 | 2011 | |||||||
| Deferred tax assets: | ||||||||
| Allowance for doubtful accounts | $ | 86 | $ | 108 | ||||
| Accrued expenses | 356 | 345 | ||||||
| Share based compensation | 859 | 1,449 | ||||||
| Capital loss carryforward | 1,132 | 1,268 | ||||||
| Net operating loss | 170 | 719 | ||||||
| Tax credit carryforward | 319 | -- | ||||||
| Gross deferred tax assets | 2,922 | 3,889 | ||||||
| Less Valuation Allowance | (1,138 | ) | (1,352 | ) | ||||
| Deferred tax assets | 1,784 | 2,537 | ||||||
| Deferred tax liabilities: | ||||||||
| Prepaid expenses | 324 | 142 | ||||||
| Property and equipment | 1,790 | 2,505 | ||||||
| Intangible assets | 6,415 | 6,506 | ||||||
| Other | 235 | 184 | ||||||
| Deferred tax liabilities | 8,764 | 9,337 | ||||||
| Net deferred tax liabilities | $ | (6,980 | ) | $ | (6,800 | ) | ||
2013 | 2012 | |||||||
(In thousands) | ||||||||
Deferred tax assets: | ||||||||
Allowance for doubtful accounts | $ | 63 | $ | 86 | ||||
Accrued expenses | 497 | 356 | ||||||
Share based compensation | 1,113 | 859 | ||||||
Capital loss carryforward | 1,124 | 1,132 | ||||||
Net operating loss | -- | 170 | ||||||
Tax credit carryforward | -- | 319 | ||||||
Other | 39 | -- | ||||||
Gross deferred tax assets | 2,836 | 2,922 | ||||||
Less Valuation Allowance | (1,124 | ) | (1,138 | ) | ||||
Deferred tax assets | 1,712 | 1,784 | ||||||
Deferred tax liabilities: | ||||||||
Prepaid expenses | 286 | 324 | ||||||
Property and equipment | 1,426 | 1,790 | ||||||
Intangible assets | 6,879 | 6,415 | ||||||
Other | 200 | 235 | ||||||
Deferred tax liabilities | 8,791 | 8,764 | ||||||
Net deferred tax liabilities | $ | (7,079 | ) | $ | (6,980 | ) | ||
At December 31, 20122013 and 2011,2012, net deferred tax assets of $547,000$53,000 and $789,000$547,000 respectively, were included in current deferred income taxes. At December 31, 20122013 and 2011,2012, net deferred tax liabilities of $7.5$7.1 million and $7.6$7.5 million, respectively, were included in long term deferred income taxes.
In assessing the realizability of deferred tax assets, the Company considers whether it is more likely than not that some portion, or all, of the deferred tax assets will not be realized. The ultimate realization of deferred tax assets is dependent upon the generation of future taxable income during the periods in which those temporary differences become deductible. The Company considers projected future taxable income, carry-back opportunities, and tax planning strategies in making this assessment. Based upon the level of historical taxable income and projections for future taxable income over the periods which the deferred tax assets are deductible, the Company believes it is more likely than not that it will realize the benefits of these deductible differences, net of the valuation allowance recorded. The net impact on income tax expense related to changes in the valuation allowance for 2013, 2012, and 2011, were $14,000, $214,000 and 2010, were $214,000, $0, and $2,000, respectively.
The Company has domestic capital loss carryforwards of $3.1 million at December 31, 2012. An additional $76,000 of carryforwards expired in 2012.2013. The total $3.1 million of the capital loss carryforwards relate to the pre-acquisition periods of acquired companies and are due to expire in 2014. The Company has provided a $1.1 million valuation allowance against the tax benefit associated with the capital loss carryforwards.
The undistributed foreign earnings of the Company’s foreign subsidiary of approximately $8.8$10.7 million are considered to be indefinitely reinvested. Accordingly, no provision for U.S. federal and state income taxes or foreign withholding taxes has been provided for such undistributed earnings. The Company estimated at December 31, 2012,2013, that an additional tax liability of $732,000$705,000 would become due if repatriation of undistributed earnings would occur.
The unrecognized tax benefit at December 31, 2012,2013, was $224,000,$188,000, excluding interest of $11,000$5,000 and no penalties. The full unrecognized tax benefits, if recognized, would favorably impact the effective income tax rate. The Company believes it is reasonably possible that the total amount of unrecognized tax benefits could continue to decrease during the next 12 months due to the expiration of the U.S. federal statute of limitations associated with certain other tax positions. The Company accrues interest and penalties related to uncertain tax position in the statements of income as income tax expense.
The change in the unrecognized tax benefits for
(In thousands) | ||||
| Balance of unrecognized tax benefits at December 31, 2010 | $ | 269 | ||
| Reductions due to lapse of applicable statue of limitations | (38 | ) | ||
| Additions based on tax positions of prior years | 3 | |||
| Additions based on tax positions related to the current year | 32 | |||
| Balance of unrecognized tax benefits at December 31, 2011 | $ | 266 | ||
| Reductions due to lapse of applicable statue of limitations | (117 | ) | ||
| Additions based on tax positions of prior years | 84 | |||
| Reductions based on tax positions of prior years | (9 | ) | ||
| Additions based on tax positions related to the current year | -- | |||
| Balance of unrecognized tax benefits at December 31, 2012 | $ | 224 | ||
(In thousands) | ||||
Balance of unrecognized tax benefits at December 31, 2011 | $ | 266 | ||
Reductions due to lapse of applicable statute of limitations | (117 | ) | ||
Additions based on tax positions of prior years | 84 | |||
Additions based on tax positions related to the current year | (9 | ) | ||
Balance of unrecognized tax benefits at December 31, 2012 | $ | 224 | ||
Reductions due to lapse of applicable statute of limitations | (91 | ) | ||
Additions based on tax positions of prior years | 27 | |||
Additions based on tax positions related to the current year | 28 | |||
Balance of unrecognized tax benefits at December 31, 2013 | $ | 188 | ||
The Company files a U.S. federal income tax return, various state jurisdictions and a Canada federal and provincial income tax return. The 20092010 to 20122013 U.S. federal and state returns remain open to examination. The 20082009 to 20122013 Canada federal and provincial income tax returns remain open to examination.
(6) Notes Payable
Notes payable consisted of the following:
| 2012 | 2011 | |||||||
| (In thousands) | ||||||||
| Revolving credit note with U.S. Bank, subject to borrowing base, matures June 30, 2013, maximum available $6.5 million | $ | -- | $ | -- | ||||
| Note payable to U.S. Bank refinanced as of July 2010 for $6.9 million, interest at a 3.79% fixed rate, 35 monthly principal and interest payments of $80,104, final balloon payment of interest and principal due July 31, 2013 | 5,143 | 5,951 | ||||||
| Note payable to U.S. Bank for $10 million, interest at a fixed rate of 3.79%, 35 monthly principal and interest payments of $121,190, final balloon payment of interest and principal due July 31, 2013 | 7,293 | 8,535 | ||||||
| Total notes payable | 12,436 | 14,486 | ||||||
| Less current portion | 12,436 | 1,861 | ||||||
| Note payable, net of current portion | $ | -- | $ | 12,625 | ||||
2013 | 2012 | |||||||
(In thousands) | ||||||||
Revolving credit note with U.S. Bank, maximum available $6.5 million subject to borrowing base, matures June 30, 2014 | $ | -- | $ | -- | ||||
Note payable to U.S. Bank for $11.8 million, interest at a 3.12% fixed rate, 60 monthly principal and interest payments of $212,468 through April 2018 | 10,324 | -- | ||||||
Notes payable to U.S. Bank, interest at a 3.79% fixed rate, monthly principal and interest payments of $201,294, with final balloon payment due July 31, 2013 | -- | 12,436 | ||||||
Total notes payable | 10,324 | 12,436 | ||||||
Less current portion | 2,256 | 12,436 | ||||||
Note payable, net of current portion | $ | 8,068 | $ | -- | ||||
The Company borrowed $9.0 million under ahad two term notenotes, which were used to partially finance acquisitions in 2008 and 2010. Borrowings under the acquisitionterm notes bore interest at an annual rate of MIV. In July 2010, the3.79%. The Company refinanced the existingthese two term loan with a $6.9 million fixed ratenotes on May 9, 2013, and combined them into one new term loan.note. The new term loannote is payable in 3560 monthly installments of $80,104 with a balloon payment of $4.8 million for the remaining principal balance and interest due on July 31, 2013.$212,468. Borrowings under the new term note bear interest at an annual rate of 3.79%3.12%.
The Company expects to refinance the term notes prior to July 31, 2013. If, however, the notes cannot be extended, the Company believes italso has adequate cash flows from operations to meet its debt and capital needs.
The term note and revolving credit note are secured by certain of the Company’s assets, including the Company’s land, building, accounts receivable and intangible assets. The term note and the revolving credit note contain various restrictions and covenants applicable to the Company, including requirements that the Company maintain certain financial ratios at prescribed levels and restrictions on the ability of the Company to consolidate or merge, create liens, incur additional indebtedness or dispose of assets. As of December 31, 2013, the Company was in compliance with the financial covenants.
The remaining note payable maturities for each year subsequent to December 31, 2013, are as follows:
Total | 2014 | 2015 | 2016 | 2017 | 2018 | |||||||||||||||||||
| (In thousands) | ||||||||||||||||||||||||
Notes payable | $ | 10,324 | $ | 2,256 | $ | 2,328 | $ | 2,402 | $ | 2,480 | $ | 858 | ||||||||||||
(7) Share-Based Compensation
The Company measures and recognizes compensation expense for all share-based payments based on the grant-date fair value of those awards. All of the Company’s existing stock option awards and non-vested stock awards have been determined to be equity-classified awards.
In August 2001, the Board of Directors adopted, and on May 1, 2002, the Company’s shareholders approved, the National Research Corporation 2001 Equity Incentive Plan (“2001 Equity Incentive Plan”). The 2001 Equity Incentive Plan provides for the granting of stock options, stock appreciation rights, restricted stock, performance shares and other share-based awards and benefits up to an aggregate of 600,0001,800,000 shares of the Company’sclass A common stock and 300,000 shares of class B common stock. OptionsStock options granted may be either nonqualified or incentive stock options. OptionsStock options vest over one to five years following the date of grant and option terms are generally five to ten years following the date of grant. At December 31, 2012, there were 38,897 shares available for issuance pursuantDue to future grants underthe expiration of the 2001 Equity Incentive Plan.plan, at December 31, 2013, there were no shares of stock available for future grants. The Company has accounted for grants of 561,1031,683,309 class A and 280,552 class B options and restricted stock under the 2001 Equity Incentive Plan using the date of grant as the measurement date for financial accounting purposes.
The National Research CorporationCompany’s 2004 Non-Employee Director Stock Plan (the “2004 Director Plan”) is a nonqualified plan that provides for the granting of options with respect to 550,0001,650,000 shares of the Company’sclass A common stock and 275,000 shares of class B common stock. The 2004 Director Plan provides for grants of nonqualified stock options to each director of the Company who is not employed by the Company. On the date of each annual meeting of shareholders of the Company, options to purchase 12,00036,000 shares of the Company’sclass A common stock and 6,000 shares of class B common stock are granted to directors that are re-elected or retained as a director at such meeting. OptionsStock options vest one year following the date of grant and option terms are generally ten years following the date of grant, or three years in the case of termination of the outside director’s service. At December 31, 2012,2013, there were 133,000255,000 shares of class A common stock and 42,500 shares of class B common stock available for issuance pursuant to future grants under the 2004 Director Plan. The Company has accounted for grants of 417,0001,395,000 class A and 232,500 class B options under the 2004 Director Plan using the date of grant as the measurement date for financial accounting purposes.
In February 2006, the Board of Directors adopted, and on May 4, 2006, the Company’s shareholders approved the National Research Corporation 2006 Equity Incentive Plan (the “2006 Equity Incentive Plan”). The 2006 Equity Incentive Plan provides for the granting of stock options, stock appreciation rights, restricted stock, performance shares and other share-based awards and benefits up to an aggregate of 600,0001,800,000 shares of the Company’sclass A common stock and 300,000 shares of class B common stock. OptionsStock options granted may be either incentive stock options or nonqualified stock options. Vesting terms vary with each grant and option terms are generally five to ten years. Options vest over one to five years following the date of grant and options terms are generally five to ten years following the date of grant. At December 31, 2012,2013, there were 373,9331,033,455 shares of class A common stock and 172,242 shares of class B common stock available for issuance pursuant to future grants under the 2006 Equity Incentive Plan. The Company has accounted for grants of 226,067766,545 class A and 127,758 class B options and restricted stock under the 2006 Equity Incentive Plan using the date of grant as the measurement date for financial accounting purposes.
The Company granted options to purchase 79,630, 166,008 and 273,812232,344 shares of the Company’s class A common stock and 38,718 shares of the class B common stock during the yearstwelve-month period ended December 31, 2013. During the same period in 2012, the Company granted options to purchase 238,890 shares of class A common stock and 39,815 shares of class B common stock, and during 2011 granted options to purchase 498,024 shares of class A common stock and 2010, respectively.83,004 shares of class B common stock. Options to purchase shares of common stock are typically granted with exercise prices equal to the fair value of the common stock on the date of grant. The Company does, in certain limited situations, grant options with exercise prices that exceed the fair value of the common shares on the date of grant. The fair value of stock options granted (pre-May 2013 Recapitalization) was estimated using a Black-Scholes valuation model with the following assumptions:
| 2012 | 2011 | 2010 | |||||||||
| Expected dividend yield at date of grant | 2.63 | to | 3.98% | 2.00 | to | 2.55% | 2.86 | to | 3.09% | ||
| Expected stock price volatility | 29.10 | to | 31.70% | 28.70 | to | 32.00% | 28.40 | to | 31.20% | ||
| Risk-free interest rate | 0.56 | to | 1.15% | 1.70 | to | 2.14% | 1.55 | to | 2.56% | ||
| Expected life of options (in years) | 4 | to | 6 | 4 | to | 6 | 4 | to | 6 | ||
2013 | 2012 | 2011 | ||||||||||||||||
Expected dividend yield at date of grant | 2.26 | to | 3.46% | 2.63 | to | 3.98% | 2.00 | to | 2.55% | |||||||||
Expected stock price volatility | 30.34 | to | 30.51% | 29.10 | to | 31.70% | 28.70 | to | 32.00% | |||||||||
Risk-free interest rate | 0.55 | to | 1.07% | 0.56 | to | 1.15% | 1.70 | to | 2.14% | |||||||||
Expected life of options (in years) | 4 | to | 6 | 4 | to | 6 | 4 | to | 6 | |||||||||
The risk-free interest rate assumptions were based on the U.S. Treasury yield curve in effect at the time of the grant. The expected volatility was based on historical monthly price changes of the Company’s stock based on the expected life of the options at the date of grant. The expected life of options is the average number of years the Company estimates that options will be outstanding. The Company considers groups of associates that have similar historical exercise behavior separately for valuation purposes.
The following table summarizes stock option activity under the Company’s 2001 and 2006 Equity Incentive Plans and the 2004 Director Plan for the year ended December 31, 2012:
Number of Options | Weighted Average Exercise Price | Weighted Average Remaining Contractual Terms (Years) | Aggregate Intrinsic Value (In thousands) | |||||||||||||
| Outstanding at beginning of period | 769,401 | $ | 25.73 | |||||||||||||
| Granted | 79,630 | $ | 45.28 | |||||||||||||
| Exercised | (262,101 | ) | $ | 22.77 | ||||||||||||
| Forfeited | (131,012 | ) | $ | 27.47 | ||||||||||||
| Outstanding at end of period | 455,918 | $ | 30.34 | 6.38 | $ | 10,877 | ||||||||||
| Exercisable at end of period | 208,423 | $ | 24.19 | 4.74 | $ | 6,254 | ||||||||||
Number of | Weighted Average Exercise Price | Weighted Average Remaining Contractual Terms (Years) | Aggregate Intrinsic Value (In thousands) | |||||||||||||
Class A | ||||||||||||||||
Outstanding at December 31, 2012 | 1,367,754 | $ | 8.45 | |||||||||||||
Granted | 232,344 | $ | 15.98 | |||||||||||||
Exercised | (155,253 | ) | $ | 3.36 | $ | 1,126 | ||||||||||
Forfeited | -- | -- | ||||||||||||||
Outstanding at December 31, 2013 | 1,444,845 | $ | 10.21 | 6.48 | $ | 12,438 | ||||||||||
Exercisable at December 31, 2013 | 693,975 | $ | 8.96 | 5.37 | $ | 6,846 | ||||||||||
Class B | ||||||||||||||||
Outstanding at December 31, 2012 | 227,959 | $ | 18.45 | |||||||||||||
Granted | 38,718 | $ | 29.35 | |||||||||||||
Exercised | (31,875 | ) | $ | 14.69 | $ | 992 | ||||||||||
Forfeited | -- | -- | ||||||||||||||
Outstanding at December 31, 2013 | 234,802 | $ | 20.76 | 6.54 | $ | 3,276 | ||||||||||
Exercisable at December 31, 2013 | 109,662 | $ | 18.85 | 5.43 | $ | 1,739 | ||||||||||
The weighted average grant date fair value of stock options granted during the years ended
December 31, 2013, 2012, and 2011, was $3.24, $2.43 andCash received from stock options exercised for the years ended December 31, 2013, 2012, and 2011 and 2010 was $840,000, $1.3 million, $568,000, and $274,000,$568,000, respectively. The actual tax benefit realized for the tax deduction from stock options exercised was $753,000, $2.0 million $350,000 and $43,000,$350,000, for the years ended December 31, 2013, 2012, and 2011, and 2010, respectively.
During 2012, 2011, and 2010, the Company granted 7,823, 39,50123,469 and 9,2383,912 non-vested shares of class A and class B common stock, respectively, under the 2006 Equity Incentive Plan. As of December 31, 2012,During 2011, the Company had 20,203granted 118,503 and 19,751 non-vested shares of class A and class B common stock, respectively, under the 2006 Equity Incentive Plan. No non-vested shares of common stock were granted during 2013. As of December 31, 2013, the Company had 60,609 and 10,101 non-vested shares of class A and class B common stock, respectively, outstanding under the 2006 Equity Incentive Plan. These shares vest over one to five years following the date of grant and holders thereof are entitled to receive dividends from the date of grant, whether or not vested. The fair value of the awards is calculated as the fair market value of the shares on the date of grant. The Company recognized $140,000, $74,000 $143,000 and $108,000$143,000 of non-cash compensation for the years ended December 31, 2013, 2012, 2011, and 2010,2011, respectively, related to this non-vested stock.
The following table summarizes information regarding non-vested stock granted to associates under the 2001 and 2006 Equity Incentive Plans for the year ended December 31, 2012:
| Shares Outstanding | Weighted Average Grant Date Fair Value Per Share | |||||||
| Outstanding at beginning of period | 30,002 | $ | 30.57 | |||||
| Granted | 7,823 | $ | 38.35 | |||||
| Forfeitures | (11,181 | ) | $ | 32.31 | ||||
| Vested | (6,441 | ) | $ | 24.22 | ||||
| Outstanding at end of period | 20,203 | $ | 34.65 | |||||
| Class A Shares Outstanding | Class A Weighted Average Grant Date Fair Value Per Share | Class B Shares Outstanding | Class B Weighted Average Grant Date Fair Value Per Share | |||||||||||||
Outstanding at December 31, 2012 | 60,609 | $ | 5.77 | 10,101 | $ | 34.65 | ||||||||||
Granted | -- | -- | -- | -- | ||||||||||||
Vested | -- | -- | -- | -- | ||||||||||||
Forfeited | -- | -- | -- | -- | ||||||||||||
Outstanding at December 31, 2013 | 60,609 | $ | 5.77 | 10,101 | $ | 34.65 | ||||||||||
(8) Restructuring and Severance Costs
The Company records restructuring liabilities that represent charges incurred in connection with consolidations, including operations from acquisitions. These charges consist primarily of severance costs. Severance charges are based on various factors including the employee’s length of service, contract provisions, and salary levels. Expense for one-time termination benefits are accrued over each individual’s service period. The Company records the expense using its best estimate based upon detailed analysis. Although significant changes are not expected, actual costs may differ from these estimates.
In 2011, the Company vacated its office in Wausau, Wisconsin, and reached agreements to terminate the operating lease for its Wausau office and other services. As a result, the Company made lump-sum payments totaling $280,000, which were included in selling, general and administrative expenses in 2011.
2010 Restructuring Plan One-time Termination Benefits | 2010 Restructuring Plan Contract Terminations | OCS One-time Termination Benefits | Total | |||||||||||||
| (In thousands) | ||||||||||||||||
| Balance, Restructuring liability at December 31, 2009 | $ | -- | $ | -- | $ | -- | $ | -- | ||||||||
| Severance assumed in OCS acquisition | -- | -- | 333 | 333 | ||||||||||||
| Accrual for severance and employee related costs | 143 | -- | 14 | 157 | ||||||||||||
| Payments | (106 | ) | -- | (333 | ) | (439 | ) | |||||||||
| Balance, Restructuring liability at December 31, 2010 | $ | 37 | $ | -- | $ | 14 | $ 51_ | |||||||||
| Accrual for Contract Terminations | -- | 280 | -- | 280 | ||||||||||||
| Payments | (37 | ) | (280 | ) | (14 | ) | (331 | ) | ||||||||
| Balance, Restructuring liability at December 31, 2011 and 2012 | $ | -- | $ | -- | $ | -- | $ | --_ | ||||||||
(9) Leases
The Company leases printing equipment in the United States, and office space in Canada, California, Nebraska and Washington. The Company also leased office space in Wisconsin through February 2011. The Company recorded rent expense in connection with its operating leases of $720,000, $715,000, and $986,000 in 2013, 2012, and $691,000 in 2012, 2011, and 2010, respectively. The Company also has capital leases for production, mailing and computer equipment.
Payments under non-cancelable operating leases and capital leases at December 31, 2013 are:
As of December 31, | Capital Leases | Operating Leases | ||||||
| (In thousands) | ||||||||
| 2013 | $ | 135 | $ | 687 | ||||
| 2014 | 135 | 591 | ||||||
| 2015 | 102 | 584 | ||||||
| 2016 | 8 | 341 | ||||||
| 2017 | -- | 233 | ||||||
| Total minimum lease payments | 380 | |||||||
| Less: Amount representing interest | 53 | |||||||
| Present value of minimum lease payments | 327 | |||||||
| Less: Current maturities | 102 | |||||||
| Capital lease obligations, net of current portion | $ | 225 | ||||||
| Year Ending December 31, | Capital | Operating Leases | ||||||
(In thousands) | ||||||||
2014 | $ | 137 | $ | 782 | ||||
2015 | 104 | 753 | ||||||
2016 | 9 | 507 | ||||||
2017 | -- | 324 | ||||||
2018 | -- | 202 | ||||||
Thereafter | -- | 14 | ||||||
Total minimum lease payments | 250 | |||||||
Less: Amount representing interest | 28 | |||||||
Present value of minimum lease payments | 222 | |||||||
Less: Current maturities | 114 | |||||||
Capital lease obligations, net of current portion | $ | 108 | ||||||
(10) Related Party
A Board member of the Company also serves as an officer of Ameritas Life Insurance Corp. In connection with the Company’s regular assessment of its insurance-based associate benefits and the costs associated therewith, in 2007 the Company began purchasing dental insurance for certain of its associates from Ameritas Life Insurance Corp. and, in 2009, the Company also began purchasing vision insurance for certain of its associates from Ameritas Life Insurance Corp. The total value of these purchases was $212,000, $198,000 and $166,000 in 2013, 2012 and $146,000 in 2012, 2011 and 2010 respectively.
The Company leased office space for OCS from EPIC Property Management LLC from August 2010 through June 2011. A former owner of OCS and an associate of the Company during the lease term was a co-owner of EPIC Property Management LLC. The total of the rental and utility payments under the lease for the year ended December 31, 2011, was $103,000 and for the year ended December 31, 2010, was $84,000.
Michael Hays, our Chief Executive Officer, is a director and owner of 14% of the equity interests of Nebraska Global Investment Company LLC. In 2012, the Company purchased certain technology consulting and software development services from Nebraska Global Investment Company LLC. The total value of these purchases was $55,000.$57,000 and $55,000 in 2013 and 2012 respectively. The Company did not have any transactions with Nebraska Global Investment Company LLC during 2011 or 2010.
(11) Associate Benefits
The Company sponsors a qualified 401(k) plan covering substantially all associates with no eligibility service requirement. Under the 401(k) plan, the Company matches 25.0% of the first 6.0% of compensation contributed by each associate. Employer contributions, which are discretionary, vest to participants at a rate of 20% per year. The Company contributed $252,000, $236,000 and $182,000 in 2013, 2012 and $168,000 in 2012, 2011, and 2010, respectively, as a matching percentage of associate 401(k) contributions.
(12) Segment Information
2013 | 2012 | 2011 | ||||||||||
(In thousands) | ||||||||||||
Revenue: | ||||||||||||
United States | $ | 85,863 | $ | 79,895 | $ | 70,074 | ||||||
Canada | 6,727 | 6,526 | 5,693 | |||||||||
Total | $ | 92,590 | $ | 86,421 | $ | 75,767 | ||||||
Long-lived assets: | ||||||||||||
United States | $ | 71,139 | $ | 72,817 | ||||||||
Canada | 3,383 | 3,414 | ||||||||||
Total | $ | 74,522 | $ | 76,231 | ||||||||
Total assets: | ||||||||||||
United States | $ | 97,982 | $ | 87,670 | ||||||||
Canada | 13,014 | 12,376 | ||||||||||
Total | $ | 110,996 | $ | 100,046 | ||||||||
| 2012 | 2011 | 2010 | ||||||||||
| (In thousands) | ||||||||||||
| Revenue: | ||||||||||||
| United States | $ | 79,895 | $ | 70,074 | $ | 58,598 | ||||||
| Canada | 6,526 | 5,693 | 4,800 | |||||||||
| Total | $ | 86,421 | $ | 75,767 | $ | 63,398 | ||||||
| Long-lived assets: | ||||||||||||
| United States | $ | 72,817 | $ | 75,355 | ||||||||
| Canada | 3,414 | 3,184 | ||||||||||
| Total | $ | 76,231 | $ | 78,539 | ||||||||
| Total assets: | ||||||||||||
| United States | $ | 87,670 | $ | 90,253 | ||||||||
| Canada | 12,376 | 10,423 | ||||||||||
| Total | $ | 100,046 | $ | 100,676 | ||||||||
Item 9.Changes in and Disagreements with Accountants on Accounting and Financial Disclosure
Not applicable.
Item 9A. Controls and Procedures
Evaluation of Disclosure Controls and Procedures
In accordance with Rule 13a-15(b) of the Securities Exchange Act of 1934 (the “Exchange Act”), the Company’s management evaluated, with the participation of the Company’s Chief Executive Officer and the Company’s Chief Financial Officer, the effectiveness of the design and operation of the Company’s disclosure controls and procedures (as defined in Rule 13a-15(e) and 15d-15(e) under the Exchange Act) as of December 31, 2012.2013. Based upon their evaluation of these disclosure controls and procedures, the Chief Executive Officer and the Chief Financial Officer concluded that the disclosure controls and procedures were effective as of December 31, 2012.
Management’s Report on Internal Control over Financial Reporting
The Company’s management is responsible for establishing and maintaining adequate internal control over financial reporting (as defined in Rule 13a-15(f) of the Exchange Act). The Company’s internal control over financial reporting is designed to provide reasonable assurance regarding the reliability of financial reporting and the preparation of financial statements for external purposes in accordance with generally accepted accounting principles. Because of its inherent limitations, however, internal control over financial reporting may not prevent or detect misstatements. Also, projections of any evaluation of effectiveness to future periods are subject to the risk that controls may become inadequate because of changes in conditions, or that the degree of compliance with the policies of procedures may deteriorate.
The Company’s management, with the participation of the Company’s Chief Executive Officer and Chief Financial Officer, has evaluated the effectiveness of the Company’s internal control over financial reporting using the framework inInternal Control – Integrated Framework (1992) issued by the Committee of Sponsoring Organizations of the Treadway Commission. Based on such evaluation, the Company’s management concluded that the Company’s internal control over financial reporting was effective as of December 31, 2012.2013.
The effectiveness of the Company’s internal control over financial reporting as of December 31, 2012,2013, has been audited by KPMG LLP, an independent registered public accounting firm, as stated in their report, a copy of which is included in this Annual Report on Form 10-K.
Changes in Internal Control over Financial Reporting
There was no change in the Company’s internal control over financial reporting that occurred during the quarter ended December 31, 2012,2013, that has materially affected, or is reasonably likely to materially affect, the Company’s internal control over financial reporting.
Item 9B. Other Information
The Company has no other information to report pursuant to this item.
Report of Independent Registered Public Accounting Firm
The Board of Directors and Shareholders
National Research Corporation:
We have audited theNational Research Corporation and subsidiary’s (the Company) internal control over financial reporting of National Research Corporation and subsidiary (the Company) as of December 31, 2012,2013, based on criteria established inInternal Control – Integrated Framework (1992) issued by the Committee of Sponsoring Organizations of the Treadway Commission (COSO). The Company’s management is responsible for maintaining effective internal control over financial reporting and for its assessment of the effectiveness of internal control over financial reporting, included in the accompanying Management’s Report on Internal Control Over Financial Reporting. Our responsibility is to express an opinion on the Company’s internal control over financial reporting based on our audit.
We conducted our audit in accordance with the standards of the Public Company Accounting Oversight Board (United States). Those standards require that we plan and perform the audit to obtain reasonable assurance about whether effective internal control over financial reporting was maintained in all material respects. Our audit included obtaining an understanding of internal control over financial reporting, assessing the risk that a material weakness exists, and testing and evaluating the design and operating effectiveness of internal control based on the assessed risk. Our audit also included performing such other procedures as we considered necessary in the circumstances. We believe that our audit provides a reasonable basis for our opinion.
A company’s internal control over financial reporting is a process designed to provide reasonable assurance regarding the reliability of financial reporting and the preparation of financial statements for external purposes in accordance with generally accepted accounting principles. A company’s internal control over financial reporting includes those policies and procedures that (1) pertain to the maintenance of records that, in reasonable detail, accurately and fairly reflect the transactions and dispositions of the assets of the company; (2) provide reasonable assurance that transactions are recorded as necessary to permit preparation of financial statements in accordance with generally accepted accounting principles, and that receipts and expenditures of the company are being made only in accordance with authorizations of management and directors of the company; and (3) provide reasonable assurance regarding prevention or timely detection of unauthorized acquisition, use, or disposition of the company’s assets that could have a material effect on the financial statements.
Because of its inherent limitations, internal control over financial reporting may not prevent or detect misstatements. Also, projections of any evaluation of effectiveness to future periods are subject to the risk that controls may become inadequate because of changes in conditions, or that the degree of compliance with the policies or procedures may deteriorate.
In our opinion, National Research Corporation and subsidiary maintained, in all material respects, effective internal control over financial reporting as of December 31, 2012,2013, based on criteria established inInternal Control – Integrated Framework (1992) issued by the Committee of Sponsoring Organizations of the Treadway Commission.Commission (COSO).
We also have audited, in accordance with the standards of the Public Company Accounting Oversight Board (United States), the consolidated balance sheets of the Company as of December 31, 20122013 and 2011,2012, and the related consolidated statements of operations,income, comprehensive income, shareholders’ equity, and cash flows for each of the years in the three-year period ended December 31, 2012,2013, and our report dated March 1, 20134, 2014 expressed an unqualified opinion on those consolidated financial statements.
/s/ KPMG LLP
Lincoln, Nebraska
March 4, 2014
PART III
Item 10. Directors, Executive Officers and Corporate Governance
The information required by this Item with respect to directors and Section 16 compliance is included under the captions “Election of Directors” and “Section 16(a) Beneficial Ownership Reporting Compliance,” respectively, in the Company’s definitive Proxy Statement for its 20132014 Annual Meeting of Shareholders (“Proxy Statement”) and is hereby incorporated herein by reference. Information with respect to the executive officers of the Company appears in Item 1 of this Annual Report on Form 10-K. The information required by this Item with respect to audit committees and audit committee financial experts is included under the caption “Corporate Governance” in the Proxy Statement and is incorporated herein by reference.
The Company has adopted a Code of Business Conduct and Ethics that applies to all of the Company’s associates, including the Company’s Chief Executive Officer, Chief Financial Officer, Vice President of Finance and other persons performing similar functions. The Company has posted a copy of the Code of Business Conduct and Ethics on its website at www.nationalresearch.com.www.nationalresearch.com, and such Code of Business Conduct and Ethics is available, in print, without change, to any shareholder who requests it from the Company’s Secretary. The Company intends to satisfy the disclosure requirements under Item 5.05 of Form 8-K regarding amendments to, or waivers from, the Code of Business Conduct and Ethics by posting such information on its website at www.nationalresearch.com.www.nationalresearch.com. The Company is not including the information contained on its website as part of, or incorporating it by reference into, this report.
Item 11. Executive Compensation
The information required by this Item is included under the captions “Compensation Discussion and Analysis,” “2012“2013 Summary Compensation Table,” “Grants of Plan-Based Awards in 2012,2013,” “Outstanding Equity Awards at December 31, 2012,2013,” “2012“2013 Director Compensation,” “Compensation Committee Report” and “Corporate Governance-Transactions with Related Persons” in the Proxy Statement and is hereby incorporated herein by reference.
Item 12. Security Ownership of Certain Beneficial Owners and Management and RelatedShareholder Matters
The information required by this Item with respect to security ownership of certain beneficial owners and management is included under the caption “Principal Shareholders” in the Proxy Statement and is hereby incorporated by reference.
The following table sets forth information with respect to compensation plans under which equity securities of the Company are authorized for issuance as of December 31, 2012.
| Plan Category | Number of securities to be issued upon the exercise of outstanding options, warrants and rights | Weighted-average exercise price of outstanding options, warrants and rights | Number of securities remaining available for future issuance under equity compensation plans (excluding securities reflected in the first column) | |||||||||
Equity compensation plans approved by security holders (1) | 455,918 | $ | 30.34 | 545,830 | (2) | |||||||
| Equity compensation plans not approved by security holders | -- | -- | -- | |||||||||
| Total | 455,918 | $ | 30.34 | 545,830 | ||||||||
Plan Category Class A shares | Number of securities to be issued upon the exercise of outstanding options, warrants and rights | Weighted-average exercise price of outstanding options, warrants and rights | Number of securities remaining available for future issuance under equity compensation plans (excluding securities reflected in the first column) | |||||||||
Equity compensation plans approved by security holders (1) | 1,444,845 | $ | 10.21 | 1,288,455 | (2) | |||||||
Equity compensation plans not approved by security holders | -- | -- | -- | |||||||||
Total | 1,444,845 | $ | 10.21 | 1,288,455 | ||||||||
Plan Category Class B shares | Number of securities to be issued upon the exercise of outstanding options, warrants and rights | Weighted-average exercise price of outstanding options, warrants and rights | Number of securities remaining available for future issuance under equity compensation plans (excluding securities reflected in the first column) | |||||||||
Equity compensation plans approved by security holders (1) | 234,802 | $ | 20.76 | 212,742 | (2) | |||||||
Equity compensation plans not approved by security holders | -- | -- | -- | |||||||||
Total | 234,802 | $ | 20.76 | 212,742 | ||||||||
(1) | Includes the Company’s 2006 Equity Incentive Plan, 2004 Director Plan, and the 2001 Equity Incentive Plan. |
(2) | Under the 2006 Equity Incentive Plan, the Company had authority to award up to |
Item 13.Certain Relationships and RelatedRealted Transactions, and Director Independence
The information required by this Item is included under the caption “Corporate Governance” in the Proxy Statement and is hereby incorporated by reference.
Item 14.Principal Accountant Fees and Services
The information required by this Item is included under the caption “Miscellaneous — Independent Registered Public Accounting Firm” in the Proxy Statement and is hereby incorporated by reference.
PART IV
Item 15.
Exhibits, Financial Statement Schedules1. | Consolidated financial statements. The consolidated financial statements listed in the accompanying index to the consolidated financial statements and financial statement schedule are filed as part of this Annual Report on Form 10-K. |
2. | Financial statement schedule. The financial statement schedule listed in the accompanying index to the consolidated financial statements and financial statement schedule is filed as part of this Annual Report on Form 10-K. |
3. | Exhibits. The exhibits listed in the accompanying exhibit index are filed as part of this Annual Report on Form 10-K. |
NATIONAL RESEARCH CORPORATION AND SUBSIDIARY
Schedule II — VALUATION AND QUALIFYING ACCOUNTS
(In thousands)
Balance at Beginning of Year | Acquisition | Bad Debt Expense | Write-offs Net of Recoveries | Balance at End of Year | ||||||||||||||||
| Allowance for doubtful accounts: | ||||||||||||||||||||
| Year Ended December 31, 2010 | 279 | 42 | 39 | 23 | 337 | |||||||||||||||
| Year Ended December 31, 2011 | 337 | 0 | 80 | 128 | 289 | |||||||||||||||
| Year Ended December 31, 2012 | 289 | 0 | 173 | 218 | 244 | |||||||||||||||
Balance at Beginning of Year | Bad Debt Expense | Write-offs Net of Recoveries | Balance at End of Year | |||||||||||||
Allowance for doubtful accounts: | ||||||||||||||||
Year Ended December 31, 2011 | 337 | 80 | 128 | 289 | ||||||||||||
Year Ended December 31, 2012 | 289 | 173 | 218 | 244 | ||||||||||||
Year Ended December 31, 2013 | 244 | 145 | 206 | 183 | ||||||||||||
See accompanying report of independent registered public accounting firm.
INDEX TO CONSOLIDATED FINANCIAL STATEMENTS
AND FINANCIAL STATEMENT SCHEDULE
Page in this Form 10-K | ||
Report of Independent Registered Public Accounting Firm | 29 |
Consolidated Balance Sheets as of December 31, | 30 |
Consolidated Statements of Income for the Three Years Ended December 31, | 31 |
Consolidated Statements of Comprehensive Income for the Three Years Ended December 31, | 32 |
| Consolidated Statements of Shareholders’ Equity for the Three Years Ended December 31, | 33 | ||
Consolidated Statements of Cash Flows for the Three Years Ended December 31, | 34 |
Notes to Consolidated Financial Statements | 35 |
Schedule II — Valuation and Qualifying Accounts | 60 |
All other financial statement schedules are omitted since the required information is not present or is not present in amounts sufficient to require submission of the schedules, or because the information required is included in the consolidated financial statements and notes thereto.
SIGNATURES
Pursuant to the requirements of Section 13 or 15(d) of the Securities Exchange Act of 1934, the Registrant has duly caused this report to be signed on its behalf by the undersigned, thereunto duly authorized, on this 1st4th day of March 2013.
NATIONAL RESEARCH CORPORATION | |||
By: | /s/ Michael D. Hays | ||
Michael D. Hays | |||
Chief Executive Officer | |||
Pursuant to the requirements of the Securities Exchange Act of 1934, this report has been signed below by the following persons on behalf of the Registrant and in the capacities and on the dates indicated.
Signature | Title | Date | ||
/s/ Michael D. Hays Michael D. Hays | Chief Executive Officer and Director (Principal | |||
| Executive Officer) | March 4, 2014 | |||
/s/ Kevin R. Karas Kevin R. Karas | Senior Vice President Finance, Chief Financial | |||
| Officer, Treasurer and Secretary (Principal Financial and Accounting Officer) | March 4, 2014 | |||
/s/ JoAnn M. Martin | ||||
JoAnn M. Martin | Director | March 4, 2014 | ||
/s/ John N. Nunnelly John N. Nunnelly | Director | March 4, 2014 | ||
/s/ Paul C. Schorr III | Director | March | ||
/s/ Gail L. Warden | ||||
Gail L. Warden | Director | March 4, 2014 |
EXHIBIT INDEX
Exhibit Number |
|
(3.1) | Amended and Restated Articles of |
(3.2) | |
By-Laws of National Research Corporation, as amended to date [Incorporated by reference to Exhibit (3.2) to National Research Corporation’s Current Report on Form 8-K dated May | |
(4.1) | |
Installment | |
(10.1)* | |
National Research Corporation 2001 Equity Incentive Plan [Incorporated by reference to Appendix A to National Research Corporation’s Proxy Statement for the 2002 Annual Meeting of Shareholders, filed with the Securities and Exchange Commission on April 3, 2002 (File No. 0-29466)] | |
(10.2)* | |
National Research Corporation 2006 Equity Incentive Plan, | |
(10.3)* | |
National Research Corporation 2004 Non-Employee Director Stock Plan, as amended [Incorporated by reference to Exhibit | |
(10.4)* | |
Form of Nonqualified Stock Option Agreement (for new associates) used in connection with the 2001 Equity Incentive Plan [Incorporated by reference to Exhibit 4.4 to National Research Corporation’s Registration Statement on Form S-8 (Registration No. 333-120530)] | |
(10.5)* | |
Form of Nonqualified Stock Option Agreement (for officers) used in connection with the 2001 Equity Incentive Plan [Incorporated by reference to Exhibit 4.5 to National Research Corporation’s Registration Statement on Form S-8 (Registration No. 333-120530)] | |
(10.6)* | |
Form of Restricted Stock Agreement for executive officers used in connection with the 2001 Equity Incentive Plan [Incorporated by reference to Exhibit 10.2 to National Research Corporation’s Current Report on Form 8-K dated March 19, 2005 (File No. 0-29466)] | |
(10.7)* | |
Form of Restricted Stock Agreement (one year vesting) used in connection with the 2001 Equity Incentive Plan [Incorporated by reference to Exhibit 4.6 to National Research Corporation’s Registration Statement on Form S-8 (Registration No. 333-120530)] | |
(10.8)* | |
Form of Restricted Stock Agreement (five year vesting) used in connection with the 2001 Equity Incentive Plan [Incorporated by reference to Exhibit 4.7 to National Research Corporation’s Registration Statement on Form S-8 (Registration No. 333-120530)] | |
(10.9)* | |
Form of Nonqualified Stock Option Agreement used in connection with the 2006 Equity Incentive Plan [Incorporated by reference to Exhibit (10.14) to National Research Corporation’s Annual Report on Form 10-K for the year ended December 31, 2006 (File No. 0-29466)] | |
(10.10)* | |
Form of Restricted Stock Agreement used in connection with the 2006 Equity Incentive Plan [Incorporated by reference to Exhibit (10.15) to National Research Corporation’s Annual Report on Form 10-K for the year ended December 31, 2006 (File No. 0-29466)] |
| Exhibit Number | Exhibit Description |
[Incorporated by reference to Exhibit (10.15) to National Research Corporation’s Annual Report on Form 10-K for the year ended December 31, 2006 (File No. 0-29466)] | |
(21) | Subsidiary of National Research Corporation |
(23) | |
Consent of Independent Registered Public Accounting Firm | |
(31.1) | |
Certification of the Chief Executive Officer pursuant to Section 302 of the Sarbanes-Oxley Act of 2002 | |
(31.2) | |
Certification of the Chief Financial Officer pursuant to Section 302 of the Sarbanes-Oxley Act of 2002 | |
(32) | |
Certification of Periodic Financial Report by the Chief Executive Officer and Chief Financial Officer pursuant to Section 906 of the Sarbanes-Oxley Act of 2002 |
(99) | |
Proxy Statement for the | |
(101)** | Financial statements from the Annual Report on Form 10-K of National Research Corporation for the year ended December 31, |
____________________
* | A management contract or compensatory plan or arrangement. |
** |
In accordance with Rule 406T of Regulation S-T, the information in these exhibits shall not be deemed to be “filed” for purposes of Section 18 of the Securities Exchange Act of 1034, as amended, or otherwise subject to liability under that section, and shall not be incorporated by reference into any registration statement or other document filed under the Securities Act of 1933, as amended, except as expressly set forth by specific reference in such filing. |
64