Most of our manufacturing partners are located in China. In addition, we have established a facilitymanufacturing and testing facilities in China, initially for the testing of our ICs.China. The Chinese government has broad discretion and authority to regulate the technology industry in China. China’s government has implemented policies from time to timetime-to-time to regulate economic expansion in China. It also exercises significant control over China’s economic growth through the allocation of resources, controlling payment of foreign currency-denominated obligations, setting monetary policy and providing preferential treatment to particular industries or companies. New regulations or the readjustment of previously implemented regulations could require us and our manufacturing partners to change our business plans, increase our costs, or limit our ability to sell products and conduct activities in China, which could adversely affect our business and operating results.
In addition, the Chinese government and provincial and local governments have provided, and continue to provide, various incentives to encourage the development of the semiconductor industry in China. Such incentives include tax rebates, reduced tax rates, favorable lending policies and other measures, some or all of which may be available to our manufacturing partners and to us with respect to our facilityfacilities in China. Any of these incentives could be reduced or eliminated by governmental authorities at any time. Any such reduction or elimination of incentives currently provided to our manufacturing partners could adversely affect our business and operating results.
There are inherent risks associated with the operation of our manufacturing and testing facilityfacilities in China, which could increase product costs or cause a delay in product shipments.
We have amanufacturing and testing facilityfacilities in China that began operations in 2006. In addition to the risks discussed elsewhere in this annual report on Form 10-K, weWe face the following risks, among others, with respect to our testing facilityoperations in China:
inability to hire and maintain a qualified workforce;
inability to maintain appropriate and acceptable manufacturing controls; and.and
higher than anticipated overhead and other costs of operation.
If we are unable to maintain our testing facilityfacilities in China at fully operational status with qualified workers, appropriate manufacturing controls and reasonable cost levels, we may incur higher costs than our current expense levels, which would affect our gross margins. In addition, if capacity restraints result in significant delays in product shipments, our business and results of operations would be adversely affected.
The average selling prices of products in our markets have historically decreased over time and will likely do so in the future, which could harm our revenuesrevenue and gross profits.
Average selling prices of semiconductor products in the markets we serve have historically decreased over time. Our gross profits and financial results will suffer if we are unable to offset any reductions in our average selling prices by reducing our costs, developing new or enhanced products on a timely basis with higher selling prices or gross profits, or increasing our sales volumes. Additionally, because we do not operate our own wafer manufacturing or assembly facilities, we may not be able to reduce our costs as rapidly as companies that operate their own facilities, and our costs may even increase, which could also reduce our profit margins.
Because of the lengthy sales cycles for our products and the fixed nature of a significant portion of our expenses, we may incur substantial expenses before we earn associated revenue and may not ultimately achieve our forecasted sales for our products.
The introduction of new products presents significant business challenges because product development plans and expenditures mustmay be made up to two years or more in advance of any sales. It generally takes us up to 12 months or more to design and manufacture a new product prototype. Only after we have a prototype do we introduce the product to the market and begin selling efforts in an attempt to achieve design wins. This sales process requires us to expend significant sales and marketing resources without any assurance of success. Volume production of products that use our ICs, if any, may not be achieved for an additional period of time after an initial sale. Sales cycles for our products are lengthy for a number of reasons, including:
our customers usually complete an in-depth technical evaluation of our products before they place a purchase order;
the commercial adoption of our products by OEMs and ODMs is typically limited during the initial release of their producttheirproduct to evaluate product performance and consumer demand;
our products must be designed into a customer’s productour customers’ products or system;systems; and
the development and commercial introduction of our customers’ products incorporating new technologies frequently arefrequentlyare delayed.
As a result of our lengthy sales cycles, we may incur substantial expenses before we earn associated revenue because a significant portion of our operating expenses is relatively fixed and based on expected revenue. The lengthy sales cycles of our products also make forecasting the volume and timing of orders difficult. In addition, the delays inherent in lengthy sales cycles raise additional risks that customers may cancel or change their orders. Our sales are made by purchase orders. Because industry practice allows customers to reschedule or cancel orders on relatively short notice, backlog is not always a good indicator of our future sales. If customer cancellations or product changes occur, we could lose anticipated sales and not have sufficient time to reduce our inventory and operating expenses.
Our success depends on our investment of significant amount of resources in research and development. We may have to invest more resources in research and development than anticipated, which could increase our operating expenses and negatively impact our operating results.
Our success depends on us investing significant amounts of resources into research and development. Our research and development expenses as a percent of our total revenue were 22.8% and 22.7% for the year ended December 31, 2012 and 2011, respectively. We expect to have to continue to invest heavily in research and development in the future in order to continue to innovate and come to market with new products in a timely manner and increase our revenue and profitability. If we have to invest more resources in research and development than we anticipate, we could see an increase in our operating expenses which may negatively impact our operating results. Also, if we are unable to properly manage and effectively utilize our research and development resources, we could see material adverse effects on our business, financial condition and operating results.
In addition, if new competitors, technological advances by existing competitors, our entry into new markets, or other competitive factors require us to invest significantly greater resources than anticipated in our research and development efforts, our operating expenses would increase. If we are required to invest significantly greater resources than anticipated in research and development efforts without a corresponding increase in revenue, our operating results could decline. Research and development expenses are likely to fluctuate from time to time to the extent we make periodic incremental investments in research and development and these investments may be independent of our level of revenue, which could negatively impact our financial results. In order to remain competitive, we anticipate that we will continue to devote substantial resources to research and development, and we expect these expenses to increase in absolute dollars in the foreseeable future due to the increased complexity and the greater number of products under development.
The loss of any of our key personnel or the failure to attract or retain specialized technical and management personnel couldaffect our operations orimpair our ability to grow our business.
Our future success depends upon our ability to attract and retain highly qualified technical and managerial personnel. We are particularly dependent on the continued services of our key executives, including Michael Hsing, our President and Chief Executive Officer, who founded our company and developed our proprietary process technology. In addition, personnel with highly skilled analog and mixed-signal design engineering expertise are scarce and competition for personnel with these skills is intense. There can be no assurance that we will be able to retain existing key employees or that we will be successful in attracting, integrating or retaining other highly qualified personnel with critical capabilities in the future. If we are unable to retain the services of existing key employees or are unsuccessful in attracting new highly qualified employees quickly enough to meet the demands orof our business, including design cycles, our business could be harmed.
If we fail to retain key employees in our sales, applications, finance and legal staff or to make continued improvements to our internal systems, particularly in the accounting and finance area, our business may suffer.
If we fail to continue to adequately staff our sales, applications, financial and legal staff, maintain or upgrade our business systems and maintain internal controlscontrol that meet the demands of our business, our ability to operate effectively will suffer. The operation of our business also depends upon our ability to retain these employees, as these employees hold a significant amount of institutional knowledge about us and our products, and, if they were to terminate their employment, our sales and internal control over financial reporting could be adversely affected.
We intend to continue to expand our operations, which may strain our resources and increase our operating expenses.
We plan to continue to expand our domestic and foreign operations through internal growth, strategic relationships, and/or acquisitions. We expect that any such expansion will strain our systems and operational and financial controls. In addition, we are likely to incur significantly higher operating costs. To manage our growth effectively, we must continue to improve and expand our systems and controls, as well as hire experienced administrative and financial personnel. If we fail to do so, our growth will be limited. If we fail to effectively manage our planned expansion of operations, our business and operating results may be harmed.
We may engagenot realize the anticipated benefits of any company or business that we acquire. In addition,acquisitionscould result in future acquisitions that dilute dilutingthe ownership interests of our stockholders, reduce our cash balances,and cause us to incur debt or to assume contingent liabilities, and we may be unable to successfully integrate these companies into our operations, which wouldcould adversely affect our business.
As a part of our business strategy, from time to time we review acquisition prospects that would complement our current product offerings, enhance our design capability or offer other competitive opportunities. In the eventFor example, we completed our acquisition of futureSensima Technology SA in July 2014 to further our diversification strategy and create new opportunities with key customers. As a result of completing acquisitions, we could use a significant portion of our available cash, cash equivalents and short-term investments, issue equity securities whichthat would dilute current stockholders’ percentage ownership, incur substantial debt or contingent liabilities, and/orand incur impairment charges related to goodwill or other acquisition-related intangibles. Such actions by us could impact our operating results and/orand the price of our common stock.
In addition, we may be unable to identify or complete prospective acquisitionacquisitions for various reasons, including competition from other companies in the semiconductor industry, the valuation expectations of acquisition candidates and applicable antitrust laws or related regulations. If we are unable to identify and complete acquisitions, we may not be able to successfully expand our business and product offerings.
We cannot guarantee that the extentSensima acquisition or any future acquisitions will improve our results of operations or that we are successful in completing strategic acquisitions,will otherwise realize the anticipated benefits of any acquisitions. In addition, if we are unsuccessful in integrating any acquired company or business into our operations or if integration is more difficult than anticipated, we may experience disruptions that could harm our business and notresult in our failure to realize the anticipated benefits of the acquisitions. Some of the risks that may adversely affect our ability to integrate or realize any anticipated benefits from the acquired companies, businesses or assets include those associated with:
unexpected losses of key employees or customers of the acquired companies or businesses;
conforming the acquired company’s standards, processes, procedures and controls with our operations;
coordinating new product and process development;
hiring additional management and other critical personnel;
increasing the scope, geographic diversity and complexity of our operations;
difficulties in consolidating facilities and transferring processes and know-how;
difficulties in the assimilation of acquired operations, technologies or products;
the risk of undisclosed liabilities of the acquired businesses and potential legal disputes with founders or stockholders ofstockholdersof acquired companies;
our inability to commercialize acquired technologies;
the risk that the future business potential as projected is not realized and as a result, we may be required to take a chargeacharge to earnings that would impact our profitability;
• | the need to take impairment charges or write-downs with respect to acquired assets and technologies; | |
• | difficulties in assessing the fair value of earn-out arrangements; |
diversion of management’s attention from other business concerns; and
adverse effects on existing business relationships with customers.
We compete against many companies with substantially greater financial and other resources, and our market share may be reduced if we are unable to respond to our competitors effectively.
The analog and mixed-signal semiconductor industry is highly competitive, and we expect competitive pressures to continue. Our ability to compete effectively and to expand our business will depend on our ability to continue to recruit applications and design talent, our ability to introduce new products, and our ability to maintain the rate at which we introduce these new products. We compete with domestic and non-domestic semiconductor companies, many of which have substantially greater financial and other resources with which to pursue engineering, manufacturing, marketing, and distribution of their products. We are in direct and active competition, with respect to one or more of our product lines, with at least 10many manufacturers of such products, of varying size and financial strength. The number of our competitors has grown due to the expansion of the market segments in which we participate. We consider our competitors to include, but not be limited to: Fairchild Semiconductor, Intersil, Linear, Maxim Integrated Products, Micrel, Microsemi, National Semiconductor, O2Micro, RichTek, Rohm, Semtech, STMicroelectronic, Texas Instruments and Volterra. We expect continued competition from existing competitors as well as competition from new entrants in the semiconductor market.
We cannot assure you that our products will continue to compete favorably, or that we will be successful in the face of increasing competition from new products and enhancements introduced by existing competitors or new companies entering this market, which would materially and adversely affect our results of operations and our financial condition.
If securities or industry analysts downgrade our stock or do not continue to publish research or reports about our business, our stock price and trading volume could decline.
The trading market for our common stock will depend, in part, on the research and reports that industry or securities analysts publish about us or our business. We do not have any control over these analysts. If one or more of the analysts who cover us downgrade our stock, our stock price would likely decline. If one or more of these analysts cease coverage of us or fail to regularly publish reports on us, we could lose visibility in the financial markets, which in turn could cause our stock price or trading volume to decline.
Major earthquakes or other natural disasters and resulting systems outages may cause us significant losses.
Our corporate headquarters, the production facilities of our third-party wafer suppliers, our IC testing facility,and manufacturing facilities, a portion of our assembly and research and development activities, and certain other critical business operations are located in or near seismically active regions and are subject to periodic earthquakes. We do not maintain earthquake insurance and could be materially and adversely affected in the event of a major earthquake. Much of our revenue, as well as our manufacturers and assemblers, are concentrated in Asia.Asia, particularly in China. Such concentration increases the risk that other natural disasters, labor strikes, terrorism, war, political unrest, epidemics, and/or health advisories could disrupt our operations. In addition, we rely heavily on our internal information and communications systems and on systems or support services from third parties to manage our operations efficiently and effectively. Any of these are subject to failure due to a natural disaster or other disruption. System-wide or local failures that affect our information processing could have material adverse effects on our business, financial condition, operating results and cash flows.
ITEM 1B. UNRESOLVED STAFF COMMENTS
None.
ITEM 2. PROPERTIES
Our primary operating locationsoperations are currentlylocated in San Jose, California and Chengdu, China. Up until May 2012, we were leasing approximately 55,110 square feet in San Jose, which served as our corporate headquarters, as well as our sales and research and development center. Certain test procedures and manufacturing also took place in our San Jose facility. The landlord exercised their right to terminate the lease which required us to seek new headquartersWe occupy an owned facility before May 1, 2012 deadline.
We lease a facility with approximately 56,00060,000 square feet in Chengdu, China, which serves as our test facility and manufacturing hubhub. In September 2015, we exercised our option to purchase this facility and expect to close the transaction in the first half of 2016. In addition, we constructed a 150,000 square footsquare-foot research and development facility in Chengdu, China, which was put into operation in October 2010.
In November 2015, we entered into an agreement to purchase three units of an office building with approximately 6,600 square feet in Shanghai, China. The space is primarily used for sales and marketing and research and development functions. The transaction was closed in January 2016.
We also lease other sales and research and development offices in China, Europe, Japan, Korea, Singapore, Taiwan and the United States, Japan, China, Taiwan and Korea.States. We believe that our existing facilities are adequate for our current operations.
ITEM 3. LEGAL PROCEEDINGS
We are partiesa party to actions and proceedings incident to the Company's business in the ordinary course of business, including litigation regarding itsour shareholders a former employee and itsour intellectual property, challenges to the enforceability or validity of itsour intellectual property, and claims that the Company’sour products infringe on the intellectual property rights of others.others, and employment matters. These proceedings often involve complex questions of fact and law and may require the expenditure of significant funds and the diversion of other resources to prosecute and defend. The Company defends itselfWe defend ourselves vigorously against any such claims.
O2 Micro
As of California issued an order finding O2 Micro International, Ltd. (“O2 Micro”) liable for approximately $9.1 million in attorneys’ fees and non-taxable costs, plus interest, in connection with the patent litigation that the Company won in 2010. This award is in addition to the approximately $0.3 million in taxable costs that the Court had earlier ordered O2 Micro to pay to the Company in connection with the same lawsuit. The Court then entered judgment for the Company. In October 2012, O2 Micro filed an appeal against this judgment.
ITEM 4. MINE SAFETY DISCLOSURES
Not applicable.
PART II
ITEM 5. Market for the Registrant’s CommonCommon Equity, Related StockholdersStockholder Matters and Issuer Purchases of Equity Securities.
Market Price of Our Common Stock
Our common stock is traded on the Nasdaq Global Select Market under the symbol “MPWR”.“MPWR.” The following table sets forth for the periods indicated, the high and low closing sales price per share of our common stock on the Nasdaq Global Select Market. These prices represent quotations among dealers without adjustments for retail mark-ups, markdowns or commissions, and may not represent prices of actual transactions.
| 2012 | High | Low | ||||||
| Fourth quarter ended December 31, 2012 | $ | 22.38 | $ | 17.17 | ||||
| Third quarter ended September 30, 2012 | $ | 23.07 | $ | 17.07 | ||||
| Second quarter ended June 30, 2012 | $ | 22.40 | $ | 17.70 | ||||
| First quarter ended March 31, 2012 | $ | 19.91 | $ | 14.58 | ||||
| 2011 | ||||||||
| Fourth quarter ended December 31, 2011 | $ | 15.61 | $ | 9.49 | ||||
| Third quarter ended September 30, 2011 | $ | 15.64 | $ | 10.16 | ||||
| Second quarter ended June 30, 2011 | $ | 18.56 | $ | 13.41 | ||||
| First quarter ended March 31, 2011 | $ | 17.12 | $ | 12.95 |
High | Low | |||||||
2015 | ||||||||
First quarter | $ | 56.12 | $ | 45.80 | ||||
Second quarter | $ | 54.95 | $ | 49.96 | ||||
Third quarter | $ | 52.12 | $ | 45.28 | ||||
Fourth quarter | $ | 68.88 | $ | 50.42 | ||||
2014: | ||||||||
First quarter | $ | 38.86 | $ | 31.36 | ||||
Second quarter | $ | 42.48 | $ | 35.14 | ||||
Third quarter | $ | 47.78 | $ | 40.77 | ||||
Fourth quarter | $ | 50.44 | $ | 34.47 | ||||
Holders of Our Common Stock
As of February 20, 2013, 22, 2016, there were 16
Dividend Policy
In June 2014, our Board declared MPS’s first ever cashof Directors approved a dividend of $1.00 per shareprogram pursuant to stockholders of record as of December 21, 2012. The cash dividend was paid on December 28, 2012 and totaled approximately $35.7 million. Other than this dividend,which we have not paidintend to pay quarterly cash dividends on our common stock since our inception. We currently do not anticipate paying any furtherstock. Stockholders of record as of the last day of the quarter are entitled to receive the quarterly cash dividends when and if declared by our Board of Directors, which are generally payable on the 15th of the following month. Our Board of Directors declared the following cash dividends (in thousands, except per-share amounts):
Dividend Declared per Share | Total Amount | |||||||
2015: | ||||||||
First quarter | $ | 0.20 | $ | 7,854 | ||||
Second quarter | $ | 0.20 | $ | 7,925 | ||||
Third quarter | $ | 0.20 | $ | 7,901 | ||||
Fourth quarter | $ | 0.20 | $ | 7,938 | ||||
2014: | ||||||||
Second quarter | $ | 0.15 | $ | 5,817 | ||||
Third quarter | $ | 0.15 | $ | 5,823 | ||||
Fourth quarter | $ | 0.15 | $ | 5,826 | ||||
The declaration of any future cash dividends is at the discretion of our Board of Directors and will depend on, among other things, our financial condition, results of operations, capital requirements, business conditions, statutory requirements of Delaware law, compliance with the terms of future indebtedness and credit facilities and other factors that our Board of Directors may deem relevant, as well as a determination that cash dividends are in the future.
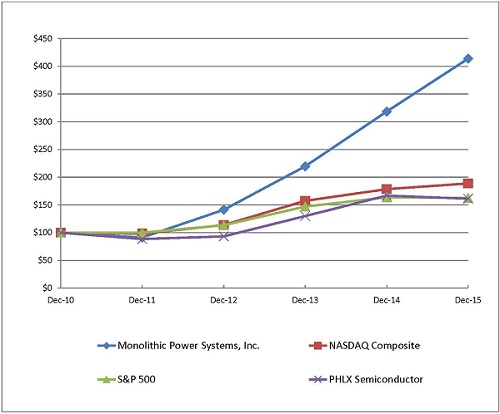
Performance of Our Common Stock
The following graph compares the cumulative 60-monthfive-year total return provided shareholders on our common stock relative to the cumulative total returns of the Nasdaq Composite Index, the S & P&P 500 Index and the Philadelphia Semiconductor Index. An investment of $100 (with reinvestment of all dividends) is assumed to have been made in our common stock on December 31, 20072010 and its relative performance is tracked through December 31, 2012.

|
The information contained in the Stock Performance Graphstock performance graph section shall not be deemed to be “soliciting material” or “filed” or incorporated by reference in future filings with the SEC, or subject to the liabilities of Section 18 of the Exchange Act, except to the extent that the Company specifically incorporates it by reference into a document filed under the Securities Act of 1933, as amended, or the Securities Exchange Act of 1934, as amended.
Recent SalesPurchases of UnregisteredEquity Securities by the Issuer and Affiliated Purchasers
Stock repurchase activity during the yearthree months ended December 31, 2012.
Total Number of Shares Purchased (a) | Average Price Paid per Share | Total Number of Shares Purchased as Part of Publicly Announced Program | Dollar Value of Shares That May Yet Be Purchased Under the Program (b) | |||||||||||||
October 1 - October 31 | �� | 11 | $ | 52.14 | 11 | |||||||||||
November 1 - November 30 | - | $ | - | - | ||||||||||||
December 1 - December 31 | - | $ | - | - | ||||||||||||
Total | 11 | $ | - | 11 | $ | - | ||||||||||
(a) | In July 2013, the Board of Directors approved a stock repurchase program that authorized us to repurchase up to $100 million in the aggregate of our common stock through June 30, 2015. In April 2015, the Board of Directors approved an extension of the program through December 31, 2015. Under the program, shares may be repurchased in privately negotiated or open market transactions, including undera Rule 10b5-1 plan. Shares were retired upon repurchase. |
(b) | The stock repurchase program expired on December 31, 2015, with a remaining balance of $5.9 million. In February 2016, the Board of Directors approved a new stock repurchase program that authorizes us to repurchase up to $50 million in the aggregate of our common stock through December 31, 2016. |
ITEM 6. SELECTED FINANCIAL DATA
The following selected consolidated financial data is derived from our audited annualshould be read in conjunction with ''Management's Discussion and Analysis of Financial Condition and Results of Operations'' and the consolidated financial statements and the notes thereto included elsewhere in this Annual Report on Form 10-K to fully understand factors that may affect the comparability of the information presented below. We derived the selected consolidated balance sheet data as of December 31, 2015 and 2014, and the consolidated statement of operations data for the years ended December 31, 2012, 2011, 2010, 20092015, 2014 and 2008. You should read the following table in conjunction with the2013 from our audited consolidated financial statements and the relatedaccompanying notes contained elsewhereincluded in this reportAnnual Report on Form 10-K. OperatingThe consolidated balance sheet data as of December 31, 2013, 2012 and 2011, and the consolidated statement of operations data for each of the years ended December 31, 2012 and 2011 are derived from our audited consolidated financial statements which are not included in this report.Operating results for any year are not necessarily indicative of results to be expected for any future periods.
Consolidated Statement of Operations Data:
| Year ended December 31, | ||||||||||||||||||||
| 2012 | 2011 | 2010 | 2009 | 2008 | ||||||||||||||||
| (in thousands, except per share amounts) | ||||||||||||||||||||
| Revenue | $ | 213,813 | $ | 196,519 | $ | 218,840 | $ | 165,008 | $ | 160,511 | ||||||||||
| Cost of revenue (1) | 100,665 | 94,925 | 97,383 | 67,330 | 61,184 | |||||||||||||||
| Gross profit | 113,148 | 101,594 | 121,457 | 97,678 | 99,327 | |||||||||||||||
| Operating expenses: | ||||||||||||||||||||
| Research and development (2) | 48,796 | 44,518 | 44,372 | 38,295 | 34,850 | |||||||||||||||
| Selling, general and administrative (3) | 50,018 | 40,280 | 41,169 | 36,752 | 35,256 | |||||||||||||||
| Litigation expense (benefit), net | (2,945 | ) | 3,379 | 5,418 | 9,457 | 6,714 | ||||||||||||||
| Patent litigation settlement (provision reversal) | - | - | - | (6,356 | ) | - | ||||||||||||||
| Total operating expenses | 95,869 | 88,177 | 90,959 | 78,148 | 76,820 | |||||||||||||||
| Income from operations | 17,279 | 13,417 | 30,498 | 19,530 | 22,507 | |||||||||||||||
| Interest income and other, net | 611 | 309 | 922 | 618 | 2,935 | |||||||||||||||
| Income before income taxes | 17,890 | 13,726 | 31,420 | 20,148 | 25,442 | |||||||||||||||
| Income tax provision | 2,134 | 425 | 1,857 | 474 | 1,216 | |||||||||||||||
| Net income | $ | 15,756 | $ | 13,301 | $ | 29,563 | $ | 19,674 | $ | 24,226 | ||||||||||
| Basic net income per share | $ | 0.45 | $ | 0.39 | $ | 0.83 | $ | 0.57 | $ | 0.72 | ||||||||||
| Diluted net income per share | $ | 0.43 | $ | 0.38 | $ | 0.78 | $ | 0.54 | $ | 0.67 | ||||||||||
| Weighted average common shares outstanding: | ||||||||||||||||||||
| Basic | 34,871 | 34,050 | 35,830 | 34,310 | 33,509 | |||||||||||||||
| Diluted | 36,247 | 35,160 | 37,826 | 36,634 | 36,120 | |||||||||||||||
| (1) Includes stock-based compensation expense | $ | 510 | $ | 312 | $ | 393 | $ | 246 | $ | 344 | ||||||||||
| (2) Includes stock-based compensation expense | 6,922 | 5,909 | 6,742 | 6,408 | 5,821 | |||||||||||||||
| (3) Includes stock-based compensation expense | 11,220 | 6,905 | 9,675 | 7,957 | 6,993 | |||||||||||||||
| Total stock-based compensation expense | $ | 18,652 | $ | 13,126 | $ | 16,810 | $ | 14,611 | $ | 13,158 | ||||||||||
Year Ended December 31, | ||||||||||||||||||||
2015 | 2014 | 2013 | 2012 | 2011 | ||||||||||||||||
(in thousands, except per share amounts) | ||||||||||||||||||||
Revenue | $ | 333,067 | $ | 282,535 | $ | 238,091 | $ | 213,813 | $ | 196,519 | ||||||||||
Cost of revenue | 152,898 | 129,917 | 110,190 | 100,665 | 94,925 | |||||||||||||||
Gross profit | 180,169 | 152,618 | 127,901 | 113,148 | 101,594 | |||||||||||||||
Operating expenses: | ||||||||||||||||||||
Research and development | 65,787 | 58,590 | 49,733 | 48,796 | 44,518 | |||||||||||||||
Selling, general and administrative | 72,312 | 66,755 | 54,624 | 50,018 | 40,280 | |||||||||||||||
Litigation expense (benefit), net | 1,000 | (8,027 | ) | (371 | ) | (2,945 | ) | 3,379 | ||||||||||||
Total operating expenses | 139,099 | 117,318 | 103,986 | 95,869 | 88,177 | |||||||||||||||
Income from operations | 41,070 | 35,300 | 23,915 | 17,279 | 13,417 | |||||||||||||||
Interest and other income, net | 1,421 | 1,092 | 92 | 611 | 309 | |||||||||||||||
Income before income taxes | 42,491 | 36,392 | 24,007 | 17,890 | 13,726 | |||||||||||||||
Income tax provision | 7,319 | 897 | 1,109 | 2,134 | 425 | |||||||||||||||
Net income | $ | 35,172 | $ | 35,495 | $ | 22,898 | $ | 15,756 | $ | 13,301 | ||||||||||
Net income per share: | ||||||||||||||||||||
Basic | $ | 0.89 | $ | 0.92 | $ | 0.61 | $ | 0.45 | $ | 0.39 | ||||||||||
Diluted | $ | 0.86 | $ | 0.89 | $ | 0.59 | $ | 0.43 | $ | 0.38 | ||||||||||
Weighted-average shares outstanding: | ||||||||||||||||||||
Basic | 39,470 | 38,686 | 37,387 | 34,871 | 34,050 | |||||||||||||||
Diluted | 40,869 | 39,793 | 38,620 | 36,247 | 35,160 | |||||||||||||||
Cash dividends declared per common share | $ | 0.80 | $ | 0.45 | $ | - | $ | 1.00 | $ | - | ||||||||||
Consolidated Balance Sheet Data:
| As of December 31, | ||||||||||||||||||||
| 2012 | 2011 | 2010 | 2009 | 2008 | ||||||||||||||||
| (in thousands) | ||||||||||||||||||||
| Cash and cash equivalents | $ | 75,104 | $ | 96,371 | $ | 48,010 | $ | 46,717 | $ | 83,266 | ||||||||||
| Short-term investments | 85,521 | 77,827 | 129,709 | 118,914 | 21,922 | |||||||||||||||
| Long-term investments | 11,755 | 13,675 | 19,180 | 19,445 | 37,425 | |||||||||||||||
| Restricted cash | - | - | - | - | 7,360 | |||||||||||||||
| Working capital | 190,841 | 185,435 | 195,403 | 179,577 | 117,365 | |||||||||||||||
| Total assets | 287,162 | 273,867 | 281,603 | 241,821 | 195,299 | |||||||||||||||
| Long-term tax liabilities | 5,408 | 4,920 | 5,015 | 4,915 | 4,762 | |||||||||||||||
| Common stock | 194,079 | 159,336 | 178,269 | 175,518 | 147,298 | |||||||||||||||
| Total stockholders' equity | 258,294 | 242,877 | 246,895 | 212,957 | 164,645 | |||||||||||||||
| Cash dividend per common share: | ||||||||||||||||||||
| Declared | $ | 1.00 | $ | - | $ | - | $ | - | $ | - | ||||||||||
| Paid | $ | 1.00 | $ | - | $ | - | $ | - | $ | - | ||||||||||
December 31, | ||||||||||||||||||||
2015 | 2014 | 2013 | 2012 | 2011 | ||||||||||||||||
(in thousands) | ||||||||||||||||||||
Cash and cash equivalents | $ | 90,860 | $ | 126,266 | $ | 101,213 | $ | 75,104 | $ | 96,371 | ||||||||||
Short-term investments | $ | 144,103 | $ | 112,452 | $ | 125,126 | $ | 85,521 | $ | 77,827 | ||||||||||
Long-term investments | $ | 5,361 | $ | 5,389 | $ | 9,860 | $ | 11,755 | $ | 13,675 | ||||||||||
Total assets | $ | 431,285 | $ | 399,366 | $ | 368,908 | $ | 287,162 | $ | 273,867 | ||||||||||
Common stock | $ | 265,763 | $ | 240,500 | $ | 234,201 | $ | 194,079 | $ | 159,336 | ||||||||||
Total stockholders' equity | $ | 368,516 | $ | 346,425 | $ | 323,399 | $ | 258,294 | $ | 242,877 | ||||||||||
Working capital (1) | $ | 288,645 | $ | 271,051 | $ | 253,304 | $ | 190,840 | $ | 185,014 | ||||||||||
(1) | In November 2015, the Financial Accounting Standards Board issued Accounting Standards Update No. 2015-17, Balance Sheet Classification of Deferred Taxes, whichrequires that all deferred tax assets and liabilities, including related valuation allowance, be classified as non-current on the balance sheets. We early adopted this standard retrospectively and reclassified the current deferred tax assets to non-current deferred tax assets on our consolidated balance sheets data for all periods presented. |
ITEM 7. MANAGEMENT’S DISCUSSION AND ANALYSIS OF FINANCIAL CONDITION AND RESULTS OF OPERATIONS
The following discussion should be read in conjunction with the consolidated financial statements and related notes which appear elsewhereunder Item 8 in this annual reportAnnual Report on Form 10-K.
Overview
We are a fabless semiconductorleading company that designs, develops,in high performance power solutions. Founded in 1997, we design and markets proprietary, advanced analogprovide small, highly energy efficient, easy-to-use power solutions for systems found in industrial applications, telecommunication infrastructures, cloud computing, automotive, and mixed-signal semiconductors. We currently offer products that serve multiple markets, including consumer electronics, communications, computing (which includes storage) and industrial markets.applications. Our mission is to reduce total energy consumption in our customers' systems with green, practical, compact solutions. We believe that we differentiate ourselves by offering solutions that are more highly integrated, smaller in size, more energy efficient, more accurate with respect to performance specifications and, consequently, more cost-effective than many competing solutions. We plan to continue to introduce additional new products within our existing product families, as well as in new innovative product categories.
We operate in the cyclical semiconductor industry where there is seasonal demand for certain of our products. We are not and will not be immune from current and future industry downturns, but we have targeted product and market areas that we believe have the ability to offer above average industry performance over the long term.
We work with third parties to manufacture and assemble our integrated circuits (“ICs”). This has enabled us to limit our capital expenditures and fixed costs, while focusing our engineering and design resources on our core strengths.
Following the introduction of a product, our sales cycle generally takes a number of quarters to achieve revenue and volume production is usually achieved several months after we receive an initial customer order for a new product.product to ramp up. Typical lead time for orders is fewer than 90 days. These factors, combined with the fact that orders in the semiconductor industry can typically be cancelled or rescheduled without significant penalty to the customer, make the forecasting of our orders and revenue difficult.
We derive most of our revenue from sales through distribution arrangements orand direct sales to customers in Asia, where the componentsproducts we produce are incorporated into an end-user product. For the years ended December 31, 2012 and 2011, 89% and 90%, respectively, of ourproducts. Our revenue was attributable tofrom direct or indirect sales to customers in Asia.Asia was 91%, 91% and 90% for the years ended December 31, 2015, 2014 and 2013, respectively. We derive a majority of our revenue from the sales of our DC to DC converter product family which servicesserves the consumer electronics, communications, storage and computing, (which includes storage)consumer and industrial markets. We believe our ability to achieve revenue growth will depend, in part, on our ability to develop new products, enter new market segments, gain market share, manage litigation risk, diversify our customer base and successfully secure manufacturing capacity.
In July 2014, we completed the acquisition of Sensima Technology SA (“Sensima”), a company located in Switzerland that develops magnetic sensors for angle measurements as well as three-dimensional magnetic field sensing.Sensima became a subsidiary of MPS and changed its name to MPS Tech Switzerland Sarl. The acquisition creates new opportunities with customers by offering enhanced solutions in power management for key industries such as automotive, industrial and cloud computing. The purchase consideration consisted of an upfront cash payment of $11.7 million and additional consideration that is contingent upon Sensima achieving a new product introduction and certain revenue and direct margin goals in 2016, with a fair value of $2.5 million at the date of acquisition. In addition, key employees received $1.7 million of time-based restricted stock units and up to $8.0 million of performance-based restricted stock units in connection with the transaction. These equity awards are considered arrangements for post-acquisition services and the related compensation expense is recognized over the requisite service period if it is probable that the performance goals will be met. The results of operations of Sensima have been included in our consolidated financial statements subsequent to the acquisition date.
Critical Accounting Policies and Estimates
Our discussion and analysis of our financial condition and results of operations are based upon our consolidated financial statements, which have been prepared in accordance with generally accepted accounting principles in the U.S. The preparation of these financial statements requires us to make estimates and judgments that affect the reported amount of assets, liabilities, revenue and expenses, and related disclosure of contingent assets and liabilities. We evaluate our estimates on an on-going basis, including those related to revenue recognition, stock-based compensation, long-term investments, short-term investments, inventories, income taxes, warranty obligationsvaluation of goodwill and intangible assets, and contingencies. We base our estimates on historical experience and on various other assumptions that are believed to be reasonable under the circumstances, the results of which form the basis for making the judgments about the carrying values of assets and liabilities that are not readily apparent from other sources. Estimates and judgments used in the preparation of our financial statements are, by their nature, uncertain and unpredictable, and depend upon, among other things, many factors outside of our control, such as demand for our products and economic conditions. Accordingly, our estimates and judgments may prove to be incorrect and actual results may differ, perhaps significantly, from these estimates.
We believe the following critical accounting policies reflect our more significant judgments used in the preparation of our consolidated financial statements.
Revenue Recognition. Recognition
We recognize revenue in accordance with Financial Accounting Standards Board (“FASB”) – Accounting Standards Codification (“ASC”) 605-10-S25 Revenue Recognition – Overall – Recognition. ASC 605-10-S25 requires thatwhen the following four basic criteria must be met before revenue can be recognized:are met: (1) persuasive evidence of an arrangement exists; (2) delivery has occurred or services have been rendered; (3) the fee is fixed or determinable; and (4) collectability is reasonably assured. Determination of criteria (3) and (4) are based on management’s judgment regarding the fixed nature of the feefees charged for products delivered and the collectability of those fees. The application of these criteria has resulted in ourus generally recognizing revenue upon shipment (when title passes)and risk of loss have transferred to customers. Should changescustomers), including distributors, original equipment manufacturers and electronic manufacturing service providers.
Our revenue consists primarily of sales of assembled and tested finished goods. We also sell die in conditions cause managementwafer form to determine these criteria are not met for certain future transactions,our customers and value-added resellers, and we receive royalty revenue recognized for any reporting period could be adversely impacted.
For the years ended December 31, 2015, 2014 and 2013, approximately 96%, 92% and 91% of our distributor sales, respectively, including sales to our value-added resellers, for the year ended December 31, 2012 were made through distribution arrangements with third parties. These arrangements generally do not include any special payment terms (our normal payment terms are 30-45 days for our distributors), price protection or exchange rights. Returns are limited to our standard product warranty. Certain of our large distributors have contracts that include limited stock rotation rights that permit the return of a small percentage of the previous six months’ purchases.
For the years ended December 31, 2015, 2014 and 2013, approximately 4%, 8% and 9% of our distributor sales, for the year ended December 31, 2012respectively, were made through small distributors primarily based on purchase orders. These distributors alsotypically have limited or no stock rotation rights.
We generally recognize revenue consists primarilyupon shipment of sales of assembled and tested finished goods. We also sell die in wafer formproducts to our customers and value-added resellers, and we receive royalty revenue from third parties and value-added resellers.
(1) | The price is fixed or determinable at the date of sale. We do not offer special payment terms, price protection orprice adjustments to distributors when we recognize revenue upon shipment. | |
(2) | The distributors are obligated to pay us and this obligation is not contingent on the resale of our products. | |
(3) | The distributors’ obligation is unchanged in the event of theft or physical destruction or damage to the products. | |
(4) | The distributors have stand-alone economic substance apart from our relationship. | |
(5) | We do not have any obligations for future performance to directly bring about the resale of our productsby the distributors. | |
(6) | The amount of future returns can be reasonably estimated. We have the ability and the information necessary totrack inventory sold to and held at our distributors. We maintain a history of returns and have the ability to estimatethe stock rotation returns on a quarterly basis. |
We maintain a sales reserve for stock rotation rights, which is based on historical experience of actual stock rotation returns on a per distributor basis, where available, and information related to products in the distribution channel. This reserve is recorded at the time of sale. Historically, these returns were not material to our consolidated financial statements. In the future, if we are unable to estimate our stock rotation returns accurately, we may not be able to recognize revenue from sales to our distributors based on when we sell inventory to our distributors. Instead, we may have to recognize revenue when the distributor sells through such inventory to an end-customer.
If we enter into arrangements that have rights of return that are not estimable, we recognize revenue under such arrangements only after the distributor hasdistributors have sold ourthe products to an end customer.
Inventory Valuation.Valuation
We value our inventory at the lower of the standard cost (which approximates actual cost on a first-in, first-out basis) or its current estimated market value. We write down inventory for obsolescence or lack of demand, based on assumptions about future demand and market conditions. If actual market conditions are less favorable than those projected by management, additional inventory write-downs may be required. Conversely, if market conditions are more favorable, inventory may be sold that was previously reserved.
Valuation of Goodwill and Acquisition-Related Intangible Assets
We evaluate intangible assets with finite lives for impairment whenever events or changes in circumstances indicate that an impairment may exist. We perform an annual impairment assessment for goodwill and intangible assets with indefinite lives in the fourth quarter, or more frequently if indicators of potential impairment exist. Impairment of intangible assets is recognized based on the difference between the fair value of the assets and their carrying value. Impairment for goodwill occurs if the fair value of a reporting unit including goodwill is less than its carrying value and is recognized based on the difference between the implied fair value of the reporting unit’s goodwill and the carrying value of the goodwill. The assumptions and estimates used to determine future value of goodwill and intangible assets are complex and subjective. They can be affected by various factors, including external factors such as industry and economic trends, and internal factors such as changes in our business strategy and revenue forecasts. If there is a significant adverse change in our business in the future, including macroeconomic and market conditions, we may be required to record impairment charges on our goodwill and acquisition-related intangible assets.
Accounting for Income Taxes.Taxes ASC 740-10 Income Taxes – Overall prescribes a recognition threshold and measurement attribute for the financial statement recognition and measurement of a tax position taken or expected to be taken in a tax return. This interpretation also provides guidance on derecognition, classification, interest and penalties, accounting in interim periods and disclosure. In accordance with ASC 740-10, we
We recognize federal, state and foreign current tax liabilities or assets based on our estimate of taxes payable or refundable in the current fiscal year by tax jurisdiction. We also recognize federal, state and foreign deferred tax assets or liabilities for our estimate of future tax effects attributable to temporary differences and carryforwards. We record a valuation allowance to reduce any deferred tax assets by the amount of any tax benefits that, based on available evidence and judgment, are not expected to be realized.
Our calculation of current and deferred tax assets and liabilities is based on certain estimates and judgments and involves dealing with uncertainties in the application of complex tax laws. Our estimates of current and deferred tax assets and liabilities may change based, in part, on added certainty or finality or uncertainty to an anticipated outcome, changes in accounting or tax laws in the U.S., or foreign jurisdictions where we operate, or changes in other facts or circumstances. In addition, we recognize liabilities for potential U.S. and foreign income tax for uncertain income tax positions taken on our tax returns if it has less than a 50% likelihood of being sustained. If we determine that payment of these amounts is unnecessary or if the recorded tax liability is less than our current assessment, we may be required to recognize an income tax benefit or additional income tax expense in our financial statements in the period such determination is made. We have calculated our uncertain tax positions which were attributable to certain estimates and judgments primarily related to transfer pricing, cost sharing and our international tax structure exposure.
As of December 31, 20122015 and 2011,2014, we had a valuation allowance of $12.5$18.6 million and $14.6$19.1 million, respectively, attributable to management’s determination that it is more likely than not that most of the deferred tax assets in the United StatesU.S. will not be realized. Should it be determined that additional amounts of the net deferred tax asset will not be realized in the future, an adjustment to increase the deferred tax asset valuation allowance will be charged to income in the period such determination is made. Likewise, in the event we were to determine that it is more likely than not that we would be able to realize our deferred tax assets in the future in excess of our net recorded amount, an adjustment to the valuation allowance for the deferred tax asset would increase income in the period such determination was made.
As a result of the cost sharing arrangements with the Company’sour international subsidiaries (cost share arrangements), relatively small changes in costs that are not subject to sharing under the cost share arrangements can significantly impact the overall profitability of the U.S. entity. Because of the U.S. entity’s inconsistent earnings history and uncertainty of future earnings, the Company haswe have determined that it is more likely than not that the U.S. deferred tax benefits will not be realized.
Contingencies
We are a single sales factor for California state apportionment, effective for tax years beginning on or after January 1, 2012. As a result of this law change that happened, our California deferred tax assets were revalued down. As we have a valuation allowance against our U.S. deferred tax assets, this revaluation of our California deferred tax assets did not impact income tax expense.
Accounting for Stock-Based Compensation.Compensation
We account for stock-based compensation under the provisions of ASC 718-10-30 Compensation – Stock Compensation – Overall – Initial Measurement. This standard requires us to measure the cost of employee services received in exchange for an award of equity instruments based on the grant-date fair value of the award. We currently use the Black-Scholes option-pricing model to estimate theThe fair value of our share-based payments. The Black-Scholes option-pricing model is based on a number of assumptions, including historical volatility, expected life, risk-free interest rate and expected dividends. The fair value for time-basedrestricted stock awards and stock awards that are contingent upon the achievement of financialunits with service conditions or performance metricsconditions is based on the grant date share price. The fair value of restricted stock units with market conditions, as well as restricted stock units with both market conditions and performance conditions, is estimated using a Monte Carlo simulation model. The fair value of options and shares issued under the employee stock purchase plan is estimated using the Black-Scholes model.
We recognize compensation expense equal to the grant-date fair value for all share-based payment awards that are expected to vest. This expense is recorded on a straight-line basis over the requisite service period of the entire award,awards, unless the awards are subject to market conditions or performance conditions, in which case we recognize compensation expense over the requisite service period offor each separateseparately vesting tranche. WeFor awards with performance conditions, as well as awards with both market conditions and performance conditions, we recognize compensation expense for our performance share units when it becomes probable that the performance criteria specifiedset by the Board of Directors will be achieved.This assessment is performed on a quarterly basis and requires significant assumptions and estimates made by management related to the projected achievement of the performance goals, which can be affected by external factors, such as macroeconomic conditions and the analog industry forecasts, and internal factors, such as our business and operations strategy, product roadmaps and revenue forecasts.Changes in the plan willprobability assessment of achieving the performance conditions are accounted for in the period of change by recording a cumulative catch-up adjustment as if the new estimate had been applied since the service inception date.If the actual performance targets achieved differ significantly from those projected by management, additional compensation expense may be achieved. Therecorded for the performance-based awards due to the cumulative catch-up adjustment, which could have an adverse impact on our results of operations. Furthermore, the amount of stock-based compensation expense that the Company recognizeswe recognize is also based on an expected forfeiture rate. If there is a difference between the forfeiture assumptions used in determining stock-based compensation costs and the actual forfeitures which become known over time, we may change the forfeiture rate, which could have a significant impact on our stock-based compensation expense.
Fair Value of Financial Instruments. ASC 820-10 Fair Value Measurements and Disclosures – Overall defines fair value, establishes a framework for measuring fair value in generally accepted accounting principles in the United States of America, and requires that assets and liabilities carried at fair value be classified and disclosed in one of the three categories, as follows:
In February 2013,May 2014, the Financial Accounting Standards Board (“FASB”("FASB") issued Accounting Standards Update (“ASU”) No. 2013-02, Reporting2014-09, Revenue from Contracts with Customers,which outlines a single comprehensive model for entities to use in accounting for revenue arising from contracts with customers. The standard’s core principle is that an entity will recognize revenue when it transfers promised goods or services to customers in an amount that reflects the consideration to which the entity expects to be entitled in exchange for those goods or services. In July 2015, the FASB approved a one-year deferral of Amounts Reclassified Out of Accumulated Other Comprehensive Income. This ASU adds new disclosure requirement for items reclassified out of accumulated other comprehensive income (“AOCI”).the effective date. The ASU isstandard will be effective for fiscal years, and interimannual reporting periods within those years, beginning on or after December 15, 2012 and must2017. Early adoption is permitted for reporting periods beginning after December 15, 2016. The standard may be applied prospectively. The Company isretrospectively to each prior period presented or retrospectively with the cumulative effect recognized as of the date of adoption. We are evaluating the impact of the standardadoption on itsour consolidated financial statementsposition, results of operations, cash flows and related disclosures.
In June 2011,November 2015, the FASB issued ASU No. 2011-05 relating to Comprehensive Income (Topic 220) – Presentation2015-17,Balance Sheet Classification of Comprehensive Income (ASU 2011-05)Deferred Taxes,which requires an entitythat all deferred tax assets and liabilities, including related valuation allowance, be classified as non-current on the balance sheets.We have elected to presentearly adopt the totalstandard as of comprehensive income,December 31, 2015 on a retrospective basis. As of December 31, 2014, we reclassified $0.2 million of current deferred tax assets to non-current deferred tax assets on the components of net income, and the components of other comprehensive income either in a single continuous statement ofConsolidated Balance Sheet. The adoption did not affect our operating results, comprehensive income or in two separate but consecutive statements. The ASU is effectivecash flows for fiscal years, and interimthe periods within those years, beginning on or after December 15, 2011 and must be applied retrospectively. The Company adopted this standard effective January 1, 2012.presented.
Results of Operations
| Year ended December 31, | ||||||||||||||||||||||||
| 2012 | 2011 | 2010 | ||||||||||||||||||||||
| (in thousands, except percentages) | ||||||||||||||||||||||||
| Revenue | $ | 213,813 | 100.0 | % | $ | 196,519 | 100.0 | % | $ | 218,840 | 100.0 | % | ||||||||||||
| Cost of revenue | 100,665 | 47.1 | 94,925 | 48.3 | 97,383 | 44.5 | ||||||||||||||||||
| Gross profit | 113,148 | 52.9 | 101,594 | 51.7 | 121,457 | 55.5 | ||||||||||||||||||
| Operating expenses: | ||||||||||||||||||||||||
| Research and development | 48,796 | 22.8 | 44,518 | 22.7 | 44,372 | 20.3 | ||||||||||||||||||
| Selling, general and administrative | 50,018 | 23.4 | 40,280 | 20.5 | 41,169 | 18.8 | ||||||||||||||||||
| Litigation expense (benefit), net | (2,945 | ) | (1.4 | ) | 3,379 | 1.7 | 5,418 | 2.5 | ||||||||||||||||
| Total operating expenses | 95,869 | 44.8 | 88,177 | 44.9 | 90,959 | 41.6 | ||||||||||||||||||
| Income from operations | 17,279 | 8.1 | 13,417 | 6.8 | 30,498 | 13.9 | ||||||||||||||||||
| Interest income and other, net | 611 | 0.3 | 309 | 0.2 | 922 | 0.5 | ||||||||||||||||||
| Income before income taxes | 17,890 | 8.4 | 13,726 | 7.0 | 31,420 | 14.4 | ||||||||||||||||||
| Income tax provision | 2,134 | 1.0 | 425 | 0.2 | 1,857 | 0.9 | ||||||||||||||||||
| Net income | $ | 15,756 | 7.4 | % | $ | 13,301 | 6.8 | % | $ | 29,563 | 13.5 | % | ||||||||||||
The following table showssummarizes our results of operations:
Year Ended December 31, | ||||||||||||||||||||||||
2015 | 2014 | 2013 | ||||||||||||||||||||||
(in thousands, except percentages) | ||||||||||||||||||||||||
Revenue | $ | 333,067 | 100.0 | % | $ | 282,535 | 100.0 | % | $ | 238,091 | 100.0 | % | ||||||||||||
Cost of revenue | 152,898 | 45.9 | 129,917 | 46.0 | 110,190 | 46.3 | ||||||||||||||||||
Gross profit | 180,169 | 54.1 | 152,618 | 54.0 | 127,901 | 53.7 | ||||||||||||||||||
Operating expenses: | ||||||||||||||||||||||||
Research and development | 65,787 | 19.8 | 58,590 | 20.7 | 49,733 | 20.9 | ||||||||||||||||||
Selling, general and administrative | 72,312 | 21.7 | 66,755 | 23.6 | 54,624 | 22.9 | ||||||||||||||||||
Litigation expense (benefit), net | 1,000 | 0.3 | (8,027 | ) | (2.8 | ) | (371 | ) | (0.2 | ) | ||||||||||||||
Total operating expenses | 139,099 | 41.8 | 117,318 | 41.5 | 103,986 | 43.6 | ||||||||||||||||||
Income from operations | 41,070 | 12.3 | 35,300 | 12.5 | 23,915 | 10.1 | ||||||||||||||||||
Interest and other income, net | 1,421 | 0.5 | 1,092 | 0.4 | 92 | 0.0 | ||||||||||||||||||
Income before income taxes | 42,491 | 12.8 | 36,392 | 12.9 | 24,007 | 10.1 | ||||||||||||||||||
Income tax provision | 7,319 | 2.2 | 897 | 0.3 | 1,109 | 0.5 | ||||||||||||||||||
Net income | $ | 35,172 | 10.6 | % | $ | 35,495 | 12.6 | % | $ | 22,898 | 9.6 | % | ||||||||||||
Revenue
The following table summarizes our revenue by product family (amounts in thousands, except percentages):
| Year ended December 31, | Percent Change | |||||||||||||||||||||||||||||||
| Product Family | 2012 | % of Revenue | 2011* | % of Revenue | 2010* | % of Revenue | 2012 to 2011 Change | 2011 to 2010 Change | ||||||||||||||||||||||||
| DC to DC Converters | $ | 188,736 | 88.3 | % | $ | 170,032 | 86.5 | % | $ | 190,286 | 87.0 | % | 11.0 | % | (10.6 | %) | ||||||||||||||||
| Lighting Control Products | 25,077 | 11.7 | % | 26,487 | 13.5 | % | 28,554 | 13.0 | % | (5.3 | %) | (7.2 | %) | |||||||||||||||||||
| Total | $ | 213,813 | 100.0 | % | $ | 196,519 | 100.0 | % | $ | 218,840 | 100.0 | % | 8.8 | % | (10.2 | %) | ||||||||||||||||
Year Ended December 31, | Change | |||||||||||||||||||||||||||||||
Product Family | 2015 | % of Revenue | 2014 | % of Revenue | 2013 | % of Revenue | From 2014 to 2015 | From 2013 to 2014 | ||||||||||||||||||||||||
(In thousands, except percentages) | ||||||||||||||||||||||||||||||||
DC to DC products | $ | 299,726 | 90.0 | % | $ | 253,083 | 89.6 | % | $ | 211,337 | 88.8 | % | 18.4 | % | 19.8 | % | ||||||||||||||||
Lighting control products | 33,341 | 10.0 | % | 29,452 | 10.4 | % | 26,754 | 11.2 | % | 13.2 | % | 10.1 | % | |||||||||||||||||||
Total | $ | 333,067 | 100.0 | % | $ | 282,535 | 100.0 | % | $ | 238,091 | 100.0 | % | 17.9 | % | 18.7 | % | ||||||||||||||||
Revenue for the year ended December 31, 20122015 was $213.8$333.1 million, an increase of $17.3$50.6 million, or 8.8%17.9%, from $196.5$282.5 million for the year ended December 31, 2011.2014. This increase was due to higher sales of both DC to DC and lighting control products, as unit shipments increased 17% due to higher market demand with current customers and additional design wins with new customers, coupled with an increase of 1% in average sales prices. Revenue from our DC to DC products was $299.7 million for the year ended December 31, 2015, an increase of $46.6 million, or 18.4%, from the same period in 2014. This increase was primarily due to increased demand for our DC to DC converters. Revenue fromhigher sales of our DC to DC converters was $188.7 million, an increaseand battery chargers, which were offset in part by lower sales of $18.7 million, or 11.0%, over the same period in 2011 primarily due to increased demand for our DC to DC converters, Mini-Monster and CLSMini-Monsters products. Sales ofRevenue from our lighting control products was $33.3 million for the year ended December 31, 2012 were down by 5.3%2015, an increase of $3.9 million, or 13.2%, compared towith the same period in 2011 primarily due to reductions in demand for our CCFL and WLED products.
Revenue for the year ended December 31, 20112014 was $196.5$282.5 million, a decreasean increase of $22.3$44.4 million, or 10.2%18.7%, from $218.8$238.1 million for the year ended December 31, 2010. For the year ended December 31, 2011, the decrease in revenue from the same period last year2013. This increase was largely attributabledue to having lost certainhigher sales of both DC to DC converters productand lighting control products, as unit shipments increased 37% due to higher market demand with current customers and additional design wins with new customers, which were offset in Korea aspart by a lack of production capacity resulted13% decrease in product shortages during 2010. Audioaverage sales which are reported inprices. Revenue from our DC to DC converters beginning in 2012, were $4.4products was $253.1 million for the year ended December 31, 2011, a decrease2014, an increase of $2.8$41.7 million, or 19.8%, from the same period in 20102013. This increase was primarily due to a changehigher sales of our DC to DC converters, offset in product mix. Thepart by lower sales of our Mini-Monsters products. Revenue from our lighting control products were downwas $29.5 million for the year ended December 31, 2011 from2014, an increase of $2.7 million, or 10.1%, compared with the similarsame period in 2010 because of a reduction in the demand for our CCFL products, which was partially offset by increased sales of our WLED products.
Cost of Revenue and Gross Margin
| Year ended December 31, | ||||||||||||
| 2012 | 2011 | 2010 | ||||||||||
| (in thousands, except percentages) | ||||||||||||
| Cost of Revenue (1) | $ | 100,665 | $ | 94,925 | $ | 97,383 | ||||||
| Cost of revenue as a percentage of revenue | 47.1 | % | 48.3 | % | 44.5 | % | ||||||
| Gross Profit | $ | 113,148 | $ | 101,594 | $ | 121,457 | ||||||
| Gross Margin | 52.9 | % | 51.7 | % | 55.5 | % | ||||||
| (1) Includes stock-based compensation expense | $ | 510 | $ | 312 | $ | 393 | ||||||
Cost of revenue primarily consists primarily of costs incurred to manufacture, assemble and test our products, as well as warranty costs, inventory-related and other overhead costs, relating to the aforementioned costs includingand stock-based compensation expense. Gross profit as a percentageexpenses. In addition, cost of revenue includes amortization of intangible assets from the Sensima acquisition beginning in the third quarter of 2014.
Year Ended December 31, | Change | |||||||||||||||||||
2015 | 2014 | 2013 | From 2014 to 2015 | From 2013 to 2014 | ||||||||||||||||
(in thousands, except percentages) | ||||||||||||||||||||
Cost of revenue | $ | 152,898 | $ | 129,917 | $ | 110,190 | 17.7 | % | 17.9 | % | ||||||||||
Cost of revenue as a percentage of revenue | 45.9 | % | 46.0 | % | 46.3 | % | ||||||||||||||
Gross profit | $ | 180,169 | $ | 152,618 | $ | 127,901 | 18.1 | % | 19.3 | % | ||||||||||
Gross margin | 54.1 | % | 54.0 | % | 53.7 | % | ||||||||||||||
Cost of revenue was $152.9 million, or gross margin, was 52.9%45.9% of revenue, for the year ended December 31, 2012, compared to 51.7%2015, and $129.9 million, or 46.0% of revenue, for the year ended December 31, 2011.2014. The $23.0 million increase in gross profit margin year-over-yearcost of revenue was primarily due to a 17% increase in unit shipments, coupled with a 4% increase in the average direct cost of units shipped. The increase in cost of revenue was also driven by additional amortization of intangible assets of $1.1 million.
Gross margin was 54.1% for the year ended December 31, 2015, compared with 54.0% for the year ended December 31, 2014. For the year ended December 31, 2015, gross margin was favorably impacted by lower inventory reserveslabor and improved product mixoverhead costs as a percentage of revenue, partially offset by increased sales of lower margin products and higher amortization of intangible assets compared to the same period in 2011.
Cost of revenue was 51.7%$129.9 million, or 46.0% of revenue, for the year ended December 31, 20112014, and 55.5%$110.2 million, or 46.3% of revenue, for the year ended December 31, 2010. For2013. The $19.7 million increase in cost of revenue was primarily due to a 37% increase in unit shipments, which was partially offset by a 14% decrease in the average direct cost of units shipped. The increase in cost of revenue was also driven by an increase of $0.8 million in the provision for inventory reserve and additional amortization of intangible assets of $0.7 million.
Gross margin was 54.0% for the year ended December 31, 2011,2014, compared to 53.7% for the year ended December 31, 2013. The increase in gross margin declined between yearswas primarily due to lower labor and overhead costs as a resultpercentage of declining average selling prices for certain of our products, unabsorbed test manufacturing costs andrevenue compared to the same period in 2013. This increase was partially offset by an increase in the provision for inventory reserves.
Research and Development
Research and development (“R&D”) expenses primarily consist of salary and benefit expenses, bonuses and stock-based compensation expenses for design and product engineers, expenses related to new product development and relatedsupplies, and facility costs.
| Year ended December 31, | Percentage Change | |||||||||||||||||||
| 2012 | 2011 | 2010 | 2012 to 2011 | 2011 to 2010 | ||||||||||||||||
| (in thousands, except percentages) | ||||||||||||||||||||
| Research and development (“R&D”) (1) | $ | 48,796 | $ | 44,518 | $ | 44,372 | 9.6 | % | 0.3 | % | ||||||||||
| R&D as a percentage of revenue | 22.8 | % | 22.7 | % | 20.3 | % | ||||||||||||||
| (1) Includes stock-based compensation expense | $ | 6,922 | $ | 5,909 | $ | 6,742 | ||||||||||||||
Year Ended December 31, | Change | |||||||||||||||||||
2015 | 2014 | 2013 | From 2014 to 2015 | From 2013 to 2014 | ||||||||||||||||
(in thousands, except percentages) | ||||||||||||||||||||
R&D expenses | $ | 65,787 | $ | 58,590 | $ | 49,733 | 12.3 | % | 17.8 | % | ||||||||||
As a percentage of revenue | 19.8 | % | 20.7 | % | 20.9 | % | ||||||||||||||
R&D expenses were $48.8$65.8 million, or 22.8%19.8% of revenue, for the year ended December 31, 20122015 and $44.5$58.6 million, or 22.7%20.7% of revenue, for the year ended December 31, 2011.2014. The $7.2 million increase in R&D expenses increased year-over-yearwas primarily due to an increase of $3.7 million in cash compensation expenses, which include salary, benefits and bonuses, an increase of $2.1 million in stock-based compensation expenses primarily associated with the performance-based equity awards, an increase of $0.5 million in new product development expenses, and an increase of $0.3 million in expenses associated with increased new product development.manufacturing and laboratory supplies. These increases were partially offset by a decrease of $0.2 million related to the changes in the value of the employee deferred compensation plan liabilities. Our R&D headcount as of December 31, 2012 was 388 employees, compared to 374506 employees as of December 31, 2011.2015, compared with 476 employees as of December 31, 2014.
R&D expenses were $44.5$58.6 million, or 22.7%20.7% of revenue, for the year ended December 31, 20112014 and $44.4$49.7 million, or 20.3%20.9% of revenue, for the year ended December 31, 2010. For the year ended December 31, 2011,2013. The $8.9 million increase in R&D expenses remained flatwas primarily due to an increase of $2.8 million in stock-based compensation expenses primarily associated with the same periodperformance-based and market-based equity awards, an increase of $2.4 million in 2010 due to lower stock-based compensation expenses. These were partially offset bynew product development expenses, an increase of $2.0 million in cash compensation expenses, which include salary, benefits and new product development expenses.
Selling, General and Administrative
Selling, general and administrative (“SG&A”) expenses primarily include salary and benefit expenses, bonuses and stock-based compensation expenses for sales, marketing and administrative personnel, sales commissions, travel expenses, related facilities costs, outside legal and accounting fees, and fees associated with Sarbanes-Oxley compliance requirements.
| Year ended December 31, | Percentage Change | |||||||||||||||||||
| 2012 | 2011 | 2010 | 2012 to 2011 | 2011 to 2010 | ||||||||||||||||
| (in thousands, except percentages) | ||||||||||||||||||||
| Selling, general and administrative (“SG&A”) (1) | $ | 50,018 | $ | 40,280 | $ | 41,169 | 24.2 | % | (2.2 | %) | ||||||||||
| SG&A as a percentage of net revenue | 23.4 | % | 20.5 | % | 18.8 | % | ||||||||||||||
| (1) Includes stock-based compensation expense | $ | 11,220 | $ | 6,905 | $ | 9,675 | ||||||||||||||
Year Ended December 31, | Change | |||||||||||||||||||
2015 | 2014 | 2013 | From 2014 to 2015 | From 2013 to 2014 | ||||||||||||||||
(in thousands, except percentages) | ||||||||||||||||||||
SG&A expenses | $ | 72,312 | $ | 66,755 | $ | 54,624 | 8.3 | % | 22.2 | % | ||||||||||
As a percentage of revenue | 21.7 | % | 23.6 | % | 22.9 | % | ||||||||||||||
SG&A expenses were $50.0$72.3 million, or 23.4%21.7% of revenue, for the year ended December 31, 20122015 and $40.3$66.8 million, or 20.5%23.6% of revenue, for the year ended December 31, 2011.2014. The $5.5 million increase in SG&A expenses increased year-over-yearwas primarily due to an increase of $5.7 million in cash and stock-based compensation expenses professional services feesprimarily associated with the performance-based equity awards, an increase of $2.0 million in cash compensation expenses, which include salary, benefits and salesbonuses, and an increase of $0.6 million in commission onexpenses due to higher revenue comparedrevenue. These increases were partially offset by a credit of $2.5 million related to the same periodrelease of a contingent consideration liability (see below), a decrease of $0.6 million in 2011.professional service fees due to the transaction costs incurred in the Sensima acquisition in 2014 but not in 2015, and a gain of $0.3 million from sales of certain operating equipment. Our SG&A headcount as of December 31, 2012 was 250 employees, compared to 238306 employees as of December 31, 2011.
Our acquisition of Senisma in July 2014 included a contingent consideration arrangement which requires us to pay up to $8.9 million to certain former Sensima shareholders if Sensima achieves a new product introduction as well as certain product revenue and direct margin targets in 2016. The fair value of the contingent consideration at the acquisition date was $2.5 million, which was estimated based on a probability-weighted analysis of possible future revenue outcomes. As part of the quarterly assessment in the fourth quarter of 2015, management reviewed the sales forecast for the products and concluded that the projected product revenue in 2016 will not likely meet the minimum target required to earn the contingent consideration, primarily because the product adoption process by customers will take longer than we had originally anticipated. Accordingly, the fair value of the contingent consideration was deemed to be $0 as of December 31, 2015, and we recorded the release of the liability of $2.5 million as a credit to SG&A expenses. We will continue to assess the probability of former Sensima shareholders earning the contingent consideration in 2016 and may record additional adjustment to the fair value.
SG&A expenses were $40.3$66.8 million, or 20.5%23.6% of revenue, for the year ended December 31, 20112014 and $41.2$54.6 million, or 18.8%22.9% of revenue, for the year ended December 31, 2010. For the year ended December 31, 2011,2013. The $12.2 million increase in SG&A expenses decreased from the same period in 2010was primarily due to loweran increase of $9.7 million in stock-based compensation expenses. These were partially offset byexpenses primarily associated with the performance-based and market-based equity awards, an increase of $0.9 million in professional service fees primarily due to the transaction costs of $0.6 million incurred in the Sensima acquisition, an increase of $0.5 million in cash compensation expenses. expenses, which include salary, benefits and bonuses, and an increase of $0.3 million in commission expenses due to higher revenue. Our SG&A headcount was 274 employees as of December 31, 2014, compared to 249 employees as of December 31, 2013.
Litigation Expense (Benefit), Net
Litigation expense (benefit), net
| Year ended December 31, | Percentage Change | |||||||||||||||||||
| 2012 | 2011 | 2010 | 2012 to 2011 | 2011 to 2010 | ||||||||||||||||
| (in thousands, except percentages) | ||||||||||||||||||||
| Litigation expense (benefit), net | $ | (2,945 | ) | $ | 3,379 | $ | 5,418 | (187.2 | %) | (37.6 | %) | |||||||||
| Litigation expense (benefit), net, as a percentage of revenue | (1.4 | %) | 1.7 | % | 2.5 | % | ||||||||||||||
Litigation benefit, net, was $(8.0) million for the year ended December 31, 2010. During2014, compared with a litigation benefit, net, of $(0.4) million for the year ended December 31, 2011, we incurred legal expenses primarily to recover attorneys’ fees from O2Micro relating to our earlier lawsuits with them, which were resolved in the second quarter of 2010. During2013. The net litigation benefit for the year ended December 31, 2010,2014 included the recognition of a $9.5 million award from the O2 Micro litigation, partially offset by $0.5 million of additional legal fees incurred in connection with the final resolution of the litigation. The net litigation benefit for the year ended December 31, 2013 included $0.8 million of proceeds received in connection with the legal settlement with Silergy Corporation. The increase in net litigation benefit for the year ended December 31, 2014 was partially offset by higher expenses we incurred legal expenses primarily forin other litigation matters, compared to the defense of those lawsuits. Overall, our litigation expense decreased as a result of us being party to fewer material legal actions.
For a more complete description of our current material litigation matters, please see Part I, Item 3 “Legal Proceedings” and Note 1013 “Litigation” of the Notes to Consolidated Financial Statements.
Interest Income and Other Income, Net
Interest and other income, net, was $1.4 million for the yearsyear ended December 31, 2012, 2011 and 2010, interest income and other, net,2015, compared with $1.1 million for the year ended December 31, 2014. The increase was $0.6 million, $0.3 million and $0.9 million, respectively. Interest income increased from 2011 to 2012primarily due to higher average cashforeign currency exchange gains and investment balanceshigher interest income, partially offset by higher expenses related to the changes in 2012 asthe value of the employee deferred compensation plan assets.
Interest and other income, net, was $1.1 million for the year ended December 31, 2014, compared to 2011. Interest income decreased from 2010 to 2011with $0.1 million for the year ended December 31, 2013. The increase was primarily due to lower cashhigher foreign currency exchange gains and investment balances in 2011, which resulted from stock repurchase activity and the purchase of our San Jose headquarters as well ashigher interest rate declines year-over-year.
Income Tax Provision
The income tax provision for the year ended December 31, 20122015 was $2.1$7.3 million, or 11.9%17.2% of ourpre-tax income. We recorded a one-time net charge of $2.7 million to the income beforetax provision related to the resolution of the income taxes. This differstax audits in the second quarter of 2015. In addition to the impact of this charge, the effective tax rate differed from the federal statutory rate primarily because foreign income was taxed at lower rates, and because of 34%the benefit that we realized from stock option exercises and the release of RSUs, and from the release of an income tax reserve where the statute of limitations expired. In addition, the effective tax rate was impacted by changes in the valuation allowance.
The income tax provision for the year ended December 31, 2014 was $0.9 million, or 2.5% of pre-tax income. The income tax provision for the year ended December 31, 2013 was $1.1 million, or 4.6% of pre-tax income. The effective tax rate differed from the federal statutory rate in both 2014 and 2013 primarily because our foreign income was taxed at lower rates, and because of the benefit that we realized as a result offrom stock options exercisedexercises and restricted units released.
For additional information on the income tax provision for year ended December 31, 2011 was $0.4 million or 3.1% of our income before income taxes. This differs fromand the federal statutory rate of 34% primarily because our foreign income was taxed at lower rates and becauseresolution of the benefit that we realized as a result of stock options exercised and restricted units released.
Liquidity and Capital Resources
| December 31, | ||||||||
| 2012 | 2011 | |||||||
| (In thousands) | ||||||||
| Cash and cash equivalents | $ | 75,104 | $ | 96,371 | ||||
| Short-term investments | 85,521 | 77,827 | ||||||
| Total cash, cash equivalents and short-term investments | $ | 160,625 | $ | 174,198 | ||||
| Percentage of total assets | 55.9 | % | 63.6 | % | ||||
| Total current assets | $ | 214,301 | $ | 211,505 | ||||
| Total current liabilities | (23,460 | ) | (26,070 | ) | ||||
| Working Capital | $ | 190,841 | $ | 185,435 | ||||
December 31, | ||||||||
2015 | 2014 | |||||||
(in thousands, except percentages) | ||||||||
Cash and cash equivalents | $ | 90,860 | $ | 126,266 | ||||
Short-term investments | 144,103 | 112,452 | ||||||
Total cash, cash equivalents and short-term investments | $ | 234,963 | $ | 238,718 | ||||
Percentage of total assets | 54.5 | % | 59.8 | % | ||||
Total current assets (1) | $ | 331,928 | $ | 307,912 | ||||
Total current liabilities | (43,283 | ) | (36,861 | ) | ||||
Working capital | $ | 288,645 | $ | 271,051 | ||||
___________________
(1) | In November 2015, the FASB issued ASU No. 2015-17, Balance Sheet Classification of Deferred Taxes, whichrequires that all deferred tax assets and liabilities, including related valuation allowance, be classified as non-current on the balance sheets. We early adopted this standard retrospectively and reclassified $0.2 million of the current deferred tax assets to non-current deferred tax assets on our consolidated balance sheet as of December 31, 2014. |
As of December 31, 2012,2015, we had cash and cash equivalents of $75.1$90.9 million and short-term investments of $85.5$144.1 million, compared with cash and cash equivalents of $96.4$126.3 million and short-term investments of $77.8$112.5 million as of December 31, 2011. The decrease of $21.3 million in cash and cash equivalents in 2012 compared to 2011 was primarily due to the $35.7 million cash dividend paid to common stockholders on December 28, 2012, investment in equipment and building improvements at our new headquarters located in San Jose, California and investment in short-term securities. These uses of cash were partially offset by cash generated from operating activities and proceeds from the exercise of stock options and purchases under our employee stock purchase plan. We have financed our operations primarily with cash generated from operating activities, proceeds received from the exercise of stock options and proceeds from the issuance of shares through our employee stock purchase plan.2014. As of December 31, 2012, $43.8 million of the $75.12015, $55.5 million of cash and cash equivalents and $17.0 million of the $85.5$36.8 million of short-term investments were held by our international subsidiaries. If these funds are needed for our operations in the U.S., we may be required to accrue and pay U.S. taxes to repatriate these funds. However, our intent is to indefinitely reinvest these funds outside of the U.S. and our current plans do not demonstrate a need to repatriate them to fund ourthe U.S. operations.
The significant components of our working capital are cash and cash equivalents, short-term investments, accounts receivable, inventories, deferred income taxes and prepaid expenses and other current assets, reduced by accounts payable, accrued compensation and related benefits, and other current liabilities, deferred revenue and customer prepayments.
Summary of Cash Flows
The following table below summarizes theour cash and cash equivalents provided by (used in) in our operating, investing and financing activities for the periods presented:
| December 31, | ||||||||||||
| 2012 | 2011 | 2010 | ||||||||||
| (In thousands) | ||||||||||||
| Cash provided by operating activities | $ | 24,912 | $ | 43,685 | $ | 48,494 | ||||||
| Cash provided by (used in) investing activities | (26,837 | ) | 36,222 | (33,751 | ) | |||||||
| Cash used in financing activities | (19,553 | ) | (31,975 | ) | (14,047 | ) | ||||||
| Effect of exchange rate changes on cash and cash equivalents | 211 | 429 | 597 | |||||||||
| Net increase (decrease) in cash and cash equivalents | $ | (21,267 | ) | $ | 48,361 | $ | 1,293 | |||||
Year Ended December 31, | ||||||||||||
2015 | 2014 | 2013 | ||||||||||
(in thousands) | ||||||||||||
Net cash provided by operating activities | $ | 69,736 | $ | 74,133 | $ | 60,686 | ||||||
Net cash used in investing activities | (57,197 | ) | (9,367 | ) | (54,324 | ) | ||||||
Net cash provided by (used in) financing activities | (46,652 | ) | (39,227 | ) | 18,850 | |||||||
Effect of exchange rate changes on cash and cash equivalents | (1,293 | ) | (486 | ) | 897 | |||||||
Net increase (decrease) in cash and cash equivalents | $ | (35,406 | ) | $ | 25,053 | $ | 26,109 | |||||
For the year ended December 31, 2012,2015, net cash provided by operating activities was $24.9$69.7 million, primarily due to cash contributedour net income adjusted for certain non-cash items, including depreciation and amortization, stock-based compensation, change in fair value of contingent consideration and a net decrease of $12.6 million from the changes in our operating results during the year partially offset by increases in both inventoriesassets and accounts receivable.liabilities. The increase in accounts receivable resulted in large measure from an increase in shipments. was primarily driven by increased sales. The increase in inventories was primarily due to an increase in strategic wafer and die bank inventories as well as an increase in finished goods to meet anticipated future demand. Net cash providedThe increase in accrued liabilities was primarily driven by operating activities decreased by $18.8 million for the year ended December 31, 2012 as comparedan increase in employee contributions to the same period in 2011, primarily due to a $27.8 million increase in working capital requirements for the year ended December 31, 2012 as compared to the same period in 2011 partially offset by cash provided by our operating results during the year 2012 compared to 2011. deferred compensation plan.
For the year ended December 31, 2011,2014, net cash provided by operating activities was $43.7$74.1 million, primarily reflecting cash generateddue to our net income adjusted for certain non-cash items, including depreciation and amortization and stock-based compensation, and a net decrease of $8.0 million from the changes in our operating results. assets and liabilities. The increase in accounts receivable was primarily due to increased sales and higher shipments in the fourth quarter of 2014. The increase in accounts payable was primarily driven by increased inventory and capital asset purchases to meet future growth. The decrease in accrued liabilities was primarily driven by the release of a liability related to the O2 Micro litigation, partially offset by an increase in employee contributions to the deferred compensation plan.
For the year ended December 31, 2010,2013, net cash provided by operating activities was $48.5$60.7 million, primarily reflecting cash contributeddue to our net income adjusted for certain non-cash items, including depreciation and amortization and stock-based compensation, and a net increase of $4.5 million from the changes in our operating results, partially offset byassets and liabilities. The increase in accounts receivable resulted primarily from an increase in shipments. The increase in inventories was primarily due to supportan increase in strategic wafer and die bank inventories as well as an increase in finished goods to meet future demand. The increase in accrued liabilities was primarily due to a cash award received in connection with the deliveries in the first quarterO2 Micro litigation that was recorded as a liability as of 2011.
For the year ended December 31, 2012,2015, net cash used in investing activities was $26.8$57.2 million, in support of our investment in equipment, building improvements at our new headquarters located in San Jose, California andprimarily due to net purchases of short-term investments. investments of $33.5 million, purchases of property and equipment of $16.0 million, and net contributions to the employee deferred compensation plan of $8.0 million.
For the year ended December 31, 2011, net cash provided by investing activities was $36.22015, we spent $5.4 million as proceeds from the sale of short-term investments were used to fund our stock repurchase program and to purchase three units of an office building located in Shanghai, China. We also exercised the option to purchase a leased manufacturing facility in Chengdu, China for approximately $1.7 million, which we expect to close in the first half of 2016. In addition, our corporate headquartersBoard of Directors approved a plan to spend up to $17 million to purchase additional office space in San Jose, California. China in 2016 to accommodate future growth.
For the year ended December 31, 2010,2014, net cash used in investing activities was $33.8$9.4 million, reflecting the constructionprimarily due to net cash of $11.6 million paid to acquire Sensima, purchases of property and equipment purchases for our facilities in Chengduof $9.5 million, and net contributions to the employee deferred compensation plan of $5.3 million, partially offset by net purchaseproceeds from sales of short-term investments.
For the year ended December 31, 2009, the potential credit loss associated with these securities2015, net cash used in financing activities was $70,000, which we deemed other-than-temporary$46.7 million, primarily reflecting $32.3 million used in repurchases of our common stock pursuant to our stock repurchase program and recorded in other expense in its Consolidated Statement$30.0 million used to pay dividends to our stockholders and dividend equivalents to our employees who hold RSUs, partially offset by $10.0 million of Operations during 2009. There have been no such losses since. Duringcash proceeds from stock option exercises and issuance of shares through our employee stock purchase plan. For the year ended December 31, 2012, we were able to redeem one of these two securities at par and therefore, recognized a gain of $40,000 in interest income and other,2014, net in our Consolidated Statement of Operations.
| December 31, 2012 | December 31, 2011 | |
| Time-to-Liquidity | 24 months | 24 months |
| Expected Return (Based on the requisite treasury rate, plus a contractual penalty rate) | 1.8% | 1.8% |
| Discount Rate (Based on the requisite LIBOR, the cost of debt and a liquidity risk premium) | 2.5% - 7.3%, depending on the credit-rating of the security | 3.1% - 7.9% depending on the credit-rating of the security |
In July 2013, our Employee Stock Purchase Plan.
In June 2014, our Board of Directors approved a dividend program pursuant to which we intend to pay quarterly cash dividends on our common stock, beginning in July 2014. In addition, outstanding RSU awards contain rights to receive dividend equivalents, which entitle employees who hold RSUs to the same dividend value per share as holders of common stock. The dividend equivalents are accumulated quarterly during the vesting periods of the RSUs and are payable to the following shares have been repurchased throughemployees when the open marketawards vest. Dividend equivalents accumulated on the RSUs are forfeited if the employees do not fulfill their service requirement during the vesting periods. For the year ended December 31, 2015, we paid dividends and subsequently retired:
| 2011 | Shares Repurchased | Average Price per Share | Value (in thousands) | |||||||||
| February | 817,500 | $ | 15.47 | $ | 12,648 | |||||||
| March | 75,000 | $ | 14.17 | $ | 1,062 | |||||||
| April | 917,200 | $ | 14.82 | $ | 13,617 | |||||||
| May | 657,800 | $ | 16.48 | $ | 10,843 | |||||||
| June | 18,000 | $ | 16.79 | $ | 302 | |||||||
| 2,485,500 | $ | 38,472 | ||||||||||
| 2010 | Shares Repurchased | Average Price per Share | Value (in thousands) | |||||||||
| August | 983,189 | $ | 17.29 | $ | 16,998 | |||||||
| November | 916,600 | $ | 15.85 | $ | 14,529 | |||||||
| 1,899,789 | $ | 31,527 | ||||||||||
Although cash requirements will fluctuate based on the timing and extent of many factors such as those discussed above, we believe that cash generated from operations, together with the liquidity provided by existing cash balances and short-term investments, will be sufficient to satisfy our liquidity requirements for the next 12 months. For further details regardingWe anticipate the cash used for future dividends, dividend equivalents and the stock repurchase program will come from our operating, investingcurrent domestic cash and financing activities, see the Consolidated Statement of Cash Flows.
In the future, in order to strengthen our financial position, in the event ofrespond to unforeseen circumstances, or in the event we need to fund our growth in future financial periods, we may need to raise additional funds by any one or a combination of the following: issuing equity securities, issuing debt or convertible debt securities, incurring indebtedness secured by our assets, or selling certain product lines and/or portions of our business. There can be no guarantee that we will be able to raise additional funds on terms acceptable to us, or at all.
From time to time, we have engaged in discussions with third parties concerning potential acquisitions of product lines, technologies, businesses and businesses,companies, and we continue to consider potential acquisition candidates. Any such transactions could involve the issuance of a significant number of new equity securities, assumptions of debt, and/or payment of cash consideration. We may also be required to raise additional funds to complete any such acquisition,acquisitions, through either the issuance of equity and debt securities or incurring indebtedness secured by our assets. If we raise additional funds or acquire businesses or technologies through the issuance of equity securities or convertible debt securities, our existing stockholders may experience significant dilution.
Contractual Obligations
The following table summarizes our contractual obligations at December 31, 2012, and the effect such obligations are expected to have on our liquidity and cash flow over the next five years (in thousands).
| Payments by Period | ||||||||||||||||||||||||
| Total | 2013 | 2014 | 2015 | 2016 | Thereafter | |||||||||||||||||||
| Operating leases | $ | 1,165 | $ | 912 | $ | 206 | $ | 45 | $ | 2 | $ | - | ||||||||||||
| Outstanding purchase commitments | 15,542 | 15,542 | - | - | - | - | ||||||||||||||||||
| $ | 16,707 | $ | 16,454 | $ | 206 | $ | 45 | $ | 2 | $ | - | |||||||||||||
Payment Due by Period | ||||||||||||||||||||
Total | Less Than 1 Year | 1 - 3 Years | 3 - 5 Years | More Than 5 years | ||||||||||||||||
(in thousands) | ||||||||||||||||||||
Operating leases | $ | 2,528 | $ | 1,354 | $ | 889 | $ | 285 | $ | - | ||||||||||
Outstanding purchase commitments (1) | 32,705 | 30,875 | 380 | 300 | 1,150 | |||||||||||||||
Other long-term obligations (2) | 15,843 | - | 1,738 | 5,503 | 8,602 | |||||||||||||||
Total | $ | 51,076 | $ | 32,229 | $ | 3,007 | $ | 6,088 | $ | 9,752 | ||||||||||
______________
(1) | Outstanding purchase commitments primarily consist of wafer purchases from our foundries, assembly services and license arrangements. In addition, the amounts include the estimated purchase price of $1.7 million for a manufacturing facility in Chengdu, China. We exercised the option to purchase this leased facility in September 2015 and expect to close the transaction in the first half of 2016. | |
| (2) | Other long-term obligations include long-term liabilities reflected on our Consolidated Balance Sheets, which primarily consist of employee deferred compensation plan liabilities and accrued dividend equivalents. Because of the uncertainty as to the timing of distributions related to a portion of the employee deferred compensation plan liabilities, we have excluded estimated obligations of $0.7 million from the table above. In addition, because of the uncertainty as to the timing of payments related to our liabilities for unrecognized tax benefits, we have excluded estimated obligations of $2.9 million from the table above. |
Off Balance Sheet Arrangements
As of December 31, 2012,2015, we had no off-balance sheet arrangements as defined in Item 303(a)(4) of the Securities and Exchange Commission’s Regulation S-K.
ITEM 7A. QUANTITATIVE AND QUALITATIVE DISCLOSURES ABOUT MARKET RISK
Interest Rate Risk
Our cash equivalents and investments are subject to market risk, primarily interest rate and credit risk. Our investments are managed by outside professional managers within investment guidelines set by us. Such guidelines include security type, credit quality and maturity and are intended to limit market risk by restricting our investments to high quality debt instruments with relatively short-term maturities.
We do not use derivative financial instruments in our investment portfolio. Investments in debt securities are classified as available-for-sale or trading.available-for-sale. For available-for-sale investments, no gains or losses are recognized by us in our results of operations due to changes in interest rates unless such securities are sold prior to maturity or are determined to be other-than-temporarily impaired. Available-for-sale investments are reported at fair value with the related unrealized gains or losses being included in accumulated other comprehensive income, a component of stockholders’ equity. Trading securities are reported at fair value with unrealized gains and losses included in earnings.
Fluctuations in interest rates of plus or minus 10% could impact our annual results of operations by approximately $0.1 million.
As of December 31, 2012,2015, all of our holdings in auction rateauction-rate securities, which have a face value of $12.3$5.6 million, have failed to reset as a result of current market conditions. Should these auctions continue to fail and if the credit rating for these securities decline, a 10% decline in the fair value could impact our results of operations by approximately $1.2 million.$0.5 million if we determine the decline in value to be other-than-temporary.
Foreign Currency Exchange Risk
Our sales outside the United States are primarily transacted in U.S. dollars. Accordingly, our sales are not generally impacted by foreign currency rate changes. The functional currency of the Company’s offshore operations is the local currency, primarily the Renminbi, the New Taiwan Dollar and the Euro. In addition, we incur foreign currency exchange gains or losses related to the timing of payments for transactions between the U.S. and our foreign subsidiaries, which are reported in interest and other income. To date, fluctuations in foreign currency exchange rates have not had a material impact on our results of operations.
ITEM 8. FINANCIAL STATEMENTS AND SUPPLEMENTARY DATA
MONOLITHIC POWER SYSTEMS, INC.
CONSOLIDATED FINANCIAL STATEMENTS
Contents
Page | |
Report of Independent Registered Public Accounting Firm | 41 |
Consolidated Balance Sheets | 42 |
Consolidated Statements of Operations | 43 |
Consolidated Statements of Comprehensive Income | 44 |
Consolidated Statements of Stockholders’ Equity | 45 |
Consolidated Statements of Cash Flows | 46 |
Notes to Consolidated Financial Statements | 47 |
REPORT OF INDEPENDENT REGISTERED PUBLIC ACCOUNTING FIRM
To the Board of Directors and Stockholders of
Monolithic Power Systems, Inc.
San Jose, California
We have audited the accompanying consolidated balance sheets of Monolithic Power Systems, Inc. and subsidiaries (the "Company") as of December 31, 20122015 and 2011,2014, and the related consolidated statements of operations, comprehensive income, stockholders' equity, and cash flows for each of the three years in the period ended December 31, 2012.2015. These financial statements are the responsibility of the Company's management. Our responsibility is to express an opinion on these financial statements based on our audits.
We conducted our audits in accordance with the standards of the Public Company Accounting Oversight Board (United States). Those standards require that we plan and perform the audit to obtain reasonable assurance about whether the financial statements are free of material misstatement. An audit includes examining, on a test basis, evidence supporting the amounts and disclosures in the financial statements.statements. An audit also includes assessing the accounting principles used and significant estimates made by management, as well as evaluating the overall financial statement presentation. We believe that our audits provide a reasonable basis for our opinion.
In our opinion, such consolidated financial statements present fairly, in all material respects, the financial position of Monolithic Power Systems, Inc. and subsidiaries as of December 31, 20122015 and 2011,2014, and the results of their operations and their cash flows for each of the three years in the period ended December 31, 2012,2015, in conformity with accounting principles generally accepted in the United States of America.
We have also audited,, in accordance with the standards of the Public Company Accounting Oversight Board (United States), the Company's internal control over financial reporting as of December 31, 2012,2015, based on the criteria established inInternal Control – Integrated Framework (2013)issued by the Committee of Sponsoring Organizations of the Treadway Commission, and our report dated March 5, 2013February 29, 2016 expressed an unqualified opinion on the Company's internal control over financial reportingreporting..
/s/ DELOITTE & TOUCHE LLP
San Jose, California
February 29, 2016
MONOLITHIC POWER SYSTEMS, INC.
CONSOLIDATED BALANCE SHEETS
(in thousands, except par value and share amounts)
| December 31, | ||||||||
| 2012 | 2011 | |||||||
| ASSETS | ||||||||
| Current assets: | ||||||||
| Cash and cash equivalents | $ | 75,104 | $ | 96,371 | ||||
| Short-term investments | 85,521 | 77,827 | ||||||
| Accounts receivable, net of allowances of $20 in 2012 and $5 in 2011 | 19,383 | 15,097 | ||||||
| Inventories | 32,115 | 20,104 | ||||||
| Deferred income tax assets, net - current | 1 | 421 | ||||||
| Prepaid expenses and other current assets | 2,177 | 1,685 | ||||||
| Total current assets | 214,301 | 211,505 | ||||||
| Property and equipment, net | 59,412 | 47,794 | ||||||
| Long-term investments | 11,755 | 13,675 | ||||||
| Deferred income tax assets, net - long-term | 669 | 239 | ||||||
| Other assets | 1,025 | 654 | ||||||
| Total assets | $ | 287,162 | $ | 273,867 | ||||
| LIABILITIES AND STOCKHOLDERS’ EQUITY | ||||||||
| Current liabilities: | ||||||||
| Accounts payable | $ | 9,859 | $ | 8,904 | ||||
| Accrued compensation and related benefits | 7,686 | 9,321 | ||||||
| Accrued liabilities | 5,915 | 7,845 | ||||||
| Total current liabilities | 23,460 | 26,070 | ||||||
| Non-current income tax liabilities | 5,408 | 4,920 | ||||||
| Total liabilities | 28,868 | 30,990 | ||||||
| Commitments and contingencies (Note 9) | ||||||||
| Stockholders' equity: | ||||||||
| Common stock, $0.001 par value; shares authorized: 150,000,000; shares issued and outstanding: 35,673,282 and 33,826,032 in 2012 and 2011, respectively | 194,079 | 159,336 | ||||||
| Retained earnings | 60,040 | 79,948 | ||||||
| Accumulated other comprehensive income | 4,175 | 3,593 | ||||||
| Total stockholders’ equity | 258,294 | 242,877 | ||||||
| Total liabilities and stockholders’ equity | $ | 287,162 | $ | 273,867 | ||||
December 31, | ||||||||
2015 | 2014 | |||||||
ASSETS | ||||||||
Current assets: | ||||||||
Cash and cash equivalents | $ | 90,860 | $ | 126,266 | ||||
Short-term investments | 144,103 | 112,452 | ||||||
Accounts receivable, net | 30,830 | 25,630 | ||||||
Inventories | 63,209 | 40,918 | ||||||
Prepaid expenses and other current assets | 2,926 | 2,646 | ||||||
Total current assets | 331,928 | 307,912 | ||||||
Property and equipment, net | 65,359 | 62,942 | ||||||
Long-term investments | 5,361 | 5,389 | ||||||
Goodwill | 6,571 | 6,571 | ||||||
Acquisition-related intangible assets, net | 5,053 | 6,812 | ||||||
Deferred tax assets, net | 672 | 1,283 | ||||||
Other long-term assets | 16,341 | 8,457 | ||||||
Total assets | $ | 431,285 | $ | 399,366 | ||||
LIABILITIES AND STOCKHOLDERS’ EQUITY | ||||||||
Current liabilities: | ||||||||
Accounts payable | $ | 13,487 | $ | 13,138 | ||||
Accrued compensation and related benefits | 9,812 | 9,020 | ||||||
Accrued liabilities | 19,984 | 14,703 | ||||||
Total current liabilities | 43,283 | 36,861 | ||||||
Income tax liabilities | 2,941 | 5,876 | ||||||
Other long-term liabilities | 16,545 | 10,204 | ||||||
Total liabilities | 62,769 | 52,941 | ||||||
Commitments and contingencies (notes 11, 12 and 13) | ||||||||
Stockholders' equity: | ||||||||
Common stock and additional paid-in capital, $0.001 par value; shares authorized:150,000; shares issued and outstanding: 39,689 and 38,832as of December 31, 2015 and December 31, 2014, respectively | 265,763 | 240,500 | ||||||
Retained earnings | 101,287 | 100,114 | ||||||
Accumulated other comprehensive income | 1,466 | 5,811 | ||||||
Total stockholders’ equity | 368,516 | 346,425 | ||||||
Total liabilities and stockholders’ equity | $ | 431,285 | $ | 399,366 | ||||
See accompanying notes to consolidated financial statements
MONOLITHIC POWER SYSTEMS, INC.
CONSOLIDATED STATEMENTS OF OPERATIONS
(in thousands, except per share amounts)
| Year Ended December 31, | ||||||||||||
| 2012 | 2011 | 2010 | ||||||||||
| Revenue | $ | 213,813 | $ | 196,519 | $ | 218,840 | ||||||
| Cost of revenue (1) | 100,665 | 94,925 | 97,383 | |||||||||
| Gross profit | 113,148 | 101,594 | 121,457 | |||||||||
| Operating expenses: | ||||||||||||
| Research and development (2) | 48,796 | 44,518 | 44,372 | |||||||||
| Selling, general and administrative (3) | 50,018 | 40,280 | 41,169 | |||||||||
| Litigation expense (benefit), net | (2,945 | ) | 3,379 | 5,418 | ||||||||
| Total operating expenses | 95,869 | 88,177 | 90,959 | |||||||||
| Income from operations | 17,279 | 13,417 | 30,498 | |||||||||
| Interest income and other, net | 611 | 309 | 922 | |||||||||
| Income before income taxes | 17,890 | 13,726 | 31,420 | |||||||||
| Income tax provision | 2,134 | 425 | 1,857 | |||||||||
| Net income | $ | 15,756 | $ | 13,301 | $ | 29,563 | ||||||
| Basic net income per share | $ | 0.45 | $ | 0.39 | $ | 0.83 | ||||||
| Diluted net income per share | $ | 0.43 | $ | 0.38 | $ | 0.78 | ||||||
| Weighted average common shares outstanding: | ||||||||||||
| Basic | 34,871 | 34,050 | 35,830 | |||||||||
| Diluted | 36,247 | 35,160 | 37,826 | |||||||||
| (1) Includes stock-based compensation expense | $ | 510 | $ | 312 | $ | 393 | ||||||
| (2) Includes stock-based compensation expense | 6,922 | 5,909 | 6,742 | |||||||||
| (3) Includes stock-based compensation expense | 11,220 | 6,905 | 9,675 | |||||||||
| Total stock-based compensation expense | $ | 18,652 | $ | 13,126 | $ | 16,810 | ||||||
Year Ended December 31, | ||||||||||||
2015 | 2014 | 2013 | ||||||||||
Revenue | $ | 333,067 | $ | 282,535 | $ | 238,091 | ||||||
Cost of revenue | 152,898 | 129,917 | 110,190 | |||||||||
Gross profit | 180,169 | 152,618 | 127,901 | |||||||||
Operating expenses: | ||||||||||||
Research and development | 65,787 | 58,590 | 49,733 | |||||||||
Selling, general and administrative | 72,312 | 66,755 | 54,624 | |||||||||
Litigation expense (benefit), net | 1,000 | (8,027 | ) | (371 | ) | |||||||
Total operating expenses | 139,099 | 117,318 | 103,986 | |||||||||
Income from operations | 41,070 | 35,300 | 23,915 | |||||||||
Interest and other income, net | 1,421 | 1,092 | 92 | |||||||||
Income before income taxes | 42,491 | 36,392 | 24,007 | |||||||||
Income tax provision | 7,319 | 897 | 1,109 | |||||||||
Net income | $ | 35,172 | $ | 35,495 | $ | 22,898 | ||||||
Net income per share: | ||||||||||||
Basic | $ | 0.89 | $ | 0.92 | $ | 0.61 | ||||||
Diluted | $ | 0.86 | $ | 0.89 | $ | 0.59 | ||||||
Weighted-average shares outstanding: | ||||||||||||
Basic | 39,470 | 38,686 | 37,387 | |||||||||
Diluted | 40,869 | 39,793 | 38,620 | |||||||||
Cash dividends declared per common share | $ | 0.80 | $ | 0.45 | $ | - | ||||||
See accompanying notes to consolidated financial statements
MONOLITHIC POWER SYSTEMS, INC.
CONSOLIDATED STATEMENTS OF COMPREHENSIVE INCOME
(in thousands)
| Year Ended December 31, | ||||||||||||
| 2012 | 2011 | 2010 | ||||||||||
| Net income | $ | 15,756 | $ | 13,301 | $ | 29,563 | ||||||
| Other comprehensive income (loss), net of tax: | ||||||||||||
| Auction-rate securities valuation reserve adjustment, net of $0 tax in 2012, 2011 and 2010 | 140 | 270 | 160 | |||||||||
| Unrealized gain (loss) on available-for-sale securities, net of $0 tax in 2012, 2011 and 2010 | 34 | (37 | ) | 104 | ||||||||
| Foreign currency translation adjustments, net of $0 tax in 2012, 2011 and 2010 | 408 | 1,381 | 1,361 | |||||||||
| Comprehensive income | $ | 16,338 | $ | 14,915 | $ | 31,188 | ||||||
Year Ended December 31, | ||||||||||||
2015 | 2014 | 2013 | ||||||||||
Net income | $ | 35,172 | $ | 35,495 | $ | 22,898 | ||||||
Other comprehensive income (loss), net of tax: | ||||||||||||
Change in unrealized losses on auction-rate securities,net of $0 tax in 2015, 2014 and 2013 | (28 | ) | 179 | 130 | ||||||||
Change in unrealized gains/losses on other available-for-sale securities,net of $0 tax in 2015, 2014 and 2013 | (151 | ) | (19 | ) | (33 | ) | ||||||
Foreign currency translation adjustments | (4,166 | ) | (609 | ) | 1,988 | |||||||
Total other comprehensive income (loss), net of tax | (4,345 | ) | (449 | ) | 2,085 | |||||||
Comprehensive income | $ | 30,827 | $ | 35,046 | $ | 24,983 | ||||||
See accompanying notes to consolidated financial statements
MONOLITHIC POWER SYSTEMS, INC.
CONSOLIDATED STATEMENTS OF STOCKHOLDERS’ EQUITY
(in thousands, except share amounts)
| Common Stock | Retained | Accumulated Other | Total Stockholders’ | |||||||||||||||||
| Shares | Amount | Earnings | Income | Equity | ||||||||||||||||
| Balance as of January 1, 2010 | 35,165,316 | $ | 175,518 | $ | 37,085 | $ | 354 | $ | 212,957 | |||||||||||
| Net income | 29,563 | 29,563 | ||||||||||||||||||
| Auction rate securities valuation reserve adjustment | 160 | 160 | ||||||||||||||||||
| Unrealized gains on available-for-sale securities | 104 | 104 | ||||||||||||||||||
| Foreign currency translation | 1,361 | 1,361 | ||||||||||||||||||
| Exercise of stock options and related tax benefit including net excess tax benefit of ($1,256) | 1,452,245 | 15,597 | 15,597 | |||||||||||||||||
| Repurchase of common shares | (1,899,789 | ) | (31,527 | ) | (31,527 | ) | ||||||||||||||
| Shares purchased through employee stock purchase plan | 114,387 | 1,885 | 1,885 | |||||||||||||||||
| Stock-based compensation expense, net of forfeitures | 16,803 | 16,803 | ||||||||||||||||||
| Compensation expense for non-employee stock options | (7 | ) | (7 | ) | ||||||||||||||||
| Release of restricted stock upon vesting | 230,874 | - | ||||||||||||||||||
| Balance as of December 31, 2010 | 35,063,033 | $ | 178,269 | $ | 66,647 | $ | 1,979 | $ | 246,895 | |||||||||||
| Net income | 13,301 | 13,301 | ||||||||||||||||||
| Auction rate securities valuation reserve adjustment | 270 | 270 | ||||||||||||||||||
| Unrealized losses on available-for-sale securities | (37 | ) | (37 | ) | ||||||||||||||||
| Foreign currency translation | 1,381 | 1,381 | ||||||||||||||||||
| Exercise of stock options and related tax benefit including net excess tax benefit of ($27) | 685,417 | 4,630 | 4,630 | |||||||||||||||||
| Repurchase of common shares | (2,485,500 | ) | (38,472 | ) | (38,472 | ) | ||||||||||||||
| Shares purchased through employee stock purchase plan | 149,981 | 1,773 | 1,773 | |||||||||||||||||
| Stock-based compensation expense, net of forfeitures | 13,123 | 13,123 | ||||||||||||||||||
| Compensation expense for non-employee stock options | 13 | 13 | ||||||||||||||||||
| Release of restricted stock upon vesting | 413,101 | - | ||||||||||||||||||
| Balance as of December 31, 2011 | 33,826,032 | $ | 159,336 | $ | 79,948 | $ | 3,593 | $ | 242,877 | |||||||||||
| Net income | 15,756 | 15,756 | ||||||||||||||||||
| Auction rate securities valuation reserve adjustment | 140 | 140 | ||||||||||||||||||
| Unrealized gains on available-for-sale securities | 34 | 34 | ||||||||||||||||||
| Foreign currency translation | 408 | 408 | ||||||||||||||||||
| Cash dividend | (35,664 | ) | (35,664 | ) | ||||||||||||||||
| Exercise of stock options and related tax benefit including net excess tax benefit of ($869) | 1,151,884 | 14,232 | 14,232 | |||||||||||||||||
| Shares purchased through employee stock purchase plan | 151,770 | 1,852 | 1,852 | |||||||||||||||||
| Stock-based compensation expense, net of forfeitures | 18,642 | 18,642 | ||||||||||||||||||
| Compensation expense for non-employee stock options | 17 | 17 | ||||||||||||||||||
| Release of restricted stock upon vesting | 543,596 | - | ||||||||||||||||||
| Balance as of December 31, 2012 | 35,673,282 | $ | 194,079 | $ | 60,040 | $ | 4,175 | $ | 258,294 | |||||||||||
Common Stock and Additional Paid-in Capital | Retained | Accumulated Other Comprehensive | Total Stockholders’ | |||||||||||||||||
Shares | Amount | Earnings | Income | Equity | ||||||||||||||||
Balance as of January 1, 2013 | 35,673 | $ | 194,079 | $ | 60,040 | $ | 4,175 | $ | 258,294 | |||||||||||
Net income | - | - | 22,898 | - | 22,898 | |||||||||||||||
Other comprehensive income | - | - | - | 2,085 | 2,085 | |||||||||||||||
Exercise of stock options | 2,446 | 37,877 | - | - | 37,877 | |||||||||||||||
Repurchase of common shares | (664 | ) | (20,615 | ) | - | - | (20,615 | ) | ||||||||||||
Shares issued under the employee stock purchase plan | 111 | 2,145 | - | - | 2,145 | |||||||||||||||
Stock-based compensation expense | - | 20,715 | - | - | 20,715 | |||||||||||||||
Release of restricted stock | 725 | - | - | - | - | |||||||||||||||
Balance as of December 31, 2013 | 38,291 | 234,201 | 82,938 | 6,260 | 323,399 | |||||||||||||||
Net income | - | - | 35,495 | - | 35,495 | |||||||||||||||
Other comprehensive loss | - | - | - | (449 | ) | (449 | ) | |||||||||||||
Dividends and dividend equivalents declared | - | - | (18,319 | ) | - | (18,319 | ) | |||||||||||||
Exercise of stock options | 742 | 11,941 | - | - | 11,941 | |||||||||||||||
Repurchase of common shares | (1,051 | ) | (41,198 | ) | - | - | (41,198 | ) | ||||||||||||
Shares issued under the employee stock purchase plan | 78 | 2,078 | - | - | 2,078 | |||||||||||||||
Stock-based compensation expense | - | 33,459 | - | - | 33,459 | |||||||||||||||
Tax benefits from equity awards | - | 19 | - | - | 19 | |||||||||||||||
Release of restricted stock | 772 | - | - | - | - | |||||||||||||||
Balance as of December 31, 2014 | 38,832 | 240,500 | 100,114 | 5,811 | 346,425 | |||||||||||||||
Net income | - | - | 35,172 | - | 35,172 | |||||||||||||||
Other comprehensive loss | - | - | - | (4,345 | ) | (4,345 | ) | |||||||||||||
Dividends and dividend equivalents declared | - | - | (33,999 | ) | - | (33,999 | ) | |||||||||||||
Exercise of stock options | 498 | 7,744 | - | - | 7,744 | |||||||||||||||
Repurchase of common shares | (645 | ) | (32,286 | ) | - | - | (32,286 | ) | ||||||||||||
Shares issued under the employee stock purchase plan | 56 | 2,227 | - | - | 2,227 | |||||||||||||||
Stock-based compensation expense | - | 41,650 | - | - | 41,650 | |||||||||||||||
Tax benefits from equity awards | - | 5,928 | - | - | 5,928 | |||||||||||||||
Release of restricted stock | 948 | - | - | - | - | |||||||||||||||
Balance as of December 31, 2015 | 39,689 | $ | 265,763 | $ | 101,287 | $ | 1,466 | $ | 368,516 | |||||||||||
See accompanying notes to consolidated financial statements
MONOLITHIC POWER SYSTEMS, INC.
CONSOLIDATED STATEMENTS OF CASH FLOWS
(in thousands)
| Year Ended December 31, | ||||||||||||
| 2012 | 2011 | 2010 | ||||||||||
| Cash flows from operating activities: | ||||||||||||
| Net income | $ | 15,756 | $ | 13,301 | $ | 29,563 | ||||||
| Adjustments to reconcile net income to net cash provided by operating activities: | ||||||||||||
| Depreciation and amortization | 9,332 | 8,732 | 8,016 | |||||||||
| Loss on disposal of property and equipment | 81 | 33 | 1 | |||||||||
| Amortization and realized gain on available-for-sale securities | 254 | 376 | 688 | |||||||||
| Deferred income tax assets | (8 | ) | (403 | ) | (56 | ) | ||||||
| Gain on auction-rate securities | (40 | ) | - | - | ||||||||
| Tax benefit from stock option transactions | 3,009 | 1,958 | 3,349 | |||||||||
| Excess tax benefit from stock option transactions | (869 | ) | (27 | ) | (1,256 | ) | ||||||
| Stock-based compensation | 18,652 | 13,126 | 16,810 | |||||||||
| Changes in operating assets and liabilities: | ||||||||||||
| Accounts receivable | (4,286 | ) | 3,250 | (2,826 | ) | |||||||
| Inventories | (12,004 | ) | 5,699 | (6,184 | ) | |||||||
| Prepaid expenses and other current assets | (456 | ) | 673 | 378 | ||||||||
| Accounts payable | 754 | (957 | ) | 1,155 | ||||||||
| Accrued and other long-term liabilities | (2,097 | ) | (438 | ) | 556 | |||||||
| Accrued income taxes payable and noncurrent tax liabilities | (1,533 | ) | (2,127 | ) | (1,995 | ) | ||||||
| Accrued compensation and related benefits | (1,633 | ) | 489 | 295 | ||||||||
| Net cash provided by operating activities | 24,912 | 43,685 | 48,494 | |||||||||
| Cash flows from investing activities: | ||||||||||||
| Property and equipment purchases | (21,059 | ) | (21,022 | ) | (22,779 | ) | ||||||
| Proceeds from sale of property and equipment | 13 | - | - | |||||||||
| Purchases of short-term investments | (143,094 | ) | (78,250 | ) | (208,621 | ) | ||||||
| Proceeds from sale of short-term investments | 135,183 | 129,719 | 197,243 | |||||||||
| Proceeds from sale of long-term investments | 2,100 | 5,775 | 425 | |||||||||
| Changes in restricted assets | 20 | - | (19 | ) | ||||||||
| Net cash provided by (used in) investing activities | (26,837 | ) | 36,222 | (33,751 | ) | |||||||
| Cash flows from financing activities: | ||||||||||||
| Proceeds from issuance of common stock | 13,390 | 4,697 | 14,339 | |||||||||
| Proceeds from employee stock purchase plan | 1,852 | 1,773 | 1,885 | |||||||||
| Repurchase of common stock | - | (38,472 | ) | (31,527 | ) | |||||||
| Dividend payment | (35,664 | ) | - | - | ||||||||
| Excess tax benefits from stock option transactions | 869 | 27 | 1,256 | |||||||||
| Net cash used in financing activities | (19,553 | ) | (31,975 | ) | (14,047 | ) | ||||||
| Effect of change in exchange rates | 211 | 429 | 597 | |||||||||
| Net increase (decrease) in cash and cash equivalents | (21,267 | ) | 48,361 | 1,293 | ||||||||
| Cash and cash equivalents, beginning of period | 96,371 | 48,010 | 46,717 | |||||||||
| Cash and cash equivalents, end of period | $ | 75,104 | $ | 96,371 | $ | 48,010 | ||||||
| Supplemental disclosures for cash flow information: | ||||||||||||
| Cash paid for taxes | $ | 807 | $ | 675 | $ | 35 | ||||||
| Supplemental disclosures of non-cash investing and financing activities: | ||||||||||||
| Liability accrued for equipment purchases | $ | 1,728 | $ | 1,483 | $ | 4,264 | ||||||
| Reversal of temporary impairment of auction-rate securities | $ | (140 | ) | $ | (270 | ) | $ | (160 | ) | |||
Year Ended December 31, | ||||||||||||
2015 | 2014 | 2013 | ||||||||||
Cash flows from operating activities: | ||||||||||||
Net income | $ | 35,172 | $ | 35,495 | $ | 22,898 | ||||||
Adjustments to reconcile net income to net cash provided by operating activities: | ||||||||||||
Depreciation and amortization of intangible assets | 13,783 | 13,130 | 12,160 | |||||||||
Loss (gain) on sales of property and equipment | (339 | ) | - | 31 | ||||||||
Premium amortization and loss on investments | 596 | 96 | 443 | |||||||||
Change in fair value of contingent consideration | (2,507 | ) | - | - | ||||||||
Deferred taxes, net | 42 | 17 | (81 | ) | ||||||||
Stock-based compensation expense | 41,563 | 33,454 | 20,701 | |||||||||
Excess tax benefit from equity awards | (5,928 | ) | (10 | ) | - | |||||||
Changes in operating assets and liabilities, net of effects of an acquisition: | ||||||||||||
Accounts receivable | (5,201 | ) | (1,870 | ) | (4,347 | ) | ||||||
Inventories | (22,210 | ) | (1,142 | ) | (7,606 | ) | ||||||
Prepaid expenses and other assets | (390 | ) | (2,029 | ) | 121 | |||||||
Accounts payable | 147 | 1,632 | 1,440 | |||||||||
Accrued liabilities | 9,942 | (3,102 | ) | 12,149 | ||||||||
Income tax liabilities | 3,998 | (248 | ) | 86 | ||||||||
Accrued compensation and related benefits | 1,068 | (1,290 | ) | 2,691 | ||||||||
Net cash provided by operating activities | 69,736 | 74,133 | 60,686 | |||||||||
Cash flows from investing activities: | ||||||||||||
Property and equipment purchases | (16,024 | ) | (9,511 | ) | (15,764 | ) | ||||||
Proceeds from sales of property and equipment | 340 | - | 88 | |||||||||
Purchases of short-term investments | (223,018 | ) | (136,872 | ) | (125,756 | ) | ||||||
Proceeds from sales of short-term investments | 189,549 | 149,291 | 85,700 | |||||||||
Proceeds from sales of long-term investments | - | 4,650 | 2,025 | |||||||||
Contributions to employee deferred compensation plan, net | (8,044 | ) | (5,335 | ) | (617 | ) | ||||||
Cash paid for an acquisition, net of cash acquired | - | (11,590 | ) | - | ||||||||
Net cash used in investing activities | (57,197 | ) | (9,367 | ) | (54,324 | ) | ||||||
Cash flows from financing activities: | ||||||||||||
Property and equipment purchased on extended payment terms | (300 | ) | (400 | ) | (557 | ) | ||||||
Proceeds from exercise of stock options | 7,744 | 11,941 | 37,877 | |||||||||
Proceeds from shares issued under the employee stock purchase plan | 2,227 | 2,078 | 2,145 | |||||||||
Repurchases of common shares | (32,286 | ) | (41,198 | ) | (20,615 | ) | ||||||
Dividends and dividend equivalents paid | (29,965 | ) | (11,658 | ) | - | |||||||
Excess tax benefit from equity awards | 5,928 | 10 | - | |||||||||
Net cash provided by (used in) financing activities | (46,652 | ) | (39,227 | ) | 18,850 | |||||||
Effect of change in exchange rates | (1,293 | ) | (486 | ) | 897 | |||||||
Net increase (decrease) in cash and cash equivalents | (35,406 | ) | 25,053 | 26,109 | ||||||||
Cash and cash equivalents, beginning of period | 126,266 | 101,213 | 75,104 | |||||||||
Cash and cash equivalents, end of period | $ | 90,860 | $ | 126,266 | $ | 101,213 | ||||||
Supplemental disclosures for cash flow information: | ||||||||||||
Cash paid for taxes and interest | $ | 3,322 | $ | 1,235 | $ | 1,116 | ||||||
Supplemental disclosures of non-cash investing and financing activities: | ||||||||||||
Liability accrued for property and equipment purchases | $ | 2,184 | $ | 1,487 | $ | 1,941 | ||||||
Liability accrued for dividends and dividend equivalents | $ | 10,109 | $ | 6,660 | $ | - | ||||||
Fair value of contingent consideration related to an acquisition | $ | - | $ | 2,507 | $ | - | ||||||
See accompanying notes to consolidated financial statements
MONOLITHIC POWER SYSTEMS, INC.
NOTES TO CONSOLIDATED FINANCIAL STATEMENTS
1. Summary of Significant Accounting PoliciesSUMMARY OF SIGNIFICANT ACCOUNTING POLICIES
Business—
Monolithic Power Systems, Inc. (“MPS” or “the Company”the “Company”) was incorporated in the State of California on August 22, 1997. On November 17, 2004, the Company was reincorporated in the State of Delaware. MPS designs, develops and markets proprietary, advanced analogintegrated power semiconductor solutions and mixed-signal semiconductors. The Company combines advanced process technology with its highly experienced analog designerspower delivery architectures. MPS's mission is to produce high-performanceprovide innovative power management integrated circuits (ICs) for DC to DC converters, LED drivers, Cold Cathode Fluorescent Lamp (CCFL) backlight controllers, Class-D audio amplifiers,solutions in communications, storage and other Linear ICs. MPS products are used extensively in computing, and network communications products, LCD monitors and TVs, and a wide variety of consumer and portable electronics products. MPS contracts with world-class manufacturing organizations to deliver top quality, ultra-compact, high-performance solutions through productive, cost-efficient channels.
Basis of Presentation—
The consolidated financial statements include the accounts of Monolithic Power Systems, Inc.the Company and its wholly owned subsidiaries. All significant intercompany accounts and transactions have been eliminated in consolidation.
Foreign Currency — The Company’s foreign subsidiaries operate primarily using their respective local currencies, and therefore, the local currency has been determined to be the functional currency for each foreign subsidiary. Accordingly, all assets and liabilities of the Company’s foreign subsidiaries are translated using exchange rates in effect at the end of the period. Revenue and costs are translated using average exchange rates for the period. The resulting translation adjustments are presented as a separate component of accumulated other comprehensive income in stockholders’ equity in the Consolidated Balance Sheets. Foreign currency transaction gains and losses are reported in interest income and other, net in the Consolidated Statements of Operations.
The preparation of financial statements in conformity with accounting principles generally accepted in the United States of America (“GAAP”) requires management to make estimates and assumptions that affect the reported amounts of assets and liabilities and disclosure of contingent assets and liabilities at the date of the financial statements, and reported amounts of revenue and expenses during the reporting period. Significant estimates and assumptions used in these consolidated financial statements primarily include those related to revenue recognition, inventory valuation, valuation of share-based awards, valuation of goodwill and acquisition-related intangible assets, contingencies and tax valuation allowances. Actual results could differ from those estimates.
Certain Significant Risks and Uncertainties—
Financial instruments which potentially subject the Company to concentrations of credit risk consist primarily of cash and cash equivalents, short-term and long-term investments and accounts receivable. The Company’s cash consists of checking and savings accounts. The Company’s cash equivalents include short-term, highly liquid investments purchased with remaining maturities at the date of purchase of three months or less. The Company’s short-term investments consist primarily of certificates of deposit, government agenciesagency bonds and treasuries, and the Company’s long-term investments consist of government-backed student loan auction-rate securities. The Company generally does not require its customers to provide collateral or other security to support accounts receivable. To manage credit risk, management performs ongoing credit evaluations of its customers’ financial condition. The Company requires cash in advance for certain customers in addition to ongoing credit evaluations for those where credit has been extended.
The Company participates in the dynamic high technology industry and believes that changes in any of the following areas could have a material adverse effect on the Company’sits future financial position, results of operations or cash flows: advances and trends in new technologies and industry standards; competitive pressures in the form of new products or price reductions on current products; changes in product mix; changes in the overall demand for products offered by the Company; changes in third-party manufacturers; changes in key suppliers; changes in certain strategic relationships or customer relationships; litigation or claims against the Company based on intellectual property, patent, product, regulatory or other factors; fluctuations in foreign currency exchange rates; risk associated with changes in domestic and international economic and/or political regulations; availability of necessary components or subassemblies;sub-assemblies; availability of foundry capacity; ability to integrate acquired companies; and the Company’s ability to attract and retain employees necessary to support its growth.
Foreign Currency
The functional currency of the Company’s international subsidiaries is generally the local currency. The primary subsidiaries are located in China and Taiwan, which utilize the Renminbi and the New Taiwan Dollar as their currencies, respectively. Accordingly, assets and liabilities of the foreign subsidiaries are translated using exchange rates in effect at the end of the period. Revenue and costs are translated using average exchange rates for the period. The resulting translation adjustments are presented as a separate component of accumulated other comprehensive income in stockholders’ equity in the Consolidated Balance Sheets. In addition, the Company incurs foreign currency exchange gains or losses related to the timing of payments for transactions between the U.S. and its foreign subsidiaries.Foreign currency transaction gains (losses) are reported in interest and other income, net, in the Consolidated Statements of Operations and totaled $0.6 million, $0.1 million and $(0.6) million for the years ended December 31, 2015, 2014 and 2013, respectively.
Cash and Cash Equivalents
The Company classifies all highly liquid investments with stated maturities of three months or less from date of purchase as cash equivalents.
Fair Value of Financial Instruments— ASC 820-10
Fair Value Measurements and Disclosures – Overall definesvalue is estimated by applying the following hierarchy, which prioritizes the inputs used to measure fair value establishes a framework for measuringinto three levels and bases the categorization within the hierarchy upon the lowest level of input that is available and significant to the fair value and requiresmeasurement:
Level 1: Quoted prices (unadjusted) for identical assets or liabilities in active markets
Level 2: Inputs other than the quoted prices in active markets that assets and liabilities carried at fair value be classified and disclosed in one of three categories, as follows:
Level of Activity for the Asset or Liability Have Significantly Decreased and Identifying Transactions That Are Not Orderly
The Company’s financial instruments include cash and cash equivalents, and short-term and long-term investments. Cash equivalents are stated at cost, which approximates fair market value. Short-termThe Company’s short-term and long-term investments are classified as available-for-sale securities and are stated at their fair market value.
The Company determines whether an impairment is $12.3 million, all of which is classified as long-term available-for-sale investments.
As of December 31, 2012, we were able to redeem a security at face2015 and 2014, the fair value forof the Company’s holdings in auction-rate securities was $5.4 million, all of which an other-than-temporary impairment (“OTTI”) of $40,000 had previously been recorded for and therefore, recognized a gain of $40,000 in interest income and other, net, in our Consolidated Statement of Operations.
Inventories
Inventories are stated at the lower of the standard cost (which approximates actual cost determined on a first-in first-out basis) or current market value. Market is based on estimated marketnet realizable value. The Company writes down excess and obsolete inventory for obsolescence or lack of demand, based on assumptions about futureits age and forecasted demand, which includes estimates taking into consideration the Company’s outlook on market and economic conditions, technology changes, new product introductions and changes in strategic direction. Actual demand may differ from forecasted demand, and market conditions. If actual market conditions are less favorable than those projected by management, additionalsuch differences may have a material effect on recorded inventory write-downs may be required. Conversely, if market conditions are more favorable,values. When the Company records a write-down on inventory, may be soldit establishes a new, lower cost basis for that was previously reserved. The Company monitors manufacturing variancesinventory, and revises standard costs if necessary.
Property and Equipment—
Property and equipment are stated at cost. Depreciation is computed using the straight-line method over the estimated useful lives of the assets, generally threeassets. Buildings and building improvements have estimated useful lives of 30 to forty40 years. Leasehold improvements are amortized over the shorter of the estimated useful lifelives or the lease period. Computer, software and production equipment have estimated useful lives of three to seven years. Transportation equipment has estimated useful lives of 5 to 15 years. Furniture and fixtures have estimated useful lives of three to five years.
Goodwill and Acquisition-Related Intangible Assets
Goodwill represents the excess of the fair value of purchase consideration over the fair value of net tangible and identified intangible assets as of the date of acquisition. In-process research and development (“IPR&D”) assets represent the fair value of incomplete R&D projects that had not reached technological feasibility as of the date of acquisition. The IPR&D assets are initially capitalized at fair value as intangible assets with indefinite lives and assessed for impairment at each reporting period. When the IPR&D projects are completed, they are reclassified as amortizable intangible assets and are amortized over their estimated useful lives. Alternatively, if the IPR&D projects are abandoned, they are impaired and expensed to research and development.
Acquisition-related intangible assets with finite lives consist of know-how and developed technologies. These assets are amortized on a straight-line basis over the estimated useful lives of three to five years and the amortization expense is recorded in cost of revenue in the Consolidated Statements of Operations.
Other Long-Term Assets
Other assets primarily consist of intangible assets for the land use rights in Chengdu, building was placed in service in October 2010. In May 2012, the Company movedChina, purchased patents, long-term lease deposits and investments related to the Company-owned headquarters located in San Jose, California. Buildingsemployee deferred compensation plan. The Company amortizes the land use rights over 50 years and building improvements have a depreciation lifethe purchased patents over five years.
Impairment of up to 40 years.
The Company evaluates long-lived assets, other than goodwill and acquisition-related intangible assets with indefinite useful lives, for impairment whenever events or changes in circumstances indicate that the carrying amount of an asset may not be recoverable. An impairment loss would be recognized when the sum of the undiscounted future net cash flows expected to result from the use of the asset and its eventual disposition is less than its carrying amount. Such impairment loss would be measured as the difference between the carrying amount of the asset and its fair value based on the present value of estimated future cash flows.
The Company tests goodwill for impairment at least annually in the fourth quarter of intangible assetsthe year, or whenever events or changes in circumstances indicate that goodwill may be impaired. The Company has elected to first assess the qualitative factors to determine whether it is more likely than not that the fair value of the reporting unit is less than its carrying amount. If the Company determines that it is more likely than not that its fair value is less than the carrying amount, then the two-step goodwill impairment test is performed. The first step compares the fair value of the reporting unit with its carrying amount. If the carrying amount exceeds its fair value, the second step measures the impairment loss by comparing the implied fair value of the goodwill with the carrying amount. No impairment of goodwill has been identified in any of the periods presented.
Deferred Compensation Plan
The Company has a non-qualified, unfunded deferred compensation plan,which provides certain key employees, including executive management, with the ability to defer the receipt of compensation in order to accumulate funds for retirement on a tax deferred basis. The Company does not make contributions to the plan or guarantee returns on the investments. The Company is responsible for the land use rights in Chengdu, purchased patentsplan’s administrative expenses. Participants’ deferrals and long-term lease deposits. We amortizeinvestment gains and losses remain as the land use rights over 50 yearsCompany’s liabilities and the purchased patents upunderlying assets are subject to five years.claims of general creditors.
The liabilities for compensation deferred under the plan are recorded at fair value in each reporting period and are included in other long-term liabilities in the Consolidated Balance Sheets. Changes in the fair value of the liabilities are recorded as an operating expense (credit) in the Consolidated Statements of Operations. The Company manages the risk of changes in the fair value of the liabilities by electing to match the liabilities with investments in corporate-owned life insurance policies and mutual funds that offset a substantial portion of the exposure. The investments are recorded in other long-term assets in the Consolidated Balance Sheets at the cash surrender value of the corporate-owned life insurance policies and the fair value of the mutual funds, which are classified as trading securities. Changes in the cash surrender value of the corporate-owned life insurance policies and the fair value of mutual fund investments are included in interest and other income, net in the Consolidated Statements of Operations. As of December 31, 2015 and 2014, the plan assets totaled $14.0 million and $6.1 million, and the plan liabilities totaled $14.1 million and $6.2 million, respectively.
Warranty Reserves
The Company generally provides a one to two-year warranty against defects in materials and workmanship and will either repair the goods or provide replacement products at no charge to the customer for defective products. Reserve requirements are recorded in the period of sale and are based on an assessment of the products sold with warranty and historical warranty costs incurred. Historically, the warranty expenses have not been material to the Company’s consolidated financial statements.
Revenue Recognition—
The Company recognizes revenue in accordance with Financial Accounting Standards Board (“FASB”) – Accounting Standards Codification (“ASC”) 605-10-S25 Revenue Recognition – Overall – Recognition. ASC 605-10-S25 requires thatwhen the following four basic criteria must be met before revenue can be recognized:are met: (1) persuasive evidence of an arrangement exists; (2) delivery has occurred or services have been rendered; (3) the fee is fixed or determinable; and (4) collectability is reasonably assured. Determination of criteria (3) and (4) are based on management’s judgment regarding the fixed nature of the feefees charged for products delivered and the collectability of those fees. The application of these criteria has resulted in the Company generally recognizing revenue upon shipment (when title passes)and risk of loss have transferred to customers.
The Company’s revenue consists primarily of sales of assembled and tested finished goods. The Company also sells die in wafer form to its customers and value-added resellers, and the Company receives royalty revenue from third parties and value-added resellers.
For the years ended December 31, 2015, 2014 and 2013, approximately 96%, 92% and 91% of the Company’s distributor sales, respectively, including sales to the Company’s value-added resellers, for the year ended December 31, 2012 were made through distribution arrangements with third parties. These agreementsarrangements generally do not include any special payment terms (the Company’s normal payment terms are 30-45 days for theits distributors), price protection or exchange rights. Returns are limited to the Company’s standard product warranty. Certain of the Company’s large distributors have contracts that include limited stock rotation rights that permit the return of a small percentage of the previous six months’ purchases.
For the years ended December 31, 2015, 2014 and 2013, approximately 4%, 8% and 9% of the Company’s distributor sales, for the year ended December 31, 2012respectively, were made through small distributors primarily based on purchase orders. These distributors alsotypically have limited or no stock rotation rights.
The Company also sells die in wafer formgenerally recognizes revenue upon shipment of products to its customers and value-added resellers, and the Company receives royalty revenue from third parties and value-added resellers.
(1) | The price is fixed or determinable at the date of sale. The Company does not offer special payment terms, priceprotection or price adjustments to distributors when the Company recognizes revenue upon shipment. | |
(2) | The distributors are obligated to pay the Company and this obligation is not contingent on the resale of theCompany’s products. | |
(3) | The distributors’ obligation is unchanged in the event of theft or physical destruction or damage to the products. | |
(4) | The distributors have stand-alone economic substance apart from the Company’s relationship. | |
(5) | The Company does not have any obligations for future performance to directly bring about the resale of its productsby the distributors. | |
(6) | The amount of future returns can be reasonably estimated. The Company has the ability and the informationnecessary to track inventory sold to and held at its distributors. The Company maintains a history of returns andhas the ability to estimate the stock rotation returns on a quarterly basis. |
The Company maintains a sales reserve for stock rotation rights, which is based on historical experience of actual stock rotation returns on a per distributor basis, where available, and information related to products in the distribution channel. This reserve is recorded at the time of sale. Historically, these returns were not material to the Company’s consolidated financial statements.
If the Company enters into arrangements that have rights of return that are not estimable, the Company recognizes revenue under such arrangements only after the distributor hasdistributors have sold itsthe products to an end customer.
Stock-Based Compensation—
The Company accounts for stock-based compensation under the provisions of ASC 718-10-30 Compensation – Stock Compensation – Overall – Initial Measurement. This standard requires the Company to measuremeasures the cost of employee services received in exchange for an award of equity instruments based on the grant-date fair value of the award.The Company currently uses the Black-Scholes option-pricing model to estimate the fair value of its share-based payments. The Black-Scholes option-pricing model is based on a number of assumptions, including historical volatility, expected life, risk-free interest rate and expected dividends. The fair value for time-basedrestricted stock awards and stock awards that are contingent upon the achievement of financialunits with service conditions or performance metricsconditions is based on the grant date share price. The fair value of restricted stock units with market conditions, as well as restricted stock units containing both market conditions and performance conditions, is estimated using a Monte Carlo simulation model. The fair value of options and shares issued under the employee stock purchase plan is estimated using the Black-Scholes model.
The Company recognizes compensation expense equal to the grant-date fair value for all share-based payment awards that are expected to vest. ThisCompensation expense related to awards with service conditions is recorded on a straight-line basis over the requisite service period of the entire award, unless theperiod. Compensation expense related to awards are subject to market conditions or performance conditions in which case we recognize compensation expenseis recognized over the requisite service period offor each separateseparately vesting tranche. We recognize
For awards with performance conditions, as well as awards containing both market conditions and performance conditions, the Company recognizes compensation expense for our performance share units when it becomes probable that the performance criteria specified inset by the planBoard of Directors will be achieved. Management performs the probability assessment on a quarterly basis by reviewing external factors, such as macroeconomic conditions and the analog industry forecasts, and internal factors, such as the Company’s business and operations strategy, product roadmaps and revenue forecasts. Changes in the probability assessment of achieving the performance conditions are accounted for in the period of change by recording a cumulative catch-up adjustment as if the new estimate had been applied since the service inception date. Any previously recognized compensation expense is reversed if the performance conditions are not expected to be satisfied. For awards with only market conditions, compensation expense is not reversed if the market conditions are not satisfied. The amount of stock-based compensation expense that the Company recognizes is also based on an expected forfeiture rate. If there is a difference between the forfeiture assumptions used in determining stock-based compensation costs and the actual forfeitures which become known over time, wethe Company may change the forfeiture rate, which could have a significant impact on ourits stock-based compensation expense.
Research and Development—
Costs incurred in research and development are charged to operationsexpensed as incurred.
Accounting for Income Taxes —ASC 740-10 Income Taxes – Overall prescribes a recognition threshold and measurement attribute for the financial statement recognition and measurement of a tax position taken or expected to be taken in a tax return. This interpretation also provides guidance on derecognition, classification, interest and penalties, accounting in interim periods and disclosure. In accordance with ASC 740-10, the
The Company recognizes federal, state and foreign current tax liabilities or assets based on ourits estimate of taxes payable or refundable in the current fiscal year by tax jurisdiction. The Company also recognizes federal, state and foreign deferred tax assets or liabilities for its estimate of future tax effects attributable to temporary differences and carryforwards. The Company records a valuation allowance to reduce any deferred tax assets by the amount of any tax benefits that, based on available evidence and judgment, are not expected to be realized.
The Company’s calculation of current and deferred tax assets and liabilities is based on certain estimates and judgments and involves dealing with uncertainties in the application of complex tax laws. The Company’s estimates of current and deferred tax assets and liabilities may change based, in part, on added certainty or finality or uncertainty to an anticipated outcome, changes in accounting or tax laws in the U.S., or foreign jurisdictions where the Company operates, or changes in other facts or circumstances. In addition, the Company recognizes liabilities for potential U.S. and foreign income tax for uncertain income tax positions taken on its tax returns if it has less than a 50% likelihood of being sustained. If the Company determines that payment of these amounts is unnecessary or if the recorded tax liability is less than its current assessment, the Company may be required to recognize an income tax benefit or additional income tax expense in its financial statements in the period such determination is made. The Company has calculated its uncertain tax positions which were attributable to certain estimates and judgments primarily related to transfer pricing, cost sharing and its international tax structure exposure.
Contingencies
The Company is a party to actions and proceedings in the ordinary course of business, including litigation regarding its shareholders and its intellectual property, challenges to the enforceability or validity of its intellectual property, claims that the Company’s products infringe on the intellectual property rights of others, and employment matters. The pending proceedings involve complex questions of fact and law and will require the expenditure of significant funds and the diversion of other resources to prosecute and defend. In addition, from time to time, the Company becomes aware that it is subject to other contingent liabilities. When this occurs, the Company will evaluate the appropriate accounting for the potential contingent liabilities to determine whether a contingent liability should be recorded. In making this determination, management may, depending on the nature of the matter, consult with internal and external legal counsel and technical experts. Based on the facts and circumstances in each matter, the Company uses its judgment to determine whether it is probable that a contingent loss has occurred and whether the amount of such loss can be estimated. If the Company determines a loss is probable and estimable, the Company records a contingent loss. In determining the amount of a contingent loss, the Company takes into account advice received from experts for each specific matter regarding the status of legal proceedings, settlement negotiations, prior case history and other factors. Should the judgments and estimates made by management need to be adjusted as additional information becomes available, the Company may need to record additional contingent losses. Alternatively, if the judgments and estimates made by management are adjusted, for example, if a particular contingent loss does not occur, the contingent loss recorded would be reversed.
Litigation Expense (Benefit)
The Company records litigation costs in the period in which they are incurred. Due to the uncertainties inherent in litigation proceedings, the Company generally recognizes the proceeds resulting from settlement of litigation or favorable judgments when the cash is received and there is no further contingency related to the litigation. The proceeds are recorded as a reduction against litigation expense to the extent that litigation costs were previously incurred in the related case. Proceeds in excess of cumulative costs incurred for the case is recorded in interest and other income, net, in the Consolidated Statements of Operations. Litigation expense (benefit), net, includes primarily patent litigation and other contract-related matters.
Net Incomeper Share
Basic net income per share is computed by dividing net income by the weighted-average number of common shares outstanding for the period. Diluted net income per share reflects the potential dilution that would occur if outstanding securities or other contracts to issue common stock were exercised or converted into common stock, and calculated using the treasury stock method.
Contingently issuable shares, including equity awards with performance conditions or market conditions, are considered outstanding common shares and included in the basic net income per share as of the date that all necessary conditions to earn the awards have been satisfied. Prior to the end of the contingency period, the number of contingently issuable shares included in the diluted net income per share is based on the number of shares, if any, that would be issuable under the terms of the arrangement at the end of the reporting period.
The Company’s outstanding restrict stock units contain forfeitable rights to receive dividend equivalents, which are accumulated quarterly during the vesting periods of the restricted stock units and are payable to the employees when the awards vest. Dividend equivalents accumulated on the restricted stock units are forfeited if the employees do not fulfill their service requirement during the vesting periods. Accordingly, these awards are not treated as participating securities in the net income per share calculation.
Comprehensive Income
Comprehensive income represents the change in the Company’s net assets during the period from non-owner sources. Accumulated other comprehensive income presented in the Consolidated Balance Sheets primarily consists of unrealized gains and losses related to available-for-sale investments and foreign currency translation adjustments.
Recent Accounting Pronouncements
In May 2014, the Financial Accounting Standards Board ("FASB") issued Accounting Standards Update (“ASU”) No. 2014-09, Revenue from Contracts with Customers,which outlines a single comprehensive model for entities to use in accounting for revenue arising from contracts with customers. The standard’s core principle is that an entity will recognize revenue when it transfers promised goods or services to customers in an amount that reflects the consideration to which the entity expects to be entitled in exchange for those goods or services. In July 2015, the FASB approved a one-year deferral of the effective date. The standard will be effective for annual reporting periods beginning after December 15, 2017. Early adoption is permitted for reporting periods beginning after December 15, 2016. The standard may be applied retrospectively to each prior period presented or retrospectively with the cumulative effect recognized as of the date of adoption. The Company is evaluating the impact of the adoption on its consolidated financial position, results of operations, cash flows and disclosures.
In November 2015, the FASB issued ASU No. 2015-17,Balance Sheet Classification of Deferred Taxes,which requires that all deferred tax assets and liabilities, including related valuation allowance, be classified as non-current on the balance sheets. TheCompany has elected to early adopt the standard as of December 31, 2015 on a retrospective basis. As of December 31, 20122014, the Company reclassified $0.2 million of current deferred tax assets to non-current deferred tax assets on the Consolidated Balance Sheet. The adoption did not affect the Company's operating results, comprehensive income or cash flows for the periods presented.
2. ACQUISITION
On July 22, 2014 (the “Acquisition Date”), the Company acquired 100% of the outstanding capital stock of Sensima Technology SA (“Sensima”), a company based in Switzerland that develops magnetic sensor technologies for angle measurements as well as three-dimensional magnetic field sensing. The acquisition creates new opportunities with customers by offering enhanced solutions in power management for key industries such as automotive, industrial and 2011,cloud computing. As a result of the acquisition, Sensima became a subsidiary of the Company and changed its name to MPS Tech Switzerland Sarl. Its results of operations have been included in the Company’s consolidated financial statements subsequent to the acquisition.
Purchase Consideration
The fair value of the purchase consideration as of the Acquisition Date consisted of the following (in thousands):
Cash paid at the Acquisition Date | $ | 11,735 | ||
Contingent consideration | 2,507 | |||
Total | $ | 14,242 |
Cash paid at the Acquisition Date included $1.2 million that was held in an escrow account for a one-year period, which was subject to Sensima’s satisfaction of certain representations and warranties. The full amount was released from the escrow account on July 22, 2015.
The contingent consideration arrangement requires the Company to pay up to an additional $8.9 million to former Sensima shareholders if Sensima achieves a new product introduction as well as certain product revenue and direct margin targets in 2016. The fair value of the contingent consideration at the Acquisition Date was $2.5 million, which was estimated based on a probability-weighted analysis of possible future revenue outcomes. The fair value of the contingent consideration was recorded in other long-term liabilities in the Consolidated Balance Sheets and was remeasured at the end of each reporting period, with any changes in fair value recorded in operating expense in the Consolidated Statements of Operations. During the fourth quarter of 2015, the Company determined the fair value of contingent consideration was $0 and recorded the release of the liability of $2.5 million as a credit to selling, general and administrative expenses (see Note 4).
The Company incurred $0.6 million of transaction costs that were expensed as incurred and included in selling, general and administrative expenses in the Consolidated Statements of Operations.
Purchase ConsiderationAllocation
The fair value of assets acquired and liabilities assumed as of the Acquisition Date was as follows (in thousands):
Cash | $ | 145 | ||
Other tangible assets acquired, net of liabilities assumed | 42 | |||
Intangible assets: | ||||
Know-how | 1,018 | |||
Developed technologies | 4,421 | |||
IPR&D | 2,045 | |||
Total identifiable net assets acquired | 7,671 | |||
Goodwill | 6,571 | |||
Total net assets acquired | $ | 14,242 |
Intangible assets with finite lives included know-how and developed technologies with estimated useful lives of three to five years. The fair value of know-how was determined using the relief from royalty method, and the fair value of the developed technologies was determined using the income approach. Intangible assets with indefinite lives included in-process research and development (“IPR&D”), which consisted of incomplete R&D projects that had not reached technological feasibility as of the Acquisition Date. The fair value of the IPR&D assets was determined using the income approach. During the third quarter of 2015, management determined that the acquired IPR&D was completed and reclassified it as a finite-lived intangible asset with an estimated useful life of four years.
Goodwill arising from the acquisition was primarily attributed to synergies which will enable the Company to develop advanced solutions in power management by integrating Sensima’s magnetic sensor technologies. Goodwill is not deductible for tax purposes.
Equity Awards
On the Acquisition Date, the Board of Directors granted $1.7 million of time-based RSUs (or 40,000 shares) to key Sensima employees who became employees of the Company. These awards vest over four years. In addition, the Board of Directors granted $2.0 million of PSUs (or 47,000 shares) to these employees, with the right to earn up to a maximum of $8.0 million based on the achievement of certain cumulative Sensima product revenue targets during the performance period from the Acquisition Date to July 22, 2019. 50% of the awards subject to each revenue goal will vest immediately when the revenue goal is met during the performance period. The remaining shares will vest over the following two years. Vesting is subject to the employees’ continued employment with the Company. These equity awards are considered arrangements for post-acquisition services and the related compensation cost is recognized over the requisite service period if it is probable that the performance goals will be met.
Pro Forma Information(Unaudited)
Supplemental information of the Company’s results of operations on a pro forma basis, as if the Sensima acquisition had been consummated on January 1, 2013, is presented as follows (in thousands, except per-share amounts):
Year Ended December 31, | ||||||||
2014 | 2013 | |||||||
Revenue | $ | 282,584 | $ | 238,181 | ||||
Net income | $ | 33,777 | $ | 20,187 | ||||
Diluted net income per share | $ | 0.85 | $ | 0.52 | ||||
These pro forma results are not necessarily indicative of the Company’s consolidated results of operations in future periods or the results that would have been realized had the Company acquired Sensima during the periods presented. The pro forma results include adjustments primarily related to Sensima’s results of operations, amortization of intangible assets, stock-based compensation expense and the related tax effects.
3. CASH, CASH EQUIVALENTS AND INVESTMENTS
The following is a summary of the Company’s cash, cash equivalents and short-term and long-term investments (in thousands):
December 31, | ||||||||
2015 | 2014 | |||||||
Cash, cash equivalents and investments: | ||||||||
Cash | $ | 58,217 | $ | 66,188 | ||||
Money market funds | 31,640 | 60,078 | ||||||
Certificates of deposit | 21,574 | 22,778 | ||||||
U.S. treasuries and government agency bonds | 123,532 | 89,674 | ||||||
Auction-rate securities backed by student-loan notes | 5,361 | 5,389 | ||||||
Total | $ | 240,324 | $ | 244,107 | ||||
December 31, | ||||||||
Reported as: | 2015 | 2014 | ||||||
Cash and cash equivalents | $ | 90,860 | $ | 126,266 | ||||
Short-term investments | 144,103 | 112,452 | ||||||
Long-term investments | 5,361 | 5,389 | ||||||
Total | $ | 240,324 | $ | 244,107 | ||||
The contractual maturities of the Company’s short-term and long-term available-for-sale investments are as follows (in thousands):
December 31, | ||||||||
2015 | 2014 | |||||||
Due in less than 1 year | $ | 110,898 | $ | 91,335 | ||||
Due in 1 - 5 years | 33,205 | 21,117 | ||||||
Due in greater than 5 years | 5,361 | 5,389 | ||||||
Total | $ | 149,464 | $ | 117,841 | ||||
The following tables summarize the unrealized gain and loss positions related to the Company’s investments in marketable securities designated as available-for sale (in thousands):
December 31, 2015 | ||||||||||||||||||||
Adjusted Cost | Unrealized Gains | Unrealized Losses | Total Fair Value | Fair Value of Investments in Unrealized Loss Position | ||||||||||||||||
Money market funds | $ | 31,640 | $ | - | $ | - | $ | 31,640 | $ | - | ||||||||||
Certificates of deposit | 21,574 | - | - | 21,574 | - | |||||||||||||||
U.S. treasuries and government agency bonds | 123,698 | 4 | (170 | ) | 123,532 | 110,720 | ||||||||||||||
Auction-rate securities backed by student-loan notes | 5,570 | - | (209 | ) | 5,361 | 5,361 | ||||||||||||||
Total | $ | 182,482 | $ | 4 | $ | (379 | ) | $ | 182,107 | $ | 116,081 | |||||||||
December 31, 2014 | ||||||||||||||||||||
Adjusted Cost | Unrealized Gains | Unrealized Losses | Total Fair Value | Fair Value of Investments in Unrealized Loss Position | ||||||||||||||||
Money market funds | $ | 60,078 | $ | - | $ | - | $ | 60,078 | $ | - | ||||||||||
Certificates of deposit | 22,778 | - | - | 22,778 | - | |||||||||||||||
U.S. treasuries and government agency bonds | 89,689 | 14 | (29 | ) | 89,674 | 35,062 | ||||||||||||||
Auction-rate securities backed by student-loan notes | 5,570 | - | (181 | ) | 5,389 | 5,389 | ||||||||||||||
Total | $ | 178,115 | $ | 14 | $ | (210 | ) | $ | 177,919 | $ | 40,451 | |||||||||
Except for the auction-rate securities, there were no individual securities that had been in a continuous loss position for 12 months or longer as of December 31, 2015 and 2014.
There were no redemptions of auction-rate securities for the year ended December 31, 2015. For the year ended December 31, 2014, the Company redeemed $4.7 million of auction-rate securities at par. The underlying maturities of the outstanding auction-rate securities are up to 32 years. As of December 31, 2015 and 2014, the impairment of $0.2 million was determined to be temporary based on the following management assessment:
(1) | The decline in the fair value of these securities is not largely attributable to adverse conditions specifically related to these securities or to specific conditions in an industry or in a geographic area; | |
(2) | Management possesses both the intent and ability to hold these securities for a period of time sufficient to allow for any anticipated recovery in fair value; | |
(3) | Management believes that it is more likely than not that the Company will not have to sell these securities before recovery of its cost basis; | |
(4) | Except for the credit loss of $70,000 recognized in the year ended December 31, 2009, the Company does not believe that there is any additional credit loss associated with these securities because the Company expects to recover the entire amortized cost basis; | |
(5) | There have been no further downgrades on these securities since 2009; | |
(6) | All scheduled interest payments have been made pursuant to the reset terms and conditions; and | |
(7) | All redemptions of these securities to date, representing 87% of the original portfolio, have been at par. |
4. FAIR VALUE MEASUREMENT
The following tables detail the fair value measurement of the financial assets and liabilities (in thousands):
Fair Value Measurement at December 31, 2015 | ||||||||||||||||
Quoted Prices in Active Markets for Identical Assets | Significant Other Observable Inputs | Significant Unobservable Inputs | ||||||||||||||
Total | Level 1 | Level 2 | Level 3 | |||||||||||||
Assets: | ||||||||||||||||
Money market funds | $ | 31,640 | $ | 31,640 | $ | - | $ | - | ||||||||
Certificates of deposit | 21,574 | - | 21,574 | - | ||||||||||||
U.S. treasuries and government agency bonds | 123,532 | - | 123,532 | - | ||||||||||||
Auction-rate securities backed by student-loan notes | 5,361 | - | - | 5,361 | ||||||||||||
Mutual funds under deferred compensation plan | 8,279 | 8,279 | - | - | ||||||||||||
Total | $ | 190,386 | $ | 39,919 | $ | 145,106 | $ | 5,361 | ||||||||
Fair Value Measurement at December 31, 2014 | ||||||||||||||||
Quoted Prices in Active Markets for Identical Assets | Significant Other Observable Inputs | Significant Unobservable Inputs | ||||||||||||||
Total | Level 1 | Level 2 | Level 3 | |||||||||||||
Assets: | ||||||||||||||||
Money market funds | $ | 60,078 | $ | 60,078 | $ | - | $ | - | ||||||||
Certificates of deposit | 22,778 | - | 22,778 | - | ||||||||||||
U.S. treasuries and government agency bonds | 89,674 | - | 89,674 | - | ||||||||||||
Auction-rate securities backed by student-loan notes | 5,389 | - | - | 5,389 | ||||||||||||
Mutual funds under deferred compensation plan | 2,236 | 2,236 | - | - | ||||||||||||
Total | $ | 180,155 | $ | 62,314 | $ | 112,452 | $ | 5,389 | ||||||||
Liabilities: | ||||||||||||||||
Contingent consideration | $ | 2,507 | $ | - | $ | - | $ | 2,507 | ||||||||
Total | $ | 2,507 | $ | - | $ | - | $ | 2,507 | ||||||||
The Company’s level 3 assets consist of government-backed student loan auction-rate securities, with interest rates that reset through a Dutch auction every 7 to 35 days and which became illiquid in 2008. The following table provides a rollforward of the fair value of the auction-rate securities (in thousands):
Balance at January 1, 2014 | $ | 9,860 | ||
Sales and settlement at par | (4,650 | ) | ||
Change in unrealized loss included in other comprehensive income | 179 | |||
Ending balance at December 31, 2014 | 5,389 | |||
Change in unrealized loss included in other comprehensive income | (28 | ) | ||
Ending balance at December 31, 2015 | $ | 5,361 |
The Company determined the fair value of the auction-rate securities using a discounted cash flow model with the following assumptions:
December 31, | ||||||||
2015 | 2014 | |||||||
| Time-to-liquidity (months) | 24 | 24 | ||||||
| Expected return | 2.9% | 2.9% | ||||||
Discount rate | 4.3% | - | 7.3% | 4.0% | - | 7.0% | ||
The Company’s level 3 liabilities consisted of contingent consideration related to the acquisition of Sensima in July 2014. The arrangement requires the Company to pay up to $8.9 million to certain former Sensima shareholders if Sensima achieves a new product introduction as well as certain product revenue and direct margin targets in 2016. The fair value of the contingent consideration at the Acquisition Date was $2.5 million, which was estimated based on a probability-weighted analysis of possible future revenue outcomes. The fair value was calculated using the following assumptions:
December 31, 2014 | ||||
Projected revenue (in millions) | $2.1 | - | $3.8 | |
| Discount rate | 9.0% | |||
Probability of occurrence | 20% | - | 50% | |
As part of the quarterly assessment in the fourth quarter of 2015, management reviewed the sales forecast for the products and concluded that the projected product revenue in 2016 will not likely meet the minimum target required to earn the contingent consideration, primarily because the product adoption process by customers will take longer than the Company had originally anticipated. Accordingly, the fair value of the contingent consideration was deemed to be $0 as of December 31, 2015, and the Company recorded the release of the liability of $2.5 million as a credit to selling, general and administrative expenses in the Consolidated Statement of Operations. The Company will continue to assess the probability of former Sensima shareholders earning the contingent consideration in 2016 and may record additional adjustment to the fair value.
5. BALANCE SHEET COMPONENTS
Inventories
Inventories consist of the following (in thousands):
December 31, | ||||||||
2015 | 2014 | |||||||
Raw materials | $ | 14,907 | $ | 7,298 | ||||
Work in process | 21,177 | 18,950 | ||||||
Finished goods | 27,125 | 14,670 | ||||||
Total | $ | 63,209 | $ | 40,918 | ||||
Property and Equipment, Net
Property and equipment, net, consist of the following (in thousands):
December 31, | ||||||||
2015 | 2014 | |||||||
Production equipment and software | $ | 92,208 | $ | 88,929 | ||||
Buildings and improvements | 34,736 | 29,386 | ||||||
Land | 5,600 | 5,600 | ||||||
Transportation equipment | 4,694 | 4,694 | ||||||
Furniture and fixtures | 2,962 | 2,883 | ||||||
Leasehold improvements | 2,283 | 2,350 | ||||||
Property and equipment, gross | 142,483 | 133,842 | ||||||
Less: accumulated depreciation and amortization | (77,124 | ) | (70,900 | ) | ||||
Total | $ | 65,359 | $ | 62,942 | ||||
Depreciation and amortization expense was $12.0 million, $12.4 million and $12.1 million for the years ended December 31, 2015, 2014 and 2013, respectively.
Other Long-Term Assets
Other long-term assets consist of the following (in thousands):
December 31, | ||||||||
2015 | 2014 | |||||||
Deferred compensation plan assets | $ | 13,985 | $ | 6,084 | ||||
Prepaid expense | 1,257 | 1,418 | ||||||
Other | 1,099 | 955 | ||||||
Total | $ | 16,341 | $ | 8,457 | ||||
Accrued Liabilities
Accrued liabilities consist of the following (in thousands):
December 31, | ||||||||
2015 | 2014 | |||||||
Dividends and dividend equivalents | $ | 8,675 | $ | 6,080 | ||||
Deferred revenue and customer prepayments | 5,236 | 3,908 | ||||||
Stock rotation reserve | 2,372 | 1,757 | ||||||
Commissions | 763 | 767 | ||||||
Income tax payable | 465 | - | ||||||
Warranty | 289 | 240 | ||||||
Sales rebate | 268 | 586 | ||||||
Other | 1,916 | 1,365 | ||||||
Total | $ | 19,984 | $ | 14,703 | ||||
Other Long-Term Liabilities
Other long-term liabilities consist of the following (in thousands):
December 31, | ||||||||
2015 | 2014 | |||||||
Deferred compensation plan liabilities | $ | 14,147 | $ | 6,177 | ||||
Dividend equivalents | 2,019 | 580 | ||||||
Contingent consideration | - | 2,507 | ||||||
Other | 379 | 940 | ||||||
Total | $ | 16,545 | $ | 10,204 | ||||
6. GOODWILL AND ACQUISITION-RELATED INTANGIBLE ASSETS, NET
There have been no changes in the balance of goodwill from the Acquisition Date to December 31, 2015. The Company did not identify any goodwill impairment in 2015 and 2014.
Acquisition-related intangible assets consist of the following (in thousands):
December 31, 2015 | ||||||||||||
Gross Amount | Accumulated Amortization | Net Amount | ||||||||||
Subject to amortization: | ||||||||||||
Know-how | $ | 1,018 | $ | (297 | ) | $ | 721 | |||||
Developed technologies | 6,466 | (2,134 | ) | 4,332 | ||||||||
Total | $ | 7,484 | $ | (2,431 | ) | $ | 5,053 | |||||
December 31, 2014 | ||||||||||||
Gross Amount | Accumulated Amortization | Net Amount | ||||||||||
Subject to amortization: | ||||||||||||
Know-how | $ | 1,018 | $ | (93 | ) | $ | 925 | |||||
Developed technologies | 4,421 | (579 | ) | 3,842 | ||||||||
Not subject to amortization: | ||||||||||||
IPR&D | 2,045 | - | 2,045 | |||||||||
Total | $ | 7,484 | $ | (672 | ) | $ | 6,812 | |||||
During the third quarter of 2015, management determined that the acquired IPR&D from the Sensima acquisition was completed and the products incorporating the technologies were ready to be commercially introduced. Accordingly, the acquired IPR&D was reclassified into developed technologies as a finite-lived intangible asset and is being amortized over its estimated useful life.
Amortization expense is recorded in cost of revenue in the Consolidated Statements of Operations and totaled $1.8 million and $0.7 million for the years ended December 31, 2015 and 2014, respectively.
The estimated future amortization expense as of December 31, 2015 is as follows (in thousands):
2016 | $ | 2,051 | ||
2017 | 2,051 | |||
2018 | 841 | |||
2019 | 110 | |||
Total | $ | 5,053 |
7. STOCK-BASED COMPENSATION
2004 Equity Incentive Plan (the “2004 Plan”)
The Board of Directors adopted the 2004 Plan in March 2004, and the stockholders approved it in November 2004. The 2004 Plan provided for annual increases in the number of shares available for issuance equal to the least of 5% of the outstanding shares of common stock on the first day of the year, 2.4 million shares, or a number of shares determined by the Board of Directors. The 2004 Plan expired on November 12, 2014 and equity awards can no longer be granted under the 2004 Plan. As of November 12, 2014, 2.9 million shares that were available for issuance expired under the 2004 Plan.
2014 Equity Incentive Plan (the “2014 Plan”)
The Board of Directors adopted the 2014 Plan in April 2013, and the stockholders approved it in June 2013. In October 2014, the Board of Directors approved certain amendments to the 2014 Plan. The 2014 Plan became effective on November 13, 2014 and provides for the issuance of up to 5.5 million shares. The 2014 Plan will expire on November 13, 2024. As of December 31, 2015, 4.7 million shares remained available for future issuance.
Stock-Based Compensation Expense
The Company recognized stock-based compensation expense as follows (in thousands):
Year Ended December 31, | ||||||||||||
2015 | 2014 | 2013 | ||||||||||
Cost of revenue | $ | 1,166 | $ | 903 | $ | 631 | ||||||
Research and development | 11,156 | 9,019 | 6,219 | |||||||||
Selling, general and administrative | 29,241 | 23,532 | 13,851 | |||||||||
Total | $ | 41,563 | $ | 33,454 | $ | 20,701 | ||||||
RSUs
The Company’s restricted stock units (“RSUs”) include time-based RSUs, RSUs with performance conditions (“PSUs”), RSUs with market conditions and performance conditions (“MPSUs”), and RSUs with market conditions (“MSUs”). Vesting of all awards requires continued employment with the Company. In addition, vesting of awards with performance conditions or market conditions is subject to the achievement of pre-determined performance goals. A summary of the RSUs is presented in the table below:
Time-Based RSUs | Weighted- Average Grant Date Fair Value Per Share | PSUs and MPSUs | Weighted- Average Grant Date Fair Value Per Share | MSUs | Weighted- Average Grant Date Fair Value Per Share | Total | Weighted- Average Grant Date Fair Value Per Share | |||||||||||||||||||||||||||
(in thousands) | (in thousands) | (in thousands) | (in thousands) | |||||||||||||||||||||||||||||||
Outstanding at January 1, 2013 | 1,099 | $ | 16.96 | 531 | $ | 18.49 | - | $ | - | 1,630 | $ | 17.46 | ||||||||||||||||||||||
Granted | 299 | $ | 24.25 | 875 | (1) | $ | 24.43 | 1,800 | $ | 23.57 | 2,974 | $ | 23.89 | |||||||||||||||||||||
Performance adjustment | - | $ | - | (124 | )(2) | $ | 21.98 | - | $ | - | (124 | ) | $ | 21.98 | ||||||||||||||||||||
Released | (519 | ) | $ | 17.57 | (206 | ) | $ | 18.90 | - | $ | - | (725 | ) | $ | 17.95 | |||||||||||||||||||
Forfeited | (125 | ) | $ | 17.06 | (48 | ) | $ | 19.06 | - | $ | - | (173 | ) | $ | 17.61 | |||||||||||||||||||
Outstanding at December 31, 2013 | 754 | $ | 19.41 | 1,028 | $ | 23.02 | 1,800 | $ | 23.57 | 3,582 | $ | 22.53 | ||||||||||||||||||||||
Granted | 335 | $ | 36.71 | 1,091 | (1) | $ | 34.23 | - | $ | - | 1,426 | $ | 34.82 | |||||||||||||||||||||
Performance adjustment | - | $ | - | (139 | )(2) | $ | 31.40 | - | $ | - | (139 | ) | $ | 31.40 | ||||||||||||||||||||
Released | (468 | ) | $ | 20.36 | (304 | ) | $ | 18.12 | - | $ | - | (772 | ) | $ | 19.48 | |||||||||||||||||||
Forfeited | (32 | ) | $ | 19.75 | (17 | ) | $ | 19.79 | - | $ | - | (49 | ) | $ | 19.77 | |||||||||||||||||||
Outstanding at December 31, 2014 | 589 | $ | 28.48 | 1,659 | $ | 28.11 | 1,800 | $ | 23.57 | 4,048 | $ | 26.14 | ||||||||||||||||||||||
Granted | 271 | $ | 49.82 | 1,291 | (1) | $ | 45.24 | - | $ | - | 1,562 | $ | 46.03 | |||||||||||||||||||||
Performance adjustment | - | $ | - | (364 | )(2) | $ | 39.20 | - | $ | - | (364 | ) | $ | 39.20 | ||||||||||||||||||||
Released | (319 | ) | $ | 26.56 | (629 | ) | $ | 23.40 | - | $ | - | (948 | ) | $ | 24.47 | |||||||||||||||||||
Forfeited | (42 | ) | $ | 35.60 | (24 | ) | $ | 28.68 | - | $ | - | (66 | ) | $ | 33.06 | |||||||||||||||||||
Outstanding at December 31, 2015 | 499 | $ | 40.75 | 1,933 | $ | 38.99 | 1,800 | $ | 23.57 | 4,232 | $ | 32.64 | ||||||||||||||||||||||
_________________
(1) | Amount reflects the maximum number of PSUs and MPSUs that can be earned assuming the achievement of the highest level of performance conditions. |
(2) | Amount reflects the number of PSUs and MPSUs that have not been earned or may not be earned based on management’s probability assessment at each reporting period. |
The intrinsic value related to awards released for the years ended December 31, 2015, 2014 and 2013 was $49.2 million, $28.9 million and $18.6 million, respectively. As of December 31, 2015, the total intrinsic value of all outstanding awards was $269.6 million, based on the closing stock price of $63.71. As of December 31, 2015, unamortized compensation expense related to all outstanding awards was approximately $86.0 million with a weighted-average remaining recognition period of approximately five years.
Time-Based RSUs:
For the years ended December 31, 2015, 2014 and 2013, the Board of Directors granted 271,000, 335,000 and 299,000 shares with service conditions, respectively, to employees and non-employee directors. The RSUs generally vest over one to four years, subject to continued employment with the Company.
2015 MPSUs:
On December 31, 2015, the Board of Directors granted 127,000 shares to the executive officers and certain key employees, which represent a target number of RSUs to be awarded upon achievement of both market conditions and performance conditions (“2015 MPSUs”). The maximum number of 2015 MPSUs that an employee can earn is 500% of the target shares. The 2015 MPSUs consist of four separate tranches with various performance periods ending on December 31, 2019. The first tranche contains market conditions only, which require the achievement of five MPS stock price targets ranging from $71.36 to $95.57 over a four-year period. The second, third and fourth tranches contain both market conditions and performance conditions. Each tranche requires the achievement of five MPS stock price targets to be measured against a base price equal to the greater of: (1) the average closing stock price during the 20 consecutive trading days immediately before the start of the measurement period for that tranche, or (2) the closing stock price immediately before the start of the measurement period for that tranche. In addition, each of the second, third and fourth tranches requires the achievement of one of following six operating metrics:
● | Successful implementation of full digital solutions vs. current analog topology for certain products. | |
● | Successful implementation and adoption by a key player of an integrated, software-based, field-oriented-control with 3D hall sensor to motor drive. | |
● | Successful implementation of certain advanced power analog processes. | |
● | Successful design wins and achievement of a specific level of revenues with a global networking customer. | |
● | Achievement of a specific level of revenues with a global electronics manufacturer. | |
● | Achievement of a specific level of market share with certain core power products. |
Subject to the employees’ continued employment with the Company, the 2015 MPSUs will fully vest on January 1, 2020 if the pre-determined individual market and performance goals in each tranche are met during the performance periods. In addition, the 2015 MPSUs contain post-vesting restrictions on sales of the vested shares by employees for up to two years.
The Company determined the grant date fair value of the 2015 MPSUs using a Monte Carlo simulation model with the following weighted-average assumptions: stock price of $61.35, expected volatility of 33.2%, risk-free interest rate of 1.3%, dividend yield of 0.0% and an illiquidity discount of 7.8% to account for the post-vesting sales restrictions. Assuming the achievement of all of the required performance goals, the total stock-based compensation cost for the 2015 MPSUs is approximately $26.4 million to be recognized for each tranche as follows: $9.2 million for the first tranche, $4.6 million for the second tranche, $5.3 million for the third tranche, and $7.3 million for the fourth tranche.
For the first tranche, stock-based compensation expense will be recognized over four years even if the market conditions are not satisfied. For the second, third and fourth tranches, stock-based compensation expense for each tranche will be recognized over one to four years depending upon the number of the operating metrics management deems probable of achievement in each reporting period. If it becomes probable in a reporting period that more than one operating metric is expected to be achieved during the performance periods, the Company will recognize stock-based compensation expense for more than one tranche in the reporting period.
2015 PSUs:
In February 2015, the Board of Directors granted 172,000 shares to the executive officers, which represent a target number of RSUs to be awarded based on the Company’s average two-year (2015 and 2016) revenue growth rate compared against the analog industry’s average two-year revenue growth rate as determined by the Semiconductor Industry Association (“2015 Executive PSUs”). The maximum number of 2015 Executive PSUs that an executive officer can earn is 300% of the target shares. 50% of the 2015 Executive PSUs will vest in the first quarter of 2017 if the pre-determined performance goals are met during the performance period. The remaining shares will vest over the following two years on a quarterly basis. Vesting is subject to the employees’ continued employment with the Company. Assuming the achievement of the highest level of performance goals, the total stock-based compensation cost for the 2015 Executive PSUs is approximately $25.0 million.
In February 2015, the Board of Directors granted 58,000 shares to certain non-executive employees, which represent a target number of RSUs to be awarded based on the Company’s 2016 revenue goals for certain regions or product line divisions, or the Company’s average two-year (2015 and 2016) revenue growth rate compared against the analog industry’s average two-year revenue growth rate as determined by the Semiconductor Industry Association (“2015 Non-Executive PSUs”). The maximum number of 2015 Non-Executive PSUs that an employee can earn is either 200% or 300% of the target shares, depending on the job classification of the employee. 50% of the 2015 Non-Executive PSUs will vest in the first quarter of 2017 if the pre-determined performance goals are met during the performance period. The remaining shares will vest over the following two years on an annual or quarterly basis. Vesting is subject to the employees’ continued employment with the Company. Assuming the achievement of the highest level of performance goals, the total stock-based compensation cost for the 2015 Non-Executive PSUs is approximately $7.0 million.
2014 PSUs:
In February 2014, the Board of Directors granted 252,000 shares to the executive officers, which represented a target number of RSUs that would be awarded based on the Company’s average two-year (2014 and 2015) revenue growth rate compared against the analog industry’s average two-year revenue growth rate as determined by the Semiconductor Industry Association (“2014 Executive PSUs”). The maximum number of 2014 Executive PSUs that an executive officer could earn was 300% of the target shares. 50% of the 2014 Executive PSUs vest in the first quarter of 2016 if the pre-determined performance goals are met during the performance period. The remaining shares vest over the following two years on a quarterly basis. Vesting is subject to the employees’ continued employment with the Company.
In February 2016, the Compensation Committee approved the revenue achievement for the 2014 Executive PSUs and a total of 694,000 shares were earned by the executive officers. Based on the actual achievement of the performance goals, the total stock-based compensation cost for the 2014 Executive PSUs is approximately $21.9 million.
In April 2014, the Board of Directors granted 61,000 shares to certain non-executive employees, which represented a target number of RSUs that would be awarded based on the Company’s 2015 revenue goals for certain regions or product line divisions, or the Company’s average two-year (2014 and 2015) revenue growth rate compared against the analog industry’s average two-year revenue growth rate as determined by the Semiconductor Industry Association (“2014 Non-Executive PSUs”). The maximum number of 2014 Non-Executive PSUs that an employee could earn was either 200% or 300% of the target shares, depending on the job classification of the employee. 50% of the 2014 Non-Executive PSUs vest in the second quarter of 2016 if the pre-determined performance goals are met during the performance period. The remaining shares will vest over the following two years on an annual or quarterly basis. Vesting is subject to the employees’ continued employment with the Company.
In February 2016, the Compensation Committee approved the revenue achievement for the 2014 Non-Executive PSUs and a total of 103,000 shares were earned by the non-executive employees. Based on the actual achievement of the performance goals, the total stock-based compensation cost for the 2014 Non-Executive PSUs is approximately $3.8 million.
In connection with the acquisition of Sensima in July 2014, the Board of Directors granted PSUs to key Sensima employees who became employees of the Company. See Note 2 for further discussion.
2013 MSUs:
In December 2013, the Board of Directors granted 360,000 shares to the executive officers and certain key employees, which represented a target number of RSUs that would be awarded upon achievement of five MPS stock price targets ranging from $40.00 to $56.00 during a five-year performance period from January 1, 2014 to December 31, 2018 (“2013 MSUs”). The maximum number of 2013 MSUs that an employee could earn was 500% of the target shares. The 2013 MSUs will vest quarterly from January 1, 2019 to December 31, 2023 if the pre-determined performance goals are met during the performance period. Vesting is subject to the employees’ continued employment with the Company. As of December 31, 2015, all five MPS stock price targets have been achieved and the employees earned a total of 1.8 million shares.
The Company determined the grant date fair value of the 2013 MSUs using a Monte Carlo simulation model with the following assumptions: stock price of $31.73, expected volatility of 38.7%, risk-free interest rate of 1.6% and dividend yield of 0.0%. The total stock-based compensation cost for the 2013 MSUs is approximately $42.4 million.
2013 PSUs:
In February 2013, the Board of Directors granted 220,000 shares to the executive officers, which represented a target number of RSUs that would be awarded upon achievement of certain pre-determined revenue targets in 2014 (“2013 Executive PSUs”). The maximum number of 2013 Executive PSUs that an executive officer could earn was 300% of the target shares. In February 2015, the Compensation Committee approved the revenue achievement for the 2013 Executive PSUs and a total of 622,000 shares were earned by the executive officers. 50% of the 2013 Executive PSUs vested in the first quarter of 2015 and the remaining shares vest over the following two years on a quarterly basis. Vesting is subject to the employees’ continued employment with the Company. Based on the actual achievement of the performance goals, the total stock-based compensation cost for the 2013 Executive PSUs is approximately $15.5 million.
In February 2013, the Board of Directors granted 91,000 shares to certain non-executive employees, which represented a target number of RSUs that would be awarded upon achievement of certain pre-determined revenue targets for the Company as a whole, certain regions or product-line divisions in 2014 (“2013 Non-Executive PSUs”). The maximum number of 2013 Non-Executive PSUs that an employee could earn was either 200% or 300% of the target shares, depending on the job classification of the employee. In February 2015, the Compensation Committee approved the revenue achievement for the 2013 Non-Executive PSUs and a total of 154,000 shares were earned by the non-executive employees. 50% of the 2013 Non-Executive PSUs vested in the first quarter of 2015 and the remaining shares vest over the following two years on an annual or quarterly basis. Vesting is subject to the employees’ continued employment with the Company. Based on the actual achievement of the performance goals, the total stock-based compensation cost for the 2013 Non-Executive PSUs is approximately $3.0 million.
Stock Options
A summary of stock option activity is presented in the table below:
Shares | Weighted- Average Exercise Price | Weighted- Average Remaining Contractual Term | Aggregate Intrinsic Value | |||||||||||||
(in thousands) | (in years) | (in thousands) | ||||||||||||||
Outstanding at January 1, 2013 | 3,813 | $ | 15.62 | 2.6 | $ | 25,380 | ||||||||||
Exercised | (2,446 | ) | $ | 15.49 | ||||||||||||
Forfeited and expired | (11 | ) | $ | 15.27 | ||||||||||||
Outstanding at December 31, 2013 | 1,356 | $ | 15.86 | 1.9 | $ | 25,506 | ||||||||||
Exercised | (742 | ) | $ | 16.09 | ||||||||||||
Forfeited and expired | (24 | ) | $ | 10.07 | ||||||||||||
Outstanding at December 31, 2014 | 590 | $ | 15.80 | 1.2 | $ | 20,039 | ||||||||||
Exercised | (498 | ) | $ | 15.55 | ||||||||||||
Forfeited and expired | (2 | ) | $ | 6.10 | ||||||||||||
Outstanding at December 31, 2015 | 90 | $ | 17.50 | 1.3 | $ | 4,134 | ||||||||||
Options exercisable at December 31, 2015 and expected to vest | 90 | $ | 17.50 | 1.3 | $ | 4,134 | ||||||||||
Options exercisable at December 31, 2015 | 89 | $ | 17.50 | 1.3 | $ | 4,126 | ||||||||||
The following table summarizes certain information related to outstanding and exercisable options as of December 31, 2015:
Options Outstanding | Options Exercisable | |||||||||||||||||||||
Range of Exercises Prices | Shares | Weighted- Average Exercise Price | Weighted- Average Remaining Contractual Term | Shares | Weighted- Average Exercise Price | |||||||||||||||||
(in thousands) | (in years) | (in thousands) | ||||||||||||||||||||
| $11.09 | - | $19.29 | 69 | $ | 16.25 | 1.5 | 69 | $ | 16.25 | |||||||||||||
| $19.56 | - | $23.02 | 21 | $ | 21.76 | 0.7 | 20 | $ | 21.76 | |||||||||||||
| 90 | $ | 17.50 | 1.3 | 89 | $ | 17.50 | ||||||||||||||||
Total intrinsic value of options exercised was $18.6 million, $17.3 million and $27.8 million for the years ended December 31, 2015, 2014 and 2013, respectively. Proceeds from the exercise of stock options were $7.7 million, $11.9 million and $37.9 million for the years ended December 31, 2015, 2014 and 2013, respectively. At December 31, 2015, unamortized compensation expense related to unvested options was not material.
Employee Stock Purchase Plan
Under the 2004 Employee Stock Purchase Plan (the “ESPP”), eligible employees may purchase common stock through payroll deductions. Participants may not purchase more than 2,000 shares in a six-month offering period or stock having a value greater than $25,000 in any calendar year as measured at the beginning of the offering period in accordance with the Internal Revenue Code and applicable Treasury Regulations. The ESPP provides for an automatic annual increase by an amount equal to the lesser of 1.0 million shares, 2% of the outstanding shares of common stock on the first day of the year, or a number of shares as determined by the Board of Directors. As of December 31, 2015, approximately 4.7 million shares were available for future issuance.
For the years ended December 31, 2015, 2014 and 2013, 56,000, 78,000 and 111,000 shares, respectively, were issued under the ESPP. The intrinsic value of shares issuedwas $0.6 million, $0.9 million and $0.8 million for the years ended December 31, 2015, 2014 and 2013, respectively. The unamortized expense as of December 31, 2015 was $78,000. The Black-Scholes model was used to value the employee stock purchase rights with the following weighted-average assumptions:
Year Ended December 31, | ||||||||||||
2015 | 2014 | 2013 | ||||||||||
Expected term (years) | 0.5 | 0.5 | 0.5 | |||||||||
Expected volatility | 30.3 | % | 29.4 | % | 28.0 | % | ||||||
Risk-free interest rate | 0.2 | % | 0.1 | % | 0.1 | % | ||||||
Dividend yield | 1.4 | % | 0.7 | % | - | |||||||
Cash proceeds from the ESPP were $2.2 million, $2.1 million and $2.1 million for the years ended December 31, 2015, 2014 and 2013, respectively.
8. STOCK REPURCHASE PROGRAM
In July 2013, the Board of Directors approved a stock repurchase program that authorized the Company to repurchase up to $100 million in the aggregate of its common stock through June 30, 2015. In April 2015, the Board of Directors approved an extension of the program through December 31, 2015. All shares were retired upon repurchase. The following table summarizes the repurchase activity under the program (in thousands, except per-share amounts):
Shares Repurchased | Average Price Per Share | Total Amount | ||||||||||
Cumulative balance at January 1, 2013 | - | $ | - | $ | - | |||||||
Repurchases | 664 | $ | 31.06 | 20,615 | ||||||||
Cumulative balance at December 31, 2013 | 664 | $ | 31.06 | 20,615 | ||||||||
Repurchases | 1,051 | $ | 39.19 | 41,198 | ||||||||
Cumulative balance at December 31, 2014 | 1,715 | $ | 36.04 | 61,813 | ||||||||
Repurchases | 645 | $ | 50.05 | 32,286 | ||||||||
Cumulative balance at December 31, 2015 | 2,360 | $ | 39.87 | $ | 94,099 | |||||||
As of December 31, 2015, the stock repurchase program expiredwith a remaining balance of $5.9 million.
9. DIVIDENDS AND DIVIDEND EQUIVALENTS
Cash Dividend Program
In June 2014, the Board of Directors approved a dividend program pursuant to which the Company intends to pay quarterly cash dividends on its common stock. Stockholders of record as of the last day of the quarter are entitled to receive the quarterly cash dividends when and if declared by the Board of Directors, which are generally payable on the 15th of the following month. The Board of Directors declared the following cash dividends (in thousands, except per-share amounts):
Dividend Declared per Share | Total Amount | |||||||
2015: | ||||||||
First quarter | $ | 0.20 | $ | 7,854 | ||||
Second quarter | $ | 0.20 | $ | 7,925 | ||||
Third quarter | $ | 0.20 | $ | 7,901 | ||||
Fourth quarter | $ | 0.20 | $ | 7,938 | ||||
2014: | ||||||||
Second quarter | $ | 0.15 | $ | 5,817 | ||||
Third quarter | $ | 0.15 | $ | 5,823 | ||||
Fourth quarter | $ | 0.15 | $ | 5,826 | ||||
As of December 31, 2015, accrued dividends totaled $7.9 million, which were paid to stockholders on January 15, 2016.
The declaration of any future cash dividends is at the discretion of the Board of Directors and will depend on, among other things, the Company’s financial condition, results of operations, capital requirements, business conditions, statutory requirements of Delaware law, compliance with the terms of future indebtedness and credit facilities and other factors that the Board of Directors may deem relevant, as well as a determination that cash dividends are in the best interests of the stockholders. The Company anticipates that the cash used for future dividends will come from its current domestic cash and cash generated from ongoing U.S. operations. If cash held by the Company’s international subsidiaries is needed for the payment of dividends, the Company may be required to accrue and pay U.S. taxes to repatriate the funds.
Cash Dividend Equivalent Rights
Under the Company’s stock plan, outstanding RSU awards contain rights to receive cash dividend equivalents, which entitle employees who hold RSUs to the same dividend value per share as holders of common stock. The dividend equivalents are accumulated during the vesting periods of the RSUs and are payable to the employees when the awards vest. Dividend equivalents accumulated on the RSUs are forfeited if the employees do not fulfill their service requirement during the vesting periods. As of December 31, 2015 and 2014, accrued dividend equivalents totaled $2.8 million and $0.8 million, respectively, which will be paid to the employees when the RSUs vest.
10. NET INCOME PER SHARE
The following table sets forth the computation of basic and diluted net income per share (in thousands, except per share amounts):
Year Ended December 31, | ||||||||||||
2015 | 2014 | 2013 | ||||||||||
Numerator: | ||||||||||||
Net income | $ | 35,172 | $ | 35,495 | $ | 22,898 | ||||||
Denominator: | ||||||||||||
Weighted-average outstanding shares used to compute basic net income per share | 39,470 | 38,686 | 37,387 | |||||||||
Effect of dilutive securities | 1,399 | 1,107 | 1,233 | |||||||||
Weighted-average outstanding shares used to compute diluted net income per share | 40,869 | 39,793 | 38,620 | |||||||||
Net income per share: | ||||||||||||
Basic | $ | 0.89 | $ | 0.92 | $ | 0.61 | ||||||
Diluted | $ | 0.86 | $ | 0.89 | $ | 0.59 | ||||||
Anti-dilutive common stock equivalents were not material in any of the periods presented.
11. INCOME TAXES
The components of income before income taxes are as follows (in thousands):
Year Ended December 31, | ||||||||||||
2015 | 2014 | 2013 | ||||||||||
United States | $ | (247 | ) | $ | 3,173 | $ | (2,309 | ) | ||||
International | 42,738 | 33,219 | 26,316 | |||||||||
Total income before income taxes | $ | 42,491 | $ | 36,392 | $ | 24,007 | ||||||
Management’s intent is to indefinitely reinvest any undistributed earnings from its foreign subsidiaries. Accordingly, no provision for Federal and state income or foreign withholding taxes has been provided thereon, nor is it practical to determine the amount of this liability. Upon distribution of those earnings in the form of dividends or otherwise, the Company will be subject to U.S. income taxes and potential foreign withholding taxes. As of December 31, 2015 and 2014, the unremitted earnings of foreign subsidiaries were $214.3 million and $172.7 million, respectively. The Company has sufficient cash reserves in the U.S. and intends to use the undistributed foreign earnings to fund foreign operations and research and development needs, planned capital outlay and expansion.
The components of the income tax provision are as follows (in thousands):
Year Ended December 31, | ||||||||||||
2015 | 2014 | 2013 | ||||||||||
Current: | ||||||||||||
Federal | $ | 6,042 | $ | 18 | $ | 77 | ||||||
State | 2 | (28 | ) | 67 | ||||||||
Foreign | 1,213 | 943 | 1,053 | |||||||||
Deferred: | ||||||||||||
Foreign | 62 | (36 | ) | (88 | ) | |||||||
Total income tax provision | $ | 7,319 | $ | 897 | $ | 1,109 | ||||||
The effective tax rate differs from the applicable U.S. statutory federal income tax rate as follows:
Year Ended December 31, | ||||||||||||
2015 | 2014 | 2013 | ||||||||||
U.S. statutory federal tax rate | 34.0 | % | 34.0 | % | 34.0 | % | ||||||
Settlement with tax authorities | 6.2 | - | - | |||||||||
Foreign income at lower rates | (43.1 | ) | (27.7 | ) | (33.8 | ) | ||||||
Changes in valuation allowance | 17.6 | 5.9 | 16.8 | |||||||||
Stock-based compensation | - | (9.3 | ) | (13.7 | ) | |||||||
Reserves and other | 2.5 | (0.4 | ) | 1.3 | ||||||||
Effective tax rate | 17.2 | % | 2.5 | % | 4.6 | % | ||||||
The components of net deferred tax assets consist of the following (in thousands):
December 31, | ||||||||
2015 | 2014 | |||||||
Deferred tax assets: | ||||||||
Research tax credits | $ | 8,869 | $ | 10,393 | ||||
| Deferred compensation | 5,038 | 2,326 | ||||||
Other expenses not currently deductible | 3,519 | 2,535 | ||||||
Stock-based compensation | 1,912 | 4,068 | ||||||
Net operating losses | - | 298 | ||||||
Depreciation and amortization | (52 | ) | 181 | |||||
Total deferred tax assets | 19,286 | 19,801 | ||||||
Valuation allowance | (18,614 | ) | (19,051 | ) | ||||
Net deferred tax assets | $ | 672 | $ | 750 | ||||
As a result of the cost sharing arrangements with the Company’s international subsidiaries (cost share arrangements), relatively small changes in costs that are not subject to sharing under the cost share arrangements can significantly impact the overall profitability of the U.S. entity. Because of the U.S. entity’s inconsistent earnings history and uncertainty of future earnings, the Company has determined that it is more likely than not that the U.S. deferred tax benefits would not be realized. The Company will continue to evaluate if its facts and circumstances warrant a reversal of the valuation allowance against the U.S. deferred tax benefits in future periods.
As of December 31, 2015 and 2014, the Company had a valuation allowance of $12.5$18.6 million and $14.6$19.1 million, respectively, attributable to management’s determination that it is more likely than not that most of the deferred tax assets in the United StatesU.S. will not be realized. Should it be determined that additional amounts of the net deferred tax asset will not be realized in the future, an adjustment to increase the deferred tax asset valuation allowance will be charged to income in the period such determination is made. Likewise, in the event the Company were to determine that it is more likely than not that it would be able to realize its deferred tax assets in the future in excess of its net recorded amount, an adjustment to the valuation allowance for the deferred tax asset would increase income in the period such determination was made.
Estimated Fair Market Value as of December 31, | ||||||||
| 2012 | 2011 | |||||||
| Cash, cash equivalents and investments | ||||||||
| Cash in banks | $ | 59,145 | $ | 43,305 | ||||
| Money market funds | 15,959 | 51,066 | ||||||
| Government agencies/ treasuries | 85,521 | 79,827 | ||||||
| Auction-rate securities backed by student-loan notes | 11,755 | 13,675 | ||||||
| Total cash, cash equivalents and investments | $ | 172,380 | $ | 187,873 | ||||
| December 31, | ||||||||
| Reported as: | 2012 | 2011 | ||||||
| Cash and cash equivalents | $ | 75,104 | $ | 96,371 | ||||
| Short-term investments | 85,521 | 77,827 | ||||||
| Long-term investments | 11,755 | 13,675 | ||||||
| Total cash, cash equivalents and investments | $ | 172,380 | $ | 187,873 | ||||
| December 31, | ||||||||
| 2012 | 2011 | |||||||
| Due in less than 1 year | $ | 52,880 | $ | 45,133 | ||||
| Due in 1 - 5 years | 32,641 | 32,694 | ||||||
| Due in greater than 5 years | 11,755 | 13,675 | ||||||
| $ | 97,276 | $ | 91,502 | |||||
| Fair Value Measurements at December 31, 2012 Using | ||||||||||||||||
| Quoted Prices in Active Markets for Identical Assets | Significant Other Observable Inputs | Significant Unobservable Inputs | ||||||||||||||
| Total | Level 1 | Level 2 | Level 3 | |||||||||||||
| Money market funds | $ | 15,959 | $ | 15,959 | $ | - | $ | - | ||||||||
| US treasuries and US government agency bonds | 85,521 | - | 85,521 | - | ||||||||||||
| Long-term available-for-sale auction-rate securities | 11,755 | - | - | 11,755 | ||||||||||||
| $ | 113,235 | $ | 15,959 | $ | 85,521 | $ | 11,755 | |||||||||
| Fair Value Measurements at December 31, 2011 Using | ||||||||||||||||
| Quoted Prices in Active Markets for Identical Assets | Significant Other Observable Inputs | Significant Unobservable Inputs | ||||||||||||||
| Total | Level 1 | Level 2 | Level 3 | |||||||||||||
| Money market funds | $ | 51,066 | $ | 51,066 | $ | - | $ | - | ||||||||
| US treasuries and US government agency bonds | 79,827 | - | 79,827 | - | ||||||||||||
| Long-term available-for-sale auction-rate securities | 13,675 | - | - | 13,675 | ||||||||||||
| $ | 144,568 | $ | 51,066 | $ | 79,827 | $ | 13,675 | |||||||||
| As of December 31, 2012 | ||||||||||||||||||||
| Adjusted Cost | Unrealized Gains | Unrealized Losses | Total Fair Value | Fair Value of Investments in Unrealized Loss Position | ||||||||||||||||
| Money market funds | $ | 15,959 | $ | - | $ | - | $ | 15,959 | $ | - | ||||||||||
| US treasuries and US government agency bonds | 85,483 | 45 | (7 | ) | 85,521 | 14,121 | ||||||||||||||
| Auction-rate securities backed by student-loan notes | 12,245 | - | (490 | ) | 11,755 | 11,755 | ||||||||||||||
| $ | 113,687 | $ | 45 | $ | (497 | ) | $ | 113,235 | $ | 25,876 | ||||||||||
| As of December 31, 2011 | ||||||||||||||||||||
| Adjusted Cost | Unrealized Gains | Unrealized Losses | Total Fair Value | Fair Value of Investments in Unrealized Loss Position | ||||||||||||||||
| Money market funds | $ | 51,066 | $ | - | $ | - | $ | 51,066 | $ | - | ||||||||||
| US treasuries and US government agency bonds | 79,830 | 14 | (17 | ) | 79,827 | 25,281 | ||||||||||||||
| Auction-rate securities backed by student-loan notes | 14,305 | - | (630 | ) | 13,675 | 13,675 | ||||||||||||||
| $ | 145,201 | $ | 14 | $ | (647 | ) | $ | 144,568 | $ | 38,956 | ||||||||||
| Auction-Rate Securities | ||||
| Beginning balance at January 1, 2011 | $ | 19,180 | ||
| Sales and settlement at par | (5,775 | ) | ||
| Unrealized gain | 270 | |||
| Ending balance at December 31, 2011 | 13,675 | |||
| Sales and settlement at par | (2,100 | ) | ||
| Total realized and unrealized gains: | ||||
| Included in interest income and other, net | 40 | |||
| Included in other comprehensive income | 140 | |||
| Ending balance at December 31, 2012 | $ | 11,755 | ||
As of December 31, 2012 and 2011, the portion of the impairment classified as temporary was based on the following analysis:
| December 31, 2012 | December 31, 2011 | |
| Time-to-Liquidity | 24 months | 24 months |
| Expected Return (Based on the requisite treasury rate, plus a contractual penalty rate) | 1.8% | 1.8% |
| Discount Rate (Based on the requisite LIBOR, the cost of debt and a liquidity risk premium) | 2.5% - 7.3%, depending on the credit-rating of the security | 3.1% - 7.9% depending on the credit-rating of the security |
| December 31, | ||||||||
| 2012 | 2011 | |||||||
| Work in progress | $ | 20,992 | $ | 11,596 | ||||
| Finished goods | 11,123 | 8,508 | ||||||
| Total inventories | $ | 32,115 | $ | 20,104 | ||||
| December 31, | ||||||||
| 2012 | 2011 | |||||||
| Computers, software and equipment | $ | 65,937 | $ | 53,514 | ||||
| Leasehold improvements | 2,053 | 3,281 | ||||||
| Vehicles | 1,002 | 977 | ||||||
| Building | 28,319 | 21,632 | ||||||
| Land | 5,600 | 6,044 | ||||||
| Furniture and fixtures | 2,518 | 1,403 | ||||||
| Total | 105,429 | 86,851 | ||||||
| Less: accumulated depreciation and amortization | (46,017 | ) | (39,057 | ) | ||||
| Property and equipment, net | $ | 59,412 | $ | 47,794 | ||||
| December 31, | ||||||||
| 2012 | 2011 | |||||||
| Deferred revenue and customer prepayments | $ | 2,198 | $ | 3,603 | ||||
| Stock rotation reserve | 961 | 1,086 | ||||||
| Legal expenses and settlement costs | 402 | 911 | ||||||
| Warranty | 331 | 561 | ||||||
| Other | 2,023 | 1,684 | ||||||
| Total accrued liabilities | $ | 5,915 | $ | 7,845 | ||||
| Year ended December 31, | ||||||||||||
| 2012 | 2011 | 2010 | ||||||||||
| Non-Employee | $ | 17 | $ | 13 | $ | (7 | ) | |||||
| ESPP | 632 | 538 | 609 | |||||||||
| Restricted Stock | 12,468 | 7,216 | 8,271 | |||||||||
| Stock Options | 5,535 | 5,369 | 7,937 | |||||||||
| $ | 18,652 | $ | 13,136 | $ | 16,810 | |||||||
| Stock Options | Weighted Average Exercise Price | Weighted Average Remaining Contractual Term (Years) | Aggregate Intrinsic Value | |||||||||||||
| Outstanding at January 1, 2010 (4,112,763 options exercisable at a weighted-average exercise price of $10.93 per share) | 7,410,914 | $ | 13.48 | 5.04 | $ | 77,918,848 | ||||||||||
| Options granted (weighted-average fair value of $8.95 per share) | 370,500 | 19.92 | ||||||||||||||
| Options exercised | (1,452,245 | ) | 9.87 | |||||||||||||
| Options forfeited and expired | (494,051 | ) | 15.67 | |||||||||||||
| Outstanding at December 31, 2010 (4,264,268 options exercisable at a weighted-average exercise price of $13.33 per share) | 5,835,118 | $ | 14.61 | 4.30 | $ | 19,035,591 | ||||||||||
| Options granted (weighted-average fair value of $5.85 per share) | 152,500 | 13.96 | ||||||||||||||
| Options exercised | (685,417 | ) | 6.85 | |||||||||||||
| Options forfeited and expired | (438,962 | ) | 18.66 | |||||||||||||
| Outstanding at December 31, 2011 (4,202,786 options exercisable at a weighted-average exercise price of $15.05 per share) | 4,863,239 | $ | 15.31 | 3.44 | $ | 8,817,049 | ||||||||||
| Options granted (weighted-average fair value of $8.22 per share) | 178,484 | (1) | 15.63 | |||||||||||||
| Options exercised | (1,151,884 | ) | 11.62 | |||||||||||||
| Options forfeited and expired | (76,478 | ) | 20.90 | |||||||||||||
| Modification adjustment | - | (0.74 | ) | |||||||||||||
| Outstanding at December 31, 2012 | 3,813,361 | $ | 15.62 | 2.56 | $ | 25,379,573 | ||||||||||
| Options exercisable at December 31, 2012 and expected to become exercisable | 3,799,748 | $ | 15.62 | 2.55 | $ | 25,288,257 | ||||||||||
| Options vested and exercisable at December 31, 2012 | 3,603,762 | $ | 15.59 | 2.42 | $ | 24,105,872 | ||||||||||
| Options Outstanding | Options Exercisable | |||||||||||||||||||||
| Range of Exercises Prices | Number of Options Outstanding as if 12/31/2012 | Weighted Average Remaining Contractual Life (Years) | Weighted Average Exercise Price | Number of Options Exercisable as of 12/31/2012 | Weighted Average Exercise Price | |||||||||||||||||
| $0.76 | - | $11.32 | 546,691 | 1.81 | $ | 8.52 | 522,609 | $ | 8.41 | |||||||||||||
| $11.44 | - | $12.43 | 388,118 | 2.32 | $ | 12.37 | 382,792 | $ | 12.37 | |||||||||||||
| $12.52 | - | $14.90 | 450,417 | 3.00 | $ | 14.17 | 386,542 | $ | 14.25 | |||||||||||||
| $14.94 | - | $14.97 | 82,757 | 2.17 | $ | 14.93 | 81,635 | $ | 14.93 | |||||||||||||
| $15.03 | - | $15.03 | 586,548 | 2.82 | $ | 15.03 | 585,480 | $ | 15.03 | |||||||||||||
| $15.14 | - | $16.41 | 383,861 | 2.22 | $ | 15.53 | 359,242 | $ | 15.53 | |||||||||||||
| $16.51 | - | $18.29 | 392,703 | 2.25 | $ | 17.68 | 373,249 | $ | 17.72 | |||||||||||||
| $18.63 | - | $20.30 | 445,551 | 3.15 | $ | 19.70 | 410,922 | $ | 19.72 | |||||||||||||
| $20.41 | - | $22.85 | 422,592 | 2.86 | $ | 21.85 | 393,194 | $ | 21.87 | |||||||||||||
| $23.03 | - | $24.84 | 114,123 | 2.76 | $ | 24.18 | 108,097 | $ | 24.24 | |||||||||||||
| 3,813,361 | 3,603,762 | |||||||||||||||||||||
| 2012 | 2011 | 2010 | ||||||||||
| Expected term (years) | 4.1 | 4.1 | 4.1 | |||||||||
| Expected volatility | 53.4 | % | 52.9 | % | 55.9 | % | ||||||
| Risk-free interest rate | 0.6 | % | 1.1 | % | 1.8 | % | ||||||
| Dividend yield | - | - | - | |||||||||
| Restricted Stock Awards | Weighted Average Grant Date Fair Value Per Share | Weighted Average Remaining Recognition Period (Years) | ||||||||||
| Outstanding at January 1, 2010 | 6,550 | $ | 16.62 | 0.14 | ||||||||
| Awards released | (6,550 | ) | 16.62 | |||||||||
| Outstanding at December 31, 2010 | - | $ | - | - | ||||||||
| Outstanding at December 31, 2011 | - | $ | - | - | ||||||||
| Outstanding at December 31, 2012 | - | $ | - | - | ||||||||
| Restricted Stock Units | Weighted Average Grant Date Fair Value Per Share | Performance-Based Restricted Stock Units | Weighted Average Grant Date Fair Value Per Share | Total | Weighted Average Grant Date Fair Value Per Share | Weighted Average Remaining Recognition Period (Years) | ||||||||||||||||||||||
| Outstanding at January 1, 2010 | 289,896 | $ | 18.67 | - | $ | - | 289,896 | $ | 18.67 | 2.22 | ||||||||||||||||||
| Awards granted | 518,240 | 19.50 | 416,000 | 20.73 | 934,240 | 20.05 | ||||||||||||||||||||||
| Awards released | (158,499 | ) | 18.56 | (72,375 | ) | 20.73 | (230,874 | ) | 19.24 | |||||||||||||||||||
| Awards forfeited | (33,088 | ) | 18.38 | - | - | (33,088 | ) | 18.38 | ||||||||||||||||||||
| Outstanding at December 31, 2010 | 616,549 | $ | 19.41 | 343,625 | $ | 20.73 | 960,174 | $ | 19.88 | 2.91 | ||||||||||||||||||
| Awards granted | 853,480 | 14.40 | - | - | 853,480 | 14.40 | ||||||||||||||||||||||
| Awards released | (310,976 | ) | 17.78 | (102,125 | ) | 20.73 | (413,101 | ) | 18.51 | |||||||||||||||||||
| Awards forfeited | (76,622 | ) | 18.39 | (24,375 | ) | 20.73 | (100,997 | ) | 18.95 | |||||||||||||||||||
| Outstanding at December 31, 2011 | 1,082,431 | $ | 16.00 | 217,125 | $ | 20.73 | 1,299,556 | $ | 16.87 | 2.71 | ||||||||||||||||||
| Awards modification (1) | (76,500 | ) | 15.69 | 76,500 | 15.69 | - | - | |||||||||||||||||||||
| Awards granted (2) | 617,084 | 18.69 | 356,752 | 18.38 | 973,836 | 18.57 | ||||||||||||||||||||||
| Performance awards adjustment (3) | - | - | (18,359 | ) | 19.18 | (18,359 | ) | 19.18 | ||||||||||||||||||||
| Awards released | (447,096 | ) | 17.30 | (96,500 | ) | 20.73 | (543,596 | ) | 17.91 | |||||||||||||||||||
| Awards forfeited | (77,356 | ) | 16.61 | (4,333 | ) | 19.07 | (81,689 | ) | 16.74 | |||||||||||||||||||
| Outstanding at December 31, 2012 | 1,098,563 | $ | 16.96 | 531,185 | $ | 18.49 | $ | 1,629,748 | $ | 17.46 | 2.18 | |||||||||||||||||
| 2012 | 2011 | 2010 | ||||||||||
| Expected term (years) | 0.5 | 0.5 | 0.5 | |||||||||
| Expected volatility | 45.8 | % | 39.2 | % | 39.5 | % | ||||||
| Risk-free interest rate | 0.1 | % | 0.1 | % | 0.2 | % | ||||||
| Dividend yield | - | - | - | |||||||||
| Year Ended December 31, | ||||||||||||
| 2012 | 2011 | 2010 | ||||||||||
| Numerator: | ||||||||||||
| Net income | $ | 15,756 | $ | 13,301 | $ | 29,563 | ||||||
| Denominator: | ||||||||||||
| Weighted average outstanding shares used to compute basic net income per share | 34,871 | 34,050 | 35,830 | |||||||||
| Effect of dilutive securities | 1,376 | 1,110 | 1,996 | |||||||||
| Weighted average outstanding shares used to compute diluted net income per share | 36,247 | 35,160 | 37,826 | |||||||||
| Net income per share - basic | $ | 0.45 | $ | 0.39 | $ | 0.83 | ||||||
| Net income per share - diluted | $ | 0.43 | $ | 0.38 | $ | 0.78 | ||||||
| Year ended December 31, | ||||||||||||
| 2012 | 2011 | 2010 | ||||||||||
| United States | $ | 807 | $ | (2,031 | ) | $ | 2,770 | |||||
| International | 17,083 | 15,757 | 28,650 | |||||||||
| Total | $ | 17,890 | $ | 13,726 | $ | 31,420 | ||||||
| Year ended December 31, | ||||||||||||
| 2012 | 2011 | 2010 | ||||||||||
| Current: | ||||||||||||
| Federal | $ | 840 | $ | 447 | $ | 1,369 | ||||||
| State | 3 | (593) | 15 | |||||||||
| Foreign | 1,302 | 992 | 534 | |||||||||
| Deferred: | ||||||||||||
| Federal | 1,610 | 742 | (1,415) | |||||||||
| State | 385 | 994 | (848 | ) | ||||||||
| Foreign | (11 | ) | (421 | ) | (61 | ) | ||||||
| Valuation allowance | (1,995 | ) | (1,736) | 2,263 | ||||||||
| Income tax provision | $ | 2,134 | $ | 425 | $ | 1,857 | ||||||
| Year ended December 31, | ||||||||||||
| 2012 | 2011 | 2010 | ||||||||||
| U.S. statutory federal tax rate | 34.0 | % | 34.0 | % | 34.0 | % | ||||||
| Research and development credits | (3.6 | ) | (0.5 | ) | (2.9 | ) | ||||||
| Stock compensation | 0.1 | 5.6 | (0.7) | |||||||||
| Foreign income taxed at lower rates | (28.4 | ) | (31.8 | ) | (29.3 | ) | ||||||
| Change in valuation allowance on federal timing differences | 7.0 | (6.1) | 4.3 | |||||||||
| Litigation reserves & other | 2.8 | 1.9 | 0.5 | |||||||||
| Effective tax rate | 11.9 | % | 3.1 | % | 5.9 | % | ||||||
| December 31, | ||||||||
| 2012 | 2011 | |||||||
| Deferred tax assets: | ||||||||
| Research tax credits | $ | 4,930 | $ | 5,162 | ||||
| Stock compensation | 5,487 | 6,553 | ||||||
| Other costs not currently deductible | 2,424 | 2,767 | ||||||
| Depreciation and amortization | 317 | 774 | ||||||
| Total deferred tax assets | 13,158 | 15,256 | ||||||
| Valuation allowance | (12,488 | ) | (14,596 | ) | ||||
| Net deferred tax assets | $ | 670 | $ | 660 | ||||
As of December 31, 2012,2015, the Company had research tax credit carryforwards of $10.8$16.3 million for federal income tax purposes, which will begin to expire in 20222026, and $10.3million$15.6 million for state income tax purposes, which can be carried forward indefinitely. $3.6$7.4 million of the federal research tax credit and $1.4$1.6 million of the state research tax credit carryoverscarryforwards are related to excess tax benefits as a result of stock option exercises and therefore will be recorded in additional-paid-in-capitaladditional paid-in-capital in the period that they become realized.
In the event of a change in ownership, as defined under federal and state tax laws, the Company's net operating loss and tax credit carryforwards could be subject to annual limitations. The annual limitations could result in the expiration of the net operating loss and tax credit carryforwards prior to utilization.
The R&D credit extension, part of the accountingProtecting Americans from Tax Hikes (“PATH”) Act of 2015, was signed into law by the President on December 18, 2015. Under prior law, R&D credit was extended as of December 31 2014. The PATH Act of 2015 permanently extends the R&D credit retroactively as of January 1, 2015. As a result of the retroactive extension, the Company had an increase to its federal R&D credits of approximately $1.9 million for uncertaintyqualifying amounts incurred in income taxes recognized2015. However, due to the Company’s current valuation allowance position, the credit did not result in a tax benefit.
On July 27, 2015, inAltera Corp. v. Commissioner, the U.S. Tax Court issued an opinion related to the treatment of stock-based compensation expense in an entity’sintercompany cost-sharing arrangement. A final decision was issued in December 2015, and the IRS appealed the decision in February 2016. At this time, the U.S. Department of the Treasury has not withdrawn the requirement from its regulations to include stock-based compensation. Due to the uncertainty surrounding the status of the current regulations, questions related to the scope of potential benefits, and the risk of the Tax Court’s decision being overturned upon appeal, the Company has not recorded any adjustments as of December 31, 2015. The Company will continue to monitor developments related to this opinion and the potential impact on its financial statements and prescribes a recognition threshold and measurement attributes for financial statement disclosure of tax positions taken or expected to be taken on a tax return. Under ASC 740-10, the impact of an uncertain income tax position on the income tax return must be recognized at the largest amount that is more-likely-than-not to be sustained upon audit by the relevant taxing authority. An uncertain income tax position will not be recognized if it has less than a 50% likelihood of being sustained. Additionally, ASC 740-10 provides guidance on derecognition, classification, interest and penalties, accounting in interim periods, disclosure and transition.statements.
At December 31, 2012,2015, the Company had $13.1$12.1 million of unrecognized tax benefits, $4.9$2.7 million of which would affect its effective tax rate if recognized after considering the valuation allowance. At December 31, 2011,2014, the Company had $12.2$16.4 million of unrecognized tax benefits, $4.5$4.8 million of which would affect its effective tax rate if recognized after considering the valuation allowance.
A reconciliation of the beginning and ending amount of gross unrecognized tax benefits is as follows (in thousands):
| Balance at January 1, 2010 | $ | 9,006 | ||
| Gross increase for tax positions of prior year | - | |||
| Gross increases for tax position of current year | 983 | |||
| Reductions for prior year tax positions | - | |||
| Settlement | (883 | ) | ||
| Reduction due to statutes expiring | - | |||
| Balance at December 31, 2010 | 9,106 | |||
| Gross increase for tax positions of prior year | 1,710 | |||
| Gross increases for tax position of current year | 1,388 | |||
| Reductions for prior year tax positions | - | |||
| Settlement | - | |||
| Reduction due to statutes expiring | - | |||
| Balance at December 31, 2011 | 12,204 | |||
| Gross increase for tax positions of prior year | 188 | |||
| Gross increases for tax position of current year | 689 | |||
| Reductions for prior year tax positions | - | |||
| Settlement | - | |||
| Reduction due to statutes expiring | - | |||
| Balance at December 31, 2012 | $ | 13,081 |
Balance as at January 1, 2013 | $ | 13,081 | ||
Increases for tax position of prior year | 646 | |||
Increases for tax position of current year | 1,528 | |||
Decreases due to lapse of statue of limitations | (333 | ) | ||
Balance as of December 31, 2013 | 14,922 | |||
Increases for tax position of prior year | 584 | |||
Increases for tax position of current year | 1,760 | |||
Decreases due to lapse of statue of limitations | (860 | ) | ||
Balance as of December 31, 2014 | 16,406 | |||
Increases for tax position of current year | 1,964 | |||
Decreases related to settlement with tax authorities | (4,162 | ) | ||
| Decreases due to lapse of statue of limitations | (669 | ) | ||
Decreases for tax position of prior year | (1,446 | ) | ||
Balance as of December 31, 2015 | $ | 12,093 |
The Company recognizes interest and penalties, if any, related to uncertain tax positions in its income tax provision. AtAs of December 31, 2012, 2011,2015 and 2010,2014, the Company has approximately $0.8 million, $0.7$0.2 million and $0.6$0.5 million, respectively, of accrued interest related to uncertain tax positions.
Uncertain tax positions relate to the allocation of income and deductions among the Company’s global entities and to the determination of the research and development tax credit. TheIt is reasonably possible that over the next twelve-month period, the Company estimates that there will be no material changesmay experience increases or decreases in its uncertainunrecognized tax positions inbenefits. However, it is not possible to determine either the next 12 months.
In Switzerland where the Company designs and sells certain of its products, the Company’s earnings are currently subject to a tax holiday through 2018. The benefit resulting from the tax holiday had an insignificant impact on earnings per share for the periods presented.
On September 13, 2013, the U.S. federal jurisdiction,Treasury Department and various U.S. states and foreign jurisdictions. Generally, the Company is no longer subject to U.S. federal, state and local,IRS issued final regulations that address costs incurred in acquiring, producing, or non-U.S. income tax examinations by tax authorities for years prior to 2005 because of the statute of limitations. However, because the Company is currently under an IRS auditimproving tangible property (the "tangible property regulations"). The tangible property regulations are effective for tax years ended December 31, 2005 through December 31, 2007,beginning on or after January 1, 2014. Given its full valuation allowance, the statuteregulations did not have a material impact on the Company’s consolidated financial position, results of limitations for tax years ended December 31, 2005 through December 31, 2007 was extended to June 30, 2013.operations or cash flows.
Income Tax Audits
The Company is subject to examination of ourits income tax returns by the IRS and other tax authorities. OurThe Company’s U.S. Federal income tax returns for the years ended December 31, 2005 through December 31, 2007 arewere under examination by the IRS. In April 2011, wethe Company received from the IRS a Notice of Proposed Adjustment or “NOPA”,("NOPA") relating to a cost-sharing agreement entered into by the Company and its international subsidiaries on January 1, 2004. In the NOPA, the IRS objected to the Company’s allocation of certain litigation expenses between the Company and ourits international subsidiaries and the amount of “buy-in payments”"buy-in payments" made by ourthe international subsidiaries to the Company in connection with the cost-sharing agreement, and proposed to increase ourthe Company’s U.S. taxable income according to a few alternative methodologies. The methodology resulting in the largest potential adjustment, if the IRS were to prevail on all matters in dispute, would result in potential federal and state income tax liabilities of up to $37.0 million, plus interest and penalties, if any. We believe that the IRS's position in the NOPA is incorrect and that our tax returns for those years were correct as filed. We are contesting these proposed adjustments vigorously. In February 2012, wethe Company received a revised NOPA from the IRS (Revised NOPA)(“Revised NOPA”). In this Revised NOPA, the IRS raised the same issues as in the NOPA issued in April 2011 but under a different methodology. Under the Revised NOPA, the largest potential federal income tax adjustment,payment, if the IRS were to prevail on all matters in dispute, has decreased towas $10.5 million, plus interest and penalties, if any. WeThe Company responded to the IRS Revised NOPA in May 2012, but have not yet2012. In June 2013, the IRS responded and continued to disagree with the Company’s rebuttal. The Company met with the IRS Office of Appeals in 2014 and both parties engaged in continuous discussions for a resolution of the matter in the first quarter of 2015. Meanwhile, the Company granted the IRS an extension of the statute of limitations for taxable years 2005 through 2007 to September 30, 2015.
The IRS also audited the research and development credits carried forward into year 2005 and the credits generated in the years 2005 through 2007. The Company received a responseNOPA from the IRS.
In April 2015, the Company reached a final resolution with the IRS in connection with the income tax audits for the years 2005 through 2007. Under the agreement, the Company made a one-time buy-in payment of $1.2 million for taxes related primarily to the above proposed adjustments. We regularly assessrevaluation of a license for certain intellectual property rights of the likelihoodCompany to one of its international subsidiaries. This buy-in payment is final and no additional payment will be required with respect to the intellectual property license for the years under examination or for a previous or subsequent tax year. In addition, the Company made an adverse outcome resulting from such examinationsinterest payment of $1.0 million as well as a tax payment of $0.1 million for the tax years 2008 to determine2013 in 2015. There were no penalties assessed on the adequacyCompany as a result of ourthe audits.
For the second quarter of 2015, the Company's income tax provision for income taxes. included a one-time net charge of approximately $2.7 million reflecting the taxes and interest, partially offset by the reversal of previously accrued tax liabilities and valuation allowances. Of the $2.7 million charge, approximately $1.6 million was related to taxes and $1.1 million was related to interest.
12. COMMITMENTS AND CONTINGENCIES
Lease Obligations
As of December 31, 2012, based on2015, future minimum payments under the technical merits of our tax return filing positions, we believe that it is more-likely-than-not that the benefit of such positions will be sustained upon the resolution of our audits resulting in no significant impact on our consolidated financial position, results of operations and cash flows.
| Payments by Period | ||||||||||||||||||||||||
| Total | 2013 | 2014 | 2015 | 2016 | Thereafter | |||||||||||||||||||
| Operating leases | $ | 1,165 | $ | 912 | $ | 206 | $ | 45 | $ | 2 | $ | - | ||||||||||||
| Outstanding purchase commitments | 15,542 | 15,542 | - | - | - | - | ||||||||||||||||||
| $ | 16,707 | $ | 16,454 | $ | 206 | $ | 45 | $ | 2 | $ | - | |||||||||||||
2016 | $ | 1,354 | ||
2017 | 631 | |||
2018 | 258 | |||
2019 | 169 | |||
2020 | 116 | |||
Total | $ | 2,528 |
In September 2004, the Company entered into a five-year lease arrangement for its manufacturing facility located in Chengdu, China. Pursuant to this agreement,In September 2015, the Company contributed capital in the form of cash, in-kind assets, and/or intellectual property, of at least $5.0 million to its wholly-owned Chinese subsidiary as the registered capital for the subsidiary and exercised the option to purchase land use rights for the facility of approximately $0.2 million. Following the five-year lease term, the Company now has the option to acquire the facility for approximately $1.8$1.7 million, which consists of total construction costs minus total rent paid by the Company during the lease term. This option became exercisable in March 2011 and does not expire. The Company will likely exercise its purchase option and enter into a purchase agreement for this facilityexpects to close the transaction in the future.
The Company also leases sales and research and development offices in China, Europe, Japan, Korea, Taiwan, and the United States, Japan, China, Taiwan and Korea.States. Certain of the Company’s facility leases provide for periodic rent increases. Rent expense for the years ended December 31, 2012, 20112015, 2014 and 20102013 was $1.6$1.8 million, $2.1$1.5 million and $1.8$1.2 million, respectively.
Warranty and Indemnification Provisions
The Company generally provides a standard one-yearone to two-year warranty against defects in materials and workmanship and will either repair the goods or provide replacements at no charge to the customer for defective units. In such cases, the Company accrues for the related costs at the time the decision to permit the return is made. Reserve requirements are recorded in the period of sale and are based on an assessment of the products sold with warranty and historical warranty costs incurred.
The changes in warranty reserves during 2012, 2011 and 2010 are as follows (in thousands):
| Year Ended December 31, | ||||||||||||
| 2012 | 2011 | 2010 | ||||||||||
| Balance at beginning of year | $ | 561 | $ | 764 | $ | 294 | ||||||
| Warranty provision for product sales | 917 | 870 | 801 | |||||||||
| Settlements made during the period | (675 | ) | (626 | ) | (107 | ) | ||||||
| Unused warranty provision | (472 | ) | (447 | ) | (224 | ) | ||||||
| Balance at end of period | $ | 331 | $ | 561 | $ | 764 | ||||||
Year Ended December 31, | ||||||||||||
2015 | 2014 | 2013 | ||||||||||
Balance at beginning of period | $ | 240 | $ | 451 | $ | 331 | ||||||
Warranty provision for product sales | 333 | 282 | 476 | |||||||||
Settlements made | (158 | ) | (42 | ) | (117 | ) | ||||||
Unused warranty provision | (126 | ) | (451 | ) | (239 | ) | ||||||
Balance at end of period | $ | 289 | $ | 240 | $ | 451 | ||||||
The Company provides indemnification agreements to a supplier and certain direct or indirect customers. The Company agrees to reimburse these parties for any damages, costs and expenses incurred by them as a result of legal actions taken against them by third parties for infringing upon their intellectual property rights as a result of using the Company’s products and technologies. These indemnification provisions are varied in their scope and are subject to certain terms, conditions, limitations and exclusions. In addition, the Company has entered into indemnification agreements with its directors and officers.
It is not possible to predict the maximum potential amount of future payments under these agreements due to the limited history of indemnification claims and the unique facts and circumstances involved in each particular agreement. There were no indemnification costsliabilities incurred in 2012, 2011 and 2010. These costs are charged to operationsany of the periods presented. However, there can be no assurances that the Company will not incur any financial liabilities in the future as incurred. a result of these obligations.
13. LITIGATION
The Company also provides for indemnification of its directors and officers.
O2 Micro
In May 3, 2012, the United States District Court for the Northern District of California (the “District Court”) issued an order finding O2 Micro International, Ltd. (“O2 Micro”) liable for approximately $9.1 million in attorneys’ fees and non-taxable costs, plus interest, in connection with the patent litigation that the Company won in 2010. This award iswas in addition to the approximately $0.3 million in taxable costs that the District Court had earlier ordered O2 Micro to pay to the Company in connection with the same lawsuit. The Court then entered judgment for the Company. In October 2012, O2 Micro appealed the District Court’s judgment to the United States Court of Appeals for the Federal Circuit (the “Federal Circuit”). In August 2013, the Federal Circuit affirmed O2 Micro’s liability for the full amount of the award. In September 2013, O2 Micro filed a petition for rehearing of that ruling, but the Federal Circuit denied O2 Micro’s petition for rehearing in October 2013.
In November 2013, the Company received a cash payment of $9.5 million from O2 Micro. In January 2014, O2 Micro filed an appeal with the United States Supreme Court. Had O2 Micro been successful in obtaining a favorable ruling against this judgment. the Company, the Company could have been liable to return a portion or all of the $9.5 million to O2 Micro. Accordingly, the Company recorded the $9.5 million as a current liability as of December 31, 2013.
In March 2014, the Supreme Court declined to hear the case. As O2 Micro had no further legal avenues to appeal, the Company released the current liability of $9.5 million and recorded the award as a litigation benefit in the Consolidated Statements of Operations in the first quarter of 2014. In addition, the Company incurred additional legal fees of $0.5 million in connection with the final resolution of the lawsuit.
Silergy
In December 2011, the Company entered into a settlement and license agreement with Silergy CorpCorp. and Silergy TechnologiesTechnology for infringement of the Company’s patent whereby the Company willwould receive a total of $2$2.0 million. The first $1.2 million which will bewas paid in equal installments of $0.3 million in each quarter of 2012 and the remainder will bewas paid in two equal installments in the first two quarters of 2013. For the year ended December 31, 2012, the Company received payments totaling $1.2 million, whichAll amounts were recorded as credits to litigation expense (benefit)benefits in the Consolidated Statements of Operations.
Linear14. EMPLOYEE 401(k) PLAN
The Company sponsors a 401(k) retirement savings and profit-sharing plan (“the Plan”) for all employees in the United States who meet certain eligibility requirements. Participants may contribute up to the amount allowable as a deduction for federal income tax purposes. The Company is not required to contribute and did not contribute to the Plan forplan in 2015, 2014 and 2013.
15. SIGNIFICANT CUSTOMERS
The Company sells its products primarily through third-party distributors, value-added resellers and directly to original equipment manufacturers, original design manufacturers, and electronic manufacturing service providers. The following table summarizes those customers with sales greater than 10% of the years ended December 31, 2012, 2011 and 2010.
| Year Ended December 31, | ||||||||||||
Customers | 2015 | 2014 | 2013 | |||||||||
Distributor A | 24 | % | 26 | % | 32 | % | ||||||
| Distributor B | * | * | 10 | % | ||||||||
____________
* Represents less than 10%.
The following table summarizes those customers with accounts receivable balances greater than 10% of the Company'sCompany’s total accounts receivable or with sales greater than 10%receivable:
December 31, | ||||||||
Customers | 2015 | 2014 | ||||||
Distributor A | 28 | % | 31 | % | ||||
Distributor B | 17 | % | 10 | % | ||||
Both of the Company's total revenue:
| Revenue | Accounts Receivable, Net | |||||||||||||||||||
| Year ended December 31, | As of December 31, | |||||||||||||||||||
| Customers | 2012 | 2011 | 2010 | 2012 | 2011 | |||||||||||||||
| A | 32 | % | 27 | % | 21 | % | 34 | % | 33 | % | ||||||||||
| B | * | * | * | 11 | % | * | ||||||||||||||
16. SEGMENT AND GEOGRAHPIC INFORMATION
The Company operates in one reportable segment that includes the design, development, marketing and sale of high-performance mixed-signal analog semiconductorspower solutions for the communications, storage and computing, consumer and industrial markets. The Company’s chief operating decision maker is its chief executive officer.officer, who reviews financial information presented on a consolidated basis for purposes of allocating resources and evaluating financial performance. The Company does not specifically allocate any of its resources to or measure the performance of, individual product families.
The following is a summary of revenue by geographic region based on customer ship-to location for the years ended December 31, 2012, 2011 and 2010regions (in thousands):
| Year ended December 31, | ||||||||||||
| Country | 2012 | 2011 | 2010 | |||||||||
| China | $ | 124,278 | $ | 113,469 | $ | 105,233 | ||||||
| Taiwan | 27,477 | 23,634 | 25,840 | |||||||||
| South East Asia | 21,641 | 14,789 | 10,219 | |||||||||
| Europe | 16,201 | 14,416 | 20,416 | |||||||||
| Korea | 9,434 | 14,183 | 33,761 | |||||||||
| Japan | 8,516 | 10,681 | 14,255 | |||||||||
| USA | 5,711 | 4,422 | 8,415 | |||||||||
| Other | 555 | 925 | 701 | |||||||||
| Total | $ | 213,813 | $ | 196,519 | $ | 218,840 | ||||||
Year Ended December 31, | ||||||||||||
Country or Region | 2015 | 2014 | 2013 | |||||||||
China | $ | 213,119 | $ | 181,050 | $ | 141,400 | ||||||
Taiwan | 41,521 | 38,460 | 34,248 | |||||||||
Europe | 22,603 | 19,830 | 15,351 | |||||||||
Korea | 20,519 | 14,362 | 9,992 | |||||||||
Southeast Asia | 18,592 | 13,993 | 21,760 | |||||||||
Japan | 9,727 | 8,251 | 7,495 | |||||||||
United States | 6,732 | 6,392 | 7,525 | |||||||||
Other | 254 | 197 | 320 | |||||||||
Total | $ | 333,067 | $ | 282,535 | $ | 238,091 | ||||||
The following is a summary of net revenue by product family for the years ended December 31, 2012, 2011 and 2010 (in thousands):
| Year ended December 31, | Percent Change | |||||||||||||||||||||||||||||||
| Product Family | 2012 | % of Revenue | 2011* | % of Revenue | 2010* | % of Revenue | 2012 to 2011 Change | 2011 to 2010 Change | ||||||||||||||||||||||||
| DC to DC Converters | $ | 188,736 | 88.3 | % | $ | 170,032 | 86.5 | % | $ | 190,286 | 87.0 | % | 11.0 | % | (10.6 | %) | ||||||||||||||||
| Lighting Control Products | 25,077 | 11.7 | % | 26,487 | 13.5 | % | 28,554 | 13.0 | % | (5.3 | %) | (7.2 | %) | |||||||||||||||||||
| Total | $ | 213,813 | 100.0 | % | $ | 196,519 | 100.0 | % | $ | 218,840 | 100.0 | % | 8.8 | % | (10.2 | %) | ||||||||||||||||
Year Ended December 31, | ||||||||||||
Product Family | 2015 | 2014 | 2013 | |||||||||
DC to DC products | $ | 299,726 | $ | 253,083 | $ | 211,337 | ||||||
Lighting control products | 33,341 | 29,452 | 26,754 | |||||||||
Total | $ | 333,067 | $ | 282,535 | $ | 238,091 | ||||||
The following is a summary of long-lived assets by geographic region, excluding restricted assets, as of December 31, 2012 and 2011regions (in thousands):
December 31, | ||||||||
Country | 2015 | 2014 | ||||||
China | $ | 40,738 | $ | 37,147 | ||||
United States | 40,405 | 33,913 | ||||||
Bermuda | 11,624 | 13,383 | ||||||
Other | 557 | 339 | ||||||
Total | $ | 93,324 | $ | 84,782 | ||||
17. ACCUMULATED OTHER COMPREHENSIVE INCOME
| December 31, | ||||||||
| 2012 | 2011 | |||||||
| China | $ | 37,071 | $ | 32,566 | ||||
| United States | 23,163 | 15,662 | ||||||
| Taiwan | 90 | 98 | ||||||
| Japan | 57 | 70 | ||||||
| Other | 55 | 51 | ||||||
| TOTAL | $ | 60,436 | $ | 48,447 | ||||
The following table summarizes the changes in accumulated other comprehensive income (in thousands):
Unrealized Losses on Auction-Rate Securities | Unrealized Gains (Losses) on Other Available-for-Sale Securities | Foreign Currency Translation Adjustments | Total | |||||||||||||
Balance as of January 1, 2014 | $ | (360 | ) | $ | 4 | $ | 6,616 | $ | 6,260 | |||||||
Other comprehensive income (loss) before reclassifications | 179 | (17 | ) | (609 | ) | (447 | ) | |||||||||
Amounts reclassified from accumulated other comprehensive income | - | (2 | ) | - | (2 | ) | ||||||||||
Net current period other comprehensive income (loss) | 179 | (19 | ) | (609 | ) | (449 | ) | |||||||||
Balance as of December 31, 2014 | (181 | ) | (15 | ) | 6,007 | 5,811 | ||||||||||
Other comprehensive loss before reclassifications | (28 | ) | (146 | ) | (4,166 | ) | (4,340 | ) | ||||||||
Amounts reclassified from accumulated other comprehensive income | - | (5 | ) | - | (5 | ) | ||||||||||
Net current period other comprehensive loss | (28 | ) | (151 | ) | (4,166 | ) | (4,345 | ) | ||||||||
Balance as of December 31, 2015 | $ | (209 | ) | $ | (166 | ) | $ | 1,841 | $ | 1,466 | ||||||
The amounts reclassified from accumulated other comprehensive income were recorded in interest and Qualifying Accounts
18. SUBSEQUENT EVENTS
15. Stock Repurchase Program
On July 27, 2010,
In February 2016, the Board of Directors approved a new stock repurchase program that authorized MPSauthorizes the Company to repurchase up to $50.0 million in the aggregate of its common stock between August 2, 2010 andthrough December 31, 2011. 2016.
2016 PSUs
In February 2011,2016, the Board of Directors approved an increase from $50.0 million to $70.0 million. From August 2010 through June 2011, the Company repurchased 4,385,289 shares forgranted a total of $70.0 million.349,000 shares to the executive officers and certain non-executive employees, which represent a target number of RSUs to be awarded upon achievement of certain performance conditions. The maximum number of shares that an employee can earn is either 200% or 300% of the target shares. The PSUs contain a purchase price feature, which requires the employees to pay the Company $20 per share upon vesting of the shares. Shares that do not vest will not be subject to the purchase price payment.
19. QUARTERLY FINANCIAL DATA (UNAUDITED)
Three Months Ended | ||||||||||||||||
March 31, 2015 | June 30, 2015 | September 30, 2015 | December 31, 2015 | |||||||||||||
(in thousands, except per share amounts) | ||||||||||||||||
Revenue | $ | 73,538 | $ | 81,416 | $ | 91,194 | $ | 86,918 | ||||||||
Cost of revenue | 33,855 | 37,287 | 41,754 | 40,001 | ||||||||||||
Gross profit | 39,683 | 44,129 | 49,440 | 46,917 | ||||||||||||
Operating expenses: | ||||||||||||||||
Research and development | 16,038 | 15,743 | 17,272 | 16,734 | ||||||||||||
Selling, general and administrative | 17,518 | 17,964 | 18,722 | 18,107 | ||||||||||||
Litigation expense | 270 | 311 | 136 | 283 | ||||||||||||
Total operating expenses | 33,826 | 34,018 | 36,130 | 35,124 | ||||||||||||
Income from operations | 5,857 | 10,111 | 13,310 | 11,793 | ||||||||||||
Interest and other income (expense), net | 642 | 235 | (6 | ) | 550 | |||||||||||
Income before income taxes | 6,499 | 10,346 | 13,304 | 12,343 | ||||||||||||
Income tax provision | 536 | 2,447 | 2,103 | 2,233 | ||||||||||||
Net income | $ | 5,963 | $ | 7,899 | $ | 11,201 | $ | 10,110 | ||||||||
Net income per share: | ||||||||||||||||
Basic | $ | 0.15 | $ | 0.20 | $ | 0.28 | $ | 0.26 | ||||||||
Diluted | $ | 0.15 | $ | 0.19 | $ | 0.28 | $ | 0.24 | ||||||||
Weighted-average shares outstanding: | ||||||||||||||||
Basic | 39,105 | 39,570 | 39,592 | 39,615 | ||||||||||||
Diluted | 40,596 | 40,745 | 40,689 | 41,445 | ||||||||||||
Cash dividends declared per common share | $ | 0.20 | $ | 0.20 | $ | 0.20 | $ | 0.20 | ||||||||
Three Months Ended | ||||||||||||||||
March 31, 2014 | June 30, 2014 | September 30, 2014 | December 31, 2014 | |||||||||||||
(in thousands, except per share amounts) | ||||||||||||||||
Revenue | $ | 60,061 | $ | 68,436 | $ | 78,335 | $ | 75,703 | ||||||||
Cost of revenue | 27,964 | 31,337 | 35,872 | 34,744 | ||||||||||||
Gross profit | 32,097 | 37,099 | 42,463 | 40,959 | ||||||||||||
Operating expenses: | ||||||||||||||||
Research and development | 15,603 | 13,368 | 14,679 | 14,941 | ||||||||||||
Selling, general and administrative | 16,109 | 16,853 | 17,006 | 16,787 | ||||||||||||
Litigation expense (benefit), net | (8,700 | ) | 274 | 332 | 66 | |||||||||||
Total operating expenses | 23,012 | 30,495 | 32,017 | 31,794 | ||||||||||||
Income from operations | 9,085 | 6,604 | 10,446 | 9,165 | ||||||||||||
Interest and other income, net | 190 | 295 | 202 | 407 | ||||||||||||
Income before income taxes | 9,275 | 6,899 | 10,648 | 9,572 | ||||||||||||
Income tax provision (benefit) | 257 | 502 | (573 | ) | 712 | |||||||||||
Net income | $ | 9,018 | $ | 6,397 | $ | 11,221 | $ | 8,860 | ||||||||
Net income per share: | ||||||||||||||||
Basic | $ | 0.23 | $ | 0.17 | $ | 0.29 | $ | 0.23 | ||||||||
Diluted | $ | 0.23 | $ | 0.16 | $ | 0.28 | $ | 0.22 | ||||||||
Weighted-average shares outstanding: | ||||||||||||||||
Basic | 38,470 | 38,684 | 38,785 | 38,807 | ||||||||||||
Diluted | 39,517 | 39,608 | 39,727 | 40,321 | ||||||||||||
Cash dividends declared per common share | $ | - | $ | 0.15 | $ | 0.15 | $ | 0.15 | ||||||||
| 2011 | Shares Repurchased | Average Price per Share | Value (in thousands) | |||||||||
| February | 817,500 | $ | 15.47 | $ | 12,648 | |||||||
| March | 75,000 | $ | 14.17 | $ | 1,062 | |||||||
| April | 917,200 | $ | 14.82 | $ | 13,617 | |||||||
| May | 657,800 | $ | 16.48 | $ | 10,843 | |||||||
| June | 18,000 | $ | 16.79 | $ | 302 | |||||||
| 2,485,500 | $ | 38,472 | ||||||||||
| 2010 | Shares Repurchased | Average Price per Share | Value (in thousands) | |||||||||
| August | 983,189 | $ | 17.29 | $ | 16,998 | |||||||
| November | 916,600 | $ | 15.85 | $ | 14,529 | |||||||
| 1,899,789 | $ | 31,527 | ||||||||||
| Three months ended | ||||||||||||||||
| March 31, 2012 | June 30, 2012 | September 30, 2012 | December 31, 2012 | |||||||||||||
| Revenue | $ | 50,484 | $ | 58,607 | $ | 56,508 | $ | 48,214 | ||||||||
| Cost of revenue (1) | 24,074 | 27,435 | 26,495 | 22,661 | ||||||||||||
| Gross profit | 26,410 | 31,172 | 30,013 | 25,553 | ||||||||||||
| Operating expenses: | ||||||||||||||||
| Research and development (2) | 11,118 | 12,468 | 11,967 | 13,243 | ||||||||||||
| Selling, general and administrative (3) | 11,966 | 12,167 | 11,955 | 13,930 | ||||||||||||
| Litigation expense (benefit), net | 128 | (244 | ) | (229 | ) | (2,600 | ) | |||||||||
| Total operating expenses | 23,212 | 24,391 | 23,693 | 24,573 | ||||||||||||
| Income from operations | 3,198 | 6,781 | 6,320 | 980 | ||||||||||||
| Interest income (expense) and other, net | 106 | 359 | 156 | (10 | ) | |||||||||||
| Income before income taxes | 3,304 | 7,140 | 6,476 | 970 | ||||||||||||
| Income tax provision | 309 | 548 | 555 | 722 | ||||||||||||
| Net income | $ | 2,995 | $ | 6,592 | $ | 5,921 | $ | 248 | ||||||||
| Basic net income per share | $ | 0.09 | $ | 0.19 | $ | 0.17 | $ | 0.01 | ||||||||
| Diluted net income per share | $ | 0.08 | $ | 0.18 | $ | 0.16 | $ | 0.01 | ||||||||
| Weighted average common shares outstanding: | ||||||||||||||||
| Basic | 34,105 | 34,665 | 35,145 | 35,556 | ||||||||||||
| Diluted | 35,538 | 35,997 | 36,438 | 36,763 | ||||||||||||
| (1) Includes stock-based compensation expense | $ | 95 | $ | 118 | $ | 112 | $ | 185 | ||||||||
| (2) Includes stock-based compensation expense | 1,266 | 1,524 | 1,465 | 2,667 | ||||||||||||
| (3) Includes stock-based compensation expense | 1,954 | 2,187 | 2,605 | 4,474 | ||||||||||||
| Total stock-based compensation expense | $ | 3,315 | $ | 3,829 | $ | 4,182 | $ | 7,326 | ||||||||
| Three months ended | ||||||||||||||||
| March 31, 2011 | June 30, 2011 | September 30, 2011 | December 31, 2011 | |||||||||||||
| Revenue | $ | 44,468 | $ | 51,628 | $ | 52,962 | $ | 47,461 | ||||||||
| Cost of revenue (1) | 22,163 | 25,070 | 25,148 | 22,544 | ||||||||||||
| Gross profit | 22,305 | 26,558 | 27,814 | 24,917 | ||||||||||||
| Operating expenses: | ||||||||||||||||
| Research and development (2) | 10,086 | 11,237 | 11,792 | 11,403 | ||||||||||||
| Selling, general and administrative (3) | 9,490 | 10,343 | 10,249 | 10,198 | ||||||||||||
| Litigation expense | 813 | 939 | 722 | 905 | ||||||||||||
| Total operating expenses | 20,389 | 22,519 | 22,763 | 22,506 | ||||||||||||
| Income from operations | 1,916 | 4,039 | 5,051 | 2,411 | ||||||||||||
| Interest income and other, net | 183 | 24 | 3 | 99 | ||||||||||||
| Income before income taxes | 2,099 | 4,063 | 5,054 | 2,510 | ||||||||||||
| Income tax provision (benefit) | 206 | 581 | (419 | ) | 57 | |||||||||||
| Net income | $ | 1,893 | $ | 3,482 | $ | 5,473 | $ | 2,453 | ||||||||
| Basic net income per share | $ | 0.05 | $ | 0.10 | $ | 0.16 | $ | 0.07 | ||||||||
| Diluted net income per share | $ | 0.05 | $ | 0.10 | $ | 0.16 | $ | 0.07 | ||||||||
| Weighted average common shares outstanding: | ||||||||||||||||
| Basic | 35,024 | 33,846 | 33,594 | 33,759 | ||||||||||||
| Diluted | 36,105 | 34,903 | 34,240 | 34,374 | ||||||||||||
| (1) Includes stock-based compensation expense | $ | 63 | $ | 89 | $ | 83 | $ | 77 | ||||||||
| (2) Includes stock-based compensation expense | 1,427 | 1,550 | 1,576 | 1,356 | ||||||||||||
| (3) Includes stock-based compensation expense | 1,497 | 2,036 | 1,715 | 1,657 | ||||||||||||
| Total stock-based compensation expense | $ | 2,987 | $ | 3,675 | $ | 3,374 | $ | 3,090 | ||||||||
ITEM 9. CHANGES IN AND DISAGREEEMENTS
WITH ACCOUNTANTS ON ACCOUNTING AND FINANCIAL DISCLOSURENone.
ITEM 9A. CONTROLS AND PROCEDURES
Evaluation of Disclosure Controls and Procedures
Our management, with the participation of our Chief Executive Officerchief executive officer and Chief Financial Officer,chief financial officer, evaluated the effectiveness of our disclosure controls and procedures pursuant to Rule 13a-15(e) and Rule 15d-15(e) under the Securities Exchange Act of 1934 as of the end of the period covered by this Annual Report on Form 10-K. Our
Based on this evaluation, our chief executive officer and chief financial officer concluded that, as of December 31, 2015, our disclosure controls and procedures have beenare designed at a reasonable assurance level and are effective to ensureprovide reasonable assurance that material information relating to us, including our consolidated subsidiaries,we are required to be disclosed by usdisclose in reports that we file or submit under the Securities Exchange Act of 1934 is recorded, processed, summarized, and reported within the time periods specified in the Securities and Exchange CommissionSEC’s rules and forms. forms, and that such information is accumulated and communicated to our management, including our chief executive officer and chief financial officer, as appropriate, to allow timely decisions regarding required disclosure.
Management’s Report on Internal Control over Financial Reporting
Our management is responsible for establishing and maintaining adequate internal control over financial reporting. Our management conducted an evaluation of the effectiveness of our internal control over financial reporting based on the framework in Internal Control—Integrated Framework (2013)issued by the Committee of Sponsoring Organizations of the Treadway Commission. Based on this evaluation, management concluded that our internal control over financial reporting was effective as of December 31, 2015. Management reviewed the results of its assessment with our Audit Committee.
Our independent registered public accounting firm, Deloitte & Touche LLP, which audited the consolidated financial statements included in this Annual Report on Form 10-K, has issued an attestation report on the effectiveness of our internal control over financial reporting.
Changes in Internal Control over Financial Reporting
There were no changes in our internal control over financial reporting that occurred during the quarter ended December 31, 2015 that have materially affected, or are reasonably likely to materially affect, our internal control over financial reporting.
Limitations on Effectiveness of Controls and Procedures
In designing and evaluating the disclosure controls and procedures, management recognizes that any controls and procedures, no matter how well designed and operated, can provide only reasonable assurance of achieving the desired control objectives. In addition, the design of disclosure controls and procedures must reflect the fact that there are resource constraints and that management is required to apply its judgment in evaluating the benefits of possible controls and procedures relative to their costs.
REPORT OF INDEPENDENT REGISTERED PUBLIC ACCOUNTING FIRM
To the Board of Directors and Stockholders of
Monolithic Power Systems, Inc.
San Jose, California
We have audited the internal control over financial reporting of Monolithic Power Systems, Inc. and subsidiaries (the "Company") as of December 31, 2012,2015, based on the criteria established inInternal Control —- Integrated Framework (2013)issued by the Committee of Sponsoring Organizations of the Treadway Commission.Commission. The Company's management is responsible for maintaining effective internal control over financial reporting and for its assessment of the effectiveness of internal control over financial reporting, included in the accompanying Management’s Annual Report on Internal Control Overover Financial Reporting. Our responsibility is to express an opinion on the Company's internal control over financial reporting based on our audit.
We conducted our audit in accordance with the standards of the Public Company Accounting Oversight Board (United States). Those standards require that we plan and perform the audit to obtain reasonable assurance about whether effective internal control over financial reporting was maintained in all material respects. Our audit included obtaining an understanding of internal control over financial reporting, assessing the risk that a material weakness exists, testing and evaluating the design and operating effectiveness of internal control based on the assessed risk, and performing such other procedures as we considered necessary in the circumstances. We believe that our audit provides a reasonable basis for our opinion.
A company's internal control over financial reporting is a process designed by, or under the supervision of, the company's principal executive and principal financial officers, or persons performing similar functions, and effected by the company's board of directors, management, and other personnel to provide reasonable assurance regarding the reliability of financial reporting and the preparation of financial statements for external purposes in accordance with generally accepted accounting principles. A company's internal control over financial reporting includes those policies and procedures that (1) pertain to the maintenance of records that, in reasonable detail, accurately and fairly reflect the transactions and dispositions of the assets of the company; (2) provide reasonable assurance that transactions are recorded as necessary to permit preparation of financial statements in accordance with generally accepted accounting principles, and that receipts and expenditures of the company are being made only in accordance with authorizations of management and directors of the company; and (3) provide reasonable assurance regarding prevention or timely detection of unauthorized acquisition, use, or disposition of the company's assets that could have a material effect on the financial statements.
Because of the inherent limitations of internal control over financial reporting, including the possibility of collusion or improper management override of controls, material misstatements due to error or fraud may not be prevented or detected on a timely basis. Also, projections of any evaluation of the effectiveness of the internal control over financial reporting to future periods are subject to the risk that the controls may become inadequate because of changes in conditions, or that the degree of compliance with the policies or procedures may deteriorate.
In our opinion, the Company maintained, in all material respects, effective internal control over financial reporting as of December 31, 2012,2015, based on the criteria established inInternal Control —- Integrated Framework (2013)issued by the Committee of Sponsoring Organizations of the Treadway Commission.Commission.
We have also audited, in accordance with the standards of the Public Company Accounting Oversight Board (United States), the consolidated financial statements as of and for the year ended December 31, 2012,2015 of the Company and our report dated March 5, 2013February 29, 2016 expressed an unqualified opinion on those financial statements.
/s/ DELOITTE & TOUCHE LLP
San Jose, California
February 29, 2016
ITEM 9B. OTHER INFORMATION
None.
PART III
ITEM 10. DIRECTORS, EXECUTIVE OFFICERS AND CORPORATE GOVERNANCE
Reference is made to the information regarding directors and nominees, code of ethics, corporate governance matters and disclosure relating to compliance with Section 16(a) of the Securities Exchange Act of 1934 appearing under the captions “Election of Directors” and “Compliance with Section 16(a) Beneficial Ownership Reporting Compliance” in ourthe Company’s Proxy Statement for ourits 2016 Annual Meeting of Stockholders (the “2013���2016 Annual Meeting”), which information is incorporated in this Annual Report on Form 10-K by reference. Information regarding executive officers is set forth under the caption “Executive Officers of the Registrant” in Part I of this Annual Report on Form 10-K.
ITEM 11. EXECUTIVE COMPENSATION
The information required by this item iswill be set forth under the caption “Executive Officer Compensation” in ourthe Company’s Proxy Statement for the 20132016 Annual Meeting, and is incorporated herein by reference.
ITEM 12. SECURITY OWNERSHIP OF CERTAIN BENEFICIAL OWNERS AND MANAGEMENT AND RELATED STOCKHOLDER MATTERS
The information required by this item iswill be set forth under the captions “Security Ownership of Certain Beneficial Owners and Management” and “Equity Compensation Plan Information” in ourthe Company’s Proxy Statement for the 20132016 Annual Meeting, and is incorporated herein by reference.
ITEM 13. CERTAIN RELATIONSHIPS AND RELATED TRANSACTIONS, AND DIRECTOR INDEPENDENCE
The information required by this item iswill be set forth under the captions “Certain Relationships and Related Transactions” and “Election of Directors” in ourthe Company’s Proxy Statement for the 20132016 Annual Meeting, and is incorporated herein by reference.
ITEM 14. PRINCIPAL ACCOUNTING FEES AND SERVICES
The information required by this item iswill be set forth under the caption “Accounting“Audit and Other Fees” in ourthe Company’s Proxy Statement for the 20132016 Annual Meeting, and is incorporated herein by reference.
PART IV
ITEM 15. EXHIBITS AND FINANCIAL STATEMENT SCHEDULES.
(a) Documents filed as part of this report
(1) All financial statements
Report of Independent Registered Public Accounting Firm
Consolidated Balance Sheets
Consolidated Statements of Operations
Consolidated Statements of Comprehensive Income
Consolidated Statements of Stockholders’ Equity
Consolidated Statements of Cash Flows
Notes to Consolidated Financial Statements
(2)Financial StatementSchedules
All schedules have been omitted because the required information is not present or not present in amounts sufficient to require submission of the schedules, or because the information required is included in the consolidated financial statements or notes thereto.
(3) Exhibits
Exhibit Number | Description | |
3.1 (1) | Amended and Restated Certificate of Incorporation. | |
3.2 (2) | Amended and Restated Bylaws. | |
10.1+ (3) | Registrant’s 1998 Stock Plan and form of option agreement. | |
10.2+ (4) | ||
Registrant’s 2004 Employee Stock Purchase Plan and form of subscription agreement. | ||
10.3+ (5) | Form of Directors’ and Officers’ Indemnification Agreement. | |
10.4† (6) | Foundry Agreement between the Registrant and Advanced Semiconductor Manufacturing Corp. of Shanghai, dated August 14, 2001. | |
10.5+ (7) | Employment Agreement with Michael Hsing and Amendment thereof. | |
10.6+ (8) | Employment Agreement with Maurice Sciammas and Amendment thereof. | |
10.7+ (9) | ||
Employment Agreement with Jim Moyer. | ||
10.8+(10) | Employment Agreement with Deming Xiao and Amendment thereof. | |
10.9 (11) | ||
Distribution Agreement with Asian Information Technology Inc. Ltd., dated March 1, 2004. | ||
10.10†(12) | ||
Investment and Cooperation Contract, dated August 19, 2004. | ||
10.11+(13) | ||
Form of Performance Unit Agreement. | ||
10.12+(14) | ||
Letter Agreement with Victor Lee. | ||
10.13+(15) | ||
Letter Agreement with Douglas McBurnie. | ||
10.14+(16) | Letter Agreement with Karen A. Smith Bogart. | |
10.15+(17) | ||
Registrant’s Employee Bonus Plan, as amended effective March 6, 2008. | ||
10.16+(18) | Form of Restricted Stock Award Agreement. | |
10.17+(19) | Letter Agreement with Jeff Zhou. | |
10.18+(20) | Employment Agreement with Meera P. Rao and Saria Tseng and Amendments thereof. |
| 10.19+(21) | Monolithic Power Systems, Inc. Master Cash Performance Bonus Plan. | |
| Monolithic Power Systems, Inc. 2004 Equity Incentive Plan, as Amended, and Form of | ||
| 21.1 | Subsidiaries of Monolithic Power Systems, Inc. | |
23.1 | Consent of Independent Registered Public Accounting Firm. | |
24.1 | Power of Attorney (included on Signature page to this Form 10-K). | |
31.1 | Certification of Chief Executive Officer pursuant to Securities Exchange Act Rules 13a-14(a) and 15d-14(a), as adopted pursuant to Section 302 of the Sarbanes-Oxley Act of 2002. | |
31.2 | Certification of Chief Financial Officer pursuant to Securities Exchange Act Rules 13a-14(a) and 15d-14(a), as adopted pursuant to Section 302 of the Sarbanes-Oxley Act of 2002. | |
32.1* | Certification of Chief Executive Officer and Chief Financial Officer pursuant to 18 U.S.C. Section 1350, as adopted pursuant to Section 906 of the Sarbanes-Oxley Act of 2002. | |
101.INS | XBRL Instance | |
101.SCH | XBRL Taxonomy Extension Schema | |
101.CAL | XBRL Taxonomy Extension Calculation | |
101.DEF | XBRL Taxonomy Extension Definition | |
101.LAB | XBRL Taxonomy Extension Labels | |
101.PRE | XBRL Taxonomy Extension Presentation |
+ | Management contract or compensatory plan or arrangement. |
† | Confidential treatment requested for portions of this agreement, which portions have been omitted and filed separately with the Securities and Exchange Commission |
* | This exhibit shall not be deemed “filed” for purposes of Section 18 of the Securities Exchange Act of 1934 or otherwise subject to the liabilities of that Section, nor shall it be deemed incorporated by reference in any filings under the Securities Act of 1933 or the Securities Exchange Act of 1934, whether made before or after the date hereof and irrespective of any general incorporation language in any filings. |
(1) |
Incorporated by reference to Exhibit 3.2 of the Registrant’s |
(2) | Incorporated by reference to Exhibit 3.4 of the Registrant’s |
(3) | Incorporated by reference to Exhibit 10.1 of the Registrant’s Registration Statement on Form S-1 |
(4) | Incorporated by reference to Exhibit 10.3 of the Registrant’s Registration Statement on Form S-1 |
(5) | Incorporated by reference to Exhibit 10.4 of the Registrant’s |
(6) | Incorporated by reference to Exhibit 10.5 of the Registrant’s |
(7) |
Incorporated by reference to Exhibit 10.7 of the Registrant’s |
(8) | Incorporated by reference to Exhibit 10.8 of the Registrant’s |
(9) | Incorporated by reference to Exhibit 10.9 of the Registrant’s Registration Statement on Form S-1 |
(10) | Incorporated by reference to Exhibit 10.10 of the Registrant’s |
(11) | Incorporated by reference to Exhibit 10.11 of the Registrant’s |
(12) |
Incorporated by reference to Exhibit 10.13 of the Registrant’s | |
(13) |
Incorporated by reference to Exhibit 10.1 of the Registrant’s current report on Form 8-K (File No. 000-51026), filed with the Securities and Exchange Commission on |
(14) |
Incorporated by reference to Exhibit 10.1 of the Registrant’s current report on Form 8-K (File No. 000-51026), filed with the Securities and Exchange Commission on |
(15) |
Incorporated by reference to Exhibit 10.1 of the Registrant’s current report on Form 8-K |
(16) | Incorporated by reference to Exhibit 10.2 of the Registrant’s current report on Form 8-K (File No. 000-51026), filed with the Securities and Exchange Commission on May 25, 2007. |
(17) | Incorporated by reference to Exhibit 10.31 of the Registrant’s annual report on Form 10-K (File No. 000-51026), filed with the Securities and Exchange Commission on March 11, 2008. |
(18) | Incorporated by reference to Exhibit 10.1 of the Registrant’s current report on Form 8-K (File No. 000-51026), filed with the Securities and Exchange Commission on |
(19) |
Incorporated by reference to Exhibit 10.1 of the Registrant’s current report on Form 8-K (File No. 000-51026), filed with the Securities and Exchange Commission on February |
(20) |
Incorporated by reference to Exhibit 10.33 of the Registrant’s annual report on Form 10-K (File No. 000-51026), filed with the Securities and Exchange Commission on March 4, 2011. | |
(21) | Incorporated by reference to Annexure C of the Registrant’s Proxy Statement on Schedule 14A(File No. 000-51026), filed with the Securities and Exchange Commission on April 30, 2013. |
(22) | Incorporated by reference to Exhibit 10.36 of the Registrant’s annual report on Form 10-K (File No. 000-51026), filed with the Securities and Exchange Commission on March 10, 2014. |
(23) | Incorporated by reference to Exhibit 4.4 of the Registrant’s Registration Statement on Form S-8 (Registration No. 333-199782), filed with the Securities and Exchange Commission on November 3, 2014. |
(24) | Incorporated by reference to Exhibit 4.6 of the Registrant’s Registration Statement on Form S-8(Registration No. 333-199782), filed with the Securities and Exchange Commission on November 3, 2014. |
SIGNATURES
Pursuant to the requirements of Section 13 or 15(d) of the Securities Exchange Act of 1934, the registrant has duly caused this Annual Report on Form 10-K to be signed on its behalf by the undersigned, thereunto duly authorized.
MONOLITHIC POWER SYSTEMS, INC. | |||
Date: February 29, 2016 | By: | ||
/s/ MICHAEL R. HSING | |||
Michael R. Hsing | |||
President and Chief Executive Officer | |||
KNOW ALL PERSONS BY THESE PRESENTS, that each person whose signature appears below constitutes and appoints Michael R. Hsing and Meera P. Rao, jointly and each of them, asseverally, his or her true and lawful attorneys-in-fact, and agents,each with fullthe power of substitution, and re-substitution, for him or her and in his or her name, place, and stead, in any and all capacities, to sign any and all amendments to this Annual Report on Form 10-K, and to file the same, with all exhibits thereto and other documents in connection therewith, with the Securities and Exchange Commission, granting unto said attorneys-in-fact and agents, and each of them, full power and authority to do and perform each and every act and thing requisite and necessary to be done in connection therewith, as fully to all intents and purposes as he or she might or could do in person, hereby ratifying and confirming all that alleach of said attorneys-in-fact, and agents, or any of his or her substitute or substituted,substitutes, may lawfully do or cause to be done by virtue hereof.
Pursuant to the requirements of the Securities Exchange Act of 1934, this reportAnnual Report on Form 10-K has been signed below on March 5, 2013February 29, 2016 by the following persons on behalf of the registrant and in the capacities indicated:
/s/ MICHAEL R. HSING | President, Chief Executive Officer, and Director (Principal Executive Officer) | |
Michael R. Hsing | ||
/s/ MEERA P. RAO | Chief Financial Officer (Principal Financial and Accounting | |
Meera P. Rao | ||
/s/ KAREN A. SMITH BOGART | Director | |
Karen A. Smith Bogart | ||
/s/ HERBERT CHANG | Director | |
Herbert Chang | ||
/s/ EUGEN ELMIGER | Director | |
Eugen Elmiger | ||
/s/ VICTOR K. LEE | Director | |
Victor K. Lee | ||
/s/ JAMES C. MOYER | Director | |
James C. Moyer | ||
/s/ JEFF ZHOU | Director | |
Jeff Zhou |
79