QCR HOLDINGS, INC. AND SUBSIDIARIES
INDEX
Page Number(s) | |||||
Part I | |||||
Item | Business | 4-13 | |||
Item | Risk Factors | 13-22 | |||
Item 1B. | Unresolved Staff Comments | 22 | |||
Item 2. | Properties | 22-23 | |||
Item 3. | Legal Proceedings | 23 | |||
Item 4. | Mine Safety Disclosures | 23 | |||
Part II | |||||
Item | Market for Registrant's Common Equity, Related Stockholder Mattersand | 23-24 | |||
Item | Selected Financial Data | 25 | |||
Item 7. | Management's Discussion and Analysis of Financial Condition andResults of Operations | 26-55 | |||
Item 7A. | Quantitative and Qualitative Disclosures About Market Risk | 55-56 | |||
Item 8. | Financial Statements | 57-130 | |||
Item 9. | Changes in and Disagreements With Accountants on Accountingand Financial Disclosure | 131 | |||
Item 9A. | Controls and Procedures | 131-134 | |||
Item 9B. | Other Information | 134 | |||
Part III | |||||
Item 10. | Directors, Executive Officers and Corporate Governance | 134 | |||
Item 11. | Executive Compensation | 134 | |||
Item 12. | Security Ownership of Certain Beneficial Owners and Management andRelated Stockholder Matters | 134 | |||
Item 13. | Certain Relationships and Related Transactions, and Director Independence | 135 | |||
Item 14. | Principal Accountant Fees and Services | 135 | |||
Part IV | |||||
Item 15. | Exhibits | 135-138 | |||
Signatures | 139-140 | ||||
Part I
Item 1. Business
General.QCR Holdings, Inc. (the “Company”) is a multi-bank holding company headquartered in Moline, Illinois, that was formed in February 1993 under the laws of the state of Delaware. The Company serves the Quad Cities, Cedar Rapids, Waterloo/Cedar Falls and Rockford communities through the following three wholly-owned banking subsidiaries, which provide full-service commercial and consumer banking and trust and asset management services:
● | Quad City Bank and Trust Company (“QCBT”), which is based in Bettendorf, Iowa, and commenced operations in 1994; |
● | Cedar Rapids Bank and Trust Company (“CRBT”), which is based in Cedar Rapids, Iowa, and commenced operations in 2001; and |
● | Rockford Bank and Trust Company (“RB&T”), which is based in Rockford, Illinois, and commenced operations in 2005. |
On May 13, 2013, the Company acquired Community National Bancorporation (“Community National”) and its banking subsidiary, Community National Bank (“CNB”). Community National and CNB commenced operations in 1997 and historically provided full-service commercial and consumer banking, and trust and asset management services, to Cedar Falls, Mason City, and Waterloo, Iowa and Austin, Minnesota. At acquisition, CNB had a total of eight branch facilities with four in the Waterloo/Cedar Falls area where CNB was headquartered, two in Mason City, and two in Austin. On October 4, 2013, the Company finalized the sale of the two branches in Mason City. On October 11, 2013, the Company finalized the sale of the two branches in Austin. On October 26, 2013, CNB merged with and into CRBT. CNB’s merged branch offices operate as a division of CRBT under the name “Community Bank & Trust.” In December 2013, one of the branch facilities in Cedar Falls was closed due to lack of sufficient customer activity. See Note 2 to the consolidated financial statements for further discussion of the acquisition and sales of certain branches.
The Company also engages in direct financing lease contracts through m2 Lease Funds, LLC (“m2”), a wholly-owned subsidiary of QCBT based in Brookfield, Wisconsin. QCBT previously owned 80% of m2. In August 2012, QCBT entered into an amendment to the operating agreement of m2 and purchased the remaining 20% noncontrolling interest. See Note 21 to the consolidated financial statements for further discussion of the acquisition.
Subsidiary Banks.QCBT was capitalized on October 13, 1993, and commenced operations on January 7, 1994. QCBT is an Iowa-chartered commercial bank that is a member of the Federal Reserve System with depository accounts insured by the Federal Deposit Insurance Corporation (the “FDIC”) to the maximum amount permitted by law. QCBT provides full service commercial, correspondent, and consumer banking and trust and asset management services in the Quad Cities and adjacent communities through its five offices that are located in Bettendorf and Davenport, Iowa and in Moline, Illinois. QCBT, on a consolidated basis with m2, had total segment assets of $1.18$1.32 billion and $1.11$1.25 billion as of December 31, 20122014 and 2011,2013, respectively.
CRBT is an Iowa-chartered commercial bank that is a member of the Federal Reserve System with depository accounts insured by the FDIC to the maximum amount permitted by law. The Company commenced operations in Cedar Rapids in June 2001, operating a branch of QCBT. The Cedar Rapids branch operation then began functioning under the CRBT charter in September 2001. As previously discussed, the merged branches of CNB operate as a division of CRBT under the name “Community Bank & Trust.” CRBT provides full-service commercial and consumer banking and trust and asset management services to Cedar Rapids and Waterloo/Cedar Falls, Iowa and adjacent communities through its twofive facilities. The headquarters for CRBT is located in downtown Cedar Rapids and itswith one other branch location is located in northern Cedar Rapids.Rapids ,two branches located in Waterloo and one branch located in Cedar Falls. CRBT had total segment assets of $625.7$840.3 million and $560.1$804.2 million as of December 31, 20122014 and 2011,2013, respectively.
RB&T is an Illinois-chartered commercial bank that is a member of the Federal Reserve System with depository accounts insured by the FDIC to the maximum amount permitted by law. The Company commenced operations in Rockford, Illinois in September 2004, operating a branch of QCBT, and that operation began functioning under the RB&T charter in January 2005. RB&T provides full-service commercial and consumer banking and trust and asset management services to Rockford and adjacent communities through its original office located in downtown Rockford and its branch facilityheadquarters located on Guilford Road at Alpine Road in Rockford and its branch facility located in downtown Rockford. RB&T had total segment assets of $313.8$353.4 million and $294.4$339.4 million as of December 31, 20122014 and 2011,2013, respectively.
See Note 2022 to the consolidated financial statements for additional business segment information.
Other Operating Subsidiaries.m2, which is based in Brookfield, Wisconsin, is engaged in the business of leasing machinery and equipment to commercial and industrial businesses under direct financing lease contracts. On August 26, 2005, QCBT originally acquired 80% of the membership units of m2. John Engelbrecht,m2 but subsequently acquired the President and Chief Executive Officer of m2, retained 20% of the membership units. On August 31, 2012, QCBT acquired theremaining 20% noncontrolling interest previously owned by John Engelbrecht.Engelbrecht in 2012.
Velie Plantation Holding Company (“VPHC”), previously owned 91% by the Company, was engaged in holding the real estate property known as the Velie Plantation Mansion in Moline, Illinois. Beginning in 1998,Illinois, which is the Company held a 20% equity investment in VPHC. The Company acquired additional membership units in 2006 (37%), in 2009 (16%), and in 2010 (18%), bringing its total equity investment to 91%.location for the Company’s headquarters. During the fourth quarter of 2012, the Company acquired the remaining 9% noncontrolling interest and, effective as of December 31, 2012, VPHC was dissolved and liquidated.
Trust Preferred Subsidiaries.Following is a listing of the Company’s non-consolidated subsidiaries formed for the issuance of trust preferred securities, including pertinent information as of December 31, 20122014 and 2011:2013:
| Name | Date Issued | Amount Issued | Interest Rate | Interest Rate as of 12/31/12 | Interest Rate as of 12/31/11 | |||||||||
| QCR Holdings Statutory Trust II | February 2004 | $ | 12,372,000 | 2.85% over 3-month LIBOR * | 3.21 | % | 3.22 | % | ||||||
| QCR Holdings Statutory Trust III | February 2004 | 8,248,000 | 2.85% over 3-month LIBOR | 3.21 | % | 3.22 | % | |||||||
| QCR Holdings Statutory Trust IV | May 2005 | 5,155,000 | 1.80% over 3-month LIBOR | 2.14 | % | 2.20 | % | |||||||
| QCR Holdings Statutory Trust V | February 2006 | 10,310,000 | 1.55% over 3-month LIBOR ** | 1.89 | % | 1.95 | % | |||||||
| $ | 36,085,000 | Weighted Average Rate | 2.68 | % | 2.71 | % | ||||||||
Name | Date Issued | Amount Issued | Interest Rate | Interest Rate as of 12/31/2014 | Interest Rate as of 12/31/2013 | |||||||||
QCR Holdings Statutory Trust II | February 2004 | $ | 12,372,000 | 2.85% over 3-month LIBOR | 3.08% | 3.10% | ||||||||
QCR Holdings Statutory Trust III | February 2004 | 8,248,000 | 2.85% over 3-month LIBOR | 3.08% | 3.10% | |||||||||
QCR Holdings Statutory Trust IV | May 2005 | 5,155,000 | 1.80% over 3-month LIBOR | 2.03% | 2.04% | |||||||||
QCR Holdings Statutory Trust V | February 2006 | 10,310,000 | 1.55% over 3-month LIBOR | 1.78% | 1.79% | |||||||||
Community National Statutory Trust II | September 2004 | 3,093,000 | 2.17% over 3-month LIBOR | 2.42% | 2.42% | |||||||||
Community National Statutory Trust III | March 2007 | 3,609,000 | 1.75% over 3-month LIBOR | 1.99% | 1.99% | |||||||||
| $ | 42,787,000 | Weighted Average Rate | 2.50% | 2.51% | ||||||||||
Securities issued by Trust II, Trust III, Trust IV, and Trust Vall of the trusts listed above mature thirty years from the date of issuance, but are all currently callable at par at anytime.
Other Ownership Interests.The Company invests limited amounts of its capital in stocks of financial institutions and mutual funds. In addition to its wholly-owned subsidiaries, the Company owns a 20% equity position in Nobel Real Estate Investors, LLC. In June 2005, CRBT entered into a joint venture as a 50% owner of Cedar Rapids Mortgage Company, LLC.
Business.The Company’s principal business consists of attracting deposits and investing those deposits in loans/leases and securities. The deposits of the subsidiary banks are insured to the maximum amount allowable by the FDIC. The Company’s results of operations are dependent primarily on net interest income, which is the difference between the interest earned on its loans/leases and securities and the interest paid on deposits and borrowings. The Company’s operating results are affected by economic and competitive conditions, particularly changes in interest rates, government policies and actions of regulatory authorities, as described more fully in this Form 10-K. Its operating results also can be affected by trust fees, investment advisory and management fees, deposit service charge fees, gains on the sale of residential real estate and government guaranteed loans, earnings from bank-owned life insurance (“BOLI”) and other income. Operating expenses include employee compensation and benefits, occupancy and equipment expense, professional and data processing fees, advertising and marketing expenses, bank service charges, FDIC and other insurance, loan/lease expenses and other administrative expenses.
The Company and its subsidiaries collectively employed 356409 and 355400 full-time equivalents (“FTEs”) at December 31, 20122014 and 2011,2013, respectively.
The Board of Governors of the Federal Reserve System (the “Federal Reserve”) is the primary federal regulator of the Company and its subsidiaries. In addition, QCBT and CRBT are regulated by the Iowa Superintendent of Banking (“Iowa Superintendent”) and RB&T is regulated by the State of Illinois Department of Financial and Professional Regulation (“DFPR”). The FDIC, as administrator of the Deposit Insurance Fund, also has regulatory authority over the subsidiary banks.
Lending/Leasing. The Company and its subsidiaries provide a broad range of commercial and retail lendinglending/leasing and investment services to corporations, partnerships, individuals, and government agencies. The subsidiary banks actively market their services to qualified lending and deposit clients. Officers actively solicit the business of new clients entering their market areas as well as long-standing members of the local business community. The Company has an established lending/leasing policy which includes a number of underwriting factors to be considered in making a loan/lease, including, but not limited to, location, loan-to-value ratio, cash flow, collateral and the credit history of the borrower.
In accordance with Iowa regulation, the legal lending limit to one borrower for QCBT and CRBT, calculated as 15% of aggregate capital, was $14.9$15.5 million and $8.4$11.9 million, respectively, as of December 31, 2012.2014. In accordance with Illinois regulation, the legal lending limit to one borrower for RB&T, calculated as 25% of aggregate capital, totaled $9.4$9.0 million as of December 31, 2012.
The Company recognizes the need to prevent excessive concentrations of credit exposure to any one borrower or group of related borrowers. As such, the Company has established an in-house lending limit, which is lower than each subsidiary bank’s legal lending limit, in an effort to manage individual borrower exposure levels.
The in-house lending limit is the maximum amount of credit each subsidiary bank will extend to a single borrowing entity or group of related entities. Under the in-house limit, total credit exposure to a single borrowing entity or group of related entities will not exceed the following, subject to certain exceptions:
Quad City Bank & Trust: | $ |
Cedar Rapids Bank & Trust: | $ |
Rockford Bank & Trust: | $3.7 million |
On a consolidated basis, the in-house lending limit is $10.0$15.0 million, which is the maximum amount of credit that all affiliated banks, when combined, will extend to a single borrowing entity or group of related entities, subject to certain exceptions.
In addition, m2’s in-house lending limit is $1.0 million to a single leasing entity or group of related entities.
As part of the loan monitoring activity at the three subsidiary banks, credit administration personnel interact closely with senior bank management. For example, the internal loan committee of each subsidiary bank meets weekly. The Company has a separate in-house loan review function to analyze credits of the subsidiary banks. To complement the in-house loan review, an independent third-party performs external loan reviews. ManagementHistorically, management has attempted to identify problem loans at an early stage and to aggressively seek a resolution of those situations.
The Company recognizes that a diversified loan/lease portfolio contributes to reducing risk in the overall loan/lease portfolio. The specific loan/lease portfolio mix is subject to change based on loan/lease demand, the business environment and various economic factors. The Company actively monitors concentrations within the loan/lease portfolio to ensure appropriate diversification and concentration risk is maintained.
Specifically, each subsidiary bank’s total loans as a percentage of average assets may not exceed 85%. In addition, following are established policy limits and the actual allocations for the three subsidiary banks as of December 31, 20122014 for the loan portfolio on a per loan type basis, reflected as a percentage of the subsidiary bank’s average gross loans:
| As of December 31, 2012 | ||||||||||||||||
| Type of Loan * | Maximum Percentage per Loan Policy ** | QCBT | CRBT | RB&T | ||||||||||||
| One-to-four family residential | 30 | % | 15 | % | 11 | % | 19 | % | ||||||||
| Multi-family | 15 | % | 4 | % | 8 | % | 5 | % | ||||||||
| Farmland | 5 | % | 0 | % | 0 | % | 1 | % | ||||||||
| Non-farm, nonresidential | 50 | % | 28 | % | 40 | % | 45 | % | ||||||||
| Construction and land development | 20 | % | 5 | % | 5 | % | 3 | % | ||||||||
| Commercial and industrial | 60 | % | 20 | % | 30 | % | 24 | % | ||||||||
| Loans to individuals | 10 | % | 3 | % | 2 | % | 1 | % | ||||||||
| Lease financing | 20 | % | 16 | % | 0 | % | 0 | % | ||||||||
| All other loans | 10 | % | 9 | % | 4 | % | 2 | % | ||||||||
| 100 | % | 100 | % | 100 | % | |||||||||||
| Bank stock loans *** | 15 | % | 7 | % | 0 | % | 1 | % | ||||||||
QCBT | CRBT | RBT | |||||||
Type of Loan * | Maximum Percentage per Loan Policy | As of December 31, 2014 | Maximum Percentage per Loan Policy | As of December 31, 2014 | Maximum Percentage per Loan Policy | As of December 31, 2014 | |||
One-to-four family residential | 30% | 14% | 25% | 11% | 30% | 21% | |||
Multi-family | 15% | 3% | 15% | 7% | 15% | 4% | |||
Farmland | 5% | 1% | 5% | 1% | 5% | 0% | |||
Non-farm, nonresidential | 50% | 25% | 50% | 35% | 50% | 46% | |||
Construction and land development | 20% | 3% | 15% | 9% | 20% | 3% | |||
Commercial and industrial | 60% | 20% | 60% | 25% | 60% | 22% | |||
Loans to individuals | 10% | 1% | 10% | 1% | 10% | 1% | |||
Lease financing | 30% | 22% | 5% | 0% | 20% | 0% | |||
Bank stock loans | ** | 6% | 10% | 2% | 10% | 0% | |||
All other loans | 15% | 5% | 10% | 9% | 10% | 3% | |||
100% | 100% | 100% | |||||||
* The loan types above are as defined and reported in the subsidiary banks’ quarterly Reports of Condition and Income (also known as Call Reports).
** TheQCBT’s maximum percentages listed are the same for all subsidiary banks except for CRBT, where the maximum percentage for one-to-four family residential is 25%, the maximum percentage for construction and land development is 15%, and the maximum percentage for lease financing receivables is 5%. Additionally, both CRBT and RB&T have maximum percentages for bank stock loans is 150% of 10%aggregate capital (bank stock loan commitments are limited to 200% of aggregate capital).
The following table presents total loans/leases by major loan/lease type and subsidiary as of December 31, 20122014 and 2011.2013. Residential real estate loans held for sale are included in residential real estate loans below.
Quad City Bank & Trust | m2 Lease Funds | Cedar Rapids Bank & Trust | Rockford Bank & Trust | Intercompany Elimination | Consolidated Total | |||||||||||||||||||||||||||||||||||||||
| $ | % | $ | % | $ | % | $ | % | $ | $ | % | ||||||||||||||||||||||||||||||||||
| (dollars in thousands) | ||||||||||||||||||||||||||||||||||||||||||||
| As of December 31, 2012: | ||||||||||||||||||||||||||||||||||||||||||||
| Commercial and industrial loans | $ | 203,542 | 36 | % | $ | - | 0 | % | $ | 130,261 | 35 | % | $ | 60,441 | 26 | % | $ | - | $ | 394,244 | 31 | % | ||||||||||||||||||||||
| Commercial real estate loans | 258,133 | 45 | % | - | 0 | % | 201,659 | 54 | % | 136,025 | 58 | % | (1,838 | ) | 593,979 | 46 | % | |||||||||||||||||||||||||||
| Direct financing leases | - | 0 | % | 103,686 | 96 | % | - | 0 | % | - | 0 | % | - | 103,686 | 8 | % | ||||||||||||||||||||||||||||
| Residential real estate loans | 60,666 | 11 | % | - | 0 | % | 27,863 | 7 | % | 27,053 | 11 | % | - | 115,582 | 9 | % | ||||||||||||||||||||||||||||
| Installment and other consumer loans | 47,621 | 8 | % | - | 0 | % | 17,425 | 4 | % | 11,675 | 5 | % | - | 76,721 | 6 | % | ||||||||||||||||||||||||||||
| Deferred loan/lease origination costs, net of fees | (77 | ) | 0 | % | 3,907 | 4 | % | (738 | ) | 0 | % | 84 | 0 | % | - | 3,176 | 0 | % | ||||||||||||||||||||||||||
| $ | 569,885 | 100 | % | $ | 107,593 | 100 | % | $ | 376,470 | 100 | % | $ | 235,278 | 100 | % | $ | (1,838 | ) | $ | 1,287,388 | 100 | % | ||||||||||||||||||||||
| As of December 31, 2011: | ||||||||||||||||||||||||||||||||||||||||||||
| Commercial and industrial loans | $ | 177,069 | 34 | % | $ | - | 0 | % | $ | 116,714 | 34 | % | $ | 57,011 | 25 | % | $ | - | $ | 350,794 | 29 | % | ||||||||||||||||||||||
| Commercial real estate loans | 260,895 | 49 | % | - | 0 | % | 184,338 | 53 | % | 134,580 | 59 | % | (2,009 | ) | 577,804 | 48 | % | |||||||||||||||||||||||||||
| Direct financing leases | - | 0 | % | 93,212 | 97 | % | - | 0 | % | - | 0 | % | - | 93,212 | 8 | % | ||||||||||||||||||||||||||||
| Residential real estate loans | 43,405 | 8 | % | - | 0 | % | 29,847 | 8 | % | 24,855 | 11 | % | - | 98,107 | 8 | % | ||||||||||||||||||||||||||||
| Installment and other consumer loans | 48,590 | 9 | % | - | 0 | % | 17,846 | 5 | % | 11,787 | 5 | % | - | 78,223 | 7 | % | ||||||||||||||||||||||||||||
| Deferred loan/lease origination costs, net of fees | 56 | 0 | % | 3,217 | 3 | % | (703 | ) | 0 | % | 35 | 0 | % | - | 2,605 | 0 | % | |||||||||||||||||||||||||||
| $ | 530,015 | 100 | % | $ | 96,429 | 100 | % | $ | 348,042 | 100 | % | $ | 228,268 | 100 | % | $ | (2,009 | ) | $ | 1,200,745 | 100 | % | ||||||||||||||||||||||
Quad City | m2 | Cedar Rapids | Rockford | Intercompany | Consolidated | |||||||||||||||||||||||||||||||||||||||
Bank & Trust | Lease Funds | Bank & Trust | Bank & Trust | Elimination | Total | |||||||||||||||||||||||||||||||||||||||
$ | % | $ | % | $ | % | $ | % | $ | $ | % | ||||||||||||||||||||||||||||||||||
| (dollars in thousands) | ||||||||||||||||||||||||||||||||||||||||||||
As of December 31, 2014: |
| |||||||||||||||||||||||||||||||||||||||||||
Commercial and industrial loans | $ | 238,495 | 39 | % | $ | 4,739 | 3 | % | $ | 212,208 | 37 | % | $ | 68,485 | 25 | % | $ | - | $ | 523,927 | 32 | % | ||||||||||||||||||||||
Commercial real estate loans | 256,195 | 42 | % | - | 0 | % | 297,377 | 51 | % | 150,031 | 55 | % | (1,463 | ) | 702,140 | 43 | % | |||||||||||||||||||||||||||
Direct financing leases | - | 0 | % | 166,032 | 93 | % | - | 0 | % | - | 0 | % | - | 166,032 | 10 | % | ||||||||||||||||||||||||||||
Residential real estate loans | 75,095 | 13 | % | - | 0 | % | 43,863 | 8 | % | 39,675 | 15 | % | - | 158,633 | 10 | % | ||||||||||||||||||||||||||||
Installment and other consumer loans | 35,213 | 6 | % | - | 0 | % | 24,252 | 4 | % | 13,142 | 5 | % | - | 72,607 | 5 | % | ||||||||||||||||||||||||||||
Deferred loan/lease origination costs, net of fees | 80 | 0 | % | 6,673 | 4 | % | (337 | ) | 0 | % | 248 | 0 | % | - | 6,664 | 0 | % | |||||||||||||||||||||||||||
| $ | 605,078 | 100 | % | $ | 177,444 | 100 | % | $ | 577,363 | 100 | % | $ | 271,581 | 100 | % | $ | (1,463 | ) | $ | 1,630,003 | 100 | % | ||||||||||||||||||||||
As of December 31, 2013: | ||||||||||||||||||||||||||||||||||||||||||||
Commercial and industrial loans | $ | 209,150 | 38 | % | $ | - | 0 | % | $ | 161,032 | 31 | % | $ | 61,506 | 24 | % | $ | - | $ | 431,688 | 30 | % | ||||||||||||||||||||||
Commercial real estate loans | 239,965 | 44 | % | - | 0 | % | 290,625 | 55 | % | 142,819 | 57 | % | (1,656 | ) | 671,753 | 46 | % | |||||||||||||||||||||||||||
Direct financing leases | - | 0 | % | 128,902 | 96 | % | - | 0 | % | - | 0 | % | - | 128,902 | 9 | % | ||||||||||||||||||||||||||||
Residential real estate loans | 65,678 | 12 | % | - | 0 | % | 45,457 | 9 | % | 36,221 | 14 | % | - | 147,356 | 10 | % | ||||||||||||||||||||||||||||
Installment and other consumer loans | 36,791 | 7 | % | - | 0 | % | 28,427 | 5 | % | 10,816 | 4 | % | - | 76,034 | 5 | % | ||||||||||||||||||||||||||||
Deferred loan/lease origination costs, net of fees | 45 | 0 | % | 4,814 | 4 | % | (537 | ) | 0 | % | 225 | 0 | % | - | 4,547 | 0 | % | |||||||||||||||||||||||||||
| $ | 551,629 | 100 | % | $ | 133,716 | 100 | % | $ | 525,004 | 100 | % | $ | 251,587 | 100 | % | $ | (1,656 | ) | $ | 1,460,280 | 100 | % | ||||||||||||||||||||||
Proper pricing of loans is necessary to provide adequate return to the Company’s stockholders. Loan pricing, as established by the subsidiary banks’ Asset/Liability Committee, shall includeinternal loan committees, includes consideration for the cost of funds, loan maturity and risk, origination and maintenance costs, appropriate stockholder return, competitive factors, and the economic environment. The portfolio contains a mix of loans with fixed and floating interest rates. Management attempts to maximize the use of interest rate floors on its variable rate loan portfolio. Refer to Item 7A. Quantitative and Qualitative Disclosures About Market Risk for more discussion on the Company’s management of interest rate risk.
Commercial and Industrial Lending
As noted above, the subsidiary banks are active commercial and industrial lenders. The current areas of emphasis include loans to small andsmalland mid-sized businesses with a wide range of operations such as wholesalers, manufacturers, building contractors, business services companies, other banks, and retailers. The banks provide a wide range of business loans, including lines of credit for working capital and operational purposes, and term loans for the acquisition of facilities, equipment and other purposes. Since 2010, the subsidiary banks have been active in participating in lending programs offered by the Small Business Administration (“SBA”) and the United States Department of Agriculture (“USDA”). Under these programs, the government entities will generally provide a guarantee of repayment ranging from 50% to 85% of the principal amount of the qualifying loan.
Loan approval is generally based on the following factors:
● | Ability and stability of current management of the borrower; |
● | Stable earnings with positive financial trends; |
● | Sufficient cash flow to support debt repayment; |
● | Earnings projections based on reasonable assumptions; |
● | Financial strength of the industry and business; and |
● | Value and marketability of collateral. |
For commercial and industrial loans, the Company assigns internal risk ratings which are largely dependent upon the aforementioned approval factors. The risk rating is reviewed annually or on an as needed basis depending on the specific circumstances of the loan. See Note 1 to the consolidated financial statements for additional information, including the internal risk rating scale.
As part of the underwriting process, management reviews current borrower financial statements. When appropriate, certain commercial and industrial loans may contain covenants requiring maintenance of financial performance ratios such as, but not limited to:
● | Minimum debt service coverage ratio; |
● | Minimum current ratio; |
● | Maximum debt to tangible net worth ratio; and/or |
● | Minimum tangible net |
Establishment of these financial performance ratios depends on a number of factors, including risk rating and the specific industry.
Collateral for these loans generally includes accounts receivable, inventory, equipment, and real estate. The Company’s lending policy specifies approved collateral types and corresponding maximum advance percentages. The value of collateral pledged on loans must exceed the loan amount by a margin sufficient to absorb potential erosion of its value in the event of foreclosure and cover the loan amount plus costs incurred to convert it to cash. Approved non-real estate collateral types and corresponding maximum advance percentages for each are listed below.
Approved Collateral Type | Maximum |
Financial Instruments | |
U.S. Government Securities | 90% of market value |
Securities of Federal Agencies | 90% of market value |
Municipal Bonds rated by Moody’s | |
| As “A” or better | 80% of market value |
Listed Stocks | 75% of market value |
Mutual Funds | 75% of market value |
Cash Value Life Insurance | 95%, less policy loans |
Savings/Time Deposits (Bank) | 100% of current value |
General Business | |
Accounts Receivable | 80% of eligible accounts |
Inventory | 50% of value |
Fixed Assets (Existing) | 50% of net book value, or |
| 75% of orderly liquidation appraised value | |
Fixed Assets (New) | 80% of cost |
Leasehold Improvements | 0% |
Generally, if the above collateral is part of a cross-collateralization with other approved assets, then the maximum advance percentage may be higher.
The Company’s lending policy specifies maximum term limits for commercial and industrial loans. For term loans, the maximum term is generally 7 years. Generally, term loans range from 3three to 5five years. For lines of credit, the maximum term is typically 365 days.
In addition, the subsidiary banks often take personal guarantees or cosignors to help assure repayment. Loans may be made on an unsecured basis if warranted by the overall financial condition of the borrower.
Commercial Real Estate Lending
The subsidiary banks also make commercial real estate loans. Commercial real estate loans are subject to underwriting standards and processes similar to commercial and industrial loans, in addition to those standards and processes specific to real estate loans. Collateral for these loans generally includes the underlying real estate and improvements, and may include additional assets of the borrower. The Company’s lending policy specifies maximum loan-to-value limits based on the category of commercial real estate (commercial real estate loans on improved property, raw land, land development, and commercial construction). These limits are the same limits as, or in some situations, more conservative than, those established by regulatory authorities. Following is a listing of these limits as well as some of the other guidelines included in the Company’s lending policy for the major categories of commercial real estate loans:
Commercial Real Estate Loan Types | Maximum Advance Rate ** | Maximum Term | ||
Commercial Real Estate Loans on Improved Property * | 80% | 7 years | ||
Raw Land | Lesser of 90% of project cost, or 65% of "as is" appraised value | |||
12 months | ||||
Land Development | Lesser of 90% of project cost, or 75% of appraised value | 24 months | ||
Commerical Construction Loans | Lesser of 90% of project cost, or 80% of appraised value | 365 days |
* Generally, the debt service coverage ratio must be a minimum of 1.25x for non-owner occupied loans and 1.15x for owner-occupied loans. For loans greater than $500 thousand, the subsidiary banks sensitivity testsensitize this ratio for deteriorated economic conditions, major changes in interest rates, and/or significant increases in vacancy rates.
** These maximum rates are consistent with, , or in some situations, more conservative than, those established by regulatory authorities.
The Company’s lending policy also includes guidelines for real estate appraisals and evaluations, including minimum appraisal and evaluation standards based on certain transactions. In addition, the subsidiary banks often take personal guarantees to help assure repayment.
In addition, management tracks the level of owner-occupied commercial real estate loans versus non-owner occupied loans. Owner-occupied loans are generally considered to have less risk. As of December 31, 20122014 and 2011,2013, approximately 35%37% and 29%39%, respectively, of the commercial real estate loan portfolio was owner-occupied.
The Company’s lending policy limits non-owner occupied commercial real estate lending to 300% of total risk-based capital, and limits construction, land development, and other land loans to 100% of total risk-based capital. Exceeding these limits warrants the use of heightened risk management practices in accordance with regulatory guidelines. As of December 31, 2012,2014, all three subsidiary banks were in compliance with these limits.
Following is a listing of the significant industries within the Company’s commercial real estate loan portfolio as of December 31, 20122014 and 2011:
| 2012 | 2011 | |||||||||||||||
| Amount | % | Amount | % | |||||||||||||
| (dollars in thousands) | ||||||||||||||||
| Lessors of Nonresidential Buildings | $ | 178,060 | 30 | % | $ | 179,511 | 31 | % | ||||||||
| Lessors of Residential Buildings | 61,460 | 10 | % | 50,029 | 9 | % | ||||||||||
| Land Subdivision | 28,854 | 5 | % | 33,252 | 6 | % | ||||||||||
| New Car Dealers | 27,079 | 5 | % | 25,223 | 4 | % | ||||||||||
| Hotels | 26,710 | 4 | % | 19,061 | 3 | % | ||||||||||
| Lessors of Other Real Estate Property | 12,765 | 2 | % | 15,830 | 3 | % | ||||||||||
| New Single Family Construction | 10,746 | 2 | % | 10,788 | 2 | % | ||||||||||
| Other * | 248,305 | 42 | % | 244,110 | 42 | % | ||||||||||
| Total Commercial Real Estate Loans | $ | 593,979 | 100 | % | $ | 577,804 | 100 | % | ||||||||
2014 | 2013 | |||||||||||||||
Amount | % | Amount | % | |||||||||||||
(dollars in thousands) | ||||||||||||||||
Lessors of Nonresidential Buildings | $ | 256,436 | 37 | % | $ | 237,049 | 35 | % | ||||||||
Lessors of Residential Buildings | 74,668 | 11 | % | 69,087 | 10 | % | ||||||||||
Land Subdivision | 19,504 | 3 | % | 29,117 | 4 | % | ||||||||||
Lessors of Other Real Estate Property | 17,553 | 2 | % | 15,509 | 2 | % | ||||||||||
Nursing Care Facilities | 17,078 | 2 | % | 19,212 | 3 | % | ||||||||||
Hotels | 16,252 | 2 | % | 20,975 | 3 | % | ||||||||||
New Car Dealers | 16,090 | 2 | % | 16,597 | 3 | % | ||||||||||
Other * | 284,559 | 41 | % | 264,207 | 40 | % | ||||||||||
Total Commercial Real Estate Loans | $ | 702,140 | 100 | % | $ | 671,753 | 100 | % | ||||||||
Direct Financing Leasing
m2 leases machinery and equipment to commercial and industrial customers under direct financing leases. All lease requests are subject to the credit requirements and criteria as set forth in the lending/leasing policy. In all cases, a formal independent credit analysis of the lessee is performed.
The following private and public sector business assets are generally acceptable to consider for lease funding:
● | Computer |
● | Photocopy |
● | Fire |
● | Specialized road maintenance |
● | Medical |
● | Commercial business |
● | Vehicles classified as heavy |
● | Aircraft; |
● | Equipment classified as plant or office |
● | Marine boat |
m2 will generally refrain from funding leases of the following type:
● | Leases collateralized by non-marketable |
● | Leases collateralized by consumer items, such as vehicles, household goods, recreational vehicles, boats, etc.; |
● | Leases collateralized by used equipment, unless its remaining useful life can be readily |
● | Leases with a repayment schedule exceeding 7 |
Residential Real Estate Lending
Generally, the subsidiary banks’ residential real estate loans conform to the underwriting requirements of Freddie Mac and Fannie Mae to allow the subsidiary banks to resell loans in the secondary market. The subsidiary banks structure most loans that will not conform to those underwriting requirements as adjustable rate mortgages that adjust in one to five years, and then retain these loans in their portfolios. During 2011 and 2012, the subsidiary banks originated and held a limited amount of 15-year fixed rate residential real estate loans that met certain credit guidelines. Servicing rights are not presently retained on the loans sold in the secondary market. The Company’s lending policy establishes minimum appraisal and other credit guidelines.
The following table presents the originations and sales of residential real estate loans for the Company.
| For the year ended December 31, | ||||||||||||
| 2012 | 2011 | 2010 | ||||||||||
| (dollars in thousands) | ||||||||||||
| Originations of residential real estate loans | $ | 151,676 | $ | 117,914 | $ | 164,572 | ||||||
| Sales of residential real estate loans | $ | 104,740 | $ | 83,926 | $ | 134,304 | ||||||
| Percentage of sales to originations | 69 | % | 71 | % | 82 | % | ||||||
For the year ended December 31, | ||||||||||||
2014 | 2013 | 2012 | ||||||||||
(dollars in thousands) | ||||||||||||
Originations of residential real estate loans | $ | 72,146 | $ | 105,716 | $ | 151,676 | ||||||
Sales of residential real estate loans | $ | 33,100 | $ | 56,103 | $ | 104,740 | ||||||
Percentage of sales to originations | 46 | % | 53 | % | 69 | % | ||||||
Installment and Other Consumer Lending
The consumer lending department of each subsidiary bank provides many types of consumer loans, including motor vehicle, home improvement, home equity, motor vehicle, signature loans and small personal credit lines. The Company’s lending policy addresses specific credit guidelines by consumer loan type. In particular, for home equity loans and home equity lines of credit, the minimum credit bureau score is 680. For both home equity loans and lines of credit, the maximum advance rate is 90% of value with a minimum credit bureau score of 720, and the maximum advance rate is 80% of value with a credit bureau score of 680 to 719. The maximum term on home equity loans is 10 years and maximum amortization is 15 years. The maximum term on home equity lines of credit is 5five years.
*****
In some instances for all loans/leases, it may be appropriate to originate or purchase loans/leases that are exceptions to the guidelines and limits established within the Company’s lending policy described above. In general, exceptions to the lending policy do not significantly deviate from the guidelines and limits established within the lending policy and, if there are exceptions, they are generally noted as such and specifically identified in loan/lease approval documents.
Competition.The Company currently operates in the highly competitive Quad Cities, Cedar Rapids, Waterloo/Cedar Falls, and Rockford markets. Competitors include not only other commercial banks, credit unions, thrift institutions, and mutual funds, but also insurance companies, finance companies, brokerage firms, investment banking companies, and a variety of other financial services and advisory companies. Many of these competitors are not subject to the same regulatory restrictions as the Company. Many of these unregulated competitors compete across geographic boundaries and provide customers increasing access to meaningful alternatives to banking services. The Company competes in markets with a number of much larger financial institutions with substantially greater resources and larger lending limits.
Appendices.The commercial banking business is a highly regulated business. See Appendix A for a summary of the federal and state statutes and regulations that are applicable to the Company and its subsidiaries. Supervision, regulation and examination of banks and bank holding companies by bank regulatory agencies are intended primarily for the protection of depositors rather than stockholders of bank holding companies and banks.
See Appendix B for tables and schedules that show selected comparative statistical information relating to the business of the Company required to be presented pursuant to federal securities laws. Consistent with the information presented in the Form 10-K, results are presented for the fiscal years ended December 31, 2012, 2011,2014, 2013, and 2010.
Internet Site, Securities Filings and Governance Documents. The Company maintains an Internet sites for itself and each of its three banking subsidiaries.site at www.qcrh.com. The Company makes available free of charge through these sitesthis site its annual report on Form 10-K, quarterly reports on Form 10-Q, current reports on Form 8-K, and other reports filed or furnished pursuant to Section 13(a) or 15(d) of the Securities Exchange Act of 1934 as soon as reasonably practicable after it electronically files such material with, or furnishes it to, the Securities and Exchange Commission. Also available are many of its corporate governance documents, including the Code of Conduct and Ethics Policy. The sites are
www.qcrh.com, www.qcbt.com, www.crbt.com, and www.rkfdbank.com.
In addition to the other information in this Annual Report on Form 10-K, stockholders or prospective investors should carefully consider the following risk factors:
A prolonged continuation of economic uncertainty or worsening of current economic conditions could have affected the financial industry and may adversely affect us in the future.
While some economic indicators show signs of gradual improvement, elevated levels of uncertainty related to U.S. and European fiscal issues, political climates and global economic conditions continue. There can be no assurance that these difficult conditionsthis improvement will continue or be spread evenly throughout the markets that the Company serves. Continued uncertainty, sustained high unemployment, volatility or disruptions of global financial markets, or prolonged deterioration in the global, national or local business or economic conditions could result in, among other things, a deterioration of credit quality, further impairment of real estate values or a reduced demand for credit or other products and services we offer to clients.
Additionally, competitive dynamics in our industry could change as a result of continued consolidation of financial markets have recently improved, a worsening of these conditions would likely exacerbate the adverse effects of these difficult market conditions on us and other financial institutions. In particular, we may face the following risksservices companies in connection with these events:
If current levels of market disruption and volatilityconditions do not continue to improve or worsen to recessionary conditions, and/or if negative developments in the domestic and international credit markets continue, there can be no assurance that we will not experience an adverse effect, which may be material, on our ability to access capital and on our business, financial condition and results of operations.
Potential future acquisitions could be difficult to integrate, divert the attention of key personnel, disrupt our business, dilute stockholder value and adversely affect our financial results.
On February 14,May 13, 2013, we announced the entry into an agreement providing for the acquisition ofacquired Community National which is expected to close in the second quarter of 2013.and CNB. As part of our business strategy, we may consider acquisitions of other banks or financial institutions or branches, assets or deposits of such organizations. There is no assurance, however, that we will determine to pursue any of these opportunities or that if we determine to pursue them that we will be successful. Acquisitions involve numerous risks, any of which could harm our business, including:
● | difficulties in integrating the operations, technologies, products, existing contracts, accounting processes and personnel of the target company and realizing the anticipated synergies of the combined businesses; |
● | difficulties in supporting and transitioning customers of the target company; |
● | diversion of financial and management resources from existing operations; |
● | the price we pay or other resources that we devote may exceed the value we realize, or the value we could have realized if we had allocated the purchase price or other resources to another opportunity; |
● | risks of entering new markets or areas in which we have limited or no experience or are outside our core competencies; |
● | potential loss of key employees, customers and strategic alliances from either our current business or the business of the target company; |
● | assumption of unanticipated problems or latent liabilities; and |
● | inability to generate sufficient revenue to offset acquisition costs. |
Future acquisitions may involve the issuance of our equity securities as payment or in connection with financing the business or assets acquired, and as a result, could dilute the ownership interests of existing stockholders. In addition, consummating these transactions could result in the incurrence of additional debt and related interest expense, as well as unforeseen liabilities, all of which could have a material adverse effect on our business, results of operations and financial condition. The failure to successfully evaluate and execute acquisitions or otherwise adequately address the risks associated with acquisitions could have a material adverse effect on our business, results of operations and financial condition.
We must effectively manage our credit risk.
There are risks inherent in making any loan, including risks inherent in dealing with specific borrowers, risks of nonpayment, risks resulting from uncertainties as to the future value of collateral and risks resulting from changes in economic and industry conditions. We attempt to minimize our credit risk through prudent loan application approval procedures, careful monitoring of the concentration of our loans within specific industries and periodic independent reviews of outstanding loans by our credit review department and an external third party. However, we cannot assure you that such approval and monitoring procedures will reduce these credit risks.
The majority of our subsidiary banks’ loan portfolios are invested in commercial and industrial and commercial real estate loans, and we focus on lending to small to medium-sized businesses. The size of the loans we can offer to commercial customers is less than the size of the loans that our competitors with larger lending limits can offer. This may limit our ability to establish relationships with the area’s largest businesses. Smaller companies tend to be at a competitive disadvantage and generally have limited operating histories, less sophisticated internal record keeping and financial planning capabilities and fewer financial resources than larger companies. As a result, we may assume greater lending risks than financial institutions that have a lesser concentration of such loans and tend to make loans to larger, more established businesses. Collateral for these loans generally includes accounts receivable, inventory, equipment and real estate. However, depending on the overall financial condition of the borrower, some loans are made on an unsecured basis. In addition to commercial and commercial real estate loans, our subsidiary banks are also active in residential mortgage and consumer lending. Should the economic climate fail to meaningfully improve or if it worsens, ourOur borrowers may experience financial difficulties, and the level of nonperforming loans, charge-offs and delinquencies could rise, which could negatively impact our business through increased provision for loan/lease losses (“provision”), reduced interest income on loans/leases, and increased expenses incurred to carry and resolve problem loans/leases.
Commercial and industrial loans make up a large portion of our loan/lease portfolio.
Commercial and industrial loans were $394.2$523.9 million, or approximately 31%32% of our total loan/lease portfolio, as of December 31, 2012.2014. Our commercial and industrial loans are primarily made based on the identified cash flow of the borrower and secondarily on the underlying collateral provided by the borrower. Most often, this collateral is accounts receivable, inventory, equipment and real estate. Credit support provided by the borrower for most of these loans and the probability of repayment is based on the liquidation value of the pledged collateral and enforcement of a personal guarantee, if any exists. Whenever possible, we require a personal guarantee or cosigner on commercial loans. As a result, in the case of loans secured by accounts receivable, the availability of funds for the repayment of these loans may be substantially dependent on the ability of the borrower to collect amounts due from its customers. The collateral securing these loans may depreciate over time, may be difficult to appraise, and may fluctuate in value based on the success of the business. In addition, if the U.S. economy experiences a prolonged recovery period, it could harm or continue to harm the businesses of our commercial and industrial customers and reduce the value of the collateral securing these loans.
Our loan/lease portfolio has a significant concentration of commercial real estate loans, which involve risks specific to real estate values.
Commercial real estate lending comprises a significant portion of our lending business. Specifically, commercial real estate loans were $594.0$702.1 million, or approximately 46%43% of our total loan/lease portfolio, as of December 31, 2012.2014. Of this amount, $204.9 million,$260.1million, or approximately 35%37%, was owner-occupied. The market value of real estate securing our commercial real estate loans can fluctuate significantly in a short period of time as a result of market conditions in the geographic area in which the real estate is located and in the past several years our market areas have experienced a general weakening in real estate valuations. Continued adverseAdverse developments affecting real estate values in one or more of our markets could increase the credit risk associated with our loan portfolio. Additionally, real estate lending typically involves higher loan principal amounts and the repayment of the loans generally is dependent, in large part, on sufficient income from the properties securing the loans to cover operating expenses and debt service. Economic events or governmental regulations outside of the control of the borrower or lender could negatively impact the future cash flow and market values of the affected properties.
The problems that have occurred in the residential real estate and mortgage markets throughout much of the U.S. in recentprior years also affected the commercial real estate market. In our market areas, we generally experienced a downturn in credit performance by our commercial real estate loan customers in recentprior years relative to historical norms, and despite recent improvements in certain aspects of the economy, a level of uncertainty continues to exist in the economy and credit markets, there can be no guarantee that we will not experience further deterioration in the performance of commercial real estate and other real estate loans in the future. In such case, we may not be able to realize the amount of security that we anticipated at the time of originating the loan, which could cause us to increase our provision for loan losses and adversely affect our operating results, financial condition and/or capital.
Our allowance for loan/lease losses may prove to be insufficient to absorb losses in our loan/lease portfolio.
We establish our allowance for loan/lease losses (“allowance”) in consultation with management of our subsidiaries and maintain it at a level considered adequate by management to absorb loan/lease losses that are inherent in the portfolio. The amount of future loan/lease losses is susceptible to changes in economic, operating and other conditions, including changes in interest rates, which may be beyond our control, and such losses may exceed current estimates. At December 31, 2012,2014, our allowance for loan/lease losses as a percentage of total gross loans/leases was 1.55%1.42%, and as a percentage of total nonperforming loans/leases was approximately 78.47%114.78%. In addition, we had net charge-offs as a percentage of gross average loans/leases of 0.27%0.34% for the year ended December 31, 2012.2014. Because of the concentration of commercial and industrial and commercial real estate loans in our loan portfolio, which tend to be larger in amount than residential real estate and installment loans, the movement of a small number of loans to nonperforming status can have a significant impact on this ratio.these ratios. Although management believes that the allowance for loan/lease losses as of December 31, 20122014 was adequate to absorb losses on any existing loans/leases that may become uncollectible, in light of the current economic environment, which remains challenging, we cannot predict loan/lease losses with certainty, and we cannot assure you that our allowance for loan/lease losses will prove sufficient to cover actual loan/lease losses in the future, particularly if economic conditions are more difficult than what management currently expects. Additional provisions to the allowance for loan/lease losses and loan/lease losses in excess of our allowance for loan/lease losses may adversely affect our business, financial condition and results of operations.
The Company’s information systems may experience an interruption or breach in security and cyber-attacks, all of which could have a material adverse effect on the Company’s business.
The Company relies heavily on internal and outsourced technologies, communications, and information systems to conduct its business. Additionally, in the normal course of business, the Company collects, processes and retains sensitive and confidential information regarding our customers. As the Company’s reliance on technology has increased, so have the potential risks of a technology-related operation interruption (such as disruptions in the Company’s customer relationship management, general ledger, deposit, loan, or other systems) or the occurrence of a cyber-attacks (such as unauthorized access to the Company’s systems). These risks have increased for all financial institutions as new technologies, the use of the Internet and telecommunications technologies (including mobile devices) to conduct financial and other business transactions and the increased sophistication and activities of organized crime, perpetrators of fraud, hackers, terrorists and others. In addition to cyber-attacks or other security breaches involving the theft of sensitive and confidential information, hackers have engaged in attacks against financial institutions, particularly denial of service attacks that are designed to disrupt key business services, such as customer-facing web sites. The Company is not able to anticipate or implement effective preventive measures against all security breaches of these types, especially because the techniques used change frequently and because attacks can originate from a wide variety of sources. However, applying guidance from the Federal Financial Institutions Examination Council, the Company has analyzed and will continue to analyze security related to device specific considerations, user access topics, transaction-processing and network integrity.
The Company also faces risks related to cyber-attacks and other security breaches in connection with credit card and debit card transactions that typically involve the transmission of sensitive information regarding the Company’s customers through various third parties, including merchant acquiring banks, payment processors, payment card networks and its processors. Some of these parties have in the past been the target of security breaches and cyber-attacks, and because the transactions involve third parties and environments such as the point of sale that the Company does not control or secure, future security breaches or cyber-attacks affecting any of these third parties could impact the Company through no fault of its own, and in some cases it may have exposure and suffer losses for breaches or attacks relating to them. Further cyber-attacks or other breaches in the future, whether affecting the Company or others, could intensify consumer concern and regulatory focus and result in reduced use of payment cards and increased costs, all of which could have a material adverse effect on the Company’s business. To the extent we are involved in any future cyber-attacks or other breaches, the Company’s reputation could be affected, would could also have a material adverse effect on the Company’s business, financial condition or results of operations.
System failure or breaches of our network security could subject us to increased operating costs as well as litigation and other liabilities.
The computer systems and network infrastructure we use could be vulnerable to unforeseen problems. Our operations are dependent upon our ability to protect our computer equipment against damage from physical theft, fire, power loss, telecommunications failure or a similar catastrophic event, as well as from security breaches, denial of service attacks, viruses, worms and other disruptive problems caused by hackers. Any damage or failure that causes an interruption in our operations could have a material adverse effect on our financial condition and results of operations. Computer break-ins, phishing and other disruptions could also jeopardize the security of information stored in and transmitted through our computer systems and network infrastructure, as well as that of our customers engaging in internet banking activities, which may result in significant liability to us and may cause existing and potential customers to refrain from doing business with us. Although we, with the help of third-party service providers, intend to continue to implement security technology and establish operational procedures to prevent such damage, there can be no assurance that these security measures will be successful. In addition, advances in computer capabilities, new discoveries in the field of cryptography or other developments could result in a compromise or breach of the algorithms we and our third-party service providers use to encrypt and protect customer transaction data. Any interruption in, or breach of security of, our computer systems and network infrastructure, or that of our internet banking customers, could damage our reputation, result in a loss of customer business, subject us to additional regulatory scrutiny, or expose us to civil litigation and possible financial liability, any of which could have a material adverse effect on our financial condition and results of operations.
We are subject to certain operational risks, including, but not limited to, customer or employee fraud and data processing system failures and errors.
Employee errors and employee and customer misconduct could subject us to financial losses or regulatory sanctions and seriously harm our reputation. Misconduct by our employees could include hiding unauthorized activities from us, improper or unauthorized activities on behalf of our customers or improper use of confidential information. It is not always possible to prevent employee errors and misconduct, and the precautions we take to prevent and detect this activity may not be effective in all cases. Employee errors could also subject us to financial claims for negligence.
We maintain a system of internal controls and insurance coverage to mitigate against operational risks, including data processing system failures and errors and customer or employee fraud. Should our internal controls fail to prevent or detect an occurrence, and if any resulting loss is not insured or exceeds applicable insurance limits, such failure could have a material adverse effect on our business, financial condition and results of operations.
We may be materially and adversely affected by the highly regulated environment in which we operate.
The Company and its bank subsidiaries are subject to extensive federal and state regulation, supervision and examination. Banking regulations are primarily intended to protect depositors’ funds, FDIC funds, customers and the banking system as a whole, rather than stockholders. These regulations affect our lending practices, capital structure, investment practices, dividend policy and growth, among other things.
As a bank holding company, we are subject to regulation and supervision primarily by the Federal Reserve. QCBT and CRBT, as Iowa-chartered state member banks, are subject to regulation and supervision primarily by both the Iowa Superintendent and the Federal Reserve. RB&T, as an Illinois-chartered state member bank, is subject to regulation and supervision primarily by both the DFPR and the Federal Reserve. We and our banks undergo periodic examinations by these regulators, who have extensive discretion and authority to prevent or remedy unsafe or unsound practices or violations of law by banks and bank holding companies.
The primary federal and state banking laws and regulations that affect us are described in Appendix A to this report. These laws, regulations, rules, standards, policies and interpretations are constantly evolving and may change significantly over time. For example, on July 21, 2010, the Dodd-Frank Act was signed into law, which significantly changed the regulation of financial institutions and the financial services industry. The Dodd-Frank Act, together with the regulations to be developed thereunder, includes provisions affecting large and small financial institutions alike, including several provisions that affect how community banks, thrifts and small bank and thrift holding companies are and will be regulated. In addition, in recent years the Federal Reserve has adopted numerous new regulations addressing banks’ overdraft and mortgage lending practices. Further, the Consumer Financial Protection Bureau was recently established, with broad powers to supervise and enforce consumer protection laws, and additional consumer protection legislation and regulatory activity is anticipated in the near future.
In September 2010, the Group of Governors and Heads of Supervision, the oversight body of the Basel Committee on Banking Supervision, adopted Basel III, which constitutes a strengthened set of capital requirements for banking organizations in the U.S. and around the world. In July 2013, the U.S., Basel III is currently the subject of notices of proposed rulemakings released in June of 2012 by the respective federal bank regulatory agencies. The comment period for these notices of proposed rulemakings ended on October 22, 2012, but final regulations have not yet been released. Basel III was intended to be implemented beginning January 1, 2013 and to be fully-phased in on a global basis on January 1, 2019. However, on November 9, 2012, the federal bank regulatory agencies announced thatbanking authorities approved the implementation of the proposed rules under Basel III inregulatory capital reforms and issued rules effecting certain changes required by the U.S. was indefinitely delayed. If and when implemented in the U.S.,Dodd-Frank Act (the “Basel III Rules”). The Basel III would require higher levelsRules are applicable to all U.S. banks that are subject to minimum capital requirements, as well as to bank and savings and loan holding companies other than “small bank holding companies” (generally bank holding companies with consolidated assets of less than $1 billion). The Basel III Rules not only increased most of the required minimum regulatory capital ratios, but they introduced a new Common Equity Tier 1 Capital ratio and the concept of a capital conservation buffer. The Basel III Rules also expanded the definition of capital as in effect currently by establishing criteria that instruments must meet to be heldconsidered Additional Tier 1 Capital (Tier 1 Capital in the form of tangible common equity, generally increase the required capital ratios, phase out certain kinds of intangibles treated as capitaladdition to Common Equity) and certain typesTier 2 Capital. A number of instruments like trust preferred securities, include unrealized gains and losses on available-for-sale securitiesthat now qualify as Tier 1 Capital will not qualify, or their qualifications will change. The Basel III Rules also permit smaller banking organizations to retain, through a one-time election, the existing treatment for accumulated other comprehensive income, which currently does not affect regulatory capital. The Company intends to make this election in the first quarter of 2015. The Basel III Rules have maintained the general structure of the current prompt corrective action framework, while incorporating the increased requirements. The prompt corrective action guidelines were also revised to add the Common Equity Tier 1 Capital ratio. In order to be a “well-capitalized” depository institution under the new regime, a bank and changeholding company must maintain a Common Equity Tier 1 Capital ratio of 6.5% or more; a Tier 1 Capital ratio of 8% or more; a Total Capital ratio of 10% or more; and a leverage ratio of 5% or more. Generally, financial institutions became subject to the risk weightings of assets used to determine required capital ratios. Such changes, including changes regarding interpretations and implementation, could affect us in substantial and unpredictable ways and could have a material adverse effectnew Basel III Rules on us. Further, such changes could subject us to additional costs, limit the types of financial services and products we may offer, and/or increase the ability of non-banks to offer competing financial services and products, among other things.
U.S. financial institutions are also subject to numerous monitoring, recordkeeping, and reporting requirements designed to detect and prevent illegal activities such as money laundering and terrorist financing. These requirements are imposed primarily through the Bank Secrecy Act, (“BSA”) which was most recently amended by the USA Patriot Act. We have instituted policies and procedures to protect us and our employees, to the extent reasonably possible, from being used to facilitate money laundering, terrorist financing and other financial crimes. There can be no guarantee, however, that these policies and procedures are effective.
Failure to comply with applicable laws, regulations or policies could result in sanctions by regulatory agencies, civil monetary penalties, and/or damage to our reputation, which could have a material adverse effect on us. Although we have policies and procedures designed to mitigate the risk of any such violations, there can be no assurance that such violations will not occur.
Monetary policies and regulations of the Federal Reserve could adversely affect our business, financial condition and results of operations.
In addition to being affected by general economic conditions, our earnings and growth are affected by the policies of the Federal Reserve. An important function of the Federal Reserve is to regulate the money supply and credit conditions. Among the instruments used by the Federal Reserve to implement these objectives are open market operations in U.S. government securities, adjustments of the discount rate and changes in reserve requirements against bank deposits. These instruments are used in varying combinations to influence overall economic growth and the distribution of credit, bank loans, investments and deposits. Their use also affects interest rates charged on loans or paid on deposits.
The monetary policies and regulations of the Federal Reserve have had a significant effect on the operating results of commercial banks in the past and are expected to continue to do so in the future. The effects of such policies upon our business, financial condition and results of operations cannot be predicted.
Interest rates and other conditions impact our results of operations.
Our profitability is in large part a function of the spread between the interest rates earned on investments and loans/leases and the interest rates paid on deposits and other interest bearing liabilities. Like most banking institutions, our net interest spread and margin will be affected by general economic conditions and other factors, including fiscal and monetary policies of the federal government that influence market interest rates and our ability to respond to changes in such rates. At any given time, our assets and liabilities will be such that they are affected differently by a given change in interest rates. As a result, an increase or decrease in rates, the length of loan/lease terms, the mix of adjustable and fixed rate loans/leases in our portfolio, the length of time deposits and borrowings, and the rate sensitivity of our deposit customers could have a positive or negative effect on our net income, capital and liquidity. We measure interest rate risk under various rate scenarios and using specific criteria and assumptions. A summary of this process, along with the results of our net interest income simulations is presented at “Quantitative and Qualitative Disclosures about Market Risk” included under Item 7A of Part II of this Form 10-K. Although we believe our current level of interest rate sensitivity is reasonable and effectively managed, significant fluctuations in interest rates may have an adverse effect on our business, financial condition and results of operations.
We are required to maintain capital to meet regulatory requirements, and if we fail to maintain sufficient capital, whether due to losses, an inability to raise additional capital or otherwise, our financial condition, liquidity and results of operations, as well as our ability to maintain regulatory compliance, would be adversely affected.
The Company and each of its banking subsidiaries are required by federal and state regulatory authorities to maintain adequate levels of capital to support their operations, and,which have recently increased due to the global financial crisis, we expect thateffectiveness of the capital requirements imposed by the regulators will increase in the future.Basel III Rules.. We intend to grow our business organically and to explore opportunities to grow our business by taking advantage of attractive acquisition opportunities, and such growth plans may require us to raise additional capital to ensure that we have adequate levels of capital to support such growth on top of our current operations. Our ability to raise additional capital, when and if needed or desired, will depend on conditions in the capital markets, economic conditions and a number of other factors, including investor perceptions regarding the banking industry and market condition,conditions, and governmental activities, many of which are outside our control, and on our financial condition and performance. Accordingly, we cannot assure you that we will be able to raise additional capital if needed or on terms acceptable to us. Our failure to meet these capital and other regulatory requirements could affect customer confidence, our ability to grow, our costs of funds and FDIC insurance costs, our ability to pay dividends on common and preferred stock and to make distributions on our trust preferred securities, our ability to make acquisitions, and our business, results of operations and financial condition.
Failure to pay interest on our debt or dividends on our preferred stock may adversely impact our ability to pay common stock dividends.
As of December 31, 2012,2014, we had $36.1$40.4 million of junior subordinated debentures held by foursix business trusts that we control. Interest payments on the debentures, which totaled $1.0$1.2 million for 2012,2014, must be paid before we pay dividends on our capital stock, including our common stock. We have the right to defer interest payments on the debentures for up to 20 consecutive quarters. However, if we elect to defer interest payments, all deferred interest must be paid before we may pay dividends on our capital stock. As of December 31, 2012, the Company had 25,000 shares of non-cumulative convertible perpetual preferred stock issued and outstanding. Although these non-cumulative preferred shares will accrue no dividends, dividends will be payable on the preferred shares if declared, and no dividends may be declared on the Company’s common stock unless and until dividends have been declared on the outstanding shares. Deferral of either interest payments on the debentures or preferred dividends on the preferred shares, could cause a subsequent decline in the market price of our common stock because the Companywe would not be able to pay dividends on itsour common stock.
As a bank holding company, our sources of funds are limited.
We are a bank holding company, and our operations are primarily conducted by our subsidiary banks, which are subject to significant federal and state regulation. When available, cash to pay dividends to our stockholders is derived primarily from dividends received from our subsidiary banks. Our ability to receive dividends or loans from our subsidiary banks is restricted. Dividend payments by our subsidiaries to us in the future will require generation of future earnings by them and could require regulatory approval if any proposed dividends are in excess of prescribed guidelines. Further, as a structural matter, our right to participate in the assets of our subsidiary banks in the event of a liquidation or reorganization of any of the banks would be subject to the claims of the creditors of such bank, including depositors, which would take priority except to the extent we may be a creditor with a recognized claim. As of December 31, 2012,2014, our subsidiary banks had deposits and other liabilities in the aggregate of approximately $1.93$2.30 billion.
Declines in asset values may result in impairment charges and adversely affect the value of our investments, financial performance and capital.
The market value of investments in our securities portfolio has become increasingly volatile in recent years, and as of December 31, 2012,2014, we had gross unrealized losses of $445 thousand$7.1 million, or 1.1% of amortized cost, in our investment portfolio (more than(mostly offset by gross unrealized gains of $9.0$5.8 million). The market value of investments may be affected by factors other than the underlying performance of the servicer of the securities or the mortgages underlying the securities, such as ratings downgrades, adverse changes in the business climate and a lack of liquidity in the secondary market for certain investment securities. On a quarterly basis, we formally evaluate investments and other assets for impairment indicators. We may be required to record additional impairment charges if our investments suffer a decline in value that is considered other-than-temporary. If we determine that a significant impairment has occurred, we would be required to charge against earnings the credit-related portion of the other-than-temporary impairment (“OTTI”), which could have a material adverse effect on our results of operations in the periods in which the write-offs occur.
Liquidity risks could affect operations and jeopardize our business, results of operations and financial condition.
Liquidity is essential to our business. An inability to raise funds through deposits, borrowings, the sale of securities and/or loans and other sources could have a substantial negative effect on our liquidity. Our primary sources of funds consist of cash from operations, deposits, investment maturities and calls, and loan/lease repayments. Additional liquidity is provided by federal funds purchased from the Federal Reserve Bank of Chicago (the “Federal Reserve Bank”) or other correspondent banks, FHLBFederal Home Loan Bank (“FHLB”) advances, wholesale and customer repurchase agreements, brokered time deposits, and the ability to borrow at the Federal Reserve Bank’s Discount Window. Our access to funding sources in amounts adequate to finance or capitalize our activities or on terms that are acceptable to us could be impaired by factors that affect us directly or the financial services industry or economy in general, such as disruptions in the financial markets or negative views and expectations about the prospects for the financial services industry.
During the recent recession and subsequent recovery, the financial services industry and the credit markets generally have beenwere materially and adversely affected by significant declines in asset values and by a lack of liquidity. The liquidity issues have beenwere particularly acute for regional and community banks, as many of the larger financial institutions have significantly curtailed their lending to regional and community banks to reduce their exposure to the risks of other banks. In addition, many of the larger correspondent lenders have reduced or even eliminated federal funds lines for their correspondent customers. Furthermore, regional and community banks generally have less access to the capital markets than do the national and super-regional banks because of their smaller size and limited analyst coverage. Any decline in available funding could adversely impact our ability to originate loans/leases, invest in securities, meet our expenses, pay dividends to our stockholders, or fulfill obligations such as repaying our borrowings or meeting deposit withdrawal demands, any of which could have a material adverse impact on our liquidity, business, results of operations and financial condition.
Our business is concentrated in and dependent upon the continued growth and welfare of the Quad Cities, Cedar Rapids, Waterloo/Cedar Falls, and Rockford markets.
We operate primarily in the Quad Cities, Cedar Rapids, Waterloo/Cedar Falls, and Rockford markets, and as a result, our financial condition, results of operations and cash flows are subject to changes in the economic conditions in those areas. We have developed a particularly strong presence in Bettendorf, Cedar Falls, Cedar Rapids, Davenport, and Davenport,Waterloo, Iowa and Moline and Rockford, Illinois and their surrounding communities. Our success depends upon the business activity, population, income levels, deposits and real estate activity in these markets. Although our customers’ business and financial interests may extend well beyond these market areas, adverse economic conditions that affect these market areas could reduce demand for our products and services, affect the ability of our customers to repay their loans to us, increase the levels of our nonperforming and problem loans, and generally affect our financial condition and results of operations. Because of our geographic concentration, we are less able than other regional or national financial institutions to diversify our credit risks across multiple markets.
We face intense competition in all phases of our business from other banks and financial institutions.
The banking and financial services businesses in our markets are highly competitive. Our competitors include large regional banks, local community banks, savings and loan associations, securities and brokerage companies, mortgage companies, insurance companies, finance companies, money market mutual funds, credit unions and other non-bank financial services providers. Many of these competitors are not subject to the same regulatory restrictions as we are. Many of our unregulated competitors compete across geographic boundaries and are able to provide customers with a feasible alternative to traditional banking services.
Increased competition in our markets may result in a decrease in the amounts of our loans and deposits, reduced spreads between loanloan/lease rates and deposit rates or loanloan/lease terms that are more favorable to the borrower. Any of these results could have a material adverse effect on our ability to grow and remain profitable. If increased competition causes us to significantly discount the interest rates we offer on loans or increase the amount we pay on deposits, our net interest income could be adversely impacted. If increased competition causes us to modifyour underwriting standards, we could be exposed to higher losses from lending and leasing activities. Additionally, many of our competitors are much larger in total assets and capitalization, have greater access to capital markets, have larger lending limits and offer a broader range of financial services than we can offer.
The soundness of other financial institutions could negatively affect us.
Our ability to engage in routine funding and other transactions could be negatively affected by the actions and commercial soundness of other financial institutions. Financial services institutions are interrelated as a result of trading, clearing, counterparty or other relationships. Defaults by, or even rumors or questions about, one or more financial services institutions, or the financial services industry generally, have led to market-wide liquidity problems and losses of depositor, creditor and counterparty confidence and could lead to losses or defaults by us or by other institutions. We could experience increases in deposits and assets as a result of the difficulties or failures of other banks, which would increase the capital we need to support our growth.
Our community banking strategy relies heavily on our subsidiaries’ independent management teams, and the unexpected loss of key managers may adversely affect our operations.
We rely heavily on the success of our bank subsidiaries’ independent management teams. Accordingly, much of our success to date has been influenced strongly by our ability to attract and to retain senior management experienced in banking and financial services and familiar with the communities in our market areas. Our ability to retain the executive officers and current management teams of our operating subsidiaries will continue to be important to the successful implementation of our strategy. It is also critical, as we manage our existing portfolio and grow, to be able to attract and retain qualified additional management and loan officers with the appropriate level of experience and knowledge about our market areas to implement our community-based operating strategy. The unexpected loss of services of any key management personnel, or the inability to recruit and retain qualified personnel in the future, could have an adverse effect on our business, financial condition and results of operations.
We have a continuing need for technological change, and we may not have the resources to effectively implement new technology.
The financial services industry continues to undergo rapid technological changes with frequent introductions of new technology-driven products and services. In addition to enabling us to better serve our customers, the effective use of technology increases efficiency and the potential for cost reduction. Our future success will depend in part upon our ability to address the needs of our customers by using technology to provide products and services that will satisfy customer demands for convenience as well as to create additional efficiencies in our operations as we continue to grow our market share. Many of our larger competitors have substantially greater resources to invest in technological improvements. As a result, they may be able to offer additional or superior products to those that we will be able to offer, which would put us at a competitive disadvantage. Accordingly, we cannot provide you with assurance that we will be able to effectively implement new technology-driven products and services or be successful in marketing such products and services to our customers.
Our reputation could be damaged by negative publicity.
Reputational risk, or the risk to our business, financial condition or results of operations from negative publicity, is inherent in our business. Negative publicity can result from actual or alleged conduct in a number of areas, including legal and regulatory compliance, lending practices, corporate governance, litigation, inadequate protection of customer data, ethical behavior of our employees, and from actions taken by regulators, ratings agencies and others as a result of that conduct. Damage to our reputation could impact our ability to attract new or maintain existing loan and deposit customers, employees and business relationships.
The repeal of federal prohibitions on payment of interest on business demand deposits could increase our interest expense.
All federal prohibitions on the ability of financial institutions to pay interest on business demand deposit accounts were repealed as part of the Dodd-Frank Act. As a result, some financial institutions have commenced offering interest on these demand deposits to compete for customers. If competitive pressures require us to pay interest on these demand deposits to attract and retain business customers, our interest expense would increase and our net interest margin would decrease. This could have a material adverse effect on our business, financial condition and results of operations. Further, the effect of the repeal of the prohibition could be more significant in a higher interest rate environment as business customers would have a greater incentive to seek interest on demand deposits.
The preparation of our consolidated financial statements requires us to make estimates and judgments, which are subject to an inherent degree of uncertainty and which may differ from actual results.
Our consolidated financial statements are prepared in accordance with U.S. generally accepted accounting principles and general reporting practices within the financial services industry, which require us to make estimates and judgments that affect the reported amounts of assets, liabilities, revenues and expenses and related disclosure of contingent assets and liabilities. Some accounting policies, such as those pertaining to our allowance, for loan/lease losses, require the application of significant judgment by management in selecting the appropriate assumptions for calculating financial estimates. By their nature, these estimates and judgments are subject to an inherent degree of uncertainty and actual results may differ from these estimates and judgments under different assumptions or conditions, which may have a material adverse effect on our financial condition or results of operations in subsequent periods.
From time to time, the Financial Accounting Standards Board and the Securities and Exchange Commission change the financial accounting and reporting standards or the interpretation of those standards that govern the preparation of our external financial statements. These changes are beyond our control, can be difficult to predict and could materially impact how we report our financial condition and results of operations.
Changes in these standards are continuously occurring, and given the current economic environment, more drastic changes may occur. The implementation of such changes could have a material adverse effect on our financial condition and results of operations.
Secondary mortgage and government guaranteed loan market conditions could have a material impact on our financial condition and results of operations.
Currently, we sell a portion of the residential real estate and government guaranteed loans we originate. The profitability of these operations depends in large part upon our ability to make loans and to sell them in the secondary market at a gain. Thus, we are dependent upon the existence of an active secondary market and our ability to profitably sell loans into that market.
In addition to being affected by interest rates, the secondary markets are also subject to investor demand for residential mortgages and government guaranteed loans and investor yield requirements for those loans. These conditions may fluctuate or even worsen in the future. As a result, a prolonged period of secondary market illiquidity may reduce our loan production volumes and could have a material adverse effect on our financial condition and results of operations.
Customers may decide not to use banks to complete their financial transactions, which could result in a loss of income to us.
Technology and other changes are allowing customers to complete financial transactions using nonbanks that historically have involved banks at one or both ends of the transaction. For example, customers can now pay bills and transfer funds directly without going through a bank. The process of eliminating banks as intermediaries, known as disintermediation, could result in the loss of fee income as well as the loss of customer deposits.
Item 1B. Unresolved Staff Comments
There are no unresolved staff comments.
Item 2. Properties
The following table is a listing of the Company’s operating facilities for its subsidiary banks:
Facility Address | Facility Square Footage | Facility Owned or Leased | |||
Quad City Bank & Trust | |||||
2118 Middle Road in Bettendorf, IA | 6,700 | Owned | |||
4500 Brady Street in Davenport, IA | 36,000 | Owned | |||
3551 7th Street in Moline, IL | 30,000 | Owned | |||
5405 Utica Ridge Road in Davenport, IA | 7,400 | Leased | |||
1700 Division Street in Davenport, IA | 12,000 | Owned | |||
Cedar Rapids Bank & Trust | |||||
500 1st Avenue NE, Suite 100 in Cedar Rapids, IA** | |||||
48,000 | Owned | ||||
5400 Council Street in Cedar Rapids, IA | |||||
5,900 | Owned | ||||
422 Commercial Street in Waterloo, IA * | |||||
25,000 | Owned | ||||
11 Tower Park Drive in Waterloo, IA * | |||||
6,000 | Owned | ||||
312 1st Street in Cedar Falls, IA * | 3,000 | Owned | |||
Rockford Bank & Trust | |||||
| |||||
| 4571 Guilford Road in Rockford, IL | 20,000 | Owned | |||
| 308 West State Street in Rockford, IL | 1,100 | Leased | |||
* The building was previously owned by VPHC. WithBranches of Community Bank & Trust.
**In January 2015, CRBT purchased the acquisition3rd floor of the remaining 9% noncontrolling interest and the subsequent dissolution1st Avenue NE branch facility, adding approximately 12,000 square feet of VPHC, the Company now owns 100% of the building as of December 31, 2012.additional business space.
The subsidiary banks intend to limit their investment in premises to no more than 50% of their capital. Management believes that the facilities are of sound construction, in good operating condition, are appropriately insured, and are adequately equipped for carrying on the business of the Company.
No individual real estate property or mortgage amounts to 10% or more of consolidated assets.
Item 3. Legal Proceedings
There are no material pending legal proceedings to which the Company or any of its subsidiaries is a party other than ordinary routine litigation incidental to their respective businesses.
Item 4.Mine Safety Disclosures
Not applicable.
Part II
Item 5. Market for Registrant’s Common Equity, Related Stockholder Matters and Issuer Purchases of Equity Securities
Market Information.The common stock, par value $1.00 per share, of the Company is listed on The NASDAQ Global Market under the symbol “QCRH”. The stock began trading on NASDAQ on October 6, 1993. The Company transferred its listing from the NASDAQ Capital Market to the NASDAQ Global Market on March 1, 2010. As of December 31, 2012,February 27, 2015, there were 4,918,2027,987,964 shares of common stock outstanding held by approximately 2,6002,400 holders of record. The following table sets forth the high and low sales prices of the common stock, as reported by NASDAQ for the periods indicated.
| 2012 Sales Price | 2011 Sales Price | 2010 Sales Price | ||||||||||||||||||||||
| High | Low | High | Low | High | Low | |||||||||||||||||||
| First quarter | $ | 12.450 | $ | 8.500 | $ | 8.670 | $ | 7.220 | $ | 10.000 | $ | 7.650 | ||||||||||||
| Second quarter | 14.500 | 10.700 | 9.470 | 7.290 | 14.400 | 8.730 | ||||||||||||||||||
| Third quarter | 14.980 | 12.620 | 9.928 | 8.701 | 10.970 | 8.930 | ||||||||||||||||||
| Fourth quarter | 15.500 | 11.400 | 9.234 | 8.420 | 9.520 | 6.745 | ||||||||||||||||||
2014 Sales Price | 2013 Sales Price | 2012 Sales Price | ||||||||||||||||||||||
High | Low | High | Low | High | Low | |||||||||||||||||||
First quarter | $ | 17.48 | $ | 16.99 | $ | 16.96 | $ | 13.05 | $ | 12.45 | $ | 8.50 | ||||||||||||
Second quarter | $ | 17.96 | $ | 17.00 | $ | 16.50 | $ | 13.18 | $ | 14.50 | $ | 10.70 | ||||||||||||
Third quarter | $ | 18.10 | $ | 16.96 | $ | 16.51 | $ | 14.96 | $ | 14.98 | $ | 12.62 | ||||||||||||
Fourth quarter | $ | 18.20 | $ | 17.50 | $ | 18.20 | $ | 15.65 | $ | 15.50 | $ | 11.40 | ||||||||||||
Dividends on Common Stock. Stock.On May 2, 2012,14, 2014, the Company declared a cash dividend of $0.04 per share, or $189$315 thousand, which was paid on July 6, 2012,8, 2014, to stockholders of record as of June 21, 2012.20, 2014. On November 8, 2012,6, 2014, the Company declared a cash dividend of $0.04 per share, or $192$316 thousand, which was paid on January 7, 2015, to stockholders of record as of December 19, 2014. On May 1, 2013, the Company declared a cash dividend of $0.04 per share, or $229 thousand, which was paid on July 8, 2013, to stockholders of record as of June 21, 2013. On November 7, 2013, the Company declared a cash dividend of $0.04 per share, or $230 thousand, which was paid on January 7, 2014, to stockholders of record as of December 22, 2012.20, 2013. In the future, it is the Company’s intention to continue to consider the payment of dividends on a semi-annual basis. The Company anticipates an ongoing need to retain much of its operating income to help provide the capital to redeem the Series F Noncumulative Perpetual Preferred Stock (the “Series F Preferred Stock” (see Note 10 to the consolidated financial statements for a detailed discussion of preferred stock) in the short-term and for continued growth, in the long-term, but believes that operating results have reached a level that can sustain dividends to stockholders as well.stockholders.
The Company is heavily dependent on dividend payments from its subsidiary banks to makeprovide cash flow for the operations of the holding company and dividend payments on the Company’s preferred and common stock. Under applicable state laws, the banks are restricted as to the maximum amount of dividends that they may pay on their common stock. Iowa and Illinois law provide that state-chartered banks in those states may not pay dividends in excess of their undivided profits.
The Company’s ability to pay dividends to its stockholders may be affected by both general corporate law considerations and policies of the Federal Reserve applicable to bank holding companies. The payment of dividends by any financial institution or its holding company is affected by the requirement to maintain adequate capital pursuant to applicable capital adequacy guidelines and regulations, and a financial institution generally is prohibited from paying any dividends if, following payment thereof, the institution would be undercapitalized.
The Company also has certain contractual restrictions on its ability to pay dividends. The Company has issued junior subordinated debentures in foursix private placements.placements (including two that were assumed in the acquisition of Community National). Under the terms of the debentures, the Company may be prohibited, under certain circumstances, from paying dividends on shares of its common stock. Additionally, the Company has issued shares of non-cumulative perpetual preferred stock and under the terms of this preferred stock, the Company may be prohibited, under certain circumstances, from paying dividends on shares of its common stock. See Note 1011 to the consolidated financial statements for additional detail on the preferred stock.junior subordinated debentures. None of these circumstances existed through the date of filing of this Form 10-K filed with the Securities and Exchange Commission.
Purchase of Equity Securities by the Company.There were no purchases of common stock by the Company for the years ended December 31, 2012, 2011,2014, 2013, and 2010.2012.
Stockholder Return Performance Graph.The following graph indicates, for the period commencing December 31, 20072009 and ending December 31, 2012,2014, a comparison of cumulative total returns for the Company, the NASDAQ Composite Index, and the SNL Bank NASDAQ Index prepared by SNL Securities, Charlottesville, Virginia. The graph was prepared at the Company’s request by SNL Securities. The information assumes that $100 was invested at the closing price inon December 31, 20072009 in the common stock of the Company and in each index, and that all dividends were reinvested.

| Period Ending | ||||||||||||||||||||||||
Index | 12/31/09 | 12/31/10 | 12/31/11 | 12/31/12 | 12/31/13 | 12/31/14 | ||||||||||||||||||
QCR Holdings, Inc. | 100.00 | 86.26 | 110.96 | 162.25 | 210.00 | 221.22 | ||||||||||||||||||
NASDAQ Composite | 100.00 | 118.15 | 117.22 | 138.02 | 193.47 | 222.16 | ||||||||||||||||||
SNL Bank NASDAQ | 100.00 | 117.98 | 104.68 | 124.77 | 179.33 | 185.73 | ||||||||||||||||||
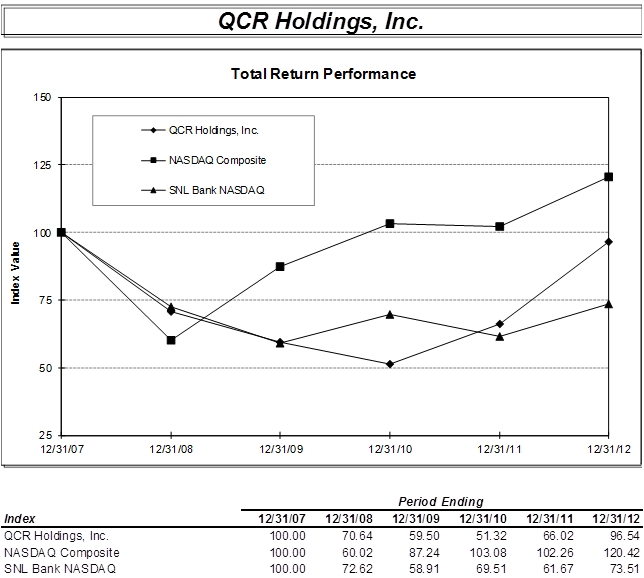
Item 6. Selected Financial Data
The following “Selected Financial Data” of the Company is derived in part from, and should be read in conjunction with, our consolidated financial statements and the accompanying notes thereto. See Item 88. Financial Statements. Results for past periods are not necessarily indicative of results to be expected for any future period.
| Years Ended December 31, | ||||||||||||||||||||
| 2012 | 2011 | 2010 | 2009 | 2008 | ||||||||||||||||
| STATEMENT OF INCOME DATA | ||||||||||||||||||||
| Continuing Operations: | ||||||||||||||||||||
| Interest income | $ | 77,376 | $ | 77,723 | $ | 80,097 | $ | 85,611 | $ | 85,147 | ||||||||||
| Interest expense | 19,727 | 23,578 | 30,233 | 34,949 | 40,524 | |||||||||||||||
| Net interest income | 57,649 | 54,145 | 49,864 | 50,662 | 44,623 | |||||||||||||||
| Provision for loan/lease losses | 4,371 | 6,616 | 7,464 | 16,976 | 9,222 | |||||||||||||||
| Non-interest income | 16,621 | 17,462 | 15,406 | 15,547 | 13,931 | |||||||||||||||
| Non-interest expense | 52,259 | 50,993 | 48,549 | 46,937 | 42,334 | |||||||||||||||
| Income tax expense | 4,534 | 3,868 | 2,449 | 247 | 1,735 | |||||||||||||||
| Income from continuing operations | 13,106 | 10,130 | 6,808 | 2,049 | 5,263 | |||||||||||||||
| Discontinued Operations: | ||||||||||||||||||||
| Income from discontinued operations, before taxes | - | - | - | - | 2,580 | |||||||||||||||
| Income tax expense | - | - | - | - | 846 | |||||||||||||||
| Income from discontinued operations | - | - | - | - | 1,734 | |||||||||||||||
| Net income | 13,106 | 10,130 | 6,808 | 2,049 | 6,997 | |||||||||||||||
| Less: net income attributable to noncontrolling interests | 488 | 438 | 221 | 277 | 288 | |||||||||||||||
| Net income attributable to QCR Holdings, Inc. | 12,618 | 9,692 | 6,587 | 1,772 | 6,709 | |||||||||||||||
| Less: preferred stock dividends and discount accretion | 3,496 | 5,284 | 4,128 | 3,844 | 1,785 | |||||||||||||||
| Net income (loss) attributable to QCR Holdings, Inc. common stockholders | 9,122 | 4,408 | 2,459 | (2,072 | ) | 4,924 | ||||||||||||||
| PER COMMON SHARE DATA | ||||||||||||||||||||
| Income (loss) from continuing operations - Basic (1) | $ | 1.88 | $ | 0.93 | $ | 0.54 | $ | (0.46 | ) | $ | 0.69 | |||||||||
| Income from discontinued operations - Basic (1) | - | - | - | - | 0.38 | |||||||||||||||
| Net income (loss) - Basic (1) | 1.88 | 0.93 | 0.54 | (0.46 | ) | 1.07 | ||||||||||||||
| Income (loss) from continuing operations - Diluted (1) | 1.85 | 0.92 | 0.53 | (0.46 | ) | 0.69 | ||||||||||||||
| Income from discontinued operations - Diluted (1) | - | - | - | - | 0.37 | |||||||||||||||
| Net income (loss) - Diluted (1) | 1.85 | 0.92 | 0.53 | (0.46 | ) | 1.06 | ||||||||||||||
| Cash dividends declared | 0.08 | 0.08 | 0.08 | 0.08 | 0.08 | |||||||||||||||
| Dividend payout ratio | 4.26 | % | 8.60 | % | 14.81 | % | (17.39 | ) % | 7.48 | |||||||||||
| BALANCE SHEET DATA | ||||||||||||||||||||
| Total assets | $ | 2,093,730 | $ | 1,966,610 | $ | 1,836,635 | $ | 1,779,646 | $ | 1,605,629 | ||||||||||
| Securities | 602,239 | 565,229 | 424,847 | 370,520 | 256,076 | |||||||||||||||
| Total loans/leases | 1,287,388 | 1,200,745 | 1,172,539 | 1,244,320 | 1,214,690 | |||||||||||||||
| Allowance for estimated losses on loans/leases | 19,925 | 18,789 | 20,365 | 22,505 | 17,809 | |||||||||||||||
| Deposits | 1,374,114 | 1,205,458 | 1,114,816 | 1,089,323 | 1,058,959 | |||||||||||||||
| Borrowings | 547,758 | 590,603 | 566,060 | 542,895 | 431,820 | |||||||||||||||
| Stockholders' equity: | ||||||||||||||||||||
| Preferred | 53,163 | 63,386 | 62,214 | 58,578 | 20,158 | |||||||||||||||
| Common | 87,271 | 81,047 | 70,357 | 67,017 | 72,337 | |||||||||||||||
| KEY RATIOS | ||||||||||||||||||||
| Return on average assets (2) | 0.62 | % | 0.51 | % | 0.36 | % | 0.10 | % | 0.43 | |||||||||||
| Return on average common stockholders' equity (3) | 10.84 | 5.82 | 3.58 | (2.97 | ) | 7.07 | ||||||||||||||
| Return on average total stockholder's equity (2) | 8.90 | 7.09 | 5.03 | 1.43 | 7.47 | |||||||||||||||
| Net interest margin, tax equivalent yield (4) | 3.10 | 3.08 | 2.92 | 3.14 | 3.27 | |||||||||||||||
| Efficiency ratio (5) | 70.36 | 71.21 | 74.38 | 70.89 | 72.30 | |||||||||||||||
| Loans to deposits | 93.69 | 99.61 | 105.18 | 114.23 | 114.71 | |||||||||||||||
| Nonperforming assets to total assets | 1.41 | 2.06 | 2.73 | 2.27 | 1.58 | |||||||||||||||
| Allowance for estimated losses on loans/leases to total loans/leases | 1.55 | 1.56 | 1.74 | 1.81 | 1.47 | |||||||||||||||
| Allowance for estimated losses on loans/leases to nonperforming loans/leases | 78.47 | 58.70 | 49.49 | 74.94 | 84.60 | |||||||||||||||
| Net charge-offs to average loans/leases | 0.27 | 0.70 | 0.79 | 1.00 | 0.24 | |||||||||||||||
| Average total stockholders' equity to average total assets | 7.00 | 7.17 | 7.13 | 7.18 | 5.78 | |||||||||||||||
Years Ended December 31, | ||||||||||||||||||||
2014 | 2013 | 2012 | 2011 | 2010 | ||||||||||||||||
STATEMENT OF INCOME DATA | (dollars in thousands, except per share data) | |||||||||||||||||||
Interest income | $ | 85,965 | $ | 81,872 | $ | 77,376 | $ | 77,723 | $ | 80,097 | ||||||||||
Interest expense | 16,894 | 17,767 | 19,727 | 23,578 | 30,233 | |||||||||||||||
Net interest income | 69,071 | 64,105 | 57,649 | 54,145 | 49,864 | |||||||||||||||
Provision for loan/lease losses | 6,807 | 5,930 | 4,371 | 6,616 | 7,464 | |||||||||||||||
Non-interest income | 20,998 | 25,814 | 16,621 | 17,462 | 15,406 | |||||||||||||||
Non-interest expense | 65,270 | 64,433 | 52,259 | 50,993 | 48,549 | |||||||||||||||
Income tax expense | 3,039 | 4,618 | 4,534 | 3,868 | 2,449 | |||||||||||||||
Net income | 14,953 | 14,938 | 13,106 | 10,130 | 6,808 | |||||||||||||||
Less: net income attributable to noncontrolling interests | - | - | 488 | 438 | 221 | |||||||||||||||
Net income attributable to QCR Holdings, Inc. | 14,953 | 14,938 | 12,618 | 9,692 | 6,587 | |||||||||||||||
Less: preferred stock dividends and discount accretion | 1,082 | 3,168 | 3,496 | 5,284 | 4,128 | |||||||||||||||
Net income attributable to QCR Holdings, Inc. common stockholders | 13,871 | 11,770 | 9,122 | 4,408 | 2,459 | |||||||||||||||
PER COMMON SHARE DATA | ||||||||||||||||||||
Net income - Basic (1) | $ | 1.75 | $ | 2.13 | $ | 1.88 | $ | 0.93 | $ | 0.54 | ||||||||||
Net income - Diluted (1) | 1.72 | 2.08 | 1.85 | 0.92 | 0.53 | |||||||||||||||
Cash dividends declared | 0.08 | 0.08 | 0.08 | 0.08 | 0.08 | |||||||||||||||
Dividend payout ratio | 4.57 | % | 3.76 | % | 4.26 | % | 8.60 | % | 14.81 | % | ||||||||||
BALANCE SHEET DATA | ||||||||||||||||||||
Total assets | $ | 2,524,958 | $ | 2,394,953 | $ | 2,093,730 | $ | 1,966,610 | $ | 1,836,635 | ||||||||||
Securities | 651,539 | 697,210 | 602,239 | 565,229 | 424,847 | |||||||||||||||
Total loans/leases | 1,630,003 | 1,460,280 | 1,287,388 | 1,200,745 | 1,172,539 | |||||||||||||||
Allowance for estimated losses on loans/leases | 23,074 | 21,448 | 19,925 | 18,789 | 20,365 | |||||||||||||||
Deposits | 1,679,668 | 1,646,991 | 1,374,114 | 1,205,458 | 1,114,816 | |||||||||||||||
Borrowings | 662,558 | 563,381 | 547,758 | 590,603 | 566,060 | |||||||||||||||
Stockholders' equity: | ||||||||||||||||||||
Preferred | - | 29,799 | 53,163 | 63,386 | 62,214 | |||||||||||||||
Common | 144,079 | 117,778 | 87,271 | 81,047 | 70,357 | |||||||||||||||
KEY RATIOS | ||||||||||||||||||||
Return on average assets (2) | 0.61 | % | 0.64 | % | 0.62 | % | 0.51 | % | 0.36 | % | ||||||||||
Return on average common stockholders' equity (1) | 10.49 | 11.48 | 10.84 | 5.82 | 3.58 | |||||||||||||||
Return on average total stockholder's equity (2) | 10.48 | 10.24 | 8.90 | 7.09 | 5.03 | |||||||||||||||
Net interest margin, tax equivalent yield (3) | 3.15 | 3.03 | 3.14 | 3.08 | 2.92 | |||||||||||||||
Efficiency ratio (4) | 72.47 | 71.66 | 70.36 | 71.21 | 74.38 | |||||||||||||||
Loans to deposits | 97.04 | 88.66 | 93.69 | 99.61 | 105.18 | |||||||||||||||
Nonperforming assets to total assets | 1.31 | 1.28 | 1.41 | 2.06 | 2.73 | |||||||||||||||
Allowance for estimated losses on loans/leases to total loans/leases | 1.42 | 1.47 | 1.55 | 1.56 | 1.74 | |||||||||||||||
Allowance for estimated losses on loans/leases to nonperforming loans/leases | 114.78 | 104.70 | 78.47 | 58.70 | 49.49 | |||||||||||||||
Net charge-offs to average loans/leases | 0.34 | 0.31 | 0.27 | 0.70 | 0.79 | |||||||||||||||
Average total stockholders' equity to average total assets | 5.82 | 6.26 | 7.00 | 7.17 | 7.13 | |||||||||||||||
(1) Income (loss) amounts areNumerator is net income attributable to QCR Holdings, Inc.
(2) Numerator is net income attributable to QCR Holdings, Inc.
(3) Numerator is net income (loss) available to QCR Holdings, Inc. common stockholders
(4) Non-interest expenses divided by the sum of net interest income before provision for loan/lease losses and non-interest income
Item 7. Management’s Discussion and Analysis of Financial Condition and Results of Operations
The following discussion provides additional information regarding our operations for the years ending December 31, 2012, 2011,2014, 2013, and 2010,2012, and our financial condition at December 31, 20122014 and 2011.2013. This discussion should be read in conjunction with “Selected Financial Data” and our consolidated financial statements and the accompanying notes thereto included or incorporated by reference elsewhere in this document.
OVERVIEW
The Company was formed in February 1993 for the purpose of organizing QCBT. Over the past twenty years, the Company has grown to include two additional banking subsidiaries (including the 2013 acquisition of CNB which was merged into one of the Company’s legacy banking subsidiaries) and a number of nonbanking subsidiaries. As of December 31, 2012,2014, the Company had $2.09$2.52 billion in consolidated assets, including $1.29$1.63 billion in total loans/leases and $1.37$1.68 billion in deposits.
The Company recognized net income and net income attributable to QCR Holdings, Inc. of $15.0 million for the year ended December 31, 2014. After preferred stock dividends of $1.1 million, the Company reported net income available to common stockholders of $13.9 million, or diluted earnings per common share (“EPS”) of $1.72. For the same period in 2013, the Company recognized net income and net income attributable to QCR Holdings, Inc. of $14.9 million. After preferred stock dividends of $3.2 million, the Company reported net income available to common stockholders of $11.8 million, or EPS of $2.08. By comparison, for 2012, the Company recognized net income of $13.1 million, for the year ended December 31, 2012, and net income attributable to QCR Holdings, Inc. of $12.6 million, which excludesexcluded the net income attributable to noncontrolling interests of $488 thousand. After preferred stock dividends of $3.5 million, the Company reported net income available to common stockholders of $9.1 million, or diluted earnings per shareEPS of $1.85. For the same period in 2011, the Company recognized net income of $10.1 million, and net income attributable to QCR Holdings, Inc. of $9.7 million, which excludes the net income attributable to noncontrolling interests of $438 thousand. After preferred stock dividends and discount accretion of $5.3 million, the Company reported net income available to common stockholders of $4.4 million, or diluted earnings per share of $0.92. The $5.3 million of preferred stock dividends and discount accretion included $1.2 million of accelerated discount accretion on the repurchased Treasury Capital Purchase Program (“TCPP”) preferred shares. Excluding the impact of the accelerated accretion, the Company’s diluted earnings per share for 2011 would have been $1.18. By comparison, for 2010, the Company recognized net income of $6.8 million, and net income attributable to QCR Holdings, Inc. of $6.6 million, which excludes the net income attributable to noncontrolling interests of $221 thousand. After preferred stock dividends and discount accretion of $4.1 million, the Company reported net income available to common stockholders of $2.5 million, or diluted earnings per share of $0.53.
Following is a table that represents the various net income measurements for the years ended December 31, 2012, 2011,2014, 2013, and 2010.
Year Ended December 31, | ||||||||||||
2014 | 2013 | 2012 | ||||||||||
Net income | $ | 14,952,537 | $ | 14,938,245 | $ | 13,106,240 | ||||||
Less: Net income attributable to noncontrolling interests | - | - | 488,473 | |||||||||
Net income attributable to QCR Holdings, Inc. | $ | 14,952,537 | $ | 14,938,245 | $ | 12,617,767 | ||||||
Less: Preferred stock dividends and discount accretion | 1,081,877 | 3,168,302 | 3,496,085 | |||||||||
Net income attributable to QCR Holdings, Inc. common stockholders | $ | 13,870,660 | $ | 11,769,943 | $ | 9,121,682 | ||||||
Diluted earnings per common share | $ | 1.72 | $ | 2.08 | $ | 1.85 | ||||||
Weighted average common and common equivalent shares outstanding* | 8,048,661 | 5,646,926 | 4,919,559 | |||||||||
*On December 23, 2013, the Company converted $25.0 million of its outstanding shares of Series E Preferred Stock to common stock, which resulted in the issuance of 2,057,502 shares of common stock, or an increase of approximately 35% in the number of common shares outstanding. The conversion strengthened tangible common equity and reduced the Company’s annual preferred stock dividend commitment by $1.75 million. In May 2013, the Company issued 834,715 shares of common stock as a result of the Community National acquisition.
| Year Ended December 31, | ||||||||||||
| 2012 | 2011 | 2010 | ||||||||||
| Net income | $ | 13,106,240 | $ | 10,129,869 | $ | 6,807,726 | ||||||
| Less: Net income attributable to noncontrolling interests | 488,473 | 438,221 | 221,047 | |||||||||
| Net income attributable to QCR Holdings, Inc. | $ | 12,617,767 | $ | 9,691,648 | $ | 6,586,679 | ||||||
| Less: Preferred stock dividends and discount accretion | 3,496,085 | 5,283,885 | * | 4,128,104 | ||||||||
| Net income attributable to QCR Holdings, Inc. common stockholders | $ | 9,121,682 | $ | 4,407,763 | $ | 2,458,575 | ||||||
| Diluted earnings per common share | $ | 1.85 | $ | 0.92 | $ | 0.53 | ||||||
| Weighted average common and common equivalent shares outstanding | 4,919,559 | 4,789,026 | 4,618,242 | |||||||||
Following is a table that represents the major income and expense categories.
| Year Ended December 31, | ||||||||||||
| 2012 | 2011 | 2010 | ||||||||||
| Net interest income | $ | 57,649,260 | $ | 54,144,856 | $ | 49,863,768 | ||||||
| Provision for loan/lease losses | (4,370,767 | ) | (6,616,014 | ) | (7,463,618 | ) | ||||||
| Noninterest income | 16,621,295 | 17,461,878 | 15,405,888 | |||||||||
| Noninterest expense | (52,258,947 | ) | (50,992,652 | ) | (48,549,063 | ) | ||||||
| Federal and state income tax | (4,534,601 | ) | (3,868,199 | ) | (2,449,249 | ) | ||||||
| Net income | $ | 13,106,240 | $ | 10,129,869 | $ | 6,807,726 | ||||||
Year Ended December 31, | ||||||||||||
2014 | 2013 | 2012 | ||||||||||
Net interest income | $ | 69,071,128 | $ | 64,105,437 | $ | 57,649,260 | ||||||
Provision for loan/lease losses | (6,807,000 | ) | (5,930,420 | ) | (4,370,767 | ) | ||||||
Noninterest income | 20,997,300 | 25,813,828 | 16,621,295 | |||||||||
Noninterest expense | (65,269,921 | ) | (64,432,658 | ) | (52,258,947 | ) | ||||||
Federal and state income tax | (3,038,970 | ) | (4,617,942 | ) | (4,534,601 | ) | ||||||
Net income | $ | 14,952,537 | $ | 14,938,245 | $ | 13,106,240 | ||||||
In comparison to 2013, the following are some noteworthy changes in the Company’s financial results for 2014:
● | Net interest income grew $5.0 million, or 8%, mostly due to strong organic loan/lease growth throughout 2014. |
● | Provision for loan/lease losses increased $877 thousand, or 15%, due to high levels of provisions in the fourth quarter of 2014. |
● | Excluding the acquisition-related gains in 2013 (bargain purchase gain of $1.8 million upon acquisition and gains on CNB branch sales of $2.3 million) and other several one-time items in 2013 ($495 thousand gain on the sale of credit card portfolio, $355 thousand gain on the sale of credit card issuing operations, and $576 thousand gain on the sale of nonperforming loans), noninterest income increased $785 thousand, or 4%, led by wealth management fees, deposit service fees, and correspondent banking fees. |
● | Excluding acquisition and data conversion costs totaling $2.4 million in 2013, noninterest expense increased $3.2 million, or 5%, with most of this increase attributable to the addition of CNB’s cost structure for the first full year. |
NET INTEREST INCOME AND MARGIN
Net interest income, on a tax equivalent basis, grew $4.2$6.3 million, or 8%10%, in 20122014 compared to 2011. Interest2013. The increase in net interest income (on a tax equivalent basis) grew slightly aswas partly driven by the addition of CNB for the first full year. Additionally, the Company’s legacy charters experienced strong organic loan growth and improvements in earning assets coupled with diversification of theinvestment securities portfolio outpaced the impact of declining yields. In addition, interest expense continued its significant decline as the Company continued its shift in mix of funding from wholesale (FHLB advances, wholesale structured repurchase agreements (“structured repos”), and brokered time deposits) to core deposits. For 2012, average earning assets increased by $122.2 million, or 7%, while average interest-bearing liabilities grew modestly by $15.7 million, or 1%, when compared with average balances for 2011. Primarily funding the growth in average earning assets, noninterest-bearing deposits grew $95.9 million, or 30%.yield during 2014. A comparison of yields, spreads and margins from 20122014 to 20112013 shows the following (on a tax equivalent basis):
● | The average yield on interest-earning assets increased 4 basis points from 3.84% to 3.88%. |
● | The average cost of interest-bearing liabilities decreased 10 basis points from 1.09% to .99%. |
● | The net interest spread improved 14 basis points from 2.75% to 2.89%. |
● | The net interest margin improved 12 basis points from 3.03% to 3.15%. |
Net interest income, on a tax equivalent basis, grew $7.2 million, or 12%, in 2013 compared to 2012. The increase in net interest income was primarily driven by the addition of CNB for more than half of the year. Secondarily, the Company’s legacy charters experienced modest organic growth in earning assets during 2013. A comparison of yields, spreads and margins from 2013 to 2012 shows the following (on a tax equivalent basis):
● | The average yield on interest-earning assets decreased |
● | The average cost of interest-bearing liabilities decreased 28 basis points from |
● | The net interest spread |
● | The net interest margin |
The Company’s management closely monitors and manages net interest margin. From a profitability standpoint, an important challenge for the Company’s subsidiary banks and leasing company is the improvement of their net interest margins. Management continually addresses this issue with pricing and other balance sheet management strategies including, but not limitedstrategies.
During 2014, the Company placed an emphasis on shifting its balance sheet mix. With a stated goal of increasing loans/leases as a percentage of assets to at least 70%, the Company plans to fund this loan/lease growth with a mixture of core deposits and cash from the investment securities portfolio. Strategies are continuously being evaluated in which securities are sold and the cash is redeployed into the loan portfolio, with little to no extension of duration and a significant increase in yield. Additionally, the Company is recognizing gains on these sales due to the usecurrent rate environment. As rates rise, the Company will also have less market volatility in the investment securities portfolio, as this becomes a smaller portion of alternative funding sources. the balance sheet.
Over the past twothree years, the Company’s management has emphasized improving its funding mix by reducing its reliance on wholesale funding, which tends to be at a higher cost than deposits. In addition, with deposit growth outpacing loan growth, the Company’s management has focused on growing and diversifying its securities portfolio.
During the second quarter of 2012, the CompanyCompany’s subsidiary banks modified $25.0 million of fixed rate wholesale structured reposrepurchase agreements (“structured repos”) with a weighted average interest rate of 3.77% and a weighted average maturity of December 2015 into new fixed rate structured repos with a weighted average interest rate of 3.21% and a weighted average maturity of April 2019.
During the first quarter of 2013, QCBT modified $50.0 million of structured repos with a weighted average interest rate of 3.21% and a weighted average maturity of February 2016 into new fixed rate structured repos with a weighted average interest rate of 2.65% and a weighted average maturity of May 2020. During the second quarter of 2013, CRBT modified $20.0 million of fixed rate FHLB advances with a weighted average rate of 4.82% and a weighted average maturity of October 2016 into new fixed rate FHLB advances with a weighted average interest rate of 4.12% and a weighted average maturity of June 2019.
These modifications serve to reduce interest expense and improve net interest margin, and minimize the exposure to rising rates through the duration extension of fixed rate liabilities.
The Company continues to monitor and evaluate both prepayment and debt restructuring opportunities within the wholesale funding portion of the balance sheet, as executing on such a strategy could potentially increase net interest margin at a much quicker pace than holding the debt until maturity.
The Company’s average balances, interest income/expense, and rates earned/paid on major balance sheet categories are presented in the following table:
| Years Ended December 31, | ||||||||||||||||||||||||||||||||||||
| 2012 | 2011 | 2010 | ||||||||||||||||||||||||||||||||||
Average Balance | Interest Earned | Average Yield or | Average Balance | Interest Earned | Average Yield or | Average Balance | Interest Earned | Average Yield or | ||||||||||||||||||||||||||||
| (dollars in thousands) | ||||||||||||||||||||||||||||||||||||
| ASSETS | ||||||||||||||||||||||||||||||||||||
| Interest earning assets: | ||||||||||||||||||||||||||||||||||||
| Federal funds sold | $ | 3,003 | $ | 6 | 0.20 | % | $ | 49,510 | $ | 92 | 0.19 | % | $ | 63,430 | $ | 174 | 0.27 | |||||||||||||||||||
| Interest-bearing deposits at financial institutions | 54,834 | 378 | 0.69 | 29,691 | 405 | 1.36 | 31,002 | 411 | 1.33 | |||||||||||||||||||||||||||
| Investment securities (1) | 603,568 | 14,268 | 2.36 | 501,470 | 12,344 | 2.46 | 400,224 | 11,457 | 2.86 | |||||||||||||||||||||||||||
| Restricted investment securities | 15,172 | 507 | 3.34 | 15,573 | 558 | 3.58 | 16,750 | 497 | 2.97 | |||||||||||||||||||||||||||
| Gross loans/leases receivable (2) (3) (4) | 1,219,623 | 63,364 | 5.20 | 1,177,705 | 64,808 | 5.50 | 1,209,587 | 67,999 | 5.62 | |||||||||||||||||||||||||||
| Total interest earning assets | $ | 1,896,200 | 78,523 | 4.14 | $ | 1,773,949 | 78,207 | 4.41 | $ | 1,720,993 | 80,538 | 4.68 | ||||||||||||||||||||||||
| Noninterest-earning assets: | ||||||||||||||||||||||||||||||||||||
| Cash and due from banks | $ | 40,770 | $ | 48,797 | $ | 34,559 | ||||||||||||||||||||||||||||||
| Premises and equipment, net | 31,502 | 30,848 | 31,557 | |||||||||||||||||||||||||||||||||
| Less allowance for estimated losses on loans/leases | (19,162 | ) | (19,902 | ) | (21,678 | ) | ||||||||||||||||||||||||||||||
| Other | 76,383 | 73,346 | 73,887 | |||||||||||||||||||||||||||||||||
| Total assets | $ | 2,025,693 | $ | 1,907,038 | $ | 1,839,318 | ||||||||||||||||||||||||||||||
| LIABILITIES AND STOCKHOLDERS' EQUITY | ||||||||||||||||||||||||||||||||||||
| Interest-bearing liabilities: | ||||||||||||||||||||||||||||||||||||
| Interest-bearing demand deposits | $ | 545,739 | 2,679 | 0.49 | % | $ | 530,340 | 3,927 | 0.74 | % | $ | 425,702 | 3,771 | 0.89 | ||||||||||||||||||||||
| Time deposits | 352,582 | 3,540 | 1.00 | 363,337 | 5,012 | 1.38 | 465,160 | 8,911 | 1.92 | |||||||||||||||||||||||||||
| Short-term borrowings | 170,065 | 248 | 0.15 | 144,267 | 290 | 0.20 | 142,197 | 628 | 0.44 | |||||||||||||||||||||||||||
| Federal Home Loan Bank advances | 201,704 | 7,280 | 3.61 | 211,361 | 7,972 | 3.77 | 233,384 | 9,247 | 3.96 | |||||||||||||||||||||||||||
| Junior subordinated debentures | 36,085 | 1,039 | 2.88 | 36,085 | 1,228 | 3.40 | 36,085 | 1,945 | 5.39 | |||||||||||||||||||||||||||
| Other borrowings (4) | 137,226 | 4,941 | 3.60 | 142,281 | 5,149 | 3.62 | 150,430 | 5,732 | 3.81 | |||||||||||||||||||||||||||
| Total interest-bearing liabilities | $ | 1,443,401 | 19,727 | 1.37 | $ | 1,427,670 | 23,578 | 1.65 | $ | 1,452,958 | 30,234 | 2.08 | ||||||||||||||||||||||||
| Noninterest-bearing demand deposits | $ | 412,039 | $ | 316,110 | $ | 231,604 | ||||||||||||||||||||||||||||||
| Other noninterest-bearing liabilities | 28,460 | 26,558 | 23,690 | |||||||||||||||||||||||||||||||||
| Total liabilities | $ | 1,883,900 | $ | 1,770,338 | $ | 1,708,252 | ||||||||||||||||||||||||||||||
| Stockholders' equity | 141,793 | 136,700 | 131,066 | |||||||||||||||||||||||||||||||||
| Total liabilities and stockholders' equity | $ | 2,025,693 | $ | 1,907,038 | $ | 1,839,318 | ||||||||||||||||||||||||||||||
| Net interest income | $ | 58,796 | $ | 54,629 | $ | 50,304 | ||||||||||||||||||||||||||||||
| Net interest spread | 2.77 | % | 2.76 | % | 2.60 | % | ||||||||||||||||||||||||||||||
| Net interest margin | 3.10 | % | 3.08 | % | 2.92 | % | ||||||||||||||||||||||||||||||
Ratio of average interest earning assets to average interest-bearing liabilities | 131.37 | % | 124.25 | % | 118.45 | % | ||||||||||||||||||||||||||||||
| Years Ended December 31, | ||||||||||||||||||||||||||||||||||||
2014 | 2013 | 2012 | ||||||||||||||||||||||||||||||||||
Interest | Average | Interest | Average | Interest | Average | |||||||||||||||||||||||||||||||
Average | Earned | Yield or | Average | Earned | Yield or | Average | Earned | Yield or | ||||||||||||||||||||||||||||
Balance | or Paid | Cost | Balance | or Paid | Cost | Balance | or Paid | Cost | ||||||||||||||||||||||||||||
(dollars in thousands) | ||||||||||||||||||||||||||||||||||||
ASSETS | ||||||||||||||||||||||||||||||||||||
Interest earning assets: | ||||||||||||||||||||||||||||||||||||
Federal funds sold | $ | 17,263 | $ | 21 | 0.12 | % | $ | 14,577 | $ | 19 | 0.13 | % | $ | 3,003 | $ | 6 | 0.20 | % | ||||||||||||||||||
Interest-bearing deposits at financial institutions | 56,620 | 299 | 0.53 | 43,909 | 275 | 0.63 | 54,834 | 378 | 0.69 | |||||||||||||||||||||||||||
Investment securities (1) | 688,827 | 18,679 | 2.71 | 700,344 | 16,140 | 2.30 | 603,568 | 14,268 | 2.36 | |||||||||||||||||||||||||||
Restricted investment securities | 16,349 | 529 | 3.24 | 16,083 | 559 | 3.48 | 15,172 | 507 | 3.34 | |||||||||||||||||||||||||||
Gross loans/leases receivable (1) (2) (3) | 1,540,382 | 70,414 | 4.57 | 1,425,364 | 67,484 | 4.73 | 1,219,623 | 64,100 | 5.26 | |||||||||||||||||||||||||||
Total interest earning assets | $ | 2,319,441 | 89,942 | 3.88 | $ | 2,200,277 | 84,477 | 3.84 | $ | 1,896,200 | 79,259 | 4.18 | ||||||||||||||||||||||||
Noninterest-earning assets: | ||||||||||||||||||||||||||||||||||||
Cash and due from banks | $ | 44,905 | $ | 44,336 | $ | 40,770 | ||||||||||||||||||||||||||||||
Premises and equipment, net | 36,372 | 35,820 | 31,502 | |||||||||||||||||||||||||||||||||
Less allowance for estimated losses on loans/leases | (22,726 | ) | (21,500 | ) | (19,162 | ) | ||||||||||||||||||||||||||||||
Other | 75,686 | 71,671 | 76,383 | |||||||||||||||||||||||||||||||||
Total assets | $ | 2,453,678 | $ | 2,330,604 | $ | 2,025,693 | ||||||||||||||||||||||||||||||
LIABILITIES AND STOCKHOLDERS' EQUITY | ||||||||||||||||||||||||||||||||||||
Interest-bearing liabilities: | ||||||||||||||||||||||||||||||||||||
Interest-bearing demand deposits | $ | 741,061 | 1,832 | 0.25 | % | $ | 672,038 | 1,879 | 0.28 | % | $ | 545,739 | 2,679 | 0.49 | % | |||||||||||||||||||||
Time deposits | 392,167 | 2,677 | 0.68 | 404,495 | 2,836 | 0.70 | 352,582 | 3,540 | 1.00 | |||||||||||||||||||||||||||
Short-term borrowings | 162,732 | 234 | 0.14 | 164,710 | 293 | 0.18 | 170,065 | 248 | 0.15 | |||||||||||||||||||||||||||
Federal Home Loan Bank advances | 218,704 | 6,026 | 2.76 | 207,684 | 6,863 | 3.30 | 201,704 | 7,280 | 3.61 | |||||||||||||||||||||||||||
Junior subordinated debentures | 40,356 | 1,234 | 3.06 | 39,495 | 1,143 | 2.89 | 36,085 | 1,039 | 2.88 | |||||||||||||||||||||||||||
Other borrowings | 147,091 | 4,891 | 3.33 | 140,888 | 4,753 | 3.37 | 137,226 | 4,941 | 3.60 | |||||||||||||||||||||||||||
Total interest-bearing liabilities | $ | 1,702,111 | 16,894 | 0.99 | $ | 1,629,310 | 17,767 | 1.09 | $ | 1,443,401 | 19,727 | 1.37 | ||||||||||||||||||||||||
Noninterest-bearing demand deposits | $ | 575,549 | $ | 518,406 | $ | 412,039 | ||||||||||||||||||||||||||||||
Other noninterest-bearing liabilities | 33,284 | 36,982 | 28,460 | |||||||||||||||||||||||||||||||||
Total liabilities | $ | 2,310,944 | $ | 2,184,698 | $ | 1,883,900 | ||||||||||||||||||||||||||||||
Stockholders' equity | 142,734 | 145,906 | 141,793 | |||||||||||||||||||||||||||||||||
Total liabilities and stockholders' equity | $ | 2,453,678 | $ | 2,330,604 | $ | 2,025,693 | ||||||||||||||||||||||||||||||
Net interest income | $ | 73,048 | $ | 66,710 | $ | 59,532 | ||||||||||||||||||||||||||||||
Net interest spread | 2.89 | % | 2.75 | % | 2.81 | % | ||||||||||||||||||||||||||||||
Net interest margin | 3.15 | % | 3.03 | % | 3.14 | % | ||||||||||||||||||||||||||||||
Ratio of average interest earning assets to average interest-bearing liabilities | 136.27 | % | 135.04 | % | 131.37 | % | ||||||||||||||||||||||||||||||
(1) Interest earned and yields on nontaxable investment securities and loans are determined on a tax equivalent basis using a 34%35% tax rate in each year presented.
(2) Loan/lease fees are not material and are included in interest income from loans/leases receivable in accordance with accounting and regulatory guidance.
(3) Non-accrual loans/leases are included in the average balance for gross loans/leases receivable in accordance with accounting and regulatory guidance.
The Company’s components of change in net interest income are presented in the following table:
| For the years ended December 31, 2012, 2011 and 2010 | ||||||||||||||||||||||||
Inc./(Dec.) from | Components of Change (1) | Inc./(Dec.) from | Components of Change (1) | |||||||||||||||||||||
| Prior Year | Rate | Volume | Prior Year | Rate | Volume | |||||||||||||||||||
| 2012 vs. 2011 | 2011 vs. 2010 | |||||||||||||||||||||||
| (dollars in thousands) | (dollars in thousands) | |||||||||||||||||||||||
| INTEREST INCOME | ||||||||||||||||||||||||
| Federal funds sold | $ | (86 | ) | $ | 6 | $ | (92 | ) | $ | (82 | ) | $ | (49 | ) | $ | (33 | ) | |||||||
| Interest-bearing deposits at other financial institutions . | (27 | ) | (263 | ) | 236 | (6 | ) | 12 | (18 | ) | ||||||||||||||
| Investment securities (2) | 1,924 | (506 | ) | 2,430 | 887 | (1,750 | ) | 2,637 | ||||||||||||||||
| Restricted investment securities | (51 | ) | (37 | ) | (14 | ) | 61 | 98 | (37 | ) | ||||||||||||||
| Gross loans/leases receivable (3) (4) (5) | (1,444 | ) | (3,701 | ) | 2,257 | (3,191 | ) | (1,420 | ) | (1,771 | ) | |||||||||||||
| Total change in interest income | $ | 316 | $ | (4,501 | ) | $ | 4,817 | $ | (2,331 | ) | $ | (3,109 | ) | $ | 778 | |||||||||
| INTEREST EXPENSE | ||||||||||||||||||||||||
| Interest-bearing demand deposits | $ | (1,248 | ) | $ | (1,359 | ) | $ | 111 | $ | 156 | $ | (727 | ) | $ | 883 | |||||||||
| Time deposits | (1,472 | ) | (1,328 | ) | (144 | ) | (3,899 | ) | (2,188 | ) | (1,711 | ) | ||||||||||||
| Short-term borrowings | (42 | ) | (88 | ) | 46 | (338 | ) | (347 | ) | 9 | ||||||||||||||
| Federal Home Loan Bank advances | (692 | ) | (336 | ) | (356 | ) | (1,275 | ) | (430 | ) | (845 | ) | ||||||||||||
| Junior subordinated debentures | (189 | ) | (189 | ) | - | (717 | ) | (717 | ) | - | ||||||||||||||
| Other borrowings (5) | (208 | ) | (26 | ) | (182 | ) | (583 | ) | (281 | ) | (302 | ) | ||||||||||||
| Total change in interest expense | $ | (3,851 | ) | $ | (3,326 | ) | $ | (525 | ) | $ | (6,656 | ) | $ | (4,690 | ) | $ | (1,966 | ) | ||||||
| Total change in net interest income | $ | 4,167 | $ | (1,175 | ) | $ | 5,342 | $ | 4,325 | $ | 1,581 | $ | 2,744 | |||||||||||
For the years ended December 31, 2014, 2013 and 2012 | ||||||||||||||||||||||||
Inc./(Dec.) | Components | Inc./(Dec.) | Components | |||||||||||||||||||||
from | of Change (1) | from | of Change (1) | |||||||||||||||||||||
Prior Year | Rate | Volume | Prior Year | Rate | Volume | |||||||||||||||||||
2014 vs. 2013 | 2013 vs. 2012 | |||||||||||||||||||||||
(dollars in thousands) | (dollars in thousands) | |||||||||||||||||||||||
INTEREST INCOME | ||||||||||||||||||||||||
Federal funds sold | $ | 2 | $ | (1 | ) | $ | 3 | $ | 13 | $ | (3 | ) | $ | 16 | ||||||||||
Interest-bearing deposits at other financial institutions | 24 | (48 | ) | 72 | (103 | ) | (33 | ) | (70 | ) | ||||||||||||||
Investment securities (2) | 2,539 | 2,808 | (269 | ) | 1,872 | (366 | ) | 2,238 | ||||||||||||||||
Restricted investment securities | (30 | ) | (39 | ) | 9 | 52 | 21 | 31 | ||||||||||||||||
Gross loans/leases receivable (2) (3) | 2,930 | (2,384 | ) | 5,314 | 3,384 | (6,754 | ) | 10,138 | ||||||||||||||||
Total change in interest income | $ | 5,465 | $ | 336 | $ | 5,129 | $ | 5,218 | $ | (7,135 | ) | $ | 12,353 | |||||||||||
INTEREST EXPENSE | ||||||||||||||||||||||||
Interest-bearing demand deposits | $ | (47 | ) | $ | (230 | ) | $ | 183 | $ | (800 | ) | $ | (1,327 | ) | $ | 527 | ||||||||
Time deposits | (159 | ) | (74 | ) | (85 | ) | (704 | ) | (1,174 | ) | 470 | |||||||||||||
Short-term borrowings | (59 | ) | (55 | ) | (4 | ) | 45 | 53 | (8 | ) | ||||||||||||||
Federal Home Loan Bank advances | (837 | ) | (1,186 | ) | 349 | (417 | ) | (628 | ) | 211 | ||||||||||||||
Junior subordinated debentures | 91 | 66 | 25 | 104 | 5 | 99 | ||||||||||||||||||
Other borrowings | 138 | (69 | ) | 207 | (188 | ) | (318 | ) | 130 | |||||||||||||||
Total change in interest expense | $ | (873 | ) | $ | (1,548 | ) | $ | 675 | $ | (1,960 | ) | $ | (3,389 | ) | $ | 1,429 | ||||||||
Total change in net interest income | $ | 6,338 | $ | 1,884 | $ | 4,454 | $ | 7,178 | $ | (3,746 | ) | $ | 10,924 | |||||||||||
(1) | The column "Inc/(Dec) from Prior Year" is segmented into the changes attributable to variations in volume and the changes attributable to changes in interest rates. The variations attributable to simultaneous volume and rate changes have been proportionately allocated to rate and volume. |
(2) | Interest earned and yields on nontaxable investment securities and loans are determined on a tax equivalent basis using a 35% tax rate in each year presented. |
(3) | Loan/lease fees are not material and are included in interest income from loans/leases receivable in accordance with accounting and regulatory guidance. |
The Company’s operating results are also impacted by various sources of noninterest income, including trust department fees, investment advisory and management fees, deposit service fees, gains from the sales of residential real estate loans and government guaranteed loans, earnings on bank-owned life insurance,BOLI, and other income. Offsetting these items, the Company incurs noninterest expenses which include salaries and employee benefits, occupancy and equipment expense, professional and data processing fees, FDIC and other insurance expense, loan/lease expense, and other administrative expenses.
The Company’s operating results are also affected by economic and competitive conditions, particularly changes in interest rates, income tax rates, government policies, and actions of regulatory authorities.
CRITICAL ACCOUNTING POLICIES
The Company’s financial statements are prepared in accordance with accounting principles generally accepted in the United States of America. The financial information contained within these statements is, to a significant extent, financial information that is based on approximate measures of the financial effects of transactions and events that have already occurred.
Based on its consideration of accounting policies that involve the most complex and subjective decisions and assessments, management has identified its most critical accounting policy to be that related to the allowance for loan/lease losses (also referred to as “allowance for estimated losses on loans/leases” or “allowance”). The Company’s allowance for loan/lease losses methodology incorporates a variety of risk considerations, both quantitative and qualitative, in establishing an allowance for loan/lease losses that management believes is appropriate at each reporting date. Quantitative factors include the Company’s historical loss experience, delinquency and charge-off trends, collateral values, governmental guarantees, payment status, changes in nonperforming loans/leases, and other factors. Quantitative factors also incorporate known information about individual loans/leases, including borrowers’ sensitivity to interest rate movements. Qualitative factors include the general economic environment in the Company’s markets, including economic conditions throughout the Midwest, and in particular, the economic health of certain industries. Size and complexity of individual credits in relation to loan/lease structure, existing loan/lease policies and pace of portfolio growth are other qualitative factors that are considered in the methodology. As the Company adds new products and increases the complexity of its loan/lease portfolio, it enhances its methodology accordingly. Management may report a materially different amount for the provision for loan/lease losses in the statement of operations to change the allowance for loan/lease losses if its assessment of the above factors were different. The discussion regarding the Company’s allowance for loan/lease losses should be read in conjunction with the Company’s financial statements and the accompanying notes presented elsewhere in this Form 10-K, as well as the portion of this Management’s Discussion and Analysis section entitled “Financial Condition – Allowance for Estimated Losses on Loans/Leases.” Although management believes the level of the allowance as of December 31, 20122014 was adequate to absorb losses inherent in the loan/lease portfolio, a decline in local economic conditions, or other factors, could result in increasing losses that cannot be reasonably predicted at this time.
The Company’s assessment of other-than-temporary impairmentOTTI of its available-for-sale securities portfolio is another critical accounting policy as a result of the level of judgment required by management. Available-for-sale and held to maturity securities are evaluated to determine whether declines in fair value below their cost are other-than-temporary. In estimating other-than-temporary impairmentOTTI losses, management considers a number of factors including, but not limited to,to: (1) the length of time and extent to which the fair value has been less than amortized cost,cost; (2) the financial condition and near-term prospects of the issuer,issuer; (3) the current market conditions,conditions; and (4) the intent of the Company to not sell the security prior to recovery and whether it is not more-likely-than-not that the Company will be required to sell the security prior to recovery. The discussion regarding the Company’s assessment of other-than-temporary impairmentOTTI should be read in conjunction with the Company’s financial statements and the accompanying notes presented elsewhere in this Form 10-K.
RESULTS OF OPERATIONS FOR THE YEARS ENDED DECEMBER 31, 2012, 2011,2014, 2013, and 2010
OVERVIEW.Net income attribute to QCR Holdings, Inc. for 2014 was $15.0 million, or EPS of $1.72 after preferred stock dividends of $1.1 million. Comparing 2014 to 2013, annual earnings were flat and EPS decreased 17%, due to the increase in common shares outstanding that resulted from the conversion of the Company’s Series E Non-Cumulative Convertible Perpetual Preferred Stock (“Series E Preferred Stock”) in December 2013 and the acquisition of Community National in May 2013. Net interest income grew $5.0 million, or 8%, in 2014 due to organic loan growth in the Company’s legacy markets, as well as improvements in the average yield of investment securities. Provision increased $877 thousand, or 15%, as the Company grew loans/leases 12% in 2014, and proactively addressed asset quality issues in the fourth quarter. Noninterest income decreased $4.8 million, or 19%, as 2013 included several nonrecurring items related to the acquisition of CNB, disposition of the credit card portfolio and credit card issuing operations, as well as a large gain on the sale of a nonperforming loan, all totaling approximately $5.6 million. Excluding these one-time items, noninterest income increased $785 thousand, or 4%, led by increased wealth management fees, deposit service fees and correspondent banking fees. Noninterest expenses grew $3.2 million, or 5%, in 2014, excluding acquisition and data conversion costs incurred in 2013 totaling $2.4 million. The addition of CNB’s cost structure (net of the cost savings realized post-acquisition) for the first full year contributed to the increased costs..
Net income attributable to QCR Holdings, Inc. for 20122013 was $12.6$14.9 million, or diluted earnings per shareEPS of $1.85$2.08 after preferred stock dividends of $3.5$3.2 million. Comparing 20122013 to 2011,2012, annual earnings grew 30%,18% and diluted earnings per share more than doubled.EPS increased 12%. Net interest income grew $3.5$6.5 million, or 11%, in 2013 with the acquisition of CNB and organic growth in the Company’s legacy markets. Provision increased $1.6 million, or 36%, as the Company added specific allowances to several existing nonperforming loans as workouts of those loans continued to progress. Noninterest income jumped $9.2 million, or 55%, propelled by acquisition-related gains of $4.1 million (bargain purchase gain of $1.8 million and the gains on branch sales of $2.3 million), growth in wealth management fee income of $1.5 million, increased gains on sales of government guaranteed portions of loans of $1.1 million, as well as increases across many of the core recurring noninterest income sources as a result of the acquisition of CNB. Noninterest expenses grew $12.2 million, or 23%, in 2013. Acquisition and data conversion costs totaled $2.4 million for the year. The addition of CNB’s cost structure contributed to increased costs for more than half of the year.
INTEREST INCOME. For 2014, interest income grew $4.1 million, or 5%. In total, the Company’s average interest-earning assets increased $119.2 million, or 5%, year-over-year. This growth more than offset the continued impact of declining yields on loans. Average loans/leases grew 8%, while average securities declined 2%. This shift was part of the Company’s strategy to shift the mix of earning assets from lower yielding securities to higher yielding loans and leases. Additionally, the Company continued to diversify its securities portfolio, included increasing its portfolio of tax exempt municipal securities. The large majority of these are privately placed debt issuances located in the Midwest and require a thorough underwriting process before investment. Execution of this strategy has led to increased interest income on a tax equivalent basis over the past several years. Management understands that this strategy has extended the duration of its securities portfolio and continually evaluates the combined benefit of increased interest income and reduced effective income tax rate and the impact on interest rate risk.
For 2013, interest income grew $4.5 million, or 6%, as growth and shift in mixwith the addition of the CNB’s earning assets and funding outpaced(approximately $255.9 million at acquisition which was later reduced by the branch sales in October 2013). In total, the Company’s average interest-earning assets increased $304.1 million, or 16%, year-over-year. This growth more than offset the continued impact of declining yields on loans and securities. Provision for loan/lease losses declined $2.2 million as loan quality continued to improve. Noninterest income fell $841 thousand which was primarilyAverage loans/leases grew 17% and average securities jumped 16%. Of the result of increased losses on other real estate owned (“OREO”) as most of the other recurring sources realized modest gains year-over-year. Noninterest expenses grew $1.3 million, or 2%, during 2012. The large majority of this increase was salaries and employee benefits as health insurance costs continued to increase, incentive compensation grew due to improved financial performance, and the continuation of customary annual salary and benefits increases across the employee base.
The Company intends to continue to grow quality loans and leases as well as diversify the securities portfolio to maximize yield while minimizing credit and interest rate risk.
INTEREST EXPENSE. Comparing 20122014 to 2011,2013, interest expense declined $3.9 million,$872 thousand, or 16%5%, year-over-year. With averageAverage interest-bearing liabilities increasing slightly, the following were major contributorsgrew 4% in 2014 with most of this in deposits. The Company was successful in continuing to the decline in interest expense:manage down its cost of funds as follows:
● | Continued reduction of interest rates paid across all deposits without runoff (the average cost of interest-bearing deposits fell from |
● | Focus on continued growth in noninterest bearing deposit accounts (average noninterest bearing balances grew 11% in 2014, primarily due to successful growth in the correspondent banking area); and |
● | Continued shift of funding from high-cost borrowings to deposits and/or low-cost borrowings. |
Comparing 2013 to 2012, interest expense declined $2.0 million, or 10%, year-over-year. Average interest-bearing liabilities grew 13% in 2013 with most of this in deposits as borrowings were flat. The acquisition of CNB was the primary contributor to the deposit growth. More than offsetting the growth, the Company was successful in continuing to manage down its cost of funds as follows:
● | Continued reduction of interest rates paid across all deposits without runoff (the average cost of interest-bearing deposits fell from 0.61% for 2012 to 0.44% for 2013); |
● | The impact of the aforementioned balance sheet restructuring strategies executed in |
● | Continued shift of funding from |
The Company’s management intends to continue to shift the mix of funding from wholesale borrowing and brokered and other time depositsfunds to core deposits, including noninterest-bearing deposits. Continuing this trend will strengthen the Company’s franchise value, reduce funding costs, and increase fee income opportunities through deposit service charges.
PROVISION FOR LOAN/LEASE LOSSES. The provision for loan/lease losses is established based on a number of factors, including the Company’s historical loss experience, delinquencies and charge-off trends, the local and national economy and the risk associated with the loans/leases in the portfolio as described in more detail in the “Critical Accounting Policies” section.
The Company’s provision totaled $6.8 million for 2014 which was an increase of $877 thousand, or 15%, from 2013 due to strong loan/lease losses declined $2.2growth coupled with charge-offs that addressed asset quality issues in the fourth quarter of 2014.
Comparing 2013 to 2012, the Company’s provision increased $1.5 million, or 34%36%, from $6.6 million for 2011 to $4.4 million for 2012. This decline followed a2012 to $5.9 million for 2013. Despite the drop in provisionnonperforming loans (decline of $4.9 million, or 19%) in 2013, the Company had an increased need for loan/lease losses of $848 thousand, or 11%, comparing 2010 to 2011. The declines were the result of continued improvement in loan quality as evidenced by a declining trend in the level of classified and criticizedspecific reserves for certain existing nonperforming loans (see table and further discussion in the Allowance for Estimated Losses on Loans/Leases section). This trend translated over to nonperforming loans/leases, as the Company’s levelworkouts of nonperforming loans/leases declined $9.1 million, or 22%, from 2010 to 2011, and then again $6.6 million, or 21%, from 2011 to 2012. The impact of improving loan quality to the provision for loan/lease losses more than offset the impact of loan growth over the past two years.
The Company had an allowance for estimated losses onof 1.42% of total gross loans/leases at December 31, 2014, compared to 1.47% of total gross loans/leases at December 31, 2013, and compared to 1.55% of total gross loans/leases at December 31, 2012, compared2012. In accordance with generally accepted accounting principles for acquisition accounting, the acquired CNB loans were recorded at fair value; therefore, there was no allowance associated with CNB’s loans at acquisition. Further, the Company’s allowance to 1.56% of total grossnonperforming loans/leases was 115% at December 31, 2011, and compared to 1.74% of total gross loans/leases2014, which was up from 105% at December 31, 2010.
NONINTEREST INCOME. The following tables set forth the various categories of noninterest income for the years ended December 31, 2012, 2011,2014, 2013, and 2010.2012.
| Years Ended | ||||||||||||||||
December 31, 2012 | December 31, 2011 | $ Change | % Change | |||||||||||||
| Trust department fees | $ | 3,632,278 | $ | 3,368,995 | $ | 263,283 | 7.8 | % | ||||||||
| Investment advisory and management fees, gross | 2,361,159 | 2,108,918 | 252,241 | 12.0 | ||||||||||||
| Deposit service fees | 3,485,929 | 3,493,001 | (7,072 | ) | (0.2 | ) | ||||||||||
| Gains on sales of residential real estate loans | 1,388,142 | 999,162 | 388,980 | 38.9 | ||||||||||||
| Gains on sales of government guaranteed portions of loans | 1,069,565 | 1,565,881 | (496,316 | ) | (31.7 | ) | ||||||||||
| Earnings on bank-owned life insurance | 1,609,208 | 1,445,891 | 163,317 | 11.3 | ||||||||||||
| Credit card fees, net of processing costs | 599,164 | 500,544 | 98,620 | 19.7 | ||||||||||||
| Subtotal | $ | 14,145,445 | $ | 13,482,392 | $ | 663,053 | 4.9 | |||||||||
| Securities gains, net | 104,600 | 1,472,528 | (1,367,928 | ) | (92.9 | ) | ||||||||||
| Losses on other real estate owned, net | (1,332,972 | ) | (374,910 | ) | (958,062 | ) | 255.5 | |||||||||
| Other | 3,704,222 | 2,881,868 | 822,354 | 28.5 | ||||||||||||
| Total noninterest income | $ | 16,621,295 | $ | 17,461,878 | $ | (840,583 | ) | (4.8 | ) % | |||||||
| Years Ended | ||||||||||||||||
| December 31, 2011 | December 31, 2010 | $ Change | % Change | |||||||||||||
| Trust department fees | $ | 3,368,995 | $ | 3,290,844 | $ | 78,151 | 2.4 | % | ||||||||
| Investment advisory and management fees, gross | 2,108,918 | 1,812,903 | 296,015 | 16.3 | ||||||||||||
| Deposit service fees | 3,493,001 | 3,478,743 | 14,258 | 0.4 | ||||||||||||
| Gains on sales of residential real estate loans | 999,162 | 1,655,570 | (656,408 | ) | (39.6 | ) | ||||||||||
| Gains on sales of government guaranteed portions of loans | 1,565,881 | 1,513,944 | 51,937 | 3.4 | ||||||||||||
| Earnings on bank-owned life insurance | 1,445,891 | 1,331,085 | 114,806 | 8.6 | ||||||||||||
| Credit card fees, net of processing costs | 500,544 | 259,590 | 240,954 | 92.8 | ||||||||||||
| Subtotal | $ | 13,482,392 | $ | 13,342,679 | $ | 139,713 | 1.0 | |||||||||
| Securities gains, net | 1,472,528 | - | 1,472,528 | 100.0 | ||||||||||||
| Losses on other real estate owned, net | (374,910 | ) | (835,163 | ) | 460,253 | (55.1 | ) | |||||||||
| Other | 2,881,868 | 2,898,372 | (16,504 | ) | (0.6 | ) | ||||||||||
| Total noninterest income | $ | 17,461,878 | $ | 15,405,888 | $ | 2,055,990 | 13.3 | % | ||||||||
Years Ended | ||||||||||||||||
December 31, 2014 | December 31, 2013 | $ Change | % Change | |||||||||||||
Trust department fees | $ | 5,715,151 | $ | 4,941,681 | $ | 773,470 | 15.7 | % | ||||||||
Investment advisory and management fees, gross | 2,798,170 | 2,580,140 | 218,030 | 8.5 | ||||||||||||
Deposit service fees | 4,483,585 | 4,267,162 | 216,423 | 5.1 | ||||||||||||
Gains on sales of residential real estate loans | 460,721 | 836,065 | (375,344 | ) | (44.9 | ) | ||||||||||
Gains on sales of government guaranteed portions of loans | 2,040,638 | 2,148,979 | (108,341 | ) | (5.0 | ) | ||||||||||
Earnings on bank-owned life insurance | 1,721,507 | 1,786,023 | (64,516 | ) | (3.6 | ) | ||||||||||
Debit card fees | 982,005 | 991,300 | (9,295 | ) | (0.9 | ) | ||||||||||
Correspondent banking fees | 1,064,030 | 772,120 | 291,910 | 37.8 | ||||||||||||
Participation service fees on commercial loan participations | 854,621 | 768,547 | 86,074 | 11.2 | ||||||||||||
Bargain purchase gain on Community National Acquisition | - | 1,841,385 | (1,841,385 | ) | (100.0 | ) | ||||||||||
Gains on sales of certain Community National Bank branches | - | 2,334,216 | (2,334,216 | ) | (100.0 | ) | ||||||||||
Securities gains, net | 92,363 | 432,492 | (340,129 | ) | (78.6 | ) | ||||||||||
Losses on other real estate owned, net | (447,272 | ) | (545,340 | ) | 98,068 | (18.0 | ) | |||||||||
Other | 1,231,781 | 2,659,058 | (1,427,277 | ) | (53.7 | ) | ||||||||||
Total noninterest income | $ | 20,997,300 | $ | 25,813,828 | $ | (4,816,528 | ) | (18.7 | )% | |||||||
Years Ended | ||||||||||||||||
December 31, 2013 | December 31, 2012 | $ Change | % Change | |||||||||||||
Trust department fees | $ | 4,941,681 | $ | 3,632,278 | $ | 1,309,403 | 36.0 | % | ||||||||
Investment advisory and management fees, gross | 2,580,140 | 2,361,159 | 218,981 | 9.3 | ||||||||||||
Deposit service fees | 4,267,162 | 3,485,929 | 781,233 | 22.4 | ||||||||||||
Gains on sales of residential real estate loans | 836,065 | 1,388,142 | (552,077 | ) | (39.8 | ) | ||||||||||
Gains on sales of government guaranteed portions of loans | 2,148,979 | 1,069,565 | 1,079,414 | 100.9 | ||||||||||||
Earnings on bank-owned life insurance | 1,786,023 | 1,609,208 | 176,815 | 11.0 | ||||||||||||
Debit card fees | 991,300 | 951,200 | 40,100 | 4.2 | ||||||||||||
Correspondent banking fees | 772,120 | 424,458 | 347,662 | 81.9 | ||||||||||||
Participation service fees on commercial loan participations | 768,547 | 665,992 | 102,555 | 15.4 | ||||||||||||
Bargain purchase gain on Community National Acquisition | 1,841,385 | - | 1,841,385 | 100.0 | ||||||||||||
Gains on sales of certain Community National Bank branches | 2,334,216 | - | 2,334,216 | 100.0 | ||||||||||||
Securities gains, net | 432,492 | 104,600 | 327,892 | 313.5 | ||||||||||||
Losses on other real estate owned, net | (545,340 | ) | (1,332,972 | ) | 787,632 | (59.1 | ) | |||||||||
Other | 2,659,058 | 2,261,736 | 397,322 | 17.6 | ||||||||||||
Total noninterest income | $ | 25,813,828 | $ | 16,621,295 | $ | 9,192,533 | 55.3 | % | ||||||||
Trust department fees continue to be a significant contributor to noninterest income.income, increasing 16% in 2014 and 36% in 2013. Income is generated primarily from fees charged based on assets under administration for corporate and personal trusts and for custodial services. The majority of the trust department fees are determined based on the value of the investments within the fully managed trusts. Part of this increase stems from the addition of CNB’s trust department for the first full year. As the markets have experienced volatilitystrengthened with the national economy’s recovery from recession, the Company’s fee income has experienced similar volatility, but has realized net growth year-over-year in fee income for 2011 (2.4%) and 2012 (7.8%).growth. In recent years, the Company has been successful in expanding its customer base which has helped to offset some ofdrive the volatility and contributed to the net growthrecent increases in fee income.
In recent years, management has placed a stronger emphasis on growing its investment advisory and management services. Part of this initiative has been to restructure the Company’s Wealth Management Division to allow for more efficient delivery of products and services including adding three business development officers in late 2011through selective additions of talent as well as leverage of and early 2012. Fee income fromcollaboration among existing resources (including the aforementioned trust department). CNB did not provide investment advisory and management services; however, the Company is leveraging its existing infrastructure to efficiently offer these services increased in consecutive years with year-over-year increases of 16.3% and 12.0% for 2011 and 2012, respectively.the communities served by CNB. Similar to trust department fees, these fees are largely determined based on the value of the investments managed. And, similar to the trust department, the Company has had some success in expanding its customer base which has helped to offsetdrive the market volatility affecting asset values as the national economy continues to slowly recover.
As management understands the importance offocuses on growing fee income, expanding market share in trust and investment advisory services will continue to be a primary strategic focus.
Deposit service fees have remained flat overexpanded 5% in 2014 and 22% in 2013 largely due to the past two years.addition of CNB’s deposits. The Company has placed an emphasis on shifting the mix of deposits from brokered and retail time deposits to non-maturity demand deposits as the latter tends to be lower in interest cost and higher in service fees. A large majority of this shift and growth over the past two years has been non-interest bearing correspondent bank deposits. The majority of these deposits include a variety of services (processing of cash letter items, wire transfer services, safekeeping of securities, etc.) and the Company has offered a reduction of fees charged for these services if the correspondent bank carries a certain level of non-interest bearing deposits. With loan demand weak and liquidity strong across the correspondent bank customer portfolio, the correspondent bank customers have carried higher deposits to maximize the reduction of fees. The Company has continually reviewed the fees charged on all deposit-related services and has consistently increased across the board to be in line with or to lead the market. In addition, the Company has recently evaluated the level of fee reduction and compensating balances for the aforementioned correspondent bank deposits and restructured the program to minimize the reduction of fees beginning in 2013. The Company plans to continue thethis shift in mix of deposits and to further focus on growing deposit service fees.
Gains on sales of residential mortgages,real estate loans decreased 45% in 2014 and 40% in 2013. With the sustained historically low interest rate environment, refinancing activity has slowed as many of the Company’s existing and prospective customers have already executed a refinancing.
Gains on the sale of government guaranteed portions of loans decreased 5% in 2014, while increasing 101% in 2013. As one of its core strategies, the Company experienced fluctuation as refinancing activity was strong in 2010, slowed in 2011, and rebounded in 2012 as the yield curve flattened further driving down longer-term interest rates and allowing opportunities for refinancing.
Earnings on Bank-Owned Life Insurance (“BOLI”) were relatively flat in 2014 (decreasing 4%). BOLI earnings increased 11% in 2013. There were no purchases of BOLI in 2014. With the $832 thousandacquisition of fees for prepaying $15.0CNB in 2013, the Company acquired $4.6 million of FHLB advances, QCBT sold $37.4 million of government agency securities for a pre-tax gain totaling $880 thousand. See detailed discussion of this restructuring transaction in the Net Interest Income and Margin section earlier in Management’s Discussion and Analysis.
Debit card fees were relatively flat in 2014, while increasing 4% in 2013. The majority of the Company’s customer checking accounts have debit cards that have high usage rates. This item represents the interchange revenue that the Company earns on debit card issuances and transactions. As the Company continues to grow the number of these deposits, this line item will continue to expand.
Correspondent banking fees grew 38% in 2014 and 82% in 2013. Correspondent banking continues to be a core strategy for the Company, as this line of business provides a high level of noninterest bearing deposits that can be used to fund additional loan growth as well as a steady source of fee income. In 2014, the Company expanded its territory to Wisconsin in order to continue to build this business unit. The Company now serves approximately 164 Banks in Iowa, Illinois and Wisconsin.
Participation service fees on commercial loan participations increased 11% in 2014 and 15% in 2013. These fees represent the amount paid to the Company by participants to cover the servicing expenses incurred by the Company. The fee is generally 25 basis points of the participated loan amount. Additionally, the Company receives a mandated 1% servicing fee on the sold portion of government guaranteed loans.
In accordance with acquisition accounting rules, the Company recognized a bargain purchase gain of $1.8 million in 2013 in recording the acquisition of Community National. The Company adjusted the acquired assets and assumed liabilities to fair value as determined by an independent valuation specialist. The gain resulted primarily from the recording of a core deposit intangible based on the value of the acquired deposit portfolio, and the recognition of a discount on the trust preferred securities that were previously issued by Community National and were assumed by the Company in the transaction. Net of other more modest valuation adjustments, and the resulting deferred income tax liabilities, the $1.8 million bargain purchase gain was included in noninterest incomeincome. See Note 2 to the consolidated financial statements for additional information regarding the Company’s acquisition of Community National.
In October 2013, the Company sold certain assets and liabilities of certain branches of CNB for a pre-tax gain on sale of $2.3 million. Specifically, the Company sold certain assets and liabilities of the two Mason City, Iowa branches, including deposits of $55 million and loans of $23 million, for a pre-tax gain on sale of $874 thousand. Additionally, the Company sold certain assets and liabilities of the two Austin, Minnesota branches, including deposits of $36 million and loans of $32 million, for a pre-tax gain on sale of $1.4 million. See Note 2 to the consolidated financial statements for additional information regarding these branch sales.
As the Company works to improve its balance sheet mix, investment securities continue to be sold (as market opportunity allows) to fund loan/lease growth and municipal securities, improving the yield the Company earns on these assets and net interest margin. In 2014, the Company sold $78.5 million of investment securities at a modest gain of $92 thousand. During the third quarter of 2013, the Company sold a mix of government-sponsored residential mortgage-backed securities, government-sponsored agency securities, and one smaller individual trust preferred security at a pre-tax gain on sale of $432 thousand. In turn, QCBT reinvested the sales proceeds back into a blend of government-sponsored agency securities and residential mortgage-backed securities at a higher yield with modest duration extension.
In 2014, the Company wrote down three existing OREO properties by a total of $475 thousand (offset by small gains on the sale of OREO). The losses were the result of further declines in appraised values. In 2013, the Company wrote down one existing individual OREO property by $463 thousand as a result of a decline in appraised value. The remaining $82 thousand consisted of small losses on the sales of several properties. In 2012, the Company incurred elevated levels of write-downs of existing OREO as the result of further declines in appraised values of certain properties. Of the total losses on OREO for 2012, the Company wrote down $1.2 million of existing OREO and recognized $580 thousand pre-tax gainlosses on sales of $173 thousand. Management continues to proactively manage its OREO portfolio in an effort to sell timely at minimal loss.
Included in “Other” noninterest income were the sale of a small equity interest in a company that provided data processing services to the Company merchant credit card acquiring business that was previously sold in 2008. In addition, CRBT recognized $616 thousand of fee income for the execution of interest rate swaps related to four commercial loans in 2012. The interest rate swaps allow the commercial borrowers to pay a fixed interest rate while CRBT receives a variable interest rate as well as an upfront fee depending on the pricing. Management believes that these swaps help position CRBT more favorably for rising rate environments. Management will continue to review opportunities to execute these swaps at all three of its subsidiary banks as the circumstances are appropriate for the borrower and the Company.
● | During the first quarter of 2013, QCBT sold its credit card loan portfolio for a pre-tax gain on sale of $495 thousand. In addition, QCBT sold its credit card issuing operations to the same purchaser for a pre-tax gain on sale of $355 thousand. The latter was the primary reason for the decline in the credit card fees, net of processing costs, during 2013. |
● | In December 2013, QCBT sold certain related nonperforming loans at a gain of $576 thousand. |
● | In 2012, the Company recognized $580 thousand pre-tax gain on the sale of a small equity interest in a company that provided data processing services to the Company’s merchant credit card acquiring business that was previously sold in 2008. |
NONINTERESTNONINTEREST EXPENSES. The following tables set forth the various categories of noninterest expenses for the years ended December 31, 2012, 2011,2014, 2013, and 2010.2012.
| Years Ended | ||||||||||||||||
December 31, 2012 | December 31, 2011 | $ Change | % Change | |||||||||||||
| Salaries and employee benefits | $ | 33,274,509 | $ | 30,365,020 | $ | 2,909,489 | 9.6 | % | ||||||||
| Occupancy and equipment expense | 5,635,257 | 5,297,949 | 337,308 | 6.4 | ||||||||||||
| Professional and data processing fees | 4,317,939 | 4,461,187 | (143,248 | ) | (3.2 | ) | ||||||||||
| FDIC and other insurance | 2,330,611 | 2,698,282 | (367,671 | ) | (13.6 | ) | ||||||||||
| Loan/lease expense | 1,041,824 | 2,160,674 | (1,118,850 | ) | (51.8 | ) | ||||||||||
| Advertising and marketing | 1,445,476 | 1,288,797 | 156,679 | 12.2 | ||||||||||||
| Postage and telephone | 959,708 | 937,557 | 22,151 | 2.4 | ||||||||||||
| Stationery and supplies | 541,122 | 516,873 | 24,249 | 4.7 | ||||||||||||
| Bank service charges | 853,895 | 725,717 | 128,178 | 17.7 | ||||||||||||
| Subtotal | $ | 50,400,341 | $ | 48,452,056 | $ | 1,948,285 | 4.0 | |||||||||
| Prepayment fees on Federal Home Loan Bank advances | - | 832,099 | (832,099 | ) | (100.0 | ) | ||||||||||
| Other-than-temporary impairment losses on securities | 62,400 | 118,847 | (56,447 | ) | (47.5 | ) | ||||||||||
| Other | 1,796,206 | 1,589,650 | 206,556 | 13.0 | ||||||||||||
| Total noninterest expense | $ | 52,258,947 | $ | 50,992,652 | $ | 1,266,295 | 2.5 | % | ||||||||
| Years Ended | ||||||||||||||||
December 31, 2011 | December 31, 2010 | $ Change | % Change | |||||||||||||
| Salaries and employee benefits | $ | 30,365,020 | $ | 27,843,127 | $ | 2,521,893 | 9.1 | % | ||||||||
| Occupancy and equipment expense | 5,297,949 | 5,472,248 | (174,299 | ) | (3.2 | ) | ||||||||||
| Professional and data processing fees | 4,461,187 | 4,524,519 | (63,332 | ) | (1.4 | ) | ||||||||||
| FDIC and other insurance | 2,698,282 | 3,528,267 | (829,985 | ) | (23.5 | ) | ||||||||||
| Loan/lease expense | 2,160,674 | 1,657,552 | 503,122 | 30.4 | ||||||||||||
| Advertising and marketing | 1,288,797 | 1,053,909 | 234,888 | 22.3 | ||||||||||||
| Postage and telephone | 937,557 | 1,004,176 | (66,619 | ) | (6.6 | ) | ||||||||||
| Stationery and supplies | 516,873 | 491,252 | 25,621 | 5.2 | ||||||||||||
| Bank service charges | 725,717 | 420,252 | 305,465 | 72.7 | ||||||||||||
| Subtotal | $ | 48,452,056 | $ | 45,995,302 | $ | 2,456,754 | 5.3 | |||||||||
| Prepayment fees on Federal Home Loan Bank advances | 832,099 | - | 832,099 | 100.0 | ||||||||||||
| Other-than-temporary impairment losses on securities | 118,847 | 113,800 | 5,047 | 4.4 | ||||||||||||
| Losses on lease residual values | - | 617,000 | (617,000 | ) | (100.0 | ) | ||||||||||
| Other | 1,589,650 | 1,822,961 | (233,311 | ) | (12.8 | ) | ||||||||||
| Total noninterest expense | $ | 50,992,652 | $ | 48,549,063 | $ | 2,443,589 | 5.0 | % | ||||||||
Years Ended | ||||||||||||||||
December 31, 2014 | December 31, 2013 | $ Change | % Change | |||||||||||||
Salaries and employee benefits | $ | 40,337,055 | $ | 37,510,318 | $ | 2,826,737 | 7.5 | % | ||||||||
Occupancy and equipment expense | 7,385,526 | 6,712,468 | 673,058 | 10.0 | ||||||||||||
Professional and data processing fees | 6,191,574 | 6,424,594 | (233,020 | ) | (3.6 | ) | ||||||||||
FDIC and other insurance | 2,895,494 | 2,587,041 | 308,453 | 11.9 | ||||||||||||
Loan/lease expense | 1,310,644 | 1,521,523 | (210,879 | ) | (13.9 | ) | ||||||||||
Advertising and marketing | 1,985,121 | 1,726,314 | 258,807 | 15.0 | ||||||||||||
Postage and telephone | 930,408 | 1,069,142 | (138,734 | ) | (13.0 | ) | ||||||||||
Stationery and supplies | 579,330 | 562,301 | 17,029 | 3.0 | ||||||||||||
Bank service charges | 1,291,017 | 1,144,757 | 146,260 | 12.8 | ||||||||||||
Acquisition and data conversion costs | - | 2,353,162 | (2,353,162 | ) | (100.0 | ) | ||||||||||
Other | 2,363,752 | 2,821,038 | (457,286 | ) | (16.2 | ) | ||||||||||
Total noninterest expense | $ | 65,269,921 | $ | 64,432,658 | $ | 837,263 | 1.3 | % | ||||||||
Years Ended | ||||||||||||||||
December 31, 2013 | December 31, 2012 | $ Change | % Change | |||||||||||||
Salaries and employee benefits | $ | 37,510,318 | $ | 33,274,509 | $ | 4,235,809 | 12.7 | % | ||||||||
Occupancy and equipment expense | 6,712,468 | 5,635,257 | 1,077,211 | 19.1 | ||||||||||||
Professional and data processing fees | 6,424,594 | 4,317,939 | 2,106,655 | 48.8 | ||||||||||||
FDIC and other insurance | 2,587,041 | 2,330,611 | 256,430 | 11.0 | ||||||||||||
Loan/lease expense | 1,521,523 | 1,041,824 | 479,699 | 46.0 | ||||||||||||
Advertising and marketing | 1,726,314 | 1,445,476 | 280,838 | 19.4 | ||||||||||||
Postage and telephone | 1,069,142 | 959,708 | 109,434 | 11.4 | ||||||||||||
Stationery and supplies | 562,301 | 541,122 | 21,179 | 3.9 | ||||||||||||
Bank service charges | 1,144,757 | 853,895 | 290,862 | 34.1 | ||||||||||||
Acquisition and data conversion costs | 2,353,162 | - | 2,353,162 | 100.0 | ||||||||||||
Other-than-temporary impairment losses on securities | - | 62,400 | (62,400 | ) | (100.0 | ) | ||||||||||
Other | 2,821,038 | 1,796,206 | 1,024,832 | 57.1 | ||||||||||||
Total noninterest expense | $ | 64,432,658 | $ | 52,258,947 | $ | 12,173,711 | 23.3 | % | ||||||||
Management places strong emphasis on overall cost containment and is committed to improveimproving the Company’s general efficiency.
Salaries and employee benefits, which is the largest component of noninterest expense, increased 9.1%8% and 9.6%13% in 20112014 and 2012,2013, respectively. ForThe increases were largely due to the past two years,addition of CNB’s cost structure for more than half of the year in 2013 and the full year in 2014. Excluding the impact of CNB, the Company’s increases arewere largely the result of:
● | Customary annual salary and benefits increases averaging approximately 2.5% for |
● | Continued increases in health insurance-related employee benefits for the |
● | Higher accrued incentive |
● | Targeted talent |
Occupancy and equipment expense increased from 2011in 2014 and 2013 due to 2012the addition of CNB’s branch network. At acquisition, CNB had eight branches, and the Company sold four in early October of 2013 and closed one in December of 2013. Over the past several years, the Company incurred increased equipment cost with the purchases of additional technology for enhanced customer service and for improved fraud detection and prevention systems. In addition, the largest branch office of RB&T was renovated in 2012 to allow for existing and future expansion.
Professional and data processing fees declineddecreased 4% in 20112014 and againincreased 49% in 20122013. The increase in 2013 was due to the addition of CNB’s cost structure and increased legal fees for a longstanding legal matter concerning a past nonperforming loan that experienced increased litigation activity. The Company, the plaintiff in the litigation, was awarded judgment in an amount to be paid by the defendant. The defendant, however, appealed the court’s decision in January 2014 and as management was successful in containingof February 2015, the case continues to be ongoing. Management will continue to focus on minimizing one-time costs and driving those recurring costs down through contract renegotiation or managed reduction in activity where costs are determined on a usage basis. Management will continue to focus on driving these recurring costs down.
FDIC and other insurance expense experienced significant declines in 2011 and 2012. FDIC insurance premiums are calculated using a variety of factors, including, but not limited to, balance sheet levels, funding mix, and regulatory compliance. The subsidiary banks have been successful in managing these factors and driving down FDIC insurance cost. In addition,has generally fallen over the past several years since the FDIC modified its assessment calculation to more closely align with bank performance and risk. The increase in 2014 and 2013 was primarily the calculationresult of adding CNB for premiums effective duringmore than half of the second quarter of 2011. The modification was favorableyear in 2013 and for the Company’s subsidiary banks.
Loan/lease expense fluctuated significantly over the past two years with a 30% increase14% decrease during 2011,2014, and a 52% decline46% increase in 2012.2013. Some of the increase in 2013 was the result of adding CNB’s cost structure. In addition, the Company incurred elevated levels of expense at the legacy banks in 2013 for certain existing nonperforming loans as workouts progressed. Generally, loan/lease expense has a direct relationship with the level of nonperforming loans/leases; however, it may deviate depending upon the individual nonperforming loans/leases. Management expects these historically elevated levels of expense to continue to decline in line with the declining trend in nonperforming loans/leases.
The Company incurred additional expenses for advertising and marketing during 20112014 and 20122013 in an effort to gain market share across all threefour markets the Company serves.
Bank service charges, which include costs incurred to provide services to QCBT’s correspondent banking customer portfolio, have increased significantly over the past two years. The increase iswas due, in large part, to the success QCBT has had in growing its correspondent banking customer portfolio over the past two years.
With the acquisition of Community National on May 13, 2013, the Company incurred costs related to the acquisition including professional fees (legal, investment banking, accounting), data conversion costs (including both the de-conversion of the sold branches and the conversion of the remaining branches), and compensation costs for retained and severed employees. In accordance with generally accepted accounting principles, the Company expensed these costs as incurred.
During 2012, the Company’s evaluation of its securities portfolio for other-than-temporary impairment (“OTTI”)OTTI determined that two privately held equity securities experienced declines in fair value that were other-than-temporary. As a result, the Company wrote down the value of these securities and recognized losses in the amount of $62 thousand. Similarly, during 2011,There were no OTTI losses in 2013 or 2014.
Other noninterest expense decreased 16% in 2014 and increased 57% in 2013. Due to the Company’s evaluation determined that two privately held equity securities experienced declinesacquisition of CNB in fair value that2013, expenses were other-than-temporaryinflated due to one-time items and other miscellaneous costs related to conversion and the Company wrote down the valueunwinding of these securities and recognized lossesdual cost structures. Expenses decreased in the amount of $119 thousand. Moreover, in 2010, management identified a single issue trust preferred security that experienced a decline in fair value determined to be other-than-temporary. As a result, the Company wrote down the value of this security and recognized a loss totaling $114 thousand. The Company does not own any other trust preferred securities.
INCOME TAX EXPENSE.The provision for income taxes was $3.0 million for 2014, or an effective tax rate of 16.9%, compared to $4.6 million for 2013, or an effective tax rate of 23.6%, and compared to $4.5 million for 2012, or an effective tax rate of 25.7%, compared to $3.9 million for 2011, or an. The declines in the effective tax rate of 27.6%, for an increase of $666 thousand, or 17%. The decline in effective tax rate iswere primarily the result of the following:
● | The continued |
● | The |
FINANCIAL CONDITION
OVERVIEW. Following is a table that represents the major categories of the Company’s balance sheet.
As of December 31, | ||||||||||||||||||||||||
2014 | 2013 | 2012 | ||||||||||||||||||||||
(dollars in thousands) | ||||||||||||||||||||||||
Amount | % | Amount | % | Amount | % | |||||||||||||||||||
Cash, federal funds sold, and interest-bearing deposits | $ | 120,350 | 5 | % | $ | 114,431 | 5 | % | $ | 110,488 | 5 | % | ||||||||||||
Securities | 651,539 | 26 | % | 697,210 | 29 | % | 602,239 | 29 | % | |||||||||||||||
Net loans/leases | 1,606,929 | 64 | % | 1,438,832 | 60 | % | 1,267,462 | 61 | % | |||||||||||||||
Other assets | 146,140 | 5 | % | 144,480 | 6 | % | 113,541 | 5 | % | |||||||||||||||
Total assets | $ | 2,524,958 | 100 | % | $ | 2,394,953 | 100 | % | $ | 2,093,730 | 100 | % | ||||||||||||
Total deposits | $ | 1,679,668 | 67 | % | $ | 1,646,991 | 69 | % | $ | 1,374,114 | 66 | % | ||||||||||||
Total borrowings | 662,558 | 26 | % | 563,381 | 24 | % | 547,758 | 26 | % | |||||||||||||||
Other liabilities | 38,653 | 1 | % | 37,004 | 1 | % | 31,424 | 1 | % | |||||||||||||||
Total stockholders' equity | 144,079 | 6 | % | 147,577 | 6 | % | 140,434 | 7 | % | |||||||||||||||
Total liabilities and stockholders' equity | $ | 2,524,958 | 100 | % | $ | 2,394,953 | 100 | % | $ | 2,093,730 | 100 | % | ||||||||||||
In 2014, total assets grew $130.0 million, or 5%. The Company organically grew its net loan/lease portfolio $168.1 million, which was partly funded by cash from the securities portfolio, as it decreased $45.7 million, or 7% (mostly due to the sale of securities). Deposits grew $32.7 million, or 2% during 2014. Borrowings increased $99.2 million, mostly due to an increase in overnight funding of $80.6 million. Quarter-end and year-end deposit balances can fluctuate a great deal due to large customer and correspondent bank activity. Since this cash outflow is typically temporary, the Company normally fills the funding gap with overnight or other short-term borrowings.
In 2013, total assets grew $301.2 million, or 14%, as a result of the acquisition of CNB and organic growth in the Company’s legacy markets. Specifically, excluding the impact of the branch sales, the Company grew loans/leases $225.8 million, or 18%, during 2013. Additionally, the Company grew its securities portfolio $95.0 million, or 16%, during 2013 with most of this growth in tax-exempt municipal securities. The earning asset growth was funded primarily by deposits which grew $363.9 million, or 26%, excluding the impact of the branch sales.
| As of December 31, | ||||||||||||||||||||||||
| 2012 | 2011 | 2010 | ||||||||||||||||||||||
| (dollars in thousands) | ||||||||||||||||||||||||
| Amount | % | Amount | % | Amount | % | |||||||||||||||||||
| Cash, federal funds sold, and interest-bearing deposits | $ | 110,488 | 5 | % | $ | 100,673 | 5 | % | $ | 143,737 | 8 | % | ||||||||||||
| Securities | 602,239 | 29 | % | 565,229 | 29 | % | 424,847 | 23 | % | |||||||||||||||
| Net loans/leases | 1,267,462 | 61 | % | 1,181,956 | 60 | % | 1,152,174 | 63 | % | |||||||||||||||
| Other assets | 113,541 | 5 | % | 118,752 | 6 | % | 115,877 | 6 | % | |||||||||||||||
| Total assets | $ | 2,093,730 | 100 | % | $ | 1,966,610 | 100 | % | $ | 1,836,635 | 100 | % | ||||||||||||
| Total deposits | $ | 1,374,114 | 66 | % | $ | 1,205,458 | 61 | % | $ | 1,114,816 | 61 | % | ||||||||||||
| Total borrowings | 547,758 | 26 | % | 590,603 | 30 | % | 566,059 | 31 | % | |||||||||||||||
| Other liabilities | 31,424 | 1 | % | 26,116 | 1 | % | 23,189 | 1 | % | |||||||||||||||
| Total stockholders' equity | 140,434 | 7 | % | 144,433 | 8 | % | 132,571 | 7 | % | |||||||||||||||
| Total liabilities and stockholders' equity | $ | 2,093,730 | 100 | % | $ | 1,966,610 | 100 | % | $ | 1,836,635 | 100 | % | ||||||||||||
In 2012, total assets grew $127.1 million, or 6%, to $2.09 billion at December 31, 2012, from $1.97 billion at December 31, 2011.. The Company grew its net loan/lease portfolio $85.5 million, or 7%, and its securities portfolio $37.0 million, or 7%, during 2012. The asset growth was funded by strong and continued growth of the Company’s deposit portfolio (as balances grew $168.7 million, or 14%) partially offset by a reduction in federal funds purchased.
INVESTMENT SECURITIES.The composition of the Company’s securities portfolio is managed to meet liquidity needs while prioritizing the impact on asset-liability position and maximizing return. With the strong growth in deposits more than outpacing the loan growth over the past twoIn recent years, the Company has grown and diversified its securities portfolio, including increasing the portfolio of agency sponsored residential mortgage-backed securities as well as more than tripling the portfolio of municipal securities. Of the latter, the large majority are privately placed debt issuances by municipalities located in the Midwest (with some in or near the Company’s existing marketsmarkets) and require a thorough underwriting process before investment. As the portfolio has grown over the recent years, management has elevated its focus on maximizing return while minimizing credit and interest rate risk. Additionally, management will continue to diversify the portfolio with further growth strictly dictated by the pace of growth in deposits and loans. Ideally, management expects to fund future loan growth partially with cashflow from the securities portfolio (calls and maturities of government sponsored agencies, and/or paydowns on residential mortgage-backed securities)securities, and/or targeted sales of securities that meet certain criteria as defined by management).
Following is a breakdown of the Company’s securities portfolio by type as of December 31, 2012, 2011,2014, 2013, and 2010.2012.
2014 | 2013 | 2012 | ||||||||||||||||||||||
Amount | % | Amount | % | Amount | % | |||||||||||||||||||
(dollars in thousands) | ||||||||||||||||||||||||
U.S. govt. sponsored agency securities | $ | 307,869 | 47 | % | $ | 356,473 | 51 | % | $ | 338,609 | 56 | % | ||||||||||||
Municipal securities | 229,230 | 35 | % | 180,361 | 26 | % | 97,615 | 17 | % | |||||||||||||||
Residential mortgage-backed and related securities | 111,423 | 17 | % | 157,429 | 23 | % | 163,601 | 27 | % | |||||||||||||||
Trust preferred securities | - | 0 | % | - | 0 | % | 139 | 0 | % | |||||||||||||||
Other securities | 3,017 | 1 | % | 2,947 | 0 | % | 2,275 | 0 | % | |||||||||||||||
| $ | 651,539 | 100 | % | $ | 697,210 | 100 | % | $ | 602,239 | 100 | % | |||||||||||||
As a % of Total Assets | 25.80 | % | 27.61 | % | 28.76 | % | ||||||||||||||||||
Net Unrealized Gains (Losses) as a % of Amortized Cost | -0.19 | % | -4.02 | % | 1.44 | % | ||||||||||||||||||
Duration (in years) | 4.4 | 4.7 | 2.8 | |||||||||||||||||||||
As a result of fluctuations in longer-term interest rates, the Company’s fair value of its securities portfolio moved from a net unrealized gain position (approximately 1.4% of amortized cost at the end of 2012) to a net unrealized loss position (approximately 4.0% at the end of 2013 and a very modest 0.2% at the end of 2014). Management monitors the level of unrealized gains/losses including performing quarterly reviews of individual securities for evidence of OTTI. Management identified no OTTI in 2014.
In 2014, the duration of the securities portfolio decreased slightly for two reasons:
● | A portion of the government-sponsored agency securities contain call options at the discretion of the issuer whereby the issuer can call the security at par at certain times which vary by individual security. With a steady decline in longer-term market interest rates in 2014, the duration of these callable agency securities shortened as the likelihood of a call increased. |
● | The Company’s sales strategy in 2014 targeted the liquidation of longer duration government-sponsored agency securities and government-sponsored mortgage-backed securities. |
| 2012 | 2011 | 2010 | ||||||||||||||||||||||
| Amount | % | Amount | % | Amount | % | |||||||||||||||||||
| (dollars in thousands) | ||||||||||||||||||||||||
| U.S. govt. sponsored agency securities | $ | 338,609 | 56 | % | $ | 428,955 | 76 | % | $ | 402,225 | 95 | % | ||||||||||||
| Residential mortgage-backed and related securities | 163,601 | 27 | % | 108,854 | 19 | % | 70 | 0 | % | |||||||||||||||
| Municipal securities | 97,615 | 16 | % | 25,689 | 5 | % | 20,603 | 5 | % | |||||||||||||||
| Trust preferred securities | 139 | 0 | % | 81 | 0 | % | 78 | 0 | % | |||||||||||||||
| Other securities | 2,275 | 0 | % | 1,650 | 0 | % | 1,871 | 0 | % | |||||||||||||||
| $ | 602,239 | 100 | % | $ | 565,229 | 100 | % | $ | 424,847 | 100 | % | |||||||||||||
| As a % of Total Assets | 28.76 | % | 28.74 | % | 23.13 | % | ||||||||||||||||||
| Net Unrealized Gains as a % of Amortized Cost | 1.44 | % | 1.38 | % | 0.27 | % | ||||||||||||||||||
| Duration (in years) | 2.8 | 1.8 | 1.7 | |||||||||||||||||||||
The duration of the securities portfolio lengthened in 2013 for two reasons:
● | With the sharp increase in longer-term rates in 2013, the duration of those callable agency securities lengthened as the likelihood of a call became remote. |
● | The increased investment in tax-exempt municipal securities which tend to be longer term (average maturity is approximately seven years). Management understands that this extended the duration of its securities portfolio and continually evaluates the combined benefit of increased interest income and reduced effective income tax rate and the impact on interest rate risk. |
The Company has not invested in commercial mortgage-backed securities or pooled trust preferred securities.
See Note 23 to the consolidated financial statements for additional information regarding the Company’s investment securities.
LOANS/LEASES.The Company’s gross loan/lease portfolio grew $86.6$167.6 million, or 7%12%, from 1.20 billion at December 31, 2011, to $1.29 billion at December 31, 2012. The growth was spread out overduring 2014. Notably, commercial and industrial ($43.5loans increased $92.2 million, or 12%), owner-occupied commercial real estate ($37.1 million, or 22%), residential real estate loans ($17.5 million, or 18%)21%, and direct financing leases ($10.5increased $37.1 million, or 11%)29%. Partially offsetting this growth, commercial construction loans ($15.4 million, or 26%) and other non-owner occupiedAlthough commercial real estate loans ($4.9grew $30.4 million, or 1%) declined.5%, this sector of the loan/lease portfolio is becoming a smaller percentage of total loans/leases (down from 46% in 2013 to 43% in 2014).
The Company’s gross loan/lease portfolio grew $28.2$171.4 million, or 2%13%, from $1.17 billion at December 31, 2010, to $1.20 billion at December 31, 2011. The growth was spread out over owner-occupied commercial real estate loans ($26.4during 2013. Excluding the impact of the branch sales, the Company grew loans/leases $225.8 million, or 19%)18%, direct financing leases ($10.2 million, or 12%), and residential real estate loans ($15.9 million, or 19%). Partially offsetting this growth, commercial and industrial loans declined $14.8 million, or 4%. The net decline in commercial and industrial loans is primarily a function of:
The mix of loan/lease types within the Company’s loan/lease portfolio is presented in the following table.
| As of December 31, | ||||||||||||||||||||||||||||||||||||||||
| 2012 | 2011 | 2010 | 2009 | 2008 | ||||||||||||||||||||||||||||||||||||
| Amount | % | Amount | % | Amount | % | Amount | % | Amount | % | |||||||||||||||||||||||||||||||
| (dollars in thousands) | ||||||||||||||||||||||||||||||||||||||||
| Commercial and industrial loans | $ | 394,244 | 31 | % | $ | 350,794 | 29 | % | $ | 365,625 | 31 | % | $ | 441,536 | 36 | % | $ | 439,117 | 36 | % | ||||||||||||||||||||
| Commercial real estate loans | 593,979 | 46 | % | 577,804 | 48 | % | 553,717 | 47 | % | 556,007 | 45 | % | 526,669 | 43 | % | |||||||||||||||||||||||||
| Direct financing leases | 103,686 | 8 | % | 93,212 | 8 | % | 83,010 | 7 | % | 90,059 | 7 | % | 79,408 | 7 | % | |||||||||||||||||||||||||
| Residential real estate loans | 115,582 | 9 | % | 98,107 | 8 | % | 82,197 | 7 | % | 70,608 | 6 | % | 79,228 | 7 | % | |||||||||||||||||||||||||
| Installment and other consumer loans | 76,720 | 6 | % | 78,223 | 7 | % | 86,240 | 8 | % | 84,271 | 6 | % | 88,540 | 7 | % | |||||||||||||||||||||||||
| Total loans/leases | $ | 1,284,211 | 100 | % | $ | 1,198,140 | 100 | % | $ | 1,170,789 | 100 | % | $ | 1,242,481 | 100 | % | $ | 1,212,962 | 100 | % | ||||||||||||||||||||
| Plus deferred loan/lease origination costs, net of fees | 3,176 | 2,605 | 1,750 | 1,839 | 1,727 | |||||||||||||||||||||||||||||||||||
| Less allowance for estimated losses on loans/leases | (19,925 | ) | (18,789 | ) | (20,365 | ) | (22,505 | ) | (17,809 | ) | ||||||||||||||||||||||||||||||
| Net loans/leases | $ | 1,267,462 | $ | 1,181,956 | $ | 1,152,174 | $ | 1,221,815 | $ | 1,196,880 | ||||||||||||||||||||||||||||||
As of December 31, | ||||||||||||||||||||||||||||||||||||||||
2014 | 2013 | 2012 | 2011 | 2010 | ||||||||||||||||||||||||||||||||||||
Amount | % | Amount | % | Amount | % | Amount | % | Amount | % | |||||||||||||||||||||||||||||||
(dollars in thousands) | ||||||||||||||||||||||||||||||||||||||||
Commercial and industrial loans | $ | 523,927 | 32 | % | $ | 431,688 | 30 | % | $ | 394,244 | 31 | % | $ | 350,794 | 29 | % | $ | 365,625 | 31 | % | ||||||||||||||||||||
Commercial real estate loans | 702,140 | 43 | % | 671,753 | 46 | % | 593,979 | 46 | % | 577,804 | 48 | % | 553,717 | 47 | % | |||||||||||||||||||||||||
Direct financing leases | 166,032 | 10 | % | 128,902 | 9 | % | 103,686 | 8 | % | 93,212 | 8 | % | 83,010 | 7 | % | |||||||||||||||||||||||||
Residential real estate loans | 158,633 | 10 | % | 147,356 | 10 | % | 115,582 | 9 | % | 98,107 | 8 | % | 82,197 | 7 | % | |||||||||||||||||||||||||
Installment and other consumer loans | 72,607 | 5 | % | 76,034 | 5 | % | 76,720 | 6 | % | 78,223 | 7 | % | 86,240 | 8 | % | |||||||||||||||||||||||||
| Total loans/leases | $ | 1,623,339 | 100 | % | $ | 1,455,733 | 100 | % | $ | 1,284,211 | 100 | % | $ | 1,198,140 | 100 | % | $ | 1,170,789 | 100 | % | ||||||||||||||||||||
Plus deferred loan/lease origination costs, net of fees | 6,664 | 4,547 | 3,176 | 2,605 | 1,750 | |||||||||||||||||||||||||||||||||||
Less allowance for estimated losses on loans/leases | (23,074 | ) | (21,448 | ) | (19,925 | ) | (18,789 | ) | (20,365 | ) | ||||||||||||||||||||||||||||||
| Net loans/leases | $ | 1,606,929 | $ | 1,438,832 | $ | 1,267,462 | $ | 1,181,956 | $ | 1,152,174 | ||||||||||||||||||||||||||||||
Historically, the Company structures most residential real estate loans to conform to the underwriting requirements of Freddie Mac and Fannie Mae to allow the subsidiary banks to resell the loans on the secondary market avoidingto avoid the interest rate risk associated with longer term fixed rate loans and recognizing noninterest income for the gain on sale. Loans originated for this purpose were classified as held for sale and are included in the residential real estate loans in the table above. Historically, the subsidiary banks structure most loans that will not conform to those underwriting requirements as adjustable rate mortgages that mature or adjust in one to five years, and then retain these loans in their portfolios. During 2011 and 2012, the Company originated and heldcontinues to hold a limited amount of 15-year fixed rate residential real estate loans that met certain credit guidelines. In 2013, the Company discontinued this specific strategy to originate and hold certain 15-year fixed residential real estate loans. The remaining residential real estate loans originated by the Company werecontinue to be sold on the secondary market to avoid the interest rate risk associated with longer term fixed rate loans. In addition, the Company has not originated any subprime, Alt-A, no documentation, or stated income residential real estate loans throughout its history.
The following tables set forth the remaining maturities by loan/lease type as of December 31, 20122014 and 2011.2013. Maturities are based on contractual dates.
| As of December 31, 2012 | ||||||||||||||||||||
| Maturities After One Year | ||||||||||||||||||||
Due in one year or less | Due after one through 5 years | Due after 5 years | Predetermined interest rates | Adjustable interest rates | ||||||||||||||||
| (dollars in thousands) | ||||||||||||||||||||
| Commerical and industrial loans | $ | 183,891 | $ | 147,051 | $ | 63,302 | $ | 117,183 | $ | 93,170 | ||||||||||
| Commercial real estate loans | 135,789 | 328,703 | 129,487 | 322,114 | 136,076 | |||||||||||||||
| Direct financing leases | 4,256 | 95,675 | 3,755 | 99,430 | - | |||||||||||||||
| Residential real estate loans | 1,717 | 2,253 | 111,612 | 75,573 | 38,292 | |||||||||||||||
| Installment and other consumer loans | 33,132 | 38,566 | 5,022 | 23,322 | 20,266 | |||||||||||||||
| $ | 358,785 | $ | 612,248 | $ | 313,178 | $ | 637,622 | $ | 287,804 | |||||||||||
| Percentage of total loans/leases | 28 | % | 48 | % | 24 | % | 69 | % | 31 | % | ||||||||||
| As of December 31, 2011 | ||||||||||||||||||||
| Maturities After One Year | ||||||||||||||||||||
Due in one year or less | Due after one through 5 years | Due after 5 years | Predetermined interest rates | Adjustable interest rates | ||||||||||||||||
| (dollars in thousands) | ||||||||||||||||||||
| Commerical and industrial loans | $ | 144,928 | $ | 150,567 | $ | 55,299 | $ | 108,815 | $ | 97,051 | ||||||||||
| Commercial real estate loans | 129,446 | 332,610 | 115,748 | 336,709 | 111,649 | |||||||||||||||
| Direct financing leases | 3,109 | 86,663 | 3,440 | 90,103 | - | |||||||||||||||
| Residential real estate loans | 825 | 1,064 | 96,218 | 57,244 | 40,038 | |||||||||||||||
| Installment and other consumer loans | 27,389 | 43,869 | 6,965 | 27,333 | 23,501 | |||||||||||||||
| $ | 305,697 | $ | 614,773 | $ | 277,670 | $ | 620,204 | $ | 272,239 | |||||||||||
| Percentage of total loans/leases | 26 | % | 51 | % | 23 | % | 69 | % | 31 | % | ||||||||||
As of December 31, 2014 | ||||||||||||||||||||
Maturities After One Year | ||||||||||||||||||||
Due in one | Due after one | Due after | Predetermined | Adjustable | ||||||||||||||||
year or less | through 5 years | 5 years | interest rates | interest rates | ||||||||||||||||
(dollars in thousands) | ||||||||||||||||||||
Commerical and industrial loans | $ | 179,177 | $ | 254,961 | $ | 89,789 | $ | 226,178 | $ | 118,572 | ||||||||||
Commercial real estate loans | 131,438 | 446,352 | 124,350 | 427,753 | 142,949 | |||||||||||||||
Direct financing leases | 5,326 | 151,558 | 9,148 | 160,706 | - | |||||||||||||||
Residential real estate loans | 3,688 | 2,625 | 152,320 | 109,398 | 45,547 | |||||||||||||||
Installment and other consumer loans | 21,851 | 41,077 | 9,679 | 25,711 | 25,045 | |||||||||||||||
| $ | 341,480 | $ | 896,573 | $ | 385,286 | $ | 949,746 | $ | 332,113 | |||||||||||
Percentage of total loans/leases | 21 | % | 55 | % | 24 | % | 74 | % | 26 | % | ||||||||||
As of December 31, 2013 | ||||||||||||||||||||
Maturities After One Year | ||||||||||||||||||||
Due in one | Due after one | Due after | Predetermined | Adjustable | ||||||||||||||||
year or less | through 5 years | 5 years | interest rates | interest rates | ||||||||||||||||
(dollars in thousands) | ||||||||||||||||||||
Commerical and industrial loans | $ | 159,145 | $ | 199,936 | $ | 72,607 | $ | 172,889 | $ | 99,654 | ||||||||||
Commercial real estate loans | 111,686 | 407,750 | 152,317 | 421,568 | 138,499 | |||||||||||||||
Direct financing leases | 4,292 | 117,106 | 7,504 | 124,610 | - | |||||||||||||||
Residential real estate loans | 3,213 | 2,558 | 141,585 | 100,492 | 43,651 | |||||||||||||||
Installment and other consumer loans | 17,935 | 49,612 | 8,487 | 30,999 | 27,100 | |||||||||||||||
| $ | 296,271 | $ | 776,962 | $ | 382,500 | $ | 850,558 | $ | 308,904 | |||||||||||
Percentage of total loans/leases | 20 | % | 54 | % | 26 | % | 73 | % | 27 | % | ||||||||||
Over the past two years, the Company has seen minimal extensionmodest changes to the duration of its overall loan/lease portfolio. With the growth in municipal securities and residential real estate loans, both of which are longer duration assets with fixed interest rates, it’sit is important that the Company limits extension of the rest of the loan portfolio in an effort to limit exposure to rising rate scenarios. The aforementioned strategy, as discussed in the Noninterest Income“Noninterest Income” section, forof the execution of interest rate swaps on commercial loans, helps to offset the growth of the longer term fixed rate assets and maintain a favorable interest rate risk profile.
Management continues to focus on growing quality loans/leases and carefully monitors maturities and interest rate sensitivity of the current portfolio.
See Note 34 to the consolidated financial statements for additional information on the Company’s loan/lease portfolio.
ALLOWANCE FOR ESTIMATED LOSSES ON LOANS/LEASES. The allowance for estimated losses on loans/leases totaled $19.9$23.1 million at December 31, 2012,2014, which was an increase of $1.1 million, or 6%, from $18.8 million at December 31, 2011. Provision for loan/lease losses totaled $4.4 million for 2012 and outpaced net charge-offs of $3.2 million, or 27 basis points of average loans/leases outstanding, which is the lowest level since 2008.
The allowance totaled $21.4 million at December 31, 2013, which was an increase of $1.5 million, or 8%, from $19.9 million at December 31, 2012. Provision totaled $5.9 million for 2013 and outpaced net decline.
The following table summarizes the activity in the allowance for estimated losses on loans/leases.
| Years ended December 31, | ||||||||||||||||||||
| 2012 | 2011 | 2010 | 2009 | 2008 | ||||||||||||||||
| (dollars in thousands) | ||||||||||||||||||||
Average amount of loans/leases outstanding, before allowance for estimated losses on loans/leases | $ | 1,219,623 | $ | 1,177,705 | $ | 1,209,587 | $ | 1,222,493 | $ | 1,124,255 | ||||||||||
| Allowance for estimated losses on loans/leases: | ||||||||||||||||||||
| Balance, beginning of fiscal period | $ | 18,789 | $ | 20,365 | $ | 22,505 | $ | 17,809 | $ | 11,315 | ||||||||||
| Charge-offs: | ||||||||||||||||||||
| Commercial and industrial | (683 | ) | (3,334 | ) | (2,609 | ) | (7,510 | ) | (1,205 | ) | ||||||||||
| Commercial real estate | (2,232 | ) | (3,682 | ) | (5,922 | ) | (2,824 | ) | (805 | ) | ||||||||||
| Direct financing leases | (740 | ) | (1,101 | ) | (999 | ) | (1,255 | ) | (264 | ) | ||||||||||
| Residential real estate | (4 | ) | - | (35 | ) | (314 | ) | (326 | ) | |||||||||||
| Installment and other consumer | (717 | ) | (945 | ) | (1,135 | ) | (2,104 | ) | (1,085 | ) | ||||||||||
| Subtotal charge-offs | (4,376 | ) | (9,062 | ) | (10,700 | ) | (14,007 | ) | (3,685 | ) | ||||||||||
| Recoveries: | ||||||||||||||||||||
| Commercial and industrial | 663 | 414 | 380 | 344 | 313 | |||||||||||||||
| Commercial real estate | 222 | 287 | 381 | 98 | 420 | |||||||||||||||
| Direct financing leases | 77 | 3 | 163 | 52 | - | |||||||||||||||
| Residential real estate | - | - | - | 40 | 81 | |||||||||||||||
| Installment and other consumer | 179 | 166 | 172 | 1,193 | 143 | |||||||||||||||
| Subtotal recoveries | 1,141 | 870 | 1,096 | 1,727 | 957 | |||||||||||||||
| Net charge-offs | (3,235 | ) | (8,192 | ) | (9,604 | ) | (12,280 | ) | (2,728 | ) | ||||||||||
| Provision charged to expense | 4,371 | 6,616 | 7,464 | 16,976 | 9,222 | |||||||||||||||
| Balance, end of fiscal year | $ | 19,925 | $ | 18,789 | $ | 20,365 | $ | 22,505 | $ | 17,809 | ||||||||||
| Ratio of net charge-offs to average loans/leases outstanding | 0.27 | % | 0.70 | % | 0.79 | % | 1.00 | % | 0.24 | % | ||||||||||
Years ended December 31, | ||||||||||||||||||||
2014 | 2013 | 2012 | 2011 | 2010 | ||||||||||||||||
(dollars in thousands) | ||||||||||||||||||||
Average amount of loans/leases outstanding, before allowance for estimated losses on loans/leases | $ | 1,540,382 | $ | 1,425,364 | $ | 1,219,623 | $ | 1,177,705 | $ | 1,209,587 | ||||||||||
Allowance for estimated losses on loans/leases: | ||||||||||||||||||||
Balance, beginning of fiscal period | $ | 21,448 | $ | 19,925 | $ | 18,789 | $ | 20,365 | $ | 22,505 | ||||||||||
Charge-offs: | ||||||||||||||||||||
Commercial and industrial | (1,476 | ) | (963 | ) | (683 | ) | (3,334 | ) | (2,609 | ) | ||||||||||
Commercial real estate | (2,756 | ) | (3,573 | ) | (2,232 | ) | (3,682 | ) | (5,922 | ) | ||||||||||
Direct financing leases | (1,504 | ) | (917 | ) | (740 | ) | (1,101 | ) | (999 | ) | ||||||||||
Residential real estate | (131 | ) | (162 | ) | (4 | ) | - | (35 | ) | |||||||||||
Installment and other consumer | (269 | ) | (229 | ) | (717 | ) | (945 | ) | (1,135 | ) | ||||||||||
Subtotal charge-offs | (6,136 | ) | (5,844 | ) | (4,376 | ) | (9,062 | ) | (10,700 | ) | ||||||||||
Recoveries: | ||||||||||||||||||||
Commercial and industrial | 363 | 626 | 663 | 414 | 380 | |||||||||||||||
Commercial real estate | 418 | 574 | 222 | 287 | 381 | |||||||||||||||
Direct financing leases | 68 | 12 | 77 | 3 | 163 | |||||||||||||||
Residential real estate | 10 | 17 | - | - | - | |||||||||||||||
Installment and other consumer | 96 | 208 | 179 | 166 | 172 | |||||||||||||||
Subtotal recoveries | 955 | 1,437 | 1,141 | 870 | 1,096 | |||||||||||||||
Net charge-offs | (5,181 | ) | (4,407 | ) | (3,235 | ) | (8,192 | ) | (9,604 | ) | ||||||||||
Provision charged to expense | 6,807 | 5,930 | 4,371 | 6,616 | 7,464 | |||||||||||||||
Balance, end of fiscal year | $ | 23,074 | $ | 21,448 | $ | 19,925 | $ | 18,789 | $ | 20,365 | ||||||||||
Ratio of net charge-offs to average loans/leases outstanding | 0.34 | % | 0.31 | % | 0.27 | % | 0.70 | % | 0.79 | % | ||||||||||
The adequacy of the allowance for estimated losses on loans/leases was determined by management based on factors that included the overall composition of the loan/lease portfolio, types of loans/leases, historical loss experience, loan/lease delinquencies, potential substandard and doubtful credits, economic conditions, collateral positions, government guarantees and other factors that, in management's judgment, deserved evaluation. To ensure that an adequate allowance was maintained, provisions were made based on the increase/decrease in loans/leases and a detailed analysis of the loan/lease portfolio. The loan/lease portfolio was reviewed and analyzed monthly with specific detailed reviews completed on all credits risk-rated less than “fair quality” and carrying aggregate exposure in excess of $100 thousand. The adequacy of the allowance for estimated losses on loans/leases was monitored by the credit administration staff and reported to management and the board of directors.
The Company continued the strengthening of its core loan portfolio as the levels of criticized andloans remained relatively flat, while levels of classified loans declined in 20112014 and 2012,2013, as reported in the following table.
| As of December 31, | ||||||||||||
| Internally Assigned Risk Rating * | 2012 | 2011 | 2010 | |||||||||
| (dollars in thousands) | ||||||||||||
| Special Mention (Rating 6) | $ | 22,056 | $ | 26,034 | $ | 43,551 | ||||||
| Substandard (Rating 7) - Performing | 31,821 | 36,278 | 42,498 | |||||||||
| Substandard (Rating 7) - Nonperforming | 16,427 | 26,434 | 32,612 | |||||||||
| Doubtful (Rating 8) | - | - | 21 | |||||||||
| $ | 70,304 | $ | 88,746 | $ | 118,682 | |||||||
| Criticized Loans ** | $ | 70,304 | $ | 88,746 | $ | 118,682 | ||||||
| Classified Loans *** | $ | 48,248 | $ | 62,712 | $ | 75,131 | ||||||
| As of December 31, | ||||||||||||
Internally Assigned Risk Rating * | 2014 | 2013 | 2012 | |||||||||
(dollars in thousands) | ||||||||||||
Special Mention (Rating 6) | $ | 32,958 | $ | 24,572 | $ | 22,056 | ||||||
Substandard (Rating 7) | 35,715 | 43,508 | 48,248 | |||||||||
Doubtful (Rating 8) | - | - | - | |||||||||
| $ | 68,673 | $ | 68,080 | $ | 70,304 | |||||||
Criticized Loans ** | $ | 68,673 | $ | 68,080 | $ | 70,304 | ||||||
Classified Loans *** | $ | 35,715 | $ | 43,508 | $ | 48,248 | ||||||
* Amounts above exclude the government guaranteed portion, if any. The Company assigns internal risk ratings of Pass (Rating 2) for the government guaranteed portion.
** Criticized loans are defined as commercial and industrial and commercial real estate loans with internally assigned risk ratings of 6, 7, or 8, regardless of performance.
*** Classified loans are defined as commercial and industrial and commercial real estate loans with internally assigned risk ratings of 7 or 8, regardless of performance.
Criticized loans stayed relatively flat in criticized and classified loans over2014, which coincided with the past two years translated to a reductionmodest decrease in nonperforming loans during the year. Nonperforming loans/leases (consisting of $6.6nonaccrual loans/leases, accruing loans/leases past due 90 days or more, and accruing troubled debt restructurings) declined $383 thousand, or 2%, during 2014 and $4.9 million, or 21%19%, during 2012, and $9.1 million, or 22%, during 2011.2013. Furthermore, nonperforming loans/leases have declined $22.4$27.7 million or 47%, from their peak at September 30, 2010. See the table in the following section for further detail on nonperforming loans/leases and nonperforming assets. As a direct result, the level of allowance as a percentage of gross loans/leases has declined since 2009 and leveled off2009. Further, in 2012. Notably,accordance with generally accepted accounting principles for acquisition accounting, the acquired CNB loans were recorded at fair value; therefore, there was no allowance associated with CNB’s loans at acquisition. Additionally, the Company has strengthened its allowance as a percentage of nonperforming loans/leases. The following table summarizes the trend in allowance as a percentage of gross loans/leases and as a percentage of nonperforming loans/leases as of December 31, 2012, 2011,2014, 2013, and 2010.
As of December 31, | ||||||||||||
2014 | 2013 | 2012 | ||||||||||
Allowance / Gross Loans/Leases | 1.42 | % | 1.47 | % | 1.55 | % | ||||||
Allowance / Nonperforming Loans/Leases | 114.78 | % | 104.70 | % | 78.47 | % | ||||||
| As of December 31, | ||||||||||||
| 2012 | 2011 | 2010 | ||||||||||
| Allowance / Gross Loans/Leases | 1.55 | % | 1.56 | % | 1.74 | % | ||||||
| Allowance / Nonperforming Loans/Leases * | 78.47 | % | 58.70 | % | 49.49 | % | ||||||
The following table presents the allowance for estimated losses on loans/leases by type and the percentage of loan/lease type to total loans/leases.
| As of December 31, | ||||||||||||||||||||||||||||||||||||||||
| 2012 | 2011 | 2010 | 2009 | 2008 | ||||||||||||||||||||||||||||||||||||
| Amount | % | Amount | % | Amount | % | Amount | % | Amount | % | |||||||||||||||||||||||||||||||
| (dollars in thousands) | ||||||||||||||||||||||||||||||||||||||||
| Commercial and industrial loans | 4,532 | 31 | % | 4,878 | 29 | % | 7,549 | 31 | % | 6,239 | 36 | % | 8,260 | 36 | % | |||||||||||||||||||||||||
| Commercial real estate loans | 11,070 | 46 | % | 10,597 | 48 | % | 9,087 | 47 | % | 11,147 | 45 | % | 6,255 | 43 | % | |||||||||||||||||||||||||
| Direct financing leases | 1,990 | 8 | % | 1,339 | 8 | % | 1,531 | 7 | % | 1,681 | 7 | % | 1,402 | 7 | % | |||||||||||||||||||||||||
| Residential real estate loans | 1,070 | 9 | % | 705 | 8 | % | 748 | 7 | % | 737 | 6 | % | 690 | 7 | % | |||||||||||||||||||||||||
| Installment and other consumer loans | 1,263 | 6 | % | 1,270 | 7 | % | 1,450 | 8 | % | 2,407 | 6 | % | 1,195 | 7 | % | |||||||||||||||||||||||||
| Unallocated | - | NA | - | NA | - | NA | 294 | NA | 7 | NA | ||||||||||||||||||||||||||||||
| $ | 19,925 | 100 | % | $ | 18,789 | 100 | % | $ | 20,365 | 100 | % | $ | 22,505 | 100 | % | $ | 17,809 | 100 | % | |||||||||||||||||||||
As of December 31, | ||||||||||||||||||||||||||||||||||||||||
2014 | 2013 | 2012 | 2011 | 2010 | ||||||||||||||||||||||||||||||||||||
Amount | % | Amount | % | Amount | % | Amount | % | Amount | % | |||||||||||||||||||||||||||||||
(dollars in thousands) | ||||||||||||||||||||||||||||||||||||||||
Commercial and industrial loans | 8,750 | 32 | % | 5,649 | 30 | % | 4,532 | 31 | % | 4,878 | 29 | % | 7,549 | 31 | % | |||||||||||||||||||||||||
Commercial real estate loans | 8,353 | 43 | % | 10,705 | 46 | % | 11,070 | 46 | % | 10,597 | 48 | % | 9,087 | 47 | % | |||||||||||||||||||||||||
Direct financing leases | 3,443 | 10 | % | 2,517 | 9 | % | 1,990 | 8 | % | 1,339 | 8 | % | 1,531 | 7 | % | |||||||||||||||||||||||||
Residential real estate loans | 1,526 | 10 | % | 1,396 | 10 | % | 1,070 | 9 | % | 705 | 8 | % | 748 | 7 | % | |||||||||||||||||||||||||
Installment and other consumer loans | 1,002 | 5 | % | 1,181 | 5 | % | 1,263 | 6 | % | 1,270 | 7 | % | 1,450 | 8 | % | |||||||||||||||||||||||||
Unallocated | - | NA | - | NA | - | NA | - | NA | - | NA | ||||||||||||||||||||||||||||||
| $ | 23,074 | 100 | % | $ | 21,448 | 100 | % | $ | 19,925 | 100 | % | $ | 18,789 | 100 | % | $ | 20,365 | 100 | % | |||||||||||||||||||||
% - Represents the percentage of the certain type of loan/lease to total loans/leases
Although management believes that the allowance for estimated losses on loans/leases at December 31, 20122014 was at a level adequate to absorb probable losses on existing loans/leases, there can be no assurance that such losses will not exceed the estimated amounts or that the Company will not be required to make additional provisions for loan/lease losses in the future. Unpredictable future events could adversely affect cash flows for both commercial and individual borrowers, which could cause the Company to experience increases in problem assets, delinquencies and losses on loans/leases, and require additional increases in the provision. Asset quality is a priority for the Company and its subsidiaries. The ability to grow profitably is in part dependent upon the ability to maintain that quality. The Company continually focuses efforts at its subsidiary banks and its leasing company with the intention to improve the overall quality of the Company’s loan/lease portfolio.
See Note 34 to the consolidated financial statements for additional information on the Company’s allowance for estimated losses on loans/leases.
NONPERFORMING ASSETS. The table below presents the amounts of nonperforming assets.
| As of December 31, | ||||||||||||||||||||
| 2012 | 2011 | 2010 | 2009 | 2008 | ||||||||||||||||
| (dollars in thousands) | ||||||||||||||||||||
| Nonaccrual loans/leases (1) (2) | $ | 17,932 | $ | 18,995 | $ | 37,427 | $ | 28,742 | $ | 20,828 | ||||||||||
| Accruing loans/leases past due 90 days or more | 159 | 1,111 | 320 | 89 | 222 | |||||||||||||||
| Troubled debt restructures - accruing | 7,300 | 11,904 | 3,405 | 1,201 | - | |||||||||||||||
| Other real estate owned | 3,955 | 8,386 | 8,535 | 9,286 | 3,857 | |||||||||||||||
| Other repossessed assets | 212 | 109 | 366 | 1,071 | 450 | |||||||||||||||
| $ | 29,558 | $ | 40,505 | $ | 50,053 | $ | 40,389 | $ | 25,357 | |||||||||||
| Nonperforming loans/leases to total loans/leases | 1.97 | % | 2.67 | % | 3.51 | % | 2.41 | % | 1.73 | % | ||||||||||
| Nonperforming assets to total loans/leases plus reposessed property | 2.29 | % | 3.35 | % | 4.24 | % | 3.22 | % | 2.08 | % | ||||||||||
| Nonperforming assets to total assets | 1.41 | % | 2.06 | % | 2.73 | % | 2.27 | % | 1.58 | % | ||||||||||
| Texas ratio (3) | 18.68 | % | 25.58 | % | 33.57 | % | 27.47 | % | 23.69 | % | ||||||||||
As of December 31, | ||||||||||||||||||||
2014 | 2013 | 2012 | 2011 | 2010 | ||||||||||||||||
(dollars in thousands) | ||||||||||||||||||||
Nonaccrual loans/leases (1) (2) | $ | 18,588 | $ | 17,878 | $ | 17,932 | $ | 18,995 | $ | 37,427 | ||||||||||
Accruing loans/leases past due 90 days or more | 93 | 84 | 159 | 1,111 | 320 | |||||||||||||||
Troubled debt restructures - accruing | 1,421 | 2,523 | 7,300 | 11,904 | 3,405 | |||||||||||||||
Nonperforming loans/leases | 20,102 | 20,485 | 25,391 | 32,010 | 41,152 | |||||||||||||||
Other real estate owned | 12,768 | 9,729 | 3,955 | 8,386 | 8,535 | |||||||||||||||
Other repossessed assets | 155 | 346 | 212 | 109 | 366 | |||||||||||||||
Nonperforming assets | $ | 33,025 | $ | 30,560 | $ | 29,558 | $ | 40,505 | $ | 50,053 | ||||||||||
Nonperforming loans/leases to total loans/leases | 1.23 | % | 1.40 | % | 1.97 | % | 2.67 | % | 3.51 | % | ||||||||||
Nonperforming assets to total loans/leases plus reposessed property | 2.01 | % | 2.08 | % | 2.29 | % | 3.35 | % | 4.24 | % | ||||||||||
Nonperforming assets to total assets | 1.31 | % | 1.28 | % | 1.41 | % | 2.06 | % | 2.73 | % | ||||||||||
Texas ratio (3) | 20.26 | % | 18.43 | % | 18.68 | % | 25.58 | % | 33.57 | % | ||||||||||
(1) | Includes government guaranteed portions of loans, if applicable. |
(2) | Includes troubled debt restructurings of $5.0 million at December 31, 2014, $10.9 million at December 31, 2013, $5.7 million at December 31, 2012, $8.6 million at December 31, 2011, and $12.6 million at December 31, |
(3) | Texas Ratio = Nonperforming Assets (excluding Other Repossessed Assets) / Tangible Equity plus Allowance for Estimated Losses on Loans/Leases. Texas Ratio is a non-GAAP financial measure. Management included the ratio as |
Historically, the large majority of the Company’s nonperforming assets consisted of nonaccrual loans/leases and OREO. For nonaccrual loans/leases, management has thoroughly reviewed these loans/leases and has provided specific allowances as appropriate. OREO is carried at the lower of carrying amount or fair value less costs to sell.
The policy of the Company is to place a loan/lease on nonaccrual status if: (a) payment in full of interest or principal is not expected; or (b) principal or interest has been in default for a period of 90 days or more unless the obligation is both in the process of collection and well secured. A loan/lease is well secured if it is secured by collateral with sufficient market value to repay principal and all accrued interest. A debt is in the process of collection if collection of the debt is proceeding in due course either through legal action, including judgment enforcement procedures, or in appropriate circumstances, through collection efforts not involving legal action which are reasonably expected to result in repayment of the debt or in its restoration to current status.
In 2014, the Company’s nonperforming assets have declined significantly ($10.9increased $2.5 million, or 27%8%, during 2012, and $9.5 million, or 19%, during 2011). A combination of improved performance and charge-offs contributed to the general decrease throughout 2011 and 2012. In addition, there was a significant shift in mix as accruingwhile nonaccrual loans increased $710 thousand. Accruing troubled debt restructurings (“TDRs”) grew and nonaccrual loans/leases and OREO fell during the two-year period. This shift in mix is favorable$1.1 million, as the accruing TDRs are performingresult of improved performance. The growth in OREO was primarily the result of foreclosure on the restructured termscollateral securing one large nonperforming relationship that was shared between each of the three charters. Management continues to proactively manage its OREO portfolio in an effort to sell timely at minimal loss. In 2013, the Company’s nonperforming assets increased $1.0 million, or 3%. Most of this increase was due to the addition of CNB’s nonperforming assets, which totaled $2.1 million at December 31, 2013. Excluding the impact of CNB, the Company’s nonperforming assets at its legacy charters experienced a decline of $1.0 million, or 4%.
The Company’s lending/leasing practices remain unchanged and accruing interest income.
DEPOSITS. Deposits grew $168.7$32.7 million, or 14%2%, during 2012, and2014. For 2013, deposits grew $90.6$272.9 million, or 8%20%, during 2011.mostly the result of the CNB acquisition. The table below presents the composition of the Company’s deposit portfolio.
| As of December 31, | ||||||||||||||||||||||||
| 2012 | 2011 | 2010 | ||||||||||||||||||||||
| Amount | % | Amount | % | Amount | % | |||||||||||||||||||
| (dollars in thousands) | ||||||||||||||||||||||||
| Noninterest bearing demand deposits | $ | 450,660 | 33 | % | $ | 357,184 | 30 | % | $ | 276,827 | 25 | % | ||||||||||||
| Interest bearing demand deposits | 588,912 | 43 | % | 510,788 | 42 | % | 460,624 | 41 | % | |||||||||||||||
| Time deposits | 289,222 | 21 | % | 292,575 | 24 | % | 312,010 | 28 | % | |||||||||||||||
| Brokered time deposits | 45,320 | 3 | % | 44,911 | 4 | % | 65,355 | 6 | % | |||||||||||||||
| $ | 1,374,114 | 100 | % | $ | 1,205,458 | 100 | % | $ | 1,114,816 | 100 | % | |||||||||||||
As of December 31, | ||||||||||||||||||||||||
2014 | 2013 | 2012 | ||||||||||||||||||||||
Amount | % | Amount | % | Amount | % | |||||||||||||||||||
(dollars in thousands) | ||||||||||||||||||||||||
Noninterest bearing demand deposits | $ | 511,992 | 31 | % | $ | 542,566 | 33 | % | $ | 450,660 | 33 | % | ||||||||||||
Interest bearing demand deposits | 792,052 | 47 | % | 715,643 | 43 | % | 588,912 | 43 | % | |||||||||||||||
Time deposits | 306,364 | 18 | % | 326,852 | 20 | % | 289,222 | 21 | % | |||||||||||||||
Brokered time deposits | 69,260 | 4 | % | 61,930 | 4 | % | 45,320 | 3 | % | |||||||||||||||
| $ | 1,679,668 | 100 | % | $ | 1,646,991 | 100 | % | $ | 1,374,114 | 100 | % | |||||||||||||
The Company has been successful in shifting thegrowing its noninterest bearing deposit mixportfolio over the past twoseveral years, with an increasegrowing average balances 11% in noninterest bearing deposits2014 and declines26% in brokered2013. Year-end balances can fluctuate a great deal due to large customer and retail time deposits. Specifically, QCBT continues tocorrespondent bank activity. Trends have success growing its correspondent banking business as noninterest bearing correspondent deposits more than doubled growing $123.2 million from $80.8 million at December 31, 2010 to $204.0 million at December 31, 2012. These increases and the Company’s overall strong liquidity position have allowed the Company to reduce the level of brokered and other time deposits which drives the reduction in the Company’s average cost of deposits.shown that this fluctuation is temporary. Management will continue to focus on growing its noninterest bearing deposit portfolio, including its correspondent banking business at QCBT, as well as shifting the mix from brokered and other higher cost deposits to lower cost core deposits. With the significant success achieved by QCBT in growing its correspondent banking business, QCBT has developed procedures to proactively monitor this industry concentration of deposits and loans. Other deposit-related industry concentrations and large accounts are monitored by the internal asset liability management committee. See discussion regarding policy limits on bank stock loans in the Lending/Leasing section under Item 1 – Business in Part I of this Form 10-K.
SHORT-TERM BORROWINGS. The subsidiary banks offer overnight repurchase agreements to some of their major customers. Also, the subsidiary banks purchase federal funds for short-term funding needs from the Federal Reserve Bank, or from their correspondent banks. The table below presents the composition of the Company’s short-term borrowings.
| As of December 31, | ||||||||||||
| 2012 | 2011 | 2010 | ||||||||||
| (dollars in thousands) | ||||||||||||
| Overnight repurchase agreements with customers | $ | 104,943 | $ | 110,236 | $ | 118,904 | ||||||
| Federal funds purchased | 66,140 | 103,300 | 22,250 | |||||||||
| $ | 171,083 | $ | 213,536 | $ | 141,154 | |||||||
As of December 31, | ||||||||||||
2014 | 2013 | 2012 | ||||||||||
(dollars in thousands) | ||||||||||||
Overnight repurchase agreements with customers | $ | 137,252 | $ | 98,823 | $ | 104,943 | ||||||
Federal funds purchased | 131,100 | 50,470 | 66,140 | |||||||||
| $ | 268,352 | $ | 149,293 | $ | 171,083 | |||||||
While overnight repurchase agreements with customers increased in 2014, the Company intends to shift some of these customer funds to deposit products which do not require collateral, helping to free up additional liquidity for the Company. Regarding the Company’s federal funds purchased, from December 31, 2010 to December 31, 2011 was temporary andthis fluctuates based on the result of short-term fluctuations in noninterest bearing correspondent deposit balances for several customers over the endfunding needs of the year.
FHLB ADVANCESADVANCES AND OTHER BORROWINGS.As a result of their memberships in the FHLB of Des Moines and Chicago, the subsidiary banks have the ability to borrow funds for short-term or long-term purposes under a variety of programs. The subsidiary banks utilize FHLB advances for loan matching as a hedge against the possibility of rising interest rates or when these advances provide a less costly source of funds than customer deposits. For 2014, FHLB advances declined $34.0decreased $27.9 million, or 12%, as QCBT had $20.4 million of advances mature without replacementduring the year. For 2013, FHLB advances increased $29.0 million, or 14%, during 2011 as the result of a combination of prepayment ($15.0 million) and maturities ($19.0 million). For 2012, FHLB advances declined slightly; however, the decline would have been larger if RB&T had notand CRBT borrowed aovernight and other short-term 14-day advance in the amount of $9.0 million at the end of 2012advances for short-term funding needs because the cost of the FHLB advance was less than federal funds purchased.
| As of December 31, | ||||||||||||
| 2012 | 2011 | 2010 | ||||||||||
| (dollars in thousands) | ||||||||||||
| Amount Due | $ | 202,350 | $ | 204,750 | $ | 238,750 | ||||||
| Weighted Average Interest Rate at Year-End | 3.45 | % | 3.67 | % | 3.84 | % | ||||||
| As of December 31, | ||||||||||||
2014 | 2013 | 2012 | ||||||||||
(dollars in thousands) | ||||||||||||
Amount Due | $ | 203,500 | $ | 231,350 | $ | 202,350 | ||||||
Weighted Average Interest Rate at Year-End | 2.83 | % | 2.86 | % | 3.45 | % | ||||||
See Note 79 to the consolidated financial statements for additional information regarding FHLB advances.
Other borrowings consist largely of wholesale structured repurchase agreements which the subsidiary banks utilize as an alternative funding source to FHLB advances and customer deposits. The table below presents the composition of the Company’s other borrowings.
| As of December 31, | ||||||||||||
2014 | 2013 | 2012 | ||||||||||
(dollars in thousands) | ||||||||||||
Wholesale structured repurchase agreements | $ | 130,000 | $ | 130,000 | $ | 130,000 | ||||||
Term note | 17,625 | 9,800 | - | |||||||||
364-day revolving note | - | - | 5,600 | |||||||||
Series A subordinated notes | 2,657 | 2,648 | 2,640 | |||||||||
| $ | 150,282 | $ | 142,448 | $ | 138,240 | |||||||
| As of December 31, | ||||||||||||
| 2012 | 2011 | 2010 | ||||||||||
| (dollars in thousands) | ||||||||||||
| Wholesale structured repurchase agreements | $ | 130,000 | $ | 130,000 | $ | 135,000 | ||||||
| 364-day revolving note | 5,600 | 3,600 | 2,500 | |||||||||
| Series A subordinated notes | 2,640 | 2,632 | 2,624 | |||||||||
| Secured borrowings - loan participations sold | - | - | 9,946 | |||||||||
| $ | 138,240 | $ | 136,232 | $ | 150,070 | |||||||
In June of 2014, the 364-day revolving noteCompany restructured its existing term debt and borrowed an additional $10.0 million of $2.0 million wasterm debt to assist with the result of funding needed to execute on the partialfinal redemption of the Series F Preferred Stock previously issued to the Treasury under the SBLF program. For a detailed discussion of this partial redemption, see below.
Additional information regarding other borrowings is described in Note 810 to the consolidated financial statements.
It is management’s intention to continue to reduce the reliance on wholesale funding, including FHLB advances, structured repos, and brokered time deposits. Replacement of this funding with core deposits helps to reduce interest expense as the wholesale funding tends to be higher funding cost. Management continually evaluates the potential opportunities to prepay or modify (essentially refinance at a net lower interest rate while extending the maturity) these liabilities, as the Company has successfully executed in the past. The Company may choose to utilize advances to supplement funding needs, as this is a way for the company to effectively and efficiently manage interest rate risk. The table below presents the maturity schedule including weighted average cost for the Company’s combined wholesale funding portfolio.
As of December 31, | ||||||||||||||||
2014 | 2013 | |||||||||||||||
Weighted | Weighted | |||||||||||||||
Average | Average | |||||||||||||||
Interest Rate | Interest Rate | |||||||||||||||
Maturity: | Amount Due | at Quarter-End | Amount Due | at Year-End | ||||||||||||
Year ending December 31: | (dollar amounts in thousands) | |||||||||||||||
2014 | $ | - | 0.00 | % | $ | 110,521 | 1.24 | % | ||||||||
2015 | 103,818 | 0.92 | 41,000 | 2.00 | ||||||||||||
2016 | 50,642 | 3.51 | 48,642 | 3.63 | ||||||||||||
2017 | 53,965 | 2.96 | 43,075 | 3.43 | ||||||||||||
2018 | 60,042 | 3.41 | 58,042 | 3.47 | ||||||||||||
2019 | 83,152 | 3.59 | 77,000 | 3.72 | ||||||||||||
Thereafter | 51,141 | 2.64 | 45,000 | 2.66 | ||||||||||||
Total Wholesale Funding | $ | 402,760 | 2.66 | % | $ | 423,280 | 2.72 | % | ||||||||
| As of December 31, | ||||||||||||||||
| 2012 | 2011 | |||||||||||||||
| Maturity: | Amount Due | Weighted Average | Amount Due | Weighted Average | ||||||||||||
| (dollar amounts in thousands) | ||||||||||||||||
| Year ending December 31: | ||||||||||||||||
| 2012 | $ | - | 0.00 | % | $ | 34,601 | 2.93 | % | ||||||||
| 2013 | 34,508 | 1.29 | 18,000 | 2.24 | ||||||||||||
| 2014 | 39,170 | 2.88 | 39,170 | 2.87 | ||||||||||||
| 2015 | 66,000 | 2.59 | 67,000 | 2.97 | ||||||||||||
| 2016 | 85,992 | 3.72 | 82,890 | 3.81 | ||||||||||||
| 2017 | 46,000 | 3.70 | 42,000 | 3.91 | ||||||||||||
| Thereafter | 106,000 | 3.66 | 96,000 | 3.75 | ||||||||||||
| Total Wholesale Funding | $ | 377,670 | 3.20 | $ | 379,661 | 3.41 | ||||||||||
STOCKHOLDERS’STOCKHOLDERS’ EQUITY.The table below presents the composition of the Company’s stockholders’ equity, including the common and preferred equity components.
| As of December 31, | ||||||||||||||||||||||||
| 2012 | 2011 | 2010 | ||||||||||||||||||||||
| Amount | % | Amount | % | Amount | % | |||||||||||||||||||
| (dollars in thousands) | ||||||||||||||||||||||||
| Common stock | $ | 5,039 | $ | 4,879 | $ | 4,732 | ||||||||||||||||||
| Additional paid in capital - common | 25,804 | 26,381 | 24,328 | |||||||||||||||||||||
| Retained earnings | 53,327 | 44,586 | 40,551 | |||||||||||||||||||||
| Accumulated other comprehensive income | 4,707 | 4,755 | 704 | |||||||||||||||||||||
| Noncontrolling interests | - | 2,052 | 1,648 | |||||||||||||||||||||
| Less: Treasury stock | (1,606 | ) | (1,606 | ) | (1,606 | ) | ||||||||||||||||||
| Total common stockholders' equity | 87,271 | 62 | % | 81,047 | 56 | % | 70,357 | 53 | % | |||||||||||||||
| Preferred stock | 55 | 65 | 63 | |||||||||||||||||||||
| Additional paid in capital - preferred | 53,108 | 63,321 | 62,151 | |||||||||||||||||||||
| Total preferred stockholders' equity | 53,163 | 38 | % | 63,386 | 44 | % | 62,214 | 47 | % | |||||||||||||||
| Total stockholders' equity | $ | 140,434 | 100 | % | $ | 144,433 | 100 | % | $ | 132,571 | 100 | % | ||||||||||||
| Tangible common equity* / total tangible assets | 4.02 | % | 3.85 | % | 3.56 | % | ||||||||||||||||||
As of December 31, | ||||||||||||||||||||||||
2014 | 2013 | 2012 | ||||||||||||||||||||||
Amount | % | Amount | % | Amount | % | |||||||||||||||||||
(dollars in thousands) | ||||||||||||||||||||||||
Common stock | $ | 8,074 | $ | 8,006 | $ | 5,039 | ||||||||||||||||||
Additional paid in capital - common | 61,669 | 60,360 | 25,804 | |||||||||||||||||||||
Retained earnings | 77,877 | 64,637 | 53,327 | |||||||||||||||||||||
Accumulated other comprehensive income (loss) | (1,935 | ) | (13,644 | ) | 4,707 | |||||||||||||||||||
Less: Treasury stock | (1,606 | ) | (1,606 | ) | (1,606 | ) | ||||||||||||||||||
Total common stockholders' equity | 144,079 | 100 | % | 117,753 | 80 | % | 87,271 | 62 | % | |||||||||||||||
Preferred stock | - | 30 | 55 | |||||||||||||||||||||
Additional paid in capital - preferred | - | 29,794 | 53,108 | |||||||||||||||||||||
Total preferred stockholders' equity | - | 0 | % | 29,824 | 20 | % | 53,163 | 38 | % | |||||||||||||||
Total stockholders' equity | $ | 144,079 | 100 | % | $ | 147,577 | 100 | % | $ | 140,434 | 100 | % | ||||||||||||
Tangible common equity* / total tangible assets | 5.52 | % | 4.71 | % | 4.02 | % | ||||||||||||||||||
*Tangible common equity is defined as total common stockholders’ equity excluding equity of noncontrolling interests and excluding goodwill and other intangible assets. This ratio is a non-GAAP financial measure. Management included this ratio as it is considered by many investors and analysts to be a metric with which to analyze and evaluate the equity composition. Other companies may calculate this ratio differently.
As of December 31, 2012.
| Date Issued | Aggregate Purchase Price | Stated Dividend Rate | Annual Dividend | ||||||||||
| Series E Non-Cumulative Convertible Perpetual Preferred Stock | June 2010 | $ | 25,000,000 | 7.00 | % | $ | 1,750,000 | ||||||
| Series F Non-Cumulative Perpetual Preferred Stock | September 2011 | 29,867,000 | 5.00 | % | 1,493,350 | ||||||||
| $ | 54,867,000 | $ | 3,243,350 | ||||||||||
The Series E Noncumulative Convertible Perpetual Preferred Stock (the “Series E Preferred Stock”) is perpetually convertible by the holderwas converted into shares of the Company’s common stock at a per share conversion price of $12.15, subjecton December 23, 2013. Pursuant to anti-dilution adjustments upon the occurrence of certain events. In addition, the Company can exercise a conversion option on or after the third anniversaryterms of the issue date (June 30, 2013) at the same $12.15 per share conversion price ifSeries E Preferred Stock, because the Company’s common stock price equals or exceedsexceeded $17.22 for at least 20 trading days in a period of 30 consecutive trading days.
On June 29, 2012, the Company redeemed 10,223 shares of Series F Preferred Stock from the Treasury for an aggregate redemption amount of $10.2 million plus unpaid dividends to the date of redemption of $125 thousand. The remainingOn March 31, 2014, the Company redeemed 15,000 shares of Series F Preferred Stock may be redeemed at any time atfrom the optionTreasury for an aggregate redemption amount of $15.0 million plus unpaid dividends to the date of redemption of $338 thousand. On June 30, 2014, the Company subject to approvalredeemed 14,867 shares of Series F Preferred Stock from the Company’s primary federal banking regulator. All redemptions must be in amounts equalTreasury for an aggregate redemption amount of $14.8 million plus unpaid dividends to the lesserdate of at least 25% of the number of originally issued shares, or 100% of the then-outstanding shares.
The following table presents the rollforward of stockholders’ equity for the years ended December 31, 2014 and 2013, respectively.
For the Years Ended December 31, | ||||||||
2014 | 2013 | |||||||
(dollars in thousands) | ||||||||
Beginning balance | $ | 147,577 | $ | 140,434 | ||||
Net income | 14,953 | 14,938 | ||||||
Other comprehensive income (loss), net of tax | 11,709 | (18,351 | ) | |||||
Preferred and common cash dividends declared | (1,713 | ) | (3,627 | ) | ||||
Issuance of 834,715 shares of common stock for acquisition of CNB, net | - | 13,017 | ||||||
Redemption of 29,867 shares of Series F Preferred Stock | (29,824 | ) | - | |||||
Other * | 1,377 | 1,166 | ||||||
Ending balance | $ | 144,079 | $ | 147,577 | ||||
*Includes mostly common stock issued for options exercised and the employee stock purchase plans, as well as stock-based compensation.
The available for sale portion of the securities portfolio experienced a significant decline in fair value during 2013 as the result of the increase in longer term interest rates. The fair value then rebounded in 2014 as the result of the decrease in longer term interest rates. See previous discussion in the Investment Securities section.
See Note 212 to the consolidated financial statements for discussion on the acquisition of CNB and the noncontrolling interest in m2 which comprises the large majority of the total purchase of $4.7 million described above.
LIQUIDITY AND CAPITAL RESOURCES
Liquidity measures the ability of the Company to meet maturing obligations and its existing commitments, to withstand fluctuations in deposit levels, to fund its operations, and to provide for customers’ credit needs. The Company monitors liquidity risk through contingency planning stress testing on a regular basis. The Company seeks to avoid over concentration of funding sources and to establish and maintain contingent funding facilities that can be drawn upon if normal funding sources become unavailable. One source of liquidity is cash and short-term assets, such as interest-bearing deposits in other banks and federal funds sold, which averaged $118.8 million during 2014, $102.8 million during 2013, and $98.6 million during 2012, $128.0 million during 2011, and $129.0 million during 2010.2012. The Company’s on balance sheet liquidity position can fluctuate based on short-term activity in deposits and loans. During 2012, the Company invested some of its excess liquidity as its overall liquidity position (both on and off balance sheet liquidity) had strengthened.
The subsidiary banks have a variety of sources of short-term liquidity available to them, including federal funds purchased from correspondent banks, FHLB advances, structured repos, brokered time deposits, lines of credit, borrowing at the Federal Reserve Discount Window, sales of securities available for sale, and loan/lease participations or sales. The Company also generates liquidity from the regular principal payments and prepayments made on its loan/lease portfolio, and on the regular monthly payments on its residential mortgage-backed securities portfolio. At December 31, 2012,2014, the subsidiary banks had 3135 lines of credit totaling $311.7$351.6 million, of which $52.7$17.1 million was secured and $259.0$334.5 million was unsecured. At December 31, 2012, $271.72014, $237.6 million was available as $40.0$114.0 million was utilized for short-term borrowing needs at QCBT.QCBT and RB&T. At December 31, 2011,2013, the subsidiary banks had 2233 lines of credit totaling $225.4$351.3 million, of which $72.9$26.8 million was secured and $152.5$324.5 million was unsecured. At December 31, 2011, $159.42013, $315.3 million was available as $66.0$36.0 million was utilized as a result of thefor short-term fluctuations in noninterest bearing correspondent deposit balances for several customers over the end of the year.borrowing needs at QCBT. The Company has emphasized growing the number and amount of lines of credit in an effort to strengthen this contingent source of liquidity. Additionally, the Company has a single $20.0maintains its $10.0 million secured revolving credit note with a variable interest rate and a maturity of March 29, 2013. As ofJune 24, 2015. At December 31, 2012,2014, the Company had $14.4 million available asnot borrowed on this revolving credit note and had the note carried an outstanding balance of $5.6 million.full amount available. See Note 810 to the consolidated financial statements for additional information regarding the lines of credit, term note, and revolving credit note.
Investing activities used cash of $129.9 million during 2014 compared to $164.6 million during 2013, and $132.8 million during 2012 compared to $137.3 million for 2011, and $59.5 million for 2010.2012. Proceeds from calls, maturities, paydowns, and sales of securities were $137.3 million for 2014 compared to $230.8 million for 2013, and $433.5 million for 2012 compared to $486.3 million for 2011, and $326.1 million for 2010.2012. Purchases of securities used cash of $76.3 million for 2014 compared to $313.0 million for 2013, and $474.5 million for 2012 compared to $622.2 million for 2011, and $383.0 million for 2010.2012. The net increase in loans/leases used cash of $180.3 million for 2014 compared to $55.3 million for 2013, and $91.3 million for 2012 compared to $56.12012. The Company paid cash of $30.4 million for 2011. For 2010, the Company’s net decreaseon sales of certain branches of CNB in loans/leases was $63.4 million.
Financing activities provided cash of $110.5$100.6 million for 20122014 compared to $111.8$112.9 million for 2011,2013, and $47.7$110.6 million for 2010.2012. Net increases in deposits totaled $32.7 million, $108.9 million, and $168.7 million $90.6 million,for 2014, 2013, and $25.5 million for 2012, 2011, and 2010, respectively.
Total cash provided by operating activities was $25.6 million for 2014 compared to $32.0 million for 2013, and $30.7 million for 2012 compared to $36.6 million for 2011, and $17.9 million for 2010.
Throughout its history, the Company has secured additional capital through various resources, including the issuance of trust preferred securities and the issuance of preferred stock. See Notes 911 and 1012 to the consolidated financial statements for information on the issuance of trust preferred securities and the issuance of preferred stock, respectively.
On June 30, 2014, the Company filed a universal shelf registration statement on Form S-3 with the Securities and Exchange Commission (“SEC”). This registration statement, declared effective by the SEC on July 14, 2014, will allow the Company to issue various types of securities, from time to time, up to an aggregate amount of $75.0 million. The specific terms and prices of the securities will be determined at the time of any future offering and described in a separate prospectus supplement, which would be filed with the SEC at the time of the particular offering, if any.
As of December 31, 20122014 and 2011,2013, the subsidiary banks remained “well-capitalized” in accordance with regulatory capital requirements administered by the federal banking authorities. See Note 1416 to the consolidated financial statements for detail of the capital amounts and ratios for the Company and subsidiary banks.
In June 2012,July 2013, the U.S. federal bankbanking authorities approved the implementation of the Basel III regulatory agenciescapital reforms and issued joint proposed rules that would implement an international capital accord called “Basel III,” developedeffecting certain changes required by the Dodd-Frank Act. The Basel Committee on Banking Supervision, a committee of central banks and bank supervisors. The proposed rules would applyIII Rules are applicable to all depository organizations in the United StatesU.S. banks that are subject to minimum capital requirements, as well as to bank and savings and loan holding companies other than “small bank holding companies” (generally bank holding companies with consolidated assets of less than $1 billion). The Basel III Rules not only increased most of their parent companies and would increasethe required minimum regulatory capital ratios, addbut they introduced a new minimum common equityCommon Equity Tier 1 Capital ratio addand the concept of a new capital conservation buffer, include unrealized gainsbuffer. The Basel III Rules also expanded the definition of capital as in effect currently by establishing criteria that instruments must meet to be considered Additional Tier 1 Capital (Tier 1 Capital in addition to Common Equity) and losses on available-for-sale securitiesTier 2 Capital. A number of instruments that now qualify as Tier 1 Capital will not qualify, or their qualifications will change. The Basel III Rules also permit smaller banking organizations to retain, through a one-time election, the existing treatment for accumulated other comprehensive income (“AOCI”), which currently does not affect regulatory capital. The Company intends to make this election in the first quarter of 2015. The Basel III Rules have maintained the general structure of the current prompt corrective action framework, while incorporating the increased requirements. The prompt corrective action guidelines were also revised to add the Common Equity Tier 1 Capital ratio. In order to be a “well-capitalized” depository institution under the new regime, a bank and would change the risk-weightingsholding company must maintain a Common Equity Tier 1 Capital ratio of certain assets for the purposes6.5% or more; a Tier 1 Capital ratio of calculating certain capital ratios.8% or more; a Total Capital ratio of 10% or more; and a leverage ratio of 5% or more. The proposed changes, if implemented, would be phased in from 2013 through 2019. The comment period with respectCompany became subject to the proposed rules expired on October 22, 2012. Various banking associations, industry groups, individual financial institutions (including the Company) provided comments on the proposed rules to the regulators. On November 9, 2012, the federal bank regulatory agencies announced that the implementation of the proposed rules undernew Basel III inRules on January 1, 2015. Management believes that its current capital structure and the United States was indefinitely delayed. It is unclear when the final rulesexecution of its existing capital plan will be adopted and what changes, if any, may be madesufficient to meet the proposed rules. Management continues to assessrevised regulatory capital ratios as required by the effect of the proposed rules on the Company and the subsidiary banks’ capital positions and will monitor development regarding the proposed rules.
COMMITMENTS, CONTINGENCIES, CONTRACTUAL OBLIGATIONS, AND OFF-BALANCE SHEET ARRANGEMENTS
In the normal course of business, the subsidiary banks make various commitments and incur certain contingent liabilities that are not presented in the accompanying consolidated financial statements. The commitments and contingent liabilities include various guarantees, commitments to extend credit, and standby letters of credit.
Commitments to extend credit are agreements to lend to a customer as long as there is no violation of any condition established in the contract. Commitments generally have fixed expiration dates or other termination clauses and may require payment of a fee. Since many of the commitments are expected to expire without being drawn upon, the total commitment amounts do not necessarily represent future cash requirements. The subsidiary banks evaluate each customer's creditworthiness on a case-by-case basis. The amount of collateral obtained, if deemed necessary by the banks upon extension of credit, is based upon management's credit evaluation of the counter-party. Collateral held varies but may include accounts receivable, marketable securities, inventory, property, plant and equipment, and income-producing commercial properties.
Standby letters of credit are conditional commitments issued by the subsidiary banks to guarantee the performance of a customer to a third party. Those guarantees are primarily issued to support public and private borrowing arrangements and, generally, have terms of one year, or less. The credit risk involved in issuing letters of credit is essentially the same as that involved in extending loan facilities to customers. The banks hold collateral, as described above, supporting those commitments if deemed necessary. In the event the customer does not perform in accordance with the terms of the agreement with the third party, the banks would be required to fund the commitments. The maximum potential amount of future payments the banks could be required to make is represented by the contractual amount. If the commitment is funded, the banks would be entitled to seek recovery from the customer. At December 31, 20122014 and 2011,2013, no amounts had been recorded as liabilities for the banks' potential obligations under these guarantees.
As of December 31, 20122014 and 2011,2013, commitments to extend credit aggregated $430.1$499.3 million and $393.6$432.6 million, respectively. As of December 31, 20122014 and 2011,2013, standby letters of credit aggregated $15.2$12.9 million and $8.3$9.7 million, respectively. Management does not expect that all of these commitments will be funded.
Additional information regarding commitments, contingencies, and off-balance sheet arrangements is described in Note 1618 to the consolidated financial statements.
The Company has various financial obligations, including contractual obligations and commitments, which may require future cash payments. The following table presents, as of December 31, 2012,2014, significant fixed and determinable contractual obligations to third parties by payment date. Further discussion of the nature of each obligation is included in the referenced note to the consolidated financial statements.
| Financial | Payments Due by Period | |||||||||||||||||||||||
| Description | Statement Note Reference | Total | One Year or Less | 2 - 3 Years | 4 - 5 Years | After 5 Years | ||||||||||||||||||
| (dollars in thousands) | ||||||||||||||||||||||||
| Deposits without a stated maturity | N/A | $ | 1,039,572 | $ | 1,039,572 | $ | - | $ | - | $ | - | |||||||||||||
| Certificates of deposit | 5 | 334,542 | 225,152 | 90,917 | 18,473 | - | ||||||||||||||||||
| Short-term borrowings | 6 | 171,083 | 171,083 | - | - | - | ||||||||||||||||||
| FHLB advances | 7 | 202,350 | 24,000 | 43,850 | 93,500 | 41,000 | ||||||||||||||||||
| Other borrowings | 8 | 138,240 | 5,600 | 35,000 | 30,000 | 67,640 | ||||||||||||||||||
| Junior subordinated debentures | 9 | 36,085 | - | - | - | 36,085 | ||||||||||||||||||
| Rental commitments | 4 | 1,752 | 373 | 592 | 448 | 339 | ||||||||||||||||||
| Operating contracts | N/A | 6,158 | 4,173 | 1,985 | - | - | ||||||||||||||||||
| Total contractual cash obligations | $ | 1,929,782 | $ | 1,469,953 | $ | 172,344 | $ | 142,421 | $ | 145,064 | ||||||||||||||
Financial | Payments Due by Period | |||||||||||||||||||||||
Statement | One Year | |||||||||||||||||||||||
Description | Note Reference | Total | or Less | 2 - 3 Years | 4 - 5 Years | After 5 Years | ||||||||||||||||||
(dollars in thousands) | ||||||||||||||||||||||||
Deposits without a stated maturity |
| N/A | $ | 1,304,044 | $ | 1,304,044 | $ | - | $ | - | $ | - | ||||||||||||
Certificates of deposit | 7 | 375,624 | 294,616 | 57,332 | 17,535 | 6,141 | ||||||||||||||||||
Short-term borrowings | 8 | 268,352 | 268,352 | - | - | - | ||||||||||||||||||
FHLB advances | 9 | 203,500 | 63,000 | 77,500 | 63,000 | - | ||||||||||||||||||
Other borrowings | 10 | 150,282 | 9,700 | 19,400 | 76,182 | 45,000 | ||||||||||||||||||
Junior subordinated debentures | 11 | 40,424 | - | - | - | 40,424 | ||||||||||||||||||
Rental commitments | 5 | 1,072 | 234 | 481 | 357 | - | ||||||||||||||||||
Operating contracts |
| N/A | 14,220 | 4,952 | 4,644 | 4,624 | - | |||||||||||||||||
Total contractual cash obligations | $ | 2,357,518 | $ | 1,944,898 | $ | 159,357 | $ | 161,698 | $ | 91,565 | ||||||||||||||
Purchase obligations represent obligations under agreements to purchase goods or services that are enforceable and legally binding on the Company and that specify all significant terms, including: (1) fixed or minimum quantities to be purchased; (2) fixed, minimum or variable price provisions; and (3) the approximate timing of the transaction. The Company had no purchase obligations at December 31, 2012.2014. The Company's operating contract obligations represent short and long-term lease payments for data processing equipment and services, software, and other equipment and professional services.
IMPACT OF INFLATION AND CHANGING PRICES
The consolidated financial statements of the Company and the accompanying notes have been prepared in accordance with U.S. generally accepted accounting principles, which require the measurement of financial position and operating results in terms of historical dollar amounts without considering the changes in the relative purchasing power of money over time due to inflation. The impact of inflation is reflected in the increased cost of the Company’s operations. Unlike industrial companies, nearly all of the assets and liabilities of the Company are monetary in nature. As a result, interest rates have a greater impact on the Company’s performance than do the effects of general levels of inflation. Interest rates do not necessarily move in the same direction or to the same extent as the price of goods and services.
IMPACT OF NEW ACCOUNTING STANDARDS
In May 2011,January 2014, the Financial Accounting Standards Board (“FASB”) issued Accounting Standards Update (“ASU”) 2014-04,Reclassification of Residential Real Estate Collateralized Consumer Mortgage Loans upon Foreclosure. The objective of ASU 2011-04, Fair Value Measurement (Topic 820) - Amendments2014-04 is to Achieve Common Fair Value Measurements and Disclosure Requirementsreduce diversity by clarifying when an in U.S. GAAP and IFRS. ASU 2011-04 amended Topic 820, Fair Value Measurements and Disclosures,substance repossession or foreclosure occurs, that is, when a creditor should be considered to convergehave received physical possession of residential real estate property collateralizing a consumer mortgage loan such that the fair value measurement guidance in U.S. generally accepted accounting principles and International Financial Reporting Standards. ASU 2011-04 clarified the application of existing fair value measurement requirements, changed certain principles in Topic 820 and required additional fair value disclosures. ASU 2011-04 was effective for annual periods beginning after December 15, 2011, and did not have a significant impact on the Company’s consolidated financial statements. See Note 19 to the consolidated financial statements.
In February 2013,May 2014, FASB issued ASU 2013-02, Comprehensive Income (Topic 220) – Reporting2014-09,Revenue from Contracts with Customers. ASU 2014-09 implements a common revenue standard that clarifies the principles for recognizing revenue. The core principle of Amounts Reclassified out of Accumulated Other Comprehensive Income. ASU 2013-02 supersedes and replaces the presentation requirements for reclassifications out of accumulated other comprehensive income (“AOCI”) in ASUs 2011-05 and 2011-12, which were adopted by the Company during the current year. The amendments require2014-09 is that an entity should recognize revenue to provide information aboutdepict the amounts reclassified outtransfer of AOCI by component. In addition,promised goods or services to customers in an amount that reflects the consideration to which the entity expects to be entitled in exchange for those goods or services. To achieve that core principle, an entity is required to present, either onshould apply the face offollowing steps: (i) identify the statement where net income is presented orcontract(s) with a customer, (ii) identify the performance obligations in the notes, significant amounts reclassified out of AOCI bycontract, (iii) determine the respective line items of net income iftransaction price, (iv) allocate the amount reclassified is requiredtransaction price to be reclassified in its entiretythe performance obligations in the same reporting period. For other amounts that are not required to be reclassified in their entirety to net income, ancontract and (v) recognize revenue when (or as) the entity satisfies a performance obligation. ASU 2014-09 is required to cross-reference to other disclosures required. Adoptioneffective on January 1, 2017 and is not expected to have a significant impact on the Company’s consolidated financial statements.
In June 2014, FASB issued ASU 2014-11,Transfers and Servicing. ASU 2014-11 requires that repurchase-to-maturity transactions be accounted for as secured borrowings, consistent with the accounting for other repurchase agreements. In addition, ASU 2014-11 requires separate accounting for repurchase financings, which entail the transfer of a financial asset executed contemporaneously with a repurchase agreement with the same counterparty. The standard requires entities to disclose certain information about transfers accounted for as sales in transactions that are economically similar to repurchase agreements. In addition, ASU 2014-11 requires disclosures related to collateral and remaining tenor and of the potential risks associated with repurchase agreements, securities lending transactions and repurchase-to-maturity transactions. ASU 2014-11 is effective on January 1, 2015 and is not expected to have a significant impact on the Company’s consolidated financial statements.
In August 2014, FASB issued ASU 2014-14,Classification of Certain Government-Guaranteed Mortgage Loans Upon Foreclosure. ASU 2014-14 requires creditors to reclassify loans that are within the scope of the ASU to “other receivables” upon foreclosure, rather than reclassifying them as other real estate owned. The most common types of government guaranteed loans include those guaranteed by the Federal Housing Authority (FHA), U.S. Department of Housing and Urban Development (HUD), U.S. Department of Veterans Affairs (VA) and the U.S. Small Business Administration (SBA). The separate other receivable recorded upon foreclosure is to be measured based on the amount of the loan balance (principal and interest) the creditor expects to recover from the guarantor. ASU 2014-14 is effective for fiscal years, and interim periods within those years, beginning after December 15, 2014 and is not expected to have a significant impact on the Company’s consolidated financial statements.
FORWARD LOOKING STATEMENTS
This document (including information incorporated by reference) contains, and future oral and written statements of the Company and its management may contain, forward-looking statements, within the meaning of such term in the Private Securities Litigation Reform Act of 1995, with respect to the financial condition, results of operations, plans, objectives, future performance and business of the Company. Forward-looking statements, which may be based upon beliefs, expectations and assumptions of the Company’s management and on information currently available to management, are generally identifiable by the use of words such as “believe,” “expect,” “anticipate,” “bode,” “predict,” “suggest,” “project,” “appear,” “plan,” “intend,” “estimate,” “may,” “will,” “would,” “could,” “should,” “likely,” or other similar expressions. Additionally, all statements in this document, including forward-looking statements, speak only as of the date they are made, and the Company undertakes no obligation to update any statement in light of new information or future events.
The Company’s ability to predict results or the actual effect of future plans or strategies is inherently uncertain. The factors that could have a material adverse effect on the operations and future prospects of the Company and its subsidiaries are detailed in the “Risk Factors” section included under Item 1A. of Part I of this Form 10-K. In addition to the risk factors described in that section, there are other factors that may impact any public company, including ours, which could have a material adverse effect on the operations and future prospects of the Company and its subsidiaries. These additional factors include, but are not limited to, the following:
● | The economic impact of past and any future terrorist attacks, acts of war or threats thereof and the response of the United States to any such threats and attacks. |
● | The costs, effects and outcomes of existing or future litigation. |
● | Changes in accounting policies and practices, as may be adopted by state and federal regulatory agencies, the FASB, the Securities and Exchange Commission or the Public Company Accounting Oversight Board. |
● | The ability of the Company to manage the risks associated with the foregoing as well as anticipated. |
These risks and uncertainties should be considered in evaluating forward-looking statements and undue reliance should not be placed on such statements.
Item 7A. Quantitative and Qualitative Disclosures About Market Risk
The Company, like other financial institutions, is subject to direct and indirect market risk. Direct market risk exists from changes in interest rates. The Company’s net income is dependent on its net interest income. Net interest income is susceptible to interest rate risk to the degree that interest-bearing liabilities mature or reprice on a different basis than interest-earning assets. When interest-bearing liabilities mature or reprice more quickly than interest-earning assets in a given period, a significant increase in market rates of interest could adversely affect net interest income. Similarly, when interest-earning assets mature or reprice more quickly than interest-bearing liabilities, falling interest rates could result in a decrease in net interest income.
In an attempt to manage the Company’s exposure to changes in interest rates, management monitors the Company’s interest rate risk. Each subsidiary bank has an asset/liability management committee of the board of directors that meets quarterly to review the bank’s interest rate risk position and profitability, and to make or recommend adjustments for consideration by the full board of each bank. Internal asset/liability management teams consisting of members of the subsidiary banks’ management meet weekly to manage the mix of assets and liabilities to maximize earnings and liquidity and minimize interest rate and other risks. Management also reviews the subsidiary banks’ securities portfolios, formulates investment strategies, and oversees the timing and implementation of transactions to assure attainment of the board's objectives in the most effective manner. Notwithstanding the Company’s interest rate risk management activities, the potential for changing interest rates is an uncertainty that can have an adverse effect on net income.
In adjusting the Company’s asset/liability position, the board of directors and management attempt to manage the Company’s interest rate risk while maintaining or enhancing net interest margins. At times, depending on the level of general interest rates, the relationship between long-term and short-term interest rates, market conditions and competitive factors, the board of directors and management may decide to increase the Company’s interest rate risk position somewhat in order to increase its net interest margin. The Company’s results of operations and net portfolio values remain vulnerable to increases in interest rates and to fluctuations in the difference between long-term and short-term interest rates.
One method used to quantify interest rate risk is a short-term earnings at risk summary, which is a detailed and dynamic simulation model used to quantify the estimated exposure of net interest income to sustained interest rate changes. This simulation model captures the impact of changing interest rates on the interest income received and interest expense paid on all interest sensitive assets and liabilities reflected on the Company’s consolidated balance sheet. This sensitivity analysis demonstrates net interest income exposure annually over a five-year horizon, assuming no balance sheet growth and various interest rate scenarios including no change in rates; 200, 300, 400, and 500 basis point upward shifts; and a 100 basis point downward shift in interest rates, where interest-bearing assets and liabilities reprice at their earliest possible repricing date. The model assumes parallel and pro rata shifts in interest rates over a twelve-month period for the 200 basis point upward shift and 100 basis point downward shift. For the 400 basis point upward shift, the model assumes a parallel and pro rata shift in interest rates over a twenty-four month period. For the 500 basis point upward shift, the model assumes a flattening and pro rata shift in interest rates over a twelve-month period where the short-end of the yield curve shifts upward greater than the long-end of the yield curve. Effective with the modeling for the second quarter of 2010,Further, in recent years, the Company added anadditional interest rate scenarioscenarios where interest rates experience a parallel and instantaneous shift upward 100, 200, 300, and 400 basis points and a parallel and instantaneous shift downward 100 basis points. The Company will run additional interest rate scenarios on an as-needed basis. The asset/liability management committees of the subsidiary bank boards of directors hashave established policy limits of a 10% decline in net interest income for the 200 and the newly added 300 basis point upward shiftsparallel shift and the 100 basis point downward parallel shift.
Application of the simulation model analysis for select interest rate scenarios at December 31, 20122014 demonstrated the following:
| NET INTEREST INCOME EXPOSURE in YEAR 1 | ||||||||||||
| INTEREST RATE SCENARIO | As of December 31, 2012 | As of December 31, 2011 | As of December 31, 2010 | |||||||||
| 100 basis point downward shift | -1.5 | % | -1.5 | % | -1.9 | % | ||||||
| 200 basis point upward shift | -0.9 | % | -3.1 | % | -3.0 | % | ||||||
| 300 basis point upward shock | 0.8 | % | -4.2 | % | -1.6 | % | ||||||
NET INTEREST INCOME EXPOSURE in YEAR 1 | ||||||||||||||||
INTEREST RATE SCENARIO | POLICY LIMIT | As of December 31, 2014 | As of December 31, 2013 | As of December 31, 2012 | ||||||||||||
100 basis point downward shift | -10.0 | % | -1.7 | % | -1.0 | % | -1.5 | % | ||||||||
200 basis point upward shift | -10.0 | % | -5.0 | % | -4.8 | % | -0.9 | % | ||||||||
300 basis point upward shock | -25.0 | % | -11.9 | % | -11.0 | % | 0.8 | % | ||||||||
The simulation is within the board-established policy limit of a 10% decline in net interest incomelimits for all three scenarios.
In the second quarter of 2014, the Company executed two interest rate cap transactions, each with a notional value of $15.0 million, for a total of $30.0 million. The initial cost (prepaid premium) of the interest rate caps totaled $2.1 million. This amount was recorded in the Other Assets section of the balance sheet. This asset will be amortized to interest expense according to a predetermined schedule and will also be adjusted to fair value on a recurring basis. The change in fair value will flow through Accumulated Other Comprehensive Income and the derivative transaction will be tested for effectiveness according to cash flow hedge accounting standards. The interest rate caps purchased will essentially set a ceiling to the interest rate paid on the $30.0 million of short-term FHLB advances that are being hedged, minimizing the interest rate risk associated with rising interest rates. The Company will continue to analyze and evaluate similar transactions as an alternative and cost effective way to mitigate interest rate risk.
Interest rate risk is considered to be one of the most significant market risks affecting the Company. For that reason, the Company engages the assistance of a national consulting firm and its risk management system to monitor and control the Company’s interest rate risk exposure. Other types of market risk, such as foreign currency exchange rate risk and commodity price risk, do not arise in the normal course of the Company’s business activities.
Item 8. Financial Statements
QCR Holdings, Inc.
Index to Consolidated Financial Statements
Report of Independent Registered Public Accounting Firm
Financial Statements | |
Consolidated balance sheets as of December 31, | 59 |
Consolidated statements of income for the years ended December 31, 2014, 2013, and 2012 | 60 |
Consolidated statements of comprehensive income (loss) for the years ended December 31, 2014, 2013, and 2012 | 61 |
Consolidated statements of changes in stockholders' equity for the years ended December 31, 2014, 2013, and 2012 | 62 |
Consolidated statements of cash flows for the years ended December 31, 2014, 2013, and 2012 | 63 |
Notes to consolidated financial statements | |
65 |

Report of Independent Registered Public Accounting Firm
To the Board of Directors and Stockholders
QCR Holdings, Inc.
We have audited the accompanying consolidated balance sheets of QCR Holdings, Inc. and subsidiaries as of December 31, 20122014 and 2011,2013, and the related consolidated statements of income, comprehensive income (loss), changes in stockholders’ equity, and cash flows for each of the three years in the period ended December 31, 2012.2014. These financial statements are the responsibility of the Company's management. Our responsibility is to express an opinion on these financial statements based on our audits.
We conducted our audits in accordance with the standards of the Public Company Accounting Oversight Board (United States). Those standards require that we plan and perform the audit to obtain reasonable assurance about whether the financial statements are free of material misstatement. An audit includes examining, on a test basis, evidence supporting the amounts and disclosures in the financial statements. An audit also includes assessing the accounting principles used and significant estimates made by management, as well as evaluating the overall financial statement presentation. We believe that our audits provide a reasonable basis for our opinion.
In our opinion, the consolidated financial statements referred to above present fairly, in all material respects, the financial position of QCR Holdings, Inc. and subsidiaries as of December 31, 20122014 and 2011,2013, and the results of their operations and their cash flows for each of the three years in the period ended December 31, 2012,2014, in conformity with U.S. generally accepted accounting principles.
We have also audited, in accordance with the standards of the Public Company Accounting Oversight Board (United States), QCR Holdings, Inc. and subsidiaries’ internal control over financial reporting as of December 31, 2012,2014, based on criteria established inInternal Control – Integrated Framework issued by the Committee of Sponsoring Organizations of the Treadway Commission in 2013, and our report dated March 11, 201312, 2015 expressed an unqualified opinion on the effectiveness of QCR Holdings, Inc. and subsidiaries’ internal control over financial reporting.

Davenport, Iowa
March 12, 2015


QCR Holdings, Inc. and Subsidiaries
Consolidated Balance Sheets
December 31, 20122014 and 2011
| Assets | 2012 | 2011 | ||||||
| Cash and due from banks | $ | 61,568,446 | $ | 53,136,710 | ||||
| Federal funds sold | 26,560,000 | 20,785,000 | ||||||
| Interest-bearing deposits at financial institutions | 22,359,490 | 26,750,602 | ||||||
| Securities held to maturity, at amortized cost | 72,079,385 | 200,000 | ||||||
| Securities available for sale, at fair value | 530,159,986 | 565,029,291 | ||||||
| 602,239,371 | 565,229,291 | |||||||
| Loans receivable, held for sale | 4,577,233 | 3,832,760 | ||||||
| Loans/leases receivable, held for investment | 1,282,810,406 | 1,196,912,737 | ||||||
| 1,287,387,639 | 1,200,745,497 | |||||||
| Less allowance for estimated losses on loans/leases | (19,925,204 | ) | (18,789,262 | ) | ||||
| 1,267,462,435 | 1,181,956,235 | |||||||
| Premises and equipment, net | 31,262,390 | 31,740,751 | ||||||
| Goodwill | 3,222,688 | 3,222,688 | ||||||
| Bank-owned life insurance | 45,620,489 | 42,011,281 | ||||||
| Restricted investment securities | 15,747,850 | 15,253,600 | ||||||
| Other real estate owned, net | 3,954,538 | 8,385,758 | ||||||
| Other assets | 13,732,795 | 18,138,138 | ||||||
| Total assets | $ | 2,093,730,492 | $ | 1,966,610,054 | ||||
| Liabilities and Stockholders' Equity | ||||||||
| Liabilities: | ||||||||
| Deposits: | ||||||||
| Noninterest-bearing | $ | 450,659,723 | $ | 357,183,481 | ||||
| Interest-bearing | 923,454,377 | 848,274,307 | ||||||
| Total deposits | 1,374,114,100 | 1,205,457,788 | ||||||
| Short-term borrowings | 171,082,961 | 213,536,450 | ||||||
| Federal Home Loan Bank advances | 202,350,000 | 204,750,000 | ||||||
| Other borrowings | 138,239,762 | 136,231,663 | ||||||
| Junior subordinated debentures | 36,085,000 | 36,085,000 | ||||||
| Other liabilities | 31,424,848 | 26,116,451 | ||||||
| Total liabilities | 1,953,296,671 | 1,822,177,352 | ||||||
| Commitments and Contingencies | ||||||||
| Stockholders' Equity: | ||||||||
| Preferred stock, $1 par value, shares authorized 250,000 | 54,867 | 65,090 | ||||||
| December 2012 - 54,867 shares issued and outstanding | ||||||||
| December 2011 - 65,090 shares issued and outstanding | ||||||||
| Common stock, $1 par value; shares authorized 20,000,000 | 5,039,448 | 4,879,435 | ||||||
| December 2012 - 5,039,448 shares issued and 4,918,202 outstanding | ||||||||
| December 2011 - 4,879,435 shares issued and 4,758,189 outstanding | ||||||||
| Additional paid-in capital | 78,912,791 | 89,702,533 | ||||||
| Retained earnings | 53,326,542 | 44,585,902 | ||||||
| Accumulated other comprehensive income | 4,706,683 | 4,754,714 | ||||||
| Noncontrolling interests | - | 2,051,538 | ||||||
| Less treasury stock, December 2012 and 2011 - 121,246 common shares, at cost | (1,606,510 | ) | (1,606,510 | ) | ||||
| Total stockholders' equity | 140,433,821 | 144,432,702 | ||||||
| Total liabilities and stockholders' equity | $ | 2,093,730,492 | $ | 1,966,610,054 | ||||
Assets | 2014 | 2013 | ||||||
Cash and due from banks | $ | 38,235,019 | $ | 41,950,790 | ||||
Federal funds sold | 46,780,000 | 39,435,000 | ||||||
Interest-bearing deposits at financial institutions | 35,334,682 | 33,044,917 | ||||||
Securities held to maturity, at amortized cost | 199,879,574 | 145,451,895 | ||||||
Securities available for sale, at fair value | 451,659,630 | 551,758,458 | ||||||
Total securities | 651,539,204 | 697,210,353 | ||||||
Loans receivable, held for sale | 553,000 | 1,358,290 | ||||||
Loans/leases receivable, held for investment | 1,629,450,070 | 1,458,921,268 | ||||||
Gross loans/leases receivable | 1,630,003,070 | 1,460,279,558 | ||||||
Less allowance for estimated losses on loans/leases | (23,074,365 | ) | (21,448,048 | ) | ||||
Net loans/leases receivable | 1,606,928,705 | 1,438,831,510 | ||||||
Bank-owned life insurance | 53,723,548 | 52,002,041 | ||||||
Premises and equipment, net | 36,021,128 | 36,755,364 | ||||||
Restricted investment securities | 15,559,575 | 17,027,625 | ||||||
Other real estate owned, net | 12,767,636 | 9,729,053 | ||||||
Goodwill | 3,222,688 | 3,222,688 | ||||||
Core deposit intangible | 1,670,921 | 1,870,433 | ||||||
Other assets | 23,174,994 | 23,873,150 | ||||||
Total assets | $ | 2,524,958,100 | $ | 2,394,952,924 | ||||
Liabilities and Stockholders' Equity | ||||||||
Liabilities: | ||||||||
Deposits: | ||||||||
Noninterest-bearing | $ | 511,991,864 | $ | 542,566,087 | ||||
Interest-bearing | 1,167,676,149 | 1,104,425,156 | ||||||
Total deposits | 1,679,668,013 | 1,646,991,243 | ||||||
Short-term borrowings | 268,351,670 | 149,292,967 | ||||||
Federal Home Loan Bank advances | 203,500,000 | 231,350,000 | ||||||
Other borrowings | 150,282,492 | 142,448,362 | ||||||
Junior subordinated debentures | 40,423,735 | 40,289,830 | ||||||
Other liabilities | 38,653,681 | 37,003,742 | ||||||
Total liabilities | 2,380,879,591 | 2,247,376,144 | ||||||
Commitments and Contingencies | ||||||||
Stockholders' Equity: | ||||||||
Preferred stock, $1 par value, shares authorized 250,000 | - | 29,867 | ||||||
December 2014 - 0 shares issued and outstanding | ||||||||
December 2013 - 29,867 shares issued and outstanding | ||||||||
Common stock, $1 par value; shares authorized 20,000,000 | 8,074,443 | 8,005,708 | ||||||
December 2014 - 8,074,443 shares issued and 7,953,197 outstanding | ||||||||
December 2013 - 8,005,708 shares issued and 7,884,462 outstanding | ||||||||
Additional paid-in capital | 61,668,968 | 90,154,528 | ||||||
Retained earnings | 77,876,824 | 64,637,173 | ||||||
Accumulated other comprehensive loss: | ||||||||
Securities available for sale | (1,535,849 | ) | (13,643,986 | ) | ||||
Interest rate cap derivatives | (399,367 | ) | - | |||||
Less treasury stock, December 2014 and 2013 - 121,246 common shares, at cost | (1,606,510 | ) | (1,606,510 | ) | ||||
Total stockholders' equity | 144,078,509 | 147,576,780 | ||||||
Total liabilities and stockholders' equity | $ | 2,524,958,100 | $ | 2,394,952,924 | ||||
See Notes to Consolidated Financial Statements.
QCR Holdings, Inc. and Subsidiaries
Consolidated Statements of Income
Years Ended December 31, 2012, 2011,2014, 2013, and 2010
| 2012 | 2011 | 2010 | ||||||||||
| Interest and dividend income: | ||||||||||||
| Loans/leases, including fees | $ | 63,363,520 | $ | 64,807,673 | $ | 67,999,191 | ||||||
| Securities: | ||||||||||||
| Taxable | 10,781,300 | 10,877,832 | 10,109,083 | |||||||||
| Nontaxable | 2,339,579 | 983,040 | 907,085 | |||||||||
| Interest-bearing deposits at financial institutions | 378,566 | 404,879 | 411,079 | |||||||||
| Restricted investment securities | 507,281 | 557,698 | 497,214 | |||||||||
| Federal funds sold | 5,627 | 92,126 | 173,714 | |||||||||
| Total interest and dividend income | 77,375,873 | 77,723,248 | 80,097,366 | |||||||||
| Interest expense: | ||||||||||||
| Deposits | 6,218,713 | 8,939,056 | 12,681,625 | |||||||||
| Short-term borrowings | 248,545 | 290,450 | 628,255 | |||||||||
| Federal Home Loan Bank advances | 7,279,599 | 7,972,025 | 9,246,562 | |||||||||
| Other borrowings | 4,940,970 | 5,149,022 | 5,732,142 | |||||||||
| Junior subordinated debentures | 1,038,786 | 1,227,839 | 1,945,014 | |||||||||
| Total interest expense | 19,726,613 | 23,578,392 | 30,233,598 | |||||||||
| Net interest income | 57,649,260 | 54,144,856 | 49,863,768 | |||||||||
| Provision for loan/lease losses | 4,370,767 | 6,616,014 | 7,463,618 | |||||||||
| Net interest income after provision for loan/lease losses | 53,278,493 | 47,528,842 | 42,400,150 | |||||||||
| Noninterest income: | ||||||||||||
| Trust department fees | 3,632,278 | 3,368,995 | 3,290,844 | |||||||||
| Investment advisory and management fees | 2,361,159 | 2,108,918 | 1,812,903 | |||||||||
| Deposit service fees | 3,485,929 | 3,493,001 | 3,478,743 | |||||||||
| Gains on sales of loans, net | 2,457,707 | 2,565,043 | 3,169,514 | |||||||||
| Securities gains | 104,600 | 1,472,528 | - | |||||||||
| Losses on other real estate owned, net | (1,332,972 | ) | (374,910 | ) | (835,163 | ) | ||||||
| Earnings on bank-owned life insurance | 1,609,208 | 1,445,891 | 1,331,085 | |||||||||
| Credit card issuing fees, net of processing costs | 599,164 | 500,544 | 259,590 | |||||||||
| Other | 3,704,222 | 2,881,868 | 2,898,372 | |||||||||
| Total noninterest income | 16,621,295 | 17,461,878 | 15,405,888 | |||||||||
| Noninterest expenses: | ||||||||||||
| Salaries and employee benefits | 33,274,509 | 30,365,020 | 27,843,127 | |||||||||
| Occupancy and equipment expense | 5,635,257 | 5,297,949 | 5,472,248 | |||||||||
| Professional and data processing fees | 4,317,939 | 4,461,187 | 4,524,519 | |||||||||
| FDIC and other insurance | 2,330,611 | 2,698,282 | 3,528,267 | |||||||||
| Loan/lease expense | 1,041,824 | 2,160,674 | 1,657,552 | |||||||||
| Advertising and marketing | 1,445,476 | 1,288,797 | 1,053,909 | |||||||||
| Postage and telephone | 959,708 | 937,557 | 1,004,176 | |||||||||
| Stationery and supplies | 541,122 | 516,873 | 491,252 | |||||||||
| Bank service charges | 853,895 | 725,717 | 420,252 | |||||||||
| Prepayment fees on Federal Home Loan Bank advances | - | 832,099 | - | |||||||||
| Other-than-temporary impairment losses on securities | 62,400 | 118,847 | 113,800 | |||||||||
| Losses on lease residual values | - | - | 617,000 | |||||||||
| Other | 1,796,206 | 1,589,650 | 1,822,961 | |||||||||
| Total noninterest expenses | 52,258,947 | 50,992,652 | 48,549,063 | |||||||||
| Income before income taxes | 17,640,841 | 13,998,068 | 9,256,975 | |||||||||
| Federal and state income tax expense | 4,534,601 | 3,868,199 | 2,449,249 | |||||||||
| Net income | $ | 13,106,240 | $ | 10,129,869 | $ | 6,807,726 | ||||||
| Less: net income attributable to noncontrolling interests | 488,473 | 438,221 | 221,047 | |||||||||
| Net income attributable to QCR Holdings, Inc. | $ | 12,617,767 | $ | 9,691,648 | $ | 6,586,679 | ||||||
| Less: preferred stock dividends and discount accretion | 3,496,085 | 5,283,885 | 4,128,104 | |||||||||
| Net income attributable to QCR Holdings, Inc. common stockholders | 9,121,682 | 4,407,763 | 2,458,575 | |||||||||
| Basic earnings per common share | $ | 1.88 | $ | 0.93 | $ | 0.54 | ||||||
| Diluted earnings per common share | $ | 1.85 | $ | 0.92 | $ | 0.53 | ||||||
| Weighted average common shares outstanding | 4,844,776 | 4,724,781 | 4,593,096 | |||||||||
| Weighted average common and common equivalent shares outstanding | 4,919,559 | 4,789,026 | 4,618,242 | |||||||||
| Cash dividends declared per common share | $ | 0.08 | $ | 0.08 | $ | 0.08 | ||||||
2014 | 2013 | 2012 | ||||||||||
Interest and dividend income: | ||||||||||||
Loans/leases, including fees | $ | 69,423,001 | $ | 66,810,952 | $ | 63,363,520 | ||||||
Securities: | ||||||||||||
Taxable | 9,618,436 | 10,061,066 | 10,781,300 | |||||||||
Nontaxable | 6,074,896 | 4,147,050 | 2,339,579 | |||||||||
Interest-bearing deposits at financial institutions | 299,227 | 275,352 | 378,566 | |||||||||
Restricted investment securities | 528,660 | 558,946 | 507,281 | |||||||||
Federal funds sold | 21,036 | 18,592 | 5,627 | |||||||||
Total interest and dividend income | 85,965,256 | 81,871,958 | 77,375,873 | |||||||||
Interest expense: | ||||||||||||
Deposits | 4,508,921 | 4,714,306 | 6,218,713 | |||||||||
Short-term borrowings | 233,994 | 293,020 | 248,545 | |||||||||
Federal Home Loan Bank advances | 6,025,749 | 6,863,216 | 7,279,599 | |||||||||
Other borrowings | 4,890,845 | 4,753,260 | 4,940,970 | |||||||||
Junior subordinated debentures | 1,234,619 | 1,142,719 | 1,038,786 | |||||||||
Total interest expense | 16,894,128 | 17,766,521 | 19,726,613 | |||||||||
Net interest income | 69,071,128 | 64,105,437 | 57,649,260 | |||||||||
Provision for loan/lease losses | 6,807,000 | 5,930,420 | 4,370,767 | |||||||||
Net interest income after provision for loan/lease losses | 62,264,128 | 58,175,017 | 53,278,493 | |||||||||
Noninterest income: | ||||||||||||
Trust department fees | 5,715,151 | 4,941,681 | 3,632,278 | |||||||||
Investment advisory and management fees | 2,798,170 | 2,580,140 | 2,361,159 | |||||||||
Deposit service fees | 4,483,585 | 4,267,162 | 3,485,929 | |||||||||
Gains on sales of residential real estate loans, net | 460,721 | 836,065 | 1,388,142 | |||||||||
Gains on sales of government guaranteed portions of loans, net | 2,040,638 | 2,148,979 | 1,069,565 | |||||||||
Securities gains | 92,363 | 432,492 | 104,600 | |||||||||
Earnings on bank-owned life insurance | 1,721,507 | 1,786,023 | 1,609,208 | |||||||||
Debit card fees | 982,005 | 991,300 | 951,200 | |||||||||
Correspondent banking fees | 1,064,030 | 772,120 | 424,458 | |||||||||
Participation service fees on commercial loan participations | 854,621 | 768,547 | 665,992 | |||||||||
Bargain purchase gain on Community National Acquisition | - | 1,841,385 | - | |||||||||
Gains on sales of certain Community National Bank branches | - | 2,334,216 | - | |||||||||
Losses on other real estate owned, net | (447,272 | ) | (545,340 | ) | (1,332,972 | ) | ||||||
Other | 1,231,781 | 2,659,058 | 2,261,736 | |||||||||
Total noninterest income | 20,997,300 | 25,813,828 | 16,621,295 | |||||||||
Noninterest expenses: | ||||||||||||
Salaries and employee benefits | 40,337,055 | 37,510,318 | 33,274,509 | |||||||||
Occupancy and equipment expense | 7,385,526 | 6,712,468 | 5,635,257 | |||||||||
Professional and data processing fees | 6,191,574 | 6,424,594 | 4,317,939 | |||||||||
FDIC and other insurance | 2,895,494 | 2,587,041 | 2,330,611 | |||||||||
Loan/lease expense | 1,310,644 | 1,521,523 | 1,041,824 | |||||||||
Advertising and marketing | 1,985,121 | 1,726,314 | 1,445,476 | |||||||||
Postage and telephone | 930,408 | 1,069,142 | 959,708 | |||||||||
Stationery and supplies | 579,330 | 562,301 | 541,122 | |||||||||
Bank service charges | 1,291,017 | 1,144,757 | 853,895 | |||||||||
Acquisition and data conversion costs | - | 2,353,162 | - | |||||||||
Other-than-temporary impairment losses on securities | - | - | 62,400 | |||||||||
Other | 2,363,752 | 2,821,038 | 1,796,206 | |||||||||
Total noninterest expenses | 65,269,921 | 64,432,658 | 52,258,947 | |||||||||
Income before income taxes | 17,991,507 | 19,556,187 | 17,640,841 | |||||||||
Federal and state income tax expense | 3,038,970 | 4,617,942 | 4,534,601 | |||||||||
Net income | $ | 14,952,537 | $ | 14,938,245 | $ | 13,106,240 | ||||||
Less: net income attributable to noncontrolling interests | - | - | 488,473 | |||||||||
Net income attributable to QCR Holdings, Inc. | $ | 14,952,537 | $ | 14,938,245 | $ | 12,617,767 | ||||||
Less: preferred stock dividends | 1,081,877 | 3,168,302 | 3,496,085 | |||||||||
Net income attributable to QCR Holdings, Inc. common stockholders | $ | 13,870,660 | $ | 11,769,943 | $ | 9,121,682 | ||||||
Basic earnings per common share | $ | 1.75 | $ | 2.13 | $ | 1.88 | ||||||
Diluted earnings per common share | $ | 1.72 | $ | 2.08 | $ | 1.85 | ||||||
Weighted average common shares outstanding | 7,925,220 | 5,531,948 | 4,844,776 | |||||||||
Weighted average common and common equivalent shares outstanding | 8,048,661 | 5,646,926 | 4,919,559 | |||||||||
Cash dividends declared per common share | $ | 0.08 | $ | 0.08 | $ | 0.08 | ||||||
See Notes to Consolidated Financial Statements.
QCR HOLDINGS, INC. AND SUBSIDIARIES
CONSOLIDATED STATEMENTS OF COMPREHENSIVE INCOME
Years Ended December 31, 2012, 2011,2014, 2013, and 2010
| 2012 | 2011 | 2010 | ||||||||||
| Net income | $ | 13,106,240 | $ | 10,129,869 | $ | 6,807,726 | ||||||
| Other comprehensive income (loss): | ||||||||||||
| Unrealized gains (losses) on securities available for sale: | ||||||||||||
| Unrealized holding gains (losses) arising during the period before tax | (40,839 | ) | 7,914,236 | 803,133 | ||||||||
| Less reclassification adjustment for gains (losses) included in net income before tax | 42,200 | 1,353,681 | (113,800 | ) | ||||||||
| (83,039 | ) | 6,560,555 | 916,933 | |||||||||
| Tax expense (benefit) | (35,008 | ) | 2,510,006 | 348,376 | ||||||||
| Other comprehensive income (loss), net of tax | (48,031 | ) | 4,050,549 | 568,557 | ||||||||
| Comprehensive income attributable to QCR Holdings, Inc. | $ | 13,058,209 | $ | 14,180,418 | $ | 7,376,283 | ||||||
2014 | 2013 | 2012 | ||||||||||
Net income | $ | 14,952,537 | $ | 14,938,245 | $ | 13,106,240 | ||||||
Other comprehensive income (loss): | ||||||||||||
Unrealized gains (losses) on securities available for sale: | ||||||||||||
Unrealized holding gains (losses) arising during the period before tax | 19,697,118 | (29,292,079 | ) | (40,839 | ) | |||||||
Less reclassification adjustment for gains included in net income before tax | 92,363 | 432,492 | 42,200 | |||||||||
| 19,604,755 | (29,724,571 | ) | (83,039 | ) | ||||||||
Unrealized losses on interest rate cap derivatives: | ||||||||||||
Unrealized holding losses arising during the period before tax | (584,264 | ) | - | - | ||||||||
Less reclassification adjustment for ineffectiveness and caplet amortization before tax | (30,147 | ) | - | - | ||||||||
| (614,411 | ) | - | - | |||||||||
Other comprehensive income (loss), before tax | 18,990,344 | (29,724,571 | ) | (83,039 | ) | |||||||
Tax expense (benefit) | 7,281,574 | (11,373,902 | ) | (35,008 | ) | |||||||
Other comprehensive income (loss), net of tax | 11,708,770 | (18,350,669 | ) | (48,031 | ) | |||||||
Comprehensive income (loss) attributable to QCR Holdings, Inc. | $ | 26,661,307 | $ | (3,412,424 | ) | $ | 13,058,209 | |||||
See Notes to Consolidated Financial Statements
QCR Holdings, Inc. and Subsidiaries
Consolidated Statements of Changes in Stockholders' Equity
Years Ended December 31, 2012, 2011,2014, 2013, and 2010
Preferred Stock | Common Stock | Additional Paid-In | Retained Earnings | Accumulated Other | Noncontrolling Interests | Treasury Stock | Total | |||||||||||||||||||||||||
| Balance, December 31, 2009 | $ | 38,805 | $ | 4,674,536 | $ | 82,194,330 | $ | 38,458,477 | $ | 135,608 | $ | 1,699,630 | $ | (1,606,510 | ) | $ | 125,594,876 | |||||||||||||||
| Net income | - | - | - | 6,586,679 | - | 221,047 | - | 6,807,726 | ||||||||||||||||||||||||
| Other comprehensive income, net of tax | - | - | - | - | 568,557 | - | - | 568,557 | ||||||||||||||||||||||||
| Common cash dividends declared, $0.08 per share | - | - | - | (366,152 | ) | - | - | - | (366,152 | ) | ||||||||||||||||||||||
| Preferred cash dividends declared and accrued | - | - | - | (3,679,100 | ) | - | - | - | (3,679,100 | ) | ||||||||||||||||||||||
| Discount accretion on cumulative preferred stock | - | - | 449,004 | (449,004 | ) | - | - | - | - | |||||||||||||||||||||||
Exchange of 268 shares of Series B Non-Cumulative Perpetual Preferred Stock for 13,400 shares of Series E Non-Cumulative Perpetual Convertible Preferred Stock | 13,132 | - | (13,132 | ) | - | - | - | - | - | |||||||||||||||||||||||
Exchange of 300 shares of Series C Non-Cumulative Perpetual Preferred Stock for 7,500 shares of Series E Non-Cumulative Perpetual Convertible Preferred Stock | 7,200 | - | (7,200 | ) | - | - | - | - | - | |||||||||||||||||||||||
Proceeds from issuance of 4,100 shares of Series E Non-Cumulative Perpetual Convertible Preferred Stock | 4,100 | - | 3,183,133 | - | - | - | - | 3,187,233 | ||||||||||||||||||||||||
Proceeds from issuance of warrants to purchase 54,000 shares of common stock in conjunction with the issuance of Series A Subordinated Notes | - | - | 84,240 | - | - | - | - | 84,240 | ||||||||||||||||||||||||
Proceeds from issuance of 28,907 shares of common stock as a result of stock purchased under the Employee Stock Purchase Plan | - | 28,907 | 192,362 | - | - | - | - | 221,269 | ||||||||||||||||||||||||
Proceeds from issuance of 5,754 shares of common stock as a result of stock options exercised | - | 5,754 | 37,621 | - | - | - | - | 43,375 | ||||||||||||||||||||||||
Exchange of 367 shares of common stock in connection with payroll taxes for restricted stock | - | (367 | ) | (2,730 | ) | - | - | - | - | (3,097 | ) | |||||||||||||||||||||
| Stock-based compensation expense | - | - | 533,271 | - | - | - | - | 533,271 | ||||||||||||||||||||||||
| Restricted stock awards | - | 23,598 | (23,598 | ) | - | - | - | - | - | |||||||||||||||||||||||
| Purchase of noncontrolling interests | - | - | (149,032 | ) | - | - | (270,968 | ) | - | (420,000 | ) | |||||||||||||||||||||
| Distributions to noncontrolling interests | - | - | - | - | - | (1,490 | ) | - | (1,490 | ) | ||||||||||||||||||||||
| Balance, December 31, 2010 | $ | 63,237 | $ | 4,732,428 | $ | 86,478,269 | $ | 40,550,900 | $ | 704,165 | $ | 1,648,219 | $ | (1,606,510 | ) | $ | 132,570,708 | |||||||||||||||
| Net income | - | - | - | 9,691,648 | - | 438,221 | - | 10,129,869 | ||||||||||||||||||||||||
| Other comprehensive income, net of tax | - | - | - | - | 4,050,549 | - | - | 4,050,549 | ||||||||||||||||||||||||
| Common cash dividends declared, $0.08 per share | - | - | - | (372,761 | ) | - | - | - | (372,761 | ) | ||||||||||||||||||||||
| Preferred cash dividends declared and accrued | - | - | - | (3,694,441 | ) | - | - | - | (3,694,441 | ) | ||||||||||||||||||||||
| Discount accretion on cumulative preferred stock * | - | - | 1,589,444 | (1,589,444 | ) | - | - | - | - | |||||||||||||||||||||||
Proceeds from issuance of 40,090 shares of Series F Non-Cumulative Perpetual Preferred Stock | 40,090 | - | 39,956,832 | - | - | - | - | 39,996,922 | ||||||||||||||||||||||||
Redemption of 38,237 shares of Series D Cumulative Perpetual Preferred Stock | (38,237 | ) | - | (38,198,763 | ) | - | - | - | - | (38,237,000 | ) | |||||||||||||||||||||
Redemption of 521,888 shares of common stock warrants issued in conjunction with Series D Cumulative Perpetual Preferred Stock | - | - | (1,100,000 | ) | - | - | - | - | (1,100,000 | ) | ||||||||||||||||||||||
Proceeds from issuance of 36,174 shares of common stock as a result of stock purchased under the Employee Stock Purchase Plan | - | 36,174 | 207,592 | - | - | - | - | 243,766 | ||||||||||||||||||||||||
Proceeds from issuance of 36,459 shares of common stock as a result of stock options exercised | - | 36,459 | 216,765 | - | - | - | - | 253,224 | ||||||||||||||||||||||||
Exchange of 2,550 shares of common stock in connection with stock options exercised | - | (2,550 | ) | (17,101 | ) | - | - | - | - | (19,651 | ) | |||||||||||||||||||||
| Stock-based compensation expense | - | - | 646,419 | - | - | - | - | 646,419 | ||||||||||||||||||||||||
| Restricted stock awards | - | 76,924 | (76,924 | ) | - | - | - | - | - | |||||||||||||||||||||||
| Distributions to noncontrolling interests | - | - | - | - | - | (34,902 | ) | - | (34,902 | ) | ||||||||||||||||||||||
| Balance, December 31, 2011 | $ | 65,090 | $ | 4,879,435 | $ | 89,702,533 | $ | 44,585,902 | $ | 4,754,714 | $ | 2,051,538 | $ | (1,606,510 | ) | $ | 144,432,702 | |||||||||||||||
| Net income | - | - | - | 12,617,767 | - | 488,473 | - | 13,106,240 | ||||||||||||||||||||||||
| Other comprehensive loss, net of tax | - | - | - | - | (48,031 | ) | - | - | (48,031 | ) | ||||||||||||||||||||||
| Common cash dividends declared, $0.08 per share | - | - | - | (381,042 | ) | - | - | - | (381,042 | ) | ||||||||||||||||||||||
| Preferred cash dividends declared and accrued | - | - | - | (3,496,085 | ) | - | - | - | (3,496,085 | ) | ||||||||||||||||||||||
Redemption of 10,223 shares of Series F Noncumulative Perpetual Preferred Stock | (10,223 | ) | - | (10,212,777 | ) | - | - | - | - | (10,223,000 | ) | |||||||||||||||||||||
Proceeds from issuance of 31,554 shares of common stock as a result of stock purchased under the Employee Stock Purchase Plan | - | 31,554 | 249,316 | - | - | - | - | 280,870 | ||||||||||||||||||||||||
Proceeds from issuance of 17,876 shares of common stock as a result of stock options exercised | - | 17,876 | 155,428 | - | - | - | - | 173,304 | ||||||||||||||||||||||||
Exchange of 611 shares of common stock in connection with stock options exercised | - | (611 | ) | (7,125 | ) | - | - | - | - | (7,736 | ) | |||||||||||||||||||||
Exchange of 576 shares of common stock in connection with payroll taxes for restricted stock | - | (576 | ) | (2,103 | ) | - | - | - | - | (2,679 | ) | |||||||||||||||||||||
Proceeds from exercise of warrants to purchase 54,000 shares of common stock issued in conjunction with the Series A Subordinated Notes | - | 54,000 | 486,000 | - | - | - | - | 540,000 | ||||||||||||||||||||||||
| Stock-based compensation expense | - | - | 849,760 | - | - | - | - | 849,760 | ||||||||||||||||||||||||
| Restricted stock awards | - | 57,770 | (57,770 | ) | - | - | - | - | - | |||||||||||||||||||||||
| Purchase of noncontrolling interest | - | - | (2,250,471 | ) | - | - | (2,531,748 | ) | - | (4,782,219 | ) | |||||||||||||||||||||
| Distributions to noncontrolling interests | - | - | - | - | - | (8,263 | ) | - | (8,263 | ) | ||||||||||||||||||||||
| Balance, December 31, 2012 | $ | 54,867 | $ | 5,039,448 | $ | 78,912,791 | $ | 53,326,542 | $ | 4,706,683 | $ | - | $ | (1,606,510 | ) | $ | 140,433,821 | |||||||||||||||
Accumulated | ||||||||||||||||||||||||||||||||
Additional | Other | |||||||||||||||||||||||||||||||
Preferred | Common | Paid-In | Retained | Comprehensive | Noncontrolling | Treasury | ||||||||||||||||||||||||||
Stock | Stock | Capital | Earnings | Income (Loss) | Interests | Stock | Total | |||||||||||||||||||||||||
Balance, December 31, 2011 | $ | 65,090 | $ | 4,879,435 | $ | 89,702,533 | $ | 44,585,902 | $ | 4,754,714 | $ | 2,051,538 | $ | (1,606,510 | ) | $ | 144,432,702 | |||||||||||||||
Net income | - | - | - | 12,617,767 | - | 488,473 | - | 13,106,240 | ||||||||||||||||||||||||
Other comprehensive loss, net of tax | - | - | - | - | (48,031 | ) | - | - | (48,031 | ) | ||||||||||||||||||||||
Common cash dividends declared, $0.08 per share | - | - | - | (381,042 | ) | - | - | - | (381,042 | ) | ||||||||||||||||||||||
Preferred cash dividends declared and accrued | - | - | - | (3,496,085 | ) | - | - | - | (3,496,085 | ) | ||||||||||||||||||||||
Redemption of 10,223 shares of Series F Noncumulative Perpetual Preferred Stock | (10,223 | ) | - | (10,212,777 | ) | - | - | - | - | (10,223,000 | ) | |||||||||||||||||||||
Proceeds from issuance of 31,554 shares of common stock as a result of stock purchased under the Employee Stock Purchase Plan | - | 31,554 | 249,316 | - | - | - | - | 280,870 | ||||||||||||||||||||||||
Proceeds from issuance of 17,876 shares of common stock as a result of stock options exercised | - | 17,876 | 155,428 | - | - | - | - | 173,304 | ||||||||||||||||||||||||
Exchange of 611 shares of common stock in connection with stock options exercised | - | (611 | ) | (7,125 | ) | - | - | - | - | (7,736 | ) | |||||||||||||||||||||
Exchange of 576 shares of common stock in connection with payroll taxes for restricted stock | - | (576 | ) | (2,103 | ) | - | - | - | - | (2,679 | ) | |||||||||||||||||||||
Proceeds from exercise of warrants to purchase 54,000 shares of common stock issued in conjunction with the Series A Subordinated Notes | - | 54,000 | 486,000 | - | - | - | - | 540,000 | ||||||||||||||||||||||||
Stock-based compensation expense | - | - | 849,760 | - | - | - | - | 849,760 | ||||||||||||||||||||||||
Restricted stock awards | - | 57,770 | (57,770 | ) | - | - | - | - | - | |||||||||||||||||||||||
Purchase of noncontrolling interest | - | - | (2,250,471 | ) | - | - | (2,531,748 | ) | - | (4,782,219 | ) | |||||||||||||||||||||
Distributions to noncontrolling interests | - | - | - | - | - | (8,263 | ) | - | (8,263 | ) | ||||||||||||||||||||||
Balance, December 31, 2012 | $ | 54,867 | $ | 5,039,448 | $ | 78,912,791 | $ | 53,326,542 | $ | 4,706,683 | $ | - | $ | (1,606,510 | ) | $ | 140,433,821 | |||||||||||||||
Net income | - | - | - | 14,938,245 | - | - | - | 14,938,245 | ||||||||||||||||||||||||
Other comprehensive loss, net of tax | - | - | - | - | (18,350,669 | ) | - | - | (18,350,669 | ) | ||||||||||||||||||||||
Common cash dividends declared, $0.08 per share | - | - | - | (459,312 | ) | - | - | - | (459,312 | ) | ||||||||||||||||||||||
Preferred cash dividends declared and accrued | - | - | - | (3,168,302 | ) | - | - | - | (3,168,302 | ) | ||||||||||||||||||||||
Issuance of 834,715 shares of common stock as a result of the acquisition of Community National Bancorporation, net | - | 834,715 | 12,181,894 | - | - | - | - | 13,016,609 | ||||||||||||||||||||||||
Conversion of 25,000 shares of Series E Non-cumulative Perpetual Preferred Stock to 2,057,502 shares of common stock | (25,000 | ) | 2,057,502 | (2,032,502 | ) | - | - | - | - | - | ||||||||||||||||||||||
Proceeds from issuance of 27,110 shares of common stock as a result of stock purchased under the Employee Stock Purchase Plan | - | 27,110 | 304,396 | - | - | - | - | 331,506 | ||||||||||||||||||||||||
Proceeds from issuance of 41,258 shares of common stock as a result of stock options exercised | - | 41,258 | 373,519 | - | - | - | - | 414,777 | ||||||||||||||||||||||||
Exchange of 7,679 shares of common stock in connection with stock options exercised | - | (7,679 | ) | (120,955 | ) | - | - | - | - | (128,634 | ) | |||||||||||||||||||||
Stock-based compensation expense | - | - | 792,279 | - | - | - | - | 792,279 | ||||||||||||||||||||||||
Tax benefit of nonqualified stock options exercised | - | - | 62,371 | - | - | - | - | 62,371 | ||||||||||||||||||||||||
Restricted stock awards | - | 30,152 | (30,152 | ) | - | - | - | - | - | |||||||||||||||||||||||
Exchange of 16,798 shares of common stock in connection with restricted stock vested | - | (16,798 | ) | (289,113 | ) | - | - | - | - | (305,911 | ) | |||||||||||||||||||||
Balance, December 31, 2013 | $ | 29,867 | $ | 8,005,708 | $ | 90,154,528 | $ | 64,637,173 | $ | (13,643,986 | ) | $ | - | $ | (1,606,510 | ) | $ | 147,576,780 | ||||||||||||||
Net income | - | - | - | 14,952,537 | - | - | - | 14,952,537 | ||||||||||||||||||||||||
Other comprehensive loss, net of tax - unrealized gains on securities available for sale of $12,108,137, unrealized losses on interest rate caps derivatives of ($399,367) | - | - | - | - | 11,708,770 | - | - | 11,708,770 | ||||||||||||||||||||||||
Common cash dividends declared, $0.08 per share | - | - | - | (631,009 | ) | - | - | - | (631,009 | ) | ||||||||||||||||||||||
Preferred cash dividends declared and accrued | - | - | - | (1,081,877 | ) | - | - | - | (1,081,877 | ) | ||||||||||||||||||||||
Redemption of 29,867 shares of Series F Non-cumulative Perpetual Preferred Stock | (29,867 | ) | - | (29,794,055 | ) | - | - | - | - | (29,823,922 | ) | |||||||||||||||||||||
Proceeds from issuance of 25,321 shares of common stock as a result of stock purchased under the Employee Stock Purchase Plan | - | 25,321 | 353,566 | - | - | - | - | 378,887 | ||||||||||||||||||||||||
Proceeds from issuance of 23,659 shares of common stock as a result of stock options exercised | - | 23,659 | 218,095 | - | - | - | - | 241,754 | ||||||||||||||||||||||||
Stock-based compensation expense | - | - | 891,619 | - | - | - | - | 891,619 | ||||||||||||||||||||||||
Tax benefit of nonqualified stock options exercised | - | - | 42,954 | - | - | - | - | 42,954 | ||||||||||||||||||||||||
Restricted stock awards | - | 30,055 | (30,055 | ) | - | - | - | - | - | |||||||||||||||||||||||
Exchange of 10,300 shares of common stock in connection with restricted stock vested | - | (10,300 | ) | (167,684 | ) | - | - | - | - | (177,984 | ) | |||||||||||||||||||||
Balance, December 31, 2014 | $ | - | $ | 8,074,443 | $ | 61,668,968 | $ | 77,876,824 | $ | (1,935,216 | ) | $ | - | $ | (1,606,510 | ) | $ | 144,078,509 | ||||||||||||||
See Notes to Consolidated Financial Statements.
QCR Holdings, Inc. and Subsidiaries
Consolidated Statements of Cash Flows
Years Ended December 31, 2012, 2011,2014, 2013, and 20102012
2014 | 2013 | 2012 | ||||||||||
Cash Flows from Operating Activities: | ||||||||||||
Net income | $ | 14,952,537 | $ | 14,938,245 | $ | 13,106,240 | ||||||
Adjustments to reconcile net income to net cash provided by operating activities | ||||||||||||
Depreciation | 2,812,645 | 2,695,578 | 2,350,303 | |||||||||
Provision for loan/lease losses | 6,807,000 | 5,930,420 | 4,370,767 | |||||||||
Deferred income taxes | (1,165,009 | ) | (1,021,991 | ) | 2,302,418 | |||||||
Stock-based compensation expense | 891,619 | 792,279 | 849,760 | |||||||||
Deferred compensation expense accrued | 1,311,627 | 822,335 | 844,844 | |||||||||
Losses on other real estate owned, net | 447,272 | 545,340 | 1,332,972 | |||||||||
Amortization of premiums on securities, net | 1,809,804 | 3,574,097 | 3,946,551 | |||||||||
Securities gains | (92,363 | ) | (432,492 | ) | (104,600 | ) | ||||||
Other-than-temporary impairment losses on securities | - | - | 62,400 | |||||||||
Loans originated for sale | (58,128,415 | ) | (80,027,780 | ) | (120,430,173 | ) | ||||||
Proceeds on sales of loans | 61,435,064 | 86,231,767 | 122,143,407 | |||||||||
Gains on sales of residential real estate loans, net | (460,721 | ) | (836,065 | ) | (1,388,142 | ) | ||||||
Gains on sales of government guaranteed portions of loans, net | (2,040,638 | ) | (2,148,979 | ) | (1,069,565 | ) | ||||||
Gain on sale of credit card loan receivables | - | (495,405 | ) | - | ||||||||
Gain on sale of credit card issuing operations | - | (355,268 | ) | - | ||||||||
Bargain purchase gain on Community National acquisition | - | (1,841,385 | ) | - | ||||||||
Amortization of core deposit intangible | 199,512 | 178,881 | - | |||||||||
Accretion of acquisition fair value adjustments, net | (674,539 | ) | (1,060,708 | ) | - | |||||||
Gains on sales of certain branches of Community National Bank | - | (2,334,216 | ) | - | ||||||||
Increase in cash value of bank-owned life insurance | (1,721,507 | ) | (1,786,023 | ) | (1,609,208 | ) | ||||||
Decrease (increase) in other assets | (1,198,107 | ) | 7,650,490 | 1,153,373 | ||||||||
Increase in other liabilities | 414,134 | 1,017,133 | 2,793,570 | |||||||||
Net cash provided by operating activities | 25,599,915 | 32,036,253 | 30,654,917 | |||||||||
Cash Flows from Investing Activities: | ||||||||||||
Net increase in federal funds sold | (7,345,000 | ) | (540,000 | ) | (5,775,000 | ) | ||||||
Net (increase) decrease in interest-bearing deposits at financial institutions | (2,289,765 | ) | (8,660,888 | ) | 4,391,112 | |||||||
Proceeds from sales of other real estate owned | 1,593,714 | 1,345,479 | 5,241,265 | |||||||||
Purchase of derivative instruments | (2,071,650 | ) | - | - | ||||||||
Activity in securities portfolio: | ||||||||||||
Purchases | (76,256,503 | ) | (312,970,498 | ) | (474,461,164 | ) | ||||||
Calls, maturities and redemptions | 35,247,090 | 147,264,900 | 374,292,050 | |||||||||
Paydowns | 23,611,559 | 46,098,773 | 39,956,569 | |||||||||
Sales | 78,476,422 | 37,393,047 | 19,215,075 | |||||||||
Activity in restricted investment securities: | ||||||||||||
Purchases | (1,912,050 | ) | (7,264,600 | ) | (4,584,300 | ) | ||||||
Redemptions | 3,380,100 | 7,244,200 | 4,090,050 | |||||||||
Purchases of bank-owned life insurance | - | - | (2,000,000 | ) | ||||||||
Net increase in loans/leases originated and held for investment | (180,325,359 | ) | (55,311,462 | ) | (91,275,511 | ) | ||||||
Purchase of premises and equipment | (2,035,855 | ) | (2,430,353 | ) | (1,871,942 | ) | ||||||
Proceeds from sale of credit card loan receivables | - | 10,674,723 | - | |||||||||
Net cash received from Community National Acquisition | - | 3,025,073 | - | |||||||||
Net cash paid on sales of certain branches of Community National Bank | - | (30,425,618 | ) | - | ||||||||
Net cash used in investing activities | (129,927,297 | ) | (164,557,224 | ) | (132,781,796 | ) | ||||||
Cash Flows from Financing Activities: | ||||||||||||
Net increase in deposits | 32,695,797 | 108,923,293 | 168,656,312 | |||||||||
Net (decrease) increase in short-term borrowings | 119,058,703 | (21,789,994 | ) | (42,453,489 | ) | |||||||
Activity in Federal Home Loan Bank advances: | ||||||||||||
Advances | 6,000,000 | 77,000,000 | 13,000,000 | |||||||||
Calls and maturities | (27,850,000 | ) | (82,000,000 | ) | (24,400,000 | ) | ||||||
Net change in short-term and overnight advances | (6,000,000 | ) | 34,000,000 | 9,000,000 | ||||||||
Net (decrease) increase in other borrowings | - | (200,000 | ) | 8,099 | ||||||||
Proceeds from term debt | 10,000,000 | 10,000,000 | - | |||||||||
Principal payments on term debt | (2,125,000 | ) | - | - | ||||||||
Advance (payment) on 364-day revolving note | - | (5,600,000 | ) | 2,000,000 | ||||||||
Repayment of Community National's other borrowings at acquisition | - | (3,950,000 | ) | - | ||||||||
Payment of cash dividends on common and preferred stock | (1,964,608 | ) | (4,062,726 | ) | (4,088,949 | ) | ||||||
Redemption of 10,223 shares of Series F Noncumulative Perpetual Preferred Stock, net | - | - | (10,223,000 | ) | ||||||||
Redemption of 29,867 shares of Series F Noncumulative Perpetual Preferred Stock, net | (29,823,922 | ) | - | - | ||||||||
Proceeds from issuance of common stock, net | 620,641 | 582,742 | 994,174 | |||||||||
Purchase of noncontrolling interests | - | - | (1,934,532 | ) | ||||||||
Net cash provided by financing activities | 100,611,611 | 112,903,315 | 110,558,615 | |||||||||
Net (decrease) increase in cash and due from banks | (3,715,771 | ) | (19,617,656 | ) | 8,431,736 | |||||||
Cash and due from banks, beginning | 41,950,790 | 61,568,446 | 53,136,710 | |||||||||
Cash and due from banks, ending | $ | 38,235,019 | $ | 41,950,790 | $ | 61,568,446 | ||||||
Continued
| 2012 | 2011 | 2010 | ||||||||||
| Cash Flows from Operating Activities: | ||||||||||||
| Net income | $ | 13,106,240 | $ | 10,129,869 | $ | 6,807,726 | ||||||
| Adjustments to reconcile net income to net cash provided by operating activities | ||||||||||||
| Depreciation | 2,350,303 | 2,442,896 | 2,533,597 | |||||||||
| Provision for loan/lease losses | 4,370,767 | 6,616,014 | 7,463,618 | |||||||||
| Deferred income taxes | 2,684,367 | 3,952,046 | 1,256,004 | |||||||||
| Amortization of offering costs on subordinated debentures | 14,317 | 14,317 | 14,317 | |||||||||
| Stock-based compensation expense | 849,760 | 696,407 | 488,112 | |||||||||
| Losses on other real estate owned, net | 1,332,972 | 374,910 | 835,163 | |||||||||
| Amortization of premiums on securities, net | 3,946,551 | 3,487,361 | 3,411,202 | |||||||||
| Securities gains, net | (104,600 | ) | (1,472,528 | ) | - | |||||||
| Other-than-temporary impairment losses on securities | 62,400 | 118,847 | 113,800 | |||||||||
| Loans originated for sale | (120,430,173 | ) | (100,789,010 | ) | (172,623,744 | ) | ||||||
| Proceeds on sales of loans | 122,143,407 | 113,606,152 | 167,843,529 | |||||||||
| Gains on sales of loans, net | (2,457,707 | ) | (2,565,043 | ) | (3,169,514 | ) | ||||||
| Prepayment fees on Federal Home Loan Bank advances | - | 832,099 | - | |||||||||
| Losses on lease residual values | - | - | 617,000 | |||||||||
| Increase in cash value of bank-owned life insurance | (1,609,208 | ) | (1,445,891 | ) | (1,331,085 | ) | ||||||
| Decrease (increase) in other assets | 757,107 | (1,881,557 | ) | 2,248,856 | ||||||||
| Increase in other liabilities | 3,638,414 | 2,523,387 | 1,406,270 | |||||||||
| Net cash provided by operating activities | 30,654,917 | 36,640,276 | 17,914,851 | |||||||||
| Cash Flows from Investing Activities: | ||||||||||||
| Net (increase) decrease in federal funds sold | (5,775,000 | ) | 41,175,000 | (55,361,667 | ) | |||||||
| Net decrease (increase) in interest-bearing deposits at financial institutions | 4,391,112 | 12,995,009 | (10,416,198 | ) | ||||||||
| Proceeds from sales of other real estate owned | 5,241,265 | 9,220,631 | 6,038,825 | |||||||||
| Activity in securities portfolio: | ||||||||||||
| Purchases | (474,461,164 | ) | (622,245,920 | ) | (383,018,764 | ) | ||||||
| Calls, maturities and redemptions | 374,292,050 | 422,870,000 | 325,649,238 | |||||||||
| Paydowns | 39,956,569 | 9,094,080 | 435,149 | |||||||||
| Sales | 19,215,075 | 54,326,191 | - | |||||||||
| Activity in restricted investment securities: | ||||||||||||
| Purchases | (4,584,300 | ) | (292,800 | ) | (1,710,800 | ) | ||||||
| Redemptions | 4,090,050 | 1,707,900 | 252,200 | |||||||||
| Activity in bank-owned life insurance: | ||||||||||||
| Purchases | (2,000,000 | ) | (7,000,000 | ) | (3,150,000 | ) | ||||||
| Surrender of policy | - | - | 609,772 | |||||||||
| Net (increase) decrease in loans/leases originated and held for investment | (91,275,511 | ) | (56,096,989 | ) | 63,387,668 | |||||||
| Purchase of premises and equipment | (1,871,942 | ) | (3,064,903 | ) | (2,197,448 | ) | ||||||
| Net cash used in investing activities | (132,781,796 | ) | (137,311,801 | ) | (59,482,025 | ) | ||||||
| Cash Flows from Financing Activities: | ||||||||||||
| Net increase in deposits | 168,656,312 | 90,641,931 | 25,493,131 | |||||||||
| Net (decrease) increase in short-term borrowings | (42,453,489 | ) | 72,381,951 | (9,745,072 | ) | |||||||
| Activity in Federal Home Loan Bank advances: | ||||||||||||
| Advances | 23,000,000 | 5,000,000 | 36,000,000 | |||||||||
| Calls and maturities | (25,400,000 | ) | (24,000,000 | ) | (13,100,000 | ) | ||||||
| Prepayments | - | (15,832,099 | ) | - | ||||||||
| Net increase (decrease) in other borrowings | 2,008,099 | (13,839,122 | ) | 7,395,184 | ||||||||
Proceeds from issuance of Series A Subordinated Notes and detachable warrants to purchase 54,000 shares of common stock | - | - | 2,700,000 | |||||||||
| Payment of cash dividends on common and preferred stock | (4,088,949 | ) | (3,712,493 | ) | (4,052,089 | ) | ||||||
| Redemption of 10,223 share of Series F Noncumulative Perpetual Preferred Stock, net | (10,223,000 | ) | - | - | ||||||||
| Proceeds from issuance of 40,090 shares of Series F Noncumulative Perpetual Preferred Stock, net | - | 39,996,922 | - | |||||||||
| Redemption of Series D Cumulative Perpetual Preferred Stock, net | - | (38,237,000 | ) | - | ||||||||
Repurchase of 521,888 shares of common stock warrants issued in conjunction with Series D Cumulative Perpetual Preferred Stock | - | (1,100,000 | ) | - | ||||||||
| Proceeds from issuance of Series E Noncumulative Convertible Perpetual Preferred Stock, net | - | - | 3,187,233 | |||||||||
| Proceeds from issuance of common stock, net | 994,174 | 477,339 | 261,547 | |||||||||
| Purchase of noncontrolling interests | (1,934,532 | ) | - | (420,000 | ) | |||||||
| Net cash provided by financing activities | 110,558,615 | 111,777,429 | 47,719,934 | |||||||||
| Net increase in cash and due from banks | 8,431,736 | 11,105,904 | 6,152,760 | |||||||||
| Cash and due from banks, beginning | 53,136,710 | 42,030,806 | 35,878,046 | |||||||||
| Cash and due from banks, ending | $ | 61,568,446 | $ | 53,136,710 | $ | 42,030,806 | ||||||
| Supplemental Disclosures of Cash Flow Information, cash payments for: | ||||||||||||
| Interest | $ | 19,962,937 | $ | 24,194,198 | $ | 31,017,369 | ||||||
| Income and franchise taxes | 1,345,000 | 1,246,489 | 3,236,558 | |||||||||
| Supplemental Schedule of Noncash Investing Activities: | ||||||||||||
Change in accumulated other comprehensive income (loss), unrealized gains (losses) on on securities available for sale, net | (48,031 | ) | 4,050,549 | 568,557 | ||||||||
Exchange of shares of common stock in connection with payroll taxes for restricted stock and options exercised | (10,415 | ) | - | (3,097 | ) | |||||||
| Transfers of loans to other real estate owned | 2,143,017 | 9,446,588 | 6,122,328 | |||||||||
| Liability established for purchase of noncontrolling interest | 2,847,687 | - | - | |||||||||
QCR Holdings, Inc. and Subsidiaries
Consolidated Statements of Cash Flows - Continued
Years Ended December 31, 2014, 2013, and 2012
2014 | 2013 | 2012 | ||||||||||
Supplemental Disclosures of Cash Flow Information, cash payments for: | ||||||||||||
Interest | $ | 16,826,619 | $ | 17,953,357 | $ | 19,962,937 | ||||||
Income and franchise taxes | 4,541,000 | 3,011,244 | 1,345,000 | |||||||||
Supplemental Schedule of Noncash Investing Activities: | ||||||||||||
Change in accumulated other comprehensive income (loss), unrealized gains (losses) on on securities available for sale and interest rate cap derivatives, net | 11,708,770 | (18,350,669 | ) | (48,031 | ) | |||||||
Exchange of shares of common stock in connection with payroll taxes for restricted stock and options exercised | (177,984 | ) | (434,545 | ) | (10,415 | ) | ||||||
Transfers of loans to other real estate owned | 5,594,256 | 7,115,008 | 2,143,017 | |||||||||
Due from broker | 2,290,930 | - | - | |||||||||
Liability established for purchase of noncontrolling interest | - | - | 2,847,687 | |||||||||
Supplemental disclosure of cash flow information for Community National Acquisition: | ||||||||||||
Fair value of assets acquired: | ||||||||||||
Cash and due from banks * | $ | - | $ | 9,286,757 | $ | - | ||||||
Federal funds sold | - | 12,335,000 | - | |||||||||
Interest-bearing deposits at financial institutions | - | 2,024,539 | - | |||||||||
Securities available for sale | - | 45,853,826 | - | |||||||||
Loans/leases receivable held for investment, net | - | 195,658,486 | - | |||||||||
Premises and equipment, net | - | 8,132,021 | - | |||||||||
Core deposit intangible | - | 3,440,076 | - | |||||||||
Bank-owned life insurance | - | 4,595,529 | - | |||||||||
Restricted investment securities | - | 1,259,375 | - | |||||||||
Other real estate owned | - | 550,326 | - | |||||||||
Other assets | - | 5,178,583 | - | |||||||||
Total assets acquired | $ | - | $ | 288,314,518 | $ | - | ||||||
Fair value of liabilities assumed: | ||||||||||||
Deposits | $ | - | $ | 255,045,071 | $ | - | ||||||
Other borrowings | - | 3,950,000 | - | |||||||||
Junior subordinated debentures | - | 4,125,175 | - | |||||||||
Other liabilities | - | 3,911,053 | - | |||||||||
Total liabilities assumed | $ | - | $ | 267,031,299 | $ | - | ||||||
Net assets acquired | $ | - | $ | 21,283,219 | $ | - | ||||||
Consideration paid: | ||||||||||||
Cash paid * | $ | - | $ | 6,261,684 | $ | - | ||||||
Issuance of 834,715 shares of common stock | - | 13,180,150 | - | |||||||||
Total consideration paid | $ | - | $ | 19,441,834 | $ | - | ||||||
Bargain purchase gain | $ | - | $ | 1,841,385 | $ | - | ||||||
* Net cash received at closing totaled $3,025,073 | ||||||||||||
Supplemental disclosure of cash flow information for sales of certain Community National Bank branches: | ||||||||||||
Assets sold: | ||||||||||||
Cash ** | $ | - | $ | 30,425,618 | $ | - | ||||||
Loans receivable | - | 54,458,870 | - | |||||||||
Premises and equipment, net | - | 2,373,822 | - | |||||||||
Core deposit intangible | - | 1,390,762 | - | |||||||||
Other assets | - | 138,899 | - | |||||||||
Total assets sold | $ | - | $ | 88,787,971 | $ | - | ||||||
Liabilities sold: | ||||||||||||
Deposits | $ | - | $ | 91,022,098 | $ | - | ||||||
Other liabilities | - | 100,089 | - | |||||||||
Total liabilities sold | $ | - | $ | 91,122,187 | $ | - | ||||||
Gains on sales of certain branches of Community National Bank | $ | - | $ | 2,334,216 | $ | - | ||||||
** Net cash paid at closing totaled $30,425,618
See Notes to Consolidated Financial Statements.
QCR Holdings, Inc. and Subsidiaries
Notes to Consolidated Financial Statements
Note 1. Nature of Business and Significant Accounting Policies
Nature of business:
QCR Holdings, Inc. (the “Company”) is a bank holding company providing bank and bank relatedbank-related services through its banking subsidiaries, Quad City Bank and Trust Company (“QCBT”), Cedar Rapids Bank and Trust Company (“CRBT”), and Rockford Bank and Trust Company (“RB&T”),. On May 13, 2013, the Company acquired Community National Bancorporation (“Community National”) and its banking subsidiary, Community National Bank (“CNB”). In October 2013, the Company sold certain assets and liabilities of certain branches of CNB in two separate transactions. The Company operated CNB as a separate banking charter since the acquisition until October 26, 2013, when CNB’s charter was merged with and into CRBT. CNB’s merged branch offices operate as a division of CRBT under the name of “Community Bank & Trust.” See Note 2 for additional information on the acquisition, sales of certain branches, and subsequent merger into CRBT. The Company also engages in direct financing lease contracts through its wholly-owned equity investment by QCBT in m2 Lease Funds, LLC (“m2”), QCR Holdings Statutory Trust II (“Trust II”), QCR Holdings Statutory Trust III (“Trust III”), QCR Holdings Statutory Trust IV (“Trust IV”),headquartered in Milwaukee, Wisconsin. The remaining subsidiaries of the Company consist of six non-consolidated subsidiaries formed for the issuance of trust preferred securities. The Company assumed two of these subsidiaries in the acquisition of Community National on May 13, 2013. See Note 11 for a listing of these subsidiaries and QCR Holdings Statutory Trust V (“Trust V”).additional information. QCBT is a commercial bank that serves the Iowa and Illinois Quad Cities and adjacent communities. CRBT is a commercial bank that serves Cedar Rapids, Iowa, and adjacent communities.communities including Cedar Falls and Waterloo, Iowa, under the name “Community Bank & Trust.” RB&T is a commercial bank that serves Rockford, Illinois, and adjacent communities.
QCBT and CRBT are chartered and regulated by the state of Iowa, and RB&T is chartered and regulated by the state of Illinois. All three subsidiary banks are insured and subject to regulation by the Federal Deposit Insurance Corporation (“FDIC”), and are members of and regulated by the Federal Reserve System. m2, which is now a wholly-owned subsidiary of QCBT, based in the Milwaukee, Wisconsin area, is engaged in the business of direct financing lease contracts. QCBT previously owned 80% of m2. In August 2012, QCBT purchased the remaining 20% noncontrolling interest. See Note 2123 for further discussion of the acquisition. Velie Plantation Holding Company, LLC ("VPHC)(“VPHC”), previously owned 91% by the Company, was engaged in holding the real estate property known as the Velie Plantation in Moline, Illinois. The Velie Plantation is the location of the Company’s headquarters. In October 2012, the Company acquired the remaining 9% noncontrolling interest, and effective December 31, 2012, VPHC was dissolved. Trust II, Trust III, Trust IVIn December 2014, the Company entered into a joint venture providing residential real estate mortgage services and Trust V were formed for the purpose of issuing various trust preferred securities (see Note 9).
Significant accounting policies:
Accounting estimates: The preparation of financial statements, in conformity with generally accepted accounting principles, requires management to make estimates and assumptions that affect the reported amount of assets and liabilities and disclosure of contingent assets and liabilities at the date of the financial statements and the reported amounts of revenues and expenses during the reporting period. Actual results could differ from those estimates. Material estimates that are particularly susceptible to significant change in the near term relate to the determination of the allowance for estimated losses on loans/leases, other-than-temporary impairment of securities, and the fair value of financial instruments.
Principles of consolidation: The accompanying consolidated financial statements include the accounts of the Company and its subsidiaries, except Trust II, Trust III, Trust IV and Trust V,those six subsidiaries formed for the issuance of trust preferred securities which do not meet the criteria for consolidation. See Note 11 for a detailed listing of these subsidiaries. All material intercompany accounts and transactions have been eliminated in consolidation.
QCR Holdings, Inc. and Subsidiaries
Notes to Consolidated Financial Statements
Note 1. Nature of Business and Significant Accounting Policies (continued)
Presentation of cash flows: For purposes of reporting cash flows, cash and due from banks include cash on hand and noninterest bearing amounts due from banks. Cash flows from federal funds sold, interest bearing deposits at financial institutions, loans/leases, deposits, and short-term and other borrowings are treated as net increases or decreases.
Cash and due from banks: The subsidiary banks are required by federal banking regulations to maintain certain cash and due from bank reserves. The reserve requirement was approximately $15,512,000$23,251,000 and $6,247,000$22,435,000 as of December 31, 20122014 and 2011,2013, respectively.
Investment securities: Investment securities held to maturity are those debt securities that the Company has the ability and intent to hold until maturity regardless of changes in market conditions, liquidity needs, or changes in general economic conditions. Such securities are carried at cost adjusted for amortization of premiums and accretion of discounts. If the ability or intent to hold to maturity is not present for certain specified securities, such securities are considered available for sale as the Company intends to hold them for an indefinite period of time but not necessarily to maturity. Any decision to sell a security classified as available for sale would be based on various factors, including movements in interest rates, changes in the maturity mix of the Company's assets and liabilities, liquidity needs, regulatory capital considerations, and other factors. Securities available for sale are carried at fair value. Unrealized gains or losses, net of taxes, are reported as increases or decreases in accumulated other comprehensive income. Realized gains or losses, determined on the basis of the cost of specific securities sold, are included in earnings.
All securities are evaluated to determine whether declines in fair value below their amortized cost are other-than-temporary.
In estimating other-than-temporary impairment losses on available for sale debt securities, management considers a number of factors including, but not limited to, (1) the length of time and extent to which the fair value has been less than amortized cost, (2) the financial condition and near-term prospects of the issuer, (3) the current market conditions, and (4) the intent of the Company to not sell the security prior to recovery and whether it is not more-likely-than-not that it will be required to sell the security prior to recovery. If the Company does not intend to sell the security, and it is not more-likely-than-not the entity will be required to sell the security before recovery of its amortized cost basis, the Company will recognize the credit component of an other-than-temporary impairment of a debt security in earnings and the remaining portion in other comprehensive income. For held to maturity debt securities, the amount of an other-than-temporary impairment recorded in other comprehensive income for the noncredit portion would be amortized prospectively over the remaining life of the security on the basis of the timing of future estimated cash flows of the security.
In estimating other-than-temporary impairment losses on available for sale equity securities management considers factors (1), (2) and (3) above as well as whether the Company has the intent and the ability to hold the security until its recovery. If the Company (a) intends to sell an impaired equity security and does not expect the fair value of the security to fully recover before the expected time of sale, or (b) does not have the ability to hold the security until its recovery, the security is deemed other-than-temporarily impaired and the impairment is charged to earnings. The Company recognizes an impairment loss through earnings if based upon other factors the loss is deemed to be other-than-temporary even if the decision to sell has not been made.
Loans receivable, held for sale: Residential real estate loans which are originated and intended for resale in the secondary market in the foreseeable future are classified as held for sale. These loans are carried at the lower of cost or estimated market value in the aggregate. As assets specifically acquired for resale, the origination of, disposition of, and gain/loss on these loans are classified as operating activities in the statement of cash flows.
QCR Holdings, Inc. and Subsidiaries
Notes to Consolidated Financial Statements
Note 1. Nature of Business and Significant Accounting Policies (continued)
Loans receivable, held for investment: Loans that management has the intent and ability to hold for the foreseeable future, or until pay-off or maturity occurs, are classified as held for investment. These loans are stated at the amount of unpaid principal adjusted for charge-offs, the allowance for estimated losses on loans, and any deferred fees and/or costs on originated loans. Interest is credited to earnings as earned based on the principal amount outstanding. Deferred direct loan origination fees and/or costs are amortized as an adjustment of the related loan’s yield. As assets held for and used in the production of services, the origination and collection of these loans are classified as investing activities in the statement of cash flows.
The Company discloses allowance for credit losses (also known as “allowance for estimated loss on loans/leases” or “allowance”) and fair value by portfolio segment, and credit quality information, impaired financing receivables, nonaccrual status, and troubled debt restructurings by class of financing receivable. A portfolio segment is the level at which the Company develops and documents a systematic methodology to determine its allowance for credit losses. A class of financing receivable is a further disaggregation of a portfolio segment based on risk characteristics and the Company’s method for monitoring and assessing credit risk. See thisthe following information following and in Note 3.
The Company’s portfolio segments are as follows:
● | Commercial and industrial |
● | Commercial real estate |
● | Residential real estate |
● | Installment and other consumer |
Direct financing leases would beare considered a segment within the overall loan/lease portfolio. The accounting policies for direct financing leases are disclosed below.
The Company’s classes of loans receivable are as follows:
● | Commercial and industrial |
● | Owner-occupied commercial real estate |
● | Commercial construction, land development, and other land loans that are not owner-occupied commercial real estate |
● | Other non-owner-occupied commercial real estate |
● | Residential real estate |
● | Installment and other consumer |
Direct financing leases would beare considered a class of financing receivable within the overall loan/lease portfolio. The accounting policies for direct financing leases are disclosed below.
Generally, for all classes of loans receivable, loans are considered past due when contractual payments are delinquent for 31 days or greater.
QCR Holdings, Inc. and Subsidiaries
Notes to Consolidated Financial Statements
Note 1. Nature of Business and Significant Accounting Policies (continued)
For all classes of loans receivable, loans will generally be placed on nonaccrual status when the loan has become 90 days past due (unless the loan is well secured and in the process of collection); or if any of the following conditions exist:
● | It becomes evident that the borrower will not make payments, or will not or cannot meet the terms for renewal of a matured |
● | When full repayment of principal and interest is not |
● | When the loan is graded “doubtful”; |
● | When the borrower files bankruptcy and an approved plan of reorganization or liquidation is not anticipated in the near |
● | When foreclosure action is initiated. |
When a loan is placed on nonaccrual status, income recognition is ceased. Previously recorded but uncollected amounts of interest on nonaccrual loans are reversed at the time the loan is placed on nonaccrual status. Generally, cash collected on nonaccrual loans is applied to principal. Should full collection of principal be expected, cash collected on nonaccrual loans can be recognized as interest income.
For all classes of loans receivable, nonaccrual loans may be restored to accrual status provided the following criteria are met:
● | The loan is current, and all principal and interest amounts contractually due have been |
● | All principal and interest amounts contractually due, including past due payments, are reasonably assured of repayment within a reasonable |
● | There is a period of minimum repayment performance, as follows, by the borrower in accordance with contractual terms: |
o | Six months of repayment performance for contractual monthly payments, or |
o | One year of repayment performance for contractual quarterly or semi-annual |
Direct finance leases receivable, held for investment: The Company leases machinery and equipment to customers under leases that qualify as direct financing leases for financial reporting and as operating leases for income tax purposes. Under the direct financing method of accounting, the minimum lease payments to be received under the lease contract, together with the estimated unguaranteed residual values (approximately 3% to 15% of the cost of the related equipment), are recorded as lease receivables when the lease is signed and the lease property delivered to the customer. The excess of the minimum lease payments and residual values over the cost of the equipment is recorded as unearned lease income. Unearned lease income is recognized over the term of the lease on a basis that results in an approximate level rate of return on the unrecovered lease investment. Lease income is recognized on the interest method. Residual value is the estimated fair market value of the equipment on lease at lease termination. In estimating the equipment’s fair value at lease termination, the Company relies on historical experience by equipment type and manufacturer and, where available, valuations by independent appraisers, adjusted for known trends. The Company’s estimates are reviewed continuously to ensure reasonableness; however, the amounts the Company will ultimately realize could differ from the estimated amounts. If the review results in a lower estimate than had been previously established, a determination is made as to whether the decline in estimated residual value is other-than-temporary. If the decline in estimated unguaranteed residual value is judged to be other-than-temporary, the accounting for the transaction is revised using the changed estimate. The resulting reduction in the investment is recognized as a loss in the period in which the estimate is changed. An upward adjustment of the estimated residual value is not recorded.
The policies for delinquency and nonaccrual for direct financing leases are materially consistent with those described above for all classes of loan receivables.
QCR Holdings, Inc. and Subsidiaries
Notes to Consolidated Financial Statements
Note 1. Nature of Business and Significant Accounting Policies (continued)
The Company defers and amortizes fees and certain incremental direct costs over the contractual term of the lease as an adjustment to the yield. These initial direct leasing costs generally approximate 4%5.5% of the leased asset’s cost. The unamortized direct costs are recorded as a reduction of unearned lease income.
Troubled debt restructuringsrestructurings: Troubled debt restructuring exists when the Company, for economic or legal reasons related to the borrower’s/lessee’s financial difficulties, grants a concession (either imposed by court order, law, or agreement between the borrower/lessee and the Company) to the borrower/lessee that it would not otherwise consider. The Company is attempting to maximize its recovery of the balances of the loans/leases through these various concessionary restructurings.
The following criteria, related to granting a concession, together or separately, create a troubled debt restructuring:
● | A modification of terms of a debt such as one or a combination of: |
o | The reduction of the stated interest rate. |
o | The extension of the maturity date or dates at a stated interest rate lower than the current market rate for the new debt with similar risk. |
o | The reduction of the face amount or maturity amount of the debt as stated in the instrument or other agreement. |
o | The reduction of accrued interest. |
● | A transfer from the borrower/lessee to the Company of receivables from third parties, real estate, other assets, or an equity position in the borrower to fully or partially satisfy a loan. |
● | The issuance or other granting of an equity position to the Company to fully or partially satisfy a debt unless the equity position is granted pursuant to existing terms for converting the debt into an equity position. |
Allowance for estimated losses on loans/leases:For all portfolio segments, the allowance for estimated losses on loans/leases (“allowance”) is established as losses are estimated to have occurred through a provision for loan/lease losses (“provision”) charged to earnings. Loan/lease losses, for all portfolio segments, are charged against the allowance when management believes the uncollectability of a loan/lease balance is confirmed. Subsequent recoveries, if any, are credited to the allowance.
For all portfolio segments, the allowance for estimated losses on loans/leases is evaluated on a regular basis by management and is based upon management’s periodic review of the collectability of the loans/leases in light of historical experience, the nature and volume of the loan/lease portfolio, adverse situations that may affect the borrower’s/lessee’s ability to repay, estimated value of any underlying collateral and prevailing economic conditions. This evaluation is inherently subjective as it requires estimates that are susceptible to significant revision as more information becomes available.
QCR Holdings, Inc. and Subsidiaries
Notes to Consolidated Financial Statements
Note 1. Nature of Business and Significant Accounting Policies (continued)
A discussion of the risk characteristics and the allowance for estimated losses on loans/leases by each portfolio segment follows:
Forcommercial and industrial loans, the Company focuses on small and mid-sized businesses with primary operations as wholesalers, manufacturers, building contractors, business services companies, other banks, and retailers. The Company provides a wide range of commercial and industrial loans, including lines of credit for working capital and operational purposes, and term loans for the acquisition of facilities, equipment and other purposes. Approval is generally based on the following factors:
● | Ability and stability of current management of the borrower; |
● | Stable earnings with positive financial trends; |
● | Sufficient cash flow to support debt repayment; |
● | Earnings projections based on reasonable assumptions; |
● | Financial strength of the industry and business; and |
● | Value and marketability of collateral. |
Collateral for commercial and industrial loans generally includes accounts receivable, inventory, equipment and real estate. The Company’s lending policy specifies approved collateral types and corresponding maximum advance percentages. The value of collateral pledged on loans must exceed the loan amount by a margin sufficient to absorb potential erosion of its value in the event of foreclosure and cover the loan amount plus costs incurred to convert it to cash.
The Company’s lending policy specifies maximum term limits for commercial and industrial loans. For term loans, the maximum term is generally 7 years. Generally, term loans range from 3 to 5 years. For lines of credit, the maximum term is typically 365 days.
In addition, the Company often takes personal guarantees or cosignerscosignors to help assure repayment. Loans may be made on an unsecured basis if warranted by the overall financial condition of the borrower.
Commercial real estate loans are subject to underwriting standards and processes similar to commercial and industrial loans, in addition to those standards and processes specific to real estate loans. Collateral for commercial real estate loans generally includes the underlying real estate and improvements, and may include additional assets of the borrower. The Company’s lending policy specifies maximum loan-to-value limits based on the category of commercial real estate (commercial real estate loans on improved property, raw land, land development, and commercial construction). These limits are the same limits established by regulatory authorities.
The Company’s lending policy also includes guidelines for real estate appraisals, including minimum appraisal standards based on certain transactions. In addition, the Company often takes personal guarantees to help assure repayment.
In addition, management tracks the level of owner-occupied commercial real estate loans versus non-owner occupied loans. Owner-occupied loans are generally considered to have less risk. As of December 31, 20122014 and 2011,2013, approximately 35%37% and 29%39%, respectively, of the commercial real estate loan portfolio was owner-occupied.
The Company’s lending policy limits non-owner occupied commercial real estate lending to 300% of total risk-based capital, and limits construction, land development, and other land loans to 100% of total risk-based capital. Exceeding these limits warrants the use of heightened risk management practices in accordance with regulatory guidelines. As of December 31, 20122014 and 2011,2013, all three subsidiary banks were in compliance with these limits.
In some instances for all loans/leases, it may be appropriate to originate or purchase loans/leases that are exceptions to the guidelines and limits established within the Company’s lending policy described above and below. In general, exceptions to the lending policy do not significantly deviate from the guidelines and limits established within the Company’s lending policy and, if there are exceptions, they are clearly noted as such and specifically identified in loan/lease approval documents.
QCR Holdings, Inc. and Subsidiaries
Notes to Consolidated Financial Statements
Note 1. Nature of Business and Significant Accounting Policies (continued)
Forcommercial and industrial and commercial real estate loans, the allowance for estimated losses on loans consists of specific and general components.
The specific component relates to loans that are classified as impaired, as defined below. For those loans that are classified as impaired, an allowance is established when the discounted cash flows (or collateral value or observable market price) of the impaired loan are lower than the carrying value of that loan.
For commercial and industrial loans and all classes of commercial real estate loans, a loan is considered impaired when, based on current information and events, it is probable that the Company will be unable to collect the scheduled payments of principal or interest when due according to the contractual terms of the loan agreement. Factors considered by management in determining impairment include payment status, collateral value, and the probability of collecting scheduled principal and interest payments when due. Loans that experience insignificant payment delays and payment shortfalls generally are not classified as impaired. Management determines the significance of payment delays and payment shortfalls on a case-by-case basis, taking into consideration all of the circumstances surrounding the loan and the borrower, including the length of the delay, the reasons for the delay, the borrower’s prior payment record, and the amount of the shortfall in relation to the principal and interest owed. Impairment is measured on a case-by-case basis by either the present value of expected future cash flows discounted at the loan’s effective interest rate, the loan’s obtainable market price, or the fair value of the collateral if the loan is collateral dependent.
The general component consists of quantitative and qualitative factors and covers non-impaired loans. The quantitative factors are based on historical charge-off experience and expected loss given default derived from the Company’s internal risk rating process. See below for a detailed description of the Company’s internal risk rating scale. The qualitative factors are determined based on an assessment of internal and/or external influences on credit quality that are not fully reflected in the historical loss or risk rating data.
For commercial and industrial and commercial real estate loans, the Company utilizes the following internal risk rating scale:
1. Highest Quality – loans of the highest quality with no credit risk, including those fully secured by subsidiary bank certificates of deposit and U.S. government securities.
2. Superior Quality – loans with very strong credit quality. Borrowers have exceptionally strong earnings, liquidity, capital, cash flow coverage, and management ability. Includes loans secured by high quality marketable securities, certificates of deposit from other institutions, and cash value of life insurance. Also includes loans supported by U.S. government, state, or municipal guarantees.
3. Satisfactory Quality – Quality–loans with satisfactory credit quality. Established borrowers with satisfactory financial condition, including credit quality, earnings, liquidity, capital and cash flow coverage. Management is capable and experienced. Collateral coverage and guarantor support, if applicable, are more than adequate. Includes loans secured by personal assets and business assets, including equipment, accounts receivable, inventory, and real estate.
4. Fair Quality – Quality–loans with moderate but still acceptable credit quality. The primary repayment source remains adequate; however, management’s ability to maintain consistent profitability is unproven or uncertain. Borrowers exhibit acceptable leverage and liquidity. May include new businesses with inexperienced management or unproven performance records in relation to peer, or borrowers operating in highly cyclical or deteriorating industries.
QCR Holdings, Inc. and Subsidiaries
Notes to Consolidated Financial Statements
Note 1. Nature of Business and Significant Accounting Policies (continued)
5. Early Warning – Warning–loans where the borrowers have generally performed as agreed, however unfavorable financial trends exist or are anticipated. Earnings may be erratic, with marginal cash flow or declining sales. Borrowers reflect leveraged financial condition and/or marginal liquidity. Management may be new and a track record of performance has yet to be developed. Financial information may be incomplete, and reliance on secondary repayment sources may be increasing.
6. Special Mention – loans where the borrowers exhibit credit weaknesses or unfavorable financial trends requiring close monitoring. Weaknesses and adverse trends are more pronounced than Early Warning loans, and if left uncorrected, may jeopardize repayment according to the contractual terms. Currently, no loss of principal or interest is expected. Borrowers in this category have deteriorated to the point that it would be difficult to refinance with another lender. Special Mention should be assigned to borrowers in turnaround situations. This rating is intended as a transitional rating, therefore, it is generally not assigned to a borrower for a period of more than one year.
7. Substandard – Substandard–loans which are inadequately protected by the current sound worth and paying capacity of the obligor or of the collateral pledged, if applicable. These loans have a well-defined weakness or weaknesses which jeopardize repayment according to the contractual terms. There is distinct loss potential if the weaknesses are not corrected. Includes loans with insufficient cash flow coverage which are collateral dependent, other real estate owned, and repossessed assets.
8. Doubtful – Doubtful–loans which have all the weaknesses inherent in a Substandard loan, with the added characteristic that existing weaknesses make full principal collection, on the basis of current facts, conditions and values, highly doubtful. The possibility of loss is extremely high, but because of pending factors, recognition of a loss is deferred until a more exact status can be determined. All doubtful loans will be placed on non-accrual, with all payments, including principal and interest, applied to principal reduction.
The Company has certain loans risk-rated 7 (substandard), which are not classified as impaired based on the facts of the credit. For these non-impaired and risk-rated 7 loans, the Company does not follow the same allowance methodology as it does for all other non-impaired, collectively evaluated loans. Rather, the Company performs a more detailed analysis including evaluation of the cash flow and collateral valuations. Based upon this evaluation, an estimate of the probable loss in this portfolio is collectively evaluated under ASC 450-20. These non-impaired risk-rated 7 loans exist primarily in the commercial and industrial and commercial real estate segments.
For term commercial and industrial and commercial real estate loans or credit relationships with aggregate exposure greater than $1,000,000, a loan review is required within 15 months of the most recent credit review. The review is completed in enough detail to, at a minimum, validate the risk rating. Additionally, the review shall include an analysis of debt service requirements, covenant compliance, if applicable, and collateral adequacy. The frequency of the review is generally accelerated for loans with poor risk ratings.
The Company’s Loan Quality area will perform a documentation review of a sampling of commercial and industrial and commercial real estate loans, the primary purpose of which is to ensure the credit is properly documented and closed in accordance with approval authorities and conditions. A review will also be performed by the Company’s Internal Audit Department of a sampling of commercial and industrial and commercial real estate loans, according to an approved schedule. Validation of the risk rating is part of Internal Audit’s review. Additionally, over the past several years, the Company has contracted an independent outside third party to review a sampling of commercial and industrial and commercial real estate loans. Validation of the risk rating is part of this review as well.
The Company leases machinery and equipment to commercial and industrial customers underdirect financing leases. All lease requests are subject to the credit requirements and criteria as set forth in the lending/leasing policy. In all cases, a formal independent credit analysis of the lessee is performed.
QCR Holdings, Inc. and Subsidiaries
Notes to Consolidated Financial Statements
Note 1. Nature of Business and Significant Accounting Policies (continued)
For direct financing leases,, the allowance for estimated lease losses consists of specific and general components.
The specific component relates to leases that are classified as impaired, as defined for commercial loans above. For those leases that are classified as impaired, an allowance is established when the discounted cash flows (or collateral value or observable market price) of the impaired lease is lower than the carrying value of that lease.
The general component consists of quantitative and qualitative factors and covers nonimpaired leases. The quantitative factors are based on historical charge-off experience for the entire lease portfolio. The qualitative factors are determined based on an assessment of internal and/or external influences on credit quality that are not fully reflected in the historical loss data.
Generally, the Company’sresidential real estate loans conform to the underwriting requirements of Freddie Mac and Fannie Mae to allow the subsidiary banks to resell loans in the secondary market. The subsidiary banks structure most loans that will not conform to those underwriting requirements as adjustable rate mortgages that mature or adjust in one to five years or fixed rate mortgages that mature in 15 years, and then retain these loans in their portfolios. Servicing rights are not presently retained on the loans sold in the secondary market. The Company’s lending policy establishes minimum appraisal and other credit guidelines.
The Company provides many types ofinstallment and other consumer loans including motor vehicle, home improvement, home equity, signature loans and small personal credit lines. The Company’s lending policy addresses specific credit guidelines by consumer loan type.
Forresidential real estate loans, andinstallment and other consumer loans, these large groups of smaller balance homogenous loans are collectively evaluated for impairment. The Company applies a quantitative factor based on historical charge-off experience in total for each of these segments. Accordingly, the Company generally does not separately identify individual residential real estate loans, and/or installment or other consumer loans for impairment disclosures, unless such loans are the subject of a restructuring agreement due to financial difficulties of the borrower.
Troubled debt restructurings are considered impaired loans/leases and are subject to the same allowance methodology as described above for impaired loans/leases by portfolio segment.
Credit related financial instruments: In the ordinary course of business, the Company has entered into commitments to extend credit and standby letters of credit. Such financial instruments are recorded when they are funded.
QCR Holdings, Inc. and Subsidiaries
Notes to Consolidated Financial Statements
Note 1. Nature of Business and Significant Accounting Policies (continued)
Transfers of financial assets: Transfers of financial assets are accounted for as sales only when control over the assets has been surrendered. Control over transferred assets is deemed to be surrendered when: (1) the assets have been isolated from the Company, (2) the transferee obtains the right to pledge or exchange the assets it received, and no condition both constrains the transferee from taking advantage of its right to pledge or exchange and provides more than a modest benefit to the transferor, and (3) the Company does not maintain effective control over the transferred assets through an agreement to repurchase them before their maturity or the ability to unilaterally cause the holder to return specific assets. In addition, for transfers of a portion of financial assets (for example, participations of loan receivables), the transfer must meet the definition of a “participating interest” in order to account for the transfer as a sale. Following are the characteristics of a “participating interest”:
● | Pro-rata ownership in an entire financial asset. |
● | From the date of the transfer, all cash flows received from entire financial assets are divided proportionately among the participating interest holders in an amount equal to their share of ownership. |
● | The rights of each participating interest holder have the same priority, and no participating interest holder’s interest is subordinated to the interest of another participating interest holder. That is, no participating interest holder is entitled to receive cash before any other participating interest holder under its contractual rights as a participating interest holder. |
● | No party has the right to pledge or exchange the entire financial asset unless all participating interest holders agree to pledge or exchange the entire financial asset. |
Bank-owned life insurance: Bank-owned life insurance is carried at cash surrender value with increases/decreases reflected as income/expense in the statement of income.
Premises and equipment: Premises and equipment are stated at cost less accumulated depreciation. Depreciation is computed primarily by the straight-line method over the estimated useful lives of the assets.
Goodwill: The Company has recorded goodwill from QCBT’s purchase of 80% of m2 in August 2005. The goodwill is not being amortized, but is evaluated at least annually for impairment. An impairment charge is recognized when the calculated fair value of the reporting unit, including goodwill, is less than its carrying amount. Based on the annual analysis completed as of July 31, 2012, the Company determined that the goodwill was not impaired.
Other real estate owned: Real estate acquired through, or in lieu of, loan foreclosures, is held for sale and initially recorded at fair value less costs to sell, establishing a new cost basis. Subsequent to foreclosure, valuations are periodically performed by management and the assets are carried at the lower of carrying amount or fair value less costs to sell. Subsequent write-downs to fair value are charged to earnings.
Goodwill: The Company recorded goodwill from QCBT’s purchase of 80% of m2 in August 2005. The goodwill is not being amortized, but is evaluated at least annually for impairment. An impairment charge is recognized when the calculated fair value of the reporting unit, including goodwill, is less than its carrying amount. Based on the annual analysis completed as of September 30, 2014, the Company determined that the goodwill was not impaired.
Core deposit intangible: The Company recorded a core deposit intangible from the acquisition of Community National. The core deposit intangible was the portion of the acquisition purchase price which represented the value assigned to the existing deposit base at acquisition. The core deposit intangible has a finite life and is amortized by the straight-line method over the estimated useful life of the deposits (10 years).
QCR Holdings, Inc. and Subsidiaries
Notes to Consolidated Financial Statements
Note 1. Nature of Business and Significant Accounting Policies (continued)
Derivatives and hedging activities: The Company enters into derivative financial instruments as part of its strategy to manage its exposure to changes in interest rates.
Derivative instruments represent contracts between parties that result in one party delivering cash to the other party based on a notional amount and an underlying index (such as a rate, security price or price index) as specified in the contract. The amount of cash delivered from one party to the other is determined based on the interaction of the notional amount of the contract with the underlying index.
The derivative financial instruments currently used by the Company to manage its exposure to interest rate risk include: (1) interest rate lock commitments provided to customers to fund certain mortgage loans to be sold into the secondary market (although this type of derivative is negligible); and (2) interest rate caps to manage the interest rate risk of certain short-term fixed rate liabilities.
Interest rate caps are valued by the transaction counterparty on a monthly basis and corroborated by a third party annually. The company uses the hypothetical derivative method to assess and measure effectiveness in accordance with Accounting Standards Codification 815, Derivatives and Hedging.
Treasury stock: Treasury stock is accounted for by the cost method, whereby shares of common stock reacquired are recorded at their purchase price. When treasury stock is reissued, any difference between the sales proceeds, or fair value when issued for business combinations, and the cost is recognized as a charge or credit to additional paid-in capital.
Stock-based compensation plans: At December 31, 2012,2014, the Company had fourthree stock-based employee compensation plans, which are described more fully in Note 13.15.
The Company accounts for stock-based compensation with measurement of compensation cost for all stock-based awards at fair value on the grant date and recognition of compensation over the requisite service period for awards expected to vest.
As discussed in Note 13,15, during the years ended December 31, 2012, 2011,2014, 2013, and 2010,2012, the Company recognized stock-based compensation expense related to stock options, stock purchase plans, and stock appreciation rights of $849,760, $696,407,$891,619, $792,279, and $488,112,$849,760, respectively. As required, management made an estimate of expected forfeitures and is recognizing compensation costs only for those equity awards expected to vest.
The Company uses the Black-Scholes option pricing model to estimate the fair value of stock option grants with the following assumptions for the indicated periods:
2014 | 2013 | 2012 | ||||||||||
Dividend yield | .47% | .44% to .53% | .86% | |||||||||
Expected volatility | 29.07% to 29.18% | 29.50% to 30.56% | 29.36% | |||||||||
Risk-free interest rate | 2.69% to 2.82% | 1.71% to 2.90% | 1.98% | |||||||||
Expected life of option grants (years) | 6 | 6 | 6 | |||||||||
Weighted-average grant date fair value | $ | 5.68 | $ | 5.14 | $ | 2.79 | ||||||
| 2012 | 2011 | 2010 | |
| Dividend yield | .86% | .88% to 1.00% | .89% to .90% |
| Expected volatility | 29.36% | 29.64% to 30.30% | 26.72% to 26.88% |
| Risk-free interest rate | 1.98% | 1.90% to 3.58% | 3.86% to 4.21% |
| Expected life of option grants (years) | 6 | 6 | 6 |
| Weighted-average grant date fair value | $2.79 | $2.74 | $2.89 |
QCR Holdings, Inc. and Subsidiaries
Notes to Consolidated Financial Statements
Note 1. Nature of Business and Significant Accounting Policies (continued)
The Company also uses the Black-Scholes option pricing model to estimate the fair value of stock purchase grants with the following assumptions for the indicated periods:
| 2012 | 2011 | 2010 | |
| Dividend yield | .61% to .88% | .88% to 1.12% | .85% to .96% |
| Expected volatility | 27.20% to 31.11% | 51.62% to 53.58% | 39.56% to 56.43% |
| Risk-free interest rate | .03% to .18% | .08% to .23% | .13% to .29% |
| Expected life of purchase grants (months) | 3 to 6 | 3 to 6 | 3 to 6 |
| Weighted-average grant date fair value | $1.71 | $1.68 | $1.81 |
2014 | 2013 | 2012 | ||||||||||
Dividend yield | .46% to .47% | .53% to .61% | .61% to .88% | |||||||||
Expected volatility | 16.96% to 19.35% | 23.05% to 24.25% | 27.20% to 31.11% | |||||||||
Risk-free interest rate | .04% to .12% | .10% to .18% | .03% to .18% | |||||||||
Expected life of purchase grants (months) | 3 to 6 | 3 to 6 | 3 to 6 | |||||||||
Weighted-average grant date fair value | $ | 2.37 | $ | 2.10 | $ | 1.71 | ||||||
The fair value is amortized on a straight-line basis over the vesting periods of the grants and will be adjusted for subsequent changes in estimated forfeitures. The expected dividend yield assumption is based on the Company's current expectations about its anticipated dividend policy. Expected volatility is based on historical volatility of the Company's common stock price. The risk-free interest rate for periods within the contractual life of the option or purchase is based on the U.S. Treasury yield curve in effect at the time of the grant. The expected life of the option and purchase grants is derived using the “simplified” method and represents the period of time that options and purchases are expected to be outstanding. Historical data is used to estimate forfeitures used in the model. Two separate groups of employees (employees subject to broad based grants, and executive employees and directors) are used.
As of December 31, 2012,2014, there was $419,100$737,464 of unrecognized compensation cost related to share based payments, which is expected to be recognized over a weighted average period of 2.22.4 years.
The aggregate intrinsic value is calculated as the difference between the exercise price of the underlying awards and the quoted price of the Company's common stock for the 305,222583,466 options that were in-the-money at December 31, 2012.2014. The aggregate intrinsic value at December 31, 20122014 was $1,295,785$2,771,424 on options outstanding and $398,168$1,754,995 on options exercisable. During the years ended December 31, 2012, 20112014, 2013 and 2010,2012, the aggregate intrinsic value of options exercised under the Company's stock option plans was $56,371, $47,026,$173,105, $268,920, and $16,639,$56,371, respectively, and determined as of the date of the option exercise.
QCR Holdings, Inc. and Subsidiaries
Notes to Consolidated Financial Statements
Note 1. Nature of Business and Significant Accounting Policies (continued)
Income taxes: The Company files its tax return on a consolidated basis with its subsidiaries. The entities follow the direct reimbursement method of accounting for income taxes under which income taxes or credits which result from the inclusion of the subsidiaries in the consolidated tax return are paid to or received from the parent company.
Deferred income taxes are provided under the liability method whereby deferred tax assets are recognized for deductible temporary differences and net operating loss and tax credit carryforwards and deferred tax liabilities are recognized for taxable temporary differences. Temporary differences are the differences between the reported amounts of assets and liabilities and their tax basis. Deferred tax assets are reduced by a valuation allowance when, in the opinion of management, it is more likely than not that some or all of the deferred tax assets will not be realized. Deferred tax assets and liabilities are adjusted for the effects of changes in tax laws and rates on the date of enactment.
When tax returns are filed, it is highly certain that some positions taken would be sustained upon examination by the taxing authorities, while others are subject to uncertainty about the merits of the position taken or the amount of the position that would be ultimately sustained. The benefit of a tax position is recognized in the financial statements in the period during which, based on all available evidence, management believes it is more likely than not that the position will be sustained upon examination, including the resolution of appeals or litigation processes, if any. Tax positions taken are not offset or aggregated with other positions. Tax positions that meet the more-likely-than-notmore likely than not recognition threshold are measured as the largest amount of tax benefit that is more than 50 percent likely of being realized upon settlement with the applicable taxing authority. The portion of the benefits associated with tax positions taken that exceeds the amount measured as described above is reflected as a liability for unrecognized tax benefits in the accompanying balance sheet along with any associated interest and penalties that would be payable to the taxing authorities upon examination.
Interest and penalties associated with unrecognized tax benefits are classified as additional income taxes in the statements of income.
Trust assets: Trust assets held by the subsidiary banks in a fiduciary, agency, or custodial capacity for their customers, other than cash on deposit at the subsidiary banks, are not included in the accompanying consolidated financial statements since such items are not assets of the subsidiary banks.
Earnings per common share: See Note 1517 for a complete description and calculation of basic and diluted earnings per common share.
Reclassifications: Certain amounts in the prior year financial statements have been reclassified, with no effect on net income, comprehensive income, or stockholders’ equity, to conform with the current period presentation.
QCR Holdings, Inc. and Subsidiaries
Notes to Consolidated Financial Statements
Note 1. Nature of Business and Significant Accounting Policies (Continued)
New accounting pronouncementspronouncements::
In May 2011,January 2014, the Financial Accounting Standards Board (“FASB”) issued Accounting Standards Update (“ASU”) 2014-04,Reclassification of Residential Real Estate Collateralized Consumer Mortgage Loans upon Foreclosure.The objective of ASU 2011-04, Fair Value Measurement (Topic 820) - Amendments2014-04 is to Achieve Common Fair Value Measurements and Disclosure Requirementsreduce diversity by clarifying when an in U.S. GAAP and IFRS. ASU 2011-04 amended Topic 820, Fair Value Measurements and Disclosures,substance repossession or foreclosure occurs, that is, when a creditor should be considered to convergehave received physical possession of residential real estate property collateralizing a consumer mortgage loan such that the fair value measurement guidance in U.S. generally accepted accounting principles and International Financial Reporting Standards. ASU 2011-04 clarified the application of existing fair value measurement requirements, changed certain principles in Topic 820 and required additional fair value disclosures. ASU 2011-04 was effective for annual periods beginning after December 15, 2011, and did not have a significant impact on the Company’s consolidated financial statements. See Note 19.
In February 2013,May 2014, FASB issued ASU 2013-02, Comprehensive Income (Topic 220) – Reporting2014-09,Revenue from Contracts with Customers. ASU 2014-09 implements a common revenue standard that clarifies the principles for recognizing revenue. The core principle of Amounts Reclassified out of Accumulated Other Comprehensive Income. ASU 2013-02 supersedes and replaces the presentation requirements for reclassifications out of accumulated other comprehensive income (“AOCI”) in ASUs 2011-05 and 2011-12, which were adopted by the Company during the current year. The amendments require2014-09 is that an entity should recognize revenue to provide information aboutdepict the amounts reclassified outtransfer of AOCI by component. In addition,promised goods or services to customers in an amount that reflects the consideration to which the entity expects to be entitled in exchange for those goods or services. To achieve that core principle, an entity is required to present, either onshould apply the face offollowing steps: (i) identify the statement where net income is presented orcontract(s) with a customer, (ii) identify the performance obligations in the notes, significant amounts reclassified out of AOCI bycontract, (iii) determine the respective line items of net income iftransaction price, (iv) allocate the amount reclassified is requiredtransaction price to be reclassified in its entiretythe performance obligations in the same reporting period. For other amounts that are not required to be reclassified in their entirety to net income, ancontract and (v) recognize revenue when (or as) the entity satisfies a performance obligation. ASU 2014-09 is required to cross-reference to other disclosures required. Adoptioneffective on January 1, 2017 and is not expected to have a significant impact on the Company’s consolidated financial statements.
In June 2014, FASB issued ASU 2014-11,Transfers and Servicing. ASU 2014-11 requires that repurchase-to-maturity transactions be accounted for as secured borrowings, consistent with the accounting for other repurchase agreements. In addition, ASU 2014-11 requires separate accounting for repurchase financings, which entail the transfer of a financial asset executed contemporaneously with a repurchase agreement with the same counterparty. The standard requires entities to disclose certain information about transfers accounted for as sales in transactions that are economically similar to repurchase agreements. In addition, ASU 2014-11 requires disclosures related to collateral and remaining tenor and of the potential risks associated with repurchase agreements, securities lending transactions and repurchase-to-maturity transactions. ASU 2014-11 is effective on January 1, 2015 and is not expected to have a significant impact on the Company’s consolidated financial statements.
In August 2014, FASB issued ASU 2014-14,Classification of Certain Government-Guaranteed Mortgage Loans Upon Foreclosure. ASU 2014-14 requires creditors to reclassify loans that are within the scope of the ASU to “other receivables” upon foreclosure, rather than reclassifying them as other real estate owned. The most common types of government guaranteed loans include those guaranteed by the Federal Housing Authority (FHA), U.S. Department of Housing and Urban Development (HUD), U.S. Department of Veterans Affairs (VA) and the U.S. Small Business Administration (SBA). The separate other receivable recorded upon foreclosure is to be measured based on the amount of the loan balance (principal and interest) the creditor expects to recover from the guarantor. ASU 2014-14 is effective for fiscal years, and interim periods within those years, beginning after December 15, 2014 and is not expected to have a significant impact on the Company’s consolidated financial statements.
QCR Holdings, Inc. and Subsidiaries
Notes to Consolidated Financial Statements
Note 2. Community National Bancorporation and Community National Bank
On May 13, 2013, the Company acquired 100% of Community National’s outstanding common stock for aggregate consideration totaling $19,441,834, which consisted of 834,715 shares of the Company’s common stock valued at $13,180,150 and cash of $6,261,684. Community National was a bank holding company providing bank and bank related services through its wholly-owned bank subsidiary, CNB. CNB was a commercial bank headquartered in Waterloo, Iowa serving Waterloo and Cedar Falls, Iowa. As a de novo bank, CNB commenced its operations in 1997. Previously, CNB also served Mason City, Iowa and Austin, Minnesota. On October 4, 2013, the Company sold certain assets and liabilities of the two Mason City branches of CNB. And, on October 11, 2013, the Company sold certain assets and liabilities of the two Austin branches of CNB. The Company operated CNB as a separate banking charter from the date of acquisition until October 26, 2013, when CNB’s charter was merged with and into CRBT. CNB’s merged branch offices now operate as a division of CRBT under the name “Community Bank & Trust.”
The Company accounted for the business combination under the acquisition method of accounting in accordance with Accounting Standards Codification (“ASC”) 805, “Business Combinations” (“ASC 805”). The Company recognized the full fair value of the assets acquired and liabilities assumed at the acquisition date, net of applicable income tax effects. The excess of fair value of net assets over the carrying value is recorded as bargain purchase gain which is included in noninterest income on the statement of income. The market value adjustments are accreted or amortized on a level yield basis over the expected term. Additionally, the Company recorded a core deposit intangible totaling $3,440,076, which was the portion of the acquisition purchase price that represented the value assigned to the existing deposit base at acquisition. The core deposit intangible has a finite life and is amortized by the straight-line method over the estimated useful life of the deposits (10 years). Following is a rollforward of the core deposit intangible for the years ended December 31, 2014 and 2013:
2014 | 2013 | |||||||
Balance, beginning | $ | 1,870,433 | $ | - | ||||
Core deposit intangible from Community National Acquistion | - | 3,440,076 | ||||||
Amortization expense | (199,512 | ) | (178,881 | ) | ||||
Core deposit intangible sold in branch sales | - | (1,390,762 | ) | |||||
Balance, ending | $ | 1,670,921 | $ | 1,870,433 | ||||
The Company expects annual amortization expense of $199,512 for each of the five succeeding years and $673,361 combined in years thereafter.
QCR Holdings, Inc. and Subsidiaries
Notes to Consolidated Financial Statements
Note 2. InvestmentCommunity National Bancorporation and Community National Bank (continued)
The following table presents the gross carrying amount, accumulated amortization, and net carrying amount of the core deposit intangible as of December 31, 2014 and 2013.
2014 | 2013 | |||||||
Gross carrying amount | $ | 1,995,127 | $ | 1,995,127 | ||||
Accumulated amortization | (324,206 | ) | (124,694 | ) | ||||
Net carrying amount | $ | 1,670,921 | $ | 1,870,433 | ||||
The Company’s acquired loans were recorded at fair value at the acquisition date and no separate valuation allowance was established. The initial fair value was determined with the assistance of a valuation specialist that discounted expected cash flows at appropriate rates. The discount rates were based on market rates for new originations of comparable loans and did not include a factor for credit losses, as that was included in the estimated cash flows. ASC Topic 310-30, “Loans and Debt Securities Acquired with Deteriorated Credit Quality”, applies to loans acquired in a transfer with evidence of deterioration of credit quality for which it is probable, at acquisition, that the investor will be unable to collect all contractually required payments receivable. If both conditions exist, the Company determines whether to account for each loan individually or whether such loans will be assembled into pools based on common risk characteristics such as credit score, loan type, and origination date. Based on this evaluation, the Company determined that the loans acquired from the Community National acquisition subject to ASC Topic 310-30 would be accounted for individually. At the acquisition date, the historical cost and fair value of these loans totaled $3,033,022 and $2,207,891, respectively.
The Company considered expected prepayments and estimated the total expected cash flows, which includes undiscounted expected principal and interest. The excess of that amount over the fair value of the loan is referred to as accretable yield. Accretable yield is recognized as interest income on a constant yield basis over the expected life of the loan. The excess of the contractual cash flows over expected cash flows is referred to as nonaccretable difference and is not accreted into income. Over the life of the loan, the Company continues to estimate expected cash flows. Subsequent decreases in expected cash flows are recognized as impairments in the current period through a provision for loan losses. Subsequent increases in cash flows to be collected are first used to reverse any existing valuation allowance and any remaining increase is recognized prospectively through an adjustment of the loan’s yield over its remaining life. At the acquisition date, accretable yield totaled $4,128,315 and nonaccretable yield totaled $397,894. At December 31, 2014 and 2013, accretable yield totaled $1,215,398 and $2,068,332 and nonaccretable yield totaled $98,615 and $233,933, respectively. The decline in accretable yield was primarily the result of accelerated accretion of accretable yield for the acquired performing loans sold in the branch sales, early payoffs of acquired performing loans and the predetermined schedule of accretable yield.
The Company assumed junior subordinated debentures with principal outstanding of $6,702,000 and fair value of $4,125,175 after a discount of $2,576,825. The initial fair value was determined with the assistance of a valuation specialist that discounted expected cash flows at appropriate rates. The discount is accreted as interest expense on a level yield basis over the expected remaining term of the junior subordinated debentures.
Results of the operations of the acquired business are included in the income statement from the effective date of the acquisition.
QCR Holdings, Inc. and Subsidiaries
Notes to Consolidated Financial Statements
Note 2. Community National Bancorporation and Community National Bank (continued)
The fair values of the assets acquired and liabilities assumed, including the consideration paid and resulting bargain purchase gain, is as follows:
As of | ||||||
May 13, 2013 | ||||||
ASSETS | ||||||
Cash and due from banks | $ | 9,286,757 | ||||
Federal funds sold | 12,335,000 | |||||
Interest-bearing deposits at financial institutions | 2,024,539 | |||||
Securities available for sale | 45,853,826 | |||||
Loans/leases receivable, net | 195,658,486 | |||||
Premises and equipment | 8,132,021 | |||||
Core deposit intangible | 3,440,076 | |||||
Bank-owned life insurance | 4,595,529 | |||||
Restricted investment securities | 1,259,375 | |||||
Other real estate owned | 550,326 | |||||
Other assets | 5,178,583 | |||||
Total assets acquired | $ | 288,314,518 | ||||
LIABILITIES | ||||||
Deposits | $ | 255,045,071 | ||||
Other borrowings | 3,950,000 | |||||
Junior subordinated debentures | 4,125,175 | |||||
Other liabilities | 3,911,053 | |||||
Total liabilties assumed | $ | 267,031,299 | ||||
Net assets acquired | $ | 21,283,219 | ||||
CONSIDERATION PAID: | ||||||
Cash | $ | 6,261,684 | ||||
Issuance of 834,715 shares of common stock | 13,180,150 | |||||
Total consideration paid | $ | 19,441,834 | ||||
Bargain purchase gain | $ | 1,841,385 | ||||
In order to fund the cash portion of the consideration and pay off the $3,950,000 of Community National borrowings at acquisition, the Company borrowed $4,400,000 on its 364-day revolving credit note. The outstanding balance on the 364-day revolving credit note totaled $10,000,000 until maturity at June 26, 2013. Upon maturity, the credit facility was restructured whereby the $10,000,000 of outstanding debt was restructured into a secured 3-year term note with principal due quarterly and interest due monthly where the interest is calculated at the effective LIBOR rate plus 3.00% per annum (3.17% at December 31, 2013). Additionally, as part of the restructuring, the Company maintained a secured 364-day revolving credit note with availability of $10,000,000 where the interest is calculated at the effective LIBOR rate plus 2.50% per annum. At December 31, 2013, the Company had not borrowed on this revolving credit note and had the full amount available. See Note 10 regarding 2014 activity in this debt.
The current note agreement contains certain covenants that place restrictions on additional debt and stipulate minimum capital and various asset quality and operating ratios.
QCR Holdings, Inc. and Subsidiaries
Notes to Consolidated Financial Statements
Note 2. Community National Bancorporation and Community National Bank (continued)
The Company recorded a bargain purchase gain on the acquisition totaling $1,841,385 as the market value of the net assets acquired from Community National exceeded the total consideration paid. The consideration paid approximated a slight premium to the book value of Community National’s net assets at acquisition. The net impact of the market value adjustments resulted in a net increase to Community National’s net assets. The more significant market value adjustments were the core deposit intangible ($3,440,076) and the discount on the trust preferred securities ($2,576,825), as previously discussed.
The Company incurred costs related to the acquisition of Community National totaling $2,353,162. These costs consisted of professional fees (legal, investment banking, and accounting) for the acquisition of Community National and the subsequent branch sales, as well as data conversion costs (including both the de-conversion of the sold branches and the conversion of the remaining branches), and compensation costs for severed and retained employees.
Unaudited pro forma combined operating results for the years ended December 31, 2013 and 2012, giving effect to the Community National acquisition as if it had occurred as of January 1, 2012, are as follows:
Years ended | ||||||||
December 31, | ||||||||
2013 | 2012 | |||||||
Interest income | $ | 83,008,255 | $ | 87,514,410 | ||||
Noninterest income | $ | 22,042,194 | $ | 19,792,383 | ||||
Net income | $ | 11,320,890 | $ | 14,077,018 | ||||
Net income attributable to QCR Holdings, Inc. common stockholders | $ | 8,152,588 | $ | 10,092,460 | ||||
Earnings per common share attributable to QCR Holdings, Inc. common stockholders | ||||||||
Basic | $ | 1.47 | $ | 1.82 | ||||
Diluted | $ | 1.44 | $ | 1.79 | ||||
The pro forma results exclude the impact of the bargain purchase gain of $1,841,385 and the impact of the gains on sales of certain CNB branches of $2,334,216. Additionally, the pro forma results do not purport to be indicative of the results of operations that actually would have resulted had the acquisition occurred on January 1, 2012 or of future results of operations of the consolidated entities.
QCR Holdings, Inc. and Subsidiaries
Notes to Consolidated Financial Statements
Note 2. Community National Bancorporation and Community National Bank (continued)
On October 4, 2013, the Company finalized the sale of certain assets and liabilities of the two Mason City, Iowa branches of CNB. The detail of the assets and liabilities sold, and resulting gain on sale, is as follows:
As of | ||||||
ASSETS | October 4, 2013 | |||||
Cash | $ | 29,905,991 | ||||
Loans receivable | 22,709,735 | |||||
Premises and equipment | 776,782 | |||||
Core deposit intangible | 910,415 | |||||
Other assets | 68,456 | |||||
Total assets sold | $ | 54,371,379 | ||||
LIABILITIES | ||||||
Deposits | $ | 55,191,930 | ||||
Other liabilities | 53,421 | |||||
Total liabilties sold | $ | 55,245,351 | ||||
Gain on sale, pre-tax | $ | 873,972 | ||||
On October 11, 2013, the Company finalized the sale of certain assets and liabilities of the two Austin, Minnesota branches of CNB. The detail of the assets and liabilities sold, and resulting gain on sale, is as follows:
As of | ||||||
ASSETS | October 11, 2013 | |||||
Cash | $ | 519,627 | ||||
Loans receivable | 31,749,135 | |||||
Premises and equipment | 1,597,040 | |||||
Core deposit intangible | 480,347 | |||||
Other assets | 70,443 | |||||
Total assets sold | $ | 34,416,592 | ||||
LIABILITIES | ||||||
Deposits | $ | 35,830,168 | ||||
Other liabilities | 46,668 | |||||
Total liabilties sold | $ | 35,876,836 | ||||
Gain on sale, pre-tax | $ | 1,460,244 | ||||
QCR Holdings, Inc. and Subsidiaries
Notes to Consolidated Financial Statements
Note 3. Investment Securities
The amortized cost and fair value of investment securities as of December 31, 20122014 and 20112013 are summarized as follows:
Amortized Cost | Gross Unrealized | Gross Unrealized | Fair Value | |||||||||||||
| December 31, 2012: | ||||||||||||||||
| Securities held to maturity: | ||||||||||||||||
| Municipal securities | $ | 71,429,385 | $ | 997,969 | $ | (71,648 | ) | $ | 72,355,706 | |||||||
| Other securities | 650,000 | - | - | 650,000 | ||||||||||||
| $ | 72,079,385 | $ | 997,969 | $ | (71,648 | ) | $ | 73,005,706 | ||||||||
| Securities available for sale: | ||||||||||||||||
| U.S. govt. sponsored agency securities | $ | 336,570,995 | $ | 2,198,655 | $ | (160,279 | ) | $ | 338,609,371 | |||||||
| Residential mortgage-backed and related securities | 160,035,196 | 3,736,821 | (170,914 | ) | 163,601,103 | |||||||||||
| Municipal securities | 24,508,015 | 1,696,555 | (18,834 | ) | 26,185,736 | |||||||||||
| Trust preferred securities | 86,200 | 53,200 | - | 139,400 | ||||||||||||
| Other securities | 1,347,113 | 300,732 | (23,469 | ) | 1,624,376 | |||||||||||
| $ | 522,547,519 | $ | 7,985,963 | $ | (373,496 | ) | $ | 530,159,986 | ||||||||
| December 31, 2011: | ||||||||||||||||
| Securities held to maturity: | ||||||||||||||||
| Other securities | $ | 200,000 | $ | - | $ | - | $ | 200,000 | ||||||||
| Securities available for sale: | ||||||||||||||||
| U.S. govt. sponsored agency securities | $ | 426,581,913 | $ | 2,428,994 | $ | (55,687 | ) | $ | 428,955,220 | |||||||
| Residential mortgage-backed and related securities | 105,373,614 | 3,488,350 | (8,215 | ) | 108,853,749 | |||||||||||
| Municipal securities | 23,937,118 | 1,752,246 | - | 25,689,364 | ||||||||||||
| Trust preferred securities | 86,200 | - | (5,400 | ) | 80,800 | |||||||||||
| Other securities | 1,354,940 | 140,022 | (44,804 | ) | 1,450,158 | |||||||||||
| $ | 557,333,785 | $ | 7,809,612 | $ | (114,106 | ) | $ | 565,029,291 | ||||||||
Gross | Gross | |||||||||||||||
Amortized | Unrealized | Unrealized | Fair | |||||||||||||
Cost | Gains | (Losses) | Value | |||||||||||||
December 31, 2014: | ||||||||||||||||
Securities held to maturity: | ||||||||||||||||
Municipal securities | $ | 198,829,574 | $ | 2,420,298 | $ | (1,186,076 | ) | $ | 200,063,796 | |||||||
Other securities | 1,050,000 | - | - | 1,050,000 | ||||||||||||
| $ | 199,879,574 | $ | 2,420,298 | $ | (1,186,076 | ) | $ | 201,113,796 | ||||||||
Securities available for sale: | ||||||||||||||||
U.S. govt. sponsored agency securities | $ | 312,959,760 | $ | 173,685 | $ | (5,263,873 | ) | $ | 307,869,572 | |||||||
Residential mortgage-backed and related securities | 110,455,925 | 1,508,331 | (541,032 | ) | 111,423,224 | |||||||||||
Municipal securities | 29,408,740 | 1,053,713 | (62,472 | ) | 30,399,981 | |||||||||||
Other securities | 1,342,554 | 625,145 | (846 | ) | 1,966,853 | |||||||||||
| $ | 454,166,979 | $ | 3,360,874 | $ | (5,868,223 | ) | $ | 451,659,630 | ||||||||
December 31, 2013: | ||||||||||||||||
Securities held to maturity: | ||||||||||||||||
Municipal securities | $ | 144,401,895 | $ | 299,789 | $ | (7,111,579 | ) | $ | 137,590,105 | |||||||
Other securities | 1,050,000 | - | - | 1,050,000 | ||||||||||||
| $ | 145,451,895 | $ | 299,789 | $ | (7,111,579 | ) | $ | 138,640,105 | ||||||||
Securities available for sale: | ||||||||||||||||
U.S. govt. sponsored agency securities | $ | 376,574,132 | $ | 41,696 | $ | (20,142,841 | ) | $ | 356,472,987 | |||||||
Residential mortgage-backed and related securities | 160,110,199 | 1,153,409 | (3,834,157 | ) | 157,429,451 | |||||||||||
Municipal securities | 35,813,866 | 923,315 | (778,324 | ) | 35,958,857 | |||||||||||
Other securities | 1,372,365 | 524,798 | - | 1,897,163 | ||||||||||||
| $ | 573,870,562 | $ | 2,643,218 | $ | (24,755,322 | ) | $ | 551,758,458 | ||||||||
The Company’s held-to-maturity municipal securities consist largely of private issues of municipal debt. The municipalities are located within the Midwest with a large portion located in or adjacent to the communities of QCBT and CRBT. The municipal debt investments are underwritten using specific guidelines with ongoing monitoring.
The Company’s residential mortgage-backed and related securities portfolio consists entirely of government sponsored or government guaranteed securities. The Company has not invested in commercial mortgage-backed securities or pooled trust preferred securities.
QCR Holdings, Inc. and Subsidiaries
Notes to Consolidated Financial Statements
Note 2.3. Investment Securities (Continued)
Gross unrealized losses and fair value, aggregated by investment category and length of time that individual securities have been in a continuous unrealized loss position, as of December 31, 20122014 and 2011,2013, are summarized as follows:
| Less than 12 Months | 12 Months or More | Total | ||||||||||||||||||||||
Fair Value | Gross Unrealized | Fair Value | Gross Unrealized | Fair Value | Gross Unrealized | |||||||||||||||||||
| December 31, 2012: | ||||||||||||||||||||||||
| Securities held to maturity: | ||||||||||||||||||||||||
| Municipal securities | $ | 4,282,352 | $ | (71,648 | ) | $ | - | $ | - | $ | 4,282,352 | $ | (71,648 | ) | ||||||||||
| Securities available for sale: | ||||||||||||||||||||||||
| U.S. govt. sponsored agency securities | $ | 55,621,718 | $ | (160,279 | ) | $ | - | $ | - | $ | 55,621,718 | $ | (160,279 | ) | ||||||||||
| Residential mortgage-backed and related securities | 29,324,928 | (170,914 | ) | - | - | 29,324,928 | (170,914 | ) | ||||||||||||||||
| Municipal securities | 1,039,625 | (18,834 | ) | - | - | 1,039,625 | (18,834 | ) | ||||||||||||||||
| Other securities | - | - | 217,500 | (23,469 | ) | 217,500 | (23,469 | ) | ||||||||||||||||
| $ | 85,986,271 | $ | (350,027 | ) | $ | 217,500 | $ | (23,469 | ) | $ | 86,203,771 | $ | (373,496 | ) | ||||||||||
| December 31, 2011: | ||||||||||||||||||||||||
| Securities available for sale: | ||||||||||||||||||||||||
| U.S. govt. sponsored agency securities | $ | 59,979,620 | $ | (55,687 | ) | $ | - | $ | - | $ | 59,979,620 | $ | (55,687 | ) | ||||||||||
| Residential mortgage-backed and related securities | 4,906,398 | (8,215 | ) | - | - | 4,906,398 | (8,215 | ) | ||||||||||||||||
| Trust preferred securities | - | - | 80,800 | (5,400 | ) | 80,800 | (5,400 | ) | ||||||||||||||||
| Other securities | 251,957 | (44,332 | ) | 2,778 | (472 | ) | 254,735 | (44,804 | ) | |||||||||||||||
| $ | 65,137,975 | $ | (108,234 | ) | $ | 83,578 | $ | (5,872 | ) | $ | 65,221,553 | $ | (114,106 | ) | ||||||||||
Less than 12 Months | 12 Months or More | Total | ||||||||||||||||||||||
Gross | Gross | Gross | ||||||||||||||||||||||
Fair | Unrealized | Fair | Unrealized | Fair | Unrealized | |||||||||||||||||||
Value | Losses | Value | Losses | Value | Losses | |||||||||||||||||||
December 31, 2014: | ||||||||||||||||||||||||
Securities held to maturity: | ||||||||||||||||||||||||
Municipal securities | $ | 20,419,052 | $ | (587,992 | ) | $ | 38,779,545 | $ | (598,084 | ) | $ | 59,198,597 | $ | (1,186,076 | ) | |||||||||
Securities available for sale: | ||||||||||||||||||||||||
U.S. govt. sponsored agency securities | $ | 23,970,085 | $ | (102,695 | ) | $ | 255,743,056 | $ | (5,161,178 | ) | $ | 279,713,141 | $ | (5,263,873 | ) | |||||||||
Residential mortgage-backed and related securities | 10,710,671 | (10,139 | ) | 37,570,774 | (530,893 | ) | 48,281,445 | (541,032 | ) | |||||||||||||||
Municipal securities | 920,935 | (1,773 | ) | 4,425,337 | (60,699 | ) | 5,346,272 | (62,472 | ) | |||||||||||||||
Other securities | 243,004 | (846 | ) | - | - | 243,004 | (846 | ) | ||||||||||||||||
| $ | 35,844,695 | $ | (115,453 | ) | $ | 297,739,167 | $ | (5,752,770 | ) | $ | 333,583,862 | $ | (5,868,223 | ) | ||||||||||
December 31, 2013: | ||||||||||||||||||||||||
Securities held to maturity: | ||||||||||||||||||||||||
Municipal securities | $ | 101,983,602 | $ | (6,711,240 | ) | $ | 2,697,375 | $ | (400,339 | ) | $ | 104,680,977 | $ | (7,111,579 | ) | |||||||||
Securities available for sale: | ||||||||||||||||||||||||
U.S. govt. sponsored agency securities | $ | 333,194,820 | $ | (19,141,077 | ) | $ | 10,978,390 | $ | (1,001,764 | ) | $ | 344,173,210 | $ | (20,142,841 | ) | |||||||||
Residential mortgage-backed and related securities | 94,723,092 | (2,947,770 | ) | 14,117,719 | (886,387 | ) | 108,840,811 | (3,834,157 | ) | |||||||||||||||
Municipal securities | 13,890,692 | (724,939 | ) | 985,687 | (53,385 | ) | 14,876,379 | (778,324 | ) | |||||||||||||||
| $ | 441,808,604 | $ | (22,813,786 | ) | $ | 26,081,796 | $ | (1,941,536 | ) | $ | 467,890,400 | $ | (24,755,322 | ) | ||||||||||
At December 31, 2012,2014, the investment portfolio included 378495 securities. Of this number, 50212 securities hadwere in an unrealized loss position. The aggregate losses with aggregate depreciation of less thanthese securities totaled approximately 1% fromof the total aggregate amortized cost basis.cost. Of these 50, one212 securities, 164 securities had an unrealized loss for 12 months or more. All of the debt securities in unrealized loss positions are considered acceptable credit risks. Based upon an evaluation of the available evidence, including the recent changes in market rates, credit rating information and information obtained from regulatory filings, management believes the declines in fair value for these debt securities are temporary. In addition, the Company does not intend to sell these securities and/or it is not more-likely-than-not that the Company will be required to sell these debt securities before their anticipated recovery. At December 31, 20122014 and 2011,2013, the Company’s equity securities represent less than 1% of the total portfolio.
The Company did not recognize other-than-temporary impairment on any debt securities.
The Company doesdid not haverecognize other-than-temporary impairment on any other investments in trust preferred securities.
For the year ended December 31, 2012, the Company’s evaluation determined that one privately held equity security experienced a decline in fair value that was other-than-temporary. As a result, the Company wrote down the value of this security and recognized a loss in the amount of $62,400.
QCR Holdings, Inc. and Subsidiaries
Notes to Consolidated Financial Statements
Note 2.3. Investment Securities (Continued)
All sales of securities, as applicable, for the years ended December 31, 2012, 20112014, 2013 and 2010,2012, respectively, were from securities identified as available for sale. Information on proceeds received, as well as the gains and losses from the sale of those securities is as follows:
| 2012 | 2011 | 2010 | ||||||||||
| Proceeds from sales of securities | $ | 19,215,075 | $ | 54,326,191 | $ | - | ||||||
| Gross gains from sales of securities | 104,600 | 1,472,528 | - | |||||||||
2014 | 2013 | 2012 | ||||||||||
Proceeds from sales of securities | $ | 78,476,422 | $ | 37,393,047 | $ | 19,215,075 | ||||||
Gross gains from sales of securities | 517,116 | 523,071 | 104,600 | |||||||||
Gross losses from sales of securities | (424,753 | ) | (90,579 | ) | - | |||||||
The amortized cost and fair value of securities as of December 31, 2012,2014, by contractual maturity are shown below. Expected maturities of mortgage-backed and related securities may differ from contractual maturities because the mortgages underlying the securities may be called or prepaid without any penalties. Therefore, these securities are not included in the maturity categories in the following summary. Other securities“Other securities” available for sale are excluded from the maturity categories as there is no fixed maturity date.
| Amortized Cost | Fair Value | |||||||
| Securities held to maturity: | ||||||||
| Due in one year or less | $ | 853,965 | $ | 858,014 | ||||
| Due after one year through five years | 9,801,254 | 9,813,395 | ||||||
| Due after five years | 61,424,166 | 62,334,297 | ||||||
| $ | 72,079,385 | $ | 73,005,706 | |||||
| Securities available for sale: | ||||||||
| Due in one year or less | $ | 995,005 | $ | 995,917 | ||||
| Due after one year through five years | 33,202,789 | 33,663,178 | ||||||
| Due after five years | 326,967,416 | 330,275,412 | ||||||
| $ | 361,165,210 | $ | 364,934,507 | |||||
| Residential mortgage-backed and related securities | 160,035,196 | 163,601,103 | ||||||
| Other securities | 1,347,113 | 1,624,376 | ||||||
| $ | 522,547,519 | $ | 530,159,986 | |||||
Amortized Cost | Fair Value | |||||||
Securities held to maturity: | ||||||||
Due in one year or less | $ | 13,233,202 | $ | 13,236,032 | ||||
Due after one year through five years | 18,369,970 | 18,455,551 | ||||||
Due after five years | 168,276,402 | 169,422,213 | ||||||
| $ | 199,879,574 | $ | 201,113,796 | |||||
Securities available for sale: | ||||||||
Due in one year or less | $ | 1,465,251 | $ | 1,472,292 | ||||
Due after one year through five years | 92,324,465 | 91,274,581 | ||||||
Due after five years | 248,578,784 | 245,522,680 | ||||||
| $ | 342,368,500 | $ | 338,269,553 | |||||
Residential mortgage-backed and related securities | 110,455,925 | 111,423,224 | ||||||
Other securities | 1,342,554 | 1,966,853 | ||||||
| $ | 454,166,979 | $ | 451,659,630 | |||||
Portions of the U.S. government sponsored agencies and municipal securities contain call options, at the discretion of the issuer, to terminate the security at predetermined dates prior to the stated maturity, summarized as follows:
| Amortized Cost | Fair Value | |||||||
| Municipal securities, held to maturity | $ | 46,672,253 | $ | 47,157,578 | ||||
| U.S. govt. sponsored agency securities | 304,670,224 | 306,253,738 | ||||||
| Municipal securities, available for sale | 13,498,939 | 14,381,300 | ||||||
| $ | 318,169,163 | $ | 320,635,038 | |||||
Amortized Cost | Fair Value | |||||||
Securities held to maturity: | ||||||||
Municipal securities | $ | 110,251,899 | $ | 111,121,516 | ||||
Securities available for sale: | ||||||||
U.S. govt. sponsored agency securities | 232,619,254 | 228,580,781 | ||||||
Municipal securities | 17,823,260 | 18,324,081 | ||||||
| $ | 250,442,514 | $ | 246,904,862 | |||||
QCR Holdings, Inc. and Subsidiaries
Notes to Consolidated Financial Statements
Note 3. Investment Securities (continued)
As of December 31, 2014, the Company’s municipal securities portfolios were comprised of general obligation bonds issued by 77 issuers with fair values totaling $68.8 million and revenue bonds issued by 64 issuers, primarily consisting of states, counties, towns, villages and school districts with fair values totaling $161.7 million. The Company held investments in general obligation bonds in 19 states, including three states in which the aggregate fair value exceeded $5.0 million. The Company held investments in revenue bonds in eight states, including four states in which the aggregate fair value exceeded $5.0 million.
As of December 31, 2013, the Company’s municipal securities portfolios were comprised of general obligation bonds issued by 84 issuers with fair values totaling $54.2 million and revenue bonds issued by 52 issuers, primarily consisting of states, counties, towns, villages and school districts with fair values totaling $119.3 million. The Company held investments in general obligation bonds in 20 states, including two states in which the aggregate fair value exceeded $5.0 million. The Company held investments in revenue bonds in eight states, including four states in which the aggregate fair value exceeded $5.0 million.
The amortized cost and fair values of the Company’s portfolio of general obligation bonds are summarized in the following tables by the issuer’s state:
December 31, 2014: | ||||||||||||||||
U.S. State: | Number of Issuers | Amortized Cost | Fair Value | Average Exposure Per Issuer (Fair Value) | ||||||||||||
Iowa | 14 | $ | 20,156,969 | $ | 20,446,655 | $ | 1,460,475 | |||||||||
Missouri | 11 | 8,424,928 | 8,426,047 | 766,004 | ||||||||||||
Illinois | 10 | 22,447,799 | 22,784,638 | 2,278,464 | ||||||||||||
Other | 42 | 16,838,719 | 17,110,831 | 407,401 | ||||||||||||
Total general obligation bonds | 77 | $ | 67,868,415 | $ | 68,768,171 | $ | 893,093 | |||||||||
December 31, 2013: | ||||||||||||||||
U.S. State: | Number of Issuers | Amortized Cost | Fair Value | Average Exposure Per Issuer (Fair Value) | ||||||||||||
Iowa | 16 | $ | 17,946,059 | $ | 17,444,045 | $ | 1,090,253 | |||||||||
Illinois | 12 | 15,063,325 | 15,264,718 | 1,272,060 | ||||||||||||
Other | 56 | 22,166,026 | 21,512,582 | 384,153 | ||||||||||||
Total general obligation bonds | 84 | $ | 55,175,410 | $ | 54,221,345 | $ | 645,492 | |||||||||
QCR Holdings, Inc. and Subsidiaries
Notes to Consolidated Financial Statements
Note 3. Investment Securities (continued)
The amortized cost and fair values of the Company’s portfolio of revenue bonds are summarized in the following tables by the issuer’s state:
December 31, 2014: | ||||||||||||||||
U.S. State: | Number of Issuers | Amortized Cost | Fair Value | Average Exposure Per Issuer (Fair Value) | ||||||||||||
Missouri | 30 | $ | 62,358,276 | $ | 62,584,516 | $ | 2,086,151 | |||||||||
Iowa | 20 | 59,417,246 | 60,402,941 | 3,020,147 | ||||||||||||
Indiana | 8 | 17,991,200 | 17,925,721 | 2,240,715 | ||||||||||||
Kansas | 2 | 12,307,866 | 12,332,528 | 6,166,264 | ||||||||||||
Other | 4 | 8,295,311 | 8,449,900 | 2,112,475 | ||||||||||||
Total revenue bonds | 64 | $ | 160,369,899 | $ | 161,695,606 | $ | 2,526,494 | |||||||||
December 31, 2013: | ||||||||||||||||
U.S. State: | Number of Issuers | Amortized Cost | Fair Value | Average Exposure Per Issuer (Fair Value) | ||||||||||||
Iowa | 17 | $ | 47,903,572 | $ | 46,257,997 | $ | 2,721,059 | |||||||||
Missouri | 21 | 42,085,249 | 40,054,613 | 1,907,363 | ||||||||||||
Indiana | 7 | 15,020,000 | 14,324,717 | 2,046,388 | ||||||||||||
Kansas | 2 | 11,022,382 | 9,997,068 | 4,998,534 | ||||||||||||
Other | 5 | 9,009,148 | 8,693,222 | 1,738,644 | ||||||||||||
Total revenue bonds | 52 | $ | 125,040,351 | $ | 119,327,617 | $ | 2,294,762 | |||||||||
Both general obligation and revenue bonds are diversified across many issuers. As of December 31, 2014 and 2013, the Company did not hold general obligation or revenue bonds of any single issuer, the aggregate book or market value of which exceeded 10% of the Company’s stockholders’ equity. Of the general obligation and revenue bonds in the Company’s portfolio, the majority are unrated bonds that represent small, private issuances. All unrated bonds were underwritten according to loan underwriting standards and have an average risk rating of 2, indicating very high quality. Additionally, many of these bonds are funding essential municipal services (water, sewer, education, medical facilities).
The Company’s municipal securities are owned by each of the three charters, whose investment policies set forth limits for various subcategories within the municipal securities portfolio. Each charter is monitored individually and as of December 31, 2014, all were well-within policy limitations approved by the board of directors. Policy limits are calculated as a percentage of total risk-based capital.
As of December 31, 2014, the Company’s standard monitoring of its municipal securities portfolio had not uncovered any facts or circumstances resulting in significantly different credits ratings than those assigned by a nationally recognized statistical rating organization, or in the case of unrated bonds, the rating assigned using the credit underwriting standards.
QCR Holdings, Inc. and Subsidiaries
Notes to Consolidated Financial Statements
Note 4. Loans/Leases Receivable
The composition of the loan/lease portfolio as of December 31, 20122014 and 20112013 is presented as follows:
| 2012 | 2011 | |||||||
| Commercial and industrial loans | $ | 394,244,252 | $ | 350,794,278 | ||||
| Commercial real estate loans | ||||||||
| Owner-occupied commercial real estate | 204,911,308 | 167,790,621 | ||||||
| Commercial construction, land development, and other land | 44,962,381 | 60,384,738 | ||||||
| Other non owner-occupied commercial real estate | 344,105,550 | 349,628,491 | ||||||
| 593,979,239 | 577,803,850 | |||||||
| Direct financing leases * | 103,685,656 | 93,212,362 | ||||||
| Residential real estate loans ** | 115,581,573 | 98,107,051 | ||||||
| Installment and other consumer loans | 76,720,514 | 78,223,080 | ||||||
| 1,284,211,234 | 1,198,140,621 | |||||||
| Plus deferred loan/lease orgination costs, net of fees | 3,176,405 | 2,604,876 | ||||||
| 1,287,387,639 | 1,200,745,497 | |||||||
| Less allowance for estimated losses on loans/leases | (19,925,204 | ) | (18,789,262 | ) | ||||
| $ | 1,267,462,435 | $ | 1,181,956,235 | |||||
| * Direct financing leases: | ||||||||
| Net minimum lease payments to be received | $ | 117,719,380 | $ | 106,389,988 | ||||
| Estimated unguaranteed residual values of leased assets | 1,095,848 | 1,043,326 | ||||||
| Unearned lease/residual income | (15,129,572 | ) | (14,220,952 | ) | ||||
| 103,685,656 | 93,212,362 | |||||||
| Plus deferred lease origination costs, net of fees | 3,907,140 | 3,217,011 | ||||||
| 107,592,796 | 96,429,373 | |||||||
| Less allowance for estimated losses on leases | (1,990,395 | ) | (1,339,496 | ) | ||||
| $ | 105,602,401 | $ | 95,089,877 | |||||
2014 | 2013 | |||||||
Commercial and industrial loans | $ | 523,927,140 | $ | 431,688,129 | ||||
Commercial real estate loans | ||||||||
Owner-occupied commercial real estate | 260,069,080 | 261,215,912 | ||||||
Commercial construction, land development, and other land | 68,118,989 | 57,844,902 | ||||||
Other non owner-occupied commercial real estate | 373,952,353 | 352,692,115 | ||||||
| 702,140,422 | 671,752,929 | |||||||
Direct financing leases * | 166,032,416 | 128,901,442 | ||||||
Residential real estate loans ** | 158,632,492 | 147,356,323 | ||||||
Installment and other consumer loans | 72,606,480 | 76,033,810 | ||||||
| 1,623,338,950 | 1,455,732,633 | |||||||
Plus deferred loan/lease orgination costs, net of fees | 6,664,120 | 4,546,925 | ||||||
| 1,630,003,070 | 1,460,279,558 | |||||||
Less allowance for estimated losses on loans/leases | (23,074,365 | ) | (21,448,048 | ) | ||||
| $ | 1,606,928,705 | $ | 1,438,831,510 | |||||
* Direct financing leases: | ||||||||
Net minimum lease payments to be received | $ | 188,181,432 | $ | 145,662,254 | ||||
Estimated unguaranteed residual values of leased assets | 1,488,342 | 1,694,499 | ||||||
Unearned lease/residual income | (23,637,358 | ) | (18,455,311 | ) | ||||
| 166,032,416 | 128,901,442 | |||||||
Plus deferred lease origination costs, net of fees | 6,639,244 | 4,814,183 | ||||||
| 172,671,660 | 133,715,625 | |||||||
Less allowance for estimated losses on leases | (3,442,915 | ) | (2,517,217 | ) | ||||
| $ | 169,228,745 | $ | 131,198,408 | |||||
Management performs an evaluation of the estimated unguaranteed residual values of leased assets on an annual basis, at a minimum. The evaluation consists of discussions with reputable and current vendors and management’s expertise and understanding of the current states of particular industries to determine informal valuations of the equipment. As necessary and where available, management will utilize valuations by independent appraisers. The large majority of leases with residual values contain a lease options rider which requires the lessee to pay the residual value directly, finance the payment of the residual value, or extend the lease term to pay the residual value. In these cases, the residual value is protected and the risk of loss is minimal.
There were no losses related to residual values during the years ended December 31, 20122014, 2013, and 2011. For the year ended December 31, 2010, the Company recognized losses totaling $617,000 in residual values for two direct financing equipment leases.2012. At December 31, 2012,2014, the Company had 3427 leases remaining with residual values totaling $1,095,848$1,488,342 that were not protected with a lease end options rider. At December 31, 2011,2013, the Company had 3933 leases remaining with residual values totaling $1,043,326$1,694,499 that were not protected with a lease end options rider. Management has performed specific evaluations of these residual values and determined that the valuations are appropriate.
**Includes residential real estate loans held for sale totaling $4,577,233$553,000 and $3,832,760$1,358,290 as of December 31, 20122014 and 2011,2013, respectively.
QCR Holdings, Inc. and Subsidiaries
Notes to Consolidated Financial Statements
Note 3.4. Loans/Leases Receivable (Continued)
The aging of the loan/lease portfolio by classes of loans/leases as of December 31, 20122014 and 20112013 is presented as follows:
| 2012 | ||||||||||||||||||||||||
| Classes of Loans/Leases | Current | 30-59 Days Past Due | 60-89 Days Past Due | Accruing Past Due 90 Days or More | Nonaccrual Loans/Leases | Total | ||||||||||||||||||
| Commercial and Industrial | $ | 388,825,307 | $ | 3,724,506 | $ | 9,940 | $ | 120,000 | $ | 1,564,499 | $ | 394,244,252 | ||||||||||||
| Commercial Real Estate | ||||||||||||||||||||||||
| Owner-Occupied Commercial Real Estate | 204,141,070 | 142,993 | - | - | 627,245 | 204,911,308 | ||||||||||||||||||
| Commercial Construction, Land Development, and Other Land | 42,180,819 | - | - | - | 2,781,562 | 44,962,381 | ||||||||||||||||||
| Other Non Owner-Occupied Commercial Real Estate | 332,644,532 | 86,986 | 1,111,856 | - | 10,262,176 | 344,105,550 | ||||||||||||||||||
| Direct Financing Leases | 101,635,084 | 877,210 | 174,560 | - | 998,802 | 103,685,656 | ||||||||||||||||||
| Residential Real Estate | 111,993,859 | 2,254,730 | 283,466 | - | 1,049,518 | 115,581,573 | ||||||||||||||||||
| Installment and Other Consumer | 75,711,203 | 301,025 | 20,112 | 39,481 | 648,693 | 76,720,514 | ||||||||||||||||||
| $ | 1,257,131,874 | $ | 7,387,450 | $ | 1,599,934 | $ | 159,481 | $ | 17,932,495 | $ | 1,284,211,234 | |||||||||||||
| As a percentage of total loan/lease portfolio | 97.89 | % | 0.58 | % | 0.12 | % | 0.01 | % | 1.40 | % | 100.00 | % | ||||||||||||
| 2011 | ||||||||||||||||||||||||
| Classes of Loans/Leases | Current | 30-59 Days Past Due | 60-89 Days Past Due | Accruing Past Due 90 Days or More | Nonaccrual Loans/Leases | Total | ||||||||||||||||||
| Commercial and Industrial | $ | 347,417,683 | $ | 226,394 | $ | 239,991 | $ | 120,000 | $ | 2,790,210 | $ | 350,794,278 | ||||||||||||
| Commercial Real Estate | ||||||||||||||||||||||||
| Owner-Occupied Commercial Real Estate | 166,632,318 | 146,847 | - | - | 1,011,456 | 167,790,621 | ||||||||||||||||||
| Commercial Construction, Land Development, and Other Land | 55,741,827 | 211,878 | 486,802 | 968,919 | 2,975,312 | 60,384,738 | ||||||||||||||||||
| Other Non Owner-Occupied Commercial Real Estate | 336,080,128 | 522,323 | 3,732,935 | - | 9,293,105 | 349,628,491 | ||||||||||||||||||
| Direct Financing Leases | 91,273,406 | 826,187 | 396,344 | - | 716,425 | 93,212,362 | ||||||||||||||||||
| Residential Real Estate | 95,456,433 | 1,127,465 | 389,678 | - | 1,133,475 | 98,107,051 | ||||||||||||||||||
| Installment and Other Consumer | 76,376,399 | 737,543 | 12,122 | 22,160 | 1,074,856 | 78,223,080 | ||||||||||||||||||
| $ | 1,168,978,194 | $ | 3,798,637 | $ | 5,257,872 | $ | 1,111,079 | $ | 18,994,839 | $ | 1,198,140,621 | |||||||||||||
| As a percentage of total loan/lease portfolio | 97.57 | % | 0.32 | % | 0.44 | % | 0.09 | % | 1.59 | % | 100.00 | % | ||||||||||||
2014 | ||||||||||||||||||||||||
Classes of Loans/Leases | Current | 30-59 Days Past Due | 60-89 Days Past Due | Accruing Past Due 90 Days or More | Nonaccrual Loans/Leases | Total | ||||||||||||||||||
Commercial and Industrial | $ | 515,616,752 | $ | 323,145 | $ | - | $ | 822 | $ | 7,986,421 | $ | 523,927,140 | ||||||||||||
Commercial Real Estate | ||||||||||||||||||||||||
Owner-Occupied Commercial Real Estate | 259,166,743 | 239,771 | - | - | 662,566 | 260,069,080 | ||||||||||||||||||
Commercial Construction, Land Development, and Other Land | 67,021,157 | 729,983 | 111,837 | - | 256,012 | 68,118,989 | ||||||||||||||||||
Other Non Owner-Occupied Commercial Real Estate | 360,970,551 | 3,448,902 | 2,840,862 | 60,000 | 6,632,038 | 373,952,353 | ||||||||||||||||||
Direct Financing Leases | 164,059,914 | 573,575 | 293,212 | - | 1,105,715 | 166,032,416 | ||||||||||||||||||
Residential Real Estate | 154,303,644 | 2,528,287 | 475,343 | 25,673 | 1,299,545 | 158,632,492 | ||||||||||||||||||
Installment and Other Consumer | 71,534,329 | 172,872 | 246,882 | 6,916 | 645,481 | 72,606,480 | ||||||||||||||||||
| $ | 1,592,673,090 | $ | 8,016,535 | $ | 3,968,136 | $ | 93,411 | $ | 18,587,778 | $ | 1,623,338,950 | |||||||||||||
As a percentage of total loan/lease portfolio | 98.11 | % | 0.49 | % | 0.24 | % | 0.01 | % | 1.15 | % | 100.00 | % | ||||||||||||
2013 | ||||||||||||||||||||||||
Classes of Loans/Leases | Current | 30-59 Days Past Due | 60-89 Days Past Due | Accruing Past Due 90 Days or More | Nonaccrual Loans/Leases | Total | ||||||||||||||||||
Commercial and Industrial | $ | 429,557,699 | $ | 199,949 | $ | 185,500 | $ | - | $ | 1,744,981 | $ | 431,688,129 | ||||||||||||
Commercial Real Estate | ||||||||||||||||||||||||
Owner-Occupied Commercial Real Estate | 258,557,660 | 465,418 | 993,163 | 60,286 | 1,139,385 | 261,215,912 | ||||||||||||||||||
Commercial Construction, Land Development, and Other Land | 56,301,186 | 358,626 | - | - | 1,185,090 | 57,844,902 | ||||||||||||||||||
Other Non Owner-Occupied Commercial Real Estate | 341,743,730 | 476,877 | 151,017 | - | 10,320,491 | 352,692,115 | ||||||||||||||||||
Direct Financing Leases | 126,878,515 | 714,464 | 414,005 | - | 894,458 | 128,901,442 | ||||||||||||||||||
Residential Real Estate | 142,353,936 | 3,088,516 | 275,262 | 20,126 | 1,618,483 | 147,356,323 | ||||||||||||||||||
Installment and Other Consumer | 74,811,489 | 127,082 | 116,468 | 3,762 | 975,009 | 76,033,810 | ||||||||||||||||||
| $ | 1,430,204,215 | $ | 5,430,932 | $ | 2,135,415 | $ | 84,174 | $ | 17,877,897 | $ | 1,455,732,633 | |||||||||||||
As a percentage of total loan/lease portfolio | 98.25 | % | 0.37 | % | 0.15 | % | 0.01 | % | 1.23 | % | 100.00 | % | ||||||||||||
QCR Holdings, Inc. and Subsidiaries
Notes to Consolidated Financial Statements
Note 3.4. Loans/Leases Receivable (Continued)
Nonperforming loans/leases by classes of loans/leases as of December 31, 20122014 and 20112013 is presented as follows:
| 2012 | ||||||||||||||||||||
| Classes of Loans/Leases | Accruing Past Due 90 Days or More | Nonaccrual Loans/Leases * | Troubled Debt Restructurings - Accruing | Total Nonperforming Loans/Leases | Percentage of Total Nonperforming Loans/Leases | |||||||||||||||
| Commercial and Industrial | $ | 120,000 | $ | 1,564,499 | $ | 184,084 | $ | 1,868,583 | 7.36 | % | ||||||||||
| Commercial Real Estate | ||||||||||||||||||||
| Owner-Occupied Commercial Real Estate | - | 627,245 | - | 627,245 | 2.47 | % | ||||||||||||||
| Commercial Construction, Land Development, and Other Land | - | 2,781,562 | 1,016,023 | 3,797,585 | 14.96 | % | ||||||||||||||
| Other Non Owner-Occupied Commercial Real Estate | - | 10,262,176 | 5,820,765 | 16,082,941 | 63.34 | % | ||||||||||||||
| Direct Financing Leases | - | 998,802 | - | 998,802 | 3.93 | % | ||||||||||||||
| Residential Real Estate | - | 1,049,518 | 167,739 | 1,217,257 | 4.79 | % | ||||||||||||||
| Installment and Other Consumer | 39,481 | 648,693 | 110,982 | 799,156 | 3.15 | % | ||||||||||||||
| $ | 159,481 | $ | 17,932,495 | $ | 7,299,593 | $ | 25,391,569 | 100.00 | % | |||||||||||
2014 | ||||||||||||||||||||
Classes of Loans/Leases | Accruing Past Due 90 Days or More | Nonaccrual Loans/Leases * | Troubled Debt Restructurings - Accruing | Total Nonperforming Loans/Leases | Percentage of Total Nonperforming Loans/Leases | |||||||||||||||
Commercial and Industrial | $ | 822 | $ | 7,986,421 | $ | 235,926 | $ | 8,223,169 | 40.91 | % | ||||||||||
Commercial Real Estate | ||||||||||||||||||||
Owner-Occupied Commercial Real Estate | - | 662,566 | - | 662,566 | 3.30 | % | ||||||||||||||
Commercial Construction, Land Development, and Other Land | - | 256,012 | - | 256,012 | 1.27 | % | ||||||||||||||
Other Non Owner-Occupied Commercial Real Estate | 60,000 | 6,632,038 | - | 6,692,038 | 33.29 | % | ||||||||||||||
Direct Financing Leases | - | 1,105,715 | 233,557 | 1,339,272 | 6.66 | % | ||||||||||||||
Residential Real Estate | 25,673 | 1,299,545 | 489,183 | 1,814,401 | 9.02 | % | ||||||||||||||
Installment and Other Consumer | 6,916 | 645,481 | 462,552 | 1,114,949 | 5.55 | % | ||||||||||||||
| $ | 93,411 | $ | 18,587,778 | $ | 1,421,218 | $ | 20,102,407 | 100.00 | % | |||||||||||
*At December 31, 2012,2014, nonaccrual loans/leases included $5,658,781$5,013,041 of troubled debt restructurings, including $99,804$1,227,537 in commercial and industrial loans, $5,173,589$3,214,468 in commercial real estate loans, $64,722$61,144 in direct financing leases, $506,283 in residential real estate loans, and $320,666$3,609 in installment loans.
| 2011 | ||||||||||||||||||||
| Classes of Loans/Leases | Accruing Past Due 90 Days or More | Nonaccrual Loans/Leases * | Troubled Debt Restructurings - Accruing | Total Nonperforming Loans/Leases | Percentage of Total Nonperforming Loans/Leases | |||||||||||||||
| Commercial and Industrial | $ | 120,000 | $ | 2,790,210 | $ | 187,407 | $ | 3,097,617 | 9.68 | % | ||||||||||
| Commercial Real Estate | ||||||||||||||||||||
| Owner-Occupied Commercial Real Estate | - | 1,011,456 | - | 1,011,456 | 3.16 | % | ||||||||||||||
| Commercial Construction, Land Development, and Other Land | 968,919 | 2,975,312 | 6,076,143 | 10,020,374 | 31.30 | % | ||||||||||||||
| Other Non Owner-Occupied Commercial Real Estate | - | 9,293,105 | 5,049,795 | 14,342,900 | 44.81 | % | ||||||||||||||
| Direct Financing Leases | - | 716,425 | 590,238 | 1,306,663 | 4.08 | % | ||||||||||||||
| Residential Real Estate | - | 1,133,475 | - | 1,133,475 | 3.54 | % | ||||||||||||||
| Installment and Other Consumer | 22,160 | 1,074,856 | - | 1,097,016 | 3.43 | % | ||||||||||||||
| $ | 1,111,079 | $ | 18,994,839 | $ | 11,903,583 | $ | 32,009,501 | 100.00 | % | |||||||||||
2013 | ||||||||||||||||||||
Classes of Loans/Leases | Accruing Past Due 90 Days or More | Nonaccrual Loans/Leases * | Troubled Debt Restructurings - Accruing | Total Nonperforming Loans/Leases | Percentage of Total Nonperforming Loans/Leases | |||||||||||||||
Commercial and Industrial | $ | - | $ | 1,744,981 | $ | 878,381 | $ | 2,623,362 | 12.81 | % | ||||||||||
Commercial Real Estate | ||||||||||||||||||||
Owner-Occupied Commercial Real Estate | 60,286 | 1,139,385 | - | 1,199,671 | 5.86 | % | ||||||||||||||
Commercial Construction, Land Development, and Other Land | - | 1,185,090 | - | 1,185,090 | 5.79 | % | ||||||||||||||
Other Non Owner-Occupied Commercial Real Estate | - | 10,320,491 | 905,205 | 11,225,696 | 54.80 | % | ||||||||||||||
Direct Financing Leases | - | 894,458 | - | 894,458 | 4.37 | % | ||||||||||||||
Residential Real Estate | 20,126 | 1,618,483 | 371,995 | 2,010,604 | 9.82 | % | ||||||||||||||
Installment and Other Consumer | 3,762 | 975,009 | 367,000 | 1,345,771 | 6.57 | % | ||||||||||||||
| $ | 84,174 | $ | 17,877,897 | $ | 2,522,581 | $ | 20,484,652 | 100.00 | % | |||||||||||
**At December 31, 2011,2013, nonaccrual loans/leases included $8,622,874$10,890,785 of troubled debt restructurings, including $198,697$77,072 in commercial and industrial loans, $8,074,777$10,077,501 in commercial real estate loans, $64,726$446,996 in direct financing leases,residential real estate loans, and $284,674$289,216 in installment loans.
QCR Holdings, Inc. and Subsidiaries
Notes to Consolidated Financial Statements
Note 3.4. Loans/Leases Receivable (Continued)
Changes in the allowance for estimated losses on loans/leases by portfolio segment for the years ended December 31, 2012, 2011,2014, 2013, and 20102012 are presented as follows:
Year Ended December 31, 2014 | ||||||||||||||||||||||||
Commercial and Industrial | Commercial Real Estate | Direct Financing Leases | Residential Real Estate | Installment and Other Consumer | Total | |||||||||||||||||||
Balance, beginning | $ | 5,648,774 | $ | 10,705,434 | $ | 2,517,217 | $ | 1,395,849 | $ | 1,180,774 | $ | 21,448,048 | ||||||||||||
Provisions charged to expense | 4,213,738 | (13,326 | ) | 2,361,647 | 251,030 | (6,089 | ) | 6,807,000 | ||||||||||||||||
Loans/leases charged off | (1,475,885 | ) | (2,756,083 | ) | (1,504,181 | ) | (130,900 | ) | (268,656 | ) | (6,135,705 | ) | ||||||||||||
Recoveries on loans/leases previously charged off | 363,690 | 417,361 | 68,232 | 9,973 | 95,766 | 955,022 | ||||||||||||||||||
Balance, ending | $ | 8,750,317 | $ | 8,353,386 | $ | 3,442,915 | $ | 1,525,952 | $ | 1,001,795 | $ | 23,074,365 | ||||||||||||
Year Ended December 31, 2013 | ||||||||||||||||||||||||
Commercial and Industrial | Commercial Real Estate | Direct Financing Leases | Residential Real Estate | Installment and Other Consumer | Total | |||||||||||||||||||
Balance, beginning | $ | 4,531,545 | $ | 11,069,502 | $ | 1,990,395 | $ | 1,070,328 | $ | 1,263,434 | $ | 19,925,204 | ||||||||||||
Provisions charged to expense | 1,453,455 | 2,635,327 | 1,431,246 | 471,060 | (60,668 | ) | 5,930,420 | |||||||||||||||||
Loans/leases charged off | (962,607 | ) | (3,573,006 | ) | (916,836 | ) | (162,010 | ) | (229,447 | ) | (5,843,906 | ) | ||||||||||||
Recoveries on loans/leases previously charged off | 626,381 | 573,611 | 12,412 | 16,471 | 207,455 | 1,436,330 | ||||||||||||||||||
Balance, ending | $ | 5,648,774 | $ | 10,705,434 | $ | 2,517,217 | $ | 1,395,849 | $ | 1,180,774 | $ | 21,448,048 | ||||||||||||
Year Ended December 31, 2012 | ||||||||||||||||||||||||
Commercial and Industrial | Commercial Real Estate | Direct Financing Leases | Residential Real Estate | Installment and Other Consumer | Total | |||||||||||||||||||
Balance, beginning | $ | 4,878,006 | $ | 10,596,958 | $ | 1,339,496 | $ | 704,946 | $ | 1,269,856 | $ | 18,789,262 | ||||||||||||
Provisions charged to expense | (327,045 | ) | 2,482,327 | 1,313,767 | 370,140 | 531,578 | 4,370,767 | |||||||||||||||||
Loans/leases charged off | (682,877 | ) | (2,232,004 | ) | (739,755 | ) | (4,758 | ) | (717,035 | ) | (4,376,429 | ) | ||||||||||||
Recoveries on loans/leases previously charged off | 663,461 | 222,221 | 76,887 | - | 179,035 | 1,141,604 | ||||||||||||||||||
Balance, ending | $ | 4,531,545 | $ | 11,069,502 | $ | 1,990,395 | $ | 1,070,328 | $ | 1,263,434 | $ | 19,925,204 | ||||||||||||
| Year Ended December 31, 2012 | ||||||||||||||||||||||||
| Commercial and Industrial | Commercial Real Estate | Direct Financing Leases | Residential Real Estate | Installment and Other Consumer | Total | |||||||||||||||||||
| Balance, beginning | $ | 4,878,006 | $ | 10,596,958 | $ | 1,339,496 | $ | 704,946 | $ | 1,269,856 | $ | 18,789,262 | ||||||||||||
| Provisions charged to expense | (327,045 | ) | 2,482,327 | 1,313,767 | 370,140 | 531,578 | 4,370,767 | |||||||||||||||||
| Loans/leases charged off | (682,877 | ) | (2,232,004 | ) | (739,755 | ) | (4,758 | ) | (717,035 | ) | (4,376,429 | ) | ||||||||||||
| Recoveries on loans/leases previously charged off | 663,461 | 222,221 | 76,887 | - | 179,035 | 1,141,604 | ||||||||||||||||||
| Balance, ending | $ | 4,531,545 | $ | 11,069,502 | $ | 1,990,395 | $ | 1,070,328 | $ | 1,263,434 | $ | 19,925,204 | ||||||||||||
| Year Ended December 31, 2011 | ||||||||||||||||||||||||
| Commercial and Industrial | Commercial Real Estate | Direct Financing Leases | Residential Real Estate | Installment and Other Consumer | Total | |||||||||||||||||||
| Balance, beginning | $ | 7,548,922 | $ | 9,087,315 | $ | 1,530,572 | $ | 748,028 | $ | 1,449,819 | $ | 20,364,656 | ||||||||||||
| Provisions charged to expense | 256,945 | 4,759,003 | 907,014 | (4,147 | ) | 697,199 | 6,616,014 | |||||||||||||||||
| Loans/leases charged off | (3,262,742 | ) | (3,590,868 | ) | (1,100,886 | ) | (38,935 | ) | (1,068,320 | ) | (9,061,751 | ) | ||||||||||||
| Recoveries on loans/leases previously charged off | 334,881 | 341,508 | 2,796 | - | 191,158 | 870,343 | ||||||||||||||||||
| Balance, ending | $ | 4,878,006 | $ | 10,596,958 | $ | 1,339,496 | $ | 704,946 | $ | 1,269,856 | $ | 18,789,262 | ||||||||||||
| Year Ended December 31, 2010 | ||||||||||||||||||||||||
| Commercial and Industrial | Commercial Real Estate | Direct Financing Leases | Residential Real Estate | Installment and Other Consumer | Total | |||||||||||||||||||
| Balance, beginning | $ | 5,425,624 | $ | 12,665,721 | $ | 1,681,376 | $ | 685,732 | $ | 2,046,281 | $ | 22,504,734 | ||||||||||||
| Provisions charged to expense | 5,099,350 | 1,203,163 | 684,619 | 97,723 | 378,763 | 7,463,618 | ||||||||||||||||||
| Loans/leases charged off | (3,309,273 | ) | (5,210,444 | ) | (998,737 | ) | (35,427 | ) | (1,146,395 | ) | (10,700,276 | ) | ||||||||||||
| Recoveries on loans/leases previously charged off | 333,221 | 428,875 | 163,314 | - | 171,170 | 1,096,580 | ||||||||||||||||||
| Balance, ending | $ | 7,548,922 | $ | 9,087,315 | $ | 1,530,572 | $ | 748,028 | $ | 1,449,819 | $ | 20,364,656 | ||||||||||||
QCR Holdings, Inc. and Subsidiaries
Notes to Consolidated Financial Statements
Note 3.4. Loans/Leases Receivable (Continued)
The allowance for estimated losses on loans/leases by impairment evaluation and by portfolio segment as of December 31, 20122014 and 20112013 is presented as follows:
2014 | ||||||||||||||||||||||||
Commercial and Industrial | Commercial Real Estate | Direct Financing Leases | Residential Real Estate | Installment and Other Consumer | Total | |||||||||||||||||||
Allowance for impaired loans/leases | $ | 3,300,199 | $ | 1,170,020 | $ | 356,996 | $ | 151,663 | $ | 265,795 | $ | 5,244,673 | ||||||||||||
Allowance for nonimpaired loans/leases | 5,450,118 | 7,183,366 | 3,085,919 | 1,374,289 | 736,000 | 17,829,692 | ||||||||||||||||||
| $ | 8,750,317 | $ | 8,353,386 | $ | 3,442,915 | $ | 1,525,952 | $ | 1,001,795 | $ | 23,074,365 | |||||||||||||
Impaired loans/leases | $ | 7,279,709 | $ | 7,433,383 | $ | 1,339,272 | $ | 1,788,729 | $ | 1,165,548 | $ | 19,006,641 | ||||||||||||
Nonimpaired loans/leases | 516,647,431 | 694,707,039 | 164,693,144 | 156,843,763 | 71,440,932 | 1,604,332,309 | ||||||||||||||||||
| $ | 523,927,140 | $ | 702,140,422 | $ | 166,032,416 | $ | 158,632,492 | $ | 72,606,480 | $ | 1,623,338,950 | |||||||||||||
Allowance as a percentage of impaired loans/leases | 45.33 | % | 15.74 | % | 26.66 | % | 8.48 | % | 22.80 | % | 27.59 | % | ||||||||||||
Allowance as a percentage of nonimpaired loans/leases | 1.05 | % | 1.03 | % | 1.87 | % | 0.88 | % | 1.03 | % | 1.11 | % | ||||||||||||
Total allowance as a percentage of total loans/leaess | 1.67 | % | 1.19 | % | 2.07 | % | 0.96 | % | 1.38 | % | 1.42 | % | ||||||||||||
2013 | ||||||||||||||||||||||||
Commercial and Industrial | Commercial Real Estate | Direct Financing Leases | Residential Real Estate | Installment and Other Consumer | Total | |||||||||||||||||||
Allowance for impaired loans/leases | $ | 927,453 | $ | 3,174,704 | $ | 192,847 | $ | 246,266 | $ | 467,552 | $ | 5,008,822 | ||||||||||||
Allowance for nonimpaired loans/leases | 4,721,321 | 7,530,730 | 2,324,370 | 1,149,583 | 713,222 | 16,439,226 | ||||||||||||||||||
| $ | 5,648,774 | $ | 10,705,434 | $ | 2,517,217 | $ | 1,395,849 | $ | 1,180,774 | $ | 21,448,048 | |||||||||||||
Impaired loans/leases | $ | 1,761,850 | $ | 12,956,915 | $ | 894,458 | $ | 2,116,747 | $ | 1,350,450 | $ | 19,080,420 | ||||||||||||
Nonimpaired loans/leases | 429,926,279 | 658,796,014 | 128,006,984 | 145,239,576 | 74,683,360 | 1,436,652,213 | ||||||||||||||||||
| $ | 431,688,129 | $ | 671,752,929 | $ | 128,901,442 | $ | 147,356,323 | $ | 76,033,810 | $ | 1,455,732,633 | |||||||||||||
Allowance as a percentage of impaired loans/leases | 52.64 | % | 24.50 | % | 21.56 | % | 11.63 | % | 34.62 | % | 26.25 | % | ||||||||||||
Allowance as a percentage of nonimpaired loans/leases | 1.10 | % | 1.14 | % | 1.82 | % | 0.79 | % | 0.95 | % | 1.14 | % | ||||||||||||
Total allowance as a percentage of total loans/leaess | 1.31 | % | 1.59 | % | 1.95 | % | 0.95 | % | 1.55 | % | 1.47 | % | ||||||||||||
| 2012 | ||||||||||||||||||||||||
| Commercial and Industrial | Commercial Real Estate | Direct Financing Leases | Residential Real Estate | Installment and Other Consumer | Total | |||||||||||||||||||
| Allowance for loans/leases individually evaluated for impairment | $ | 280,170 | $ | 4,005,042 | $ | 125,000 | $ | 105,565 | $ | 71,992 | $ | 4,587,769 | ||||||||||||
| Allowance for loans/leases collectively evaluated for impairment | 4,251,375 | 7,064,460 | 1,865,395 | 964,763 | 1,191,442 | 15,337,435 | ||||||||||||||||||
| $ | 4,531,545 | $ | 11,069,502 | $ | 1,990,395 | $ | 1,070,328 | $ | 1,263,434 | $ | 19,925,204 | |||||||||||||
| Loans/leases individually evaluated for impairment | $ | 1,006,952 | $ | 20,383,846 | $ | 998,802 | $ | 1,217,256 | $ | 687,355 | $ | 24,294,211 | ||||||||||||
| Loans/leases collectively evaluated for impairment | 393,237,300 | 573,595,393 | 102,686,854 | 114,364,317 | 76,033,159 | 1,259,917,023 | ||||||||||||||||||
| $ | 394,244,252 | $ | 593,979,239 | $ | 103,685,656 | $ | 115,581,573 | $ | 76,720,514 | $ | 1,284,211,234 | |||||||||||||
| Allowance as a percentage of loans/leases individually evaluated for impairment | 27.82 | % | 19.65 | % | 12.51 | % | 8.67 | % | 10.47 | % | 18.88 | % | ||||||||||||
| Allowance as a percentage of loans/leases collectively evaluated for impairment | 1.08 | % | 1.23 | % | 1.82 | % | 0.84 | % | 1.57 | % | 1.22 | % | ||||||||||||
| Total allowance as a percentage of total loans/leaess | 1.15 | % | 1.86 | % | 1.92 | % | 0.93 | % | 1.65 | % | 1.55 | % | ||||||||||||
| 2011 | ||||||||||||||||||||||||
| Commercial and Industrial | Commercial Real Estate | Direct Financing Leases | Residential Real Estate | Installment and Other Consumer | Total | |||||||||||||||||||
| Allowance for loans/leases individually evaluated for impairment | $ | 903,187 | $ | 4,297,738 | $ | 66,675 | $ | 55,884 | $ | 22,819 | $ | 5,346,303 | ||||||||||||
| Allowance for loans/leases collectively evaluated for impairment | 3,974,819 | 6,299,220 | 1,272,821 | 649,062 | 1,247,037 | 13,442,959 | ||||||||||||||||||
| $ | 4,878,006 | $ | 10,596,958 | $ | 1,339,496 | $ | 704,946 | $ | 1,269,856 | $ | 18,789,262 | |||||||||||||
| Loans/leases individually evaluated for impairment | $ | 2,152,855 | $ | 24,281,365 | $ | 1,306,663 | $ | 1,133,474 | $ | 984,806 | $ | 29,859,163 | ||||||||||||
| Loans/leases collectively evaluated for impairment | 348,641,423 | 553,522,485 | 91,905,699 | 96,973,577 | 77,238,274 | 1,168,281,458 | ||||||||||||||||||
| $ | 350,794,278 | $ | 577,803,850 | $ | 93,212,362 | $ | 98,107,051 | $ | 78,223,080 | $ | 1,198,140,621 | |||||||||||||
| Allowance as a percentage of loans/leases individually evaluated for impairment | 41.95 | % | 17.70 | % | 5.10 | % | 4.93 | % | 2.32 | % | 17.91 | % | ||||||||||||
| Allowance as a percentage of loans/leases collectively evaluated for impairment | 1.14 | % | 1.14 | % | 1.38 | % | 0.67 | % | 1.61 | % | 1.15 | % | ||||||||||||
| Total allowance as a percentage of total loans/leaess | 1.39 | % | 1.83 | % | 1.44 | % | 0.72 | % | 1.62 | % | 1.56 | % | ||||||||||||
QCR Holdings, Inc. and Subsidiaries
Notes to Consolidated Financial Statements
Note 3.4. Loans/Leases Receivable (Continued)
Information for impaired loans/leases is presented in the tables below. The recorded investment represents customer balances net of any partial charge-offs recognized on the loan/lease. The unpaid principal balance represents the recorded balance outstanding on the loan/lease prior to any partial charge-offs.
Loans/leases, by classes of financing receivable, considered to be impaired as of and for the years ended December 31, 2014, 2013, and 2012 2011, and 2010 isare presented as follows:
| 2012 | ||||||||||||||||||||||||
| Classes of Loans/Leases | Recorded Investment | Unpaid Principal Balance | Related Allowance | Average Recorded Investment | Interest Income Recognized | Interest Income Recognized for Cash Payments Received | ||||||||||||||||||
| Impaired Loans/Leases with No Specific Allowance Recorded: | ||||||||||||||||||||||||
| Commercial and Industrial | $ | 438,355 | $ | 1,203,710 | $ | - | $ | 757,286 | $ | 7,910 | $ | 7,910 | ||||||||||||
| Commercial Real Estate | ||||||||||||||||||||||||
| Owner-Occupied Commercial Real Estate | 503,321 | 503,321 | - | 624,766 | - | - | ||||||||||||||||||
| Commercial Construction, Land Development, and Other Land | 678,523 | 678,523 | - | 3,359,435 | 3,549 | 3,549 | ||||||||||||||||||
| Other Non Owner-Occupied Commercial Real Estate | 495,702 | 495,702 | - | 5,288,820 | 2,017 | 2,017 | ||||||||||||||||||
| Direct Financing Leases | 777,645 | 777,645 | - | 871,076 | - | - | ||||||||||||||||||
| Residential Real Estate | 944,211 | 1,127,242 | - | 1,050,160 | 6,728 | 6,728 | ||||||||||||||||||
| Installment and Other Consumer | 534,368 | 534,368 | - | 815,720 | 629 | 629 | ||||||||||||||||||
| $ | 4,372,125 | $ | 5,320,511 | $ | - | $ | 12,767,263 | $ | 20,833 | $ | 20,833 | |||||||||||||
| Impaired Loans/Leases with Specific Allowance Recorded: | ||||||||||||||||||||||||
| Commercial and Industrial | $ | 568,597 | $ | 590,849 | $ | 280,170 | $ | 499,036 | $ | - | $ | - | ||||||||||||
| Commercial Real Estate | ||||||||||||||||||||||||
| Owner-Occupied Commercial Real Estate | - | - | - | - | - | - | ||||||||||||||||||
| Commercial Construction, Land Development, and Other Land | 3,967,583 | 3,967,583 | 1,105,795 | 2,311,845 | 5,749 | 5,749 | ||||||||||||||||||
| Other Non Owner-Occupied Commercial Real Estate | 14,738,717 | 14,991,676 | 2,899,247 | 10,949,295 | 308,339 | 308,339 | ||||||||||||||||||
| Direct Financing Leases | 221,157 | 221,157 | 125,000 | 90,610 | - | - | ||||||||||||||||||
| Residential Real Estate | 273,045 | 273,045 | 105,565 | 258,677 | - | - | ||||||||||||||||||
| Installment and Other Consumer | 152,987 | 152,987 | 71,992 | 101,075 | - | - | ||||||||||||||||||
| $ | 19,922,086 | $ | 20,197,297 | $ | 4,587,769 | $ | 14,210,538 | $ | 314,088 | $ | 314,088 | |||||||||||||
| Total Impaired Loans/Leases: | ||||||||||||||||||||||||
| Commercial and Industrial | $ | 1,006,952 | $ | 1,794,559 | $ | 280,170 | $ | 1,256,322 | $ | 7,910 | $ | 7,910 | ||||||||||||
| Commercial Real Estate | ||||||||||||||||||||||||
| Owner-Occupied Commercial Real Estate | 503,321 | 503,321 | - | 624,766 | - | - | ||||||||||||||||||
| Commercial Construction, Land Development, and Other Land | 4,646,106 | 4,646,106 | 1,105,795 | 5,671,280 | 9,298 | 9,298 | ||||||||||||||||||
| Other Non Owner-Occupied Commercial Real Estate | 15,234,419 | 15,487,378 | 2,899,247 | 16,238,115 | 310,356 | 310,356 | ||||||||||||||||||
| Direct Financing Leases | 998,802 | 998,802 | 125,000 | 961,686 | - | - | ||||||||||||||||||
| Residential Real Estate | 1,217,256 | 1,400,287 | 105,565 | 1,308,837 | 6,728 | 6,728 | ||||||||||||||||||
| Installment and Other Consumer | 687,355 | 687,355 | 71,992 | 916,795 | 629 | 629 | ||||||||||||||||||
| $ | 24,294,211 | $ | 25,517,808 | $ | 4,587,769 | $ | 26,977,801 | $ | 334,921 | $ | 334,921 | |||||||||||||
2014 | ||||||||||||||||||||||||
Classes of Loans/Leases | Recorded Investment | Unpaid Principal Balance | Related Allowance | Average Recorded Investment | Interest Income Recognized | Interest Income Recognized for Cash Payments Received | ||||||||||||||||||
Impaired Loans/Leases with No Specific Allowance Recorded: | ||||||||||||||||||||||||
Commercial and Industrial | $ | 246,308 | $ | 342,391 | $ | - | $ | 525,543 | $ | 7,599 | $ | 7,599 | ||||||||||||
Commercial Real Estate | ||||||||||||||||||||||||
Owner-Occupied Commercial Real Estate | 67,415 | 163,638 | - | 548,464 | - | - | ||||||||||||||||||
Commercial Construction, Land Development, and Other Land | 31,936 | 143,136 | - | 1,656,401 | - | - | ||||||||||||||||||
Other Non Owner-Occupied Commercial Real Estate | 491,717 | 491,717 | - | 4,925,681 | 13,283 | 13,283 | ||||||||||||||||||
Direct Financing Leases | 561,414 | 561,414 | - | 867,657 | 31,911 | 31,911 | ||||||||||||||||||
Residential Real Estate | 1,060,770 | 1,060,770 | - | 1,269,213 | 3,032 | 3,032 | ||||||||||||||||||
Installment and Other Consumer | 671,319 | 671,319 | - | 898,764 | - | - | ||||||||||||||||||
| $ | 3,130,879 | $ | 3,434,385 | $ | - | $ | 10,691,723 | $ | 55,825 | $ | 55,825 | |||||||||||||
Impaired Loans/Leases with Specific Allowance Recorded: | ||||||||||||||||||||||||
Commercial and Industrial | $ | 7,033,401 | $ | 8,190,495 | $ | 3,300,199 | $ | 3,159,985 | $ | 14,837 | $ | 14,837 | ||||||||||||
Commercial Real Estate | ||||||||||||||||||||||||
Owner-Occupied Commercial Real Estate | 620,896 | 620,896 | 4,462 | 316,743 | - | - | ||||||||||||||||||
Commercial Construction, Land Development, and Other Land | 337,076 | 577,894 | 12,087 | 528,564 | - | - | ||||||||||||||||||
Other Non Owner-Occupied Commercial Real Estate | 5,884,343 | 6,583,934 | 1,153,471 | 4,240,000 | - | - | ||||||||||||||||||
Direct Financing Leases | 777,858 | 777,858 | 356,996 | 514,144 | - | - | ||||||||||||||||||
Residential Real Estate | 727,959 | 763,537 | 151,663 | 538,678 | 2,967 | 2,967 | ||||||||||||||||||
Installment and Other Consumer | 494,229 | 494,229 | 265,795 | 386,009 | 3,564 | 3,564 | ||||||||||||||||||
| $ | 15,875,762 | $ | 18,008,843 | $ | 5,244,673 | $ | 9,684,123 | $ | 21,368 | $ | 21,368 | |||||||||||||
Total Impaired Loans/Leases: | ||||||||||||||||||||||||
Commercial and Industrial | $ | 7,279,709 | $ | 8,532,886 | $ | 3,300,199 | $ | 3,685,528 | $ | 22,436 | $ | 22,436 | ||||||||||||
Commercial Real Estate | ||||||||||||||||||||||||
Owner-Occupied Commercial Real Estate | 688,311 | 784,534 | 4,462 | 865,207 | - | - | ||||||||||||||||||
Commercial Construction, Land Development, and Other Land | 369,012 | 721,030 | 12,087 | 2,184,965 | - | - | ||||||||||||||||||
Other Non Owner-Occupied Commercial Real Estate | 6,376,060 | 7,075,651 | 1,153,471 | 9,165,681 | 13,283 | 13,283 | ||||||||||||||||||
Direct Financing Leases | 1,339,272 | 1,339,272 | 356,996 | 1,381,801 | 31,911 | 31,911 | ||||||||||||||||||
Residential Real Estate | 1,788,729 | 1,824,307 | 151,663 | 1,807,891 | 5,999 | 5,999 | ||||||||||||||||||
Installment and Other Consumer | 1,165,548 | 1,165,548 | 265,795 | 1,284,773 | 3,564 | 3,564 | ||||||||||||||||||
| $ | 19,006,641 | $ | 21,443,228 | $ | 5,244,673 | $ | 20,375,846 | $ | 77,193 | $ | 77,193 | |||||||||||||
Impaired loans/leases for which no allowance has been provided have adequate collateral, based on management’s current estimates.
QCR Holdings, Inc. and Subsidiaries
Notes to Consolidated Financial Statements
Note 3.4. Loans/Leases Receivable (Continued)
| 2011 | ||||||||||||||||||||||||
| Classes of Loans/Leases | Recorded Investment | Unpaid Principal Balance | Related Allowance | Average Recorded Investment | Interest Income Recognized | Interest Income Recognized for Cash Payments Received | ||||||||||||||||||
| Impaired Loans/Leases with No Specific Allowance Recorded: | ||||||||||||||||||||||||
| Commercial and Industrial | $ | 360,947 | $ | 979,901 | $ | - | $ | 3,873,371 | $ | - | $ | - | ||||||||||||
| Commercial Real Estate | ||||||||||||||||||||||||
| Owner-Occupied Commercial Real Estate | 736,610 | 736,610 | - | 1,909,754 | - | - | ||||||||||||||||||
| Commercial Construction, Land Development, and Other Land | - | - | - | 2,979,950 | - | - | ||||||||||||||||||
| Other Non Owner-Occupied Commercial Real Estate | 3,936,826 | 3,986,820 | - | 5,568,776 | - | - | ||||||||||||||||||
| Direct Financing Leases | 1,094,178 | 1,094,178 | - | 1,487,570 | 81,921 | 81,921 | ||||||||||||||||||
| Residential Real Estate | 788,685 | 862,298 | - | 892,480 | - | - | ||||||||||||||||||
| Installment and Other Consumer | 593,987 | 593,987 | - | 821,889 | - | - | ||||||||||||||||||
| $ | 7,511,233 | $ | 8,253,794 | $ | - | $ | 17,533,790 | $ | 81,921 | $ | 81,921 | |||||||||||||
| Impaired Loans/Leases with Specific Allowance Recorded: | ||||||||||||||||||||||||
| Commercial and Industrial | $ | 1,791,908 | $ | 1,791,908 | $ | 903,187 | $ | 1,175,105 | $ | 36,984 | $ | 36,984 | ||||||||||||
| Commercial Real Estate | ||||||||||||||||||||||||
| Owner-Occupied Commercial Real Estate | 217,059 | 217,059 | 47,911 | 121,201 | - | - | ||||||||||||||||||
| Commercial Construction, Land Development, and Other Land | 9,051,455 | 9,051,455 | 3,002,450 | 4,334,241 | 16,249 | 16,249 | ||||||||||||||||||
| Other Non Owner-Occupied Commercial Real Estate | 10,339,415 | 10,839,415 | 1,247,377 | 5,595,044 | 11,623 | 11,623 | ||||||||||||||||||
| Direct Financing Leases | 212,485 | 212,485 | 66,675 | 138,127 | 5,244 | 5,244 | ||||||||||||||||||
| Residential Real Estate | 344,789 | 344,789 | 55,884 | 282,020 | - | - | ||||||||||||||||||
| Installment and Other Consumer | 390,819 | 390,819 | 22,819 | 51,871 | - | - | ||||||||||||||||||
| $ | 22,347,930 | $ | 22,847,930 | $ | 5,346,303 | $ | 11,697,609 | $ | 70,100 | $ | 70,100 | |||||||||||||
| Total Impaired Loans/Leases: | ||||||||||||||||||||||||
| Commercial and Industrial | $ | 2,152,855 | $ | 2,771,809 | $ | 903,187 | $ | 5,048,476 | $ | 36,984 | $ | 36,984 | ||||||||||||
| Commercial Real Estate | ||||||||||||||||||||||||
| Owner-Occupied Commercial Real Estate | 953,669 | 953,669 | 47,911 | 2,030,955 | - | - | ||||||||||||||||||
| Commercial Construction, Land Development, and Other Land | 9,051,455 | 9,051,455 | 3,002,450 | 7,314,191 | 16,249 | 16,249 | ||||||||||||||||||
| Other Non Owner-Occupied Commercial Real Estate | 14,276,241 | 14,826,235 | 1,247,377 | 11,163,820 | 11,623 | 11,623 | ||||||||||||||||||
| Direct Financing Leases | 1,306,663 | 1,306,663 | 66,675 | 1,625,697 | 87,165 | 87,165 | ||||||||||||||||||
| Residential Real Estate | 1,133,474 | 1,207,087 | 55,884 | 1,174,500 | - | - | ||||||||||||||||||
| Installment and Other Consumer | 984,806 | 984,806 | 22,819 | 873,760 | - | - | ||||||||||||||||||
| $ | 29,859,163 | $ | 31,101,724 | $ | 5,346,303 | $ | 29,231,399 | $ | 152,021 | $ | 152,021 | |||||||||||||
2013 | ||||||||||||||||||||||||
Classes of Loans/Leases | Recorded Investment | Unpaid Principal Balance | Related Allowance | Average Recorded Investment | Interest Income Recognized | Interest Income Recognized for Cash Payments Received | ||||||||||||||||||
Impaired Loans/Leases with No Specific Allowance Recorded: | ||||||||||||||||||||||||
Commercial and Industrial | $ | 492,622 | $ | 568,951 | $ | - | $ | 747,134 | $ | 7,749 | $ | 7,749 | ||||||||||||
Commercial Real Estate | ||||||||||||||||||||||||
Owner-Occupied Commercial Real Estate | 392,542 | 392,542 | - | 1,881,823 | - | - | ||||||||||||||||||
Commercial Construction, Land Development, and Other Land | 1,943,168 | 2,054,368 | - | 2,666,039 | - | - | ||||||||||||||||||
Other Non Owner-Occupied Commercial Real Estate | 1,790,279 | 1,902,279 | - | 3,869,493 | 58,534 | 58,534 | ||||||||||||||||||
Direct Financing Leases | 557,469 | 557,469 | - | 802,825 | - | - | ||||||||||||||||||
Residential Real Estate | 1,071,927 | 1,071,927 | - | 1,010,027 | 4,235 | 4,235 | ||||||||||||||||||
Installment and Other Consumer | 509,667 | 509,667 | - | 606,282 | 4,464 | 4,464 | ||||||||||||||||||
| $ | 6,757,674 | $ | 7,057,203 | $ | - | $ | 11,583,623 | $ | 74,982 | $ | 74,982 | |||||||||||||
Impaired Loans/Leases with Specific Allowance Recorded: | ||||||||||||||||||||||||
Commercial and Industrial | $ | 1,269,228 | $ | 1,956,755 | $ | 927,453 | $ | 1,222,449 | $ | 33,703 | $ | 33,703 | ||||||||||||
Commercial Real Estate | ||||||||||||||||||||||||
Owner-Occupied Commercial Real Estate | 159,247 | 159,247 | 67,498 | 87,035 | - | - | ||||||||||||||||||
Commercial Construction, Land Development, and Other Land | 888,547 | 1,011,747 | 503,825 | 1,137,489 | 10,862 | 10,862 | ||||||||||||||||||
Other Non Owner-Occupied Commercial Real Estate | 7,783,132 | 8,488,414 | 2,603,381 | 7,426,299 | 45,926 | 45,926 | ||||||||||||||||||
Direct Financing Leases | 336,989 | 336,989 | 192,847 | 97,846 | - | - | ||||||||||||||||||
Residential Real Estate | 1,044,820 | 1,044,820 | 246,266 | 641,217 | 1,883 | 1,883 | ||||||||||||||||||
Installment and Other Consumer | 840,783 | 840,783 | 467,552 | 640,557 | - | - | ||||||||||||||||||
| $ | 12,322,746 | $ | 13,838,755 | $ | 5,008,822 | $ | 11,252,892 | $ | 92,374 | $ | 92,374 | |||||||||||||
Total Impaired Loans/Leases: | ||||||||||||||||||||||||
Commercial and Industrial | $ | 1,761,850 | $ | 2,525,706 | $ | 927,453 | $ | 1,969,583 | $ | 41,452 | $ | 41,452 | ||||||||||||
Commercial Real Estate | ||||||||||||||||||||||||
Owner-Occupied Commercial Real Estate | 551,789 | 551,789 | 67,498 | 1,968,858 | - | - | ||||||||||||||||||
Commercial Construction, Land Development, and Other Land | 2,831,715 | 3,066,115 | 503,825 | 3,803,528 | 10,862 | 10,862 | ||||||||||||||||||
Other Non Owner-Occupied Commercial Real Estate | 9,573,411 | 10,390,693 | 2,603,381 | 11,295,792 | 104,460 | 104,460 | ||||||||||||||||||
Direct Financing Leases | 894,458 | 894,458 | 192,847 | 900,671 | - | - | ||||||||||||||||||
Residential Real Estate | 2,116,747 | 2,116,747 | 246,266 | 1,651,244 | 6,118 | 6,118 | ||||||||||||||||||
Installment and Other Consumer | 1,350,450 | 1,350,450 | 467,552 | 1,246,839 | 4,464 | 4,464 | ||||||||||||||||||
| $ | 19,080,420 | $ | 20,895,958 | $ | 5,008,822 | $ | 22,836,515 | $ | 167,356 | $ | 167,356 | |||||||||||||
Impaired loans/leases for which no allowance has been provided have adequate collateral, based on management’s current estimates.
QCR Holdings, Inc. and Subsidiaries
Notes to Consolidated Financial Statements
Note 3.4. Loans/Leases Receivable (Continued)
| 2010 | ||||||||||||||||||||||||
| Classes of Loans/Leases | Recorded Investment | Unpaid Principal Balance | Related Allowance | Average Recorded Investment | Interest Income Recognized | Interest Income Recognized for Cash Payments Received | ||||||||||||||||||
| Impaired Loans/Leases with No Specific Allowance Recorded: | ||||||||||||||||||||||||
| Commercial and Industrial | $ | 1,459,790 | $ | 3,350,036 | $ | - | $ | 1,782,357 | $ | - | $ | - | ||||||||||||
| Commercial Real Estate | ||||||||||||||||||||||||
| Owner-Occupied Commercial Real Estate | 681,727 | 681,727 | - | 553,012 | - | - | ||||||||||||||||||
| Commercial Construction, Land Development, and Other Land | 2,538,621 | 2,872,083 | - | 1,530,324 | - | - | ||||||||||||||||||
| Other Non Owner-Occupied Commercial Real Estate | 2,942,189 | 3,792,226 | - | 1,478,956 | - | - | ||||||||||||||||||
| Direct Financing Leases | 953,994 | 953,994 | - | 1,080,564 | 27,089 | 27,089 | ||||||||||||||||||
| Residential Real Estate | 758,031 | 758,031 | - | 721,757 | - | - | ||||||||||||||||||
| Installment and Other Consumer | 1,561,322 | 1,561,322 | - | 569,542 | 11,825 | 11,825 | ||||||||||||||||||
| $ | 10,895,674 | $ | 13,969,419 | $ | - | $ | 7,716,512 | $ | 38,914 | $ | 38,914 | |||||||||||||
| Impaired Loans/Leases with Specific Allowance Recorded: | ||||||||||||||||||||||||
| Commercial and Industrial | $ | 7,364,880 | $ | 7,866,634 | $ | 3,331,436 | $ | 5,962,381 | $ | 19,891 | $ | 19,891 | ||||||||||||
| Commercial Real Estate | ||||||||||||||||||||||||
| Owner-Occupied Commercial Real Estate | 1,074,210 | 1,074,210 | 232,194 | 847,507 | 45,641 | 45,641 | ||||||||||||||||||
| Commercial Construction, Land Development, and Other Land | 7,660,458 | 7,660,458 | 1,818,193 | 9,263,675 | 3,832 | 3,832 | ||||||||||||||||||
| Other Non Owner-Occupied Commercial Real Estate | 9,872,826 | 10,091,777 | 1,658,791 | 9,393,250 | 235,366 | 235,366 | ||||||||||||||||||
| Direct Financing Leases | 811,096 | 811,096 | 335,000 | 663,697 | - | - | ||||||||||||||||||
| Residential Real Estate | 528,246 | 528,246 | 27,355 | 565,051 | - | - | ||||||||||||||||||
| Installment and Other Consumer | 49,777 | 49,777 | 49,777 | 432,460 | - | - | ||||||||||||||||||
| $ | 27,361,493 | $ | 28,082,198 | $ | 7,452,746 | $ | 27,128,021 | $ | 304,730 | $ | 304,730 | |||||||||||||
| Total Impaired Loans/Leases: | ||||||||||||||||||||||||
| Commercial and Industrial | $ | 8,824,670 | $ | 11,216,670 | $ | 3,331,436 | $ | 7,744,738 | $ | 19,891 | $ | 19,891 | ||||||||||||
| Commercial Real Estate | ||||||||||||||||||||||||
| Owner-Occupied Commercial Real Estate | 1,755,937 | 1,755,937 | 232,194 | 1,400,519 | 45,641 | 45,641 | ||||||||||||||||||
| Commercial Construction, Land Development, and Other Land | 10,199,079 | 10,532,541 | 1,818,193 | 10,793,999 | 3,832 | 3,832 | ||||||||||||||||||
| Other Non Owner-Occupied Commercial Real Estate | 12,815,015 | 13,884,003 | 1,658,791 | 10,872,206 | 235,366 | 235,366 | ||||||||||||||||||
| Direct Financing Leases | 1,765,090 | 1,765,090 | 335,000 | 1,744,261 | 27,089 | 27,089 | ||||||||||||||||||
| Residential Real Estate | 1,286,277 | 1,286,277 | 27,355 | 1,286,808 | - | - | ||||||||||||||||||
| Installment and Other Consumer | 1,611,099 | 1,611,099 | 49,777 | 1,002,002 | 11,825 | 11,825 | ||||||||||||||||||
| $ | 38,257,167 | $ | 42,051,617 | $ | 7,452,746 | $ | 34,844,533 | $ | 343,644 | $ | 343,644 | |||||||||||||
2012 | ||||||||||||||||||||||||
Classes of Loans/Leases | Recorded Investment | Unpaid Principal Balance | Related Allowance | Average Recorded Investment | Interest Income Recognized | Interest Income Recognized for Cash Payments Received | ||||||||||||||||||
Impaired Loans/Leases with No Specific Allowance Recorded: | ||||||||||||||||||||||||
Commercial and Industrial | $ | 438,355 | $ | 1,203,710 | $ | - | $ | 757,286 | $ | 7,910 | $ | 7,910 | ||||||||||||
Commercial Real Estate | ||||||||||||||||||||||||
Owner-Occupied Commercial Real Estate | 503,321 | 503,321 | - | 624,766 | - | - | ||||||||||||||||||
Commercial Construction, Land Development, and Other Land | 678,523 | 678,523 | - | 3,359,435 | 3,549 | 3,549 | ||||||||||||||||||
Other Non Owner-Occupied Commercial Real Estate | 495,702 | 495,702 | - | 5,288,820 | 2,017 | 2,017 | ||||||||||||||||||
Direct Financing Leases | 777,645 | 777,645 | - | 871,076 | - | - | ||||||||||||||||||
Residential Real Estate | 944,211 | 1,127,242 | - | 1,050,160 | 6,728 | 6,728 | ||||||||||||||||||
Installment and Other Consumer | 534,368 | 534,368 | - | 815,720 | 629 | 629 | ||||||||||||||||||
| $ | 4,372,125 | $ | 5,320,511 | $ | - | $ | 12,767,263 | $ | 20,833 | $ | 20,833 | |||||||||||||
Impaired Loans/Leases with Specific Allowance Recorded: | ||||||||||||||||||||||||
Commercial and Industrial | $ | 568,597 | $ | 590,849 | $ | 280,170 | $ | 499,036 | $ | - | $ | - | ||||||||||||
Commercial Real Estate | ||||||||||||||||||||||||
Owner-Occupied Commercial Real Estate | - | - | - | - | - | - | ||||||||||||||||||
Commercial Construction, Land Development, and Other Land | 3,967,583 | 3,967,583 | 1,105,795 | 2,311,845 | 5,749 | 5,749 | ||||||||||||||||||
Other Non Owner-Occupied Commercial Real Estate | 14,738,717 | 14,991,676 | 2,899,247 | 10,949,295 | 308,339 | 308,339 | ||||||||||||||||||
Direct Financing Leases | 221,157 | 221,157 | 125,000 | 90,610 | - | - | ||||||||||||||||||
Residential Real Estate | 273,045 | 273,045 | 105,565 | 258,677 | - | - | ||||||||||||||||||
Installment and Other Consumer | 152,987 | 152,987 | 71,992 | 101,075 | - | - | ||||||||||||||||||
| $ | 19,922,086 | $ | 20,197,297 | $ | 4,587,769 | $ | 14,210,538 | $ | 314,088 | $ | 314,088 | |||||||||||||
Total Impaired Loans/Leases: | ||||||||||||||||||||||||
Commercial and Industrial | $ | 1,006,952 | $ | 1,794,559 | $ | 280,170 | $ | 1,256,322 | $ | 7,910 | $ | 7,910 | ||||||||||||
Commercial Real Estate | ||||||||||||||||||||||||
Owner-Occupied Commercial Real Estate | 503,321 | 503,321 | - | 624,766 | - | - | ||||||||||||||||||
Commercial Construction, Land Development, and Other Land | 4,646,106 | 4,646,106 | 1,105,795 | 5,671,280 | 9,298 | 9,298 | ||||||||||||||||||
Other Non Owner-Occupied Commercial Real Estate | 15,234,419 | 15,487,378 | 2,899,247 | 16,238,115 | 310,356 | 310,356 | ||||||||||||||||||
Direct Financing Leases | 998,802 | 998,802 | 125,000 | 961,686 | - | - | ||||||||||||||||||
Residential Real Estate | 1,217,256 | 1,400,287 | 105,565 | 1,308,837 | 6,728 | 6,728 | ||||||||||||||||||
Installment and Other Consumer | 687,355 | 687,355 | 71,992 | 916,795 | 629 | 629 | ||||||||||||||||||
| $ | 24,294,211 | $ | 25,517,808 | $ | 4,587,769 | $ | 26,977,801 | $ | 334,921 | $ | 334,921 | |||||||||||||
Impaired loans/leases for which no allowance has been provided have adequate collateral, based on management’s current estimates.
QCR Holdings, Inc. and Subsidiaries
Notes to Consolidated Financial Statements
Note 3.4. Loans/Leases Receivable (Continued)
For commercial and industrial and commercial real estate loans, the Company’s credit quality indicator is internally assigned risk ratings. Each commercial loan is assigned a risk rating upon origination. The risk rating is reviewed every 15 months, at a minimum, and on an as needed basis depending on the specific circumstances of the loan. See Note 1 for further discussion on the Company’s risk ratings.
For direct financing leases, residential real estate loans, and installment and other consumer loans, the Company’s credit quality indicator is performance determined by delinquency status. Delinquency status is updated daily by the Company’s loan system.
For each class of financing receivable, the following presents the recorded investment by credit quality indicator as of December 31, 20122014 and 2011:
| 2012 | ||||||||||||||||||||
| Commercial Real Estate | ||||||||||||||||||||
| Non Owner-Occupied | ||||||||||||||||||||
| Internally Assigned Risk Rating | Commercial and Industrial | Owner-Occupied Commercial Real Estate | Commercial Construction, Land Development, and Other Land | Other Commercial Real Estate | Total | |||||||||||||||
| Pass (Ratings 1 through 5) | $ | 371,856,380 | $ | 195,567,523 | $ | 38,125,793 | $ | 312,370,393 | $ | 917,920,089 | ||||||||||
| Special Mention (Rating 6) | 8,008,866 | 5,488,602 | 1,238,152 | 7,319,902 | 22,055,522 | |||||||||||||||
| Substandard (Rating 7) | 14,379,006 | 3,855,183 | 5,598,436 | 24,415,255 | 48,247,880 | |||||||||||||||
| Doubtful (Rating 8) | - | - | - | - | - | |||||||||||||||
| $ | 394,244,252 | $ | 204,911,308 | $ | 44,962,381 | $ | 344,105,550 | $ | 988,223,491 | |||||||||||
| 2012 | ||||||||||||||||||||
| Delinquency Status * | Direct Financing Leases | Residential Real Estate | Installment and Other Consumer | Total | ||||||||||||||||
| Performing | $ | 102,686,854 | $ | 114,364,316 | $ | 75,921,358 | $ | 292,972,528 | ||||||||||||
| Nonperforming | 998,802 | 1,217,257 | 799,156 | 3,015,215 | ||||||||||||||||
| $ | 103,685,656 | $ | 115,581,573 | $ | 76,720,514 | $ | 295,987,743 | |||||||||||||
| 2011 | ||||||||||||||||||||
| Commercial Real Estate | ||||||||||||||||||||
| Non Owner-Occupied | ||||||||||||||||||||
| Internally Assigned Risk Rating | Commercial and Industrial | Owner-Occupied Commercial Real Estate | Commercial Construction, Land Development, and Other Land | Other Commercial Real Estate | Total | |||||||||||||||
| Pass (Ratings 1 through 5) | $ | 324,225,905 | $ | 158,955,618 | $ | 46,268,554 | $ | 310,401,972 | $ | 839,852,049 | ||||||||||
| Special Mention (Rating 6) | 8,814,497 | 2,700,496 | 764,586 | 13,754,798 | 26,034,377 | |||||||||||||||
| Substandard (Rating 7) | 17,753,876 | 6,134,507 | 13,351,598 | 25,471,721 | 62,711,702 | |||||||||||||||
| Doubtful (Rating 8) | - | - | - | - | - | |||||||||||||||
| $ | 350,794,278 | $ | 167,790,621 | $ | 60,384,738 | $ | 349,628,491 | $ | 928,598,128 | |||||||||||
| 2011 | ||||||||||||||||||||
| Delinquency Status * | Direct Financing Leases | Residential Real Estate | Installment and Other Consumer | Total | ||||||||||||||||
| Performing | $ | 91,905,699 | $ | 96,973,576 | $ | 77,126,064 | $ | 266,005,339 | ||||||||||||
| Nonperforming | 1,306,663 | 1,133,475 | 1,097,016 | 3,537,154 | ||||||||||||||||
| $ | 93,212,362 | $ | 98,107,051 | $ | 78,223,080 | $ | 269,542,493 | |||||||||||||
2014 | ||||||||||||||||||||
Commercial Real Estate | ||||||||||||||||||||
Non Owner-Occupied | ||||||||||||||||||||
Internally Assigned Risk Rating | Commercial and Industrial | Owner-Occupied Commercial Real Estate | Commercial Construction, Land Development, and Other Land | Other Commercial Real Estate | Total | |||||||||||||||
Pass (Ratings 1 through 5) | $ | 491,883,568 | $ | 245,237,462 | $ | 65,691,737 | $ | 354,581,419 | $ | 1,157,394,186 | ||||||||||
Special Mention (Rating 6) | 17,034,909 | 12,637,930 | - | 3,285,191 | 32,958,030 | |||||||||||||||
Substandard (Rating 7) | 15,008,663 | 2,193,688 | 2,427,252 | 16,085,743 | 35,715,346 | |||||||||||||||
Doubtful (Rating 8) | - | - | - | - | - | |||||||||||||||
| $ | 523,927,140 | $ | 260,069,080 | $ | 68,118,989 | $ | 373,952,353 | $ | 1,226,067,562 | |||||||||||
2014 | ||||||||||||||||
Delinquency Status * | Direct Financing Leases | Residential Real Estate | Installment and Other Consumer | Total | ||||||||||||
Performing | $ | 164,693,144 | $ | 156,818,091 | $ | 71,491,531 | $ | 393,002,766 | ||||||||
Nonperforming | 1,339,272 | 1,814,401 | 1,114,949 | 4,268,622 | ||||||||||||
| $ | 166,032,416 | $ | 158,632,492 | $ | 72,606,480 | $ | 397,271,388 | |||||||||
2013 | ||||||||||||||||||||
Commercial Real Estate | ||||||||||||||||||||
Non Owner-Occupied | ||||||||||||||||||||
Internally Assigned Risk Rating | Commercial and Industrial | Owner-Occupied Commercial Real Estate | Commercial Construction, Land Development, and Other Land | Other Commercial Real Estate | Total | |||||||||||||||
Pass (Ratings 1 through 5) | $ | 407,294,743 | $ | 250,028,731 | $ | 51,868,919 | $ | 326,168,882 | $ | 1,035,361,275 | ||||||||||
Special Mention (Rating 6) | 11,355,713 | 8,318,232 | 1,588,086 | 3,310,017 | 24,572,048 | |||||||||||||||
Substandard (Rating 7) | 13,037,673 | 2,868,949 | 4,387,897 | 23,213,216 | 43,507,735 | |||||||||||||||
Doubtful (Rating 8) | - | - | - | - | - | |||||||||||||||
| $ | 431,688,129 | $ | 261,215,912 | $ | 57,844,902 | $ | 352,692,115 | $ | 1,103,441,058 | |||||||||||
2013 | ||||||||||||||||
Delinquency Status * | Direct Financing Leases | Residential Real Estate | Installment and Other Consumer | Total | ||||||||||||
Performing | $ | 128,006,984 | $ | 145,345,719 | $ | 74,688,039 | $ | 348,040,742 | ||||||||
Nonperforming | 894,458 | 2,010,604 | 1,345,771 | 4,250,833 | ||||||||||||
| $ | 128,901,442 | $ | 147,356,323 | $ | 76,033,810 | $ | 352,291,575 | |||||||||
*Performing = loans/leases accruing and less than 90 days past due. Nonperforming = loans/leases on nonaccrual, accruing loans/leases that are greater than or equal to 90 days past due, and accruing troubled debt restructurings.
QCR Holdings, Inc. and Subsidiaries
Notes to Consolidated Financial Statements
Note 3.4. Loans/Leases Receivable (Continued)
As of December 31, 20122014 and 2011,2013, troubled debt restructurings totaled $12,958,374$6,434,259 and $20,526,457,$13,413,366, respectively.
For each class of financing receivable, the following presents the number and recorded investment of troubled debt restructurings, by type of concession, that were restructured during the years ended December 31, 20122014 and 2011.2013. The difference between the pre-modification recorded investment and the post-modification recorded investment would be any partial charge-offs at the time of restructuring.
| 2012 | ||||||||||||||||
| Classes of Loans/Leases | Number of Loans/Leases | Pre- Modification Recorded Investment | Post- Modification Recorded Investment | Specific Allowance | ||||||||||||
| CONCESSION - Extension of maturity | ||||||||||||||||
| Other Non Owner-Occupied Commercial Real Estate | 1 | $ | 733,442 | $ | 733,442 | $ | 176,526 | |||||||||
| CONCESSION - Significant payment delay | ||||||||||||||||
| Commercial Construction, Land Development, and Other Land | 8 | $ | 1,274,172 | $ | 1,274,172 | $ | 190,997 | |||||||||
| Other Non Owner-Occupied Commercial Real Estate | 2 | 264,173 | 264,173 | 36,724 | ||||||||||||
| Residential Real Estate | 1 | 64,722 | 64,722 | - | ||||||||||||
| Installment and Other Consumer | 2 | 35,318 | 35,318 | 5,332 | ||||||||||||
| 13 | $ | 1,638,385 | $ | 1,638,385 | $ | 233,053 | ||||||||||
| CONCESSION - Interest rate adjusted below market | ||||||||||||||||
| Commercial Construction, Land Development, and Other Land | 1 | $ | 337,500 | $ | 337,500 | $ | 55,295 | |||||||||
| Other Non Owner-Occupied Commercial Real Estate | 2 | 1,542,784 | 1,289,825 | 262,704 | ||||||||||||
| Residential Real Estate | 1 | 167,739 | 167,739 | - | ||||||||||||
| Installment and Other Consumer | 1 | 16,043 | 16,043 | - | ||||||||||||
| 5 | $ | 2,064,066 | $ | 1,811,107 | $ | 317,999 | ||||||||||
| TOTAL | 19 | $ | 4,435,893 | $ | 4,182,934 | $ | 727,578 | |||||||||
| 2011 | ||||||||||||||||
| Classes of Loans/Leases | Number of Loans/Leases | Pre- Modification Recorded Investment | Post- Modification Recorded Investment | Specific Allowance | ||||||||||||
| CONCESSION - Extension of maturity | ||||||||||||||||
| Other Non Owner-Occupied Commercial Real Estate | 1 | $ | 2,851,134 | $ | 2,851,134 | $ | - | |||||||||
| CONCESSION - Significant payment delay | ||||||||||||||||
| Commercial and Industrial | 4 | $ | 1,175,819 | $ | 1,175,819 | $ | - | |||||||||
| Other Non Owner-Occupied Commercial Real Estate | 2 | 4,309,589 | 4,309,589 | 308,254 | ||||||||||||
| Direct Financing Leases | 2 | 633,621 | 633,621 | - | ||||||||||||
| Installment and Other Consumer | 1 | 187,650 | 187,650 | 125,928 | ||||||||||||
| 9 | $ | 6,306,679 | $ | 6,306,679 | $ | 434,182 | ||||||||||
| CONCESSION - Interest rate adjusted below market | ||||||||||||||||
| Commercial Construction, Land Development, and Other Land | 5 | $ | 6,549,376 | $ | 6,549,376 | $ | 2,203,438 | |||||||||
| TOTAL | 15 | $ | 15,707,189 | $ | 15,707,189 | $ | 2,637,620 | |||||||||
2014 | ||||||||||||||||
Classes of Loans/Leases | Number of Loans/Leases | Pre-Modification Recorded Investment | Post-Modification Recorded Investment | Specific Allowance | ||||||||||||
CONCESSION - Extension of maturity | ||||||||||||||||
Commercial and Industrial | 1 | $ | 58,987 | $ | 58,987 | $ | 58,987 | |||||||||
Direct Financing Leases | 2 | 303,701 | 303,701 | 12,644 | ||||||||||||
Residential Real Estate | 1 | 159,680 | 159,680 | 25,360 | ||||||||||||
Installment and Other Consumer | 1 | 113,653 | 113,653 | 113,653 | ||||||||||||
| 5 | $ | 636,021 | $ | 636,021 | $ | 210,644 | ||||||||||
CONCESSION - Significant payment delay | ||||||||||||||||
Commercial and Industrial | 3 | $ | 889,154 | $ | 889,154 | $ | 217,524 | |||||||||
| 3 | $ | 889,154 | $ | 889,154 | $ | 217,524 | ||||||||||
CONCESSION - Foregiveness of principal | ||||||||||||||||
Commercial and Industrial | 1 | 96,439 | 71,760 | 6,948 | ||||||||||||
| 1 | $ | 96,439 | $ | 71,760 | $ | 6,948 | ||||||||||
CONCESSION - Other | ||||||||||||||||
Commercial and Industrial | 1 | $ | 427,849 | $ | 427,849 | $ | 60,429 | |||||||||
| 1 | $ | 427,849 | $ | 427,849 | $ | 60,429 | ||||||||||
TOTAL | 10 | $ | 2,049,463 | $ | 2,024,784 | $ | 495,545 | |||||||||
Of the troubled debt restructurings reported above, five with post-modification recorded investments totaling $4,480,398$1,387,147 were on nonaccrual atas of December 31, 2011. None of2014.
For the year ended December 31, 2014, the Company had no troubled debt restructurings reported above had partial charge-offs.
Not included in the table above, the Company had one troubled debt restructuring that was restructured and charged off in 2014, totaling $89,443.
QCR Holdings, Inc. and Subsidiaries
Notes to Consolidated Financial Statements
Note 4. Loans/Leases Receivable (continued)
2013 | ||||||||||||||||
Classes of Loans/Leases | Number of Loans/Leases | Pre-Modification Recorded Investment | Post-Modification Recorded Investment | Specific Allowance | ||||||||||||
CONCESSION - Extension of maturity | ||||||||||||||||
Commercial and Industrial | 3 | $ | 809,494 | $ | 809,494 | $ | 182,498 | |||||||||
Owner-Occupied Commercial Real Estate | 1 | 61,517 | 61,517 | 10,260 | ||||||||||||
Other Non Owner-Occupied Commercial Real Estate * | 8 | 6,637,835 | 6,637,835 | 1,535,154 | ||||||||||||
| 12 | $ | 7,508,846 | $ | 7,508,846 | $ | 1,727,912 | ||||||||||
CONCESSION - Significant payment delay | ||||||||||||||||
Residential Real Estate | 1 | $ | 91,581 | $ | 91,581 | $ | - | |||||||||
Installment and Other Consumer | 1 | 370,000 | 370,000 | 300 | ||||||||||||
| 2 | $ | 461,581 | $ | 461,581 | $ | 300 | ||||||||||
CONCESSION - Interest rate adjusted below market | ||||||||||||||||
Commercial Construction, Land Development, and Other Land | 1 | $ | 337,500 | $ | 337,500 | $ | - | |||||||||
Other Non Owner-Occupied Commercial Real Estate ** | 1 | - | - | 4,837 | ||||||||||||
Residential Real Estate | 3 | 394,838 | 394,838 | 108,121 | ||||||||||||
| 5 | $ | 732,338 | $ | 732,338 | $ | 112,958 | ||||||||||
TOTAL | 19 | $ | 8,702,765 | $ | 8,702,765 | $ | 1,841,170 | |||||||||
*Includes one troubled debt restructuring that is a $136,000 line of credit that had nothing outstanding at the time of modification. The total amount outstanding as of December 31, 2013 was $135,477 with specific allowance of $67,745.
**Includes one troubled debt restructuring that is a $25,000 line of credit that had nothing outstanding at the time of modification. The total amount outstanding as of December 31, 2013 was $4,837 with specific allowance of $4,837.
Of the troubled debt restructurings reported above, nine with post-modification recorded investments totaling $6,579,346 were on nonaccrual as of December 31, 2013.
For the year ended December 31, 2013, the Company had one troubled debt restructuring that redefaulted within 12 months subsequent to restructure, where default is defined as delinquency of 90 days or more and/or placement on nonaccrual status. The one troubled debt restructuring had a pre-modification and post-modification recorded investment of $61,517 with no specific allowance.
QCR Holdings, Inc. and Subsidiaries
Notes to Consolidated Financial Statements
Note 4. Loans/Leases Receivable (continued)
Loans are made in the normal course of business to directors, executive officers, and their related interests. The terms of these loans, including interest rates and collateral, are similar to those prevailing for comparable transactions with other persons. An analysis of the changes in the aggregate committed amount of loans greater than or equal to $60,000 during the years ended December 31, 2014, 2013, and 2012, 2011, and 2010, wasis as follows:
| 2012 | 2011 | 2010 | ||||||||||
| Balance, beginning | $ | 19,155,542 | $ | 20,796,427 | $ | 25,532,422 | ||||||
| Net increase (decrease) due to change in related parties | 2,784,143 | (235,000 | ) | (9,306,435 | ) | |||||||
| Advances | 6,754,970 | 10,674,567 | 13,576,200 | |||||||||
| Repayments | (8,192,597 | ) | (12,080,452 | ) | (9,005,760 | ) | ||||||
| Balance, ending | $ | 20,502,058 | $ | 19,155,542 | $ | 20,796,427 | ||||||
2014 | 2013 | 2012 | ||||||||||
Balance, beginning | $ | 39,192,966 | $ | 20,502,058 | $ | 19,155,542 | ||||||
Net increase due to change in related parties | 1,040,278 | 17,124,702 | 2,784,143 | |||||||||
Advances | 13,284,475 | 6,213,381 | 6,754,970 | |||||||||
Repayments | (11,048,608 | ) | (4,647,175 | ) | (8,192,597 | ) | ||||||
Balance, ending | $ | 42,469,111 | $ | 39,192,966 | $ | 20,502,058 | ||||||
The Company’s loan portfolio includes a geographic concentration in the Midwest. Additionally, the loan portfolio includesincluded a concentration of loans in certain industries as of December 31, 20122014 and 20112013 as follows:
2014 | 2013 | |||||||||||||||
Industry Name | Balance | Percentage of Total Loans/Leases | Balance | Percentage of Total Loans/Leases | ||||||||||||
Lessors of Non-Residential Buildings | $ | 256,436,213 | 16 | % | $ | 237,049,149 | 16 | % | ||||||||
Lessors of Residential Buildings | 74,667,674 | 5 | % | 69,087,354 | 5 | % | ||||||||||
Bank Holding Companies | 60,910,570 | 4 | % | 56,716,875 | 4 | % | ||||||||||
Concentrations within the leasing portfolio are monitored by equipment type – none of which represent a concentration within the total loans/leases portfolio. Within the leasing portfolio, diversification is spread among construction, manufacturing and the service industries.
| 2012 | 2011 | |||||||||||||||
| Industry Name | Balance | Percentage of Total Loans/Leases | Balance | Percentage of Total Loans/Leases | ||||||||||||
| Lessors of Non-Residential Buildings | $ | 178,060,120 | 14 | % | $ | 179,510,937 | 15 | % | ||||||||
| Lessors of Residential Buildings | 61,459,574 | 5 | % | 50,029,069 | 4 | % | ||||||||||
| Bank Holding Companies | 47,662,055 | 4 | % | 38,046,779 | 3 | % | ||||||||||
QCR Holdings, Inc. and Subsidiaries
Notes to Consolidated Financial Statements
Note 4.5. Premises and Equipment
The following summarizes the components of premises and equipment as of December 31, 20122014 and 2011:
| 2012 | 2011 | |||||||
| Land | $ | 5,583,180 | $ | 5,525,022 | ||||
| Buildings (useful lives 15 to 50 years) | 28,368,503 | 28,124,868 | ||||||
| Furniture and equipment (useful lives 3 to 10 years) | 20,069,281 | 18,882,807 | ||||||
| 54,020,964 | 52,532,697 | |||||||
| Less accumulated depreciation | 22,758,574 | 20,791,946 | ||||||
| $ | 31,262,390 | $ | 31,740,751 | |||||
2014 | 2013 | |||||||
Land | $ | 7,100,393 | $ | 7,287,656 | ||||
Buildings (useful lives 15 to 50 years) | 31,602,931 | 31,290,618 | ||||||
Furniture and equipment (useful lives 3 to 10 years) | 23,142,643 | 21,882,303 | ||||||
| 61,845,967 | 60,460,577 | |||||||
Less accumulated depreciation | 25,824,839 | 23,705,213 | ||||||
| $ | 36,021,128 | $ | 36,755,364 | |||||
Certain facilities are leased under operating leases. Rental expense was $372,631, $290,101,$484,868, $795,816, and $464,447,$372,631 for the years ended December 31, 2014, 2013, and 2012, 2011, and 2010, respectively.
Future minimum rental commitments under noncancelable leases are as follows as of December 31, 2012:
| Year ending December 31: | ||||
| 2013 | $ | 373,079 | ||
| 2014 | 374,846 | |||
| 2015 | 216,844 | |||
| 2016 | 222,897 | |||
| 2017 | 224,772 | |||
| Thereafter | 339,102 | |||
| $ | 1,751,540 | |||
Year ending December 31: | ||||
2015 | $ | 233,512 | ||
2016 | 239,565 | |||
2017 | 241,440 | |||
2018 | 194,340 | |||
2019 | 162,819 | |||
Thereafter | - | |||
| $ | 1,071,676 |
Note 6. Derivatives and Hedging Activities
During the second quarter of 2014, the Company executed and designated two interest rate cap derivatives (“caps”) as cash flow hedges of short-term fixed rate FHLB advances. The short-term FHLB advance rates fluctuate with rate movements; therefore the Company determined it was necessary to hedge against this increase in interest expense in a rising rate environment. The caps purchased will essentially set a ceiling on the rate paid on the FHLB advances, minimizing the risk associated with rate increases.
Below is a summary of the interest rate cap derivatives held by the Company as of December 31, 2014. An initial premium of $2.1 million was paid upfront for the two caps. The fair value of these instruments will fluctuate with market value changes, as well as amortization of the initial premium to interest expense.
Effective Date | Maturity Date | Balance Sheet Location | Notional Amount | Accounting Treatment | Fair Value | ||||||
June 5, 2014 | June 5, 2019 | Other Assets | $ | 15,000,000 | Cash Flow Hedging | $ | 608,189 | ||||
June 5, 2014 | June 5, 2021 | Other Assets | 15,000,000 | Cash Flow Hedging | 879,197 | ||||||
| $ | 30,000,000 | $ | 1,487,386 | ||||||||
QCR Holdings, Inc. and Subsidiaries
Notes to Consolidated Financial Statements
Note 5.6. Derivatives and Hedging Activities (continued)
Changes in the fair values of derivative financial instruments accounted for as cash flow hedges to the extent they are effective hedges, are recorded as a component of accumulated other comprehensive income. The following is a summary of how accumulated other comprehensive income was impacted during the reporting periods:
Twelve Months Ended December, 2014 | ||||
Unrealized loss at beginning of period, net of tax | $ | - | ||
Amount reclassified from accumulated other comprehensive income to noninterest income related to hedge ineffectiveness | (30,212 | ) | ||
Amount reclassified from accumulated other comprehensive income to interest expense related to caplet amortization | 65 | |||
Amount of loss recognized in other comprehensive income, net of tax | (369,220 | ) | ||
Unrealized loss at end of period, net of tax | $ | (399,367 | ) | |
Changes in the fair value related to the ineffective portion of cash flow hedges, are reported in noninterest income during the period of the change. As shown in the table above, $30,212 of the change in fair value year-to-date, was due to ineffectiveness.
Note 7. Deposits
The aggregate amount of certificates of deposit, each with a minimum denomination of $100,000,$250,000, was $249,664,219$230,925,385 and $244,564,702$222,017,080 as of December 31, 20122014 and 2011,2013, respectively.
As of December 31, 2012,2014, the scheduled maturities of certificates of deposit were as follows:
Year ending December 31: | ||||
2015 | $ | 294,615,613 | ||
2016 | 38,993,397 | |||
2017 | 18,338,677 | |||
2018 | 6,336,460 | |||
2019 | 11,198,767 | |||
Thereafter | 6,141,000 | |||
| $ | 375,623,914 |
The Company has a $15.0 million Public Unit Deposit Letter of Credit with the FHLB of Des Moines for the purpose of providing additional collateral on public deposits. There was no amount outstanding under this letter of credit as of December 31, 2014.
| Year ending December 31: | ||||
| 2013 | $ | 225,152,331 | ||
| 2014 | 51,775,136 | |||
| 2015 | 39,141,526 | |||
| 2016 | 14,601,275 | |||
| 2017 | 3,871,506 | |||
| $ | 334,541,774 | |||
QCR Holdings, Inc. and Subsidiaries
Notes to Consolidated Financial Statements
Note 6.8. Short-Term Borrowings
Short-term borrowings as of December 31, 20122014 and 20112013 are summarized as follows:
| 2012 | 2011 | |||||||
| Overnight repurchase agreements with customers | $ | 104,942,961 | $ | 110,236,450 | ||||
| Federal funds purchased | 66,140,000 | 103,300,000 | ||||||
| $ | 171,082,961 | $ | 213,536,450 | |||||
2014 | 2013 | |||||||
Overnight repurchase agreements with customers | $ | 137,251,670 | $ | 98,822,967 | ||||
Federal funds purchased | 131,100,000 | 50,470,000 | ||||||
| $ | 268,351,670 | $ | 149,292,967 | |||||
Information concerning overnight repurchase agreements with customers is summarized as follows as of December 31, 20122014 and 2011:
| 2012 | 2011 | |||||||
| Average daily balance during the period | $ | 111,782,307 | $ | 110,468,792 | ||||
| Average daily interest rate during the period | 0.13 | % | 0.23 | % | ||||
| Maximum month-end balance during the period | $ | 141,890,506 | $ | 117,901,743 | ||||
| Weighted average rate as of end of period | 0.11 | % | 0.23 | % | ||||
| Securities underlying the agreements as of end of period: | ||||||||
| Carrying value | $ | 160,950,808 | $ | 201,053,829 | ||||
| Fair value | 160,950,808 | 201,053,829 | ||||||
2014 | 2013 | |||||||
Average daily balance during the period | $ | 128,818,152 | $ | 123,543,416 | ||||
Average daily interest rate during the period | 0.12 | % | 0.12 | % | ||||
Maximum month-end balance during the period | $ | 147,623,624 | $ | 146,075,177 | ||||
Weighted average rate as of end of period | 0.13 | % | 0.13 | % | ||||
Securities underlying the agreements as of end of period: | ||||||||
Carrying value | $ | 165,360,426 | $ | 143,262,002 | ||||
Fair value | 165,360,426 | 143,262,002 | ||||||
The securities underlying the agreements as of December 31, 20122014 and 20112013 were under the Company's control in safekeeping at third-party financial institutions.
Information concerning federal funds purchased is summarized as follows as of December 31, 20122014 and 2011:
| 2012 | 2011 | |||||||
| Average daily balance during the period | $ | 52,379,823 | $ | 33,702,904 | ||||
| Average daily interest rate during the period | 0.27 | % | 0.27 | % | ||||
| Maximum month-end balance during the period | $ | 80,150,000 | $ | 103,300,000 | ||||
| Weighted average rate as of end of period | 0.26 | % | 0.22 | % | ||||
2014 | 2013 | |||||||
Average daily balance during the period | $ | 33,876,815 | $ | 41,156,729 | ||||
Average daily interest rate during the period | 0.40 | % | 0.40 | % | ||||
Maximum month-end balance during the period | $ | 131,100,000 | $ | 95,380,000 | ||||
Weighted average rate as of end of period | 0.23 | % | 0.28 | % | ||||
Note 7.9. Federal Home Loan Bank Advances
The subsidiary banks are members of the FHLB of Des Moines or Chicago. As of December 31, 20122014 and 2011,2013, the subsidiary banks held $11,986,400$11,279,000 and $11,516,800,$12,343,500, respectively, of FHLB stock, which is included in restricted investment securities on the consolidated balance sheets.
During the firstsecond quarter of 2011, the Company’s largest subsidiary bank, QCBT, prepaid $15,000,000 of FHLB advances with a weighted average interest rate of 4.87% and a weighted average maturity of May 2012. The fees for prepayment totaled $832,099 and are included in noninterest expenses in the Statement of Income. In addition, QCBT2013, CRBT modified $20,350,000$20,000,000 of fixed rate FHLB advances with a weighted average interest rate of 4.33%4.82% and a weighted average maturity of October 20132016 into new fixed rate FHLB advances with a weighted average interest rate of 3.35%4.12% and a weighted average maturity of February 2014.
There were no FHLB advance prepayments or modifications or prepayments during 2012.
QCR Holdings, Inc. and Subsidiaries
Notes to Consolidated Financial Statements
Note 7.9. Federal Home Loan Bank Advances (Continued)
Maturity and interest rate information on advances from FHLB as of December 31, 20122014 and 20112013 is as follows:
| December 31, 2012 | ||||||||||||||||
| Amount Due | Weighted Average | Amount Due with | Weighted Average | |||||||||||||
| Maturity: | ||||||||||||||||
| Year ending December 31: | ||||||||||||||||
| 2013 | $ | 24,000,000 | 1.50 | % | $ | - | - | % | ||||||||
| 2014 | 27,850,000 | 3.16 | - | - | ||||||||||||
| 2015 | 16,000,000 | 2.84 | - | - | ||||||||||||
| 2016 | 57,500,000 | 4.19 | 47,500,000 | 4.64 | ||||||||||||
| 2017 | 36,000,000 | 3.89 | 20,000,000 | 4.51 | ||||||||||||
| Thereafter | 41,000,000 | 3.58 | 33,000,000 | 3.64 | ||||||||||||
| Total FHLB advances | $ | 202,350,000 | 3.45 | $ | 100,500,000 | 4.29 | ||||||||||
| December 31, 2011 | ||||||||||||||||
| Amount Due | Weighted Average | Amount Due with | Weighted Average | |||||||||||||
| Maturity: | ||||||||||||||||
| Year ending December 31: | ||||||||||||||||
| 2012 | $ | 15,400,000 | 3.95 | % | $ | - | - | % | ||||||||
| 2013 | 15,000,000 | 2.35 | - | - | ||||||||||||
| 2014 | 27,850,000 | 3.16 | - | - | ||||||||||||
| 2015 | 16,000,000 | 3.03 | - | - | ||||||||||||
| 2016 | 57,500,000 | 3.91 | 47,500,000 | 4.64 | ||||||||||||
| Thereafter | 73,000,000 | 3.85 | 53,000,000 | 3.97 | ||||||||||||
| Total FHLB advances | $ | 204,750,000 | 3.67 | $ | 100,500,000 | 4.29 | ||||||||||
December 31, 2014 | ||||||||||||||||
Weighted | Weighted | |||||||||||||||
Average | Amount Due | Average | ||||||||||||||
Interest Rate | with | Interest Rate | ||||||||||||||
Amount Due | at Year-End | Putable Option * | at Year-End | |||||||||||||
Maturity: | ||||||||||||||||
Year ending December 31: | ||||||||||||||||
2015 | $ | 63,000,000 | 0.87 | % | $ | - | - | % | ||||||||
2016 | 44,500,000 | 3.81 | 32,500,000 | 4.56 | ||||||||||||
2017 | 33,000,000 | 3.59 | 15,000,000 | 4.42 | ||||||||||||
2018 | 43,000,000 | 3.49 | 5,000,000 | 2.84 | ||||||||||||
2019 | 20,000,000 | 4.12 | - | - | ||||||||||||
Total FHLB advances | $ | 203,500,000 | 2.83 | % | $ | 52,500,000 | 4.36 | % | ||||||||
December 31, 2013 | ||||||||||||||||
Weighted | Weighted | |||||||||||||||
Average | Amount Due | Average | ||||||||||||||
Interest Rate | with | Interest Rate | ||||||||||||||
Amount Due | at Year-End | Putable Option * | at Year-End | |||||||||||||
Maturity: | ||||||||||||||||
Year ending December 31: | ||||||||||||||||
2014 | $ | 75,850,000 | 1.32 | % | $ | - | - | % | ||||||||
2015 | 21,000,000 | 2.26 | - | - | ||||||||||||
2016 | 42,500,000 | 3.96 | 32,500,000 | 4.56 | ||||||||||||
2017 | 31,000,000 | 3.75 | 15,000,000 | 4.42 | ||||||||||||
2018 | 41,000,000 | 3.58 | 5,000,000 | 2.84 | ||||||||||||
Thereafter | 20,000,000 | 4.12 | - | - | ||||||||||||
Total FHLB advances | $ | 231,350,000 | 2.86 | % | $ | 52,500,000 | 4.36 | % | ||||||||
*Of the advances outstanding, a large portion have putable options which allow the FHLB, at its discretion, to terminate the advances and require the subsidiary banks to repay at predetermined dates prior to the stated maturity date of the advances.
Advances are collateralized by securities with a carrying value of $18,959,669$0 and $14,095,430$87,061,601 as of December 31, 20122014 and 2011,2013, respectively, and by loans pledged of $423,179,584$499,084,047 and $413,662,493,$543,076,034, respectively, in aggregate. On pledged loans, the FHLB applies varying collateral maintenance levels from 125% to 333% based on the loan type.
As of December 31, 2014 and included with the 2015 maturity grouping above are $37.0 million of short-term advances from the FHLB. These advances have maturities ranging from 2 weeks to 1 month. Short-term and overnight advances totaled $42.0 million as of December 31, 2013 and had maturities ranging from 1 day to 6 months.
QCR Holdings, Inc. and Subsidiaries
Notes to Consolidated Financial Statements
Note 8.10. Other Borrowings and Unused Lines of Credit
Other borrowings as of December 31, 20122014 and 20112013 are summarized as follows:
| 2012 | 2011 | |||||||
| Wholesale structured repurchase agreements | $ | 130,000,000 | $ | 130,000,000 | ||||
| 364-day revolving note | 5,600,000 | 3,600,000 | ||||||
| Series A subordinated notes | 2,639,762 | 2,631,663 | ||||||
| $ | 138,239,762 | $ | 136,231,663 | |||||
2014 | 2013 | |||||||
Wholesale structured repurchase agreements | $ | 130,000,000 | $ | 130,000,000 | ||||
Term note | 17,625,000 | 9,800,000 | ||||||
Series A subordinated notes | 2,657,492 | 2,648,362 | ||||||
| $ | 150,282,492 | $ | 142,448,362 | |||||
Maturity and interest rate information concerning wholesale structured repurchase agreements is summarized as follows:
| December 31, 2012 | December 31, 2011 | |||||||||||||||
| Amount Due | Weighted Average | Amount Due | Weighted Average | |||||||||||||
| Maturity: | ||||||||||||||||
| Year ending December 31: | ||||||||||||||||
| 2015 | $ | 35,000,000 | 3.00 | % | $ | 45,000,000 | 3.11 | % | ||||||||
| 2016 | 20,000,000 | 3.46 | 35,000,000 | 3.67 | ||||||||||||
| 2017 | 10,000,000 | 3.00 | 10,000,000 | 3.00 | ||||||||||||
| Thereafter | 65,000,000 | 3.71 | 40,000,000 | 4.03 | ||||||||||||
| Total Wholesale Structured Repurchase Agreements | $ | 130,000,000 | 3.43 | $ | 130,000,000 | 3.54 | ||||||||||
December 31, 2014 | December 31, 2013 | |||||||||||||||
Weighted | Weighted | |||||||||||||||
Average | Average | |||||||||||||||
Interest Rate | Interest Rate | |||||||||||||||
Amount Due | at Year-End | Amount Due | at Year-End | |||||||||||||
Maturity: | ||||||||||||||||
Year ending December 31: | ||||||||||||||||
2015 | $ | 5,000,000 | 2.77 | % | $ | 5,000,000 | 2.77 | % | ||||||||
2016 | - | - | - | - | ||||||||||||
2017 | 10,000,000 | 3.00 | 10,000,000 | 3.00 | ||||||||||||
2018 | 10,000,000 | 3.97 | 10,000,000 | 3.97 | ||||||||||||
2019 | 60,000,000 | 3.57 | 60,000,000 | 3.57 | ||||||||||||
Thereafter | 45,000,000 | 2.66 | 45,000,000 | 2.66 | ||||||||||||
Total Wholesale Structured Repurchase Agreements | $ | 130,000,000 | 3.21 | % | $ | 130,000,000 | 3.21 | % | ||||||||
Each wholesale structured repurchase agreement has a one-time put option, at the discretion of the counterparty, to terminate the agreement and require the subsidiary bank to repay at predetermined dates prior to the stated maturity date of the agreement.
As of December 31, 2013 and 2012, and 2011,interest rate caps were embedded within $50,000,000 and $65,000,000, respectively,certain wholesale structured repurchase agreements. All of the caps expired in 2014.
QCR Holdings, Inc. and Subsidiaries
Notes to Consolidated Financial Statements
Note 10. Other Borrowings and Unused Lines of Credit (continued)
During 2013, the Company modified $50,000,000 of fixed rate wholesale structured repurchase agreements werewith a weighted average interest rate cap optionsof 3.21% and a weighted average maturity of February 2016 into new fixed rate wholesale structured repurchase agreements with varying terms. Of the $50,000,000 as of December 31, 2012, $20,000,000 matures in 2016 with the caps expiring in 2013 in conjunction with the one-time put option, and $30,000,000 matures in 2019 with the caps expiring in 2014 in conjunction with the one-time put option. Of the $65,000,000 at December 31, 2011, $35,000,000 matures in 2016 with the caps expiring in 2013 in conjunction with the one-time put option, and $30,000,000 matures in 2019 with the caps expiring in 2014 in conjunction with the one-time put option. Thea weighted average interest rate cap options are effected when the 3-month LIBOR rate increases to certain levels. If that situation occurs, the rate paid will be decreased by the difference between the 3-month LIBOR rateof 2.65% and the particular cap level. In no case will the rate paid fall below 0.00%.
The wholesale structured repurchase agreements are collateralized by securities with a carrying value of $160,772,093$153,757,514 and $156,909,176$151,592,944 as of December 31, 20122014 and 2011,2013, respectively.
At December 31, 2011,2013, the Company had a single $20,000,000 secured revolving credit3-year term note which matures every 364 days. At December 31, 2011,with principal due quarterly and interest due monthly where the note carried a balance outstanding of $3,600,000. Interest was payable monthlyinterest is calculated at the effective LIBOR rate plus 3.00% per annum (3.17% at December 31, 2013). The note, which originated in conjunction with the CNB acquisition, carried a balance of $9,800,000 at December 31, 2013. In June 2014, the Company restructured its existing term debt and borrowed an additional $10.0 million to help assist with the final redemption of the Senior Non-Cumulative Perpetual Preferred Stock, Series F (“Series F Preferred Stock”). The term debt is secured by common stock of the Company’s subsidiary banks and has a 4-year term with principal and interest due quarterly. Interest is calculated at the effective LIBOR rate plus 3.00% per annum (3.23% at December 31, 2014) and the balance totaled $17,625,000 at December 31, 2014. Maturity information for term debt is summarized as defined by the credit agreement. Asfollows:
2014 | 2013 | |||||||
2014 | $ | - | $ | 3,600,000 | ||||
2015 | 4,700,000 | 3,600,000 | ||||||
2016 | 4,700,000 | 3,600,000 | ||||||
2017 | 4,700,000 | - | ||||||
2018 | 3,525,000 | - | ||||||
| $ | 17,625,000 | $ | 10,800,000 | |||||
Additionally, as of December 31, 2011,2014 and 2013, the Company maintained a $10.0 million revolving line of credit notewhere the interest rate on the note was 3.27%. The note renewed on March 30, 2012. At December 31, 2012, the note carried a balance outstanding of $5,600,000. Interest is payable monthlycalculated at the effective LIBOR rate plus 2.50% per annum, as a result of achieving certain asset quality measures as defined in the credit agreement. As ofannum. At December 31, 2012,2014 and 2013, the interest rateCompany had not borrowed on this revolving credit note and had the note was 2.71%.
The current revolving note agreement contains certain covenants that place restrictions on additional debt and stipulate minimum capital and various operating ratios.
QCR Holdings, Inc. and Subsidiaries
Notes to Consolidated Financial Statements
Note 10. Other Borrowings and Unused Lines of 2,700 units (each, a “Unit”) to accredited investors for an aggregate purchase price of $2,700,000, or $1,000 per Unit. Each Unit consists of a 6.00%Credit (continued)
The Series A Subordinated Note, due September 1, 2018 (collectively, the “Subordinated Notes”), $1,000 principal amount, and a detachable warrant (collectively, the “Warrants”) to acquire 20 shares of the Company’s common stock, par value $1.00 per share (the “Common Stock”), at a per share exercise price equal to $10.00 per share, subject to normal adjustments, as set forth in the Warrants.
Unused lines of credit of the subsidiary banks as of December 31, 20122014 and 20112013 are summarized as follows:
| 2012 | 2011 | |||||||
| Secured | $ | 52,703,791 | $ | 72,929,607 | ||||
| Unsecured | 259,000,000 | 152,500,000 | ||||||
| $ | 311,703,791 | $ | 225,429,607 | |||||
2014 | 2013 | |||||||
Secured | $ | 17,050,159 | $ | 26,791,107 | ||||
Unsecured | 329,500,000 | 324,500,000 | ||||||
| $ | 346,550,159 | $ | 351,291,107 | |||||
The Company pledges the eligible portion of its municipal securities portfolio and select commercial and industrial and commercial real estate loans to the Federal Reserve Bank of Chicago for borrowing at the Discount Window
QCR Holdings, Inc. and Subsidiaries
Notes to Consolidated Financial Statements
Note 9.11. Junior Subordinated Debentures
As part of the acquisition of Community National, the Company assumed two junior subordinated debentures detailed as follows:
The first debenture assumed was issued in September 2004 in the amount of $3,093,000, and provides that interest is payable quarterly with the interest rate adjusted to equal three-month LIBOR plus 2.17%. Principal is due September 20, 2034, but is callable at any time. The second debenture assumed was issued in March 2007 in the amount of $3,609,000, and provides that interest is payable quarterly with the interest rate adjusted to equal three-month LIBOR plus 1.75%. Principal is due March 15, 2037, but is callable at any time.
Junior subordinated debentures are summarized as of December 31, 20122014 and 20112013 as follows:
| 2012 | 2011 | |||||||
| Note Payable to Trust II | $ | 12,372,000 | $ | 12,372,000 | ||||
| Note Payable to Trust III | 8,248,000 | 8,248,000 | ||||||
| Note Payable to Trust IV | 5,155,000 | 5,155,000 | ||||||
| Note Payable to Trust V | 10,310,000 | 10,310,000 | ||||||
| $ | 36,085,000 | $ | 36,085,000 | |||||
2014 | 2013 | |||||||
Note Payable to QCR Holdings Capital Trust II | $ | 12,372,000 | $ | 12,372,000 | ||||
Note Payable to QCR Holdings Capital Trust III | 8,248,000 | 8,248,000 | ||||||
Note Payable to QCR Holdings Capital Trust IV | 5,155,000 | 5,155,000 | ||||||
Note Payable to QCR Holdings Capital Trust V | 10,310,000 | 10,310,000 | ||||||
Note Payable to Community National Trust II | 3,093,000 | 3,093,000 | ||||||
Note Payable to Community National Trust III | 3,609,000 | 3,609,000 | ||||||
Market Value Discount per ASC 805 (see Note 2) | (2,363,265 | ) | (2,497,170 | ) | ||||
| $ | 40,423,735 | $ | 40,289,830 | |||||
A schedule of the Company’s non-consolidated subsidiaries formed for the issuance of trust preferred securities including the amounts outstanding as of December 31, 20122014 and 2011,2013, is as follows:
| Name | Date Issued | Amount Issued | Interest Rate | Interest Rate as of 12/31/12 | Interest Rate as of 12/31/11 | |||||||||
| QCR Holdings Statutory Trust II | February 2004 | $ | 12,372,000 | 2.85% over 3-month LIBOR * | 3.21 | % | 3.22 | % | ||||||
| QCR Holdings Statutory Trust III | February 2004 | 8,248,000 | 2.85% over 3-month LIBOR | 3.21 | % | 3.22 | % | |||||||
| QCR Holdings Statutory Trust IV | May 2005 | 5,155,000 | 1.80% over 3-month LIBOR | 2.14 | % | 2.20 | % | |||||||
| QCR Holdings Statutory Trust V | February 2006 | 10,310,000 | 1.55% over 3-month LIBOR ** | 1.89 | % | 1.95 | % | |||||||
| $ | 36,085,000 | Weighted Average Rate | 2.68 | % | 2.71 | % | ||||||||
Name | Date Issued | Amount Issued | Interest Rate | Interest Rate as of 12/31/2014 | Interest Rate as of 12/31/2013 | |||||||||
QCR Holdings Statutory Trust II | February 2004 | $ | 12,372,000 | 2.85% over 3-month LIBOR | 3.08 | % | 3.10 | % | ||||||
QCR Holdings Statutory Trust III | February 2004 | 8,248,000 | 2.85% over 3-month LIBOR | 3.08 | % | 3.10 | % | |||||||
QCR Holdings Statutory Trust IV | May 2005 | 5,155,000 | 1.80% over 3-month LIBOR | 2.03 | % | 2.04 | % | |||||||
QCR Holdings Statutory Trust V | February 2006 | 10,310,000 | 1.55% over 3-month LIBOR | 1.78 | % | 1.79 | % | |||||||
Community National Statutory Trust II | September 2004 | 3,093,000 | 2.17% over 3-month LIBOR | 2.42 | % | 2.42 | % | |||||||
Community National Statutory Trust III | March 2007 | 3,609,000 | 1.75% over 3-month LIBOR | 1.99 | % | 1.99 | % | |||||||
| $ | 42,787,000 | Weighted Average Rate | 2.50 | % | 2.51 | % | ||||||||
Securities issued by Trust II, Trust III, Trust IV, and Trust Vall of the trusts listed above mature 30 years from the date of issuance, but all are currently callable at par at anytime.
QCR Holdings, Inc. and Subsidiaries
Notes to Consolidated Financial Statements
Note 10.12. Preferred Stock
As of December 31, 2012 and 2011 as follows:
| 2012 | 2011 | |||||||
| Series E Non-Cumulative Convertible Perpetual Preferred Stock | 25,000 | 25,000 | ||||||
| Series F Non-Cumulative Perpetual Preferred Stock | 29,867 | 40,090 | ||||||
| $ | 54,867 | $ | 65,090 | |||||
Series E Non-Cumulative Convertible Perpetual Preferred StockStock (“Series E Preferred Stock”). See below for detailed discussion of the issuance of Series E Preferred Stock.
Pursuant to the terms of the Series E Preferred Stock, because the Company’s common stock price exceeded $17.22 for at least 20 trading days in a period of 30 consecutive trading days, the Company’s Board of Directors approved the conversion and the preferred shareholders were notified by mail on November 21, 2013. The conversion was effective December 23, 2013. Each share of the Series E Preferred Stock was converted into the number of shares of common stock that resulted from dividing $1,000 (the issuance price per share of the Series E Preferred Stock) by $12.15 (the conversion price per share). No fractional shares were issued as a result of the conversion of the Series E Preferred Stock. Instead, holders received cash totaling $1,915 which equaled the amount of fractional shares multiplied by $17.24 (the closing price of the Company’s common stock on December 20, 2013). As a result of the conversion, the Company issued 2,057,502 shares of common stock.
Senior Non-Cumulative Perpetual PreferredStock, Series F Non-Cumulative Perpetual Preferred Stock:On September 15, 2011, the Company issued 40,090 shares of Series F Preferred Stock to the Treasury for an aggregate purchase price of $40,090,000. The sale of Series F Preferred Stock iswas the result of an investment by the Treasury from the Small Business Lending Fund, (“SBLF”), a $30 billion fund established under the Small Business Jobs Act of 2010 that encourages lending to small businesses by providing capital to qualified community banks with assets of less than $10 billion. As a requirement of the SBLF, simultaneously, the Company redeemed the 38,327 shares of Series D Preferred Stock, at an aggregate price of $38,237,000, plus accrued and unpaid dividends to the date of redemption of $159,321.
On June 29, 2012, the Company redeemed 10,223 shares of Series F Preferred Stock from the Treasury for an aggregate redemption amount of $10,223,000 plus unpaid dividends to the date of redemption of $124,948. The remainingOn March 31, 2014, the Company redeemed 15,000 shares of Series F Preferred Stock may be redeemed at any time atfor an aggregate amount of $15,000,000 plus unpaid dividends to the optiondate of redemption of $337,500. On June 30, 2014, the Company subjectredeemed the remaining 14,867 shares of Series F Preferred Stock for an aggregate amount of $14,823,922, plus unpaid dividends to the approvaldate of redemption of $373,869. With this final redemption on June 30, 2014, the Company’s primary federal banking regulator. All redemptions must be in amounts equal to at least the lesser of 25% of the number of originally issued shares, or 100% of the then-outstanding shares.
QCR Holdings, Inc. and Subsidiaries
Notes to Consolidated Financial Statements
Note 11.13. Federal and State Income Taxes
Federal and state income tax expense was comprised of the following components for the years ended December 31, 2012, 2011,2014, 2013, and 2010:
| 2012 | 2011 | 2010 | ||||||||||
| Current | $ | 1,850,234 | $ | 195,135 | $ | 1,193,245 | ||||||
| Deferred | 2,684,367 | 3,673,064 | 1,256,004 | |||||||||
| $ | 4,534,601 | $ | 3,868,199 | $ | 2,449,249 | |||||||
2014 | 2013 | 2012 | ||||||||||
Current | $ | 4,203,979 | $ | 5,639,933 | $ | 2,232,183 | ||||||
Deferred | (1,165,009 | ) | (1,021,991 | ) | 2,302,418 | |||||||
| $ | 3,038,970 | $ | 4,617,942 | $ | 4,534,601 | |||||||
A reconciliation of the expected federal income tax expense to the income tax expense included in the consolidated statements of income was as follows for the years ended December 31, 2012, 2011,2014, 2013, and 2010:
| Years Ended December 31, | ||||||||||||||||||||||||
| 2012 | 2011 | 2010 | ||||||||||||||||||||||
| Amount | % of Pretax | Amount | % of Pretax | Amount | % of Pretax | |||||||||||||||||||
| Computed "expected" tax expense | $ | 6,174,295 | 35.0 | % | $ | 4,899,324 | 35.0 | % | $ | 3,239,941 | 35.0 | % | ||||||||||||
| Effect of graduated tax rates interest | (20,775 | ) | (0.1 | ) | (139,981 | ) | (1.0 | ) | (92,570 | ) | (1.0 | ) | ||||||||||||
| Tax exempt income, net | (1,243,660 | ) | (7.0 | ) | (692,742 | ) | (4.9 | ) | (556,682 | ) | (6.0 | ) | ||||||||||||
| Bank-owned life insurance | (544,292 | ) | (3.1 | ) | (490,491 | ) | (3.5 | ) | (451,457 | ) | (4.9 | ) | ||||||||||||
State income taxes, net of federal benefit, current year | 730,865 | 4.1 | 533,250 | 3.8 | 330,917 | 3.6 | ||||||||||||||||||
| Change in unrecognized tax benefits | (149,183 | ) | (0.8 | ) | 2,074 | - | 71,671 | 0.8 | ||||||||||||||||
| Noncontrolling interests | (166,081 | ) | (0.9 | ) | (148,995 | ) | (1.1 | ) | (75,156 | ) | (0.8 | ) | ||||||||||||
| Other | (246,568 | ) | (1.5 | ) | (94,240 | ) | (0.7 | ) | (17,415 | ) | (0.2 | ) | ||||||||||||
| $ | 4,534,601 | 25.7 | % | $ | 3,868,199 | 27.6 | % | $ | 2,449,249 | 26.5 | % | |||||||||||||
Years Ended December 31, | ||||||||||||||||||||||||
2014 | 2013 | 2012 | ||||||||||||||||||||||
% of | % of | % of | ||||||||||||||||||||||
Pretax | Pretax | Pretax | ||||||||||||||||||||||
Amount | Income | Amount | Income | Amount | Income | |||||||||||||||||||
Computed "expected" tax expense | $ | 6,297,027 | 35.0 | % | $ | 6,844,665 | 35.0 | % | $ | 6,174,295 | 35.0 | % | ||||||||||||
Effect of graduated tax rates | (79,529 | ) | (0.4 | ) | (123,868 | ) | (0.6 | ) | (20,775 | ) | (0.1 | ) | ||||||||||||
Tax exempt income, net | (2,646,275 | ) | (14.7 | ) | (1,790,049 | ) | (9.2 | ) | (1,243,660 | ) | (7.0 | ) | ||||||||||||
Bank-owned life insurance | (585,312 | ) | (3.3 | ) | (624,847 | ) | (3.2 | ) | (544,292 | ) | (3.1 | ) | ||||||||||||
State income taxes, net of federal benefit, current year | 497,068 | 2.8 | 758,695 | 3.9 | 730,865 | 4.1 | ||||||||||||||||||
Change in unrecognized tax benefits | (6,395 | ) | - | 37,180 | 0.2 | (149,183 | ) | (0.8 | ) | |||||||||||||||
Acquisition costs | - | - | 248,952 | 1.3 | - | - | ||||||||||||||||||
Noncontrolling interests | - | - | - | - | (166,081 | ) | (0.9 | ) | ||||||||||||||||
Other | (437,614 | ) | (2.4 | ) | (732,786 | ) | (3.8 | ) | (246,568 | ) | (1.5 | ) | ||||||||||||
| $ | 3,038,970 | 17.0 | % | $ | 4,617,942 | 23.6 | % | $ | 4,534,601 | 25.7 | % | |||||||||||||
Changes in the unrecognized tax benefits included in other liabilities are as follows for the years ended December 31, 20122014 and 2011:
| 2012 | 2011 | |||||||
| Balance, beginning | $ | 1,148,549 | $ | 1,034,025 | ||||
| Impact of tax positions taken during current year | 202,341 | 245,441 | ||||||
| Gross increase related to tax positions of prior years | 21,781 | 89,310 | ||||||
| Reduction as a result of a lapse of the applicable statute of limitations | (378,593 | ) | (220,227 | ) | ||||
| Balance, ending | $ | 994,078 | $ | 1,148,549 | ||||
2014 | 2013 | |||||||
Balance, beginning | $ | 1,058,019 | $ | 994,078 | ||||
Impact of tax positions taken during current year | 234,475 | 288,016 | ||||||
Gross increase related to tax positions of prior years | 16,915 | 16,939 | ||||||
Reduction as a result of a lapse of the applicable statute of limitations | (307,118 | ) | (241,014 | ) | ||||
Balance, ending | $ | 1,002,291 | $ | 1,058,019 | ||||
Included in the unrecognized tax benefits liability at December 31, 20122014 are potential benefits of approximately $692,000$742,000 that, if recognized, would affect the effective tax rate.
The liability for unrecognized tax benefits includes accrued interest for tax positions, which either do not meet the more-likely-than-not recognition threshold or where the tax benefit is measured at an amount less than the tax benefit claimed or expected to be claimed on an income tax return. At December 31, 20122014 and 2011,2013, accrued interest on uncertain tax positions was approximately $302,000$260,000 and $343,500,$316,000, respectively. Estimated interest related to the underpayment of income taxes is classified as a component of “income taxes” in the statements of income.
QCR Holdings, Inc. and Subsidiaries
Notes to Consolidated Financial Statements
Note 13. Federal and State Income Taxes (continued)
The Company’s federal income tax returns are open and subject to examination from the 20092011 tax return year and forward.later. Various state franchise and income tax returns are generally open from the 20082010 and later tax return years based on individual state statute of limitations.
The net deferred tax assets (liabilities) included with other assets on the consolidated balance sheets consisted of the following as of December 31, 20122014 and 2011:
| 2012 | 2011 | |||||||
| Deferred tax assets: | ||||||||
| Alternative minimum tax credits | $ | 3,075,372 | $ | 1,955,270 | ||||
| New markets tax credits | 1,000,000 | 500,000 | ||||||
| Compensation | 5,756,439 | 4,934,312 | ||||||
| Loan/lease losses | 5,927,442 | 5,130,551 | ||||||
| Net operating loss carryforwards, federal and state | 876,769 | 6,342,415 | ||||||
| Deferred loan origination fees, net | 285,794 | 240,063 | ||||||
| Other | 379,523 | 285,590 | ||||||
| 17,301,339 | 19,388,201 | |||||||
| Deferred tax liabilities: | ||||||||
| Net unrealized gains on securities available for sale | 2,905,784 | 2,940,792 | ||||||
| Premises and equipment | 1,532,602 | 1,580,272 | ||||||
| Equipment financing leases | 20,516,189 | 19,897,412 | ||||||
| Investment accretion | 43,740 | 43,648 | ||||||
| Other | 444,302 | 417,996 | ||||||
| 25,442,617 | 24,880,120 | |||||||
| Net deferred tax asset (liability) | $ | (8,141,278 | ) | $ | (5,491,919 | ) | ||
2014 2013 Deferred tax assets: Alternative minimum tax credits New markets tax credits Net unrealized losses on securities available for sale and derivative instruments Compensation Loan/lease losses Net operating loss carryforwards, federal and state Deferred loan origination fees, net Other Deferred tax liabilities: Premises and equipment Equipment financing leases Acquisition fair value adjustments Investment accretion Other Net deferred tax asset (liability) $ 5,018,008 $ 3,936,226 2,100,000 1,500,000 1,186,544 8,468,118 8,266,896 7,056,579 7,393,437 6,890,532 2,415,284 2,914,140 13,536 143,949 482,908 410,640 26,876,613 31,320,184 1,216,080 1,575,582 24,701,676 23,191,514 1,774,157 1,319,981 45,580 45,463 619,121 551,080 28,356,614 26,683,620 $ (1,480,001 ) $ 4,636,564
At December 31, 2014, the Company had $6,424,739 of federal tax net operating loss carryforwards which are set to expire in varying amounts between 2029 and 2033. At December 31, 2014, the Company had $4,759,745 of state tax net operating loss carryforwards which are set to expire in varying amounts between 2017 and 2029. All of the federal tax net operating loss carryforwards and the majority of the state tax net operating loss carryforwards were acquired from Community National and CNB.
The change in deferred income taxes was reflected in the consolidated financial statements as follows for the years ended ended December 31, 2012, 2011,2014, 2013, and 2010:
| 2012 | 2011 | 2010 | ||||||||||
| Provision for income taxes | $ | 2,684,367 | $ | 3,673,064 | $ | 1,256,004 | ||||||
Statement of stockholders' equity- accumulated other comprehensive income,unrealized gains (losses) on securities available for sale, net | (35,008 | ) | 2,510,006 | 348,376 | ||||||||
| $ | 2,649,359 | $ | 6,183,070 | $ | 1,604,380 | |||||||
2014 | 2013 | 2012 | ||||||||||
Provision for income taxes | $ | (1,165,009 | ) | $ | (1,021,991 | ) | $ | 2,302,418 | ||||
Statement of stockholders' equity- accumulated other comprehensive income (loss), unrealized gains (losses) on securities available for sale, net, and unrealized losses on derivative instruments | 7,281,574 | (11,373,902 | ) | (35,008 | ) | |||||||
| $ | 6,116,565 | $ | (12,395,893 | ) | $ | 2,267,410 | ||||||
QCR Holdings, Inc. and Subsidiaries
Notes to Consolidated Financial Statements
Note 12.14. Employee Benefit Plans
The Company has a profit sharing plan which includes a provision designed to qualify under Section 401(k) of the Internal Revenue Code of 1986, as amended, to allow for participant contributions. All employees are eligible to participate in the plan. The Company matches 100% of the first 3% of employee contributions, and 50% of the next 3% of employee contributions, up to a maximum amount of 4.5% of an employee's compensation. Additionally, at its discretion, the Company may make additional contributions to the plan which are allocated to the accounts of participants in the plan based on relative compensation. Company contributions for the years ended December 31, 2012, 2011,2014, 2013, and 20102012 were as follows:
| 2012 | 2011 | 2010 | ||||||||||
| Matching contribution | $ | 1,014,418 | $ | 929,869 | $ | 875,138 | ||||||
| Discretionary contribution | 188,700 | 150,000 | 99,400 | |||||||||
| $ | 1,203,118 | $ | 1,079,869 | $ | 974,538 | |||||||
2014 | 2013 | 2012 | ||||||||||
Matching contribution | $ | 1,179,979 | $ | 1,129,726 | $ | 1,014,418 | ||||||
Discretionary contribution | 198,800 | 186,000 | 188,700 | |||||||||
| $ | 1,378,779 | $ | 1,315,726 | $ | 1,203,118 | |||||||
The Company has entered into nonqualified supplemental executive retirement plans (“SERPs”) with certain executive officers. The SERPs allow certain executives to accumulate retirement benefits beyond those provided by the qualified plans. During the years ended December 31, 2012, 2011,2014, 2013, and 2010,2012, the Company expensed $289,437, $190,105,$650,016, $264,672, and $157,261,$289,437, respectively, related to these plans. As part of the acquisition of Community National, the Company assumed the liability related to a SERP for one CNB executive. The assumed SERP liability was $317,418 at acquisition. As of December 31, 20122014 and 2011,2013, the liability related to the SERPs, included in other liabilities, was $2,802,497$3,800,603 and $2,630,060,$3,267,587, respectively. Payments to former executives in the amount of $117,000 were made in both 20122014 and 2011.
The Company has entered into deferred compensation agreements with certain executive officers. Under the provisions of the agreements, the officers may defer compensation and the Company matches the deferral up to certain maximums. The Company’s matching contribution varies by officer and is a maximum of between $10,000$17,500 and $20,000$25,000 annually. Interest on the deferred amounts is earned atThe Wall Street Journal’s prime rate subject to a minimum of 6% and a maximum of 12% with such limits differing by officer. The Company has also entered into deferred compensation agreements with certain management officers. Under the provisions of the agreements the officers may defer compensation and the Company matches the deferral up to certain maximums. The Company’s matching contribution differs by officer and is a maximum between 4% and 10% of officer’s compensation. Interest on the deferred amounts is earned atThe Wall Street Journal’s prime rate plus one percentage point, and has a minimum of 4% and shall not exceed 8%. Upon retirement, the officer will receive the deferral balance in 180 equal monthly installments. As of December 31, 20122014 and 2011,2013, the liability related to the agreements totaled $5,151,630$7,503,692 and $4,202,733,$6,224,368, respectively.
Changes in the deferred compensation agreements, included in other liabilities, are as follows for the years ended December 31, 2012, 20112014, 2013, and 2010:
| 2012 | 2011 | 2010 | ||||||||||
| Balance, beginning | $ | 4,202,733 | $ | 3,469,525 | $ | 2,734,989 | ||||||
| Company expense | 555,407 | 414,478 | 369,950 | |||||||||
| Employee deferrals | 405,788 | 381,616 | 371,374 | |||||||||
| Cash payments made | (12,298 | ) | (62,886 | ) | (6,788 | ) | ||||||
| Balance, ending | $ | 5,151,630 | $ | 4,202,733 | $ | 3,469,525 | ||||||
2014 | 2013 | 2012 | ||||||||||
Balance, beginning | $ | 6,224,368 | $ | 5,151,630 | $ | 4,202,733 | ||||||
Company expense | 661,611 | 557,663 | 555,407 | |||||||||
Employee deferrals | 628,589 | 525,469 | 405,788 | |||||||||
Cash payments made | (10,876 | ) | (10,394 | ) | (12,298 | ) | ||||||
Balance, ending | $ | 7,503,692 | $ | 6,224,368 | $ | 5,151,630 | ||||||
QCR Holdings, Inc. and Subsidiaries
Notes to Consolidated Financial Statements
Note 13.15. Stock-Based Compensation
Stock-based compensation expense was reflected in the consolidated financial statements as follows for the years ended December 31, 2012, 2011,2014, 2013, and 2010.
| 2012 | 2011 | 2010 | ||||||||||
| Stock option and incentive plans | $ | 798,929 | $ | 587,900 | $ | 475,835 | ||||||
| Stock purchase plan | 50,831 | 58,519 | 57,436 | |||||||||
| Stock appreciation rights | - | 49,988 | (45,159 | ) | ||||||||
| $ | 849,760 | $ | 696,407 | $ | 488,112 | |||||||
2014 | 2013 | 2012 | ||||||||||
Stock option and incentive plans | $ | 832,845 | $ | 734,827 | $ | 798,929 | ||||||
Stock purchase plan | 58,774 | 57,452 | 50,831 | |||||||||
| $ | 891,619 | $ | 792,279 | $ | 849,760 | |||||||
Stock option and incentive plans:
The Company’s Board of Directors adopted in January 2008, and the stockholders approved in May 2008, the QCR Holdings, Inc. 2008 Equity Incentive Plan (“2008 Equity Incentive Plan”). Up to 250,000 shares of common stock may be issued to employees and directors of the Company and its subsidiaries pursuant to the exercise of nonqualified stock options and restricted stock granted under the 2008 Equity Incentive Plan. As of December 31, 2012, there were 14,922 remaining options available for grant under this plan. The Company’s Board of Directors adopted in February 2010, and the stockholders approved in May 2010, the QCR Holdings, Inc. 2010 Equity Incentive Plan (“2010 Equity Incentive Plan”). Up to 350,000 shares of common stock may be issued to employees and directors of the Company and its subsidiaries pursuant to the exercise of the nonqualified stock options and restricted stock granted under the 2010 Equity Incentive Plan. AsThe Company’s Board of December 31, 2012, there were 57,872 remainingDirectors adopted in February 2013, and the stockholders approved in May 2013, the QCR Holdings, Inc. 2013 Equity Incentive Plan (“2013 Equity Incentive Plan”). Up to 350,000 shares of common stock may be issued to employees and directors of the Company and its subsidiaries pursuant to the exercise of nonqualified stock options available for grantand restricted stock granted under this plan.the 2013 Equity Incentive Plan. The 2008 Equity Incentive Plan, the 2010 Equity Incentive Plan, and the 20102013 Equity Incentive Plan (collectively, “the stock option plans”) are administered by the Compensation Committee of the Board of Directors (the “Committee”).
The number and exercise price of options granted under the stock option plans isare determined by the Committee at the time the option is granted. In no event can the exercise price be less than the value of the common stock at the date of the grant for incentive stock options. All options have a 10-year life and will vest and become exercisable from 1-to-51-to-7 years after the date of the grant. Only nonqualified stock options have been issued to date.
In the case of nonqualified stock options, the stock option plans provide for the granting of "Tax Benefit Rights" to certain participants at the same time as these participants are awarded nonqualified options. Each Tax Benefit Right entitles a participant to a cash payment, which is expensed by the Company, equal to the excess of the fair market value of a share of common stock on the exercise date over the exercise price of the related option multiplied by the difference between the rate of tax on ordinary income over the rate of tax on capital gains (federal and state).
QCR Holdings, Inc. and Subsidiaries
Notes to Consolidated Financial Statements
Note 13.15. Stock-Based Compensation (Continued)
A summary of the stock option plans as of December 31, 2012, 2011,2014, 2013, and 20102012 and changes during the years then ended is presented below:
| December 31, | ||||||||||||||||||||||||
| 2012 | 2011 | 2010 | ||||||||||||||||||||||
| Shares | Weighted Average | Shares | Weighted Average | Shares | Weighted Average | |||||||||||||||||||
| Outstanding, beginning | 535,130 | $ | 13.85 | 510,612 | $ | 14.04 | 474,416 | $ | 14.44 | |||||||||||||||
| Granted | 102,722 | 9.30 | 73,250 | 8.23 | 67,760 | 9.00 | ||||||||||||||||||
| Exercised | (17,876 | ) | 9.68 | (36,459 | ) | 8.30 | (5,754 | ) | 10.24 | |||||||||||||||
| Forfeited | (11,124 | ) | 10.57 | (12,273 | ) | 8.28 | (25,810 | ) | 9.68 | |||||||||||||||
| Outstanding, ending | 608,852 | 13.27 | 535,130 | 13.85 | 510,612 | 14.04 | ||||||||||||||||||
| Exercisable, ending | 391,378 | 355,398 | 321,336 | |||||||||||||||||||||
Weighted average fair value per option of options granted during the period | $ | 2.79 | $ | 2.74 | $ | 2.89 | ||||||||||||||||||
December 31, | ||||||||||||||||||||||||
2014 | 2013 | 2012 | ||||||||||||||||||||||
Weighted | Weighted | Weighted | ||||||||||||||||||||||
Average | Average | Average | ||||||||||||||||||||||
Exercise | Exercise | Exercise | ||||||||||||||||||||||
Shares | Price | Shares | Price | Shares | Price | |||||||||||||||||||
Outstanding, beginning | 662,506 | $ | 13.82 | 608,852 | $ | 13.27 | 535,130 | $ | 13.85 | |||||||||||||||
Granted | 82,609 | 17.11 | 96,232 | 15.68 | 102,722 | 9.30 | ||||||||||||||||||
Exercised | (23,659 | ) | 10.22 | (41,258 | ) | 10.06 | (17,876 | ) | 9.68 | |||||||||||||||
Forfeited | (59,685 | ) | 19.02 | (1,320 | ) | 10.53 | (11,124 | ) | 10.57 | |||||||||||||||
Outstanding, ending | 661,771 | 13.89 | 662,506 | 13.82 | 608,852 | 13.27 | ||||||||||||||||||
Exercisable, ending | 420,429 | 419,735 | 391,378 | |||||||||||||||||||||
Weighted average fair value per option of options granted during the period | $ | 5.68 | $ | 5.14 | $ | 2.79 | ||||||||||||||||||
A further summary of options outstanding as of December 31, 20122014 is presented below:
| Options Outstanding | ||||||||||||||||||||
| Weighted | Options Exercisable | |||||||||||||||||||
Range of Exercise Prices | Number Outstanding | Average | Weighted Average | Number Exercisable | Weighted Average | |||||||||||||||
| $7.72 to $8.93 | 65,530 | 7.90 | $ | 8.10 | 16,730 | $ | 8.22 | |||||||||||||
| $9.00 to $11.64 | 239,692 | 7.75 | 9.21 | 78,098 | 9.19 | |||||||||||||||
| $13.25 to $16.85 | 157,205 | 4.68 | 15.94 | 150,125 | 15.96 | |||||||||||||||
| $17.00 to $18.60 | 49,840 | 2.73 | 18.06 | 49,840 | 18.06 | |||||||||||||||
| $18.67 to $20.90 | 67,885 | 2.16 | 19.48 | 67,885 | 19.48 | |||||||||||||||
| $21.00 to $22.00 | 28,700 | 2.16 | 21.28 | 28,700 | 21.28 | |||||||||||||||
| 608,852 | 391,378 | |||||||||||||||||||
Options Outstanding | ||||||||||||||||||||||
Weighted | Options Exercisable | |||||||||||||||||||||
Average | Weighted | Weighted | ||||||||||||||||||||
Remaining | Average | Average | ||||||||||||||||||||
Range of | Number | Contractual | Exercise | Number | Exercise | |||||||||||||||||
Exercise Prices | Outstanding | Life | Price | Exercisable | Price | |||||||||||||||||
| $7.72 | to | $8.93 | 51,990 | 5.89 | $ | 8.13 | 29,140 | $ | 8.19 | |||||||||||||
| $9.00 | to | $10.24 | 198,499 | 5.82 | 9.22 | 131,420 | 9.21 | |||||||||||||||
| $13.25 | to | $16.85 | 237,893 | 4.92 | 15.85 | 169,514 | 15.94 | |||||||||||||||
| $17.00 | to | $18.60 | 114,424 | 7.05 | 17.33 | 31,390 | 17.86 | |||||||||||||||
| $19.05 | to | $20.63 | 30,265 | 1.04 | 19.10 | 30,265 | 19.10 | |||||||||||||||
| $21.00 | to | $22.00 | 28,700 | 0.16 | 21.28 | 28,700 | 21.28 | |||||||||||||||
| 661,771 | 420,429 | |||||||||||||||||||||
QCR Holdings, Inc. and Subsidiaries
Notes to Consolidated Financial Statements
Note 13.15. Stock-Based Compensation (Continued)
Stock purchase plan:
The Company’s Board of Directors and its stockholders adopted in October 2002 the QCR Holdings, Inc. Employee Stock Purchase Plan (the “Purchase Plan”). On May 2, 2012, the Company'sCompany’s stockholders approved a complete amendment and restatement of the Purchase Plan. As of January 1, 2012,2014, there were 32,266254,851 shares of common stock available for issuance under the Purchase Plan. For each six-month offering period, the Board of Directors will determine how many of the total number of available shares will be offered. The purchase price is the lesser of 90% of the fair market value at the date of the grant or the investment date. The investment date, as established by the Board of Directors, is the date common stock is purchased after the end of each calendar quarter during an offering period. The maximum dollar amount any one participant can elect to contribute in an offering period is $7,500. Additionally, the maximum percentage that any one participant can elect to contribute is 8% of his or her compensation for the years ended December 31, 2012, 2011,2014, 2013, and 2010.2012. Information for the stock purchase plan for the years ended December 31, 2012, 2011,2014, 2013, and 20102012 is presented below:
| 2012 | 2011 | 2010 | ||||||||||
| Shares granted | 29,671 | 34,860 | 31,718 | |||||||||
| Shares purchased | 31,554 | 36,174 | 28,907 | |||||||||
| Weighted average fair value per share granted | $ | 1.71 | $ | 1.68 | $ | 1.81 | ||||||
2014 | 2013 | 2012 | ||||||||||
Shares granted | 24,811 | 27,415 | 29,671 | |||||||||
Shares purchased | 25,321 | 27,110 | 31,554 | |||||||||
Weighted average fair value per share granted | $ | 2.37 | $ | 2.10 | $ | 1.71 | ||||||
QCR Holdings, Inc. and Subsidiaries
Notes to Consolidated Financial Statements
Note 14.16. Regulatory Capital Requirements and Restrictions on Dividends
The Company (on a consolidated basis) and the subsidiary banks are subject to various regulatory capital requirements administered by the federal banking agencies. Failure to meet minimum capital requirements can initiate certain mandatory and possibly additional discretionary actions by regulators that, if undertaken, could have a direct material effect on the Company and subsidiary banks’ financial statements. Under capital adequacy guidelines and the regulatory framework for prompt corrective action, the Company and the subsidiary banks must meet specific capital guidelines that involve quantitative measures of their assets, liabilities, and certain off-balance-sheet items as calculated under regulatory accounting practices. The capital amounts and classification are also subject to qualitative judgments by the regulators about components, risk weightings, and other factors. Quantitative measures established by regulation to ensure capital adequacy require the Company and the subsidiary banks to maintain minimum amounts and ratios (set forth in the following table) of total and Tier 1 capital to risk-weighted assets and of Tier 1 capital to average assets, each as defined by regulation. Management believes, as of December 31, 20122014 and 2011,2013, that the Company and the subsidiary banks met all capital adequacy requirements to which they are subject.
Under the regulatory framework for prompt corrective action, to be categorized as “well capitalized,” an institution must maintain minimum total risk-based, Tier 1 risk-based and Tier 1 leverage ratios as set forth in the following tables. The Company and the subsidiary banks’ actual capital amounts and ratios as of December 31, 20122014 and 20112013 are also presented in the following table (dollars in thousands). As of December 31, 20122014 and 2011,2013, the subsidiary banks met the requirements to be “well capitalized”.
| Actual | For Capital Adequacy Purposes | To Be Well Capitalized Under | ||||||||||||||||||||||
| Amount | Ratio | Amount | Ratio | Amount | Ratio | |||||||||||||||||||
| As of December 31, 2012: | ||||||||||||||||||||||||
| Company: | ||||||||||||||||||||||||
| Total risk-based capital | $ | 188,841 | 12.71 | % | $ | 118,878 | > | 8.0 | % | N/A | N/A | |||||||||||||
| Tier 1 risk-based capital | 167,475 | 11.27 | % | 59,439 | > | 4.0 | % | N/A | N/A | |||||||||||||||
| Tier 1 leverage | 167,475 | 8.13 | % | 82,357 | > | 4.0 | % | N/A | N/A | |||||||||||||||
| Quad City Bank & Trust: | ||||||||||||||||||||||||
| Total risk-based capital | $ | 98,789 | 12.12 | % | $ | 65,218 | > | 8.0 | % | $ | 81,522 | 10.00 | % | |||||||||||
| Tier 1 risk-based capital | 90,533 | 11.11 | % | 32,609 | > | 4.0 | 48,913 | > | 6.00 | % | ||||||||||||||
| Tier 1 leverage | 90,533 | 7.74 | % | 46,784 | > | 4.0 | 58,480 | > | 5.00 | % | ||||||||||||||
| Cedar Rapids Bank & Trust: | ||||||||||||||||||||||||
| Total risk-based capital | $ | 55,736 | 12.87 | % | $ | 34,652 | > | 8.0 | % | $ | 43,315 | > | 10.00 | % | ||||||||||
| Tier 1 risk-based capital | 50,297 | 11.61 | % | 17,326 | > | 4.0 | 25,989 | > | 6.00 | % | ||||||||||||||
| Tier 1 leverage | 50,297 | 8.49 | % | 23,685 | > | 4.0 | 29,606 | > | 5.00 | % | ||||||||||||||
| Rockford Bank & Trust: | ||||||||||||||||||||||||
| Total risk-based capital | $ | 36,894 | 15.33 | % | $ | 19,255 | > | 8.0 | % | $ | 24,609 | > | 10.00 | % | ||||||||||
| Tier 1 risk-based capital | 33,870 | 14.07 | % | 9,628 | > | 4.0 | 14,441 | 6.00 | % | |||||||||||||||
| Tier 1 leverage | 33,870 | 11.13 | % | 12,177 | > | 4.0 | 15,221 | > | 5.00 | % | ||||||||||||||
Actual | For Capital Adequacy Purposes | To Be Well Capitalized Under Prompt Corrective Action Provisions | ||||||||||||||||||||||
Amount | Ratio | Amount | Ratio | Amount | Ratio | |||||||||||||||||||
As of December 31, 2014: | ||||||||||||||||||||||||
Company: | ||||||||||||||||||||||||
Total risk-based capital | $ | 204,376 | 10.91 | % | $ | 149,876 | > | 8.0 | % | N/A | N/A | |||||||||||||
Tier 1 risk-based capital | 178,364 | 9.52 | % | 74,938 | > | 4.0 | N/A | N/A | ||||||||||||||||
Tier 1 leverage | 178,364 | 7.62 | % | 93,658 | > | 4.0 | N/A | N/A | ||||||||||||||||
Quad City Bank & Trust: | ||||||||||||||||||||||||
Total risk-based capital | $ | 104,869 | 11.26 | % | $ | 74,495 | > | 8.0 | % | $ | 93,119 | > | 10.0 | % | ||||||||||
Tier 1 risk-based capital | 93,785 | 10.07 | % | 37,248 | > | 4.0 | 55,872 | > | 6.0 | |||||||||||||||
Tier 1 leverage | 93,785 | 7.10 | % | 52,817 | > | 4.0 | 66,021 | > | 5.0 | |||||||||||||||
Cedar Rapids Bank & Trust: | ||||||||||||||||||||||||
Total risk-based capital | $ | 76,662 | 11.54 | % | $ | 53,126 | > | 8.0 | % | $ | 66,407 | > | 10.0 | % | ||||||||||
Tier 1 risk-based capital | 68,772 | 10.36 | % | 26,563 | > | 4.0 | 39,844 | > | 6.0 | |||||||||||||||
Tier 1 leverage | 68,772 | 8.21 | % | 33,525 | > | 4.0 | 41,906 | > | 5.0 | |||||||||||||||
Rockford Bank & Trust: | ||||||||||||||||||||||||
Total risk-based capital | $ | 35,906 | 12.56 | % | $ | 22,875 | > | 8.0 | % | $ | 28,594 | > | 10.0 | % | ||||||||||
Tier 1 risk-based capital | 32,325 | 11.30 | % | 11,438 | > | 4.0 | 17,156 | > | 6.0 | |||||||||||||||
Tier 1 leverage | 32,325 | 9.16 | % | 14,112 | > | 4.0 | 17,640 | > | 5.0 | |||||||||||||||
QCR Holdings, Inc. and Subsidiaries
Notes to Consolidated Financial Statements
Note 14.16. Regulatory Capital Requirements and Restrictions on Dividends (Continued)
| Actual | For Capital Adequacy Purposes | To Be Well Capitalized Under | ||||||||||||||||||||||
| Amount | Ratio | Amount | Ratio | Amount | Ratio | |||||||||||||||||||
| As of December 31, 2011: | ||||||||||||||||||||||||
| Company: | ||||||||||||||||||||||||
| Total risk-based capital | $ | 191,419 | 13.84 | % | $ | 110,686 | > | 8.0 | % | N/A | N/A | |||||||||||||
| Tier 1 risk-based capital | 169,360 | 12.24 | % | 55,343 | > | 4.0 | % | N/A | N/A | |||||||||||||||
| Tier 1 leverage | 169,360 | 8.70 | % | 77,857 | > | 4.0 | % | N/A | N/A | |||||||||||||||
| Quad City Bank & Trust: | ||||||||||||||||||||||||
| Total risk-based capital | $ | 98,382 | 13.03 | % | $ | 60,391 | > | 8.0 | % | $ | 75,488 | > | 10.00 | % | ||||||||||
| Tier 1 risk-based capital | 90,336 | 11.97 | % | 30,195 | > | 4.0 | 45,293 | > | 6.00 | % | ||||||||||||||
| Tier 1 leverage | 90,336 | 8.21 | % | 44,009 | > | 4.0 | 55,012 | > | 5.00 | % | ||||||||||||||
| Cedar Rapids Bank & Trust: | ||||||||||||||||||||||||
| Total risk-based capital | $ | 56,312 | 14.44 | % | $ | 31,198 | > | 8.0 | % | $ | 38,998 | > | 10.00 | % | ||||||||||
| Tier 1 risk-based capital | 51,415 | 13.18 | % | 15,599 | > | 4.0 | 23,399 | > | 6.00 | % | ||||||||||||||
| Tier 1 leverage | 51,415 | 9.02 | % | 22,807 | > | 4.0 | 28,509 | > | 5.00 | % | ||||||||||||||
| Rockford Bank & Trust: | ||||||||||||||||||||||||
| Total risk-based capital | $ | 36,259 | 15.27 | % | $ | 19,001 | > | 8.0 | % | $ | 23,752 | > | 10.00 | % | ||||||||||
| Tier 1 risk-based capital | 33,277 | 14.01 | % | 9,501 | > | 4.0 | 14,251 | > | 6.00 | % | ||||||||||||||
| Tier 1 leverage | 33,277 | 11.31 | % | 11,770 | > | 4.0 | 14,713 | > | 5.00 | % | ||||||||||||||
Actual | For Capital Adequacy Purposes | To Be Well Capitalized Under Prompt Corrective Action Provisions | ||||||||||||||||||||||
Amount | Ratio | Amount | Ratio | Amount | Ratio | |||||||||||||||||||
As of December 31, 2013: | ||||||||||||||||||||||||
Company: | ||||||||||||||||||||||||
Total risk-based capital | $ | 217,011 | 12.87 | % | $ | 134,935 | > | 8.0 | % | N/A | N/A | |||||||||||||
Tier 1 risk-based capital | 193,044 | 11.45 | % | 67,468 | > | 4.0 | N/A | N/A | ||||||||||||||||
Tier 1 leverage | 193,044 | 7.96 | % | 97,029 | > | 4.0 | N/A | N/A | ||||||||||||||||
Quad City Bank & Trust: | ||||||||||||||||||||||||
Total risk-based capital | $ | 101,168 | 12.25 | % | $ | 66,049 | > | 8.0 | % | $ | 82,562 | > | 10.0 | % | ||||||||||
Tier 1 risk-based capital | 91,820 | 11.12 | % | 33,025 | > | 4.0 | 49,537 | > | 6.0 | |||||||||||||||
Tier 1 leverage | 91,820 | 7.13 | % | 51,527 | > | 4.0 | 64,408 | > | 5.0 | |||||||||||||||
Cedar Rapids Bank & Trust: | ||||||||||||||||||||||||
Total risk-based capital | $ | 74,912 | 12.54 | % | $ | 47,808 | > | 8.0 | % | $ | 59,760 | > | 10.0 | % | ||||||||||
Tier 1 risk-based capital | 67,432 | 11.28 | % | 23,904 | > | 4.0 | 35,856 | > | 6.0 | |||||||||||||||
Tier 1 leverage | 67,432 | 8.78 | % | 30,736 | > | 4.0 | 38,420 | > | 5.0 | |||||||||||||||
Rockford Bank & Trust: | ||||||||||||||||||||||||
Total risk-based capital | $ | 38,778 | 14.59 | % | $ | 21,263 | > | 8.0 | % | $ | 26,579 | > | 10.0 | % | ||||||||||
Tier 1 risk-based capital | 35,449 | 13.34 | % | 10,631 | > | 4.0 | 15,947 | > | 6.0 | |||||||||||||||
Tier 1 leverage | 35,449 | 10.54 | % | 13,459 | > | 4.0 | 16,824 | > | 5.0 | |||||||||||||||
The Company’s ability to pay dividends to its stockholders may be affected by both general corporate law considerations and policies of the Federal Reserve applicable to bank holding companies.
The payment of dividends by any financial institution or its holding company is affected by the requirement to maintain adequate capital pursuant to applicable capital adequacy guidelines and regulations, and a financial institution generally is prohibited from paying any dividends if, following payment thereof, the institution would be undercapitalized. Notwithstanding the availability of funds for dividends, however, the Federal Reserve may prohibit the payment of any dividends by the subsidiary banks if the Federal Reserve determines such payment would constitute an unsafe or unsound practice.
The Company also has certain contractual restrictions on its ability to pay dividends. The Company has issued junior subordinated debentures in four private placements.placements and assumed two issues of junior subordinated debentures in connection with the Community National acquisition. Under the terms of the debentures, the Company may be prohibited, under certain circumstances, from paying dividends on shares of its common stock. Additionally, the Company has issued shares of non-cumulative perpetual preferred stock and under the terms of this preferred stock, the Company may be prohibited, under certainThese circumstances from paying dividends on shares of its common stock. None of these circumstances existeddid not exist at December 31, 20122014 or 2011.
QCR Holdings, Inc. and Subsidiaries
Notes to Consolidated Financial Statements
Note 15.16. Regulatory Capital Requirements and Restrictions on Dividends (continued)
In July 2013, the U.S. federal banking authorities approved the implementation of the Basel III regulatory capital reforms and issued rules effecting certain changes required by the Dodd-Frank Act (the “Basel III Rules”). The Basel III Rules are applicable to all U.S. banks that are subject to minimum capital requirements, as well as to bank and savings and loan holding companies other than “small bank holding companies” (generally bank holding companies with consolidated assets of less than $1 billion). The Basel III Rules not only increased most of the required minimum regulatory capital ratios, but they introduced a new Common Equity Tier 1 Capital ratio and the concept of a capital conservation buffer. The Basel III Rules also expand the definition of capital as in effect currently by establishing criteria that instruments must meet to be considered Additional Tier 1 Capital (Tier 1 Capital in addition to Common Equity) and Tier 2 Capital. A number of instruments that now qualify as Tier 1 Capital will not qualify, or their qualifications will change. The Basel III Rules also permit smaller banking organizations (including the Company and the subsidiary banks) to retain, through a one-time election, the existing treatment for accumulated other comprehensive income (“AOCI”), which currently does not affect regulatory capital. The Company will elect the existing treatment for AOCI. The Basel III Rules have maintained the general structure of the current prompt corrective action framework, while incorporating the increased requirements. The prompt corrective action guidelines were also revised to add the Common Equity Tier 1 Capital ratio. In order to be a “well-capitalized” depository institution under the new regime, a bank and holding company must maintain a Common Equity Tier 1 Capital ratio of 6.5% or more; a Tier 1 Capital ratio of 8% or more; a Total Capital ratio of 10% or more; and a leverage ratio of 5% or more. Generally, financial institutions, including the Company and subsidiary banks, became subject to the new Basel III Rules on January 1, 2015, with the first formal reporting as of March 31, 2015. Management believes that its current capital structure and the execution of its existing capital plan will be sufficient to meet and exceed the revised regulatory capital ratios as required by the new Basel III Rules.
Note 17. Earnings Per Common Share
The following information was used in the computation of basic and diluted earnings per common share for the years ended December 31, 2012, 2011,2014, 2013, and 2010:
| 2012 | 2011 | 2010 | ||||||||||
| Net income | $ | 13,106,240 | $ | 10,129,869 | $ | 6,807,726 | ||||||
| Less: Net income attributable to noncontrolling interests | 488,473 | 438,221 | 221,047 | |||||||||
| Net income attributable to QCR Holdings, Inc. | $ | 12,617,767 | $ | 9,691,648 | $ | 6,586,679 | ||||||
| Less: Preferred stock dividends and discount accretion | 3,496,085 | 5,283,885 | * | 4,128,104 | ||||||||
| Net income attributable to QCR Holdings, Inc. common stockholders | $ | 9,121,682 | $ | 4,407,763 | $ | 2,458,575 | ||||||
| Earnings per common share attributable to QCR Holdings, Inc. common stockholders | ||||||||||||
| Basic | $ | 1.88 | $ | 0.93 | $ | 0.54 | ||||||
| Diluted | $ | 1.85 | $ | 0.92 | $ | 0.53 | ||||||
| Weighted average common shares outstanding | 4,844,776 | 4,724,781 | 4,593,096 | |||||||||
Weighted average common shares issuable upon exercise of stock options and under the employee stock purchase plan ** | 74,783 | 64,245 | 25,146 | |||||||||
| Weighted average common and common equivalent shares outstanding | 4,919,559 | 4,789,026 | 4,618,242 | |||||||||
2014 | 2013 | 2012 | ||||||||||
Net income | $ | 14,952,537 | $ | 14,938,245 | $ | 13,106,240 | ||||||
Less: Net income attributable to noncontrolling interests | - | - | 488,473 | |||||||||
Net income attributable to QCR Holdings, Inc. | $ | 14,952,537 | $ | 14,938,245 | $ | 12,617,767 | ||||||
Less: Preferred stock dividends | 1,081,877 | 3,168,302 | 3,496,085 | * | ||||||||
Net income attributable to QCR Holdings, Inc. common stockholders | $ | 13,870,660 | $ | 11,769,943 | $ | 9,121,682 | ||||||
Earnings per common share attributable to QCR Holdings, Inc. common stockholders | ||||||||||||
Basic | $ | 1.75 | $ | 2.13 | $ | 1.88 | ||||||
Diluted | $ | 1.72 | $ | 2.08 | $ | 1.85 | ||||||
Weighted average common shares outstanding | 7,925,220 | 5,531,948 | 4,844,776 | |||||||||
Weighted average common shares issuable upon exercise of stock options and under the employee stock purchase plan * | 123,441 | 114,978 | 74,783 | |||||||||
Weighted average common and common equivalent shares outstanding | 8,048,661 | 5,646,926 | 4,919,559 | |||||||||
*Excludes anti-dilutive shares of 158,375124,983, 116,324, and 546,521158,375 at December 31, 2014, 2013 and 2012, and 2011, respectively.
QCR Holdings, Inc. and Subsidiaries
Notes to Consolidated Financial Statements
Note 16.18. Commitments and Contingencies
In the normal course of business, the subsidiary banks make various commitments and incur certain contingent liabilities that are not presented in the accompanying consolidated financial statements. The commitments and contingent liabilities include various guarantees, commitments to extend credit, and standby letters of credit.
Commitments to extend credit are agreements to lend to a customer as long as there is no violation of any condition established in the contract. Commitments generally have fixed expiration dates or other termination clauses and may require payment of a fee. Since many of the commitments are expected to expire without being drawn upon, the total commitment amounts do not necessarily represent future cash requirements. The subsidiary banks evaluate each customer's creditworthiness on a case-by-case basis. The amount of collateral obtained, if deemed necessary by the subsidiary banks upon extension of credit, is based upon management's credit evaluation of the counterparty. Collateral held varies but may include accounts receivable, marketable securities, inventory, property, plant and equipment, and income-producing commercial properties.
Standby letters of credit are conditional commitments issued by the subsidiary banks to guarantee the performance of a customer to a third party. Those guarantees are primarily issued to support public and private borrowing arrangements and, generally, have terms of one year or less. The credit risk involved in issuing letters of credit is essentially the same as that involved in extending loan facilities to customers. The subsidiary banks hold collateral, as described above, supporting those commitments if deemed necessary. In the event the customer does not perform in accordance with the terms of the agreement with the third party, the subsidiary banks would be required to fund the commitments. The maximum potential amount of future payments the subsidiary banks could be required to make is represented by the contractual amount. If the commitment is funded, the subsidiary banks would be entitled to seek recovery from the customer. At December 31, 20122014 and 2011,2013, no amounts had been recorded as liabilities for the subsidiary banks’ potential obligations under these guarantees.
As of December 31, 20122014 and 2011,2013, commitments to extend credit aggregated $430,058,000$499,267,717 and $393,559,000,$432,601,000, respectively. As of December 31, 20122014 and 2011,2013, standby letters of credit aggregated $15,179,000$12,896,428 and $8,250,000,$9,697,000, respectively. Management does not expect that all of these commitments will be funded.
The Company has also executed contracts for the sale of mortgage loans in the secondary market in the amount of $4,577,233$553,000 and $3,832,760$1,358,290 as of December 31, 20122014 and 2011,2013, respectively. These amounts are included in loans held for sale at the respective balance sheet dates.
QCR Holdings, Inc. and Subsidiaries
Notes to Consolidated Financial Statements
Note 18. Commitments and Contingencies (continued)
Residential mortgage loans sold to investors in the secondary market are sold with varying recourse provisions. Essentially, all loan sales agreements require the repurchase of a mortgage loan by the seller in situations such as breach of representation, warranty, or covenant, untimely document delivery, false or misleading statements, failure to obtain certain certificates or insurance, unmarketability, etc. Certain loan sales agreements contain repurchase requirements based on payment-related defects that are defined in terms of the number of days/months since the purchase, the sequence number of the payment, and/or the number of days of payment delinquency. Based on the specific terms stated in the agreements of investors purchasing residential mortgage loans from the Company’s subsidiary banks, the Company had $38,846,068$9,049,519 and $51,129,561$16,151,133 of sold residential mortgage loans with recourse provisions still in effect at December 31, 20122014 and 2011,2013, respectively. The subsidiary banks did not repurchase any loans from secondary market investors under the terms of loans sales agreements during the years ended December 31, 2012, 2011,2014, 2013, and 2010.2012. In the opinion of management, the risk of recourse and the subsequent requirement of loan repurchase to the subsidiary banks is not significant, and accordingly no liabilities have been established related to such.
Aside from cash on-hand and in-vault, the majority of the Company's cash is maintained at upstream correspondent banks. The total amount of cash on deposit, certificates of deposit, and federal funds sold exceeded federal insured limits by approximately $30,020,230$101,602,829 and $22,455,000$54,163,895 as of December 31, 20122014 and 2011,2013, respectively. In the opinion of management, no material risk of loss exists due to the financial condition of the upstream correspondent banks. In addition, some of the Company’s cash maintained at upstream correspondent banks is in non-interest bearing deposit accounts. In accordance with the FDIC’s Transaction Account Guarantee (“TAG”) Program, cash maintained in non-interest bearing deposit accounts was fully insured through December 31, 2012. As scheduled, the unlimited coverage for noninterest-bearing transaction accounts provided under the Dodd-Frank Act expired on December 31, 2012. Effective January 1, 2013, deposits held in noninterest-bearing transaction accounts are now aggregated with interest-bearing deposits the owner holds, and the combined total is insured up to $250,000.
In an arrangement with Goldman Sachs and Company (“Goldman Sachs”), certain subsidiary banks offer a cash management program for select customers. Based on a predetermined minimum balance, which must be maintained in the account, excess funds are automatically swept daily to an institutional money market fund administered by Goldman Sachs. At December 31, 20122014 and 2011,2013, the Company had $66,783,049$89,006,285 and $57,332,572,$78,880,300, respectively of customer funds invested in this cash management program.
In April 2011, CNB was named as one of 36 co-defendants in a complaint alleging unjust enrichment relating to participation loans originated, sold and repaid in a fraudulent scheme perpetuated by a loan broker. At acquisition, CNB had not settled the claims and, using all available information, including the settlement amounts of many of the initial co-defendants who had already settled, CNB’s management recorded a contingent liability of $1,028,000, which was assumed by the Company upon acquisition of CNB. In December 2013, the Company settled the claim in the amount of $940,333.
QCR Holdings, Inc. and Subsidiaries
Notes to Consolidated Financial Statements
Note 17.19. Quarterly Results of Operations (Unaudited)
| Year Ended December 31, 2012 | ||||||||||||||||
March 2012 | June 2012 | September 2012 | December 2012 | |||||||||||||
| Total interest income | $ | 19,373,804 | $ | 19,534,528 | $ | 19,487,525 | $ | 18,980,016 | ||||||||
| Total interest expense | 5,170,351 | 5,019,035 | 4,858,007 | 4,679,220 | ||||||||||||
| Net interest income | 14,203,453 | 14,515,493 | 14,629,518 | 14,300,796 | ||||||||||||
| Provision for loan/lease losses | 780,446 | 1,048,469 | 1,496,194 | 1,045,658 | ||||||||||||
| Noninterest income | 3,956,878 | 4,067,509 | 4,117,182 | 4,479,726 | ||||||||||||
| Noninterest expense | 12,738,080 | 13,109,083 | 13,031,517 | 13,380,267 | ||||||||||||
| Income before taxes | 4,641,805 | 4,425,450 | 4,218,989 | 4,354,597 | ||||||||||||
| Federal and state income tax expense | 1,238,956 | 1,152,071 | 1,034,479 | 1,109,095 | ||||||||||||
| Net income | $ | 3,402,849 | $ | 3,273,379 | $ | 3,184,510 | $ | 3,245,502 | ||||||||
| Less net income (loss) attributable to noncontrolling interests | 166,031 | 201,223 | 127,177 | (5,958 | ) | |||||||||||
| Net income attributable to QCR Holdings, Inc. | $ | 3,236,818 | $ | 3,072,156 | $ | 3,057,333 | $ | 3,251,460 | ||||||||
| Earnings per common share: | ||||||||||||||||
| Basic | $ | 0.48 | $ | 0.44 | $ | 0.45 | $ | 0.50 | ||||||||
| Diluted | $ | 0.48 | $ | 0.44 | $ | 0.44 | $ | 0.49 | ||||||||
| Year Ended December 31, 2011 | ||||||||||||||||
March 2011 | June 2011 | September 2011 | December 2011 | |||||||||||||
| Total interest income | $ | 18,651,232 | $ | 19,862,076 | $ | 19,569,430 | $ | 19,640,510 | ||||||||
| Total interest expense | 6,442,430 | 5,911,021 | 5,740,726 | 5,484,215 | ||||||||||||
| Net interest income | 12,208,802 | 13,951,055 | 13,828,704 | 14,156,295 | ||||||||||||
| Provision for loan/lease losses | 1,067,664 | 1,672,221 | 2,456,965 | 1,419,164 | ||||||||||||
| Noninterest income | 5,057,124 | 4,173,381 | 4,335,307 | 3,896,066 | ||||||||||||
| Noninterest expense | 13,012,271 | 12,555,547 | 12,773,149 | 12,651,685 | ||||||||||||
| Income before taxes | 3,185,991 | 3,896,668 | 2,933,897 | 3,981,512 | ||||||||||||
| Federal and state income tax expense | 954,507 | 1,123,454 | 667,296 | 1,122,942 | ||||||||||||
| Net income | $ | 2,231,484 | $ | 2,773,214 | $ | 2,266,601 | $ | 2,858,570 | ||||||||
| Less net income attributable to noncontrolling interests | 106,524 | 98,245 | 103,446 | 130,006 | ||||||||||||
| Net income attributable to QCR Holdings, Inc. | $ | 2,124,960 | $ | 2,674,969 | $ | 2,163,155 | $ | 2,728,564 | ||||||||
| Earnings per common share: | ||||||||||||||||
| Basic | $ | 0.23 | $ | 0.35 | $ | (0.01 | ) | $ | 0.36 | |||||||
| Diluted | $ | 0.23 | $ | 0.34 | $ | (0.01 | ) | $ | 0.35 | |||||||
Year Ended December 31, 2014 | ||||||||||||||||
March | June | September | December | |||||||||||||
2014 | 2014 | 2014 | 2014 | |||||||||||||
Total interest income | $ | 21,035,211 | $ | 21,105,376 | $ | 21,796,642 | $ | 22,028,027 | ||||||||
Total interest expense | 4,185,970 | 4,140,033 | 4,321,311 | 4,246,814 | ||||||||||||
Net interest income | 16,849,241 | 16,965,343 | 17,475,331 | 17,781,213 | ||||||||||||
Provision for loan/lease losses | 1,094,162 | 1,001,879 | 1,063,323 | 3,647,636 | ||||||||||||
Noninterest income | 4,746,841 | 5,344,213 | 5,067,642 | 5,838,604 | ||||||||||||
Noninterest expense | 16,140,420 | 16,106,529 | 16,388,109 | 16,634,863 | ||||||||||||
Income before taxes | 4,361,500 | 5,201,148 | 5,091,541 | 3,337,318 | ||||||||||||
Federal and state income tax expense | 472,285 | 1,193,312 | 1,028,876 | 344,497 | ||||||||||||
Net income | $ | 3,889,215 | $ | 4,007,836 | $ | 4,062,665 | $ | 2,992,821 | ||||||||
Earnings per common share: | ||||||||||||||||
Basic | $ | 0.40 | $ | 0.46 | $ | 0.51 | $ | 0.38 | ||||||||
Diluted | $ | 0.40 | $ | 0.45 | $ | 0.50 | $ | 0.37 | ||||||||
Year Ended December 31, 2013 | ||||||||||||||||
March | June | September | December | |||||||||||||
2013 | 2013 | 2013 | 2013 | |||||||||||||
Total interest income | $ | 18,537,482 | $ | 20,139,401 | $ | 21,996,243 | $ | 21,198,832 | ||||||||
Total interest expense | 4,346,165 | 4,431,349 | 4,685,907 | 4,303,100 | ||||||||||||
Net interest income | 14,191,317 | 15,708,052 | 17,310,336 | 16,895,732 | ||||||||||||
Provision for loan/lease losses | 1,057,782 | 1,520,137 | 1,366,984 | 1,985,517 | ||||||||||||
Noninterest income | 5,204,029 | 6,948,756 | 5,934,653 | 7,726,390 | ||||||||||||
Noninterest expense | 13,958,500 | 15,234,349 | 17,027,268 | 18,212,541 | ||||||||||||
Income before taxes | 4,379,064 | 5,902,322 | 4,850,737 | 4,424,064 | ||||||||||||
Federal and state income tax expense | 1,113,920 | 1,857,091 | 1,038,793 | 608,138 | ||||||||||||
Net income | $ | 3,265,144 | $ | 4,045,231 | $ | 3,811,944 | $ | 3,815,926 | ||||||||
Earnings per common share: | ||||||||||||||||
Basic | $ | 0.50 | $ | 0.60 | $ | 0.52 | $ | 0.51 | ||||||||
Diluted | $ | 0.49 | $ | 0.59 | $ | 0.51 | $ | 0.50 | ||||||||
QCR Holdings, Inc. and Subsidiaries
Notes to Consolidated Financial Statements
Note 18.20. Parent Company Only Financial Statements
The following is condensed financial information of QCR Holdings, Inc. (parent company only):
Condensed Balance Sheets
December 31, 20122014 and 2011
| Assets | 2012 | 2011 | ||||||
| Cash and due from banks | $ | 1,072,434 | $ | 3,542,484 | ||||
| Interest-bearing deposits at financial institutions | 185,113 | 183,176 | ||||||
| Securities available for sale, at fair value | 1,406,876 | 1,252,658 | ||||||
| Investment in bank subsidiaries | 182,465,733 | 181,045,066 | ||||||
| Investment in nonbank subsidiaries | 1,202,791 | 2,510,382 | ||||||
| Premises and equipment, net | 3,318,757 | - | ||||||
| Other assets | 7,720,933 | 5,196,321 | ||||||
| Total assets | $ | 197,372,637 | $ | 193,730,087 | ||||
| Liabilities and Stockholders' Equity | ||||||||
| Liabilities: | ||||||||
| Other borrowings | $ | 10,077,769 | $ | 6,231,663 | ||||
| Junior subordinated debentures | 36,085,000 | 36,085,000 | ||||||
| Other liabilities | 10,776,047 | 9,032,260 | ||||||
| Total liabilities | 56,938,816 | 51,348,923 | ||||||
| Stockholders' Equity: | ||||||||
| Preferred stock | 54,867 | 65,090 | ||||||
| Common stock | 5,039,448 | 4,879,435 | ||||||
| Additional paid-in capital | 78,912,791 | 89,702,533 | ||||||
| Retained earnings | 53,326,542 | 44,585,902 | ||||||
| Accumulated other comprehensive income | 4,706,683 | 4,754,714 | ||||||
| Treasury stock | (1,606,510 | ) | (1,606,510 | ) | ||||
| Total stockholders' equity | 140,433,821 | 142,381,164 | ||||||
| Total liabilities and stockholders' equity | $ | 197,372,637 | $ | 193,730,087 | ||||
Assets | 2014 | 2013 | ||||||
Cash and due from banks | $ | 4,499,139 | $ | 7,212,584 | ||||
Interest-bearing deposits at financial institutions | 190,127 | 187,401 | ||||||
Securities available for sale, at fair value | 1,724,353 | 1,644,663 | ||||||
Investment in bank subsidiaries | 198,881,739 | 187,410,269 | ||||||
Investment in nonbank subsidiaries | 1,388,361 | 1,396,632 | ||||||
Premises and equipment, net | 3,160,035 | 3,243,575 | ||||||
Other assets | 6,765,109 | 8,709,546 | ||||||
Total assets | $ | 216,608,863 | $ | 209,804,670 | ||||
Liabilities and Stockholders' Equity | ||||||||
Liabilities: | ||||||||
Other borrowings | $ | 21,745,116 | $ | 14,104,323 | ||||
Junior subordinated debentures | 40,423,735 | 40,289,830 | ||||||
Other liabilities | 10,361,503 | 7,833,737 | ||||||
Total liabilities | 72,530,354 | 62,227,890 | ||||||
Stockholders' Equity: | ||||||||
Preferred stock | - | 29,867 | ||||||
Common stock | 8,074,443 | 8,005,708 | ||||||
Additional paid-in capital | 61,668,968 | 90,154,528 | ||||||
Retained earnings | 77,876,824 | 64,637,173 | ||||||
Accumulated other comprehensive loss | (1,935,216 | ) | (13,643,986 | ) | ||||
Treasury stock | (1,606,510 | ) | (1,606,510 | ) | ||||
Total stockholders' equity | 144,078,509 | 147,576,780 | ||||||
Total liabilities and stockholders' equity | $ | 216,608,863 | $ | 209,804,670 | ||||
QCR Holdings, Inc. and Subsidiaries
Notes to Consolidated Financial Statements
Note 18.20. Parent Company Only Financial Statements (Continued)
Condensed Statements of Income
Years Ended December 31, 2012, 2011,2014, 2013, and 2010
| 2012 | 2011 | 2010 | ||||||||||
| Total interest income | $ | 57,136 | $ | 62,521 | $ | 43,157 | ||||||
| Equity in net income of bank subsidiaries | 17,206,086 | 14,449,843 | 11,223,115 | |||||||||
| Equity in net income of nonbank subsidiaries | 168,934 | 174,058 | 199,285 | |||||||||
| Other * | 657,733 | 129,773 | 46,030 | |||||||||
| Total income | 18,089,889 | 14,816,195 | 11,511,587 | |||||||||
| Interest expense | 1,408,948 | 1,562,323 | 2,296,446 | |||||||||
| Salaries and employee benefits | 4,717,609 | 4,078,474 | 3,153,062 | |||||||||
| Professional fees | 988,306 | 1,103,910 | 1,192,225 | |||||||||
| Other-than-temporary impairment losses on securities | 62,400 | 118,847 | - | |||||||||
| Other | 760,618 | 783,460 | 743,859 | |||||||||
| Total expenses | 7,937,881 | 7,647,014 | 7,385,592 | |||||||||
| Income before income tax benefit | 10,152,008 | 7,169,181 | 4,125,995 | |||||||||
| Income tax benefit | 2,465,759 | 2,522,467 | 2,460,684 | |||||||||
| Net income | $ | 12,617,767 | $ | 9,691,648 | $ | 6,586,679 | ||||||
2014 | 2013 | 2012 | ||||||||||
Total interest income | $ | 40,815 | $ | 43,476 | $ | 57,136 | ||||||
Equity in net income of bank subsidiaries | 20,333,194 | 20,499,070 | 17,206,086 | |||||||||
Equity in net income of nonbank subsidiaries | 32,675 | 31,540 | 168,934 | |||||||||
Bargain purchase gain on Community National acquisition | - | 1,841,385 | - | |||||||||
Other * | 7,486 | 7,942 | 657,733 | |||||||||
Total income | 20,414,170 | 22,423,413 | 18,089,889 | |||||||||
Interest expense | 1,986,752 | 1,714,814 | 1,408,948 | |||||||||
Salaries and employee benefits | 4,671,719 | 4,765,762 | 4,717,609 | |||||||||
Professional fees | 1,100,714 | 977,571 | 988,306 | |||||||||
Acquisition and data conversion costs | - | 2,037,684 | - | |||||||||
Other-than-temporary impairment losses on securities | - | - | 62,400 | |||||||||
Other | 635,081 | 642,044 | 760,618 | |||||||||
Total expenses | 8,394,266 | 10,137,875 | 7,937,881 | |||||||||
Income before income tax benefit | 12,019,904 | 12,285,538 | 10,152,008 | |||||||||
Income tax benefit | 2,932,633 | 2,652,707 | 2,465,759 | |||||||||
Net income | $ | 14,952,537 | $ | 14,938,245 | $ | 12,617,767 | ||||||
*For theThe year ended December 31, 2012 includes pre-tax gain of approximately $580 thousand on the sale of a 2.25% equity interest in a company providing data processing services to merchant credit card acquiring businesses.
QCR Holdings, Inc. and Subsidiaries
Notes to Consolidated Financial Statements
Note 18.20. Parent Company Only Financial Statements (Continued)
Condensed Statements of Cash Flows
Years Ended December 31, 2012, 2011,2014, 2013, and 2010
2014 | 2013 | 2012 | ||||||||||
Cash Flows from Operating Activities: | ||||||||||||
Net income | $ | 14,952,537 | $ | 14,938,245 | $ | 12,617,767 | ||||||
Adjustments to reconcile net income to net cash provided by operating activities: | ||||||||||||
Distributions in excess of (less than) earnings of: | ||||||||||||
Bank subsidiaries | 166,806 | 5,500,930 | (3,706,086 | ) | ||||||||
Nonbank subsidiaries | 9 | (103 | ) | (132,911 | ) | |||||||
Bargain purchase gain on Community National acquisition | - | (1,841,385 | ) | - | ||||||||
Accretion of acquisition fair value adjustments | 133,905 | 79,655 | - | |||||||||
Depreciation | 100,158 | 75,182 | - | |||||||||
Other-than-temporary impairment losses on securities | - | - | 62,400 | |||||||||
Stock-based compensation expense | 891,619 | 792,279 | 849,760 | |||||||||
Decrease (increase) in other assets | 1,912,597 | (725,105 | ) | (437,827 | ) | |||||||
(Decrease) increase in other liabilities | 2,644,458 | (2,978,106 | ) | 1,938,832 | ||||||||
Net cash provided by operating activities | 20,802,089 | 15,841,592 | 11,191,935 | |||||||||
Cash Flows from Investing Activities: | ||||||||||||
Net increase in interest-bearing deposits at financial instituions | (2,726 | ) | (2,288 | ) | (1,937 | ) | ||||||
Purchase of securities available for sale | (40,523 | ) | (34,040 | ) | (53,501 | ) | ||||||
Calls, maturities and redemptions of securities available for sale | 71,429 | - | - | |||||||||
Net cash paid for Community National acquisition | - | (6,261,684 | ) | - | ||||||||
Increase in cash from dissolution of VPHC | - | - | 99,645 | |||||||||
Purchase of premises and equipment | (16,618 | ) | - | - | ||||||||
Net cash (used in) provided by' investing activities | 11,562 | (6,298,012 | ) | 44,207 | ||||||||
Cash Flows from Financing Activities: | ||||||||||||
Net (decrease) increase in other borrowings | (2,359,207 | ) | (373,446 | ) | - | |||||||
Proceeds from other borrowings term note | 10,000,000 | 10,000,000 | - | |||||||||
Advance (payment) on 364-day revolving note | - | (5,600,000 | ) | 2,000,000 | ||||||||
Repayment of Community National's other borrowings at acquisition | - | (3,950,000 | ) | - | ||||||||
Payment of cash dividends on common and preferred stock | (1,964,608 | ) | (4,062,726 | ) | (4,088,949 | ) | ||||||
Redemption of 10,223 shares of Series F Noncumulative Perpetual Preferred Stock, net | - | - | (10,223,000 | ) | ||||||||
Redemption of 29,867 shares of Series F Noncumulative Perpetual Preferred Stock, net | (29,823,922 | ) | - | - | ||||||||
Proceeds from issuance of common stock, net | 620,641 | 582,742 | 994,174 | |||||||||
Purchase of noncontrolling interests | - | - | (2,388,417 | ) | ||||||||
Net cash used in financing activities | (23,527,096 | ) | (3,403,430 | ) | (13,706,192 | ) | ||||||
Net increase (decrease) in cash and due from banks | (2,713,445 | ) | 6,140,150 | (2,470,050 | ) | |||||||
Cash and due from banks: | ||||||||||||
Beginning | 7,212,584 | 1,072,434 | 3,542,484 | |||||||||
Ending | $ | 4,499,139 | $ | 7,212,584 | $ | 1,072,434 | ||||||
| 2012 | 2011 | 2010 | ||||||||||
| Cash Flows from Operating Activities: | ||||||||||||
| Net income | $ | 12,617,767 | $ | 9,691,648 | $ | 6,586,679 | ||||||
| Adjustments to reconcile net income to net cash provided by operating activities: | ||||||||||||
| Distributions in excess of (less than) earnings of: | ||||||||||||
| Bank subsidiaries | (3,706,086 | ) | (4,449,843 | ) | (4,573,115 | ) | ||||||
| Nonbank subsidiaries | (132,911 | ) | 133,951 | (141,234 | ) | |||||||
| Depreciation | - | 54 | 590 | |||||||||
| Other-than-temporary impairment losses on securities | 62,400 | 118,847 | - | |||||||||
| Stock-based compensation expense | 849,760 | 646,419 | 533,271 | |||||||||
| Increase in other assets | (437,827 | ) | (65,205 | ) | (2,935,064 | ) | ||||||
| Increase in other liabilities | 1,930,733 | 658,610 | 926,645 | |||||||||
| Net cash provided by operating activities | 11,183,836 | 6,734,481 | 397,772 | |||||||||
| Cash Flows from Investing Activities: | ||||||||||||
| Net increase in interest-bearing deposits at financial instituions | (1,937 | ) | (1,227 | ) | (940 | ) | ||||||
| Purchase of securities available for sale | (53,501 | ) | (58,149 | ) | (27,980 | ) | ||||||
| Capital infusion, bank subsidiaries | - | (1,693,679 | ) | (2,700,000 | ) | |||||||
| Increase in cash from dissolution of VPHC | 99,645 | - | - | |||||||||
| Net cash provided by (used in) investing activities | 44,207 | (1,753,055 | ) | (2,728,920 | ) | |||||||
| Cash Flows from Financing Activities: | ||||||||||||
| Net increase (decrease) in other borrowings | 2,008,099 | 1,107,630 | (2,491,727 | ) | ||||||||
Proceeds from issuance of Series A Subordinated Notes and detachable warrants to purchase 54,000 shares of common stock | - | - | 2,700,000 | |||||||||
| Payment of cash dividends on common and preferred stock | (4,088,949 | ) | (3,712,493 | ) | (4,052,089 | ) | ||||||
| Redemption of 10,223 shares of Series F Noncumulative Perpetual Preferred Stock, net | (10,223,000 | ) | - | - | ||||||||
| Proceeds from issuance of 40,090 shares of Series F Noncumulative Perpetual Preferred Stock, net | - | 39,996,922 | - | |||||||||
| Redemption of Series D Cumulative Perpetual Preferred Stock, net | - | (38,237,000 | ) | - | ||||||||
Repurchase of 521,888 shares of common stock warrants issued in conjunction with Series D Cumulative Perpetual Preferred Stock | - | (1,100,000 | ) | - | ||||||||
| Proceeds from issuance of Series E Noncumulative Convertible Perpetual Preferred Stock, net | - | - | 3,187,233 | |||||||||
| Proceeds from issuance of common stock, net | 994,174 | 477,339 | 261,547 | |||||||||
| Purchase of noncontrolling interests | (2,388,417 | ) | - | (149,032 | ) | |||||||
| Net cash used in financing activities | (13,698,093 | ) | (1,467,602 | ) | (544,068 | ) | ||||||
| Net increase (decrease) in cash and due from banks | (2,470,050 | ) | 3,513,824 | (2,875,216 | ) | |||||||
| Cash and due from banks: | ||||||||||||
| Beginning | 3,542,484 | 28,660 | 2,903,876 | |||||||||
| Ending | $ | 1,072,434 | $ | 3,542,484 | $ | 28,660 | ||||||
| Supplemental Schedule of Noncash Investing Activities: | ||||||||||||
| Dissolution of VPHC (see Note 1) | ||||||||||||
| Assets acquired: | ||||||||||||
| Cash | $ | 99,645 | $ | - | $ | - | ||||||
| Premises | 3,318,757 | - | - | |||||||||
| Other assets | 12,473 | - | - | |||||||||
| Total assets | 3,430,875 | - | - | |||||||||
| Liabilities assumed: | ||||||||||||
| Other borrowings | 1,838,007 | - | - | |||||||||
| Other liabilities | 14,461 | - | - | |||||||||
| Total liabilities | 1,852,468 | - | - | |||||||||
| Net | 1,578,407 | - | - | |||||||||
QCR Holdings, Inc. and Subsidiaries
Notes to Consolidated Financial Statements
Note 19.21. Fair Value
Accounting guidance on fair value measurements uses a hierarchy intended to maximize the use of observable inputs and minimize the use of unobservable inputs. This hierarchy includes three levels and is based upon the valuation techniques used to measure assets and liabilities. The three levels are as follows:
● | Level 1 – Inputs to the valuation methodology are quoted prices (unadjusted) for identical assets or liabilities in markets; |
● | Level 2 – Inputs to the valuation methodology include quoted prices for similar assets and liabilities in active markets and inputs that are observable for the asset or liability, either directly or indirectly, for substantially the full term of the financial instrument; and |
● | Level 3 – Inputs to the valuation methodology are unobservable and significant to the fair value measurement |
Assets measured at fair value on a recurring basis comprisecomprised the following at December 31, 20122014 and 2011:
| Fair Value Measurements at Reporting Date Using | ||||||||||||||||
| Fair Value | Quoted Prices in Active | Significant Other | Significant Unobservable | |||||||||||||
| December 31, 2012: | ||||||||||||||||
| Securities available for sale: | ||||||||||||||||
| U.S. govt. sponsored agency securities | $ | 338,609,371 | $ | - | $ | 338,609,371 | $ | - | ||||||||
| Residential mortgage-backed securities | 163,601,103 | - | 163,601,103 | - | ||||||||||||
| Municipal securities | 26,185,736 | - | 26,185,736 | - | ||||||||||||
| Trust preferred securities | 139,400 | - | 139,400 | - | ||||||||||||
| Other securities | 1,624,376 | 234,453 | 1,389,923 | - | ||||||||||||
| $ | 530,159,986 | $ | 234,453 | $ | 529,925,533 | $ | - | |||||||||
| December 31, 2011: | ||||||||||||||||
| Securities available for sale: | ||||||||||||||||
| U.S. govt. sponsored agency securities | $ | 428,955,220 | $ | - | $ | 428,955,220 | $ | - | ||||||||
| Residential mortgage-backed securities | 108,853,749 | - | 108,853,749 | - | ||||||||||||
| Municipal securities | 25,689,364 | - | 25,689,364 | - | ||||||||||||
| Trust preferred securities | 80,800 | - | 80,800 | - | ||||||||||||
| Other securities | 1,450,158 | 191,506 | 1,258,652 | - | ||||||||||||
| $ | 565,029,291 | $ | 191,506 | $ | 564,837,785 | $ | - | |||||||||
Fair Value Measurements at Reporting Date Using | ||||||||||||||||
Quoted Prices | Significant | |||||||||||||||
in Active | Other | Significant | ||||||||||||||
Markets for | Observable | Unobservable | ||||||||||||||
Identical Assets | Inputs | Inputs | ||||||||||||||
Fair Value | (Level 1) | (Level 2) | (Level 3) | |||||||||||||
December 31, 2014: | ||||||||||||||||
Securities available for sale: | ||||||||||||||||
U.S. govt. sponsored agency securities | $ | 307,869,572 | $ | - | $ | 307,869,572 | $ | - | ||||||||
Residential mortgage-backed securities | 111,423,224 | - | 111,423,224 | - | ||||||||||||
Municipal securities | 30,399,981 | - | 30,399,981 | - | ||||||||||||
Other securities | 1,966,853 | 345,952 | 1,620,901 | - | ||||||||||||
Derivative instruments | 1,487,386 | - | 1,487,386 | - | ||||||||||||
| $ | 453,147,016 | $ | 345,952 | $ | 452,801,064 | $ | - | |||||||||
December 31, 2013: | ||||||||||||||||
Securities available for sale: | ||||||||||||||||
U.S. govt. sponsored agency securities | $ | 356,472,987 | $ | - | $ | 356,472,987 | $ | - | ||||||||
Residential mortgage-backed securities | 157,429,451 | - | 157,429,451 | - | ||||||||||||
Municipal securities | 35,958,857 | - | 35,958,857 | - | ||||||||||||
Other securities | 1,897,163 | 317,698 | 1,579,465 | - | ||||||||||||
| $ | 551,758,458 | $ | 317,698 | $ | 551,440,760 | $ | - | |||||||||
There were no transfers of assets or liabilities between Levels 1, 2, and 3 of the fair value hierarchy during the years ended December 31, 20122014 or 2011.
A small portion of the securities available for sale portfolio consists of common stocksstock issued by various unrelated bank holding companies and mutual funds. The fair values used by the Company are obtained from an independent pricing service, which represent quoted market prices for the identical securities (Level 1 inputs).
QCR Holdings, Inc. and Subsidiaries
Notes to Consolidated Financial Statements
Note 19.21. Fair Value (Continued)
The remainder of the securities available for sale portfolio consistconsists of securities whereby the Company obtains fair values from an independent pricing service. The fair values are determined by pricing models that consider observable market data, such as interest rate volatilities, LIBOR yield curve, credit spreads and prices from market makers and live trading systems (Level 2 inputs).
Derivative instruments consist of interest rate caps that are used for the purpose of hedging interest rate risk. See Note 6 to the Consolidated Financial Statements for the details of these instruments. The fair values are determined by pricing models that consider observable market data for derivative instruments with similar structures (Level 2 inputs).
Certain financial assets are measured at fair value on a non-recurring basis; that is, the assets are not measured at fair value on an ongoing basis but are subject to fair value adjustments in certain circumstances (for example, when there is evidence of impairment).
Assets measured at fair value on a non-recurring basis comprisecomprised the following at December 31, 20122014 and 2011:
| Fair Value Measurements at Reporting Date Using | ||||||||||||||||
| Fair Value | Quoted Prices in Active | Significant Other | Significant Unobservable | |||||||||||||
| December 31, 2012: | ||||||||||||||||
| Impaired loans/leases | $ | 18,054,234 | $ | - | $ | - | $ | 18,054,234 | ||||||||
| Other real estate owned | 4,270,901 | - | - | 4,270,901 | ||||||||||||
| $ | 22,325,135 | $ | - | $ | - | $ | 22,325,135 | |||||||||
| December 31, 2011: | ||||||||||||||||
| Impaired loans/leases | $ | 19,603,360 | $ | - | $ | - | $ | 19,603,360 | ||||||||
| Other real estate owned | 9,056,619 | - | - | 9,056,619 | ||||||||||||
| $ | 28,659,979 | $ | - | $ | - | $ | 28,659,979 | |||||||||
Fair Value Measurements at Reporting Date Using | ||||||||||||||||
Quoted Prices | Significant | |||||||||||||||
in Active | Other | Significant | ||||||||||||||
Markets for | Observable | Unobservable | ||||||||||||||
Identical Assets | Inputs | Inputs | ||||||||||||||
Fair Value | (Level 1) | (Level 2) | (Level 3) | |||||||||||||
December 31, 2014: | ||||||||||||||||
Impaired loans/leases | $ | 12,467,362 | $ | - | $ | - | $ | 12,467,362 | ||||||||
Other real estate owned | 13,789,047 | - | - | 13,789,047 | ||||||||||||
| $ | 26,256,409 | $ | - | $ | - | $ | 26,256,409 | |||||||||
December 31, 2013: | ||||||||||||||||
Impaired loans/leases | $ | 9,009,557 | $ | - | $ | - | $ | 9,009,557 | ||||||||
Other real estate owned | 10,507,377 | - | - | 10,507,377 | ||||||||||||
| $ | 19,516,934 | $ | - | $ | - | $ | 19,516,934 | |||||||||
Impaired loans/leases are evaluated and valued at the time the loan/lease is identified as impaired, at the lower of cost or fair value and are classified as a Level 3 in the fair value hierarchy. Fair value is measured based on the value of the collateral securing these loans/leases. Collateral may be real estate and/or business assets including equipment, inventory and/or accounts receivable and is determined based on appraisals by qualified licensed appraisers hired by the Company. Appraised and reported values may be discounted based on management’s historical knowledge, changes in market conditions from the time of valuation, and/or management’s expertise and knowledge of the client and client’s business.
Other real estate owned in the table above consists of property acquired through foreclosures and settlements of loans. Property acquired is carried at the estimated fair value of the property, less disposal costs, and is classified as a Level 3 in the fair value hierarchy. The estimated fair value of the property is determined based on appraisals by qualified licensed appraisers hired by the Company. Appraised and reported values are discounted based on management’s historical knowledge, changes in market conditions from the time of valuation, and/or management’s expertise and knowledge of the property.
QCR Holdings, Inc. and Subsidiaries
Notes to Consolidated Financial Statements
Note 21. Fair Value (continued)
The following table presents additional quantitative information about assets measured at fair value on a non-recurring basis for which the Company has utilized Level 3 inputs to determine fair value:
Quantitave Information about Level Fair Value Measurments | ||||||||||
Fair Value | Valuation Technique | Unobservable Input | Range | |||||||
December 31, 2014: | ||||||||||
Impaired loans/leases | $ | 12,467,362 | Appraisal of collateral | Appraisal adjustments | -10.00% to -50.00 | % | ||||
Other real estate owned | 13,789,047 | Appraisal of collateral | Appraisal adjustments | 0.00% to -35.00 | % | |||||
Quantitave Information about Level Fair Value Measurments | ||||||||||
Fair Value | Valuation Technique | Unobservable Input | Range | |||||||
December 31, 2013: | ||||||||||
Impaired loans/leases | $ | 9,009,557 | Appraisal of collateral | Appraisal adjustments | -10.00% to -50.00 | % | ||||
Other real estate owned | 10,507,377 | Appraisal of collateral | Appraisal adjustments | 0.00% to -35.00 | % | |||||
For impaired loans/leases and other real estate owned, the Company records carrying value at fair value less disposal or selling costs. The amounts reported in the tables above are fair values before the adjustment for disposal or selling costs.
There have been no changes in valuation techniques used for any assets measured at fair value during the years ended December 31, 20122014 or 2011.
The following table presents the carrying values and estimated fair values of financial assets and liabilities carried on the Company’s consolidated balance sheets,sheet, including those financial assets and liabilities that are not measured and reported at fair value on a recurring basis or non-recurring basis:
Fair Value | As of December 31, 2014 | As of December 31, 2013 | |||||||||||||||
Heirarchy | Carrying | Estimated | Carrying | Estimated | |||||||||||||
Level | Value | Fair Value | Value | Fair Value | |||||||||||||
Cash and due from banks | Level 1 | $ | 38,235,019 | $ | 38,235,019 | $ | 41,950,790 | $ | 41,950,790 | ||||||||
Federal funds sold | Level 2 | 46,780,000 | 46,780,000 | 39,435,000 | 39,435,000 | ||||||||||||
Interest-bearing deposits at financial institutions | Level 2 | 35,334,682 | 35,334,682 | 33,044,917 | 33,044,917 | ||||||||||||
Investment securities: | |||||||||||||||||
Held to maturity | Level 3 | 199,879,574 | 201,113,796 | 145,451,895 | 138,640,105 | ||||||||||||
Available for sale | See Previous Table | 451,659,630 | 451,659,630 | 551,758,458 | 551,758,458 | ||||||||||||
Loans/leases receivable, net | Level 3 | 11,543,854 | 12,467,362 | 8,342,182 | 9,009,557 | ||||||||||||
Loans/leases receivable, net | Level 2 | 1,595,384,851 | 1,606,646,146 | 1,430,489,328 | 1,441,952,443 | ||||||||||||
Derivative instruments | Level 2 | 1,487,386 | 1,487,386 | - | - | ||||||||||||
Deposits: | |||||||||||||||||
Nonmaturity deposits | Level 2 | 1,304,044,099 | 1,304,044,099 | 1,256,209,352 | 1,256,209,352 | ||||||||||||
Time deposits | Level 2 | 375,623,914 | 376,509,000 | 390,781,891 | 391,923,000 | ||||||||||||
Short-term borrowings | Level 2 | 268,351,670 | 268,351,670 | 149,292,967 | 149,292,967 | ||||||||||||
Federal Home Loan Bank advances | Level 2 | 203,500,000 | 208,172,000 | 231,350,000 | 241,623,000 | ||||||||||||
Other borrowings | Level 2 | 150,282,492 | 159,741,000 | 142,448,362 | 152,761,000 | ||||||||||||
Junior subordinated debentures | Level 2 | 40,423,735 | 28,585,294 | 40,289,830 | 28,094,228 | ||||||||||||
| As of December 31, 2012 | As of December 31, 2011 | ||||||||||||||||
Fair Value Heirarchy | Carrying Value | Estimated Fair Value | Carrying Value | Estimated Fair Value | |||||||||||||
| Cash and due from banks | Level 1 | $ | 61,568,446 | $ | 61,568,446 | $ | 53,136,710 | $ | 53,136,710 | ||||||||
| Federal funds sold | Level 2 | 26,560,000 | 26,560,000 | 20,785,000 | 20,785,000 | ||||||||||||
| Interest-bearing deposits at financial institutions | Level 2 | 22,359,490 | 22,359,490 | 26,750,602 | 26,750,602 | ||||||||||||
| Investment securities: | |||||||||||||||||
| Held to maturity | Level 3 | 72,079,385 | 73,005,706 | 200,000 | 200,000 | ||||||||||||
| Available for sale | See Previous Table | 530,159,986 | 530,159,986 | 565,029,291 | 565,029,291 | ||||||||||||
| Loans/leases receivable, net | Level 3 | 16,716,883 | 18,054,234 | 18,151,259 | 19,603,360 | ||||||||||||
| Loans/leases receivable, net | Level 2 | 1,250,745,552 | 1,262,090,766 | 1,163,804,976 | 1,183,213,640 | ||||||||||||
| Deposits: | |||||||||||||||||
| Nonmaturity deposits | Level 2 | 1,039,572,326 | 1,039,572,326 | 867,972,148 | 867,972,148 | ||||||||||||
| Time deposits | Level 2 | 334,541,774 | 337,343,000 | 337,485,640 | 341,224,852 | ||||||||||||
| Short-term borrowings | Level 2 | 171,082,961 | 171,082,961 | 213,536,450 | 213,536,450 | ||||||||||||
| Federal Home Loan Bank advances | Level 2 | 202,350,000 | 220,815,000 | 204,750,000 | 223,678,000 | ||||||||||||
| Other borrowings | Level 2 | 138,239,762 | 154,101,000 | 136,231,663 | 151,813,000 | ||||||||||||
| Junior subordinated debentures | Level 2 | 36,085,000 | 18,786,000 | 36,085,000 | 18,444,000 | ||||||||||||
QCR Holdings, Inc. and Subsidiaries
Notes to Consolidated Financial Statements
Note 21. Fair Value (continued)
The methodologies for estimating the fair value of financial assets and liabilities that are measured at fair value on a recurring or non-recurring basis are discussed above. For certain financial assets and liabilities, carrying value approximates fair value due to the nature of the financial instrument. These instruments include: cash and due from banks, federal funds sold, interest-bearing deposits at financial institutions, non-maturity deposits, and short-term borrowings. The Company used the following methods and assumptions in estimating the fair value of the following instruments:
Securities held to maturity:: The fair values are estimated using pricing models that consider certain observable market data, however, as most of the securities have limited or no trading activity and are not rated, the fair value is partially dependent upon unobservable inputs.
Loans/leases receivable: The fair values for all types of loans/leases are estimated using discounted cash flow analyses, using interest rates currently being offered for loans/leases with similar terms to borrowers with similar credit quality. The fair value of loans held for sale is based on quoted market prices of similar loans sold in the secondary market.
Deposits: The fair values disclosed for demand deposits equal their carrying amounts, which represent the amount payable on demand. Fair values for time deposits are estimated using a discounted cash flow calculation that applies interest rates currently being offered on time deposits to a schedule of aggregate expected monthly maturities on time deposits.
FHLB advances and junior subordinated debentures: The fair value of these instruments is estimated using discounted cash flow analyses, based on the Company's current incremental borrowing rates for similar types of borrowing arrangements.
Other borrowings: The fair value for the wholesale repurchase agreements and fixed rate other borrowings is estimated using rates currently available for debt with similar terms and remaining maturities. The fair value for variable rate other borrowings is equal to its carrying value.
Commitments to extend credit: The fair value of these commitments is not material.
Note 20.22. Business Segment Information
Selected financial and descriptive information is required to be disclosed for reportable operating segments, applying a “management perspective” as the basis for identifying reportable segments. The management perspective is determined by the view that management takes of the segments within the Company when making operating decisions, allocating resources, and measuring performance. The segments of QCR Holdings, Inc.the Company have been defined by the structure of the Company’s internal organization, focusing on the financial information that the Company’s operating decision-makers routinely use to make decisions about operating matters.
The Company’s primary segment, Commercial Banking, is geographically divided by markets into the secondary segments which are the three subsidiary banks wholly-owned by the Company: QCBT, CRBT, and RB&T. CRBT includes CNB’s operations from acquisition date (May 13, 2013) forward. Each of these secondary segments offer similar products and services, but are managed separately due to different pricing, product demand, and consumer markets. Each offers commercial, consumer, and mortgage loans and deposit services.
The Company’s Wealth Management segment represents trust and asset management and investment management and advisory services offered at the Company’s three subsidiary banks in aggregate. This segment generates income primarily from fees charged based on assets under administration for corporate and personal trusts, custodial services, and investments managed. No assets of the subsidiary banks have been allocated to the Wealth Management segment.
QCR Holdings, Inc. and Subsidiaries
Notes to Consolidated Financial Statements
Note 22. Business Segment Information (continued)
The Company’s All Other segment includes the corporate operations of the parent and operations of all other consolidated subsidiaries and/or defined operating segments that fall below the segment reporting thresholds. This segment includes the corporate operations of the parent and VPHC, which was dissolved and liquidated effective December 31, 2012.
Selected financial information on the Company's business segments, with all intercompany accounts and transactions eliminated, is presented as follows as of and for the years ended December 31, 2012, 2011,2014, 2013, and 2010:
| Commercial Banking | ||||||||||||||||||||||||||||
Quad City Bank & Trust | Cedar Rapids Bank & Trust | Rockford Bank & Trust | Wealth Management | All other | Intercompany Eliminations | Consolidated Total | ||||||||||||||||||||||
| Twelve Months Ended December 31, 2012 | ||||||||||||||||||||||||||||
| Total revenue | $ | 47,984,123 | $ | 26,697,921 | $ | 12,955,951 | $ | 5,993,437 | $ | 745,682 | $ | (379,946 | ) | $ | 93,997,168 | |||||||||||||
| Net interest income | 33,770,092 | 15,717,038 | 9,630,481 | - | (1,468,351 | ) | - | 57,649,260 | ||||||||||||||||||||
| Net income attributable to QCR Holdings, Inc. | 9,915,267 | 5,786,446 | 857,610 | 646,762 | (4,577,566 | ) | (10,752 | ) | 12,617,767 | |||||||||||||||||||
| Total assets | 1,177,294,502 | 625,713,218 | 313,824,607 | - | 14,906,904 | (38,008,739 | ) | 2,093,730,492 | ||||||||||||||||||||
| Provision for loan/lease losses | 1,527,767 | 1,275,000 | 1,568,000 | - | - | - | 4,370,767 | |||||||||||||||||||||
| Goodwill | 3,222,688 | - | - | - | - | - | 3,222,688 | |||||||||||||||||||||
| Twelve Months Ended December 31, 2011 | ||||||||||||||||||||||||||||
| Total revenue | $ | 47,952,867 | $ | 28,406,789 | $ | 13,518,534 | $ | 5,477,913 | $ | 228,900 | $ | (399,877 | ) | $ | 95,185,126 | |||||||||||||
| Net interest income | 30,831,946 | 15,856,555 | 9,085,293 | - | (1,628,938 | ) | - | 54,144,856 | ||||||||||||||||||||
| Net income attributable to QCR Holdings, Inc. | 8,176,665 | 5,154,769 | 329,251 | 789,159 | (4,733,869 | ) | (24,327 | ) | 9,691,648 | |||||||||||||||||||
| Total assets | 1,113,435,783 | 560,076,246 | 294,382,640 | - | 14,826,484 | (16,111,099 | ) | 1,966,610,054 | ||||||||||||||||||||
| Provision for loan/lease losses | 2,735,014 | 1,655,000 | 2,226,000 | - | - | - | 6,616,014 | |||||||||||||||||||||
| Goodwill | 3,222,688 | - | - | - | - | - | 3,222,688 | |||||||||||||||||||||
| Twelve Months Ended December 31, 2010 | ||||||||||||||||||||||||||||
| Total revenue | $ | 47,708,698 | $ | 29,221,682 | $ | 13,718,493 | $ | 5,103,747 | $ | 147,577 | $ | (396,943 | ) | $ | 95,503,254 | |||||||||||||
| Net interest income | 28,664,024 | 15,568,717 | 8,041,016 | - | (2,409,989 | ) | - | 49,863,768 | ||||||||||||||||||||
| Net income attributable to QCR Holdings, Inc. | 5,767,982 | 3,565,637 | 729,714 | 1,159,782 | (4,581,870 | ) | (54,566 | ) | 6,586,679 | |||||||||||||||||||
| Total assets | 1,025,699,414 | 546,789,724 | 271,378,714 | - | 11,622,441 | (18,855,077 | ) | 1,836,635,216 | ||||||||||||||||||||
| Provision for loan/lease losses | 2,457,618 | 4,200,000 | 806,000 | - | - | - | 7,463,618 | |||||||||||||||||||||
| Goodwill | 3,222,688 | - | - | - | - | - | 3,222,688 | |||||||||||||||||||||
Commercial Banking | ||||||||||||||||||||||||||||
Quad City | Cedar Rapids | Rockford | Wealth | Intercompany | Consolidated | |||||||||||||||||||||||
Bank & Trust | Bank & Trust | Bank & Trust | Management | All other | Eliminations | Total | ||||||||||||||||||||||
Twelve Months Ended December 31, 2014 | ||||||||||||||||||||||||||||
Total revenue | $ | 48,542,678 | $ | 35,683,917 | $ | 14,598,307 | $ | 8,513,322 | $ | 80,978 | $ | (456,646 | ) | $ | 106,962,556 | |||||||||||||
Net interest income | 36,539,635 | 24,215,815 | 10,261,615 | - | (1,945,937 | ) | - | 69,071,128 | ||||||||||||||||||||
Net income | 9,065,183 | 7,562,252 | 2,149,676 | 1,556,082 | (5,380,656 | ) | - | 14,952,537 | ||||||||||||||||||||
Total assets | 1,320,684,456 | 840,331,777 | 353,448,134 | - | 17,727,123 | (7,233,390 | ) | 2,524,958,100 | ||||||||||||||||||||
Provision for loan/lease losses | 3,800,667 | 1,855,333 | 1,151,000 | - | - | - | 6,807,000 | |||||||||||||||||||||
Goodwill | 3,222,688 | - | - | - | - | - | 3,222,688 | |||||||||||||||||||||
Core deposit intangible | - | 1,670,921 | - | - | - | - | 1,670,921 | |||||||||||||||||||||
Twelve Months Ended December 31, 2013 | ||||||||||||||||||||||||||||
Total revenue | $ | 48,742,635 | $ | 36,089,448 | $ | 13,809,593 | $ | 7,521,821 | $ | 1,924,329 | $ | (402,040 | ) | $ | 107,685,786 | |||||||||||||
Net interest income | 33,892,035 | 22,239,329 | 9,645,411 | - | (1,671,338 | ) | - | 64,105,437 | ||||||||||||||||||||
Net income | 9,310,779 | 7,953,230 | 1,855,672 | 1,379,402 | (5,560,838 | ) | - | 14,938,245 | ||||||||||||||||||||
Total assets | 1,245,128,136 | 804,223,453 | 339,375,139 | - | 22,394,401 | (16,168,205 | ) | 2,394,952,924 | ||||||||||||||||||||
Provision for loan/lease losses | 3,391,406 | 1,531,014 | 1,008,000 | - | - | - | 5,930,420 | |||||||||||||||||||||
Goodwill | 3,222,688 | - | - | - | - | - | 3,222,688 | |||||||||||||||||||||
Core deposit intangible | - | 1,870,433 | - | - | - | - | 1,870,433 | |||||||||||||||||||||
Twelve Months Ended December 31, 2012 | ||||||||||||||||||||||||||||
Total revenue | $ | 47,984,123 | $ | 26,697,921 | $ | 12,955,951 | $ | 5,993,437 | $ | 745,682 | $ | (379,946 | ) | $ | 93,997,168 | |||||||||||||
Net interest income | 33,770,092 | 15,717,038 | 9,630,481 | - | (1,468,351 | ) | - | 57,649,260 | ||||||||||||||||||||
Net income | 9,915,267 | 5,786,446 | 857,610 | 646,762 | (4,577,566 | ) | (10,752 | ) | 12,617,767 | |||||||||||||||||||
Total assets | 1,177,294,502 | 625,713,218 | 313,824,607 | - | 14,906,904 | (38,008,739 | ) | 2,093,730,492 | ||||||||||||||||||||
Provision for loan/lease losses | 1,527,767 | 1,275,000 | 1,568,000 | - | - | - | 4,370,767 | |||||||||||||||||||||
Goodwill | 3,222,688 | - | - | - | - | - | 3,222,688 | |||||||||||||||||||||
Note 21.23. Acquisition of 20% Noncontrolling Interest in m2 Lease Funds
On August 27, 2012, the Company’s largest subsidiary bank, QCBT, entered into an amendment to the operating agreement of m2 and purchased the remaining 20% noncontrolling interest in m2 for $4,501,442. The purchase price and related acquisition costs exceeded the book value by $2,133,417. This excess is reflected as a reduction in additional paid in capital.capital on the Company’s consolidated financial statements. The acquisition iswas structured in two payments with the initial payment of $1,653,755 made on September 11, 2012 and the final payment of $3,307,509 due in September 2015. QCBT calculated the present value of this future payment using a discount rate of 5% and recorded a resulting liability of $2,847,687. QCBT is accreting the discount of $459,822 using the effective yield method over the three year period to the final payment date. DuringAccretion totaled $155,716, $148,137 and $47,759 for the yearyears ended December 31, 2014, 2013 and 2012, accretion totaled $47,758, and, as a result, therespectively. The liability related to the final payment due totals $3,199,298, $3,043,582 and $2,895,445 at December 31, 2012.
In conjunction with the purchase agreement, the Company also entered into an agreement with the Chief Executive Officer and former 20% owner of m2, whereby he will be provided additional consideration equal to 20% of the earnings of m2 for the period from September 2012 through the earlier of August 2015 or his separation from service. The payment under this arrangement will also be due in September 2015. Because the payment is contingent upon future service, QCBT is accruing the liability and related compensation expense over the service period. As ofExpense totaled $701,634, $725,483 and $195,715 for the years ended December 31, 2014, 2013 and 2012, $195,715 has been accrued and expensedrespectively. The liability related to this obligation.future payment totaled $1,622,832, $921,198 and $195,715 at December 31, 2014, 2013 and 2012, respectively.
QCR Holdings, Inc. and Subsidiaries
Notes to Consolidated Financial Statements
Note 22.24. Sale of Credit Card Loan Receivables and Credit Card Issuing Operations for QCBT
On January 31, 2013, QCBT entered into an agreement to sell its credit card loan receivables totaling approximately $10,180,000.$10,179,318. This transaction closed on February 15, 2013 and resulted in a pre-tax gain net of expenses, of approximately $435,000.$495,405. As a part of the agreement, QCBT also agreed to sell its credit card issuing operations to the purchaser. The gain to be realizedrecognized on this transaction is wholly dependent upon successful re-contractingwas $355,268. QCBT incurred pre-tax expenses related to these transactions of QCBT’s agent bank customer base with the purchaser. The re-contracting period expires March 15, 2013 and the maximum$257,476, resulting in a net pre-tax gain expected to be realized is approximately $440,000.
Item 9. Changes in and Disagreements with Accountants on Accounting and Financial Disclosure
None.
Item 9A. Controls and Procedures
Evaluation of disclosure controls and procedures. An evaluation was performed under the supervision and with the participation of the Company’s management, including the Chief Executive Officer and Chief Financial Officer, of the effectiveness of the design and operation of the Company’s disclosure controls and procedures (as defined in Rule 13a-15(e) and 15d – 15(e) promulgated under the Exchange Act) as of December 31, 2012.2014. Based on that evaluation, the Company’s management, including the Chief Executive Officer and Chief Financial Officer, concluded that the Company’s disclosure controls and procedures were effective to ensure that information required to be disclosed in the reports filed and submitted under the Exchange Act waswas: (1) accumulated and communicated to our management, including the Chief Executive Officer and Chief Finance Officer, to allow for timely decisions regarding required disclosures; and (2) recorded, processed, summarized and reported as and when required.
Management’s Report on Internal Control over Financial Reporting.The Company’s management is responsible for establishing and maintaining adequate internal control over financial reporting (as defined in Rule 13a-15(f) and 15d-15(f) of the Exchange Act). Internal control over financial reporting includes controls and procedures designed to provide reasonable assurance regarding the reliability of financial reporting and the preparation of financial statements for external purposes in accordance with generally accepted accounting principles. Internal control over financial reporting includes those policies and procedures that: (1) pertain to the maintenance of records that, in reasonable detail, accurately and fairly reflect the transactions of the Company; (2) provide reasonable assurance that transactions are recorded as necessary to permit preparation of financial statements in accordance with generally accepted accounting principles, and that receipts and expenditures of the Company are being made only in accordance with authorizations of management and directors of the Company; and (3) provide reasonable assurance regarding prevention or timely detection of unauthorized acquisition, use or disposition of the Company’s assets that could have a material effect on the financial statements.
All internal control systems, no matter how well designed, have inherent limitations, including the possibility of human error and the circumvention of overriding controls. Accordingly, even effective internal control can provide only reasonable assurance with respect to financial statement preparation. Further, because of changes in conditions, the effectiveness of internal control may vary over time.
The Company’s management assessed the effectiveness of the Company’s internal control over financial reporting as of December 31, 2012.2014. Management’s assessment is based on the criteria established in theInternal Control — Integrated Framework issued by the Committee of Sponsoring Organizations of the Treadway Commission in 2013 and was designed to provide reasonable assurance that the Company maintained effective internal control over financial reporting as of December 31, 2012.2014. Based on this assessment, management believes that the Company maintained effective internal control over financial reporting as of December 31, 2012.2014.
McGladrey LLP, the Company’s independent registered public accounting firm has issued an attestation report on the Company’s internal control over financial reporting as of December 31, 2012,2014, which is included on the following pages of this Form 10-K.
To the Board of Directors and Stockholders
QCR Holdings, Inc.
We have audited QCR Holdings, Inc. and subsidiaries’ internal control over financial reporting as of December 31, 2012,2014, based on criteria established inInternal Control — Integrated Framework issued by the Committee of Sponsoring Organizations of the Treadway Commission.Commission in 2013. QCR Holdings, Inc. and subsidiaries’ management is responsible for maintaining effective internal control over financial reporting and for its assessment of the effectiveness of internal control over financial reporting included in the accompanying Management’s Report on Internal Control over Financial Reporting. Our responsibility is to express an opinion on the company's internal control over financial reporting based on our audit.
We conducted our audit in accordance with the standards of the Public Company Accounting Oversight Board (United States). Those standards require that we plan and perform the audit to obtain reasonable assurance about whether effective internal control over financial reporting was maintained in all material respects. Our audit included obtaining an understanding of internal control over financial reporting, assessing the risk that a material weakness exists, and testing and evaluating the design and operating effectiveness of internal control based on the assessed risk. Our audit also included performing such other procedures as we considered necessary in the circumstances. We believe that our audit provides a reasonable basis for our opinion.
A company's internal control over financial reporting is a process designed to provide reasonable assurance regarding the reliability of financial reporting and the preparation of financial statements for external purposes in accordance with generally accepted accounting principles. A company's internal control over financial reporting includes those policies and procedures that(a) pertain to the maintenance of records that, in reasonable detail, accurately and fairly reflect the transactions and dispositions of the assets of the company;(b) provide reasonable assurance that transactions are recorded as necessary to permit preparation of financial statements in accordance with generally accepted accounting principles, and that receipts and expenditures of the company are being made only in accordance with authorizations of management and directors of the company; and(c) provide reasonable assurance regarding prevention or timely detection of unauthorized acquisition, use, or disposition of the company's assets that could have a material effect on the financial statements.
Because of its inherent limitations, internal control over financial reporting may not prevent or detect misstatements. Also, projections of any evaluation of effectiveness to future periods are subject to the risk that controls may become inadequate because of changes in conditions, or that the degree of compliance with the policies or procedures may deteriorate.
We have also audited, in accordance with the standards of the Public Company Accounting Oversight Board (United States), the consolidated balance sheets of QCR Holdings, Inc. and subsidiaries as of December 31, 20122014 and 2011,2013, and the related consolidated statements of income, comprehensive income (loss), changes in stockholders’ equity and cash flows for each of the three years in the period ended December 31, 20122014 and our report dated March 11, 201312, 2015 expressed an unqualified opinion.

Davenport, Iowa
March 12, 2015
Changes in Internal Control Over Financial Reporting. There have been no significant changes to the Company’s internal control over financial reporting during the period covered by this report that have materially effected, or are reasonably likely to affect, the Company’s internal control over financial reporting. On May 14, 2013,
Item 9B. Other Information
None.
Part III
Item 10. Directors, Executive Officers and Corporate Governance
The information required by this item is set forth under the captions “Proposal 1: Election of Directors,” “Corporate Governance and the Board of Directors” and “Section 16(a) Beneficial Ownership Reporting Compliance” in the Company’s 20132015 Proxy Statement and is incorporated herein by reference.
Item 11. Executive Compensation
The information required by this item is set forth under the captions “Executive Compensation” and “Director Compensation” in the Company’s 20132015 Proxy Statement and is incorporated herein by reference.
Item 12. Security Ownership of Certain Beneficial Owners and Management and Related Stockholder Matters
The information required by this item is set forth under the captionscaption “Security Ownership of Certain Beneficial Owners” and “Equity Compensation Plan Information” in the Company’s 20132015 Proxy Statement and is incorporated herein by reference.
The table below sets forth the following information as of December 31, 2014 for (i) all compensation plans previously approved by the Company’s stockholders and (ii) all compensation plans not previously approved by the Company’s stockholders:
(a) | The number of securities to be issued upon the exercise of outstanding options, warrants, and rights; |
(b) | The weighted-average exercise price of such outstanding options, warrants, and rights; and |
(c) | Other than securities to be issued upon the exercise of such outstanding options, warrants, and rights, the number of securities remaining available for future issuance under the plans. |
EQUITY COMPENSATION PLAN INFORMATION | ||||
Plan category | Number of securities to be issued upon exercise of outstanding options, warrants, and rights | Weighted-average exercise price of outstanding options, warrants, and rights | Number of securities remaining available for future issuance under equity compensation plans (excluding securities reflected in column (a)) | |
(a) | (b) | (c) | ||
Equity compensation plans approved by stockholders | 667,450 | $13.90 | 416,629 | (1) |
Equity compensation plans not approved by stockholders | - | - | - | |
Total | 667,450 | $13.82 | 416,629 | (1) |
(1) | Includes 230,040 shares available under the QCR Holdings, Inc. Employee Stock Purchase Plan. |
Item 13. Certain Relationships and Related Transactions, and Director Independence
The information required by this item is set forth under the captions “Corporate Governance and the Board of Directors” and “Transactions with Management and Directors” in the Company’s 20132015 Proxy Statement and is incorporated herein by reference.
Item 14. Principal Accountant Fees and Services
The information required by this item is set forth under the caption “Proposal 6:4: Ratification of Selection of Independent Registered Public Accounting Firm” in the Company’s 20132015 Proxy Statement and is incorporated herein by reference.
Part IV
Item 15.Exhibits and Financial Statement Schedules
(a) | 1. Financial Statements |
These documents are listed in the Index to Consolidated Financial Statements under Item 8.
(a) | 2. Financial Statement Schedules |
Financial statement schedules are omitted, as they are not required or are not applicable, or the required information is shown in the consolidated financial statements and the accompanying notes thereto.
(a) | 3. Exhibits |
The following exhibits are either filed as a part of this Annual Report on Form 10-K or are incorporated herein by reference:
| Exhibit Number | Exhibit Description | |||||||||||||
3.1 | Certificate of Incorporation of QCR Holdings, Inc., as amended (incorporated by reference to Exhibit 3.1 of the Registrant’s Quarterly Report on Form 10-Q/A Amendment No. 1 for the period ended September 30, 2011). | |||||||||||||
3.2 | Bylaws of QCR Holdings, Inc. (incorporated by reference to Exhibit 3.1 of the Registrant’s Form 8-K dated May 18, 2010). | |||||||||||||
| 4.1 | ||||||||||||||
| 4.2 | ||||||||||||||
| | ||||||||||||||
10.1 | Employment Agreement between QCR Holdings, Inc., Quad City Bank and Trust Company and Douglas M. Hultquist dated January 1, 2004 (incorporated by reference to Exhibit 10.2 of Registrant’s Annual Report on Form 10-K for the year ended December 31, 2003). | |||||||||||||
10.2 | Employment Agreement between Cedar Rapids Bank and Trust Company and Larry J. Helling dated January 1, 2004 (incorporated by reference to Exhibit 10.6 of Registrant’s Annual Report on Form 10-K for the year ended December 31, 2003). | |||||||||||||
10.3 | Employment Agreement between QCR Holdings, Inc. and Todd A. Gipple dated January 1, 2004 (incorporated by reference to Exhibit 10.11 of Registrant’s Annual Report on Form 10-K for the year ended December 31, 2003). | |||||||||||||
10.4 | QCR Holdings, Inc. Employee Stock Purchase Plan (incorporated by reference to Exhibit 10.1 of Registrant’s Form S-8, file No. 333-101356 dated November 20, 2002). | |||||||||||||
10.5 | Dividend Reinvestment Plan of QCR Holdings, Inc. (incorporated by reference to Exhibit 99.1 of Registrant’s Form S-3D, File No. 333-102699 dated January 24, 2003). | |||||||||||||
| Second Amended and Restated Operating Agreement between Quad City Bank and Trust Company and John Engelbrecht dated August 26, 2005 (incorporated by reference to Exhibit 10.2 of Registrant’s Quarterly Report on Form 10-Q for the quarter ended September 30, 2005). | ||
| | ||
10.7 | First Amendment to the Employment Agreement among QCR Holdings, Inc., Quad City Bank and Trust Company and Douglas M. Hultquist dated December 27, 2008 (incorporated by reference to Exhibit 10.19 of the Registrant’s Annual Report on Form 10-K for the year ended December 31, 2008). | |
10.8 | First Amendment to the Employment Agreement between Cedar Rapids Bank and Trust | |
10.9 | First Amendment to the Employment Agreement between QCR Holdings, Inc. and Todd A. Gipple dated December 30, 2008 (incorporated by reference to Exhibit 10.21 of the Registrant’s Annual Report on Form 10-K for the year ended December 31, 2008). | |
10.10 | Executive Deferred Compensation Plan of QCR Holdings, Inc. (incorporated by reference to Exhibit 10.22 of the Registrant’s Annual Report on Form 10-K for the year ended December 31, 2008). | |
10.11 | Amended and Restated Executive Deferred Compensation Plan Participation Agreement among QCR Holdings, Inc., Quad City Bank and Trust Company and Douglas M. Hultquist dated | |
10.12 | Amended and Restated Executive Deferred Compensation Plan Participation Agreement between Cedar Rapids Bank and Trust Company and Larry J. Helling dated | |
10.13 | Amended and Restated Executive Deferred Compensation Plan Participation Agreement between QCR Holdings, Inc. and Todd A. Gipple dated | |
10.14 | Amended and Restated Non-Qualified Supplemental Executive Retirement Plan of QCR Holdings, Inc. (incorporated by reference to Exhibit 10.27 of the Registrant’s Annual Report on Form 10-K for the year ended December 31, 2008). | |
10.15 | Non-Qualified Supplemental Executive Retirement Plan Joinder Agreement among QCR Holdings, Inc., Quad City Bank and Trust Company and Douglas M. Hultquist dated December 31, 2008 (incorporated by reference to Exhibit 10.28 of the Registrant’s Annual Report on Form 10-K for the year ended December 31, 2008). |
10.16 | ||
Non-Qualified Supplemental Executive Retirement Plan Joinder Agreement between Cedar Rapids Bank and Trust Company and Larry J. Helling dated December 31, 2008 (incorporated by reference to Exhibit 10.29 of the Registrant’s Annual Report on Form 10-K for the year ended December 31, 2008). | ||
10.17 | Non-Qualified Supplemental Executive Retirement Plan Joinder Agreement between QCR Holdings, Inc. and Todd A. Gipple dated December 31, 2008 (incorporated by reference to Exhibit 10.30 of the Registrant’s Annual Report on Form 10-K for the year ended December 31, 2008). | |
10.18 | Non-Qualified Supplemental Executive Retirement Plan Joinder Agreement among QCR Holdings, Inc., Quad City Bank and Trust Company and Michael A. Bauer dated December 31, 2008 (incorporated by reference to Exhibit 10.31 of the Registrant’s Annual Report on Form 10-K for the year ended December 31, 2008). | |
10.19 | ||
Amended and Restated Employee Stock Purchase Plan (incorporated by reference to Appendix A to the Registrant’s Definitive Proxy Statement on Schedule 14A dated March 21, 2012). | ||
10.20 | Amendment No. 1 to the Second Amended and Restated Operating Agreement between Quad City Bank and Trust Company and John Engelbrecht, dated August 26, 2012 (incorporated by reference to Exhibit 10.1 to the Registrant’s Quarterly Report on Form 10-Q for the quarter ended September 30, 2012). | |
10.21 | Agreement and Plan of Merger among QCR Holdings, Inc., QCR Acquisition, LLC and Community National Bancorporation, dated February 13, 2013 (incorporated by reference to Exhibit 2.1 of the Registrant’s Form 8-K dated February 14, 2013). | |
10.22 | QCR Holdings, Inc. 2013 Equity Incentive Plan (incorporated by reference to Appendix A to the Registrant’s Definitive Proxy Statement on Schedule 14A dated March 20, 2013). | |
| 10.23 | Form of Participation Agreement under the QCR Holdings, Inc. Executive Deferred Compensation Plan (exhibit is being filed herewith). | |
| First Amendment to the Employment Agreement between Quad City Bank and Trust Company and John Anderson dated December 18, 2012 (exhibit is being filed herewith). | ||
| 10.26 | Employment Agreement between Rockford Bank and Trust Company and Thomas Budd dated December 30, 2008 (exhibit is being filed herewith). | |
| 10.27 | First Amendment to the Employment Agreement between Rockford Bank and Trust Company and Thomas Budd dated December 30, 2008 (exhibit is being filed herewith). | |
| 10.28 | Employment Agreement between QCR Holdings, Inc. and Cathie Whiteside dated August 27, 2007 (exhibit is being filed herewith). | |
| 10.29 | First Amendment to the Employment Agreement between QCR Holdings, Inc. and Cathie Whiteside dated December 28, 2008 (exhibit is being filed herewith). | |
21.1 | Subsidiaries of QCR Holdings, Inc. (exhibit is being filed herewith). | |
23.1 | Consent of Independent Registered Public Accounting Firm — McGladrey LLP (exhibit is being filed herewith). | |
31.1 | Certification of Chief Executive Officer Pursuant to Rule 13a-14(a)/15d-14(a) (exhibit is being filed herewith). | |
31.2 | Certification of Chief Financial Officer Pursuant to Rule 13a-14(a)/15d-14(a) (exhibit is being filed herewith). |
32.1 | ||
Certification of Chief Executive Officer Pursuant to 18 U.S.C. Section 1350, as Adopted Pursuant to Section 906 of the Sarbanes-Oxley Act of 2002 (exhibit is being filed herewith). | ||
32.2 | Certification of Chief Financial Officer Pursuant to 18 U.S.C. Section 1350, as Adopted Pursuant to Section 906 of the Sarbanes-Oxley Act of 2002 (exhibit is being filed herewith). | |
101 | Interactive Data File Interactive data files pursuant to Rule 405 of Regulation S-T: (i) Consolidated Balance Sheets at December 31, |
SIGNATURES
Pursuant to the requirements of Section 13 or 15(d) of the Securities Exchange Act of 1934, the Registrant has duly caused this report to be signed on its behalf by the undersigned, thereunto duly authorized.
QCR HOLDINGS, INC. | |||
Dated: March | By: | /s/ Douglas M. Hultquist | |
Douglas M. Hultquist | |||
President and Chief Executive Officer | |||
Dated: March | By | /s/ | |
| Todd A. Gipple | |||
Todd A. Gipple | |||
Executive Vice President, Chief Operating Officer and | |||
Chief Financial Officer | |||
Dated: March 12, 2015 | By | ||
Elizabeth A. Grabin | |||
Vice President and Controller | |||
Principal Accounting Officer | |||
SIGNATURES
Pursuant to the requirements of the Securities and Exchange Act of 1934, this report has been signed by the following persons on behalf of the Registrant in the capacities and on the dates indicated.
Signature | Title | Date | ||
/s/ James J. Brownson | Chairman of the Board of Directors | March 12, 2015 | ||
James J. Brownson | ||||
/s/ | President, Chief Executive | March 12, 2015 | ||
Douglas M. Hultquist | Officer and Director | |||
/s/ Pat S. Baird | Director | March 12, 2015 | ||
Pat S. Baird | ||||
/s/ Lindsay Y. Corby | Director | March 12, 2015 | ||
Lindsay Y. Corby | ||||
/s/ Todd A. Gipple | Executive Vice President, Chief | March 12, 2015 | ||
Todd A. Gipple | Operating Officer, Chief Financial | |||
| Officer and Director | ||||
/s/ Larry J. Helling | Director | March | ||
Larry J. Helling | ||||
/s/ Mark C. Kilmer | Director | March | ||
Mark C. Kilmer | ||||
/s/ Linda K. Neuman | Director | March 12, 2015 | ||
Linda K. Neuman | ||||
/s/ Michael L. Peterson | Director | March 12, 2015 | ||
Michael L. Peterson | ||||
| /s/ Ronald G. Peterson | Director | March | ||
| Ronald G. Peterson | ||||
| /s/ George T. Ralph III | Director | March 12, 2015 | ||
| George T. Ralph III | ||||
| /s/ Donna J. Sorensen, J.D. | Director | March | ||
| Donna J. Sorensen, J.D. | ||||
| /s/ Marie Z. Ziegler | Director | March | ||
| Marie Z. Ziegler |
Appendix A
APPENDIX A
General
Financial institutions, their holding companies and their affiliates are extensively regulated under federal and state law. As a result, the growth and earnings performance of the Company may be affected not only by management decisions and general economic conditions, but also by the requirements of federal and state statutes and by the regulations and policies of various bank regulatory authorities,agencies, including the Iowa Superintendent of Banking (the “Iowa Superintendent”), the Illinois Department of Financial and Professional Regulation (the “DFPR”), the Board of Governors of the Federal Reserve System (the “Federal Reserve”), the Federal Deposit Insurance Corporation (the “FDIC”) and the newly-created Bureau of Consumer Financial Protection (the “CFPB”). Furthermore, taxation laws administered by the Internal Revenue Service and state taxing authorities, accounting rules developed by the Financial Accounting Standards Board, (the “FASB”) and securities laws administered by the Securities and Exchange Commission (the “SEC”) and state securities authorities, and anti-money laundering laws enforced by the U.S. Department of the Treasury (the “Treasury”) have an impact on the business of the Company. The effect of these statutes, regulations, regulatory policies and accounting rules are significant to the operations and results of the Company and its subsidiary Banks,banks, and the nature and extent of future legislative, regulatory or other changes affecting financial institutions are impossible to predict with any certainty.
Federal and state banking laws impose a comprehensive system of supervision, regulation and enforcement on the operations of financial institutions, their holding companies and affiliates that is intended primarily for the protection of the FDIC-insured deposits and depositors of banks, rather than stockholders. These federal and state laws, and the regulations of the bank regulatory authoritiesagencies issued under them, affect, among other things, the scope of business, the kinds and amounts of investments banks may make, reserve requirements, capital levels relative to operations, the nature and amount of collateral for loans, the establishment of branches, the ability to merge, consolidate and acquire, dealings with insiders and affiliates and the payment of dividends. Moreover, turmoil in the credit markets in recent yearsas a result of the global financial crisis prompted the enactment of unprecedented legislation that has allowed the U.S. Department of the Treasury (the “Treasury”) to make equity capital available to qualifying financial institutions to help restore confidence and stability in the U.S. financial markets, which imposesimposing additional requirements on institutions in which the Treasury invests.
This supervisory and its subsidiary Banks are also subjectregulatory framework subjects banks and bank holding companies to regular examination by their respective regulatory authorities,agencies, which results in examination reports and ratings that are not publicly available and that can impact the conduct and growth of their business. These examinations consider not only compliance with applicable laws and regulations, but also capital levels, asset quality and risk, management ability and performance, earnings, liquidity, and various other factors. The regulatory agencies generally have broad discretion to impose restrictions and limitations on the operations of a regulated entity where the agencies determine, among other things, that such operations are unsafe or unsound, fail to comply with applicable law or are otherwise inconsistent with laws and regulations or with the supervisory policies of these agencies.
The following is a summary of the material elements of the supervisory and regulatory framework applicable to the Company and its subsidiaries. It does not describe all of the statutes, regulations and regulatory policies that apply, nor does it restate all of the requirements of those that are described. The descriptions are qualified in their entirety by reference to the particular statutory orand regulatory provision.
Financial Regulatory Reform
On July 21, 2010, President Obama signed the Dodd-Frank Wall Street Reform and Consumer Protection Act (the “Dodd-Frank Act”) into law. The Dodd-Frank Act representsrepresented a sweeping reform of the U.S. supervisory and regulatory framework applicable to financial institutions and capital markets in the United States,wake of the global financial crisis, certain aspects of which are described below in more detail. The Dodd-Frank Act creates new federal governmental entities responsible for overseeing different aspects of the U.S. financial services industry, including identifying emerging systemic risks. It also shifts certain authorities and responsibilities among federal financial institution regulators, including the supervision of holding company affiliates and the regulation of consumer financial services and products. In particular, and among other things, the Dodd-Frank Act: createscreated a Financial Stability Oversight Council as part of a regulatory structure for identifying emerging systemic risks and improving interagency cooperation; created the CFPB, which is authorized to regulate providers of consumer credit, savings, payment and other consumer financial products and services; narrowsnarrowed the scope of federal preemption of state consumer laws enjoyed by national banks and federal savings associations and expandsexpanded the authority of state attorneys general to bring actions to enforce federal consumer protection legislation; imposesimposed more stringent capital requirements on bank holding companies and subjectssubjected certain activities, including interstate mergers and acquisitions, to heightened capital conditions; with respect to mortgage lending, (i) significantly expands underwritingexpanded requirements applicable to loans secured by 1-4 family residential real property; restricts the interchange fees payableproperty, (ii) imposed strict rules on debit card transactions for issuers with $10 billion in assets or greater; requiresmortgage servicing, and (iii) required the originator of a securitized loan, or the sponsor of a securitization, to retain at least 5% of the credit risk of securitized exposures unless the underlying exposures are qualified residential mortgages or meet certain underwriting standardsstandards; repealed the prohibition on the payment of interest on business checking accounts; restricted the interchange fees payable on debit card transactions for issuers with $10 billion in assets or greater; in the so-called “Volcker Rule,” subject to be determined by regulation; creates a Financial Stability Oversight Council as partnumerous exceptions, prohibited depository institutions and affiliates from certain investments in, and sponsorship of, a regulatory structure for identifying emerging systemic riskshedge funds and improving interagency cooperation; providesprivate equity funds and from engaging in proprietary trading; provided for enhanced regulation of advisers to private funds and of the derivatives markets; enhancesenhanced oversight of credit rating agencies; and prohibitsprohibited banking agency requirements tied to credit ratings. These statutory changes shifted the regulatory framework for financial institutions, impacted the way in which they do business and have the potential to constrain revenues.
Numerous provisions of the Dodd-Frank Act arewere required to be implemented through rulemaking by the appropriate federal regulatory agencies. Many of the required regulations have been issued and others have been released for public comment, but there remain a number that haveare not yet to be released in any form. Furthermore, whilefinal. Although the reforms primarily targettargeted systemically important financial service providers, their influence is expected to filter down in varying degrees to smaller institutions over time. Management of the Company and its three subsidiary banks (the “Banks”) will continue to evaluate the effect of the changes;Dodd-Frank Act; however, in many respects, the ultimate impact of the Dodd-Frank Act will not be fully known for years, and no current assurance may be given that the Dodd-Frank Act, or any other new legislative changes, will not have a negative impact on the results of operations and financial condition of the Company and its subsidiaries.
The Increasing Regulatory Emphasis on Capital
Regulatory capital represents the net assets of a financial institution available to various regulatoryabsorb losses. Because of the risks attendant to their business, depository institutions are generally required to hold more capital requirements administered by the federal and state banking regulators noted above. Failure to meet regulatory capital requirements may result in certain mandatory and possible additional discretionary actions by regulators that, if undertaken, could have a direct material effect on our financial statements. Under capital adequacy guidelines and the regulatory framework for “prompt corrective action” (described below), the Company must meet specific capital guidelines that involve quantitative measures of our assets, liabilities and certain off-balance sheet items as calculated under regulatory accounting policies. Our capital amounts and classifications are also subject to judgments by the regulators regarding qualitative components, risk weightings andthan other factors.
Company and BankRequired Capital Levels. Bank holding companies have historically had to comply with less stringent capital standards than their bank subsidiaries and werehave been able to raise capital with hybrid instruments such as trust preferred securities. The Dodd-Frank Act mandated the Federal Reserve to establish minimum capital levels for bank holding companies on a consolidated basis that are as stringent as those required for insured depository institutions. As a consequence, over a phase-in period of three years, the components of holding company permanent capital known as “Tier 1 capital” are beingCapital” were restricted to those capital instruments that are considered to be Tier 1 capitalCapital for insured depository institutions. A result of this change is that the proceeds of hybrid instruments, such as trust preferred securities, are being excluded from Tier 1 capital unlessCapital over a phase-out period. However, if such securities were issued prior to May 19, 2010 by bank holding companies with less than $15 billion of assets.assets as of December 31, 2009, they may be retained as Tier I Capital subject to certain restrictions. Because the Company hashad assets of less than $15 billion, it iswas able to meet the requirements and maintain its trust preferred proceeds as Tier 1 capitalCapital but will have to comply with newthe revised capital mandates in other respects and will not be able to raise Tier 1 capitalCapital in the future through the issuance of trust preferred securities. In addition, the Basel III proposal, discussed below, includes a phase-out of trust preferred securities for all bank holding companies, including the Company.
The Company owns three subsidiary banks (collectively, the “Banks”): Quad City Bank and Trust Company (“QCBT”), Cedar Rapids Bank and Trust Company (“CRBT”), and Rockford Bank and Trust Company (“RB&T”). Under current federal regulations, the Banks are subject to, and, after the phase-in period, the Company will be subject to, the following minimum capital standards:
● | A leverage requirement, consisting of a minimum ratio of Tier 1 |
● | A risk-based capital requirement, consisting of a minimum ratio of |
For these purposes, “Tier 1 Capital” consisted primarily of common stock, noncumulative perpetual preferred stock and related surplus less intangible assets (other than certain loan servicing rights and purchased credit card relationships). “Total Capital” consisted primarily of Tier 1 Capital plus “Tier 2 Capital,” which included other non-permanent capital items, such as certain other debt and equity instruments that do not qualify as Tier 1 Capital, and a portion of each Bank’s allowance for loan and lease losses. Further, risk-weighted assets for the purpose of the risk-weighted ratio calculations were balance sheet assets and off-balance sheet exposures to which required risk weightings of 0% to 100% were applied.
The capital standards described above areminimum requirements. Federal requirements and were increased beginning January 1, 2015 under Basel III, as discussed below. Bank regulatory agencies uniformly encourage banks and bank holding companies to be “well-capitalized” and, to that end, federal law and regulations provide various incentives for banking organizations to maintain regulatory capital at levels in excess of minimum regulatory requirements. For example, a banking organization that is “well-capitalized” may: (i) qualify for exemptions from prior notice or application requirements otherwise applicable to certain types of activities; (ii) qualify for expedited processing of other required notices or applications; and (iii) accept, roll-over or renew brokered deposits. Under the capital regulations of the FDIC and Federal Reserve, in order to be “well-capitalized,” a banking organization, for the year ended December 31, 2014, must maintain a ratio of total capital to total risk-weighted assets of 10% or greater, a ratio of Tier 1 capitalhave maintained:
● | A leverage ratio of Tier 1 Capital to total assets of 5% or greater, |
● | A ratio of Tier 1 Capital to total risk-weighted assets of 6% or greater, and |
● | A ratio of Total Capital to total risk-weighted assets of 10% or greater. |
The FDIC and a ratio of Tier 1 capital to total assets of 5% or greater. The Federal Reserve’sReserve guidelines also provide that banks and bank holding companies experiencing internal growth or making acquisitions willwould be expected to maintain strong capital positions substantially above the minimum supervisory levels without significant reliance on intangible assets. Furthermore, the guidelines indicate that the Federal Reserveagencies will continue to consider a “tangible tierTier 1 leverage ratio” (deducting all intangibles) in evaluating proposals for expansion or to engage in new activity.
Higher capital levels maycould also be required if warranted by the particular circumstances or risk profilesprofile of individual banking organizations. For example, the Federal Reserve’s capital guidelines contemplate that additional capital may be required to take adequate account of, among other things, interest rate risk, or the risks posed by concentrations of credit, nontraditional activities or securities trading activities. Further, any banking organization experiencing or anticipating significant growth would be expected to maintain capital ratios, including tangible capital positions (i.e., Tier 1 capitalCapital less all intangible assets), well above the minimum levels.
Prompt Corrective Action. Action.A banking organization’s capital plays an important role in connection with regulatory enforcement as well. Federal law provides the federal banking regulators with broad power to take prompt corrective action to resolve the problems of undercapitalized institutions. The extent of the regulators’ powers depends on whether the institution in question is “adequately capitalized,” “undercapitalized,” “significantly undercapitalized” or “critically undercapitalized,” in each case as defined by regulation. Depending upon the capital category to which an institution is assigned, the regulators’ corrective powers include: (i) requiring the institution to submit a capital restoration plan; (ii) limiting the institution’s asset growth and restricting its activities; (iii) requiring the institution to issue additional capital stock (including additional voting stock) or to be acquired;sell itself; (iv) restricting transactions between the institution and its affiliates; (v) restricting the interest rate that the institution may pay on deposits; (vi) ordering a new election of directors of the institution; (vii) requiring that senior executive officers or directors be dismissed; (viii) prohibiting the institution from accepting deposits from correspondent banks; (ix) requiring the institution to divest certain subsidiaries; (x) prohibiting the payment of principal or interest on subordinated debt; and (xi) ultimately, appointing a receiver for the institution.
As of December 31, 2012:2014: (i) none of the Banks was subject to a directive from the Federal Reserve to increase its capital to an amount in excess of the minimum regulatory capital requirements; (ii) each Bank exceeded its minimum regulatory capital requirements under Federal Reserve capital adequacy guidelines; and (iii)(ii) each Bank was “well-capitalized,” as defined by Federal Reserve regulations. As of December 31, 2012,2014, the Company had regulatory capital in excess of the Federal Reserve’s requirements and met the Dodd-Frank capitalAct requirements.
The Basel III.International Capital Accords. The current risk-based capital guidelines described above which apply to the Banks and are being phased in for the Company, are based upon the 1988 capital accord known as “Basel I” adopted by the international Basel Committee on Banking Supervision, a committee of central banks and bank supervisors, as implemented by the U.S. federal banking regulators on an interagency basis. In 2008, the banking agencies collaboratively began to phase-in capital standards based on a second capital accord, referred to as “Basel II,” for large or “core” international banks (generally defined for U.S. purposes as having total assets of $250 billion or more, or consolidated foreign exposures of $10 billion or more). Basel II emphasized internal assessment of credit, market and operational risk, as well as supervisory assessment and market discipline in determining minimum capital requirements.
On September 12, 2010, the Group of Governors and Heads of Supervision, the oversight body of the Basel Committee on Banking Supervision, announced agreement on a strengthened set of capital requirements for banking organizations around the world, known as Basel III, to address deficiencies recognized in connection with the global financial crisis. Basel III requires, among other things:
U.S. Implementation of Basel III. In July of 2013, the U.S. federal banking agencies approved the implementation of the Basel III regulatory capital reforms in pertinent part, and, at the same time, promulgated rules effecting certain changes required by the Dodd-Frank Act (the “Basel III Rule”). In contrast to capital requirements previously, which were in the form of guidelines, Basel III was released in the form of regulations by each of the federal regulatory agencies. The Basel III Rule is applicable to all financial institutions that are subject to minimum capital requirements, including federal and state banks and savings and loan associations, as well as to bank and savings and loan holding companies other than “small bank holding companies” (generally bank holding companies with consolidated assets of less than $1 billion).
The Basel III Rule not only increased most of the required minimum capital ratios as of January 1, 2015, but it introduced the concept of “Common Equity Tier 1 Capital,” which consists primarily of common stock, related surplus (net of treasury stock), retained earnings, and Common Equity Tier 1 minority interests, subject to certain regulatory adjustments. The Basel III Rule also established more stringent criteria for instruments to be considered “Additional Tier 1 Capital” (Tier 1 Capital in addition to Common Equity) and Tier 2 Capital. A number of instruments that qualified as Tier 1 Capital will not qualify, or their qualifications will change. For example, cumulative preferred stock and certain hybrid capital instruments, including trust preferred securities, will no longer qualify as Tier 1 Capital of any kind, with the exception, subject to certain restrictions, of such instruments issued before May 10, 2010, by bank holding companies with total consolidated assets of less than $15 billion as of December 31, 2009. For those institutions, trust preferred securities and other nonqualifying capital instruments currently included in consolidated Tier 1 Capital were permanently grandfathered under the Basel III Rule, subject to certain restrictions. Noncumulative perpetual preferred stock, which formerly qualified as simple Tier 1 Capital, will not qualify as Common Equity Tier 1 Capital, but will instead qualify as Additional Tier 1 Capital. The Basel III Rule also constrained the inclusion of minority interests, mortgage-servicing assets, and deferred tax assets in capital and requires deductions from Common Equity Tier 1 Capital in the event that such assets exceed a certain percentage of a banking institution’s Common Equity Tier 1 Capital.
As of January 1, 2015, the Basel III Rule requires:
● | A new |
● | An increase in the minimum required amount of Tier 1 |
● | A continuation of the current minimum required amount of |
● | A minimum leverage ratio of Tier 1Capital to total assets equal to 4% in all circumstances. |
The Basel III Rule maintained the general structure of the prompt corrective action framework, while incorporating the increased requirements and adding the Common Equity Tier 1 Capital ratio. In order to be “well-capitalized” under the new regime, a depository institution must maintain a Common Equity Tier 1 Capital ratio of 6.5% or more; a Tier 1 Capital ratio of 8% or more; a Total Capital ratio of 10% or more; and a leverage ratio of 5% or more.
In addition, institutions that seek the freedom to make capital distributions (including for dividends and repurchases of stock) and pay discretionary bonuses to executive officers without restriction must also maintain 2.5% of risk-weighted assets in common equityCommon Equity Tier 1 attributable to a capital conservation buffer to be phased in over three years.years beginning in 2016. The purpose of the conservation buffer is to ensure that banksbanking institutions maintain a buffer of capital that can be used to absorb losses during periods of financial and economic stress. Factoring in the fully phased-in conservation buffer increases the minimum ratios depicted above to 7% for common equity,Common Equity Tier 1, 8.5% for Tier 1 capitalCapital and 10.5% for total capital.
As discussed above, most of the Comptrollercapital requirements are based on a ratio of the Currency, the Federal Reserve and the FDIC) (the “Agencies”) formally proposed for comment, in three separate but related proposals, rulesspecific types of capital to implement“risk-weighted assets.” Not only did Basel III inchange the United States. The proposals are: (i) the “Basel III Proposal,” which applies the Basel III capital framework to almost all U.S. banking organizations; (ii) the “Standardized Approach Proposal,” which applies certain elementscomponents and requirements of the Basel II standardized approach for credit risk weightings to almost all U.S. banking organizations; and (iii) the “Advanced Approaches Proposal,” which applies changes made to Basel II and Basel III in the past few years to large U.S. banking organizations subject to the advanced Basel II capital framework. The comment period for these notices of proposed rulemaking ended October 22, 2012.
Furthermore, there iswas significant concern noted by the financial industry in connection with the Basel III rulemaking as to the proposed treatment of accumulated other comprehensive income (“AOCI”). The proposed treatment of AOCI would requireBasel III requires unrealized gains and losses on available-for-sale securities to flow through to regulatory capital as opposed to the currentprevious treatment, which neutralizesneutralized such effects. There is concern that this treatment would introduce capital volatility, due not only to credit risk but also to interest rate risk, and affectRecognizing the composition of firms’ securities holdings.
Banking institutions (except for the proposed Basel III rules has been delayed and it is unclear whenlarge, internationally active financial institutions) became subject to the Basel III regime, as it may be implemented by final rules, will become effectiveRule on January 1, 2015, and both the Company and its subsidiary Banks are currently in compliance with the United States.
The Company
General.The Company, as the sole stockholder of each of the Banks, is a bank holding company. As a bank holding company, the Company is registered with, and is subject to regulation by, the Federal Reserve under the Bank Holding Company Act of 1956, as amended (the “BHCA”). In accordance with Federal Reserve policy, and as now codified by the Dodd-Frank Act, the Company is legally obligated to act as a source of financial strength to the Banks and to commit resources to support the Banks in circumstances where the Company might not otherwise do so. Under the BHCA, the Company is subject to periodic examination by the Federal Reserve. The Company is also required to file with the Federal Reserve periodic reports of the Company’s operations and such additional information regarding the Company and its subsidiaries as the Federal Reserve may require.
Acquisitions, Activities and Change in Control.. The primary purpose of a bank holding company is to control and manage banks. Thebanks.The BHCA generally requires the prior approval of the Federal Reserve for any merger involving a bank holding company or any acquisition by a bank holding company of another bank or bank holding company. Subject to certain conditions (including deposit concentration limits established by the BHCA and the Dodd-Frank Act), the Federal Reserve may allow a bank holding company to acquire banks located in any state of the United States.U.S. In approving interstate acquisitions, the Federal Reserve is required to give effect to applicable state law limitations on the aggregate amount of deposits that may be held by the acquiring bank holding company and its insured depository institution affiliates in the state in which the target bank is located (provided that those limits do not discriminate against out-of-state depository institutions or their holding companies) and state laws that require that the target bank have been in existence for a minimum period of time (not to exceed five years) before being acquired by an out-of-state bank holding company. Furthermore, in accordance with the Dodd-Frank Act, bank holding companies must be well-capitalized and well-managed in order to effect interstate mergers or acquisitions. For a discussion of the capital requirements, see “—The“The Increasing Regulatory Emphasis on Capital” above.
The BHCA generally prohibits the Company from acquiring direct or indirect ownership or control of more than 5% of the voting shares of any company that is not a bank and from engaging in any business other than that of banking, managing and controlling banks or furnishing services to banks and their subsidiaries. This general prohibition is subject to a number of exceptions. The principal exception allows bank holding companies to engage in, and to own shares of companies engaged in, certain businesses found by the Federal Reserve prior to November 11, 1999 to be “so closely related to banking ... as to be a proper incident thereto.” This authority would permit the Company to engage in a variety of banking-related businesses, including the ownership and operation of a savings association, or any entity engaged in consumer finance, equipment leasing, the operation of a computer service bureau (including software development) and mortgage banking and brokerage. The BHCA generally does not place territorial restrictions on the domestic activities of non-banknonbank subsidiaries of bank holding companies.
Additionally, bank holding companies that meet certain eligibility requirements prescribed by the BHCA and elect to operate as financial holding companies may engage in, or own shares in companies engaged in, a wider range of nonbanking activities, including securities and insurance underwriting and sales, merchant banking and any other activity that the Federal Reserve, in consultation with the Secretary of the Treasury, determines by regulation or order is financial in nature or incidental to any such financial activity or that the Federal Reserve determines by order to be complementary to any such financial activity and does not pose a substantial risk to the safety or soundness of depository institutions or the financial system generally. As of the date of this filing, theThe Company hasdoes not elected tocurrently operate as a financial holding company.
Federal law also prohibits any person or company from acquiring “control” of an FDIC-insured depository institution or its holding company without prior notice to the appropriate federal bank regulator. “Control” is conclusively presumed to exist upon the acquisition of 25% or more of the outstanding voting securities of a bank or bank holding company, but may arise under certain circumstances between 10% and 24.99% ownership.
Capital Requirements. Requirements.Bank holding companies are required to maintain minimum levels of capital in accordance with Federal Reserve capital adequacy guidelines,requirements, as affected by the Dodd-Frank Act and Basel III. For a discussion of capital requirements, see “—The Increasing Regulatory Emphasis on Capital” above. If capital levels fall below the minimum required levels, a bank holding company, among other things, may be denied approval to acquire or establish additional banks or non-bank businesses.
U.S. Government Investment in Bank Holding Companies.Events in the U.S. and global financial markets in 2008 and 2009,leading up to the global financial crisis, including the deterioration of the worldwide credit markets, created significant challenges for financial institutions throughout the country. In response to this crisis affecting the U.S. banking system and financial markets, on October 3, 2008, the U.S. Congress passed, and the President signed into law, the Emergency Economic Stabilization Act of 2008 (the “EESA”). The EESA authorized the Secretary of the Treasury to implement various temporary emergency programs designed to strengthen the capital positions of financial institutions and stimulate the availability of credit within the U.S. financial system. Financial institutions participating in certain of the programs established under the EESA are required to adopt the Treasury’s standards for executive compensation and corporate governance.
On October 14, 2008, the Treasury announced that it would provide Tier 1 capitalCapital (in the form of perpetual preferred stock) to eligible financial institutions. This program, known as the TARP Capital Purchase Program (the “TCPP”“CPP”), allocated $250 billion from the $700 billion authorized by the EESA to the Treasury for the purchase of senior preferred shares from qualifying financial institutions (the “TCPP“CPP Preferred Stock”). Under the program, eligible institutions were able to sell equity interests to the Treasury in amounts equal to between 1% and 3% of the institution’s risk-weighted assets. In conjunction with the purchase of the TCPPCPP Preferred Stock, the Treasury received warrants to purchase common stock from the participating public institutions with an aggregate market price equal to 15% of the preferred stock investment. Participating financial institutions were required to adopt the Treasury’s standards for executive compensation and corporate governance for the period during which the Treasury holds equity issued under the TCPP.
Pursuant to the TCPP,CPP, on February 13, 2009, the Company entered into a Letter Agreement with the Treasury, pursuant to which the Company issued (i) 38,237 shares of its Fixed Rate Cumulative Perpetual Preferred Stock, Series D (the “Series D Preferred Stock”) and (ii) a warrant to purchase 521,888 shares of the Company’s common stock for an aggregate purchase price of $38.237 million in cash.
Small Business Lending Fund and TCPPCPP Redemption.Under the Small Business Jobs Act of 2010, the Treasury established a Small Business Lending Fund (the “SBLF”), a $30 billion fund that encourages lending to small businesses by providing capital to qualified community banks with assets of less than $10 billion. The Company applied for the SBLF program, was accepted, and on September 15, 2011, entered into a Securities Purchase Agreement (the “Purchase Agreement”) with the Treasury, pursuant to which it issued and sold to the Treasury 40,090 shares of its Senior Non-Cumulative Perpetual Preferred Stock, Series F (the “Series F Preferred Stock”), having a liquidation preference of $1,000 per share (the “Liquidation Amount”), for aggregate proceeds of $40,090,000. On the same date, the Company redeemed from the Treasury, using the proceeds from the issuance of the Series F Preferred Stock, all 38,237 outstanding shares of its Series D Preferred Stock issued under the TCPP,CPP, for a redemption price of approximately $38.4 million, including accrued but unpaid dividends to the date of redemption. The Treasury remitted a cash payment to the Company in the amount of approximately $1.7 million to cover the difference between the outstanding balance of the Series D Preferred Stock and the proceeds from the issuance of the Series F Preferred Stock. As a result of its redemption of the Series D Preferred Stock, the Company is no longer subject to the limits on executive compensation and other restrictions stipulated under the TCPP.CPP. The Company also repurchased the warrant issued to the Treasury in November of 2011 for an aggregate purchase price of $1.1 million.
On June 29, 2012,30, 2014, the Company redeemed 10,223the remaining 14,867 shares of the Series F Preferred Stock from the Treasury for an aggregate redemption amount of $10,223,000$14,823,922, plus unpaid dividends to the date of redemption of $124,948. The remaining$373,869. Previously, on June 29, 2012, the Company redeemed 10,223 shares of Series F Preferred Stock may be redeemed at any time at the option ofand on March 31, 2014, the Company subject to the approval of the Company’s primary federal banking regulator. All redemptions must be in amounts equal to at least 25% of the number of originally issued shares, or 100% of the then-outstanding shares (if less than 25% of the originally issued shares).
Dividend Payments.The Company’s ability to pay dividends to its stockholders may be affected by both general corporate law considerations and policies of the Federal Reserve applicable to bank holding companies. As a Delaware corporation, the Company is subject to the limitations of the Delaware General Corporation Law (the “DGCL”), which allow the Company to pay dividends only out of its surplus (as defined and computed in accordance with the provisions of the DGCL) or if the Company has no such surplus, out of its net profits for the fiscal year in which the dividend is declared and/or the preceding fiscal year. In addition, under the Basel III Rule, institutions that seek the freedom to pay dividends will have to maintain 2.5% in Common Equity Tier 1 attributable to the capital conservation buffer, which is to be phased in over three years beginning in 2016. See “—The Increasing Regulatory Emphasis on Capital” above.
As a general matter, the Federal Reserve indicateshas indicated that the board of directors of a bank holding company should eliminate, defer or significantly reduce the dividends to stockholders if: (i) the company’s net income available to stockholders for the past four quarters, net of dividends previously paid during that period, is not sufficient to fully fund the dividends; (ii) the prospective rate of earnings retention is inconsistent with the company’s capital needs and overall current and prospective financial condition; or (iii) the company will not meet, or is in danger of not meeting, its minimum regulatory capital adequacy ratios. The Federal Reserve also possesses enforcement powers over bank holding companies and their non-bank subsidiaries to prevent or remedy actions that represent unsafe or unsound practices or violations of applicable statutes and regulations. Among these powers is the ability to proscribe the payment of dividends by banks and bank holding companies.
Federal Securities Regulation. Regulation.The Company’s common stock is registered with the SEC under the Securities Act of 1933, as amended, and the Securities Exchange Act of 1934, as amended (the “Exchange Act”). Consequently, the Company is subject to the information, proxy solicitation, insider trading and other restrictions and requirements of the SEC under the Exchange Act.
Corporate Governance. Governance.The Dodd-Frank Act addresses many investor protection, corporate governance and executive compensation matters that will affect most U.S. publicly traded companies. The Dodd-Frank Act will increase stockholder influence over boards of directors by requiring companies to give stockholders a non-binding vote on executive compensation and so-called “golden parachute” payments, and authorizing the SEC to promulgate rules that would allow stockholders to nominate and solicit voters for their own candidates using a company’s proxy materials. The legislation also directs the Federal Reserve to promulgate rules prohibiting excessive compensation paid to executives of bank holding company executives,companies, regardless of whether the company issuch companies are publicly traded.
The Banks
General.The Company owns three subsidiary banks: QCBTQuad City Bank and CRBTTrust Company (“QCBT”) and Cedar Rapids Bank and Trust Company are chartered under Iowa law (collectively, the “Iowa Banks”) and Rockford Bank and Trust Company (“RB&T&T”) is chartered under Illinois law. The deposit accounts of the Banks are insured by the FDIC’s Deposit Insurance Fund (“DIF”) to the maximum extent provided under federal law and FDIC regulations. The Banks are also members of the Federal Reserve System (“member banks”).
As Iowa-chartered, FDIC-insured member banks, the Iowa Banks are subject to the examination, supervision, reporting and enforcement requirements of the Iowa Superintendent, as the chartering authority for Iowa banks. As an Illinois-chartered, FDIC-insured member bank, RB&T is subject to the examination, supervision, reporting and enforcement requirements of the DFPR, as the chartering authority for Illinois banks. The Banks are also subject to the examination, reporting and enforcement requirements of the Federal Reserve, as the primary federal regulator of member banks. In addition, the FDIC, as administrator of the DIF, has regulatory authority over the Banks.
Deposit Insurance. Insurance.As FDIC-insured institutions, the Banks are required to pay deposit insurance premium assessments to the FDIC. The FDIC has adopted a risk-based assessment system whereby FDIC-insured depository institutions pay insurance premiums at rates based on their risk classification. An institution’s risk classification is assigned based on its capital levels and the level of supervisory concern the institution poses to the regulators.
The FDIC has authority to raise or lower assessment rates on insured deposits in order to achieve statutorily required reserve ratios in the DIF and to impose special additional assessments. In light of the significant increase in depository institution failures in 2008-2010 and the increase of deposit insurance limits, the DIF incurred substantial losses during recent years. To bolster reserves in the DIF, the Dodd-Frank Act makes changes toincreased the minimum designated reserve ratio of the DIF increasing the minimum from 1.15% to 1.35% of the estimated amount of total insured deposits and eliminatingdeleted the requirement thatstatutory cap for the reserve ratio. In December 2010, the FDIC pay dividends to depository institutions whenset the designated reserve ratio exceeds certain thresholds. Theat 2%, 65 basis points above the statutory minimum. At least semi-annually, the FDIC is given until September 3, 2020 to meetwill update its loss and income projections for the 1.35% reserve ratio target. Several of these provisions couldDIF and, if needed, will increase or decrease the assessment rates, following notice and comment on proposed rulemaking. As a result, the Banks’ FDIC deposit insurance premiums.
FICO Assessments. In addition to paying basic deposit insurance for banks, savingsassessments, insured depository institutions and credit unions to $250,000 per insured depositor, retroactive to January 1, 2009. Although the legislation provided that non-interest-bearing transaction accounts had unlimited deposit insurance coverage through December 31, 2012.
Supervisory Assessments. Assessments.Each of the Banks is required to pay supervisory assessments to its respective state banking regulator to fund the operations of that agency. The amount of the assessment payable by each Bank is calculated on the basis of that Bank’s total assets. During the year ended December 31, 2012,2014, the Iowa Banks paid supervisory assessments to the Iowa Superintendent totaling $160 thousand$154,288 and RB&T paid supervisory assessments to the DFPR totaling $48 thousand.$52,425.
Capital Requirements.Banks are generally required to maintain capital levels in excess of other businesses. For a discussion of capital requirements, see “—The Increasing Regulatory Emphasis on Capital” above.
Liquidity Requirements. Liquidity is a measure of the ability and ease with which bank assets may be converted to cash. Liquid assets are those that can be converted to cash quickly if needed to meet financial obligations. To remain viable, financial institutions must have enough liquid assets to meet their near-term obligations, such as withdrawals by depositors. Because the global financial crisis was in part a liquidity crisis, Basel III also included a liquidity framework that requires financial institutions to measure their liquidity against specific liquidity tests.One test, referred to asthe Liquidity Coverage Ratio (“LCR”), is designed to ensure that the banking entity has an adequate stock of unencumbered high-quality liquid assets that can be converted easily and immediately in private markets into cash to meet liquidity needs for a 30-calendar day liquidity stress scenario. The other test, known as the Net Stable Funding Ratio (“NSFR”), is designed to promote more medium- and long-term funding of the assets and activities of financial institutions over a one-year horizon. These tests provide an incentive for banks and holding companies to increase their holdings in Treasury securities and other sovereign debt as a component of assets, increase the use of long-term debt as a funding source and rely on stable funding like core deposits (in lieu of brokered deposits).
In addition to liquidity guidelines already in place, the U.S. bank regulatory agencies implemented the LCR in September 2014, which requires large financial firms to hold levels of liquid assets sufficient to protect against constraints on their funding during times of financial turmoil. While the LCR only applies to the largest banking organizations in the country, certain elements are expected to filter down to all insured depository institutions. The Company and the Banks are reviewing their liquidity risk management policies in light of the LCR and NSFR.
Liability of Commonly Controlled Institutions.Under federal law, institutions insured by the FDIC may be liable for any loss incurred by, or reasonably expected to be incurred by, the FDIC in connection with the default of commonly controlled FDIC-insured depository institutions or any assistance provided by the FDIC to commonly controlled FDIC-insured depository institutions in danger of default. Because the Company controls each of the Banks, the Banks are commonly controlledcommonly-controlled for purposes of these provisions of federal law.
Dividend Payments. The primary source of funds for the Company is dividends from the Banks. In general, the Banks may only pay dividends either out of their historical net income after any required transfers to surplus or reserves have been made or out of their retained earnings. The Federal Reserve Act also imposes limitations on the amount of dividends that may be paid by state member banks, such as the Banks. Without prior Federal Reserve approval, a state member bank may not pay dividends in any calendar year that, in the aggregate, exceed the bank’s calendar year-to-date net income plus the bank’s retained net income for the two preceding calendar years.
The payment of dividends by any financial institution is affected by the requirement to maintain adequate capital pursuant to applicable capital adequacy guidelines and regulations, and a financial institution generally is prohibited from paying any dividends if, following payment thereof, the institution would be undercapitalized. As described above, each of the Banks exceeded its minimum capital requirements under applicable guidelines as of December 31, 2012.2014. As of December 31, 2012,2014, approximately $10.9$10.1 million was available to be paid as dividends by the Banks. Notwithstanding the availability of funds for dividends, however, the Federal Reserve, DFPR and Iowa Superintendent may prohibit the payment of any dividends by one of the Banks if the Federal Reserveit determines such payment would constitute an unsafe or unsound practice.
Insider Transactions.The Banks are subject to certain restrictions imposed by federal law on “covered transactions” between the Bankseach Bank and theirits “affiliates.” The Company is an affiliate of each Bankthe Banks for purposes of these restrictions, and covered transactions subject to the restrictions include extensions of credit to the Company, investments in the stock or other securities of the Company and the acceptance of the stock or other securities of the Company as collateral for loans made by any of the Banks. The Dodd-Frank Act enhances the requirements for certain transactions with affiliates as of July 21, 2011, including an expansion of the definition of “covered transactions” and an increase in the amount of time for which collateral requirements regarding covered transactions must be maintained.
Certain limitations and reporting requirements are also placed on extensions of credit by the Bankseach Bank to its directors and officers, to directors and officers of the Company and its subsidiaries, to principal stockholders of the Company and to “related interests” of such directors, officers and principal stockholders. In addition, federal law and regulations may affect the terms upon which any person who is a director or officer of the Company or the Banks, or a principal stockholder of the Company, may obtain credit from banks with which the Banks maintainmaintains a correspondent relationships.
Safety and Soundness Standards. Standards/Risk Management.The federal banking agencies have adopted guidelines that establish operational and managerial standards to promote the safety and soundness of federally insured depository institutions. The guidelines set forth standards for internal controls, information systems, internal audit systems, loan documentation, credit underwriting, interest rate exposure, asset growth, compensation, fees and benefits, asset quality and earnings.
In general, the safety and soundness guidelines prescribe the goals to be achieved in each area, and each financial institution is responsible for establishing its own procedures to achieve those goals. If ana financial institution fails to comply with any of the standards set forth in the guidelines, the financial institution’s primary federal regulator may require the financial institution to submit a plan for achieving and maintaining compliance. If ana financial institution fails to submit an acceptable compliance plan, or fails in any material respect to implement a compliance plan that has been accepted by its primary federal regulator, the regulator is required to issue an order directing the financial institution to cure the deficiency. Until the deficiency cited in the regulator’s order is cured, the regulator may restrict the financial institution’s rate of growth, require the financial institution to increase its capital, restrict the rates the financial institution pays on deposits or require the financial institution to take any action the regulator deems appropriate under the circumstances. Noncompliance with the standards established by the safety and soundness guidelines may also constitute grounds for other enforcement action by the federal banking regulators,bank regulatory agencies, including cease and desist orders and civil money penalty assessments.
During the past decade, the bank regulatory agencies have increasingly emphasized the importance of sound risk management processes and strong internal controls when evaluating the activities of the financial institutions they supervise. Properly managing risks has been identified as critical to the conduct of safe and sound banking activities and has become even more important as new technologies, product innovation, and the size and speed of financial transactions have changed the nature of banking markets. The agencies have identified a spectrum of risks facing a banking institution including, but not limited to, credit, market, liquidity, operational, legal, and reputational risk. In particular, recent regulatory pronouncements have focused on operational risk, which arises from the potential that inadequate information systems, operational problems, breaches in internal controls, fraud, or unforeseen catastrophes will result in unexpected losses. New products and services, third-party risk management and cybersecurity are critical sources of operational risk that financial institutions are expected to address in the current environment. Each Bank is expected to have active board and senior management oversight; adequate policies, procedures, and limits; adequate risk measurement, monitoring, and management information systems; and comprehensive internal controls.
Branching Authority. Authority.The Iowa Banks have the authority under Iowa law to establish branches anywhere in the State of Iowa, subject to receipt of all required regulatory approvals. In 1997, the Company formed a de novo Illinois bank that was merged into QCBT, resulting in QCBT establishing a branch office in Illinois. Under Illinois law, QCBT may continue to establish offices in Illinois to the same extent permitted for an Illinois bank (subject to certain conditions, including certain regulatory notice requirements). Similarly, RB&T has the authority under Illinois law to establish branches anywhere in the State of Illinois, subject to receipt of all required regulatory approvals.
Federal law permits state and national banks to merge with banks in other states subject to: (i) regulatory approval; (ii) federal and state deposit concentration limits; and (iii) state law limitations requiring the merging bank to have been in existence for a minimum period of time (not to exceed five years) prior to the merger. The establishment of new interstate branches or the acquisition of individual branches of a bank in another state (rather than the acquisition of an out-of-state bank in its entirety) has historically been permitted only in those states the laws of which expressly authorize such expansion. However, the Dodd-Frank Act permits well-capitalized and well-managed banks to establish new branches across state lines without these impediments.
State Bank Investments and Activities.The Banks are permitted to make investments and engage in activities directly or through subsidiaries as authorized by Iowa or Illinois law, as applicable. However, under federal law, and FDIC regulations, FDIC-insured state banks are prohibited, subject to certain exceptions, from making or retaining equity investments of a type, or in an amount, that are not permissible for a national bank. Federal law and FDIC regulations also prohibitprohibits FDIC-insured state banks and their subsidiaries, subject to certain exceptions, from engaging as principal in any activity that is not permitted for a national bank unless the bank meets, and continues to meet, its minimum regulatory capital requirements and the FDIC determines that the activity would not pose a significant risk to the DIF. These restrictions have not had, and are not currently expected to have, a material impact on the operations of the Banks.
Transaction Account Reserves.Federal Reserve regulations require insured depository institutions to maintain reserves against their transaction accounts (primarily NOW and regular checking accounts). For 2013:2015: the first $12.4$14.5 million of otherwise reservable balances are exempt from the reserve requirements; for transaction accounts aggregating more than $12.4$14.5 million to $79.5$103.6 million, the reserve requirement is 3% of total transaction accounts; and for net transaction accounts in excess of $79.5$103.6 million, the reserve requirement is $2,013,000$2,673,000 plus 10% of the aggregate amount of total transaction accounts in excess of $79.5$103.6 million. These reserve requirements are subject to annual adjustment by the Federal Reserve.
Federal Home Loan Bank System. The Banks are each a member of the Federal Home Loan Bank of Chicago (the “FHLB”), which serves as a central credit facility for its members. The FHLB is funded primarily from proceeds from the sale of obligations of the FHLB system. It makes loans to member banks in compliancethe form of FHLB advances. All advances from the FHLB are required to be fully collateralized as determined by the FHLB.
Community Reinvestment Act Requirements. The Community Reinvestment Act requires the Banks to have a continuing and affirmative obligation in a safe and sound manner to help meet the credit needs of the entire community, including low- and moderate-income neighborhoods. Federal regulators regularly assess each Bank’s record of meeting the credit needs of its communities. Applications for additional acquisitions would be affected by the evaluation of the Bank’s effectiveness in meeting its Community Reinvestment Act requirements.
Anti-Money Laundering. The Uniting and Strengthening America by Providing Appropriate Tools Required to Intercept and Obstruct Terrorism Act of 2001 (the “Patriot Act”) is designed to deny terrorists and criminals the ability to obtain access to the U.S. financial system and has significant implications for depository institutions, brokers, dealers and other businesses involved in the transfer of money. The Patriot Act mandates financial services companies to have policies and procedures with respect to measures designed to address any or all of the following matters: (i) customer identification programs; (ii) money laundering; (iii) terrorist financing; (iv) identifying and reporting suspicious activities and currency transactions; (v) currency crimes; and (vi) cooperation between financial institutions and law enforcement authorities.
Concentrations in Commercial Real Estate. Concentration risk exists when financial institutions deploy too many assets to any one industry or segment. Concentration stemming from commercial real estate is one area of regulatory concern. The interagency Concentrations in Commercial Real Estate Lending, Sound Risk Management Practices guidance (“CRE Guidance”) provides supervisory criteria, including the following numerical indicators, to assist bank examiners in identifying banks with potentially significant commercial real estate loan concentrations that may warrant greater supervisory scrutiny: (i) commercial real estate loans exceeding 300% of capital and increasing 50% or more in the preceding three years; or (ii) construction and land development loans exceeding 100% of capital. The CRE Guidance does not limit banks’ levels of commercial real estate lending activities, but rather guides institutions in developing risk management practices and levels of capital that are commensurate with the foregoing requirements.level and nature of their commercial real estate concentrations. Based on the Banks’ loan portfolio, none of the Banks exceed these guidelines.
Consumer Financial Services
The historical structure of federal consumer protection regulation applicable to all providers of consumer financial products and services changed significantly on July 21, 2011, when the CFPB commenced operations to supervise and enforce consumer protection laws. The CFPB has broad rulemaking authority for a wide range of consumer protection laws that apply to all providers of consumer products and services, including the Banks, as well as the authority to prohibit “unfair, deceptive or abusive” acts and practices. The CFPB has examination and enforcement authority over providers with more than $10 billion in assets. Banks and savings institutions with $10 billion or less in assets, like the Banks, will continue to be examined by their applicable bank regulators.
Because abuses in connection with residential mortgages were a significant factor contributing to the financial crisis, many new rules issued by the CFPB and Qualified Mortgage Rule.
Ability-to-Repay Requirement and Qualified Mortgage Rule.On January 10, 2013, the CFPB issued a final rule effective January 10, 2014, which implementsimplementing the Dodd-Frank Act’s ability-to-repay requirements and clarifiesrequirements. Under the presumption of compliance for “qualified mortgages.” Infinal rule, lenders, in assessing a borrower’s ability to repay a mortgage-related obligation, lenders generally must consider eight underwriting factors: (i) current or reasonably expected income or assets; (ii) current employment status; (iii) monthly payment on the subject transaction; (iv) monthly payment on any simultaneous loan; (v) monthly payment for all mortgage-related obligations; (vi) current debt obligations, alimony, and child support; (vii) monthly debt-to-income ratio or residual income; and (viii) credit history. The final rule also includes guidance regarding the application of, and methodology for evaluating, these factors.
Further, the final rule also clarifiesclarified that qualified mortgages do not include “no-doc” loans and loans with negative amortization, interest-only payments, balloon payments, terms in excess of 30 years, or points and fees paid by the borrower that exceed 3% of the loan amount, subject to certain exceptions. In addition, for qualified mortgages, the rule mandated that the monthly payment must be calculated on the highest payment that will occur in the first five years of the loan, and required that the borrower’s total debt-to-income ratio generally may not be more than 43%. The final rule also providesprovided that certain mortgages that satisfy the general product feature requirements for qualified mortgages and that also satisfy the underwriting requirements of Fannie Mae and Freddie Mac (while they operate under federal conservatorship or receivership), or the U.S. Department of Housing and Urban Development, Department of Veterans Affairs, or Department of Agriculture or Rural Housing Service, are also considered to be qualified mortgages. This second category of qualified mortgages will phase out as the aforementioned federal agencies issue their own rules regarding qualified mortgages, the conservatorship of Fannie Mae and Freddie Mac ends, and, in any event, after seven years.
As set forth in the Dodd-Frank Act, subprime (or higher-priced) mortgage loans are subject to the ability-to-repay requirement, and the final rule providesprovided for a rebuttable presumption of lender compliance for those loans. The final rule also appliesapplied the ability-to-repay requirement to prime loans, while also providing a conclusive presumption of compliance (i.e., a safe harbor) for prime loans that are also qualified mortgages. Additionally, the final rule generally prohibitsprohibited prepayment penalties (subject to certain exceptions) and setsset forth a 3-year record retention period with respect to documenting and demonstrating the ability-to-repay requirement and other provisions.
Changes to Mortgage Loan Originator Compensation. Effective April 2, 2011, previously existing regulations concerning As a part of the compensationoverhaul of mortgage loan originators were amended. As a result of these amendments,origination practices, mortgage loan originatorsoriginators’ compensation was limited such that they may notno longer receive compensation based on a mortgage transaction’s terms or conditions other than the amount of credit extended under the mortgage loan. Further, the new standards limit the total points and fees that a bank and/or a broker may charge on conforming and jumbo loans was limited to 3% of the total loan amount. Mortgage loan originators may receive compensation from a consumer or from a lender, but not both. These rules contain requirements designed to prohibit mortgage loan originators from “steering” consumers to loans that provide mortgage loan originators with greater compensation. In addition, the rules contain other requirements concerning recordkeeping.recordkeeping.
Servicing.The CFPB was also required to implement certain provisions of the Dodd-Frank Act relating to mortgage servicing through rulemaking. The servicing rules require servicers to meet certain benchmarks for loan servicing and customer service in general. Servicers must provide periodic billing statements and certain required notices and acknowledgments, promptly credit borrowers’ accounts for payments received and promptly investigate complaints by borrowers and are required to take additional steps before purchasing insurance to protect the lender’s interest in the property. The servicing rules also called for additional notice, review and timing requirements with respect to delinquent borrowers, including early intervention, ongoing access to servicer personnel and specific loss mitigation and foreclosure procedures. The rules provided for an exemption from most of these requirements for “small servicers.” A small servicer is defined as a loan servicer that services 5,000 or fewer mortgage loans and services only mortgage loans that they or an affiliate originated or own.
Additional Constraints on the Company and Banks
Monetary Policy.The monetary policy of the Federal Reserve has a significant effect on the operating results of financial or bank holding companies and their subsidiaries. Among the tools available to the Federal Reserve to affect the money supply are open market transactions in U.S. government securities, changes in the discount rate on member bank borrowings and changes in reserve requirements against member bank deposits. These means are used in varying combinations to influence overall growth and distribution of bank loans, investments and deposits, and their use may affect interest rates charged on loans or paid on deposits.
The Volcker Rule.In addition to other implications of the Dodd-Frank Act discussed above, the Act amended the BHCA to require the federal regulatory agencies to adopt rules that prohibit banking entities and their affiliates from engaging in proprietary trading and investing in and sponsoring certain unregistered investment companies (defined as hedge funds and private equity funds). This statutory provision is commonly called the “Volcker Rule.” On December 10, 2013, the federal regulatory agencies issued final rules to implement the prohibitions required by the Volcker Rule. Thereafter, in reaction to industry concern over the adverse impact to community banks of the treatment of certain collateralized debt instruments in the final rule, the federal regulatory agencies approved an interim final rule to permit financial institutions to retain interests in collateralized debt obligations backed primarily by trust preferred securities (“TruPS CDOs”) from the investment prohibitions contained in the final rule. Under the interim final rule, the regulatory agencies permitted the retention of an interest in or sponsorship of covered funds by banking entities if the following qualifications were met: (i) the TruPS CDO was established, and the interest was issued, before May 19, 2010; (ii) the banking entity reasonably believes that the offering proceeds received by the TruPS CDO were invested primarily in qualifying TruPS collateral; and (iii) the banking entity's interest in the TruPS CDO was acquired on or before December 10, 2013. This amendment impacted the Company favorably as an issuer of TruPS CDOs.
Although the Volcker Rule has significant implications for many large financial institutions, the Company does not currently anticipate that it will have a material effect on the operations of the Company or the Banks. The Company may incur costs if it is required to adopt additional policies and systems to ensure compliance with certain provisions of the Volcker Rule, but any such costs are not expected to be material.
Appendix B
GUIDE 3 INFORMATION
The following tables and schedules show selected comparative financial information required by the Securities and Exchange Commission SecuritiesCommissionSecurities Act Guide 3, regarding the business of QCR Holdings, Inc. (the "Company") for the periods shown.
I. Distribution of Assets, Liabilities and Stockholders Equity; Interest Rates and Interest Differential
A. and B. Consolidated Average Balance Sheets and Analysis of Net Interest Earnings
The information requested is disclosed in Management's Discussion and Analysis section of the the Company's Form 10-K for10-Kfor the fiscal year ended December 31, 2012.
C. Analysis of Changes of Interest Income/Interest Expense
The information requested is disclosed in Management's Discussion and Analysis section of the the Company's Form 10-K for10-Kfor the fiscal year ended December 31, 2012.
II. Investment Portfolio
A. Investment Securities
The following tables present the amortized cost and fair value of investment securities as of DecemberofDecember 31, 2012, 2011,2014, 2013, and 2010
Amortized Cost | Gross Unrealized | Gross Unrealized | Fair Value | |||||||||||||
| (dollars in thousands) | ||||||||||||||||
| December 31, 2012 | ||||||||||||||||
| Securities held to maturity: | ||||||||||||||||
| Municipal securities | $ | 71,429 | $ | 998 | $ | (71 | ) | $ | 72,356 | |||||||
| Other bonds | 650 | - | - | 650 | ||||||||||||
| Totals | $ | 72,079 | $ | 998 | $ | (71 | ) | $ | 73,006 | |||||||
| Securities available for sale: | ||||||||||||||||
| U.S. gov't.sponsored agency securities | $ | 336,571 | $ | 2,198 | $ | (160 | ) | $ | 338,609 | |||||||
| Residential mortgage-backed and related securitiies | 160,035 | 3,737 | (171 | ) | 163,601 | |||||||||||
| Municipal securities | 24,508 | 1,697 | (19 | ) | 26,186 | |||||||||||
| Trust preferred securities | 86 | 53 | - | 139 | ||||||||||||
| Other securities | 1,347 | 301 | (23 | ) | 1,625 | |||||||||||
| Totals | $ | 522,547 | $ | 7,986 | $ | (373 | ) | $ | 530,160 | |||||||
| December 31, 2011 | ||||||||||||||||
| Securities held to maturity: | ||||||||||||||||
| Other bonds | $ | 200 | $ | - | $ | - | $ | 200 | ||||||||
| Totals | $ | 200 | $ | - | $ | - | $ | 200 | ||||||||
| Securities available for sale: | ||||||||||||||||
| U.S. gov't.sponsored agency securities | $ | 426,582 | $ | 2,429 | $ | (56 | ) | $ | 428,955 | |||||||
| Residential mortgage-backed and related securitiies | 105,374 | 3,488 | (8 | ) | 108,854 | |||||||||||
| Municipal securities | 23,937 | 1,752 | - | 25,689 | ||||||||||||
| Trust preferred securities | 86 | - | (5 | ) | 81 | |||||||||||
| Other securities | 1,355 | 140 | (45 | ) | 1,450 | |||||||||||
| Totals | $ | 557,334 | $ | 7,809 | $ | (114 | ) | $ | 565,029 | |||||||
| December 31, 2010 | ||||||||||||||||
| Securities held to maturity: | ||||||||||||||||
| Other bonds | $ | 300 | $ | - | $ | - | $ | 300 | ||||||||
| Totals | $ | 300 | $ | - | $ | - | $ | 300 | ||||||||
| Securities available for sale: | ||||||||||||||||
| U.S. gov't.sponsored agency securities | $ | 401,711 | $ | 3,219 | $ | (2,705 | ) | $ | 402,225 | |||||||
| Municipal securities | 20,135 | 579 | (110 | ) | 20,604 | |||||||||||
| Residential mortgage-backed securities | 65 | 6 | - | 71 | ||||||||||||
| Trust preferred securities | 86 | - | (8 | ) | 78 | |||||||||||
| Other securities | 1,415 | 168 | (14 | ) | 1,569 | |||||||||||
| Totals | $ | 423,412 | $ | 3,972 | $ | (2,837 | ) | $ | 424,547 | |||||||
Gross | Gross | |||||||||||||||
Amortized | Unrealized | Unrealized | Fair | |||||||||||||
Cost | Gains | (Losses) | Value | |||||||||||||
(dollars in thousands) | ||||||||||||||||
December 31, 2014 | ||||||||||||||||
Securities held to maturity: | ||||||||||||||||
Municipal securities | $ | 198,830 | $ | 2,420 | $ | (1,186 | ) | $ | 200,064 | |||||||
Other bonds | 1,050 | - | - | 1,050 | ||||||||||||
Totals | $ | 199,880 | $ | 2,420 | $ | (1,186 | ) | $ | 201,114 | |||||||
Securities available for sale: | ||||||||||||||||
U.S. gov't.sponsored agency securities | $ | 312,960 | $ | 174 | $ | (5,264 | ) | $ | 307,870 | |||||||
Residential mortgage-backed and related securitiies | 110,456 | 1,508 | (541 | ) | 111,423 | |||||||||||
Municipal securities | 29,409 | 1,053 | (62 | ) | 30,400 | |||||||||||
Other securities | 1,342 | 626 | (1 | ) | 1,967 | |||||||||||
Totals | $ | 454,167 | $ | 3,361 | $ | (5,868 | ) | $ | 451,660 | |||||||
December 31, 2013 | ||||||||||||||||
Securities held to maturity: | ||||||||||||||||
Municipal securities | $ | 144,402 | $ | 300 | $ | (7,112 | ) | $ | 137,590 | |||||||
Other bonds | 1,050 | - | - | 1,050 | ||||||||||||
Totals | $ | 145,452 | $ | 300 | $ | (7,112 | ) | $ | 138,640 | |||||||
Securities available for sale: | ||||||||||||||||
U.S. gov't.sponsored agency securities | $ | 376,574 | $ | 42 | $ | (20,143 | ) | $ | 356,473 | |||||||
Residential mortgage-backed and related securitiies | 160,110 | 1,153 | (3,834 | ) | 157,429 | |||||||||||
Municipal securities | 35,814 | 923 | (778 | ) | 35,959 | |||||||||||
Other securities | 1,372 | 525 | - | 1,897 | ||||||||||||
Totals | $ | 573,870 | $ | 2,643 | $ | (24,755 | ) | $ | 551,758 | |||||||
December 31, 2012 | ||||||||||||||||
Securities held to maturity: | ||||||||||||||||
Municipal securities | $ | 71,429 | $ | 998 | $ | (71 | ) | $ | 72,356 | |||||||
Other bonds | 650 | - | - | 650 | ||||||||||||
Totals | $ | 72,079 | $ | 998 | $ | (71 | ) | $ | 73,006 | |||||||
Securities available for sale: | ||||||||||||||||
U.S. gov't.sponsored agency securities ...…… | $ | 336,571 | $ | 2,198 | $ | (160 | ) | $ | 338,609 | |||||||
Residential mortgage-backed and related securitiies | 160,035 | 3,737 | (171 | ) | 163,601 | |||||||||||
Municipal securities | 24,508 | 1,697 | (19 | ) | 26,186 | |||||||||||
Trust preferred securities | 86 | 53 | - | 139 | ||||||||||||
Other securities | 1,347 | 301 | (23 | ) | 1,625 | |||||||||||
Totals | $ | 522,547 | $ | 7,986 | $ | (373 | ) | $ | 530,160 | |||||||
NOTE: Stock of the Federal Home Loan Bank and Federal Reserve Bank are NOT included in the above. The Companyreportscarries these investments separatelywithin restricted investment securities on the consolidated balance sheets. Following is a summaryof the carrying value of all of the Company's restricted investment securities as of December 31, 2012, 2011,2014, 2013, and 2010:2012:
As of December 31, | ||||||||||||
2014 | 2013 | 2012 | ||||||||||
(dollars in thousands) | ||||||||||||
Federal Home Loan Bank | $ | 11,279 | $ | 12,344 | $ | 15,748 | ||||||
Federal Reserve Bank | 4,227 | 4,630 | 3,761 | |||||||||
Other | 54 | 54 | - | |||||||||
Totals | $ | 15,560 | $ | 17,028 | $ | 19,509 | ||||||
| As of December 31, | ||||||||||||
| 2012 | 2011 | 2010 | ||||||||||
| (dollars in thousands) | ||||||||||||
| Federal Home Loan Bank | $ | 11,987 | $ | 11,517 | $ | 12,980 | ||||||
| Federal Reserve Bank | 3,761 | 3,737 | 3,689 | |||||||||
| Totals | $ | 15,748 | $ | 15,254 | $ | 16,669 | ||||||
B. Investment Securities, Maturities, and Yields
The following table presents the maturity of securities held on December 31, 2012 and2014and the weighted average stated coupon rates by range of maturity:
Amortized Cost | Weighted Average | |||||||
| (dollars in thousands) | ||||||||
| U.S. gov't.sponsored agency securities: | ||||||||
| After 1 but within 5 years | $ | 27,498 | 1.29 | % | ||||
| After 5 but within 10 years | 291,300 | 1.69 | % | |||||
| After 10 years | 17,773 | 2.85 | % | |||||
| Total | $ | 336,571 | 1.72 | % | ||||
| Residential mortgage-backed and related securities: | ||||||||
| Within 1 year | $ | 9 | 6.08 | % | ||||
| After 10 years | 160,026 | 2.09 | % | |||||
| Total | $ | 160,035 | 2.09 | % | ||||
| Municipal securities: | ||||||||
| Within 1 year | $ | 1,749 | 2.62 | % | ||||
| After 1 but within 5 years | 14,956 | 2.33 | % | |||||
| After 5 but within 10 years | 27,584 | 3.17 | % | |||||
| After 10 years | 51,648 | 3.35 | % | |||||
| Total | $ | 95,937 | 3.13 | % | ||||
| Trust preferred securities: | ||||||||
| After 10 years | $ | 86 | 7.80 | % | ||||
| Other bonds: | ||||||||
| Within 1 year | $ | 100 | 5.50 | % | ||||
| After 1 but within 5 years | 550 | 2.81 | % | |||||
| Total | $ | 650 | 3.22 | % | ||||
| Other securities with no maturity or stated face rate | $ | 1,347 | ||||||
Weighted | ||||||||
Amortized | Average | |||||||
Cost | Yield | |||||||
(dollars in thousands) | ||||||||
U.S. gov't.sponsored agency securities: | ||||||||
Within 1 year | $ | - | 0.00 | % | ||||
After 1 but within 5 years | 85,251 | 1.41 | % | |||||
After 5 but within 10 years | 227,209 | 2.00 | % | |||||
After 10 years | 500 | 2.00 | % | |||||
Total | $ | 312,960 | 1.84 | % | ||||
Residential mortgage-backed and related securities: | ||||||||
After 1 but within 5 years | $ | 257 | 3.88 | % | ||||
After 5 but within 10 years | 4,048 | 4.02 | % | |||||
After 10 years | 106,151 | 3.36 | % | |||||
Total | $ | 110,456 | 3.39 | % | ||||
Municipal securities: | ||||||||
Within 1 year | $ | 14,698 | 1.51 | % | ||||
After 1 but within 5 years | 24,894 | 2.36 | % | |||||
After 5 but within 10 years | 53,315 | 3.22 | % | |||||
After 10 years | 135,332 | 3.60 | % | |||||
Total | $ | 228,239 | 3.24 | % | ||||
Other bonds: | ||||||||
After 1 but within 5 years | $ | 550 | 2.81 | % | ||||
After 5 but within 10 years | 742 | 3.73 | % | |||||
Total | $ | 1,292 | 3.34 | % | ||||
Other securities with no maturity or stated face rate | $ | 1,100 | ||||||
NOTE: Yields above are NOT computed on a tax equivalent basis.
C. As of December 31, 2012,2014, there were no securities with aggregate book value and market value purchasedvaluepurchased from a single issuer (as defined by Sction 2(4) of the Securities Act of 1933) that exceededthatexceeded 10% of stockholders' equity.
III. Loan/Lease Portfolio
A. Types of Loans/Leases
The information requested is disclosed in Management's Discussion and Analysis section of the the Company's Form 10-K for10-Kfor the fiscal year ended December 31, 2012.
B. Maturities and Sensitivities of Loans/Leases to Changes in Interest Rates
The information requested is disclosed in Management's Discussion and Analysis section of the the Company's Form 10-K for10-Kfor the fiscal year ended December 31, 2012.
C. Risk Elements
1. Nonaccrual, Past Due and Restructured Loans/Leases
The gross interest income that would have been recorded if nonaccrual loans/leases and performing troubled debt restructurings had beenhadbeen current in accordance with their original terms was $618,733$764,234 and $277,576,$19,978 respectively, for the year ended December 31, 2012.2014. The amount of interest collected on nonaccrual loans/leases and performing troubled debt restructurings that was included in interest incomeinterestincome was none and $334,921,$77,193, respectively, for the year ended December 31, 2012.
The remaining information requested is disclosed in Management's Discussion and Analysis section of the the Company's Form 10-K for10-Kfor the fiscal year ended December 31, 2012.
2. Potential Problem Loans/Leases.
To management's best knowledge, there are no such significant loans/leases that have not been disclosed in the table presentedtablepresented in the Management's Discussion and Analysis section of the Company's Form 10-K for the fiscal year ended DecemberendedDecember 31, 2012.
3. Foreign Outstandings. None.
4. Loan/Lease Concentrations.
As of December 31, 2012,2014, there was a single concentration of loans/leases exceeding 10% of total loans/leases, which is not otherwise disclosed in Item III. A. That concentration is Lessors of Non-Residential Buildings & Dwellings at 14%16%.
D. Other Interest-Bearing Assets
As of December 31, 2012,2014, there are no interest-bearing assets required to be disclosed in this Appendix.
IV. Summary of Loan/Lease Loss Experience
A. Analysis of the Allowance for Estimated Losses on Loans/Leases
The information requested is disclosed in Management's Discussion and Analysis section of the the Company's Form 10-K for10-Kfor the fiscal year ended December 31, 2012.
B. Allocation of the Allowance for Estimated Losses on Loans/Leases
The information requested is disclosed in Management's Discussion and Analysis section of the the Company's Form 10-K for10-Kfor the fiscal year ended December 31, 2012.
V. Deposits.
The average amount of and average rate paid for the categories of deposits for the years ended December 31, 2012, 2011, 2014, 2013,and 20102012 are included in the consolidated average balance sheets and can be found in the Management's Discussion andDiscussionand Analysis section of the Company's Form 10-K for the fiscal year ended December 31, 2012.
The Company has no deposits by foreign depositors in domestic offices as of December 31, 2012.
Included in interest bearing deposits at December 31, 2012,2014, were certificates of deposit totaling $249,664,000$301,555,000 that were $100,000$100,000 or greater. Maturities of these certificates were as follows:
| December 31, | ||||
| 2012 | ||||
| (dollars in thousands) | ||||
| One to three months | $ | 69,777 | ||
| Three to six months | 48,478 | |||
| Six to twelve months | 53,078 | |||
| Over twelve months | 78,331 | |||
Total certificates of deposit greater than $100,000 | $ | 249,664 | ||
December 31, | ||||
2014 | ||||
(dollars in thousands) | ||||
One to three months | $ | 110,861 | ||
Three to six months | 44,079 | |||
Six to twelve months | 91,791 | |||
Over twelve months | 54,824 | |||
Total certificates of deposit greater than $100,000 | $ | 301,555 | ||
VI. Return on Equity and Assets.
The following tables present the return on assets and equity and the equity to assets ratio of the Company:
Years ended | ||||||||||||
December 31, | ||||||||||||
2014 | 2013 | 2012 | ||||||||||
(dollars in thousands) | ||||||||||||
Average total assets | $ | 2,453,678 | $ | 2,330,604 | $ | 2,025,693 | ||||||
Average equity | 142,734 | 145,906 | 141,793 | |||||||||
Net income attributable to QCR Holdings, Inc. | 14,953 | 14,938 | 12,618 | |||||||||
Return on average assets | 0.61 | % | 0.64 | % | 0.62 | % | ||||||
Return on average common equity | 10.49 | % | 11.48 | % | 10.84 | % | ||||||
Return on average total equity | 10.48 | % | 10.24 | % | 8.90 | % | ||||||
Dividend payout ratio | 4.57 | % | 3.76 | % | 4.26 | % | ||||||
Average equity to average assets ratio | 5.82 | % | 6.26 | % | 7.00 | % | ||||||
Years ended December 31, | ||||||||||||
| 2012 | 2011 | 2010 | ||||||||||
| (dollars in thousands) | ||||||||||||
| Average total assets | $ | 2,025,691 | $ | 1,907,038 | $ | 1,839,318 | ||||||
| Average equity | 141,793 | 136,700 | 131,066 | |||||||||
| Net income attributable to QCR Holdings, Inc. | 12,618 | 9,692 | 6,587 | |||||||||
| Return on average assets | 0.62 | % | 0.51 | % | 0.36 | % | ||||||
| Return on average common equity | 10.84 | % | 5.82 | % | 3.58 | % | ||||||
| Return on average total equity | 8.90 | % | 7.09 | % | 5.03 | % | ||||||
| Dividend payout ratio | 4.26 | % | 8.60 | % | 14.81 | % | ||||||
| Average equity to average assets ratio | 7.00 | % | 7.17 | % | 7.13 | % | ||||||
VII. Short Term Borrowings.
The following tables present the information requested on short-term borrowings of the Company:
Short-term borrowings as of December 31, 2012, 2011,2014, 2013, and 20102012 are summarized as follows:
| 2012 | 2011 | 2010 | ||||||||||
| (dollars in thousands) | ||||||||||||
| Overnight repurchase agreements with customers | $ | 104,943 | $ | 110,236 | $ | 118,904 | ||||||
| Federal funds purchased | 66,140 | 103,300 | 22,250 | |||||||||
| $ | 171,083 | $ | 213,536 | $ | 141,154 | |||||||
2014 | 2013 | 2012 | ||||||||||
| (dollars in thousands) | ||||||||||||
Overnight repurchase agreements with customers | $ | 137,252 | $ | 98,823 | $ | 104,943 | ||||||
Federal funds purchased | 131,100 | 50,470 | 66,140 | |||||||||
| $ | 268,352 | $ | 149,293 | $ | 171,083 | |||||||
Information concerning overnight repurchase agreements with customers is summarized as follows:
| 2012 | 2011 | 2010 | ||||||||||
| (dollars in thousands) | ||||||||||||
| Average daily balance during the period | $ | 111,782 | $ | 110,469 | $ | 108,232 | ||||||
| Average daily interest rate during the period | 0.13 | % | 0.23 | % | 0.41 | % | ||||||
| Maximum month-end balance during the period | $ | 141,891 | $ | 117,902 | $ | 135,143 | ||||||
| Weighted average rate as of end of period | 0.11 | % | 0.23 | % | 0.50 | % | ||||||
| Securities underlying the agreements as of end of period: | ||||||||||||
| Carrying value | $ | 160,951 | $ | 201,054 | $ | 157,042 | ||||||
| Fair value | 160,951 | 201,054 | 157,042 | |||||||||
2014 | 2013 | 2012 | ||||||||||
| (dollars in thousands) | ||||||||||||
Average daily balance during the period | $ | 128,818 | $ | 123,543 | $ | 111,782 | ||||||
Average daily interest rate during the period | 0.12 | % | 0.12 | % | 0.13 | % | ||||||
Maximum month-end balance during the period | $ | 147,624 | $ | 146,075 | $ | 141,891 | ||||||
Weighted average rate as of end of period | 0.13 | % | 0.13 | % | 0.11 | % | ||||||
Securities underlying the agreements as of end of period: | ||||||||||||
Carrying value | $ | 165,360 | $ | 143,262 | $ | 160,951 | ||||||
Fair value | 165,360 | 143,262 | 160,951 | |||||||||
Information concerning federal funds purchased is summarized as follows:
| 2012 | 2011 | 2010 | ||||||||||
| (dollars in thousands) | ||||||||||||
| Average daily balance during the period | $ | 52,380 | $ | 33,703 | $ | 33,897 | ||||||
| Average daily interest rate during the period | 0.27 | % | 0.27 | % | 0.31 | % | ||||||
| Maximum month-end balance during the period | $ | 80,150 | $ | 103,300 | $ | 46,990 | ||||||
| Weighted average rate as of end of period | 0.26 | % | 0.22 | % | 0.27 | % | ||||||
2014 | 2013 | 2012 | ||||||||||
| (dollars in thousands) | ||||||||||||
Average daily balance during the period | $ | 33,877 | $ | 41,157 | $ | 52,380 | ||||||
Average daily interest rate during the period | 0.40 | % | 0.40 | % | 0.27 | % | ||||||
Maximum month-end balance during the period | $ | 131,100 | $ | 95,380 | $ | 80,150 | ||||||
Weighted average rate as of end of period | 0.23 | % | 0.28 | % | 0.26 | % | ||||||
B-6