UNITED STATES SECURITIES AND EXCHANGE COMMISSION
Washington, D.C. 20549
FORM 10-K
(Mark One)
[X]ANNUAL REPORT PURSUANT TO SECTION 13 OR 15(d) OF THE SECURITIES EXCHANGE ACT OF 1934
For the fiscal year endedJune 30, 20132016
OR
[ ]TRANSITION REPORT PURSUANT TO SECTION 13 OR 15(d) OF THE SECURITIES EXCHANGE ACT OF 1934
For the transition period from to
Commission file number1-11692
Ethan Allen Interiors Inc.
(Exact name of registrant as specified in its charter)
Delaware |
| 06-1275288 |
|
| | (I.R.S. Employer Identification No.) | |
| Ethan Allen Drive, Danbury, CT | 06811 | ||
| (Address of principal executive offices) | (Zip Code) |
Registrant's telephone number, including area code | (203) 743-8000 |
Securities registered pursuant to Section 12(b) of the Act:
Title of Each Class | Name of Each Exchange On Which Registered | |||
Common Stock, $.01 par value | New York Stock Exchange, Inc. | |||
Securities registered pursuant to Section 12(g) of the Act:
None
(Title of Class)
Indicate by checkmark if the Registrant is a well-known seasoned issuer, as defined in Rule 405 of the Securities Act. [X][ X ] Yes [ ] No
Indicate by check mark if the Registrant is not required to file reports pursuant to Section 13 or Section 15(d) of the Act. [ ] Yes [X] No
Indicate by check mark whether the Registrant (1) has filed all reports required to be filed by Section 13 or 15(d) of the Securities Exchange Act of 1934 during the preceding 12 months (or for such shorter period that the Registrant was required to file such reports), and (2) has been subject to such filing requirements for the past 90 days. [X] Yes [ ] No
Indicate by check mark whether the Registrant has submitted electronically and posted on its corporate Web site, if any, every Interactive Data File required to be submitted and posted pursuant to Rule 405 of Regulation S-T (§232.405 of this chapter) during the preceding 12 months (or such shorter period that the registrant was required to submit and post such files). [X] Yes [ ] No
Indicate by check mark if disclosure of delinquent filers pursuant to Item 405 of Regulation S-K is not contained herein, and will not be contained, to the best of Registrant's knowledge, in definitive proxy or information statements incorporated by reference in Part III of this Form 10-K or any amendment to this Form 10-K. [ X ]
Indicate by check mark whether the registrant is a large accelerated filer, an accelerated filer, a non-accelerated filer, or a smaller reporting company. See the definitions of “large accelerated filer,” “accelerated filer” and “smaller reporting company” in Rule 12b-2 of the Exchange Act (check one):
Large accelerated | [X] | Accelerated | [ ] |
Non-accelerated | [ ] | Smaller reporting | [ ] |
Indicate by check mark whether the Registrant is a shell company (as defined in Rule 12b-2 of the Act). [ ] Yes [X] No
The aggregate market value of the Registrant’s common stock, par value $.01 per share, held by non-affiliates (based upon the closing sale price on the New York Stock Exchange) on December 31, 2012,2015, (the last day of the Registrant’s most recently completed second fiscal quarter) was approximately $670,953,921.$703,752,000. As of July 31, 2013,2016, there were 28,909,61127,747,128 shares of the Registrant’s common stock, par value $.01 per share, outstanding.
DOCUMENTS INCORPORATED BY REFERENCE: Certain information contained in the Registrant’s definitive Proxy Statement for the 20132016 Annual Meeting of stockholders, which will be filed with the Securities and Exchange Commission pursuant to Regulation 14A of the Securities Exchange Act of 1934, is incorporated by reference into Part III hereof.
ETHAN ALLEN INTERIORS INC. AND SUBSIDIARIES
TABLE OF CONTENTS
| Item | Page | Page | ||
| PART I | ||||
| PART I | ||||
1. | Business | 3 | Business | 3 |
1A. | Risk Factors | 11 | Risk Factors | 12 |
1B. | Unresolved Staff Comments | 16 | Unresolved Staff Comments | 18 |
2. | Properties | 16 | Properties | 18 |
3. | Legal Proceedings | 17 | Legal Proceedings | 19 |
4. | Mine Safety Disclosures | 17 | Mine Safety Disclosures | 19 |
PART II | ||||
PART II | ||||
5. | Market for Registrant's Common Equity, Related Stockholder Matters and Issuer Purchases of Equity Securities | 17 | Market for Registrant's Common Equity, Related Stockholder Matters and Issuer Purchases of Equity Securities | 20 |
6. | Selected Financial Data | 19 | Selected Financial Data | 22 |
7. | Management's Discussion and Analysis of Financial Condition and Results of Operations | 21 | Management's Discussion and Analysis of Financial Condition and Results of Operation | 23 |
7A. | Quantitative and Qualitative Disclosures About Market Risk | 33 | Quantitative and Qualitative Disclosures About Market Risk | 37 |
8. | Financial Statements and Supplementary Data | 33 | Financial Statements and Supplementary Data | 37 |
9. | Changes in and Disagreements with Accountants on Accounting and Financial Disclosure | 65 | Changes in and Disagreements with Accountants on Accounting and Financial Disclosure | 65 |
9A. | Controls and Procedures | 65 | Controls and Procedures | 65 |
9B. | Other Information | 66 | Other Information | 66 |
PART III | ||||
PART III | ||||
10. | Directors, Executive Officers and Corporate Governance | 66 | Directors, Executive Officers and Corporate Governance | 67 |
11. | Executive Compensation | 66 | Executive Compensation | 67 |
12. | Security Ownership of Certain Beneficial Owners and Management and Related Stockholder Matters | 66 | Security Ownership of Certain Beneficial Owners and Management and Related Stockholder Matters | 67 |
13. | Certain Relationships and Related Transactions, and Director Independence | 66 | Certain Relationships and Related Transactions, and Director Independence | 67 |
14. | Principal Accountant Fees and Services | 66 | Principal Accountant Fees and Services | 68 |
PART IV | ||||
PART IV | ||||
15. | Exhibits and Financial Statement Schedules | 67 | Exhibits and Financial Statement Schedules | 68 |
| Signatures | 71 | Signatures | 73 |
ETHAN ALLEN INTERIORS INC. AND SUBSIDIARIES
PART I
Item 1. Business
Item 1. Business The Company
Background
Incorporated in Delaware in 1989, Ethan Allen Interiors Inc., through its wholly-owned subsidiary, Ethan Allen Global, Inc., and Ethan Allen Global, Inc.’s subsidiaries (collectively, "We," "Us," "Our," "Ethan Allen" or the "Company"), is a leading interior design company and manufacturer and retailer of quality home furnishingsfurnishings. Founded over 80 years ago, today we are a leading international home fashion brand doing business in North America, Europe, Asia and accessories, offeringthe Middle East. We are vertically integrated from design through delivery, affording our clientele a value equation of style, quality and price that is unique to the industry. We offer complimentary interior design service to our clients and sell a full complementrange of home decoratingfurniture products and decorative accents through ethanallen.com and a network of approximately 300 design solutions throughcenters in the United States and abroad. The design centers represent a mix of independent licensees and our own Company operated retail segment. We own and operate nine manufacturing facilities including six manufacturing plants and one sawmill in the United States and one manufacturing plant each in Mexico and Honduras.
Available Information
We make available, free of charge via our website, all Annual Reports on Form 10-K, Quarterly Reports on Form 10-Q, Current Reports on Form 8-K and other information filed with, or furnished to, the Securities and Exchange Commission (the "SEC" or the "Commission"), including exhibits and amendments to such reports.Information contained on our website is not part of this Annual Report.This information is available at www.ethanallen.com/investors as soon as reasonably practicable after it is electronically filed with, or furnished to, the SEC. In addition,our SEC filings, including exhibits filed therewith, are also available on the SEC’s website at www.sec.gov. You may obtain and copy any document we furnish or file with the SEC at the SEC’s public reference room at 100 F Street, NE, Room 1580, Washington, D.C. 20549. You may obtain information on the operation of the country’s largest home furnishing retail networks. We referSEC’s public reference facilities by calling the SEC at 1-800-SEC-0330. You may request copies of these documents, upon payment of a duplicating fee, by writing to the SEC at its principal office at 100 F Street, NE, Room 1580, Washington, D.C..
In addition, charters of all committees of our Board of Directors, as well as our Corporate Governance guidelines, are available on our website at www.ethanallen.com/governance or, upon written request, in printed hardcopy form. Written requests should be sent to Office of the Secretary, Ethan Allen retail outlets as "design centers" instead of "stores" to better reflect these expanded capabilities. We have made, and continue to make, considerable investment in our business in order to expand and improve our interior design capabilities and to leverage our Company operated manufacturing and logistics operations. The Company was founded in 1932 and has sold products under theInteriors Inc., Ethan Allen brand name since 1937.Drive, Danbury, Connecticut 06811.
Mission Statement
Our primary business objective is to provide our customers with a convenient, full-service, one-stop shopping solution for their home decorating needs by offering complementary interior design services and stylish, high-quality products at good value. In order to meet our stated objective, we have developed and adhere to a focused and comprehensive business strategy. The elements of this strategy, each of which is integral to our solutions-based philosophy, include (i) our vertically integrated operating structure, (ii) our stylish products and related marketing initiatives, (iii) our retail design center network, (iv) our people, and (v) our focus on providing interior design solutions.
ETHAN ALLEN INTERIORS INC. AND SUBSIDIARIES
Operating Segments
Our products are sold through a dedicated global network of approximately 300 retail design centers. As of June 30, 2013,2016, the Company operated 147143 design centers (our retail segment) and our independent retailers operated 148153 design centers (as compared to 147144 and 151,155, respectively, at the end of the prior fiscal year). Our wholesale segment net sales include sales to our retail segment (which are eliminated in consolidation), and sales to our independent retailers. Our retail segment net sales accounted for 79% of our consolidated net sales in fiscal 2013.2016. Our wholesale segment net sales to independent retailers accounted for 21%, including approximately 10%10.5% of our net sales in fiscal 20132016 to the ten largest independent retailers, who operate 89102 design centers. Our independent retailer in China operated 6883 of these locations at the end of fiscal 2013.2016.
Our wholesale and retail operating segments represent strategic business areas of our vertically integrated business that operate separately and provide their own distinctive services (further outlined below). This vertical structure enables us to more effectively offer our complete line of home furnishings and accessories andaccents more efficiently controleffectively while controlling quality and cost. For certain financial information regarding our operating segments, see Note 15 to the Consolidated Financial Statements included under Item 8 of this Annual Report and incorporated herein by reference.
Our home furnishings and accessoriesaccents are marketed and sold in a similar manner in our wholesale and retail segments, although the type of customer (wholesale versus retail) and the specific services that each operating segment provides are different. Within the wholesale segment, we maintain revenue information according to each respective product line (i.e. case goods, upholstery, or home accessoriesaccents and other). Case goods include items such as beds, dressers, armoires, tables, chairs, buffets, entertainment units, home office furniture, and wooden accents. Upholstery items include sleepers, recliners and other motion furniture, chairs, ottomans, custom pillows, sofas, loveseats, cut fabrics and leather. Skilled craftsmenartisans cut, sew and upholster custom-designed upholstery items which are available in a variety of frame, fabric and fabrictrim options. Home accessoryaccent and other items include window treatments and drapery hardware, wall decor, florals, lighting, clocks, bedding andmattresses, bedspreads, throws, pillows, decorative accessories,accents, area rugs, wall coverings and home and garden furnishings. The allocation of retail sales by product line follows that of the wholesale segment (see table of wholesale net sales allocated by product line in the Wholesale Segment Overview below).
We evaluate performance of the respective segments based upon revenues and operating income. Inter-segment transactions result, primarily, from the wholesale sale of inventory to the retail segment, including the related profit margin.
Wholesale Segment Overview:
Wholesale net sales for each of the last three fiscal years are summarized below (in millions):
Fiscal Year Ended June 30, 2013 2012 2011 Wholesale net sales $ 434.4 $ 456.9 $ 422.9
Fiscal Year Ended June 30, | ||||||||||||
2016 | 2015 | 2014 | ||||||||||
Wholesale net sales | $ | 491.5 | $ | 469.4 | $ | 453.6 | ||||||
Wholesale net sales for each of the last three fiscal years, allocated by product line, were as follows:
Fiscal Year Ended June 30, | Fiscal Year Ended June 30, | |||||||||||||||||||||||
2013 | 2012 | 2011 | 2016 | 2015 | 2014 | |||||||||||||||||||
Case Goods | 37 | % | 38 | % | 39 | % | 32 | % | 34 | % | 36 | % | ||||||||||||
Upholstered Products | 48 | % | 44 | % | 46 | % | 51 | % | 48 | % | 48 | % | ||||||||||||
Home Accessories and Other | 15 | % | 18 | % | 15 | % | ||||||||||||||||||
Home Accents and Other | 17 | % | 18 | % | 16 | % | ||||||||||||||||||
| 100 | % | 100 | % | 100 | % | 100 | % | 100 | % | 100 | % | |||||||||||||
The wholesale segment, principally involved in the development of the Ethan Allen brand, encompasses all aspects of design, manufacture, sourcing, sale, and distribution of our broad range of home furnishings and accessories.accents. Wholesale revenue is generated upon the wholesale sale and shipment of our products to our network of independently operated design centers and Company operated design centers (see Company operated retail comments below) through its national distribution center and one other smaller fulfillment center.
ETHAN ALLEN INTERIORS INC. AND SUBSIDIARIES
During the past year, independent retailers opened 1115 new design centers (twoand closed 16, two of which were relocations), acquired two from the Company, closed 12, and sold two to the Company.relocations. We continue to promote the growth and expansion of our independent retailers through ongoing support in the areas of market analysis, site selection, and business development. As in the past, our independent retailers are required to enter into license agreements with us, which (i) authorize the use of certain Ethan Allen trademarks and (ii) require adherence to certain standards of operation, including a requirement to fulfill related warranty service agreements. We are not subject to any territorial or exclusive retailer agreements in North America. The wholesale segment also develops and implements related marketing and brand awareness programs.
Wholesale profitability includes (i) the wholesale gross margin, which represents the difference between the wholesale net sales price and the cost associated with manufacturing and/or sourcing the related product, and (ii) other operating costs associated with wholesale segment activities.
Approximately 70%75% of the products sold by the Company are manufactured in its North American plants. During fiscal 2013,2016, the Company’s case goods manufacturing footprint remained stable, whileincreased 59,000 square feet, further increasing throughput in our two newest Company operated North AmericanHonduras facility. In our upholstery plants in Maiden, North Carolina we expanded production capacity and built a new R&D facility. A 300,000 square foot expansion is underway at our upholstery plant in Mexico and Honduras by adding skilled workers and state-of-the-art manufacturing equipment.which we anticipate completing during fiscal 2017. We operate four case good plants (two in Vermont including one sawmill, one in North Carolina, and one in Honduras), threefour upholstery plants (two in(three at our North Carolina campus, and one in Mexico) and one home accessoryaccent plant in New Jersey. We also source selected case goods, upholstery, and home accessoryaccent items from third-party suppliers domestically and abroad.
As of June 30, 2013,2016, our wholesale backlog was $48.0$40.3 million (as compared to $49.5$63.7 million as of June 30, 2012)2015) which is anticipated to be serviced in the first quarter of fiscal 2014.2017. This backlog fluctuates based on the timing of net orders booked, manufacturing schedules and efficiency, the timing of sourced product receipts, and the timing and volume of wholesale shipments.shipments, and the timing of various promotional events. Because orders may be rescheduled and/or canceled and the sourcing timing may change, the measure of backlog at a point in time mayis not necessarily be indicative of future sales performance.
For the twelve months ended June 30, 2013,2016, net orders booked at the wholesale level, which includes orders generated by independently operated and Company operated design centers, totaled $434.1$470.7 million as compared to $442.3$487.4 million for the twelve months ended June 30, 2012.2015. In any given period, net orders booked may be impacted by the timing of floor sample orders received in connection with new product introductions which were significant during the prior fiscal year ended June 30, 2012.introductions. New product offerings may be made available to the retail network at any time during the year, including in connection with our periodic retailer conferences.
Retail Segment OverviewOverview::
Retail net sales for each of the last three fiscal years are summarized below (in millions):
Fiscal Year Ended June 30, | ||||||||||||
2016 | 2015 | 2014 | ||||||||||
Retail net sales | $ | 626.5 | $ | 579.7 | $ | 580.7 | ||||||
Fiscal Year Ended June 30, 2013 2012 2011 Retail net sales $ 578.3 $ 559.4 $ 505.9
Retail net sales for each of the last three fiscal years, allocated by product line, were as follows:
Fiscal Year Ended June 30, | ||||||||||||
2016 | 2015 | 2014 | ||||||||||
Case Goods | 30 | % | 32 | % | 33 | % | ||||||
Upholstered Products | 48 | % | 45 | % | 45 | % | ||||||
Home Accents and Other | 22 | % | 23 | % | 22 | % | ||||||
| 100 | % | 100 | % | 100 | % | |||||||
The retail segment sells home furnishings and accessoriesaccents to consumers through a network of Company operated design centers. During fiscal 2013, we opened seven design centers (three of which were relocations), acquired two from independent retailers, closed four design centers and sold two to our independent retailers. The Company also offers access to its products to qualified independent interior designers through our interior design affiliate (“IDA”) program. Retail revenue is generated upon the retail sale and delivery of our products to our retail customers through our network of service centers. Retail profitability reflects (i) the retail gross margin, which represents the difference between the retail net sales price and the cost of goods, purchased primarily from the wholesale segment, and (ii) other operating costs associated with retail segment activities.
We measure the performance of our design centers based on net sales and written orders booked on a comparable period to period basis. Comparable design centers are those which have been operating for at least 15 months. During the first three months of operations of newly opened (including relocated) design centers, written orders are booked but minimal net sales are achieved through the delivery of products. Design centers we acquire from independent retailers are included in comparable design center sales in their 13th full month of Ethan Allen-owned operations. The frequency of our promotional events as well as the timing of the end of those events can also affect the comparability of orders booked during a given period.
We pursue further expansion of the Company operated retail business by adding interior design professionals and expanding the IDA program, opening new design centers, relocating existing design centers and, when appropriate, acquiring design centers from independent retailers. During fiscal 2013,2016 our reach was expanded further through our launch of our gift registry, and through establishing licensing arrangements with Disney Consumer Products, an affiliate program with the Army and Air Force Exchange Service and marketing agreements with several leading national real estate brokerages. During fiscal 2016, we opened oneten new design center in Canada and two in Belgium. We also launchedwww.ethanallen.ca, our new multi-lingual website and near the endcenters, six of the fiscal year moved the Company’s U.S. based website onto a cloud based platform. These are our first Company operated design centers in non-English speaking international markets.which were relocations. The geographic distribution of retail design center locations is included under Item 2 of Part I of this Annual Report.
Products
Our strategy has been to position Ethan Allen as a preferred brand offering complimentary design service together with products of superior style, quality and value while, at the same time, providingto provide consumers with a comprehensive, one-stop shopping solution for their home furnishing and interior design needs. In carrying out our strategy, we continue to expand our reach to a broader consumer base through a diverse selection of attractively priced products, designed to complement one another, reflecting the popular trend toward eclecticcurrent fashion trends in home decorating. During fiscal 2013,2016, the Company introducedcontinued to strengthen its product offerings by introducing new Fresh Colorsproducts to retail consumers in case goods, upholstery, and American Colorhome accents, by introducing a very large collection of new products and existing products in new finishes under the umbrella of “Romantic Classics”, “Casual Classics”, and the Impressions product line that take advantageexpansion of the Company’sour custom manufacturing capabilitiesquick-ship program. Much of our furniture is built by hand, one piece at a time, in itsour North American plants. These introductions follow a significant change in products begun in fiscal 2012, when the Company introduced significantly more new products than normal, refreshing a broad range of its products. Regular product introductions, aworkshops. Most frames are hand-assembled and stitching is guided by hand. We select international partners who are as committed to quality as we are. All case good frames are made with premium lumber and veneers. We use best-in-class construction techniques, including mortise and tenon joinery and four-corner glued dovetail joinery on drawers. We combine technology with personal service and maintain an up-to-date broad range of styles and selections within our custom upholstery and case good lines, new finishes for, and redesigns of, previous product introductions, and expanded product offerings to accommodateoptions in keeping with today’s home decorating trends,trends. These factors continue to redefinedefine Ethan Allen, positioning us as a leader in style.home fashion.
All of our case goods, upholstered products, and home accessories are styled with distinct design characteristics. Home accessories play an important role in our marketing strategy as they enable us to offer the consumer the convenience of one-stop shopping by creating a comprehensive home furnishing solution. ETHAN ALLEN INTERIORS INC. AND SUBSIDIARIES
The interior of our design centers, iswhich were substantially refreshed during the past two fiscal years, are organized to facilitate display of our product offerings, both in room settings that project the category lifestyle and by product grouping to facilitate comparisons of the styles and tastes of our clients. To further enhance the experience, technology is used to expand the range of products viewed by including content from our award-winning website and advancedin applications used on large touch-screen flat panel displays.
We continuously monitor changes in home designfashion trends through attendance at international industry events and fashion shows, internal market research, and regular communication with our retailers and design center design consultants who provide valuable input on consumer tendencies.trends. We believe that the observations and input gathered enable us to incorporate appropriate style details into our products to react quickly to changing consumer tastes.
Product Development and Sourcing Activities
Using a combination of on staff and outsourced artisans,product designers, we design the majority of the products we sell; all of which are branded Ethan Allen. This important facet of our vertically integrated business enables us to control the design specifications and establish consistent levels of quality across the products in our own North American plants. To capitalize on this vertical integration, between the fall of 2014 and the spring of 2016, the Company undertook a significant redesign of products. Much of the product offerings. Wedesign took advantage of the Company’s custom manufacturing capabilities in its North American plants, where we manufacture and / or assemble approximately 70%75% of the products we sell, in our own North American plants making us one of the largest manufacturers of home furnishings in the United States. Our main manufacturing facilities are located in the Northeast and Southeast regions of the United States supported by an upholstery plant in Mexico and a case goods plant in Honduras. Our plants are located near sources of raw materials and / or skilled craftspeople.artisans. We source approximately 30%25% of the products we sell from third-party suppliers, most of which are located outside the United States, primarily in Asia. We carefully select our sourcing partners and require them to provide products according to our specifications and quality standards. We believe that relatively minor strategic investments in our manufacturing facilities balanced with outsourcing from foreign and domestic suppliers will accommodate significant future sales growth and allow us to maintain an appropriate degree of control over cost, quality and service to our customers.
We take pride inare focused on environmental and social responsibility and incorporating uniform environment, health and safety programs into our manufacturing standards. Our “green” initiatives includinginclude but are not limited to the use of responsibly harvested Appalachian woods, water based finishes organic cotton textilesand measuring our carbon footprint, greenhouse gases and recycled materials infrom our products.operations. We have also reduced our carbon footprint by using the wooden waste from our case goods manufacturing plants to generate heat and electricity for our plants in the Northeast. This led to receipt in 2013 of the Vermont Governor’s Award for Environmental Excellence. This year we expanded our voluntary participation inimplemented the Enhancing Furniture’s Environmental Culture (EFEC) programenvironmental management system sponsored by the American Home Furnishing Alliance already in place in(AHFA) at all of our domestic manufacturing, facilities. This program requires participatingdistribution and service center facilities, and have begun to expand these effort to our retail design centers. Our domestic manufacturing, distribution and service centers have also achieved Sustainable by Design (SBD) registration under the EFEC program. Our Silao Mexico facility has also been audited and registered under the AHFA's EFEC program. SBD provides a framework for home furnishings companies to analyzecreate and better understand themaintain a corporate culture of conservation and environmental impact of processes, raw materialsstewardship by integrating socio-economic policies and finished products on a facility-by-facility basis.sustainable business practices into their manufacturing operations and sourcing strategies.
Raw Materials and Other Suppliers
The most important raw materials we use in furniture manufacturing are lumber, veneers, plywood, hardware, glue, finishing materials, glass, mirrored glass, laminates, fabrics, foam, and filling material. The various types of wood used in our products include cherry, ash, oak, maple, prima vera, African mahogany, birch, rubber wood and pine; substantially all of which are purchased domestically.poplar.
ETHAN ALLEN INTERIORS INC. AND SUBSIDIARIES
Fabrics and other raw materials are purchased both domestically and outside the United States. We have no significant long-term supply contracts, and have sufficient alternate sources of supply to prevent disruption in supplying our operations. We maintain a number of sources for our raw materials, which we believe contribute to our ability to obtain competitive pricing. Lumber prices and availability fluctuate over time based on factors such as weather and demand, which, in turn, impact availability.demand. The cost of some of our raw materials (suchsuch as foam)foam and the shipping costs on purchased finished goods are dependent on petroleum cost. Higher material prices, cost of petroleum, and purchased finished goods pricescosts of sourced products could have an adverse effect on margins.
Appropriate amounts of lumber and fabric inventory are typically stocked to maintain adequate production levels. We believe that our sources of supply for these materials are sufficient and that we are not dependent on any one supplier. Within our existing case goods manufacturing sites, we have “supermarkets of parts” housing the components used in our custom manufacturing of those products.
We enter into standard purchase agreements with certain foreign and domestic suppliers to source selected case goods, upholstery, and home accessoryaccent items. The terms of these arrangements are customary for the industry and do not contain any long-term contractual obligations on our behalf. We believe we maintain good relationships with our suppliers.
Distribution and Logistics
We distribute our products through one primarythree distribution center,centers, owned by the Company, strategically located in New Jersey, Oklahoma, and Virginia. This nationalThese distribution center is supported by a smaller Company owned order fulfillment center located in Oklahoma. Our primary distribution center providescenters provide efficient cross-dock operations to receive and ship product from our manufacturing facilities and third-party suppliers to our network of Company and independently operated retail service centers. Retail service centers prepare products for delivery into clients’ homes. At June 30, 2013,2016, the Company operated retail design centers were supported by 13 Company operated retail service centers plus nineand 14 service centers operated by third party service companies.parties.
While we manufacture to custom order the majority of our products, we also stock selected case goods, upholstery and accessorieshome accents to provide for quick delivery of in-stock items and to allow for more efficient production runs. Ethan Allen Express, a program that markets a selection of attractively priced products held in stock for faster delivery, further enhances our ability to reduce lead times for our clients. Wholesale shipments utilize our own fleet of trucks and trailers or are subcontracted with independent carriers. Approximately 89%Our fleet of our fleet (trucks and trailers) is owned, with the remaindertrucks are financed under operating and capital lease agreements with remaining terms ranging from less than onetwo to five years.over three years, and all of our trailers are owned.
Our practice has been to sell our products at the same delivered cost to all Company and independently operated design centers nationwide,in North America, regardless of their shipping point. This policy creates pricing credibility with our wholesale customers while providing our retail network the opportunity to achieve more consistent margins by removing fluctuations attributable to the cost of shipping. Further, this policy eliminates the need for our independent retailers to carry significant amounts of inventory in their own warehouses. As a result, we obtain more accurate consumer product demand information.
Marketing Programs
Our marketing and advertising strategies are developed to drive traffic into our network of design centers and to ethanallen.com. We believe these strategies give Ethan Allen a strong competitive advantage in the home furnishings industry. We create and coordinate print, digital and television campaigns nationally, as well as assist in international and local marketing and promotional efforts. The Company’s network of approximately 300 retail design centers, and approximately 4,000along with the over 6,000 independent members of the Interior Design Affiliate program, benefit from these marketing efforts, and we believe these efforts position us to consistently fulfill our brand promise.promise as America's Classic Design Brand.
Our team of advertising specialists sendscreates consistent, clear messages that Ethan Allen is a leader in stylehome fashion, designer services and service,classic style, with everything for the well designed home. We use several forms of media to accomplish this,communicate our message, including social media, digital advertising, television (national and local), direct mail, newspapers regionaland national shelter magazines, social media, email, and online advertising.magazines. These messages are also conveyed on our website at ethanallen.com. A strong email marketing campaignprogram delivers promotional messages, inspiration, design ideas and product brochures to a growing database of clients.
ETHAN ALLEN INTERIORS INC. AND SUBSIDIARIES
Our national television, social media, online and print advertising campaigns are designed to leverage our strong brand equity, finding creative and compelling ways to remind consumers of our tremendous range of products, services, special programs, and custom options. Coordinated local digital, television and print advertising also serve to support our national programs.
The Ethan Allen direct mail magazine, which emphasizes the eclectic mix of our wide breadth of products and our services, is one of our most importanta key marketing tools.tool. We publish these magazines and sell them to Company and independently operated design centers whothat use demographic information collected internally and through independent market research to target potential clients. Given the importance of this advertising medium, direct mail marketing lists are continually refined to target those consumers who are most likely to purchase, and improve the return on direct mail expenditures. Approximately 1523 million copies of our direct mail magazine were distributed to consumers during fiscal 2013.2016.
Our television advertising and direct mail efforts are supported by strong print campaigns. We also update our Style Book approximately every six months. The Style Book is a celebration of Ethan Allen’s rich history, as well as a catalog of our case goods, upholstery and accent products. Throughout the Style Book,At ethanallen.com we tell the stories of some inspiring associates, provide inspirational photos, and detail the attributes that have become Ethan Allen hallmarks over the years; fine craftsmanship, exceptional quality, great prices, style, personal service, white glove delivery and remarkable functionality, while maintaining the ability to produce about 70% of our offerings in our own workshops. This publication is a comprehensive and effective resource for our clients.
Ethanallen.com provides our clients and our associates with the tools they need to shop, design and design.buy. The website features a series of helpful tabs with videos, feature stories, designinspiring photography, engaging video content, and style solutions, and fresh, new looks. Those looking to shop our site can do so by lifestyle, by product, or by room in an easy-to-navigate format. The site's “My Projects” tool lets visitors create idea boards and room plans, and even gives them the option of consulting with a design professional from their local Ethan Allen design center. Visitors to ethanallen.com will also find all our latest news and promotional information. Nearly all of This year we launched an enhanced user experience and streamlined the path to purchase by updating the designs to our category pages, product types, and checkout.
Ethan Allen’s products are available for purchase online, andAllen also has local websites in various international regions to support our list of on-line products are expanding. At the end of fiscal 2013, we migrated our website ontointernational licensees. These websites, some in local languages, provide a “cloud” platform, further enhancing search and usability featuresregionalized presentation of the site.brand while also linking to our main website.
We launched an online specialty store in partnership with the Army and Air Force Exchange Service. The specialty online store accessible through shopmyexchange.com is an Exchange members-only website. The Army and Air Force Exchange Service is dedicated to ensuring active and retired soldiers, airmen, and their families have access to U.S. goods and services, wherever they serve or live.
To enhance the Ethan Allen client experience, our Design Centersdesign centers have interactive touchscreens, where users can take our Style Quiz, browse our full product catalog, check out hundreds of fully designed rooms, print product descriptions, learn about promotions, and much more. Our design consultants utilize customized tablets so they can be more productive in our design centers and in our clients’ homes.
Our social media content is updated regularly and offersplatforms offer fans and followers inspirational images, trend information, and design ideas, as well as tips for how to bring distinctive Ethan Allen style to their homes. We have a robust and loyal following on Facebook, Pinterest, Instagram, Twitter, Google+, YouTube, LinkedIn and Houzz. Our products are available to buy on Pinterest where we were one of the first brands to launch with Pinterest’s buyable pins program.
Our new mover and marketing program with major realtors brings Ethan Allen into targeted homes at the moment homeowners are most likely in the market for new furnishings. This program educates qualified consumers about our services and product offerings and is an extension of our designers’ grassroots marketing efforts.
We also have a robust and informative extranet available to our retailers and design professionals. It is the primary source of communication in and among members of our retail network. It provides information about every aspect of the retail business at Ethan Allen, including advertising materials, prototype floor plan displays, and extensive product details. Some of our design consultants utilize customized tablets so they can be more productive in our clients’ homes.
Retail Design Center Network
Ethan Allen design centers are typically located in busy urbanretail settings as freestanding destinations or as part of suburban strip malls or shopping malls, depending upon the real estate opportunities in a particular market. Our design centers average approximately 16,000 square feet in size but range from approximately 3,000with 75% between 15,000 and 25,000 square feet to 35,000and 20% less than 15,000 square feet and 5% greater than 25,000 square feet.
ETHAN ALLEN INTERIORS INC. AND SUBSIDIARIES
Combining technology with personal service in our design centers has allowed us to reduce the size of our design centers. At June 30, 2016 we operated 19 design centers that have opened in the past three years, and these average 8,700 square feet. These smaller footprint design centers reflect our direction as we move forward in repositioning our retail design center network. These new and relocated design centers also reflect our shift from destination and shopping mall locations to lifestyle centers that better project our brand and offer increased traffic opportunities.
We maximize uniformitymaintain consistency of presentation throughout the retail design center network through a comprehensive set of standards and display planning assistance. These standard interior display design formatsstandards assist each design center in presenting a high quality image by using focused lifestyle settings and select product category groupings to display our products and information to facilitate design solutions and to educate consumers. We also create a uniform design center image with consistent brand projection through our exterior facades in addition to the interior layouts.and signage. The adherence to allestablishment of these standards havehas helped position Ethan Allen as a leader in home furnishings retailing.
We continue to strengthen the retail network with many initiatives, including the opening of new and relocating design centers in desirable locations, updating presentations and floor plans, strengthening of the professionalism of our designers through training and certification, and the consolidation of certain design centers and service centers.
People
At June 30, 2013,2016, the Company , through its subsidiaries, had approximately 4,9005,200 employees (“associates”), approximately one percentnone of whom are represented by unions whose collective bargaining agreements expire within the next year.unions. We expect no significant changes in our relations with the unions and believe we maintain good relationships with our employees.
The retail network, which includes both Company subsidiaries and independently operated design centers, is staffed with a sales force of interior design consultants and service professionals who provide customers with effectivecomplimentary home decorating solutions at no additional charge.and interior design solutions. Our interior design associates receive specialty training with respect to the distinctive design and quality features inherent in each of our products and programs. This enables them to more effectively communicate the elements of style and value that serve to differentiate us from our competition. As such, we believe our design consultants, and the complimentary service they provide, create a distinct competitive advantage over other home furnishing retailers. We continue to strengthen the level of service, professionalism, interior design competence, efficiency, and effectiveness of retail design center associates.
The Company’s interior design affiliate program now has over 4,000 qualified professional interior design affiliates, who addadds further strength and breadth to our interior design reach. We believe that this program augments the Company and independent retailer design staffscenter design staff to reach more clients and improve market penetration.
We recognize the importance of our retail design center network to our long-term success. Accordingly, we believe we (i) have established a strong management team within Company operated design centers and (ii) continue to work closely with our independent retailers in order to assist them. With this in mind, we make our services available to every design center, whether independently operated or Company operated, in support of their marketing efforts, including coordinated advertising, merchandising and display programs, and by providing extensive training seminars and educational materials. We believe that the development of design consultants, service and delivery personnel, and independent retailers is important for the growth of our business. As a result, we have committed to make available comprehensive retail training programs intended to increase the customer service capabilities of each individual.
ETHAN ALLEN INTERIORS INC. AND SUBSIDIARIES
Customer Service Offerings
We offer numerous customer service programs, each of which has been developed and introduced to consumers in an effort to make their shopping experience easier and more enjoyable.
Gift Card
This programallowsprogram allows customers to purchase and redeem gift cards through our website or at any participating retail design center, which can be redeemedused for any of our products or services.
On-Line Room Planning
On our website, we offer an interactive on-line room planning resource which serves to further assist consumers with their home decorating needs. Through the use of this web-based tool, customers can determine which of our product offerings best fit their particular needs based on their own individual home floor plan.
Ethan Allen Consumer Credit Programs
The Ethan Allen Finance PlusPlatinum program offers consumers (clients) a menu of custom financing options. Financing offered through this program is administered by a third-party financial institution and is granted to our customers on a non-recourse basis to the Company. Clients may apply for an Ethan Allen Finance PlusPlatinum card at any participating design center or on-line at ethanallen.com.
Competition
The domestic and global home furnishings industry faces numerous challenges, which include an influx of low-priced products from overseas. As a result, there is a high degree of competition in our markets. The “Great Recession’ of 2008-2009 resulted in many small and medium sized furniture retailers going out of business, and other well-established competitors resorting to heavy discounts to attract customers. We differentiate ourselves as a preferred brand by adhering to a business strategy focused on providing (i) high-quality, well designed and often custom, handmade products at good value, (ii) a comprehensive complement of home furnishing design solutions, including our complimentary design service, and (iii) excellence in customer service. We consider our vertical integration a significant competitive advantage in the current environment as it allows us to design, manufacture and source, distribute, market, and sell our products through one of the industry’s largest single-source retail networks.
The internet also provides a highly competitive medium for the sale of a significant amount of home furnishings each year. Muchyear, and we believe it is becoming increasingly important. Although much of that product is sold through commodity oriented, low priced and low service retailers.retailers, we believe consumers are spending more time window shopping on the internet and are thus better informed when they do visit our brick and mortar facilities. At Ethan Allen, the ultimate goal of our internet strategy is to drive traffic into our network of design centers by couplingcombining technology with excellent personal service. At ethanallen.com, customers have the opportunity to buy our products online but we take the process further. With so much of our product offering being custom, we encourage our website customers to get online help from our network of interior design professionals. This complimentary interior design support creates a competitive advantage through our excellent personal service. This enhances the online experience and regularly leads to internet customers becoming clients of our network of interior design centers.
Industry globalization has provided us an opportunity to adhere to a blended sourcing strategy, establishing relationships with certain manufacturers, both domestically and outside the United States, to source selected case goods, upholstery, and home accessoryaccent items. We intend to continue to balance our domesticown North American production with opportunities to source from foreign and domestic manufacturers, as appropriate, in order to maintain our competitive advantage.
We believe the home furnishings industry competes primarily on the basis of product styling and quality, personal service, prompt delivery, product availability and price. We further believe that we effectively compete on the basis of each of these factors and that, more specifically, our direct manufacturing, product presentations, website, and complimentary design service create a distinct competitive advantage, further supporting our mission of providing consumers with a complete home decorating and design solution. We also believe that we differentiate ourselves further with the quality of our design service through our intensive training. Our objective is to continue to develop and strengthen our retail network by (i) expanding the Company operated retail business through the repositioning of ourand opening of new design centers, and (ii) obtaining and retaining independent retailers, encouraging such retailers to expand their business through the opening or relocation of new design centers with the objective of increasing the volume of their sales and (iii) further expanding our sales network through our IDA program.and realtor referral programs and (iv) further expanding our ecommerce.
ETHAN ALLEN INTERIORS INC. AND SUBSIDIARIES
Trademarks
We currently hold, or have registration applications pending for, numerous trademarks, service marks and design patentscopyrights for the Ethan Allen name, logos and designs in a broad range of classes for both products and services in the United States and in many foreign countries. In addition, we have registered, or have applications pending for certain of our slogans utilized in connection with promoting brand awareness, retail sales and other services and certain collection names. We view such trademarks and service marks as valuable assets and have an ongoing program to diligently monitor and defend, through appropriate action, against their unauthorized use.
Available InformationExecutive Officers of the Registrant
Set forth in the table below is a list of our executive officers, together with certain biographical information, including their ages as of the date of this Report:
We make available, free of charge via our website, all Annual Reports on Form 10-K, Quarterly Reports on Form 10-Q, Current Reports on Form 8-K and other information filed with, or furnished to, the Securities and Exchange Commission (the "SEC" or the "Commission"), including amendments to such reports. This information is available at www.ethanallen.com/investors as soon as reasonably practicable after it is electronically filed with, or furnished to, the SEC. In addition, the SEC maintains a website that contains reports, proxy and information statements, and other information regarding companies that file electronically with the Commission. This information is available at www.sec.gov.
In addition, charters of all committees of our Board of Directors, as well as our Corporate Governance guidelines, are available on our website at www.ethanallen.com/governance or, upon written request, in printed hardcopy form. Written requests should be sent to Office of the Secretary, Ethan Allen Interiors Inc., Ethan Allen Drive, Danbury, Connecticut 06811.
M. Farooq Kathwari, age 71 |
| ● Chairman of the Board, President and Chief Executive Officer since 1988 |
Daniel M. Grow, age 70 |
| ● Senior Vice President, Business Development since February 2015 |
| ● Vice-President, Business Development from 2009 to 2015 |
Eric D. Koster, age 69 |
| ● Vice-President, General Counsel and Secretary since April 2013 |
| ● Private practice prior to joining the Company in April 2013 |
Tracy Paccione, age 50 |
| ● Vice-President, Merchandising since June 2009 |
Clifford Thorn, age 64 |
| ● Vice-President, Upholstery Manufacturing since May 2001 |
Corey Whitely, age 56 |
| ● Executive Vice-President, Administration, Chief Financial Officer and Treasurer since July 2014 |
| ● Executive Vice-President, Operations from October 2007 through July 2014 |
Item 1A. Risk Factors
The following information describes certain significant risks and uncertainties inherent in our business that should be carefully considered, along with other information contained elsewhere in this reportAnnual Report and in other filings, when making an investment decision with respect to us. If one or more of these risks actually occurs, the impact on our business, including our financial condition, results of operations, and cash flows could be adverse.
An economic downturn may materially adversely affect our business.
Our business and results of operations are affected by international, national and regional economic conditions. Regional economic conditions in the United States and in other regions of the world where we have a concentration of design centers such as Canada or China may impact the Company greater compared to economic conditions in other parts of the world where we have lesser concentration of design centers. The United States and many other international economies experienced a major recession, which reduced the available market size for our industry from historic peak levels. While we have recalibrated the footprint of our vertically integrated enterprise to be profitable with lower revenues than achieved at our historic peak, an economic downturn of significance or extended duration may materiallycouldadversely affect consumer demand and discretionary spending habits and, as a result, our business performance,businessperformance, profitability, and cash flows.
Access to consumer credit could be interrupted and reduce sales and profitability.
Our ability to continue to access consumer credit for our clients could be negatively affected by conditions outside our control. If capital market conditions were to worsen meaningfully, there is a risk that our business partner that issues our private label credit card program under a contract that expires July 2014 may not be able to fulfill its obligations under that agreement. In addition, further tightening of credit markets may restrict our customers’the ability and willingness of customers to make purchases.
ETHAN ALLEN INTERIORS INC. AND SUBSIDIARIES
We may be unable to obtain sufficient external funding to finance our operations and growth.
Historically, we have relied upon our cash from operations to fund our debt service, operations and growth. As we operate and expand our business, we may rely on external funding sources, including the proceeds from the issuance of additional debt or use of the $50$115 million revolving bank line of credit under our existing $150 million credit facility. The credit facility bears interest at a floating rate and there is a risk that the rate will increase and as we are not hedging our interest rate for the credit facility, our debt service costs could increase. Any unexpected reduction in cash flow from operations could increase our external funding requirements to levels above those currently available. The credit rating agencies Moody’s Corporation and Standard and Poor’s most recent rating of our corporate and senior unsecured credit is Ba2 and BB- respectively. If our credit ratings were lowered further, the Company’s access to debt could be negatively impacted. There can be no assurance that we will not experience unexpected cash flow shortfalls in the future or that any increase in external funding required by such shortfalls will be available on acceptable terms or at all.
Operating losses could reduce our liquidity and impact our dividend policy.
Historically, we have relied on our cash from operations or debt issuances to fund our operations and the payment of cash dividends. If the Company’s financial performance were to deteriorate resulting in financial losses we may not be able to fund a shortfall from operations and would require external funding. Some financing instruments used by the Company historically may not be available to the Company in the future. We cannot assure that additional sources of financing would be available to the Company on commercially favorable terms should the Company's capital requirements exceed cash available from operations and existing cash and cash equivalents. In such circumstances, the Company may reduce its quarterly dividends.
Additional impairment charges could reduce our profitability.
We have significant long-lived tangible and intangible assets recorded on our balance sheets. If our operating results decline, we may incur impairment charges in the future, which could have a material impact on our financial results. We evaluate the recoverability of the carrying amount of our long-lived tangible and intangible assets on an ongoing basis. There can be no assurance that the outcome of such future reviews will not result in substantial impairment charges. Impairment assessment inherently involves judgments as to assumptions about expected future cash flows and the impact of market conditions on those assumptions. Future events and changing market conditions may impact our assumptions as to prices, costs or other factors that may result in changes in our estimates of future cash flows. Although we believe the assumptions we use in testing for impairment are reasonable, significant changes in any of our assumptions could produce a significantly different result.
Weface changes in global and local economic conditions that may adversely affect consumer demand and spending, our manufacturing operations or sources of merchandise.merchandise and international operations.
Historically, the home furnishings industry has been subject to cyclical variations in the general economy and to uncertainty regarding future economic prospects. Such uncertainty, as well as other variations in global economic conditions such as rising fuel costs, wage and benefit inflation, currency fluctuations, and increasing interest rates, may continue to cause inconsistent and unpredictable consumer spending habits, while increasing our own input costs. These risks, as well as industrial accidents or work stoppages, could also severely disrupt our manufacturing operations, which could have a material adverse effect on our financial performance.
ETHAN ALLEN INTERIORS INC. AND SUBSIDIARIES
We import a portion of our merchandise from foreign countries and operate manufacturing plants in Mexico and Honduras.Honduras and operate retail design centers in Canada. As a result, our ability to obtain adequate supplies or to control our costs may be adversely affected by events affecting international commerce and businesses located outside the United States, including natural disasters, changes in international trade, central bank actions, changes in the relationship of the U.S. dollar versus other currencies, labor availability and cost, and other governmental policies of the U.S. and the countries from which we import our merchandise or in which we operate facilities. The inability to import products from certain foreign countries or the imposition of significant tariffs could have a material adverse effect on our results of operations.
Competition from overseas manufacturers and domestic retailers may adversely affect our business, operating results or financial condition.
Our wholesale business segment is involved in the development of our brand, which encompasses the design, manufacture, sourcing, sales and distribution of our home furnishings products, and competes with other U.S. and foreign manufacturers. Our retail network sells home furnishings to consumers through a network of Company operated design centers, and competes against a diverse group of retailers ranging from specialty stores to traditional furniture and department stores, any of which may operate locally, regionally and nationally, as well as over the internet. We also compete with these and other retailers for appropriate retail locations as well as for qualified design consultants and management personnel. Such competition could adversely affect our future financial performance.
Industry globalization has led to increased competitive pressures brought about by the increasing volume of imported finished goods and components, particularly for case good products, and the development of manufacturing capabilities in other countries, specifically within Asia. The increase in overseas production capacity has created over-capacity for many manufacturers, including us, which has led to industry-wide plant consolidation. In addition, because many foreign manufacturers are able to maintain substantially lower production costs, including the cost of labor and overhead, imported product may be capable of being sold at a lower price to consumers, which, in turn, could lead to some measure of further industry-wide price deflation.
We cannot provide assurance that we will be able to establish or maintain relationships with sufficient or appropriate manufacturers, whether foreign or domestic, to supply us with selected case goods, upholstery and home accessoryaccent items to enable us to maintain our competitive advantage. In addition, the emergence of foreign manufacturers has served to broaden the competitive landscape. Some of these competitors produce furniture types not manufactured by us and may have greater financial resources available to them or lower costs of operating. This competition could adversely affect our future financial performance.
Failure to successfully anticipate or respond to changes in consumer tastes and trends in a timely manner could adversely impact our business, operating results and financial condition.
Sales of our products are dependent upon consumer acceptance of our product designs, styles, quality and price. We continuously monitor changes in home design trends through attendance at international industry events and fashion shows, internal marketing research, and regular communication with our retailers and design consultants who provide valuable input on consumer tendencies. However, as with all retailers, our business is susceptible to changes in consumer tastes and trends. Such tastes and trends can change rapidly and any delay or failure to anticipate or respond to changing consumer tastes and trends in a timely manner could adversely impact our business, operating results and financial condition.
ETHAN ALLEN INTERIORS INC. AND SUBSIDIARIES
Our number of manufacturing and logistics sites may increase our exposure to business disruptions and could result in higher transportation costs.
We have reduced thea limited number of manufacturing sites in our case good and upholstery operations, consolidated our distribution network into fewer centers for both wholesale and retail segments, and operate a single accessorieshome accents plant. Our upholstery operations consist of twothree upholstery plants onat our Maiden, North Carolina campus and one plant in Mexico. The Company operates three manufacturing plants (North Carolina, Vermont, and Honduras) and one sawmill in support of our case goods operations. Our plants require various raw materials and commodities such as logs and lumber for our case good plants and foam, springs and engineered hardwood board for our upholstery plants. As a result of the consolidation of our manufacturing operations into fewer facilities, if any of our manufacturing or logistics sites experience significant business interruption, our ability to manufacture products or deliver timely would likely be impacted. While we have long-standing relationships with multiple outside suppliers of our raw materials and commodities, there can be no assurance of their ability to fulfill our supply needs on a timely basis. The consolidation to fewer locations has resulted in longer distances for delivery and could result in higher costs to transport products if fuel costs increase significantly.
Our current and former manufacturing and retail operations and products are subject to increasingly stringent environmental, health and safety requirements.
We use and generate hazardous substances in our manufacturing and retail operations. In addition, both the manufacturing properties on which we currently operate and those on which we have ceased operations are and have been used for industrial purposes. Our manufacturing operations and, to a lesser extent, our retail operations involve risk of personal injury or death. We are subject to increasingly stringent environmental, health and safety laws and regulations relating to our products, current and former properties and our current operations. These laws and regulations provide for substantial fines and criminal sanctions for violations and sometimes require product recalls and/or redesign, the installation of costly pollution control or safety equipment, or costly changes in operations to limit pollution or decrease the likelihood of injuries. In addition, we may become subject to potentially material liabilities for the investigation and cleanup of contaminated properties and to claims alleging personal injury or property damage resulting from exposure to or releases of hazardous substances or personal injury because of an unsafe workplace.
In addition, noncompliance with, or stricter enforcement of, existing laws and regulations, adoption of more stringent new laws and regulations, discovery of previously unknown contamination or imposition of new or increased requirements could require us to incur costs or become the basis of new or increased liabilities that could be material.
Fluctuations in the price, availability and quality of raw materials could result in increased costs or cause production delays which might result in a decline in sales, either of which could adversely impact our earnings.
We use various types of wood, foam, fibers, fabrics, leathers, and other raw materials in manufacturing our furniture. Certain of our raw materials, including fabrics, are purchased domestically and outside North America. Fluctuations in the price, availability and quality of raw materials could result in increased costs or a delay in manufacturing our products, which in turn could result in a delay in delivering products to our customers. For example, lumber prices fluctuate over time based on factors such as weather and demand, which in turn, impact availability. Production delays or upward trends in raw material prices could result in lower sales or margins, thereby adversely impacting our earnings.
In addition, certain suppliers may require extensive advance notice of our requirements in order to produce products in the quantities we desire. This long lead time may require us to place orders far in advance of the time when certain products will be offered for sale, thereby exposing us to risks relating to shifts in consumer demand and trends, and any significant downturn in the U.S. economy.
ETHAN ALLEN INTERIORS INC. AND SUBSIDIARIES
We depend on key personnel and could be affected by the loss of their servicesservices..
The success of our business depends upon the services of certain senior executives, and in particular, the services of M. Farooq Kathwari, Chairman of the Board, President and Chief Executive Officer, who is the only one of our senior executives who operates under a written employment agreement. The loss of any such person or other key personnel could have a material adverse effect on our business and results of operations.
Our business is sensitive to increasing labor costs, competitive labor markets, our continued ability to retain high-quality personnel and risks of work stoppages.
The market for qualified employees and personnel in the retail and manufacturing industries is highly competitive. Our success depends upon our ability to attract, retain and motivate qualified craftsmen,artisans, professional and clerical associates and upon the continued contributions of these individuals. We cannot provide assurance that we will be successful in attracting and retaining qualified personnel. A shortage of qualified personnel may require us to enhance our wage and benefits package in order to compete effectively in the hiring and retention of qualified employees. Our labor and benefit costs may continue to increase and such increases may not be recovered. In addition, some of our employees are covered by collective bargaining agreements with local labor unions. Although we do not anticipate any difficulty renegotiating these contracts as they expire, a labor-related stoppage by these unionized employees could adversely affect our business and results of operations. The loss of the services of such personnel or our failure to attract additional qualified personnelThis could have a material adverse effect on our business, operating results and financial condition.
Our success depends upon our brand, marketing and advertising efforts and pricing strategies. If we are not able to maintain and enhance our brand, or if we are not successful in these other efforts, our business and operating results could be adversely affected.
Maintaining and enhancing our brand is critical to our ability to expand our base of customers and may require us to make substantial investments. Our advertising campaign utilizes television, direct mail, newspapers, magazines and radio to maintain and enhance our existing brand equity. We cannot provide assurance that our marketing, advertising and other efforts to promote and maintain awareness of our brand will not require us to incur substantial costs. If these efforts are unsuccessful or we incur substantial costs in connection with these efforts, our business, operating results and financial condition could be adversely affected.
We may not be able to maintain our current design center locations at current costs. We may also fail to successfully select and secure design center locations.
Our design centers are typically located in busy urban settings as freestanding destinations or as part of suburban strip malls or shopping malls, depending upon the real estate opportunities in a particular market. Our business competes with other retailers and as a result, our success may be affected by our ability to renew current design center leases and to select and secure appropriate retail locations for existing and future design centers.
Our results of operations for any quarter are not necessarily indicative of our results of operations for a full year.
Sales of furniture and other home furnishing products fluctuate from quarter to quarter due to such factors as changes in global and regional economic conditions, changes in competitive conditions, changes in production schedules in response to seasonal changes in energy costs and weather conditions, and changes in consumer order patterns.patterns, and the timing of various promotional events. From time to time, we have experienced, and may continue to experience, volatility with respect to demand for our home furnishing products. Accordingly, results of operations for any quarter are not necessarily indicative of the results of operations for a full year.
ETHAN ALLEN INTERIORS INC. AND SUBSIDIARIES
Failure to protect our intellectual property could adversely affect us.
We believe that our patents,copyrights, trademarks, service marks, trade secrets, copyrights and all of our other intellectual property are important to our success. We rely on patent, trademark, copyright and trade secret laws, and confidentiality and restricted use agreements, to protect our intellectual property and may seek licenses to intellectual property of others. Some of our intellectual property is not covered by any patent, trademark, or copyright or any applications for the same. We cannot provide assurance that agreements designed to protect our intellectual property will not be breached, that we will have adequate remedies for any such breach, or that the efforts we take to protect our proprietary rights will be sufficient or effective. Any significant impairment of our intellectual property rights or failure to obtain licenses of intellectual property from third parties could harm our business or our ability to compete. Moreover, we cannot provide assurance that the use of our technology or proprietary know-how or information does not infringe the intellectual property rights of others. If we have to litigate to protect or defend any of our rights, such litigation could result in significant expense.
The Company relies heavily on information and technology to operate its business, and any disruption to its technology infrastructure (including cyber attacks) or the internet could harm the Company's operations.
We operate many aspects of our business including financial reporting, and customer relationship management through server and web-based technologies, and store various types of data on such servers or with third-parties who in turn store it on servers and in the “cloud”. Any disruption to the internet or to the Company's or its service providers' global technology infrastructure, including malware, insecure coding, “Acts of God,” attempts to penetrate networks, data leakagetheft or loss and human error, could have adverse affects on the Company's operations. Whileoperations.A cyber attack of our systems or networks that impairs our information technology systems could disrupt our business operations and result in loss of service to customers. We have a comprehensive cybersecurity program designed to protect and preserve the integrity of our information technology systems. We have experienced and expect to continue to experience actual or attempted cyber attacks of our IT systems or networks; however, none of these actual or attempted cyber attacks has had a material impact on our operations or financial condition. Additionally, we have access to sensitive customer information in the ordinary course of business. If a significant data breach occurred, our reputation may be adversely affected, customer confidence may be diminished, or we may be subject to legal claims, any of which may contribute to the loss of customers and have a material adverse impact on our business.While we have invested and continue to invest in information technology risk management, cybersecurity and disaster recovery plans, these measures cannot fully insulate the Company from technology disruptions or data theft or loss and the resulting adverse effect on the Company's operations and financial results.
We could incur substantial costs due to compliance with conflict mineral regulations, which may materially adversely affect our business, operating results, and financial condition.
The SEC has adopted rules regarding disclosure of the use of tantalum, tin, tungsten, and gold (commonly referred to as conflict minerals), which are mined from the Democratic Republic of the Congo and surrounding countries. This requirement could affect the sourcing of materials used in some of our products as well as the companies we use to manufacture our products. If our products are found to contain conflict minerals sourced from the Democratic Republic of the Congo or surrounding countries, the Company would take actions such as changing materials or designs to reduce the possibility that the purchase of conflict minerals may fund armed groups in the region. These actions could add engineering and other costs to the manufacture of our products.
We expect to incur costs to continue to upgrade our process to discover the origin of the tantalum, tin, tungsten, and gold used in our products, and to audit our conflict minerals disclosures. Our reputation and consequently our financial condition may also suffer if we have included conflict minerals originating in the Democratic Republic of the Congo or surrounding countries in our products, and those conflict minerals funded armed groups in the region.
ETHAN ALLEN INTERIORS INC. AND SUBSIDIARIES
Item 1B. Unresolved Staff Comments
None.
Item 2. Properties
Our 144,000 sq. ft. corporate headquarters, located in Danbury, Connecticut, consists of one building containing 144,000 square feet, situated on approximately 18.0 acres of land, all of which is owned by us. Locatedand adjacent to the corporate headquarters, and situated on approximately 5.4 acres, is the Ethan Allen Hotel and Conference Center, containing approximately 200 guestrooms. This hotel,guestrooms, are owned by a wholly-owned subsidiary of Ethan Allen,the Company. The hotel is used primarily for functions and accommodations for the general public as well as in connection with Ethan Allen functions and training programs, as well as for functions and accommodations for the general public.programs.
We operate eightnine manufacturing facilities located in the U.S., Mexico and Honduras. All of these facilities are owned by the Company and include four case good plants (including one sawmill) totaling 1,711,0001,789,000 square feet, threefour upholstery furniture plants totaling 820,000947,000 square feet, and one home accessoryaccent plant of 295,000177,000 square feet. Our wholesale division also owns and operates onethree national distribution center supported by one owned small parcel and fulfillment centercenters, one of which shares a facility with our manufacturing, which are a combined 829,0001,001,000 square feet. Two of our case goods manufacturing facilities are located in Vermont, one is in North Carolina and one is in Choloma, Honduras. We have twothree upholstery manufacturing facilities at our Maiden, North Carolina campus, and one in Guanajuato, Mexico. Our distribution facilityhome accents plant is located in Virginia.New Jersey, and our distribution facilities are located in New Jersey, Oklahoma, and Virginia .
We own fivethree and lease eightten retail service centers, totaling 993,000732,000 square feet. Our retail service centers are located throughout the United States and Canada and serve to support our various retail sales districts.
The location activity and geographic distribution of our retail design center network as of June 30, 20132016 is as follows:
Year-to-date Fiscal 2016 | Year-to-date Fiscal 2015 | |||||||||||||||||||||||
Independent retailers | Company- operated | Total | Independent retailers | Company- operated | Total | |||||||||||||||||||
Retail Design Center location activity: | ||||||||||||||||||||||||
Balance at beginning of period | 155 | 144 | 299 | 152 | 143 | 295 | ||||||||||||||||||
New locations | 15 | 10 | 25 | 22 | 4 | 26 | ||||||||||||||||||
Closures | (16 | ) | (12 | ) | (28 | ) | (17 | ) | (5 | ) | (22 | ) | ||||||||||||
Transfers | (1 | ) | 1 | - | (2 | ) | 2 | - | ||||||||||||||||
Balance at end of period | 153 | 143 | 296 | 155 | 144 | 299 | ||||||||||||||||||
Relocations (in new and closures) | 2 | 6 | 8 | 7 | 2 | 9 | ||||||||||||||||||
Retail Design Center geographic locations: | ||||||||||||||||||||||||
United States | 50 | 137 | 187 | 58 | 137 | 195 | ||||||||||||||||||
Canada | - | 6 | 6 | 2 | 6 | 8 | ||||||||||||||||||
Asia | 94 | - | 94 | 87 | - | 87 | ||||||||||||||||||
Europe | 2 | - | 2 | 1 | 1 | 2 | ||||||||||||||||||
Middle East | 7 | - | 7 | 7 | - | 7 | ||||||||||||||||||
Total | 153 | 143 | 296 | 155 | 144 | 299 | ||||||||||||||||||
Retail Design Center Category Company Operated Independently Operated United States Canada Asia Europe Middle East Total 139 62 6 3 - 79 2 - - 4 147 148
Of the 147143 Company operated retail design centers, 7166 of the properties are owned and 7677 of the properties are leased from independent third parties. Of the 7166 owned design centers, 17 are subject to land leases. We own ninesix additional retail properties, two of which are leased to independent Ethan Allen retailers, and four of which are leased to unaffiliated third parties. See Note 7 to the Consolidated Financial Statements included under Item 8 of this Annual Report for more information with respect to our operating lease obligations.
ETHAN ALLEN INTERIORS INC. AND SUBSIDIARIES
We believe that all of our properties are well maintained and in good condition. We estimate that our manufacturing plants are currently operating at approximately 70%66% of capacity.capacity based on their current shifts and staffing. We believe we have additional capacity at selected facilities, which we could utilize with minimal additional capital expenditures.
Item 3. Legal Proceedings
WeIn the ordinary course of our business, we are a party to various legal actions with customers, employeesproceedings and others arising inclaims which we believe are incidental to the normal courseoperation of our business. We maintain liability insurance,Other than as described under Note 13 to our consolidated financial statements included in Part II, Item 8 of this Annual Report on Form 10-K, we believe the ultimate outcome of these proceedings to which is deemed to be adequate for our needs and commensurate with other companies in the home furnishings industry. We believe that the final resolution of pending actions (including any potential liability not fully covered by insurance)we are currently a party will not have a material adverse effect on our business, financial condition,position, results of operations or cash flows.
Environmental Matters
We and our subsidiaries are subject to various environmental laws and regulations. Under these laws, we and/or our subsidiaries are, or may be,Regulations issued under the Clean Air Act Amendments of 1990 required to remove or mitigate the effects on the environment of the disposal or release of certain hazardous materials. We believe our currently anticipated capital expenditures for environmental control facility matters are not material.
We are subject to other federal, state and local environmental protection laws and regulations and are involved, from time to time, in investigations and proceedings regarding environmental matters. Such investigations and proceedings typically concern air emissions, water discharges, and/or management of solid and hazardous wastes. We believe that our facilities are in material compliance with all applicable environmental laws and regulations.
Federal and state regulations provided the initiative for usindustry to reformulate certain furniture finishes or institute process changes to reduce emissions of volatile organic compounds. Compliance with many of these requirements has been facilitated through the introduction of high solids coating technology and alternative formulations. In addition, we have instituted a variety of technical and procedural controls, including reformulation of finishing materials to reduce toxicity, implementation of high velocity low pressure spray systems, development of storm water protection plans and controls, and further development of related inspection/audit teams, all of which have served to reduce emissions per unit of production. We remain committed to implementing new waste minimization programs and/or enhancing existing programs with the objective of (i) reducing the total volume of waste, (ii) limiting the liability associated with waste disposal, and (iii) continuously improving environmental and job safety programs on the factory floor which serve to minimize emissions and safety risks for employees. We will continue to evaluate the most appropriate, cost effective, control technologies for finishing operations and design production methodsIn order to reduce the use of hazardous materials in the manufacturing process.process, we will continue to evaluate the most appropriate, cost-effective control technologies for finishing operations and production methods. We believe that our facilities are in material compliance with all such applicable laws and regulations. Our currently anticipated capital expenditures for environmental control facility matters are not material.
Item 4. Mine Safety Disclosures
Not applicable
PART II
ETHAN ALLEN INTERIORS INC. AND SUBSIDIARIES
PART II
Item 5. Market for Registrant's Common Equity, Related Stockholder Matters and Issuer Purchases of Equity Securities
Our common stock is traded on the New York Stock Exchange (“NYSE”) under ticker symbol "ETH". The following table sets forth, for each quarterly period during the past two fiscal years, (i) the intraday high and low sales prices of our common stock as reported on the New York Stock ExchangeNYSE and (ii) the dividends per share paiddeclared by us:
Market Price | Dividends | |||||||||||
High | Low | Per Share | ||||||||||
Fiscal 2016 | ||||||||||||
First Quarter | $ | 31.87 | $ | 25.76 | 0.14 | |||||||
Second Quarter | 29.65 | 25.30 | 0.14 | |||||||||
Third Quarter | 32.10 | 22.46 | 0.17 | |||||||||
Fourth Quarter | 35.31 | 29.39 | 0.17 | |||||||||
Fiscal 2015 | ||||||||||||
First Quarter | $ | 26.84 | $ | 22.06 | $ | 0.12 | ||||||
Second Quarter | 31.24 | 22.58 | 0.12 | |||||||||
Third Quarter | 32.63 | 25.31 | 0.12 | |||||||||
Fourth Quarter | 28.25 | 23.33 | 0.14 | |||||||||
Market Price High Low Per Share Fiscal 2013 First Quarter Second Quarter Third Quarter Fourth Quarter Fiscal 2012 First Quarter Second Quarter Third Quarter Fourth Quarter Dividends $ 25.30 $ 19.54 $ 0.09 30.29 21.48 0.50 33.18 26.26 0.09 33.36 26.76 0.09 $ 22.32 $ 13.17 $ 0.07 24.40 12.30 0.07 28.37 22.50 0.07 25.60 18.00 0.09
As of August 8, 2013,July 31, 2016, there were 267238 shareholders of record of our common stock. Management estimates there are approximately 10,000 beneficial shareholders of the Company’s common stock. WeThe Company’s policy is to issue quarterly dividends, and we expect to continue to declare quarterly dividends for the foreseeable future, business conditions permitting.
Equity Compensation Plan Information
The Equity Compensation Plan Information required by this Item will appear in the Ethan Allen Interiors Inc. proxy statement for the Annual Meeting of Shareholders scheduled to be held on November 19, 201316, 2016 and is incorporated herein by reference in the introductory paragraph of Part III of this Annual Report.
Issuer Purchases of Equity Securities
On November 21, 2002, our Board of Directors approved a share repurchase program authorizing us to repurchase up to 2,000,000 shares of our common stock, from time to time, either directly or through agents, in the open market at prices and on terms satisfactory to us. Subsequent to that date, the Board of Directors increased the remainingaggregate authorization under the repurchase program on sevenseveral separate occasions, the last of which was on NovemberApril 13, 2007.2015 when the Board of Directors increased the aggregate authorization to approximately 3,000,000 shares. There is no expiration date on the repurchase authorization and the amount and timing of future share repurchases, if any, will be determined as market and business conditions warrant. There were no share repurchasespurchases made by or on behalf of us or any affiliated purchaser (as defined in Rule 10b-18(a)(3) under the Exchange Act) of our common stock during the quarterthree months ended June 30, 2013. As of2016.
ETHAN ALLEN INTERIORS INC. AND SUBSIDIARIES
Comparative Company PerformanceThe following line graph compares the cumulative total stockholder return for the Company with the S&P 500 Index, and the S&P Retail Select Industry Index (SPSIRE), assuming $100 was invested on June 30, 2013 we had a remaining Board authorization to repurchase 1,101,490 shares.2011.
Comparative Company PerformanceETHAN ALLEN INTERIORS INC. AND SUBSIDIARIES
The following line graph compares cumulative total stockholder return for the Company with a performance indicator of the overall stock market, the Standard & Poor’s 500 Index, and an industry index, the Peer Issuer Group Index, assuming $100 was invested on June 30, 2008. The peer group includes Bassett Furniture Industries, Inc., Flexsteel Industries, Inc., Furniture Brands International, Inc., Haverty Furniture Companies, Inc., La-Z-boy Inc., Leggett & Platt, Inc., and Pier 1 Imports Inc. Chromcraft Revington has been removed from the peer group for all periods due to its delisting from the NYSE. The returns of each company have been weighted according to each company’s market capitalization.
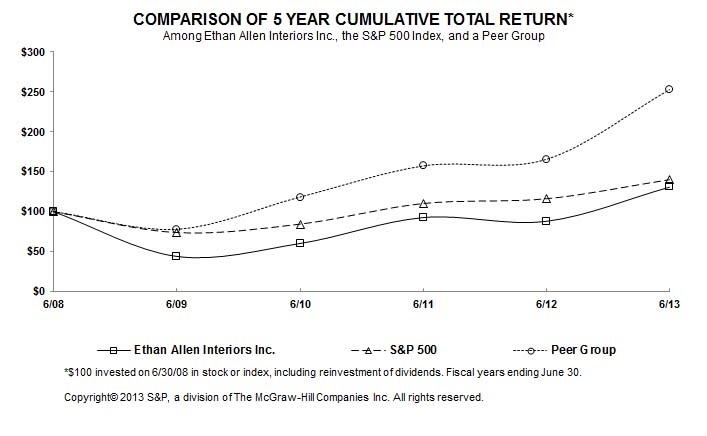
Item 6. Selected Financial Data
The following table presents selected financial data for the fiscal years ended June 30, 2016, 2015, 2014, 2013 and 2012 2011, 2010 and 2009 whichthat has been derived from our consolidated financial statements (dollar amounts in thousands except per share data). The information set forth below should be read in conjunction with Management’s Discussion and Analysis of Financial Condition and Results of Operations included under Item 7 of this Annual Report and our Consolidated Financial Statements (including the notes thereto) included under Item 8 of this Annual Report.
Fiscal Year Ended June 30, | Fiscal Year Ended June 30, | |||||||||||||||||||||||||||||||||||||||||||||||||
2013 | 2012 | 2011 | 2010 | 2009 | 2016 | 2015 | 2014 | 2013 | 2012 | |||||||||||||||||||||||||||||||||||||||||
Consolidated Operations Data | ||||||||||||||||||||||||||||||||||||||||||||||||||
Net Sales | $ | 729,083 | $ | 729,373 | $ | 678,960 | $ | 590,054 | $ | 674,277 | $ | 794,202 | $ | 754,600 | $ | 746,659 | $ | 729,083 | $ | 729,373 | ||||||||||||||||||||||||||||||
Cost of Sales | 330,734 | 339,085 | 329,500 | 309,777 | 326,935 | 351,966 | 343,437 | 340,163 | 330,734 | 339,085 | ||||||||||||||||||||||||||||||||||||||||
Selling, general and administrative expenses | 337,912 | 340,591 | 317,527 | 289,575 | 353,112 | |||||||||||||||||||||||||||||||||||||||||||||
Restructuring and impairment charges, net | - | - | - | 2,437 | 67,001 | |||||||||||||||||||||||||||||||||||||||||||||
Operating income (loss) | 60,437 | 49,697 | 31,933 | (11,735 | ) | (72,771 | ) | |||||||||||||||||||||||||||||||||||||||||||
Selling, general andadministrative expenses | 353,057 | 345,229 | 336,860 | 337,912 | 340,591 | |||||||||||||||||||||||||||||||||||||||||||||
Operating income | 89,179 | 65,934 | 69,636 | 60,437 | 49,697 | |||||||||||||||||||||||||||||||||||||||||||||
Interest and other expense, net | 10,263 | 8,458 | 5,562 | 7,052 | 8,409 | 1,223 | 9,251 | 7,234 | 10,263 | 8,458 | ||||||||||||||||||||||||||||||||||||||||
Income (loss) before income tax expense | 50,174 | 41,239 | 26,371 | (18,787 | ) | (81,180 | ) | |||||||||||||||||||||||||||||||||||||||||||
Income before incometax expense | 87,956 | 56,683 | 62,402 | 50,174 | 41,239 | |||||||||||||||||||||||||||||||||||||||||||||
Income tax expense (benefit) | 17,696 | (8,455 | ) | (2,879 | ) | 25,529 | (28,493 | ) | 31,319 | 19,541 | 19,471 | 17,696 | (8,455 | ) | ||||||||||||||||||||||||||||||||||||
Net income (loss) | $ | 32,478 | $ | 49,694 | $ | 29,250 | $ | (44,316 | ) | $ | (52,687 | ) | ||||||||||||||||||||||||||||||||||||||
Net income | $ | 56,637 | $ | 37,142 | $ | 42,931 | $ | 32,478 | $ | 49,694 | ||||||||||||||||||||||||||||||||||||||||
Per Share Data | ||||||||||||||||||||||||||||||||||||||||||||||||||
Net income (loss) per basic share | $ | 1.13 | $ | 1.72 | $ | 1.02 | $ | (1.53 | ) | $ | (1.83 | ) | ||||||||||||||||||||||||||||||||||||||
Basic weighted average shares outstanding | 28,864 | 28,824 | 28,758 | 28,982 | 28,814 | |||||||||||||||||||||||||||||||||||||||||||||
Net income (loss) per diluted share | $ | 1.11 | $ | 1.71 | $ | 1.01 | $ | (1.53 | ) | $ | (1.83 | ) | ||||||||||||||||||||||||||||||||||||||
Diluted weighted average shares outstanding | 29,239 | 29,109 | 28,966 | 28,982 | 28,814 | |||||||||||||||||||||||||||||||||||||||||||||
Net income per basicshare | $ | 2.02 | $ | 1.29 | $ | 1.48 | $ | 1.13 | $ | 1.72 | ||||||||||||||||||||||||||||||||||||||||
Basic weighted average sharesoutstanding | 28,072 | 28,874 | 28,918 | 28,864 | 28,824 | |||||||||||||||||||||||||||||||||||||||||||||
Net income per dilutedshare | $ | 2.00 | $ | 1.27 | $ | 1.47 | $ | 1.11 | $ | 1.71 | ||||||||||||||||||||||||||||||||||||||||
Diluted weighted averageshares outstanding | 28,324 | 29,182 | 29,276 | 29,239 | 29,109 | |||||||||||||||||||||||||||||||||||||||||||||
Cash dividends per share | $ | 0.77 | $ | 0.30 | $ | 0.22 | $ | 0.20 | $ | 0.65 | $ | 0.62 | $ | 0.50 | $ | 0.40 | $ | 0.77 | $ | 0.30 | ||||||||||||||||||||||||||||||
Other Information | ||||||||||||||||||||||||||||||||||||||||||||||||||
Depreciation and amortization | $ | 18,008 | $ | 18,581 | $ | 20,816 | $ | 29,398 | $ | 25,635 | $ | 19,353 | $ | 19,142 | $ | 17,930 | $ | 18,008 | $ | 18,581 | ||||||||||||||||||||||||||||||
Capital expenditures and acquisitions | $ | 19,775 | $ | 23,404 | $ | 12,051 | $ | 9,972 | $ | 23,903 | ||||||||||||||||||||||||||||||||||||||||
Capital expenditures andacquisitions | $ | 23,132 | $ | 21,778 | $ | 19,305 | $ | 19,775 | $ | 23,404 | ||||||||||||||||||||||||||||||||||||||||
Working capital | $ | 127,631 | $ | 131,715 | $ | 113,912 | $ | 113,950 | $ | 139,239 | $ | 124,857 | $ | 130,012 | $ | 169,582 | $ | 127,631 | $ | 131,715 | ||||||||||||||||||||||||||||||
Current ratio | 1.96 | to | 1 | 1.87 | to | 1 | 1.74 | to | 1 | 1.78 | to | 1 | 2.24 | to | 1 | 2.01 to 1 | 1.92 to 1 | 2.25 to 1 | 1.96 to 1 | 1.87 to 1 | ||||||||||||||||||||||||||||||
Effective tax rate | 35.3 | % | -20.5 | % | -10.9 | % | -135.9 | % | 35.1 | % | 35.6 | % | 34.5 | % | 31.2 | % | 35.3 | % | -20.5 | % | ||||||||||||||||||||||||||||||
Balance Sheet Data (at end of period) | ||||||||||||||||||||||||||||||||||||||||||||||||||
Total assets | $ | 617,285 | $ | 644,788 | $ | 628,325 | $ | 631,777 | $ | 646,485 | $ | 577,409 | $ | 605,977 | $ | 654,434 | $ | 617,285 | $ | 644,788 | ||||||||||||||||||||||||||||||
Total debt, including capital lease obligations | 131,289 | 154,500 | 165,032 | 203,267 | 203,148 | |||||||||||||||||||||||||||||||||||||||||||||
Total debt, including capitallease obligations | 41,838 | 76,237 | 130,912 | 131,289 | 154,500 | |||||||||||||||||||||||||||||||||||||||||||||
Shareholders' equity | $ | 334,357 | $ | 321,868 | $ | 281,687 | $ | 258,459 | $ | 305,923 | $ | 392,202 | $ | 370,535 | $ | 367,467 | $ | 334,357 | $ | 321,868 | ||||||||||||||||||||||||||||||
Debt as a percentage of equity | 39.3 | % | 48.0 | % | 58.6 | % | 78.6 | % | 66.4 | % | 10.7 | % | 20.6 | % | 35.6 | % | 39.3 | % | 48.0 | % | ||||||||||||||||||||||||||||||
Debt as a percentage of capital | 28.2 | % | 32.4 | % | 36.9 | % | 44.0 | % | 39.9 | % | 9.6 | % | 17.1 | % | 26.3 | % | 28.2 | % | 32.4 | % | ||||||||||||||||||||||||||||||
ETHAN ALLEN INTERIORS INC. AND SUBSIDIARIES
Item 7. Management's Discussion and Analysis of Financial Condition and Results of Operation
The following discussion of financial condition and results of operations is based upon, and should be read in conjunction with, our Consolidated Financial Statements (including the notes thereto) included under Item 8 of this Annual Report.
Forward-Looking Statements
Management's discussion and analysis of financial condition and results of operations and other sections of this Annual Report on Form 10-K contain forward-looking statements within the meaning of the Private Securities Litigation Reform Act of 1995, Section 27A of the Securities Act of 1933, as amended, and Section 21E of the Securities Exchange Act of 1934, as amended (the “Exchange Act”), which represent management’s beliefs and assumptions concerning future events based on information currently available to us relating to our future results. Such forward-looking statements are identified in this Annual Report on Form 10-K and in documents incorporated herein by reference by use of forward-looking words such as "anticipates""anticipate", "believes""believe", "plans""plan", "estimates""estimate", "expects""expect", "intend", “will”, “may”, “continue”, “project”, ”target”, “outlook”, “forecast”, “guidance”, and "intends" or words or phrasessimilar expressions and the negatives of similar expression.such forward-looking words. These forward-looking statements are subject to management decisions and various assumptions about future events, and are not guarantees of future performance. A number of risks and uncertainties could cause actual results to differ materially from those anticipated in the forward-looking statements, including, but not limited to: the potential effects of natural disasters affecting our suppliers or trading partners; the effects of labor strikes; weather conditions that may affect sales; volatility in fuel, utility, transportation and security costs; changes in global or regional political or economic conditions, including changes in governmental and central bank policies; our ability to secure debt or other forms of financing; the effect of operating losses on our ability to pay cash dividends; changes in business conditions in the furniture industry, including changes in consumer spending patterns, tastes and demand for home furnishings; competition from overseas manufacturers and domestic retailers and competitive factors such as changes in products or marketing efforts of others; effects of our brand awareness and marketing programs, including changes in demand for our existing and new products; our ability to locate new design center sites and/or negotiate favorable lease terms for additional design centers or for the expansion of existing design centers; competitive factors, including changes in products or marketing efforts of others; pricing pressures; fluctuations in interest rates and the cost, availability and quality of raw materials; pricing pressures; the effects of labor strikes; weather conditions that may affect sales; volatility in fuel, utility, transportation and security costs; the potential effects of natural disasters affecting our suppliers or trading partners; the effects of terrorist attacks or conflicts or wars involving the United States or its allies or trading partners; and those matters discussed in Items 1A and 7A of this Annual Report on Form 10-K and in our other SEC filings; and our future decisions.filings. Accordingly, actual circumstances and results could differ materially from those contemplated by the forward-looking statements.
Given the risks and uncertainties surrounding forward-looking statements, you should not place undue reliance on these statements. Many of these factors are beyond our ability to control or predict. Our forward-looking statements speak only as of the date of this Annual Report on Form 10-K. Other than as required by law, we undertake no obligation to update or revise forward-looking statements, whether as a result of new information, future events, or otherwise.
Critical Accounting Policies
Our consolidated financial statements have been prepared in conformity with U.S. generally accepted accounting principles that require, in some cases, that certain estimates and assumptions be made that affect the amounts and disclosures reported in those financial statements and the related accompanying notes. Estimates are based on currently known facts and circumstances, prior experience and other assumptions believed to be reasonable.reasonable assumptions. We use our best judgment in valuing these estimates and may, as warranted, solicit external advice. Actual results could differ from these estimates, assumptions and judgments, and these differences could be material. The following critical accounting policies, some of which are impacted significantly by estimates, assumptions and judgments, affect our consolidated financial statements. For the years ended June 30, 2013, 2012 and 2011, the Company has presented selling, general and administrative expenses as a single line on the consolidated statements of Comprehensive Income to remove information we believe is not meaningful and to improve comparability with our peer companies. Selling expenses, general and administrative expenses, and restructuring and impairment charges had previously been presented separately in those years.
ETHAN ALLEN INTERIORS INC. AND SUBSIDIARIES
Inventories– Inventories (finished goods, work in process and raw materials) are stated at the lower of cost, determined on a first-in, first-out basis, or market. Cost is determined based solely on those charges incurred in the acquisition and production of the related inventory (i.e. material, labor and manufacturing overhead costs). We estimate an inventory reserve for excess quantities and obsolete items based on specific identification and historical write-downs, taking into account future demand and market conditions. If actual demand or market conditions in the future are less favorable than those estimated, additional inventory write-downs may be required.
Revenue Recognition – Revenue is recognized when all of the following have occurred: persuasive evidence of a sales arrangement exists (e.g. a wholesale purchase order or retail sales invoice); the sales arrangement specifies a fixed or determinable sales price; title and risk of ownership has passed to the customer; no specific performance obligations remain; product is shipped or services are provided to the customer or a fixed schedule of delivery is agreed upon and in place;customer; collectability is reasonably assured. As such, revenue recognition generally occurs upon the shipment of goods to independent retailers or, in the case of Ethan Allen operated retail design centers, upon delivery to the customer. If a shipping charge is billed to customers, this is included in revenue. Recorded sales provide for estimated returns and allowances. We permit our customers to return defective products and incorrect shipments, and terms we offer are standard for the industry.
Allowance for Doubtful Accounts – We maintain an allowance for doubtful accounts for estimated losses resulting from the inability of our customers to make required payments. The allowance for doubtful accounts is based on a review of specifically identified accounts in addition to an overall aging analysis. Judgments are made with respect to the collectability of accounts receivable based on historical experience and current economic trends. Actual losses could differ from those estimates.
Retail Design Center Acquisitions - – We account for the acquisition of retail design centers and related assets with the purchase method. Accounting for these transactions as purchase business combinations requires the allocation of purchase price paid to the assets acquired and liabilities assumed based on their fair values as of the date of the acquisition. The amount paid in excess of the fair value of net assets acquired is accounted for as goodwill.
Impairment of Long-Lived Assets and Goodwill –Goodwill –Goodwill and other indefinite-lived intangible assets are evaluated for impairment on an annual basis during the fourth quarter of each fiscal year, and between annual tests whenever events or circumstances indicate that the carrying value of the goodwill or other intangible asset may exceed its fair value. When testing goodwill for impairment, we may assess qualitative factors for some or all of our reporting units to determine whether it is more likely than not (that is, a likelihood of more than 50 percent) that the fair value of a reporting unit is less than its carrying amount, including goodwill. Alternatively, we may bypass this qualitative assessment for some or all of our reporting units and determine whether the carrying value exceeds the fair value using a quantitative assessment as described below.
The recoverability of long-lived assets are evaluated for impairment by determining whether the carrying value will be recovered through the expected undiscounted future cash flows resulting from the use of the asset. In the event the sum of the expected undiscounted future cash flows is less than the carrying value of the asset, an impairment loss equal to the excess of the asset’s carrying value over its fair value is recorded. The long-term nature of these assets requires the estimation of cash inflows and outflows several years into the future and only takes into consideration technological advances known at the time of the impairment test.
ETHAN ALLEN INTERIORS INC. AND SUBSIDIARIES
To evaluate goodwill using a quantitative assessment, the Company determines the current fair value of the reporting units using a combination of “Market” and “Income” approaches. In the Market approach, the “Guideline Company” method is used, which focuses on comparing the Company’s risk profile and growth prospects to reasonably similar publicly traded companies. Key assumptions used for the Guideline Company method are total invested capital (“TIC”) multiples for revenues and operating cash flows, as well as consideration of control premiums. The TIC multiples are determined based on public furniture companies within our peer group, and if appropriate, recent comparable transactions are considered. Control premiums are determined using recent comparable transactions in the open market. Under the Income approach, a discounted cash flow method is used, which includes a terminal value, and is based on external analyst financial projection estimates, as well as internal financial projection estimates prepared by management. The long-term terminal growth rate assumptions reflect our current long-term view of the market in which we compete. Discount rates use the weighted average cost of capital for companies within our peer group, adjusted for specific company risk premium factors.
The fair value of our trade name, which is the Company’s only indefinite-lived intangible asset other than goodwill, is valued using the relief-from-royalty method. Significant factors used in trade name valuation are rates for royalties, future growth, and a discount factor. Royalty rates are determined using an average of recent comparable values. Future growth rates are based on the Company’s perception of the long-term values in the market in which we compete, and the discount rate is determined using the weighted average cost of capital for companies within our peer group, adjusted for specific company risk premium factors.
In the fourth quarter of fiscal years 20132016, 2015 and 2012,2014, the Company performed qualitative assessments of the fair value of the wholesale reporting unit and concluded that the fair value of its goodwill exceeded its carrying value. In fiscal year 2011 the Company performed a quantitative assessment and determined the fair value of its wholesale reporting unit exceeded its carrying value by a substantial margin. The fair value of the trade name exceeded its carrying value by a substantial margin in fiscal years 2013, 20122016, 2015, and 2011.To2014.To calculate fair value of these assets, management relies on estimates and assumptions which by their nature have varying degrees of uncertainty. Wherever possible, management therefore looks for third party transactions to provide the best possible support for the assumptions incorporated. Management considers several factors to be significant when estimating fair value including expected financial outlook of the business, changes in the Company’s stock price, the impact of changing market conditions on financial performance and expected future cash flows, and other factors. Deterioration in any of these factors may result in a lower fair value assessment, which could lead to impairment of the long-lived assets and goodwill of the Company.
Income Taxes – Income taxes are accounted for under the asset and liability method. Deferred tax assets and liabilities are recognized for the future tax consequences attributable to differences between the financial statement carrying amounts of existing assets and liabilities and their respective tax bases and operating loss and tax credit carryforwards. Deferred tax assets and liabilities are measured using enacted tax rates expected to apply to taxable income in the years in which those temporary differences are expected to be recovered or settled. The effect on deferred tax assets and liabilities of a change in tax rates is recognized in income in the period that includes the enactment date. Additional factors that we consider when making judgments about the deferred tax valuation include tax law changes, a recent history of cumulative losses, and variances in future projected profitability.
The Company evaluates, on a quarterly basis, uncertain tax positions taken or expected to be taken on tax returns for recognition, measurement, presentation, and disclosure in its financial statements. If an income tax position exceeds a 50% probability of success upon tax audit, based solely on the technical merits of the position, the Company recognizes an income tax benefit in its financial statements. The tax benefits recognized are measured based on the largest benefit that has a greater than 50% likelihood of being realized upon ultimate settlement. The liability associated with an unrecognized tax benefit is classified as a long-term liability except for the amount for which a cash payment is expected to be made or tax positions settled within one year. We recognize interest and penalties related to income tax matters as a component of income tax expense.
ETHAN ALLEN INTERIORS INC. AND SUBSIDIARIES
Business Insurance Reserves – We have insurance programs in place to cover workers’ compensation and property/casualty claims. The insurance programs, which are funded through self-insured retention, are subject to various stop-loss limitations. We accrue estimated losses using actuarial models and assumptions based on historical loss experience. Although we believe that the insurance reserves are adequate, the reserve estimates are based on historical experience, which may not be indicative of current and future losses. In addition, the actuarial calculations used to estimate insurance reserves are based on numerous assumptions, some of which are subjective. We adjust insurance reserves, as needed, in the event that future loss experience differs from historical loss patterns.
Other Loss Reserves –We have a number of other potential loss exposures incurred in the ordinary course of business such as environmental claims, product liability, litigation, tax liabilities, restructuring charges, and the recoverability of deferred income tax benefits. Establishing loss reserves for these matters requires the use of estimates and judgment with regard to maximum risk exposure and ultimate liability or realization. As a result, these estimates are often developed with our counsel, or other appropriate advisors, and are based on our current understanding of the underlying facts and circumstances. Because of uncertainties related to the ultimate outcome of these issues or the possibilities of changes in the underlying facts and circumstances, additional charges related to these issues could be required in the future.future.
Results of Operations
A summary of our consolidated operations for the past three fiscal years are presented in the following table ($ in millions).
Fiscal years ended June 30, | ||||||||||||||||||||||||
2016 | % | 2015 | % | 2014 | % | |||||||||||||||||||
Net sales | $ | 794.2 | 100.0 | % | $ | 754.6 | 100.0 | % | $ | 746.7 | 100.0 | % | ||||||||||||
Gross profit | $ | 442.2 | 55.7 | % | $ | 411.2 | 54.5 | % | $ | 406.5 | 54.4 | % | ||||||||||||
SG&A | $ | 353.1 | 44.5 | % | $ | 345.2 | 45.7 | % | $ | 336.9 | 45.1 | % | ||||||||||||
Operating income | 89.2 | 11.2 | % | 65.9 | 8.7 | % | 69.6 | 9.3 | % | |||||||||||||||
Net income | 56.6 | 7.1 | % | 37.1 | 4.9 | % | 42.9 | 5.7 | % | |||||||||||||||
Earnings per diluted share | $ | 2.00 | $ | 1.27 | $ | 1.47 | ||||||||||||||||||
Net cash provided by operating activities | $ | 58.4 | $ | 55.1 | $ | 59.9 | ||||||||||||||||||
A summary of changes from the preceeding fiscal year are presented in the following table.
| Fiscal years ended June 30, | |||||||||||||
| 2016 | 2015 | 2014 | |||||||||||
Net sales | 5.2 | % | 1.1 | % | 2.4 | % | |||||||
Operating income | 35.3 | % | -5.3 | % | 15.2 | % | |||||||
Net income | 52.5 | % | -13.5 | % | 32.2 | % | |||||||
Earnings per diluted share | 57.5 | % | -13.6 | % | 32.4 | % | |||||||
Net cash provided by operating activities | 5.9 | % | -8.0 | % | -2.3 | % | |||||||
Basis of PresentationETHAN ALLEN INTERIORS INC. AND SUBSIDIARIES
AsBeginning in the fall of 2014, we began a major transformation of our product offerings with several phases. We introduced Casual Classics during the first phase in the fall of 2014, focusing on several design projections with relaxed finishes and comfort. In the spring and summer of 2015, we launched the second phase, Romantic Classics, with design projections featuring unique, stand-alone timeless pieces with new finishes and forms, designed specifically for manufacturing primarily at our North American workshops to obtain maximum benefit from our vertical integration. We launched the third phase in the fall of 2015, during which we further developed Romantic Classics, inspired by European designs, taking inspiration from the classics and modernizing them for today’s living, with continued focus on North American manufacturing. In our current phase, we continue to differentiate our brand by further expanding our Casual Classics, with three new design projections; Buckhead, featuring designs infused with European inspiration and Southern charm, introduced in June 30, 2013,2016; Santa Monica, a blend of breezy beach house and vintage farmhouse flair, introduced in July 2016; and Brooklyn, a sophisticated industrial design, expected to be introduced in August 2016. These new product offerings will be followed by the introduction of our Ethan Allen Interiors Inc. has no material assets other than its ownership| Disney home line in the fall of 2016. While we implement major product introductions, such as the capital stockanticipated introductions described above, our wholesale segment experiences some disruptions in manufacturing as we change tooling and methods, build prototypes and then ramp up production. In our retail segment, some disruption also occurs in our design centers as we update floor displays, and sell the remainder of Ethan Allen Global, Inc.our older products on clearance to make space for the new product. Our continuous product transformation in measured steps helps us minimize these disruptions and conducts all significant transactions through Ethan Allen Global, Inc.; therefore, substantially all of the financial information presented herein is that of Ethan Allen Global, Inc.
Results of Operationspreserve our reputation for offering high-quality and fashionable products.
For the year ended June 30, 2013,2016, our operatingnet sales increased from the prior fiscal year at a higher rate than in the previous two fiscal years, as our new introductions and marketing efforts gain traction with consumers. Operating expenses during fiscal 2016 decreased as a percentage of sales in fiscal 2016 compared to fiscal 2015, further contributing to a fiscal 2016 net income increased 21.6%increase of 52.5% over the prior fiscal year to $60.4 million, and netearnings per diluted share of $2.00. Net cash provided by operating activities increased 62.6% over the prior fiscal year to $61.3 million. Our retail division contributed $8.0 million inalong with operating income, up $19.5 million from the loss of $11.5 million the prior year while the retail division net sales grew 3.4%. Our liquidity continued to be strong allowingcash enabled us to buy back $24repurchase $19.3 million of our Senior Notescommon stock under our share repurchase program, pay down $31.5 million of our debt earlier than scheduled, and pay $22return $16.6 million in cash dividends which were $14 million or 176% greater than the prior year, while maintaining ato our shareholders. At June 30, 2016 we had total cash and securities balance at June 30, 2013 about even with the prior year at $104of $60.5 million, and working capital of $124.9 million.
Despite highly promotionalThe components of consolidated revenues and competitive conditionsoperating income (loss) by business segment are as follows (in millions):
Fiscal Year Ended June 30, | ||||||||||||
2016 | 2015 | 2014 | ||||||||||
Revenue: | ||||||||||||
Wholesale segment | $ | 491.5 | $ | 469.4 | $ | 453.6 | ||||||
Retail segment | 626.5 | 579.7 | 580.7 | |||||||||
Elimination of inter-segment sales | (323.8 | ) | (294.5 | ) | (287.6 | ) | ||||||
Consolidated revenue | $ | 794.2 | $ | 754.6 | $ | 746.7 | ||||||
Operating income : | ||||||||||||
Wholesale segment | $ | 74.4 | $ | 67.0 | $ | 57.8 | ||||||
Retail segment | 16.5 | 1.7 | 10.5 | |||||||||
Adjustment for inter-company profit (1) | (1.7 | ) | (2.8 | ) | 1.3 | |||||||
Consolidated operating income | $ | 89.2 | $ | 65.9 | $ | 69.6 | ||||||
(1) | Represents the change in wholesale profit contained in Ethan Allen operated design center inventory existing at the end of the period. |
ETHAN ALLEN INTERIORS INC. AND SUBSIDIARIES
A summary by business segment of annual percentage changes from the preceeding fiscal years are presented in the following tables.
| Fiscal Year Ended June 30, | ||||||||||||
| 2016 | 2015 | 2014 | ||||||||||
Wholesale segment | ||||||||||||
Revenue | 4.7 | % | 3.5 | % | 4.4 | % | ||||||
Operating Income | 11.1 | % | 15.9 | % | 13.7 | % | ||||||
Backlog | -36.8 | % | 41.8 | % | -6.5 | % | ||||||
| Fiscal Year Ended June 30, | ||||||||||||
| 2016 | 2015 | 2014 | ||||||||||
Retail segment | ||||||||||||
Revenue | 8.1 | % | -0.2 | % | 0.4 | % | ||||||
Comparable design center revenue | 8.5 | % | 0.7 | % | 3.0 | % | ||||||
Total written orders | 1.7 | % | 3.9 | % | 1.0 | % | ||||||
Comparable design center written orders | 1.8 | % | 4.4 | % | 3.0 | % | ||||||
Operating Income | 853.1 | % | -83.6 | % | 31.2 | % | ||||||
Backlog | -13.1 | % | 18.6 | % | -4.7 | % | ||||||
The fiscal 2016 decreases in backlogs of 36.8% for our industry,wholesale and 13.1% for retail followed backlog increases at the end of fiscal 2015. In June 2015 a price increase effective July 1, 2015 was announced which created a spike in June 2015 orders for both our wholesale and retail, business segments continue to make substantial progress. Ourin advance of the price increase, increasing the fiscal 2015 ending backlogs. There was no corresponding price increase announced at the end of fiscal 2016.
Operating income in the retail segment has now had 14 consecutive quarters of year over year sales growth, and on a consolidated basis, we have had 12 consecutive quarterly profits. Despite 3.4% growth in net sales this fiscal year by our retail division, our consolidated net sales of $729.1 million were essentially flat with the prior year. This was2016 increased 853.1% compared to fiscal 2015 primarily due to a decline$46.8 million increase in revenue in fiscal 2016, and net gains on the last two quarterssale of real estate in fiscal 20132016 compared to net losses in our wholesale shipments to an international independent retailer. As we continue totake strong and decisive actions to grow the business, we continue to operate the business with cautious optimism while aggressively pursuing our business objectives.fiscal 2015.
One such objective isWecontinue to continuously reexamine our retail footprint to optimize our structure and “do more with less.” While the number of Company operated design centers was 147 at June 30 of both 2013 and 2012, we had approximately 1,900 associates in our retail division at fiscal year end, 11% fewer than the prior year. Despite the lower staffing, we grew our retail division net sales by 3.4% and improved significantly our retail division operating profit.Our culture of entrepreneurship and streamlined operating structure made this possible despite investments made this year to open international, foreign language design centers in Canada and Belgium.
We also continue to make considerable investments to strengthen the level of service, professionalism, interior design competence, efficiency, and effectiveness of the retail network design center personnel. We believe that over time, we will continue to benefit from (i) continuous repositioning and opening of new design centers in our retail network, (ii) frequent new product introductions, (iii) new and innovative marketing promotions and effective use of targeted advertising media, and (iv) continued use of the latest technology coupled with personal service from our interior design professionals. We believe our network of professionally trained interior design professionals differentiates us significantly from others in our industry.
Our manufacturing operations gained efficiency by increasing throughput in our Honduras facility, and logistics operations are also more efficient. We strengthened our domestic operations with strategic equipment purchasesexpanding capacity and added capacitybuilding a new R&D facility in Mexico and Honduras.North Carolina. We estimate our manufacturing facilities are currently operating at approximately 70%66% of capacity based on their current shifts and staffing. We believe we have sufficient scalable capacity that with minimal capital investments and a balance of outsourcing we can significantly growsupport strong sales while maintaininggrowth whilemaintaining control over cost, quality and service to our customers.
Independent retailers operated 148 design centers at June 30, 2013 compared with 151 at June 30, 2012. Our international net sales to independent retailers were 5.1% of our consolidated net sales for the year ended June 30, 2013 compared with 6.6% the previous year. Most of this decrease came from lower shipments to our independent retailer in China who reduced its inventory and number of design centers (68 at June 30, 2013 compared to 70 at June 30, 2012).
Business Results:
Our revenues are comprised of (i) wholesale sales to independently operated and Company operated retail design centers and (ii) retail sales of Company operated design centers. See Note 15 to our Consolidated Financial Statements for the year ended June 30, 20132016 included under Item 8 of this Annual Report.Report.
The components of consolidated revenues and operating income (loss) are as follows (in millions):
Fiscal Year Ended June 30, 2013 2012 2011 Revenue: Wholesale segment Retail segment Elimination of inter-segment sales Consolidated revenue Operating income (loss): Wholesale segment Retail segment Adjustment for inter-company profit (1) Consolidated operating income $ 434.4 $ 456.9 $ 422.9 578.3 559.4 505.9 (283.6 ) (286.9 ) (249.8 ) $ 729.1 $ 729.4 $ 679.0 $ 50.8 $ 64.4 $ 49.9 8.0 (11.5 ) (15.4 ) 1.6 (3.2 ) (2.6 ) $ 60.4 $ 49.7 $ 31.9
|
|
Fiscal 20132016 Compared to Fiscal 20122015
Consolidated revenue for the fiscal year ended June 30, 20132016 was $729.1$794.2 million compared to $729.4$754.6 million infor fiscal 2012.2015. There was year-over-year sales growth in the retail segment in both net sales and written orders, which were offset by declines in our wholesale segment.The decreases in the wholesale segment were partly due to lower international shipments and higher display product sales in the prior year.retail segments.
ETHAN ALLEN INTERIORS INC. AND SUBSIDIARIES
Wholesale revenue for fiscal 2013 decreased2016 increased by $22.5$22.1 million, or 4.9%4.7%, to $434.4$491.5 million from $456.9$469.4 million in the prior fiscal year. The year-over-year decreaseincrease was primarily attributable to increased sales to our Company operated design centers and domestic independent retailers, partly offset by a reductiondecrease to our international independent design centers, primarily in the incoming order rate for the second and third quarters of fiscal 2013. Orders in the fourth quarter of fiscal 2013 increased over the same prior year period. We believe this decrease in year-over-year sales and orders is due primarily to (i) lower shipments of prototype products, (ii) lower international shipments, and (iii) a slight decrease in the number of totalChina. There were 296 design centers globally in the current year. The numberas of total design centers globally decreased to 295 at June 30, 20132016, a decrease by three from 298 at June 30, 2012. The2015. There was a net decrease of two independently operated retail network decreased by threelocations, which included a decrease of eight legacy locations in the U.S., bringing the total U.S. independent total to 50, and a net design centersincrease of eight new locations in China, bringing the China total to 148 at83.Our international net sales to independent retailers was 5.4% of our consolidated net sales for the fiscal year ended June 30, 2013 including a net decrease of 2 locations2016 compared to 68 in China. While7.5% the count of Ethan Allen operated design centers was 147 at both June 30 of 2013 and 2012, we opened seven design centers (three of which were relocations), acquired two from independent retailers, closed four design centers, and sold two to an independent retailer.previous fiscal year.
Retail revenue from Ethan Allen operated design centers for the twelve months ended June 30, 20132016 increased by $18.9$46.8 million, or 3.4%8.1%, to $578.3$626.5 million from $559.4$579.7 million for the twelve months ended June 30, 2012.We believe the increase in retail sales by Ethan Allen operated design centers is due to (i) our new product introductions, promotional marketing campaigns, and the design solutions approach of our interior design professionals, (ii) continued use of both our national television and direct mail media campaigns, (iii) our digital communications to prospective clients, and (iv) the positive effects of continuously repositioning our retail network. These factors were partly offset by a decrease in clearance sale2015. Comparable store revenue by our US retail division. We ended both the current and prior fiscal years with 147 Ethan Allen operated design centers.increased 8.5%. Year-over-year, written business of Ethan Allenorders for the Company operated design centers increased 1.1%1.7% and comparable design centers written businessorders increased 1.0%1.8%. A higher increase in net sales relative to written orders is reflected in the 13.1% decrease in ending backlog at June 30 2016.
Gross profit for fiscal 20132016 increased to $398.3$442.2 million from $390.3$411.2 million in fiscal 2012.2015. The $8.1$31.1 million increase in gross profit was primarily attributable to (i) the increaseincreases in both our retail and wholesale segment net sales, of 3.4% or $18.9 million (ii)as well as a stronger sell through of retail inventory, releasing profit contained in the retail segment inventory, and (iii) the higher mix of retail net sales to consolidated net sales in the current year (79.3%)fiscal 2016 of 78.9% compared to the 76.8% in the prior year period (76.7%). These positive factors were partly offset by a decline in wholesale gross profit driven primarily by 4.9% or $22.5 million lower wholesale net sales. Our consolidated gross margin increased to 54.6% for fiscal 2013 from 53.5% in fiscal 2012 as a result, primarily, of the factors noted above.year.
Operating expenses decreased $2.7 increased $7.8 million or 0.8%2.3% to $337.9$353.1 million or 46.3%44.5% of net sales in fiscal 20132016 from $340.6$345.2 million or 46.7%45.7% of net sales in fiscal 2012.2015. The decreaseincrease in currentfiscal year 2016 expenses in absolute dollars is primarily due to operating efficienciesincreased variable costs associated with our increased sales in our retail segment and general cost controls partly offset by (i) losses onboth business segments. As a percentage of net sales, expenses decreased during fiscal 2016 as compared to fiscal 2015 primarily due to gains associated with the saledisposal of vacant real estate (ii) costs of operating our plants in Mexico and Honduras, and (iii) costs of international expansion into Montreal and Belgium during fiscal 2013.2016 compared to expenses in the prior fiscal year.
Operating income for the fiscal year ended June 30, 20132016 totaled $60.4$89.2 million, or 8.3%11.2% of net sales, compared to $49.7$65.9 million, or 6.8%8.7% of net sales, in the prior year.Wholesalefiscal year.Wholesale operating income for fiscal 20132016 totaled $50.8$74.4 million, or 11.7%15.1% of net sales, as compared to $64.4$67.0 million, or 14.1%14.3% of net sales, in the prior year.Retail operating income was $8.0$16.5 million, or 1.4%2.6% of sales, for fiscal 2013,2016, compared to a loss of $11.5$1.7 million, or a negative 2.1%0.3% of sales, for fiscal 2012,2015, an improvementincrease of $19.5$14.7 million. The improvementincrease in consolidated operating income was primarily attributable (i) to an increase inincreased net sales, volume and operating efficiencies achieved in our retail segment, (ii) through greater sell throughthe net impact of retail segment inventory compared to the prior yearreal estate dispositions on both fiscal years as shown in the table above, partly offset by reduced volume in our wholesale segment.previously discussed.
Interest and other income, net was $0.4 million in fiscal 2016 compared to an expense of $1.5$3.3 million in fiscal 2013 compared to income of $0.6 million in2015. The prior fiscal 2012. The $2.0 million decrease was primarily due to theyearincluded a loss incurred on the repurchaseearly extinguishment of $24 million of theour Senior Notes duringin the fourth quarter ended March 31, 2015 of $3.7 million, which consisted of a $3.5 million “make whole” payment, and the current fiscal year.write-off of unamortized balances of original issue discount, deferred financing fees and derivative instruments.
Interest and other related financing costs decreased $0.2$4.3 million to $8.8$1.6 million from $9.0$5.9 million in the prior fiscal year. The decrease is primarily due to lower interest expense throughout fiscal 2016 due toearly extinguishment of our Senior Notes in the quarter ended March 31, 2015, as well as further debt outstanding. Interest savings on therepayments during fiscal 2013 Senior Note repurchases will be realized beginning in fiscal 2014.2016.
Income tax expense was an expense of $17.7$31.3 million for fiscal 2013 as compared to a benefit of $8.52016 and $19.5 million for fiscal 2012.2015. Our effective tax rate for fiscal 20132016 was 35.3%35.6% compared to a negative 20.5%34.5% in fiscal 2012. The current year2015.The effective tax rate for both fiscal years primarily includes tax expense on that fiscal year’s net income, and tax and interest expense on uncertain tax positions, and the recording of additional uncertain tax positions, partially offset by the reversal and recognition of previously unrecognized tax benefits and the impact of maintaining certain valuation allowances. The prior period effective tax rate includes the benefit from the reversal of certain valuation allowances on deferred tax assets established in fiscal 2010, and the recognition of certain previously unrecognized tax benefits, partly offset by tax expense on the prior year’s net income, recording additional uncertain tax positions and interest expense onsome uncertain tax positions.
Net income for fiscal 20132016 was $32.5$56.6 million as compared to $49.7$37.1 million in fiscal 2012.2015. Net income per diluted share totaled $1.11$2.00 in the current yearfiscal 2016 compared to $1.71$1.27 per diluted share in the prior fiscal year.
ETHAN ALLEN INTERIORS INC. AND SUBSIDIARIES
Fiscal 20122015 Compared to Fiscal 20112014
Consolidated revenue for the fiscal year ended June 30, 20122015 was $754.6 million compared to $746.7 million for fiscal 2014. There was year-over-year sales growth in the wholesale segment and a slight decline in the retail segment.The increase in the wholesale segment in fiscal 2015 was primarily due to higher shipments internationally and to our retail segment.
Wholesale revenue for fiscal 2015 increased by $50.4$15.8 million, or 7.4%3.5%, to $729.4$469.4 million from $679.0$453.6 million in fiscal 2011. There was year-over-year growth in both the wholesale and retail segments, in both net sales, and written orders.We believe this growth is due to (i) continued new and innovative marketing initiatives including promotional pricing and our interactive web site Ethanallen.com, (ii) the positive effects of our national television and direct mail media campaigns, (iii) an increase in the number of our highly skilled interior designers and other retail associates, (iv) significant new product introductions during the year, and (v) our continued repositioning of the retail network.
Wholesale revenue for fiscal 2012 increased by $34.0 million, or 8.0%, to $456.9 million from $422.9 million in the prior year.2014. The year-over-year increase was primarily attributable to a 14.9% increase in the incoming order rate for the first half of fiscal 2012, as we beganincreased sales to see a gradual though inconsistent improvement in consumer spending.both our Company operated design centers and independent retailers worldwide. Orders similarly increased 7.7% during the second half of fiscal 2012 decreased 5.6%, compared to a very strong same prior year period, but were up 6.1% over the first half of fiscal 2012. For the full year, orders increased 3.3% in fiscal 2012 compared to fiscal 2011. We believe this improvement in year-over-year sales and orders is due to our promotional activities, significant new product offerings, our ability to increase production through operating efficiencies, staffing increases, and an increase in theperiod. The number of total design centers globally to 298 atas of June 30, 20122015 was 299, which increased by four from 286 at June 30, 2011.2014. The independently operated retail network, grewnet of relocations, increased by twelve netthree design centers to 151155 at June 30, 20122015 including a net increase of 17five locations to 7075 in China. WhileChina.Our international net sales to independent retailers was 7.5% of our consolidated net sales for the count of Ethan Allen operated design centers was 147 atfiscal year ended June 30, of 2012 and 2011, we opened two new locations, relocated two others, closed five and acquired three design centers during fiscal 2012.2015 compared to 6.5% the for the year ended June 30, 2014.
Retail revenue from Ethan Allen operated design centers for the twelve months ended June 30, 2012 increased2015 decreased by $53.5$1.0 million, or 10.6%0.2%, to $559.4$579.7 million from $505.9$580.7 million for the twelve months ended June 30, 2011.We believe the increase in retail sales by Ethan Allen operated design centers is due to our promotional marketing campaigns and the design solutions approach of our interior design professionals, continued use of both our national television and direct mail media, our digital communications to prospective clients, the positive effects of repositioning the retail network, and an increase in the number of highly skilled interior designers, retail management, and other retail associates. We ended both the current and prior fiscal years with 147 Ethan Allen operated design centers as noted above.
Comparable design centers are those which have been operating for at least 15 months. Minimal net sales, derived from the delivery of customer ordered product, are generated during the first three months of operations of newly opened (including relocated) design centers. Design centers acquired by us from independent retailers are included in comparable design center sales in their 13th full month of Ethan Allen-owned operations.2014. Year-over-year, written business of Ethan Allenorders for the Company operated design centers increased 8.9%3.9% and comparable design centers written business increased 6.4%.4.4% Net sales were impacted by the increased level of clearance sales during fiscal 2015 as compared to fiscal 2014. The frequency of our promotional events as well as the timingstrengthening of the endU.S. dollar to the Canadian dollar and euro resulted in an average decrease in sales of those events can impact0.5% due to the seven to eight design centers we operated in Canada and Europe throughout the fiscal year. The increase in written orders booked during a given period.is reflected in the 18.6% increase in ending backlog at June 30 2015.
Each year we make considerable investments to strengthen the level of service, professionalism, interior design competence, efficiency, and effectiveness of the retail design center personnel. We believe that over time, we will continue to benefit from (i) our repositioning of the retail network, (ii) new product introductions, (iii) new marketing promotions, and our interior design affiliate (IDA) program, (iv) continued use of technology coupled with personal service from our design professionals and our touch screen displays, and (v) ongoing use of targeted advertising media.
Gross profit for fiscal 20122015 increased to $390.3$411.2 million from $349.5$406.5 million in fiscal 2011.2014. The $40.8$4.7 million increase in gross profit was primarily attributable to (i) an overall increase in net sales of 7.4%, with increases in both segments, (ii) improved operating efficiencies, (iii) improved product mix within theour wholesale segment of both manufacturing efficiency and (iv) the highernet sales. This was partly offset by a lower mix of retail net sales to consolidated net sales in the current year (76.7%)fiscal 2015 of 76.8% compared to the prior year period (74.5%). With77.8% in fiscal 2014, and a net increase in cost of goods sold due to the elimination of intercompany profit in ending inventory.
Operating expenses increased $8.4 million or 2.5% to $345.2 million or 45.7% of net sales in fiscal 2015 from $336.9 million or 45.1% of net sales in fiscal 2014. The increase in fiscal 2015 expenses is primarily due to costs associated with strengthening our additional manufacturing capacitymanagement team in Mexicothe retail segment, increased maintenance and Honduras we operated at approximately 75% of capacityrepair costs and depreciation expense associated with our retail design center refurbishing efforts undertaken during fiscal 20122015 and increased expense associated with the disposal of real estate, due to our continual repositioning of the retail network.
Operating income for the fiscal year ended June 30, 2015 totaled $65.9 million, or 8.7% of net sales, compared to 80%$69.6 million, or 9.3% of net sales, in fiscal 2011. The consolidated gross margin increased to 53.5%2014.Wholesale operating income for fiscal 2012 from 51.5%2015 totaled $67.0 million, or 14.3% of net sales, as compared to $57.8 million, or 12.7% of net sales, in fiscal 20112014. Retail operating income was $1.7 million, or 0.3% of sales, for fiscal 2015, compared to $10.5 million, or 1.8% of sales, for fiscal 2014, a decrease of $8.8 million. The reduction in consolidated operating income was primarily attributable to increased operating expenses in our retail segment and increased clearance sales as previously discussed, and an increase in the intercompany profit in ending inventory, partly offset by increases in our wholesale segment due to efficiency and volume.
Interest and other income, net was an expense of $3.3 million in fiscal 2015 compared to income of $0.3 million in fiscal 2014. Fiscal 2015included a result, primarily,loss on the early extinguishment of our Senior Notes in the factors set forth above.quarter ended March 31, 2015 of $3.7 million, which consisted of a $3.5 million “make whole” payment, and the write-off of unamortized balances of original issue discount, deferred financing fees and derivative instruments.
Operating expenses increased $23.1 million, or 7.3%, to $340.6 million, or 46.7% of net sales, in fiscal 2012 from $317.5 million, or 46.8% of net sales, in fiscal 2011. The increase in current year expenses is primarily due to (i) the increase in sales which primarily affected commissions and delivery and warehousing costs, (ii) increased compensation and benefit costs primarily from increased investments in retail management, designers and other associates, (iii) increased costs associated with our significant new product introductions in the current fiscal year, (iv) a loss on the sale of real estate in our retail segment during the second quarter of fiscal 2012, (v) an increase in our IT costs due to investments in technology across the business in fiscal 2012, and (vi) higher advertising costs.ETHAN ALLEN INTERIORS INC. AND SUBSIDIARIES
Operating income for the year ended June 30, 2012 totaled $49.7 million, or 6.8% of net sales, compared to $31.9 million, or 4.7% of net sales, in the prior year.Wholesale operating income for fiscal 2012 totaled $64.4 million, or 14.1% of net sales, as compared to $49.9 million, or 11.8% of net sales, in the prior year.Retail operating loss was $11.5 million, or 2.1% of sales, for fiscal 2012, compared to a loss of $15.4 million, or 3.0% of sales, for fiscal 2011, an improvement of $3.8 million. Improvements in operating income in both segments was primarily attributable to an increase in sales volume, but also arose from continuing operating efficiencies achieved.
Interest and other income, net totaled $0.6 million in fiscal 2012 as compared to $5.6 million in fiscal 2011. The $5.0 million decrease was mostly due to a decrease in miscellaneous non-operating fees during the current fiscal year and the recording in fiscal 2011 of a $1.5 million out of period adjustment benefiting the prior fiscal year, related to non-operating income in prior years.
Interest and other related financing costs decreased $2.1$1.6 million to $9.0$5.9 million from $11.1$7.5 million in the prior year.fiscal 2014. The decrease is primarily due to lower interest expense throughout fiscal 2015, from lower debt due to the decreaseSenior Note repurchases during fiscal 2014 and the early extinguishment of our Senior Notes in the principal amount of our senior unsecured debt outstanding as a result of our repurchases of an aggregate of $12.0 million of that debt during fiscal 2012, which followed fiscal 2011 aggregate repurchases of $34.6 million.quarter ended March 31, 2015.
Income tax expense was a benefit of $8.5$19.5 million for both fiscal 2012 as compared to a benefit of $2.9 million for2015 and fiscal 2011.2014. Our effective tax rate for fiscal 20122015 was a negative 20.5%34.5% compared to a negative 10.9%31.2% in fiscal 2011.2014. The Fiscal 2012fiscal 2015 effective tax rate includes the benefit from the reversal of valuation allowance,tax expense on income, and the recognition of certain previously unrecognized tax benefits, partly offset by tax expense on the current year’s net income, recording additional uncertain tax positions and interest expense on additional uncertain tax positions. The fiscal 2014 effective tax rate includes tax expense on income, the benefit from the reversal of valuation allowances against certain deferred tax assets in the retail segment, and the recognition of certain previously unrecognized tax benefits, partially offset by tax and interest expense on additional uncertain tax positions.
The effective tax rateNet income for fiscal 20112015 was impacted by a tax benefit from the reduction in valuation allowance due to a decrease in deferred tax assets which were subject to a full valuation allowance. The rate was also impacted by a net tax benefit from the expiration of the statute of limitations causing certain unrecognized tax benefits to be recognized, partly offset by new tax issues that were identified in the year.
Net income for fiscal 2012 was $49.7$37.1 million as compared to $29.3$42.9 million in fiscal 2011.2014. Net income per diluted share totaled $1.71$1.27 in the current yearfiscal 2015 compared to $1.01$1.47 per diluted share in the prior year.fiscal 2014.
Liquidity and Capital Resources
As ofAt June 30, 2013,2016, we held unrestricted cash and equivalents of $52.7 million and restricted cash and investments of $7.8 million. At June 30, 2015, we held unrestricted cash and cash equivalents of $72.6$76.2 million, and marketable securities of $15.5$2.2 million, and restricted cash and investments of $8.0 million. We also held $15.4 million inDuring fiscal 2016 we used cash equivalents in restricted accounts in lieuto pay down a portion of letters of credit to minimize interest expense.our debt and for common share repurchases. Our principal sources of liquidity include cash and cash equivalents, marketable securities, cash flow from operations, and borrowing capacityamounts available under our revolving credit facility, and other borrowings.
In September 2005, we issued $200 million in ten-year senior unsecured notes due October 1, 2015 (the "Senior Notes"). The Company hasentered into a five year, $150 million senior secured asset-based, revolving credit and term loan facility on October 21, 2014, as amended (the “Facility”). The Facility, which expires on October 21, 2019, provides revolving credit financinga term loan of up to $50$35 million and a revolving credit line of up to $115 million, subject to borrowing base availability,availability. During March 2015, we utilized $35 million of the term loan and includes a right for$40 million of the Companyrevolving credit line, along with our available cash to increasefully redeem our Senior Notes. We incurred financing costs of $1.5 million under the total facility to $100 million either with existing or additional lenders subject to certain conditions. The Facility, expires March 25, 2016, or June 26, 2015 ifwhich are being amortized by the Company’s Senior Notes (as defined below) have not been refinanced. interest method, over the remaining life of the Facility.
At the Company’s option, revolving loans under the Facility bear interest, based on the average availability, at an annual rate of either:either (a) the London Interbank Offered rate (“LIBOR”) plus 1.5% to 1.75%, or (b) the higher of (i) the prime rate, (ii) the federal funds effective rate plus 0.50%, or (iii) LIBOR plus 1.0% plus in each case 0.5% to 0.75%. At June 30, 2016 the annual interest rate in effect on the revolving loan was 2.0%.
|
|
|
|
The CompanypaysCompany pays a commitment fee of 0.15% to 0.25% per annum on the unused portion of the Facility, and participation fees on issued letters of credit at an annual rate of 1.0%1.5% to 2.5%,1.75% based on the average availability and the letter of credit type. If the average monthly availability is less than the greater of (i) 12.5% of the aggregate commitment and (ii) $6.3 million, the Company’s fixed charge coverage ratio may not be less than 1 to 1 for any period of four consecutive fiscal quarters.availability. Certain payments are restricted if the availability ofunder the collateral supporting the facilityrevolving credit line falls below $10 million or 20% of the facility size.total revolving credit line, and the Company is subject to pro forma compliance with the fixed charge coverage ratio if applicable.
ETHAN ALLEN INTERIORS INC. AND SUBSIDIARIES
Quarterly installments of principal on the term loan are payable based on a straight line 15-year amortization period, with the balance due at maturity. The Company does not expect to repay the revolving credit line portion of the Facility within the next year.
The Facility is secured by all property owned, leased or operated by the Company in the United States excluding anyand includes certain real property owned by the Company and contains customary covenants which may limit the Company’s ability to incur debt; engage in mergers and consolidations; make restricted payments (including dividends)dividends and share repurchases); sell certain assets; and make investments.
The Company must maintain a minimum fixed charge coverage ratio of 1.1 to 1.0 at all times. If the outstanding term loans are less than $17.5 million and the fixed charge coverage ratio equals or exceeds 1.25 to 1.0, the fixed charge coverage ratio ceases to apply and thereafter is only triggered if average monthly availability is less than 15% of the amount of the revolving credit line.During November 2015, we made a $16.5 million prepayment on the term loan, bringing the outstanding term loan to $17.3 million, and the fixed charge coverage ratio ceased to apply.Our subsequent average availability exceeded 65%, such that the fixed charge coverage ratio did not apply.
The Company intends to use the Facility for working capital and general corporate purposes, including dividend payments and share repurchases, in addition to the refinancing of our Senior Notes which occurred in March 2015. At both June 30, 2013, we had no revolving loans2016 and $0.6June 30, 2015, there was $0.2 million of standby and trade letters of credit outstanding under the Facility. RemainingTotal availability under the facility totaled $49.4Facility was $89.8 million subjectat June 30, 2016 and $74.8 million at June 30, 2015. The increase in availability was due to limitations set forth in$15.0 million payments we made on the agreement and as a result, the coverage charge ratio, and other restricted payment limitations did not apply.revolving loan during fiscal 2016.
In September 2005, we issued $200.0 million in ten-year senior unsecured notes due 2015 (the "Senior Notes"). The Senior Notes were issued by Global, bearing an annual coupon rate of 5.375% with interest payable semi-annually in arrears on April 1 and October 1. We used the net proceeds of $198.4 million to improve our retail network, invest in our manufacturing and logistics operations, and for other general corporate purposes. In fiscal years 2011 through 2013, the Company repurchased an aggregate $70.6 million of the Senior Notes in several unsolicited transactions, including $24 million repurchased during the fourth quarter of fiscal 2013.
As ofAt both June 30, 2013,2016 and June 30, 2015, we arewere in compliance with all covenants of the FacilitySenior Notes and our Senior Notes.the credit facilities.
A summary of net cash provided by (used in) operating, investing, and financing activities for each of the last three fiscal years is provided below (in millions):
Fiscal Years Ended June 30, | ||||||||||||
2016 | 2015 | 2014 | ||||||||||
Cash provided by (used in) operating activities | ||||||||||||
Net income plus depreciation and amortization | $ | 76.0 | $ | 56.3 | $ | 60.9 | ||||||
Working capital items | (19.3 | ) | (15.2 | ) | (2.1 | ) | ||||||
Other operating activities | 1.7 | 14.0 | 1.1 | |||||||||
Total provided by operating activities | $ | 58.4 | $ | 55.1 | $ | 59.9 | ||||||
Cash provided by (used in) investing activities | ||||||||||||
Capital expenditures & acquisitions | $ | (23.1 | ) | $ | (21.8 | ) | $ | (19.3 | ) | |||
Net sales (purchases) of marketable securities | 2.2 | 15.4 | (3.4 | ) | ||||||||
Other investing activities | 8.4 | 9.8 | 10.6 | |||||||||
Total provided (used) in investing activities | $ | (12.5 | ) | $ | 3.4 | $ | (12.1 | ) | ||||
Cash provided by (used in) financing activities | ||||||||||||
Payments of long-term debt and capital lease obligations | $ | (34.8 | ) | $ | (133.7 | ) | $ | (0.5 | ) | |||
Borrowings from revolving credit and term loan facilities | $ | - | $ | 75.0 | $ | - | ||||||
Purchases and retirements of company stock | (19.3 | ) | (17.6 | ) | - | |||||||
Payment of cash dividends | (16.6 | ) | (13.3 | ) | (11.3 | ) | ||||||
Other financing activities | 1.6 | (1.4 | ) | 0.5 | ||||||||
Total used in financing activities | $ | (69.1 | ) | $ | (91.0 | ) | $ | (11.3 | ) | |||
Fiscal Year Ended June 30, 2013 2012 2011 Operating Activities Net income plus depreciation and amortization Working capital items Other operating activities Total provided by operating activities Investing Activities Capital expenditures & acquisitions Net sales (purchases) of marketable securities Other investing activities Total used in investing activities Financing Activities Payments of long-term debt and capital lease obligations Purchases and retirements of company stock Payment of cash dividends Other financing activities Total used in financing activities $ 50.5 $ 68.3 $ 50.1 2.4 (13.2 ) 11.9 8.4 (17.4 ) 1.2 $ 61.3 $ 37.7 $ 63.2 $ (19.8 ) $ (23.4 ) $ (12.1 ) (7.1 ) 3.6 (2.1 ) 5.3 3.6 4.6 $ (21.6 ) $ (16.2 ) $ (9.6 ) $ (26.1 ) $ (12.2 ) $ (37.9 ) - (1.3 ) (5.4 ) (22.2 ) (8.1 ) (5.8 ) 1.7 0.7 - $ (46.6 ) $ (20.9 ) $ (49.1 )
Cash Provided By (Used in) Operating Activities
In fiscal 2013,2016 cash of $61.3$58.4 million was generatedprovided by operating activities, an increase of $23.6$3.3 million overfrom $55.1 million in the prior year comparable period. This was largely due to an increase in net income in fiscal 2012.2016. This increase was driven by a $31.1 million change in cash flow generated from changes in inventory plus $8.9 million higher income before income taxes partly offset by unfavorable changesnet decreases in cash flow generated from changes in customer depositsother operating activities of $9.3 million, accounts payable $4.7$12.3 million and netcash used for working capital in the ordinary course of business of $4.1 million (defined below). Net income plus depreciation and amortization in the prior fiscal year includes a $3.7 million expense for the early redemption of our Senior Notes. Of this amount, $3.5 million is offset as a positive in other operating activities, as this is considered a financing activity and not an operating activity. Other operating activities changed primarily due to net gains on the sale of real estate in the current year compared to net losses in the prior year. These are deducted from net income to arrive at cash from operating activities. Working capital items consist of $2.4 million.current assets (accounts receivable, inventories, prepaid and other current assets) less current liabilities (customer deposits, payables, and accrued expenses and other current liabilities).
Cash Provided By (Used in) Investing Activities
In fiscal 2013, $21.62016, cash of $12.5 million of cash was used in investing activities, which is $5.4 million morean increase in cash used thanof $16.0 million from $3.4 million which was provided by during the prior year comparable period. More cash was used during fiscal 2016 primarily due to decreases in fiscal 2012. This was due primarily to a $10.7 million increase in purchasesnet sales of marketable securities partly offset by lowerin the current fiscal year. There were also less proceeds from the sale of real estate in fiscal 2016 than in the prior fiscal year, although the gains on sale were greater in fiscal 2016 than in the prior fiscal year, and increased current fiscal year capital spending and acquisitions and higher net cash from other investing activities.expenditures. We anticipate that cash from operations will be sufficient to fund future capital expenditures, business conditions permitting.expenditures.
ETHAN ALLEN INTERIORS INC. AND SUBSIDIARIES
Cash Provided By (Used in) Financing Activities
Financing Activities
In fiscal 2013, $46.62016, $69.1 million was used in financing activities, which is $25.7a decrease of $21.8 million more cash than usedfrom $91.0 million in financing activities in fiscal 2012.the prior year comparable period. This was driven primarily by $14.1 million more paid in dividends in fiscal 2013 and $12.0 million moredue to the early redemption of our Senior Notes repurchased duringin March 2015. The Senior Notes had a face value of $129.4 million, which we redeemed by paying $54.4 million with available cash, and $75 million with borrowings under the currentFacility. We also paid a $3.5 million prepayment premium to bondholders as stipulated in the original bond indenture. During fiscal year. The increase2016 we made a $16.5 million prepayment on the term loan, a $15 million payment on our revolver, $3.3 million in scheduled payments on debt and capital leases, and utilized $19.3 million to repurchase 697,799 shares at a weighted average cost of $27.72 per share. At June 30, 2016 we have remaining Board authorization to repurchase 1.8 million shares.Cash dividends were due to (i) a special dividend of $0.41paid per share increased from $0.10 to $0.12 in December 2012October 2014, $0.14 in July 2015, and (ii)$0.17 in April 2016, resulting in an increase in the regular quarterly dividend from $.07 per share to $.09 per share from July 2012 forward.payments during fiscal 2016 of 24.7%. We expect to continue to declare quarterly dividends for the foreseeable future, business conditions permitting.
As ofOur total debt obligations at June 30, 2013, our outstanding debt totaled $131.3 million, the current and long-term portions of which amounted to less than $0.5 million and $130.8 million, respectively. The aggregate scheduled maturities of long-term debt for each2016 consist of the next five fiscal years are $0.5 million in each of fiscal 2014 and 2015, $129.7 million in fiscal 2016, $0.5 million in fiscal 2017, and $0.1 million in fiscal 2018 and thereafter.following (in millions):
Revolving Credit Facility due 10/21/2019 | $ | 25.0 | ||
Term Loan due 10/21/2019 | $ | 16.2 | ||
Capital leases | $ | 1.5 | ||
Unamortized debt issuance costs | $ | (0.9 | ) | |
Total debt | $ | 41.8 | ||
Less current maturities | $ | 3.0 | ||
Total long-term | $ | 38.8 |
The following table summarizes, as of June 30, 2013,2016, the timing of cash payments related to our outstanding contractual obligations (in thousands)millions):
Less | More | |||||||||||||||||||
than 1 | 1-3 | 4-5 | than 5 | |||||||||||||||||
Total | Year | Years | Years | Years | ||||||||||||||||
Long-term debt obligations: | ||||||||||||||||||||
Debt maturities | $ | 41.8 | $ | 3.0 | $ | 4.7 | $ | 34.1 | $ | - | ||||||||||
Contractual interest | 2.7 | 0.9 | 1.6 | 0.2 | - | |||||||||||||||
Operating lease obligations | 215.4 | 33.9 | 60.7 | 46.5 | 74.3 | |||||||||||||||
Letters of credit | 0.2 | 0.2 | - | - | - | |||||||||||||||
Purchase obligations (1) | - | - | - | - | - | |||||||||||||||
Other long-term liabilities | 0.2 | - | - | 0.0 | 0.2 | |||||||||||||||
Total contractual obligations | $ | 260.3 | $ | 37.9 | $ | 67.0 | $ | 80.9 | $ | 74.5 | ||||||||||
Total Less than 1 Year 1-3 Years 4-5 Years More than 5 Years Long-term debt obligations: Debt maturities Contractual interest Operating lease obligations Letters of credit Purchase obligations (1) Other long-term liabilities Total contractual obligations $ 131,289 $ 480 $ 130,176 $ 633 $ - 15,847 7,036 8,792 19 - 202,531 30,485 51,936 40,311 79,799 586 586 - - - - - - - - 230 2 5 45 178 $ 350,483 $ 38,589 $ 190,909 $ 41,008 $ 79,977
(1) For purposes of this table, purchase obligations are defined as agreements that are enforceable and legally binding and that specify all significant terms, including fixed or minimum quantities to be purchased; fixed, minimum or variable price provisions; and the approximate timing of the transaction. While we are not a party to any significant long-term supply contracts or purchase commitments, we do, in the normal course of business, regularly initiate purchase orders for the procurement of (i) selected finished goods sourced from third-party suppliers, (ii) lumber, fabric, leather and other raw materials used in production, and (iii) certain outsourced services. All purchase orders are based on current needs and are fulfilled by suppliers within short time periods. At June 30, 2013,2016, our open purchase orders with respect to such goods and services totaled approximately $34$31 million.
Further discussion of our contractual obligations associated with outstanding debt and lease arrangements can be found in Notes 6 and 7, respectively, to the Consolidated Financial Statementsincluded under Item 8 of this Annual Report.
ETHAN ALLEN INTERIORS INC. AND SUBSIDIARIES
We believe that our cash flow from operations, together with our other available sources of liquidity, will be adequate to make all required payments of principal and interest on our debt, to permit anticipated capital expenditures, and to fund working capital and other cash requirements. As of June 30, 2013,2016, we had working capital of $127.6$124.9 million compared to $130.0 million at June 30, 2015, a decrease of $5.2 million and a current ratio of 1.962.0 to 1.1 at June 30, 2016 and 1.9 to 1 at June 30, 2015. In addition to using available cash to fund changes in working capital, necessary capital expenditures, acquisition activity, the repayment of debt, and the payment of dividends, the Company has been authorized by our Boardboard of Directorsdirectors to repurchase our common stock, from time to time, either directly or through agents, in the open market at prices and on terms satisfactory to us.
Off-Balance Sheet Arrangements and Other Commitments, Contingencies and Contractual Obligations
Except as indicated below, we do not utilize or employ any off-balance sheet arrangements, including special-purpose entities, in operating our business. As such, we do not maintain any (i) retained or contingent interests, (ii) derivative instruments, or (iii) variable interests which could serve as a source of potential risk to our future liquidity, capital resources and results of operations.
We may, from time to time in the ordinary course of business, provide guarantees on behalf of selected affiliated entities or become contractually obligated to perform in accordance with the terms and conditions of certain business agreements. The nature and extent of these guarantees and obligations may vary based on our underlying relationship with the benefiting party and the business purpose for which the guarantee or obligation is being provided. The only such program in place at both June 30, 20132016 and June 30, 2015 was for our consumer credit program.program described below.
Ethan Allen Consumer Credit Program
The terms and conditions of our consumer credit program, which is financed and administered by a third-party financial institution on a non-recourse basis to Ethan Allen, are set forth in an agreement between the Company and that financial service provider (the “Program Agreement”). which was last amended effective January 2014. Any independent retailer choosing to participate in the consumer credit program is required to enter into a separate agreement with that same third-party financial institution which sets forth the terms and conditions under which the retailer is to perform in connection with its offering of consumer credit to its customers (the “Retailer Agreement”). We have obligated ourselves on behalf of any independent retailer choosing to participate in our consumer credit program by agreeing, in the event of default, breach, or failure of the independent retailer to perform under such Retailer Agreement, to take on certain responsibilities of the independent retailer, including, but not limited to, delivery of goods and reimbursement of customer deposits. Customer receivables originated by independent retailers remain non-recourse to Ethan Allen. Our obligation remains in effect for the term of theThe Program Agreement that expires inwill terminate on July 2014. We expect to renew or replace the current program with31, 2019, but includes a similar program during fiscal 2014.provision for automatic one-year renewals unless either party gives notice of termination. While the maximum potential amount of future payments (undiscounted) that we could be required to make under this obligation is indeterminable, recourse provisions exist that would enable us to recover, from the independent retailer, any amount paid or incurred by us related to our performance. Based on the underlying creditworthiness of our independent retailers, including their historical ability to satisfactorily perform in connection with the terms of our consumer credit program, we believe this obligation will expire without requiring funding by us. To ensure funding for delivery of products sold, the terms of this agreementthe Program Agreement also contain a right for the credit card issuerfinancial services provider to demand from the Company collateral at a variable rate based on the volume of up to $12 millionprogram sales if the Company does not meet certain covenants. As ofAt June 30 2013,of 2016 and 2015, no collateral was required under the Company had established a restricted cash and investment collateral account of $6 million to satisfy the current requirement under this demand.Program Agreement.
Product WarrantiesETHAN ALLEN INTERIORS INC. AND SUBSIDIARIES
Product Warranties
Our products, including our case goods, upholstery and home accents, generally carry explicit product warranties that extend from three to seven years and are provided based on terms that are generally accepted in the industry. All of our domestic independent retailers are required to enter into, and perform in accordance with the terms and conditions of, a warranty service agreement. We record provisions for estimated warranty and other related costs at time of sale based on historical warranty loss experience and make periodic adjustments to those provisions to reflect actual experience. On rare occasion, certain warranty and other related claims involve matters of dispute that ultimately are resolved by negotiation, arbitration or litigation. In certain cases, a material warranty issue may arise which is beyond the scope of our historical experience. We provide for such warranty issues as they become known and are deemed to be both probable and estimable. It is reasonably possible that, from time to time, additional warranty and other related claims could arise from disputes or other matters beyond the scope of our historical experience. As of June 30, 2013,2016 and 2015, the Company’s product warranty liability totaled $0.8 million.$1.2 million and $1.0 million, respectively.
Impact of Inflation
We believe inflation had an impact on our business the last three fiscal years but we have generally been able to create operational efficiencies, seek lower cost alternatives, or raise selling prices in order to offset increases in product and operating costs. It is possible in the future that we will not be successful in our efforts to offset the impacts from inflation.
Business Outlook
We continue to strengthen our vertically integrated structure from concept of idea, to engineering, to manufacturing, to retail and logistics. On the manufacturing side, our objective is to maintain strong manufacturing capabilities in North America, which we believe is a long-term competitive advantage that will allow us to advance our objectives of maintaining short order times, exceptional quality and improving capacity to ship custom made to order items more quickly, which in turn will allow us to grow our business. In September 2015, the Company announced the planned doubling of its upholstery manufacturing facility in Mexico. The home furnishings industry remainsexpansion has begun and is expected to be completed within the next two years.
Beginning in fiscal 2014, we have been undergoing a slow recovery period followingmajor transformation of our product offerings, which is intended to refresh over 70% of our products with the ’Great Recession’. Many macroeconomic factorscompletion of the most current phase during the summer through fall of 2016. We believe that we are well positioned to leverage all the actions we have improved including unemployment, consumer confidence, and housing related market indicators in the U.S. However, the U.S. home furnishings industry remains highly competitive and promotional. We remain cautiously optimistic about our performance due to the many strong programs already in place and others we currently plan to introduce in the coming months.taken.
We expect the home furnishings industry to remain extremely competitive with respect to both the sourcing of products and the wholesale and retail sale of those products for the foreseeable future. Domestic manufacturers continue to face pricing pressures because of the lower manufacturing costs in some other countries, particularly within Asia. While we have also turned toutilize overseas sourcing to remain competitive,for approximately one quarter of our products, we choose to differentiate ourselves by maintaining a substantial North American manufacturing base, where we can leverage our vertically integrated structure to our advantage. We continue to believe that a balanced approach to product sourcing, which includes the domestic manufactureour own North American manufacturing of certainabout 75% of our product offerings coupled with the import of other selected products, provides the greatest degree of flexibility and is the most effective approach to ensuring that acceptable levels of quality, service and value are attained.
We therefore remain cautiously optimistic about our performance due to the many strong programs already in place and others we currently plan to introduce in the coming months. Our retail strategy involves (i) a continued focus on providing new product introductions, a wide array of product solutions, and superior interior design solutions through our large staff of interior design professionals, (ii) continuing strong advertising and marketing campaigns to get our message across and to continue to broadenbroadening our customer base, (iii) the opening of new or relocated design centers in more prominent locations, whileand encouraging independent retailers to do the same, (iv) leveraging the use of technology and personal service within our retail network and online through www.ethanallen.com, and (v) further expansion internationally. We believe this strategy provides an opportunity to grow our business.
Further discussion of the home furnishings industry has been included underItem 1 of this Annual Report.
ETHAN ALLEN INTERIORS INC. AND SUBSIDIARIES
Where You Can Find Other Information
Our website iswww.ethanallen.com. Information contained on our website is not part of this Annual Report on Form 10-K. Information that we furnish or file with the SEC, including our Annual Reports on Form 10-K, Quarterly Reports on Form 10-Q, Current Reports on Form 8-K and any amendments to, or exhibits included in, these reports are available for download, free of charge, on our website soon after such reports are filed with or furnished to the SEC. Our SEC filings, including exhibits filed therewith, are also available on the SEC’s website at www.sec.gov. You may obtain and copy any document we furnish or file with the SEC at the SEC’s public reference room at 100 F Street, NE, Room 1580, Washington, D.C. 20549. You may obtain information on the operation of the SEC’s public reference facilities by calling the SEC at 1-800-SEC-0330. You may request copies of these documents, upon payment of a duplicating fee, by writing to the SEC at its principal office at 100 F Street, NE, Room 1580, Washington, D.C. 20549.
Recent Accounting Pronouncements
See Note 1 to our consolidated financial statements included in Part II, Item 8 of this Annual Report on Form 10-K.
In February 2013, the Financial Accounting Standards Board (“FASB”) issued ASU 2013-02,“Reporting of Amounts Reclassified Out of Accumulated Other Comprehensive Income”. This ASU requires items reclassified in their entirety to net income from accumulated other comprehensive income in the same reporting period to be reported separately from other amounts in other comprehensive income, either on the face of the financial statements or in the notes to the financial statements. We adopted this ASU in the fourth quarter of fiscal 2013 and it had no material impact on our consolidated financial statements.
Item 7A. Quantitative and Qualitative Disclosures About Market Risk
We are exposed to market risks relating to fluctuations in interest rates and foreign currency exchange rates.
Interest rate risk exists primarily through our borrowing activities. We utilize United States dollar denominated borrowings to fund substantially all our working capital and investment needs. Short-term debt, if required, is used to meet working capital requirements and long-term debt is generally used to finance long-term investments. There is inherent rollover risk for borrowings as they mature and are renewed at current market rates. The extent of this risk is not quantifiable or predictable because of the variability of future interest rates and our future financing requirements.
For floating-rate obligations, interest rate changes do not affect the fair value of the underlying financial instrument but would impact future earnings and cash flows, assuming other factors are held constant. Conversely, for fixed-rate obligations, interest rate changes affect the fair value of the underlying financial instrument but would not impact earnings or cash flows. At June 30, 2013,2016, we had no$41.2 million of floating-rate debt obligations outstanding. Asoutstanding under our Facility. We currently do not engage in any interest rate hedging activity and we have no intention of that same date, our fixed-rate debt obligations primarily consisteddoing so in the foreseeable future. Based on the average interest rate of the Senior Notes issued on September 27, 2005. The estimated fair value ofloans under the Senior Notes as ofFacility during the quarter ended June 30, 2013 was $133.9 million as compared2016, and to the extent that borrowings were outstanding, a carrying value10% change in the interest rate would not have a material effect on our consolidated results of $129.2 million.operations and financial condition.
Foreign currency exchange risk is primarily limited to our operation of five Ethan Allen operated retail design centers located in Canada, twoone distribution center in Belgium, and our plants in Mexico and Honduras, as substantially all purchases of imported parts and finished goods are denominated in United States dollars. As such, gains or losses resulting from market changes in the value of foreign currencies have not had, nor are they expected to have, a material effect on our consolidated results of operations. A decrease in the value of foreign currencies (in particular Asian) relative to the United States dollar may affect the profitability of our vendors but as we employ a balanced sourcing strategy, we believe any impact would be moderate relative to peers in the industry.
Item 8. Financial Statements and Supplementary Data
Our Consolidated Financial Statements and Supplementary Data are listed in Item 15 of this Annual Report.
ETHAN ALLEN INTERIORS INC. AND SUBSIDIARIES
Report of Independent Registered Public Accounting Firm
The Board of Directors and Shareholders
Ethan Allen Interiors Inc.:
We have audited the accompanying consolidated balance sheets of Ethan Allen Interiors Inc. and subsidiaries (the Company) as of June 30, 20132016 and 2012,2015, and the related consolidated statements of comprehensive income, shareholders’ equity, and cash flows for each of the years in the three-year period ended June 30, 2013.2016. We also have audited the Company’s internal control over financial reporting as of June 30, 2013,2016, based on criteria established inInternal Control – Integrated Framework (2013) issued by the Committee of Sponsoring Organizations of the Treadway Commission (COSO). The Company’s management is responsible for these consolidated financial statements, for maintaining effective internal control over financial reporting, and for its assessment of the effectiveness of internal control over financial reporting, included in the accompanying Management’s Report on Internal Control over Financial Reporting. Our responsibility is to express an opinion on these consolidated financial statements and an opinion on the Company’s internal control over financial reporting based on our audits.
We conducted our audits in accordance with the standards of the Public Company Accounting Oversight Board (United States). Those standards require that we plan and perform the audits to obtain reasonable assurance about whether the financial statements are free of material misstatement and whether effective internal control over financial reporting was maintained in all material respects. Our audits of the consolidated financial statements included examining, on a test basis, evidence supporting the amounts and disclosures in the financial statements, assessing the accounting principles used and significant estimates made by management, and evaluating the overall financial statement presentation. Our audit of internal control over financial reporting included obtaining an understanding of internal control over financial reporting, assessing the risk that a material weakness exists, and testing and evaluating the design and operating effectiveness of internal control based on the assessed risk. Our audits also included performing such other procedures as we considered necessary in the circumstances. We believe that our audits provide a reasonable basis for our opinions.
A company’s internal control over financial reporting is a process designed to provide reasonable assurance regarding the reliability of financial reporting and the preparation of financial statements for external purposes in accordance with generally accepted accounting principles. A company’s internal control over financial reporting includes those policies and procedures that (1) pertain to the maintenance of records that, in reasonable detail, accurately and fairly reflect the transactions and dispositions of the assets of the company; (2) provide reasonable assurance that transactions are recorded as necessary to permit preparation of financial statements in accordance with generally accepted accounting principles, and that receipts and expenditures of the company are being made only in accordance with authorizations of management and directors of the company; and (3) provide reasonable assurance regarding prevention or timely detection of unauthorized acquisition, use, or disposition of the company’s assets that could have a material effect on the financial statements.
Because of its inherent limitations, internal control over financial reporting may not prevent or detect misstatements. Also, projections of any evaluation of effectiveness to future periods are subject to the risk that controls may become inadequate because of changes in conditions, or that the degree of compliance with the policies or procedures may deteriorate.
In our opinion, the consolidated financial statements referred to above present fairly, in all material respects, the financial position of Ethan Allen Interiors Inc. and subsidiaries as of June 30, 20132016 and 2012,2015, and the results of its operations and its cash flows for each of the years in the three-year period ended June 30, 2013,2016, in conformity with U.S. generally accepted accounting principles. Also in our opinion, Ethan Allen Interiors Inc. and subsidiaries maintained, in all material respects, effective internal control over financial reporting as of June 30, 2013,2016, based on criteria established inInternal Control – Integrated Framework (2013) issued by the Committee of Sponsoring Organizations of the Treadway Commission.Commission (COSO).
/s/ KPMG LLP
Stamford, Connecticut
August 16, 20138, 2016
ETHAN ALLEN INTERIORS INC. AND SUBSIDIARIES
Consolidated Balance Sheets
Consolidated Balance Sheets 2013 2012 ASSETS Current assets: Cash and cash equivalents Marketable securities Accounts receivable, less allowance for doubtful accounts of $1,230 at June 30, 2013 and $1,250 at June 30, 2012 Inventories Prepaid expenses and other current assets Total current assets Property, plant and equipment, net Goodwill and other intangible assets Restricted cash and investments Other assets Total assets LIABILITIES AND SHAREHOLDERS' EQUITY Current liabilities: Current maturities of long-term debt Customer deposits Accounts payable Accrued compensation and benefits Accrued expenses and other current liabilities Total current liabilities Long-term debt Other long-term liabilities Total liabilities Shareholders' equity: Class A common stock, par value $0.01; 150,000,000 shares authorized; 48,557,973 shares issued at June 30, 2013 and 48,485,704 shares issued at June 30, 2012 Class B common stock, par value $0.01; 600,000 shares authorized; none issued Preferred stock, par value $0.01; 1,055,000 shares authorized; none issued Additional paid-in-capital Less: Treasury stock (at cost), 19,650,385 shares at June 30, 2013 and 19,650,385 shares at June 30, 2012 Retained earnings Accumulated other comprehensive income Total Ethan Allen Interiors Inc. shareholders' equity Noncontrolling interests Total shareholders equity Total liabilities and shareholders' equity June 30, 2016 and 2015 (In thousands, except share data) 2016 2015 ASSETS Current assets: Cash and cash equivalents Marketable securities Accounts receivable, less allowance for doubtful accounts of $1,639 at June 30, 2016 and $1,386 at June 30, 2015 Inventories Prepaid expenses and other current assets Total current assets Property, plant and equipment, net Goodwill and other intangible assets Restricted cash and investments Other assets Total assets LIABILITIES AND SHAREHOLDERS' EQUITY Current liabilities: Current maturities of long-term debt Customer deposits Accounts payable Accrued compensation and benefits Accrued expenses and other current liabilities Total current liabilities Long-term debt Other long-term liabilities Total liabilities Shareholders' equity: Class A common stock, par value $0.01; 150,000,000 shares authorized; 48,921,544 shares issued at June 30, 2016 and 48,884,5866 shares issued at June 30, 2015 Class B common stock, par value $0.01; 600,000 shares authorized; none issued Additional paid-in-capital Less: Treasury stock (at cost), 21,175,416 shares at June 30, 2016 and 20,477,617 shares at June 30, 2015 Retained earnings Accumulated other comprehensive income Total Ethan Allen Interiors Inc. shareholders' equity Noncontrolling interests Total shareholders' equity Total liabilities and shareholders' equity 2013 2012 2011 Net sales Cost of sales Gross profit Selling, general and administrative expenses Operating income Interest and other income (expense) Interest and other related financing costs Income before income taxes Income tax expense (benefit) Net income Per share data: Net income per basic share Basic weighted average common shares Net income per diluted share Diluted weighted average common shares Dividends declared per common share Comprehensive income: Net income Other comprehensive income Curency translation adjustment Other Other comprehensive income (loss) net of tax Comprehensive income See accompanying notes to consolidated financial statements. ETHAN ALLEN INTERIORS INC. AND SUBSIDIARIES Consolidated Statements of Comprehensive Income For Years Ended June 30, 2016, 2015, and 2014 (In thousands, except share data) 2013 2012 2011 Operating activities: Net income Adjustments to reconcile net income to netcash provided by operating activities: Depreciation and amortization Compensation expense related to share-based payment awards Provision (benefit) for deferred income taxes Loss on disposal of property, plant and equipment Other Change in operating assets and liabilities, net ofeffects of acquired businesses: Accounts receivable Inventories Prepaid and other current assets Customer deposits Accounts payable Accrued expenses and other current liabilities Other assets and liabilities Net cash provided by operating activities Investing activities: Proceeds from the disposal of property, plant & equipment Change in restricted cash and investments Capital expenditures Acquisitions Purchases of marketable securities Sales of marketable securities Other investing activities Net cash used in investing activities Financing activities: Payments on long-term debt and capital lease obligations Purchases and retirements of company stock Payment of cash dividends Other financing activities Net cash used in financing activities Effect of exchange rate changes on cash Net increase (decrease) in cash & cash equivalents Cash & cash equivalents - beginning of year Cash & cash equivalents - end of year Supplemental cash flow information: Income taxes paid (received) Interest paid Non-cash capital lease obligations incurred 2016 2015 2014 Net sales Cost of sales Gross profit Selling, general and administrative expenses Operating income Interest and other income (expense) Interest and other related financing costs Income before income taxes Income tax expense Net income Per share data: Net income per basic share Basic weighted average common shares Net income per diluted share Diluted weighted average common shares Dividends declared per common share Comprehensive income: Net income Other comprehensive income Curency translation adjustment Other Other comprehensive income (loss) net of tax Comprehensive income See accompanying notes to consolidated financial statements. ETHAN ALLEN INTERIORS INC. AND SUBSIDIARIES Consolidated Statements of Cash Flows For Years Ended June 30, 2016, 2015, and 2014 (In thousands) Common Stock Additional Paid-in Capital Treasury Stock Other Comprehensive Income Retained Earnings Non- Controlling Interests Total Balance at June 30, 2010 Stock issued on share-based awards Compensation expense associated with share-based awards Purchase/retirement shares of company stock Issuance of treasury shares for 401k match Dividends declared on common stock Comprehensive income Balance at June 30, 2011 Stock issued on share-based awards Compensation expense associated with share-based awards Tax benefit associated with exercise of share based awards Purchase/retirement of company stock Dividends declared on common stock Increase from business combination Comprehensive income (loss) Balance at June 30, 2012 Stock issued on share-based awards Compensation expense associated with share-based awards Tax benefit associated with exercise of share based awards Dividends declared on common stock Comprehensive income (loss) Balance at June 30, 2013 2016 2015 2014 Operating activities: Net income Adjustments to reconcile net income to netcash provided by operating activities: Depreciation and amortization Compensation expense related to share-based payment awards Provision (benefit) for deferred income taxes Restructuring and impairment charge Loss (gain) on disposal of property, plant and equipment Other Change in operating assets and liabilities, net ofeffects of acquired businesses: Accounts receivable Inventories Prepaid and other current assets Customer deposits Accounts payable Accrued expenses and other current liabilities Other assets and liabilities Net cash provided by operating activities Investing activities: Proceeds from the disposal of property, plant & equipment Change in restricted cash and investments Capital expenditures Acquisitions Purchases of marketable securities Sales of marketable securities Other investing activities Net cash provided by (used in) investing activities Financing activities: Borrowings from revolving credit and term loan facilities Payments on long-term debt and capital lease obligations Purchases and retirements of company stock Payment of cash dividends Other financing activities Net cash used in financing activities Effect of exchange rate changes on cash Net increase (decrease) in cash & cash equivalents Cash & cash equivalents - beginning of year Cash & cash equivalents - end of year Supplemental cash flow information: Income taxes paid Interest paid Non-cash capital lease obligations incurred See accompanying notes to consolidated financial statements. ETHAN ALLEN INTERIORS INC. AND SUBSIDIARIES Consolidated Statements of Shareholders' Equity For Years Ended June 30, 2016, 2015, and 2014 (In thousands, except share data) Accumulated Additional Other Non- Common Paid-in Treasury Comprehensive Retained Controlling Stock Capital Stock Income Earnings Interests Total Balance at June 30, 2013 Stock issued on share-based awards Compensation expense associated with share-based awards Tax benefit associated with exercise of share based awards Dividends declared on common stock Capital distribution Comprehensive income (loss) Balance at June 30, 2014 Stock issued on share-based awards Compensation expense associated with share-based awards Tax benefit associated with exercise of share based awards Purchase/retirement of company stock Dividends declared on common stock Capital distribution Comprehensive income (loss) Balance at June 30, 2015 Stock issued on share-based awards Compensation expense associated with share-based awards Tax benefit associated with exercise of share based awards Purchase/retirement of company stock Dividends declared on common stock Capital distribution Comprehensive income (loss) Balance at June 30, 2016 See accompanying notes to consolidated financial statements. ETHAN ALLEN INTERIORS INC. AND SUBSIDIARIES Notes to the Consolidated Financial Statements June 30, Basis of Presentation The following is a summary of significant accounting policies of Ethan Allen Interiors Inc. On April 7, 2015 the FASB issued ASU 2015-03, Simplifying the Presentation of Debt Issuance Costs. The new standard classifies debt issuance costs as a deduction from the debt liability, consistent with debt discounts. Prior to the issuance of ASU 2015-03, these costs were classified as assets. We adopted the provisions of ASU 2015-03 beginning in July 2015 and prior period amounts have been reclassified to conform to the current period presentation. As of June 30, 2015, $0.3 million of debt issuance costs were reclassified in the consolidated balance sheet from other noncurrent assets to current portion of long-term debt and $1.0 million was reclassified from other noncurrent assets to long-term debt, less current portion. The adoption of ASU 2015-03 did not impact our consolidated statements of comprehensive income, or Nature of Operations We are a leading manufacturer and retailer of quality home furnishings and Use of Estimates We prepare our consolidated financial statements in conformity with accounting principles generally accepted in the United States, which requires management to make estimates and assumptions that affect the reported amounts of assets and liabilities and disclosure of contingent assets and liabilities at the date of the consolidated financial statements and the reported amounts of revenues and expenses during the reporting period. ETHAN ALLEN INTERIORS INC. AND SUBSIDIARIES Reclassifications Certain reclassifications have been made to prior years’ financial statements in order to conform to the current year’s presentation. These changes were made for disclosure purposes only and did not have any impact on previously reported results. Cash Equivalents Cash and short-term, Inventories Inventories are stated at the lower of cost (first-in, first-out) or market. Cost is determined based solely on those charges incurred in the acquisition and production of the related inventory (i.e. material, labor and manufacturing overhead costs). Marketable Securities The Company’s investments are classified at the time of purchase as either available-for-sale or held-to-maturity, and reassessed as of each balance sheet date. Our marketable securities consist of available-for-sale securities, and are marked-to-market based on prices provided by our investment advisors, with unrealized gains and temporary unrealized losses reported as a component of other comprehensive income net of tax, until realized. When realized, the Company recognizes gains and losses on the sales of the securities on a specific identification method and includes the realized gains or losses in other income, net, in the consolidated statements of operations. The Company includes interest, dividends, and amortization of premium or discount on securities classified as available-for-sale in other income, net in the consolidated statements of operations. We also evaluate our available-for-sale securities to determine whether a decline in fair value of a security below the amortized cost basis is other than temporary. Should the decline be considered other than temporary, we write down the cost of the security and include the loss in earnings. In making this determination we consider such factors as the reason for and significance of the decline, current economic conditions, the length of time for which there has been an unrealized loss, the time to maturity, and other relevant information. Available-for-sale securities are classified as either short-term or long-term based on management’s intention of when to sell the securities. Property, Plant and Equipment Property, plant and equipment are stated at cost, net of accumulated depreciation and amortization. Depreciation of plant and equipment is provided over the estimated useful lives of the respective assets on a straight-line basis. Estimated useful lives of the respective assets typically range from twenty to forty years for buildings and improvements and from three to twenty years for machinery and equipment. Leasehold improvements are amortized based on the underlying lease term, or the asset’s estimated useful life, whichever is shorter. Operating Leases We record expense for operating leases by recognizing the minimum lease payments on a straight-line basis, beginning on the date that the lessee takes possession or control of the property. A number of our operating lease agreements contain provisions for tenant improvement allowances, rent holidays, rent concessions, and/or rent escalations. Incentive payments received from landlords are recorded as deferred lease incentives and are amortized over the underlying lease term on a straight-line basis as a reduction of rent expense. When the terms of an operating lease provide for periods of free rent, rent concessions, and/or rent escalations, we establish a deferred rent liability for the difference between the scheduled rent payment and the straight-line rent expense recognized. This deferred rent liability is also amortized over the underlying lease term on a straight-line basis as a reduction of rent expense. ETHAN ALLEN INTERIORS INC. AND SUBSIDIARIES Retail Design Center Acquisitions We account for the acquisition of retail design centers and related assets with the purchase method. Accounting for these transactions as purchase business combinations requires the allocation of purchase price paid to the assets acquired and liabilities assumed based on their fair values as of the date of the acquisition. The amount paid in excess of the fair value of net assets acquired is accounted for as goodwill. Goodwill and Other Intangible Assets Our intangible assets are comprised primarily of goodwill, which represents the excess of cost over the fair value of net assets acquired, and trademarks. We determined these assets have indefinite useful lives, and are therefore not amortized. Impairment of Long-Lived Assets and Goodwill Goodwill and other indefinite-lived intangible assets are evaluated for impairment on an annual basis during the fourth quarter of each fiscal year, and between annual tests whenever events or circumstances indicate that the carrying value of the goodwill or other intangible asset may exceed its fair value. When testing goodwill for impairment, we may assess qualitative factors for some or all of our reporting units to determine whether it is more likely than not (that is, a likelihood of more than 50 percent) that the fair value of a reporting unit is less than its carrying amount, including goodwill. Alternatively, we may bypass this qualitative assessment for some or all of our reporting units and determine whether the carrying value exceeds the fair value using a quantitative assessment as described below. The recoverability of long-lived assets are evaluated for impairment by determining whether the carrying value will be recovered through the expected undiscounted future cash flows resulting from the use of the asset. In the event the sum of the expected undiscounted future cash flows is less than the carrying value of the asset, an impairment loss equal to the excess of the asset’s carrying value over its fair value is recorded. The long-term nature of these assets requires the estimation of cash inflows and outflows several years into the future and only takes into consideration technological advances known at the time of the impairment test. To evaluate goodwill using a quantitative assessment, the Company determines the current fair value of the reporting units using a combination of “Market” and “Income” approaches. In the Market approach, the “Guideline Company” method is used, which focuses on comparing the Company’s risk profile and growth prospects to reasonably similar publicly traded companies. Key assumptions used for the Guideline Company method are total invested capital (“TIC”) multiples for revenues and operating cash flows, as well as consideration of control premiums. The TIC multiples are determined based on public furniture companies within our peer group, and if appropriate, recent comparable transactions are considered. Control premiums are determined using recent comparable transactions in the open market. Under the Income approach, a discounted cash flow method is used, which includes a terminal value, and is based on external analyst financial projection estimates, as well as internal financial projection estimates prepared by management. The long-term terminal growth rate assumptions reflect our current long-term view of the market in which we compete. Discount rates use the weighted average cost of capital for companies within our peer group, adjusted for specific company risk premium factors. The fair value of our trade name, which is the Company’s only indefinite-lived intangible asset other than goodwill, is valued using the relief-from-royalty method. Significant factors used in trade name valuation are rates for royalties, future growth, and a discount factor. Royalty rates are determined using an average of recent comparable values. Future growth rates are based on the Company’s perception of the long-term values in the market in which we compete, and the discount rate is determined using the weighted average cost of capital for companies within our peer group, adjusted for specific company risk premium factors. ETHAN ALLEN INTERIORS INC. AND SUBSIDIARIES Financial Instruments Income Taxes Income taxes are accounted for under the asset and liability method. Deferred tax assets and liabilities are recognized for the future tax consequences attributable to differences between the financial statement carrying amounts of existing assets and liabilities and their respective tax bases and operating loss and tax credit carryforwards. Deferred tax assets and liabilities are measured using enacted tax rates expected to apply to taxable income in the years in which those temporary differences are expected to be recovered or settled. The effect on deferred tax assets and liabilities of a change in tax rates is recognized in income in the period that includes the enactment date. A valuation allowance must be established for deferred tax assets when it is more likely than not that the assets will not be realized. We recognize the tax benefit from an uncertain tax position only if it is more likely than not that the tax position will be sustained on examination by the taxing authorities, based on the technical merits of the position. Most of the unrecognized tax benefits, if recognized, would be recorded as a benefit to income tax expense. The liability associated with an unrecognized tax benefit is classified as a long-term liability except for the amount for which a cash payment is expected to be made or tax positions settled within one year. We recognize interest and penalties related to income tax matters as a component of income tax expense. Revenue Recognition Revenue is recognized when all of the following have occurred: persuasive evidence of a sales arrangement exists (e.g. a wholesale purchase order or retail sales invoice); the sales arrangement specifies a fixed or determinable sales price; title and risk of ownership has passed to the customer; no specific performance obligations remain; product is shipped or services are provided to the Shipping and Handling Costs Our practice has been to sell our products at the same delivered cost to all retailers nationwide, regardless of shipping point. Costs incurred by the Company to deliver finished goods are expensed and recorded in selling, general and administrative expenses. Shipping and handling costs amounted to Advertising Costs Advertising costs are expensed when first aired or distributed. Our total advertising costs were ETHAN ALLEN INTERIORS INC. AND SUBSIDIARIES Earnings Per Share We compute basic earnings per share by dividing net income by the weighted average number of common shares outstanding during the period. Diluted earnings per share is calculated similarly, except that the weighted average outstanding shares are adjusted to include the effects of converting all potentially dilutive share-based awards issued under our employee stock plans (see Notes 9 and 10). Certain unvested share-based payment awards are participating securities because they contain rights to receive non-forfeitable dividends (if paid) Share-Based Compensation We estimate, as of the date of grant, the fair value of stock options awarded using the Black-Scholes Share-based compensation expense is included in the Consolidated Statements of Operations within selling, general and administrative expenses. Tax benefits associated with our share-based compensation arrangements are included in the Consolidated Statements of Operations within income tax expense. All shares of our common stock received in connection with the exercise of share-based awards have been recorded as treasury stock and result in a reduction in shareholders’ equity. Foreign Currency Translation The functional currency of each Company operated foreign location is the respective local currency. Assets and liabilities are translated into United States dollars using the current period-end exchange rate and income and expense amounts are translated using the average exchange rate for the period in which the transaction occurred. Resulting translation adjustments are reported as a component of accumulated other comprehensive income within shareholders’ equity. Recent Accounting Pronouncements In In April 2015 the FASB issued ASU 2015-03,Simplifying the Presentation of Debt Issuance Costs. The new standard classifies debt issuance costs as a deduction from the debt liability, consistent with debt discounts. Prior to the issuance of ASU 2015-03, these costs were classified as assets. We adopted the provisions of ASU 2015-03 beginning in July 2015 and prior period amounts have been reclassified to conform to the current period presentation. As of June 30, 2015, $0.3 million of debt issuance costs were reclassified in ETHAN ALLEN INTERIORS INC. AND SUBSIDIARIES In November 2015, the In February 2016, the FASB issued ASU 2016-02,Leases, which is intended to improve financial reporting about leasing transactions. The ASU will require lessees that lease assets with lease terms of more than twelve months to recognize on the balance sheet the assets and liabilities for the rights and obligations created by those leases. Lessors will remain largely unchanged from current GAAP. In addition, the ASU will require disclosures to help investors and other financial statement users better understand the amount, timing and uncertainty of cash flows arising from leases. This pronouncement is effective for the Company on July 1, 2019, and early adoption is permitted. The Company is currently evaluating the impact on our consolidated financial statements and the timing of adoption. In March 2016, the FASB issued Accounting Standards 2016-09,Improvements to Employee Share-Based Payment Accounting, which amends ASC Topic 718, Stock Compensation. The objective of this amendment is part of the FASB’s Simplification Initiative as it applies to several aspects of the accounting for share-based payment transactions, including the income tax consequences, classification of awards as either equity or liabilities, and classification on the statement of cash flows. This pronouncement is effective for the Company on July 1, 2017, and allows for prospective, retrospective or modified retrospective adoption, depending on the area covered in the update, with early adoption permitted. The Company is currently evaluating the impact on our consolidated financial statements and the timing of adoption. In July 2015, the FASB issued ASU No. 2015-11,“Inventory (Topic 330): Simplifying the Measurement of Inventory,” which states that inventory should be measured at the lower of cost and net realizable value. Net realizable value is defined as estimated selling price in the ordinary course of business, less reasonably predictable costs of completion, disposal and transportation. The new guidance is effective for the Company on July 1, 2017. The new guidance should be applied prospectively with earlier application permitted as of the beginning of an interim or annual reporting period. The Company is currently evaluating the impact on our consolidated financial statements and the timing of adoption. (2) Business Acquisitions From time to time the Company acquires design centers from its independent retailers in arms length transactions. There were no material acquisitions completed during the three fiscal years ended June 30, (3) Inventories Inventories at June 30 are summarized as follows (in thousands): 2016 2015 Finished goods Work in process Raw materials Valuation allowance 2013 2012 Finished goods Work in process Raw materials (4) Property, Plant and Equipment Property, plant and equipment at June 30 are summarized as follows (in thousands): 2013 2012 2016 2015 Land and improvements Building and improvements Machinery and equipment Less: accumulated depreciation and amortization (5) Goodwill and Other Intangible Assets At both June 30, In the fourth quarter of fiscal years ETHAN ALLEN INTERIORS INC. AND SUBSIDIARIES (6) Borrowings Total debt obligations at June 30 consist of the following (in thousands): 2016 2015 Term loan Revolver Capital leases and other Total debt Less curent maturities Total long-term debt 2013 2012 5.375% Senior Notes due 2015 Capital leases and other Total debt Less curent maturities Total long-term debt At the Company’s option, revolving loans under the Facility bear interest, based on the average availability, at an annual rate of The Quarterly installments of principal on the term loan are payable based on a straight line 15-year amortization period, with the balance due at maturity. The Company does not expect to repay the revolving credit line portion of the Facility within the next year. The Facility is secured by all property owned, leased or operated by the Company in the United States The Company must maintain a minimum fixed charge coverage ratio of 1.1 to 1.0 at all times. If the outstanding term loans are less than $17.5 million and the fixed charge coverage ratio equals or exceeds 1.25 to 1.0, the fixed charge coverage ratio ceases to apply and thereafter is only triggered if average monthly availability is less than 15% of the amount of the revolving credit line.During November 2015, we made a $16.5 million prepayment on the term loan, bringing the outstanding term loan to $17.3 million, and the fixed charge coverage ratio ceased to apply.Our subsequent average availability exceeded 65.0%, such that the fixed charge coverage ratio did not apply. ETHAN ALLEN INTERIORS INC. AND SUBSIDIARIES The Company intends to use the Facility for working capital and general corporate purposes, including dividend payments and share repurchases, in addition to the refinancing of our Senior Notes which occurred in March 2015. At both June 30, At both June 30, 2016 and June 30, 2015, we were in compliance with all Fiscal Year Ended June 30, 2016 2015 2014 Weighted-average interest rate Aggregate scheduled maturities of our debt obligations for each of the five fiscal years subsequent to June 30, Fiscal Year Ended June 30 2017 2018 2019 2020 2021 Subsequent to 2021 Total scheduled debt payments Fiscal Year Ended June 30 2013 2014 2015 2016 2017 2018 Subsequent to 2018 Total scheduled debt payments (7) Leases We lease real property and equipment under various operating lease agreements expiring at various times through Fiscal Year Ended June 30, 2013 Minimum Future Lease Payments Minimum Future Sublease Rentals 2014 2015 2016 2017 2018 Subsequent to 2018 Total Fiscal Year Ended June 30 Minimum Minimum Future Future Lease Sublease Payments Rentals 2017 2018 2019 2020 2021 Subsequent to 2021 Total ETHAN ALLEN INTERIORS INC. AND SUBSIDIARIES Total rent expense for each of the past three fiscal years ended June 30 was as follows (in thousands): 2013 2012 2011 2016 2015 2014 Basic rentals under operating leases Contingent rentals under operating leases Less: sublease rent Total rent expense 2016 2015 Deferred rent credits Deferred lease incentives (8) Shareholders' Equity Our authorized capital stock consists of (a) 150,000,000 shares of Class A Common Stock, par value $.01 per share, (b) 600,000 shares of Class B Common Stock, par value $.01 per share, and (c) 1,055,000 shares of Preferred Stock, par value $.01 per share, of which (i) 30,000 shares have been designated Series A Redeemable Convertible Preferred Stock, (ii) 30,000 shares have been designated Series B Redeemable Convertible Preferred Stock, (iii) 155,010 shares have been designated as Series C Junior Participating Preferred Stock, and (iv) the remaining 839,990 shares may be designated by the Board of Directors with such rights and preferences as they determine (all such preferred stock, collectively, the "Preferred Stock"). Shares of Class B Common Stock are convertible to shares of our Common Stock upon the occurrence of certain events or other specified conditions being met. As of June 30, Share Repurchase Program On November 21, 2002, During the past three fiscal years, we repurchased 2013 2012 2011 2016 2015 2014 Common shares repurchased Cost to repurchase common shares Average price per share For the fiscal years presented above, we funded our purchases of treasury stock with existing cash on hand and cash generated through current period operations. All of our common stock repurchases ETHAN ALLEN INTERIORS INC. AND SUBSIDIARIES (9) Earnings per Share The following table sets forth the calculation of weighted average shares for the fiscal years ended June 30 (in thousands): 2016 2015 2014 Weighted average shares of common stockoutstanding for basic calculation Effect of dilutive stock options and othershare-based awards Weighted average shares of common stockoutstanding adjusted for dilution calculation 2013 2012 2011 Weighted average common shares outstanding for basic calculation Effect of dilutive stock options and other share-based awards Weighted average common shares outstanding adjusted for dilution calculation Certain restricted stock awards and the potential exercise of certain stock options were excluded from the respective diluted earnings per share calculation because their impact is anti-dilutive. In (10) Share-Based Compensation For the twelve months ended June 30, At June 30, 2016, we had 1,341,207 shares of common stock available for future issuance pursuant to the 1992 Stock Option Plan (the “Plan”). The maximum number of shares of common stock reserved for issuance under the Plan is 6,487,867 shares. The Plan provides for the grant of non-compensatory stock options to eligible employees and non-employee directors. Stock options unde the Plan are non-qualified under section 422 of the Internal Revenue Code and allow for the purchase of shares of our common stock. The Plan also provides for the issuance of stock appreciation rights ("SARs") on issued options, however no SARs have been issued to date. The awarding of such options is determined by the Compensation Committee of the Board of Directors after consideration of recommendations proposed by the Chief Executive Officer. Options are generally granted with an exercise price equal to the market price of our common stock at the date of grant, vest ratably over a specified service period, and have a contractual term of 10 years. Equity awards can also include performance vesting conditions. Company policy further requires an additional one year holding period beyond the service vest date for certain executives. Beginning January 31, 2014, grants to employees included both company performance and service vesting conditions (as further described below). Grants to independent directors had a 3 year service vest condition. Following is a description of grants made under the Plan. ETHAN ALLEN INTERIORS INC. AND SUBSIDIARIES Stock Option Awards We estimate, as of the date of grant, the fair value of stock options awarded using the Black-Scholes 2013 2012 2011 2016 2015 2014 Volatility Risk-free rate of return Dividend yield Expected average life (in years) 5.8 9.6 1.8 Expected average life (years) Options granted to employees beginning January 1, 2014 vest provided certain performance and service conditions are met (“Performance Options”). The performance conditions allow the potential vesting in three equal tranches, provided attainment of a minimum annual 5% growth in operating income (as defined in the agreement) for each of the ensuing three fiscal years. If the minimum annual growth is not achieved in any fiscal year, that tranche is forfeited, except that if a cumulative compound growth rate of 5% is achieved at the end of the three fiscal years, performance conditions for all three tranches will have been met. Service conditions require an additional period after performance conditions are met. Consequently, assuming both performance and service conditions are met, shares become exercisable between 3 and 5 years from grant date. At June 30, anniversary in years three, four and five provided service conditions are also met. The Company considers the remaining 130,000 Performance Options to be probable of achieving the respective performance conditions so they are being amortized to expense over their respective service periods. The Performance Options are reflected in the options tables presented below. All options were issued at the closing stock price on each grant date, and have a contractual term of 10 years. A summary of stock option activity occurring during the fiscal year ended June 30, Weighted Weighted Average Average Remaining Exercise Contractual Aggregate Options Shares Exercise Price Weighted Average Remaining Contractual Term (yrs) Aggregate Intrinsic Value Shares Price Term (yrs) Intrinsic Value Outstanding - June 30, 2012 Outstanding - June 30, 2015 Granted Exercised Canceled (forfeited/expired) Outstanding - June 30, 2013 Exercisable - June 30, 2013 Outstanding - June 30, 2016 Exercisable - June 30, 2016 ETHAN ALLEN INTERIORS INC. AND SUBSIDIARIES All options granted during fiscal 2016 were to non-employee independent directors of the Company as compensation for their services. The weighted average grant-date fair value of options granted during fiscal Options Shares Weighted Average Grant Date Fair Value Shares Nonvested June 30, 2012 Nonvested June 30, 2015 Granted Vested Canceled (forfeited/expired) Nonvested at June 30, 2013 Nonvested at June 30, 2016 Restricted Stock Awards awards were granted during fiscal 2016. A summary of nonvested restricted share activity occurring during the fiscal year ended June 30, Average Grant Date Restricted Awards Shares Fair Value Nonvested - June 30, 2015 Granted Vested Canceled (forfeited/expired) Nonvested - June 30, 2016 Restricted Awards Shares Weighted Average Grant Date Fair Value Nonvested - June 30, 2012 Granted Vested Canceled (forfeited/expired) Nonvested - June 30, 2013 As of June 30, Stock Unit Awards We account for stock unit awards as equity-based awards because upon vesting, they will be settled in common shares. These awards, which contain time and other vesting conditions, may also contain performance conditions providing recipients a contingent right to 2016 Volatility Risk-free rate of return Dividend yield Expected average life (years) ETHAN ALLEN INTERIORS INC. AND SUBSIDIARIES For each grant of Performance Units, the amount of the grant that will be earned and paid will be determined by reference to the achievement of certain performance goals for each of two initial fiscal years (on a cumulative basis) and the three fiscal years (on a cumulative basis) applicable to such grant. A summary of stock unit activity occurring during the fiscal year ended June 30, 2016 is presented below. Weighted Average Grant Date Units Fair Value Non-vested units at June 30, 2015 Granted Vested Canceled (forfeited/expired) Non-vested units at June 30, 2016 As of June 30, 2016, there was $1.4 million of total unrecognized compensation cost related to nonvested units granted under the Plan based on our probability estimates. That cost is expected to be recognized over a weighted average period of 1.3 years. (11) Income Taxes Income tax expense (benefit) attributable to income from operations consists of the following for the fiscal years ended June 30 (in thousands): 2016 2015 2014 Current: Federal State Foreign Total current Deferred: Federal State Foreign Total deferred Income Tax Expense (Benefit) 2013 2012 2011 Current: Federal State Foreign Total current Deferred: Federal State Foreign Total deferred Income tax expense (benefit) ETHAN ALLEN INTERIORS INC. AND SUBSIDIARIES The following is a reconciliation of expected income tax expense (benefit) (computed by applying the federal statutory income tax rate to income before taxes) to actual income tax expense (benefit) (in thousands): Expected income tax expense State income taxes, net of federal income tax Valuation allowance Section 199 Qualified Production Activities deduction Unrecognized tax expense (benefit) Other, net Actual income tax expense (benefit) 2016 2015 2014 Expected Income Tax Expense State income taxes, net of federal income tax Valuation allowance Section 199 Qualified Production Activities deduction Unrecognized tax expense (benefit) Other, net Actual income tax expense (benefit) The deferred income tax asset and liability balances at June 30 (in thousands) include: 2016 2015 Deferred tax assets: Employee compensation accruals Stock based compensation Deferred rent credits Net operating loss carryforwards Goodwill Other, net Total deferred tax assets Less: Valuation allowance Net deferred tax assets 2013 2012 Deferred tax assets: Accounts receivable Employee compensation accruals Stock based compensation Deferred rent credits Restructuring charges Net operating loss carryforwards Goodwill Other, net Total deferred tax assets Less: Valuation allowance Net deferred tax assets 2016 2015 Deferred tax liabilities: Property, plant and equipment Intangible assets other than goodwill Commissions Other, net Total deferred tax liability Total net deferred tax asset Deferred tax liabilities: Inventories Property, plant and equipment Intangible assets other than goodwill Commissions Other, net Total deferred tax liability Net deferred tax asset The deferred tax balances are classified in the Consolidated Balance Sheets as follows at June 30 (in thousands): 2016 2015 Current assets Non-current assets Current liabilities Non-current liabilities Total net deferred tax asset 2013 2012 Current assets Non-current assets Current liabilities Non-current liabilities Total net deferred tax asset ETHAN ALLEN INTERIORS INC. AND SUBSIDIARIES We evaluate our deferred taxes to determine if the “more likely than not” standard of evidence has not been met thereby supporting the need for a valuation allowance. A valuation allowance must be established for deferred tax assets when it is The Company’s deferred income tax assets at June 30, Deferred Income Tax Assets Net Operating Loss Carryforwards United States (State), expiring between 2013 and 2032 Foreign, Expiring between 2029 and 2030 Deferred Net Operating Income Loss Tax Assets Carryforwards United States (State), expiring between 2017 and 2032 Foreign, Expiring in 2034 Deferred U.S. federal income taxes are not provided for unremitted foreign earnings of our foreign subsidiaries because we expect those earnings will be permanently reinvested. Uncertain Tax Positions We recognize interest and penalties related to income tax matters as a component of income tax expense. If the 2013 2012 2016 2015 Beginning balance Additions for tax positions taken Reductions for tax positions of prior years Reductions for tax positions taken in prior years Settlements Ending balance It is reasonably possible that various issues relating to approximately The Company conducts business globally and, as a result, the Company or one or more of its subsidiaries files income tax returns in the U.S., various state, and foreign jurisdictions. In the normal course of business, the Company is subject to examination by the taxing authorities in such major jurisdictions as the U.S. Canada, Mexico, Belgium and Honduras. As of June 30, (12) Employee Retirement Programs The Ethan Allen Retirement Savings Plan The Ethan Allen Retirement Savings Plan (the "Savings Plan") is a defined contribution plan, which is offered to substantially all of our employees who have completed three consecutive months of service regardless of hours worked. We may, at our discretion, make a matching contribution to the 401(k) portion of the Savings Plan on behalf of each participant. Total 401(k) Company match expense amounted to ETHAN ALLEN INTERIORS INC. AND SUBSIDIARIES Other Retirement Plans and Benefits Ethan Allen provides additional benefits to selected members of senior and middle management in the form of previously entered deferred compensation arrangements and a management cash bonus and other incentive programs. The total cost of these benefits was (13) Litigation We are routinely party to various legal proceedings, including investigations or as a defendant in litigation, in the ordinary course of business. We are also subject to On a quarterly basis, we review our litigation activities and determine if an unfavorable outcome to us is considered “remote”, “reasonably possible” or “probable” as defined by U.S. GAAP. Where we determine an unfavorable outcome is probable and is reasonably estimable, we accrue for potential litigation losses. The liability we may ultimately incur with respect to such litigation matters, in the event of a negative outcome, may be in excess of amounts currently accrued, if any; however, we do not expect that the reasonably possible outcome of these litigation matters would, individually or in the aggregate, have a material adverse effect on our financial condition, results of operations or cash flows. Where we determine an unfavorable outcome is not probable or reasonably estimable, we do not accrue for any potential litigation loss. Although the outcome of the various claims and proceedings against us cannot be predicted with certainty, management believes that the likelihood is remote that any existing claims or proceedings, individually or in the aggregate, will have a material adverse effect on our financial position, results of operations or cash flows. ETHAN ALLEN INTERIORS INC. AND SUBSIDIARIES (14) Accumulated Other Comprehensive Income The following table sets forth the activity in accumulated other comprehensive income for the fiscal year ended June 30, Foreign currency translation adjustments Derivative instruments Unrealized gains and losses on investments Total Foreign Balance June30, 2012 currency translation adjustments Balance June 30, 2015 Changes before reclassifications Changes before reclassifications Amounts reclassified from accumulatedother comprehensive income Amounts reclassified from accumulatedother comprehensive income Current period other comprehensive income Current period other comprehensive income Balance June30, 2013 Balance June 30, 2016 Foreign currency translation adjustments are the result of changes in foreign currency exchange rates related to our operations in Canada, Belgium, Honduras and Mexico, and exclude income taxes given that the earnings of non-U.S. subsidiaries are deemed to be reinvested for an indefinite period of time. (15) Segment Information Our operations are classified into two operating segments: wholesale and retail. These operating segments represent strategic business areas which, although they operate separately and provide their own distinctive services, enable us to more effectively offer our complete line of home furnishings and The wholesale segment is principally involved in the development of the Ethan Allen brand, which encompasses the design, manufacture, domestic and offshore sourcing, sale and distribution of a full range of home furnishings and The retail segment sells home furnishings and Inter-segment eliminations result, primarily, from the wholesale sale of inventory to the retail segment, including the related profit margin. We evaluate performance of the respective segments based upon revenues and operating income. While the manner in which our home furnishings and Fiscal Year Ended June 30, Fiscal Year Ended June 30, 2013 2012 2011 2016 2015 2014 Case Goods Upholstered Products Home Accessories and Other ETHAN ALLEN INTERIORS INC. AND SUBSIDIARIES A breakdown of retail sales by product line for each of the last three fiscal years ended June 30 is provided below: Fiscal Year Ended June 30, 2016 2015 2014 Case Goods Upholstered Products Home Accents and Other Information for each of the last three fiscal years ended June 30 is provided below (in thousands): 2016 2015 2014 Net sales: Wholesale segment Retail segment Elimination of inter-company sales Consolidated Total Operating income (loss): Wholesale segment Retail segment Adjustment of inter-company profit (1) Consolidated Total Depreciation & Amortization: Wholesale segment Retail segment Consolidated Total Capital expenditures: Wholesale segment Retail segment Acquisitions Consolidated Total 2013 2012 2011 Net sales: Wholesale segment Retail segment Elimination of inter-company sales Consolidated Total Operating income (loss): Wholesale segment Retail segment Adjustment of inter-company profit (1) Consolidated Total Depreciation & Amortization: Wholesale segment Retail segment Consolidated Total Capital expenditures: Wholesale segment Retail segment Acquisitions Consolidated Total ETHAN ALLEN INTERIORS INC. AND SUBSIDIARIES June 30 June 30 June 30 2016 2015 2014 Total Assets: Wholesale segment Retail segment Inventory profit elimination (2) Consolidated Total June 30 2013 June 30 2012 June 30 2011 Total Assets: Wholesale segment Retail segment Inventory profit elimination (2) Consolidated Total (2) Our international net sales are comprised of our wholesale segment sales to independent retailers and our retail segment Company operated design centers. The number of Fiscal Year Ended June 30, 2016 2015 2014 Independent design centers Company operated design centers Total international design centers Percentage of consolidated net sales Fiscal Year Ended June 30, 2013 2012 2011 Design centers Net sales percentage ETHAN ALLEN INTERIORS INC. AND SUBSIDIARIES (16) Selected Quarterly Financial Data (Unaudited) Tabulated below is selected financial data for each quarter of the fiscal years ended June 30, Quarter Ended September 30 December 31 March 31 June 30 Fiscal 2016: Net Sales Gross profit Net income Earnings per basic share Earnings per diluted share Dividends declared per common share Fiscal 2015: Net Sales Gross profit Net income Earnings per basic share Earnings per diluted share Dividends declared per common share Fiscal 2014: Net Sales Gross profit Net income Earnings per basic share Earnings per diluted share Dividends declared per common share Quarter Ended September 30 December 31 March 31 June 30 Fiscal 2013: Net Sales Gross profit Net income Earnings per basic share Earnings per diluted share Dividends declared per common share Fiscal 2012: Net Sales Gross profit Net income Earnings per basic share Earnings per diluted share Dividends declared per common share Fiscal 2011: Net Sales Gross profit Net income Earnings per basic share Earnings per diluted share Dividends declared per common share (17) Financial Instruments We determine fair value as the price that would be received upon sale of an asset or paid upon transfer of a liability in an orderly transaction between market participants at the measurement date and in the principal or most advantageous market for that asset or liability. The fair value should be calculated based on assumptions that market participants would use in pricing the asset or liability, not on assumptions specific to the Company. In addition, the fair value of liabilities includes consideration of non-performance risk including our own credit risk. Each fair value measurement is reported in one of the three levels, determined by the lowest level input that is significant to the fair value measurement in its entirety. These levels are: ETHAN ALLEN INTERIORS INC. AND SUBSIDIARIES The following section describes the valuation methodologies we use to measure different financial assets and liabilities at fair value. Assets and Liabilities Measured at Fair Value on a Recurring Basis The following table presents our assets and liabilities measured at fair value on a recurring basis at June 30, (in thousands): June 30, 2013 June 30, 2016 June 30, 2016 Level 1 Level 2 Level 3 Balance Level 1 Level 2 Level 3 Balance Cash equivalents Available-for-sale securities Total June 30, 2012 June 30, 2015 June 30, 2015 Level 1 Level 2 Level 3 Balance Level 1 Level 2 Level 3 Balance Cash equivalents Available-for-sale securities Total Cash equivalents consist of money market accounts, and mutual funds in U.S. government and agency fixed income securities. We use quoted prices in active markets for identical assets or liabilities to determine fair value. There were no transfers between level 1 and level 2 during fiscal years Amortized Cost Basis Fair Value 2013 2012 The contractual maturities of our available-for-sale investments as of June 30, June 30, 2015 June 30, 2015 Amortized Estimated Cost Estimated Fair Value Cost Cost Fair Value Due in one year or less Due after one year through five years June 30, 2012 Cost Estimated Fair Value Due in one year or less Due after one year through five years Assets and Liabilities Measured at Fair Value on a Nonrecurring Basis We measure certain assets, including our cost and equity method investments, at fair value on a nonrecurring basis. These assets are recognized at fair value when they are deemed to be other-than-temporarily impaired. During the year ended June 30, ETHAN ALLEN INTERIORS INC. AND SUBSIDIARIES (18)Restricted Cash and Investments At (19) Subsequent Events None. (20) Valuation and Parent Issuer Guarantors Non-Guarantors Eliminations Consolidated Assets Current assets: Cash and cash equivalents Marketable securities Accounts receivable, net Inventories Prepaid expenses and other current assets Intercompany receivables Total current assets Property, plant and equipment, net Goodwill and other intangible assets Restricted cash and investments Other assets Investment in affiliated companies Total assets Liabilities and Shareholders’ Equity Current liabilities: Current maturities of long-term debt Customer deposits Accounts payable Accrued expenses and other current liabilities Intercompany payables Total current liabilities Long-term debt Other long-term liabilities Total liabilities Shareholders’ equity Total liabilities and shareholders’ equity (1,734,783 Parent Issuer Guarantors Non-Guarantors Eliminations Consolidated Assets Current assets: Cash and cash equivalents Marketable securities Accounts receivable, net Inventories Prepaid expenses and other current assets Intercompany receivables Total current assets Property, plant and equipment, net Goodwill and other intangible assets Restricted cash and investments Other assets Investment in affiliated companies Total assets Liabilities and Shareholders’ Equity Current liabilities: Current maturities of long-term debt Customer deposits Accounts payable Accrued expenses and other current liabilities Intercompany payables Total current liabilities Long-term debt Other long-term liabilities Total liabilities Shareholders’ equity Total liabilities and shareholders’ equity Parent Issuer Guarantors Non-Guarantors Eliminations Consolidated Net sales Cost of sales Gross profit Selling, general and administrative expenses Operating income (loss) Interest and other miscellaneous income, net Interest and other related financing costs Income before income tax expense Income tax expense (benefit) Net income/(loss) Parent Issuer Guarantors Non-Guarantors Eliminations Consolidated Net sales Cost of sales Gross profit Selling, general and administrative expenses Operating income (loss) Interest and other miscellaneous income, net Interest and other related financing costs Income before income tax expense Income tax expense (benefit) Net income/(loss) Parent Issuer Guarantors Non-Guarantors Eliminations Consolidated Net sales Cost of sales Gross profit Selling, general and administrative expenses Operating income (loss) Interest and other miscellaneous income, net Interest and other related financing costs Income before income tax expense Income tax expense (benefit) Net income/(loss) Parent Issuer Guarantors Non-Guarantors Eliminations Consolidated Net cash provided by operating activities Cash flows from investing activities: Capital expenditures Acquisitions Proceeds from the disposal of property, plant andequipment Change in restricted cash and investments Purchase of marketable securities Proceeds from the sale of marketable securities Other Net cash used in investing activities Cash flows from financing activities: Payments on long-term debt Purchases and other retirements of company stock Dividends paid Other Net cash used in financing activities Effect of exchange rate changes on cash Net increase (decrease) in cash and cash equivalents Cash and cash equivalents – beginning of period Cash and cash equivalents – end of period Parent Issuer Guarantors Non-Guarantors Eliminations Consolidated Net cash provided by operating activities Cash flows from investing activities: Capital expenditures Acquisitions Proceeds from the disposal of property, plant andequipment Change in restricted cash and investments Purchase of marketable securities Proceeds from the sale of marketable securities Other Net cash provided by (used in) investing activities Cash flows from financing activities: Payments on long-term debt Purchases and other retirements of company stock Dividends paid Other Net cash used in financing activities Effect of exchange rate changes on cash Net increase (decrease) in cash and cash equivalents Cash and cash equivalents – beginning of period Cash and cash equivalents – end of period Parent Issuer Guarantors Non-Guarantors Eliminations Consolidated Net cash provided by operating activities Cash flows from investing activities: Capital expenditures Acquisitions Proceeds from the disposal of property, plant andequipment Change in restricted cash and investments Purchase of marketable securities Proceeds from the sale of marketable securities Other Net cash used in investing activities Cash flows from financing activities: Payments on long-term debt Purchases and other retirements of company stock Dividends paid Other Net cash used in financing actvities Effect of exchange rate changes on cash Net increase in cash and cash equivalents Cash and cash equivalents – beginning of period Cash and cash equivalents – end of period The following table provides information regarding the Company’s sales discounts, sales returns and allowance for doubtful accounts Balance at Beginning of Period Additions (Reductions) Charged to Income Adjustments and/or Deductions Balance at End of Period Accounts Receivable: Sales discounts, sales returns andallowance for doubtful accounts: June 30, 2013 June 30, 2012 June 30, 2011 Inventory: Inventory valuation allowance: June 30, 2013 June 30, 2012 June 30, 2011 Additions Balance at (Reductions) Adjustments Balance at Beginning Charged to and/or End of of Period Income Deductions Period Accounts Receivable: Sales discounts, sales returns andallowance for doubtful accounts: June 30, 2016 June 30, 2015 June 30, 2014 Item 9. Changes in and Disagreements with Accountants on Accounting and Financial Disclosure Item 9A. Controls and Procedures We carried out an evaluation, under the supervision and with the participation of our management, including the CEO and the CFO, of the effectiveness of the design and operation of our disclosure controls and procedures (as such term is defined in Rules 13a-15(e) and 15d-15(e) under the Securities Exchange Act of 1934, as amended (the "Exchange Act")) as of the end of the period covered by this report. Based on such evaluation, the CEO and ETHAN ALLEN INTERIORS INC. AND SUBSIDIARIES Management's Report on Internal Control over Financial Reporting Our management is responsible for establishing and maintaining adequate internal control over financial reporting Our internal control over financial reporting includes those policies and • pertain to the maintenance of records that, in reasonable detail, accurately and fairly reflect the transactions and dispositions of our assets; • provide reasonable assurance that transactions are recorded as necessary to permit preparation of financial statements in accordance with U.S. GAAP, and that our receipts and expenditures are being made only in accordance with authorizations of our management and directors; and • provide reasonable assurance regarding prevention or timely detection of unauthorized acquisition, use, or disposition of our assets that could have a material effect on our financial statements. KPMG LLP, the independent registered public accounting firm that audited the consolidated financial statements included in this Annual Report on Form 10-K, has also audited the effectiveness of our internal control over financial reporting as of June 30, Changes in Internal Control over Financial Reporting Item 9B. Other Information None. PART III Except as set forth below, the information required by Items 10, 11, 12, 13 and 14 ETHAN ALLEN INTERIORS INC. AND SUBSIDIARIES Item 10. Directors, Executive Officers and Corporate Governance Code of Ethics We have adopted a code of ethics that applies to our principal executive officer, principal financial officer, principal accounting officer or controller, or persons performing similar functions. Our code of ethics can be accessed via our website We intend to disclose any amendment of our Code of Ethics, or any waiver of any provision thereof, applicable to our principal executive officer and/or principal financial officer, or persons performing similar functions, directors and other executive officers on our website within 4 days of the date of such amendment or waiver. In the case of a waiver, the nature of the waiver, the name of the person to whom the waiver was granted, and the date of the waiver will also be disclosed. Information contained on, or connected to, our website is not incorporated by reference into this Form 10-K and should not be considered part of this or any other report that we file with, or furnish to, the SEC. Identification of Executive Officers The information set forth under the heading “Executive Officers of the Registrant” in Part I, Item 1 of this form 10-K is also incorporated by reference in this section. Audit Committee Financial Expert Our Board of Directors has determined that we have four "audit committee financial experts", as defined under Item 407(d)(5)(ii) of Regulation S-K of the Securities Exchange Act of 1934, currently serving on our Audit Committee. Those members of our Audit Committee who are deemed to be audit committee financial experts are as follows: James B. Carlson Clinton A. Clark The remaining information required by this Item will be included in and is incorporated herein by reference from our definitive proxy statement for our 2016 Annual Meeting of Shareholders to be filed with the SEC pursuant to Regulation 14A within 120 days after the end of our 2016 fiscal year, or our 2016 Proxy Statement. Item 12.Security Ownership of Certain Beneficial Owners and Management and Related ETHAN ALLEN INTERIORS INC. AND SUBSIDIARIES Item 14.Principal Accounting Fees and Services PART IV Item 15. Exhibits and Financial Statement Schedules (a)(1) Financial June 30, 2013 and 2012(In thousands, except share data) $ 72,601 $ 79,721 15,529 9,005 12,277 14,919 137,256 155,739 22,907 23,408 260,570 282,792 291,672 295,695 45,128 45,128 15,433 15,416 4,482 5,757 $ 617,285 $ 644,788 $ 480 $ 250 59,098 65,465 22,995 27,315 27,205 30,534 23,161 27,513 132,939 151,077 130,809 154,250 19,180 17,593 282,928 322,920 486 485 - - - - 363,938 361,165 (584,041 ) (584,041 ) 553,083 542,918 684 1,141 334,150 321,668 207 200 334,357 321,868 $ 617,285 $ 644,788 See accompanying notes to consolidated financial statements. $ 52,659 $ 76,182 - 2,198 9,467 12,547 162,323 151,916 23,755 27,831 248,204 270,674 273,615 277,035 45,128 45,128 7,820 8,010 2,642 5,130 $ 577,409 $ 605,977 $ 3,001 $ 3,034 60,958 67,970 15,437 18,946 22,067 26,896 21,884 23,816 123,347 140,662 38,837 73,203 23,023 21,577 185,207 235,442 489 489 - - 374,972 370,914 (624,932 ) (605,586 ) 646,315 607,079 (4,846 ) (2,638 ) 391,998 370,258 204 277 392,202 370,535 $ 577,409 $ 605,977 For Years Ended June 30, 2013, 2012, and 2011(In thousands, except share data) $ 729,083 $ 729,373 $ 678,960 330,734 339,085 329,500 398,349 390,288 349,460 337,912 340,591 317,527 60,437 49,697 31,933 (1,485 ) 562 5,564 8,778 9,020 11,126 50,174 41,239 26,371 17,696 (8,455 ) (2,879 ) $ 32,478 $ 49,694 $ 29,250 $ 1.13 $ 1.72 $ 1.02 28,864 28,824 28,758 $ 1.11 $ 1.71 $ 1.01 29,239 29,109 28,966 $ 0.77 $ 0.30 $ 0.22 $ 32,478 $ 49,694 $ 29,250 (506 ) (1,154 ) 917 56 (38 ) 97 (450 ) (1,192 ) 1,014 $ 32,028 $ 48,502 $ 30,264 Consolidated Statements of Cash FlowsFor Years Ended June 30, 2013, 2012, and 2011(In thousands) $ 32,478 $ 49,694 $ 29,250 18,008 18,581 20,816 1,401 1,702 931 2,767 (19,522 ) (63 ) 3,717 1,648 325 1,824 (42 ) (132 ) 1,922 (456 ) 187 18,569 (12,531 ) (5,278 ) 1,070 (755 ) 4,407 (6,951 ) 2,331 7,861 (4,320 ) 357 5,595 (7,839 ) (2,125 ) (884 ) (1,345 ) (1,181 ) 147 61,301 37,701 63,162 3,283 1,873 3,196 (17 ) 975 927 (19,005 ) (22,884 ) (9,094 ) (770 ) (520 ) (2,957 ) (18,247 ) (3,647 ) (9,466 ) 11,165 7,230 7,319 1,990 816 432 (21,601 ) (16,157 ) (9,643 ) (26,104 ) (12,204 ) (37,887 ) - (1,350 ) (5,377 ) (22,220 ) (8,062 ) (5,754 ) 1,758 738 (61 ) (46,566 ) (20,878 ) (49,079 ) (254 ) 536 227 (7,120 ) 1,202 4,667 79,721 78,519 73,852 $ 72,601 $ 79,721 $ 78,519 $ 19,046 $ 14,731 $ (8,595 ) $ 8,626 $ 8,693 $ 10,838 $ 927 $ 1,590 $ - $ 794,202 $ 754,600 $ 746,659 351,966 343,437 340,163 442,236 411,163 406,496 353,057 345,229 336,860 89,179 65,934 69,636 395 (3,333 ) 276 1,618 5,918 7,510 87,956 56,683 62,402 31,319 19,541 19,471 $ 56,637 $ 37,142 $ 42,931 $ 2.02 $ 1.29 $ 1.48 28,072 28,874 28,918 $ 2.00 $ 1.27 $ 1.47 28,324 29,182 29,276 $ 0.62 $ 0.50 $ 0.40 $ 56,637 $ 37,142 $ 42,931 (2,208 ) (3,308 ) (77 ) 27 78 105 (2,181 ) (3,230 ) 28 $ 54,456 $ 33,912 $ 42,959 Consolidated Statements of Shareholders' EquityFor Years Ended June 30, 2013, 2012, and 2011(In thousands, except share data) 483 358,722 (581,331 ) 1,244 479,341 - 258,459 1 75 - - - - 76 - 931 - - - - 931 - - (2,787 ) - - - (2,787 ) - - 1,427 - (345 ) - 1,082 - - - - (6,338 ) - (6,338 ) - - - 1,014 29,250 - 30,264 484 359,728 (582,691 ) 2,258 501,908 - 281,687 1 224 - - - - 225 - 1,702 - - - - 1,702 - (489 ) - - - - (489 ) - - (1,350 ) - - - (1,350 ) - - - - (8,684 ) - (8,684 ) 275 275 - - - (1,117 ) 49,694 (75 ) 48,502 485 361,165 (584,041 ) 1,141 542,918 200 321,868 1 1,398 - - - - 1,399 - 1,401 - - - - 1,401 - (26 ) - - - - (26 ) - - - - (22,313 ) - (22,313 ) - - - (457 ) 32,478 7 32,028 $ 486 $ 363,938 $ (584,041 ) $ 684 $ 553,083 $ 207 $ 334,357 $ 56,637 $ 37,142 $ 42,931 19,353 19,142 17,930 2,356 1,236 1,325 671 3,923 (3,032 ) - 784 - (2,267 ) 4,180 2,093 (1,295 ) 3,606 415 2,926 (559 ) (149 ) (9,982 ) (5,036 ) (9,019 ) 5,113 (9,628 ) 4,269 (7,275 ) 7,517 586 (3,509 ) (5,349 ) 1,300 (6,550 ) (2,113 ) 969 2,191 261 271 58,369 55,106 59,889 8,073 9,103 3,381 190 497 6,926 (22,967 ) (19,787 ) (19,305 ) (165 ) (1,991 ) - - - (18,268 ) 2,150 15,430 14,883 193 176 325 (12,526 ) 3,428 (12,058 ) - 75,000 - (34,840 ) (133,710 ) (480 ) (19,346 ) (17,552 ) - (16,646 ) (13,348 ) (11,297 ) 1,718 (1,353 ) 525 (69,114 ) (90,963 ) (11,252 ) (252 ) (565 ) (4 ) (23,523 ) (32,994 ) 36,575 76,182 109,176 72,601 $ 52,659 $ 76,182 $ 109,176 $ 29,003 $ 18,250 $ 20,928 $ 1,352 $ 7,181 $ 7,085 $ - $ 1,700 $ - 486 363,938 (584,041 ) 684 553,083 207 334,357 - 357 - - - - 357 - 1,325 - - - - 1,325 - 113 - - - - 113 - - - - (11,619 ) - (11,619 ) - - - - - (25 ) (25 ) - - - (42 ) 42,931 70 42,959 486 365,733 (584,041 ) 642 584,395 252 367,467 3 4,117 - - - - 4,120 - 1,236 - - - - 1,236 - (172 ) - - - - (172 ) - - (21,545 ) - - - (21,545 ) - - - - (14,458 ) - (14,458 ) - - - - - (25 ) (25 ) - - - (3,280 ) 37,142 50 33,912 489 370,914 (605,586 ) (2,638 ) 607,079 277 370,535 - 734 - - - - 734 - 2,356 - - - - 2,356 - 968 - - - - 968 - - (19,346 ) - - - (19,346 ) - - - - (17,401 ) - (17,401 ) - - - - - (100 ) (100 ) - - - (2,208 ) 56,637 27 54,456 $ 489 $ 374,972 $ (624,932 ) $ (4,846 ) $ 646,315 $ 204 $ 392,202 2013, 20122016, 2015 and 20112014 ("Interiors") is a Delaware corporation incorporated on May 25, 1989. The consolidated financial statements include the accounts of Interiors,, and its wholly-owned subsidiary Ethan Allen Global, Inc. ("Global"), and Global’s subsidiaries (collectively "We," "Us," "Our," "Ethan Allen" or the "Company"). All significant intercompany accounts and transactions have been eliminated in the consolidated financial statements. AllOur consolidated financial statements also include the accounts of Global’s capital stock is owned by Interiors,an entity in which has nowe are a majority shareholder with the power to direct the activites that most significantly impact the entity’s performance. Noncontrolling interest amounts in the entity are immaterial and included in the Consolidated Statement of Comprehensive Income within interest and other income, net.operating results other than those associated with its investment in Global.our consolidated statements of cash flows.accessories,accents, offering complimentary interior design service to our clients and sell a full complementrange of home decoratingfurniture products and design solutions.decorative accents. We sell our products through one of the country’s largest home furnishing retail networks withand at June 30, 2016 there were a total of 295296 retail design centers, of which 147143 are Company operated and 148153 are independently operated. Nearly all of our Company operated retail design centers are located in the United States, with the remaining Company operated design centers located in Canada and Belgium.Canada. The majority of the independently operated design centers are in Asia, with the remaining independently operated design centers located throughout the United States, Canada and the Middle East.East and Europe. We have eightnine manufacturing facilities, one of which includes a separate sawmill operation, located throughout the United States, and one plant each in Mexico and one in Honduras.Due toBecause of the inherent uncertainty involved in making those estimates, actual results could differ from those estimates. Areas in which significant estimates have been made include, but are not limited to, revenue recognition, the allowance for doubtful accounts receivable, inventory obsolescence, tax valuation allowances, useful lives for property, plant and equipment and definite lived intangible assets, goodwill and indefinite lived intangible asset impairment analyses, the evaluation of uncertain tax positions and the fair value of assets acquired and liabilities assumed in business combinations.highly-liquidhighly liquid investments with original maturities of three months or less are considered cash and cash equivalents. We invest excess cash in money market accounts, short-term commercial paper, and U.S. Treasury Bills. Due toBecause of their short-term nature, the carrying value of our cash and cash equivalents, receivables and payables, short-term debt and customer deposit liabilities approximates fair value. Substantially all of our long-term debt at both June 30, 2016 and 2015 consists of our Senior Notes, theterm loan and revolving credit facility. The estimated fair value of which is $133.9 million at June 30, 2013 and $155.3 million at June 30, 2012, as comparedequal to athe carrying value on those dates of $129.2 million and $153.0 million, respectively.dates. During fiscal 2012, we released all of United States federal and Canadian valuation allowance against net deferred tax assets established during the fourth quarter of fiscal 2010. We recorded a tax benefit of $21.6 million for the reversal of the valuation allowance against those assets, with a non-cash benefit to earnings in the quarter ended March 31, 2012. We retained a valuation allowance against various foreign, state and local deferred tax assets in our retail segment. At June 30, 2013 this valuation allowance was approximately $2.9 million.customer or a fixed schedule of delivery is agreed upon and in place;customer; collectability is reasonably assured. As such, revenue recognition generally occurs upon the shipment of goods to independent retailers or, in the case of Ethan Allen operated retail design centers, upon delivery to the customer. If shipping is billed to customers, this is included in revenue. Recorded sales provide for estimated returns and allowances. We permit our customers to return defective products and incorrect shipments, and terms we offer are standard for the industry.$60.6$71.7 million in fiscal years 2013 and 2012 and $58.2year 2016, $67.3 million for fiscal year 2011.2015 and $67.1 million in fiscal 2014.$29.8 million in fiscal years 2013 and 2012 and $28.2$31.5 million in fiscal year 2011.2016, $30.2 million in fiscal year 2015 and $29.5 million in fiscal year 2014. These amounts are presentedinclude advertising media expenses, outside and inside agency expenses, certain website related fees and photo and video production net of proceeds received by us under our agreement with the third-party financial institution responsible for administering our consumer finance programs. Prepaid advertising costs at June 30, 20132016 totaled $1.6$2.0 million compared to $1.4$1.8 million at June 30, 2012.2015. , and are included in. The earnings available to participating securities under the two-class method of computing earnings per share.share is insignificant.option-pricingoption pricing model. Use of a valuation model requires management to make certain assumptions with respect to selected model inputs, including anticipated changes in the underlying stock price (i.e. expected volatility) and option exercise activity (i.e. expected life). Expected volatility is based on the historical volatility of our stock and other contributing factors. The expected life of options granted, which represents the period of time that the options are expected to be outstanding, is based, primarily, on historical data. We estimate, as of the date of grant, the fair value of restricted stock units awarded using a discounted cash flow model which requires management to make certain assumptions with respect to model inputs including anticipated future dividends not paid during the restriction period, and a discount for lack of marketability for a one-year holding period after vesting.February 2013,May 2014, the Financial Accounting Standards Board (“FASB”(the “FASB”) issued ASU 2013-02,2014-09,“Reporting of Amounts Reclassified Out of Accumulated Other Comprehensive Income”Revenue from Contracts with Customers. This ASU requires itemsprovides a framework for revenue recognition that replaces most existing GAAP revenue recognition guidance when it becomes effective. We have an option to use either a retrospective approach or a cumulative effect adjustment approach to implement the guidance. The new standard is effective for us on July 1, 2018, with early adoption permitted in 2017. We are currently evaluating the impact of this guidance on our financial statements and the timing of adoption, and have not yet selected a transition approach.their entiretythe consolidated balance sheets from other noncurrent assets to net incomecurrent portion of long-term debt and $1.0 million was reclassified from accumulated other noncurrent assets to long-term debt, less current portion. The adoption of ASU 2015-03 did not impact our consolidated statements of comprehensive income, inor our consolidated statements of cash flows.same reporting periodFASB issued ASU 2015-17,Balance Sheet Classification of Deferred Taxes, which requires the Company to be reported separately from other amounts in other comprehensive income, eitherpresent all deferred tax assets and liabilities as noncurrent. This pronouncement is effective for the Company on the face of the financial statements or in the notes to the financial statements. We adopted this ASU in the fourth quarter of fiscal 2013July 1, 2017, and it had no materialearly adoption is permitted. The Company is currently evaluating the impact on our consolidated financial statements.statements and the timing of adoption.2013, 20122016, 2015 and 20112014 respectively. $ 129,627 $ 118,537 9,497 10,537 27,554 25,943 (4,355 ) (3,101 ) Inventories $ 162,323 $ 151,916 $ 107,508 $ 119,978 6,961 8,638 22,787 27,123 $ 137,256 $ 155,739 Inventories are presented net of a related valuation allowance of $2.7 million at both June 30, 2013 and June 30, 2012.ETHAN ALLEN INTERIORS INC. AND SUBSIDIARIES $ 89,091 $ 89,963 $ 80,002 $ 82,806 388,628 383,801 392,196 385,439 116,666 113,604 126,066 126,667 594,385 587,368 Property, plant and equipment, gross 598,264 594,912 (302,713 ) (291,673 ) (324,649 ) (317,877 ) $ 291,672 $ 295,695 Property, plant and equipment, net $ 273,615 $ 277,035 20132016 and 2012,2015, we had $25.4 million of goodwill, and $19.7 million of other indefinite-lived intangible assets consisting of Ethan Allen trade names, all of which is in our wholesale segment. Our retail segment had $48.4 million of goodwill which was fully impaired in fiscal 2009.20132016, 2015, and 2012,2014, the Company performed qualitative assessments of the fair value of the wholesale reporting unit and concluded that the fair value of its goodwill exceeded its carrying value. In fiscal year 2011 the Company performed a quantitative assessment and determined the fair value of its wholesale reporting unit exceeded its carrying value by a substantial margin. The fair value of the trade name exceeded its carrying value by a substantial margin in fiscal years 2013, 20122016, 2015 and 2011.To2014.To calculate fair value of these assets, management relies on estimates and assumptions which by their nature have varying degrees of uncertainty. Wherever possible, managementManagement therefore looks for third party transactions to provide the best possible support for the assumptions incorporated. Management considers several factors to be significant when estimating fair value including expected financial outlook of the business, changes in the Company’s stock price, the impact of changing market conditions on financial performance and expected future cash flows, and other factors. Deterioration in any of these factors may result in a lower fair value assessment, which could lead to impairment of the long-lived assets and goodwill of the Company. $ 16,167 $ 35,000 25,000 40,000 671 1,237 41,838 76,237 3,001 3,034 $ 38,837 $ 73,203 $ 129,152 $ 152,986 2,137 1,514 131,289 154,500 480 250 $ 130,809 $ 154,250 Senior NotesOnIn September 27, 2005, we completed a private offering of $200.0issued $200 million ofin ten-year senior unsecured notes due October 1, 2015 (the "Senior Notes"). The Senior Notes were offered by Global and have an annual coupon rate of 5.375% with interest payable semi-annually in arrears on April 1 and October 1 of each year. Proceeds received in connection with the issuance of the Senior Notes, net ofCompany entered into a related discount of $1.6five year, $150 million totaled $198.4 million. We used the net proceeds from the offering to expand our retail network, invest in our manufacturing and logistics operations, and for other general corporate purposes. As of June 30, 2013, outstanding borrowings related to this transaction have been included in the Consolidated Balance Sheets within long-term debt. The discount on the Senior Notes is being amortized to interest expense over the life of the related debt as is debt issuance costs of $2.0 million primarily for banking, legal, accounting, rating agency, and printing services and $0.8 million of losses on settled forward contracts entered in conjunction with this debt issuance. During fiscal 2013, the Company repurchased $24.0 million of the Senior Notes in a single unsolicited transaction. During fiscal 2012, the Company repurchased $12.0 million of the Senior Notes in several unsolicited transactions.The Senior Notes may be redeemed in whole or in part, at Global’s option at any time at the greater of (i) 100% of the principal amount of the notes to be redeemed and (ii) the sum of the present values of the remaining scheduled payments of principal and interest on the Senior Notes to be redeemed, discounted to the date of redemption on a semi-annual basis at the applicable treasury rate plus 20 basis points, plus, in each case, accrued and unpaid interest to the redemption date. In the event of default, the trustee or the holders of 25% of the outstanding principal amount of the Senior Notes may accelerate payment of principal, premium, if any, and accrued and unpaid interest. Events of default include failure to pay in accordance with the terms of the indenture, including failure, under certain circumstances, to pay indebtedness other than the Senior Notes. As of June 30, 2013, we are in compliance with the terms and conditions and all covenants of the Senior Notes.Revolving Credit FacilityThe Company has a senior secured asset-based, revolving credit and term loan facility on October 21, 2014, as amended (the “Facility”). The Facility, which expires on October 21, 2019, provides revolving credit financinga term loan of up to $50$35 million and a revolving credit line of up to $115 million, subject to borrowing base availability,availability. During March 2015, we utilized $35 million of the term loan and includes a right for$40 million of the Companyrevolving credit line, along with our available cash to increasefully redeem our Senior Notes. We incurred financing costs of $1.5 million under the total facility to $100 million either with existing or additional lenders subject to certain conditions. The Facility, expires March 25, 2016, or June 26, 2015 ifwhich are being amortized by the Company’s Senior Notes have not been refinanced. interest method, over the remaining life of the Facility.either:either (a) the London Interbank Offered rate (“LIBOR”) plus 1.5% to 1.75%, or (b) the higher of (i) the prime rate, (ii) the federal funds effective rate plus 0.50%, or (iii) LIBOR plus 1.0% plus in each case 0.5% to 0.75%. At June 30, 2016 the annual interest rate in effect on the revolving loan was 2.0%.(a)London Interbank Offered rate (“LIBOR”) plus 2.0% to 2.5%, based on the average availability, or
At the Company’s option, term loans under the Facility bear interest, based on the Company’s rent adjusted leverage ratio, at an annual rate of either (a) LIBOR plus 1.75% to 2.25%, or (b) the higher of (i) the prime rate, (ii) the federal funds effective rate plus 0.50%, or (iii) LIBOR plus 1.0% plus in each case 0.75% to 1.25%. At June 30, 2016 the annual interest rate in effect on the term loan was 2.25%.(b)The higher of (i) a prime rate, (ii) the federal funds effective rate plus 0.50%, or (iii) LIBOR plus 1.0% plus, in each case, an additional 1.0% to 1.5%, based on average availability.CompanypaysCompany pays a commitment fee of 0.15% to 0.25% per annum on the unused portion of the Facility, and participation fees on issued letters of credit at an annual rate of 1.0%1.5% to 2.5%,1.75% based on the average availability and the letter of credit type. If the average monthly availability is less than the greater of (i) 12.5% of the aggregate commitment and (ii) $6.3 million, the Company’s fixed charge coverage ratio may not be less than 1 to 1 for any period of four consecutive fiscal quarters.availability. Certain payments are restricted if the availability ofunder the collateral supporting the facilityrevolving credit line falls below $10 million or 20% of the facility size.total revolving credit line, and the Company is subject to pro forma compliance with the fixed charge coverage ratio if applicable.excluding anyand includes certain real property owned by the Company and contains customary covenants which may limit the Company’s ability to incur debt; engage in mergers and consolidations; make restricted payments (including dividends)dividends and share repurchases); sell certain assets; and make investments.2013, we had no revolving loans2016 and $0.6June 30, 2015, there was $0.2 million of standby and trade letters of credit outstanding under the Facility. RemainingTotal availability under the facility totaled $49.4Facility was $89.8 million subject to limitations set forth in the agreement and as a result, the coverage charge ratio, and other restricted payment limitations did not apply. As ofat June 30, 2013,2016 and $74.8 million at June 30, 2015. The increase was due to $15.0 million payments we aremade on the revolving loan during fiscal 2016.the covenants of the Facility.Senior Notes and the credit facilities.For fiscal years ended June 30, 2013, 2012 and 2011, theThe weighted-average interest ratesrate applicable under our outstanding debt obligations for each year was approximately 5.5%. of the last three fiscal years were as follows: 2.0 % 4.8 % 5.5 % 2013,2016, and thereafter are as follows (in thousands): 3,303 2,815 2,396 34,213 - - $ 42,727 $ 480 501 129,675 474 159 - $ 131,289 2034.2039. Leases covering retail design center locations and equipment may require, in addition to stated minimums, contingent rentals based on retail sales or equipment usage. Generally, the leases provide for renewal for various periods at stipulated rates. Future minimum lease payments under non-cancelable operating leases for each of the five fiscal years subsequent to June 30, 2013,2016, and thereafter are shown in the table following. Also shown are minimum future rentals from subleases, which will partially offset lease payments in the aggregate (in thousands): $ 30,485 $ 2,683 27,780 2,264 24,156 1,408 21,082 1,262 19,229 1,161 79,799 2,630 $ 202,531 $ 11,408 $ 33,895 $ 1,990 32,197 2,009 28,517 1,460 24,439 956 22,081 767 74,291 766 $ 215,420 $ 7,948 $ 29,897 $ 30,895 $ 30,834 $ 31,692 $ 31,220 $ 31,168 75 109 135 180 160 215 29,972 31,004 30,969 Basic and contingent rentals 31,872 31,380 31,383 (2,034 ) (1,656 ) (1,621 ) (1,964 ) (3,062 ) (2,494 ) $ 27,938 $ 29,348 $ 29,348 $ 29,908 $ 28,318 $ 28,889 As of June 30, 2013 and 2012, deferredDeferred rent credits totaling $11.9 million and $11.6 million, respectively, and deferred lease incentives totaling $1.9 million and $2.3 million, respectively, are reflected in the Consolidated Balance Sheets. These amountsSheets and are amortized over the respective underlying lease terms on a straight-line basis as a reduction of rent expense. The amounts for the past two fiscal years are as follows: $ 13,003 $ 12,362 $ 4,538 $ 3,762 20132016 and 2012,2015, there were no shares of Preferred Stock or Class B Common Stock issued or outstanding.the Company’sour Board of Directors approved a share repurchase program authorizing us to repurchase up to 2.0 million2,000,000 shares of our common stock, from time to time, either directly or through agents, in the open market at prices and on terms satisfactory to us. Subsequent to that date, the Board of Directors increased the then remaining shareaggregate authorization under the repurchase authorizationprogram on sevenseveral separate occasions, the last of which was on NovemberApril 13, 2007. As2015 when the Board of Directors increased the aggregate authorization to approximately 3,000,000 shares. There is no expiration date on the repurchase authorization and the amount and timing of future share repurchases, if any, will be determined as market and business conditions warrant.As of June 30, 20132016 we had a remaining Board authorization to repurchase 1.11.8 million shares.and/or retired the following shares of our common stock (trade date basis): - 79,293 204,286 697,799 645,831 - $ - $ 1,349,557 $ 2,787,777 $ 19,346,104 $ 16,469,725 $ - $ - $ 17.02 $ 13.65 $ 27.72 $ 25.50 $ - and retirements are recorded as treasury stock and result in a reduction of shareholders’ equity. 28,072 28,874 28,918 252 308 358 28,324 29,182 29,276 28,864 28,824 28,758 375 285 208 29,239 29,109 28,966 2013, 20122016, 2015 and 2011,2014, stock options and share based awards of 877,100, 1,641,500460,155, 591,058 and 1,657,932,724,292, respectively, have been excluded.2013, 2012,2016, 2015, and 2011,2014, share-based compensation expense totaled $1.4$2.4 million, $1.7$1.2 million, and $0.9$1.3 million respectively. These amounts have been included in the Consolidated Statements of OperationsComprehensive Income within selling, general and administrative expenses. During the twelve months ended June 30, 2013, 2012,2016, 2015, and 2011,2014, we recognized related tax benefits associated with our share-based compensation arrangements totaling $0.8 million, $0.5 million $0.6 million and $0.3$0.5 million, respectively (before valuation allowances). Such amounts have been included in the Consolidated Statements of OperationsComprehensive Income within income tax expense.option-pricingoption pricing model. Use of a valuation model requires management to make certain assumptions with respect to selected model inputs, including anticipated changes in the underlying stock price (i.e. expected volatility) and option exercise activity (i.e. expected life). Expected volatility is based on the historical volatility of our stock. The risk-free rate of return is based on the U.S. Treasury bill rate forextrapolated to the term closest matching the expected life of the grant. The dividend yield is based on the annualized dividend rate at the grant date relative to the grant date stock price. The expected life of options granted, which represents the period of time that the options are expected to be outstanding, is based, primarily, on historical data. The weighted average assumptions used for fiscal years ended June 30 are noted in the following table: 56.5 % 45.1 % 59.5 % 48.1 % 52.9 % 56.3 % 0.80 % 1.92 % 0.61 % 1.93 % 2.03 % 1.52 % 1.64 % 2.00 % 1.16 % 1.95 % 2.09 % 1.55 % 6.3 6.7 5.2 2013, we had 1,067,407 shares of common stock available for future issuance pursuant to2016, 196,000 Performance Options achieved the 1992 Stock Option Plan (the “Plan”). The maximum number of shares of common stock reserved for issuance under the Plan is 6,487,867 shares. Following is a description of grants made under the Plan.Stock Option AwardsThe Plan provides for the grant of non-compensatory stock options to eligible employeesperformance conditions, and non-employee directors. Stock options granted under the Plan are non-qualified under Section 422 of the Internal Revenue code and allow for the purchase of shares of our common stock. The Plan also provides for the issuance of stock appreciation rights ("SARs") on issued options, however, no SARs have been issued as of June 30, 2013. The awarding of such options is determined by the Compensation Committee of the Board of Directors after consideration of recommendations proposed by the Chief Executive Officer. Option awards are generally granted with an exercise price equal to the market price of our common stock at the date of grant,consequently will vest ratably over a specified service period (4 years for awards to employees; 2 years for awards to independent directors), and have a contractual term of 10 years.Effective October 1, 2011, the Company and M. Farooq Kathwari, our President and Chief Executive Officer, entered into a new employment agreement (the "Agreement"). Pursuant to the terms of the Agreement, Mr. Kathwari was awarded on October 1, 2011, (i) options to purchase 300,000 shares of our common stock at an exercise price of $13.61 which vest ratably over a 5-year period on each June 30, unless earlier vested, in certain circumstances, in accordance with the terms of the Agreement. During fiscal 2013, the Company awarded options to purchase an aggregate of 74,082 shares of our common stock to certain employees other than Mr. Kathwari, which vest in fourthree equal annual installmentstranches on the grant date anniversary.20132016 is presented below:below. 2,270,708 $ 27.58 994,888 $ 24.33 74,082 22.42 24,367 28.73 (73,071 ) 19.14 (36,958 ) 19.87 (635,225 ) 30.65 (75,224 ) 30.85 1,636,494 26.54 4.0 $ 9,616,619 1,333,287 $ 28.92 3.1 $ 5,754,148 907,073 24.08 5.1 $ 8,308,141 553,371 $ 22.93 3.1 $ 5,778,995 2013, 2012,2016, 2015 and 20112014 was $9.96, $5.98$11.53, $11.30 and $1.70$11.42 respectively. The total intrinsic value of options exercised during 2013, 20122016, 2015 and 20112014 was $0.8$0.3 million, $0.1$4.5 million, and $0.0$0.2 million, respectively. As of June 30, 2013,2016, there was $1.7$2.0 million of total unrecognized compensation cost related to nonvested options granted under the Plan. That cost is expected to be recognized over a weighted average period of 2.82.6 years. A summary of the nonvested shares as of June 30, 20132016 and changes during the year then ended is presented below:below. Weighted Average Grant Date Fair Value 377,742 $ 5.65 454,574 $ 10.49 74,082 9.96 24,367 11.53 (139,282 ) 5.15 (96,191 ) 7.59 (9,335 ) 6.61 (29,048 ) 11.33 303,207 $ 6.90 353,702 $ 11.28 On July 26, 2011, as a result of the Company’s performance, the Compensation Committee of the Company’s board of directors awarded Mr. Kathwari 30,000 service-based restricted shares, which vest in three equal annual installments on the grant date anniversary. Effective October 1, 2011, pursuant to the terms of the Agreement, Mr. Kathwari was awarded 105,000 shares ofNo new restricted stock which vest ratably over a 5-year period on each June 30, unless earlier vested, in certain circumstances, in accordance with the terms of the Agreement.20132016 is presented below. 21,000 $ 13.61 - (21,000 ) $ 13.61 - - $ - 142,066 $ 15.12 - (54,686 ) 15.18 (568 ) 14.45 86,812 $ 15.09 2013,2016, there was $1.1 million of totalno unrecognized compensation cost related to restricted shares granted under the Plan. That cost is expected to be recognized over a weighted average period of 2.5 years. The total fair value of restricted shares vested during the fiscal years ending June 30, 20132016 and 20122015 was $1.4$0.7 million and $1.4$0.8 million respectively.In connection with previous employment agreements, Mr. Kathwari was deemed have earned 126,000 stock units. In the event of the termination of his employment, regardless of the reason for termination, Mr. Kathwari will receive shares of the Company's common stock equal("Performance Units"), conditioned upon the Company's achievement of certain performance targets and goals, and subject to the numberterms of the agreements. For Performance Units, we expense as compensation cost the fair value of the shares as of the grant date, and amortize expense ratably over the total performance and time vest period, taking into account the probability that we will satisfy the performance goals. We estimate, as of the date of grant, the fair value of Performance Units with a discounted cash flow model, using as model inputs the risk-free rate of return as the discount rate, dividend yield for dividends not paid during the restriction period, and a discount for lack of marketability for a one-year post-vest holding period. The lack of marketability discount used is the present value of a future put option using Monte-Carlo and Black-Scholes pricing models. The weighted average assumptions used for the fiscal year ended June 30 is noted in the table following. No Performance based restricted stock units earned.unit awards were granted under the Plan prior to December 1, 2015.33.3 % 0.77 % 1.99 % 1.75 126,000 $ 24.67 92,050 24.34 - - - - 218,050 24.53 $ 27,660 $ 15,064 $ 20,693 2,898 489 1,900 88 55 60 30,646 15,608 22,653 (237 ) 2,979 (941 ) 207 759 (1,921 ) 703 195 (320 ) 673 3,933 (3,182 ) $ 31,319 $ 19,541 $ 19,471 $ 13,305 $ 13,086 $ (4,428 ) 1,822 (1,433 ) 1,505 125 57 107 15,252 11,710 (2,816 ) 1,798 (20,896 ) (1,432 ) 669 591 1,369 (23 ) 140 - 2,444 (20,165 ) (63 ) $ 17,696 $ (8,455 ) $ (2,879 ) $ 17,561 35.0 % $ 14,434 35.0 % $ 9,228 35.0 % 1,467 2.9 % 1,038 2.5 % 750 2.8 % 631 1.3 % (21,237 ) -51.5 % (12,672 ) -48.1 % (1,157 ) -2.3 % (1,001 ) -2.4 % (705 ) -2.7 % 30 0.1 % (1,483 ) -3.6 % 490 1.9 % (836 ) -1.7 % (206 ) -0.5 % 30 0.1 % $ 17,696 35.3 % $ (8,455 ) -20.5 % $ (2,879 ) -10.9 % $ 30,785 35.0 % $ 19,839 35.0 % $ 21,841 35.0 % 2,514 2.9 % 1,597 2.8 % 2,209 3.5 % 339 0.4 % 409 0.7 % (1,540 ) -2.5 % (1,513 ) -1.7 % (998 ) -1.8 % (1,342 ) -2.2 % (479 ) -0.5 % (641 ) -1.1 % (904 ) -1.4 % (327 ) -0.4 % (665 ) -1.2 % (793 ) -1.3 % $ 31,319 35.6 % $ 19,541 34.5 % $ 19,471 31.2 % 4,343 4,555 2,665 2,639 6,705 5,943 3,375 4,059 1,729 2,748 2,659 3,241 21,476 23,185 (2,155 ) (1,816 ) $ 19,321 $ 21,369 $ 463 $ 470 5,057 6,321 2,342 2,617 5,071 5,283 622 526 3,592 3,066 5,020 6,251 3,053 3,829 25,220 28,363 (2,948 ) (2,317 ) 22,272 26,046 654 1,358 14,260 14,261 3,478 3,999 - 149 18,392 19,767 $ 929 $ 1,602 775 2,068 1,121 536 14,264 14,264 3,590 3,880 20 22 19,770 20,770 $ 2,502 $ 5,276 $ 3,174 $ 2,301 3,001 3,932 - - 5,246 4,631 $ 929 $ 1,602 $ 2,876 $ 2,147 251 3,129 - - 625 - $ 2,502 $ 5,276 Note: Current deferred tax assets and liabilities and non-current deferred tax assets and liabilities have been presented net in the Consolidated Balance Sheets.moreless than 50% likely than not that the assets will not be realized. During fiscal 2012, we released all of United States federal and Canadian valuation allowance against net deferred tax assets established during the fourth quarter of fiscal 2010. We recorded a tax benefit of $21.6 million for the reversal of the valuation allowance against those assets, with a non-cash benefit to earnings in the quarter ended March 31, 2012. We retained a valuation allowance against various foreign, state and local deferred tax assets in our retail segment. At June 30 2013of 2016 and 2015, such an allowance was in place against the Belgian foreign tax assets, and at June 30, 2016 this valuation allowance was approximately $2.9$2.2 million.20132016 with respect to the net operating losses expire as follows (in thousands): $ 2,398 $ 51,808 1,194 3,880 $ 1,086 $ 24,130 2,289 6,809 $6.8$2.2 million of unrecognized tax benefits and related interest and penalties as of June 30, 20132016 were recognized, approximately $4.2$1.4 million would be recorded as a benefit to income tax expense. A reconciliation of the beginning and ending amount of unrecognized tax benefits including related interest and penalties as of June 30, 20132016 and 20122015 is as follows (in thousands): $ 7,369 $ 11,027 $ 3,117 $ 4,699 1,227 1,074 776 568 (1,351 ) (3,543 ) (1,530 ) (1,555 ) (402 ) (1,189 ) (193 ) (596 ) $ 6,843 $ 7,369 $ 2,170 $ 3,117 $3.2$0.4 million of the total gross unrecognized tax benefits as of June 30, 20132016 will be resolved within the next twelve months as exams are completed or statutes expire. If recognized, approximately $2.0$0.3 million of unrecognized tax benefits would reduce our tax expense in the period realized. However, actual results could differ from those currently anticipated.2013,2016, the Company and certain subsidiaries are currently under audit from 20062010 through 20102015 in the U.S. While the amount of uncertain tax benefits with respect to the entities and years under audit may change within the next twelve months, it is not anticipated that any of the changes will be significant.$2.9$3.4 million in 2013, $2.62016, $3.3 million in 2012,2015, and $2.5$2.8 million in 2011.2014. The contribution was made entirely in cash in 2013,2016, 2015 and 2012 and half in cash and half in shares of the Company’s common stock in 2011.2014. $3.4$3.6 million, $2.7$3.7 million, and $1.1$3.5 million in 2013, 20122016, 2015 and 2011,2014, respectively.Environmental MattersWe and our subsidiaries are subject to various environmental laws and regulations. Under these laws, we and/or our subsidiaries are, or may be, required to remove or mitigate the effects on the environment of the disposal or release of certain hazardous materials. We believe our currently anticipated capital expenditures for environmental control facility matters are not material.othervarious federal, state and local environmental protection laws and regulations and are involved, from time to time, in investigations and proceedings regarding environmental matters. Such investigations and proceedings typically concern air emissions, water discharges, and/or management of solid and hazardous wastes. We believe thatUnder these laws, we and/or our facilitiessubsidiaries are, in material compliance with all applicable environmental laws and regulations.or may be, required to remove or mitigate the effects on the environment of the disposal or release of certain hazardous materials.Federal and state regulations providedRegulations issued under the initiative for usClean Air Act Amendments of 1990 required the industry to reformulate certain furniture finishes or institute process changes to reduce emissions of volatile organic compounds. Compliance with many of these requirements has been facilitated through the introduction of high solids coating technology and alternative formulations. In addition, we have instituted a variety of technical and procedural controls, including reformulation of finishing materials to reduce toxicity, implementation of high velocity low pressure spray systems, development of storm water protection plans and controls, and further development of related inspection/audit teams, all of which have served to reduce emissions per unit of production. We remain committed to implementing new waste minimization programs and/or enhancing existing programs with the objective of (i) reducing the total volume of waste, (ii) limiting the liability associated with waste disposal, and (iii) continuously improving environmental and job safety programs on the factory floor which serve to minimize emissions and safety risks for employees. We will continue to evaluate the most appropriate, cost effective, control technologies for finishing operations and design production methodsIn order to reduce the use of hazardous materials in the manufacturing process.process, we will continue to evaluate the most appropriate, cost-effective control technologies for finishing operations and production methods. We believe that our facilities are in material compliance with all such applicable laws and regulations. Our currently anticipated capital expenditures for environmental control facility matters are not material.20132016 (in thousands): $ 1,253 $ (119 ) $ 7 $ 1,141 $ (2,638 ) $ (506 ) $ - $ (1 ) $ (507 ) (2,208 ) $ - $ 50 $ - $ 50 - $ (506 ) $ 50 $ (1 ) $ (457 ) (2,208 ) $ 747 $ (69 ) $ 6 $ 684 $ (4,846 ) The derivative instruments are reclassified to interest expense in our consolidated statements of operations. accessories.accents.accessoriesaccents to a network of independently operated and Ethan Allen operated design centers as well as related marketing and brand awareness efforts. Wholesale revenue is generated upon the wholesale sale and shipment of our product to all retail design centers, including those operated by Ethan Allen. Wholesale profitability includes (i) the wholesale gross margin, which represents the difference between the wholesale sales price and the cost associated with manufacturing and/or sourcing the related product, and (ii) other operating costs associated with wholesale segment activities.accessoriesaccents to consumers through a network of Company operated design centers. Retail revenue is generated upon the retail sale and delivery of our product to our customers. Retail profitability includes (i) the retail gross margin, which represents the difference between the retail sales price and the cost of goods purchased from the wholesale segment, and (ii) other operating costs associated with retail segment activities.accessoriesaccents are marketed and sold is consistent, the nature of the underlying recorded sales (i.e. wholesale versus retail) and the specific services that each operating segment provides (i.e. wholesale manufacturing, sourcing, and distribution versus retail selling) are different. Within the wholesaleeach segment, we maintain revenue information according to each respective product line (i.e. case goods, upholstery, or home accessoriesaccents and other). The allocation of retail sales by product line generally follows that of the wholesale segment (see the product line table below). A breakdown of wholesale sales by product line for each of the last three fiscal years ended June 30 is provided below: 37 % 38 % 39 % 32 % 34 % 36 % 48 % 44 % 46 % 51 % 48 % 48 % 15 % 18 % 15 % 17 % 18 % 16 % 100 % 100 % 100 % 100 % 100 % 100 % 30 % 32 % 33 % 48 % 45 % 45 % 22 % 23 % 22 % 100 % 100 % 100 % $ 491,467 $ 469,384 $ 453,607 626,511 579,713 580,739 (323,776 ) (294,497 ) (287,687 ) $ 794,202 $ 754,600 $ 746,659 $ 74,412 $ 66,988 $ 57,816 16,450 1,726 10,515 (1,683 ) (2,780 ) 1,305 $ 89,179 $ 65,934 $ 69,636 $ 7,587 $ 8,044 $ 7,887 11,766 11,098 10,043 $ 19,353 $ 19,142 $ 17,930 $ 12,446 $ 9,427 $ 11,013 10,521 10,360 8,292 165 1,991 - $ 23,132 $ 21,778 $ 19,305 $ 434,439 $ 456,915 $ 422,946 578,284 559,417 505,910 (283,640 ) (286,959 ) (249,896 ) $ 729,083 $ 729,373 $ 678,960 $ 50,843 $ 64,436 $ 49,898 8,016 (11,522 ) (15,344 ) 1,578 (3,217 ) (2,621 ) $ 60,437 $ 49,697 $ 31,933 $ 8,166 $ 7,525 $ 9,199 9,842 11,056 11,617 $ 18,008 $ 18,581 $ 20,816 $ 7,024 $ 12,168 $ 6,604 11,981 10,716 2,490 770 520 2,957 $ 19,775 $ 23,404 $ 12,051 $ 271,116 $ 295,949 $ 339,271 339,942 341,886 344,025 (33,649 ) (31,858 ) (28,862 ) $ 577,409 $ 605,977 $ 654,434 $ 291,942 $ 309,573 $ 309,081 355,233 366,594 347,044 (29,890 ) (31,379 ) (27,800 ) $ 617,285 $ 644,788 $ 628,325 (1) Represents the change in wholesale profit contained in Ethan Allen design center inventory at the end of the period. (2) The wholesale profit contained in the retail segment inventory that has not yet been realized. These profits are realized when the related inventory is sold.inventory that has not yet been realized. These profits are realized whensales to consumers through the related inventory is sold.independent retailinternational design centers, located outside the United States, and the related net sales to these foreign independent retailers as a percent of our consolidated net sales is shown in the following table. 103 97 91 6 7 8 109 104 99 9.2 % 11.6 % 10.6 % 86 87 70 5.1 % 6.6 % 6.3 % 2013, 2012,2016, 2015, and 20112014 (in thousands, except per share data): $ 190,391 $ 207,535 $ 190,583 $ 205,693 104,673 116,058 105,717 115,788 13,147 16,534 10,178 16,778 0.46 0.58 0.37 0.60 0.46 0.58 0.36 0.60 0.14 0.14 0.17 0.17 $ 190,706 $ 197,067 $ 173,259 $ 193,568 104,803 106,074 94,110 106,176 11,879 10,038 2,536 12,689 0.41 0.35 0.09 0.44 0.41 0.34 0.09 0.44 0.12 0.12 0.12 0.14 $ 181,659 $ 193,104 $ 173,061 $ 198,835 98,743 105,999 93,130 108,624 9,034 11,555 5,258 17,084 0.31 0.40 0.18 0.59 0.31 0.39 0.18 0.58 0.10 0.10 0.10 0.10 $ 187,437 $ 191,251 $ 168,144 $ 182,251 104,253 103,967 91,785 98,344 10,064 9,846 4,374 8,194 0.35 0.34 0.15 0.28 0.35 0.34 0.15 0.28 0.09 0.50 0.09 0.09 $ 184,921 $ 183,275 $ 175,861 $ 185,316 97,885 98,219 94,275 99,909 6,770 8,077 27,548 7,299 0.24 0.28 0.95 0.25 0.23 0.28 0.94 0.25 0.07 0.07 0.07 0.09 $ 164,841 $ 173,345 $ 162,822 $ 177,952 82,381 89,861 83,069 94,149 3,813 14,744 3,518 7,175 0.13 0.51 0.12 0.25 0.13 0.51 0.12 0.25 0.05 0.05 0.05 0.07 ● Level 1 – inputs are based upon unadjusted quoted prices for identical instruments traded in active markets.● Level 2 – inputs are based upon quoted prices for similar instruments in active markets, quoted prices for identical or similar instruments in markets that are not active, and model-based valuation techniques for which all significant assumptions are observable in the market or can be corroborated by observable market data for substantially the full term of the assets or liabilities.● Level 3 – inputs are generally unobservable and typically reflect management’s estimates of assumptions that market participants would use in pricing the asset or liability. The fair values are therefore determined using model-based techniques that include option pricing models, discounted cash flow models, and similar techniques.20132016 and June 30, 2012 (in2015 $ 88,034 $ - $ - $ 88,034 $ 60,479 $ - $ - $ 60,479 - 15,529 - 15,529 - - - - $ 88,034 $ 15,529 $ - $ 103,563 $ 60,479 $ - $ - $ 60,479 $ 95,137 $ - $ - $ 95,137 $ 84,192 $ - $ - $ 84,192 - 9,005 - 9,005 - 2,198 - 2,198 $ 95,137 $ 9,005 $ - $ 104,142 $ 84,192 $ 2,198 $ - $ 86,390 20132016 or 2012.2015. At June 30, of 20132016 and 2012, $15.42015, $7.8 million and $8.0 million, respectively, of cash equivalents were restricted and classified as a long-term asset.At June 30, 2013We did not hold any available-for-sale securities consist of $14.0 million of U.S. municipal bonds and $1.5 million of corporate bonds, and at June 30, 2012,2016 as all municipal bonds matured and the proceeds were transferred to our operating cash accounts. As of June 30, 2015, available for sale securities consisted of $7.5$2.2 million in U.S. municipal bonds, and $1.5 million of corporate bonds. All securities in both years havewith maturities of less than two years, and arewere rated A/A2 or better by S&P/Moody’s respectively. There were no material gross unrealized gains or losses on available-for-sale securities at June 30, 20132016 or June 30, 2012.Additional information on available-for-sale securities balances at June 30 are provided in the following table (in thousands). $ 15,314 $ 15,529 $ 8,862 $ 9,005 2013 and 20122015 were as follows (in thousands):June 30, 2013 $ 13,213 $ 13,067 $ 2,296 $ 2,155 $ 2,198 $ 2,463 $ 2,462 $ - $ - $ 6,999 $ 6,862 $ 2,130 $ 2,143 ProceedsThere were no proceeds from sales of investments available for sale were $11.2 million in fiscal 20132016 and $7.2$15.4 million during fiscal 2012,2015, resulting in no material gain or loss in either period. There were no investments that have been in a continuous loss position for more than one year, and there have been no other-than-temporary impairments recognized.2013,2015, we did not record any other-than-temporary impairments on thosedetermined that certain long-lived assets required to be measuredof our retail design centers in Belgium were impaired, and an impairment charge of $0.8 million was recorded at fair value on a nonrecurring basis. See also Note 18, “Restricted Cash and Investments”.that time.both June 30, 20132016 and 20122015 we held $15.4$7.8 million and $8.0 million, respectively, of cash and investments in lieu of providing letters of credit for the benefit of the provider of our workmen’s compensation and other insurance liabilities, and for the benefit of the issuer of our private label credit cards to ensure funding for delivery of products sold.liabilities. These restricted funds, which can be invested by us in money market mutual funds, and U.S. Treasuries and U.S. Government agency fixed income instruments with maturities of two years or less, cannot be withdrawn from our account without the prior written consent of the secured parties. These restricted funds are classified as long-term assets because they are not expected to be used within one year to fund operations. See also Note 17, “Financial Instruments”.(20) Financial Information About the Parent, the Issuer and the GuarantorsOn September 27, 2005, Global (the “Issuer”) issued $200 million aggregate principal amount of Senior Notes which have been guaranteed on a senior basis by Interiors (the “Parent”),other wholly owned domestic subsidiaries of the Issuer and the Parent, including Ethan Allen Retail, Inc., Ethan Allen Operations, Inc., Ethan Allen Realty, LLC, Lake Avenue Associates, Inc. and Manor House, Inc. The subsidiary guarantors (other than the Parent) are collectively called the “Guarantors”. The guarantees of the Guarantors are unsecured. All of the guarantees are full, unconditional and joint and several and the Issuer and each of the Guarantors are 100% owned by the Parent. Our other subsidiaries which are not guarantors are called the “Non-Guarantors”.The following tables set forth the condensed consolidating balance sheets as of June 30, 2013 and June 30, 2012, the condensed consolidating statements of operations for the twelve months ended June 30, 2013, 2012 and 2011, and the condensed consolidating statements of cash flows for the twelve months ended June 30, 2013, 2012 and 2011 of the Parent, the Issuer, the Guarantors and the Non-Guarantors.ETHAN ALLEN INTERIORS INC. AND SUBSIDIARIESQualifying AccountsCONDENSED CONSOLIDATING BALANCE SHEET(In thousands)June 30, 2013 $ - $ 57,307 $ 12,463 $ 2,831 $ - �� $ 72,601 - 15,529 - - - 15,529 - 12,061 212 4 - 12,277 - - 161,683 5,463 (29,890 ) 137,256 - 9,882 11,275 1,750 - 22,907 - 831,238 302,577 (3,726 ) (1,130,089 ) - - 926,017 488,210 6,322 (1,159,979 ) 260,570 - 9,432 265,698 16,542 - 291,672 - 37,905 7,223 - - 45,128 - 15,433 - - - 15,433 - 2,188 1,488 806 - 4,482 686,451 (111,647 ) - - (574,804 ) - $ 686,451 $ 879,328 $ 762,619 $ 23,670 $ (1,734,783 ) $ 617,285 $ - $ - $ 480 $ - $ - $ 480 - - 56,030 3,068 - 59,098 - 7,390 15,097 508 - 22,995 2,720 29,710 16,683 1,253 - 50,366 349,374 (7,460 ) 766,039 22,136 (1,130,089 ) - 352,094 29,640 854,329 26,965 (1,130,089 ) 132,939 - 129,152 1,657 - - 130,809 - 4,492 14,355 333 - 19,180 352,094 163,284 870,341 27,298 (1,130,089 ) 282,928 334,357 716,044 (107,722 ) (3,628 ) (604,694 ) 334,357 $ 686,451 $ 879,328 $ 762,619 $ 23,670 $ ) $ 617,285 ETHAN ALLEN INTERIORS INC. AND SUBSIDIARIESCONDENSED CONSOLIDATING BALANCE SHEET(In thousands)June 30, 2012 $ - $ 64,946 $ 12,276 $ 2,499 $ - $ 79,721 - 9,005 - - - 9,005 - 14,648 263 8 - 14,919 - - 182,382 4,736 (31,379 ) 155,739 - 6,191 14,689 2,528 - 23,408 - 829,913 273,536 (8,515 ) (1,094,934 ) - - 924,703 483,146 1,256 (1,126,313 ) 282,792 - 9,078 272,228 14,389 - 295,695 - 37,905 7,223 - - 45,128 - 15,416 - - - 15,416 - 4,948 809 - - 5,757 652,868 (108,864 ) - - (544,004 ) - $ 652,868 $ 883,186 $ 763,406 $ 15,645 $ (1,670,317 ) $ 644,788 $ - $ - $ 250 $ - $ - $ 250 - - 62,479 2,986 - 65,465 - 7,126 19,695 494 - 27,315 2,713 35,752 18,537 1,045 - 58,047 328,287 327 756,513 9,807 (1,094,934 ) - 331,000 43,205 857,474 14,332 (1,094,934 ) 151,077 - 152,986 1,264 - - 154,250 - 3,641 13,874 78 - 17,593 331,000 199,832 872,612 14,410 (1,094,934 ) 322,920 321,868 683,354 (109,206 ) 1,235 (575,383 ) 321,868 $ 652,868 $ 883,186 $ 763,406 $ 15,645 $ (1,670,317 ) $ 644,788 ETHAN ALLEN INTERIORS INC. AND SUBSIDIARIESCONDENSED CONSOLIDATING STATEMENT OF OPERATIONS(In thousands)Year Ended June 30, 2013 $ - $ 434,741 $ 796,194 $ 38,181 $ (540,033 ) $ 729,083 - 327,723 520,570 23,963 (541,522 ) 330,734 - 107,018 275,624 14,218 1,489 398,349 180 46,620 272,794 18,318 - 337,912 (180 ) 60,398 2,830 (4,100 ) 1,489 60,437 32,658 (4,229 ) 38 (75 ) (29,877 ) (1,485 ) - 8,709 69 - - 8,778 32,478 47,460 2,799 (4,175 ) (28,388 ) 50,174 - 16,291 1,320 85 - 17,696 $ 32,478 $ 31,169 $ 1,479 $ (4,260 ) $ (28,388 ) $ 32,478 CONDENSED CONSOLIDATING STATEMENT OF OPERATIONS(In thousands)Year Ended June 30, 2012 $ - $ 456,895 $ 787,295 $ 33,417 $ (548,234 ) $ 729,373 - 341,365 523,064 19,311 (544,655 ) 339,085 - 115,530 264,231 14,106 (3,579 ) 390,288 180 45,690 280,480 14,241 - 340,591 (180 ) 69,840 (16,249 ) (135 ) (3,579 ) 49,697 49,874 (15,403 ) 216 17 (34,142 ) 562 - 8,997 23 - - 9,020 49,694 45,440 (16,056 ) (118 ) (37,721 ) 41,239 - (8,013 ) (523 ) 81 - (8,455 ) $ 49,694 $ 53,453 $ (15,533 ) $ (199 ) $ (37,721 ) $ 49,694 CONDENSED CONSOLIDATING STATEMENT OF OPERATIONS(In thousands)Year Ended June 30, 2011 $ - $ 423,458 $ 718,660 $ 29,861 $ (493,019 ) $ 678,960 - 321,706 481,814 16,198 (490,218 ) 329,500 - 101,752 236,846 13,663 (2,801 ) 349,460 180 43,791 260,665 12,891 - 317,527 (180 ) 57,961 (23,819 ) 772 (2,801 ) 31,933 29,430 (17,842 ) 232 5 (6,261 ) 5,564 - 10,847 279 - - 11,126 29,250 29,272 (23,866 ) 777 (9,062 ) 26,371 - (2,959 ) - 80 - (2,879 ) $ 29,250 $ 32,231 $ (23,866 ) $ 697 $ (9,062 ) $ 29,250 ETHAN ALLEN INTERIORS INC. AND SUBSIDIARIESCONDENSED CONSOLIDATING STATEMENT OF CASH FLOWS(In thousands)Year Ended June 30, 2013 $ 20,821 $ 24,720 $ 12,336 $ 3,424 $ - $ 61,301 - (1,320 ) (14,847 ) (2,838 ) - (19,005 ) - - (770 ) - - (770 ) - 61 3,222 - - 3,283 - (17 ) - - - (17 ) - (18,247 ) - - - (18,247 ) - 11,165 - - - 11,165 - 1,440 550 - - 1,990 - (6,918 ) (11,845 ) (2,838 ) - (21,601 ) - (25,800 ) (304 ) - - (26,104 ) - - - - - - (22,220 ) - - - - (22,220 ) 1,399 359 - - - 1,758 (20,821 ) (25,441 ) (304 ) - - (46,566 ) - - - (254 ) - (254 ) - (7,639 ) 187 332 - (7,120 ) - 64,946 12,276 2,499 - 79,721 $ - $ 57,307 $ 12,463 $ 2,831 $ - $ 72,601 CONDENSED CONSOLIDATING STATEMENT OF CASH FLOWS(In thousands)Year Ended June 30, 2012 $ 9,187 $ 3,939 $ 18,441 $ 6,134 $ - $ 37,701 - (1,952 ) (15,721 ) (5,211 ) - (22,884 ) - - (520 ) - - (520 ) - 12 1,861 - - 1,873 - 975 - - - 975 - (3,647 ) - - - (3,647 ) - 7,230 - - - 7,230 - 305 511 - - 816 - 2,923 (13,869 ) (5,211 ) - (16,157 ) - (11,917 ) (287 ) - - (12,204 ) (1,350 ) - - - - (1,350 ) (8,062 ) - - - - (8,062 ) 225 238 275 - - 738 (9,187 ) (11,679 ) (12 ) - - (20,878 ) - - - 536 - 536 - (4,817 ) 4,560 1,459 - 1,202 - 69,763 7,716 1,040 - 78,519 $ - $ 64,946 $ 12,276 $ 2,499 $ - $ 79,721 ETHAN ALLEN INTERIORS INC. AND SUBSIDIARIESCONDENSED CONSOLIDATING STATEMENT OF CASH FLOWS(In thousands)Year Ended June 30, 2011 $ 11,055 $ 38,590 $ 10,672 $ 2,845 $ - $ 63,162 - (1,182 ) (5,017 ) (2,895 ) - (9,094 ) - - (2,957 ) - - (2,957 ) - - 3,196 - - 3,196 - 927 - - - 927 - (9,466 ) - - - (9,466 ) - 7,319 - - - 7,319 - 432 - - - 432 - (1,970 ) (4,778 ) (2,895 ) - (9,643 ) - (33,989 ) (3,898 ) - - (37,887 ) (5,377 ) - - - - (5,377 ) (5,754 ) - - - - (5,754 ) 76 (137 ) - - - (61 ) (11,055 ) (34,126 ) (3,898 ) - - (49,079 ) - - - 227 �� - 227 - 2,494 1,996 177 - 4,667 - 67,269 5,720 863 - 73,852 $ - $ 69,763 $ 7,716 $ 1,040 $ - $ 78,519 ETHAN ALLEN INTERIORS INC. AND SUBSIDIARIES(21) VALUATION AND QUALIFYING ACCOUNTSand inventory valuation allowances (in thousands): $ 1,250 $ (20 ) $ - $ 1,230 $ 1,171 $ 9 $ 70 $ 1,250 $ 1,160 $ 11 $ - $ 1,171 $ 2,651 $ 61 $ - $ 2,712 $ 1,716 $ 935 $ - $ 2,651 $ 2,072 $ (356 ) $ - $ 1,716 $ 1,386 $ 253 $ - $ 1,639 1,442 (56 ) - 1,386 $ 1,230 $ 212 $ - $ 1,442 No changes in, or disagreements with, accountants as a result of accounting or financial disclosure matters, occurred during fiscal years 2013, 2012 or 2011.None.Management's Report on Disclosure Controls and ProceduresOurWe maintain disclosure controls and procedures that are designed to ensure that information required to be disclosed in our Exchange Act reports is recorded, processed, summarized and reported within the time periods specified in the SEC’s rules and forms, and that such information is accumulated and communicated to our management, including the Chairman of the Board andour Chief Executive Officer ("CEO") and the Vice President-Finance ("VPF"Chief Financial Officer("CFO"), conductedas appropriate, to allow timely decisions regarding required financial disclosure.VPFCFO have concluded that, as of June 30, 2013,2016, our disclosure controls and procedures were effective in ensuring that material information relating to us (including our consolidated subsidiaries), which is required to be disclosed by us in our periodic reports filed or submitted underto the Exchange ActSEC is (i) recorded, processed, summarized and reported within the time periods specified in the SEC’s rules and forms, and (ii) accumulated and communicated to management, including the CEO and VPF,CFO, as appropriate, to allow timely decisions regarding required disclosure.as(as such term is defined in Exchange Act Rule 13a-15(f) and 15d-15(f)). UnderOur internal control over financial reporting is a process designed to provide reasonable assurance regarding the supervisionreliability of financial reporting and the preparation of financial statements for external purposes in accordance with the participation of management, including the CEOU.S. GAAP.VPF, we conducted an evaluationprocedures that:
Management has assessed the effectiveness of our internal control over financial reporting based on the framework inInternal Control - Integrated Frameworkissued by the Committee of Sponsoring Organizations of the Treadway Commission (1992 framework)(2013 framework). Based on that evaluation, management concluded that our internal control over financial reporting was effective as of June 30, 2013.ETHAN ALLEN INTERIORS INC. AND SUBSIDIARIES2016 to provide reasonable assurance regarding the reliability of financial reporting and the preparation of consolidated financial statements for external reporting purposes in accordance with U.S. GAAP.2013,2016, as stated in their report included under Item 8 of this Annual Report.There have been noDuring fiscal 2016, we adopted the criteria set forth by the Committee of Sponsoring Organizations of the Treadway Commission (“COSO”) in the 2013 Internal Control–Integrated Framework to review, document and test our internal control over financial reporting. We may from time to time make changes aimed at enhancing their effectiveness and to ensure that our systems evolve with our business. These efforts may lead to various changes in our internal control over financial reporting (as such term is defined in Rules 13a-15(f) and 15d-15(f) under the Exchange Act) during the fourth fiscal quarter ended June 30, 2013 that have materially affected, or are reasonably likely to materially affect, our internal control over financial reporting.will appear in theis incorporated by reference to Ethan Allen Interiors Inc. proxy statement for the Annual Meeting of Shareholders scheduled to be held on November 19, 201316, 2016 (the "Proxy Statement"). The Proxy Statement, which will to be filed with the SEC pursuant to Regulation 14A underwithin 120 days after the Securities Exchange Actend of 1934, is incorporated by reference in this Annual Report pursuant to General Instruction G(3) of Form 10-K (other than the portions thereof not deemed to be "filed" for the purpose of Section 18 of the Securities Exchange Act of 1934). In addition, the information set forth below is provided as required by Item 10 and the listing standards of the New York Stock Exchange ("NYSE").our 2016 fiscal year.atwww.Ethanallen.com/at www.ethanallen.com/governance.Kristin GambleDomenick J. EspositoDr. James W. SchmotterDon M. Wilson, III
All persons identified as audit committee financial experts are independent from management as defined by the applicable listing standards of the New York Stock Exchange.ETHAN ALLEN INTERIORS INC. AND SUBSIDIARIESItem 11. Executive Compensation
The information required by this Item will be included in and is incorporated herein by reference from our 2016 Proxy Statement.StockholderShareholder MattersNYSE CertificationMr. Kathwari, Chief Executive Officer and President, has certified
The information required by this Item is incorporated by reference to the NYSE, pursuant to Section 303A.12sections entitled ["Equity Compensation Plan Information"] and ["Security Ownership of Common Stock of Certain Owners and Management"] in the NYSE’s Listing Company Manual, that he is unaware of any violation by the Company of the NYSE’s corporate governance listing standards.2016 Proxy Statement.PART IVItem 13.Certain Relationships and Related Transactions, and Director Independence
The information required by this Item is incorporated by reference to the section entitled ["Certain Relationships and Related Party Transactions"] and ["Corporate Governance —Director Independence "] in the 2016 Proxy Statement.
The information required by this item is incorporated by reference to the sections entitled ["Audit Fees"]and ["Audit and Non-Audit Engagement Pre-Approval Policy "] in the 2016 Proxy Statement.I. Listing of Documents Statements.Statements. Our Consolidated Financial Statements, included under Item 8 hereof, as required at June 30, 20132016 and 2012,2015, and for the years ended June 30, 2013, 20122016, 2015 and 20112014 consist of the following:Consolidated Balance SheetsConsolidated Statements of OperationsConsolidated Statements of Cash FlowsConsolidated Statements of Shareholders' EquityNotes to Consolidated Financial Statements
|
| |
| Consolidated Balance Sheets | ||
| Consolidated Statements of Operations | ||
| Consolidated Statements of Cash Flows | ||
| Consolidated Statements of Shareholders' Equity | ||
| Notes to Consolidated Financial Statements | ||
| (a)(2) | Financial Statement Schedules. None. | |
| (b) | The following Exhibits are filed as part of this report on Form 10-K: |
Exhibit Number | Exhibit | |
3 (a) | Restated Certificate of Incorporation of the Company | |
| 23, 1993, Certificate of Amendment to Restated Certificate of Incorporation dated as of August 5, 1997, Second Certificate of Amendment to Restated Certificate of Incorporation dated as of March 27, 1998, Third Certificate of Amendment to Restated Certificate of Incorporation dated as of April 28, 1999, Fourth Amendment to Restated Certificate of Incorporation dated as of December 5, 2013, Fifth Amendment to Restated Certificate of Incorporation dated as of December 11, 2015 (incorporated by reference | |
|
| |
|
| |
3 (b) | Certificate of | |
3 (c) | Certificate of | |
|
| |
3 (d) | Amended and Restated By-laws of the Company (incorporated by reference to Exhibit 3(d) to the Registration Statement on Form S-1 of the Company filed with the SEC on March 16, 1993) | |
3 (e) | Certificate of Incorporation of Ethan Allen Global, Inc. (incorporated by reference to Exhibit 3(e) to the Registration Statement on Form S-4 of Ethan Allen Global, Inc. filed with the SEC on February 3, 2006) |
ETHAN ALLEN INTERIORS INC. AND SUBSIDIARIES
3 (f) | By-laws of Ethan Allen Global, Inc. (incorporated by reference to Exhibit 3(f) to the Registration Statement on Form S-4 of Ethan Allen Global, Inc. filed with the SEC on February 3, 2006) |
ETHAN ALLEN INTERIORS INC. AND SUBSIDIARIES
3 (g) | Restated Certificate of Incorporation of Ethan Allen Inc. (now known as, Ethan Allen Retail, Inc.) (incorporated by reference to Exhibit 3(g) to the Registration Statement on Form S-4 of Ethan Allen Global, Inc. filed with the SEC on February 3, 2006) | |
3 (g)-1 | Certificate of Amendment of Restated Certificate of Incorporation of Ethan Allen Inc. (now known as Ethan Allen Retail, Inc.) as of June 29, 2005 (incorporated by reference to Exhibit 3(g)-1 to the Registration Statement on Form S-4 of Ethan Allen Global, Inc. filed with the SEC on February 3, 2006) | |
3 (h) | Amended and Restated By-laws of Ethan Allen Inc. (now known as Ethan Allen Retail, Inc.) (incorporated by reference to Exhibit 3(h) to the Registration Statement on Form S-4 of Ethan Allen Global, Inc. filed with the SEC on February 3, 2006) | |
3 (i) | Certificate of Incorporation of Ethan Allen Manufacturing Corporation (now known as Ethan Allen Operations, Inc.) (incorporated by reference to Exhibit 3(i) to the Registration Statement on Form S-4 of Ethan Allen Global, Inc. filed with the SEC on February 3, 2006) | |
3 (i)-1 | Certificate of Amendment of Certificate of Incorporation of Ethan Allen Manufacturing Corporation (now known as, Ethan Allen Operations, Inc.) as of June 29, 2005 (incorporated by reference to Exhibit 3(i)-1 to the Registration Statement on Form S-4 of Ethan Allen Global, Inc. filed with the SEC on February 3, 2006) | |
3 (j) | By-laws of Ethan Allen Manufacturing Corporation (now known as, Ethan Allen Operations, Inc.) (incorporated by reference to Exhibit 3(j) to the Registration Statement on Form S-4 of Ethan Allen Global, Inc. filed with the SEC on February 3, 2006) | |
3 (k) | Certificate of Formation of Ethan Allen Realty, LLC (incorporated by reference to Exhibit 3(k) to the Registration Statement on Form S-4 of Ethan Allen Global, Inc. filed with the SEC on February 3, 2006) | |
3 (l) | Limited Liability Company Operating Agreement of Ethan Allen Realty, LLC (incorporated by reference to Exhibit 3(l) to the Registration Statement on Form S-4 of Ethan Allen Global, Inc. filed with the SEC on February 3, 2006) | |
3 (l)-1 | Amendment No. 1 to Operating Agreement of Ethan Allen Realty, LLC as of June 30, 2005 (incorporated by reference to Exhibit 3(l)-1 to the Registration Statement on Form S-4 of Ethan Allen Global, Inc. filed with the SEC on February 3, 2006) | |
3 (m) | Certificate of Incorporation of Lake Avenue Associates, Inc. (incorporated by reference to Exhibit 3(m) to the Registration Statement on Form S-4 of Ethan Allen Global, Inc. filed with the SEC on February 3, 2006) |
3 (n) | By-laws of Lake Avenue Associates, Inc. (incorporated by reference to Exhibit 3(n) to the Registration Statement on Form S-4 of Ethan Allen Global, Inc. filed with the SEC on February 3, 2006) | |
3 (o) | Certificate of Incorporation of Manor House, Inc. (incorporated by reference to Exhibit 3(o) to the Registration Statement on Form S-4 of Ethan Allen Global, Inc. filed with the SEC on February 3, 2006) | |
3 (p) | Restated By-laws of Manor House, Inc. (incorporated by reference to Exhibit 3(p) to the Registration Statement on Form S-4 of Ethan Allen Global, Inc. filed with the SEC on February 3, 2006) | |
|
ETHAN ALLEN INTERIORS INC. AND SUBSIDIARIES
Form of outstanding 5.375% Senior Note due 2015 pursuant to Rule 144A of the Securities Act (incorporated by reference to Exhibit A to Exhibit 10.2 to the Current Report on Form 8-K of the Company filed with the SEC on September 30, 2005)
4 (b)
Indenture dated September 27, 2005, by and among Ethan Allen Global, Inc., the Guarantors named therein, and the Initial Purchaser named therein, relating to the Notes (incorporated by reference to Exhibit 10.2 to the Current Report on Form 8-K of Ethan Allen Interiors Inc. filed with the SEC on September 30, 2005)
4 (c)
Form of Exchange Note (incorporated by reference to Exhibit 4(d) to the Registration Statement on Form S-4 of Ethan Allen Global, Inc. filed with the SEC on February 3, 2006)
10 (a) | Restated Directors Indemnification Agreement dated March 1993, among the Company and Ethan Allen and their Directors (incorporated by reference to Exhibit 10(c) to the Registration Statement on Form S-1 of the Company filed with the SEC on March 16, 1993) |
ETHAN ALLEN INTERIORS INC. AND SUBSIDIARIES
10 (b) | The Ethan Allen Retirement Savings Plan as Amended and Restated, effective January 1, 2006 (incorporated by reference to Exhibit 10(b)-7 to the Quarterly Report on Form 10-Q of the Company filed with the SEC on November 5, 2007 | |
10 (c) | Sales Finance Agreement, dated June 25, 1999, between the Company and MBNA America Bank, N.A. (incorporated by reference to Exhibit 10(j) to the Annual Report on Form 10-K of the Company filed with the SEC on September 13, 2000) | |
10 (d) | Second Amended and Restated Private Label Consumer Credit Card Program Agreement, dated as of July 23, 2007, by and between Ethan Allen Global, Inc., Ethan Allen Retail, Inc. and GE Money Bank (incorporated by reference to Exhibit 10(e)-3 to the Quarterly Report on Form 10-Q of the Company filed with the SEC on November 5, 2007)(confidential treatment granted under Rule 24b-2 as to certain portions which are omitted and filed separately with the | |
10 (d)-1 | First Amendment to Second Amended and Restated Private Label Consumer Credit Card Program Agreement, dated as of July 25, 2008, by and between Ethan Allen Global, Inc., Ethan Allen Retail, Inc. and GE Money Bank (incorporated by reference as Exhibit 10(e)-1 to the Quarterly Report on Form 10-Q of the Company filed with the SEC on May 10, 2010) | |
10 (d)-2 | Second Amendment to Second Amended and Restated Private Label Consumer Credit Card Program Agreement, dated as of February 16, 2010, by and between Ethan Allen Global, Inc., Ethan Allen Retail, Inc. and GE Money Bank (incorporated by reference as Exhibit 10(e)-2 to the Quarterly Report on Form 10-Q of the Company filed with the SEC on May 10, 2010) (confidential treatment granted under Rule 24b-2 as to certain portions which are omitted and filed separately with the SEC) | |
10 (d)-3 | Third Amendment to Second Amended and Restated Private Label Consumer Credit Card Program Agreement, dated as of June 30, 2011, by and between Ethan Allen Global, Inc., Ethan Allen Retail, Inc. and GE Money Bank (incorporated by reference to Exhibit 10(e)-3 to the Quarterly Report on Form 10-Q of the Company filed with the SEC on November 3, 2010) |
10 (d)-4 | Fourth Amendment to Second Amended and Restated Private Label Consumer Credit Card Program Agreement dated as of January 1, 2014, by and between Ethan Allen Global, Inc., Ethan Allen Retail, Inc., and GE Capital Retail Bank (incorporated by reference to Exhibit 10(d)-4 to the Quarterly Report on Form 10-Q of the Company filed with the SEC on January 31, 2014) (confidential treatment requested under Rule 24b-2 as to certain portions which are omitted and filed separately with the SEC) | |
10 (d)-5 | Fifth Amendment to Second Amended and Restated Private Label Consumer Credit Card Program Agreement effective as of July 1, 2015, by and between Ethan Allen Global, Inc., Ethan Allen Retail, Inc., and Synchrony Bank (incorporated by reference to Exhibit 10.(D)‐5 to the Annual Report on Form 10‐K of the Company filed with the SEC on August 12, 2015) | |
10 (e) | Employment Agreement | |
|
|
ETHAN ALLEN INTERIORS INC. AND SUBSIDIARIES
10 (e)-1 | Form of Performance-Based Stock Unit Agreement (incorporated by reference to Exhibit 10.2 to the Company’s Current Repot on Form 8-K filed with the SEC on October 2, 2015) | |
10 (e)-2 | Change in Control Severance Plan (incorporated by reference to Exhibit 10.3 to the Company’s Current Repot on Form 8-K filed with the SEC on October 2, 2015) | |
10 (f)-1 | Credit Agreement, dated as of May 29, 2009, among Ethan Allen Global, Inc., Ethan Allen Interiors Inc., J.P. Morgan Chase Bank, N.A., and Capital One Leverage Finance Corp (confidential treatment requested as to certain | |
10 (f)-2 | Amendment No. 1, dated as of October 23, 2009 to the Credit Agreement dated May 29, 2009, among Ethan Allen Global, Inc., Ethan Allen Interiors Inc., J.P.Morgan Chase Bank, N.A., and the lenders thereunder (incorporated by reference to the Quarterly Report on Form 10-Q of the Company filed with the SEC on November 9, 2009). | |
10 (f)-3 | Amendment No. 2, dated as of March 25, 2011, to the Credit Agreement dated May 29, 2009, among Ethan Allen Global, Inc., Ethan Allen Interiors Inc., J.P.Morgan Chase Bank, N.A., and Wells Fargo Bank, National Association (incorporated by reference to the Quarterly Report on Form 10-Q of the Company filed with the SEC on May 5, 2011) | |
10 (f)-4 | Amended and Restated Credit Agreement, dated October 21, 2014, among Ethan Allen Global, Inc., Ethan Allen Interiors Inc., J.P. Morgan Chase Bank, N.A., and Capital One, National Association (incorporated herein by reference to Exhibit 10.1 to the Current Report on Form 8-K of the Company filed with the SEC on October 22, 2014) | |
10 (f)-5 | Amendment No. 2 Dated as of September 10, 2015 to Amended and restated credit agreement dated as of October 21, 2014 among Ethan Allen Global, Inc., and J.P. Morgan Chase Bank, N.A. as Administrative Agent and Syndication Agent, and Capital One, National Association as Documention Agent dated as of October 21, 2014 (incorporated by reference to Exhibit 10.1 to the Company’s QuarterlyRepot on Form 10-Q filed with the SEC on September 11, 2015) | |
10 (f)-6 | Amendment No. 3, dated as of January 22, 2016, to the Amended and Restated Credit Agreement dated as of October 21, 2014 among Ethan Allen Global, Inc., Ethan Allen Interiors Inc., J.P.Morgan Chase Bank, N.A. and Capital One, National Association (incorporated by reference to the Company’s Quarterly Report on Form 10-Q filed with the SEC on January 27, 2016). |
10 (g) | Amended and Restated 1992 Stock Option Plan (incorporated by reference to Exhibit 10(f) to the Current Report on Form 8-K of the Company filed with the SEC on November 19, 2007) |
ETHAN ALLEN INTERIORS INC. AND SUBSIDIARIES
10 (g)-1 | Form of Option Agreement for Grants to Independent Directors (incorporated by reference to Exhibit 10(h)-4 to the Annual Report on Form 10-K of the Company filed with the SEC on September 13, | |
10 (g)-2 | Form of Option Agreement for Grants to Employees (incorporated by reference to Exhibit 10(h)-5 to the Annual Report on Form 10-K of the Company filed with the SEC on September 13, 2005 |
ETHAN ALLEN INTERIORS INC. AND SUBSIDIARIES
10 (g)-3 | Form of Restricted Stock Agreement for Executives (incorporated by reference to Exhibit 10(f)-1 to the Current Report on Form | |
10 (g)-4 | Form of Restricted Stock Agreement for Directors (incorporated by reference to Exhibit 10(f)-2 to the Current Report on Form 8-K of the Company filed with the SEC on November 19, | |
10 |
| |
|
| |
|
|
|
| 21 | List of wholly-owned subsidiaries of the Company |
| ||
23 | Consent of KPMG LLP | |
| ||
31.1 |
| |
| ||
31.2 |
| |
* | 32.1 |
|
* | 32.2 |
|
| ||
101.INS | XBRL Instance Document | |
| ||
101.SCH | XBRL Taxonomy Extension Schema | |
| ||
101.CAL | XBRL Taxonomy Extension Calculation Linkbase | |
| ||
101.DEF | XBRL Taxonomy Extension Definition Linkbase | |
| ||
101.LAB | XBRL Taxonomy Extension Labels Linkbase | |
| ||
101.PRE | XBRL Taxonomy Extension Presentation Linkbase | |
* FiledFurnished herewith.
** XBRL information is furnished and not filed or a part of a registration statement or prospectus for purposes of Sections 11 or 12 of the Securities Act of 1933, as amended, is deemed not filed for purposes of Section 18 of the Securities Exchange Act of 1934, as amended, and otherwise is not subject to liability under these sections.
ETHAN ALLEN INTERIORS INC. AND SUBSIDIARIES
SIGNATURES
Pursuant to the requirements of SectionofSection 13 or 15(d) of the Securities Exchange Act of 1934, the Registrant has duly caused this Report to be signed on its behalf by the undersigned, thereunto duly authorized.
ETHAN ALLEN INTERIORS INC. | |
(Registrant) |
| |
DATE: August 8, 2016 | (M. Farooq Kathwari) |
Chairman, President and Chief Executive Officer | |
(Principal Executive Officer) |
| |
DATE: August 8, 2016 | ( |
Executive Vice President, Chief Financial Officer and Treasurer | |
(Principal Financial
|
KNOW ALL MEN BY THESE PRESENTS, that each individual whose signature appears below hereby constitutes and appoints M. Farooq Kathwari and Corey Whitely, and each of them individually, his or her true and lawful agent, proxy and attorney-in-fact, with full power of substitution and resubstitution, for him or her and in his or her name, place and stead, in any and all capacities, to (i) act on, sign and file with the Securities and Exchange Commission any and all amendments to this Report together with all schedules and exhibits thereto, (ii) act on, sign and file with the Securities and Exchange Commission any and all exhibits to this Report and any and all exhibits and schedules thereto, (iii) act on, sign and file any and all such certificates, notices, communications, reports, instruments, agreements and other documents as may be necessary or appropriate in connection therewith and (iv) take any and all such actions which may be necessary or appropriate in connection therewith, granting unto such agents, proxies and attorneys-in-fact, and each of them individually, full power and authority to do and perform each and every act and thing necessary or appropriate to be done, as fully for all intents and purposes as he or she might or could do in person, and hereby approving, ratifying and confirming all that such agents, proxies and attorneys-in-fact, any of them or any of his, her or their substitute or substitutes, may lawfully do or cause to be done by virtue hereof.
Pursuant to the requirements of the Securities Exchange Act of 1934, this Report has been signed below by the following persons on behalf of the Registrant and in the capacities and on the date indicated.
/s/ M. Farooq Kathwari | Chairman, President and Chief Executive Officer |
(M. Farooq Kathwari) | (Principal Executive Officer) |
/s/ | Executive Vice President, Administration, |
(Corey Whitely) | Chief Financial Officer and Treasurer (Principal Financial Officer) |
/s/ John S. Bedford | Vice President, |
( | ( Principal Accounting Officer) |
/s/ James B. Carlson | Director |
(James B. Carlson) |
/s/ Clinton A. Clark | Director |
(Clinton A. Clark) |
/s/ John J. Dooner Jr. | Director |
(John Dooner) |
/s/ | Director |
( |
/s/ Mary Garrett | Director |
(Mary Garrett) |
/s/ James W. Schmotter | Director |
(James W. Schmotter) |
/s/ | Director |
( |
|
|
|
Date: August 16, 20138, 2016
74
71