UNITED STATES
SECURITIES AND EXCHANGE COMMISSION
Washington, D.C. 20549
FORM 10-K
(Mark One)
☒ | ANNUAL REPORT PURSUANT TO SECTION 13 OR 15(d) OF THE SECURITIES EXCHANGE ACT OF 1934 |
For the fiscal year ended December 31, 20132014
or
☐ | TRANSITION REPORT PURSUANT TO SECTION 13 OR 15(d) OF THE SECURITIES EXCHANGE ACT OF 1934 |
Commission file number: 000-51026
Monolithic Power Systems, Inc.
(Exact name of registrant as specified in its charter)
Delaware | 77-0466789 |
(State or other jurisdiction of incorporation or organization) | (I.R.S. Employer Identification Number) |
79 Great Oaks Boulevard, San Jose, CA 95119 (408) 826-0600
(Address of principal executive offices, including zip code and telephone number)
Securities registered pursuant to Section 12(b) of the Act:
Title of each class | Name of each exchange on which registered |
Common Stock, $0.001 Par Value | The NASDAQ Global Select Market |
Securities registered pursuant to Section 12(g) of the Act:
None
Indicate by check mark if the registrant is a well-known seasoned issuer, as defined in Rule 405 of the Securities Act of 1933.☐☒ Yes ☒☐ No
Indicate by check mark if the registrant is not required to file reports pursuant to Section 13 or Section 15(d) of the Securities Exchange Act of 1934 (the “Exchange Act”).☐ Yes ☒ No
Indicate by check mark whether the registrant (1) has filed all reports required to be filed by Section 13 or 15(d) of the Exchange Act during the preceding 12 months (or for such shorter period that the registrant was required to file such reports), and (2) has been subject to such filing requirements for the past 90 days. Yes ☒ No ☐
Indicate by check mark whether the registrant has submitted electronically and posted on its corporate Web site, if any, every Interactive Data File required to be submitted and posted pursuant to Rule 405 of Regulation S-T (§ 232.405 of this chapter) during the preceding 12 months (or for such shorter period that the registrant was required to submit and post such files). Yes ☒ No ☐
Indicate by check mark if disclosure of delinquent filers pursuant to Item 405 of Regulation S-K is not contained herein, and will not be contained, to the best of the registrant’s knowledge, in definitive proxy or information statements incorporated by reference in Part III of this Form 10-K or any amendment to this Form 10-K. ☐
Indicate by check mark whether the registrant is a large accelerated filer, an accelerated filer, a non-accelerated filer or a smaller reporting company. See the definitions of “large accelerated filer,” “accelerated filer” and “smaller reporting company” in Rule 12b-2 of the Exchange Act.
Large accelerated filer ☐☒ Accelerated filer ☒☐ Non-accelerated filer ☐ Smaller reporting company ☐
Indicate by check mark whether the registrant is a shell company (as defined in Rule 12b-2 of the Exchange Act). ☐ Yes ☒ No
The number of shares of the registrant’s stock outstanding as of June 30, 20132014 was 37,336,120.38,774,391. The closing price of the registrant’s common stock on the Nasdaq Global Select Market as ofon June 30, 20132014 was $24.11.$42.35. The aggregate market value of the voting and non-voting common equity held by non-affiliates of the registrant based upon the closing price of the Common Stock on the Nasdaq Global Select Market on June 30, 20132014 was $446,761,917.$946.0 million.*
There were 38,686,17239,290,882 shares of the registrant’s common stock issued and outstanding as of March 3, 2014.February 23, 2015.
DOCUMENTS INCORPORATED BY REFERENCE
Portions of the registrant’s Proxy Statement for the registrant’s 20142015 Annual Meeting of Stockholders are incorporated by reference into Part III of this Form 10-K to the extent stated herein. The Proxy Statement will be filed within 120 days of the registrant’s fiscal year ended December 31, 2013.2014.
* | Excludes |
MONOLITHIC POWER SYSTEMS, INC.
TABLE OF CONTENTS
|
| Page |
|
|
|
PART I | ||
Item 1. | Business | 5 |
Executive Officers of the Registrant | 9 | |
Item 1A | Risk Factors | 10 |
Item 1B | Unresolved Staff Comments | 24 |
Item 2. | Properties | 24 |
Item 3. | Legal Proceedings | 24 |
Item 4. | Mine Safety Disclosures |
|
|
|
|
PART II | ||
Item 5. | Market for | 25 |
Item 6. | Selected Financial Data | 27 |
Item 7. | Management's Discussion and Analysis of Financial Condition and Results of Operations | 28 |
Item 7A. | Quantitative and Qualitative Disclosures About Market Risk |
|
Item 8. | Financial Statements and Supplementary Data | 38 |
Item 9. | Changes in and Disagreements with Accountants on Accounting and Financial Disclosure |
|
Item 9A. | Controls and Procedures |
|
Item 9B. | Other Information |
|
|
|
|
PART III | ||
Item 10. | Directors, Executive Officers and Corporate Governance |
|
Item 11. | Executive Compensation |
|
Item 12. | Security Ownership of Certain Beneficial Owners and Management and Related Stockholder Matters |
|
Item 13. | Certain Relationships and Related Transactions, and Director Independence |
|
Item 14. | Principal |
|
|
|
|
PART IV | ||
Item | Exhibits and Financial Statement Schedules |
|
| Signatures |
|
Except as the context otherwise requires, the terms “Monolithic Power Systems”, “MPS”, “Registrant”, “Company”, “we”, “us”, or “our” as used herein are references to Monolithic Power Systems, Inc. and its consolidated subsidiaries.
FORWARD-LOOKING STATEMENTS
This Annual Report on Form 10-K and the documents incorporated herein by reference contain forward-looking statements within the meaning of Section 27A of the Securities Act of 1933, as amended, and Section 21E of the Securities Exchange Act of 1934, as amended, that have been made pursuant to and in reliance on the provisions of the Private Securities Litigation Reform Act of 1995. These statements include among other things, statements concerning:
the above-average industry growth of product and market areas that we have targeted,
our plan to introduce additionalincrease our revenue through the introduction of new products within our existing product families as well as in new product categoriesandcategories and families,
our intention to exercise our purchase option with respect to our manufacturing facility in Chengdu, China,
our belief that we will continue to incur significant legal expenses that vary with the level of activity in each of our legalproceedings,legal proceedings,
the effect of auction-rate securities on our liquidity and capital resources, as well as thethat liquidity of our other investments has on our capital resources,
the continuing application of our products in the communications, storage and computing, consumer and industrial marketscontinuing tomarkets, which account for a majority of our revenue,
estimates of our future liquidity requirements,
the cyclical nature of the semiconductor industry,
protection of our proprietary technology,
near termnear-term business outlook for 2014,2015 and beyond,
the factors that we believe will impact our ability to achieve revenue growth,
the outcome of the IRSIRS’s audit of our tax returns,
the percentage of our total revenue from various market segments, and
• | the percentage of our total revenue from various market segments, | |
• | our ability to integrate Sensima successfully and achieve the anticipated benefits from the acquisition, | |
• | our ability to identify, acquire and integrate future acquisitions and achieve the anticipated benefits from such acquisitions, | |
• | our intention and ability to continue our stock repurchase program and pay future cash dividends, and |
the factors that differentiate us from our competitors.
In some cases, words such as “would,” “could,” “may,” “should,” “predict,” “potential,” “targets,” “continue,” “anticipate,” “expect,” “intend,” “plan,” “believe,” “seek,” “estimate,” “project,” “forecast,” “will,” the negative of these terms or other variations of such terms and similar expressions relating to the future identify forward-looking statements.
All forward-looking statements are based on our current outlook, expectations, estimates, projections, beliefs and plans or objectives about our business and our industry. These statements are not guarantees of future performance and are subject to risks and uncertainties. Actual events or results could differ materially and adversely from those expressed in any such forward-looking statements. Risks and uncertainties that could cause actual results to differ materially include those set forth throughout this Annual Report on Form 10-K and, in particular, in Itemthe section entitled “Item 1A. “Risk Factors.”Risk Factors”. Except as required by law, we disclaim any duty to and undertake no obligation to update any forward-looking statements, whether as a result of new information relating to existing conditions, future events or otherwise or to release publicly the results of any future revisions we may make to forward-looking statements to reflect events or circumstances after the date hereof or to reflect the occurrence of unanticipated events. Readers are cautioned not to place undue reliance on such statements, which speak only as of the date of this Annual Report on Form 10-K. Readers should carefully review future reports and documents that we file from time to time with the Securities and Exchange Commission, such as our Annual Reports on Form 10-K, Quarterly Reports on Form 10-Q and any Current Reports on Form 8-K.8-K
PART I
ITEM 1. BUSINESS
General
Monolithic Power Systems (“MPS”) is a fablessleading company in high performance power solutions. Founded in 1997, MPS pioneered integrated power semiconductor company that designs, developssolutions and markets proprietary, advanced analog and mixed-signal semiconductors. We combine advanced process technology with our highly experienced analog designerspower delivery architectures. MPS's mission is to produce high-performanceprovide innovative power management integrated circuits (ICs) for DC to DC converters and Lighting Control products. Our products are used extensivelysolutions in cloud computing, and network communications products, flat panel TVs, set top boxes, lighting products and a wide variety of consumer and portable electronics products,telecommunications, industrial and automotive, and industrial markets. We partner with world-class manufacturing organizations to deliver top quality, ultra-compact, high-performance solutions through productive, cost-efficient channels. Foundedconsumer market segments. MPS has over 1,000 employees worldwide, located in 1997the United States, China, Taiwan, Korea, Japan and headquartered in San Jose, California, we have expanded our global presence with offices in Taiwan, China, Korea and Japan, which operate under MPS International, Ltd. We have marketing representatives in Europe and Singapore.across Europe.
Industry Overview
Semiconductors comprise the basic building blocks of electronic systems and equipment. Within the semiconductor industry, components can be classified either as discrete devices, such as individual transistors, or as ICs, in which a number of transistors and other elements are combined to form a more complicated electronic circuit. ICs can be further divided into three primary categories: digital, analog, and mixed-signal. Digital ICs, such as memory devices and microprocessors, can store or perform arithmetic functions on data that is represented by a series of ones and zeroes. Analog ICs, in contrast, handle real world signals such as temperature, pressure, light, sound, or speed. In addition, analog ICs also perform power management functions, such as regulating or converting voltages, for electronic devices. Mixed-signal ICs combine digital and analog functions onto a single chip and play an important role in bridging real world phenomena to digital systems.
Analog and Mixed-Signal Markets. We focus on the market for “high‘high performance’ analog and mixed-signal ICs. “High‘High performance’ products generally are differentiated by functionality and performance factors which include integration of higher levels of functionality onto a single chip, greater precision, higher speed and lower heat and noise. There are several key factors that distinguish analog and mixed-signal IC markets, and in particular the high performance portion of the analog and mixed signal IC market, from digital IC markets. These factors include longer product life cycles, numerous market segments, technology that is difficult to replicate, relative complexity of design and process technology, importance of experienced design engineers, lower capital requirements and diversity of end markets. We have, however, targeted product and market areas that we believe have the ability to offer above average industry growth over the long term.
Acquisition
In July 2014, we completed the acquisition of Sensima Technology SA (“Sensima”), a company based in Switzerland that develops magnetic sensors for angle measurement as well as three-dimensional magnetic field sensing. Sensima’s products are based on Hall devices that are directly integrated with the signal treatment and instantaneously detect and deliver the angle value in digital format. Their angle sensors are used in rotary encoders, electronically commutated motors and a broad range of products. By combining Sensima’s real time precision magnetic angle sensing with our technologies, we expect to create new opportunities with customers by offering enhanced solutions in power management for key industries such as automotive, industrial and cloud computing.
For a detailed discussion of the terms of the acquisition, please refer to Note 2 to our consolidated financial statements under Item 8 of this Annual Report on Form 10-K.
Products and Applications
We currently have two primary product families that address multiple applications within the storage and computing, consumer electronics, communications, and industrial/automotive markets. Our products are differentiated with respect to their high degree of integration and strong levels of accuracy and efficiency, making them cost-effective relative to many competing solutions. These product families include:
Direct Current (DC) to DC Products.DC to DC ICs are used to convert and control voltages within a broad range of electronic systems, such as portable electronic devices, wireless LAN access points, computers, set top boxes, TVs and monitors, automobiles and medical equipment. We believe that our DC to DC products are differentiated in the market, particularly with respect to their high degree of integration, high voltage operation, high load current, high switching speed and small footprint. These features are important to our customers as they result in fewer components, a smaller form factor, more accurate regulation of voltages, and, ultimately, lower system cost and increased reliability through the elimination of many discrete components and power devices. The DC to DC product family accounted for 90%, 89% and 88% of our total revenue in 2014, 2013 and 2012, respectively.
Lighting Control Products and AC/DC Offline Solutions. Lighting control ICs are used in backlighting and general illumination products. Lighting control ICs for backlighting are used in systems that provide the light source for LCD panels typically found in notebook computers, LCD monitors, car navigation systems, and LCD televisions. Backlighting solutions are typically either white light emitting diode (WLED) lighting sources or cold cathode fluorescent lamps (CCFL). WLED lighting control ICs step-up or step-down a DC voltage, or convert from an AC line voltage supplied by the utility company (also called AC/DC Offline) and provide efficient precision power and protection to a LED string or to multiple LED strings. The CCFL ICs function by converting low-voltage direct current (DC) or battery voltage to high-voltage alternating current (AC). We believe our CCFL ICs were the first to utilize a full bridge resonant topology that allows for high efficiency, extended lifetimes for cold cathode fluorescent lamps (CCFLs),CCFLs, and lower signal interference with adjacent components. The full bridge topology is now the industry standard for these products. The Lighting Control product family accounted for 10%, 11% and 12% of our total revenue in 2014, 2013 and 2012, respectively.
In addition to AC/DC offline solutions for lighting illumination applications, we also offer AC/DC power conversion solutions for a diverse number of end products that plug into a wall outlet.
We currently target our products at the consumer electronics, communications, storage and computing, and industrial markets, with the consumer electronics market representing the largest portion of our revenue.
The following is a brief summary of our product family for various applications. For each of these applications, we are currently shipping products or have design wins, which are decisions by original equipment manufacturers (OEMs) or original design manufacturers (ODMs) to use our ICs:
Applications | WLED Lighting Illumination
backlight) | LCD Backlight (Inverters or WLED) | DC to DC Converters (Buck & Boost) | µP Reset & Supervisory | Audio Amplifiers | AC/DC Offline | Chargers (Switching &
| Current Limit Switches |
Storage andComputing | ||||||||
Computers | X | X | X | X | X | X | X | |
LCD Monitors | X | X | X | X | X | |||
Disk Drives/ Storage Networks | X | X | X | |||||
Consumer Electronics | ||||||||
|
|
|
|
|
|
| ||
|
|
|
|
|
|
| ||
Set Top Boxes | X | X | X | X | X | X | ||
Blu-Ray & DVD Players | X | X | X | X | X | |||
Digital Still Cameras | X | X | X | X | ||||
Commercial & Industrial Bulb & CFL Replacement | X | X | X | |||||
GPS and Infotainment systems | X | X | X | X | X | X | ||
Communications | ||||||||
Cellular Handsets | X | X | X | X | X | |||
Networking Infrastructure | X | X | X | |||||
VOIP | X | X | ||||||
Wireless Access Points | X | X | X | |||||
Industrial | ||||||||
Automotive | X | X | X | X | X | X | ||
Industrial Applications | X | X | X | X | X | X |
We derive a majority of our revenue from our DC to DC IC product family sold to the consumer electronics, communications, storage and computing and industrial markets. In the future, we will continue to introduce additional new products within our existing product families, such as high current, high voltage, small form factor switching voltage regulators, as well as expand our newer product families in battery chargers, voltage references and low dropout regulators. Our ability to achieve revenue growth will depend in part upon our ability to enter new market segments, gain market share, grow in regions outside of Greater China, Taiwan and other Asian markets, expand our customer base and successfully secure manufacturing capacity.
Please refer to the table showingFor a detailed discussion of our revenue by product family, in the section entitled “Item 7. Management’s Discussion and Analysisplease refer to Note 16 to our consolidated financial statements under Item 8 of Financial Condition and Results of Operations – Results of Operations”. this Annual Report on Form 10-K.
Customers, Sales and Marketing
We sell our products through third party distributors, value-added resellers and directly to OEMs, ODMs, and electronic manufacturing service (EMS) providers. Our third party distributors are subject to distribution agreements with us which allow the distributor to sell our products to end customers and other resellers. Distributors may distribute our products to end customers which include OEMs, ODMs or EMS providers. Our value-added resellers may second source our products and provide other services to customers. ODMs typically design and manufacture electronic products on behalf of OEMs, and EMS providers typically provide manufacturing services for OEMs and other electronic product suppliers.
As a result of consolidations in recent years among distributors, salesSales to our largest distributor accounted for approximately 26% of revenue in 2014, 32% of revenue in 2013 and 32% of revenue in 2012, and 27% in 2011.2012. In addition, one other distributor accounted for 10% of our revenue in 2013. No other customers accounted for more than 10% of revenue in any periods presented.
Current distribution agreements with several of our major distributors provide that each distributor shall have the non-exclusive right to sell and use its best efforts to promote and develop a market for our products. These agreements provide that payment for purchases from us will generally occur within 30 to 45 days from the date of invoice. In addition, we allow for limited stock rotation in certain agreements.
We have sales offices located in the United States, Taiwan, China, Korea and Japan and have marketing representatives in Europe and Singapore. Our products typically require a highly technical sales and applications engineering effort where we assist our customers in the design and use of our products in their application. We maintain a staff of applications engineers who work directly with our customers’ engineers in the development of their systemssystems’ electronics containing our products.
Because our sales are billed and payable in United States dollars, our sales are not directly subject to fluctuating currency exchange rates. However, because a majority of our revenue is attributable to direct or indirect sales to customers in Asia, changes in the relative value of the dollar may create pricing pressures for our products. For the yearyears ended December 31, 2014, 2013 and 2012, approximately 91%, 90% and 89% of our revenue was from customers in Asia.Asia, respectively.
Our sales are made primarily pursuant to standard individual purchase orders. Our backlog consists of orders that we have received from customers which have not yet shipped. Our manufacturing lead times are generally 4 to 12 weeks and we often build inventory in advance of customer orders based on our forecast of future customer orders. This subjects us to certain risks, most notably the possibility that sales will not meet our forecast, which could lead to inventories in excess of demand. If excess inventory exists, it may be necessary for us to sell it at a substantial discount, take a significant write-down or dispose of it altogether, either of which would negatively affect our profit margins.
We operate in the cyclical semiconductor industry where there is seasonal demand for certain of our products. While we are not and will not be immune from current and future industry downturns, we have targeted product and market areas that we believe have the ability to offer above average industry performance over the long term.
Research and Development
We have assembled a qualified team of engineers in the United States and China with core competencies in analog and mixed-signal design. Through our research and development efforts, we have developed a collection of intellectual property and know-how that we are able to leverage across our products and markets. These include the development of high efficiency power devices, the design of precision analog circuits, expertise in mixed-signal integration and the development of proprietary semiconductor process technologies.
Our research and development efforts are generally targeted at three areas: systems architecture, circuit design and implementation, and process technology. In the area of systems architecture, we are exploring new ways of solving our customers’ system design challenges and are investing in the development of systems expertise in new markets and applications that align well with our core capabilities. In the area of circuit design and implementation, our initiatives include expanding our portfolio of products and adding new features to our products. In the area of process technology, we are investing research and development resources to provide leading-edge analog power processes for our next generation of integrated circuits. Process technology is a key strategic component to our future growth.
Our research and development expenses totaled $58.6 million, $49.7 million $48.8 million and $44.5$48.8 million for the years ended December 31, 2014, 2013 and 2012, and 2011, respectively.
Patents and Intellectual Property Matters
We rely on our proprietary technologies, which include both our proprietary circuit designs for our products and our proprietary manufacturing process technologies. Our future success and competitive position depend in part upon our ability to obtain and maintain protection of our proprietary technologies.
In general, we have elected to pursue patent protection for aspects of our circuit and device designs that we believe are patentable and to protect our manufacturing process technologies by maintaining those process technologies as trade secrets. As of December 31, 2013,2014, we had approximately 1,040 patents1,172 patents/applications issued andor pending, of which 170223 patents have been issued in the United States. Our issued patents are scheduled to expire at various times through December 2033. 2034.Our patents are material to our business, but we do not rely on any one particular patent for our success. We also rely on a combination of nondisclosure agreements and other contractual provisions, as well as our employees’ commitment to confidentiality and loyalty, to protect our technology, know-how, and processes. We also seek to register certain of our trademarks as we deem appropriate. We have not registered any of our copyrights and do not believe registration of copyrights is material to our business. Despite precautions that we take, it may be possible for unauthorized third parties to copy aspects of our current or future technology or products or to obtain and use information that we regard as proprietary. There can be no assurance that the steps we take will be adequate to protect our proprietary rights, that our patent applications will lead to issued patents, that others will not develop or patent similar or superior products or technologies, or that our patents will not be challenged, invalidated, or circumvented by others. Furthermore, the laws of the countries in which our products are or may be developed, manufactured or sold may not protect our products and intellectual property rights to the same extent as laws in the United States. Our failure to adequately protect our proprietary technologies could materially harm our business.
The semiconductor industry is characterized by frequent claims of infringement and litigation regarding patent and other intellectual property rights. For a more complete description of our legal matters, please read the section entitled Item 3 “Legal Proceedings” and Note 1013 to our consolidated financial statements. Patent infringement is an ongoing risk, in part because other companies in our industry could have patent rights that may not be identifiable when we initiate development efforts. Litigation may be necessary to enforce our intellectual property rights, and we may have to defend ourselves against infringement claims. Any such litigation could be very costly and may divert our management resources. Further, we have agreed to indemnify certain of our customers and suppliers in some circumstances against liability from infringement by our products. In the event any third party were to make an infringement claim against us or our customers, we could be enjoined from selling selected products or could be required to indemnify our customers or suppliers or pay royalties or other damages to third parties. If any of our products is found to infringe and we are unable to obtain necessary licenses or other rights on acceptable terms, we would either have to change our product so that it does not infringe or stop making the infringing product, which could have a material adverse effect on our operating results, financial condition and cash flows.
Manufacturing
We utilize a fabless business model, working with third parties to manufacture and assemble our integrated circuits. This fabless approach allows us to focus our engineering and design resources on our strengths and to reduce our fixed costs and capital expenditures. In contrast to many fabless semiconductor companies, who utilize standard process technologies and design rules established by their foundry partners, we have developed our own proprietary process technology and collaborate with our foundry partners to install our technology on their equipment in their facilities for use solely on our behalf. This close collaboration and control over the manufacturing process has historically resulted in favorable yields and product performance for our integrated circuits.
We currently contract with three suppliers to manufacture our wafers in foundries located in China. Once our silicon wafers have been produced, they are shipped to our facility in Chengdu, China for wafer sort. Our semiconductor products are then assembled and packaged by independent subcontractors in China and Malaysia. The assembled ICs are then sent for final testing primarily at our Chengdu facility prior to shipping to our customers.
In September 2004, we signed an agreement withentered into a Chinese local authority to construct alease arrangement for our manufacturing facility located in Chengdu, China, initially forChina. We have the testing of our ICs. Pursuant to this agreement, we agreed to contribute capital in the form of cash, in-kind assets, and intellectual property, of at least $5.0 million to our wholly-owned Chinese subsidiary as the registered capital for the subsidiary and have exercised the option to purchase land use rights for the facility for approximately $0.2 million. Following the initial five-year lease term, we now have an option to acquire the facility in Chengdu for approximately $1.8$1.6 million which consists of total construction costs incurred minus total rent paid by us during the lease term. This option became exercisable in March 2011. We will likelymay exercise our purchase option and enter into a purchase agreement for this facility in the future. The facility has been fully operational since 2006 and we have benefitted from shorter manufacturing cycle times and lower labor and overhead costs. We have expanded our product testing capabilities in our China facility and are able to take advantage of the rich pool of local engineering talent to expand our manufacturing support and engineering operations. We
In addition, we constructed a 150,000 square footsquare-foot research and development facility in Chengdu, China which was put into operation in October 2010.
Key Personnel and Employees
Our performance is substantially dependent on the performance of our executive officers and key employees. Due to the relative complexity of the design of our analog and mixed-signal ICs, our engineers generally have more years of experience and greater circuit design aptitude than the more prevalent digital circuit design engineer. Analog engineers with advanced skills are limited in number and difficult to replace. The loss of the services of key officers, managers, engineers and other technical personnel would materially harm our business. Our future success will depend, in part, on our ability to attract, train, retain, and motivate highly qualified technical and managerial personnel. We may not be successful in attracting and retaining such personnel. Our employees are not represented by a collective bargaining organization, and we have never experienced a work stoppage or strike. Our management considers employee relations to be good. As of December 31, 2013,2014, we employed 1,1051,178 employees located in the United States, Taiwan, China, Japan, Korea, Europe and Singapore.
Competition
The analog and mixed-signal semiconductor industry is highly competitive, and we expect competitive pressures to continue. Our ability to compete effectively and to expand our business will depend on our ability to continue to recruit both applications engineering and design engineering personnel, our ability to introduce new products, and our ability to maintain the rate at which we introduce these new products. Our industry is characterized by decreasing unit selling prices over the life of a product. We compete with domestic and international semiconductor companies, many of which have substantially greater financial and other resources with which to pursue engineering, manufacturing, marketing, and distribution of their products. We are in direct and active competition, with respect to one or more of our product lines, with at least 10 manufacturers of such products, of varying size and financial strength. The number of our competitors has grown due to expansion of the market segments in which we participate. We consider our primary competitors to include Analog Devices, Fairchild Semiconductor, International Rectifier, Intersil Corporation, Linear Technology, Maxim Integrated Products, Micrel Inc., Microchip Technology, Microsemi Corporation, O2MicroO2 Micro International, ON Semiconductor, Power Integrations, Inc., Richtek Technology Corporation, Rohm Co., Ltd., Semtech Corporation, STMicroelectronics N.V., and Texas Instruments.Instruments Incorporated.
We expect continued competition from existing competitors as well as competition from new entrants into the semiconductor market. We believe that we are competitive in the markets in which we sell, particularly because our ICs typically are smaller in size, are highly integrated, possess higher levels of power management functionalities and achieve high performance specifications at lower price points than most of our competition. However, we cannot assure you that our products will continue to compete favorably or that we will be successful in the face of increasing competition from new products and enhancements introduced by existing competitors or new companies entering this market.
Geographical and Segment Information
Please refer to the geographical and segment information for each of the last three fiscal years in Note 1316 to our consolidated financial statements.
Please refer to the discussion of risks related to our foreign operations in the section entitled “Item 1A: Risk Factors”.Factors.”
Available Information
We were incorporated in California in 1997 and reincorporated in Delaware in November 2004. Our executive offices are located at 79 Great Oaks Boulevard, San Jose CA 95119. Our telephone number is (408) 826-0600. Our e-mail address is investors@monolithicpower.com, and our website is www.monolithicpower.com. Our Annual Reports on Form 10-K, Quarterly Reports on Form 10-Q, current reports on Form 8-K, and amendments to those filed or furnished pursuant to Sections 13(a) or 15(d) of the Securities Exchange Act of 1934, as amended, are available free of charge. TheseThey may be obtained from our website as soon as reasonably practicable after we electronically file such material with, or furnish it to, the Securities and Exchange Commission, or at the SEC website at www.sec.gov. Information contained on our website is not a part of this Annual Report on Form 10-K.
Executive Officers of the Registrant
Information regarding our executive officers as of February 28, 20142015 is as follows:
Name | Age | Position | |||
Michael R. Hsing |
| 55 | President, | ||
Meera P. Rao |
| 54 | CFO and Principal Financial and Accounting Officer | ||
Deming Xiao |
| 52 | President of Asia Operations | ||
Maurice Sciammas |
| 55 | Senior Vice President of Worldwide Sales and Marketing | ||
Saria Tseng |
| 44 | Vice President, Strategic Corporate Development, General Counsel and Corporate Secretary | ||
Michael R. Hsing has served on our board of directors and has served as our President and Chief Executive Officer since founding Monolithic Power SystemsMPS in August 1997. Before founding our company,MPS, Mr. Hsing held senior technical positions at companies such as Supertex, Inc. and Micrel, Inc. Mr. Hsing is an inventor on numerous patents related to the process development of bipolar mixed-signal semiconductor manufacturing. Mr. Hsing holds a B.S.E.E. from the University of Florida.
Meera P. Raohas served as our Chief Financial Officer since January 2011. Ms. Rao joined us in January 2009 and served as our Vice President of Finance and Corporate Controller. Prior to joining MPS, she was the principal in her own consulting practice, working with various semiconductor companies, including MPS, where she set up our business operations in Chengdu, China in 2006. Ms. Rao has more than 20 years of experience with semiconductor and high technology companies and has held various senior executive positions, including CFO of Integration Associates, Vice President of Finance and Interim CFO at Atrica, Vice President of Finance at Raza Foundries, Corporate Controller and Interim CFO at nVIDIA, as well as various positions at Advanced Micro Devices. Ms. Rao is a CPA and holds an MBA from the University of Rochester.
Maurice Sciammas currently serveshas served as our Senior Vice President of Worldwide Sales and Marketing a position he has had since 2007. Mr. Sciammas joined the CompanyMPS in July 1999 and served as Vice President of Products and Vice President of Sales (excluding greater China) until he was appointed to his current position. Before joining the Company,MPS, he was Director of IC Products at Supertex from 1990 to 1999. He has also held positions at Micrel, Inc. He holds a B.S.E.E. degree from San Jose State University.
Deming Xiao has served as our President of Asia Operations since January 2008. Since joining us in May 2001, Mr. Xiao has held several executive positions, including Foundry Manager and Senior Vice President of Operations. Before joining us, from June 2000 to May 2001, Mr. Xiao was Engineering Account Manager at Chartered Semiconductor Manufacturing, Inc. Prior to that, Mr. Xiao spent 6six years as the Manager of Process Integration Engineering at Fairchild Imaging Sensors. Mr. Xiao holds a B.S. in Semiconductor Physics from Sichuan University, Chengdu, China and an M.S.E.E. from Wayne State University.
Saria Tsenghas served as our Vice President, General Counsel and Corporate Secretary since 2004 and additionally as our Vice President, Strategic Corporate Development since 2009. Ms. Tseng joined the CompanyMPS from MaXXan Systems, Inc. where she was Vice President and General Counsel from 2001 to 2004. Previously, Ms. Tseng was an attorney at Gray Cary Ware & Freidenrich, LLP and Jones, Day, Reavis & Pogue. Ms. Tseng is a member of the state bar in both California and New York and is a member of the bar association of the Republic of China (Taiwan). She holds Masters of Law degrees from the University of California at Berkeley and the Chinese Culture University in Taipei.
ITEM 1A. RISK FACTORS
Our business involves risks and uncertainties. You should carefully consider the risks described below, together with all of the other information in this Annual Report on Form 10-K and other filings with the Securities and Exchange Commission in evaluating our business. If any of the following risks actually occur, our business, financial condition, operating results, and growth prospects would likely be materially and adversely affected. In such an event, the trading price of our common stock could decline, and you could lose all or part of your investment in our common stock. Our past financial performance should not be considered to be a reliable indicator of future performance, and investors should not use historical trends to anticipate results or trends in future periods. These risks involve forward-looking statements and our actual results may differ substantially from those discussed in these forward-looking statements.
The future trading price of our common stock could be subject to wide fluctuations in response to a variety of factors.
The future trading price of our common stock is likely to be highly volatile and could be subject to wide fluctuations in response to various factors, many of which are beyond our control, including:
our results of operations and financial performance;
general economic, industry and market conditions worldwide;
our ability to outperform the market, and outperform at a level that meets or exceeds our investors’ expectations;
whether our forward guidance meets the expectations of our investors;
the depth and liquidity of the market for our common stock;
developments generally affecting the semiconductor industry;
commencement of or developments relating to our involvement in litigation;
investor perceptions of us and our business strategies;
changes in securities analysts’ expectations or our failure to meet those expectations;
actions by institutional or other large stockholders;
terrorist acts or acts of war;
actual or anticipated fluctuations in our results of operations;
developments with respect to intellectual property rights;
announcements of technological innovations or significant contracts by us or our competitors;
• | actual or anticipated manufacturing capacity limitations; | |
• | developments with respect to intellectual property rights; |
introduction of new products by us or our competitors;
our sale of common stock or other securities in the future;
conditions and trends in technology industries;
| • |
|
| • | our loss of key customers; |
changes in market valuation or earnings of our competitors;
any mergers, acquisitions or divestitures of assets undertaken by us;
government debt default;
our ability to develop new products, enter new market segments, gain market share, manage litigation risk, diversify our customer base and successfully secure manufacturing capacity;
• • | our ability to increase our gross margins; market reactions to guidance from other semiconductor companies or | |
| • |
|
| our ability to |
our ability to increase our gross margins; and
changes in the estimation of the future size and growth rate of our markets.
In addition, the stock market in general often experiences substantial volatility that is seemingly unrelated to the operating performance of particular companies. These broad market fluctuations may adversely affect the trading price of our common stock.
We expect our operating results to fluctuate from quarter to quarter and year to year, which may make it difficult to predict our future performance and could cause our stock price to decline and be volatile.
Our revenue, expenses, and results of operations are difficult to predict, have varied significantly in the past and will continue to fluctuate significantly in the future due to a number of factors, many of which are beyond our control. We expect fluctuations to continue for a number of reasons, including:
changes in general demand for electronic products as a result of worldwide macro-economic conditions;
changes in business conditions at our distributors, value-added resellers and/or end-customers;
changes in general economic conditions in the countries where our products are sold or used;
the timing of developments and related expenses in our litigation matters;
the possibilityloss of lost business as a result ofkey customers or our inability to attract new customers due to customer and prospective customer concerns about being litigation targets;
continued dependence on our turns business (orders received and shipped within the same fiscal quarter);
continued dependence on the Asian markets for our customer base;
increases in assembly costs due to commodity price increases, such as the price of gold;
the timing of new product introductions by us and our competitors;
changes in our revenue mix between OEMs, ODMs, distributors and value-added resellers;
changes in product mix, product returns, and actual and potential product liability;
the acceptance of our new products in the marketplace;
our ability to develop new process technologies and achieve volume production;
our ability to meet customer product demand in a timely manner;
the scheduling, rescheduling, or cancellation of orders by our customers;
the cyclical nature of demand for our customers’ products;
the fluctuations in our estimate for stock rotation reserves;
our ability to manage our inventory levels, including the levels of inventory held by our distributors;
inventory levels and product obsolescence;
seasonality and variability in the storage and computing, consumer electronics, and communications markets;
the availability of adequate manufacturing capacity from our outside suppliers;
increases in prices for finished wafers due to general capacity shortages;
the potential loss of future business resulting from capacity issues;
changes in manufacturing yields;
movements in exchange rates, interest rates or tax rates; and
accounting charges resulting from equity awards granted to our employees.
Due to the factors noted above and other risks described in this section, many of which are beyond our control, you should not rely on quarter-to-quarter or year-over-year comparisons to predict our future financial performance. Unfavorable changes in any of the above factors may seriously harm our business and results of operations, and may cause our stock price to decline and be volatile.
Our business has been and may continue to be significantly impacted by worldwide economic conditions and uncertainty in the outlook for the global economy makes it more likely that our actual results will differ materially from expectations.
GlobalIn recent years, global credit and financial markets have experienced disruptions, and may continue to experience disruptions in the future, including diminished liquidity and credit availability, declines in consumer confidence, declines in economic growth, increases in unemployment rates, and continued uncertainty about economic stability. These economic uncertainties affect businesses such as ours in a number of ways, making it difficult to accurately forecast and plan our future business activities. The continued or further tightening of credit in financial markets may lead consumers and businesses to postpone spending, which may cause our customers to cancel, decrease or delay their existing and future orders with us. In addition, financial difficulties experienced by our suppliers or distributors could result in product delays, increased accounts receivable defaults and inventory challenges. The volatilityVolatility in the credit markets hascould severely diminisheddiminish liquidity and capital availability. Demand for consumer electronics is a function of the health of the economies in the United States, JapanEurope, China and aroundthe rest of the world. We cannot predict the timing, strength or duration of any economic disruption or subsequent economic recovery, worldwide, in the United States, in our industry, or in the consumer electronics market. These and other economic factors have had and may continue to have a material adverse effect on demand for our products and on our financial condition and operating results.
We may not be profitable on a quarterly or annual basis.
Our profitability is dependent on many factors, including:
our sales, which because of our turns business (i.e., orders received and shipped within the same fiscal quarter), are difficult to accurately forecast;
consumer electronic sales, which have experienced a downturn as a result of the worldwide economic crisis;
the cancellation or rescheduling of our customers’ orders, which may occur without significant penalty to our customers;
changes in general demand for electronic products as a result of worldwide macro-economic conditions;
changes in revenue mix between OEMs, ODMs, distributors and value-added resellers;
changes in product mix and actual and potential product liability;
changes in revenue mix between end market segments (i.e. communication, storage and computing, consumer and industrial);
our competition, which could adversely impact our selling prices and our potential sales;
our manufacturing costs, including our ability to negotiate with our vendors and our ability to efficiently run our test facility in China;
manufacturing capacity constraints;
settlements of tax audits;
stock-based compensation accounting charges; and
our operating expenses, including general and administrative expenses, selling and marketing expenses, and research and development expenses relating to products that will not be introduced and will not generate revenue until later periods, if at all.
We may not achieve profitability on a quarterly or annual basis in the future. Unfavorable changes in our operations, including any of the factors noted above, may have a material adverse effect on our quarterly or annual profitability. For example, due to product shortages early in 2010, several major customers in Korea sought alternative suppliers, which impacted our revenue particularly in 2011 and may continue to impact our revenue sources and growth in future periods.
We may not experience growth rates comparable to past years.
In the past, our revenue increased significantly in certain years due to increased sales of certain of our products. Due to various factors, including increased competition, loss of certain of our customer base,customers, unfavorable changes in our operations, reduced global electronics demand, end-customer market downturn, market acceptance and penetration of our current and future products and ongoing litigation, we may not experience growth rates comparable to past periods, which could materially and adversely affect our stock price and results of operations.
We may be unsuccessful in developing and selling new products with margins similar to or better than what we have experienced in the past, which would impact our overall gross margin and financial performance.
Our success depends on products that are differentiated in the market, which result in gross margins that have historically been above the industry averages. Should we fail to improve our gross margin in the future, and accordingly develop and introduce sufficiently differentiated products that result in higher gross margins than industry averages, our financial condition and results of operations could be materially and adversely affected.
The highly cyclical nature of the semiconductor industry, which has produced significant and sometimes prolonged downturns, could materially adversely affect our operating results, financial condition and cash flows.
Historically, the semiconductor industry has been highly cyclical and, at various times, has experienced significant downturns and wide fluctuations in supply and demand. These conditions have caused significant variances in product demand and production capacity, as well as rapid erosion of average selling prices. The industry may experience severe or prolonged downturns in the future, which could result in downward pressure on the price of our products as well as lower demand for our products. Because significant portions of our expenses are fixed in the short term or incurred in advance of anticipated sales, we may not be able to decrease our expenses in a timely manner to offset any sales shortfall. These conditions could have a material adverse effect on our operating results, financial condition and cash flows.
If demand for our products declines in the major end markets that we serve, our revenue will decrease and our results of operations and financial condition would be materially and adversely affected.
We believe that the application of our products in the storage and computer, consumer electronics, communications and industrial markets will continue to account for the majority of our revenue. If the demand for our products declines in the major end markets that we serve, our revenue will decrease and our results of operations and financial condition would be materially and adversely affected. In addition, as technology evolves, the ability to integrate the functionalities of various components, including our discrete semiconductor products, onto a single chip and/or onto other components of systems containing our products increases. Should our customers require integrated solutions that we do not offer, demand for our products could decrease, and our business and results of operations would be materially and adversely affected.
We may be unsuccessful in developing and selling new products or in penetrating new markets required to maintain or expand our business.
Our competitiveness and future success depend on our ability to design, develop, manufacture, assemble, test, market, and support new products and enhancements on a timely and cost-effective basis. A fundamental shift in technologies in any of our product markets could have a material adverse effect on our competitive position within these markets. Our failure to timely develop new technologies or to react quickly to changes in existing technologies could materially delay our development of new products, which could result in product obsolescence, decreased revenue, and/or a loss of market share to competitors.
As we develop new product lines, we must adapt to market conditions that are unfamiliar to us, such as competitors and distribution channels that are different from those we have known in the past. Some of our new product lines require us to re-equip our labs to test parameters we have not tested in the past. If we are unable to adapt rapidly to these new and additional conditions, we may not be able to successfully penetrate new markets.
The success of a new product depends on accurate forecasts of long-term market demand and future technological developments, as well as on a variety of specific implementation factors, including:
timely and efficient completion of process design and device structure improvements;
timely and efficient implementation of manufacturing, assembly, and test processes;
the ability to secure and effectively utilize fabrication capacity in different geometries;
product performance;
product availability;
product quality and reliability; and
effective marketing, sales and service.
To the extent that we fail to timely introduce new products or to quickly penetrate new markets, our revenue and financial condition could be materially adversely affected.
We derive most of our revenue from direct or indirect sales to customers in Asia and have significant operations in Asia, which may expose us to political, cultural, regulatory, economic, foreign exchange, and operational risks.
We derive most of our revenue from customers located in Asia through direct sales or indirect sales through distribution arrangements and value-added reseller agreements with parties located in Asia. As a result, we are subject to increased risks due to this geographic concentration of business and operations. For the year ended December 31, 2013,2014, approximately 90%91% of our revenue was from customers in Asia. There are risks inherent in doing business in Asia, and internationally in general, including:
changes in, or impositions of, legislative or regulatory requirements, including tax laws in the United States and in the countries in which we manufacture or sell our products;
trade restrictions, including restrictions imposed by the United States on trading with parties in foreign countries;
currency exchange rate fluctuations impacting intra-company transactions;
transportation delays;
changes in tax regulations in China that may impact our tax status in Chengdu;
multi-tiered distribution channels that lack visibility to end customer pricing and purchase patterns;
international political relationships and threats of war;
terrorism and threats of terrorism;
epidemics and illnesses;
work stoppages and infrastructure problems due to adverse weather conditions or natural disasters;
work stoppages related to employee dissatisfaction;
economic, social and political instability;
changes in import/export regulations, tariffs, and freight rates;
longer accounts receivable collection cycles and difficulties in collecting accounts receivables;
enforcing contracts generally; and
less effective protection of intellectual property and contractual arrangements.
If we fail to expand our customer base and significantly reduce the geographic concentration of our customers, we will continue to be subject to the foregoing risks, which could materially and adversely affect our revenue and financial condition.
We depend on a limited number of customers for a significant percentage of our revenue.
Historically, we have generated most of our revenue from a limited number of customers. For example, as a result of consolidations in recent years among distributors, sales to our largest distributor accounted for approximately 32%26% of our total revenue for the year ended December 31, 2013.2014. We continue to rely on a limited number of customers for a significant portion of our revenue. Because we rely on a limited number of customers for significant percentages of our revenue, a decrease in demand for our products from any of our major customers for any reason (including due to market conditions, catastrophic events or otherwise) could have a materially adverse impact on our financial conditions and results of operations.
We are subject to anti-corruption laws in the jurisdictions in which we operate, including the U.S. Foreign Corrupt Practices Act, or the FCPA. Our failure to comply with these laws could result in penalties which could harm our reputation and have a material adverse effect on our business, results of operations and financial condition.
We are subject to the FCPA, which generally prohibits companies and their intermediaries from making improper payments to foreign officials for the purpose of obtaining or keeping business and/or other benefits, along with various other anti-corruption laws. Although we have implemented policies and procedures designed to ensure that we, our employees and other intermediaries comply with the FCPA and other anti-corruption laws to which we are subject, there is no assurance that such policies or procedures will work effectively all of the time or protect us against liability under the FCPA or other laws for actions taken by our employees and other intermediaries with respect to our business or any businesses that we may acquire. We have significant operations in Asia, which places us in frequent contact with persons who may be considered “foreign officials” under the FCPA, resulting in an elevated risk of potential FCPA violations. If we are not in compliance with the FCPA and other laws governing the conduct of business with government entities (including local laws), we may be subject to criminal and civil penalties and other remedial measures, which could have an adverse impact on our business, financial condition, results of operations and liquidity. Any investigation of any potential violations of the FCPA or other anti-corruption laws by U.S. or foreign authorities could harm our reputation and have an adverse impact on our business, financial condition and results of operations.
We receive a significant portion of our revenue from distribution arrangements, value-added resellers and direct customers, and the loss of any one of these distributors, value-added resellers or direct customers or failure to collect a receivable from them could adversely affect our operations and financial position.
We market our products through distribution arrangements and value-added resellers and through our direct sales and applications support organization to customers that include OEMs, ODMs and electronic manufacturing service providers.EMSs. Receivables from our customers are generally not secured by any type of collateral and are subject to the risk of being uncollectible. As a result of consolidations in recent years among distributors, salesSales to our largest distributor accounted for approximately 32%26% of our total revenue for the year ended December 31, 2013.2014. Significant deterioration in the liquidity or financial condition of any of our major customers or any group of our customers could have a material adverse impact on the collectability of our accounts receivable and our future operating results. We primarily conduct our sales on a purchase order basis, and we do not have any long-term supply commitments.
Moreover, we believe a high percentage of our products are eventually sold to a number of OEMs. Although we communicate with OEMs in an attempt to achieve “design wins,” which are decisions by OEMs and/or ODMs to incorporate our products, we do not have purchase commitments from these end users. Therefore, there can be no assurance that the OEMs and/or ODMs will continue to incorporate our ICs into their products. OEM technical specifications and requirements can change rapidly, and we may not have products that fit new specifications from an end-customer for whom we have had previous design wins. We cannot be certain that we will continue to achieve design wins from large OEMs, that our direct customers will continue to be successful in selling to the OEMs, or that the OEMs will be successful in selling products which incorporate our ICs. The loss of any significant customer, any material reduction in orders by any of our significant customers or by their OEM customers, the cancellation of a significant customer order, or the cancellation or delay of a customer’s or OEM’s significant program or product could reduce our revenue and adversely affect our results of operations and financial condition.
Due to the nature of our business as a component supplier, we may have difficulty both in accurately predicting our future revenue and appropriately managing our expenses.
Because we provide components for end products and systems, demand for our products is influenced by our customers’ end product demand. As a result, we may have difficulty in accurately forecasting our revenue and expenses. Our revenue depends on the timing, size, and speed of commercial introductions of end products and systems that incorporate our products, all of which are inherently difficult to forecast, as well as the ongoing demand for previously introduced end products and systems. In addition, demand for our products is influenced by our customers’ ability to manage their inventory. Our sales to distributors are subject to higher volatility because they service demand from multiple levels of the supply chain which, in itself, is inherently difficult to forecast. If our customers, including distributors, do not manage their inventory correctly or misjudge their customers’ demand, our shipments to and orders from our customers may vary significantly on a quarterly basis.
Our ability to increase product sales and revenue may be constrained by the manufacturing capacity of our suppliers.
Although we provide our suppliers with rolling forecasts of our production requirements, their ability to provide wafers to us is limited by the available capacity, particularly capacity in the geometries we require, at the facilities in which they manufacture wafers for us. As a result, this lack of capacity has at times constrained our product sales and revenue growth. In addition, an increased need for capacity to meet internal demands or demands of other customers could cause our suppliers to reduce capacity available to us. Our suppliers may also require us to pay amounts in excess of contracted or anticipated amounts for wafer deliveries or require us to make other concessions in order to acquire the wafer supply necessary to meet our customer requirements. If our suppliers extend lead times, limit supplies or the types of capacity we require, or increase prices due to capacity constraints or other factors, our revenue and gross margin may materially decline. In addition, if we experience supply delays or limitations, our customers may reduce their purchase levels with us and/or seek alternative solutions to meet their demand, which could materially and adversely impact our business and results of operations. For example, due to lack of capacity, which resulted in product shortages in 2010, several major customers in Korea sought alternative suppliers, which impacted our revenue particularly in 2011 and may continue to impact our revenue sources and growth in future periods.
We currently depend on third-party suppliers to provide us with wafers for our products. If any of our wafer suppliers become insolvent or capacity constrained and are unable and/or fail to provide us sufficient wafers at acceptable yields and at anticipated costs, our revenue and gross margin may decline or we may not be able to fulfill our customer orders.
We have a supply arrangement with certain suppliers for the production of wafers. Should any of our suppliers become insolvent or capacity constrained, we may not be able to fulfill our customer orders, which would likely cause a decline in our revenue.
While certain aspects of our relationship with these suppliers are contractual, many important aspects of this relationship depend on our suppliers’ continued cooperation and our management of relationships. In addition, the fabrication of ICs is a highly complex and precise process. Problems in the fabrication process can cause a substantial percentage of wafers to be rejected or numerous ICs on each wafer to be non-functional. This could potentially reduce yields. The failure of our suppliers to supply us wafers at acceptable yields could prevent us from fulfilling our customer orders for our products and would likely cause a decline in our revenue.
Further, as is common in the semiconductor industry, our customers may reschedule or cancel orders on relatively short notice. Under our agreement with our suppliers, we have an option to order wafers based on a committed forecast that can cover a period of one to six months. If our customers cancel orders after we submit a committed forecast to our suppliers for the corresponding wafers, we may be required to purchase wafers that we may not be able to resell, which would adversely affect our operating results, financial condition, and cash flows.
We might not be able to deliver our products on a timely basis if our relationships with our assembly and test subcontractors are disrupted or terminated.
We do not have direct control over product delivery schedules or product quality because all of our products are assembled by third-party subcontractors and a portion of our testing is currently performed by third-party subcontractors. Also, due to the amount of time typically required to qualify assembly and test subcontractors, we could experience delays in the shipment of our products if we were forced to find alternate third parties to assemble or test our products. In addition, events such as the recent global economic crisis may materially impact our assembly suppliers’ ability to operate. Any future product delivery delays or disruptions in our relationships with our subcontractors could have a material adverse effect on our operating results, financial condition, and cash flows.
There may be unanticipated costs associated with adding to or supplementing our third-party suppliers’ manufacturing capacity.
We anticipate that future growth of our business will require increased manufacturing capacity on the part of third-party supply foundries, assembly shops, and testing facilities for our products. In order to facilitate such growth, we may need to enter into strategic transactions, investments and other activities. Such activities are subject to a number of risks, including:
the costs and expense associated with such activities;
the availability of modern foundries to be developed, acquired, leased or otherwise made available to us or our third-party suppliers;
the ability of foundries and our third-party suppliers to obtain the advanced equipment used in the production of our products;
delays in bringing new foundry operations online to meet increased product demand; and
unforeseen environmental, engineering or manufacturing qualification problems relating to existing or new foundry facilities.
These and other risks may affect the ultimate cost and timing of any expansion of our third-party suppliers’ capacity.
We purchase inventory in advance based on expected demand for our products, and if demand is not as expected, we may have insufficient or excess inventory, which could adversely impact our financial position.
As a fabless semiconductor company, we purchase our inventory from third party manufacturers in advance of selling our product. We place orders with our manufacturers based on existing and expected orders from our customers for particular products. While most of our contracts with our customers and distributors include lead time requirements and cancellation penalties that are designed to protect us from misalignment between customer orders and inventory levels, we must nonetheless make some predictions when we place orders with our manufacturers. In the event that our predictions are inaccurate due to unexpected increases in orders or unavailability of product within the timeframe that is required, we may have insufficient inventory to meet our customer demands. In the event that we order products that we are unable to sell due to a decrease in orders, unexpected order cancellations, injunctions due to patent litigations, or product returns, we may have excess inventory which, if not sold, may need to be disposed of or would result in a decrease in our revenue in future periods as the excess inventory at our distributors is sold. If any of these situations were to arise, it could have a material impact on our business and financial position.
The outcome of currently ongoing and future examinations of our income tax returns by the IRS and foreign tax authorities could have a material adverse effect on our results of operations.
We are subject to examination of our income tax returns by the IRS and other tax authorities. Our U.S. Federal income tax returns for the years ended December 31, 2005 through December 31, 2007 are under examination by the IRS. In April 2011, we received from the IRS a Notice of Proposed Adjustment, or "NOPA", relating to a cost-sharing agreement entered into by us and our international subsidiaries on January 1, 2004. In the NOPA, the IRS objected to our allocation of certain litigation expenses between us and our international subsidiaries and the amount of "buy-in payments" made by our international subsidiaries to us in connection with the cost-sharing agreement, and proposed to increase our U.S. taxable income according to a few alternative methodologies. In February 2012, we received a revised NOPA from the IRS (Revised NOPA). In this Revised NOPA, the IRS raised the same issues as in the NOPA issued in April 2011 but under a different methodology. Under the Revised NOPA, the largest potential federal income tax adjustment,payment, if the IRS were to prevail on all matters in dispute, is $10.5 million, plus interest and penalties, if any. We responded to the IRS Revised NOPA in May 2012. As ofIn June 2013, the IRS has responded and continuescontinued to disagree with our rebuttal. We took the issue tomet with the IRS Office of Appeals in 2014, had additional discussions again in 2015, and both parties have an appointed datebeen in March 2014. continuous discussions for a resolution of the matter. However, there is no guarantee these discussions will be conclusive.Meanwhile, we agreed to grant the IRS an extension of the statute of limitations for taxable years 2005 through 2007 to December 31, 2014. September 30, 2015.
The IRS also audited the research and development credits carried forward into year 2005 and the credits generated in the years 2005 through 2007. We received a NOPA from the IRS in February 2011, proposing to reduce the research and development credits generated in yearyears 2005 through 2007 and the carryforwards, which would then reduce the value of such credits carried forward to subsequent tax years.
We have reviewed and responded to the above proposed adjustments. We regularly assess the likelihood of an adverse outcome resulting from such examinations to determine the adequacy of our provision for income taxes. Based on the technical merits of our tax return filing positions and the interactions to date with the IRS, we believe that it is more likely than not that the benefit of such positions will be sustained upon the resolution of ourthese audits resulting in no significantwill not have a material impact on our consolidated financial position and the results of operations and cash flows.
Changes in effective tax rates or adverse outcomes resulting from examination of our income tax returns could adversely affect our results.
Our future effective tax rates could be adversely affected by earnings being lower than anticipated in countries where we have lower statutory rates and higher than anticipated in countries where we have higher statutory rates, by changes in the valuation of our deferred tax assets and liabilities, or by changes in tax laws, regulations, accounting principles or interpretations thereof and discrete items such as future exercises or dispositions of stock options and restricted stock releases. In addition, we are subject to the continuous examination of our income tax returns by the IRS and other tax authorities. We regularly assess the likelihood of adverse outcomes resulting from these examinations to determine the adequacy of our provision for income taxes. There can be no assurance that the outcomes from these continuous examinations will not have an adverse effect on our operating results and financial condition.
The complexity of calculating our tax provision may result in errors that could result in restatements of our financial statements.
Due to the complexity associated with the calculation of our tax provision, we have hired independent tax advisors to assist us in the calculation. If we or our independent tax advisors fail to resolve or fully understand certain issues that we may have had in the past and issues that may arise in the future, we could be subject to errors, which would result in us having to restate our financial statements. For example, because of the complexity of our tax structure, we have had errors in our financial statements in the calculation of our tax provision that previously resulted in restatements of our prior year financial results. Restatements are generally costly and could adversely impact our results of operations and/or have a negative impact on the trading price of our common stock.
If we are unsuccessful in legal proceedings brought against us or any of our customers, we could be prevented from selling many of our products and/or be required to pay substantial damages. An unfavorable outcome or an additional award of damages, attorneys’ fees or an injunction could cause our revenue to decline significantly and could severely harm our business and operating results.
From time to time we are party to various legal proceedings. If we are not successful in litigation that could be brought against us or our customers, we could be ordered to pay monetary fines and/or damages. If we are found liable for willful patent infringement, damages could be doubled or tripled.significant. We and/or our customers could also be prevented from selling some or all of our products. Moreover, our customers and end-users could decide not to use our products, and our products and our customers’ accounts payable to us could be seized. Finally, interim developments in these proceedings could increase the volatility in our stock price as the market assesses the impact of such developments on the likelihood that we will or will not ultimately prevail in these proceedings.
Given our inability to control the timing and nature of significant events in our legal proceedings that either have arisen or may arise, our legal expenses are difficult to forecast and may vary substantially from our publicly-disclosed forecasts with respect to any given quarter, which could contribute to increased volatility in our stock price and financial condition.
Historically, we have incurred significant expenses in connection with various legal proceedings that vary with the level of activity in the proceeding. It is difficult for us to forecast our legal expenses for any given quarter, which adversely affects our ability to forecast our expected results of operations in general. We may also be subject to unanticipated legal proceedings, which would result in our incurrence of unexpected legal expenses. If we fail to meet the expectations of securities or industry analysts as a result of unexpected changes in our legal expenses, our stock price could be impacted.
Future legal proceedings may divert our financial and management resources.
The semiconductor industry is characterized by frequent claims of infringement and litigation regarding patent and other intellectual property rights. Patent infringement is an ongoing risk, in part because other companies in our industry could have patent rights that may not be identifiable when we initiate development efforts. Litigation may be necessary to enforce our intellectual property rights, and we may have to defend ourselves against additional infringement claims. Such litigation is very costly. In the event any third party makes a new infringement claim against us or our customers, we could incur additional ongoing legal expenses. In addition, in connection with these legal proceedings, we may be required to post bonds to defend our intellectual property rights in certain countries for an indefinite period of time, until such dispute is resolved. If our legal expenses materially increase or exceed anticipated amounts, our capital resources and financial condition could be adversely affected. Further, if we are not successful in any of our intellectual property defenses, our financial condition could be adversely affected and our business could be harmed. In addition, our management team may also be required to devote a great deal of time, effort and energy to these legal proceedings, which could divert management’s attention from focusing on our operations and adversely affect our business.
We will continue to vigorously defend and enforce our intellectual property rights around the world, especially as it relates to patent litigation.
From time to time, we are faced with having to defend our intellectual property rights throughout the world. Should we become engaged in such proceedings, it could divert management’s attention from focusing on and implementing our business strategy. Further, should we not be successful in any of our intellectual property enforcement actions, our revenue may be affected and our business could be harmed.
Failure to protect our proprietary technologies or maintain the right to certain technologies may negatively affect our ability to compete.
We rely heavily on our proprietary technologies. Our future success and competitive position depend in part upon our ability to obtain and maintain protection of certain proprietary technologies used in our products. We pursue patents for some of our new products and unique technologies, and we also rely on a combination of nondisclosure agreements and other contractual provisions, as well as our employees’ commitment to confidentiality and loyalty, to protect our technology, know-how, and processes. Despite the precautions we take, it may be possible for unauthorized third parties to copy aspects of our current or future technologytechnologies or products or to obtain and use information that we regard as proprietary. We intend to continue to protect our proprietary technology,technologies, including through patents. However, there can be no assurance that the steps we take will be adequate to protect our proprietary rights, that our patent applications will lead to issued patents, that others will not develop or patent similar or superior products or technologies, or that our patents will not be challenged, invalidated, or circumvented by others. Furthermore, the laws of the countries in which our products are or may be developed, manufactured, or sold may not protect our products and intellectual property rights to the same extent as laws in the United States. Our failure to adequately protect our proprietary technologies couldwould materially harm our business.
The downgrade of the credit rating for U.S. long-term sovereign debt and that of certain Eurozone countries could affect global and domestic financial markets, which may affect our business, financial condition and liquidity.
Although a downgrade of long-term sovereign credit ratings is not unprecedented, a downgrade of the U.S. credit rating is, and the potential impact is uncertain. Management will continue to monitor the situation and there could be future changes in capital requirements or a rebalancing of investment portfolios in response to management’s assessment of the related risk weightings. At this time, however, U.S. treasuries continue to trade in active markets, and the yield curve on U.S. treasuries remains an appropriate basis for determining risk-free rates.
Should there be a deterioration of the global and financial markets as a result of the downgraded credit rating for U.S. long-term sovereign debt, and that of certain Eurozone countries, our business, financial condition and liquidity could be adversely affected.
The market for government-backed student loan auction-rate securities has suffered a decline in liquidity which may impact the liquidity and potential value of our investment portfolio.
The market for government-backed student loan auction-rate securities with interest rates that reset through a Dutch auction every 7 to 35 days became illiquid in 2008. We experienced our first failed auction in mid-February 2008. Since 2008, we have redeemed 87% of the original portfolio at par. At December 31, 2013, $10.32014, $5.6 million of our auction-rate security investments have failed to reset through successful auctions and it is unclear as to when these investments will regain their liquidity. The underlying maturity of these auction-rate securities is up to 3533 years.
We recorded temporary and other-than-temporary impairment charges on these investments. The valuation is subject to fluctuations in the future, which will depend on many factors, including the quality of underlying collateral, estimated time for liquidity including potential to be called or restructured, underlying final maturity, insurance guaranty and market conditions, among others.
Should there be further deterioration in the market for auction-rate securities, the value of our portfolio may decline, which may have an adverse impact on our cash position and our earnings. If the accounting rules for these securities change, there may be an adverse impact on our earnings.
We face risks in connection with our internal control over financial reporting.
Effective internal control over financial reporting is necessary for us to provide reliable and accurate financial reports. If we cannot provide reliable financial reports or prevent fraud or other financial misconduct, our business and operating results could be harmed. Our failure to implement and maintain effective internal control over financial reporting could result in a material misstatement of our financial statements or otherwise cause us to fail to meet our financial reporting obligations. This, in turn, could result in a loss of investor confidence in the accuracy and completeness of our financial reports, which could have an adverse effect on our results of operations and/or have a negative impact on the trading price of our common stock, and could subject us to stockholder litigation. For example, because of the complexity of our tax structure, we have had errors in our financial statements in the calculation of our tax provision that previously resulted in restatements of our prior year financial results. Although we believe that we have implemented appropriate internal control over financial reporting related to the computation of our income tax provision, we cannot be certain that any measures we have taken or may take in the future will ensure that we implement and maintain adequate internal control over financial reporting and that we will avoid any material weakness in the future. In addition, we cannot assure you that we will not in the future identify further material weaknesses in our internal control over financial reporting that we have not discovered to date, which may impact the reliability of our financial reporting and financial statements.
Our products must meet specifications, and undetected defects and failures may occur, which may cause customers to return or stop buying our products and may expose us to product liability risk.
Our customers generally establish demanding specifications for quality, performance, and reliability that our products must meet. Integrated circuits as complex as ours often encounter development delays and may contain undetected defects or failures when first introduced or after commencement of commercial shipments, which might require product replacement or recall. Further, our third-party manufacturing processes or changes thereof, or raw material used in the manufacturing processes may cause our products to fail. We have from time to time in the past experienced product quality, performance or reliability problems. Our standard warranty period is generally one to two years, which exposes the companyus to significant risks of claims for defects and failures. If defects and failures occur in our products, we could experience lost revenue, increased costs, including warranty expense and costs associated with customer support, delays in, cancellations or rescheduling of orders or shipments, and product returns or discounts, any of which would harm our operating results.
In addition, product liability claims may be asserted with respect to our technology or products. Although we currently have insurance, there can be no assurance that we have obtained a sufficient amount of insurance coverage, that asserted claims will be within the scope of coverage of the insurance, or that we will have sufficient resources to satisfy any asserted claims.
The price and availability of commodities (e.g., gold, copper and silicon) may adversely impact our ability to deliver our products in a timely and cost-effective manner and may adversely affect our business and results of operations.
Our products incorporate commodities such as gold, copper and silicon. An increase in the price or a decrease in the availability of these commodities and similar commodities that we use could negatively impact our business and results of operations.
DevaluationFluctuations in thevalue of theU.S. Dollar relative to other foreign currencies, including the renminbi,Renminbi, may adversely affect results of operations.
Our manufacturing and packaging suppliers are and will continue to be primarily located in China for the foreseeable future. ShouldIf the value of the renminbi continue to riseRenminbi rises against the U.S. Dollar, there could be an increase in our manufacturing costs relative to competitors who have manufacturing facilities located in the U.S., which could adversely affect our operations. In addition, because we collect payments from all customers in U.S. dollars, fluctuations in the value of foreign currencies could have an adverse impact on our customers’ business, which could negatively impact our business and results of operations.
We incur foreign currency exchange gains or losses related to the timing of payments between the U.S. and our foreign subsidiaries, which are reported in interest and other income. Fluctuations in the value of foreign currencies could increase the amount of foreign currency exchange losses we record, which could have an adverse impact on our results of operations.
We and our manufacturing partners are or will be subject to extensive Chinese government regulation, and the benefit of various incentives from Chinese governments that we and our manufacturing partners receive may be reduced or eliminated, which could increase our costs or limit our ability to sell products and conduct activities in China.
Most of our manufacturing partners are located in China. In addition, we have established a facility in China, initially for the testing of our ICs. The Chinese government has broad discretion and authority to regulate the technology industry in China. China’s government has implemented policies from time to time to regulate economic expansion in China. It also exercises significant control over China’s economic growth through the allocation of resources, controlling payment of foreign currency-denominated obligations, setting monetary policy and providing preferential treatment to particular industries or companies. New regulations or the readjustment of previously implemented regulations could require us and our manufacturing partners to change our business plans, increase our costs, or limit our ability to sell products and conduct activities in China, which could adversely affect our business and operating results.
In addition, the Chinese government and provincial and local governments have provided, and continue to provide, various incentives to encourage the development of the semiconductor industry in China. Such incentives include tax rebates, reduced tax rates, favorable lending policies and other measures, some or all of which may be available to our manufacturing partners and to us with respect to our facility in China. Any of these incentives could be reduced or eliminated by governmental authorities at any time. Any such reduction or elimination of incentives currently provided to our manufacturing partners could adversely affect our business and operating results.
There are inherent risks associated with the operation of our testing facility in China, which could increase product costs or cause a delay in product shipments.
We have a testing facility in China that began operations in 2006. We face the following risks, among others, with respect to our testing facility in China:
inability to hire and maintain a qualified workforce;
inability to maintain appropriate and acceptable manufacturing controls; and
higher than anticipated overhead and other costs of operation.
If we are unable to maintain our testing facility in China at fully operational status with qualified workers, appropriate manufacturing controls and reasonable cost levels, we may incur higher costs than our current expense levels, which would affect our gross margins. In addition, if capacity restraints result in significant delays in product shipments, our business and results of operations would be adversely affected.
The average selling prices of products in our markets have historically decreased over time and will likely do so in the future, which could harm our revenue and gross profits.
Average selling prices of semiconductor products in the markets we serve have historically decreased over time. Our gross profits and financial results will suffer if we are unable to offset any reductions in our average selling prices by reducing our costs, developing new or enhanced products on a timely basis with higher selling prices or gross profits, or increasing our sales volumes. Additionally, because we do not operate our own manufacturing or assembly facilities, we may not be able to reduce our costs as rapidly as companies that operate their own facilities, and our costs may even increase, which could also reduce our profit margins.
Because of the lengthy sales cycles for our products and the fixed nature of a significant portion of our expenses, we may incur substantial expenses before we earn associated revenue and may not ultimately achieve our forecasted sales for our products.
The introduction of new products presents significant business challenges because product development plans and expenditures must be made up to two years or more in advance of any sales. It takes us up to 12 months or more to design and manufacture a new product prototype. Only after we have a prototype do we introduce the product to the market and begin selling efforts in an attempt to achieve design wins. This sales process requires us to expend significant sales and marketing resources without any assurance of success. Volume production of products that use our ICs, if any, may not be achieved for an additional period of time after an initial sale. Sales cycles for our products are lengthy for a number of reasons, including:
our customers usually complete an in-depth technical evaluation of our products before they place a purchase order;
the commercial adoption of our products by OEMs and ODMs is typically limited during the initial release of their product to evaluate product performance and consumer demand;
our products must be designed into our customers’ products or systems; and
the development and commercial introduction of our customers’ products incorporating new technologies frequently are delayed.
As a result of our lengthy sales cycles, we may incur substantial expenses before we earn associated revenue because a significant portion of our operating expenses is relatively fixed and based on expected revenue. The lengthy sales cycles of our products also make forecasting the volume and timing of orders difficult. In addition, the delays inherent in lengthy sales cycles raise additional risks that customers may cancel or change their orders. Our sales are made by purchase orders. Because industry practice allows customers to reschedule or cancel orders on relatively short notice, backlog is not always a good indicator of our future sales. If customer cancellations or product changes occur, we could lose anticipated sales and not have sufficient time to reduce our inventory and operating expenses.
Our success depends on our investment of significant resources in research and development. We may have to invest more resources in research and development than anticipated, which could increase our operating expenses and negatively impact our operating results.
Our success depends on us investing significant amounts of resources into research and development. We expect to have to continue to invest heavily in research and development in the future in order to continue to innovate and come to market with new products in a timely manner and increase our revenue and profitability. If we have to invest more resources in research and development than we anticipate, we could see an increase in our operating expenses which may negatively impact our operating results. Also, if we are unable to properly manage and effectively utilize our research and development resources, we could see material adverse effects on our business, financial condition and operating results.
In addition, if new competitors, technological advances by existing competitors, our entry into new markets, or other competitive factors require us to invest significantly greater resources than anticipated in our research and development efforts, our operating expenses would increase. If we are required to invest significantly greater resources than anticipated in research and development efforts without a corresponding increase in revenue, our operating results could decline. Research and development expenses are likely to fluctuate from time to time to the extent we make periodic incremental investments in research and development and these investments may be independent of our level of revenue which could negatively impact our financial results. In order to remain competitive, we anticipate that we will continue to devote substantial resources to research and development, and we expect these expenses to increase in absolute dollars in the foreseeable future due to the increased complexity and the greater number of products under development.
The loss of any of our key personnel or the failure to attract or retain specialized technical and management personnel could impair our ability to grow our business.
Our future success depends upon our ability to attract and retain highly qualified technical and managerial personnel. We are particularly dependent on the continued services of our key executives, including Michael Hsing, our President and Chief Executive Officer, who founded our company and developed our proprietary process technology. In addition, personnel with highly skilled analog and mixed-signal design engineering expertise are scarce and competition for personnel with these skills is intense. There can be no assurance that we will be able to retain existing key employees or that we will be successful in attracting, integrating or retaining other highly qualified personnel with critical capabilities in the future. If we are unable to retain the services of existing key employees or are unsuccessful in attracting new highly qualified employees quickly enough to meet the demands orof our business, including design cycles, our business could be harmed.
If we fail to retain key employees in sales, applications, finance and legal or to make continued improvements to our internal systems, particularly in the accounting and finance area, our business may suffer.
If we fail to continue to adequately staff our sales, applications, financial and legal staff, maintain or upgrade our business systems and maintain internal control that meet the demands of our business, our ability to operate effectively will suffer. The operation of our business also depends upon our ability to retain these employees, as these employees hold a significant amount of institutional knowledge about us and our products, and, if they were to terminate their employment, our sales and internal control over financial reporting could be adversely affected.
We intend to continue to expand our operations, which may strain our resources and increase our operating expenses.
We plan to continue to expand our domestic and foreign operations through internal growth, strategic relationships, and/or acquisitions. We expect that any such expansion will strain our systems and operational and financial controls. In addition, we are likely to incur significantly higher operating costs. To manage our growth effectively, we must continue to improve and expand our systems and controls, as well as hire experienced administrative and financial personnel. If we fail to do so, our growth will be limited. If we fail to effectively manage our planned expansion of operations, our business and operating results may be harmed.
We may engagenot realize the anticipated benefits of any company or business that we acquire. In addition, acquisitionscould result in future acquisitions that dilutediluting the ownership interests of our stockholders, reduce our cash balances, and cause us to incur debt or to assume contingent liabilities, and we may be unable to successfully integrate these companies into our operations, which wouldcould adversely affect our business.
As a part of our business strategy, from time to time we review acquisition prospects that would complement our current product offerings, enhance our design capability or offer other competitive opportunities. In the eventFor example, we completed our acquisition of futureSensima Technology SA in July 2014 to further our diversification strategy and create new opportunities with key customers. As a result of completing acquisitions, we could use a significant portion of our available cash, cash equivalents and short-term investments, issue equity securities whichthat would dilute current stockholders’ percentage ownership, incur substantial debt or contingent liabilities, and incur impairment charges related to goodwill or other intangibles. Such actions by us could impact our operating results and the price of our common stock.
In addition, we may be unable to identify or complete prospective acquisitions for various reasons, including competition from other companies in the semiconductor industry, the valuation expectations of acquisition candidates and applicable antitrust laws or related regulations. If we are unable to identify and complete acquisitions, we may not be able to successfully expand our business and product offerings.
To
We cannot guarantee that the extentSensima acquisition or any future acquisitions will improve our results of operations or that we are successful in completing strategic acquisitions,will otherwise realize the anticipated benefits of any acquisitions. In addition, if we are unsuccessful in integrating any acquired company or business into our operations or if integration is more difficult than anticipated, we may experience disruptions that could harm our business and notresult in our failure to realize the anticipated benefits of the acquisitions. Some of the risks that may adversely affect our ability to integrate or realize any anticipated benefits from the acquired companies, businesses or assets include those associated with:
unexpected losses of key employees or customers of the acquired companies or businesses;
conforming the acquired company’s standards, processes, procedures and controls with our operations;
coordinating new product and process development;
hiring additional management and other critical personnel;
increasing the scope, geographic diversity and complexity of our operations;
difficulties in consolidating facilities and transferring processes and know-how;
other difficulties in the assimilation of acquired operations, technologies or products;
the risk of undisclosed liabilities of the acquired businesses and potential legal disputes with founders or stockholders of acquired companies;
our inability to commercialize acquired technologies;
the risk that the future business potential as projected is not realized and as a result, we may be required to take a charge to earnings that would impact our profitability;
the need to take impairment charges or write-downs with respect to acquired assets and technologies;
diversion of management’s attention from other business concerns; and
adverse effects on existing business relationships with customers.
We compete against many companies with substantially greater financial and other resources, and our market share may be reduced if we are unable to respond to our competitors effectively.
The analog and mixed-signal semiconductor industry is highly competitive, and we expect competitive pressures to continue. Our ability to compete effectively and to expand our business will depend on our ability to continue to recruit applications and design talent, our ability to introduce new products, and our ability to maintain the rate at which we introduce these new products. We compete with domestic and non-domestic semiconductor companies, many of which have substantially greater financial and other resources with which to pursue engineering, manufacturing, marketing, and distribution of their products. We are in direct and active competition, with respect to one or more of our product lines, with at least 10 manufacturers of such products, of varying size and financial strength. The number of our competitors has grown due to the expansion of the market segments in which we participate.
We cannot assure you that our products will continue to compete favorably or that we will be successful in the face of increasing competition from new products and enhancements introduced by existing competitors or new companies entering this market, which would materially and adversely affect our results of operations and our financial condition.
If securities or industry analysts downgrade our stock or do not continue to publish research or reports about our business, our stock price and trading volume could decline.
The trading market for our common stock will depend, in part, on the research and reports that industry or securities analysts publish about us or our business. We do not have any control over these analysts. If one or more of the analysts who cover us downgrade our stock, our stock price would likely decline. If one or more of these analysts cease coverage of us or fail to regularly publish reports on us, we could lose visibility in the financial markets, which in turn could cause our stock price or trading volume to decline.
Major earthquakes or other natural disasters and resulting systems outages may cause us significant losses.
Our corporate headquarters, the production facilities of our third-party wafer suppliers, our IC testing facility, a portion of our assembly and research and development activities, and certain other critical business operations are located in or near seismically active regions and are subject to periodic earthquakes. We do not maintain earthquake insurance and could be materially and adversely affected in the event of a major earthquake. Much of our revenue, as well as our manufacturers and assemblers, are concentrated in Asia. Such concentration increases the risk that other natural disasters, labor strikes, terrorism, war, political unrest, epidemics, and/or health advisories could disrupt our operations. In addition, we rely heavily on our internal information and communications systems and on systems or support services from third parties to manage our operations efficiently and effectively. Any of these are subject to failure due to a natural disaster or other disruption. System-wide or local failures that affect our information processing could have material adverse effects on our business, financial condition, operating results, and cash flows.
There can be no assurance that we will continue to declare cash dividends at all or in any particular amounts.
In June 2014, the Board of Directors approved a dividend program pursuant to which we intend to pay quarterly cash dividends on our common stock. We anticipate the cash used for future dividends will come from our current domestic cash and cash generated from ongoing U.S. operations. If cash held by our international subsidiaries is needed for the payment of dividends, we may be required to accrue and pay U.S. taxes to repatriate these funds.
The declaration of cash dividends on our common stock is at the discretion of our Board of Directors. Any future decision to declare and pay a cash dividend on our common stock will be subject to, among other things, our results of operations, cash balances and future cash requirements, financial condition, statutory requirements of Delaware law, compliance with the terms of future indebtedness and credit facilities, and other factors that our Board of Directors may deem relevant. Our dividend payments may change from time to time, and we cannot provide assurance that we will continue to declare dividends at all or in any particular amounts. A reduction in or elimination of our dividend payments could have a negative effect on the price of our common stock.
ITEM 1B. UNRESOLVED STAFF COMMENTS
None.
ITEM 2. PROPERTIES
Our primary operations are located in San Jose, California and Chengdu, China. Prior to May 2012, we leased a facility with approximately 55,110 square feet in San Jose, California, which served as our corporate headquarters, as well as our sales and research and development center. Certain test procedures and manufacturing also took place in this San Jose facility. The landlord exercised their right to terminate the lease in April 2012. In May 2012, we moved toWe occupy an owned facility located at 79 Great Oaks Boulevard in San Jose, California, which serves as our corporate headquarters and sales offices. The property consists of a building with approximately 106,262 square feet and 5.5 acres of land.
We lease a facility with approximately 56,000 square feet in Chengdu, China, which serves as our test facility and manufacturing hub. In addition, we constructed a 150,000-square foot150,000 square-foot research and development facility in Chengdu, China, which was put into operation in October 2010.
We also lease sales and research and development offices in the United States, Europe, Japan, China, Taiwan and Korea. We believe that our existing facilities are adequate for our current operations.
ITEM 3. LEGAL PROCEEDINGS
We and certain of our subsidiaries are parties to actions and proceedings in the ordinary course of business, including litigation regarding our shareholders and our intellectual property, challenges to the enforceability or validity of our intellectual property and claims that our products infringe on the intellectual property rights of others. These proceedings often involve complex questions of fact and law and may require the expenditure of significant funds and the diversion of other resources to prosecute and defend. We defend ourselves vigorously against any such claims.
O2 Micro
In May 2012, the United States District Court for the Northern District of California (the “District Court”) issued an order finding O2 Micro International, Ltd. (“O2 Micro”) liable for approximately $9.1 million in attorneys’ fees and non-taxable costs, plus interest, in connection with the patent litigation that we won in 2010. This award was in addition to the approximately $0.3 million in taxable costs that the District Court had earlier ordered O2 Micro to pay to us in connection with the same lawsuit. In October 2012, O2 Micro appealed the District Court’s judgment to the United States Court of Appeals for the Federal Circuit (the “Federal Circuit”). In August 2013, the Federal Circuit affirmed O2 Micro’s liability for the full amount of the award. In September 2013, O2 Micro filed a petition for rehearing of that ruling, but the Federal Circuit denied O2 Micro’s petition for rehearing on October 16, 2013.
In November 2013, we received a cash payment of $9.5 million from O2 Micro. In January 2014, O2 Micro filed an appeal with the United States Supreme Court.If the Supreme Court agrees to review the case and O2 Micro is successful in obtaining a favorable ruling against us, we may be liable to return a portion or all of the $9.5 million to O2 Micro. Accordingly, we recorded the $9.5 million as a current liability asAs of December 31, 2013.
Silergy
In December 2011,2014, there were no material pending legal proceedings to which we entered intowere a settlement and license agreement with Silergy Corp. and Silergy Technology for infringement of our patent whereby we would receive a total of $2.0 million. The first $1.2 million was paid in equal installments of $300,000 in each quarter of 2012 and the remainder was paid in two equal installments in the first two quarters of 2013. No further amount was due to us as of December 31, 2013. All amounts were recorded as credits to litigation expense (benefit), net, in the Consolidated Statements of Operations in the periods the proceeds were received.
Linear
In August 2012, the United States Court of Appeals for the Federal Circuit issued an order affirming the judgment issued by the United States District Court for the District of Delaware finding Linear Technology Corporation (“Linear”) liable for approximately $2.3 million in attorneys’ fees and non-taxable costs, plus interest, in connection with the litigation regarding a contract dispute that we won in 2011. During the fourth quarter of 2012, we received a payment from Linear of $2.3 million plus $0.2 million reimbursement of additional attorney fees in connection with the cost of defending the appeal, which was recorded as a credit to litigation expense (benefit), net, in the Consolidated Statements of Operations. party.
ITEM 4. MINE SAFETY DISCLOSURES
Not applicable.
PART II
ITEM 5. Market for the Registrant’s Common Equity, Related Stockholders Matters, and Issuer Purchases of Equity Securities.MARKET FOR REGISTRANT’S COMMON EQUITY, RELATED STOCKHOLDERS MATTERS, AND ISSUER PURCHASES OF EQUITY SECURITIES.
Market Price of Our Common Stock
Our common stock is traded on the Nasdaq Global Select Market under the symbol “MPWR”. The following table sets forth for the periods indicated, the high and low sales price per share of our common stock:
High | Low | |||||||
2014: | ||||||||
First quarter | $ | 38.86 | $ | 31.36 | ||||
Second quarter | $ | 42.48 | $ | 35.14 | ||||
Third quarter | $ | 47.78 | $ | 40.77 | ||||
Fourth quarter | $ | 50.44 | $ | 34.47 | ||||
2013: | ||||||||
First quarter | $ | 25.51 | $ | 22.18 | ||||
Second quarter | $ | 25.02 | $ | 20.99 | ||||
Third quarter | $ | 31.05 | $ | 23.93 | ||||
Fourth quarter | $ | 34.66 | $ | 27.59 | ||||
High Low 2013 Fourth quarter Third quarter Second quarter First quarter 2012 Fourth quarter Third quarter Second quarter First quarter $ 34.66 $ 27.59 31.05 23.93 25.02 20.99 25.51 22.18 $ 22.38 $ 17.17 23.07 17.07 22.40 17.70 19.91 14.58
Holders of Our Common Stock
As of February 28, 2014,23, 2015, there were 1612 registered holders of record of our common stock. A substantially greater number of holders of our common stock are “street name” or beneficial holders, whose shares are held by banks, brokers and other financial institutions.
Dividend Policy
In December 2012,June 2014, our Board of Directors approved a dividend program pursuant to which we paid our first everintend to pay quarterly cash dividend of $1.00 per share to stockholders for a total of $35.7 million. Other than this special dividend, we have not paid cash dividenddividends on our common stock. Stockholders of record as of the last day of the quarter are entitled to receive the quarterly cash dividends declared by our Board of Directors, which are payable on the 15th of the following month. Our Board of Directors declared the following cash dividends in 2014 (in thousands, except per share amounts):
Dividend Declared | Total | |||||||
per Share | Amount | |||||||
2014: | ||||||||
Second quarter | $ | 0.15 | $ | 5,817 | ||||
Third quarter | $ | 0.15 | $ | 5,823 | ||||
Fourth quarter | $ | 0.15 | $ | 5,826 | ||||
The declaration of any future cash dividends is at the discretion of our Board of Directors and will depend on our financial condition, results of operations, capital requirements, business conditions and other factors, as well as a determination that cash dividends are in the best interests of our stockholders. We anticipate that the cash used for future dividends will come from our current domestic cash and cash generated from ongoing U.S. operations. If cash held by our international subsidiaries is needed for the payment of dividends, we may be required to accrue and pay U.S. taxes to repatriate the funds.
Performance of Our Common Stock
The following graph compares the cumulative 60-monthfive-year total return on our common stock relative to the cumulative total returns of the Nasdaq Composite Index, the S&P 500 Index and the Philadelphia Semiconductor Index. An investment of $100 (with reinvestment of all dividends) is assumed to have been made in our common stock on December 31, 20082009 and its relative performance is tracked through December 31, 2013.2014.
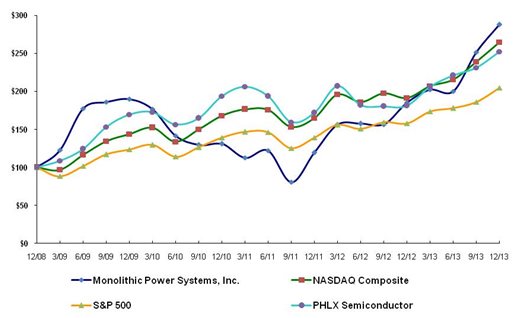
The information contained in the stock performance graph section shall not be deemed to be “soliciting material” or “filed” or incorporated by reference in future filings with the SEC, or subject to the liabilities of Section 18 of the Exchange Act, except to the extent that the Company specifically incorporates it by reference into a document filed under the Securities Act of 1933, as amended, or the Securities Exchange Act of 1934, as amended.
Purchases of Equity Securities by the Issuer and Affiliated Purchasers
Stock repurchase activities during the three months ended December 31, 20132014 were as follows:follows (in thousands, except per share amounts):
Total Number of Shares Purchased (a) | Average Price Paid per Share | Total Number of Shares Purchased as Part of Publicly Announced Program | Dollar Value of Shares That May Yet Be Purchased Under the Program (in thousands) | Total Number of Shares Purchased (a) | Average Price Paid per Share | Total Number of Shares Purchased as Part of Publicly Announced Program | Dollar Value of Shares That May Yet Be Purchased Under the Program | |||||||||||||||||||||||||
October 1 - October 31 | 148,188 | $ | 30.70 | 148,188 | 107 | $ | 38.57 | 107 | ||||||||||||||||||||||||
November 1 - November 30 | 122,865 | $ | 32.26 | 122,865 | 41 | $ | 45.62 | 41 | ||||||||||||||||||||||||
December 1 - December 31 | 124,750 | $ | 33.10 | 124,750 | 45 | $ | 48.97 | 45 | ||||||||||||||||||||||||
Total | 395,803 | 395,803 | $ | 79,400 | 193 | $ | 42.48 | 193 | $ | 38,187 | ||||||||||||||||||||||
(a) | In July 2013, the Board of Directors approved a stock repurchase program that authorizes us to repurchase up to $100 million in the aggregate of our common stock through June 30, 2015. Under the program, shares may be repurchased in privately negotiated or open market transactions, including undera Rule 10b5-1 plan. Shares are retired upon repurchase. |
ITEM 6. SELECTED FINANCIAL DATA
The following financial data is derived from our audited annual consolidated financial statements as of and for the years ended December 31, 2014, 2013, 2012, 2011 2010 and 2009.2010. You should read the following table in conjunction with the consolidated financial statements and the related notes contained elsewherein Item 8 in this reportAnnual Report on Form 10-K. Operating results for any year are not necessarily indicative of results to be expected for any future periods.
Consolidated Statement of Operations Data:
| Year Ended December 31, | Year Ended December 31, | |||||||||||||||||||||||||||||||||||||||
| 2013 | 2012 | 2011 | 2010 | 2009 | 2014 | 2013 | 2012 | 2011 | 2010 | |||||||||||||||||||||||||||||||
| (in thousands, except per share amounts) | (in thousands, except per share amounts) | |||||||||||||||||||||||||||||||||||||||
Revenue | $ | 238,091 | $ | 213,813 | $ | 196,519 | $ | 218,840 | $ | 165,008 | $ | 282,535 | $ | 238,091 | $ | 213,813 | $ | 196,519 | $ | 218,840 | ||||||||||||||||||||
Cost of revenue | 110,190 | 100,665 | 94,925 | 97,383 | 67,330 | 129,917 | 110,190 | 100,665 | 94,925 | 97,383 | ||||||||||||||||||||||||||||||
Gross profit | 127,901 | 113,148 | 101,594 | 121,457 | 97,678 | 152,618 | 127,901 | 113,148 | 101,594 | 121,457 | ||||||||||||||||||||||||||||||
Operating expenses: | ||||||||||||||||||||||||||||||||||||||||
Research and development | 49,733 | 48,796 | 44,518 | 44,372 | 38,295 | 58,590 | 49,733 | 48,796 | 44,518 | 44,372 | ||||||||||||||||||||||||||||||
Selling, general and administrative | 54,624 | 50,018 | 40,280 | 41,169 | 36,752 | 66,755 | 54,624 | 50,018 | 40,280 | 41,169 | ||||||||||||||||||||||||||||||
Litigation expense (benefit), net | (371 | ) | (2,945 | ) | 3,379 | 5,418 | 3,101 | (8,027 | ) | (371 | ) | (2,945 | ) | 3,379 | 5,418 | |||||||||||||||||||||||||
Total operating expenses | 103,986 | 95,869 | 88,177 | 90,959 | 78,148 | 117,318 | 103,986 | 95,869 | 88,177 | 90,959 | ||||||||||||||||||||||||||||||
Income from operations | 23,915 | 17,279 | 13,417 | 30,498 | 19,530 | 35,300 | 23,915 | 17,279 | 13,417 | 30,498 | ||||||||||||||||||||||||||||||
Interest and other income, net | 92 | 611 | 309 | 922 | 618 | 1,092 | 92 | 611 | 309 | 922 | ||||||||||||||||||||||||||||||
Income before income taxes | 24,007 | 17,890 | 13,726 | 31,420 | 20,148 | 36,392 | 24,007 | 17,890 | 13,726 | 31,420 | ||||||||||||||||||||||||||||||
Income tax provision | 1,109 | 2,134 | 425 | 1,857 | 474 | 897 | 1,109 | 2,134 | 425 | 1,857 | ||||||||||||||||||||||||||||||
Net income | $ | 22,898 | $ | 15,756 | $ | 13,301 | $ | 29,563 | $ | 19,674 | $ | 35,495 | $ | 22,898 | $ | 15,756 | $ | 13,301 | $ | 29,563 | ||||||||||||||||||||
Basic net income per share | $ | 0.61 | $ | 0.45 | $ | 0.39 | $ | 0.83 | $ | 0.57 | ||||||||||||||||||||||||||||||
Diluted net income per share | $ | 0.59 | $ | 0.43 | $ | 0.38 | $ | 0.78 | $ | 0.54 | ||||||||||||||||||||||||||||||
Weighted average common shares outstanding: | ||||||||||||||||||||||||||||||||||||||||
Net income per share: | ||||||||||||||||||||||||||||||||||||||||
Basic | 37,387 | 34,871 | 34,050 | 35,830 | 34,310 | $ | 0.92 | $ | 0.61 | $ | 0.45 | $ | 0.39 | $ | 0.83 | |||||||||||||||||||||||||
Diluted | 38,620 | 36,247 | 35,160 | 37,826 | 36,634 | $ | 0.89 | $ | 0.59 | $ | 0.43 | $ | 0.38 | $ | 0.78 | |||||||||||||||||||||||||
Weighted-average shares outstanding: | ||||||||||||||||||||||||||||||||||||||||
Basic | 38,686 | 37,387 | 34,871 | 34,050 | 35,830 | |||||||||||||||||||||||||||||||||||
Diluted | 39,793 | 38,620 | 36,247 | 35,160 | 37,826 | |||||||||||||||||||||||||||||||||||
Cash dividends declared per common share | $ | 0.45 | $ | - | $ | 1.00 | $ | - | $ | - | ||||||||||||||||||||||||||||||
Consolidated Balance Sheet Data:
As of December 31, | As of December 31, | |||||||||||||||||||||||||||||||||||||||
2013 | 2012 | 2011 | 2010 | 2009 | 2014 | 2013 | 2012 | 2011 | 2010 | |||||||||||||||||||||||||||||||
(in thousands, except cash dividend per common share) | (in thousands) | |||||||||||||||||||||||||||||||||||||||
Cash and cash equivalents | $ | 101,213 | $ | 75,104 | $ | 96,371 | $ | 48,010 | $ | 46,717 | $ | 126,266 | $ | 101,213 | $ | 75,104 | $ | 96,371 | $ | 48,010 | ||||||||||||||||||||
Short-term investments | 125,126 | 85,521 | 77,827 | 129,709 | 118,914 | $ | 112,452 | $ | 125,126 | $ | 85,521 | $ | 77,827 | $ | 129,709 | |||||||||||||||||||||||||
Long-term investments | 9,860 | 11,755 | 13,675 | 19,180 | 19,445 | $ | 5,389 | $ | 9,860 | $ | 11,755 | $ | 13,675 | $ | 19,180 | |||||||||||||||||||||||||
Total assets | 368,908 | 287,162 | 273,867 | 281,603 | 241,821 | $ | 399,366 | $ | 368,908 | $ | 287,162 | $ | 273,867 | $ | 281,603 | |||||||||||||||||||||||||
Long-term income tax liabilities | 5,542 | 5,408 | 4,920 | 5,015 | 4,915 | $ | 5,876 | $ | 5,542 | $ | 5,408 | $ | 4,920 | $ | 5,015 | |||||||||||||||||||||||||
Common stock | 234,201 | 194,079 | 159,336 | 178,269 | 175,518 | $ | 240,500 | $ | 234,201 | $ | 194,079 | $ | 159,336 | $ | 178,269 | |||||||||||||||||||||||||
Total stockholders' equity | 323,399 | 258,294 | 242,877 | 246,895 | 212,957 | $ | 346,425 | $ | 323,399 | $ | 258,294 | $ | 242,877 | $ | 246,895 | |||||||||||||||||||||||||
Working capital | 253,597 | 190,841 | 185,435 | 195,403 | 179,577 | $ | 271,285 | $ | 253,597 | $ | 190,841 | $ | 185,435 | $ | 195,403 | |||||||||||||||||||||||||
Cash dividend per common share | - | 1.00 | - | - | - | |||||||||||||||||||||||||||||||||||
ITEM 7. MANAGEMENT’S DISCUSSION AND ANALYSIS OF FINANCIAL CONDITION AND RESULTS OF OPERATIONS
The following discussion should be read in conjunction with the consolidated financial statements and related notes which appear elsewhereunder Item 8 in this Annual Report on Form 10-K.
Overview
We are a fablessleading company in high performance power solutions. Founded in 1997, we pioneered integrated power semiconductor company that designs, develops,solutions and markets proprietary, advanced analog and mixed-signal semiconductors.power delivery architectures. Our products are used extensivelymission is to provide innovative power solutions in storage andcloud computing, products, network communications products, flat panel TVs, set top boxes, lighting products and a wide variety of consumer and portable electronics products,telecommunications, industrial and automotive, and industrial markets.consumer market segments. We believe that we differentiate ourselves by offering solutions that are more highly integrated, smaller in size, more energy efficient, more accurate with respect to performance specifications and, consequently, more cost-effective than many competing solutions. We plan to continue to introduce new products within our existing product families, as well as in new innovative product categories.
We operate in the cyclical semiconductor industry where there is seasonal demand for certain products. We are not and will not be immune from current and future industry downturns, but we have targeted product and market areas that we believe have the ability to offer above average industry performance.
We work with third parties to manufacture and assemble our integrated circuits (“ICs”). This has enabled us to limit our capital expenditures and fixed costs, while focusing our engineering and design resources on our core strengths.
Following the introduction of a product, our sales cycle generally takes a number of quarters after we receive an initial customer order for a new product to ramp up. Typical lead time for orders is fewer than 90 days. These factors, combined with the fact that orders in the semiconductor industry can typically be cancelled or rescheduled without significant penalty to the customer, make the forecasting of our orders and revenue difficult.
We derive most of our revenue from sales through distribution arrangements and direct sales to customers in Asia, where the products we produce are incorporated into end-user products. For the years ended December 31, 2013 and 2012, 90% and 89% of ourOur revenue respectively, was attributable tofrom direct or indirect sales to customers in Asia.Asia was 91% and 90% for the years ended December 31, 2014 and 2013, respectively. We derive a majority of our revenue from the sales of our DC to DC converter product family which services the communications, storage and computing, consumer and industrial markets. We believe our ability to achieve revenue growth will depend, in part, on our ability to develop new products, enter new market segments, gain market share, manage litigation risk, diversify our customer base and successfully secure manufacturing capacity.
In July 2014, we completed the acquisition of Sensima Technology SA (“Sensima”), a company located in Switzerland that develops magnetic sensors for angle measurements as well as three-dimensional magnetic field sensing. The acquisition is expected to create new opportunities with customers by offering enhanced solutions in power management for key industries such as automotive, industrial and cloud computing. The purchase consideration consisted of an upfront cash payment of $11.7 million and additional consideration that is contingent upon Sensima achieving a new product introduction and certain revenue and direct margin goals in 2016, with a fair value of $2.5 million at the date of acquisition. In addition, key employees received $1.7 million of time-based restricted stock units and up to $8.0 million of performance-based restricted stock units in connection with the transaction. These equity awards are considered arrangements for post-acquisition services and the related compensation expense is being recognized over the requisite service period. The results of operations of Sensima have been included in our consolidated financial statements subsequent to the acquisition date.
Critical Accounting Policies and Estimates
Our discussion and analysis of our financial condition and results of operations are based upon our consolidated financial statements, which have been prepared in accordance with generally accepted accounting principles in the U.S. The preparation of these financial statements requires us to make estimates and judgments that affect the reported amount of assets, liabilities, revenue and expenses, and related disclosure of contingent assets and liabilities. We evaluate our estimates on an on-going basis, including those related to revenue recognition, stock-based compensation, financial instruments, inventories, income taxes, warranty obligationsvaluation of goodwill and intangible assets, and contingencies. We base our estimates on historical experience and on various other assumptions that are believed to be reasonable under the circumstances, the results of which form the basis for making the judgments about the carrying values of assets and liabilities that are not readily apparent from other sources. Estimates and judgments used in the preparation of our financial statements are, by their nature, uncertain and unpredictable, and depend upon, among other things, many factors outside of our control, such as demand for our products and economic conditions. Accordingly, our estimates and judgments may prove to be incorrect and actual results may differ, perhaps significantly, from these estimates.
We believe the following critical accounting policies reflect our more significant judgments used in the preparation of our consolidated financial statements.
Revenue Recognition.Recognition
We recognize revenue when the following four basic criteria are met: (1) persuasive evidence of an arrangement exists; (2) delivery has occurred or services have been rendered; (3) the fee is fixed or determinable; and (4) collectability is reasonably assured. Determination of criteria (3) and (4) are based on management’s judgment regarding the fixed nature of the feefees charged for products delivered and the collectability of those fees. The application of these criteria has resulted in us generally recognizing revenue upon shipment (when title passes) to customers, including distributors, original equipment manufacturers and electronic manufacturing service providers. Should changes in conditions cause management to determine these criteria are not met for certain future transactions, revenue recognized for any reporting period could be adversely impacted.
Our revenue consists primarily of sales of assembled and tested finished goods. We also sell die in wafer form to our customers and value-added resellers, and we receive royalty revenue from third parties and value-added resellers.
For the years ended December 31, 2014 and 2013, approximately 92% and 2012, approximately 91% of our distributor sales, respectively, including sales to our value-added resellers, were made through distribution arrangements with third parties. These arrangements do not include any special payment terms (our normal(normal payment terms are 30-45 days for our distributors), price protection or exchange rights. Returns are limited to our standard product warranty. Certain of our large distributors have contracts that include limited stock rotation rights that permit the return of a small percentage of the previous six months’ purchases.
For the years ended December 31, 2014 and 2013, approximately 8% and 2012, approximately 9% of our distributor sales, respectively, were made through small distributors primarily based on purchase orders. These distributors typically have no stock rotation rights.
We maintain a sales reserve for stock rotation rights, which is based on historical experience of actual stock rotation returns on a per distributor basis, where available, and information related to products in the distribution channel. This reserve is recorded at the time of sale. Historically, these returns were not material to our consolidated financial statements. In the future, if we are unable to estimate our stock rotation returns accurately, we may have to recognize revenue when the distributors sell such inventory to end customers.
We generally recognize revenue upon shipment of products to the distributors for the following reasons:
| (1) |
|
| (2) |
|
| (3) | The distributors’ obligation is unchanged in the event of theft or physical destruction or damage to the products. |
| (4) |
|
| (5) | We do not have any obligations for future performance to directly bring about the resale of our products by the distributors. |
| (6) | The amount of future returns can be reasonably estimated. We have the ability and the information necessary to track inventory sold to and held at our distributors. We maintain a history of returns and have the ability to estimate the stock rotation returns on a quarterly basis. |
We maintain a sales reserve for stock rotation rights, which is based on historical experience of actual stock rotation returns on a per distributor basis, where available, and information related to products in the distribution channel. This reserve is recorded at the time of sale. Historically, these returns were not material to our consolidated financial statements. In the future, if we are not able to estimate our stock rotation returns accurately, we may have to recognize revenue when the distributors sell such inventory to end customers.
If we enter into arrangements that have rights of return that are not estimable, we recognize revenue under such arrangements only after the distributors have sold ourthe products to end customers. TwoThree of our U.S. distributors have distribution agreements where revenue is recognized upon sale by these distributors to their end customers because these distributors have certain rights of return which management believes are not estimable. The deferred revenue balance from these two distributors as of December 31, 2014 and 2013 and 2012 was $1.7$2.0 million and $1.6$1.7 million, respectively. The deferred costs as of December 31, 20132014 and 20122013 were $0.2 million.
We generally provide a one to two-year warranty against defects in materials and workmanship. Under this warranty, we will repair the goods, provide replacements at no charge, or, under certain circumstances, provide a refund to the customer for defective products. Estimated warranty returns and warranty costs are based on historical experience and are recorded at the time product revenue is recognized.
Inventory Valuation.Valuation
We value our inventory at the lower of the standard cost (which approximates actual cost on a first-in, first-out basis) or its current estimated market value. We write down inventory for obsolescence or lack of demand, based on assumptions about future demand and market conditions. If actual market conditions are less favorable than those projected by management, additional inventory write-downs may be required. Conversely, if market conditions are more favorable, inventory may be sold that was previously reserved.
Valuation of Goodwill and Acquisition-Related Intangible Assets
We evaluate intangible assets with finite lives for impairment whenever events or changes in circumstances indicate that an impairment may exist. We perform an annual impairment assessment for goodwill and intangible assets with indefinite lives in the fourth quarter, or more frequently if indicators of potential impairment exist. Impairment of intangible assets is recognized based on the difference between the fair value of the assets and their carrying value. Impairment for goodwill occurs if the fair value of a reporting unit including goodwill is less than its carrying value and is recognized based on the difference between the implied fair value of the reporting unit’s goodwill and the carrying value of the goodwill. The assumptions and estimates used to determine future values of goodwill and intangible assets are complex and subjective. They can be affected by various factors, including external factors such as industry and economic trends, and internal factors such as changes in our business strategy and revenue forecasts. If there is a significant adverse change in our business in the future, including macroeconomic and market conditions, we may be required to record impairment charges on our goodwill and acquisition-related intangible assets.
Accounting for Income Taxes.Taxes
ASC 740-10, Income Taxes – Overall, prescribes a recognition threshold and measurement attribute for the financial statement recognition and measurement of a tax position taken or expected to be taken in a tax return. This interpretation also provides guidance on classification, interest and penalties, accounting in interim periods and disclosure. In accordance with ASC 740-10, we recognize federal, state and foreign current tax liabilities or assets based on our estimate of taxes payable or refundable in the current fiscal year by tax jurisdiction. We also recognize federal, state and foreign deferred tax assets or liabilities for our estimate of future tax effects attributable to temporary differences and carryforwards. We record a valuation allowance to reduce any deferred tax assets by the amount of any tax benefits that, based on available evidence and judgment, are not expected to be realized.
Our calculation of current and deferred tax assets and liabilities is based on certain estimates and judgments and involves dealing with uncertainties in the application of complex tax laws. Our estimates of current and deferred tax assets and liabilities may change based, in part, on added certainty or finality or uncertainty to an anticipated outcome, changes in accounting or tax laws in the U.S., or foreign jurisdictions where we operate, or changes in other facts or circumstances. In addition, we recognize liabilities for potential U.S. and foreign income tax for uncertain income tax positions taken on our tax returns if it has less than a 50% likelihood of being sustained. If we determine that payment of these amounts is unnecessary or if the recorded tax liability is less than our current assessment, we may be required to recognize an income tax benefit or additional income tax expense in our financial statements in the period such determination is made. We have calculated our uncertain tax positions which were attributable to certain estimates and judgments primarily related to transfer pricing, cost sharing and our international tax structure exposure.
As of December 31, 20132014, and 2012,2013, we had a valuation allowance of $16.7$19.1 million and $12.5$16.7 million, respectively, attributable to management’s determination that it is more likely than not that most of the deferred tax assets in the U.S. will not be realized. Should it be determined that additional amounts of the net deferred tax asset will not be realized in the future, an adjustment to increase the deferred tax asset valuation allowance will be charged to income in the period such determination is made. Likewise, in the event we were to determine that it is more likely than not that we would be able to realize our deferred tax assets in the future in excess of our net recorded amount, an adjustment to the valuation allowance for the deferred tax asset would increase income in the period such determination was made.
As a result of the cost sharing arrangements with our international subsidiaries (cost share arrangements), relatively small changes in costs that are not subject to sharing under the cost share arrangements can significantly impact the overall profitability of the U.S. entity. Because of the U.S. entity’s inconsistent earnings history and uncertainty of future earnings, we have determined that it is more likely than not that the U.S. deferred tax benefits will not be realized.
We incurred significant stock-based compensation expense, which related to employee stock purchase plans for which no corresponding tax benefit will be recognized unless a disqualifying disposition occurs. Disqualifying dispositions result in a reduction of income tax expense in the period when the disqualifying disposition occurs. Tax benefits related to realized tax deductions in excess of previously expensed stock compensation are recorded as an addition to paid-in-capital.Contingencies
Contingencies. We are a party to actions and proceedings incidentalincident to our business in the ordinary course of business, including litigation regarding our intellectual property, challenges to the enforceability or validity of our intellectual property and claims that our products infringe on the intellectual property rights of others. The pending proceedings involve complex questions of fact and law and will require the expenditure of significant funds and the diversion of other resources to prosecute and defend. In addition, from time to time, we become aware that we are subject to other contingent liabilities. When this occurs, we will evaluate the appropriate accounting for the potential contingent liabilities using ASC 450-20-25,Contingencies – Loss Contingencies – Recognition,to determine whether a contingent liability should be recorded. In making this determination, management may, depending on the nature of the matter, consult with internal and external legal counsel and technical experts. Based on the facts and circumstances in each matter, we use our judgment to determine whether it is probable that a contingent loss has occurred and whether the amount of such loss can be estimated. If we determine a loss is probable and estimable, we record a contingent loss in accordance with ASC 450-20-25-2.loss. In determining the amount of a contingent loss, we take into account advice received from experts for each specific matter regarding the status of legal proceedings, settlement negotiations, (which may be ongoing), prior case history and other factors. Should the judgments and estimates made by management need to be adjusted as additional information becomes available, we may need to record additional contingent losses that could materially and adversely impact our results of operations. Alternatively, if the judgments and estimates made by management are adjusted, for example, if a particular contingent loss does not occur, the contingent loss recorded would be reversed which could result in a favorable impact on our results of operations.
Stock-Based Compensation
Stock-Based Compensation. We account for stock-based compensation under the provisions of ASC 718-10-30,Compensation – Stock Compensation – Overall – Initial Measurement.This standard requires us to measure the cost of employee services received in exchange for an award of equity instruments based on the grant-date fair value of the award.We use the Black-Scholes model to estimate the fair value of our options and shares issued under employee stock purchase plan. The fair value of our time-based and performance-based restricted stock units is based on the grant date share price. The fair value of our market-based restricted stock units is estimated using a Monte Carlo simulation model.
We recognize compensation expense equal to the grant-date fair value for all share-based payment awards that are expected to vest. This expense is recorded on a straight-line basis over the requisite service period of the entire awards, unless the awards are subject to performance or market conditions, in which case we recognize compensation expense over the requisite service period of each separate vesting tranche. For ourthe performance-based awards, we recognize compensation expense when it becomes probable that the performance criteria specified inset by the planBoard of Directors will be achieved. For ourthe market-based awards, compensation expense is not reversed if the market condition is not satisfied. TheIf the actual performance targets achieved differ significantly from those projected by management, additional stock-based compensation expense may be recorded for the performance-based awards, which could have an adverse impact on our results of operations. Furthermore, the amount of stock-based compensation that we recognize is also based on an expected forfeiture rate. If there is a difference between the forfeiture assumptions used in determining stock-based compensation expensecosts and the actual forfeitures which become known over time, we may change the forfeiture rate, which could have a significant impact on our stock-based compensation expense.
Recent Accounting Pronouncements
In June 2011,July 2013, the Financial Accounting Standards Board (“FASB”) issued Accounting Standards Update (“ASU”) No. 2011-05,Presentation of Comprehensive Income. The standard requires entities to have more detailed reporting of comprehensive income. Specifically, the standard allows an entity to present components of net income and components of other comprehensive income in one continuous statement of comprehensive income, or in two separate, but consecutive statements. The guidance became effective in the first quarter of 2013 and applied retrospectively. The adoption of this guidance did not have a material impact on our consolidated financial position, results of operations, or cash flows.
In February 2013, the FASB issued ASU No. 2013-02,Reporting of Amounts Reclassified Out of Accumulated Other Comprehensive Income.This ASU adds new disclosure requirements for items reclassified out of accumulated other comprehensive income. The ASU was effective for fiscal years, and interim periods within those years, beginning on or after December 15, 2012 and must be applied prospectively. We adopted this standard on January 1, 2013 and the adoption did not have a material impact on our consolidated financial position, results of operations or cash flows.
In July 2013, the FASB issued ASU No. 2013-11,Presentation of an Unrecognized Tax Benefit When a NetOperating Loss Carryforward, a Similar Tax Loss, or a Tax Credit Carryforward Exists. The standard gives guidance on the financial statement presentation of an unrecognized tax benefit when a net operating loss carryforward, a similar tax loss, or a tax credit carryforward exists, with the purpose of reducing diversity in practice. TheThis new standard requires the netting of unrecognized tax benefits against a deferred tax asset for a loss or other carryforward that would apply in settlement of the uncertain tax positions. The guidance will become effectiveWe adopted this standard in the first quarter of 2014 prospectively and should be applied prospectively. Early adoption is permitted. We do not expect that the adoption of this guidance willdid not have a materialan impact on our consolidated financial position, results of operations or cash flows.
In May 2014, the FASB issued ASU No. 2014-09, Revenue from Contracts with Customers,which outlines a single comprehensive model for entities to use in accounting for revenue arising from contracts with customers. The standard’s core principle is that an entity will recognize revenue when it transfers promised goods or services to customers in an amount that reflects the consideration to which the entity expects to be entitled in exchange for those goods or services. Under the new standard, entities will apply the following five-step model when evaluating revenue contracts with customers:
(1) | Identify the contract with a customer. |
(2) | Identify the performance obligations in the contract. |
(3) | Determine the transaction price. |
(4) | Allocate the transaction price to the performance obligations in the contract. |
(5) | Recognize revenue when the entity satisfies a performance obligation. |
The new standard is effective for annual and interim reporting periods beginning after December 15, 2016. Entities have the option of using either a full retrospective or a modified retrospective application in the adoption of this standard. We will adopt the standard in the first quarter of 2017 and are evaluating the transition method and the impact of the adoption on our consolidated financial position, results of operations and cash flows.
Results of Operations
The following table summarizes our results of operations:
Year Ended December 31, | ||||||||||||||||||||||||
2013 | 2012 | 2011 | ||||||||||||||||||||||
(in thousands, except percentages) | ||||||||||||||||||||||||
Revenue | $ | 238,091 | 100.0 | % | $ | 213,813 | 100.0 | % | $ | 196,519 | 100.0 | % | ||||||||||||
Cost of revenue | 110,190 | 46.3 | 100,665 | 47.1 | 94,925 | 48.3 | ||||||||||||||||||
Gross profit | 127,901 | 53.7 | 113,148 | 52.9 | 101,594 | 51.7 | ||||||||||||||||||
Operating expenses: | ||||||||||||||||||||||||
Research and development | 49,733 | 20.9 | 48,796 | 22.8 | 44,518 | 22.7 | ||||||||||||||||||
Selling, general and administrative | 54,624 | 22.9 | 50,018 | 23.4 | 40,280 | 20.5 | ||||||||||||||||||
Litigation expense (benefit), net | (371 | ) | (0.2 | ) | (2,945 | ) | (1.4 | ) | 3,379 | 1.7 | ||||||||||||||
Total operating expenses | 103,986 | 43.6 | 95,869 | 44.8 | 88,177 | 44.9 | ||||||||||||||||||
Income from operations | 23,915 | 10.1 | 17,279 | 8.1 | 13,417 | 6.8 | ||||||||||||||||||
Interest and other income, net | 92 | 0.0 | 611 | 0.3 | 309 | 0.2 | ||||||||||||||||||
Income before income taxes | 24,007 | 10.1 | 17,890 | 8.4 | 13,726 | 7.0 | ||||||||||||||||||
Income tax provision | 1,109 | 0.5 | 2,134 | 1.0 | 425 | 0.2 | ||||||||||||||||||
Net income | $ | 22,898 | 9.6 | % | $ | 15,756 | 7.4 | % | $ | 13,301 | 6.8 | % | ||||||||||||
Year Ended December 31, | ||||||||||||||||||||||||
2014 | 2013 | 2012 | ||||||||||||||||||||||
(in thousands, except percentages) | ||||||||||||||||||||||||
Revenue | $ | 282,535 | 100.0 | % | $ | 238,091 | 100.0 | % | $ | 213,813 | 100.0 | % | ||||||||||||
Cost of revenue | 129,917 | 46.0 | 110,190 | 46.3 | 100,665 | 47.1 | ||||||||||||||||||
Gross profit | 152,618 | 54.0 | 127,901 | 53.7 | 113,148 | 52.9 | ||||||||||||||||||
Operating expenses: | ||||||||||||||||||||||||
Research and development | 58,590 | 20.7 | 49,733 | 20.9 | 48,796 | 22.8 | ||||||||||||||||||
Selling, general and administrative | 66,755 | 23.6 | 54,624 | 22.9 | 50,018 | 23.4 | ||||||||||||||||||
Litigation benefit, net | (8,027 | ) | (2.8 | ) | (371 | ) | (0.2 | ) | (2,945 | ) | (1.4 | ) | ||||||||||||
Total operating expenses | 117,318 | 41.5 | 103,986 | 43.6 | 95,869 | 44.8 | ||||||||||||||||||
Income from operations | 35,300 | 12.5 | 23,915 | 10.1 | 17,279 | 8.1 | ||||||||||||||||||
Interest and other income, net | 1,092 | 0.4 | 92 | 0.0 | 611 | 0.3 | ||||||||||||||||||
Income before income taxes | 36,392 | 12.9 | 24,007 | 10.1 | 17,890 | 8.4 | ||||||||||||||||||
Income tax provision | 897 | 0.3 | 1,109 | 0.5 | 2,134 | 1.0 | ||||||||||||||||||
Net income | $ | 35,495 | 12.6 | % | $ | 22,898 | 9.6 | % | $ | 15,756 | 7.4 | % | ||||||||||||
Revenue
The following table summarizes our revenue by product family:
Year Ended December 31, | Percentage Change | Year Ended December 31, | Change | |||||||||||||||||||||||||||||||||||||||||||||||||||||||||||||
Product Family | 2013 | % of Revenue | 2012 | % of Revenue | 2011 | % of Revenue | From 2012 to 2013 | From 2011 to 2012 | 2014 | % of Revenue | 2013 | % of Revenue | 2012 | % of Revenue | From 2013 to 2014 | From 2012 to 2013 | ||||||||||||||||||||||||||||||||||||||||||||||||
(In thousands, except percentages) | (In thousands, except percentages) | |||||||||||||||||||||||||||||||||||||||||||||||||||||||||||||||
DC to DC products | $ | 211,337 | 88.8 | % | $ | 188,736 | 88.3 | % | $ | 170,032 | 86.5 | % | 12.0% | 11.0% | $ | 253,083 | 89.6 | % | $ | 211,337 | 88.8 | % | $ | 188,736 | 88.3 | % | 19.8 | % | 12.0 | % | ||||||||||||||||||||||||||||||||||
Lighting control products | 26,754 | 11.2 | % | 25,077 | 11.7 | % | 26,487 | 13.5 | % | 6.7% | (5.3% | ) | 29,452 | 10.4 | % | 26,754 | 11.2 | % | 25,077 | 11.7 | % | 10.1 | % | 6.7 | % | |||||||||||||||||||||||||||||||||||||||
Total | $ | 238,091 | 100.0 | % | $ | 213,813 | 100.0 | % | $ | 196,519 | 100.0 | % | 11.4% | 8.8% | $ | 282,535 | 100.0 | % | $ | 238,091 | 100.0 | % | $ | 213,813 | 100.0 | % | 18.7 | % | 11.4 | % | ||||||||||||||||||||||||||||||||||
Revenue for the year ended December 31, 2014 was $282.5 million, an increase of $44.4 million, or 18.7%, from $238.1 million for the year ended December 31, 2013. This increase was due to higher sales of both DC to DC and lighting control products, as unit shipments increased 37% due to higher market demand with current customers and additional design wins with new customers, which were offset in part by a 13% decrease in average sales prices. Revenue from our DC to DC products was $253.1 million for the year ended December 31, 2014, an increase of $41.7 million, or 19.8%, from the same period in 2013. This increase was primarily due to higher sales of our DC to DC converters, offset in part by lower sales of our Mini-Monsters products. Revenue from our lighting control products was $29.5 million for the year ended December 31, 2014, an increase of $2.7 million, or 10.1%, compared with the same period in 2013.
Revenue for the year ended December 31, 2013 was $238.1 million, an increase of $24.3 million, or 11.4%, from $213.8 million for the year ended December 31, 2012. This increase was due to higher sales of both DC to DC and lighting control products, as higher unit shipments increased 18% due to higher market demand with current customers and additional design wins with new customers, which were offset in part by lowera 6% decrease in average sellingsales prices. Revenue from our DC to DC products was $211.3 million for the year ended December 31, 2013, an increase of $22.6 million, or 12.0%, from the same period in 2012. This increase was primarily due to higher sales of our DC to DC converters, Mini-Monsters, PMICs and battery charger products. Revenue from our lighting control products was $26.8 million for the year ended December 31, 2013, an increase of $1.7 million, or 6.7%, compared with the same period in 2012. This increase was primarily due to higher sales of our WLED products, offset in part by decreased demand for our CCFLC products.
Revenue for the year ended December 31, 2012 was $213.8 million, an increase of $17.3 million, or 8.8%, from $196.5 millionfor the year ended December 31, 2011. This increase was primarily due to increased demand for our DC to DC products. Revenue from our DC to DC products was $188.7 million, an increase of $18.7 million, or 11.0%, over the same period in 2011. This increase was primarily due to increased demand for our DC to DC converters, Mini-Monster and CLS products. Sales of our lighting control products for the year ended December 31, 2012 were down by 5.3% compared to the same period in 2011. This decrease was primarily due to reductions in demand for our CCFL and WLED products.
Cost of Revenue and Gross Margin
Cost of revenue consists primarily of costs incurred to manufacture, assemble and test our products, as well as warranty costs, inventory-related expenses and other overhead costs and stock-based compensation expenses. In addition, cost of revenue includes amortization of intangible assets from the Sensima acquisition beginning in the third quarter of 2014.
Year Ended December 31, | Percentage Change | Year Ended December 31, | Change | |||||||||||||||||||||||||||||||||||||
2013 | 2012 | 2011 | From 2012 to 2013 | From 2011 to 2012 | 2014 | 2013 | 2012 | From 2013 to 2014 | From 2012 to 2013 | |||||||||||||||||||||||||||||||
(in thousands, except percentages) | (in thousands, except percentages) | |||||||||||||||||||||||||||||||||||||||
Cost of revenue | $ | 110,190 | $ | 100,665 | $ | 94,925 | 9.5 | % | 6.0 | % | $ | 129,917 | $ | 110,190 | $ | 100,665 | 17.9 | % | 9.5 | % | ||||||||||||||||||||
Cost of revenue as a percentage of revenue | 46.3 | % | 47.1 | % | 48.3 | % | 46.0 | % | 46.3 | % | 47.1 | % | ||||||||||||||||||||||||||||
Gross profit | $ | 127,901 | $ | 113,148 | $ | 101,594 | 13.0 | % | 11.4 | % | $ | 152,618 | $ | 127,901 | $ | 113,148 | 19.3 | % | 13.0 | % | ||||||||||||||||||||
Gross margin | 53.7 | % | 52.9 | % | 51.7 | % | 54.0 | % | 53.7 | % | 52.9 | % | ||||||||||||||||||||||||||||
Cost of revenue was $129.9 million, or 46.0% of revenue, for the year ended December 31, 2014, and $110.2 million, or 46.3% of revenue, for the year ended December 31, 2013. The $19.7 million increase in cost of revenue was primarily due to a 37% increase in unit shipments, which was partially offset by a 14% decrease in the average direct cost of units shipped. In addition, the increase in cost of revenue was driven by an increase of $0.8 million in the provision for inventory reserve, and an increase of $0.7 million in amortization of intangible assets from the Sensima acquisition in July 2014.
Gross profit as a percentage of revenue, or gross margin, was 54.0% for the year ended December 31, 2014, compared to 53.7% for the year ended December 31, 2013. The increase in gross margin was primarily due to higher absorption of in-house test manufacturing overhead, compared to the same period in 2013. This increase was partially offset by an increase in the provision for inventory reserve and an increase in the amortization of intangible assets from the Sensima acquisition in July 2014.
Cost of revenue was $110.2 million, or 46.3% of revenue, for the year ended December, 2013, and $100.7 million, or 47.1% of revenue, for the year ended December, 2012. The $9.5 million increase in cost of revenue was primarily due to an 18% increase in unit shipments, which was partially offset by an 8% decrease in the average direct cost of units shipped. The increase in cost of revenue was partially offset by a decrease of $0.5 million in the provision for inventory reserve.
Gross margin was 53.7% for the year ended December 31, 2013, compared to 52.9% for the year ended December 31, 2012. The increase in gross margin year-over-year was primarily due to an improved product mixincreased sales of higher margin products and a lower provision for inventory reserves,reserve. This increase was partially offset in part by lower overhead capitalization, compared to the same period in 2012.absorption of in-house test manufacturing overhead.
Gross margin was 52.9% for the year ended December 31, 2012, compared to 51.7% for the year ended December 31, 2011. The increase in gross profit margin year-over-year was primarily due to lower inventory reserves and an improved product mix compared to the same period in 2011.
Research and Development
Research and development expenses primarily consist of salary and benefit expenses, bonuses and stock-based compensation expenses for design and product engineers, expenses related to new product development and relatedsupplies, and facility costs.
Year Ended December 31, Change 2014 2013 2012 From 2013 to 2014 From 2012 to 2013 (in thousands, except percentages) Research and development ("R&D") R&D as a percentage of revenue $ 58,590 $ 49,733 $ 48,796 17.8 % 1.9 % 20.7 % 20.9 % 22.8 %
Year Ended December 31, | Percentage Change | |||||||||||||||||||
2013 | 2012 | 2011 | From 2012 to 2013 | From 2011 to2012 | ||||||||||||||||
(in thousands, except percentages) | ||||||||||||||||||||
Research and development ("R&D") | $ | 49,733 | $ | 48,796 | $ | 44,518 | 1.9 | % | 9.6 | % | ||||||||||
R&D as a percentage of revenue | 20.9 | % | 22.8 | % | 22.7 | % | ||||||||||||||
R&D expenses were $58.6 million, or 20.7% of revenue, for the year ended December 31, 2014 and $49.7 million, or 20.9% of revenue, for the year ended December 31, 2013. The $8.9 million increase in R&D expenses was primarily due to an increase of $2.8 million in stock-based compensation expenses primarily associated with the performance-based and market-based equity awards, an increase of $2.4 million in new product development expenses, an increase of $2.0 million in cash compensation expenses, which include salary, benefits and bonuses, and an increase of $0.6 million in manufacturing and laboratory supplies. Our R&D headcount was 476 employees as of December 31, 2014, compared with 449 employees as of December 31, 2013.
R&D expenses were $49.7 million, or 20.9% of revenue, for the year ended December 31, 2013 and $48.8 million, or 22.8% of revenue, for the year ended December 31, 2012. The $0.9 million increase in R&D expenses increased year-over-yearwas primarily due to an increase of $1.6 million in depreciation expense, and an increase of $0.7 million in cash compensation expenses, which include salary, benefits and benefit expenses.bonuses. These increases were partially offset by a decrease of $0.7 million in stock-based compensation expenses primarily due to the cancellation of certain performance-based equity awards. Our R&D headcount was 449 employees as of December 31, 2013, was 449 employees, compared towith 388 employees as of December 31, 2012.
R&D expenses were $48.8 million, or 22.8% of revenue, for the year ended December 31, 2012 and $44.5 million, or 22.7% of revenue, for the year ended December 31, 2011. R&D expenses increased year-over-year primarily due to an increase in salary and benefit expenses, stock-based compensation expenses and expenses associated with increased new product development. Our R&D headcount as of December 31, 2012 was 388 employees, compared to 374 employees as of December 31, 2011.
Selling, General and Administrative
Selling, general and administrative expenses primarily include salary and benefit expenses, bonuses and stock-based compensation expenses for sales, marketing and administrative personnel, sales commissions, travel expenses, related facilities costs, and outside legal and accountingprofessional service fees.
Year Ended December 31, | Percentage Change | Year Ended December 31, | Change | |||||||||||||||||||||||||||||||||||||
2013 | 2012 | 2011 | From 2012 to 2013 | From 2011 to 2012 | 2014 | 2013 | 2012 | From 2013 to 2014 | From 2012 to 2013 | |||||||||||||||||||||||||||||||
(in thousands, except percentages) | (in thousands, except percentages) | |||||||||||||||||||||||||||||||||||||||
Selling, general and administrative ("SG&A") | $ | 54,624 | $ | 50,018 | $ | 40,280 | 9.2 | % | 24.2 | % | $ | 66,755 | $ | 54,624 | $ | 50,018 | 22.2 | % | 9.2 | % | ||||||||||||||||||||
SG&A as a percentage of revenue | 22.9 | % | 23.4 | % | 20.5 | % | 23.6 | % | 22.9 | % | 23.4 | % | ||||||||||||||||||||||||||||
SG&A expenses were $66.8 million, or 23.6% of revenue, for the year ended December 31, 2014 and $54.6 million, or 22.9% of revenue, for the year ended December 31, 2013. The $12.2 million increase in SG&A expenses was primarily due to an increase of $9.7 million in stock-based compensation expenses primarily associated with the performance-based and market-based equity awards, an increase of $0.9 million in professional service fees primarily due to the acquisition of Sensima, an increase of $0.5 million in cash compensation expenses, which include salary, benefits and bonuses, and an increase of $0.3 million in commission expenses due to higher revenue.Our SG&A headcount was 274 employees as of December 31, 2014, compared to 249 employees as of December 31, 2013.
SG&A expenses were $54.6 million, or 22.9% of revenue, for the year ended December 31, 2013 and $50.0 million, or 23.4% of revenue, for the year ended December 31, 2012. The $4.6 million increase in SG&A expenses increased year-over-yearwas primarily due to an increase of $2.6 million in stock-based compensation expenses primarily associated with the performance-based awards, an increase of $1.8 million in cash compensation expenses, which include salary, benefits and benefitbonuses, and an increase of $1.0 million in commission expenses and sales commissions ondue to higher revenue,revenue. These increases were partially offset in part by lowera decrease of $1.1 million in professional service fees. Ourfees.Our SG&A headcount was 249 employees as of December 31, 2013, was 249 employees, compared to 250 employees as of December 31, 2012.
SG&A expenses were $50.0Litigation Benefit, Net
Litigation benefit, net, was $(8.0) million or 23.4% of revenue, for the year ended December 31, 2012 and $40.32014, compared to litigation benefit, net, of $(0.4) million or 20.5% of revenue, for the year ended December 31, 2011. SG&A expenses increased year-over-year primarily due to an2013. Net litigation benefit for the year ended December 31, 2014 included the recognition of a $9.5 million award from the O2 Micro litigation, partially offset by $0.5 million of additional legal fees incurred in connection with the final resolution of the litigation. Net litigation benefit for the year ended December 31, 2013 included $0.8 million of proceeds received in connection with the legal settlement with Silergy Corporation. The increase in salary andnet litigation benefit expenses, stock-based compensation expenses, professional service fees and sales commissions on higher revenue. Our SG&A headcount as offor the year ended December 31, 20122014 was 250 employees,partially offset by higher expenses we incurred in other litigation matters, compared to 238 employees as of December 31, 2011.the same period in 2013.
Litigation Expense (Benefit), Net
Year Ended December 31, | Percentage Change | |||||||||||||||||||
2013 | 2012 | 2011 | From 2012 to 2013 | From 2011 to 2012 | ||||||||||||||||
(in thousands, except percentages) | ||||||||||||||||||||
Litigation expense (benefit), net | $ | (371 | ) | $ | (2,945 | ) | $ | 3,379 | (87.4% | ) | (187.2% | ) | ||||||||
Litigation expense (benefit), net, as a percentage of revenue | (0.2% | ) | (1.4% | ) | 1.7 | % | ||||||||||||||
Litigation benefit, net, was ($371,000), or (0.2%) of revenue,$(0.4) million for the year ended December 31, 2013, compared to a net litigation benefit, net, of ($2.9)$(2.9) million or (1.4%) of revenue, for the year ended December 31, 2012. The year-over-year decrease in litigation benefit was primarily due to $0.8 million received in 2013 in connection with the settlement from Silergy, compared with $3.7 million received in 2012 in connection with settlements from Linear and Silergy. These payments were recorded as credits to litigation expense (benefit), net, in the Consolidated Statements of Operations. No further amount was due to us from these two lawsuits as of December 31, 2013.
Litigation benefit, net, was ($2.9) million, or (1.4%) of revenue, for the year ended December 31, 2012, compared to a net expense of $3.4 million, or 1.7% of revenue, for the year ended December 31, 2011. The year-over-year decrease in litigation expense was primarily due to $3.7 million received in connection with settlements from Linear and Silergy in 2012. These payments were recorded as credits to litigation expense (benefit), net, in the Consolidated Statements of Operations. During the year ended December 31, 2011, we incurred additional legal expenses primarily relating to our lawsuits involving O2 Micro.
For a more complete description of our current material litigation matters, please see Part I, Item 3 “Legal Proceedings” and Note 1013 “Litigation” of Notes to Consolidated Financial Statements.
Interest and Other Income, Net
For the years ended December 31, 2014, 2013 2012 and 2011,2012, interest and other income, net, was $92,000, $611,000$1.1 million, $0.1 million and $309,000,$0.6 million, respectively. Interest and other income, net increased from 2013 to 2014 primarily due to lower foreign currency exchange losses and higher interest income in 2014 compared to 2013. Interest and other income, net, decreased from 2012 to 2013 primarily due to higher foreign currency exchange losses and lower interest income in 2013 compared to 2012. Interest and other income, net, increased from 2011 to 2012 primarily due to lower foreign currency exchange losses, partially offset by lower interest income in 2012 compared to 2011.
Income Tax Provision
The income tax provision for the year ended December 31, 2014 was $0.9 million or 2.5% of our income before income taxes. This differs from the federal statutory rate primarily because our foreign income was taxed at lower rates and because of the benefit that we realized as a result of stock options exercised and restricted units released and changes in our valuation allowance during the year.
The income tax provision for the year ended December 31, 2013 was $1.1 million or 4.6% of our income before income taxes. This differs from the federal statutory rate primarily because our foreign income was taxed at lower rates and because of the benefit that we realized as a result of stock options exercised and restricted stock units released and changes in our valuation allowance during the year.
The income tax provision for the year ended December 31, 2012 was $2.1 million or 11.9% of our income before income taxes. This differs from the federal statutory rate primarily because our foreign income was taxed at lower rates.The income tax provision for year ended December 31, 2011 was $0.4 million or 3.1% of our income before income taxes. This differs from the federal statutory rate primarily because our foreign income was taxed at lower rates.
For additional information, see Note 811 “Income Taxes” of the Notes to Consolidated Financial Statements.
Liquidity and Capital Resources
As of December 31, | As of December 31, | |||||||||||||||
2013 | 2012 | 2014 | 2013 | |||||||||||||
(In thousands) | (In thousands) | |||||||||||||||
Cash and cash equivalents | $ | 101,213 | $ | 75,104 | $ | 126,266 | $ | 101,213 | ||||||||
Short-term investments | 125,126 | 85,521 | 112,452 | 125,126 | ||||||||||||
Total cash, cash equivalents and short-term investments | $ | 226,339 | $ | 160,625 | $ | 238,718 | $ | 226,339 | ||||||||
Percentage of total assets | 61.4 | % | 55.9 | % | 59.8 | % | 61.4 | % | ||||||||
Total current assets | $ | 292,086 | $ | 214,301 | $ | 308,146 | $ | 292,086 | ||||||||
Total current liabilities | (38,489 | ) | (23,460 | ) | (36,861 | ) | (38,489 | ) | ||||||||
Working capital | $ | 253,597 | $ | 190,841 | $ | 271,285 | $ | 253,597 | ||||||||
As of December 31, 2013,2014, we had cash and cash equivalents of $126.3 million and short-term investments of $112.5 million, compared with cash and cash equivalents of $101.2 million and short-term investments of $125.1 million compared with cash and cash equivalents of $75.1 million and short-term investments of $85.5 million as of December 31, 2012. The increase of $26.1 million in cash and cash equivalents was primarily due to cash generated from operating activities, a cash payment received in connection with the O2 Micro litigation, and proceeds from stock option exercises and stock purchases under our employee stock purchase plan. This increase was partially offset by repurchases of our common stock, property and equipment purchases and investment in short-term securities.2013. As of December 31, 2013, $58.22014, $56.4 million of cash and cash equivalents and $17.0$35.8 million of short-term investments were held by our international subsidiaries. If these funds are needed for our operations in the U.S., we may be required to accrue and pay U.S. taxes to repatriate these funds. However, our intent is to indefinitely reinvest these funds outside of the U.S. and our current plans do not demonstrate a need to repatriate them to fund our U.S. operations.
The significant components of our working capital are cash and cash equivalents, short-term investments, accounts receivable, inventories, deferred income taxes and prepaid expenses and other current assets, reduced by accounts payable, accrued compensation and related benefits, and other current liabilities, deferred revenue and customer prepayments.
accrued liabilities. As of December 31, 2013,2014, we had working capital of $253.6$271.3 million, compared with working capital of $190.8$253.6 million as of December 31, 2012.2013. The $62.8$17.7 million increase in working capital was due to a $77.8$16.1 million increase in current assets net ofand a $15.0$1.6 million increasedecrease in current liabilities. The increase in current assets was primarily due to an increase in cash and cash equivalents, short-term investments,an increase in inventory, and an increase in accounts receivable, and inventories.partially offset by a decrease in short-term investments. The increasedecrease in current liabilities was primarily due to an increasea decrease in accrued compensation and related benefits, and a decrease in other accrued liabilities, which included a cash payment received from the O2 Micro litigation. partially offset by an increase in accounts payable.
Summary of Cash Flows
The following table below summarizes our cash flow activities:
Year Ended December 31, | ||||||||||||
2014 | 2013 | 2012 | ||||||||||
(In thousands) | ||||||||||||
Net cash provided by operating activities | $ | 74,133 | $ | 60,686 | $ | 24,912 | ||||||
Net cash used in investing activities | (9,367 | ) | (54,324 | ) | (26,837 | ) | ||||||
Net cash provided by (used in) financing activities | (39,227 | ) | 18,850 | (19,553 | ) | |||||||
Effect of exchange rate changes on cash and cash equivalents | (486 | ) | 897 | 211 | ||||||||
Net increase (decrease) in cash and cash equivalents | $ | 25,053 | $ | 26,109 | $ | (21,267 | ) | |||||
For the year ended December 31, 2014, net cash and cash equivalents provided by (used in)operating activities was $74.1 million, primarily due to our net income adjusted for certain non-cash items, including depreciation and amortization and stock-based compensation, and a net decrease of $8.0 million from the changes in our operating investingassets and financing activities:
Year Ended December 31, | ||||||||||||
2013 | 2012 | 2011 | ||||||||||
(In thousands) | ||||||||||||
Cash provided by operating activities | $ | 60,686 | $ | 24,912 | $ | 43,685 | ||||||
Cash provided by (used in) investing activities | (54,324 | ) | (26,837 | ) | 36,222 | |||||||
Cash provided by (used in) financing activities | 18,850 | (19,553 | ) | (31,975 | ) | |||||||
Effect of exchange rate changes on cash and cash equivalents | 897 | 211 | 429 | |||||||||
Net increase (decrease) in cash and cash equivalents | $ | 26,109 | $ | (21,267 | ) | $ | 48,361 | |||||
liabilities. The increase in accounts receivable was primarily due to higher sales and an increase in shipments in the fourth quarter of 2014. The increase in inventories was primarily due to an increase in strategic wafer and die bank inventories as well as an increase in finished goods necessary to meet anticipated future demand. The increase in accounts payable was primarily driven by increased inventory and capital asset purchases to meet anticipated future demand. The decrease in accrued liabilities was primarily driven by the release of the liability related to the O2 Micro litigation, partially offset by an increase in employee contributions to the deferred compensation plan. For the year ended December 31, 2013, net cash provided by operating activities was $60.7 million, primarily due to cash contributed from our operating results during the year and athe cash payment of $9.5 million received in connection with the O2 Micro litigation recorded as a liability as of December 31, 2013. These increases were partially offset by increases in both inventories and accounts receivable. The increase in accounts receivable resulted in large measureprimarily from an increase in shipments. The increase in inventories was primarily due to an increase in strategic wafer and die bank inventories as well as finished goods to meet anticipated future demand. NetFor the year ended December 31, 2012, net cash provided by operating activities was $24.9 million, for the year ended December 31, 2012, primarily reflecting cash contributed from our operating results, partially offset by $27.8 million increase in working capital requirements.
For the year ended December 31, 2011,2014, net cash provided by operatingused in investing activities was $43.7$9.4 million, primarily reflectingdue to net cash generatedof $11.6 million paid to acquire Sensima, purchases of property and equipment of $9.5 million, and net purchases of investments of $7.1 million, partially offset by proceeds of $4.7 million from our operating results.
the redemption of auction-rate securities. For the year ended December 31, 2013, net cash used in investing activities was $54.3 million, primarily reflecting net purchases of short-term investments and purchases of property and equipment, partially offset by proceeds from the redemption of auction-rate securities. For the year ended December 31, 2012, net cash used in investing activities was $26.8 million related to our investment in equipment, building improvements at our new headquarters located in San Jose, California and net purchases of short-term investments, partially offset by proceeds from the redemption of auction-rate securities.
For the year ended December 31, 2011,2014, net cash provided by investingused in financing activities was $36.2$39.2 million, primarily from net proceeds from the salesreflecting $41.2 million used in repurchases of short-term investmentsour common stock pursuant to our stock repurchase program and the redemption of auction-rate securities,$11.7 million used to pay dividends to our stockholders and dividend equivalents to our employees who hold restricted stock units (“RSUs”), partially offset by purchases of property and equipment.
We use professional investment management firms to manage the majority of our invested cash. Our fixed income portfolio is primarily invested in U.S. government securities and auction-rate securities. The balance of the fixed income portfolio is managed internally and invested primarily in money market securities for working capital purposes.
Our investment portfolio as of December 31, 2013 included $9.9 million in government-backed student loan auction-rate securities, net of impairment charges of $390,000, of which $360,000 was temporary and $30,000 was recorded as other-than-temporary. This compares to an investment balance as of December 31, 2012 of $11.8 million in government-backed student loan auction-rate securities, net of impairment charges of $520,000, of which $490,000 was temporary and $30,000 was recorded as other-than-temporary. For the years ended December 31, 2013 and 2012, we redeemed $2.0 million and $2.1$14.0 million of auction-rate securities at par.
cash proceeds from stock option exercises and issuance of shares through our employee stock purchase plan. For the year ended December 31, 2013, net cash provided by financing activities was $18.9 million, primarily reflecting $40.0 million of cash proceeds from stock option exercises and stock purchasesissuance of shares through our employee stock purchase plan, partially offset by $20.6 million used in the repurchases of our common stock. Net cash used in financing activities forstock pursuant to our stock repurchase program. For the year ended December 31, 2012, net cash used in financing activities was $19.6 million, primarily reflecting the $35.7 million cash dividenddividends paid to common stockholders on December 28, 2012, partially offset by $15.2 million of cash proceeds from stock option exercises and stock purchasesissuance of shares through our employee stock purchase plan. Net cash used in financing activities for the year ended December 31, 2011 was $32.0 million, primarily reflecting $38.5 million of stock repurchases, which was partially offset by $6.5 million of cash proceeds from stock option exercises and stock purchases through our employee stock purchase plan.
In July 2013, theour Board of Directors approved a stock repurchase program that authorizes us to repurchase up to $100 million in the aggregate of our common stock through June 30, 2015. All shares are retired upon repurchase. FromFor the inceptionyear ended December 31, 2014, we repurchased a total of 1.1 million shares for $41.2 million, at an average price of $39.19 per share. For the program throughyear ended December 31, 2013, we repurchased a total of 663,8020.7 million shares for $20.6 million, at an average price of $31.06 per share. As of December 31, 2013, $79.42014, $38.2 million remained available for future repurchases under the program.
In June 2014, our Board of Directors approved a dividend program pursuant to which we intend to pay quarterly cash dividends on our common stock. In addition, RSU awards contain rights to receive dividend equivalents, which entitle employees who hold RSUs to the same dividend value per share as holders of common stock. Dividend equivalents accrued on the RSUs are forfeited if the employees do not fulfill their service requirement during the vesting periods. For the year ended December 31, 2014, we paid dividends and dividend equivalents totaling $11.7 million. In addition, our Board of Directors authorized dividend payments totaling $5.8 million to stockholders of record on December 31, 2014, which will be paid on January 15, 2015.
Although cash requirements will fluctuate based on the timing and extent of many factors such as those discussed above, we believe that cash generated from operations, together with the liquidity provided by existing cash balances and short-term investments, will be sufficient to satisfy our liquidity requirements for the next 12 months. For further details regardingWe anticipate the cash used for future dividends, dividend equivalents and the stock repurchase program will come from our operating, investingcurrent domestic cash and financing activities, see the Consolidated Statements of Cash Flows.cash generated from ongoing U.S. operations. If cash held by our international subsidiaries is needed for these payments, we may be required to accrue and pay U.S. taxes to repatriate these funds.
In the future, in order to strengthen our financial position, in the event of unforeseen circumstances, or in the event we need to fund our growth in future financial periods, we may need to raise additional funds by any one or a combination of the following: issuing equity securities, issuing debt or convertible debt securities, incurring indebtedness secured by our assets, or selling certain product lines and/or portions of our business. There can be no guarantee that we will be able to raise additional funds on terms acceptable to us, or at all.
From time to time, we have engaged in discussions with third parties concerning potential acquisitions of product lines, technologies, businesses and companies, and we continue to consider potential acquisition candidates. Any such transactions could involve the issuance of a significant number of new equity securities, assumptions of debt, and/or payment of cash consideration. We may also be required to raise additional funds to complete any such acquisition, through either the issuance of equity and debt securities or incurring indebtedness secured by our assets. If we raise additional funds or acquire businesses or technologies through the issuance of equity securities or convertible debt securities, our existing stockholders may experience significant dilution.
Contractual Obligations
The following table summarizes our contractual obligations at December 31, 20132014 (in thousands):
Payment Due by Period | ||||||||||||||||||||||||||||||||||||||||
Total | 2014 | 2015 | 2016 | 2017 and Thereafter | Total | Less Than 1 Year | 1 - 3 Years | 3 - 5 Years | More Than 5 years | |||||||||||||||||||||||||||||||
Operating leases | $ | 2,019 | $ | 739 | $ | 600 | $ | 567 | $ | 113 | $ | 2,322 | $ | 1,094 | $ | 1,060 | $ | 130 | $ | 38 | ||||||||||||||||||||
Outstanding purchase commitments | 12,350 | 12,350 | - | - | - | |||||||||||||||||||||||||||||||||||
Other obligations | 1,250 | 400 | 300 | 300 | 250 | |||||||||||||||||||||||||||||||||||
Outstanding purchase commitments (1) | 44,203 | 42,123 | 480 | 300 | 1,300 | |||||||||||||||||||||||||||||||||||
Other long-term obligations (2) | 9,965 | - | 4,283 | 2,052 | 3,630 | |||||||||||||||||||||||||||||||||||
Total | $ | 15,619 | $ | 13,489 | $ | 900 | $ | 867 | $ | 363 | $ | 56,490 | $ | 43,217 | $ | 5,823 | $ | 2,482 | $ | 4,968 | ||||||||||||||||||||
______________
(1) | Outstanding purchase commitments primarily consist of wafer purchases from our foundries, assembly services and license arrangements. |
Our outstanding purchase commitments primarily consist of wafer purchases from our foundries and assembly services. As of December 31, 2013, the outstanding balance was $12.4 million compared with $15.5 million as of December 31, 2012.
Because of the uncertainty as to the timing of payments related to our liabilities for unrecognized tax benefits, we have excluded estimated obligations of $5.5 million from the table above. In addition, because of the uncertainty as to the timing of distributions related to our liabilities for the employee deferred compensation plan, we have excluded estimated obligations of $0.6
(2) | Other long-term obligations include future cash payments to satisfy long-term liabilities reflected in our Consolidated Balance Sheets, which primarily consist of employee deferred compensation plan liabilities, contingent consideration related to the Sensima acquisition, and accrued dividend equivalents. Because of the uncertainty as to the timing of distributions related to a portion of the employee deferred compensation plan liabilities, we have excluded estimated obligations of $0.2 million from the table above. In addition, because of the uncertainty as to the timing of payments related to our liabilities for unrecognized tax benefits, we have excluded estimated obligations of $5.3 million from the table above. |
Off Balance Sheet Arrangements
As of December 31, 2013,2014, we had no off-balance sheet arrangements as defined in Item 303(a)(4) of the Securities and Exchange Commission’s Regulation S-K.
ITEM 7A. QUANTITATIVE AND QUALITATIVE DISCLOSURES ABOUT MARKET RISK
Interest Rate Risk
Our cash equivalents and investments are subject to market risk, primarily interest rate and credit risk. Our investments are managed by outside professional managers within investment guidelines set by us. Such guidelines include security type, credit quality and maturity and are intended to limit market risk by restricting our investments to high quality debt instruments with relatively short-term maturities. Fluctuations in interest rates of 10% would not have a material impact on our results of operations.
We do not use derivative financial instruments in our investment portfolio. Investments in debt securities are classified as available-for-sale. For available-for-sale investments, no gains or losses are recognized by us in our results of operations due to changes in interest rates unless such securities are sold prior to maturity or are determined to be other-than-temporarily impaired. Available-for-sale investments are reported at fair value with the related unrealized gains or losses being included in accumulated other comprehensive income, a component of stockholders’ equity.
Long-Term Investments
As of December 31, 2013,2014, all of our holdings in auction rate securities, which have a face value of $10.3$5.6 million, have failed to reset as a result of current market conditions. Should these auctions continue to fail and if the credit rating for these securities decline, a 10% decline in the fair value could impact our results of operations by approximately $1.0$0.5 million.
Foreign Currency Exchange Risk
Our sales outside the United States are primarily transacted in U.S. dollars. Accordingly, our sales are not generally impacted by foreign currency rate changes. The functional currency of the Company’s offshore operations is the local currency, primarily the Chinese Yuan andRenminbi, the New Taiwan Dollar.Dollar and the Euro. In addition, we incur foreign currency exchange gains or losses related to the timing of payments for transactions between the U.S. and our foreign subsidiaries, which are reported in interest and other income. To date, fluctuations in foreign currency exchange rates have not had a material impact on our results of operations.
ITEM 8. FINANCIAL STATEMENTS AND SUPPLEMENTARY DATA
MONOLITHIC POWER SYSTEMS, INC.
CONSOLIDATED FINANCIAL STATEMENTS
Contents
| Page |
Report of Independent Registered Public Accounting Firm | 39 |
Consolidated Balance Sheets | 40 |
Consolidated Statements of Operations | 41 |
Consolidated Statements of Comprehensive Income | 42 |
Consolidated Statements of Stockholders’ Equity | 43 |
Consolidated Statements of Cash Flows | 44 |
Notes to Consolidated Financial Statements | 45 |
REPORT OF INDEPENDENT REGISTERED PUBLIC ACCOUNTING FIRM
To the Board of Directors and Stockholders of
Monolithic Power Systems, Inc.
San Jose, California
We have audited the accompanying consolidated balance sheets of Monolithic Power Systems, Inc. and subsidiaries (the "Company") as of December 31, 20132014 and 2012,2013, and the related consolidated statements of operations, comprehensive income, stockholders' equity, and cash flows for each of the three years in the period ended December 31, 2013.2014. These financial statements are the responsibility of the Company's management. Our responsibility is to express an opinion on these financial statements based on our audits.
We conducted our audits in accordance with the standards of the Public Company Accounting Oversight Board (United States). Those standards require that we plan and perform the audit to obtain reasonable assurance about whether the financial statements are free of material misstatement. An audit includes examining, on a test basis, evidence supporting the amounts and disclosures in the financial statements. An audit also includes assessing the accounting principles used and significant estimates made by management, as well as evaluating the overall financial statement presentation. We believe that our audits provide a reasonable basis for our opinion.
In our opinion, such consolidated financial statements present fairly, in all material respects, the financial position of Monolithic Power Systems, Inc. and subsidiaries as of December 31, 20132014 and 2012,2013, and the results of their operations and their cash flows for each of the three years in the period ended December 31, 2013,2014, in conformity with accounting principles generally accepted in the United States of America.
We have also audited, in accordance with the standards of the Public Company Accounting Oversight Board (United States), the Company's internal control over financial reporting as of December 31, 2013,2014, based on the criteria established inInternal Control – Integrated Framework (1992)(2013)issued by the Committee of Sponsoring Organizations of the Treadway Commission, and our report dated March 10, 20142, 2015 expressed an unqualified opinion on the Company's internal control over financial reporting.
/s/ DELOITTE & TOUCHE LLP
San Jose, California
March 10, 20142, 2015
MONOLITHIC POWER SYSTEMS, INC.
CONSOLIDATED BALANCE SHEETS
(in thousands, except par value)
December 31, | December 31, | |||||||||||||||
December 31, 2013 | December 31, 2012 | 2014 | 2013 | |||||||||||||
ASSETS | ||||||||||||||||
Current assets: | ||||||||||||||||
Cash and cash equivalents | $ | 101,213 | $ | 75,104 | $ | 126,266 | $ | 101,213 | ||||||||
Short-term investments | 125,126 | 85,521 | 112,452 | 125,126 | ||||||||||||
Accounts receivable, net of allowances of $0 as of December 31, 2013 and $20 as of December 31, 2012 | 23,730 | 19,383 | ||||||||||||||
Accounts receivable, net | 25,630 | 23,730 | ||||||||||||||
Inventories | 39,737 | 32,115 | 40,918 | 39,737 | ||||||||||||
Deferred income tax assets, net | 294 | 1 | ||||||||||||||
Prepaid expenses and other current assets | 1,986 | 2,177 | 2,880 | 2,280 | ||||||||||||
Total current assets | 292,086 | 214,301 | 308,146 | 292,086 | ||||||||||||
Property and equipment, net | 64,837 | 59,412 | 62,942 | 64,837 | ||||||||||||
Long-term investments | 9,860 | 11,755 | 5,389 | 9,860 | ||||||||||||
Deferred income tax assets, net | 481 | 669 | ||||||||||||||
Goodwill | 6,571 | - | ||||||||||||||
Acquisition-related intangible assets, net | 6,812 | - | ||||||||||||||
Deferred tax assets, net | 1,049 | 481 | ||||||||||||||
Other long-term assets | 1,644 | 1,025 | 8,457 | 1,644 | ||||||||||||
Total assets | $ | 368,908 | $ | 287,162 | $ | 399,366 | $ | 368,908 | ||||||||
LIABILITIES AND STOCKHOLDERS’ EQUITY | ||||||||||||||||
Current liabilities: | ||||||||||||||||
Accounts payable | $ | 10,694 | $ | 9,859 | $ | 13,138 | $ | 10,694 | ||||||||
Accrued compensation and related benefits | 10,419 | 7,686 | 9,020 | 10,419 | ||||||||||||
Accrued liabilities | 17,376 | 5,915 | 14,703 | 17,376 | ||||||||||||
Total current liabilities | 38,489 | 23,460 | 36,861 | 38,489 | ||||||||||||
Income tax liabilities | 5,542 | 5,408 | ||||||||||||||
Deferred tax and other tax liabilities | 5,876 | 5,542 | ||||||||||||||
Other long-term liabilities | 1,478 | - | 10,204 | 1,478 | ||||||||||||
Total liabilities | 45,509 | 28,868 | 52,941 | 45,509 | ||||||||||||
Commitments and contingencies (Notes 8, 9 and 10) | ||||||||||||||||
Commitments and contingencies (notes 11, 12 and 13) | ||||||||||||||||
Stockholders' equity: | ||||||||||||||||
Common stock, $0.001 par value; shares authorized: 150,000; shares issued and outstanding: 38,291 and 35,673 as of December 31, 2013 and December 31, 2012, respectively | 234,201 | 194,079 | ||||||||||||||
Common stock, $0.001 par value; shares authorized: 150,000; shares issued and outstanding: 38,832 and 38,291 as of December 31, 2014 and December 31, 2013, respectively | 240,500 | 234,201 | ||||||||||||||
Retained earnings | 82,938 | 60,040 | 100,114 | 82,938 | ||||||||||||
Accumulated other comprehensive income | 6,260 | 4,175 | 5,811 | 6,260 | ||||||||||||
Total stockholders’ equity | 323,399 | 258,294 | 346,425 | 323,399 | ||||||||||||
Total liabilities and stockholders’ equity | $ | 368,908 | $ | 287,162 | $ | 399,366 | $ | 368,908 | ||||||||
See accompanying notes to consolidated financial statements.
MONOLITHIC POWER SYSTEMS, INC.
CONSOLIDATED STATEMENTS OF OPERATIONS
(in thousands, except per share amounts)
Year Ended December 31, | Year Ended December 31, | |||||||||||||||||||||||
2013 | 2012 | 2011 | 2014 | 2013 | 2012 | |||||||||||||||||||
Revenue | $ | 238,091 | $ | 213,813 | $ | 196,519 | $ | 282,535 | $ | 238,091 | $ | 213,813 | ||||||||||||
Cost of revenue | 110,190 | 100,665 | 94,925 | 129,917 | 110,190 | 100,665 | ||||||||||||||||||
Gross profit | 127,901 | 113,148 | 101,594 | 152,618 | 127,901 | 113,148 | ||||||||||||||||||
Operating expenses: | ||||||||||||||||||||||||
Research and development | 49,733 | 48,796 | 44,518 | 58,590 | 49,733 | 48,796 | ||||||||||||||||||
Selling, general and administrative | 54,624 | 50,018 | 40,280 | 66,755 | 54,624 | 50,018 | ||||||||||||||||||
Litigation expense (benefit), net | (371 | ) | (2,945 | ) | 3,379 | |||||||||||||||||||
Litigation benefit, net | (8,027 | ) | (371 | ) | (2,945 | ) | ||||||||||||||||||
Total operating expenses | 103,986 | 95,869 | 88,177 | 117,318 | 103,986 | 95,869 | ||||||||||||||||||
Income from operations | 23,915 | 17,279 | 13,417 | 35,300 | 23,915 | 17,279 | ||||||||||||||||||
Interest and other income, net | 92 | 611 | 309 | 1,092 | 92 | 611 | ||||||||||||||||||
Income before income taxes | 24,007 | 17,890 | 13,726 | 36,392 | 24,007 | 17,890 | ||||||||||||||||||
Income tax provision | 1,109 | 2,134 | 425 | 897 | 1,109 | 2,134 | ||||||||||||||||||
Net income | $ | 22,898 | $ | 15,756 | $ | 13,301 | $ | 35,495 | $ | 22,898 | $ | 15,756 | ||||||||||||
Basic net income per share | $ | 0.61 | $ | 0.45 | $ | 0.39 | ||||||||||||||||||
Diluted net income per share | $ | 0.59 | $ | 0.43 | $ | 0.38 | ||||||||||||||||||
Weighted average common shares outstanding: | ||||||||||||||||||||||||
Net income per share: | ||||||||||||||||||||||||
Basic | 37,387 | 34,871 | 34,050 | $ | 0.92 | $ | 0.61 | $ | 0.45 | |||||||||||||||
Diluted | 38,620 | 36,247 | 35,160 | $ | 0.89 | $ | 0.59 | $ | 0.43 | |||||||||||||||
Weighted-average shares outstanding: | ||||||||||||||||||||||||
Basic | 38,686 | 37,387 | 34,871 | |||||||||||||||||||||
Diluted | 39,793 | 38,620 | 36,247 | |||||||||||||||||||||
Cash dividends declared per common share | $ | 0.45 | $ | - | $ | 1.00 | ||||||||||||||||||
See accompanying notes to consolidated financial statements.
MONOLITHIC POWER SYSTEMS, INC.
CONSOLIDATED STATEMENTS OF COMPREHENSIVE INCOME
(in thousands)
Year Ended December 31, | ||||||||||||
2013 | 2012 | 2011 | ||||||||||
Net income | $ | 22,898 | $ | 15,756 | $ | 13,301 | ||||||
Other comprehensive income, net of tax: | ||||||||||||
Change in unrealized losses on auction-rate securities, net of $0 tax in 2013, 2012 and 2011 | 130 | 140 | 270 | |||||||||
Change in unrealized gains on other available-for-sale securities, net of $0 tax in 2013, 2012 and 2011 | (33 | ) | 34 | (37 | ) | |||||||
Foreign currency translation adjustments | 1,988 | 408 | 1,381 | |||||||||
Total other comprehensive income, net of tax | 2,085 | 582 | 1,614 | |||||||||
Comprehensive income | $ | 24,983 | $ | 16,338 | $ | 14,915 | ||||||
Year Ended December 31, | ||||||||||||
2014 | 2013 | 2012 | ||||||||||
Net income | $ | 35,495 | $ | 22,898 | $ | 15,756 | ||||||
Other comprehensive income (loss), net of tax: | ||||||||||||
Change in unrealized losses on auction-rate securities, net of $0 tax in 2014, 2013 and 2012 | 179 | 130 | 140 | |||||||||
Change in unrealized gains/losses on other available-for-sale securities, net of $0 tax in 2014, 2013 and 2012 | (19 | ) | (33 | ) | 34 | |||||||
Foreign currency translation adjustments | (609 | ) | 1,988 | 408 | ||||||||
Total other comprehensive income (loss), net of tax | (449 | ) | 2,085 | 582 | ||||||||
Comprehensive income | $ | 35,046 | $ | 24,983 | $ | 16,338 | ||||||
See accompanying notes to consolidated financial statements.
MONOLITHIC POWER SYSTEMS, INC.
CONSOLIDATED STATEMENTS OF STOCKHOLDERS’ EQUITY
(in thousands)
Common Stock |
Retained |
Accumulated Other Comprehensive |
Total Stockholders’ | |||||||||||||||||
Shares | Amount | Earnings | Income | Equity | ||||||||||||||||
Balance as of January 1, 2011 | 35,063 | $ | 178,269 | $ | 66,647 | $ | 1,979 | $ | 246,895 | |||||||||||
Net income | - | - | 13,301 | 13,301 | ||||||||||||||||
Change in unrealized losses on auction-rate securities | - | - | - | 270 | 270 | |||||||||||||||
Change in unrealized gains on other available-for-sale securities | - | - | - | (37 | ) | (37 | ) | |||||||||||||
Foreign currency translation adjustments | - | - | - | 1,381 | 1,381 | |||||||||||||||
Exercise of stock options and related tax benefit | 685 | 4,630 | - | - | 4,630 | |||||||||||||||
Repurchase of common shares | (2,485 | ) | (38,472 | ) | - | - | (38,472 | ) | ||||||||||||
Shares purchased through employee stock purchase plan | 150 | 1,773 | - | - | 1,773 | |||||||||||||||
Stock-based compensation expense | - | 13,123 | - | - | 13,123 | |||||||||||||||
Compensation expense for non-employee stock options | - | 13 | - | - | 13 | |||||||||||||||
Release of restricted stock | 413 | - | - | - | - | |||||||||||||||
Balance as of December 31, 2011 | 33,826 | 159,336 | 79,948 | 3,593 | 242,877 | |||||||||||||||
Net income | - | - | 15,756 | - | 15,756 | |||||||||||||||
Change in unrealized losses on auction-rate securities | - | - | - | 140 | 140 | |||||||||||||||
Change in unrealized gains on other available-for-sale securities | - | - | - | 34 | 34 | |||||||||||||||
Foreign currency translation adjustments | - | - | - | 408 | 408 | |||||||||||||||
Cash dividend | - | - | (35,664 | ) | - | (35,664 | ) | |||||||||||||
Exercise of stock options and related tax benefit | 1,152 | 14,232 | - | - | 14,232 | |||||||||||||||
Shares purchased through employee stock purchase plan | 152 | 1,852 | - | - | 1,852 | |||||||||||||||
Stock-based compensation expense | - | 18,642 | - | - | 18,642 | |||||||||||||||
Compensation expense for non-employee stock options | - | 17 | - | - | 17 | |||||||||||||||
Release of restricted stock | 543 | - | - | - | - | |||||||||||||||
Balance as of December 31, 2012 | 35,673 | 194,079 | 60,040 | 4,175 | 258,294 | |||||||||||||||
Net income | - | - | 22,898 | - | 22,898 | |||||||||||||||
Change in unrealized losses on auction-rate securities | - | - | - | 130 | 130 | |||||||||||||||
Change in unrealized gains on other available-for-sale securities | - | - | - | (33 | ) | (33 | ) | |||||||||||||
Foreign currency translation adjustments | - | - | - | 1,988 | 1,988 | |||||||||||||||
Exercise of stock options | 2,446 | 37,877 | - | - | 37,877 | |||||||||||||||
Repurchase of common shares | (664 | ) | (20,615 | ) | - | - | (20,615 | ) | ||||||||||||
Shares purchased through employee stock purchase plan | 111 | 2,145 | - | - | 2,145 | |||||||||||||||
Stock-based compensation expense | - | 20,715 | - | - | 20,715 | |||||||||||||||
Release of restricted stock | 725 | - | - | - | - | |||||||||||||||
Balance as of December 31, 2013 | 38,291 | $ | 234,201 | $ | 82,938 | $ | 6,260 | $ | 323,399 | |||||||||||
Accumulated | ||||||||||||||||||||
Other | Total | |||||||||||||||||||
Common Stock | Retained | Comprehensive | Stockholders’ | |||||||||||||||||
Shares | Amount | Earnings | Income | Equity | ||||||||||||||||
Balance as of January 1, 2012 | 33,826 | $ | 159,336 | $ | 79,948 | $ | 3,593 | $ | 242,877 | |||||||||||
Net income | - | - | 15,756 | - | 15,756 | |||||||||||||||
Other comprehensive income | - | - | - | 582 | 582 | |||||||||||||||
Dividends declared | - | - | (35,664 | ) | - | (35,664 | ) | |||||||||||||
Exercise of stock options and related tax benefits | 1,152 | 14,232 | - | - | 14,232 | |||||||||||||||
Shares issued under the employee stock purchase plan | 152 | 1,852 | - | - | 1,852 | |||||||||||||||
Stock-based compensation expense | - | 18,659 | - | - | 18,659 | |||||||||||||||
Release of restricted stock | 543 | - | - | - | - | |||||||||||||||
Balance as of December 31, 2012 | 35,673 | 194,079 | 60,040 | 4,175 | 258,294 | |||||||||||||||
Net income | - | - | 22,898 | - | 22,898 | |||||||||||||||
Other comprehensive income | - | - | - | 2,085 | 2,085 | |||||||||||||||
Exercise of stock options and related tax benefits | 2,446 | 37,877 | - | - | 37,877 | |||||||||||||||
Repurchase of common shares | (664 | ) | (20,615 | ) | - | - | (20,615 | ) | ||||||||||||
Shares issued under the employee stock purchase plan | 111 | 2,145 | - | - | 2,145 | |||||||||||||||
Stock-based compensation expense | - | 20,715 | - | - | 20,715 | |||||||||||||||
Release of restricted stock | 725 | - | - | - | - | |||||||||||||||
Balance as of December 31, 2013 | 38,291 | 234,201 | 82,938 | 6,260 | 323,399 | |||||||||||||||
Net income | - | - | 35,495 | - | 35,495 | |||||||||||||||
Other comprehensive loss | - | - | - | (449 | ) | (449 | ) | |||||||||||||
Dividends and dividend equivalents declared | - | - | (18,319 | ) | - | (18,319 | ) | |||||||||||||
Exercise of stock options and related tax benefits | 742 | 11,960 | - | - | 11,960 | |||||||||||||||
Repurchase of common shares | (1,051 | ) | (41,198 | ) | - | - | (41,198 | ) | ||||||||||||
Shares issued under the employee stock purchase plan | 78 | 2,078 | - | - | 2,078 | |||||||||||||||
Stock-based compensation expense | - | 33,459 | - | - | 33,459 | |||||||||||||||
Release of restricted stock | 772 | - | - | - | - | |||||||||||||||
Balance as of December 31, 2014 | 38,832 | $ | 240,500 | $ | 100,114 | $ | 5,811 | $ | 346,425 | |||||||||||
See accompanying notes to consolidated financial statements.
MONOLITHIC POWER SYSTEMS, INC.
CONSOLIDATED STATEMENTS OF CASH FLOWS
(in thousands)
Year Ended December 31, | ||||||||||||
2013 | 2012 | 2011 | ||||||||||
Cash flows from operating activities: | ||||||||||||
Net income | $ | 22,898 | $ | 15,756 | $ | 13,301 | ||||||
Adjustments to reconcile net income to net cash provided by operating activities: | ||||||||||||
Depreciation and amortization | 12,160 | 9,332 | 8,732 | |||||||||
Loss on disposal of property and equipment | 31 | 81 | 33 | |||||||||
Amortization and loss on investments | 443 | 254 | 376 | |||||||||
Gain on auction-rate securities | - | (40 | ) | - | ||||||||
Deferred income tax assets | (81 | ) | (8 | ) | (403 | ) | ||||||
Excess tax benefit from stock option transactions | - | (869 | ) | (27 | ) | |||||||
Stock-based compensation | 20,701 | 18,652 | 13,126 | |||||||||
Changes in operating assets and liabilities: | ||||||||||||
Accounts receivable | (4,347 | ) | (4,286 | ) | 3,250 | |||||||
Inventories | (7,606 | ) | (12,004 | ) | 5,699 | |||||||
Prepaid expenses and other current assets | 121 | (456 | ) | 673 | ||||||||
Accounts payable | 1,440 | 754 | (957 | ) | ||||||||
Accrued liabilities | 12,149 | (2,097 | ) | (438 | ) | |||||||
Accrued income taxes payable and long-term income tax liabilities | 86 | 1,476 | (169 | ) | ||||||||
Accrued compensation and related benefits | 2,691 | (1,633 | ) | 489 | ||||||||
Net cash provided by operating activities | 60,686 | 24,912 | 43,685 | |||||||||
Cash flows from investing activities: | ||||||||||||
Property and equipment purchases | (15,764 | ) | (21,059 | ) | (21,022 | ) | ||||||
Proceeds from sale of property and equipment | 88 | 13 | - | |||||||||
Premiums paid on deferred compensation plan | (617 | ) | - | - | ||||||||
Purchases of short-term investments | (125,756 | ) | (143,094 | ) | (78,250 | ) | ||||||
Proceeds from sale of short-term investments | 85,700 | 135,183 | 129,719 | |||||||||
Proceeds from sale of long-term investments | 2,025 | 2,100 | 5,775 | |||||||||
Change in restricted assets | - | 20 | - | |||||||||
Net cash provided by (used in) investing activities | (54,324 | ) | (26,837 | ) | 36,222 | |||||||
Cash flows from financing activities: | ||||||||||||
Property and equipment purchased on extended payment terms | (557 | ) | - | - | ||||||||
Proceeds from issuance of common shares | 37,877 | 13,390 | 4,697 | |||||||||
Proceeds from employee stock purchase plan | 2,145 | 1,852 | 1,773 | |||||||||
Repurchases of common shares | (20,615 | ) | - | (38,472 | ) | |||||||
Dividend payment | - | (35,664 | ) | - | ||||||||
Excess tax benefits from stock option transactions | - | 869 | 27 | |||||||||
Net cash provided by (used in) financing activities | 18,850 | (19,553 | ) | (31,975 | ) | |||||||
Effect of change in exchange rates | 897 | 211 | 429 | |||||||||
Net increase (decrease) in cash and cash equivalents | 26,109 | (21,267 | ) | 48,361 | ||||||||
Cash and cash equivalents, beginning of period | 75,104 | 96,371 | 48,010 | |||||||||
Cash and cash equivalents, end of period | $ | 101,213 | $ | 75,104 | $ | 96,371 | ||||||
Supplemental disclosures for cash flow information: | ||||||||||||
Cash paid for taxes | $ | 1,116 | $ | 807 | $ | 675 | ||||||
Supplemental disclosures of non-cash activities: | ||||||||||||
Liability accrued for property and equipment purchases | $ | 1,941 | $ | 1,728 | $ | 1,483 | ||||||
Year Ended December 31, | ||||||||||||
2014 | 2013 | 2012 | ||||||||||
Cash flows from operating activities: | ||||||||||||
Net income | $ | 35,495 | $ | 22,898 | $ | 15,756 | ||||||
Adjustments to reconcile net income to net cash provided by operating activities: | ||||||||||||
Depreciation and amortization of tangible and intangible assets | 13,130 | 12,160 | 9,332 | |||||||||
Loss on disposal of property and equipment | - | 31 | 81 | |||||||||
Amortization and realized gains/losses on investments | 96 | 443 | 214 | |||||||||
Deferred taxes, net | 17 | (81 | ) | (8 | ) | |||||||
Excess tax benefit from equity awards | (10 | ) | - | (869 | ) | |||||||
Stock-based compensation | 33,454 | 20,701 | 18,652 | |||||||||
Changes in operating assets and liabilities, net of effects of an acquisition: | ||||||||||||
Accounts receivable | (1,870 | ) | (4,347 | ) | (4,286 | ) | ||||||
Inventories | (1,142 | ) | (7,606 | ) | (12,004 | ) | ||||||
Prepaid expenses and other assets | (2,029 | ) | 121 | (456 | ) | |||||||
Accounts payable | 1,632 | 1,440 | 754 | |||||||||
Accrued liabilities | (3,102 | ) | 12,149 | (2,097 | ) | |||||||
Tax liabilities | (248 | ) | 86 | 1,476 | ||||||||
Accrued compensation and related benefits | (1,290 | ) | 2,691 | (1,633 | ) | |||||||
Net cash provided by operating activities | 74,133 | 60,686 | 24,912 | |||||||||
Cash flows from investing activities: | ||||||||||||
Property and equipment purchases | (9,511 | ) | (15,764 | ) | (21,059 | ) | ||||||
Proceeds from sale of property and equipment | - | 88 | 13 | |||||||||
Purchases of short-term investments | (136,872 | ) | (125,756 | ) | (143,094 | ) | ||||||
Proceeds from sale of short-term investments | 149,291 | 85,700 | 135,183 | |||||||||
Proceeds from sale of long-term investments | 4,650 | 2,025 | 2,100 | |||||||||
Premiums paid on deferred compensation plan | (5,335 | ) | (617 | ) | - | |||||||
Change in restricted assets | - | - | 20 | |||||||||
Cash paid for an acquisition, net of cash acquired | (11,590 | ) | - | - | ||||||||
Net cash used in investing activities | (9,367 | ) | (54,324 | ) | (26,837 | ) | ||||||
Cash flows from financing activities: | ||||||||||||
Property and equipment purchased on extended payment terms | (400 | ) | (557 | ) | - | |||||||
Proceeds from exercise of stock options | 11,941 | 37,877 | 13,390 | |||||||||
Proceeds from shares issued under the employee stock purchase plan | 2,078 | 2,145 | 1,852 | |||||||||
Repurchases of common shares | (41,198 | ) | (20,615 | ) | - | |||||||
Dividends and dividend equivalents paid | (11,658 | ) | - | (35,664 | ) | |||||||
Excess tax benefits from equity awards | 10 | - | 869 | |||||||||
Net cash provided by (used in) financing activities | (39,227 | ) | 18,850 | (19,553 | ) | |||||||
Effect of change in exchange rates | (486 | ) | 897 | 211 | ||||||||
Net increase (decrease) in cash and cash equivalents | 25,053 | 26,109 | (21,267 | ) | ||||||||
Cash and cash equivalents, beginning of period | 101,213 | 75,104 | 96,371 | |||||||||
Cash and cash equivalents, end of period | $ | 126,266 | $ | 101,213 | $ | 75,104 | ||||||
Supplemental disclosures for cash flow information: | ||||||||||||
Cash paid for taxes | $ | 1,235 | $ | 1,116 | $ | 807 | ||||||
Supplemental disclosures of non-cash investing and financing activities: | ||||||||||||
Liability accrued for property and equipment purchases | $ | 1,487 | $ | 1,941 | $ | 1,728 | ||||||
Liability accrued for dividends and dividend equivalents | $ | 6,660 | $ | - | $ | - | ||||||
Fair value of contingent consideration related to an acquisition | $ | 2,507 | $ | - | $ | - | ||||||
See accompanying notes to consolidated financial statements.
MONOLITHIC POWER SYSTEMS, INC.
NOTES TO CONSOLIDATED FINANCIAL STATEMENTS
1. Summary of Significant Accounting PoliciesSUMMARY OF SIGNIFICANT ACCOUNTING POLICIES
Business—
Monolithic Power Systems, Inc. (“MPS” or the “Company”) was incorporated in the State of California on August 22, 1997. On November 17, 2004, the Company was reincorporated in the State of Delaware. MPS designs, develops and markets proprietary, advanced analogintegrated power semiconductor solutions and mixed-signal semiconductors.power delivery architectures. MPS's mission is to provide innovative power solutions in cloud computing, telecommunications, industrial and automotive, and consumer market segments.
Basis of Presentation
Basis of Presentation— The consolidated financial statements include the accounts of the Company and its wholly owned subsidiaries. All significant intercompany accounts and transactions have been eliminated in consolidation.
Use of Estimates
Foreign Currency — The Company’s foreign subsidiaries operate primarily using their respective local currencies, and therefore, the local currency has been determined to be the functional currency for each foreign subsidiary. Accordingly, all assets and liabilities of the Company’s foreign subsidiaries are translated using exchange rates in effect at the end of the period. Revenue and costs are translated using average exchange rates for the period. The resulting translation adjustments are presented as a separate component of accumulated other comprehensive income in stockholders’ equity in the Consolidated Balance Sheets. Foreign currency transaction losses are reported in interest and other income, net, in the Consolidated Statements of Operations and totaled $0.6 million, $0.1 million and $0.3 million for the years ended December 31, 2013, 2012 and 2011, respectively.
Use of Estimates— The preparation of financial statements in conformity with accounting principles generally accepted in the United States of America (“GAAP”) requires management to make estimates and assumptions that affect the reported amounts of assets and liabilities and disclosure of contingent assets and liabilities at the date of the financial statements and reported amounts of revenue and expenses during the reporting period. Significant estimates and assumptions used in these consolidated financial statements primarily include those related to revenue recognition, inventory valuation, valuation of stock-based awards, valuation of goodwill and acquisition-related intangible assets, contingencies and tax valuation allowances. Actual results could differ from those estimates.
Certain Significant Risks and Uncertainties—
Financial instruments which potentially subject the Company to concentrations of credit risk consist primarily of cash and cash equivalents, short-term and long-term investments and accounts receivable. The Company’s cash consists of checking and savings accounts. The Company’s cash equivalents include short-term, highly liquid investments purchased with remaining maturities at the date of purchase of three months or less. The Company’s short-term investments consist primarily of certificates of deposit and government agencies and treasuries and the Company’s long-term investments consist of government-backed student loan auction-rate securities. The Company generally does not require its customers to provide collateral or other security to support accounts receivable. To manage credit risk, management performs ongoing credit evaluations of its customers’ financial condition. The Company requires cash in advance for certain customers in addition to ongoing credit evaluations for those where credit has been extended. Accounts receivable allowances were not material in any periods presented.
The Company participates in the dynamic high technology industry and believes that changes in any of the following areas could have a material adverse effect on the Company’sits future financial position, results of operations or cash flows: advances and trends in new technologies and industry standards; competitive pressures in the form of new products or price reductions on current products; changes in product mix; changes in the overall demand for products offered by the Company; changes in third-party manufacturers; changes in key suppliers; changes in certain strategic relationships or customer relationships; litigation or claims against the Company based on intellectual property, patent, product, regulatory or other factors; fluctuations in foreign currency exchange rates; risk associated with changes in domestic and international economic and/or political regulations; availability of necessary components or subassemblies; availability of foundry capacity; ability to integrate acquired companies; and the Company’s ability to attract and retain employees necessary to support its growth.
Foreign Currency
The functional currency of the Company’s international subsidiaries is primarily the local currency. The majority of the subsidiaries is located in China and Taiwan, which utilize the Renminbi and the New Taiwan Dollar as their currencies, respectively.Accordingly, assets and liabilities of the foreign subsidiaries are translated using exchange rates in effect at the end of the period. Revenue and costs are translated using average exchange rates for the period. The resulting translation adjustments are presented as a separate component of accumulated other comprehensive income in stockholders’ equity in the Consolidated Balance Sheets. In addition, the Company incurs foreign currency exchange gains or losses related to the timing of payments for transactions between the U.S. and its subsidiaries. Foreign currency transaction gains (losses) are reported in interest and other income, net, in the Consolidated Statements of Operations and totaled $0.1 million, $(0.6) million and $(0.1) million for the years ended December 31, 2014, 2013 and 2012, respectively.
Cash and Cash Equivalents—
The Company classifies all highly liquid investments with stated maturities of three months or less from date of purchase as cash equivalents.
Fair Value of Financial InstrumentsInstruments— ASC 820-10,
Fair Value Measurements and Disclosures – Overall,definesvalue is estimated by applying the following hierarchy, which prioritizes the inputs used to measure fair value establishes a framework for measuringinto three levels and bases the categorization within the hierarchy upon the lowest level of input that is available and significant to the fair value and requires that assets and liabilities carried at fair value be classified and disclosed in one of three categories, as follows:measurement:
Level 1: Quoted prices in active markets for identical assets Level 2: Significant other observable inputs Level 3: Significant unobservable inputs |
|
|
|
The Company’s financial instruments include cash and cash equivalents, short-term and long-term investments. Cash equivalents are stated at cost, which approximates fair market value. The Company’s short-term and long-term investments are classified as available-for-sale securities and are stated at their fair market value.
The Company uses ASC 320,Investments – Debt and Equity Securities, to determinedetermines whether an impairment is temporary or other-than temporary. Unrealized gains or losses that are deemed to be temporary are recorded as a component of accumulated other comprehensive income in stockholder’s equity in the Consolidated Balance Sheets, and changes in unrealized gains or losses are recorded in the Consolidated Statements of Comprehensive Income. The Company records an impairment charge in interest and other income, net, in the Consolidated Statements of Operations when an available-for-sale investment has experienced a decline in value that is deemed to be other-than-temporary. Other-than-temporary impairment exists when the Company either has the intent to sell the security, it will more likely than not be required to sell the security before anticipated recovery, or it does not expect to recover the entire amortized cost basis of the security.
At December 31, 2013,2014, the fair value of the Company’s holdings in auction rateauction-rate securities was $9.9$5.4 million, all of which was classified as long-term available-for-sale investments. The valuation of the auction-rate securities is subject to fluctuations in the future, which will depend on many factors, including the quality of the underlying collateral, estimated time to liquidity including potential to be called or restructured, underlying final maturity, insurance guaranty and market conditions, among others.
Inventories— Inventories consist of work-in-process and finished goods.
Inventories are stated at the lower of standard cost (which approximates actual cost determined on a first-in first-out basis) or current market value. The Company writes down excess and obsolete inventory based on its age and forecasted demand, which includes estimates taking into consideration the Company’s outlook on uncertain events such as market and economic conditions, technology changes, new product introductions and changes in strategic direction. Actual demand may differ from forecasted demand and such differences may have a material effect on recorded inventory values. Inventory write-downs are not reversed until the related inventories have been sold.
Property and Equipment
Property and Equipment— Property and equipment are stated at cost. Depreciation is computed using the straight-line method over the estimated useful lives of the assets, generally three to forty years.assets. Buildings and building improvements have a depreciation life of up30 to 40 years. Leasehold improvements are amortized over the shorter of the estimated useful life or the lease period. Computer, software and equipment have a depreciation life of three to seven years. Transportation equipment has a depreciate life of 5 to 15 years. Furniture and fixtures have a depreciation life of three to five years.
Goodwill and Acquisition-Related Intangible Assets
Goodwill represents the excess of the fair value of purchase consideration over the fair value of net tangible and identified intangible assets as of the date of acquisition. In-process research and development (“IPR&D”) assets represent the fair value of incomplete R&D projects that had not reached technological feasibility as of the date of acquisition. The IPR&D assets are initially capitalized at fair value as intangible assets with indefinite lives. When the IPR&D projects are completed, they are reclassified as amortizable intangible assets and are amortized over their estimated useful lives. Alternatively, if the IPR&D projects are abandoned, they are impaired and expensed to research and development.
Acquisition-related intangible assets with finite lives consist of know-how and developed technologies. These assets are amortized on a straight-line basis over estimated useful lives ranging from three to five years and the amortization expense is recorded in cost of revenue in the Consolidated Statements of Operations.
Other Long-Term Assets
Other assets primarily consist of intangible assets for the land use rights in Chengdu, China, purchased patents, long-term lease deposits and deferred compensation plan investments. We amortize the land use rights over 50 years and the purchased patents over five years.
Impairment of Long-Lived Assets—
The Company evaluates long-lived assets, other than goodwill and acquisition-related intangible assets with indefinite useful lives, for impairment whenever events or changes in circumstances indicate that the carrying amount of an asset may not be recoverable. An impairment loss would be recognized when the sum of the undiscounted future net cash flows expected to result from the use of the asset and its eventual disposition is less than its carrying amount. Such impairment loss would be measured as the difference between the carrying amount of the asset and its fair value based on the present value of estimated future cash flows.
The Company tests goodwill for impairment at least annually, or whenever events or changes in circumstances indicate that the goodwill may be impaired. The Company has elected to first assess the qualitative factors to determine whether it is more likely than not that the fair value of the reporting unit is less than its carrying amount. If the Company determines that it is more likely than not that its fair value is less than the carrying amount, then the two-step goodwill impairment test is performed. The first step compares the fair value of the reporting unit with its carrying amount. If the carrying amount exceeds its fair value, the second step measures the impairment loss by comparing the implied fair value of the goodwill with the carrying amount. As of December 31, 2014, no impairment of goodwill has been identified.
Deferred Compensation Plan
Other Assets— Other assets primarily consist of intangible assets for the land use rights in Chengdu, China, purchased patents, long-term lease deposits and deferred compensation plan assets. We amortize the land use rights over 50 years and the purchased patents up to five years.
Deferred Compensation Plan — The Company has a non-qualified, unfunded deferred compensation plan,which provides certain key employees, including our executive management, with the ability to defer the receipt of compensation in order to accumulate funds for retirement on a tax deferred basis. The Company does not make contributions to the plan or guarantee returns on the investments. The Company is responsible for the plan’s administrative expenses. ParticipantParticipants’ deferrals and investment gains and losses remain as the Company’s liabilities and the underlying assets are subject to claims of general creditors.
The liabilities for compensation deferred compensation plan assets include corporate-owned life insurance policies, which are recorded at the cash surrender value in each reporting period and are included in other assets. Changes in the cash surrender value are recorded in interest and other income, net, in the Consolidated Statements of Operations. The liabilities ofunder the plan are recorded at fair value in each reporting period and are included in other long-term liabilities.liabilities in the Consolidated Balance Sheets. Changes in the fair value of the liabilities are recorded as an operating expense (credit) in the Consolidated Statements of Operations. The Company manages the risk of changes in the fair value of the liabilities by electing to match the liabilities with investments that offset a substantial portion of the exposure. The investments are recorded in other long-term assets in the Consolidated Balance Sheets at the cash surrender value of the corporate-owned life insurance policies and at the fair value of the mutual fund investments, which are classified as trading securities. Changes in the cash surrender value of the corporate-owned life insurance policies and the fair value of mutual fund investments are included in interest and other income, net in the Consolidated Statements of Operations. As of December 31, 2014 and 2013, the plan assets totaled $6.1 million and $0.6 million, and the plan liabilities totaled $6.2 million and $0.6 million, respectively.
Warranty Reserves—
The Company generally provides a one to two-year warranty against defects in materials and workmanship and will either repair the goods or provide replacement products at no charge to the customer for defective products. Reserve requirements are recorded in the period of sale and are based on an assessment of the products sold with warranty and historical warranty costs incurred. Historically, the warranty expenses werehave not been material to the Company’s consolidated financial statements.
Revenue Recognition
Revenue Recognition— The Company recognizes revenue when the following four basic criteria are met: (1) persuasive evidence of an arrangement exists; (2) delivery has occurred or services have been rendered; (3) the fee is fixed or determinable; and (4) collectability is reasonably assured. Determination of criteria (3) and (4) are based on management’s judgment regarding the fixed nature of the feefees charged for products delivered and the collectability of those fees. The application of these criteria has resulted in the Company generally recognizing revenue upon shipment (when title passes) to customers, including distributors, original equipment manufacturers and electronic manufacturing service providers.
The Company’s revenue consists primarily of sales of assembled and tested finished goods. The Company also sells die in wafer form to its customers and value-added resellers, and the Company receives royalty revenue from third parties and value-added resellers.
For the years ended December 31, 2014 and 2013, approximately 92% and 2012, approximately 91% of the Company’s distributor sales, respectively, including sales to the Company’s value-added resellers, were made through distribution arrangements with third parties. These arrangements do not include any special payment terms (the Company’s normal payment terms are 30-45 days for its distributors), price protection or exchange rights. Returns are limited to the Company’s standard product warranty. Certain of the Company’s large distributors have contracts that include limited stock rotation rights that permit the return of a small percentage of the previous six months’ purchases.
For the years ended December 31, 2014 and 2013, approximately 8% and 2012, approximately 9% of the Company’s distributor sales, respectively, were made through small distributors primarily based on purchase orders. These distributors typically have no stock rotation rights.
The Company maintains a sales reserve for stock rotation rights, which is based on historical experience of actual stock rotation returns on a per distributor basis, where available, and information related to products in the distribution channel. This reserve is recorded at the time of sale. Historically, these returns were not material to the Company’s consolidated financial statements. In the future, if the Company is not able to estimate its stock rotation returns accurately, the Company may have to recognize revenue when the distributors sell such inventory to end customers.
The Company generally recognizes revenue upon shipment of products to the distributors for the following reasons:
| (1) | The price is fixed or determinable at the date of sale. The Company does not offer special payment terms, price protection or price adjustments to distributors when the Company recognizes revenue upon shipment. |
| (2) | The distributors are obligated to pay the Company and this obligation is not contingent on the resale of the Company’s products. |
| (3) | The distributors’ obligation is unchanged in the event of theft or physical destruction or damage to the products. |
| (4) | The distributors have stand-alone economic substance apart from the Company’s relationship. |
| (5) | The Company does not have any obligations for future performance to directly bring about the resale of its products by the distributors. |
| (6) | The amount of future returns can be reasonably estimated. The Company has the ability and the information necessary to track inventory sold to and held at its distributors. The Company maintains a history of returns and has the ability to estimate the stock rotation returns on a quarterly basis. |
The Company maintains a sales reserve for stock rotation rights, which is based on historical experience of actual stock rotation returns on a per distributor basis, where available, and information related to products in the distribution channel. This reserve is recorded at the time of sale. Historically, these returns were not material to the Company’s consolidated financial statements.
If the Company enters into arrangements that have rights of return that are not estimable, the Company recognizes revenue under such arrangements only after the distributors have sold the products to end customers. TwoThree of the Company’s U.S. distributors have distribution agreements where revenue is recognized upon sale by these distributors to their end customers because these distributors have certain rights of return which management believes are not estimable. The deferred revenue balance from these two distributors as of December 31, 2014 and 2013 and 2012 was $1.7$2.0 million and $1.6$1.7 million, respectively. The deferred costs as of December 31, 20132014 and 20122013 were $0.2 million.
Stock-Based Compensation—
The Company accounts for stock-based compensation under the provisions of ASC 718-10-30,Compensation – Stock Compensation – Overall – Initial Measurement.This standard requires the Company to measuremeasures the cost of employee services received in exchange for an award of equity instruments based on the grant-date fair value of the award.The Company uses the Black-Scholes model to estimate the fair value of its options and shares issued under employee stock purchase plan. The fair value of time-based and performance-based restricted stock units is based on the grant date share price. The fair value of market-based restricted stock units is estimated using a Monte Carlo simulation model.
The Company recognizes compensation expense equal to the grant-date fair value for all share-based payment awards that are expected to vest. This expense is recorded on a straight-line basis over the requisite service period of the entire awards, unless the awards are subject to performance or market conditions, in which case the Company recognizes compensation expense over the requisite service period of each separate vesting tranche. For the performance-based awards, the Company recognizes compensation expense when it becomes probable that the performance criteria specified inset by the planBoard of Directors will be achieved. For the market-based awards, compensation expense is not reversed if the market condition is not satisfied. The amount of stock-based compensation that the Company recognizes is also based on an expected forfeiture rate. If there is a difference between the forfeiture assumptions used in determining stock-based compensation costs and the actual forfeitures which become known over time, the Company may change the forfeiture rate, which could have a significant impact on its stock-based compensation expense.
Research and Development—
Costs incurred in research and development are charged to operationsexpensed as incurred.
Litigation Expenses (Benefits) — The Company records litigation costs in the period in which they are incurred. Due to the uncertainties inherent in litigation proceedings, the Company generally recognizes the proceeds resulting from settlement of litigation or favorable judgments when the cash is received and there is no further contingency related to the litigation. The proceeds are recorded as a reduction in litigation expense to the extent that litigation costs were previously incurred in the related case. Proceeds in excess of cumulative costs incurred for a case is recorded to interest and other income, net, on the Consolidated Statements of Operations. Litigation expense (benefit), net, in the Consolidated Statements of Operations includes primarily patent litigation and other contract-related matters.
Accounting for Income Taxes — In accordance with ASC 740-10, the
The Company recognizes federal, state and foreign current tax liabilities or assets based on its estimate of taxes payable or refundable in the current fiscal year by tax jurisdiction. The Company also recognizes federal, state and foreign deferred tax assets or liabilities for its estimate of future tax effects attributable to temporary differences and carryforwards. The Company records a valuation allowance to reduce any deferred tax assets by the amount of any tax benefits that, based on available evidence and judgment, are not expected to be realized.
The Company’s calculation of current and deferred tax assets and liabilities is based on certain estimates and judgments and involves dealing with uncertainties in the application of complex tax laws. The Company’s estimates of current and deferred tax assets and liabilities may change based, in part, on added certainty or finality or uncertainty to an anticipated outcome, changes in accounting or tax laws in the U.S., or foreign jurisdictions where the Company operates, or changes in other facts or circumstances. In addition, the Company recognizes liabilities for potential U.S. and foreign income tax for uncertain income tax positions taken on its tax returns if it has less than a 50% likelihood of being sustained. If the Company determines that payment of these amounts is unnecessary or if the recorded tax liability is less than its current assessment, the Company may be required to recognize an income tax benefit or additional income tax expense in its financial statements in the period such determination is made. The Company has calculated its uncertain tax positions which were attributable to certain estimates and judgments primarily related to transfer pricing, cost sharing and its international tax structure exposure.
The Company incurred significant stock-based compensation expense, some of which are related to incentive stock options for which no corresponding tax benefit will be recognized unless a disqualifying disposition occurs. Disqualifying dispositions result in a reduction of income tax expense in the period when the disqualifying disposition occurs. Tax benefits related to realized tax deductions in excess of previously expensed stock compensation are recorded as an addition to paid-in-capital.Contingencies
Contingencies — The Company is a party to actions and proceedings incident to its business in the ordinary course of business, including litigation regarding the Company’s intellectual property, challenges to the enforceability or validity of its intellectual property and claims that its products infringe on the intellectual property rights of others. The pending proceedings involve complex questions of fact and law and will require the expenditure of significant funds and the diversion of other resources to prosecute and defend. In addition, from time to time, the Company becomes aware that it is subject to other contingent liabilities. When this occurs, the Company will evaluate the appropriate accounting for the potential contingent liabilities using ASC 450-20-25,Contingencies – Loss Contingencies – Recognition,to determine whether a contingent liability should be recorded. In making this determination, management may, depending on the nature of the matter, consult with internal and external legal counsel and technical experts. Based on the facts and circumstances in each matter, the Company uses its judgment to determine whether it is probable that a contingent loss has occurred and whether the amount of such loss can be estimated. If the Company determines a loss is probable and estimable, the Company records a contingent loss in accordance with ASC 450-20-25-2.loss. In determining the amount of a contingent loss, the Company takes into account advice received from experts for each specific matter regarding the status of legal proceedings, settlement negotiations, (which may be ongoing), prior case history and other factors. Should the judgments and estimates made by management need to be adjusted as additional information becomes available, the Company may need to record additional contingent losses. Alternatively, if the judgments and estimates made by management are adjusted, for example, if a particular contingent loss does not occur, the contingent loss recorded would be reversed.
Litigation Expense (Benefit)
The Company records litigation costs in the period in which they are incurred. Due to the uncertainties inherent in litigation proceedings, the Company generally recognizes the proceeds resulting from settlement of litigation or favorable judgments when the cash is received and there is no further contingency related to the litigation. The proceeds are recorded as a reduction against litigation expense to the extent that litigation costs were previously incurred in the related case. Proceeds in excess of cumulative costs incurred for the case is recorded in interest and other income, net, in the Consolidated Statements of Operations. Litigation expense (benefit), net, includes primarily patent litigation and other contract-related matters.
Comprehensive Income
—
Comprehensive income represents the change in the Company’s net assets during the period from non-owner sources. Accumulated other comprehensive income presented in the Consolidated Balance SheetSheets primarily consists of unrealized gains and losses related to available-for-sale investments and foreign currency translation adjustments.
Recent Accounting Pronouncements
In June 2011,July 2013, the Financial Accounting Standards Board (“FASB”) issued Accounting Standards Update 2011-05,Presentation of Comprehensive Income. The standard requires entities to have more detailed reporting of comprehensive income. Specifically, the standard allows an entity to present components of net income and components of other comprehensive income in one continuous statement of comprehensive income, or in two separate, but consecutive statements. The guidance became effective in the first quarter of 2013 and applied retrospectively. The adoption of this guidance did not have a material impact on the Company’s consolidated financial position, results of operations, or cash flows.
In February 2013, the FASB issued ASU(“ASU”) No. 2013-02,Reporting of Amounts Reclassified Out of Accumulated Other Comprehensive Income.This ASU adds new disclosure requirements for items reclassified out of accumulated other comprehensive income. The ASU was effective for fiscal years, and interim periods within those years, beginning on or after December 15, 2012 and must be applied prospectively. The Company adopted this standard on January 1, 2013 and the adoption of this guidance did not have a material impact on its consolidated financial position, results of operations or cash flows.
In July 2013, the FASB issued ASU No. 2013-11,Presentation of an Unrecognized Tax Benefit When a NetOperating Loss Carryforward, a Similar Tax Loss, or a Tax Credit Carryforward Exists. The standard gives guidance on the financial statement presentation of an unrecognized tax benefit when a net operating loss carryforward, a similar tax loss, or a tax credit carryforward exists, with the purpose of reducing diversity in practice. This new standard requires the netting of unrecognized tax benefits against a deferred tax asset for a loss or other carryforward that would apply in settlement of the uncertain tax positions. The guidance will become effectiveCompany adopted this standard in the first quarter of 2014 prospectively and should be applied prospectively. Early adoption is permitted. The Company does not expect that the adoption of this guidance willdid not have a materialan impact on its consolidated financial position, results of operations or cash flows.
In May 2014, the FASB issued ASU No. 2014-09, Revenue from Contracts with Customers,which outlines a single comprehensive model for entities to use in accounting for revenue arising from contracts with customers. The standard’s core principle is that an entity will recognize revenue when it transfers promised goods or services to customers in an amount that reflects the consideration to which the entity expects to be entitled in exchange for those goods or services. Under the new standard, entities will apply the following five-step model when evaluating revenue contracts with customers:
(1) | Identify the contract with a customer. |
(2) | Identify the performance obligations in the contract. |
(3) | Determine the transaction price. |
(4) | Allocate the transaction price to the performance obligations in the contract. |
(5) | Recognize revenue when the entity satisfies a performance obligation. |
The new standard is effective for annual and interim reporting periods beginning after December 15, 2016. Entities have the option of using either a full retrospective or a modified retrospective application in the adoption of this standard. The Company will adopt the standard in the first quarter of 2017 and is evaluating the transition method and the impact of the adoption on its consolidated financial position, results of operations and cash flows.
2. ACQUISITION
On July 22, 2014 (the “Acquisition Date”), the Company acquired 100% of the outstanding capital stock of Sensima Technology SA (“Sensima”), a company based in Switzerland that develops magnetic sensor technologies for angle measurements as well as three-dimensional magnetic field sensing. The acquisition is expected to create new opportunities with customers by offering enhanced solutions in power management for key industries such as automotive, industrial and cloud computing. Subsequent to the Acquisition Date, Sensima became a subsidiary of the Company and its results of operations have been included in the Company’s consolidated financial statements.
Purchase Consideration
The fair value of the purchase consideration consists of the following (in thousands):
Cash paid at the Acquisition Date | $ | 11,735 | ||
Contingent consideration | 2,507 | |||
Total | $ | 14,242 |
Cash Cash Equivalentspaid at the Acquisition Date included $1.2 million that is being held in an escrow account for a one-year period, which is subject to Sensima’s satisfaction of certain representations and Investmentswarranties.
The contingent consideration arrangement requires the Company to pay up to an additional $8.9 million to former Sensima shareholders if Sensima achieves a new product introduction as well as certain product revenue and direct margin targets in 2016. The fair value of the contingent consideration at the Acquisition Date was $2.5 million, which was estimated based on a probability-weighted analysis of possible future cash flow outcomes. The fair value of the contingent consideration is recorded in other long-term liabilities in the Consolidated Balance Sheets and is remeasured at the end of each reporting period, with any changes in fair value recorded in operating expense in the Consolidated Statements of Operations. Actual amounts that will ultimately be paid may differ from the obligations recorded.
The Company incurred $0.6 million of transaction costs that were expensed as incurred and included in selling, general and administrative expenses in the Consolidated Statements of Operations.
PreliminaryPurchase ConsiderationAllocation
The estimated fair value of assets acquired and liabilities assumed is as follows (in thousands):
Cash | $ | 145 | ||
Other tangible assets acquired, net of liabilities assumed | 42 | |||
Intangible assets: | ||||
Know-how | 1,018 | |||
Developed technologies | 4,421 | |||
IPR&D | 2,045 | |||
Total identifiable net assets acquired | 7,671 | |||
Goodwill | 6,571 | |||
Total net assets acquired | $ | 14,242 |
Intangible assets with finite lives include know-how and developed technologies with estimated useful lives of three to five years. The fair value of know-how was determined using the relief from royalty method, and the fair value of the developed technologies was determined using the income approach. Intangible assets with indefinite lives include IPR&D, which consists of incomplete R&D projects that had not reached technological feasibility as of the Acquisition Date. The fair value of the IPR&D assets was determined using the income approach.
The goodwill arising from the acquisition was primarily attributed to synergies which will enable the Company to develop advanced solutions in power management by combining with Sensima’s magnetic sensor technologies. The goodwill is not expected to be deductible for tax purposes.
The purchase price allocation is considered preliminary and dependent upon the finalization of the valuation of assets acquired and liabilities assumed, primarily related to deferred taxes. The Company is currently determining if the acquisition qualifies as a tax-free reorganization within the meaning of Swiss tax rules pursuant to the tax holiday granted to Sensima by the Swiss tax authorities. Final determination of the valuation could result in an adjustment to the preliminary purchase price allocation, with an offsetting adjustment to goodwill.
Equity Awards
On the Acquisition Date, the Board of Directors granted $1.7 million of time-based RSUs (or 40,000 shares) to key Sensima employees who became employees of the Company. These awards vest over four years. In addition, the Board of Directors granted $2.0 million of PSUs (or 47,000 shares) to these employees, with the right to earn up to a maximum of $8.0 million based on the achievement of certain cumulative Sensima product revenue targets during the performance period from the Acquisition Date to July 22, 2019. One half of the awards subject to each revenue goal will vest immediately when the pre-determined revenue goal is met and approved by the Compensation Committee, and the remaining 50% will vest over the following two years. The vesting is subject to the employees’ continued employment with the Company. These equity awards are considered arrangements for post-acquisition services and the related compensation expense is being recognized over the requisite service period.
Pro Forma Information(Unaudited)
Supplemental information of the Company’s results of operations on a pro forma basis, as if the Sensima acquisition had been consummated on January 1, 2013, is presented as follows (in thousands, except per-share amounts):
Year Ended December 31, | ||||||||
2014 | 2013 | |||||||
Revenue | $ | 282,584 | $ | 238,181 | ||||
Net income | $ | 33,777 | $ | 20,187 | ||||
Diluted net income per share | $ | 0.85 | $ | 0.52 | ||||
These pro forma results are not necessarily indicative of the Company’s consolidated results of operations in future periods or the results that would have been realized had the Company acquired Sensima during the periods presented. The pro forma results include adjustments primarily related to Sensima’s results of operations, amortization of intangible assets, stock-based compensation expense and the related tax effects.
3. CASH, CASH EQUIVALENTS AND INVESTMENTS
The following is a summary of the Company’s cash, and cash equivalents, and short-term and long-term investments (in thousands):
Estimated Fair Market Value as of | As of December 31, | |||||||||||||||
December 31, 2013 | December 31, 2012 | 2014 | 2013 | |||||||||||||
Cash, cash equivalents and investments: | ||||||||||||||||
Cash | $ | 62,625 | $ | 59,145 | $ | 66,188 | $ | 62,625 | ||||||||
Money market funds | 35,588 | 15,959 | 60,078 | 35,588 | ||||||||||||
Certificates of deposit | 22,778 | - | ||||||||||||||
U.S. treasuries and government agency bonds | 128,126 | 85,521 | 89,674 | 128,126 | ||||||||||||
Auction-rate securities backed by student-loan notes | 9,860 | 11,755 | 5,389 | 9,860 | ||||||||||||
Total cash, cash equivalents and investments | $ | 236,199 | $ | 172,380 | ||||||||||||
Total | $ | 244,107 | $ | 236,199 | ||||||||||||
Reported as: | December 31, 2013 | December 31, 2012 | ||||||
Cash and cash equivalents | $ | 101,213 | $ | 75,104 | ||||
Short-term investments | 125,126 | 85,521 | ||||||
Long-term investments | 9,860 | 11,755 | ||||||
Total cash, cash equivalents and investments | $ | 236,199 | $ | 172,380 | ||||
For the years ended December 31, 2013 and 2012, the Company redeemed $2.0 million and $2.1 million, respectively, of auction-rate securities at par.
As of December 31, | ||||||||
| 2014 | 2013 | |||||||
Reported as: |
|
| ||||||
Cash and cash equivalents | $ | 126,266 | $ | 101,213 | ||||
Short-term investments | 112,452 | 125,126 | ||||||
Long-term investments | 5,389 | 9,860 | ||||||
Total | $ | 244,107 | $ | 236,199 | ||||
The contractual maturities of the Company’s short-term and long-term available-for-sale investments are as follows (in thousands):
December 31, 2013 | December 31, 2012 | |||||||
Due in less than 1 year | $ | 95,509 | $ | 52,880 | ||||
Due in 1 - 5 years | 29,617 | 32,641 | ||||||
Due in greater than 5 years | 9,860 | 11,755 | ||||||
| $ | 134,986 | $ | 97,276 | |||||
As of December 31, | ||||||||
2014 | 2013 | |||||||
Due in less than 1 year | $ | 91,335 | $ | 95,509 | ||||
Due in 1 - 5 years | 21,117 | 29,617 | ||||||
Due in greater than 5 years | 5,389 | 9,860 | ||||||
Total | $ | 117,841 | $ | 134,986 | ||||
The following tables summarize unrealized gains and losses related to ourthe Company's investments in marketable securities designated as available-for sale (in thousands):
As of December 31, 2013 | ||||||||||||||||||||
Adjusted Cost | Unrealized Gains | Unrealized Losses | Total Fair Value | Fair Value of Investments in Unrealized Loss Position | ||||||||||||||||
Money market funds | $ | 35,588 | $ | - | $ | - | $ | 35,588 | $ | - | ||||||||||
U.S. treasuries and government agency bonds | 128,123 | 26 | (23 | ) | 128,126 | 42,880 | ||||||||||||||
Auction-rate securities backed by student-loan notes | 10,220 | - | (360 | ) | 9,860 | 9,860 | ||||||||||||||
| $ | 173,931 | $ | 26 | $ | (383 | ) | $ | 173,574 | $ | 52,740 | ||||||||||
As of December 31, 2012 | As of December 31, 2014 | |||||||||||||||||||||||||||||||||||||||
Adjusted Cost | Unrealized Gains | Unrealized Losses | Total Fair Value | Fair Value of Investments in Unrealized Loss Position | Adjusted Cost | Unrealized Gains | Unrealized Losses | Total Fair Value | Fair Value of Investments in Unrealized Loss Position | |||||||||||||||||||||||||||||||
Money market funds | $ | 15,959 | $ | - | $ | - | $ | 15,959 | $ | - | $ | 60,078 | $ | - | $ | - | $ | 60,078 | $ | - | ||||||||||||||||||||
Certificates of deposit | 22,778 | - | - | 22,778 | - | |||||||||||||||||||||||||||||||||||
U.S. treasuries and government agency bonds | 85,483 | 45 | (7 | ) | 85,521 | 14,121 | 89,689 | 14 | (29 | ) | 89,674 | 35,062 | ||||||||||||||||||||||||||||
Auction-rate securities backed by student-loan notes | 12,245 | - | (490 | ) | 11,755 | 11,755 | 5,570 | - | (181 | ) | 5,389 | 5,389 | ||||||||||||||||||||||||||||
| $ | 113,687 | $ | 45 | $ | (497 | ) | $ | 113,235 | $ | 25,876 | ||||||||||||||||||||||||||||||
Total | $ | 178,115 | $ | 14 | $ | (210 | ) | $ | 177,919 | $ | 40,451 | |||||||||||||||||||||||||||||
The following table details the fair value measurement of the financial assets (in thousands):
Fair Value Measurement at December 31, 2013 | ||||||||||||||||
Quoted Prices in Active Markets for Identical Assets | Significant Other Observable Inputs | Significant Unobservable Inputs | ||||||||||||||
Total | Level 1 | Level 2 | Level 3 | |||||||||||||
Money market funds | $ | 35,588 | $ | 35,588 | $ | - | $ | - | ||||||||
U.S. treasuries and government agency bonds | 128,126 | - | 128,126 | - | ||||||||||||
Auction-rate securities backed by student-loan notes | 9,860 | - | - | 9,860 | ||||||||||||
| $ | 173,574 | $ | 35,588 | $ | 128,126 | $ | 9,860 | |||||||||
Fair Value Measurement at December 31, 2012 | As of December 31, 2013 | |||||||||||||||||||||||||||||||||||
Quoted Prices in Active Markets for Identical Assets | Significant Other Observable Inputs | Significant Unobservable Inputs | Adjusted Cost | Unrealized Gains | Unrealized Losses | Total Fair Value | Fair Value of Investments in Unrealized Loss Position | |||||||||||||||||||||||||||||
Total | Level 1 | Level 2 | Level 3 | |||||||||||||||||||||||||||||||||
Money market funds | $ | 15,959 | $ | 15,959 | $ | - | $ | - | $ | 35,588 | $ | - | $ | - | $ | 35,588 | $ | - | ||||||||||||||||||
U.S. treasuries and government agency bonds | 85,521 | - | 85,521 | - | 128,123 | 26 | (23 | ) | 128,126 | 42,880 | ||||||||||||||||||||||||||
Auction-rate securities backed by student-loan notes | 11,755 | - | - | 11,755 | 10,220 | - | (360 | ) | 9,860 | 9,860 | ||||||||||||||||||||||||||
| $ | 113,235 | $ | 15,959 | $ | 85,521 | $ | 11,755 | |||||||||||||||||||||||||||||
Total | $ | 173,931 | $ | 26 | $ | (383 | ) | $ | 173,574 | $ | 52,740 | |||||||||||||||||||||||||
The Company's level 2 assets consistFor the years ended December 31, 2014 and 2013, the Company redeemed $4.7 million and $2.0 million, respectively, of U.S. treasuries and government agency bonds. These securities generally have market prices available from multiple sources, which are used as inputs into a distribution-curve based algorithm to determine fair value.
The Company’s level 3 assets consist of government-backed student loan auction-rate securities with interest rates that reset through a Dutch auction every 7 to 35 days and which became illiquid in 2008. The following table provides a reconciliation of the Company’s level 3 assets (in thousands):
Beginning balance at January 1, 2012 | $ | 13,675 | ||
Sales and settlement at par | (2,100 | ) | ||
Realized gain included in interest and other income, net | 40 | |||
Change in unrealized loss included in other comprehensive income | 140 | |||
Balance at December 31, 2012 | 11,755 | |||
Sales and settlement at par | (2,025 | ) | ||
Change in unrealized loss included in other comprehensive income | 130 | |||
Ending balance at December 31, 2013 | $ | 9,860 |
The Company’s investment portfolio as of December 31, 2013 included $9.9 million in government-backed student loan auction-rate securities, net of impairment charges of $390,000, of which $360,000 was temporary and $30,000 was recorded as other-than-temporary. This compares to an investment balance as of December 31, 2012 of $11.8 million in government-backed student loan auction-rate securities, net of impairment charges of $520,000, of which $490,000 was temporary and $30,000 was recorded as other-than-temporary.
at par. The underlying maturities of thesethe outstanding auction-rate securities are up to 3433 years. As of December 31, 20132014 and 2012, the portion of2013, the impairment classified aswas determined to be temporary was based on the following analysis:management assessment:
|
| The decline in the fair value of these securities is not largely attributable to adverse conditions specifically related to these securities or to specific conditions in an industry or in a geographic area; |
|
| Management possesses both the intent and ability to hold these securities for a period of time sufficient to allow for any anticipated recovery in fair value; |
|
| Management believes that it is more likely than not that the Company will not have to sell these securities before recovery of its cost basis; |
|
| Except for the credit loss of $70,000 recognized in the year ended December 31, 2009, the Company does not believe that there is any additional credit loss associated with these securities because the Company expects to recover the entire amortized cost basis; |
|
| There have been no further downgrades on these securities since 2009; |
|
| All scheduled interest payments have been made pursuant to the reset terms and conditions; and |
|
| All redemptions of these securities to date, representing |
Unless a rights offering or other similar offer is made to redeem at par and accepted by the Company, the Company intends to hold the balance of these investments through successful auctions at par.4. FAIR VALUE MEASUREMENT
DeterminingThe following table details the fair value measurement of the financial assets and liabilities (in thousands):
Fair Value Measurement at December 31, 2014 | ||||||||||||||||
Quoted Prices in Active Markets for Identical Assets | Significant Other Observable Inputs | Significant Unobservable Inputs | ||||||||||||||
Total | Level 1 | Level 2 | Level 3 | |||||||||||||
Assets: | ||||||||||||||||
Money market funds | $ | 60,078 | $ | 60,078 | $ | - | $ | - | ||||||||
Certificates of deposit | 22,778 | - | 22,778 | - | ||||||||||||
U.S. treasuries and government agency bonds | 89,674 | - | 89,674 | - | ||||||||||||
Auction-rate securities backed by student-loan notes | 5,389 | - | - | 5,389 | ||||||||||||
Mutual funds under deferred compensation plan | 2,236 | 2,236 | - | - | ||||||||||||
Total | $ | 180,155 | $ | 62,314 | $ | 112,452 | $ | 5,389 | ||||||||
Liabilities: | ||||||||||||||||
Contingent consideration | $ | 2,507 | $ | - | $ | - | $ | 2,507 | ||||||||
Total | $ | 2,507 | $ | - | $ | - | $ | 2,507 | ||||||||
Fair Value Measurement at December 31, 2013 | ||||||||||||||||
Quoted Prices in Active Markets for Identical Assets | Significant Other Observable Inputs | Significant Unobservable Inputs | ||||||||||||||
Total | Level 1 | Level 2 | Level 3 | |||||||||||||
Assets: | ||||||||||||||||
Money market funds | $ | 35,588 | $ | 35,588 | $ | - | $ | - | ||||||||
U.S. treasuries and government agency bonds | 128,126 | - | 128,126 | - | ||||||||||||
Auction-rate securities backed by student-loan notes | 9,860 | - | - | 9,860 | ||||||||||||
Total | $ | 173,574 | $ | 35,588 | $ | 128,126 | $ | 9,860 | ||||||||
The Company’s level 3 assets consist of government-backed student loan auction-rate securities, with interest rates that reset through a Dutch auction every 7 to 35 days and which became illiquid in 2008. The following table provides a rollforward of the fair value of the auction-rate securities requires significant management judgment regarding projected future cash flows which will depend on many factors, including the quality of the underlying collateral, estimated time for liquidity including potential to be called or restructured, underlying final maturity, insurance guaranty and market conditions, among others. To determine(in thousands):
Balance at January 1, 2013 | $ | 11,755 | ||
Sales and settlement at par | (2,025 | ) | ||
Change in unrealized loss included in other comprehensive income | 130 | |||
Ending balance at December 31, 2013 | 9,860 | |||
Sales and settlement at par | (4,650 | ) | ||
Change in unrealized loss included in other comprehensive income | 179 | |||
Ending balance at December 31, 2014 | $ | 5,389 |
The Company determined the fair value of the auction-rate securities the Company usedusing a discounted cash flow model with the following assumptions:
As of December 31, | ||||||||||||||
| At December 31, 2013 | At December 31, 2012 | 2014 | 2013 | ||||||||||
Time-to-liquidity (months) | 24 | 24 | 24 | 24 | ||||||||||
Expected return | 2.5% | 1.8% | 2.9% | 2.5% | ||||||||||
Discount rate | 3.3% | - | 8.1% | 2.5% | - | 7.3% | 4.0% - 7.0% | 3.3% - 8.1% | ||||||
ForThe Company’s level 3 liabilities consist of the year ended December 31, 2012, the Company redeemed a security at face value for which an other-than-temporary impairment of $40,000 had previously been recorded and therefore, recognized a gain of $40,000 in interest and other income, net, in the Consolidated Statement of Operations.
Deferred Compensation Plan:
In the second quarter of 2013, the Company adopted a deferred compensation plan, which provides certain key employees, including our executive management, with the ability to defer the receipt of compensation in order to accumulate funds for retirement on a tax-deferred basis. As of December 31, 2013, the plan assets totaled $607,000 and the plan liabilities totaled $628,000. For the year ended December 31, 2013, the Company recorded an expense of $10,000 in interest and other income, net,contingent consideration related to the changesacquisition of Sensima in July 2014. The arrangement requires the cash surrenderCompany to pay up to $8.9 million to certain former Sensima shareholders if Sensima achieves a new product introduction as well as certain product revenue and direct margin targets in 2016. The fair value of the plan assets and an operating expensecontingent consideration at the Acquisition Date was $2.5 million, which was estimated based on a probability-weighted analysis of $11,000 related to thepossible future cash flow outcomes. There were no significant changes in the fair value of the plan liabilities.contingent consideration from the Acquisition Date to December 31, 2014. The fair value is calculated using the following assumptions:
As of December 31, | ||||
2014 | ||||
Project revenue in 2016 (in millions) | $2.1 - $3.8 | |||
Discount rate | 9.0% | |||
Probability of occurrence | 20% - 50% | |||
3. 5. BALANCE SHEET COMPONENTS
Inventories
Inventories consist of the following (in thousands):
As of December 31, | As of December 31, | |||||||||||||||
2013 | 2012 | 2014 | 2013 | |||||||||||||
Raw materials | $ | 7,298 | $ | 12,453 | ||||||||||||
Work in process | $ | 26,605 | $ | 20,992 | 18,950 | 14,152 | ||||||||||
Finished goods | 13,132 | 11,123 | 14,670 | 13,132 | ||||||||||||
Total inventories | $ | 39,737 | $ | 32,115 | ||||||||||||
Total | $ | 40,918 | $ | 39,737 | ||||||||||||
Property and Equipment, Net
Property and equipment, net, consist of the following (in thousands):
As of December 31, | ||||||||
2014 | 2013 | |||||||
Production equipment and software | $ | 88,929 | $ | 83,075 | ||||
Buildings and improvements | 29,386 | 29,342 | ||||||
Land | 5,600 | 5,600 | ||||||
Transportation equipment | 4,694 | 976 | ||||||
Furniture and fixtures | 2,883 | 2,681 | ||||||
Leasehold improvements | 2,350 | 2,150 | ||||||
Property and equipment, gross | 133,842 | 123,824 | ||||||
Less: accumulated depreciation and amortization | (70,900 | ) | (58,987 | ) | ||||
Total | $ | 62,942 | $ | 64,837 | ||||
Depreciation and amortization expense for the years ended December 31, 2014, 2013 and 2012 was $12.4 million, $12.1 million and $9.3 million, respectively.
4. Property and Equipment, NetOther Long-Term Assets
Property and equipmentOther long-term assets consist of the following (in thousands):
As of December 31, | ||||||||
2013 | 2012 | |||||||
Equipment and software | $ | 83,075 | $ | 65,937 | ||||
Buildings and improvements | 29,342 | 28,319 | ||||||
Land | 5,600 | 5,600 | ||||||
Furniture and fixtures | 2,681 | 2,518 | ||||||
Leasehold improvements | 2,150 | 2,053 | ||||||
Vehicles | 976 | 1,002 | ||||||
Property and equipment, gross | 123,824 | 105,429 | ||||||
Less: accumulated depreciation and amortization | (58,987 | ) | (46,017 | ) | ||||
Property and equipment, net | $ | 64,837 | $ | 59,412 | ||||
Depreciation expense for the years ended December 31, 2013, 2012 and 2011 was $12.1 million, $9.3 million and $8.7 million, respectively.
As of December 31, 2014 2013 Deferred compensation plan assets Prepaid expense Other Total $ 6,084 $ 607 1,418 57 955 980 $ 8,457 $ 1,644
5.
Accrued Liabilities
Accrued liabilities consist of the following (in thousands):
As of December 31, | As of December 31, | |||||||||||||||
2013 | 2012 | 2014 | 2013 | |||||||||||||
Proceeds from litigation (see Note 10) | $ | 9,489 | $ | - | ||||||||||||
Deferred proceeds from litigation | $ | - | $ | 9,489 | ||||||||||||
Dividends and dividend equivalents | 6,080 | - | ||||||||||||||
Deferred revenue and customer prepayments | 2,523 | 2,198 | 3,908 | 2,523 | ||||||||||||
Stock rotation reserve | 1,459 | 961 | 1,757 | 1,459 | ||||||||||||
Commissions | 931 | 464 | 767 | 931 | ||||||||||||
Sales rebate | 900 | 575 | 586 | 900 | ||||||||||||
Warranty | 451 | 331 | 240 | 451 | ||||||||||||
Other | 1,623 | 1,386 | 1,365 | 1,623 | ||||||||||||
Total accrued liabilities | $ | 17,376 | $ | 5,915 | ||||||||||||
Total | $ | 14,703 | $ | 17,376 | ||||||||||||
Other Long-Term Liabilities
Other long-term liabilities consist of the following (in thousands):
As of December 31, 2014 2013 Deferred compensation plan liabilities Contingent consideration Dividend equivalents Other Total $ 6,177 $ 628 2,507 - 580 - 940 850 $ 10,204 $ 1,478
6. Stockholder’s EquityGOODWILL AND ACQUISITION-RELATED INTANGIBLE ASSETS, NET
There have been no changes in the balance of goodwill from the Acquisition Date to December 31, 2014. The Company has two stock plans —the 2004 Equity Incentive Plandid not identify any goodwill impairment in 2014.
Acquisition-related intangible assets consist of the following (in thousands):
As of December 31, 2014 | ||||||||||||
Gross Amount | Accumulated Amortization | Net Amount | ||||||||||
Subject to amortization: | ||||||||||||
Know-how | $ | 1,018 | $ | (93 | ) | $ | 925 | |||||
Developed technologies | 4,421 | (579 | ) | 3,842 | ||||||||
Not subject to amortization: | ||||||||||||
IPR&D | 2,045 | - | 2,045 | |||||||||
Total | $ | 7,484 | $ | (672 | ) | $ | 6,812 | |||||
Amortization expense was recorded in cost of revenue in the Consolidated Statements of Operations and totaled $0.7 million for the year ended December 31, 2014.
The estimated future amortization expense as of December 31, 2014 Equity Incentive Plan (collectively, the “Stock Plans”).is as follows (in thousands):
2015 | $ | 1,467 | ||
2016 | 1,467 | |||
2017 | 1,467 | |||
2018 and thereafter | 366 | |||
Total | $ | 4,767 |
7. STOCK-BASED COMPENSATION
2004 Equity Incentive Plan (the “2004 Plan”)
The Company’s Board of Directors adopted the 2004 Plan in March 2004, and the Company’s stockholders approved it in November 2004. Grants generally vest over two to ten years. The 2004 Plan providesprovided for annual increases in the number of shares available for issuance beginning on January 1, 2005 equal to the least of 5% of the outstanding shares of common stock on the first day of the year, 2,400,0002.4 million shares, or a number of shares determined by the Board of Directors. For the year ended December 31, 2013, the Company added 1.8 million shares available for future issuance toThe 2004 Plan expired on November 12, 2014 and equity awards can no longer be granted under the 2004 Plan. As of December 31, 2013, approximately 3.8November 12, 2014, 2.9 million shares that were available for future issuance.
The 2004 Plan will expire on November 12, 2014. Once the 2004 Plan expires, the Company will no longer be able to grant equity awardsissuance expired under the 2004 Plan, and any shares otherwise remaining available for future grants under the 2004 Plan will no longer be available for issuance.Plan.
2014 Equity Incentive Plan (the “2014 Plan”)
The Company’s Board of Directors adopted the 2014 Plan in April 2013, and the Company’s stockholders approved it in June 2013. The 2014 Plan will becomebecame effective on November 13, 2014, the day after the 2004 Plan expires.2014. The 2014 Plan provides for the issuance of up to 5,500,0005.5 million shares and will expire on November 13, 2024. As of December 31, 2014, 5.5 million shares remained available for future issuance.
Stock-Based Compensation Expense
The Company recognized stock-based compensation expense as follows (in thousands):
Year Ended December 31, | Year Ended December 31, | |||||||||||||||||||||||
2013 | 2012 | 2011 | 2014 | 2013 | 2012 | |||||||||||||||||||
Cost of revenue | $ | 631 | $ | 510 | $ | 312 | $ | 903 | $ | 631 | $ | 510 | ||||||||||||
Research and development | 6,219 | 6,922 | 5,909 | 9,019 | 6,219 | 6,922 | ||||||||||||||||||
Selling, general and administrative | 13,851 | 11,220 | 6,905 | 23,532 | 13,851 | 11,220 | ||||||||||||||||||
Tax benefit | - | (187 | ) | (114 | ) | - | - | (187 | ) | |||||||||||||||
Total | $ | 20,701 | $ | 18,465 | $ | 13,012 | $ | 33,454 | $ | 20,701 | $ | 18,465 | ||||||||||||
Special Cash Dividend
On December 11, 2012, the Company’s Board of Directors declared a special cash dividend of $1.00 per common share, which was paid on December 28, 2012 to all shareholders of record as of the close of business on December 21, 2012, for a total of $35.7 million. This was the first cash dividend in the Company’s history. Any future dividends will be subject to the approval of the Company’s Board of Directors.
Equity Award Modifications
In connection with thea special cash dividend declared and paid in December 2012, the Company’s Board of Directors approved an equity award modification whereby the number of shares of each option outstanding as of December 28, 2012 was increased by a ratio of 1.0471 and the exercise price was reduced by the same ratio. Consequently, the Company granted an additional 171,484171,000 shares. This modification was permissible pursuant to the Company’s 2004 Plan and resulted in an incremental compensation cost of $2.9 million, of which $2.8 million was recognized during the fourth quarter of 2012. The remaining $0.1 million is being recognized over the remaining vesting period of the awards. The Company used the Black-Scholes model to determine the fair value of the additional option awards with the following weighted-average assumptions: expected term of 1.9 years, expected volatility of 41.0%, risk-free interest rate of 0.3% and dividend yield of 0.0%.
In addition, in connection with the special cash dividend, the Company’s Board of Directors approved an equity award modification whereby for each unvested RSUrestricted stock unit (“RSU”) as of December 28, 2012, the holder would receive 1.0471 shares upon vesting of the original awards granted. Consequently, the Company granted an additional 73,80574,000 shares. This modification was permissible pursuant to the Company’s 2004 Plan and resulted in an incremental compensation cost of $1.5 million, which is being recognized over the remaining vesting period of the awards. The fair value of the additional RSUs was based on the grant date share price.
RSUs
The Company’s RSUs include time-based RSUs, performance-based RSUs (“PSUs”) and market-based RSUs (“MSUs”). A summary of the RSUs is presented in the table below:
Time-Based RSUs | Weighted-AverageGrant Date Fair Value Per Share | PSUs | Weighted-Average Grant Date Fair Value Per Share | MSUs | Weighted-Average Grant Date Fair Value Per Share | Total | Weighted-Average Grant Date Fair Value Per Share | |||||||||||||||||||||||||
Outstanding at January 1, 2011 | 616,549 | $ | 19.41 | 343,625 | $ | 20.73 | - | $ | - | 960,174 | $ | 19.88 | ||||||||||||||||||||
Awards granted | 853,480 | 14.40 | - | - | - | - | 853,480 | 14.40 | ||||||||||||||||||||||||
Awards released | (310,976 | ) | 17.78 | (102,125 | ) | 20.73 | - | - | (413,101 | ) | 18.51 | |||||||||||||||||||||
Awards forfeited | (76,622 | ) | 18.39 | (24,375 | ) | 20.73 | - | - | (100,997 | ) | 18.95 | |||||||||||||||||||||
Outstanding at December 31, 2011 | 1,082,431 | 16.00 | 217,125 | 20.73 | - | - | 1,299,556 | 16.87 | ||||||||||||||||||||||||
Awards modification (1) | (76,500 | ) | 15.69 | 76,500 | 15.69 | - | - | - | - | |||||||||||||||||||||||
Awards granted (2)(3) | 617,084 | 18.69 | 962,796 | 18.24 | - | - | 1,579,880 | 18.42 | ||||||||||||||||||||||||
Performance adjustment (4) | - | - | (624,403 | ) | 18.19 | - | - | (624,403 | ) | 18.19 | ||||||||||||||||||||||
Awards released | (447,096 | ) | 17.30 | (96,500 | ) | 20.73 | - | - | (543,596 | ) | 17.91 | |||||||||||||||||||||
Awards forfeited | (77,356 | ) | 16.61 | (4,333 | ) | 19.07 | - | - | (81,689 | ) | 16,74 | |||||||||||||||||||||
Outstanding at December 31, 2012 | 1,098,563 | 16.96 | 531,185 | 18.49 | - | - | 1,629,748 | 17.46 | ||||||||||||||||||||||||
Awards granted (3) | 298,908 | 24.25 | 874,806 | 24.43 | 1,800,000 | 23.57 | 2,973,714 | 23.89 | ||||||||||||||||||||||||
Performance adjustment (4) | - | - | (124,141 | ) | 21.98 | - | - | (124,141 | ) | 21.98 | ||||||||||||||||||||||
Awards released | (518,552 | ) | 17.57 | (206,409 | ) | 18.90 | - | - | (724,961 | ) | 17.95 | |||||||||||||||||||||
Awards forfeited | (124,613 | ) | 17.06 | (47,659 | ) | 19.06 | - | - | (172,272 | ) | 17.61 | |||||||||||||||||||||
Outstanding at December 31, 2013 | 754,306 | 19.41 | 1,027,782 | 23.02 | 1,800,000 | 23.57 | 3,582,088 | 22.53 | ||||||||||||||||||||||||
Time-Based RSUs | Weighted- Average Grant Date Fair Value Per Share | PSUs | Weighted- Average Grant Date Fair Value Per Share | MSUs | Weighted- Average Grant Date Fair Value Per Share | Total | Weighted- Average Grant Date Fair Value Per Share | |||||||||||||||||||||||||
(in thousands) | (in thousands) | (in thousands) | (in thousands) | |||||||||||||||||||||||||||||
Outstanding at January 1, 2012 | 1,082 | $ | 16.00 | 217 | $ | 20.73 | - | $ | - | 1,299 | $ | 16.87 | ||||||||||||||||||||
Modification (1) | (76 | ) | $ | 15.69 | 76 | $ | 15.69 | - | $ | - | - | $ | - | |||||||||||||||||||
Granted (2)(3) | 617 | $ | 18.69 | 963 | $ | 18.24 | - | $ | - | 1,580 | $ | 18.42 | ||||||||||||||||||||
Performance adjustment (4) | - | $ | - | (624 | ) | $ | 18.19 | - | $ | - | (624 | ) | $ | 18.19 | ||||||||||||||||||
Released | (447 | ) | $ | 17.30 | (97 | ) | $ | 20.73 | - | $ | - | (544 | ) | $ | 17.91 | |||||||||||||||||
Forfeited | (77 | ) | $ | 16.61 | (4 | ) | $ | 19.07 | - | $ | - | (81 | ) | $ | 16.74 | |||||||||||||||||
Outstanding at December 31, 2012 | 1,099 | $ | 16.96 | 531 | $ | 18.49 | - | $ | - | 1,630 | $ | 17.46 | ||||||||||||||||||||
Granted (3) | 299 | $ | 24.25 | 875 | $ | 24.43 | 1,800 | $ | 23.57 | 2,974 | $ | 23.89 | ||||||||||||||||||||
Performance adjustment (4) | - | $ | - | (124 | ) | $ | 21.98 | - | $ | - | (124 | ) | $ | 21.98 | ||||||||||||||||||
Released | (519 | ) | $ | 17.57 | (206 | ) | $ | 18.90 | - | $ | - | (725 | ) | $ | 17.95 | |||||||||||||||||
Forfeited | (125 | ) | $ | 17.06 | (48 | ) | $ | 19.06 | - | $ | - | (173 | ) | $ | 17.61 | |||||||||||||||||
Outstanding at December 31, 2013 | 754 | $ | 19.41 | 1,028 | $ | 23.02 | 1,800 | $ | 23.57 | 3,582 | $ | 22.53 | ||||||||||||||||||||
Granted (3)(5) | 335 | $ | 36.71 | 1,091 | $ | 34.23 | - | $ | - | 1,426 | $ | 34.82 | ||||||||||||||||||||
Performance adjustment (4) | - | $ | - | (139 | ) | $ | 31.40 | - | $ | - | (139 | ) | $ | 31.40 | ||||||||||||||||||
Released | (468 | ) | $ | 20.36 | (304 | ) | $ | 18.12 | - | $ | - | (772 | ) | $ | 19.48 | |||||||||||||||||
Forfeited | (32 | ) | $ | 19.75 | (17 | ) | $ | 19.79 | - | $ | - | (49 | ) | $ | 19.77 | |||||||||||||||||
Outstanding at December 31, 2014 | 589 | $ | 28.48 | 1,659 | $ | 28.11 | 1,800 | $ | 23.57 | 4,048 | $ | 26.14 | ||||||||||||||||||||
_________________
(1) | See “2011 and 2012 CEO Awards” |
(2) |
|
(3) |
|
(4) |
|
(5) | Amount does not include 674,000 shares of |
The intrinsic value related to time-based RSUs and PSUsawards released for the years ended December 31, 2014, 2013 and 2012 and 2011 was $28.9 million, $18.6 million $10.5 million and $5.8$10.5 million, respectively. As of December 31, 2013,2014, the total intrinsic value of outstanding time-based RSUs, PSUs and MSUsawards was $124.2 million.$201.3 million, based on the closing stock price of $49.74. As of December 31, 2013,2014, unamortized compensation expense related to outstanding time-based RSUs, PSUs and MSUsawards was approximately $47.7$73.6 million with a weighted-average remaining recognition period of approximately sevensix years.
2014 Time-Based RSUs and PSUs:
In February 2014, the Board of Directors granted 336,000 shares to executive officers. These grants included 84,000 shares of time-based RSUs which vest over two years on a quarterly basis, and 252,000 shares of PSUs which represent a target number of RSUs to be awarded based on the Company’s achievement of an average two-year (2014 and 2015) revenue growth rate compared against the analog industry’s average two-year revenue growth rate as determined by the Semiconductor Industry Association (“2014 Executive PSUs”). The maximum number of 2014 Executive PSUs that an executive officer can ultimately earn is 300% of the target shares. Half of the 2014 Executive PSUs will vest in February 2016 if the pre-determined performance goals are met and approved by the Compensation Committee. The remaining shares will vest over the following two years on a quarterly basis. The vesting is subject to the employees’ continued employment with the Company.
In April 2014, the Board of Directors granted 139,000 shares to non-executive employees. These grants included 78,000 shares of time-based RSUs which vest over four years on an annual or quarterly basis, and 61,000 shares of PSUs which represent a target number of RSUs to be awarded based on the Company’s achievement of 2015 revenue goals for certain regions or product line divisions, or the Company’s achievement of an average two-year (2014 and 2015) revenue growth rate compared against the analog industry’s average two-year revenue growth rate as determined by the Semiconductor Industry Association (“2014 Non-Executive PSUs”). The maximum number of 2014 Non-Executive PSUs that an employee can ultimately earn is either 200% or 300% of the target shares, depending on the job classifications of the employees. Half of the 2014 Non-Executive PSUs will vest in the second quarter of 2016 if the pre-determined performance goals are met and approved by the Compensation Committee. The remaining shares will vest over the following two years on an annual or quarterly basis. The vesting is subject to the employees’ continued employment with the Company.
In connection with the acquisition of Sensima in July 2014, the Board of Directors granted time-based RSUs and PSUs to key Sensima employees who became employees of the Company. See Note 2 for further discussion.
In October 2014, the Board of Directors approved 212,000 shares of PSUs to executive officers with a two-year performance period that will begin in 2015. In addition, the Board of Directors approved 358,000 shares of PSUs to non-executive employees with five consecutive two-year performance periods that will begin in 2015 and end in 2020. The performance metrics for all of the PSUs will be defined by the Board of Directors at the inception of each performance period. The shares were reserved from the 2004 Plan prior to its expiration in November 2014. The shares will be subject to adjustments at the discretion of the Board of Directors at the inception of each performance period. The Company will determine the grant date fair value of these awards and begin recognizing the related expense when the performance metrics are approved by the Board of Directors and the awards are communicated to the employees at the inception of each performance period.
In October 2014, the Board of Directors approved 104,000 shares of time-based RSUs to non-executive employees with vesting period that will begin in 2015. The shares were reserved from the 2004 Plan prior to its expiration in November 2014. The Company will determine the grant date fair value of these awards and begin recognizing the related expense when the awards are communicated to the employees in 2015.
2013 MSUs:
In December 2013, the Board of Directors granted 360,000 shares to the Company’s executive officers and certain key employees. The MSUs representthe right to receive a maximum of 1.8 million shares that can be earned upon achievement of certainfive pre-determined MPS stock price hurdles from January 1, 2014 to December 31, 2018 (“2013 MSUs”). The 2013 MSUs that meet the pre-determined stock price hurdles from January 1, 2014 to December 31, 2018 will vest quarterly from January 1, 2019 to December 31, 2023, subject to the employees’ continued employment with the Company.
In 2014, the event of a change in control, as generally defined in the 2004 Plan, in which the effective price per share paid by the acquiror meets or exceeds the stockCompany achieved three price hurdles, associated withand the 2013 MSUs, all stock price hurdles at or below that price per share will be deemed met. AllCompensation Committee approved an additional 720,000 shares associated with the stock price hurdles that have been met (or deemed met based upon the price per share to be paid by the acquiror) prior to the closing of such transaction will be immediately and fully vested as they are deemed to have satisfied the time-based vesting requirement as of the closing of such transaction.employees.
The Company determined the grant date fair value of the 2013 MSUs using a Monte Carlo simulation model with the following assumptions: grant date stock price of $31.73;$31.73, expected volatility of 38.69%, risk-free interest rate of 1.6% and dividend yield of 0.0%.Stock-based compensation expense for the 2013 MSUs is not reversed if the pre-determined stock price hurdles are not satisfied.
2013 Time-Based RSUs and PSUs:
In February 2013, the Board of Directors granted 294,000 shares to the Company’s executive officers. These grants included 25%74,000 shares of time-based RSUs which vestvested over two years on a quarterly basis, and 75%220,000 shares of PSUs which representrepresented a target number of RSUs tothat would be awarded upon achievement of certain pre-determined revenue targets in 2014 (“2013 Executive PSUs”). The maximum number of 2013 Executive PSUs that an executive officer cancould receive iswas 300% of the target shares. In February 2015, the Compensation Committee approved the revenue achievement for the 2013 Executive PSUs and an additional 402,000 shares granted.were awarded to the executive officers. Half of the 2013 Executive PSUs will vestvested in February 2015 if the pre-determined revenue goals are met and approved by the Compensation Committee and the employee is employed by the Company. The remaining shares will vest over the following two years on a quarterly basis. The vesting is subject to the employees’ continued employment with the Company.
In February 2013, the Board of Directors granted 215,000 shares to its non-executive employees. These grants included 124,000 shares of time-based RSUs which vest over four years on a quarterly or annual basis, and 91,000 shares of PSUs which representrepresented a target number of RSUs tothat would be awarded upon achievement of certain pre-determined revenue targets for the Company as a whole, certain regions or product-line divisions in 2014 (“2013 Non-Executive PSUs”). The maximum number of shares2013 Non-Executive PSUs an employee cancould receive iswas either 200% or 300% of the target shares, granted, depending on the job classificationclassifications of the employee.employees. In February 2015, the Compensation Committee approved the revenue achievement for the 2013 Non-Executive PSUs and an additional 63,000 shares were awarded to the employees. Half of the 2013 Non-Executive PSUs will vestvested in the first quarter ofFebruary 2015 if the pre-determined performance goals are met and approved by the Compensation Committee and the employee is employed by the Company. The remaining shares will vest over the following two years on a quarterly or annual basis.
Based onThe vesting is subject to the Company’s 2014 revenue forecast as of December 31, 2013,employees’ continued employment with the Company has determined that it is probable that it will be able to achieve or exceed the pre-determined revenue targets set for both the 2013 Executive PSUs and the 2013 Non-Executive PSUs. The Company continues to evaluate the expected performance against the pre-determined goals and will adjust stock-based compensation expense based on this assessment accordingly.Company.
2012 Time-Based RSUs and PSUs:
In February 2012, the Board of Directors granted 413,000 shares to the Company’s executive officers. These grants included 50%206,500 shares of time-based RSUs which vestvested over two years on a quarterly basis, and 50%206,500 shares of PSUs which representrepresented a target number of RSUs tothat would be awarded upon achievement of certain pre-determined revenue targets in 2013 (“2012 Executive PSUs”PSUs���). The maximum number of 2012 Executive PSUs that an executive officer cancould receive was 300% of the target shares granted. Half of the 2012 Executive PSUs will vest in February 2014 if the pre-determined revenue goals are met and approved by the Compensation Committee and the executive officer is employed by the Company. The remaining shares will vest over the following two years on a quarterly basis.shares. In February 2014, the Compensation Committee approved the revenue goals achievedachievement for the 2012 Executive PSUs and an additional 139,000 shares were awarded to the executive officersofficers. Half of the 2012 Executive PSUs vested in February 2014.2014 and the remaining shares vest over the following two years on a quarterly basis. The vesting is subject to the employees’ continued employment with the Company.
In April 2012, the Board granted 345,000 shares to its non-executive employees. These grants included 220,000 shares of time-based RSUs which vest over four years on a quarterly or annual basis, and 125,000 shares of PSUs which representrepresented a target number of shares tothat would be awarded upon achievement of certain pre-determined revenue targets for the Company as a whole, certain regions or product-line divisions in 2013 (“2012 Non-Executive PSUs”). The maximum number of shares an employee cancould receive was either 200% or 300% of the target shares, granted, depending on the job classificationclassifications of the employee.employees. In April 2014, the Compensation Committee approved the revenue achievement for the 2012 Non-Executive PSUs and an additional 30,000 shares were awarded to the employees. Half of the 2012 Non-Executive PSUs will vestvested in the second quarter of 2014 if the pre-determined performance goals are met and approved by the Compensation Committee and the employee is employed by the Company. The remaining shares will vest over the following two years on a quarterly or annual basis. The vesting is subject to the employees’ continued employment with the Company.
2011 and 2012 CEO Awards:
In February 2011, the CompanyBoard of Directors granted 153,000 shares of time-based RSUs to itsthe CEO. In February 2012, the Board of Directors approved the modification of half of the time-based RSUs to PSUs (“2012 CEO PSUs”). The time-based RSUs that were not modified vested over two years on a quarterly basis from February 2011 to February 2013. The 2012 CEO PSUs would vest upon achievement of the pre-determined performance goals based on the Company’s 2012 revenue and the CEO’s continued employment. The maximum number of 2012 CEO PSUs that could be released was 100% of the target shares granted.shares. In February 2013, the Compensation Committee determined that the pre-determined performance goals were met and the 2012 CEO PSUs were released in February 2013.
2010 PSUs:
In February 2010, the Board granted 416,000 shares of PSUs to the Company’s executive officers (“2010 Executive PSUs”), which would vest over four years, with a graded acceleration feature that allowed all or a portion of these awards to be accelerated if certain performance conditions were satisfied. The number of shares that would be accelerated was based on achieving certain performance targets as set forth in the Company’s annual operating plan, as determined by the Compensation Committee in its sole discretion. In February 2013, the Compensation Committee determined that the pre-determined performance goals for the 2010 Executive PSUs were met and accelerated the vesting of the remaining unvested awards in February 2013.
Stock Options
A summary of the stock options activities is presented in the table below:
Shares | Weighted- Average Exercise Price | Weighted- Average Remaining Contractual Term | Aggregate Intrinsic Value | |||||||||||||
(in thousands) | (in years) | (in thousands) | ||||||||||||||
Outstanding at January 1, 2012 | 4,863 | $ | 15.31 | 3.4 | $ | 8,817 | ||||||||||
Options granted (1) | 178 | $ | 15.63 | |||||||||||||
Options exercised | (1,152 | ) | $ | 11.62 | ||||||||||||
Options forfeited and expired | (76 | ) | $ | 20.90 | ||||||||||||
Outstanding at December 31, 2012 | 3,813 | $ | 15.62 | 2.6 | $ | 25,380 | ||||||||||
Options exercised | (2,446 | ) | $ | 15.49 | ||||||||||||
Options forfeited and expired | (11 | ) | $ | 15.27 | ||||||||||||
Outstanding at December 31, 2013 | 1,356 | $ | 15.86 | 1.9 | $ | 25,506 | ||||||||||
Options exercised | (742 | ) | $ | 16.09 | ||||||||||||
Options forfeited and expired | (24 | ) | $ | 10.07 | ||||||||||||
Outstanding at December 31, 2014 | 590 | $ | 15.80 | 1.2 | $ | 20,039 | ||||||||||
Options exercisable at December 31, 2014 and expected to vest | 590 | $ | 15.80 | 1.2 | $ | 20,026 | ||||||||||
Options exercisable at December 31, 2014 | 568 | $ | 15.92 | 1.2 | $ | 19,221 | ||||||||||
_______________________
Stock Options | Weighted Average Exercise Price | Weighted-Average Remaining Contractual Term (Years) | Aggregate Intrinsic Value | |||||||||||||
Outstanding at January 1, 2011 | 5,835,118 | $ | 14.61 | 4.30 | $ | 19,035,591 | ||||||||||
Options granted (weighted-average fair value of $5.85 per share) | 152,500 | 13.96 | ||||||||||||||
Options exercised | (685,417 | ) | 6.85 | |||||||||||||
Options forfeited and expired | (438,962 | ) | 18.66 | |||||||||||||
Outstanding at December 31, 2011 | 4,863,239 | 15.31 | 3.44 | 8,817,049 | ||||||||||||
Options granted (weighted-average fair value of $8.22 per share) (1) | 178,484 | 15.63 | ||||||||||||||
Options exercised | (1,151,884 | ) | 11.62 | |||||||||||||
Options forfeited and expired | (76,478 | ) | 20.90 | |||||||||||||
Outstanding at December 31, 2012 | 3,813,361 | 15.62 | 2.56 | 25,379,573 | ||||||||||||
Options exercised | (2,445,523 | ) | 15.49 | |||||||||||||
Options forfeited and expired | (11,392 | ) | 15.27 | |||||||||||||
Outstanding at December 31, 2013 | 1,356,446 | 15.86 | 1.91 | 25,505,753 | ||||||||||||
Options exercisable at December 31, 2013 and expected to vest | 1,353,337 | 15.86 | 1.91 | 25,437,135 | ||||||||||||
Options exercisable at December 31, 2013 | 1,274,757 | 15.96 | 1.76 | 23,843,458 | ||||||||||||
(1) | Includes 171,000 options granted as a result of the equity award modification. See “Equity Award Modifications” above for further discussion. |
The following table summarizes certain information related to outstanding and exercisable options as of December 31, 2013:2014:
Options Outstanding | Options Exercisable | ||||||||||||||||||||||
Range of Exercises | Shares | Weighted-Average Remaining Contractual Life (Years) | Weighted-Average Exercise Price | Shares | Weighted-Average Exercise Price | ||||||||||||||||||
| $0.76 | - | $12.42 | 159,981 | 2.14 | $ | 10.46 | 140,945 | $ | 10.36 | ||||||||||||||
| $12.57 | - | $14.89 | 193,422 | 2.20 | 14.36 | 159,617 | 14.50 | ||||||||||||||||
| $14.93 | - | $14.96 | 11,494 | 1.32 | 14.93 | 10,882 | 14.93 | ||||||||||||||||
| $15.03 | - | $15.03 | 485,881 | 1.82 | 15.03 | 485,881 | 15.03 | ||||||||||||||||
| $15.13 | - | $17.92 | 223,686 | 1.23 | 16.97 | 205,322 | 17.07 | ||||||||||||||||
| $18.17 | - | $19.53 | 137,282 | 2.69 | 19.29 | 130,726 | 19.31 | ||||||||||||||||
| $19.56 | - | $23.02 | 131,109 | 1.83 | 21.55 | 127,793 | 21.56 | ||||||||||||||||
| $23.09 | - | $23.09 | 12,564 | 2.93 | 23.09 | 12,564 | 23.09 | ||||||||||||||||
| $23.50 | - | $23.50 | 22 | 2.72 | 23.50 | 22 | 23.50 | ||||||||||||||||
| $24.67 | - | $24.67 | 1,005 | 1.46 | 24.67 | 1,005 | 24.67 | ||||||||||||||||
| 1,356,446 | 1,274,757 | ||||||||||||||||||||||
Options Outstanding | Options Exercisable | |||||||||||||||||||||
Range of Exercises Prices | Shares | Weighted- Average Remaining Contractual Term | Weighted- Average Exercise Price | Shares | Weighted- Average Exercise Price | |||||||||||||||||
(in thousands) | (in years) | (in thousands) | ||||||||||||||||||||
| $ | 0.76 - $14.96 | 118 | 2.0 | $ | 12.16 | 98 | $ | 12.07 | ||||||||||||||
| $ | 15.03 - $15.03 | 321 | 0.8 | $ | 15.03 | 321 | $ | 15.03 | ||||||||||||||
| $ | 15.13 - $23.50 | 151 | 1.6 | $ | 20.29 | 149 | $ | 20.36 | ||||||||||||||
| 590 | 1.2 | $ | 15.80 | 568 | $ | 15.92 | ||||||||||||||||
Total intrinsic value of options exercised was $17.3 million, $27.8 million and $10.0 million and $5.8 million, respectively, for the years ended December 31, 2014, 2013 and 2012, and 2011.respectively. The net cash proceeds from the exercise of stock options were $11.9 million, $37.9 million and $13.4 million and $4.7 million, respectively, for the years ended December 31, 2014, 2013 and 2012, and 2011.respectively. At December 31, 2013,2014, unamortized compensation expense related to unvested options was approximately $0.5 million. The$0.1 million with a weighted-average remaining recognition period over which compensation expense related to these unvested options will be recognized is approximatelyof less than one year.
The grant date fair value of stock options was determined using the Black-Scholes model with the following assumptions (excluding the options modification discussed above):
Year Ended December 31, | ||||||||
2012 | 2011 | |||||||
Expected term (years) | 4.1 | 4.1 | ||||||
Expected volatility | 53.4 | % | 52.9 | % | ||||
Risk-free interest rate | 0.6 | % | 1.1 | % | ||||
Dividend yield | - | - | ||||||
Year Ended | ||||
December 31, 2012 | ||||
Expected term (years) | 4.1 | |||
Expected volatility | 53.4 | % | ||
Risk-free interest rate | 0.6 | % | ||
Dividend yield | - | |||
In estimating the expected term, the Company considers its historical stock option exercise experience, post-vesting cancellations and remaining contractual term of the options outstanding. In estimating the expected volatility, the Company uses its own historical data to determine the estimated expected volatility. The Company uses the U.S. Treasury yield for the risk-free interest rate and a dividend yield of zero, as the Company generally has not paid dividends. The cash dividend paid in December 2012 was a special dividend.The Company applies a forfeiture rate that is based on options that have been forfeited historically.
2004 Employee Stock Purchase Plan
Under the 2004 Employee Stock Purchase Plan (the “ESPP”), eligible employees may purchase common stock through payroll deductions. Participants may not purchase more than 2,000 shares in a six-month offering period or stock having a value greater than $25,000 in any calendar year as measured at the beginning of the offering period in accordance with the Internal Revenue Code and applicable Treasury Regulations. The ESPP provides for an automatic annual increase beginning on January 1, 2005 by an amount equal to the least of 1,000,0001.0 million shares, 2% of the outstanding shares of common stock on the first day of the year, or a number of shares as determined by the Board of Directors. For the years ended December 31, 2014, 2013 and 2012, 78,000, 111,000 and 2011, 111,000 shares, 152,000 shares and 150,000 shares, respectively, were issued under the ESPP. As of December 31, 2013,2014, approximately 4.84.7 million shares were available for future issuance.
The intrinsic value for stock purchased was $0.9 million, $0.8 million $1.0 million and $0.3$1.0 million for the years ended December 31, 2014, 2013 2012 and 2011,2012, respectively. The unamortized expense as of December 31, 20132014 was $66,000,$0.1 million, which will be recognized over two months.by the first quarter of 2015. The Black-Scholes model was used to value the employee stock purchase rights with the following weighted-average assumptions:
Year Ended December 31, | Year Ended December 31, | |||||||||||||||||||||||
2013 | 2012 | 2011 | 2014 | 2013 | 2012 | |||||||||||||||||||
Expected term (years) | 0.5 | 0.5 | 0.5 | 0.5 | 0.5 | 0.5 | ||||||||||||||||||
Expected volatility | 28.0 | % | 45.8 | % | 39.2 | % | 29.4 | % | 28.0 | % | 45.8 | % | ||||||||||||
Risk-free interest rate | 0.1 | % | 0.1 | % | 0.1 | % | 0.1 | % | 0.1 | % | 0.1 | % | ||||||||||||
Dividend yield | - | - | - | 0.7 | % | - | - | |||||||||||||||||
Cash proceeds from employee stock purchasesthe ESPP were $2.1 million, $2.1 million and $1.9 million for the years ended December 31, 2014, 2013 2012 and 2011 was $2.1 million, $1.9 million and $1.8 million,2012, respectively.
7. Net Income Per Share8. STOCK REPURCHASE PROGRAM
In July 2013, the Board of Directors approved a stock repurchase program that authorizes the Company to repurchase up to $100 million in the aggregate of its common stock through June 30, 2015. All shares are retired upon repurchase. The following table summarizes the repurchase activities under the program (in thousands, except per share amounts):
Shares Repurchased | Average Price Per Share | Total Amount | ||||||||||
Cumulative balance at January 1, 2014 | 664 | $ | 31.06 | $ | 20,615 | |||||||
Repurchases | 1,051 | $ | 39.19 | 41,198 | ||||||||
Cumulative balance at December 31, 2014 | 1,715 | $ | 36.04 | $ | 61,813 | |||||||
As of December 31, 2014, $38.2 million remained available for future repurchases under the program.
9. DIVIDENDS AND DIVIDEND EQUIVALENTS
2014 Cash Dividend Program
In June 2014, the Board of Directors approved a dividend program pursuant to which the Company intends to pay quarterly cash dividends on its common stock. Stockholders of record as of the last day of the quarter are entitled to receive the quarterly cash dividends declared by the Board of Directors, which are payable on the 15th of the following month. The Board of Directors declared the following cash dividends in 2014 (in thousands, except per-share amounts):
Dividend Declared | Total | |||||||
per Share | Amount | |||||||
Second quarter | $ | 0.15 | $ | 5,817 | ||||
Third quarter | $ | 0.15 | $ | 5,823 | ||||
Fourth quarter | $ | 0.15 | $ | 5,826 | ||||
As of December 31, 2014, accrued dividends totaled $5.8 million.
The declaration of any future cash dividends is at the discretion of the Board of Directors and will depend on the Company's financial condition, results of operations, capital requirements, business conditions and other factors, as well as a determination that cash dividends are in the best interests of the Company's stockholders. The Company anticipates that the cash used for future dividends will come from its current domestic cash and cash generated from ongoing U.S. operations. If cash held by the Company’s international subsidiaries is needed for the payment of dividends, the Company may be required to accrue and pay U.S. taxes to repatriate the funds.
Cash Dividend Equivalents
Beginning in June 2014, outstanding RSU awards contain rights to receive cash dividend equivalents under the Company’s stock plans, which entitle employees who hold RSUs to the same dividend value per share as holders of common stock. The dividend equivalents are accrued quarterly during the vesting periods of the RSUs and payable to the employees when the awards vest. Dividend equivalents accrued on the outstanding RSUs are forfeited if the employees do not fulfill their service requirement during the vesting periods. As of December 31, 2014, accrued dividend equivalents totaled $0.8 million.
2012 Special Cash Dividend
In December 2012, the Board of Directors declared a special cash dividend of $1.00 per common share, which was paid on December 28, 2012 to all stockholders of record as of the close of business on December 21, 2012, for a total of $35.7 million.
10. NET INCOME PER SHARE
Basic net income per share is computed by dividing net income by the weighted averageweighted-average number of common shares outstanding for the period. Diluted net income per share reflects the potential dilution that would occur if outstanding securities or other contracts to issue common stock were exercised or converted into common stock, and calculated using the treasury stock method.
Beginning in June 2014, the Company’s outstanding RSU awards contain forfeitable rights to receive cash dividend equivalents, which are accrued quarterly during the vesting periods of the RSUs and payable to the employees when the awards vest. Dividend equivalents accrued on outstanding RSUs are forfeited if the employees do not fulfill their service requirement during the vesting periods. Accordingly, these awards are not treated as participating securities in the net income per share calculation.
The following table sets forth the computation of basic and diluted net income per share (in thousands, except per share amounts):
Year Ended December 31, | Year Ended December 31, | |||||||||||||||||||||||
2013 | 2012 | 2011 | 2014 | 2013 | 2012 | |||||||||||||||||||
Numerator: | ||||||||||||||||||||||||
Net income | $ | 22,898 | $ | 15,756 | $ | 13,301 | $ | 35,495 | $ | 22,898 | $ | 15,756 | ||||||||||||
Denominator: | ||||||||||||||||||||||||
Weighted average outstanding shares used to compute basic net income per share | 37,387 | 34,871 | 34,050 | |||||||||||||||||||||
Weighted-average outstanding shares used to compute basic net income per share | 38,686 | 37,387 | 34,871 | |||||||||||||||||||||
Effect of dilutive securities | 1,233 | 1,376 | 1,110 | 1,107 | 1,233 | 1,376 | ||||||||||||||||||
Weighted average outstanding shares used to compute diluted net income per share | 38,620 | 36,247 | 35,160 | |||||||||||||||||||||
Weighted-average outstanding shares used to compute diluted net income per share | 39,793 | 38,620 | 36,247 | |||||||||||||||||||||
Net income per share - basic | $ | 0.61 | $ | 0.45 | $ | 0.39 | ||||||||||||||||||
Net income per share - diluted | $ | 0.59 | $ | 0.43 | $ | 0.38 | ||||||||||||||||||
Net income per share: | ||||||||||||||||||||||||
Basic | $ | 0.92 | $ | 0.61 | $ | 0.45 | ||||||||||||||||||
Diluted | $ | 0.89 | $ | 0.59 | $ | 0.43 | ||||||||||||||||||
For the year ended December 31, 2014, there were no anti-dilutive common stock equivalents. For the years ended December 31, 2013 2012 and 2011,2012, approximately 2,000 1.1 million and 4.91.1 million weighted-average common stock equivalents, respectively, were excluded from the calculation of diluted net income per share because their inclusion would have been anti-dilutive.
8. Income Taxes11. INCOME TAXES
The components of income (loss) before income taxes are as follows (in thousands):
Year Ended December 31, | Year Ended December 31, | |||||||||||||||||||||||
2013 | 2012 | 2011 | 2014 | 2013 | 2012 | |||||||||||||||||||
United States | $ | (2,309 | ) | $ | 807 | $ | (2,031 | ) | $ | 3,173 | $ | (2,309 | ) | $ | 807 | |||||||||
International | 26,316 | 17,083 | 15,757 | 33,219 | 26,316 | 17,083 | ||||||||||||||||||
Total income before income taxes | $ | 24,007 | $ | 17,890 | $ | 13,726 | $ | 36,392 | $ | 24,007 | $ | 17,890 | ||||||||||||
Management’s intent is to indefinitely reinvest any undistributed earnings from the Company'sits foreign subsidiaries. Accordingly, no provision for Federal and state income or foreign withholding taxes has been provided thereon, nor is it practical to determine the amount of this liability. Upon distribution of those earnings in the form of dividends or otherwise, the Company will be subject to the U.S. income taxes and potential foreign withholding taxes. As of December 31, 2014 and 2013, the unremitted earnings of foreign subsidiaries were $172.7 million and $141.0 million.million, respectively. The Company has sufficient cash reserves in the U.S. and intends to use the undistributed foreign earnings to fund foreign operations and research and development needs, planned capital outlay and expansion.
The components of the income tax provision are as follows (in thousands):
Year Ended December 31, | Year Ended December 31, | |||||||||||||||||||||||
2013 | 2012 | 2011 | 2014 | 2013 | 2012 | |||||||||||||||||||
Current: | ||||||||||||||||||||||||
Federal | $ | 77 | $ | 840 | $ | 447 | $ | 18 | $ | 77 | $ | 840 | ||||||||||||
State | 67 | 3 | (593 | ) | (28 | ) | 67 | 3 | ||||||||||||||||
Foreign | 1,053 | 1,302 | 992 | 943 | 1,053 | 1,302 | ||||||||||||||||||
Deferred: | ||||||||||||||||||||||||
Foreign | (88 | ) | (11 | ) | (421 | ) | (36 | ) | (88 | ) | (11 | ) | ||||||||||||
Total income tax provision | $ | 1,109 | $ | 2,134 | $ | 425 | $ | 897 | $ | 1,109 | $ | 2,134 | ||||||||||||
The effective tax rate differs from the applicable U.S. statutory federal income tax rate as follows:
Year Ended December 31, | Year Ended December 31, | |||||||||||||||||||||||
2013 | 2012 | 2011 | 2014 | 2013 | 2012 | |||||||||||||||||||
U.S. statutory federal tax rate | 34.0 | % | 34.0 | % | 34.0 | % | 34.0 | % | 34.0 | % | 34.0 | % | ||||||||||||
State, net of federal benefit | 0.3 | - | - | - | 0.3 | - | ||||||||||||||||||
Research and development credits | - | (3.6 | ) | (0.5 | ) | (0.3 | ) | - | (3.6 | ) | ||||||||||||||
Stock-based compensation | (13.7 | ) | 0.1 | 5.6 | (9.3 | ) | (13.7 | ) | 0.1 | |||||||||||||||
Foreign income at lower rates | (33.8 | ) | (28.4 | ) | (31.8 | ) | (27.7 | ) | (33.8 | ) | (28.4 | ) | ||||||||||||
Changes in valuation allowance | 16.8 | 7.0 | (6.1 | ) | 6.2 | 16.8 | 7.0 | |||||||||||||||||
Litigation reserves and other | 1.0 | 2.8 | 1.9 | (0.4 | ) | 1.0 | 2.8 | |||||||||||||||||
Effective tax rate | 4.6 | % | 11.9 | % | 3.1 | % | 2.5 | % | 4.6 | % | 11.9 | % | ||||||||||||
The components of net deferred tax assets consist of the following (in thousands):
As of December 31, | As of December 31, | |||||||||||||||
2013 | 2012 | 2014 | 2013 | |||||||||||||
Deferred tax assets: | ||||||||||||||||
Research tax credits | $ | 8,303 | $ | 4,930 | $ | 10,393 | $ | 8,303 | ||||||||
Other expenses not currently deductible | 3,204 | 2,133 | 4,861 | 3,204 | ||||||||||||
Stock-based compensation | 2,599 | 5,487 | 4,068 | 2,599 | ||||||||||||
Litigation settlement | 2,490 | - | - | 2,490 | ||||||||||||
Net operating losses | 627 | 291 | 298 | 627 | ||||||||||||
Depreciation and amortization | 291 | 317 | 181 | 291 | ||||||||||||
Total deferred tax assets | 17,514 | 13,158 | 19,801 | 17,514 | ||||||||||||
Valuation allowance | (16,739 | ) | (12,488 | ) | (19,051 | ) | (16,739 | ) | ||||||||
Net deferred tax assets | $ | 775 | $ | 670 | $ | 750 | $ | 775 | ||||||||
As a result of the cost sharing arrangements with the Company’s international subsidiaries (cost share arrangements), relatively small changes in costs that are not subject to sharing under the cost share arrangements can significantly impact the overall profitability of the U.S. entity. Because of the U.S. entity’s inconsistent earnings history and uncertainty of future earnings, the Company has determined that it is more likely than not that the U.S. deferred tax benefits would not be realized. The Company will continue to evaluate if its facts and circumstances warrant a reversal of the valuation allowance against the U.S. deferred tax benefits during 2014.in future periods.
As of December 31, 20132014 and 2012,2013, the Company had a valuation allowance of $16.7$19.1 million and $12.5$16.7 million, respectively, attributable to management’s determination that it is more likely than not that most of the deferred tax assets in the U.S. will not be realized. Should it be determined that additional amounts of the net deferred tax asset will not be realized in the future, an adjustment to increase the deferred tax asset valuation allowance will be charged to income in the period such determination is made. Likewise, in the event the Company were to determine that it is more likely than not that it would be able to realize its deferred tax assets in the future in excess of its net recorded amount, an adjustment to the valuation allowance for the deferred tax asset would increase income in the period such determination was made.
As of December 31, 2013,2014, the federal and state net operating loss carryforwards for income tax purposes were approximately $15.6$24.5 million and $30.2$33.2 million, respectively. The federal net operating loss carryforwards will begin to expire in 2027 and the state net operating loss carryforwardscarry forwards will expire beginning in 2018. $14.6$24.5 million of the federal net operating loss carry forwards and $25.1$28.0 million of the state net operating loss carryforwardscarry forwards are related to excess tax benefits as a result of stock option exercises and therefore will be recorded in additional paid-in-capital in the period that they become realized. The Company has elected to follow the “with and without” approach to account for excess tax benefits from stock options exercises. In addition, the Company only considers the direct effects of stock option exercises when calculating the amount of windfalls or shortfalls.
As of December 31, 2013,2014, the Company had research tax credit carryforwards of $14.4$16.7 million for federal income tax purposes, which will begin to expire in 2022,2020, and $12.4$14.7 million for state income tax purposes, which can be carried forward indefinitely. $3.6$4.0 million of the federal research tax credit and $1.4 million of the state research tax credit carryovers are related to excess tax benefits as a result of stock option exercises and therefore will be recorded in additional-paid-in-capital in the period that they become realized.
On January 2, 2013,
In December 2014, the President signed into law The American Taxpayer ReliefTax Increase Prevention Act of 20122014 (the "2012 Act"“2014 Act”). Under prior law, a taxpayer was entitled to a research tax credit for qualifying amounts paid or incurred on or before December 31, 2011.2013. The 20122014 Act extends the research credit for two years to December 31, 2013. The extension of the research credit is retroactive and includes amounts paid or incurred after December 31, 2011.2014. As a result of the retroactive extension, the Company had an increase to its federal R&D credits carryforwards of approximately $1.7$1.9 million for qualifying amounts incurred in 2012.2014. However, due to the Company’s current valuation allowance position, thisthe credit did not result in a tax benefit.
In the event of a change in ownership, as defined under federal and state tax laws, the Company's net operating loss and tax credit carryforwards could be subject to annual limitations. The annual limitations could result in the expiration of the net operating loss and tax credit carryforwards prior to utilization.
At December 31, 2013,2014, the Company had $14.9$16.4 million of unrecognized tax benefits, $5.0$4.8 million of which would affect its effective tax rate if recognized after considering the valuation allowance. At December 31, 2012,2013, the Company had $13.1$14.9 million of unrecognized tax benefits, $4.9$5.0 million of which would affect its effective tax rate if recognized after considering the valuation allowance.
A reconciliation of the beginning and ending amount of gross unrecognized tax benefits is as follows (in thousands):
Balance as at January 1, 2011 | $ | 9,106 | ||||||
Gross increase for tax position of prior year | 1,710 | |||||||
Gross increase for tax position of current year | 1,388 | |||||||
Balance as at December 31, 2011 | 12,204 | |||||||
Balance as at January 1, 2012 | $ | 12,204 | ||||||
Gross increase for tax position of prior year | 188 | 188 | ||||||
Gross increase for tax position of current year | 689 | 689 | ||||||
Balance as of December 31, 2012 | 13,081 | 13,081 | ||||||
Gross increase for tax position of prior year | 646 | 646 | ||||||
Gross increase for tax position of current year | 1,528 | 1,528 | ||||||
Reduction for prior year tax position | (333 | ) | (333 | ) | ||||
Balance as of December 31, 2013 | $ | 14,922 | 14,922 | |||||
Gross increase for tax position of prior year | 584 | |||||||
Gross increase for tax position of current year | 1,760 | |||||||
Reduction for prior year tax position | (860 | ) | ||||||
Balance as of December 31, 2014 | $ | 16,406 | ||||||
The Company recognizes interest and penalties, if any, related to uncertain tax positions in its income tax provision. As of December 31, 20132014 and 2012,2013, the Company hadhas approximately $0.5 million and $0.8 million, respectively, of accrued interest related to uncertain tax positions, which were recorded in long-term income tax liabilities in the Consolidated Balance Sheets.
Uncertain tax positions relate to the allocation of income and deductions among the Company’s global entities and to the determination of the research and development tax credit. The Company believes that it is reasonably possible that approximately $1.2 million of its unrecognized tax benefits may be released in 2014 as a result of a lapse of the statute of limitation. In addition, itIt is reasonably possible that over the next twelve-month period, the Company may experience other increases or decreases in its unrecognized tax benefits. However, it is not possible to determine either the magnitude or the range of other increases or decreases at this time.
In Switzerland where the Company designs and sells certain of its products, the Company’s earnings are currently subject to a tax holiday. The tax holiday is currently being reviewed for an extension through 2018 by local Swiss tax authorities. The benefit resulting from the tax holiday had an insignificant impact on earnings per share for the year endedDecember 31, 2014.
On September 13, 2013, the U.S. Treasury Department and the IRS issued final regulations that address costs incurred in acquiring, producing, or improving tangible property (the "tangible property regulations"). The tangible property regulations are generally effective for tax years beginning on or after January 1, 2014, and may be adopted in earlier years.2014. Given its full valuation allowance, the Company doesregulations did not anticipatehave a material impact on the impact of these changes to be material to itsCompany’s consolidated financial position, results of operations or cash flows.
Income Tax Audits
The Company is subject to examination of its income tax returns by the IRS and other tax authorities. The Company’s U.S. Federal income tax returns for the years ended December 31, 2005 through December 31, 2007 are under examination by the IRS. In April 2011, the Company received from the IRS a Notice of Proposed Adjustment ("NOPA") relating to a cost-sharing agreement entered into by the Company and its international subsidiaries on January 1, 2004. In the NOPA, the IRS objected to the Company’s allocation of certain litigation expenses between the Company and its international subsidiaries and the amount of "buy-in payments" made by the international subsidiaries to the Company in connection with the cost-sharing agreement, and proposed to increase the Company’s U.S. taxable income according to a few alternative methodologies. In February 2012, the Company received a revised NOPA from the IRS (“Revised NOPA”). In this Revised NOPA, the IRS raised the same issues as in the NOPA issued in April 2011 but under a different methodology. Under the Revised NOPA, the largest potential federal income tax adjustment,payment, if the IRS were to prevail on all matters in dispute, is $10.5 million, plus interest and penalties, if any. The Company responded to the IRS Revised NOPA in May 2012. As ofIn June 2013, the IRS has responded and continuescontinued to disagree with the Company’s rebuttal. The Company took the issue tomet with the IRS Office of Appeals in 2014, had additional discussions again in 2015, and has an appointed dateboth parties have been in March 2014.continuous discussions for a resolution of the matter. However, there is no guarantee these discussions will be conclusive. Meanwhile, the Company agreed to grant the IRS an extension of the statute of limitations for taxable years 2005 through 2007 to December 31, 2014.September 30, 2015.
The IRS also audited the research and development credits carried forward into year 2005 and the credits generated in the years 2005 through 2007. The Company received a NOPA from the IRS in February 2011, proposing to reduce the research and development credits generated in yearyears 2005 through 2007 and the carryforwards, which would then reduce the value of such credits carried forward to subsequent tax years.
The Company reviewed and responded to the above proposed adjustments. The Company regularly assesses the likelihood of an adverse outcome resulting from such examinations to determine the adequacy of its provision for income taxes. As of December 31, 2013,2014, based on the technical merits of its tax return filing positions and the interactions to date with the IRS, the Company believes that it is more-likely-than-not that the benefit of such positions will be sustained upon the resolution of itsthe audits resulting in no significantwill not have a material impact on the Company’sits consolidated financial position, results of operations and cash flows.
9. Commitments and Contingencies12. COMMITMENTS AND CONTINGENCIES
Lease Obligations
As of December 31, 2013,2014, future minimum lease payments under the non-cancelable operating leases were as follows (in thousands):
2014 | $ | 739 | ||||||
2015 | 600 | |||||||
2016 | 567 | |||||||
2017 and thereafter | 113 | |||||||
Total | $ | 2,019 |
2015 2016 2017 2018 and thereafter TotalUntil May 2012, the Company leased its headquarters and sales offices in San Jose, California. The landlord of the San Jose facility exercised their right to terminate the lease, effective April 18, 2012. In May 2012, the Company moved to an owned facility also located in San Jose, California. $ 1,094 763 297 168 $ 2,322
In September 2004, the Company entered into a lease arrangement for its manufacturing facility located in Chengdu, China. The Company now has the option to acquire the facility for approximately $1.8$1.6 million which consists of total construction costs minus total rent paid by the Company during the lease term. This option became exercisable in March 2011 and does not expire.2011. The Company will likelymay exercise its purchase option and enter into a purchase agreement for this facility in the future.
The Company also leases sales and research and development offices in the United States, Japan, China, Europe, Taiwan and Korea. Certain of the Company’s facility leases provide for periodic rent increases.
Rent expense for the years ended December 31, 2014, 2013 and 2012 and 2011 was $1.5 million, $1.2 million $1.6 million and $2.1$1.6 million, respectively.
Warranty and Indemnification Provisions
The Company generally provides a standard one to two-year warranty against defects in materials and workmanship and will either repair the goods or provide replacements at no charge to the customer for defective units. In such cases, the Company accrues for the related costs at the time the decision to permit the return is made. Reserve requirements are recorded in the period of sale and are based on an assessment of the products sold with warranty and historical warranty costs incurred.
The changes in warranty reserves are as follows (in thousands):
Year Ended December 31, | Year Ended December 31, | |||||||||||||||||||||||
2013 | 2012 | 2011 | 2014 | 2013 | 2012 | |||||||||||||||||||
Balance at beginning of period | $ | 331 | $ | 561 | $ | 764 | $ | 451 | $ | 331 | $ | 561 | ||||||||||||
Warranty provision for product sales | 476 | 917 | 870 | 282 | 476 | 917 | ||||||||||||||||||
Settlements made | (117 | ) | (675 | ) | (626 | ) | (42 | ) | (117 | ) | (675 | ) | ||||||||||||
Unused warranty provision | (239 | ) | (472 | ) | (447 | ) | (451 | ) | (239 | ) | (472 | ) | ||||||||||||
Balance at end of period | $ | 451 | $ | 331 | $ | 561 | $ | 240 | $ | 451 | $ | 331 | ||||||||||||
The Company provides indemnification agreements to certain direct or indirect customers. The Company agrees to reimburse these parties for any damages, costs and expenses incurred by them as a result of legal actions taken against them by third parties for infringing upon their intellectual property rights as a result of using the Company’s products and technologies. These indemnification provisions are varied in their scope and are subject to certain terms, conditions, limitations and exclusions. There were no indemnification liabilities incurred in 2014, 2013 2012 and 2011.2012. The Company also provides for indemnification of its directors and officers.
10. Litigation13. LITIGATION
The Company and certain of its subsidiaries are parties to actions and proceedings in the ordinary course of business, including litigation regarding its shareholders and its intellectual property, challenges to the enforceability or validity of its intellectual property and claims that the Company’s products infringe on the intellectual property rights of others. These proceedings often involve complex questions of fact and law and may require the expenditure of significant funds and the diversion of other resources to prosecute and defend. The Company defends itself vigorously against any such claims.
O2 Micro
In May 2012, the United States District Court for the Northern District of California (the “District Court”) issued an order finding O2 Micro International, Ltd. (“O2 Micro”) liable for approximately $9.1 million in attorneys’ fees and non-taxable costs, plus interest, in connection with the patent litigation that the Company won in 2010. This award was in addition to the approximately $0.3 million in taxable costs that the District Court had earlier ordered O2 Micro to pay to the Company in connection with the same lawsuit. In October 2012, O2 Micro appealed the District Court’s judgment to the United States Court of Appeals for the Federal Circuit (the “Federal Circuit”). In August 2013, the Federal Circuit affirmed O2 Micro’s liability for the full amount of the award. In September 2013, O2 Micro filed a petition for rehearing of that ruling, but the Federal Circuit denied O2 Micro’s petition for rehearing onin October 16, 2013.
In November 2013, the Company received a cash payment of $9.5 million from O2 Micro. In January 2014, O2 Micro filed an appeal with the United States Supreme Court.If the Supreme Court agrees to review the case andCourt. Had O2 Micro isbeen successful in obtaining a favorable ruling against the Company, MPS may bethe Company could have been liable to return a portion or all of the $9.5 million to O2 Micro. Accordingly, the Company recorded the $9.5 million as a current liability as of December 31, 2013.
In March 2014, the Supreme Court declined to hear the case. As O2 Micro had no further legal avenues to appeal, the Company released the current liability of $9.5 million and recorded the award as a credit to litigation benefit, net, in the Consolidated Statements of Operations in the first quarter of 2014. In addition, the Company incurred additional legal fees of $0.5 million in connection with the final resolution of the lawsuit.
Silergy
In December 2011, the Company entered into a settlement and license agreement with Silergy Corp. and Silergy Technology for infringement of the Company’s patent whereby the Company would receive a total of $2.0 million. The first $1.2 million was paid in equal installments of $300,000 in each quarter of 2012 and the remainder was paid in two equal installments in the first two quarters of 2013. No further amount was due to the Company as of December 31, 2013. All amounts were recorded as credits to litigation expense (benefit),benefit, net, in the Consolidated Statements of Operations in the periods the proceeds were received.
Linear
In August 2012, the United States Court of Appeals for the Federal Circuit issued an order affirming the judgment issued by the United States District Court for the District of Delaware finding Linear Technology Corporation (“Linear”) liable for approximately $2.3 million in attorneys’ fees and non-taxable costs, plus interest, in connection with the litigation regarding a contract dispute that the Company won in 2011. During the fourth quarter of 2012, the Company received a payment from Linear of $2.3 million plus $0.2 million reimbursement of additional attorney fees in connection with the cost of defending the appeal, which was recorded as a credit to litigation expense (benefit),benefit, net, in the Consolidated Statements of Operations.
11. Employee Benefits Plan14. EMPLOYEE BENEFIT PLAN
The Company sponsors a 401(k) retirement savings and profit-sharing plan for all employees in the United States who meet certain eligibility requirements. Participants may contribute up to the amount allowable as a deduction for federal income tax purposes. The Company is not required to contribute and did not contribute to the plan forin 2014, 2013 2012 and 2011.2012.
12. Major Customers15. SIGNIFICANT CUSTOMERS
The Company sells its products primarily through third-party distributors, value-added resellers and directly to original equipment manufacturers, original design manufacturers, and electronic manufacturing service providers. The following table summarizes those customers with sales greater than 10% of the Company's total revenue or accounts receivable balances greater than 10% of the Company'sCompany’s total accounts receivable:
Revenue | Accounts Receivable, Net | |||||||||
Year Ended December 31, | As of December 31, | |||||||||
Customers | 2013 | 2012 | 2011 | 2013 | 2012 | |||||
A | 32% | 32% | 27% | 32% | 34% | |||||
B | * | * | * | * | 11% | |||||
C | 10% | * | * | 17% | * | |||||
Revenue | Accounts Receivable | |||||||||||||||||||
Year Ended December 31, | As of December 31, | |||||||||||||||||||
Customers | 2014 | 2013 | 2012 | 2014 | 2013 | |||||||||||||||
Distributor A | 26 | % | 32 | % | 32 | % | 31 | % | 32 | % | ||||||||||
Distributor B | * | 10 | % | * | 10 | % | 17 | % | ||||||||||||
____________
* Represents less than 10%.
Both of the customers are third-party distributors. The Company’s agreements with these distributors were made in the ordinary course of business and may be terminated with or without cause by either party with advance notice. Although the Company may experience a short-term disruption in the distribution of its products and a short-term decline in revenue if its agreement with either of these distributors was terminated, the Company believes that such termination would not have a material adverse effect on its financial statements because it would be able to engage alternative distributors, resellers and other distribution channels to deliver its products to end customers within a few quarters following the termination of any agreement with a distributor.
13. Segment Information16. SEGMENT AND GEOGRAHPIC INFORMATION
As defined by the requirements of ASC 280-10-55,Segment Reporting – Overall – Implementation Guidance and Illustrations, theThe Company operates in one reportable segment that includes the design, development, marketing and sale of high-performance, mixed-signal analog semiconductors for the communications, storage and computing, consumer and industrial markets. The Company’s chief operating decision maker is its chief executive officer.officer, who reviews financial information presented on a consolidated basis. The Company derives a majority of its revenue from sales to customers located outside North America, with geographic revenue based on the customers’ ship-to locations.
The following is a summary of revenue by geographic regions (in thousands):
Year Ended December 31, | ||||||||||||
Country and Region | 2013 | 2012 | 2011 | |||||||||
China | $ | 141,400 | $ | 124,278 | $ | 113,469 | ||||||
Taiwan | 34,248 | 27,477 | 23,634 | |||||||||
Southeast Asia | 21,760 | 21,641 | 14,789 | |||||||||
Europe | 15,351 | 16,201 | 14,416 | |||||||||
Korea | 9,992 | 9,434 | 14,183 | |||||||||
United States | 7,525 | 5,711 | 4,422 | |||||||||
Japan | 7,495 | 8,516 | 10,681 | |||||||||
Other | 320 | 555 | 925 | |||||||||
Total | $ | 238,091 | $ | 213,813 | $ | 196,519 | ||||||
Year Ended December 31, | ||||||||||||
Country or Region | 2014 | 2013 | 2012 | |||||||||
China | $ | 181,050 | $ | 141,400 | $ | 124,278 | ||||||
Taiwan | 38,460 | 34,248 | 27,477 | |||||||||
Europe | 19,830 | 15,351 | 16,201 | |||||||||
Korea | 14,362 | 9,992 | 9,434 | |||||||||
Southeast Asia | 13,993 | 21,760 | 21,641 | |||||||||
Japan | 8,251 | 7,495 | 8,516 | |||||||||
United States | 6,392 | 7,525 | 5,711 | |||||||||
Other | 197 | 320 | 555 | |||||||||
Total | $ | 282,535 | $ | 238,091 | $ | 213,813 | ||||||
The following is a summary of revenue by product family (in thousands):
Year Ended December 31, | Year Ended December 31, | |||||||||||||||||||||||
Product Family | 2013 | 2012 | 2011* | 2014 | 2013 | 2012 | ||||||||||||||||||
DC to DC products | $ | 211,337 | $ | 188,736 | $ | 170,032 | $ | 253,083 | $ | 211,337 | $ | 188,736 | ||||||||||||
Lighting control products | 26,754 | 25,077 | 26,487 | 29,452 | 26,754 | 25,077 | ||||||||||||||||||
Total | $ | 238,091 | $ | 213,813 | $ | 196,519 | $ | 282,535 | $ | 238,091 | $ | 213,813 | ||||||||||||
The following is a summary of long-lived assets by geographic regions (in thousands):
As of December 31, | As of December 31, | |||||||||||||||
2013 | 2012 | |||||||||||||||
Country | 2014 | 2013 | ||||||||||||||
China | $ | 41,557 | $ | 37,071 | $ | 37,147 | $ | 41,557 | ||||||||
United States | 24,719 | 23,163 | 33,913 | 24,719 | ||||||||||||
Bermuda | 13,383 | - | ||||||||||||||
Other | 205 | 202 | 339 | 205 | ||||||||||||
Total | $ | 66,481 | $ | 60,436 | $ | 84,782 | $ | 66,481 | ||||||||
14. Stock Repurchase Program
In July 2013, the Board of Directors approved a stock repurchase program that authorizes the Company to repurchase up to $100 million in the aggregate of its common stock through June 30, 2015. All shares are retired upon repurchase. From the inception of the program through December 31, 2013, the Company repurchased a total of 663,802 shares for $20.6 million, at an average price of $31.06 per share. As of December 31, 2013, $79.4 million remained available for future repurchases under the program.
15. Accumulated Other Comprehensive Income17. ACCUMULATED OTHER COMPREHENSIVE INCOME
The following table summarizes the changes in accumulated other comprehensive income (in thousands):
Unrealized Losses on Auction-Rate Securities | Unrealized Gains on Other Available-for-Sale Securities | Foreign Currency Translation Adjustments | Total | Unrealized Losses on Auction-Rate Securities | Unrealized Gains (Losses) on Other Available-for-Sale Securities | Foreign Currency Translation Adjustments | Total | |||||||||||||||||||||||||
| Balance as of January 1, 2012 | $ | (630 | ) | $ | 3 | $ | 4,220 | $ | 3,593 | |||||||||||||||||||||||
Other comprehensive income before reclassifications | 140 | 20 | 408 | 568 | ||||||||||||||||||||||||||||
Amounts reclassified from accumulated other comprehensive income | - | 14 | - | 14 | ||||||||||||||||||||||||||||
Net current period other comprehensive income | 140 | 34 | 408 | 582 | ||||||||||||||||||||||||||||
| Balance as of December 31, 2012 | (490 | ) | 37 | 4,628 | 4,175 | |||||||||||||||||||||||||||
Balance as of January 1, 2013 | $ | (490 | ) | $ | 37 | $ | 4,628 | $ | 4,175 | |||||||||||||||||||||||
Other comprehensive income (loss) before reclassifications | 130 | (29 | ) | 1,988 | 2,089 | 130 | (29 | ) | 1,988 | 2,089 | ||||||||||||||||||||||
Amounts reclassified from accumulated other comprehensive income | - | (4 | ) | - | (4 | ) | - | (4 | ) | - | (4 | ) | ||||||||||||||||||||
Net current period other comprehensive income (loss) | 130 | (33 | ) | 1,988 | 2,085 | 130 | (33 | ) | 1,988 | 2,085 | ||||||||||||||||||||||
| Balance as of December 31, 2013 | $ | (360 | ) | $ | 4 | $ | 6,616 | $ | 6,260 | (360 | ) | 4 | 6,616 | 6,260 | ||||||||||||||||||
Other comprehensive income (loss) before reclassifications | 179 | (17 | ) | (609 | ) | (447 | ) | |||||||||||||||||||||||||
Amounts reclassified from accumulated other comprehensive income | - | (2 | ) | - | (2 | ) | ||||||||||||||||||||||||||
Net current period other comprehensive income (loss) | 179 | (19 | ) | (609 | ) | (449 | ) | |||||||||||||||||||||||||
Balance as of December 31, 2014 | $ | (181 | ) | $ | (15 | ) | $ | 6,007 | $ | 5,811 | ||||||||||||||||||||||
The amounts reclassified from accumulated other comprehensive income were recorded in interest and other income, net, in the Consolidated StatementsStatement of Operations.
18. QUARTERLY FINANCIAL DATA (UNAUDITED)
Three Months Ended | ||||||||||||||||
March 31, 2014 | June 30, 2014 | September 30, 2014 | December 31, 2014 | |||||||||||||
(in thousands, except per share amounts) | ||||||||||||||||
Revenue | $ | 60,061 | $ | 68,436 | $ | 78,335 | $ | 75,703 | ||||||||
Cost of revenue | 27,964 | 31,337 | 35,872 | 34,744 | ||||||||||||
Gross profit | 32,097 | 37,099 | 42,463 | 40,959 | ||||||||||||
Operating expenses: | ||||||||||||||||
Research and development | 15,603 | 13,368 | 14,679 | 14,941 | ||||||||||||
Selling, general and administrative | 16,109 | 16,853 | 17,006 | 16,787 | ||||||||||||
Litigation expense (benefit), net | (8,700 | ) | 274 | 332 | 66 | |||||||||||
Total operating expenses | 23,012 | 30,495 | 32,017 | 31,794 | ||||||||||||
Income from operations | 9,085 | 6,604 | 10,446 | 9,165 | ||||||||||||
Interest and other income, net | 190 | 295 | 202 | 407 | ||||||||||||
Income before income taxes | 9,275 | 6,899 | 10,648 | 9,572 | ||||||||||||
Income tax provision (benefit) | 257 | 502 | (573 | ) | 712 | |||||||||||
Net income | $ | 9,018 | $ | 6,397 | $ | 11,221 | $ | 8,860 | ||||||||
Net income per share: | ||||||||||||||||
Basic | $ | 0.23 | $ | 0.17 | $ | 0.29 | $ | 0.23 | ||||||||
Diluted | $ | 0.23 | $ | 0.16 | $ | 0.28 | $ | 0.22 | ||||||||
Weighted-average shares outstanding: | ||||||||||||||||
Basic | 38,470 | 38,684 | 38,785 | 38,807 | ||||||||||||
Diluted | 39,517 | 39,608 | 39,727 | 40,321 | ||||||||||||
Cash dividends declared per common share | $ | - | $ | 0.15 | $ | 0.15 | $ | 0.15 | ||||||||
16. Quarterly Financial Data (Unaudited)
Three Months Ended | ||||||||||||||||
March 31, 2013 | June 30, 2013 | September 30, 2013 | December 31, 2013 | |||||||||||||
(in thousands, except per share amounts) | ||||||||||||||||
Revenue | $ | 51,470 | $ | 57,714 | $ | 65,347 | $ | 63,560 | ||||||||
Cost of revenue | 24,085 | 26,786 | 30,053 | 29,266 | ||||||||||||
Gross profit | 27,385 | 30,928 | 35,294 | 34,294 | ||||||||||||
Operating expenses: | ||||||||||||||||
Research and development | 12,123 | 12,478 | 12,643 | 12,487 | ||||||||||||
Selling, general and administrative | 13,258 | 13,793 | 13,891 | 13,683 | ||||||||||||
Litigation expense (benefit), net | (301 | ) | (257 | ) | 104 | 84 | ||||||||||
Total operating expenses | 25,080 | 26,014 | 26,638 | 26,254 | ||||||||||||
Income from operations | 2,305 | 4,914 | 8,656 | 8,040 | ||||||||||||
Interest and other income (expense), net | (10 | ) | 218 | (59 | ) | (57 | ) | |||||||||
Income before income taxes | 2,295 | 5,132 | 8,597 | 7,983 | ||||||||||||
Income tax provision (benefit) | (204 | ) | (357 | ) | 1,187 | 484 | ||||||||||
Net income | $ | 2,499 | $ | 5,489 | $ | 7,410 | $ | 7,499 | ||||||||
Net income per share: | ||||||||||||||||
Basic | $ | 0.07 | $ | 0.15 | $ | 0.20 | $ | 0.20 | ||||||||
Diluted | $ | 0.07 | $ | 0.14 | $ | 0.19 | $ | 0.19 | ||||||||
Weighted-average shares outstanding: | ||||||||||||||||
Basic | 36,259 | 37,053 | 37,910 | 38,328 | ||||||||||||
Diluted | 37,708 | 38,239 | 39,009 | 39,524 | ||||||||||||
Cash dividends declared per common share | $ | - | $ | - | $ | - | $ | - | ||||||||
Three Months Ended | ||||||||||||||||
March 31, 2013 | June 30, 2013 | September 30, 2013 | December 31, 2013 | |||||||||||||
(in thousands, except per share amounts) | ||||||||||||||||
Revenue | $ | 51,470 | $ | 57,714 | $ | 65,347 | $ | 63,560 | ||||||||
Cost of revenue | 24,085 | 26,786 | 30,053 | 29,266 | ||||||||||||
Gross profit | 27,385 | 30,928 | 35,294 | 34,294 | ||||||||||||
Operating expenses: | ||||||||||||||||
Research and development | 12,123 | 12,478 | 12,643 | 12,487 | ||||||||||||
Selling, general and administrative | 13,258 | 13,793 | 13,891 | 13,683 | ||||||||||||
Litigation expense (benefit), net | (301 | ) | (257 | ) | 104 | 84 | ||||||||||
Total operating expenses | 25,080 | 26,014 | 26,638 | 26,254 | ||||||||||||
Income from operations | 2,305 | 4,914 | 8,656 | 8,040 | ||||||||||||
Interest and other income (expense), net | (10 | ) | 218 | (59 | ) | (57 | ) | |||||||||
Income before income taxes | 2,295 | 5,132 | 8,597 | 7,983 | ||||||||||||
Income tax provision (benefit) | (204 | ) | (357 | ) | 1,187 | 484 | ||||||||||
Net income | $ | 2,499 | $ | 5,489 | $ | 7,410 | $ | 7,499 | ||||||||
Basic net income per share | $ | 0.07 | $ | 0.15 | $ | 0.20 | $ | 0.20 | ||||||||
Diluted net income per share | $ | 0.07 | $ | 0.14 | $ | 0.19 | $ | 0.19 | ||||||||
Weighted-average common shares outstanding: | ||||||||||||||||
Basic | 36,259 | 37,053 | 37,910 | 38,328 | ||||||||||||
Diluted | 37,708 | 38,239 | 39,009 | 39,524 | ||||||||||||
Three Months Ended | ||||||||||||||||
March 31, 2012 | June 30, 2012 | September 30, 2012 | December 31, 2012 | |||||||||||||
(in thousands, except per share amounts) | ||||||||||||||||
Revenue | $ | 50,484 | $ | 58,607 | $ | 56,508 | $ | 48,214 | ||||||||
Cost of revenue | 24,074 | 27,435 | 26,495 | 22,661 | ||||||||||||
Gross profit | 26,410 | 31,172 | 30,013 | 25,553 | ||||||||||||
Operating expenses: | ||||||||||||||||
Research and development | 11,118 | 12,468 | 11,967 | 13,243 | ||||||||||||
Selling, general and administrative | 11,966 | 12,167 | 11,955 | 13,930 | ||||||||||||
Litigation expense (benefit), net | 128 | (244 | ) | (229 | ) | (2,600 | ) | |||||||||
Total operating expenses | 23,212 | 24,391 | 23,693 | 24,573 | ||||||||||||
Income from operations | 3,198 | 6,781 | 6,320 | 980 | ||||||||||||
Interest and other income (expense), net | 106 | 359 | 156 | (10 | ) | |||||||||||
Income before income taxes | 3,304 | 7,140 | 6,476 | 970 | ||||||||||||
Income tax provision | 309 | 548 | 555 | 722 | ||||||||||||
Net income | $ | 2,995 | $ | 6,592 | $ | 5,921 | $ | 248 | ||||||||
Basic net income per share | $ | 0.09 | $ | 0.19 | $ | 0.17 | $ | 0.01 | ||||||||
Diluted net income per share | $ | 0.08 | $ | 0.18 | $ | 0.16 | $ | 0.01 | ||||||||
Weighted average common shares outstanding: | ||||||||||||||||
Basic | 34,105 | 34,665 | 35,145 | 35,556 | ||||||||||||
Diluted | 35,538 | 35,997 | 36,438 | 36,763 | ||||||||||||
ITEM 9. CHANGES IN AND DISAGREEEMENTS WITH ACCOUNTANTS ON ACCOUNTING AND FINANCIAL DISCLOSURE
None.
ITEM 9A. CONTROLS AND PROCEDURES
Evaluation of Disclosure Controls and Procedures
Our management, with the participation of our chief executive officer and chief financial officer, evaluated the effectiveness of our disclosure controls and procedures pursuant toRule 13a-15(e) and Rule 15d-15(e) under the Securities Exchange Act of 1934 as of the end of the period covered by this Annual Report on Form 10-K.
Based on this evaluation, our chief executive officer and chief financial officer concluded that, as of December 31, 2013,2014, our disclosure controls and procedures are designed at a reasonable assurance level and are effective to provide reasonable assurance that information we are required to disclose in reports that we file or submit under the Exchange Act is recorded, processed, summarized, and reported within the time periods specified in the SEC’s rules and forms, and that such information is accumulated and communicated to our management, including our chief executive officer and chief financial officer, as appropriate, to allow timely decisions regarding required disclosure.
Management’s Report on Internal Control over Financial Reporting
Our management is responsible for establishing and maintaining adequate internal control over financial reporting. Our management conducted an evaluation of the effectiveness of our internal control over financial reporting based on the framework in Internal Control—Integrated Framework (1992) (2013)issued by the Committee of Sponsoring Organizations of the Treadway Commission. Based on this evaluation, management concluded that our internal control over financial reporting was effective as of December 31, 2013.2014. Management reviewed the results of its assessment with our Audit Committee.
Our independent registered public accounting firm, Deloitte & Touche LLP, which audited the consolidated financial statements included in this Annual Report on Form 10-K, has issued an attestation report on the effectiveness of our internal control over financial reporting.
Changes in Internal Control over Financial Reporting
ThereWe completed the acquisition of Sensima Technology SA (“Sensima”) in July 2014 and are currently evaluating the internal control at Sensima. We intend to include the acquired entity in our assessment of the effectiveness of internal control over financial reporting in the annual management report following the first anniversary of the acquisition. Other than the Sensima acquisition, there were no changes in our internal control over financial reporting that occurred during the quarter ended December 31, 20132014 that have materially affected, or are reasonably likely to materially affect, our internal control over financial reporting.
Limitations on Effectiveness of Controls and Procedures
In designing and evaluating the disclosure controls and procedures, management recognizes that any controls and procedures, no matter how well designed and operated, can provide only reasonable assurance of achieving the desired control objectives. In addition, the design of disclosure controls and procedures must reflect the fact that there are resource constraints and that management is required to apply its judgment in evaluating the benefits of possible controls and procedures relative to their costs.
REPORT OF INDEPENDENT REGISTERED PUBLIC ACCOUNTING FIRM
To the Board of Directors and Stockholders of
Monolithic Power Systems, Inc.
San Jose, California
We have audited the internal control over financial reporting of Monolithic Power Systems, Inc. and subsidiaries (the "Company") as of December 31, 2013,2014, based on criteria established inInternal Control - Integrated Framework (1992)(2013) issued by the Committee of Sponsoring Organizations of the Treadway Commission (the COSO criteria). The Company's management is responsible for maintaining effective internal control over financial reporting and for its assessment of the effectiveness of internal control over financial reporting, included in the accompanying Management’s Report on Internal Control Over Financial Reporting. Our responsibility is to express an opinion on the Company's internal control over financial reporting based on our audit.
We conducted our audit in accordance with the standards of the Public Company Accounting Oversight Board (United States). Those standards require that we plan and perform the audit to obtain reasonable assurance about whether effective internal control over financial reporting was maintained in all material respects. Our audit included obtaining an understanding of internal control over financial reporting, assessing the risk that a material weakness exists, testing and evaluating the design and operating effectiveness of internal control based on the assessed risk, and performing such other procedures as we considered necessary in the circumstances. We believe that our audit provides a reasonable basis for our opinion.
A company's internal control over financial reporting is a process designed by, or under the supervision of, the company's principal executive and principal financial officers, or persons performing similar functions, and effected by the company's board of directors, management, and other personnel to provide reasonable assurance regarding the reliability of financial reporting and the preparation of financial statements for external purposes in accordance with generally accepted accounting principles. A company's internal control over financial reporting includes those policies and procedures that (1) pertain to the maintenance of records that, in reasonable detail, accurately and fairly reflect the transactions and dispositions of the assets of the company; (2) provide reasonable assurance that transactions are recorded as necessary to permit preparation of financial statements in accordance with generally accepted accounting principles, and that receipts and expenditures of the company are being made only in accordance with authorizations of management and directors of the company; and (3) provide reasonable assurance regarding prevention or timely detection of unauthorized acquisition, use, or disposition of the company's assets that could have a material effect on the financial statements.
Because of the inherent limitations of internal control over financial reporting, including the possibility of collusion or improper management override of controls, material misstatements due to error or fraud may not be prevented or detected on a timely basis. Also, projections of any evaluation of the effectiveness of the internal control over financial reporting to future periods are subject to the risk that the controls may become inadequate because of changes in conditions, or that the degree of compliance with the policies or procedures may deteriorate.
In our opinion, the Company maintained, in all material respects, effective internal control over financial reporting as of December 31, 2013,2014, based on the COSO criteria.
We have also audited, in accordance with the standards of the Public Company Accounting Oversight Board (United States), the consolidated financial statements as of and for the year ended December 31, 20132014 of the Company and our report dated March 10, 20142, 2015 expressed an unqualified opinion on those financial statements.
/s/ DELOITTE & TOUCHE LLP
San Jose, California
March 10, 20142, 2015
ITEM 9B. OTHER INFORMATION
None.
PART III
ITEM 10. DIRECTORS, EXECUTIVE OFFICERS AND CORPORATE GOVERNANCE
Reference is made to the information regarding directors and nominees, code of ethics, corporate governance matters and disclosure relating to compliance with Section 16(a) of the Securities Exchange Act of 1934 appearing under the captions “Election of Directors” and “Compliance with Section 16(a) Beneficial Ownership Reporting Compliance” in the Company’s Proxy Statement for its Annual Meeting of Stockholders (the “2014“2015 Annual Meeting”), which information is incorporated in this Annual Report on Form 10-K by reference. Information regarding executive officers is set forth under the caption “Executive Officers of the Registrant” in Part I of this Annual Report on Form 10-K.
ITEM 11. EXECUTIVE COMPENSATION
The information required by this item will be set forth under “Executive Officer Compensation” in ourthe Company’s Proxy Statement for the 20142015 Annual Meeting, and is incorporated herein by reference.
ITEM 12. SECURITY OWNERSHIP OF CERTAIN BENEFICIAL OWNERS AND MANAGEMENT AND RELATED STOCKHOLDER MATTERS
The information required by this item will be set forth under the captions “Security Ownership of Certain Beneficial Owners and Management” and “Equity Compensation Plan Information” in ourthe Company’s Proxy Statement for the 20142015 Annual Meeting, and is incorporated herein by reference.
ITEM 13. CERTAIN RELATIONSHIPS AND RELATED TRANSACTIONS, AND DIRECTOR INDEPENDENCE
The information required by this item will be set forth under the captions “Certain Relationships and Related Transactions” and “Election of Directors” in ourthe Company’s Proxy Statement for the 20142015 Annual Meeting, and is incorporated herein by reference.
ITEM 14. PRINCIPAL ACCOUNTINGACCOUNTANT FEES AND SERVICES
The information required by this item will be set forth under the caption “Audit and Other Fees” in ourthe Company’s Proxy Statement for the 20142015 Annual Meeting, and is incorporated herein by reference.
PART IV
ITEM 15. EXHIBITS AND FINANCIAL STATEMENT SCHEDULES.
(a) Documents filed as part of this report
(1) All financial statements
Report of Independent Registered Public Accounting Firm
Consolidated Balance Sheets
Consolidated Statements of Operations
Consolidated Statements of Comprehensive Income
Consolidated Statements of Stockholders’ Equity
Consolidated Statements of Cash Flows
Notes to Consolidated Financial Statements
(2) Schedules
All schedules have been omitted because the required information is not present or not present in amounts sufficient to require submission of the schedules, or because the information required is included in the consolidated financial statements or notes thereto.
(3) Exhibits
Exhibit Number |
| Description |
|
|
|
3.1 (1) |
| Amended and Restated Certificate of Incorporation. |
|
|
|
3.2 (2) |
| Amended and Restated Bylaws. |
|
|
|
10.1+ (3) |
| Registrant’s 1998 Stock Plan and form of option agreement. |
|
|
|
10.2+ (4) |
| Registrant’s |
|
| |
|
|
|
|
| Form of Directors’ and Officers’ Indemnification Agreement. |
|
|
|
|
| Foundry Agreement between the Registrant and Advanced Semiconductor Manufacturing Corp. of Shanghai, dated August 14, 2001. |
|
|
|
|
| |
|
| Employment Agreement with Michael Hsing and Amendment thereof. |
|
|
|
|
| Employment Agreement with Maurice Sciammas and Amendment thereof. |
|
| Employment Agreement with Jim Moyer. |
|
|
|
|
| Employment Agreement with Deming Xiao and Amendment thereof. |
|
|
|
|
| |
|
| Distribution Agreement with Asian Information Technology Inc. Ltd., dated March 1, 2004. |
|
|
|
|
| |
|
| Investment and Cooperation Contract, dated August 19, 2004. |
|
|
|
|
| |
|
| |
|
| |
|
| |
|
|
|
| |
|
| Form of Performance Unit Agreement. |
|
|
|
|
| |
|
| Letter Agreement with Victor Lee. |
|
|
|
|
| |
|
| Letter Agreement with Douglas McBurnie. |
|
|
|
|
| Letter Agreement with Karen A. Smith Bogart. |
|
|
|
|
| |
|
| Registrant’s Employee Bonus Plan, as amended effective March 6, 2008. |
|
|
|
|
| |
|
| Form of Restricted Stock Award Agreement. |
|
|
|
|
| |
|
| Letter Agreement with Jeff Zhou. |
|
|
|
|
| Employment |
| Monolithic Power Systems, Inc. Master Cash Performance Bonus Plan. | ||
| 10.20+(22) | Letter Agreement with Eugen Elmiger. | ||
10.21+(23) | Monolithic Power Systems, Inc. 2004 Equity Incentive Plan, as Amended, and Form of Grant Agreement. | ||
10.22+(24) |
| Monolithic Power Systems, Inc. 2014 Equity Incentive | |
|
| ||
|
| |
21.1 |
| Subsidiaries of Monolithic Power Systems, Inc. |
|
|
|
23.1 |
| Consent of Independent Registered Public Accounting Firm. |
|
|
|
24.1 |
| Power of Attorney (included on Signature page to this Form 10-K). |
|
|
|
31.1 |
| Certification of Chief Executive Officer pursuant to Securities Exchange Act Rules 13a-14(a) and 15d-14(a), as adopted pursuant to Section 302 of the Sarbanes-Oxley Act of 2002. |
|
|
|
31.2 |
| Certification of Chief Financial Officer pursuant to Securities Exchange Act Rules 13a-14(a) and 15d-14(a), as adopted pursuant to Section 302 of the Sarbanes-Oxley Act of 2002. |
|
|
|
32.1* |
| Certification of Chief Executive Officer and Chief Financial Officer pursuant to 18 U.S.C. Section 1350, as adopted pursuant to Section 906 of the Sarbanes-Oxley Act of 2002. |
|
|
|
|
| XBRL Instance |
|
|
|
|
| XBRL Taxonomy Extension Schema |
|
|
|
|
| XBRL Taxonomy Extension Calculation |
|
|
|
|
| XBRL Taxonomy Extension Definition |
|
|
|
|
| XBRL Taxonomy Extension Labels |
|
|
|
|
| XBRL Taxonomy Extension Presentation |
+ | Management contract or compensatory plan or arrangement. |
† | Confidential treatment requested for portions of this agreement, which portions have been omitted and filed separately with the Securities and Exchange Commission |
* | This exhibit shall not be deemed “filed” for purposes of Section 18 of the Securities Exchange Act of 1934 or otherwise subject to the liabilities of that Section, nor shall it be deemed incorporated by reference in any filings under the Securities Act of 1933 or the Securities Exchange Act of 1934, whether made before or after the date hereof and irrespective of any general incorporation language in any filings. |
|
|
(1) | Incorporated by reference to Exhibit 3.2 of the Registrant’s Registration Statement on Form S-1/A (Registration No. 333-117327), filed with the Securities and Exchange Commission on November 15, 2004. |
(2) | Incorporated by reference to Exhibit 3.4 of the Registrant’s Registration Statement on Form S-1/A (Registration No. 333-117327), filed with the Securities and Exchange Commission on November 15, 2004. |
(3) | Incorporated by reference to Exhibit 10.1 of the Registrant’s Registration Statement on Form S-1 (Registration No. 333-117327), filed with the Securities and Exchange Commission on July 13, 2004. |
(4) |
|
| Incorporated by reference to Exhibit 10.3 of the Registrant’s Registration Statement on Form S-1 (Registration No. 333-117327), filed with the Securities and Exchange Commission on July 13, 2004. |
| Incorporated by reference to Exhibit 10.4 of the Registrant’s Registration Statement on Form S-1/A (Registration No. 333-117327), filed with the Securities and Exchange Commission on November 15, 2004. |
| Incorporated by reference to Exhibit 10.5 of the Registrant’s Registration Statement on Form S-1/A (Registration No. 333-117327), filed with the Securities and Exchange Commission on November 2, 2004. |
|
|
| Incorporated by reference to Exhibit 10.7 of the Registrant’s annual report on Form 10-K (File No. 000-51026), filed with the Securities and Exchange Commission on March 11, 2008 and Exhibit 10.1 of the Registrant’s current report on Form 8-K (File No. 000-51026), filed with the Securities and Exchange Commission on December 19, 2008. |
| Incorporated by reference to Exhibit 10.8 of the Registrant’s annual report on Form 10-K (File No. 000-51026), filed with the Securities and Exchange Commission on March 11, 2008 and Exhibit 10.3 of the Registrant’s current report on Form 8-K (File No. 000-51026), filed with the Securities and Exchange Commission on December 19, 2008. |
| Incorporated by reference to Exhibit 10.9 of the Registrant’s Registration Statement on Form S-1 (Registration No. 333-117327), filed with the Securities and Exchange Commission on July 13, 2004. |
| Incorporated by reference to Exhibit 10.10 of the Registrant’s annual report on Form 10-K (File No. 000-51026), filed with the Securities and Exchange Commission on March 11, 2008 and Exhibit 10.4 of the Registrant’s current report on Form 8-K (File No. 000-51026), filed with the Securities and Exchange Commission on December 19, 2008. |
|
|
| Incorporated by reference to Exhibit 10.11 of the Registrant’s Registration Statement on Form S-1/A (Registration No. 333-117327), filed with the Securities and Exchange Commission on September 10, 2004. |
|
|
| Incorporated by reference to Exhibit 10.13 of the Registrant’s Registration Statement on Form S-1/A (Registration No. 333-117327), filed with the Securities and Exchange Commission on September 10, 2004. |
|
|
|
|
|
|
|
|
|
|
|
|
| Incorporated by reference to Exhibit 10.1 of the Registrant’s current report on Form 8-K (File No. 000-51026), filed with the Securities and Exchange Commission on November 1, 2006. |
|
|
| Incorporated by reference to Exhibit 10.1 of the Registrant’s current report on Form 8-K (File No. 000-51026), filed with the Securities and Exchange Commission on September 14, 2006. |
|
|
| Incorporated by reference to Exhibit 10.1 of the Registrant’s current report on Form 8-K (File No. 000-51026), filed with the Securities and Exchange Commission on May 25, |
| Incorporated by reference to Exhibit 10.2 of the Registrant’s current report on Form 8-K (File No. 000-51026), filed with the Securities and Exchange Commission on May 25, |
|
|
| Incorporated by reference to Exhibit 10.31 of the Registrant’s annual report on Form 10-K (File No. 000-51026), filed with the Securities and Exchange Commission on March 11, 2008. |
|
|
| Incorporated by reference to Exhibit 10.1 of the Registrant’s current report on Form 8-K (File No. 000-51026), filed with the Securities and Exchange Commission on February 15, 2008. |
|
|
| Incorporated by reference to Exhibit 10.1 of the Registrant’s current report on Form 8-K (File No. 000-51026), filed with the Securities and Exchange Commission on February 3, 2010. |
| Incorporated by reference to Exhibit 10.33 of the Registrant’s annual report on Form 10-K (File No. 000-51026), filed with the Securities and Exchange Commission on March 4, 2011. |
|
|
| Incorporated by reference to Annexure C of the Registrant’s Proxy Statement on Schedule 14A(File No. 000-51026), filed with the Securities and Exchange Commission on April 30, 2013. |
(22) | Incorporated by reference to Exhibit 10.36 of the Registrant’s annual report on Form 10-K (File No. 000-51026), filed with the Securities and Exchange Commission on March 10, 2014. |
(23) | Incorporated by reference to Exhibit 4.4 of the Registrant’s Registration Statement on Form S-8 (Registration No. 333-199782), filed with the Securities and Exchange Commission on November 3, 2014. |
(24) | Incorporated by reference to Exhibit 4.6 of the Registrant’s Registration Statement on Form S-8 (Registration No. 333-199782), filed with the Securities and Exchange Commission on November 3, 2014. |
SIGNATURES
Pursuant to the requirements of Section 13 or 15(d) of the Securities Exchange Act of 1934, the registrant has duly caused this Annual Report on Form 10-K to be signed on its behalf by the undersigned, thereunto duly authorized.
| MONOLITHIC POWER SYSTEMS, INC. |
| |
|
|
|
|
|
|
| |
Date: March 2, 2015 | By: | /s/ MICHAEL R. HSING |
|
|
| Michael R. Hsing |
|
|
| President and Chief Executive Officer |
|
Date: March 10, 2014
KNOW ALL PERSONS BY THESE PRESENTS, that each person whose signature appears below constitutes and appoints Michael R. Hsing and Meera P. Rao, jointly and each of them, asseverally, his or her true and lawful attorneys-in-fact, and agents,each with fullthe power of substitution, and re-substitution, for him or her and in his or her name, place, and stead, in any and all capacities, to sign any and all amendments to this Annual Report on Form 10-K, and to file the same, with all exhibits thereto and other documents in connection therewith, with the Securities and Exchange Commission, granting unto said attorneys-in-fact and agents, and each of them, full power and authority to do and perform each and every act and thing requisite and necessary to be done in connection therewith, as fully to all intents and purposes as he or she might or could do in person, hereby ratifying and confirming all that alleach of said attorneys-in-fact, and agents, or any of his or her substitute or substitutes, may lawfully do or cause to be done by virtue hereof.
Pursuant to the requirements of the Securities Exchange Act of 1934, this report has been signed below on March 10, 20142, 2015 by the following persons on behalf of the registrant and in the capacities indicated:
/s/ MICHAEL R. HSING |
| President, Chief Executive Officer, and Director (Principal Executive Officer) |
|
|
|
|
|
|
/s/ MEERA P. RAO |
| Chief Financial Officer (Principal Financial and Accounting Officer) |
|
|
|
|
|
|
/s/ KAREN A. SMITH BOGART |
| Director |
|
|
|
|
|
|
/s/ HERBERT CHANG |
| Director |
|
|
|
|
|
|
/s/ EUGEN ELMIGER |
| Director |
|
|
|
|
|
|
/s/ VICTOR K. LEE |
| Director |
| ||
|
| |
|
|
|
|
|
|
/s/ JAMES C. MOYER |
| Director |
|
|
|
|
|
|
/s/ JEFF ZHOU |
| Director |
|
|
|
72 76