UNITED STATES
SECURITIES AND EXCHANGE COMMISSION
Washington, D.C. 20549
FORM 10-K
☒ | ANNUAL REPORT PURSUANT TO SECTION 13 OR 15(d) OF THE SECURITIES EXCHANGE ACT OF 1934
For the fiscal year ended December 31, 20132016 |
OR
| ☐ | OR
|
☐
| TRANSITION REPORT PURSUANT TO SECTION 13 OR 15(d) OF THE SECURITIES EXCHANGE ACT OF 1934
For the transition period from ____________________ to _____________________ |
Commission File Number 000-13611
SPARTAN MOTORS, INC.
(Exact Name of Registrant as Specified in Its Charter)
Michigan
(State or Other Jurisdiction of
Incorporation or Organization) | | 38-2078923
(I.R.S. Employer Identification No.) |
| | |
15411541 Reynolds Road
Charlotte, Michigan
(Address of Principal Executive Offices) | |
48813
48813
(Zip Code)
|
RegistrantRegistrant’s’s Telephone Number, Including Area Code: (517) 543-6400
Securities registered pursuant to Section 12(b) of the Securities Exchange Act
Securities registered pursuant to Section 12(b) of the Securities Exchange Act |
| |
Title of Class
Common Stock, $.01 Par Value | | Name of Exchange on which Registered
NASDAQ Global Select Market |
| | |
Securities registered pursuant to Section 12(g) of the Securities Exchange Act: None |
Indicate by check mark whether the registrant is a well-known seasoned issuer, as defined in Rule 405 of the Securities Act.
Indicate by check mark whether the registrant is not required to file reports pursuant to Section 13 or Section 15(d) of the Act.
Indicate by check mark whether the registrant: (1) has filed all reports required to be filed by Section 13 or 15(d) of the Securities Exchange Act of 1934 during the preceding 12 months (or for such shorter period that the registrant was required to file such reports), and (2) has been subject to such filing requirements for the past 90 days.
Indicate by check mark whether the registrant has submitted electronically and posted on its corporate web site, if any, every Interactive Data File required to be submitted and posted pursuant to Rule 405 of Regulation S-T (§ 232.405 of this chapter) during the preceding 12 months (or for such shorter period that the registrant was required to submit and post such files).
Indicate by check mark if disclosure of delinquent filers pursuant to Item 405 of Regulation S-K is not contained herein, and will not be contained, to the best of registrant’sregistrant’s knowledge, in definitive proxy or information statements incorporated by reference in Part III of this Form 10-K or any amendment to this Form 10-K. X
Indicate by check mark whether the registrant is a large accelerated filer, an accelerated filer, a non-accelerated filer or a smaller reporting company. See definitions of “large accelerated filer”, “accelerated filer” and “smaller reporting company” in Rule 12b-2 of the Exchange Act. (Check One):
Large accelerated filer | | Accelerated filer | X | Non-accelerated filer | | Smaller reporting company | |
Indicate by check mark whether the registrant is a shell company (as defined in Exchange Act Rule 12b-2).
The aggregate market value of the registrant’sregistrant’s voting stock held by non-affiliates of the registrant, based on the last sales price of such stock on NASDAQ Global Select Market on June 30, 2013,2016, the last business day of the registrant’s most recently completed second fiscal quarter: $200,165,585.$207,813,677.
The number of shares outstanding of the registrant’sregistrant’s Common Stock, $.01 par value, as of February 28, 2013: 34,206,66827, 2017: 34,385,986 shares
Documents Incorporated by Reference
Portions of the definitive proxy statement for the registrant’sregistrant’s May 21, 201424, 2017 annual meeting of shareholders, to be filed with the Securities and Exchange Commission no later than 120 days after December 31, 2013,2016, are incorporated by reference in Part III.
FORWARD-LOOKING STATEMENTS
FORWARD-LOOKING STATEMENTS
This Form 10-K contains some statements that are not historical facts. These statements are called “forward-looking statements” within the meaning of Section 27A of the Securities Act of 1933 and Section 21E of the Securities Exchange Act of 1934. These statements involve important known and unknown risks, uncertainties and other factors and can be identified by phrases using “estimate,” “anticipate,” “believe,” “project,” “expect,” “intend,” “predict,” “potential,” “future,” “may,” “will,” “should” and similar expressions or words. Our future results, performance or achievements may differ materially from the results, performance or achievements discussed in the forward-looking statements. These statements are not guarantees of future performance and involve certain risks, uncertainties and assumptions (“Risk Factors”) that are difficult to predict with regard to timing, extent, likelihood and degree of occurrence. Therefore, actual results and outcomes may materially differ from what may be expressed or forecasted in such forward-looking statements.
Risk Factors includethe risk factors listed and more fully described in Item 1A below, “Risk Factors”, as well as risk factorsthat we have discussed in previous public reports and other documents filed with the Securities and Exchange Commission. The list in Item 1A below includes all known risks our management believes could materially affect the results described by forward-looking statements contained in this Form 10-K. However, these risks may not be the only risks we face. Our business, operations, and financial performance could also be affected by additional factors that are not presently known to us or that we currently consider to be immaterial to our operations. In addition, new Risk Factors may emerge from time to time that may cause actual results to differ materially from those contained in any forward-looking statements. Given these risks and uncertainties, although we believe that the forward-looking statements contained in this Form 10-K are reasonable, we cannot provide you with any guarantee that the anticipated results will be achieved. All forward-looking statements in this Form 10-K are expressly qualified in their entirety by the cautionary statements contained in this section and investors should not place undue reliance on forward-looking statements as a prediction of actual results. The Company undertakes no obligation to update or revise any forward-looking statements to reflect developments or information obtained after the date this Form 10-K is filed with the Securities and Exchange Commission.
PART I
Item 1. | BusinessItem 1. Business. |
When used in this Form 10-K, “Company”, “we”, “us” or “our” refers to Spartan Motors, Inc. and, depending on the context, could also be used to refer generally to the Company and its subsidiaries, which are described below.
General
Spartan Motors, Inc. was organized as a Michigan corporation on September 18, 1975, and is headquartered in Charlotte, Michigan. Spartan Motors began development of its first product that same year and shipped its first fire truck chassis in October 1975.
We are known as a leading, niche market engineer and manufacturer in the heavy-duty, custom vehicles marketplace. Our operating activities are conducted through our wholly-owned operating subsidiary, Spartan Motors USA, Inc. (“Spartan USA”), with locations in Charlotte, Michigan; Brandon, South Dakota; Ephrata, Pennsylvania; and Bristol, Indiana, along with contract manufacturing in Kansas City, Missouri and Saltillo, Mexico. In addition, as a result of a recent acquisition described below, we now also have facilities in Snyder and Neligh, Nebraska; Delavan, Wisconsin; and a second location in Ephrata, Pennsylvania.
We have five wholly owned operating subsidiaries:recently completed a corporate reorganization. On July 1, 2015, our former Spartan Motors Chassis, Inc., located at the corporate headquarters in subsidiary (which operated our Charlotte, Michigan (“Spartan Chassis”);location) and our former Crimson Fire Aerials, Inc. locatedsubsidiary (which operated our Ephrata, Pennsylvania location) were merged into Spartan USA. On January 1, 2016, our former Utilimaster Corporation subsidiary (which operated our Bristol and Wakarusa, Indiana locations) was also merged into Spartan USA. These transactions were primarily completed in order to consolidate our U.S. operations into a single subsidiary and to simplify our corporate structure.
Our Charlotte, Michigan location manufactures heavy duty chassis and vehicles and supplies aftermarket parts and accessories under the Spartan Chassis and Spartan ERV brand names. Our Brandon, South Dakota (“Crimson”); Crimson Fire Aerials, Inc., located inand Ephrata, Pennsylvania (“Crimson Aerials”); Utilimaster Corporation, located in Wakarusa andlocations manufacture emergency response vehicles under the Spartan ERV brand name, while our Bristol, Indiana (“Utilimaster”);location manufactures vehicles used in the parcel delivery, mobile retail and Classic Fire, LLC (“Classic Fire”), locatedtrades and construction industries, and supplies related aftermarket parts and services under the Utilimaster brand name. Our Kansas City, Missouri and Saltillo, Mexico locations sell and install equipment used in Ocala, Florida. We arefleet vehicles. Spartan USA is also a participant in a joint venture, Spartan-Gimaex Innovations, LLC (“Spartan-Gimaex”), with Gimaex Holding, Inc. Spartan Chassis is a leading designer, engineer and manufacturer of custom heavy-duty chassis. The chassis consist of a frame assembly, engine, transmission, electrical system, running gear (wheels, tires, axles, suspension and brakes) and, for fire trucks and some specialty chassis applications, a cab. Spartan Chassis customers are original equipment manufacturers (“OEMs”) who complete their heavy-duty vehicle product by mounting the body or apparatus on our chassis. Crimson engineers and manufactures fire trucks built on chassis platforms purchased from either Spartan Chassis or outside sources. Crimson Aerials engineers and manufactures aerial ladder components for fire trucks. Classic Fire engineers and manufactures fire trucks that are built on commercial chassis and offered at a lower price point for use as brush trucks, urban interface, tankers and smaller rescues. Spartan-Gimaex is a 50/50 joint venture with Gimaex Holding, Inc. that was formed to leverageprovide emergency response vehicles for the complementary footprints, capabilities, brands, technologiesdomestic and product portfoliosinternational markets. Spartan-Gimaex is reported as a consolidated subsidiary of both companiesSpartan Motors, Inc. In February 2015, Spartan USA and Gimaex Holding, Inc. mutually agreed to enable technology sharing,begin discussions regarding the dissolution of the joint product development, commercial agreementsventure. In June 2015, Spartan USA and additional purchasing leverage,Gimaex Holding, Inc. entered into court proceedings to determine the terms of the dissolution. In February 2017, by agreement of the parties, the court proceeding was dismissed with prejudice and the goaljudge entered an order to this effect as the parties agreed to seek a dissolution plan on their own. No dissolution terms have been determined as of enabling both companiesthe date of this Form 10-K.
On January 1, 2017, Spartan USA acquired substantially all of the assets and certain liabilities of Smeal Fire Apparatus Co., Smeal Properties, Inc., Ladder Tower Co., and U.S. Tanker Co. When used in this Annual Report on Form 10-K, “Smeal” refers to amass a true global presencethe assets, liabilities, and operations acquired from such entities. The assets acquired consist of the assets used by the former owners of Smeal in the operation of its business designing, manufacturing, and distributing emergency response vehicle market. Utilimaster is a leading manufacturerbodies and aerial devices for the fire service industry. Smeal has operations in Snyder and Neligh, Nebraska; Delavan, Wisconsin; and Ephrata, Pennsylvania and will be operated as part of specialty vehicles made to customer specifications in the delivery and service market, including walk-in vans and hi-cube vans, as well as truck bodies.our Emergency Response Vehicles segment.
Our business strategy is to further diversify product lines and develop innovative design, engineering and manufacturing expertise in order to be the best value producer of custom vehicle products. Our diversification across several sectors provides numerous opportunities while minimizingreducing overall risk. Additionally, our business model provides the agility to quickly respond to market needs, take advantage of strategic opportunities when they arise and correctly size operations to ensure stability and growth.
We have an innovative team focused on building lasting relationships with our customers. This is accomplished by striving to deliver premium custom vehicles, vehicle components, and services. We believe we can best carry out our long-term business plan and obtain optimal financial flexibility by using a combination of borrowings under our credit facilities, as well as internally or externally generated equity capital, as sources of expansion capital.
OurOur Segments
We identify our reportable segments based on our management structure and the financial data utilized by our chief operating decision makermakers to assess segment performance and allocate resources among our operating units. We have three reportable segments: Emergency Response Vehicles, DeliveryFleet Vehicles and Service Vehicles,Services, and Specialty Chassis and Vehicles. For certain financial information related to each segment, see Note 15,16, Business Segments, of the Notes to Consolidated Financial Statements appearing in Item 8 of this Form 10-K.
Emergency Response VehiclesSegment
Our Emergency Response Vehicles segment consists of the operations of our Crimson, Crimson Aerials, Classic Fire and Spartan-Gimaex subsidiaries (together “Spartan ERV”) and the emergency response chassis and vehicle operations ofat our Charlotte, Michigan location and the Spartan Chassis subsidiary.ERV operations at our Brandon, South Dakota and Ephrata, Pennsylvania locations, along with our Spartan-Gimaex joint venture. Beginning in 2017, the Spartan ERV operations will also include the Smeal operations in Snyder and Neligh, Nebraska, Delavan, Wisconsin and Ephrata, Pennsylvania. This segment engineers and manufactures emergency response chassis, emergency response bodies and aerial equipment.equipment, and distributes related aftermarket parts and accessories. The emergency response chassis operations of Spartan USA involve the design and manufacture of custom chassis for emergency response vehicles. Our Spartan ERV division specializes in the manufacture of aerial ladders and emergency response vehicle bodies which are mounted on custom chassis frommanufactured by Spartan, Chassis, commercial chassis or other custom chassis. The emergency response chassis operations of Spartan Chassis designs and manufactures custom chassis for emergency response vehicles. Sales from the Emergency Response Vehicles segment represented 35.2%31.0%, 34.5%35.1% and 36.3%37.5% of our consolidated sales for the years ended December 31, 2013, 20122016, 2015 and 2011, respectively.2014.
The Emergency Response Vehicles segment has extensive engineering experience in creating custom vehicles that perform specialized tasks, and generally manufactures vehicles only upon receipt of confirmed purchase orders; thus, it does not have significant amounts of completed product inventory. As an emergency response vehicle producer, Spartan Motors believes it holds a unique position for continued growth due to its engineering reaction time, manufacturing expertise and flexibility. The addition of Smeal will place Spartan among the four largest North American fire apparatus manufacturers. Spartan Motors markets its emergency response vehicles throughout the U.S. and Canada, as well as in select markets in South America and Asia. The Emergency Response Vehicles segment employed approximately 700associates1,080associates in Charlotte, Michigan; Brandon, South Dakota; Snyder and Neligh, Nebraska; Delavan, Wisconsin and Ephrata, Pennsylvania; and Ocala, FloridaPennsylvania as of January 31, 2014, approximately 1752017, 4 of which were contracted employees.
Emergency Response Chassis
We custom manufacture emergency response chassis in response to customer specifications through our Spartan ChassisUSA subsidiary. These specifications vary based on such factors as application, terrain, street configuration and the nature of the community, state or country in which the fire truck will be utilized. Spartan Chassis hasWe have four fire truck models within this product line: (1) the “Gladiator” chassis; (2) the “Metro Star” chassis; (3) the “Metro Star X” chassis and (4) the “Metro Star RT” (rescue transport).
Spartan Chassis strivesWe strive to develop innovative engineering solutions to meet customer requirements, and designsdesign new products anticipating the future needs of the marketplace. NewWe regularly introduce new vehicle systems and components are regularly introduced by Spartan Chassis that incrementally improve the level of product performance, reliability, and safety for vehicle occupants. Spartan Chassis monitorsWe monitor the availability of new technology and workswork closely with itsour component manufacturers to apply new technology to itsour products.
Over the past few years, Spartan ChassisUSA has introduced innovations on our emergency response chassis such as: our Spartan Select and 180 truck programs, designed to provide the custom apparatus that emergency response professionals need with unprecedented order-to-delivery cycle times as short as 180 days; our Intelligent Backup Camera system, which can distinguish moving from stationary objects and detect when the apparatus is in close proximity to a wall, another truck or a person; Mobile Gateway, which provides an extensive group of connectivity features - even if the communications infrastructure is compromised or down; heated roll down side glass; optimized engine tunnel; and a new Angle of Approach (AoA) chassis that exceeds all NFPA angle-of-approachfire truck cab interior configuration, which provides additional space and departure standards with its 19-degree approach angle;comfort in both the driver and the Advanced Protection System (APS), an unequaled occupant restraint system which includes additional airbagofficer positions, improved shoulder harness accessibility, increased interior volume and intelligent seats providing best-in-class protection against frontal impact, rollover, side impact and occupant ejection.a 45% reduction in in-cab noise levels when traveling at 45 mph.
Emergency Response BodiesVehicles
WeWe engineer and manufacture bodies for custom and commercial emergency response vehicles and apparatus utilizing custom and commercial chassis through our Crimson, Classic Fire and Spartan-Gimaex subsidiaries. These subsidiariesSpartan USA subsidiary. We market these products through a network of dealers throughout North America, and in select markets in South America and Asia under the Spartan ERV brand. The Spartan ERVbrand and, beginning in 2017 under the Smeal, Ladder Tower Company and U.S. Tanker brands. Our product lines include pumpers and aerial fire apparatus, heavy- and light-duty rescue units, tankers and quick attack units. Spartan ERV isWe are recognized in the industry for itsour innovative design and engineering, with signature features such as Tubular Stainless Steel body structure (known as the Tri-MaxTM body frame), Vibra-TorqTM mounting system, and Smart Access pump panels that are designed to offer the safety, reliability and durability that firefighters need to get the job done. Spartan ERV’s product lines also include an array of lower price point apparatus built on commercial chassis such as brush trucks, urban interface rescue vehicles and tankers.
Aerial Ladders
We engineer, manufacture and market aerial ladder components for fire trucks under the Spartan ERV brand and, beginning in 2017 through our Crimson Aerials subsidiarySmeal and Ladder Tower Company brands. Our aerial products are produced through our Spartan USA operations in Snyder, Nebraska and Ephrata, Pennsylvania, which began operations in 2003 and hashave developed a full line of aerial products. Spartan ERV Aerials introduced its first models in 2004
Aftermarket Parts and is poised to produce the next generation of aerial devices in terms of technology, operation and serviceability. Spartan ERV Aerials primarily sells its products to Spartan ERV.
Accessories
The aftermarket parts and accessories operation of Spartan USA supplies aftermarket repair parts and accessories along with limited servicing and refurbishment for our products in the emergency response vehicles market.
DeliveryFleet Vehicles and Service VehiclesServicesSegment
We manufacture fleet vehicles used in the parcel delivery, mobile retail, and service vehiclestrades and construction industries through our Bristol, Indiana operations. Our fleet vehicles are marketed under the Utilimaster subsidiary,brand name, which was acquired on November 30, 2009. Utilimaster, which was established in 1973, designs, develops, and manufactures products to customer specifications for use in the package delivery, one-way truck rental, bakery/snack delivery, utility, and linen/uniform rental businesses. Utilimaster serves a diverse customer base and also sells aftermarket parts and assemblies. The majority of its revenues are fromaccessories and customer specific up-fit equipment for walk-in vans sold to customers in theand other delivery and service market. Its remaining revenues are attributable to commercial truck bodies, along with aftermarket parts and assemblies.vehicles. Sales from the Deliveryour Fleet Vehicles and Service VehiclesServices segment represented 38.2%47.1%, 44.2%41.4% and 38.9%41.5% of our consolidated sales for the years ended December 31, 2013, 20122016, 2015 and 2011,2014, respectively. UtilimasterOur Fleet Vehicles and Services segment employed approximately 760920 associates at our Bristol, Indiana facility, as of January 31, 2014,2017, of which approximately 10078 were contracted employees.
Utilimaster’sOur Fleet Vehicles and Services sales and distribution efforts are designed to sell to national, fleet and commercial dealer accounts within these niches under the Aeromaster®, Trademaster®, Metromaster® and Utilivan® brand names. Utilimaster markets its productsWe market our fleet vehicles throughout the U.S. and Canada.
The principal types of commercial vehicles manufactured by Utilimasterwe manufacture are walk-in vans, cutaway vans and truck bodies. Walk-in vans are assembled on a “stripped” truck chassis supplied with engine and drive train components, but without a cab. Walk-in vans are sold under the Aeromaster® brand, and are typically used in multi-stop applications that include the delivery of packages, the distribution of food products and the delivery of uniforms/linens. Cutaway vans are installed on “cutaway” van chassis, and are sold under the Utilimaster, Utilivan®, Metromaster® and Trademaster® brand names. Cutaway bodies are primarily used for local delivery of parcels, freight and perishable food. Truck bodies are installed on a chassis that is supplied with a finished cap. Utilimaster’scab. Our truck bodies are typically fabricated with pre-painted panels, aerodynamic front and side corners, hardwood floors and various door configurations to accommodate end-user loading and unloading requirements. Utilimaster’sOur truck bodies are sold under the Utilimaster brand name and are used for diversified dry freight transportation. In addition to vehicles, Utilimasterour Fleet Vehicles and Services segment sells aftermarket parts and assembliesaccessories for its walk-in vans and truck bodies.bodies and sells and installs up-fit equipment for walk-in vans and other delivery vehicles. In the years ended December 31, 2013, 20122016, 2015 and 2011,2014, interior equipment up fitting and aftermarket parts and assemblies sales represented 12.2%25.9%, 27.8%14.9% and 28.2%10.2% of the DeliveryFleet Vehicles and Service VehiclesServices segment sales.
Our Delivery and Service Vehicles segment began shipments of the "Reach "TMcommercial van in the first quarter of 2012. The ReachTM offers greatly improved fuel economy and reduced CO2 emissions, as well as enhanced aesthetics and functional improvements.
Specialty Chassis and Vehicles segment
Our Specialty Chassis and Vehicles segment consists of the Spartan Chassisour Charlotte, Michigan operations that engineer and manufacture motor home chassis, defense vehicles and other specialty chassis and distribute related aftermarket parts and assemblies.accessories. Our specialty vehicle products are manufactured to customer specifications upon receipt of confirmed purchase orders. As a specialty chassis and vehicle manufacturer, we believe we hold a unique position for continued growth due to the high quality and performance of our products, our engineering reaction time, manufacturing expertise and flexibility. Our specialty vehicle products are generally sold through original equipment manufacturers in the case of chassis and vehicles and to dealer distributors or directly to consumers for aftermarket parts and assemblies.accessories. Sales from our Specialty Chassis and Vehicles segment represented 26.6%21.9%, 21.3%23.5% and 24.8%21.0% of our consolidated sales for the years ended December 31, 2013, 20122016, 2015 and 2011.2014. The Specialty Chassis and Vehicles segment employed approximately 420associates323associates (all in Charlotte, MichiganMichigan) as of January 31, 2014,2017, of which approximately 10037 were contracted employees.
Motor Home Chassis
We custom manufacture chassis to the individual specifications of our motor home OEMoriginal equipment manufacturer (“OEM”) customers through our Spartan ChassisUSA subsidiary. These specifications vary based on specific interior and exterior design specifications, power requirements, horsepower and electrical needs of the motor home bodies to be attached to the Spartan chassis. Spartan Chassis’sUSA’s motor home chassis are separated into threefour models: (1) the “Mountain Master” series chassis; (2) the“K1”, “K2” series chassis, “K3”, and (3) the “K3”“K4” series chassis.
Versions of these threefour basic product models are designed and engineered in order to meet customer requirements. This allows the chassis to be adapted to the specific floor plan and manufacturing process used by the OEM. We seek to develop innovative engineering solutions to meet our customer’s requirements and strive to anticipate future market needs by working closely with OEMs and listening to end users. We monitor the availability of new technology and work closely with our component manufacturers to apply new technology to our products. Over the past few years we have introduced new innovations, including: the Spartan Advanced Protection System, the industry's first comprehensive safety system which brings automotive grade safety features to the Class A RV market; the Spartan Mobile Gateway, which allows Spartan chassis the ability to maintain redundant cell network connections or satellite connectivity; Spartan Connected Care, which provides owners of RVs built on Spartan chassis with instant access to coach-specific diagnostic codes, maintenance schedules, and an interactive map to pinpoint which of Spartan’s more than 250 RV-specific authorized service centers is closest; electronic steering control,control; heavy duty air ride independent front suspensionsuspension; and multiplexed electrical controls. More recent innovations include our certified 2013 EPA compliant clean diesel technology and front engine gas chassis concepts which target the largest growth segment in class A recreational vehicles.
Specialty Vehicle Chassis
Through our Spartan ChassisUSA subsidiary, we develop specialized chassis to unique customer requirements and actively seek additional applications of our existing products and technology in the specialty vehicle market. Over the past few years we have expanded into highly customized niche markets for specialty vehicle chassis, including high power/high capability drill rigs, and specialty bus applications and assembly of the Isuzu N-Series Gasoline Cab-Forward Trucks, a direct result of our alliance with Isuzu Commercial Truck of America.
Aftermarket Parts and AssembliesAccessories
The aftermarket parts and assembliesaccessories operation of Spartan ChassisUSA supplies aftermarket repair parts and sub-assemblies along with limited servicing and refurbishment for our products in the defense and motor home and emergency response markets.
Marketing
We market our specialty vehicles, including custom emergency response chassis, emergency response bodies and other specialty vehicles, throughout the U.S. and Canada, as well as select markets in South America and Asia, primarily through the direct contact of our sales department with OEMs, dealers and end users. We utilize dealer organizations that establish close working relationships through their sales departments with end users. These personal contacts focus on the quality of the group’s specialty products and allow us to keep customers updated on new and improved product lines and end users’ needs.
We Through our Utilimaster subsidiary, we sell delivery vehicles, including walk-in vans, cutaway vans and service vehiclestruck bodies, to commercial vehicle dealers, leasing companies and directly to end-users, and the ReachTM commercial van through the Isuzu dealer network. Utilimasterend-users. We also markets its productsmarket our delivery vehicles directly to several national and fleet accounts (national accounts typically have 1,000+ vehicle fleets and fleet accounts typically have 100+ vehicle fleets), and through a network of independent truck dealers in the U.S. and, to a lesser extent, in Canada. Utilimaster has organized its sales force and product engineering staff into market teams. Utilimaster also providesWe provide aftermarket support, including parts sales and field service, to all of itsour delivery vehicle customers through itsour Customer Service Department located in Bristol, Indiana, as well as maintainingwhich maintains the only online parts resource among the major delivery and service vehicle manufacturers. Utilimaster doesExcept in limited circumstances, we do not provide financing to dealers, fleet or national accounts. UtilimasterWe also maintainsmaintain multi-year supply agreements with certain key fleet customers in the parcel and linen/uniform rental industries.
In 20132016 and consistent with prior years, our representatives attended trade shows, rallies and expositions throughout North America as well as Europe and Asia to promote our products. Trade shows provide the opportunity to display products and to meet directly with OEMs who purchase chassis, dealers who sell finished vehicles and consumers who buy the finished products. Participation in these events also allows us to better identify what customers and end users are looking for in the future. We use these events to create a competitive advantage by relaying this information back to our advanced product development team for future projects.
Our sales and marketing team is responsible for promoting and selling our manufactured goods and producing product literature. The sales group consists of approximately 40 salespeople based in Company locations in Charlotte, Michigan; Brandon, South Dakota; Ephrata, Pennsylvania; Ocala, Florida; and Bristol, Indiana;Indiana, with 14 additional salespeople located throughout North America and one in South America.
Competition
The principal methods of buildingwe use to build competitive advantages we utilize include short engineering reaction time, custom design capability, high product quality, superior customer service and quick delivery. We compete with companies that manufacture for similar markets, including some divisions of large diversified organizations that have total sales and financial resources exceeding ours. Certain competitors are vertically integrated and manufacture their own chassis and/or apparatuses, although they generally do not sell their chassis to outside customers (other OEMs). Our direct competitors in the emergency vehicle apparatus market are principally smaller manufacturers. Our competition in the delivery and service vehicle market primarily walk-in vans, comes from a small number of manufacturers.
Because of the lack of reliable published statistics, we are unable to state with certainty our position in most of our markets compared to our competitors. The emergency vehicle market and, to a lesser degree, the custom chassis market are fragmented. We believe that no one company has a dominant position in either of those markets. We are thea leading manufacturer of walk-in vans in the United States, and believe we have a market share of approximately 50% in this market. The cutaway and truck body markets are highly fragmented, making the determination of our market share difficult. However, we believe we are one of the top five manufacturers of these products in the United States.
Manufacturing
We manufacture
Manufacturing
Through December 31, 2016, we manufactured our products in sixfour locations in Charlotte, Michigan,Michigan; Bristol, and Wakarusa, Indiana,Indiana; Brandon, South Dakota,Dakota; and Ephrata, PennsylvaniaPennsylvania. On January 1, 2017 we completed our acquisition of Smeal, which includes manufacturing locations in Snyder and Ocala, Florida.Neligh, Nebraska, Delavan, Wisconsin and Ephrata, Pennsylvania.
Spartan Chassis currently has six principal assembly facilities inAt our Charlotte, Michigan location, we manufacture custom emergency response chassis, emergency response vehicles, motor home and other specialty chassis and assemble Isuzu N-Series gasoline cab-forward trucks for its custom chassis products. MostIsuzu and General Motors Corp. With the exception of these facilities have been updated over the past few years in order to increase efficiencies and to improve the quality ofIsuzu N-Series trucks, our manufacturing process. Dueproducts are assembled on non-automated assembly lines owing to the custom nature of our business, our chassis are built to customer specifications on non-automated assembly lines.the products. Generally, Spartan Chassis designs, engineerswe design, engineer and assembles itsassemble our specialized heavy-duty truck chassis using primarily commercially available components purchased from outside suppliers. This approach facilitates prompt serviceability of finished products, reduces production costs, expedites the development of new products and reduces the potential of costly down time for the end user.
Crimson’s products are manufacturedAt our Bristol, Indiana location, we manufacture walk-in vans, truck bodies and assembled at its manufacturing facility located incutaway vans on an assembly line utilizing a commercial truck chassis and engineered structural components, such as floors, roofs, and wall panels. After assembly, we install optional equipment and finishes based on customer specifications.
At our Brandon, South Dakota. TheDakota, Snyder and Neligh, Nebraska and Delavan, Wisconsin locations, we manufacture emergency response vehicles, utilizing either a Spartan chassis for its products are purchasedsourced from Spartan Chassis and from outsideour Charlotte, Michigan facility or a custom or commercial chassis manufacturers. Crimson’ssourced from another manufacturer. At our Ephrata, Pennsylvania locations, we manufacture aerial ladder structures that are assembled on a Spartan or other manufacturer’s custom chassis. These facilities do not use automated assembly lines since each vehicle is manufactured to meet specifications of an end user customizeduser-customized order. The chassis is rolled down the production line as other components are added and connected. The body is manufactured at the facility with components such as pumps, tanks, and electrical control units purchased from outside suppliers.
Crimson Aerials’ products are manufactured and assembled at its manufacturing facility located in Ephrata, Pennsylvania, utilizing a chassis produced by Spartan Chassis. Crimson Aerials also refurbishes aerial ladders and other fire truck components manufactured by it and other manufacturers.
Classic Fire’s products are manufactured and assembled at its plant in Ocala, Florida, utilizing mainly commercial chassis to build specialty emergency response vehicles. They also design, engineer and produce pump modules along with Compressed Air Foam Systems (CAFS) to be used in the truck’s multiplex system.
Through 2012, Utilimaster’s manufacturing operations were located in Wakarusa, Indiana. During the first quarter of 2013, we completed the move of Utilimaster’s walk-in van production to a new, single building facility in Bristol, Indiana. The move has enabled all walk-in van production to take place in one building, thereby eliminating non value added product movement and increasing manufacturing efficiency. Utilimaster’s truck body production remains in leased facilities in Wakarusa, Indiana. Utilimaster builds commercial vehicles and installs other related equipment on truck chassis. These commercial vehicles are built on an assembly line from engineered structural components, such as floors, roofs, and wall panels. After assembly, Utilimaster installs optional equipment and finishes based on customer specifications. At each step of the manufacturing, installation and finish process, Utilimaster conducts quality control procedures to ensure product and specification integrity.
Suppliers
We are dedicated to establishing long-term and mutually beneficial relationships with our suppliers. Through these relationships, we benefit from new innovations, higher quality, reduced lead times, smoother/faster manufacturing ramp-up of new vehicle introductions and lower total costs of doing business. The combined buying power of our subsidiaries and a corporate supply chain management initiative allow us to benefit from economies of scale and to focus on a common vision.
The single largest commodity directly utilized in production is aluminum, which we purchase under purchase agreements based on forecasted production requirements. To a lesser extent we are dependent upon suppliers of lumber, fiberglass and steel for our manufacturing. We have no significant long-term material supply contracts. There are several readily available sources for the majority of these raw materials. However, we are heavily dependent on specific component part products from a few single source vendors. We maintain a qualification, on-site inspection, assistance, and performance measurement system to control risks associated with reliance on suppliers. We normally do not carry inventories of such raw materials or components in excess of those reasonably required to meet production and shipping schedules. Material and component cost increases are passed on to our customers whenever possible. However, there can be no assurance that there will not be any supply issues over the long-term.
In the assembly of delivery and service vehicles, we use chassis supplied by third parties, and generally do not purchase these chassis for inventory. For this market, we typically accept shipment of truck chassis owned by dealers or end users, for the purpose of installing and/or manufacturing our specialized commercial vehicles on such chassis. In the event of a labor disruption or other uncontrollable event adversely affecting the limited number of companies whichthat manufacture and/or deliver such commercial truck chassis, Utilimaster’sour level of manufacturing could be substantially reduced.
Research and Development
Our success depends on our ability to respond quickly to changing market demands and new regulatory requirements. Thus, we emphasize research and development and commit significant resources to develop and adapt new products and production techniques. We dedicate a portion of our facilities to research and development projects and focus on implementing the latest technology from component manufacturers into existing products and manufacturing prototypes of new product lines. We spent $10.9$6.8 million, $12.9$4.6 million and $13.9$3.9 million on research and development in 2013, 20122016, 2015 and 2011,2014, respectively. Beginning in 2015, certain engineering costs related to routine product changes that were formerly classified within Research and development expense have been classified within Cost of products sold on the Condensed Consolidated Statements of Operations in order to more consistently align the results of our individual business units. Expenses of $7.8 million for 2014 have been reclassified accordingly.
Product Warranties
WeOur subsidiaries all provide limited warranties against assembly and construction defects. These warranties generally provide for the replacement or repair of defective parts or workmanship for a specified periodperiods, ranging from one year to the life of the product, following the date of sale. The end users also may receive limited warranties from suppliers of components that are incorporated into our chassis and vehicles. For more information concerning our product warranties, see Note 12,10, Commitments and Contingent Liabilities, of the Notes to Consolidated Financial Statements appearing in this Form 10-K.
Patents, Trademarks and Licenses
We have 1624 United States patents (provisional and regular), which include rights to the design and structure of chassis and certain peripheral equipment, and have 1613 pending patent applications in the United States. The existing patents will expire on various dates from 20162018 through 20252033 and all are subject to payment of required maintenance fees. We also own 3031 United States trademark and service mark registrations. The trademark and service mark registrations are generally renewable under applicable laws, subject to payment of required fees and the filing of affidavits of use. In addition, we have various international trademark applications pending.
We believe our products are identified by our trademarks and that our trademarks are valuable assets to all of our business segments. We are not aware of any infringing uses or any prior claims of ownership of our trademarks that could materially affect our business. It is our policy to pursue registration of our primary marks whenever possible and to vigorously defend our patents, trademarks and other proprietary marks against infringement or other threats to the greatest extent practicable under applicable laws.
Environmental Matters
Compliance with federal, state and local environmental laws and regulations has not had, nor is it expected to have, a material effect on our capital expenditures, earnings or competitive position.
Associates
We employed 1,900approximately 2,340 associates as of January 31, 2014,2017, substantially all of which are full-time, including 375119 contracted associates. Management presently considers its relations with associates to be positive.
Customer Base
Customer Base
In 2013,2016, our customer base included one major customer as defined by sales of more than 10% of total net sales. Sales to Jayco, Inc. in 2013,2016, which is a customer of our Specialty Chassis and Vehicles segment, were $65.1$71.0 million.
In 2012,2015, our customer base included one major customer as defined by sales of more than 10% of total net sales. Sales to United Parcel ServiceJayco, Inc. in 2012,2015, which is a customer of our DeliverySpecialty Chassis and Service Vehicles segment, were $59.1$78.8 million.
In 2011,2014, our customer base included one major customer as defined by sales of more than 10% of total net sales. Sales to United Parcel ServiceJayco, Inc. in 2011,2014, which is a customer of our DeliverySpecialty Chassis and Service Vehicles segment, were $73.5$57.1 million.
Sales to customers classified as major amounted to 13.9%12.0%, 12.6%14.3% and 17.3%11.3% of total revenues in 2013, 20122016, 2015 and 2011,2014, respectively. We do have other significant customers which, if the relationship changes significantly, could have a material adverse impact on our financial position and results of operations. We believe that we have developed strong relationships with our customers and continually work to develop new customers and markets. See related risk factors in Item 1A of this Form 10-K.
Sales to customers outside the United States were $33.1$31.7 million, $44.2$40.1 million and $22.7$55.9 million for the years ended December 31, 2013, 20122016, 2015 and 2011,2014, respectively, or 7.1%5.4%, 9.1%7.3% and 5.3%11.0%, respectively, of sales for those years. All of our long-lived assets are located in the United States.
OrderBacklog Orders
Our order backlog orders, by reportable segment areis summarized in the following table (in thousands).
| | | December 31, 2013 | | | December 31, 2012 | | | December 31, 2016 | | | December 31, 2015 | |
Emergency Response Vehicles | | $ | 156,489 | | | $ | 95,769 | | | $ | 139,870 | | | $ | 156,270 | |
| | | | | | | | | | |
Delivery and Service Vehicles | | | 73,148 | | | | 39,656 | | |
| | | | | | | | | | |
Fleet Vehicles and Services | | | | 89,549 | | | | 96,120 | |
Specialty Chassis and Vehicles | | | 13,024 | | | | 26,600 | | | | 20,037 | | | | 18,369 | |
| | | | | | | | | | |
Total consolidated | | $ | 242,661 | | | $ | 162,025 | | | $ | 249,456 | | | $ | 270,759 | |
The increasedecrease in our Emergency Response Vehicles backlog is the result of strongwas driven by a reduction in order intake for fire truck bodies due to market share gains domestically along with increased internationalresulting from a more selective bid process established in 2016 as part of our turnaround strategy. The decrease in Fleet Vehicles and Services backlog was driven by a $25.5 million decrease in equipment up-fit orders, including a $20which was partially offset by an $18.9 million 70 unit order from Peru. The increase in Delivery and Service Vehicles backlog is due to anvehicle orders. The increase in major fleet orders, mainly for our ReachTM commercial van, from the December 31, 2012 level. Of the decrease in Specialty Chassis and Vehicles backlog approximately $7.5 million is due to a decreasewas driven by an increase in outstanding aftermarket parts and assemblies orders $4.0 million is due to the absence of orders for defense related vehicles at December 31, 2013, and the remainder is due to decreased order intake for motor home chassis as a result of new model introductions and pricing adjustments enacted in the fourth quarter of 2013. We expect to fill all of the backlog orders at December 31, 2013 during 2014.2016.
Although the backlog of unfilled orders is one of many indicators of market demand, several factors, such as changes in production rates, available capacity, new product introductions and competitive pricing actions, may affect actual sales. Accordingly, a comparison of backlog from period to period is not necessarily indicative of eventual actual shipments.
Available Information
OurOur Annual Reports on Form 10-K, Quarterly Reports on Form 10-Q, Current Reports on Form 8-K and other reports (and amendments thereto) filed or furnished pursuant to Section 13(a) of the Securities Exchange Act are available, free of charge, on our internet website (www.SpartanMotors.com) as soon as reasonably practicable after we electronically file or furnish such materials with the Securities and Exchange Commission.
The public may read and copy materials that we file with the SEC at the SEC’sSEC’s Public Reference Room at 100 F Street, NW, Washington, DC 20549. The public may obtain information on the operation of the Public Reference Room by calling the SEC at 1-800-SEC-0330. The SEC maintains an internet website(www.sec.gov) that contains reports, proxy and information statements, and other information regarding issuers that file electronically with the SEC.
| |
Item 1A. | Risk FactorsItem 1A. Risk Factors. |
The Company’sOur financial condition, results of operations and cash flows are subject to various risks, many of which are not exclusively within the Company’sour control, that may cause actual performance to differ materially from historical or projected future performance. The risks described below are the risks known to us that we believe could materially affect our business, financial condition, results of operations, or cash flows. However, these risks may not be the only risks we face. Our business could also be affected by additional factors that are not presently known to us, factors we currently consider to be immaterial to our operations, or factors that emerge as new risks in the future.
We depend on local and municipal governments for a substantial portion of our business.business.
LocalLocal and municipal governments are the end customer for a substantial proportion of our products, including custom fire truck chassis, fire truck bodies, aerial ladders and other fire truck related apparatus. These markets are cyclical later in an economic downturn and are heavily impacted by municipal capital spending budgets, which have been negativelymay be impacted by weakenedfluctuating municipal tax revenues. These budgetary constraints may have a significant adverse effect on the overall fire and emergency vehicle market and/or cause a shift in the fire and emergency vehicle market away from highly customized products toward commercially produced vehicles. These changes could result in weakened demand for our products, which may have an adverse impact on our net sales, financial condition, profitability and/or cash flows.
TThehe integration of businesses or assets we have acquired or may acquire in the future involves challenges that could disrupt our business and harm our financial condition.
As part of our growth strategy, we have pursued and expect we will continue to selectively pursue, acquisitions of businesses or assets in order to diversify, expand our capabilities, enter new markets, or increase our market share. Integrating any newly acquired business or assets can be expensive and can require a great deal of management time and other resources. If we are unable to successfully integrate the newly acquired businesses with our existing business, we may not realize the synergies we expect from the acquisition and our business and results of operations would suffer from our current expectations.may be adversely impacted.
Re-configuration or relocation of our production operations could negatively impact our earnings.
We may, from time to time, re-configure our production lines or relocate production of products between buildings or locations or to new locations in order to maximize the efficient utilization of our existing production capacity or take advantage of opportunities to increase manufacturing efficiencies, including, but not limited to, the move of our Utilimaster operations.efficiencies. Costs incurred to effect these re-configurations or re-locations may exceed our estimate, and efficiencies gained may be less than anticipated, each of which may have a negative impact on our results of operations and financial position.
Disruptions within our dealer network could adversely affect our business.
We rely, for certain of our products, on a network of independent dealers to market, deliver, provide training for, and service our products to and for customers. Our business is influenced by our ability to initiate and manage new and existing relationships with dealers.
From time to time, we or an individual dealer or the Company may choose to terminate the relationship, or the dealership could face financial difficulty leading to failure or difficulty in transitioning to new ownership. In addition, our competitors could engage in a strategy to attempt to acquire or convert a number of our dealers to carry their products. We do not believe our business is dependent on any single dealer, the loss of which would have a sustained material adverse effect upon our business.
However, temporary disruption of dealer coverage within a specific local market could temporarily have an adverse impact on our business within the affected market. The loss or termination of a significant number of dealers could cause difficulties in marketing and distributing our products and have an adverse effect on our business, operating results or financial condition. In the event that a dealer in a strategic market experiences financial difficulty, we may choose to provide financial support, such as extending credit, to a dealership, reducing the risk of disruption, but increasing our financial exposure.
We may not be able to successfully implement and manage our growth strategy.
Our growth strategy includes expanding existing market share through product innovation, continued expansion into industrial and global markets, and merger or acquisition related activities.
We believe our future success depends in part on our research and development and engineering efforts, our ability to manufacture or source the products and customer acceptance of our products. As it relates to new markets, our success also depends on our ability to create and implement local supply chain, sales and distribution strategies to reach these markets.
The potential inability to successfully implement and manage our growth strategy could adversely affect our business and our results of operations. The successful implementation of our growth strategy will depend, in part, on our ability to integrate operations with acquired companies.
Our efforts to grow our business in emerging markets are subject to all of these risks plus additional, unique risks. In certain markets, the legal and political environment can be unstable and uncertain which could make it difficult for us to compete successfully and could expose us to liabilities.
We also make investments in new business development initiatives which, like many startups, could have a relatively high failure rate. We limit our investments in these initiatives and establish governance procedures to contain the associated risks, but losses could result and may be material. Our growth strategy also may involve acquisitions, joint venture alliances and additional arrangements of distribution. We may not be able to enter into acquisitions or joint venture arrangements on acceptable terms, and we may not successfully integrate these activities into our operations. We also may not be successful in implementing new distribution channels, and changes could create discord in our existing channels of distribution.
When we introduce new products, we may incur expenses that we did not anticipate, such as recall expenses, resulting in reduced earnings.
The introduction of new products is critical to our future success. We have additional costs when we introduce new products, such as initial labor or purchasing inefficiencies, but we may also incur unexpected expenses. For example, we may experience unexpected engineering or design issues that will force a recall of a new product or increase production costs of the product above levels needed to ensure profitability. In addition, we may make business decisions that include offering incentives to stimulate the sales of products not adequately accepted by the market, or to stimulate sales of older or less marketable products. The costs resulting from these types of problems could be substantial and have a significant adverse effect on our earnings.
Any negative change in our relationship with our major customers could have significant adverse effects on revenues and profits.
Our financial success is directly related to the willingness of our customers to continue to purchase our products. Failure to fill customers’ orders in a timely manner or on the terms and conditions they may impose could harm our relationships with our customers. The importance of maintaining excellent relationships with our major customers may also give these customers leverage in our negotiations with them, including pricing and other supply terms, as well as post-sale disputes. This leverage may lead to increased costs to us or decreased margins. Furthermore, if any of our major customers experience a significant downturn in their business, or fail to remain committed to our products or brands, then these customers may reduce or discontinue purchases from us, which could have an adverse effect on our business, results of operations and financial condition. We had threetwo customers that together accounted for approximately 24%20% of our total sales in 2013 - any2016. Any negative change in our relationship with any oneeither of them, or the orders placed by any oneeither of them, could significantly affect our revenues and profits.
We depend on a small group of suppliers for some of our components, and the loss of any of these suppliers could affect our ability to obtain components at competitive prices, which would decrease our sales or earnings.
Most chassis, emergency response vehicle, aerial ladder and specialty vehicle commodity components are readily available from a variety of sources. However, a few proprietary or specialty components are produced by a small group of suppliers.
In addition, Utilimasterwe generally doesdo not purchase vehicle chassis for its inventory. Utilimaster acceptsour delivery vehicles. Rather, we accept shipments of vehicle chassis owned by dealers or end-users for the purpose of installing and/or manufacturing itsour specialized truck bodies on such chassis. There are four primary sources for commercial chassis and Utilimaster haswe have established relationships with all major chassis manufacturers.
Changes in our relationships with these suppliers, shortages, production delays or work stoppages by the employees of such suppliers could have a material adverse effect on our ability to timely manufacture our products and secure sales. If we cannot obtain an adequate supply of components or commercial chassis, this could result in a decrease in our sales and earnings.
Disruption of our supply base could affect our ability to obtain component parts.
We increasingly rely on component parts from global sources in order to manufacture our products. Disruption of this supply base due to international political events or natural disasters could affect our ability to obtain component parts at acceptable prices, or at all, and have a negative impact on our sales, results of operations and financial position.
Changes to laws and regulations governing our business could have a material impact on our operations.
Our manufactured products and the industries in which we operate are subject to extensive federal and state regulations. Changes to any of these regulations or the implementation of new regulations could significantly increase the costs of manufacturing, purchasing, operating or selling our products and could have a material adverse effect on our results of operations. Our failure to comply with present or future regulations could result in fines, potential civil and criminal liability, suspension of sales or production, or cessation of operations.
Certain U.S. tax laws currently afford favorable tax treatment for the purchase and sale of recreational vehicles that are used as the equivalent of second homes. These laws and regulations have historically been amended frequently, and it is likely that further amendments and additional regulations will be applicable to us and our products in the future. Amendments to these laws and regulations and the implementation of new regulations could have a material adverse effect on our results of operations.
Our operations are subject to a variety of federal and state environmental regulations relating to noise pollution and the use, generation, storage, treatment, emission and disposal of hazardous materials and wastes. Although we believe that we are currently in material compliance with applicable environmental regulations, our failure to comply with present or future regulations could result in fines, potential civil and criminal liability, suspension of production or operations, alterations to the manufacturing process, costly cleanup or capital expenditures.
Our businesses are cyclical and this can lead to fluctuations in our operating results.
The industries in which we operate are highly cyclical and there can be substantial fluctuations in our manufacturing, shipments and operating results, and the results for any prior period may not be indicative of results for any future period. Companies within these industries are subject to volatility in operating results due to external factors such as economic, demographic and political changes. Factors affecting the manufacture of chassis, emergency response vehicles, aerial ladders, specialty vehicles, delivery and service vehicles and other of our products include but are not limited to:
| | ● | Interest rates and the availability of financing;Commodity prices;
|
| | ● | Commodity prices;Fuel availability and prices.
|
| ● | Federal, state and municipal budgets; |
| | ● | Unemployment trends; |
| | ● | International tensions and hostilities; |
| | ● | General economic conditions; |
| | ● | Various tax incentives; |
| | ● | Federal, state and municipal budgets;
|
| ●
| Strength of the U.S. dollar compared to foreign currencies; |
| | ● | Overall consumer confidence and the level of discretionary consumer spending; |
| | ● | Dealers’Dealers’ and manufacturers’ inventory levels; and
|
| | ● | FuelInterest rates and the availability and prices.of financing.
|
Economic, legal and other factors could impact our customers’customers’ ability to pay accounts receivable balances due from them.
In the ordinary course of business, customers are granted terms related to the sale of goods and services delivered to them. These terms typically include a period of time between when the goods and services are tendered for delivery to the customer and when the customer needs to pay for these goods and services. The amounts due under these payment terms are listed as accounts receivable on our balance sheet. Prior to collection of these accounts receivable, our customers could encounter drops in sales, unexpected increases in expenses, or other factors which could impact their ability to continue as a going concern and which could affect the collectability of these amounts. Writing off uncollectible accounts receivable could have a material adverse effect on our earnings and cash flow as the Company has major customers with material accounts receivable balances at any given time.
Our business operations could be disrupted if our information technology systems fail to perform adequately or experience a security breach
We rely on our information technology systems to effectively manage our business data, communications, supply chain, product engineering, manufacturing, accounting and other business processes. While we believe we have robust processes in place to protect our information technology systems, if these systems are damaged, cease to function properly or are subject to a cyber-security breach such as infection with viruses or intentional attacks aimed at theft or destruction of sensitive data, we may suffer an interruption in our ability to manage and operate the business, and our results of operations and financial condition may be adversely affected.
Implementing a new enterprise resource planning system could interfere with our business or operations.
We are in the process of implementing a new enterprise resource planning (ERP) system. Phase 1 of this implementation is expected to be completed in 2014,2017, with the second and third phasesphase expected to be completed in 2015 and 2016.2018. This project requires significant investment of capital and human resources, the re-engineering of many processes of our business, and the attention of many associates and managers who would otherwise be focused on other aspects of our business. Should the system not be implemented successfully, or ifwe may incur impairment charges that could materially impact our financial results. If the system does not perform in a satisfactory manner once implementation is complete, our business and operations could be disrupted and our results of operations negatively affected, including our ability to report accurate and timely financial results.
Global political conditions could have a negative effect on our business.
Concerns regarding acts of terrorism, armed conflicts, natural disasters and budget shortfalls have created significant global economic and political uncertainties that may have material and adverse effects on consumer demand (particularly the specialty and motor home markets), shipping and transportation, the availability of manufacturing components, commodity prices and our ability to engage in overseas markets.
Risks associated with international sales and contracts could have a negative effect on our business.
In 2013 2016, 2015 and 20122014 we derived approximately 7.1%5.4%, 7.3% and 9.1%11.0% of our revenue from sales to, or related to, end customers outside the United States. We expect that international sales will continue to account for an increasinga meaningful amount of our total revenue, especially in our emergency response chassis and emergency response vehicles businesses.segment. Accordingly we face numerous risks associated with conducting international operations, any of which could negatively affect our financial performance, including but not limited to, changes in foreign country regulatory requirements, the strength of the U.S. dollar compared to foreign currencies, import/export restrictions, the imposition of foreign tariffs and other trade barriers and disruptions in the shipping of exported products.
Additionally, as a U.S. corporation, we are subject to the Foreign Corrupt Practices Act, which may place us at a competitive disadvantage to foreign companies that are not subject to similar regulations.
Fuel shortages, or higher prices for fuel, could have a negative effect on sales.
Gasoline or diesel fuel is required for the operation of motor homes, emergency response vehicles, delivery and service vehicles and the specialty vehicles we manufacture. Particularly in view of increased international tensions and increased global demand for oil, thereThere can be no assurance that the supply of these petroleum products will continue uninterrupted, that rationing will not be imposed or that the price of or tax on these petroleum products will not significantly increase in the future. Increases in gasoline and diesel prices and speculation about potential fuel shortages have had an unfavorable effect on consumer demand for motor homes from time to time in the past and may continue to do so in the future. This, in turn, hasmay have a material adverse effect on our sales volume. Increases in the price of oil also can result in significant increases in the price of many of the components in our products, which may have an adverse impact on margins or sales volumes.
Our operating results may fluctuate significantly on a quarter-to-quarter basis.
Our quarterly operating results depend on a variety of factors including but not limited to, the timing and volume of orders, the completion of product inspections and acceptance by our customers, and various restructuring initiatives that may be undertaken from time to time. In addition, our Utilimaster subsidiaryFleet Vehicles and Services segment experiences seasonality whereby product shipments in the first and fourth quarters are generally lower than other quarters as a result of the busy holiday delivery operations experienced by some of Utilimaster’sits largest customers. Accordingly, our financial results may be subject to significant and/or unanticipated quarter-to-quarter fluctuations.
We could incur asset impairment charges for goodwill, intangible assets or other long-lived assets.
We have a significant amount of goodwill, intangible assets and other long-lived assets. At least annually, we review goodwill and non-amortizing intangible assets for impairment. Identifiable intangible assets, goodwill and other long-lived assets are also reviewed for impairment whenever events or changes in circumstances indicate the carrying amount of an asset may not be recoverable from future cash flows. In 2013,2016 and 2015 we recorded asset impairment charges totaling $0.4 and $2.2 million against an asset group related to certain locations of our Emergency Response Vehicles reporting unit recorded a goodwill impairment charge of $4.9 million as a result of that reporting unit’s failure to meet its forecasted results and an expected decline in its future cash flows from levels previously expected.segment. If the operating performance at one or more of our reporting units fails to meet future forecasts, or if future cash flow estimates decline, we could be required, under current U.S. accounting rules, to record additional impairment charges for our goodwill, intangible assets or other long-lived assets. Any write-off of a material portion of such assets could negatively affect our results of operations or financial position.
Our stock price has been and may continue to be volatile, which may result in losses to our shareholders.
The market price of the Company’sCompany’s common stock has been and may continue to be subject to wide fluctuations in response to, among other things, quarterly fluctuations in operating results, a failure to meet published estimates of or changes in earnings estimates by securities analysts, sales of common stock by existing holders, loss of key personnel, market conditions in our industries, shortages of key product inventory components and general economic conditions.
Credit market developments may reduce availability under our credit agreement.
Due to the current volatile state of the credit markets, there is risk that lenders, even those with strong balance sheets and sound lending practices, could fail or refuse to honor their legal commitments and obligations under existing credit commitments. If our lenders fail to honor their legal commitments under our credit facilities, it could be difficult in the current environment to replace our credit facilities on similar terms. Although we believe that our operating cash flow, access to capital markets and existing credit facilities will give us the ability to satisfy our liquidity needs for at least the next 12 months, the failure of any of the lenders under our credit facilities may impact our ability to finance our operating or investing activities.
If there is a rise in the frequency and size of product liability, warranty and other claims against us, including wrongful death claims, our business, results of operations and financial condition may be harmed.
We are frequently subject, in the ordinary course of business, to litigation involving product liability and other claims, including wrongful death claims, related to personal injury and warranties. We partially self-insure our product liability claims and purchase excess product liability insurance in the commercial insurance market. We cannot be certain that our insurance coverage will be sufficient to cover all future claims against us. Any increase in the frequency and size of these claims, as compared to our experience in prior years, may cause the premiums that we are required to pay for such insurance to rise significantly. It may also increase the amounts we pay in punitive damages, which may not be covered by our insurance. In addition, a major product recall or increased levels of warranty claims could have a material adverse effect on our results of operations.
In 2015 we entered into a settlement agreement with the National Highway Traffic Safety Administration (“NHTSA”) pertaining to our early warning and defect reporting. The terms of the agreement include certain performance obligations that, if not completed satisfactorily, could subject us to additional fines of up to $5 million.
Increased costs, including costs of raw materials, component parts and labor costs, potentially impacted by changes in labor rates and practices, could reduce our operating income.
Our results of operations may be significantly affected by the availability and pricing of manufacturing components and labor, as well as changes in labor rates and practices. Increases in costs of raw materials used in our products could affect the cost of our supply materials and components, as the rising steel and aluminum prices have impacted the cost of certain of the Company’sour manufacturing components. Although we attempt to mitigate the effect of any escalation in components and labor costs by negotiating with current or new suppliers and by increasing productivity or, where necessary, by increasing the sales prices of our products, we cannot be certain that we will be able to do so without it having an adverse impact on the competitiveness of our products and, therefore, our sales volume. If we cannot successfully offset increases in our manufacturing costs, this could have a material adverse impact on our margins, operating income and cash flows. Our profit margins may decrease if prices of purchased component parts or labor rates increase and we are unable to pass on those increases to our customers. Even if we were able to offset higher manufacturing costs by increasing the sales prices of our products, the realization of any such increases often lags behind the rise in manufacturing costs, especially in our operations, due in part to our commitment to give our customers and dealers price protection with respect to previously placed customer orders.
Item 1B. | Unresolved Staff CommentsItem 1B. Unresolved Staff Comments. |
None.
Item 2. | PropertiesItem 2. Properties. |
The following table sets forth information concerning the properties we own or lease. We consider that our properties areto generally be in good condition, are well maintained, and are generally suitable and adequate to meet our business requirements for the foreseeable future. In 2013,2016, our manufacturing plants, taken as a whole, operated moderately below capacity.
| | Square Footage | | Owned/Leased | | Operating Segment |
Manufacturing/Assembly | | | | | | | |
Charlotte, Michigan | | 156,000 | | Owned | | Emergency Response Vehicles |
| Charlotte, Michigan | | 295,000181,000 | | Owned | | Emergency Response/Specialty Chassis and Vehicles |
Charlotte, Michigan | | | 82,000110,000 | | Owned | | DeliveryFleet Vehicles and Service VehiclesServices |
Brandon, South Dakota | | | 24,000 | | Owned | | Emergency Response Vehicles |
Brandon, South Dakota | | | 21,000 | | Leased | | Emergency Response Vehicles |
Ephrata, Pennsylvania | | | 45,000 | | Leased | | Emergency Response Vehicles |
Ocala, Florida
Bristol, Indiana | | | 50,000417,000 | | Leased | | Emergency ResponseFleet Vehicles
|
Bristol, Indiana
| | | 417,000 | | Leased
| | Delivery and Service Vehicles
|
Wakarusa, Indiana
| | | 149,000 | | LeasedServices
| | Delivery and Service Vehicles
|
| | | | 1,083,000 | | | |
| | 954,000 | | | | |
| | | | | | | | |
Warehousing | | | | | | | |
Charlotte, Michigan | | | 130,00011,000 | | Owned | | Emergency Response/Response Vehicles |
| Charlotte, Michigan | | 74,000 | | Owned | | Specialty Chassis and Vehicles |
Charlotte, Michigan | | 25,000 | | Owned | | Fleet Vehicles and Services |
| Brandon, South Dakota | | | 1,000 | | Owned | | Emergency Response Vehicles |
Brandon, South Dakota | | | 3,000 | | Leased | | Emergency Response Vehicles
|
Ephrata, Pennsylvania
| | | 4,500 | | Leased
| | Emergency Response Vehicles
|
Ocala, Florida
| | | 10,00010,200 | | Leased | | Emergency Response Vehicles |
Wakarusa, Indiana
Ephrata, Pennsylvania | | | 20,0004,500 | | Leased | | Delivery and ServiceEmergency Response Vehicles |
| Bristol, Indiana | | | 35,00035,000 | | Leased | | DeliveryFleet Vehicles and Service VehiclesServices |
| | | | 203,500160,700 | | | | |
| | | | | | | | |
Research and Development | | | | | | | |
Charlotte, Michigan | | | 12,00012,000 | | Owned | | Emergency Response/Specialty Chassis and Vehicles |
Bristol, Indiana | | | 3,000 | | Leased | | DeliveryFleet Vehicles and Service VehiclesServices
|
| | | | 15,00015,000 | | | | |
| | | | | | | | |
Service Area/Inspection | | | | | | | |
Charlotte, Michigan | | | 58,00053,000 | | Owned | | Emergency Response/Specialty Chassis and Vehicles |
Brandon, South Dakota | | | 7,000 | | Leased | | Emergency Response Vehicles |
| | | | 65,00060,000 | | | | |
| | | | | | | |
| Offices | | | | | | |
Corporate Offices Offices– Charlotte, Michigan | | 12,000 | | Owned | | Not Applicable |
| Charlotte, Michigan | | 127,000 | | Owned | | Emergency Response/Specialty Chassis and Vehicles |
| Brandon, South Dakota | | 7,000 | | Owned | | Emergency Response Vehicles |
| Brandon, South Dakota | | 3,000 | | Leased | | Emergency Response Vehicles |
| Ephrata, Pennsylvania | | 12,500 | | Leased | | Emergency Response Vehicles |
| Bristol, Indiana | | 36,000 | | Leased | | Fleet Vehicles and Services |
| | | | | | | |
Corporate Offices – Charlotte, MI
| | | 9,000 | | Owned
| | Not Applicable
|
Charlotte, Michigan
| | | 122,000 | | Owned
| | Emergency Response/Specialty Chassis and Vehicles
|
Brandon, South Dakota
| | | 7,000 | | Owned
| | Emergency Response Vehicles
|
Brandon, South Dakota
| | | 3,000 | | Leased | | Emergency Response Vehicles
|
Ephrata, Pennsylvania
| | | 12,500 | | Leased | | Emergency Response Vehicles
|
Ocala, Florida
| | | 3,000 | | Owned | | Emergency Response Vehicles
|
Bristol, Indiana
| | | 36,000 | | Leased
| | Delivery and Service Vehicles
|
Wakarusa, Indiana
| | | 5,000 | | 197Leased,500 | | Delivery and Service Vehicles
|
| | | 197,500 | | | | |
| | | | | | | | |
Unutilized | | | | | | | |
Charlotte, Michigan | | | 113,000 | | Owned48,000
| | Not Applicable
|
Wakarusa, Indiana (1)
| | | 40,000 | | Owned | | Not Applicable |
| | | | 153,000 | | | | |
Total square footage | | | 1,717,0001,435,200 | | | | |
(1) As of December 31, 2012, the owned office facility in Wakarusa, Indiana has been vacated and is recorded as held-for-sale.
Item 3. | Legal ProceedingsItem 3. Legal Proceedings. |
At December 31, 2013,2016, we were parties, both as plaintiff or defendant, to a number of lawsuits and claims arising out of the normal conduct of our businesses. Our management does not currently expect our financial position, future operating results or cash flows to be materially affected by the final outcome of these legal proceedings.
Item 4. Mine Safety Disclosures.Item 4. | Mine Safety Disclosures. |
Not applicable
PART II
Item 5. | Market For Registrant’s Common Equity, Related Shareholder Matters, and Issuer Purchases of Equity SecuritiesItem 5. Market For Registrant’s Common Equity, Related Shareholder Matters, and Issuer Purchases of Equity Securities. |
Our common stock is traded on the NASDAQ Global Select Market under the symbol “SPAR.”
The following table sets forth the high and low sale prices for our common stock for the periods indicated, all as reported by the NASDAQ Global Select Market:
| | | High | | | Low | | | High | | | Low | |
Year Ended December 31, 2013: | | | | | | | | | |
Year Ended December 31, 2016: | | | | | | | | | |
Fourth Quarter | | $ | 7.07 | | | $ | 5.94 | | | $ | 10.50 | | | $ | 7.20 | |
Third Quarter | | | 6.27 | | | | 5.47 | | | | 9.95 | | | | 6.16 | |
Second Quarter | | | 6.18 | | | | 4.97 | | | | 6.50 | | | | 3.95 | |
First Quarter | | | 5.80 | | | | 5.04 | | | | 4.12 | | | | 2.61 | |
| | | | | | | | | | | | | | | | | |
Year Ended December 31, 2012: | | | | | | | | | |
Year Ended December 31, 2015: | | | | | | | | | |
Fourth Quarter | | $ | 5.33 | | | $ | 4.48 | | | $ | 4.58 | | | $ | 3.11 | |
Third Quarter | | | 5.44 | | | | 4.67 | | | | 4.92 | | | | 3.98 | |
Second Quarter | | | 5.24 | | | | 4.08 | | | | 5.07 | | | | 4.24 | |
First Quarter | | | 6.46 | | | | 4.82 | | | | 5.57 | | | | 4.67 | |
On October 24, 2013November 2, 2016 our Board of Directors declared a cash dividend of $0.05 per share of common stock, payablewhich was paid on December 19, 201315, 2016 to shareholders of record on November 14, 2013.15, 2016.
On May 8, 2013April 28, 2016 our Board of Directors declared a cash dividend of $0.05 per share of common stock, which was paid on June 27, 201323, 2016 to shareholders of record at the close of business on May 23, 2013.19, 2016.
On October 26, 2012,2015, our Board of Directors declared a cash dividend of $0.05 per outstanding share payableof common stock, which was paid on December 13, 201217, 2015 to shareholders of record on November 8, 2012.12, 2015.
On April 26, 2012May 8, 2015, our Board of Directors declared a cash dividend of $0.05 per outstanding share payableof common stock, which was paid on June 14, 201225, 2015 to shareholders of record on May 10, 2012.21, 2015.
No assurance, however, can be given that any future distributions will be made or, if made, as to the amounts or timing of any future distributions as such distributions are subject to earnings, financial condition, liquidity, capital requirements, and such other factors as our Board of Directors deems relevant. The number of shareholders of record (excluding participants in security position listings) of our common stock on February 28, 201427, 2017 was 351.357. See Item 12 below for information concerning our equity compensation plans.
The following graph compares the cumulative total stockholder return on our common stock with the cumulative total return on the Nasdaq Composite Index, the CRSP Trucking and Transportation Index andDow Jones U.S. Commercial Vehicles & Trucks index and a company-selected peer group for the period beginning on December 31, 20082011 and ending on the last day of 2013.2016. The graph assumes an investment of $100 in our stock, the two indices Nasdaq Composite Index, the Dow Jones U.S. Commercial Vehicles & Trucks index and the company-selected peer group on December 31, 2008,2011, and further assumes the reinvestment of all dividends. Stock price performance, presented for the period from December 31, 20082011 to December 31, 2013,2016, is not necessarily indicative of future results.
The Dow Jones U.S. Commercial Vehicles & Trucks index was used for peer comparisons utilized in determining officer incentive compensation awards for 2016. The company-selected peer group waswas determined based on a custom peer group of companies in the specialty manufacturing and automotive industries, against whom we compete for sales or management talent, that werewhich was identified for the purpose of benchmarking officer salaries.salaries in 2014. The company-selected peer group includes: Terex Corporation;Oshkosh Corporation;Drew Industries, Inc.; Standard Motor Products, Inc.; Winnebago Industries, Inc.; Federal Signal Corporation; SupremeCorp.; Methode Electronics, Inc.; Shiloh Industries, Inc.; Commercial Vehicle Group, Inc.; Altra Industrial Motion Corp.; Alamo Group, Inc.; ESCO Technologies, Inc.; Miller Industries, Inc.; Navistar International Corporation; Alamo Group, Inc.; Thor Industries, Inc.; Drew Industries, Inc.; Winnebago Industries,Twin Disc, Inc.; and Rosenbaur International.Supreme Industries, Inc.
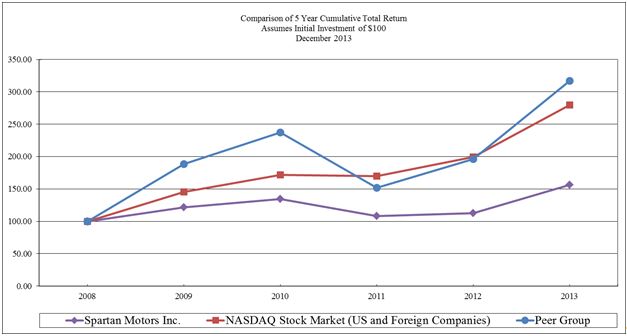
| | | 12/31/2008 | | | 12/31/2009 | | | 12/31/2010 | | | 12/31/2011 | | | 12/31/2012 | | | 12/31/2013 | |
Spartan Motors, Inc. | | $ | 100.00 | | | $ | 121.83 | | | $ | 134.22 | | | $ | 107.95 | | | $ | 112.72 | | | $ | 156.07 | |
NASDAQ Stock Market | | $ | 100.00 | | | $ | 145.32 | | | $ | 171.51 | | | $ | 170.05 | | | $ | 199.67 | | | $ | 279.75 | |
Peer Group | | $ | 100.00 | | | $ | 188.16 | | | $ | 237.03 | | | $ | 152.03 | | | $ | 195.84 | | | $ | 316.86 | |
| | | 12/31/2011 | | | 12/31/2012 | | | 12/31/2013 | | | 12/31/2014 | | | 12/31/2015 | | | 12/31/2016 | |
Spartan Motors, Inc. | | $ | 100.00 | | | $ | 104.42 | | | $ | 144.58 | | | $ | 115.63 | | | $ | 69.96 | | | $ | 211.15 | |
NASDAQ Stock Market | | $ | 100.00 | | | $ | 117.41 | | | $ | 164.50 | | | $ | 188.23 | | | $ | 201.40 | | | $ | 219.15 | |
Dow Jones U.S. Commercial Vehicles & Trucks Index | | $ | 100.00 | | | $ | 109.54 | | | $ | 130.35 | | | $ | 135.07 | | | $ | 102.28 | | | $ | 146.74 | |
Peer Group | | $ | 100.00 | | | $ | 124.50 | | | $ | 202.87 | | | $ | 196.65 | | | $ | 189.81 | | | $ | 280.59 | |
The stock price performance graph and related information shall not be deemed “filed” with the Securities and Exchange Commission, nor shall such information be incorporated by reference by any general statement incorporating by reference this annual report on Form 10-K into any filing under the Securities Act of 1933 or the Securities Exchange Act of 1934, each as amended, except to the extent that we specifically incorporate this information by reference.
Issuer Purchases of Equity Securities
On October 19, 2011, our Board of Directors authorized management to repurchase up to a total of 1.0 million shares of our common stock in open market transactions, contingent upon market conditions. During the second and third quarters of 2014, we repurchased a total of 382,000 shares of our common stock at an average price of $5.23 per share and during the second quarter of 2016, we repurchased a total of 422,000 shares of our common stock at an average price of $4.74 per share under this authorization. We did not repurchase any shares in 2015.
On April 28, 2016, our Board of Directors terminated the 2011 repurchase authorization effective June 30, 2016, and authorized the repurchase of up to 1.0 million additional shares of our common stock in open market transactions. At December 31, 2016 there were 1.0 million shares remaining under this repurchase authorization. If we were to repurchase the remaining 1.0 million shares of stock under the repurchase program, it would cost us $7.1 million based on the closing price of our stock on February 27, 2017. We believe that we have sufficient resources to fund any potential stock buyback in which we may engage.
A summary of our purchases of our common stock during the fourth quarter of fiscal year 20132016 is as follows:
Period
| |
Total
Number of
Shares
Purchased
| | |
Average
Price Paid
per Share
| | | Total Number of
Shares Purchased
as Part of Publicly
Announced Plans
or Programs (1) | | |
Number of Shares that
May Yet Be Purchased
Under the Plans
or Programs
| |
Oct. 1, 2013 to Oct. 31, 2013 | | | 161 | (2) | | | 6.55 | | | | -- | | | | 1,000,000 | |
Nov. 1, 2013 to Nov. 30, 2013 | | | -- | | | | -- | | | | -- | | | | 1,000,000 | |
Dec. 1, 2013 to Dec. 31, 2013 | | | -- | | | | -- | | | | -- | | | | 1,000,000 | |
Total | | | -- | | | | -- | | | | -- | | | | 1,000,000 | |
| (1)Period
| On October 19, 2011, the Board of Directors authorized management to repurchase up to a total of 1.0 million shares of its common stock in open market transactions, contingent upon market conditions. Repurchase of common stock is based on management’s assessment of market conditions. If the Company was to repurchase the full 1.0 million shares of stock under the repurchase program, it would cost the Company approximately $5.7 million based on the closing price of the Company’s stock on February 28, 2014. The Company believes that it has sufficient resources to fund any potential stock buyback in which it may engage.
|
| | (2)Total
Number of
Shares
Purchased
| | | During
Average
Price Paid
per Share
| | | Total Number of
Shares Purchased
as Part of Publicly
Announced Plans
or Programs | | | Number of Shares that
May Yet Be Purchased
Under the quarter ended DecemberPlans
or Programs | |
Oct. 1, 2016 to Oct. 31, 2013 there were 161 shares delivered by associates in satisfaction of tax withholding obligations that occurred upon the vesting of restricted shares. These shares are not repurchased pursuant2016 | | | - | | | | - | | | | - | | | | 1,000,000 | |
Nov. 1, 2016 to the Board of Directors authorization disclosed above.Nov. 30, 2016 | | | - | | | | - | | | | - | | | | 1,000,000 | |
Dec. 1, 2016 to Dec. 31, 2016 | | | - | | | | - | | | | - | | | | 1,000,000 | |
Total | | | - | | | | - | | | | - | | | | 1,000,000 | |
Item 6. | Item 6. Selected Financial Data.
|
The selected financial data shown below for each of the five years in the period ended December 31, 20132016 has been derived from our Consolidated Financial Statements. The following data should be read in conjunction with the Consolidated Financial Statements and related Notes thereto and “Management’s Discussion and Analysis of Financial Condition and Results of Operations” included in this Form 10-K.
Five-Year Operating and Financial Summary
(In Thousands, Except Per Share Data)
| | | 2013 | | | 2012 | | | 2011 | | | 2010 | | | 2009 | |
| | | | | | | | | | | | | | | | (1) | | | | (2) | |
| | | | | | | | | | | | | | | | | | | | | |
Sales | | $ | 469,538 | | | $ | 470,577 | | | $ | 426,010 | | | $ | 480,736 | | | $ | 409,538 | |
Cost of products sold | | | 416,475 | | | | 405,455 | | | | 363,662 | | | | 407,201 | | | | 328,305 | |
Restructuring charge | | | - | | | | 6,514 | | | | 1,731 | | | | 990 | | | | 264 | |
Gross profit | | | 53,063 | | | | 58,608 | | | | 60,617 | | | | 72,545 | | | | 80,969 | |
Operating expenses: | | | | | | | | | | | | | | | | | | | | |
Research and development | | | 10,911 | | | | 12,873 | | | | 13,931 | | | | 16,912 | | | | 16,962 | |
Selling, general and administrative | | | 45,495 | | | | 45,707 | | | | 44,305 | | | | 43,869 | | | | 42,448 | |
Goodwill impairment | | | 4,855 | | | | - | | | | - | | | | - | | | | - | |
Restructuring charge | | | - | | | | 2,619 | | | | 1,050 | | | | 1,006 | | | | 576 | |
Operating income (loss) | | | (8,198 | ) | | | (2,591 | ) | | | 1,331 | | | | 10,758 | | | | 20,983 | |
| | | | | | | | | | | | | | | | | | | | | |
Other income (expense), net | | | 348 | | | | 234 | | | | (48 | ) | | | (506 | ) | | | (805 | ) |
Income (loss) from continuing operations before taxes | | | (7,850 | ) | | | - | | | | 1,283 | | | | 10,252 | | | | 20,178 | |
Income tax expense (benefit) from continuing operations | | | (1,881 | ) | | | 100 | | | | 510 | | | | 3,017 | | | | 7,023 | |
Net earnings (loss) from continuing operations | | | (5,969 | ) | | | (2,457 | ) | | | 773 | | | | 7,235 | | | | 13,155 | |
Loss from discontinued operations, net of tax | | | - | | | | - | | | | - | | | | (3,094 | ) | | | (1,383 | ) |
Less: Net income attributable to non-controlling interest | | | 2 | | | | - | | | | - | | | | - | | | | - | |
| | | | | | | | | | | | | | | | | | | | | |
Net earnings (loss) attributable to Spartan Motors, Inc. | | $ | (5,971 | ) | | $ | (2,457 | ) | | $ | 773 | | | $ | 4,141 | | | $ | 11,772 | |
| | | | | | | | | | | | | | | | | | | | | |
Basic earnings (loss) per share from continuing operations | | $ | (0.18 | ) | | $ | (0.07 | ) | | $ | 0.02 | | | $ | 0.22 | | | $ | 0.40 | |
Basic loss per share from discontinued operations | | | - | | | | - | | | | | | | | (0.09 | ) | | | (0.04 | ) |
Basic earnings (loss) per share | | $ | (0.18 | ) | | $ | (0.07 | ) | | $ | 0.02 | | | $ | 0.13 | | | $ | 0.36 | |
| | | | | | | | | | | | | | | | | | | | | |
Diluted earnings (loss) per share from continuing operations | | $ | (0.18 | ) | | $ | ( 0.07 | ) | | $ | 0.02 | | | $ | 0.22 | | | $ | 1.40 | |
Diluted loss per share from discontinued operations | | | - | | | | - | | | | - | | | | (0.09 | ) | | | (0.04 | ) |
Diluted earnings (loss) per share | | $ | (0.18 | ) | | $ | ( 0.07 | ) | | $ | 0.02 | | | $ | 0.13 | | | $ | 0.36 | |
| | | | | | | | | | | | | | | | | | | | | |
Cash dividends per common share | | $ | 0.10 | | | $ | 0.10 | | | $ | 0.10 | | | $ | 0.10 | | | $ | 0.13 | |
| | | | | | | | | | | | | | | | | | | | | |
Basic weighted average common shares outstanding | | | 33,550 | | | | 33,165 | | | | 33,438 | | | | 33,021 | | | | 32,729 | |
Diluted weighted average common shares outstanding | | | 33,550 | | | | 33,165 | | | | 33,488 | | | | 33,101 | | | | 32,916 | |
Balance Sheet Data: | | | | | | | | | | | | | | | | | | | | |
Net working capital | | $ | 100,575 | | | $ | 98,833 | | | $ | 98,673 | | | $ | 98,230 | | | $ | 119,737 | |
Total assets | | | 253,282 | | | | 245,151 | | | | 248,609 | | | | 241,749 | | | | 293,277 | |
Long-term debt, including current portion | | | 5,340 | | | | 5,289 | | | | 5,139 | | | | 5,224 | | | | 46,350 | |
Shareholders’ equity | | | 171,551 | | | | 178,729 | | | | 182,838 | | | | 182,979 | | | | 180,520 | |
(1)Five-Year Operating and Financial Summary
|
(In Thousands, Except Per Share Data) |
| | | 2016 | | | 2015 | | | 2014 | | | 2013 | | | 2012 | |
| | | | | | | | | | | | | | | | | | | | | |
| | | | | | | | | | | | | | | | | | | | | |
Sales | | $ | 590,777 | | | $ | 550,414 | | | $ | 506,764 | | | $ | 469,538 | | | $ | 470,577 | |
Cost of products sold (1) | | | 518,113 | | | | 502,783 | | | | 450,702 | | | | 424,312 | | | | 412,899 | |
Restructuring charges | | | 136 | | | | 519 | | | | 808 | | | | - | | | | 6,514 | |
Gross profit | | | 72,528 | | | | 47,112 | | | | 55,254 | | | | 45,226 | | | | 51,164 | |
| | | | | | | | | | | | | | | | | | | | | |
Operating expenses: | | | | | | | | | | | | | | | | | | | | |
Research and development | | | 6,772 | | | | 4,560 | | | | 3,851 | | | | 3,074 | | | | 5,429 | |
Selling, general and administrative | | | 56,172 | | | | 52,695 | | | | 51,205 | | | | 45,496 | | | | 45,707 | |
Goodwill impairment | | | - | | | | - | | | | - | | | | 4,854 | | | | - | |
Restructuring charges | | | 959 | | | | 2,336 | | | | 1,349 | | | | - | | | | 2,619 | |
Operating income (loss) | | | 8,625 | | | | (12,479 | ) | | | (1,151 | ) | | | (8,198 | ) | | | (2,591 | ) |
| | | | | | | | | | | | | | | | | | | | | |
Other income (expense), net | | | 78 | | | | (121 | ) | | | 77 | | | | 348 | | | | 234 | |
Income (loss) before taxes | | | 8,703 | | | | (12,600 | ) | | | (1,074 | ) | | | (7,850 | ) | | | (2,357 | ) |
Income tax expense (benefit) | | | 100 | | | | 4,880 | | | | (2,103 | ) | | | (1,881 | ) | | | 100 | |
Net earnings (loss) | | | 8,603 | | | | (17,480 | ) | | | 1,029 | | | | (5,969 | ) | | | (2,457 | ) |
Less: Net earnings (loss) attributable to non-controlling interest | | | (7 | ) | | | (508 | ) | | | (144 | ) | | | 2 | | | | - | |
| | | | | | | | | | | | | | | | | | | | | |
Net earnings (loss) attributable to Spartan Motors, Inc. | | $ | 8,610 | | | $ | (16,972 | ) | | $ | 1,173 | | | $ | (5,971 | ) | | $ | (2,457 | ) |
| | | | | | | | | | | | | | | | | | | | | |
Basic earnings (loss) per share | | $ | 0.25 | | | $ | (0.50 | ) | | $ | 0.03 | | | $ | (0.18 | ) | | $ | (0.07 | ) |
| | | | | | | | | | | | | | | | | | | | | |
Diluted earnings (loss) per share | | $ | 0.25 | | | $ | (0.50 | ) | | $ | 0.03 | | | $ | (0.18 | ) | | $ | ( 0.07 | ) |
| | | | | | | | | | | | | | | | | | | | | |
Cash dividends per common share | | $ | 0.10 | | | $ | 0.10 | | | $ | 0.10 | | | $ | 0.10 | | | $ | 0.10 | |
| | | | | | | | | | | | | | | | | | | | | |
Basic weighted average common shares outstanding | | | 34,405 | | | | 33,826 | | | | 34,251 | | | | 33,550 | | | | 33,165 | |
Diluted weighted average common shares outstanding | | | 34,405 | | | | 33,826 | | | | 34,256 | | | | 33,550 | | | | 33,165 | |
Balance Sheet Data: | | | | | | | | | | | | | | | | | | | | |
| | | | | | | | | | | | | | | | | | | | | |
Net working capital (2) | | $ | 74,467 | | | $ | 82,764 | | | $ | 92,832 | | | $ | 93,839 | | | $ | 92,542 | |
Total assets (2) | | | 243,294 | | | | 228,151 | | | | 236,807 | | | | 250,073 | | | | 240,697 | |
Long-term debt, including current portion | | | 139 | | | | 5,187 | | | | 5,261 | | | | 5,340 | | | | 5,289 | |
Shareholders’ equity | | | 152,952 | | | | 148,491 | | | | 168,618 | | | | 171,551 | | | | 178,729 | |
| (1) | On September 20, 2010 we completed the saleBeginning in 2015, certain engineering costs related to routine product changes that were formerly classified within Research and development have been classified within Cost of substantially all of the assets of our Road Rescue, Inc. subsidiary. Accordingly,products sold to more consistently align the results of operationsour individual business units. Expenses of $7,825 for Road Rescue were2014, $7,837 for 2013, and $7,444 for 2012 have been reclassified into discontinued operationsaccordingly.
|
| (2) | Beginning in the second quarter of 2016, we adopted a new accounting pronouncement which requires net deferred tax assets and liabilities to be classified as non-current on the Consolidated Balance Sheets. We retrospectively adopted this standard, and accordingly our Net working capital and Total assets for 2010 and prior years.periods are shown reflecting this change. |
| | |
(2)Item 7.
| Effective November 30, 2009, we acquired Utilimaster Corporation. The information shown for 2009 includes the resultsManagement’s Discussion and Analysis of operations for Utilimaster Corporation for the monthFinancial Condition and Results of December 2009, and the balance sheet data reflects such acquisition and changes to our debt facilities made in connection with this acquisition.Operations.
|
Item 7. Management’s Discussion and Analysis of Financial Condition and Results of Operations.
General
Spartan Motors, Inc. was organized as a Michigan corporation on September 18, 1975, and is headquartered in Charlotte, Michigan. Spartan Motors began development of its first product that same year and shipped its first fire truck chassis in October 1975.
We are known as a leading, niche market engineer and manufacturer in the heavy-duty, custom vehicles marketplace. Our operating activities are conducted through our wholly-owned operating subsidiary, Spartan Motors USA, Inc. (“Spartan USA”), with locations in Charlotte, Michigan; Brandon, South Dakota; Ephrata, Pennsylvania; and Bristol, Indiana along with contract manufacturing in Kansas City, Missouri and Saltillo, Mexico. In addition, as a result of a recent acquisition described below, we now also have facilities in Snyder and Neligh, Nebraska; Delavan, Wisconsin; and a second location in Ephrata, Pennsylvania.
We have five wholly owned operating subsidiaries:recently completed a corporate reorganization. On July 1, 2015, our former Spartan Motors Chassis, Inc., located at the corporate headquarters in subsidiary (which operated our Charlotte, Michigan (“Spartan Chassis”);location) and our former Crimson Fire Aerials, Inc. locatedsubsidiary (which operated our Ephrata, Pennsylvania location) were merged into Spartan USA. On January 1, 2016, our former Utilimaster Corporation subsidiary (which operated our Bristol and Wakarusa, Indiana locations) was also merged into Spartan USA. These transactions were primarily completed in order to consolidate our U.S. operations into a single subsidiary and to simplify our corporate structure.
On January 1, 2017, Spartan USA acquired substantially all of the assets and certain liabilities of Smeal Fire Apparatus Co., Smeal Properties, Inc., Ladder Tower Co., and U.S. Tanker Co. When used in this Annual Report on Form 10-K, “ Smeal” refers to the assets, liabilities, and operations acquired from such entities. The assets acquired consist of the assets used by the former owners of Smeal in the operation of its business designing, manufacturing, and distributing emergency response vehicle bodies and aerial devices for the fire service industry. Smeal has operations in Snyder and Neligh, Nebraska; Delavan, Wisconsin; and Ephrata, Pennsylvania and will be operated as part of our Emergency Response Vehicles segment.
Our Charlotte, Michigan location manufactures heavy duty chassis and vehicles and supplies aftermarket parts and accessories under the Spartan Chassis and Spartan ERV brand names. Our Brandon, South Dakota (“Crimson”); Crimson Fire Aerials, Inc., located inand Ephrata, Pennsylvania (“Crimson Aerials”); Utilimaster Corporation, located in Wakarusa andlocations manufacture emergency response vehicles under the Spartan ERV brand name, while our Bristol, Indiana (“Utilimaster”);location manufactures vehicles used in the parcel delivery, mobile retail and Classic Fire, LLC (“Classic Fire”), locatedtrades and construction industries, and supplies related aftermarket parts and services under the Utilimaster brand name. Our Kansas City, Missouri and Saltillo, Mexico locations sell and install equipment used in Ocala, Florida. We arefleet vehicles. Spartan USA is also a participant in a joint venture, Spartan-Gimaex Innovations, LLC (“Spartan-Gimaex”), with Gimaex Holding, Inc.
Spartan Chassis is a leading designer, engineer and manufacturer of custom heavy-duty chassis. The chassis consist of a frame assembly, engine, transmission, electrical system, running gear (wheels, tires, axles, suspension and brakes) and, for fire trucks and some specialty chassis applications, a cab. Spartan Chassis customers are original equipment manufacturers (“OEMs”) who complete their heavy-duty vehicle product by mounting the body or apparatus on our chassis. Crimson engineers and manufactures fire trucks built on chassis platforms purchased from either Spartan Chassis or outside sources. Crimson Aerials engineers and manufactures aerial ladder components for fire trucks. Classic Fire engineers and manufactures fire trucks that are built primarily on commercial chassis and offered at a lower price point for use as brush trucks, urban interface, tankers and smaller rescues. Spartan-Gimaex is a 50/50 joint venture with Gimaex Holding, Inc. that was formed to leverage the complementary footprints, capabilities, brands, technologies and product portfolios of both companies to enable technology sharing, joint product development, commercial agreements and additional purchasing leverage, with the goal of enabling both companies to amass a true global presence in theprovide emergency response vehicle market.Utilimastervehicles for the domestic and international markets. Spartan-Gimaex is reported as a leading manufacturerconsolidated subsidiary of specialty vehicles madeSpartan Motors, Inc. In February 2015, Spartan USA and Gimaex Holding, Inc. mutually agreed to customer specifications inbegin discussions regarding the deliverydissolution of the joint venture. In June 2015, Spartan USA and service market, including walk-in vansGimaex Holding, Inc. entered into court proceedings to determine the terms of the dissolution. In February 2017, by agreement of the parties, the court proceeding was dismissed with prejudice and hi-cube vans,the judge entered an order to this effect as wellthe parties agreed to seek a dissolution plan on their own. No dissolution terms have been determined as truck bodies.of the date of this Form 10-K.
Our business strategy is to further diversify product lines and develop innovative design, engineering and manufacturing expertise in order to be the best value producer of custom vehicle products. Our diversification across several sectors provides numerous opportunities while minimizingreducing overall risk. Additionally, our business model provides the agility to quickly respond to market needs, take advantage of strategic opportunities when they arise and correctly size operations to ensure stability and growth.
We have an innovative team focused on building lasting relationships with our customers. This is accomplished by striving to deliver premium custom vehicles, vehicle components, and services. We believe we can best carry out our long-term business plan and obtain optimal financial flexibility by using a combination of borrowings under our credit facilities, as well as internally or externally generated equity capital, as sources of expansion capital.
Recent Acquisition
In furthering our strategy to diversify our products offered in the emergency vehicle business, we acquired Classic Fire on April 1, 2011, as more fully described in Note 2,Acquisition Activities, in the Notes to Consolidated Financial Statements appearing in Item 8 of this Form 10-K. Classic Fire is a manufacturer of emergency response vehicles and firefighting apparatus. The acquisition of Classic Fire has enabled us to expand our product offerings into lower price-points that complement our offerings from Spartan Chassis, Crimson and Crimson Aerials. In addition, Classic Fire has provided strategic sourcing of pump modules and other technology.
Executive Overview
Revenue in 2013 was $469.5 million, which reflected a decrease of $1.1 million or 0.2% from 2012 revenue of $470.6 million. A sharp decrease in revenue in our Delivery and Service Vehicles segment, driven by a decrease in sales of aftermarket parts, was largely offset by increases in our Specialty Chassis and Vehicles segment as a result of an increase in motor home and bus unit volumes and in our Emergency Response Vehicles segment due to a favorable sales mix and pricing changes. Gross margin was 11.3% in 2013, compared to 12.5% in 2012, driven by a product mix in 2013 that included a higher proportion of vehicles compared to 2012 which included high levels of parts sales in our Delivery and Service Vehicle segment. Operating expenses in 2013 were $61.3 million, or 13.0% of sales, compared to $61.2 million or 13.0% of sales in 2012, with decreases of $2.6 million in restructuring charges, $2.0 million in research and development expense and $0.2 million of other general and administrative items in 2013 offset by a $4.9 million goodwill impairment charge. Net loss for 2013 was $6.0 million, or $0.18 per share, compared to a net loss of $2.5 million, or $0.07 per share in 2012. Cash flow remained strong, generating $13.0 million from operations in 2013, which helped to offset uses of cash from investing activities, primarily related to purchases of property, plant, and equipment, and financing activities, primarily the payment of dividends. Our balance sheet remains strong with low debt and access to financing sufficient to fund our initiatives for the foreseeable future.
| ● | Revenue of $590.8 million in 2016, compared to $550.4 million in 2015. |
| ● | Gross Margin of 12.3% in 2016, compared to 8.6% in 2015, driven by favorable product mix in 2016. |
| ● | Operating expense of $63.9 million, or 10.8% of sales in 2016, compared to $59.6 million or 10.8% of sales in 2015. |
| ● | Operating income of $8.6 million in 2016, compared to an operating loss of $12.5 million in 2015. |
| ● | Income tax expense of $0.1 million in 2016, compared to $4.9 million in 2015, due to increases in deferred tax asset valuation allowance recorded in 2015. |
| ● | Net income of $8.6 million in 2016, compared to a net loss of $17.0 million in 2015. |
| ● | Earnings per share of $0.25 in 2016, compared to loss of $0.50 in 2015. |
| ● | Operating cash flow of $23.5 million in 2016, compared to $12.9 million in 2015. |
| ● | Order backlog of $249.5 million at December 31, 2016, compared to $270.8 million at December 31, 2015. |
The following table shows our sales by market for the years ended December 31, 2013, 20122016, 2015 and 20112014 as a percentage of total sales:
| | | 2013 | | | 2012 | | | 2011 | |
Emergency response chassis | | | 17.8 | % | | | 17.8 | % | | | 19.0 | % |
Emergency response bodies | | | 17.4 | % | | | 16.7 | % | | | 17.2 | % |
Defense and government | | | 0.9 | % | | | 0.3 | % | | | 2.8 | % |
Aftermarket parts and assemblies | | | 5.2 | % | | | 4.4 | % | | | 5.7 | % |
Total government | | | 41.3 | % | | | 39.2 | % | | | 44.7 | % |
| | | | | | | | | | | | | |
| Motor home chassis | | | 19.2 | % | | | 15.3 | % | | | 15.5 | % |
Delivery and service | | | 38.2 | % | | | 44.2 | % | | | 38.9 | % |
Other vehicles | | | 1.3 | % | | | 1.3 | % | | | 0.9 | % |
Total business/consumer | | | 58.7 | % | | | 60.8 | % | | | 55.3 | % |
| | | 2016 | | | 2015 | | | 2014 | |
Emergency response vehicles | | | 29.7 | % | | | 34.0 | % | | | 36.4 | % |
Defense vehicles | | | 1.0 | % | | | 0.7 | % | | | 0.0 | % |
Aftermarket parts and accessories | | | 3.0 | % | | | 3.4 | % | | | 3.2 | % |
Total government | | | 33.7 | % | | | 38.1 | % | | | 39.6 | % |
| | | | | | | | | | | | | |
Motor home chassis | | | 16.6 | % | | | 18.8 | % | | | 17.0 | % |
Fleet vehicles | | | 47.1 | % | | | 41.4 | % | | | 41.6 | % |
Other vehicles | | | 2.6 | % | | | 1.7 | % | | | 1.8 | % |
Total business/consumer | | | 66.3 | % | | | 61.9 | % | | | 60.4 | % |
We continue to focus on diversifying our revenuesgrowth by expanding our salesmarket share in the delivery and service market,existing markets, pursuing new commercial opportunities through our alliance with Isuzu and other manufacturers and pursuing strategic acquisitions that enable us to expand into existing or new markets as opportunities occur.
We are well positioned to take advantage of long-term opportunities as a result of:
| | ● | Our diversified business model. We believe the major strength of our business model is market diversity and customization, with an expanding product offering in emergency response vehicles as well as deliverycustomization. Our Fleet Vehicles and service vehicles. The deliverySpecialty Chassis and serviceVehicles segments serve mainly business and consumer markets, effectively diversifying our company and complementing our Emergency Response Vehicles segment, which primarily serves governmental entities. Additionally, the fleet vehicle market is an early-cycle industry, complementary to the late-cycle emergency response vehicle industry. We intend to continue to pursue additional areas that build on our core competencies in order to further diversify our business. |
| | |
| ● | Our acquisition of Smeal, completed in January 2017 which will bring significant scale to our Emergency Response Vehicles segment, expand the geographic reach of our dealer network and add complementary products to our existing emergency response product portfolio. |
| | | |
| | ● | The movedevelopment of our Utilimaster subsidiary’s walk-in van production to a new, single building facility that will result in greater manufacturing flexibility and efficiency, higher product quality and lower operating costs. Operating in this new facility has reduced the distance a vehicle travels during assembly from 2.5 miles previously to less than one-half mile today and has eliminated a number of non-value added production steps.in Kansas City, Missouri which will support Ford Transit van equipment up-fit operations for our current customer base. |
| | | |
| | ● | AOur Spartan Select and 180 truck programs, designed to provide the custom apparatus that emergency response professionals need with unprecedented order-to-delivery cycle times as short as 180 days.
|
| | |
| ● | Spartan Connected Care, a new Enterprise Resource Planning (ERP) systemmobile application that we began implementingprovides owners of motor homes built on Spartan chassis with instant access to a pre-trip inspection checklist, coach-specific diagnostic codes and an interactive map to locate the closest Spartan authorized service center. Spartan Connected Care also provides notifications of events and rallies where owners can meet with Spartan engineers and service technicians, and participate in late 2011, with expected go-live for various modules and subsidiaries through 2016. This new ERP system will provide information on a more timely and granular basis, which will enable management to make informed decisions using up to the minute information. In addition the new ERP system is expected to result in meaningful cost savings through re-engineered and streamlined processes that will impact all aspects of our operations.training sessions. |
| | | |
| | ● | The Spartan Advanced Protection System (APS),introduction of the Velocity, a pioneering blendnew delivery vehicle design that combines the productivity of industry-first airbag and safety belt protections that make occupants safer than ever before. The APS offers eight airbags, including officer and driver knee airbags and a rear side curtain which is larger than any other system on the road, along with a restraint control module deploying advanced motion sensors around the cab perimeter and advanced seat belts with pretensioning and load limiting. |
| | |
| ●
| Our joint venture with Gimaex. This 50/50 JV was formed to leverage the complementary footprints, capabilities, brands, technologies and product portfolios of both companies, and will encompass technology sharing, joint product development, commercial agreements and additional purchasing leverage,walk-in van for multi-stop deliveries with the goalsuperior fuel economy of enabling both companies to amass a true global presence.the Ford Transit chassis.
|
| | | |
| | ● | The Spartan One-Touch Rapid Compressed Air Foam System (CAFS). Spartan engineering has incorporated smart electronicsexpansion of our alliance with Isuzu to include the assembly of Isuzu’s new F-Series truck. This expanded relationship demonstrates Isuzu’s confidence in Spartan’s quality, people, flexibility and developed an exclusive plumbing design to deliver the unique, easy to use, One-Touch Rapid CAFS. |
| | |
| ●
| Our ability to react swiftly when challenges ariseexpertise and respond nimbly when opportunities arise, as demonstrated byprovides another positive example of our aggressive cost realignment in 2011 and 2012 andsuccessful execution of our past ramp up on defense initiatives. We remain focused on keeping costs aligned with sales levels and are continuing efforts to identify cost reduction opportunities.multi-year plan for improving performance.
|
| | | |
| | ● | The strength of our balance sheet, which includes robust working capital, low debt and access to credit through our revolving line of credit and private shelf agreement. |
We expect sales of our emergency response vehicles to increase substantially in 2014 as a result of strong order intake throughout 2013 and the receipt of a fire truck order from Peru in the fourth quarter of 2013 that is expected to generate more than $20 million of revenue in 2014. Sales in our Delivery and Service Vehicles segment are expected to increase modestly in 2014 compared to the levels achieved in 2013 due to higher shipments of our ReachTMcommercial van, a full year of production at our Bristol facility and a recovery in the truck body market. We expect 2014 sales in our Specialty Chassis and Vehicles segment to be flat with 2013. Our Delivery and Service Vehicles and Specialty Chassis and Vehicles segments are expected to be profitable in 2014, although we expect the operating income in our Specialty Chassis and Vehicles segment to be lower than 2013 due to planned investments to expand its distribution network and develop new motor home chassis. We expect our Emergency Response Vehicles segment to generate an operating loss in the first half of 2014, but be profitable in the second half and for the year as a whole. On a consolidated basis, we expect to report net losses in the first and second quarters, but to be profitable in the second half of 2014 and for the year as a whole. Please see “Forward-Looking Statements” above for important information regarding the disclosure of our expectations.
The following section provides a narrative discussion about our financial condition and results of operations. The comments that follow should be read in conjunction with our Consolidated Financial Statements and related Notes thereto appearing in Item 8 of this Form 10-K.
Results of Operations
The following table sets forth, for the periods indicated, the components of our consolidated statements of income, as a percentage of revenues (percentages may not sum due to rounding):
| | | Year Ended December 31, | | | Year Ended December 31, | |
| | | 2013 | | | 2012 | | | 2011 | | | 2016 | | | 2015 | | | 2014 | |
Sales | | | 100.0 | | | | 100.0 | | | | 100.0 | | | | 100.0 | | | | 100.0 | | | | 100.0 | |
Cost of products sold | | | 88.7 | | | | 87.5 | | | | 85.8 | | | | 87.7 | | | | 91.4 | | | | 89.1 | |
Gross profit | | | 11.3 | | | | 12.5 | | | | 14.2 | | | | 12.3 | | | | 8.6 | | | | 10.9 | |
Operating expenses: | | | | | | | | | | | | | | | | | | | | | | | | |
Research and development | | | 2.3 | | | | 2.7 | | | | 3.4 | | | | 1.1 | | | | 0.8 | | | | 0.8 | |
Selling, general and administrative | | | 11.0 | | | | 10.3 | | | | 10.5 | | | | 9.7 | | | | 10.0 | | | | 10.4 | |
Operating income (loss) | | | (1.7 | ) | | | (0.6 | ) | | | 0.3 | | | | 1.5 | | | | (2.3 | ) | | | (0.2 | ) |
Other expense, net | | | 0.1 | | | | -- | | | | -- | | |
Earnings (loss) before taxes on income | | | (1.7 | ) | | | (0.5 | ) | | | 0.3 | | |
Taxes on income | | | (0.4 | ) | | | -- | | | | 0.1 | | |
| | | | | | | | | | | | | | |
Other income, net | | | | - | | | | - | | | | - | |
Income (loss) before taxes on income | | | | 1.5 | | | | (2.3 | ) | | | (0.2 | ) |
Income tax expense (benefit) | | | | - | | | | 0.9 | | | | (0.4 | ) |
Net earnings (loss) | | | (1.3 | ) | | | (0.5 | ) | | | 0.2 | | | | 1.5 | | | | (3.2 | ) | | | 0.2 | |
| | | | | | | | | | | | | | |
Non-controlling interest | | | -- | | | | -- | | | | -- | | | | - | | | | (0.1 | ) | | | - | |
| | | | | | | | | | | | | | | | | | | | | | | | | |
Net earnings (loss) attributable to Spartan Motors, Inc. | | | (1.3 | ) | | | (0.5 | ) | | | 0.2 | | | | 1.5 | | | | (3.1 | ) | | | 0.2 | |
During 20132016, we recorded a $4.9restructuring charges of $1.1 million impairment chargeor 0.2% of sales, related to goodwill inthe restructuring of our Emergency Response Vehicles segment operations. During 2015, we recorded restructuring charges of $2.9 million, or 0.5% of sales, related to the restructuring of our Emergency Response Vehicles segment operations and the consolidation of our Ocala, Florida operations into our Charlotte, Michigan and Brandon, South Dakota locations. During 2015, we also recorded a $2.2 million charge for the impairment of certain long-lived assets related to our Emergency Response Vehicles segment. During 2012 and 2011,2014, we undertookrecorded restructuring activities ascharges of $2.2 million, or 0.5% of sales, related to the result of the planned moverestructuring of our UtilimasterEmergency Response Vehicles segment operations from Wakarusa, Indiana to Bristol, Indiana and to help align expenses with currentthe consolidation of our Ocala, Florida operations into our Charlotte, Michigan and future revenue expectations. Restructuring chargesBrandon, South Dakota locations. During 2014, we also incurred in 2012 and 2011 were $9.1$0.7 million and $2.8 million. No restructuring charges were recorded during 2013. During 2012 and 2011, we incurred $2.9 million and $1.0 million, respectively, of expense due to changes in the fair value of the contingent liability for earn-out consideration related to our Utilimaster acquisition in 2009.
Year Ended December 31, 20132016 compared to Year Ended December 31, 20122015
Consolidated sales for the year ended December 31, 2013 decreased2016 increased by $1.1$40.4 million, or 0.2%,7.3% to $469.5$590.8 million from $550.4 million in 2013 from $470.6 million in 2012,2015, driven by a decrease of $29.0$50.7 million increase in our DeliveryFleet Vehicles and Service VehiclesServices segment. This decreaseincrease was largelypartially offset by increases in revenuesdecreases of $25.2 million in our Specialty Chassis and Vehicles segment and $2.8$10.2 million in our Emergency Response Vehicles segment. These changes in revenue are discussed more fully below in the description of our segments.
Cost of products sold increased by $4.5 million or 1.1% to $416.5 million in 2013 from $412.0 million in 2012. $7.7 million of this increase was due to a sales mix that favored products with higher material content while $3.3 million was due to unfavorable overhead absorption, mainly due to inefficiencies related to the start-up of production at our Bristol, Indiana facility. These increases were partially offset by the absence of restructuring charges in 2013 compared to the $6.5 million incurred in 2012, mainly related to the planned relocation of our Utilimaster walk-in van production from Wakarusa, Indiana to Bristol, Indiana.
Gross margin decreased by 120 basis points to 11.3% in 2013 from 12.5% in 2012. 180 basis points of this decrease was due to the unfavorable product mix in 2013, with 80 basis points due to the unfavorable overhead absorption in 2013. These decreases were offset by a 140 basis point increase due to the absence of restructuring charges in 2013.
Operating expenses for the year ended December 31, 2013 were flat with 2012. Research and development expense decreased by $2.0 million in 2013, with $1.0 million of the decrease due to lower development engineering costs on the ReachTM commercial van in 2013. The completion of the Spartan Advanced Protection System airbag system in 2012 accounted for an additional $1.0 million of the decrease. Selling, general and administrative expenses in 2013 were flat with 2012. During 2013, operating expenses included a $4.9 million impairment charge related to goodwill acquired with the purchase of Crimson Fire and Classic Fire. See Note 6,Goodwill and Intangible Assetsin the Notes to Consolidated Financial Statements appearing in Item 8 of this Form 10-K for more information on our goodwill. Operating expenses in 2012 included $2.6 million in restructuring charges, mainly related to the planned move of our Utilimaster operations to Bristol, Indiana, that did not recur in 2013.
Income taxes for the year ended December 31, 2013 decreased by $2.0 million to $(1.9) million, compared to $0.1 million in 2012, driven by the higher pre-tax loss in 2013. $0.7 million of tax expense incurred in 2012 due to the impact of non-deductible expenses was offset by $0.7 million of tax expense incurred in 2013 related to an adjustment to the valuation of various deferred tax assets. Our effective tax rate in 2013 was 24.0%, compared to (4.2)% in 2012. Our effective tax rate in 2013 was impacted by the inclusion of expense related to the adjustment to deferred tax assets, while our effective rate in 2012 was heavily impacted by non-deductible expenses, mainly the $2.9 million Utilimaster earn-out contingency provision recorded in 2012. See Note 7,Taxes on Income in the Notes to Consolidated Financial Statements appearing in Item 8 of this Form 10-K for more information on our income tax expense and effective tax rate.
Net loss for the year ended December 31, 2013 increased by $3.5 million to a net loss of $6.0 million in 2013 compared to a net loss of $2.5 million in 2012. On a per share basis, net loss increased by $0.11 to a net loss of $0.18 per share in 2013 from a net loss of $0.07 per share in 2012. Our net loss increased due to the unfavorable product mix, unfavorable overhead absorption and goodwill impairment charge incurred in 2013, partially offset by the absence of restructuring charges compared to 2012.
Year Ended December 31, 2012 compared to Year Ended December 31, 2011
Consolidated sales for the year ended December 31, 2012 increased by $44.6 million or 10.5% from $426.0 million in 2011 to $470.6 million in 2012, driven by increases of $42.7 million in our Delivery and Service Vehicles segment and $7.6 million in our Emergency Response Vehicles segment. These increases were partially offset by a decrease in revenues of $5.7$0.1 million in our Specialty Chassis and Vehicles segment. These changes in revenue are discussed more fully below in the descriptiondiscussion of our segments.segments below.
Cost of products sold increased by $46.6$14.9 million, or 12.7%3.0%, to $518.2 million for the year ended December 31, 2015 from $365.4$503.3 million in 20112015, primarily due to $412.0increased sales volume in 2016.
Gross profit increased by $25.4 million, or 53.9%, to $72.5 million in 2012, driven by2016 from $47.1 million in 2015. The increase was mainly due to the higher equipment up-fit and other specialty chassis sales in 2016. Also contributing to the increase was an approximately $4.0 million increase resulting from improved manufacturing performance in sales volume. Restructuringour Emergency Response Vehicles segment, along with reductions of $1.7 million in accruals for warranty and recalls, $0.7 million in asset impairment charges and $0.4 million in restructuring charges recorded within costin 2016 compared to 2015. In addition, we incurred $1.0 million of products sold in 2012 were $6.5 million, mainlycharges related to the planned relocationwind-down of our Utilimaster operations from Wakarusa, Indiana to Bristol, Indiana, compared to restructuring charges of $1.7 million recorded within cost of products soldSpartan-Gimaex joint venture in 2011.2015 that did not recur in 2016.
Gross margin decreasedincreased by 170370 basis points to 12.5%12.3% in 20122016 from 14.2%8.6% in 2011,2015, mainly due to higher restructuring costs in 2012, which accounted for approximately 100 basis points of the decrease. The remainder of the decrease is attributed todriven by a change inmore favorable product mix with lower margin deliveryresulting from the increase in equipment up-fit and service vehicles accounting for a larger percentage of consolidatedother specialty chassis sales in 2012 as compared to 2011. 2016.
Operating expenses for the year ended December 31, 20122016 increased by $1.9$4.3 million, or 7.2%, to $61.2$63.9 million from $59.6 million in 2012 from $59.32015. Research and development expense increased by $2.2 million in 2011. Increases of $1.62016, with approximately equal amounts due to charges incurred for testing related to product recalls in our Emergency Response Vehicles segment, new vehicle development expenses incurred in our Fleet Vehicles and Services segment, and increased engineering management and administrative costs experienced in 2016. Selling, general and administrative expense increased by $3.5 million in restructuring charges incurred2016 compared to 2015. This increase was due to a $4.4 million increase in 2012, mainlyincentive compensation in 2016 based on company performance, along with $0.8 million of costs related to the planned move of Utilimaster to Bristol, Indiana along with $1.9Smeal acquisition that closed on January 1, 2017 and a $0.5 million increase in additional charges related to an earn-out contingency for the 2009 Utilimaster purchaselegal fees in 2016. These increases were partially offset by savings fromcharges of $1.2 million for asset impairments and $1.0 million for a NHTSA penalty recorded in 2015 that did not recur in 2016. Restructuring charges recorded in 2016 were $1.4 million lower than those recorded in 2015 as the activities related to our Emergency Response Vehicles segment restructuring initiatives undertaken earlyinitiated in 2012 and in prior years.2015 wind down.
Income taxestax expense for the year ended December 31, 20122016 decreased by $0.4$4.8 million to expense of $0.1 million compared to $0.5$4.9 million in 2011.2015. Our effective tax rate in 20122016 was (4.2)%,1.1% compared to 39.8%(38.7)% in 2011 when we recorded income before taxes. 2015. Our effective tax rate in 20122016 was impacted by a $2.9 million reduction to our deferred tax asset valuation allowance as a result of the taxable income generated in 2016. Our effective tax rate in 2015 was heavily impacted by non-deductible expenses, mainly the $2.9 million Utilimaster earn-out contingency provision recorded in 2012. See Note 7,Taxes on Incomean increase in the Notesvaluation allowances for various deferred tax assets.
During the year ended December 31, 2015, we recorded an increase to Consolidated Financial Statements appearingour deferred tax asset valuation allowance, representing the portion of our deferred tax assets, net of the deferred tax liabilities, that, based on an assessment of available positive and negative evidence, may not be realizable in Item 8future periods. During the year ended December 31, 2016, we reversed a portion of this Form 10-K for more information on ourthe deferred tax asset valuation allowance as a result of the taxable income tax expense and effective tax rate.we generated. We will continue to evaluate whether the valuation allowance is needed in future reporting periods. It is possible that sufficient positive evidence, including sustained profitability, may become available in future periods to allow us to reach a conclusion that all or part of the valuation allowance could be reversed.
Net earnings for the year ended December 31, 2012 decreased2016 increased by $3.3$26.1 million to income of $8.6 million compared to a net loss of $2.5$17.5 million in 20122015. Driving this increase were the increases in gross profit of $25.4 million and decrease of $4.8 million in taxes, which were offset by the $4.3 million increase in operating expenses as discussed above.
Net loss attributable to non-controlling interest consists of the portion of the after-tax loss related to the Spartan-Gimaex joint venture that is attributable to our joint venture partner.
Net earnings attributable to Spartan Motors, Inc. for the year ended December 31, 2016 increased by $25.6 million to income of $8.6 million compared to net earningsa loss of $0.8$17.0 million in 2011.2015. On a per diluted share basis, net earnings decreasedincreased by $0.09$0.75 to a net lossincome of $0.07$0.25 per share in 2012 from net income2016 compared to a loss of $0.02$0.50 per share in 2011. Net loss2015, due to the factors discussed above.
Year Ended December 31, 2015 compared to Year Ended December 31, 2014
Consolidated sales for the year ended December 31, 2015 increased by $43.6 million, or 8.6% to $550.4 million from $506.8 million in 2012 includes2014, driven by increases of $23.2 million in our Specialty Chassis and Vehicles segment, $17.2 million in our Fleet Vehicles and Services segment and $3.2 million in our Emergency Response Vehicles segment. These changes in revenue are discussed more fully in the discussion of our segments below.
Cost of products sold increased by $51.8 million, or 11.5%, to $503.3 million for the year ended December 31, 2015 from $451.5 million in 2014, primarily due to increased sales volume in 2015.
Gross profit decreased by $8.2 million, or 14.8%, to $47.1 million in 2015 from $55.3 million in 2014. $8.9 million of this decrease was due to higher warranty accruals due to various repair campaigns initiated during 2015 along with higher claims cost data utilized in estimating general warranty reserves in 2015. Additional causes of the decrease include: $3.6 million due to a pricing adjustment on certain motor home chassis enacted in 2015; $1.9 million due to production inefficiencies as a result of the relocation of certain Emergency Response Vehicles operations in 2015; $1.0 million due to impairment charges on certain long-lived assets recorded in 2015; and $0.8 million for an additional $4.0increase in charges related to the wind-down of our Spartan-Gimaex joint venture recorded in 2015. These decreases were partially offset by increases of $1.3 million due to a more favorable product mix in 2015, $6.4 million due to the higher overall sales volumes experienced in 2015 and a $0.3 million reduction in restructuring charges (netrecorded in 2015.
Gross margin decreased by 230 basis points to 8.6% in 2015 from 10.9% in 2014. Higher warranty expense in 2015 accounted for 260 basis points of tax impact)the decrease. Additional causes of the decrease include: 100 basis points due to competitive pricing adjustments enacted on certain motor home chassis; 50 basis points due to production inefficiencies resulting from the relocation of certain Emergency Response Vehicles operations in 2015; 30 basis points due to asset impairment charges recorded in 2015; and $1.920 basis points due to an increase in charges related to the wind-down of our Spartan-Gimaex joint venture recorded in 2015. These decreases were partially offset by increases of 180 basis points resulting from the higher overall sales volume in 2015, 40 basis points due to a more favorable product mix in 2015 and 10 basis points due to lower restructuring charges recorded in 2015.
Operating expenses for the year ended December 31, 2015 increased by $3.2 million, or 5.7%, to $59.6 million from $56.4 million in Utilimaster earn-out contingency provisions (net2014. Research and development expense increased by $0.7 million in 2015, mainly due to additional resources devoted to product development projects in our Fleet Vehicles and Services segment. Selling, general and administrative expense increased by $1.5 million in 2015 compared to 2014. $1.2 million of tax impact) over the amountsthis increase was due to impairment charges on certain long-lived assets of our Emergency Response Vehicles segment recorded in 2011.2015, while an additional $1.0 million of the increase was due to a NHTSA penalty recorded in 2015. These increases were partially offset by a $0.7 million decrease resulting from additional earnout contingency recorded in 2014 that did not recur in 2015. We also recorded an additional $1.0 million of restructuring charges, related to our Emergency and Response Vehicles segment, in 2015 in excess of the amount recorded in 2014.
Income tax expense for the year ended December 31, 2015 increased by $7.0 million to expense of $4.9 million compared to a benefit of $2.1 million in 2014, mainly due to an increase in a deferred tax asset valuation allowance that was recorded in 2015. Our effective tax rate in 2015 was (38.7)% compared to 195.8% in 2014. Our effective tax rate in 2015 was heavily impacted by an increase in the valuation allowances for various deferred tax assets, while our effective tax rate in 2014 was heavily impacted by the reduction of valuation allowances related to state tax net operating loss carry forwards as a result of our subsidiary legal entity reorganization and adjustments to unrecognized tax benefits.
During the year ended December 31, 2015 we recorded an increase to our deferred tax asset valuation allowance of $5.1 million, representing the portion of our deferred tax assets, net of the deferred tax liabilities, that, based on an assessment of available positive and negative evidence, may not be realizable in future periods. We will continue to evaluate whether the valuation allowance is needed in future reporting periods. It is possible that sufficient positive evidence, including sustained profitability, may become available in future periods to allow us to reach a conclusion that all or part of the valuation allowance could be reversed.
Net earnings (loss) for the year ended December 31, 2015 decreased by $18.5 million to a loss of $17.5 million compared to income of $1.0 million in 2014. Driving this decrease were the decreases of gross profit of $8.2 million and increases of $3.2 million in operating expense and $7.0 million in taxes discussed above.
Net loss attributable to non-controlling interest of $0.5 million in 2015 consists of the portion of the after-tax loss related to the Spartan-Gimaex joint venture that is attributable to our joint venture partner. This loss is mainly attributable to reserves recorded during 2015 to adjust certain inventory items to their fair market value at December 31, 2015.
Net earnings (loss) attributable to Spartan Motors, Inc. for the year ended December 31, 2015 decreased by $18.2 million to a loss of $17.0 million compared to earnings of $1.2 million in 2014. On a per share basis, net earnings (loss) decreased by $0.53 to a loss of $0.50 per share in 2015 from earnings of $0.03 per share in 2014, due to the factors discussed above.
Our Segments
We identify our reportable segments based on our management structure and the financial data utilized by our chief operating decision makermakers to assess segment performance and allocate resources among our operating units. We have three reportable segments: Emergency Response Vehicles, DeliveryFleet Vehicles and Service Vehicles,Services, and Specialty Chassis and Vehicles.
OurThe Emergency Response Vehicles segment consists of the operations of our Crimson, Crimson Aerials, Classic Fire and Spartan-Gimaex subsidiaries and the emergency response chassis operations at our Charlotte, Michigan location and our operations at our Brandon, South Dakota and Ephrata, Pennsylvania locations, along with our Spartan-Gimaex joint venture. In addition, as a result of Spartan Chassis.our recent acquisition of Smeal, this segment now also has operations in Snyder and Neligh, Nebraska; Delavan, Wisconsin; and a second facility in Ephrata, Pennsylvania. This segment engineers and manufactures emergency response chassis emergency response bodies and aerial equipment.vehicles and distributes related aftermarket parts and accessories.
Our DeliveryThe Fleet Vehicles and Service VehiclesServices segment consists of Utilimasterour operations at our Bristol, Indiana location and focuses on designing and manufacturing walk-in vans for the parcel delivery, mobile retail, and service markettrades and the production of commercial truck bodies,construction industries, and distributesupplies related aftermarket parts and assemblies.services under the Utilimaster brand name.
OurThe Specialty Chassis and Vehicles segment consists of the Spartan Chassis and Vehiclesour Charlotte, Michigan operations that engineer and manufacture or assemble motor home chassis, defense vehicles and other specialty chassis and distribute related aftermarket parts and assemblies.accessories.
As a result of a realignment of our operating segments completed during the second quarter of 2016, aftermarket parts and accessories related to emergency response vehicles, which were formerly reported under the Specialty Chassis and Vehicles segment, are now included in the Emergency Response Vehicles segment. Segment results from 2015 and 2014 are shown reflecting the change. Appropriate expense amounts are allocated to the three reportable segments and are included in their reported operating income or loss.
For certain financial information related to each segment, see Note 15,16, Business Segments, of the Notes to Consolidated Financial Statements appearing in Item 8 of this Form 10-K.
Emergency Response Vehicles
Segment Financial Data – In Thousands
| | | Year Ended December 31, | |
| | | 2013 | | | 2012 | | | 2011 | |
| | | Amount | | | Percentage | | | Amount | | | Percentage | | | Amount | | | Percentage | |
| | | | | | | | | | | | | | | | | | | | | | | | | |
Sales | | $ | 165,087 | | | | 100.0 | % | | $ | 162,320 | | | | 100.0 | % | | $ | 154,766 | | | | 100.0 | % |
Operating Income (loss) | | $ | (7,664 | ) | | | -4.6 | % | | $ | (2,951 | ) | | | -1.8 | % | | $ | (95 | ) | | | -0.1 | % |
Segment assets | | $ | 80,540 | | | | | | | $ | 77,806 | | | | | | | $ | 68,044 | | | | | |
Segment Financial Data (Dollars in Thousands) | | Year Ended December 31, | |
| | | 2016 | | | 2015 | | | 2014 | |
| | | Amount | | | Percentage | | | Amount | | | Percentage | | | Amount | | | Percentage | |
| | | | | | | | | | | | | | | | | | | | | | | | | |
Sales | | $ | 182,981 | | | | 100.0 | % | | $ | 193,220 | | | | 100.0 | % | | $ | 190,003 | | | | 100.0 | % |
Operating loss | | $ | (13,660 | ) | | | -7.5 | % | | $ | (23,722 | ) | | | -12.3 | % | | $ | (6,280 | ) | | | -3.3 | % |
Segment assets | | $ | 77,887 | | | | | | | $ | 76,030 | | | | | | | $ | 81,748 | | | | | |
Year ended December 31, 20132016 compared to year ended December 31, 20122015
Sales in our Emergency Response Vehicles segment increaseddecreased by $2.8$10.2 million, or 1.7%5.3%, from 20122015 to 2013, as an increase of $14.02016. A $23.2 million due to a favorable sales mix and pricing changes were partially offset by an $11.2 million decrease due to lower unit volumesvolume was partially offset by a $13.0 million sales increase due to the product mix sold in both chassis and bodies.2016, which included fewer low content fire trucks. International sales accounted for 12.9%13.5% of revenue in our Emergency Response Vehicles segment in 2013 and 18.7% in 2012.
Operating loss in the segment increased by $4.7 million mainly due to a $4.9 million goodwill impairment charge.
Backlog for our Emergency Response Vehicles segment increased by $60.7 million or 63.4% to $156.5 million in 2013 compared to $95.8 million in 2012. This increase is the result of strong order intake for fire truck bodies due to market share gains domestically along with increased international orders, including a $20 million, 70 unit order from Peru.
Year ended December 31, 2012 compared to year ended December 31, 2011
Sales in our Emergency Response Vehicles segment increased by 4.9% from 2011 to 2012, due to increases in unit volumes in both chassis and bodies, driven by increased international sales, primarily in South America. International sales in our Emergency Response Vehicles segment accounted for18.7% of revenue in 2012 and 2.7% in 2011.2016. There were no significant changes in the pricing of the products in our Emergency Response Vehicles segment during 2012.2016.
Operating loss in the segment increaseddecreased by $2.9$10.0 million, or 42.2%, from 2015 to 2016. $4.0 million of the decrease was due to an approximately $1.2improved manufacturing performance, largely accomplished through the production outsourcing of lower priced units. Higher asset impairments recorded in 2015 accounted for $1.8 million expenditure relatedof the decrease, while $1.6 million was due to developmentlower warranty costs in 2016 resulting from various repair campaigns and higher overall warranty accruals recorded in 2015. $0.9 million of our APS (Advanced Protection System) airbag system, with the remainderdecrease was due to reduced selling expenses in 2016, mainly resulting from headcount reductions, while $0.7 million of the decrease was due to the impactNHTSA fine incurred in 2015 that did not recur in 2016 and $1.8 million of labor inefficiencies as production ramped upthe decrease was due to meet higher order volumereduced restructuring charges incurred in the third and fourth quarters.2016. These decreases were partially offset by a $0.7 million increase in R&D costs in 2016, largely due to testing related to product recalls.
BacklogOrder backlog for our Emergency Response Vehicles segment decreased by $16.4 million or 10.5% to $139.9 million at December 31, 2016 compared to $156.3 million in 2015, driven by a more selective bid process established in 2016 as part of our turnaround strategy.
Year ended December 31, 2015 compared to year ended December 31, 2014
Sales in our Emergency Response Vehicles segment increased by $21.8$3.2 million, or 29.5%1.7%, from 2014 to $95.8 million in 2012 compared to $74.0 million in 2011, driven by an increase in international sales.
Delivery and Service Vehicles
Segment Financial Data – In Thousands
| | | Year Ended December 31, | |
| | | 2013 | | | 2012 | | | 2011 | |
| | | Amount | | | Percentage | | | Amount | | | Percentage | | | Amount | | | Percentage | |
| | | | | | | | | | | | | | | | | | | | | | | | | |
Sales | | $ | 179,209 | | | | 100.0 | % | | $ | 208,230 | | | | 100.0 | % | | $ | 165,526 | | | | 100.0 | % |
Operating Income (loss) | | $ | (3,942 | ) | | | -2.2 | % | | $ | 6,035 | | | | 2.9 | % | | $ | 10,040 | | | | 6.1 | % |
Segment assets | | $ | 78,654 | | | | | | | $ | 73,567 | | | | | | | $ | 80,674 | | | | | |
Year ended December 31, 2013 compared to year ended December 31, 2012
Sales in our Delivery and Service Vehicles segment decreased by $29.0 million, or 13.9%, in 2013 compared to 2012. This decrease was due to a $35.5 million decrease in aftermarket parts and field service sales as a result of the decrease in keyless entry system sales after the first half of 2012. Partially offsetting this decrease was a $6.5 million increase in vehicle sales, primarily the ReachTM commercial van. There were no changes in the pricing of products sold by our Delivery and Service Vehicles segment that had a significant impact on our financial statements when comparing 2013 to 2012.
Operating income in 2013 decreased by $9.9 million to an operating loss of $3.9 million compared to operating income of $6.0 million in 2012. $8.3 million of this decrease was due to an unfavorable sales mix, with 2013 sales including a lower proportion of higher margin aftermarket parts compared to 2012, while approximately $3.6 million of the decrease was due to overall lower sales levels in 2013. Inefficiencies associated with the ramp up of production at our Bristol, Indiana facility contributed $5.8 million to the decrease. Partially offsetting these decreases was the absence of restructuring charges in 2013 compared to the $7.8 million incurred in 2012.
Backlog for our Delivery and Service Vehicles segment increased by $33.4 million, or 84.4%, to $73.1 million in 2013 compared to $39.7 million in 2012, driven by an increase in orders for the ReachTM commercial van.
Year ended December 31, 2012 compared to year ended December 31, 2011
Sales in our Delivery and Service Vehicles segment increased by $42.7 million, or 25.8%, in 2012 compared to 2011, driven by higher unit volume, a favorable product mix and increased aftermarket parts and field service sales. Higher unit volume accounted for $26.0 million of the sales increase from 2011 to 2012, with higher aftermarket parts sales contributing $11.4 million to the increase as we continued a high level of shipments of our keyless entry systems in the first half of 2012. A product mix in 2012 that favored higher content walk in vans and truck bodies compared to those produced in 2011 contributed approximately $3.6 million to the sales increase. Price increases, which were2015, mainly the result of higher material costs, contributed $1.7 million to the overall revenue increase in 2012.
Operating income in 2012 decreased by $4.0 million or 39.9% from that reported in 2011. The main driver of this decrease was $7.8 million in restructuring charges incurred in 2012, which was partially offset by increased sales levels which resulted in favorable absorption of overhead and fixed expenses when compared to 2011.
Specialty Chassis and Vehicles
Segment Financial Data –In Thousands| | | Year Ended December 31, | |
| | | 2013 | | | 2012 | | | 2011 | |
| | | Amount | | | Percentage | | | Amount | | | Percentage | | | Amount | | | Percentage | |
| | | | | | | | | | | | | | | | | | | | | | | | | |
Sales | | $ | 125,242 | | | | 100.0 | % | | $ | 100,027 | | | | 100.0 | % | | $ | 105,718 | | | | 100.0 | % |
Operating Income (loss) | | $ | 10,030 | | | | 8.0 | % | | $ | 2,198 | | | | 2.2 | % | | $ | (2,300 | ) | | | -2.2 | % |
Segment assets | | $ | 24,399 | | | | | | | $ | 27,565 | | | | | | | $ | 23,163 | | | | | |
Year ended December 31, 2013 compared to year ended December 31, 2012
Sales in our Specialty Chassis and Vehicles segment increased by $25.2 million, or 25.2%, in 2013 compared to 2012, primarily due to higher unit volumessales volumes. International sales accounted for 13.0% of revenue in motor home and bus chassis and other specialty vehicles.our Emergency Response Vehicles segment in 2015. There were no significant changes in the pricing of the products in our Specialty Chassis andEmergency Response Vehicles segment during 2013.2015.
Operating loss in the segment increased by $17.4 million, or 277.7%, from 2014 to 2015. $7.2 million of the increase was due to higher warranty costs resulting from various repair campaigns and higher overall warranty accruals in 2015 due to claims experience. $4.7 million of this increase was due to an unfavorable product mix in 2015 compared to 2014, which included more orders with multiple identical units. $2.2 million of the decrease resulted from impairment charges on certain long-lived assets recorded in 2015, while $1.9 million was due to higher labor and overhead costs experienced in 2015 resulting from inefficiencies caused by production relocations. $0.7 million of the decrease was due to charges related to a NHTSA penalty imposed in 2015, while an additional $0.7 million was due to higher restructuring charges incurred in 2015.
Fleet Vehicles and Services
Segment Financial Data (Dollars in Thousands) | | Year Ended December 31, | |
| | | 2016 | | | 2015 | | | 2014 | |
| | | Amount | | | Percentage | | | Amount | | | Percentage | | | Amount | | | Percentage | |
| | | | | | | | | | | | | | | | | | | | | | | | | |
Sales | | $ | 278,389 | | | | 100.0 | % | | $ | 227,683 | | | | 100.0 | % | | $ | 210,498 | | | | 100.0 | % |
Operating Income | | $ | 28,740 | | | | 10.3 | % | | $ | 14,530 | | | | 6.4 | % | | $ | 8,324 | | | | 4.0 | % |
Segment assets | | $ | 65,277 | | | | | | | $ | 70,491 | | | | | | | $ | 65,827 | | | | | |
Year ended December 31, 2016 compared to year ended December 31, 2015
Sales in our Fleet Vehicles and Services segment increased by $50.7 million, or 22.3%, to $278.4 million in 2016 from $227.7 million in 2015. $37.3 million of the increase was due to higher aftermarket parts and accessories sales, driven by higher demand for equipment up-fit. $10.0 million was due to increased vehicle unit volume, while $3.4 million was due to a more favorable mix of vehicle sales driven by a change in our truck body sales strategy. International sales accounted for 1.9% of revenue in our Fleet Vehicles and Services segment in 2016.
Operating income increased by $7.8$14.2 million, or 354.5%97.9%, to $28.7 million in 2013 compared to 2012, mainly due to the increased unit2016 from $14.5 million in 2015, driven by an increase in parts and equipment up-fit sales volumes.in 2016.
BacklogOrder backlog for our Specialty ChassisFleet Vehicles and VehiclesServices segment decreased by $13.6$6.6 million, or 51.1%6.8%, to $13.0$89.5 million at December 31, 2013in 2016 compared to $26.6 million at December 31, 2012, with decreases of $7.5$96.1 million in 2015, driven by a $25.5 million decrease in equipment up-fit orders, for aftermarket parts and assemblies, $4.0which was partially offset by an $18.9 million increase in orders for defense related vehicles and $2.1 million in orders for motor home and other specialty chassis.vehicle backlog.
Year ended December 31, 20122015 compared to year ended December 31, 20112014
Sales in our Fleet Vehicles and Services segment increased by $17.2 million, or 8.2%, to $227.7 million in 2015 from $210.5 million in 2014. $12.4 million of the increase was due to higher parts and equipment up-fit revenue, while $4.8 million was due to a change in the mix of vehicle sales. International sales accounted for 3.5% of revenue in our Fleet Vehicles and Services segment in 2015.
Operating income increased by $6.2 million, or 74.7%, to $14.5 million in 2015 from $8.3 million in 2014, driven by a favorable sales mix in 2015 that included a higher proportion of parts and equipment up-fit sales.
Order backlog for our Fleet Vehicles and Services segment increased by $35.5 million, or 58.6%, to $96.1 million in 2015 compared to $60.6 million in 2014, driven by an increase in equipment up-fit orders. In January 2017, we received $37.0 million of new orders for our Fleet Vehicles and Services segment, a 21.9% increase from January 2016.
Specialty Chassis and Vehicles
Segment Financial Data (Dollars in Thousands) | | Year Ended December 31, | |
| | | 2016 | | | 2015 | | | 2014 | |
| | | Amount | | | Percentage | | | Amount | | | Percentage | | | Amount | | | Percentage | |
| | | | | | | | | | | | | | | | | | | | | | | | | |
Sales | | $ | 129,407 | | | | 100.0 | % | | $ | 129,511 | | | | 100.0 | % | | $ | 106,263 | | | | 100.0 | % |
Operating Income | | $ | 6,846 | | | | 5.3 | % | | $ | 4,906 | | | | 3.8 | % | | $ | 6,619 | | | | 6.2 | % |
Segment assets | | $ | 28,825 | | | | | | | $ | 24,032 | | | | | | | $ | 21,269 | | | | | |
Year ended December 31, 2016 compared to year ended December 31, 2015
Sales in our Specialty Chassis and Vehicles segment decreased by 5.4%$0.1 million, to $129.4 million in 2012 primarily2016 compared to $129.5 million in 2015. Sales of motor home chassis decreased by $5.3 million, driven by lower unit volume in 2016, while sales of aftermarket parts and accessories decreased by $2.1 million. These decreases were nearly offset by other specialty vehicles sales, which increased by $7.3 million due to lower defense related vehicles and parts sales, which decreasedincreased unit volumes.
Operating income increased by $12.0$1.9 million, or 30.1%39.5%, to $27.9$6.8 million in 2012 from $39.92016 compared to $4.9 million in 2012.2015, mainly due to the increase in other specialty chassis sales in 2016.
Order backlog for our Specialty Chassis and Vehicles segment increased by $1.6 million, or 8.7%, to $20.0 million at December 31, 2016 compared to $18.4 million at December 31, 2015. This decreaseincrease was due to a $6.3 million increase in backlog for motor home chassis and a $0.3 million increase in aftermarket parts and accessories backlog, which were partially offset by an increasea decrease of $6.3$4.9 million in motor home chassis salesbacklog for defense vehicles due to increasesthe fulfillment of defense orders on hand in unit volume in 20122016.
Year ended December 31, 2015 compared to 2011. There were no significant changes in the pricing of the productsyear ended December 31, 2014
Sales in our Specialty Chassis and Vehicles segment during 2012.increased by $23.2 million, or 21.9%, to $129.5 million in 2015 compared to $106.3 million in 2014. Sales of motor home chassis increased by $17.1 million, with a $25.8 million increase as a result of higher unit volume partially offset by decreases of $5.1 million due to an unfavorable product mix in 2015 and $3.6 million due to competitive pricing adjustments enacted in 2015. Sales of other specialty vehicles increased by $4.7 million mainly due to the completion of an order for defense vehicles in 2015, while sales of aftermarket parts and accessories increased by $1.4 million.
Operating income increaseddecreased by $4.5$1.7 million, or 25.9%, to $4.9 million in 2012, mainly2015 compared to $6.6 million in 2014. $3.6 million of this decrease was due to the competitive pricing adjustments enacted in 2015, with an additional $1.9 million due to accruals related to warranty repair campaigns in 2015, $0.8 million due to higher selling, general and administrative expense, largely related to the increased sales levels, and $0.5 million related to a decrease in operating expenseNHTSA fine incurred in 2012 as2015. These decreases were partially offset by a result of restructuring initiatives undertaken early$5.1 million increase related to the higher unit sales volumes in 2012 and in prior years.
Fourth Quarter Results2015.
Historically, our sales levels have varied from quarter to quarter. For a description of quarterly financial data, see Note 16, Quarterly Financial Data (Unaudited), in the Notes to Consolidated Financial Statements appearing in Item 8 of this Form 10-K.
2013
Sales in the fourth quarter of 2013 were $126.5 million, an increase of $0.4 million, or 0.3%, from our third quarter sales of $126.1 million, as strong sales of motor home chassis were largely offset by lower sales of delivery and service vehicles due to delayed production on ReachTM commercial vans as a result of supplier constraints.
Gross profit in the fourth quarter decreased by $1.1 million, or 6.8%, to $15.0 million in the fourth quarter from $16.1 million in the third quarter, mainly due to operations in our Emergency Response Vehicles segment, as the result of an unfavorable sales mix and higher warranty accruals in the fourth quarter.
Net income decreased by $3.6 million to a net loss of $3.0 million in the fourth quarter from net income of $0.6 million in the third quarter, mainly due to an impairment charge related to goodwill in our Emergency Response Vehicles segment recorded in the fourth quarter.
2012
Sales in the fourth quarter of 2012 were $124.5 million, an increase of $11.6 million or 10.3% from our sales in the third quarter of 2012. The increase was driven by higher sales in our Emergency Response Vehicles segment as a result of the strong order intake we experienced in 2012, along with smaller increases inOrder backlog for our Specialty Chassis and Vehicles segment decreased by $4.0 million, or 17.9%, to $18.4 million at December 31, 2015 compared to $22.4 million at December 31, 2014, driven by a decrease in orders on hand for motor home chassis, largely as a result of timing.
Financial Condition
Balance sheet at December 31, 2016 compared to December 31, 2015
Accounts receivable increased by $8.8 million, or 15.5%, to $65.4 million at December 31, 2016 from $56.6 million at December 31, 2015, with approximately equal parts of the increase due to increased volume in motor home chassis and our Delivery and Service Vehicles segment due to higher walk-in van unit volumes.
Gross profit in the fourth quarter increased by $0.2 million, or 1.4%, from the third quarter, mainly as the result of lower restructuring charges incurred during the fourth quarter, which were partially offset by an unfavorable product sales mix in the fourth quarter as compared to the third quarter.
Net losslate in the fourth quarter of 2012 increased by $2.22016 compared to 2015 and the timing of payment receipts in late 2016 compared to late 2015. In January 2017, $7.4 million of our accounts receivable was forgiven as part of our acquisition of Smeal. Our receivable days sales outstanding decreased to $2.5 million in the fourth quarter40 days sales at December 31, 2016 from $0.3 million in the third quarter,41 days at December 31, 2015 mainly due to additional expense recorded forincreased sales compared to the earn-out contingency relatedprevious year.
Inventory decreased by $1.7 million, or 2.8%, to our 2009 Utilimaster acquisition$58.9 million at December 31, 2016 from $60.6 million at December 31, 2015, mainly due to completion and shipment of units and continued focus on inventory reduction actions.
Other current assets increased by $1.0 million, or 28.6%, to $4.5 million at December 31, 2016 from $3.5 million at December 31, 2015 mainly due to an increase in prepaid expenses during the period.
Net deferred tax asset increased by $2.7 million or 450.0%, to $3.3 million at December 31, 2016 from $0.6 million at December 31, 2015 as a result of the increased sales level at Utilimaster.change in our valuation allowance during the year. The remaining residual value of $3.3 million represents that portion of our deferred income tax assets that could generate future tax losses and be successfully carried back and offset against current year taxable income to recover taxes paid.
Accounts payable2011
Sales for the fourth quarter were $111.2 million, a decrease of $9.1 increased by $4.0 million, or 7.6%14.7%, to $31.3 million at December 31, 2016 from our$27.3 million at December 31, 2015, mainly due to increased sales volume which resulted in the third quarter of 2011. The decrease was drivenincreased purchases to support production.
Accrued warranty increased by a decrease of$2.7 million, or 16.3%, to $19.3 million or 31.6% in Delivery and Service Vehicles salesat December 31, 2016 from $16.6 million at December 31, 2015, due to seasonal decreases$5.7 million of accruals for warranties provided on vehicles produced during the year and additional accruals of $4.0 million for various repair campaigns in aftermarket parts2016 and assemblies$3.3 million for changes in existing warranties, offset by $10.3 million of payments for repairs made during the year.
Accrued compensation and walkrelated taxes increased by $4.5 million, or 51.7%, to $13.2 million at December 31, 2016 from $8.7 million at December 31, 2015, mainly due to an increase in van sales relatedincentive compensation accruals as a result of our financial performance during the year.
Deposits from customers increased by $3.0 million, or 22.9%, to $16.1 million at December 31, 2016 from $13.1 million at December 31, 2015, due to more customers electing to make deposits on orders in 2016. We receive deposits on orders at the option of our customary fourth quarter slowdowncustomers. Consequently, the amount of deposits on hand will vary from time to time.
Other current liabilities and accrued expenses increased by $1.1 million, or 16.7%, to $7.7 million at December 31, 2016 from $6.6 million at December 31, 2015 mainly due to the busy holiday delivery season. In addition, in late December we delayed shipment until 2012timing of certain walk-in vans in order to effect updates to meet certain regulatory safety requirements. These decreases were partially offset by sales increases in our Emergency Response Vehicles segment, which increased by $6.4 million due to increased chassis sales and $2.6 million due to increased vehicle sales, along with increases in our Specialty Chassis and Vehicles segment of $1.2 million due to increases in motor home chassis sales.
Gross profit in the fourth quarter decreased by $5.9 million, or 29.0%, from the third quarter. This was driven primarily by the seasonal volume decrease in our Delivery and Service Vehicles segment, as discussed above, offset by increases in Emergency Response Vehicle and Specialty Chassis and Vehicles sales.
Net earningsaccruals for the fourth quarter 2011 decreased $2.5 million or 78.3% from the third quarter. The decrease in net income was impacted substantially by the sales decline in Delivery and Service Vehicles described above. Partially offsetting this decrease were increases in sales in our Emergency Response Vehicles and Specialty Chassis and Vehicles segments, along with lower general and administrative expense, driven by lower research and development spending as the ReachTM product neared production.various expenses incurred but not yet invoiced.
Financial Condition
Balance sheet at December 31, 20132015 compared to December 31, 20122014
Cash increased by $9.0$4.1 million, or 41.5%14.3%, to $30.7$32.7 million at December 31, 20132015 from $21.7$28.6 million at December 31, 2012, mainly2014, due to operating activities that provided $13.0$12.9 million, which more than offset the $8.8 million utilized through financing and investing activities. See the discussion on cash flows below for more information on the sources and uses of cash in 2013.our cash.
Accounts receivable increased by $0.5$8.2 million, or 1.1%16.9%, to $47.6$56.6 million at December 31, 20132015 from $47.1$48.4 million at December 31, 2012.2014. Our receivable days sales outstanding increased to 3841 days sales at December 31, 20132015 from 3639 days at December 31, 20122014 mainly due to the timing of revenue, with higher shipment of completed units in December 2015 compared to the previous year.
Inventory decreased by $10.6 million, or 14.9%, to $60.6 million at December 31, 2015 from $71.2 million at December 31, 2014, mainly due to completion and shipment of vehicles in the first quarter of 2015 that were in work in process inventory at December 31, 2014.
Net deferred tax asset decreased by $5.1 million, or 88.9%, to $0.6 million at December 31, 2015 from $5.8 million at December 31, 2014. During 2015, we recorded a $5.1 million adjustment to the valuation allowance largely as a result of a change in the customer mix and receivable terms on certain products in the fourth quarter of 2013 compared to the same period of 2012.
Inventories increased by $13.8 million, or 20.4%, to $81.4 million at December 31, 2013 from $67.6 million at December 31, 2012, mainly due to an increase in work in progress inventory caused by supplier constraints that delayed the final production of certain vehicles.
Income taxes receivable decreased by $1.4 million, or 46.7%, to $1.6 million at December 31, 2013 from $3.0 million at December 31, 2012, due to the utilization of prior year overpayments to reduce the current year tax liability.
Other current assets decreased by $3.7 million, or 61.7%, to $2.3 million at December 31, 2013 from $6.0 million at December 31, 2012. This decrease was mainly due to the collection of a short term note receivable of $2.5 million related to the sale of buildings and land at our Wakarusa, Indiana campus. Also contributing to the decrease was a $0.7 million decrease in prepaid insurance fees, and a $0.5 million decrease in miscellaneous prepaid fees.
Property, plant and equipment decreased by $4.8 million, or 8.1%, to $54.2 million at December 31, 2013 from $59.1 million at December 31, 2012, due to depreciation recorded during the year of $8.3 million, partially offset by $3.5 million of investments in property, plant and equipment.
Goodwill decreased by $4.9 million, or 23.1%, to approximately $16.0 million at December 31, 2013 from approximately $20.8 million at December 31, 2012, due to the impairment of goodwill related our Emergency Response Vehicles reporting unit.net loss position for 2015.
Accounts payable increased by $7.5$4.5 million, or 32.6%19.7%, to $30.5$27.3 million at December 31, 20132015 from $23.0$22.8 million at December 31, 2012,2014, mainly due to the timing of paymentsincreased sales volume which resulted in late 2013.increased purchases to support production.
Accrued warranty increased by $1.5$7.4 million, or 24.6%80.4%, to $7.6$16.6 million at December 31, 20132015 from $6.1$9.2 million at December 31, 2012,2014, mainly due to a $1.4additional accruals of $7.1 million charge for a motor home related recall incurredvarious repair campaigns in 2013.
Accrued compensation and related taxes decreased by $1.3 million, or 16.9%, to $6.4 million at December 31, 2013 from $7.7 million at December 31, 2012,2015, along with increases in the general reserves due to a $1.1 million decrease in accrued incentive compensation for 2013 as compared to 2012.claims experience.
Deposits from customers increased by $11.6$1.6 million, or 181.3%13.9%, to $18.0$13.1 million at December 31, 20132015 from $6.4$11.5 million at December 31, 2012,2014, due to the election of certainmore customers electing to make deposits on orders including a $5.0 million depositin 2015. We receive deposits on a 70 unit fire truck orderorders at the option of our customers. Consequently, the amount of deposits on hand will vary from Peru.time to time.
Other current liabilities and accrued expenses decreased by $2.8$2.2 million, or 34.6%25.1%, to $5.3$6.6 million at December 31, 20132015 from $8.1$8.8 million at December 31, 2012, due to $2.7 million of payments made during the year related to the earn-out provision from our purchase of Utilimaster.
Deferred income tax liabilities decreased by $1.3 million, or 28.9%, to $3.2 million at December 31, 2013 from $4.5 million at December 31, 2012, largely due to the income tax effect of the deductible portion of goodwill impairment expense recorded in 2013.
Balance sheet at December 31, 2012 compared to December 31, 2011
Accounts receivable increased by $7.1 million or 17.1% to $47.1 million at December 31, 2012,2014 mainly due to the higher sales levels recorded in the fourth quarterpayment of 2012 as compared with the same period in 2011. Our receivable days sales outstanding increased to 36 days sales at December 31, 2012 as a result of a change in the mix of sales to products with longer receivable terms in the fourth quarter of 2012 compared to the same period in 2011.
Income taxes receivable increased by $1.5 million or 103.6% to $3.0 million at December 31, 2012 due to estimated income tax payments made during 2012, based onfor the taxable income recorded earliercontingent liability for our purchase of Utilimaster that was accrued in the year, which exceeded the liability finally determined2014 along with reductions in the year end provision.
Other current assets increased by $3.6 million or 156.5% to $6.0 million at December 31, 2012 due to the recording of a short term note receivable of $2.5 million related to the sale of buildings and land at our Wakarusa, Indiana campus completed on December 31, 2012. Also contributing to the increases were a $0.4 million increase in prepaid fees for trade shows to be held in 2013 and $0.7 million in other miscellaneous prepaid items.
Property, plant and equipment decreased by $6.3 million or 9.6% to $59.1 million at December 31, 2012, due to depreciation recordedrestructuring accruals during the year of $8.1 million, $10.4 million due to the write-down and reclassification to held-for-sale of our Wakarusa, Indiana facility and $0.3 million due to other disposals. Partially offsetting these decreases were $12.5 million of investments in property, plant and equipment, mainly related to the relocation of our Utilimaster operations to Bristol, Indiana.
Accounts payable increased by $1.3 million or 6.2% to $23.0 million at December 31, 2012, mainly due to the purchase of additional engines prior to the 2013 emissions changes.
Accrued compensation and payroll taxes increased by $2.1 million or 71.1% to $5.0 million at December 31, 2012 due to additional payroll liabilities recorded in 2012, compared to 2011, as the result of the timing of pay periods at the end of December.
Deposits from customers decreased by $1.5 million or 19.2% to $6.4 million at December 31, 2012, due to the timing of customer payments received in the last few days of the year and the election of certain customers to make deposits on orders.
Deferred tax liability decreased by $2.9 million or 39.5% to $4.5 million at December 31, 2012 due to a decrease in the excess of the amount of depreciation and asset impairment recorded in the financial statements over the amount deducted for income taxes through December 31, 2012.year.
Liquidity and Capital Resources
Cash FlowsFlows
Our cash flows from operating, investing and financing activities, as reflected in the Consolidated Statements of Cash Flows appearing in Item 8 of this Form 10-K, are summarized in the following table (in thousands):
| | | Year Ended December 31, | | | Year Ended December 31, | |
| | | 2013 | | | 2012 | | | 2011 | | | 2016 | | | 2015 | | | 2014 | |
Cash provided by (used in): | | | | | | | | | | | | | | | | | | | | | | | | |
Operating activities | | $ | 13,046 | | | $ | 6,367 | | | $ | 30,137 | | | $ | 23,451 | | | $ | 12,900 | | | $ | 6,506 | |
Investing activities | | | (846 | ) | | | (12,393 | ) | | | (9,159 | ) | | | (13,385 | ) | | | (4,687 | ) | | | (2,815 | ) |
Financing activities | | | (3,241 | ) | | | (3,903 | ) | | | (3,808 | ) | | | (10,726 | ) | | | (4,082 | ) | | | (5,828 | ) |
Net increase (decrease) in cash and cash equivalents | | $ | 8,959 | | | $ | (9,929 | ) | | $ | (17,170 | ) | | $ | (660 | ) | | $ | 4,131 | | | $ | (2,137 | ) |
During 2013,2016, cash and cash equivalents increaseddecreased by $9.0$0.7 million to a balance of $30.7$32.0 million as of December 31, 2013.2016. These funds, in addition to cash generated from future operations and available credit facilities, are expected to be sufficient to finance the Company’sour foreseeable liquidity and capital needs.
Cash Flow from OperatingOperating Activities
We generated $13.0$23.5 million of cash from operating activities during the year ended December 31, 2013.2016. Cash flow from operating activities was generated primarily throughimpacted by non-cash expenses of $14.4$20.2 million and net income of $8.6 million. Changes in working capital requirements, including accounts receivable, inventories, accounts payable and deposits from customers resulted in the use of $5.4 million of cash.
We generated $12.9 million of cash from operating activities during the year ended December 31, 2015. Cash flow from operating activities was impacted by non-cash expenses of $31.4 million, which offset our net loss of $6.0$17.5 million. Changes in working capital requirements, including accounts receivable, inventories, income taxes receivable, accounts payable and deposits from customers generated $4.6resulted in the use of $1.0 million of cash.
We generated $6.4$6.5 million of cash from operating activities during the year ended December 31, 2012. Cash2014. In addition to our net income of $1.0 million, our cash flow from operations was generated primarily throughimpacted by non-cash expenses of $16.5$8.4 million. We utilized $2.9 million which offset our net loss of $2.5 million. Increasescash due to changes in working capital requirements, including accounts receivable, inventories, income taxes receivable, accounts payable, accrued warranty and deposits from customers absorbed $7.7 million of cash.
For the year ended December 31, 2011, cash generated by operating activities was $30.1 million primarily due to a decrease in accounts receivable of $13.1 million and increases in accounts payable of $3.5 million and deposits from customers of $3.9 million from December 31, 2010 to December 31, 2011, as discussed above.customers.
In 20142017 we expect to incur non-recurring cash outlays of $4$44 million to $6$45 million. This estimate includes approximately $32.5 million including spendingof cash investment related to our acquisition of Smeal, along with expenditures for our ERP system implementation andthe replacement and upgradesupgrade of machinery and equipment used in operations.operations and approximately $6 million to expand certain production facilities. We plan to fund these cash outlays with borrowings from our existing $100 million line of credit along with cash generated from our operations in 2017.
Cash Flow from Investing Activities
We used $0.8 million for investing activities during the year ended December 31, 2013, mainly due to the purchase of $3.5 million of property, plant and equipment which was largely offset by the collection of a $2.5 million note receivable.
We used $12.4$13.4 million of cash for investing activities during the year ended December 31, 2012,2016, mainly for the construction of our new assembly plant in Charlotte, Michigan, along with the purchase of property, plant and equipment used in our operations.
We used $4.7 million of cash for investing activities during the year ended December 31, 2015, mainly for the purchase of property, plant and equipment which included approximately $8.8 million for the purchase of equipment related to the relocation ofused in our Utilimaster operations to Bristol, Indiana.operations.
DuringWe used $2.8 million of cash for investing activities during the year ended December 31, 2011, cash used in investing activities of $9.2 million was driven by $5.3 million of cash used in2014, mainly for the purchase of property, plant and equipment used in our operations.
Cash Flow from Financing Activities
Cash used in financing activities of $10.7 million during the year ended December 31, 2016 consisted primarily of the repayment of long-term debt, funds used to pay cash dividends during the year and $4.8 million used for the acquisitionrepurchase of Classic Fire in April 2011.our common stock. See Note 2,14, Acquisition ActivitiesShareholders Equity, in the Notes to Consolidated Financial Statements containedappearing in Item 8 of this Form 10-K for further information on this acquisition.
Cash Flow from Financing Activitiesour share repurchases.
Cash used in financing activities of $3.2$4.1 million during the year ended December 31, 20132015 consisted primarily of funds used to pay cash dividends during the year.
CashWe used in$5.8 million for financing activities of $3.9 million during the year ended December 31, 2012 was due to2014, including $3.4 million for the payment of $3.4dividends and $2.0 million for the repurchase of dividends during the year, along with $0.7 million of earn-out payments made in 2012 related to the 2009 Utilimaster acquisition. Additional cash earn-out payments of $1.4 million made during 2012 are reflected within cash provided by operating activities.our common stock.
Cash usedRecent Acquisition (subsequent event)
On January 1, 2017, we completed the acquisition of substantially all of the assets and certain liabilities of Smeal Fire Apparatus Co., Smeal Properties, Inc., Ladder Tower Co., and U.S. Tanker Co. pursuant to a Purchase Agreement dated December 12, 2016. This acquisition will bring significant scale to our Emergency Response Vehicles segment, expand the geographic reach of our dealer network and add complementary products to our existing emergency response product portfolio. See Note 2, Acquisition Activities (Subsequent Event) in financing activitiesthe Notes to Consolidated Financial Statements appearing in Item 8 of $3.8 million duringthis Form 10-K for more information on this acquisition.
Restructuring Activities
During the years ended December 31, 2011 consisted primarily of funds used to pay cash dividends during the year.
Restructuring Activities
We recorded no restructuring charges during the year ended December 31, 2013.
During the year ended December 31, 2012,2016, 2015 and 2014, we incurred $7.8$1.1 million, $2.9 million and $2.2 million of restructuring charges within our Delivery and ServiceEmergency Response Vehicles segment including asset impairments, as the result of our planned relocation of our Utilimaster operations from Wakarusa, Indianarelated to Bristol, Indiana and the relocation of our ReachTMOcala, Florida manufacturing from Wakarusa, Indiana to Charlotte, Michigan. We undertook the moves of our Utilimaster and ReachTMoperations in order to improve profitability within the segment and eliminate non-value added manufacturing processes related to our walk-in van production. When fully implemented, these moves are expectedCharlotte, Michigan and Brandon, South Dakota facilities, along with efforts undertaken to result in savings of approximately $4 million on an annual basis. In 2012, we also incurred $1.3 million in severance charges withinupgrade production processes at our Specialty ChassisBrandon, South Dakota and Vehicles and Emergency Response Vehicles segments to help align the organizational structure and expenses with current and future revenue expectations.Ephrata, Pennsylvania locations.
During the year ended December 31, 2011, we incurred restructuring charges of $2.8 million related to initiatives to align expenses to coincide with revenue expectations. The actions we took allowed us to maintain profitability in 2011 despite the fall in sales volumes. Cost reduction measures included workforce reductions, plant and operation consolidations and overall improved cost management. An increased focus on our cash conversion cycle in 2011 helped us to maintain our working capital at a level similar to the prior year. See Note 13,4, Restructuring Charges,in the Notes to Consolidated Financial Statements appearing in Item 8 of this Form 10-K for further information.
Working CapitalCapital
Our working capital is summarized in the following table (in thousands):
| | | As of December 31, | | | As of December 31, | |
| | | 2013 | | | 2012 | | | 2011 | | | 2016 | | | 2015 | | | 2014 | |
| | | | | | | | | | | | | | | | | | | | | | | | | |
Current assets | | $ | 170,727 | | | $ | 152,523 | | | $ | 149,069 | | | $ | 162,191 | | | $ | 155,137 | | | $ | 153,453 | |
Current liabilities | | | 70,152 | | | | 53,690 | | | | 50,396 | | | | 87,724 | | | | 72,373 | | | | 60,621 | |
Working capital | | $ | 100,575 | | | $ | 98,833 | | | $ | 98,673 | | | $ | 74,467 | | | $ | 82,764 | | | $ | 92,832 | |
Working capital increaseddecreased from December 31, 20122015 to December 31, 2013 by $1.8 million to $100.6 million,2016, driven by the changes in cash,accounts receivable, inventory, income taxes receivable, other current assets, accounts payable, accrued warranty, accrued compensation and related taxes, and deposits from customers as described above. Increases in inventory, mainly due to the delay in final production as a result of supplier constraints, and cash were largely offset by increases in accounts payable due to the timing of payments and increased deposits from customers.
Working capital increaseddecreased from December 31, 20112014 to December 31, 2012 by $0.1 million to $98.8 million,2015, driven by the changes in cash, accounts receivable, income taxes receivable, other current assets,inventory, accounts payable, accrued compensationwarranty and deposits from customers as described above. Increases in accounts receivable, mainly due
Contingent Liabilities
Spartan-Gimaex joint venture
In February 2015, Spartan USA and Gimaex Holding, Inc. mutually agreed to begin discussions regarding the timingdissolution of sales,the Spartan-Gimaex joint venture. In June 2015, Spartan USA and other current liabilities dueGimaex Holding, Inc. entered into court proceedings to determine the reclassificationterms of property, plantthe dissolution. In February 2017, by agreement of the parties, the court proceeding was dismissed with prejudice and equipmentthe judge entered an order to this effect as the parties agreed to seek a dissolution plan on their own. No dissolution terms have been determined as of the date of this Form 10-K. In the fourth quarters of 2015 and 2014, we accrued charges totaling $1.0 million and $0.2 million to write down certain inventory items associated with this joint venture to their estimated fair values. Costs associated with the wind-down will be impacted by the final dissolution agreement. The costs we have accrued so far represent the low end of the range of the estimated total charges that we believe we may incur related to the Wakarusa, Indiana campuswind-down. While we are unable to held-for-sale were largely offset bydetermine the final cost of the wind-down with certainty at this time, we may incur additional charges, depending on the final terms of the dissolution, and such charges could be material to our results.
National Highway Traffic Safety Administration (“NHTSA”) penalty
In July 2015, we entered into a decreasesettlement agreement with the NHTSA pertaining to our early warning and defect reporting. Under the terms of the agreement, we will pay a fine of $1.0 million in cash usedequal installments over three years, and will complete performance obligations including compliance and regulatory practice improvements, industry outreach, and recalls to fund equipment purchases forremedy potential safety defects in certain of our chassis. The following table presents the new Bristol, Indiana facility.charges recorded in the Condensed Consolidated Statement of Operations during the year ended December 31, 2015 as a result of this agreement (in thousands):
Cost of products sold | | $ | 1,269 | |
Selling, general and administrative | | | 1,000 | |
| | | $ | 2,269 | |
Contingent Obligations
In connection with the acquisition of Utilimaster on November 30, 2009, we incurred contingent obligations in the form of certain performance-based earn-out payments, up to an aggregate maximum amount of $7.0 million, which become due through the first quarter of 2015.During the years ended December 31, 2013 and 2012, the Company made earn out payments totaling $2.7 million and $2.1 million, leaving an aggregate maximum amount of future payments of $2.2 million as of December 31, 2013. In accordance with accounting guidance, we recorded the estimated fair value of the future consideration on the acquisition date and subsequently adjusted the balance to reflect amortization of the discount and changes in Utilimaster’s expected performance, resulting in a balance of $1.0 million at December 31, 2013, including $0.2 million classified as current and $0.8 million classified as long term, based upon the likelihood of the payments, discounted to the reporting date. We believe that we have sufficient liquidity to fund the contingent obligations as they become due.See Note 12,Commitments and Contingent Liabilities, in the Notes to Consolidated Financial Statements appearing in Item 8 of this Form 10-K for further details.
Debt
OnOn December 16, 2011, October 31, 2016, we amendedentered into a second Amended and Restated Credit Agreement (the "Credit Agreement") by and among us, certain of our unsecured revolving credit facility under whichsubsidiaries, Wells Fargo Bank, National Association, as administrative agent ("Wells Fargo"), and the lenders party thereto consisting of Wells Fargo, JPMorgan Chase Bank, N.A. and PNC Bank (the "Lenders"). Under the Credit Agreement, we may borrow up to $70.0$100 million from the Lenders under a syndicate of lenders, including Wells Fargo Bank N.A. and JPMorgan Chase Bank, N.A., to, among other things, extend the maturity of thethree-year unsecured revolving credit facility for an additional five years. See Note 8,Debt, in the Notes to Consolidated Financial Statements appearing in Item 8 of this Form 10-K for further details. Under the terms of the agreement, the Companyfacility. We may also request an increase in the facility of up to $35.0$35 million in the aggregate, subject to customary conditions. The credit facility is available for the issuance of letters of credit of up to $20 million, swing line loans of up to $15 million and revolving loans, subject to certain limitations and restrictions. Interest rates on borrowings under the credit facility are based on applicable rates ateither (i) the highest of the prime rate, the federal funds effective rate from time of issuance but are generally anto time plus 0.5%, or the one month adjusted London interbank market rate ("LIBOR") plus 1.0%; or (ii) adjusted LIBOR rate plus a margin rangingbased upon our ratio of debt to earnings from 125time to 225 basis points, basedtime. The Credit Agreement contains certain customary representations and covenants, including performance-based financial covenants on specified leverage ratio tiers from periodour part. The credit facility matures October 31, 2019, following which we have the option to period. In addition, commitmentrenew the credit facility, subject to lender approval, for two successive one-year periods with an ultimate maturity date of October 31, 2021. Commitment fees range from 2017.5 to 3532.5 basis points on the unused portion of the line. The credit facility matures on December 16, 2016. We had no drawings against this credit line as of December 31, 20132016 or 2012.December 31, 2015. In January 2017, we borrowed $32.8 million from our credit line to fund our acquisition of Smeal. During the year ended December 31, 2013,2016, and in future years, our revolving credit facility was utilized, and will continue to be utilized, to finance commercial chassis received by our Utilimaster subsidiary under a chassis bailment inventory agreementagreements with General Motors Company.Company (“GM”) and Chrysler Group, LLC (“Chrysler”). This funding is reflected as a reduction of up to $5.0 million on the revolving credit facility available to us.us equal to the amount drawn by GM and Chrysler. See Note 12,10, Commitments and Contingent Liabilities, in the Notes to Consolidated Financial Statements appearing in Item 8 of this Form 10-K for further details about Utilimaster’sthese chassis bailment inventory agreement.agreements. The applicable borrowing rate including margin was 1.86672% (or one-month LIBOR plus 1.5%) at December 31, 2016.
On November 30, 2012,At December 31, 2015 we entered into an amendment to our existing amended and restated private shelf agreement with Prudential Investment Management, Inc. Under the original private shelf agreement, we issued $5.0had $5.0 million of 5.46% Series B Senior Notes due December 1,outstanding with Prudential Investment Management, Inc. The notes were repaid with cash on hand on October 31, 2016. The amended agreement extended the period during which we may issue private notes by three years to November 30, 2015 and increased the limit of the uncommitted shelf facility up to $50.0 million. The interest rate is determined based on applicable rates at time of issuance. The total outstanding debt under this agreement was $5.0 million at December 31, 2013 and 2012.
Under the terms of our credit agreement with our banks, we have the ability to issue letters of credit totaling $15.0$20.0 million. At December 31, 20132016 and 2012,2015, we had outstanding letters of credit totaling $10.4 million$1,599 and $0.2 million$1,337 related to certain emergency response vehicle contracts and our workers compensation insurance. The increase in the outstanding letters of credit at December 31, 2013 is mainly due to performance bonds issued in relation to the award of an order from Peru for 70 emergency response vehicles.
Under
Under the terms of the line of credit and the term notes detailed above, we are required to maintain certain financial ratios and other financial conditions.conditions, which limited our available borrowings under our line of credit to a total of approximately $73.6 million and $36.5 million at December 31, 2016 and 2015. The agreements prohibit us from incurring additional indebtedness; limit certain acquisitions, investments, advances or loans; limit our ability to pay dividends in certain circumstances; and restrict substantial asset sales. At December 31, 2013,2016, we were in compliance with all debt covenants, and, based on our outlook for 2014,2017, we expect to be able to meet these financial covenants over the next twelve months.
We had capital lease obligations outstanding of approximately $0.3$0.1 million and $0.3$0.2 million as of December 31, 20132016 and 2012,2015, due and payable over the next sevenfive years.
Equity Securities
Equity Securities
On October 19, 2011, theour Board of Directors authorized management to repurchase up to a total of 1.0 million shares of itsour common stock in open market transactions, contingent upon market conditions. During the second and third quarters of 2014, we repurchased a total of 382,000 shares of our common stock and during the second quarter of 2016, we repurchased a total of 422,000 shares of our common stock under this authorization. We did not repurchase any shares in 2015.
On April 28, 2016, our Board of Directors terminated the 2011 repurchase authorization effective June 30, 2016, and authorized the repurchase of up to 1.0 million additional shares of our common stock in open market transactions. Repurchase of common stock is based on management’s assessment of market conditions. As ofAt December 31, 2013, no2016 there were 1.0 million shares of common stock were repurchasedremaining under this repurchase authorization. If we were to repurchase the fullremaining 1.0 million shares of stock under the repurchase program, it would cost approximately $5.7us $7.1 million based on the closing price of our stock on February 28, 2014.27, 2017. We believe that we have sufficient resources to fund thisany potential stock buyback.
On October 20, 2010, the Board of Directors authorized management to repurchase, over the course of the subsequent 12-month period, up to a total of 1.0 million shares of its common stockbuyback in open market transactions. No shares of common stock were repurchased under this authorization, which expired October 19, 2011.
Dividendswe may engage.
Dividends
On October 24, 2013November 2, 2016 our Board of Directors declared a cash dividend of $0.05 per share of common stock, payablewhich was paid on December 19, 201315, 2016 to shareholders of record on November 14, 2013.15, 2016.
On May 8, 2013April 28, 2016 our Board of Directors declared a cash dividend of $0.05 per share of common stock, which was paid on June 27, 201323, 2016 to shareholders of record at the close of business on May 23, 2013. 19, 2016. The total amount of dividends paid in 20132016 was $3.4 million.
On October 26, 2012, we2015, our Board of Directors declared a cash dividend of $0.05 per outstanding share payableof common stock, which was paid on December 13, 201217, 2015 to shareholders of record on November 8, 2012.12, 2015.
On April 26, 2012 weMay 8, 2015, our Board of Directors declared a cash dividend of $0.05 per outstanding share payableof common stock, which was paid on June 14, 201225, 2015 to shareholders of record on May 10, 2012.21, 2015. The total amount of dividends paid in 20122015 was $3.4 million.
On October 23, 2014 our Board of Directors declared a cash dividend of $0.05 per share of common stock, which was paid on December 18, 2014 to shareholders of record on November 13, 2014.
On May 1, 2014 our Board of Directors declared a cash dividend of $0.05 per share of common stock, which was paid on June 19, 2014 to shareholders of record on May 15, 2014. The total amount of dividends paid in 2014 was $3.4 million.
Off-Balance Sheet Arrangements
We have no off balance sheet arrangements that have or are reasonably likely to have a material current or future effect on our financial condition, cash flows, results of operations, liquidity, capital expenditures or capital resources.
Contractual Obligations and Commercial Commitments
Our future contractual obligations for agreements, including agreements to purchase materials in the normal course of business, are summarized below. The weighted average interest rate for long term debt as of December 31, 2013 was 5.46%.
| | | Payments Due by Period (in thousands) | | | Payments Due by Period (in thousands) | |
| | | Total | | | Less than 1 Year | | | 1-3 Years | | | 4-5 Years | | | More than 5 Years | | | | | | | Less than | | | | | | | | | | | More than | |
| | | | | | | | | | | | | | | | | | | | | | | Total | | | 1 Year | | | 1-3 Years | | | 4-5 Years | | | 5 Years | |
Long-term debt (1) | | $ | 5,523 | | | $ | 273 | | | $ | 5,250 | | | $ | - | | | $ | - | | |
| | | | | | | | | | | | | | | | | | | | | | |
Capital leases | | | 386 | | | | 96 | | | | 142 | | | | 115 | | | | 33 | | | $ | 149 | | | $ | 71 | | | $ | 78 | | | $ | - | | | $ | - | |
Operating leases | | | 8,217 | | | | 1,687 | | | | 2,356 | | | | 1,910 | | | | 2,264 | | | | 8,289 | | | | 2,247 | | | | 3,384 | | | | 2,585 | | | | 73 | |
Contingent payments (2) | | | 1,007 | | | | 247 | | | | 760 | | | | - | | | | - | | |
Purchase obligations | | | 24,237 | | | | 24,237 | | | | - | | | | - | | | | - | | | | 36,580 | | | | 36,580 | | | | - | | | | - | | | | - | |
| | | | | | | | | | | | | | | | | | | | | | | | | | | | | | | | | | | | | | | | | |
Total contractual obligations | | $ | 39,370 | | | $ | 26,540 | | | $ | 8,508 | | | $ | 2,025 | | | $ | 2,297 | | | $ | 45,018 | | | $ | 38,898 | | | $ | 3,462 | | | $ | 2,585 | | | $ | 73 | |
(1)
| Long term debt includes estimated interest payments; interest payments on related variable rate debt were calculated using the effective interest rate at December 31, 2013.
|
(2)
| Contingent payments are estimates associated with the Utilimaster acquisition in November, 2009, which assumes that various contingencies and market opportunities occur in 2014.
|
Critical Accounting Policies and Estimates
The following discussion of critical accounting policies and estimates is intended to supplement Note 1, General and Summary of Accounting Policies, of the Notes to Consolidated Financial Statements appearing in Item 8 of this Form 10-K. These policies were selected because they are broadly applicable within our operating units and they involve additional management judgment due to the sensitivity of the methods, assumptions and estimates necessary in determining the related statement of income, asset and/or liability amounts.
Revenue Recognition
We recognize revenue in accordance with authoritative guidelines, including those of the SEC.Securities and Exchange Commission (“SEC”). Accordingly, revenue is recognized when title to the product and risk of ownership passes to the buyer. In certain instances, risk of ownership and title passes when the product has been completed in accordance with purchase order specifications and has been tendered for delivery to the customer. On certain customer requested bill and hold transactions, revenue recognition occurs after the customer has been notified that the products have been completed according to the customer specifications, have passed all of our quality control inspections, and are ready for delivery. All sales are shown net of returns, discounts and sales incentive programs, which historically have not been significant. The collectability of any related receivable is reasonably assured before revenue is recognized.
Accounts Receivable
WeWe maintain an allowance for customer accounts that reduces receivables to amounts that are expected to be collected. In estimating the allowance for doubtful accounts, we make certain assumptions regarding the risk of uncollectable open receivable accounts. This risk factor is applied to the balance on accounts that are aged over 90 days: generally this reserve has an estimated range from 10-25%. The risk percentage applied to the aged accounts may change based on conditions such as: general economic conditions, industry-specific economic conditions, historical and anticipated customer performance, historical experience with write-offs and the level of past-due amounts from year to year. However, generally our assumptions are consistent year-over-year and there has been little adjustment made to the percentages used. In addition, in the event there are certain known risk factors with an open account, we may increase the allowance to include estimated losses on such “specific” account balances. The “specific” reserves are identified by a periodic review of the aged accounts receivable. If there is an account in question, credit checks are made and there is communication with the customer, along with other means to try to assess if a specific reserve is required. The inclusion of the “specific” reserve has caused the greatest fluctuation in our allowance for doubtful accounts balance historically. Please see Note 1,General and Summary of Accounting Policies,in the Notes to Consolidated Financial Statements appearing in Item 8 of this Form 10-K and Appendix A included in this Form 10-K for further details and historical view of our allowance for doubtful accounts balance.
Goodwill and Other Indefinite-Lived Intangible Assets
In accordance with authoritative guidance on goodwill and other indefinite-lived intangible assets, such assets are tested for impairment at least annually, and written down when and to the extent impaired. We perform our annual impairment test for goodwill and indefinite-lived intangible assets as of October 1 of each year, or more frequently if an event occurs or conditions change that would more likely than not reduce the fair value of the asset below its carrying value.
We have recorded goodwill at our Crimson, Classic FireAt December 31, 2016 and Utilimaster subsidiaries. Crimson and Classic Fire are components2015, all of our Emergency Responsegoodwill relates to our Fleet Vehicles and Services reportable segment. This reportable segment which was determined to be a reporting unit for goodwill impairment testing. Utilimaster comprises the Delivery and Service Vehicles reportable segment, which was also determined to be a reporting unit for goodwill impairment testing. We first assess qualitative factors including, but not limited to, macroeconomic conditions, industry conditions, the competitive environment, changes in the market for our products and current and forecasted financial performance to determine whether it is more likely than not that the fair value of a reporting unit is less than its carrying amount. If we determine that it is more likely than not that the fair value of the reporting unit is greater than its carrying amount, we are not required to calculate the fair value of a reporting unit. We have the option to bypass this qualitative assessment and proceed to the first step of a two-step goodwill impairment assessment. If we elect to bypass the qualitative assessment, or if after completing the assessment it is determined to be more likely than not that the fair value of a reporting unit is less than its carrying value, we perform a two-step impairment test, whereby the first step is comparing the fair value of a reporting unit with its carrying amount, including goodwill. The fair value of the reporting unit is determined by estimating the future cash flows of the reporting unit to which the goodwill relates, and then discounting the future cash flows at a market-participant-derived weighted-average cost of capital (“WACC”). In determining the estimated future cash flows, we consider current and projected future levels of income based on our plans for that business; business trends, prospects and market and economic conditions; and market-participant considerations. If the fair value of a reporting unit exceeds its carrying amount, goodwill of the reporting unit is considered to not be impaired and the second step of the test is not performed. The second step of the impairment test is performed when the carrying amount of the reporting unit exceeds its fair value, in which case the implied fair value of the reporting unit goodwill is compared with the carrying amount of that goodwill based on a hypothetical allocation of the reporting unit’s fair value to all of its underlying assets and liabilities. If the carrying amount of the reporting unit goodwill exceeds the implied fair value of that goodwill, an impairment loss is recognized in an amount equal to the excess.
We evaluate the recoverability of our indefinite lived intangible assets,assets, which, consistas of December 31, 2016, consisted of our Classic Fire and Utilimaster trade names,name, by comparing the estimated fair value of the trade name with its carrying value. We estimate the fair value of our trade namesname based on estimates of future royalty payments that are avoided through our ownership of the trade names,name, discounted to their present value. In determining the estimated fair value of the trade names,name, we consider current and projected future levels of revenue based on our plans for Classic Fire or Utilimaster branded products, business trends, prospects and market and economic conditions.
Significant judgments inherent in these analyses include assumptions about appropriate sales growth rates, WACC and the amount of expected future net cash flows. The judgments and assumptions used in the estimate of fair value are generally consistent with the projections and assumptions that are used in current operating plans. Such assumptions are subject to change as a result of changing economic and competitive conditions. The determination of fair value is highly sensitive to differences between estimated and actual cash flows and changes in the related discount rate used to evaluate the fair value of the reporting units and trade name.
The
In 2016, we elected to bypass the qualitative assessment and proceed to the first step of the two-step goodwill ofimpairment assessment for our DeliveryFleet Vehicles and Service Vehicles segment of $16.0 million at December 31, 2013 related to our Utilimaster subsidiary, the soleServices reporting unit of that segment.unit. The estimated fair value of our Delivery and Service Vehiclesthis reporting unit exceeded its carrying value by 12%115% as of October 1, 2013,2016, the most recent annual assessment date. Based on the discounted cash flow valuation at October 1, 2013,2016, an increase in the WACC for the Utilimaster reporting unit of approximately 160500 basis points would not result in impairment.
The results of our 2012 annual goodwill impairment test for our Emergency Response Vehicles reporting unit indicated that the goodwill for that reporting unit was not impaired. However, our 2013 annual goodwill impairment test indicated that the goodwill for that reporting unit was fully impaired. We determined that the carrying cost of the reporting unit exceeded its fair value, requiring us to compare the carrying cost of the goodwill to its implied fair value, which resulted in a non-cash impairment charge of $4.9 million being recorded during the fourth quarter of 2013. While we believe that the future profitability of our Emergency Response Vehicles reporting unit is likely, the impairment reflects our failure to reverse the ongoing operating losses of the reporting unit over the past three years, and the inability to definitively demonstrate the reporting unit’s ability to generate sufficient cash flow, on a discounted basis, to cover the carrying cost of its assets. The assumptions used to estimate the fair value of the Emergency Response Vehicles reporting unit in 2013 reflect our current outlook for the reporting unit, which was revised as a result of the failure to meet forecasts. This revised outlook reflects lowered expectations for future growth in revenue and operating income than the estimates used in the 2012 goodwill impairment analysis for this reporting unit.
The acquired Utilimaster trade name hashas an indefinite life as it is anticipated that it will contribute to our cash flows to the Company indefinitely. The estimated fair value of our Utilimaster trade name exceeded its associated carrying value of $2.9 million by 85%505% as of October 1, 2013.2016. Accordingly, there was no impairment recorded on this trade name. Based on the discounted cash flow valuations at October 1, 2016, an increase in the WACC used for this impairment analysis of 500 basis points would not result in impairment in the trade name.
The acquiredAt December 31, 2014, our indefinite lived intangible assets included the Classic Fire trade name has an indefinite life asname. During the quarter ended September 30, 2015, we determined that, based on updated sales forecasts for our Classic line of emergency response vehicles, it is anticipatedwas more likely than not that it will contribute cash flows to the Company indefinitely. The estimated fair value of our Classic Fire trade name intangible asset was impaired. Accordingly, we conducted an impairment test by comparing the discounted future cash flows expected to result from our ownership of the trade name with its carrying cost at September 30, 2015. The result of this analysis showed that the carrying cost of the Classic Fire trade name, which was recorded as an asset of our Emergency Response Vehicles segment exceeded its associated carrying valuefair value. Accordingly, an impairment charge of $0.6 million by 187% aswas recorded during the three months ended September 30, 2015 to reduce the carrying cost of October 1, 2013.the trade name to its estimated fair value.
SeeSee Note 6,5, Goodwill and Intangible Assets,in the Notes to Consolidated Financial Statements appearing in Item 8 of this Form 10-K for further details on our goodwill and indefinite-lived intangible assets.
We cannot predict the occurrence of certain events or changes in circumstances that might adversely affect the carrying value of goodwill and indefinite-lived intangible assets. Such events may include, but are not limited to, the impact of the general economic environment; a material negative change in relationships with significant customers; or strategic decisions made in response to economic and competitive conditions; and other risk factors as detailed in Item 1A “Risk Factors” in this Annual Report on Form 10-K.
Warranties
OurOur policy is to record a provision for the estimated cost of warranty-related claims at the time of the sale, and periodically adjust the warranty liability to reflect actual experience. The amount of warranty liability accrued reflects actual historical warranty cost, which is accumulated on specific identifiable units. From that point, there is a projection of the expected future cost of honoring our obligations under the warranty agreements. Historically, the cost of fulfilling our warranty obligations has principally involved replacement parts and labor for field retrofit campaigns and recalls, which increase the reserve. Our estimates are based on historical experience, the number of units involved and the extent of features and components included in product models. Over time, this method has been consistently applied and has proven to be an appropriate approach to estimating future costs to be incurred. See Note 12,10, Commitments and Contingent Liabilities, in the Notes to Consolidated Financial Statements appearing in Item 8 of this Form 10-K for further information regarding warranties.
Provision for Income Taxes
We account for income taxes under a method that requires deferred income tax assets and liabilities to be recognized using enacted tax rates for the effect of temporary differences between the book and tax bases of recorded assets and liabilities. Authoritative guidance also requires deferred income tax assets, which include state tax credit carryforwards, operating loss carryforwards and deductible temporary differences, be reduced by a valuation allowance if it is more likely than not that some portion or all of the deferred income tax assets will not be realized.
We evaluate the likelihood of realizing our deferred income tax assets by assessing our valuation allowance and by adjusting the amount of such allowance, if necessary. The factors used to assess the likelihood of realization include our forecast of future taxable income, the projected reversal of temporary differences and available tax planning strategies that could be implemented to realize the net deferred income tax assets.
We recognize the tax benefit from an uncertain tax position only if it is more likely than not that the tax position will be sustained on examination by the taxing authorities. The determination is based on the technical merits of the position and presumes that each uncertain tax position will be examined by the relevant taxing authority that has full knowledge of all relevant information. Although management believes the estimates are reasonable, no assurance can be given that the final outcome of these matters will not be different than what is reflected in the historical income tax provisions and accruals.
Interest and penalties attributable to income taxes are recorded as a component of income taxes.
New and Pending Accounting Policies
See Note 1, General and Summary of Accounting Policies, in the Notes to Consolidated Financial Statements appearing in Item 8 of this Form 10-K.
Effect of Inflation
Inflation affects us in two principal ways. First, our revolving note payablecredit agreement is generally tied to the prime and LIBOR interest rates so that increases in those interest rates would be translated into additional interest expense. Second, general inflation impacts prices paid for labor, parts and supplies. Whenever possible, we attempt to cover increased costs of production and capital by adjusting the prices of our products. However, we generally do not attempt to negotiate inflation-based price adjustment provisions into our contracts. Since order lead times can be as much as nine months, we have limited ability to pass on cost increases to our customers on a short-term basis. In addition, the markets we serve are competitive in nature, and competition limits our ability to pass through cost increases in many cases. We strive to minimize the effect of inflation through cost reductions and improved productivity.
Item 7A. | Quantitative and Qualitative Disclosures About Market RiskItem 7A. Quantitative and Qualitative Disclosures About Market Risk. |
Our primary market risk exposure is a change in interest rates and the effect of such a change on outstanding variable rate short-term and long-term debt. At December 31, 2013,2016, we had $5.0 million ofno debt outstanding under our variable rate short-term and long-term debt agreements. In January 2017 we borrowed $32.8 million from our existing revolving credit facility. An increase of 100 basis points in interest rates would notresult in additional interest expense of $0.3 million on an annualized basis for the floating rate debt that we incurred in January 2017. We believe that we have a material adverse effect on oursufficient financial position or results of operations.resources to accommodate this hypothetical increase in interest rates. We do not enter into market-risk-sensitive instruments for trading or otherpurposes.otherpurposes.
We do not believe that there has been a material change in the nature or categories of the primary market risk exposures or the particular markets that present our primary risk of loss. As of the date of this report, we do not know of or expect any material changes in the general nature of our primary market risk exposure in the near term. In this discussion, “near term” means a period of one year following the date of the most recent balance sheet contained in this report.
Prevailing interest rates and interest rate relationships are primarily determined by market factors that are beyond our control. All information provided in response to this item consists of forward-looking statements. Reference is made to the section captioned “Forward-Looking Statements” before Part I of this Annual Report on Form 10-K for a discussion of the limitations on our responsibility for such statements.
Item 8. | Financial Statements and Supplementary DataItem 8. Financial Statements and Supplementary Data. |
Report of Independent Registered Public Accounting Firm
Board of Directors and Shareholders
Spartan Motors, Inc.
Charlotte, Michigan
We have audited the accompanying consolidated balance sheets of Spartan Motors, Inc. as of December 31, 20132016 and 20122015 and the related consolidated statements of operations, shareholders’stockholders’ equity and cash flows for each of the three years in the period ended December 31, 2013.2016. In connection with our audits of the financial statements, we have also audited the financial statement schedule as listed in the accompanying index in Item 15(a)(1)(2) of this Form 10-K. These financial statements and schedule are the responsibility of the Company’s management. Our responsibility is to express an opinion on these financial statements and schedule based on our audits.
We conducted our audits in accordance with the standards of the Public Company Accounting Oversight Board (United States). Those standards require that we plan and perform the audit to obtain reasonable assurance about whether the financial statements are free of material misstatement. An audit includes examining, on a test basis, evidence supporting the amounts and disclosures in the financial statements, assessing the accounting principles used and significant estimates made by management, as well as evaluating the overall presentation of the financial statements and schedule.statement presentation. We believe that our audits provide a reasonable basis for our opinion.
In our opinion, the consolidated financial statements referred to above present fairly, in all material respects, the financial position of Spartan Motors, Inc. as of December 31, 20132016 and 2012,2015, and the results of its operations and its cash flows for each of the three years in the period ended December 31, 2013,2016, in conformity with accounting principles generally accepted in the United States of America.
Also, in our opinion, the financial statement schedule, when considered in relation to the basic consolidated financial statements taken as a whole, presents fairly, in all material respects, the information set forth therein.
We also have audited, in accordance with the standards of the Public Company Accounting Oversight Board (United States), Spartan Motors, Inc.’s internal control over financial reporting as of December 31, 2013,2016, based on criteria established inInternal Control – Integrated Framework (1992) (2013)issued by the Committee of Sponsoring Organizations of the Treadway Commission (COSO) and our report dated March 13, 20143, 2017 expressed an unqualified opinion thereon.
/s/ BDO USA, LLP
Grand Rapids, Michigan
March 13, 20143, 2017
Report of Independent Registered Public Accounting Firm
on Internal Control Over Financial Reporting
Board of Directors and Shareholders
Spartan Motors, Inc.
Charlotte, Michigan
We have audited Spartan Motors, Inc.’s internal control over financial reporting as of December 31, 2013,2016, based on criteria established inInternal Control – Integrated Framework (1992) (2013) issued by the Committee of Sponsoring Organizations of the Treadway Commission (the COSO criteria). Spartan Motors, Inc.’s management is responsible for maintaining effective internal control over financial reporting and for its assessment of the effectiveness of internal control over financial reporting, included in the accompanying Item 9A, Management’s Report on Internal Control Over Financial Reporting. Our responsibility is to express an opinion on the Company’s internal control over financial reporting based on our audit.
We conducted our audit in accordance with the standards of the Public Company Accounting Oversight Board (United States). Those standards require that we plan and perform the audit to obtain reasonable assurance about whether effective internal control over financial reporting was maintained in all material respects. Our audit included obtaining an understanding of internal control over financial reporting, assessing the risk that a material weakness exists, and testing and evaluating the design and operating effectiveness of internal control based on the assessed risk. Our audit also included performing such other procedures as we considered necessary in the circumstances. We believe that our audit provides a reasonable basis for our opinion.
A company’scompany’s internal control over financial reporting is a process designed to provide reasonable assurance regarding the reliability of financial reporting and the preparation of financial statements for external purposes in accordance with generally accepted accounting principles. A company’s internal control over financial reporting includes those policies and procedures that (1) pertain to the maintenance of records that, in reasonable detail, accurately and fairly reflect the transactions and dispositions of the assets of the company; (2) provide reasonable assurance that transactions are recorded as necessary to permit preparation of financial statements in accordance with generally accepted accounting principles, and that receipts and expenditures of the company are being made only in accordance with authorizations of management and directors of the company; and (3) provide reasonable assurance regarding prevention or timely detection of unauthorized acquisition, use, or disposition of the company’s assets that could have a material effect on the financial statements.
Because of its inherent limitations, internal control over financial reporting may not prevent or detect misstatements. Also, projections of any evaluation of effectiveness to future periods are subject to the risk that controls may become inadequate because of changes in conditions, or that the degree of compliance with the policies or procedures may deteriorate.
In our opinion, Spartan Motors, Inc. maintained, in all material respects, effective internal control over financial reporting as of December 31, 2013,2016, based on the COSO criteria.
We also have audited, in accordance with the standards of the Public Company Accounting Oversight Board (United States), the consolidated balance sheets of Spartan Motors, Inc. as of December 31, 20132016 and 20122015 and the related consolidated statements of operations, shareholders’stockholders’ equity and cash flows for each of the three years in the period ended December 31, 20132016 and our report dated March 13, 20143, 2017 expressed an unqualified opinion thereon.
/s/ BDO USA, LLP
Grand Rapids, Michigan
March 13, 20143, 2017
SPARTAN MOTORS, INC. AND SUBSIDIARIES
CONSOLIDATED BALANCE SHEETS
(In thousands, except par value)
| | | | December 31, | | | December 31, | |
| | | December 31, 2013 | | | December 31, 2012 | | | 2016 | | | 2015 | |
ASSETS | | | | | | | | | | | | | | | | |
Current assets: | | | | | | | | | | | | | | | | |
Cash and cash equivalents | | $ | 30,707 | | | $ | 21,748 | | | $ | 32,041 | | | $ | 32,701 | |
Accounts receivable, less allowance of $769 and $1,021 | | | 47,560 | | | | 47,139 | | |
Accounts receivable, less allowance of $487 and $130 | | | | 65,441 | | | | 56,617 | |
Inventories | | | 81,419 | | | | 67,591 | | | | 58,896 | | | | 60,558 | |
Deferred income tax assets | | | 6,736 | | | | 6,291 | | |
Income taxes receivable | | | 1,641 | | | | 3,011 | | | | 1,287 | | | | 1,755 | |
Assets held for sale | | | 373 | | | | 716 | | |
Other current assets | | | 2,291 | | | | 6,027 | | | | 4,526 | | | | 3,506 | |
Total current assets | | | 170,727 | | | | 152,523 | | | | 162,191 | | | | 155,137 | |
| | | | | | | | | | | | | | | | | |
Property, plant and equipment, net | | | 54,278 | | | | 59,122 | | | | 53,116 | | | | 47,320 | |
Goodwill | | | 15,961 | | | | 20,815 | | | | 15,961 | | | | 15,961 | |
Intangible assets, net | | | 10,094 | | | | 11,052 | | | | 6,385 | | | | 7,093 | |
Other assets | | | 2,222 | | | | 1,639 | | | | 2,331 | | | | 1,996 | |
Net deferred tax asset | | | | 3,310 | | | | 644 | |
TOTAL ASSETS | | $ | 253,282 | | | $ | 245,151 | | | $ | 243,294 | | | $ | 228,151 | |
| | | | | | | | | | | | | | | | | |
LIABILITIES AND SHAREHOLDERS' EQUITY | | | | | | | | | | | | | | | | |
Current liabilities: | | | | | | | | | | | | | | | | |
Accounts payable | | $ | 30,525 | | | $ | 23,000 | | | $ | 31,336 | | | $ | 27,318 | |
Accrued warranty | | | 7,579 | | | | 6,062 | | | | 19,334 | | | | 16,610 | |
Accrued customer rebates | | | 2,190 | | | | 2,299 | | |
Accrued compensation and related taxes | | | 6,440 | | | | 7,748 | | | | 13,188 | | | | 8,684 | |
Deposits from customers | | | 18,006 | | | | 6,386 | | | | 16,142 | | | | 13,095 | |
Other current liabilities and accrued expenses | | | 5,333 | | | | 8,113 | | | | 7,659 | | | | 6,603 | |
Current portion of long-term debt | | | 79 | | | | 82 | | | | 65 | | | | 63 | |
Total current liabilities | | | 70,152 | | | | 53,690 | | | | 87,724 | | | | 72,373 | |
| | | | | | | | | | | | | | | | | |
Other non-current liabilities | | | 3,109 | | | | 3,071 | | | | 2,544 | | | | 2,163 | |
Long-term debt, less current portion | | | 5,261 | | | | 5,207 | | | | 74 | | | | 5,124 | |
Deferred income tax liabilities | | | 3,209 | | | | 4,454 | | |
| | | | | | | | | | |
Total liabilities | | | | 90,342 | | | | 79,660 | |
Commitments and contingencies | | | | | | | | | |
Shareholders' equity: | | | | | | | | | | | | | | | | |
Preferred stock, no par value: 2,000 shares authorized (none issued) | | | - | | | | - | | | | - | | | | - | |
Common stock, $0.01 par value; 40,000 shares authorized; 34,210 and 33,862 outstanding | | | 342 | | | | 339 | | |
Common stock, $0.01 par value; 40,000 shares authorized; 34,383 and 34,271 outstanding | | | | 344 | | | | 343 | |
Additional paid in capital | | | 75,075 | | | | 72,873 | | | | 76,837 | | | | 76,472 | |
Retained earnings | | | 96,132 | | | | 105,517 | | | | 76,428 | | | | 72,326 | |
Total Spartan Motors, Inc. shareholders’ equity | | | 171,549 | | | | 178,729 | | |
Total Spartan Motors, Inc. shareholders’ equity | | | | 153,609 | | | | 149,141 | |
Non-controlling interest | | | 2 | | | | - | | | | (657 | ) | | | (650 | ) |
Total shareholders' equity | | | 171,551 | | | | 178,729 | | | | 152,952 | | | | 148,491 | |
TOTAL LIABILITIES AND SHAREHOLDERS' EQUITY | | $ | 253,282 | | | $ | 245,151 | | | $ | 243,294 | | | $ | 228,151 | |
See accompanying Notes to Consolidated Financial Statements.
|
| SPARTAN MOTORS, INC. AND SUBSIDIARIES |
| CONSOLIDATED STATEMENTS OF OPERATIONS |
| (In thousands, except per share data) |
|
| | | Year Ended December 31, | |
| | | 2016 | | | 2015 | | | 2014 | |
| | | | | | | | | | | | | |
Sales | | $ | 590,777 | | | $ | 550,414 | | | $ | 506,764 | |
Cost of products sold | | | 518,113 | | | | 502,783 | | | | 450,702 | |
Restructuring charges | | | 136 | | | | 519 | | | | 808 | |
Gross profit | | | 72,528 | | | | 47,112 | | | | 55,254 | |
| | | | | | | | | | | | | |
Operating expenses: | | | | | | | | | | | | |
Research and development | | | 6,772 | | | | 4,560 | | | | 3,851 | |
Selling, general and administrative | | | 56,172 | | | | 52,695 | | | | 51,205 | |
Restructuring charges | | | 959 | | | | 2,336 | | | | 1,349 | |
Total operating expenses | | | 63,903 | | | | 59,591 | | | | 56,405 | |
| | | | | | | | | | | | | |
Operating income (loss) | | | 8,625 | | | | (12,479 | ) | | | (1,151 | ) |
Other income (expense): | | | | | | | | | | | | |
Interest expense | | | (410 | ) | | | (365 | ) | | | (341 | ) |
Interest and other income | | | 488 | | | | 244 | | | | 418 | |
Total other income (expense) | | | 78 | | | | (121 | ) | | | 77 | |
| | | | | | | | | | | | | |
Income (loss) before taxes | | | 8,703 | | | | (12,600 | ) | | | (1,074 | ) |
| | | | | | | | | | | | | |
| Income tax expense (benefit) | | | 100 | | | | 4,880 | | | | (2,103 | ) |
| | | | | | | | | | | | | |
Net earnings (loss) | | | 8,603 | | | | (17,480 | ) | | | 1,029 | |
| | | | | | | | | | | | | |
Less: net loss attributable to non-controlling interest | | | (7 | ) | | | (508 | ) | | | (144 | ) |
| | | | | | | | | | | | | |
Net earnings (loss) attributable to Spartan Motors, Inc. | | $ | 8,610 | | | $ | (16,972 | ) | | $ | 1,173 | |
| | | | | | | | | | | | | |
Basic net earnings (loss) per share | | $ | 0.25 | | | $ | (0.50 | ) | | $ | 0.03 | |
| | | | | | | | | | | | | |
Diluted net earnings (loss) per share | | $ | 0.25 | | | $ | (0.50 | ) | | $ | 0.03 | |
| | | | | | | | | | | | | |
Basic weighted average common shares outstanding | | | 34,405 | | | | 33,826 | | | | 34,251 | |
| | | | | | | | | | | | | |
Diluted weighted average common shares outstanding | | | 34,405 | | | | 33,826 | | | | 34,256 | |
See accompanying Notes to Consolidated Financial Statements.
SPARTAN MOTORS, INC. AND SUBSIDIARIES
CONSOLIDATED STATEMENTS OF OPERATIONS
(In thousands, except per share data)
| | | Year Ended December 31, | |
| | | 2013 | | | 2012 | | | 2011 | |
| | | | | | | | | | | | | |
Sales | | $ | 469,538 | | | $ | 470,577 | | | $ | 426,010 | |
Cost of products sold | | | 416,475 | | | | 405,455 | | | | 363,662 | |
Restructuring charges | | | - | | | | 6,514 | | | | 1,731 | |
Gross profit | | | 53,063 | | | | 58,608 | | | | 60,617 | |
| | | | | | | | | | | | | |
Operating expenses: | | | | | | | | | | | | |
Research and development | | | 10,911 | | | | 12,873 | | | | 13,931 | |
Selling, general and administrative | | | 45,496 | | | | 45,707 | | | | 44,305 | |
Goodwill impairment | | | 4,854 | | | | - | | | | - | |
Restructuring charges | | | - | | | | 2,619 | | | | 1,050 | |
Total operating expenses | | | 61,261 | | | | 61,199 | | | | 59,286 | |
| | | | | | | | | | | | | |
Operating income (loss) | | | (8,198 | ) | | | (2,591 | ) | | | 1,331 | |
| | | | | | | | | | | | | |
Other income (expense): | | | | | | | | | | | | |
Interest expense | | | (311 | ) | | | (335 | ) | | | (324 | ) |
Interest and other income | | | 659 | | | | 569 | | | | 276 | |
Total other income (expense) | | | 348 | | | | 234 | | | | (48 | ) |
| | | | | | | | | | | | | |
Earnings (loss) before taxes | | | (7,850 | ) | | | (2,357 | ) | | | 1,283 | |
| | | | | | | | | | | | | |
Taxes | | | (1,881 | ) | | | 100 | | | | 510 | |
| | | | | | | | | | | | | |
Net earnings (loss) | | | (5,969 | ) | | | (2,457 | ) | | | 773 | |
| | | | | | | | | | | | | |
Less: net earnings attributable to non-controlling interest | | | 2 | | | | - | | | | - | |
| | | | | | | | | | | | | |
Net earnings (loss) attributable to Spartan Motors, Inc. | | $ | (5,971 | ) | | $ | (2,457 | ) | | $ | 773 | |
| | | | | | | | | | | | | |
Basic net earnings (loss) per share | | $ | (0.18 | ) | | $ | (0.07 | ) | | $ | 0.02 | |
| | | | | | | | | | | | | |
Diluted net earnings (loss) per share | | $ | (0.18 | ) | | $ | (0.07 | ) | | $ | 0.02 | |
| | | | | | | | | | | | | |
Basic weighted average common shares outstanding | | | 33,550 | | | | 33,165 | | | | 33,438 | |
| | | | | | | | | | | | | |
Diluted weighted average common shares outstanding | | | 33,550 | | | | 33,165 | | | | 33,488 | |
See accompanying Notes to Consolidated Financial Statements.
SPARTAN MOTORS, INC. AND SUBSIDIARIES
CONSOLIDATED STATEMENTS OF SHAREHOLDERS’ EQUITY
YEARS ENDED DECEMBER 31, 2013, 2012 2016, 2015 and 20112014
(In thousands, except per share data)data)
| | | | | | | | | | | | | | | | | | | |
| | | Number of Shares | | | Common Stock | | | Additional Paid In Capital | | | Retained Earnings | | | Non- Controlling Interest | | | Total Shareholders' Equity | |
Balance at December 31, 2010 | | | 33,215 | | | $ | 332 | | | $ | 68,715 | | | $ | 113,932 | | | $ | - | | | $ | 182,979 | |
| | | | | | | | | | | | | | | | | | | | | | | | | |
Issuance of common stock and the taximpact of stock incentive plan transactions | | | 7 | | | | - | | | | (375 | ) | | | - | | | | - | | | | (375 | ) |
| | | | | | | | | | | | | | | | | | | | | | | | | |
Dividends declared ($0.10 per share) | | | - | | | | - | | | | - | | | | (3,348 | ) | | | - | | | | (3,348 | ) |
| | | | | | | | | | | | | | | | | | | | | | | | | |
Issuance of common stock related toinvestment in subsidiary | | | 188 | | | | 2 | | | | 1,027 | | | | - | | | | - | | | | 1,029 | |
| | | | | | | | | | | | | | | | | | | | | | | | | |
Issuance of restricted stock, net ofcancellation | | | 186 | | | | 2 | | | | (2 | ) | | | - | | | | - | | | | - | |
| | | | | | | | | | | | | | | | | | | | | | | | | |
Stock based compensation expense relatedto restricted stock | | | - | | | | - | | | | 1,780 | | | | - | | | | - | | | | 1,780 | |
| | | | | | | | | | | | | | | | | | | | | | | | | |
Net earnings | | | - | | | | - | | | | - | | | | 773 | | | | - | | | | 773 | |
| | | | | | | | | | | | | | | | | | | | | | | | | |
Balance at December 31, 2011 | | | 33,596 | | | | 336 | | | | 71,145 | | | | 111,357 | | | | - | | | | 182,838 | |
| | | | | | | | | | | | | | | | | | | | | | | | | |
Issuance of common stock and the taximpact of stock incentive plan transactions | | | 70 | | | | 1 | | | | 85 | | | | - | | | | - | | | | 86 | |
| | | | | | | | | | | | | | | | | | | | | | | | | |
Dividends declared ($0.10 per share) | | | - | | | | - | | | | - | | | | (3,383 | ) | | | - | | | | (3,383 | ) |
| | | | | | | | | | | | | | | | | | | | | | | | | |
Issuance of restricted stock, net ofcancellation | | | 196 | | | | 2 | | | | (2 | ) | | | - | | | | - | | | | - | |
| | | | | | | | | | | | | | | | | | | | | | | | | |
Stock based compensation expense relatedto restricted stock | | | - | | | | - | | | | 1,645 | | | | - | | | | - | | | | 1,645 | |
| | | | | | | | | | | | | | | | | | | | | | | | | |
Net loss | | | - | | | | - | | | | - | | | | (2,457 | ) | | | - | | | | (2,457 | ) |
| | | | | | | | | | | | | | | | | | | | | | | | | |
Balance at December 31, 2012 | | | 33,862 | | | | 339 | | | | 72,873 | | | | 105,517 | | | | - | | | | 178,729 | |
| | | | | | | | | | | | | | | | | | | | | | | | | |
Issuance of common stock and the taximpact of stock incentive plan transactions | | | 217 | | | | 2 | | | | 579 | | | | - | | | | - | | | | 581 | |
| | | | | | | | | | | | | | | | | | | | | | | | | |
Dividends declared ($0.10 per share) | | | - | | | | - | | | | - | | | | (3,414 | ) | | | - | | | | (3,414 | ) |
| | | | | | | | | | | | | | | | | | | | | | | | | |
Issuance of restricted stock, net ofcancellation | | | 131 | | | | 1 | | | | (1 | ) | | | - | | | | - | | | | - | |
| | | | | | | | | | | | | | | | | | | | | | | | | |
Stock based compensation expense relatedto restricted stock | | | - | | | | - | | | | 1,624 | | | | - | | | | - | | | | 1,624 | |
| | | | | | | | | | | | | | | | | | | | | | | | | |
Net income (loss) | | | - | | | | - | | | | - | | | | (5,971 | ) | | | 2 | | | | (5,969 | ) |
| | | | | | | | | | | | | | | | | | | | | | | | | |
Balance at December 31, 2013 | | | 34,210 | | | $ | 342 | | | $ | 75,075 | | | $ | 96,132 | | | $ | 2 | | | $ | 171,551 | |
| | | Number of | | | Common | | | Additional | | | Retained | | | Non- Controlling | | | Total Shareholders' | |
| | | Shares | | | Stock | | | Paid In Capital | | | Earnings | | | Interest | | | Equity | |
Balance at December 31, 2013 | | | 34,210 | | | $ | 342 | | | $ | 75,075 | | | $ | 96,132 | | | $ | 2 | | | $ | 171,551 | |
| | | | | | | | | | | | | | | | | | | | | | | | | |
Issuance of common stock and the tax impact of stock incentive plan transactions | | | 25 | | | | - | | | | (159 | ) | | | - | | | | - | | | | (159 | ) |
| | | | | | | | | | | | | | | | | | | | | | | | | |
Dividends declared ($0.10 per share) | | | - | | | | - | | | | - | | | | (3,427 | ) | | | - | | | | (3,427 | ) |
| | | | | | | | | | | | | | | | | | | | | | | | | |
Purchase and retirement of common stock | | | (382 | ) | | | (3 | ) | | | (843 | ) | | | (1,154 | ) | | | - | | | | (2,000 | ) |
| | | | | | | | | | | | | | | | | | | | | | | | | |
Issuance of restricted stock, net of cancellation | | | 241 | | | | 2 | | | | (2 | ) | | | - | | | | - | | | | - | |
| | | | | | | | | | | | | | | | | | | | | | | | | |
Stock based compensation expense related to restricted stock | | | - | | | | - | | | | 1,624 | | | | - | | | | - | | | | 1,624 | |
| | | | | | | | | | | | | | | | | | | | | | | | | |
Net earnings (loss) | | | - | | | | - | | | | - | | | | 1,173 | | | | (144 | ) | | | 1,029 | |
| | | | | | | | | | | | | | | | | | | | | | | | | |
Balance at December 31, 2014 | | | 34,094 | | | | 341 | | | | 75,695 | | �� | | 92,724 | | | | (142 | ) | | | 168,618 | |
| | | | | | | | | | | | | | | | | | | | | | | | | |
Issuance of common stock and the tax impact of stock incentive plan transactions | | | 13 | | | | - | | | | (419 | ) | | | - | | | | - | | | | (419 | ) |
| | | | | | | | | | | | | | | | | | | | | | | | | |
Dividends declared ($0.10 per share) | | | - | | | | - | | | | - | | | | (3,426 | ) | | | - | | | | (3,426 | ) |
| | | | | | | | | | | | | | | | | | | | | | | | | |
Issuance of restricted stock, net of cancellation | | | 164 | | | | 2 | | | | (2 | ) | | | - | | | | - | | | | - | |
| | | | | | | | | | | | | | | | | | | | | | | | | |
Stock based compensation expense related to restricted stock | | | - | | | | - | | | | 1,198 | | | | - | | | | - | | | | 1,198 | |
| | | | | | | | | | | | | | | | | | | | | | | | | |
| | | | | | | | | | | | | | | | | | | | | | | | | |
Net loss | | | - | | | | - | | | | - | | | | (16,972 | ) | | | (508 | ) | | | (17,480 | ) |
| | | | | | | | | | | | | | | | | | | | | | | | | |
Balance at December 31, 2015 | | | 34,271 | | | | 343 | | | | 76,472 | | | | 72,326 | | | | (650 | ) | | | 148,491 | |
| | | | | | | | | | | | | | | | | | | | | | | | | |
Issuance of common stock and the tax impact of stock incentive plan transactions | | | 16 | | | | - | | | | (234 | ) | | | - | | | | - | | | | (234 | ) |
| | | | | | | | | | | | | | | | | | | | | | | | | |
Dividends declared ($0.10 per share) | | | - | | | | - | | | | - | | | | (3,444 | ) | | | - | | | | (3,444 | ) |
| | | | | | | | | | | | | | | | | | | | | | | | | |
Purchase and retirement of common stock | | | (422 | ) | | | (4 | ) | | | (932 | ) | | | (1,064 | ) | | | - | | | | (2,000 | ) |
| | | | | | | | | | | | | | | | | | | | | | | | | |
Issuance of restricted stock, net of cancellation | | | 518 | | | | 5 | | | | (5 | ) | | | - | | | | - | | | | - | |
| | | | | | | | | | | | | | | | | | | | | | | | | |
Stock based compensation expense related to restricted stock | | | - | | | | - | | | | 1,536 | | | | - | | | | - | | | | 1,536 | |
| | | | | | | | | | | | | | | | | | | | | | | | | |
Net earnings (loss) | | | - | | | | - | | | | - | | | | 8,610 | | | | (7 | ) | | | 8,603 | |
| | | | | | | | | | | | | | | | | | | | | | | | | |
Balance at December 31, 2016 | | | 34,383 | | | $ | 344 | | | $ | 76,837 | | | $ | 76,428 | | | $ | (657 | ) | | $ | 152,952 | |
See accompanying Notes to Consolidated Financial Statements.
SPARTAN MOTORS, INC. AND SUBSIDIARIES
CONSOLIDATED STATEMENTS OF CASH FLOWS
(In thousands)
| | | Year Ended December 31, | |
| | | 2013 | | | 2012 | | | 2011 | |
Cash flows from operating activities: | | | | | | | | | | | | |
Net earnings (loss) | | $ | (5,969 | ) | | $ | (2,457 | ) | | $ | 773 | |
Adjustments to reconcile net earnings (loss) to net cash provided by operating activities | | | | | | | | | | | | |
Depreciation and amortization | | | 9,238 | | | | 8,990 | | | | 10,010 | |
Loss on disposal and impairment of assets | | | 255 | | | | 5,621 | | | | 1,139 | |
Goodwill impairment | | | 4,854 | | | | - | | | | - | |
Expense from changes in fair value of contingent consideration | | | 21 | | | | 2,872 | | | | 983 | |
Tax benefit related to stock incentive plan transactions | | | 118 | | | | 134 | | | | 222 | |
Deferred income taxes | | | (1,690 | ) | | | (2,771 | ) | | | (488 | ) |
Stock based compensation related to stock awards | | | 1,624 | | | | 1,645 | | | | 1,780 | |
Decrease (increase) in operating assets, net of acquired business: | | | | | | | | | | | | |
Accounts receivable | | | (421 | ) | | | (7,097 | ) | | | 13,118 | |
Inventories | | | (13,828 | ) | | | (600 | ) | | | (5,478 | ) |
Income taxes receivable | | | 1,758 | | | | (1,532 | ) | | | 1,412 | |
Other assets | | | 1,236 | | | | 661 | | | | 1,190 | |
Increase (decrease) in operating liabilities, net of acquired business: | | | | | | | | | | | | |
Accounts payable | | | 7,525 | | | | 1,350 | | | | 3,510 | |
Accrued warranty | | | 1,517 | | | | 260 | | | | (40 | ) |
Accrued customer rebates | | | (109 | ) | | | 753 | | | | (842 | ) |
Accrued compensation and related taxes | | | (1,308 | ) | | | 2,079 | | | | 61 | |
Deposits from customers | | | 11,620 | | | | (1,515 | ) | | | 3,919 | |
Other current liabilities and accrued expenses | | | (2,212 | ) | | | (1,896 | ) | | | (1,036 | ) |
Taxes on income | | | (1,183 | ) | | | (130 | ) | | | (96 | ) |
Total adjustments | | | 19,015 | | | | 8,824 | | | | 29,364 | |
Net cash provided by operating activities | | | 13,046 | | | | 6,367 | | | | 30,137 | |
| | | | | | | | | | | | | |
Cash flows from investing activities: | | | | | | | | | | | | |
Purchases of property, plant and equipment | | | (3,526 | ) | | | (12,468 | ) | | | (5,255 | ) |
Proceeds from sale of property, plant and equipment | | | 180 | | | | 75 | | | | 842 | |
Proceeds from notes receivable | | | 2,500 | | | | | | | | | |
Acquisition of business, net of cash acquired | | | - | | | | - | | | | (4,746 | ) |
Net cash used in investing activities | | | (846 | ) | | | (12,393 | ) | | | (9,159 | ) |
| | | | | | | | | | | | | |
Cash flows from financing activities: | | | | | | | | | | | | |
Borrowings under credit facilities | | | - | | | | 2,891 | | | | - | |
Payments on credit facilities | | | - | | | | (2,891 | ) | | | - | |
Proceeds from long-term debt | | | 138 | | | | 223 | | | | 17 | |
Payments on long-term debt | | | (86 | ) | | | (73 | ) | | | (102 | ) |
Payment of contingent consideration on acquisitions | | | (460 | ) | | | (756 | ) | | | - | |
Net cash provided from (used in) the exercise, vesting or cancellation of stock incentive awards | | | 699 | | | | 220 | | | | (153 | ) |
Cash paid related to tax impact of stock incentive plan transactions | | | (118 | ) | | | (134 | ) | | | (222 | ) |
Payment of dividends | | | (3,414 | ) | | | (3,383 | ) | | | (3,348 | ) |
Net cash used in financing activities | | | (3,241 | ) | | | (3,903 | ) | | | (3,808 | ) |
| | | | | | | | | | | | | |
Net increase (decrease) in cash and cash equivalents | | | 8,959 | | | | (9,929 | ) | | | 17,170 | |
Cash and cash equivalents at beginning of year | | | 21,748 | | | | 31,677 | | | | 14,507 | |
Cash and cash equivalents at end of year | | $ | 30,707 | | | $ | 21,748 | | | $ | 31,677 | |
| | | Year Ended December 31, | |
| | | 2016 | | | 2015 | | | 2014 | |
Cash flows from operating activities: | | | | | | | | | | | | |
Net earnings (loss) | | $ | 8,603 | | | $ | (17,480 | ) | | $ | 1,029 | |
Adjustments to reconcile net earnings (loss) to net cash provided by operating activities | | | | | | | | | | | | |
Depreciation and amortization | | | 7,903 | | | | 7,437 | | | | 8,378 | |
Gain on disposal of assets | | | (13 | ) | | | (24 | ) | | | (191 | ) |
Impairment of assets | | | 406 | | | | 2,234 | | | | - | |
Accruals for warranty | | | 12,989 | | | | 15,388 | | | | 6,533 | |
Expense from changes in fair value of contingent consideration | | | - | | | | - | | | | 742 | |
Tax benefit related to stock incentive plan transactions | | | 123 | | | | 44 | | | | 100 | |
Deferred income taxes | | | (2,666 | ) | | | 5,147 | | | | (2,265 | ) |
Stock based compensation related to stock awards | | | 1,536 | | | | 1,198 | | | | 1,624 | |
Decrease (increase) in operating assets: | | | | | | | | | | | | |
Accounts receivable | | | (8,824 | ) | | | (8,255 | ) | | | (802 | ) |
Inventories | | | 1,662 | | | | 10,605 | | | | 10,256 | |
Income taxes receivable | | | 468 | | | | (59 | ) | | | (55 | ) |
Other assets | | | (1,020 | ) | | | 155 | | | | (1,370 | ) |
Increase (decrease) in operating liabilities: | | | | | | | | | | | | |
Accounts payable | | | 4,018 | | | | 4,556 | | | | (7,763 | ) |
Cash paid for warranty repairs | | | (10,265 | ) | | | (8,015 | ) | | | (4,875 | ) |
Accrued compensation and related taxes | | | 4,504 | | | | 458 | | | | 1,786 | |
Deposits from customers | | | 3,047 | | | | 1,571 | | | | (6,482 | ) |
Payment of contingent consideration on acquisitions | | | - | | | | (1,338 | ) | | | (86 | ) |
Other current liabilities and accrued expenses | | | 1,056 | | | | (707 | ) | | | 35 | |
Taxes on income | | | (76 | ) | | | (15 | ) | | | (88 | ) |
Total adjustments | | | 14,848 | | | | 30,380 | | | | 5,477 | |
Net cash provided by operating activities | | | 23,451 | | | | 12,900 | | | | 6,506 | |
| | | | | | | | | | | | | |
Cash flows from investing activities: | | | | | | | | | | | | |
Purchases of property, plant and equipment | | | (13,410 | ) | | | (4,895 | ) | | | (3,463 | ) |
Proceeds from sale of property, plant and equipment | | | 25 | | | | 208 | | | | 648 | |
Net cash used in investing activities | | | (13,385 | ) | | | (4,687 | ) | | | (2,815 | ) |
| | | | | | | | | | | | | |
Cash flows from financing activities: | | | | | | | | | | | | |
Borrowings under credit facilities | | | - | | | | 15,244 | | | | 2,191 | |
Payments on credit facilities | | | - | | | | (15,244 | ) | | | (2,191 | ) |
Proceeds from long-term debt | | | 10 | | | | - | | | | - | |
Payments on long-term debt | | | (5,058 | ) | | | (75 | ) | | | (80 | ) |
Payment of contingent consideration on acquisitions | | | - | | | | (162 | ) | | | (162 | ) |
Purchase and retirement of common stock | | | (2,000 | ) | | | - | | | | (2,000 | ) |
Net cash used in the exercise, vesting or cancellation of stock incentive awards | | | (111 | ) | | | (375 | ) | | | (59 | ) |
Cash paid related to tax impact of stock incentive plan transactions | | | (123 | ) | | | (44 | ) | | | (100 | ) |
Payment of dividends | | | (3,444 | ) | | | (3,426 | ) | | | (3,427 | ) |
Net cash used in financing activities | | | (10,726 | ) | | | (4,082 | ) | | | (5,828 | ) |
| | | | | | | | | | | | | |
Net increase (decrease) in cash and cash equivalents | | | (660 | ) | | | 4,131 | | | | (2,137 | ) |
Cash and cash equivalents at beginning of year | | | 32,701 | | | | 28,570 | | | | 30,707 | |
Cash and cash equivalents at end of year | | $ | 32,041 | | | $ | 32,701 | | | $ | 28,570 | |
See accompanying Notes to Consolidated Financial Statements.
SPARTAN MOTORS, INC. AND SUBSIDIARIESSUBSIDIARIES
NOTES TO CONSOLIDATED FINANCIAL STATEMENTSSTATEMENTS
(Dollar amounts in thousands, except per share data)data)
NOTE 1 - GENERAL AND SUMMARY OF ACCOUNTING POLICIES
Nature of Operations. Spartan Motors, Inc. (the “Company”, “we”, or “us”) is a custom engineer and manufacturer of specialized motor vehicle chassis and bodies. The Company’sOur principal chassis markets are emergency response vehicles, motor homes and other specialty vehicles. The CompanyWe also hashave various subsidiaries that are manufacturers of bodies for various markets including emergency response vehicles and delivery and servicefleet vehicles.
Our operating activities are conducted through our wholly-owned operating subsidiary, Spartan Motors USA, Inc. (“Spartan USA”), with locations in Charlotte, Michigan; Brandon, South Dakota; Ephrata, Pennsylvania; and Bristol, Indiana, along with contract manufacturing in Kansas City, Missouri and Saltillo, Mexico. Spartan USA was formerly known as Crimson Fire, Inc.
We recently completed a corporate reorganization. On July 1, 2015, our former Spartan Motors Chassis, Inc. subsidiary (which operated our Charlotte, Michigan location) and our former Crimson Fire Aerials, Inc. subsidiary (which operated our Ephrata, Pennsylvania location) were merged into Spartan USA. On January 1, 2016, our former Utilimaster Corporation subsidiary (which operated our Bristol, Indiana location) was also merged into Spartan USA. These transactions were completed to consolidate our U.S. operations into a single subsidiary and to simplify our corporate structure.
Our Charlotte, Michigan location manufactures heavy duty chassis and vehicles and supplies aftermarket parts and accessories under the Spartan Chassis and Spartan ERV brand names. Our Brandon, South Dakota and Ephrata, Pennsylvania locations manufacture emergency response vehicles under the Spartan ERV brand name, while our Bristol, Indiana location manufactures vehicles used in the parcel delivery, mobile retail and trades and construction industries, and supplies related aftermarket parts and services under the Utilimaster brand name. Our Kansas City, Missouri and Saltillo, Mexico locations sell and install equipment used in fleet vehicles. Spartan USA is also a participant in Spartan-Gimaex Innovations, LLC (“Spartan-Gimaex”), a 50/50 joint venture with Gimaex Holding, Inc. that was formed to provide emergency response vehicles for the domestic and international markets. Spartan-Gimaex is reported as a consolidated subsidiary of Spartan Motors, Inc. In February 2015, Spartan USA and Gimaex Holding, Inc. mutually agreed to begin discussions regarding the dissolution of the joint venture. In June 2015, Spartan USA and Gimaex Holding, Inc. entered into court proceedings to determine the terms of the dissolution. In February 2017, by agreement of the parties, the court proceeding was dismissed with prejudice and the judge entered an order to this effect as the parties agreed to seek a dissolution plan on their own. No dissolution terms have been determined as of the date of this Form 10-K.
Principles of Consolidation. The consolidated financial statements include our accounts and the accounts of the Company and itsour wholly owned subsidiaries:subsidiary, Spartan Chassis, Inc. (“Spartan Chassis”), Crimson Fire, Inc. (“Crimson”), Crimson Fire Aerials, Inc. (“Crimson Aerials”), Utilimaster Corporation (“Utilimaster”) and Classic Fire, LLC (which was acquired on April 1, 2011) (“Classic Fire”). In November, 2012, Crimson entered into a joint venture with Gimaex Holding, Inc. to form Spartan-Gimaex Innovations, LLC (“Spartan-Gimaex”).USA. All intercompany transactions have been eliminated.
Non-Controlling Interest
Crimson holdsAt December 31, 2016, Spartan USA held a 50% share in Spartan-Gimaex, but hashowever, due to the management and operational structure of the joint venture, Spartan USA was considered to have had the ability to exert majority influence oncontrol the operations of Spartan-Gimaex. Accordingly, Spartan-Gimaex is reported as a consolidated subsidiary of Spartan Motors, Inc., within the Emergency Response Vehicles segment.
Use of Estimates. In the preparation of the Company’sour financial statements in accordance with U.S. generally accepted accounting
Principles (“GAAP”), management uses estimates and makes judgments and assumptions that affect asset and liability values and the amounts reported as income and expense during the periods presented. Certain of these estimates, judgments and assumptions, such as the allowance for credit losses, warranty expenses, earn-out liabilities, impairment assessments of tangible and intangible assets, and the provision for income taxes, are particularly sensitive. If actual results are different from estimates used by management, they may have a material impact on the financial statements.
Revenue Recognition. The Company recognizesWe recognize revenue in accordance with Accounting Standards Codification Topic (“ASC”) 605. Accordingly, revenue is recognized when title to the product and risk of ownership passes to the buyer. In certain instances, risk of ownership and title passes when the product has been completed in accordance with purchase order specifications and has been tendered for delivery to the customer. On certain customer requested bill and hold transactions, revenue recognition occurs afterprior to the products being delivered to the buyer. We enter into such transactions when there is a valid business reason and the buyer has committed to the purchase. At the time revenue is recognized, the customer has been notified that the products have been completed according to their specifications, the customer specifications,products have passed all of the Company’sour quality control inspections and are ready for delivery.delivery and the customer has accepted all of the risks of ownership. All sales are shown net of returns, discounts and sales incentive programs, which historically have not been significant. Rebates for certain product sales, which are known and accrued at time of sale, are reflected as a reduction of revenue. Service revenue is immaterial at less than one percent of total sales. The collectability of any related receivable is reasonably assured before revenue is recognized.
Business Combinations. When acquiring other businesses we recognize identifiable assets acquired and liabilities assumed at their acquisition date fair values, and separately from any goodwill that may be required to be recognized. Goodwill, when recognizable, is measured as the excess amount of any consideration transferred, which is measured at fair value, over the acquisition date fair values of the identifiable assets acquired and liabilities assumed. Acquisition gain, when recognizable, is measured as the excess of the acquisition date fair values of the identifiable assets acquired and liabilities assumed over the acquisition date fair value of any consideration transferred.
SPARTAN MOTORS, INC. AND SUBSIDIARIES
NOTES TO CONSOLIDATED FINANCIAL STATEMENTS
(Dollar amounts in thousands, except per share data)
Accounting for such acquisitions requires us to make significant assumptions and estimates and, although we believe any estimates and assumptions we make are reasonable and appropriate at the time they are made, unanticipated events and circumstances may arise that affect their accuracy, which may cause actual results to differ from those estimated by us. When necessary, we will adjust the values of the assets acquired and liabilities assumed against the goodwill or acquisition gain, as initially recorded, for a period of up to one year after the acquisition date.
Costs incurred to effect an acquisition, such as legal, accounting, valuation or other third party costs, as well as internal general and administrative costs incurred are charged to expense in the periods incurred.
Shipping and Handling of Products. Costs incurred related to the shipment and handling of products are classified in cost of products sold. Amounts billed to customers for shipping and handling of products are included in sales.
Cash and Cash Equivalents include cash on hand, cash on deposit, treasuries and money market funds. The Company considersWe consider all investments purchased with an original maturity of three months or less to be cash equivalents. Cash that will be required for operations within 90 days or less will be invested in money market funds or treasuries.
SPARTAN MOTORS, INC. AND SUBSIDIARIES
NOTES TO CONSOLIDATED FINANCIAL STATEMENTS
(Dollar amounts in thousands, except per share data)
Accounts Receivable. The Company’sOur receivables are subject to credit risk, and the Company doeswe do not typically require collateral on itsour accounts receivable. The Company performsWe perform periodic credit evaluations of itsour customers’ financial condition and generally requiresrequire a security interest in the products sold. Receivables generally are due within 30 to 60 days. The Company maintainsWe maintain an allowance for customer accounts that reduces receivables to amounts that are expected to be collected. In estimating the allowance for doubtful accounts, management makes certain assumptions regarding the risk of uncollectable open receivable accounts. This risk factor is applied to the balance on accounts that are aged over 90 days: generally this reserve has an estimated range from 10-25%. The risk percentage applied to the aged accounts may change based on conditions such as: general economic conditions, industry-specific economic conditions, historical and anticipated customer performance, historical experience with write-offs and the level of past-due amounts from year to year. However, generally the Company’sour assumptions are consistent year-over-year and there has been little adjustment made to the percentages used. In addition, in the event there are certain known risk factors with an open account, the Companywe may increase the allowance to include estimated losses on such “specific” account balances. The “specific” reserves are identified by a periodic review of the aged accounts receivable. If there is an account in question, credit checks are made and there is communication with the customer, along with other means to try to assess if a specific reserve is required. The inclusion of the “specific” reserve has caused the greatest fluctuation in the allowance for doubtful accounts balance historically. Past due accounts are written off when collectability is determined to be no longer assured.
Inventories are stated at the lower of first-in, first-out cost or market. Estimated inventory allowances for slow-moving inventory are based upon current assessments about future demands, market conditions and related management initiatives. If market conditions are less favorable than those projected by management, additional inventory allowances may be required.
Property, Plant and Equipment is stated at cost and the related assets are depreciated over their estimated useful lives on a straight line basis for financial statement purposes and an accelerated method for income tax purposes. Cost includes an amount of interest associated with significant capital projects. Estimated useful lives range from 20 to 31.5 years for buildings and improvements, 3 to 15 years for plant machinery and equipment, 3 to 7 years for furniture and fixtures and 3 to 5 years for vehicles. Leasehold improvements are depreciated over the shorter of the lease term or the estimated useful life of the asset. Maintenance and repair costs are charged to earnings, while expenditures that increase asset lives are capitalized. The Company reviews itsWe review our property, plant and equipment, along with all other long-lived assets that have finite lives, including finite-lived intangible assets, for impairment whenever events or changes in circumstances indicate that their carrying amounts may not be recoverable. Assets held-for-sale are recorded at the lower of historical depreciated cost or the estimated fair value less costs to sell. See Note 6, Property, Plant and Equipment for further information on our property and equipment.
Related Party Transactions. We purchase certain components used in the manufacture of our products from parties that could be considered related to us because one or more of our executive officers or board members is also an executive officer or board member of the related party. See Note 17, Related Party Transactions, for more information regarding our transactions with related parties.
SPARTAN MOTORS, INC. AND SUBSIDIARIES
NOTES TO CONSOLIDATED FINANCIAL STATEMENTS
(Dollar amounts in thousands, except per share data)
Goodwill and Other Intangible Assets. Goodwill represents the excess of the cost of a business combination over the fair value of the net assets acquired. Goodwill and intangible assets deemed to have indefinite lives are not amortized, but are subject to impairment tests on an annual basis, or whenever events or changes in circumstances indicate that the carrying value may not be recoverable. Goodwill is allocated to the reporting unit from which it was created. A reporting unit is an operating segment or sub-segment to which goodwill is assigned when initially recorded. The Company annually reviewsWe review indefinite lived intangible assets annually for impairment by comparing the carrying value of those assets to their fair value.
Other intangible assets with finite lives are amortized over their estimated useful lives and are tested for impairment whenever events or changes in circumstances indicate that their carrying amounts may not be recoverable.
The Company performs itsWe perform our annual goodwill and indefinite lived intangible assets impairment test as of October 1 and monitorsmonitor for interim triggering events on an ongoing basis. The CompanyFor goodwill we first assessesassess qualitative factors to determine whether it is more likely than not that the fair value of a reporting unit is less than its carrying amount. Under authoritative guidance, the Company iswe are not required to calculate the fair value of a reporting unit unless it determineswe determine that it is more likely than not that the fair value of the reporting unit is less than its carrying amount. The Company hasWe have the option to bypass the qualitative assessment and proceed to the first step of the two-step impairment test.
SPARTAN MOTORS, INC. AND SUBSIDIARIES
NOTES TO CONSOLIDATED FINANCIAL STATEMENTS
(Dollar amounts in thousands, except per share data)
If the Company electsIf we elect to bypass the qualitative assessment for a reporting unit, or if after completing the assessment we determine that it is determined to be more likely than not that the fair value of a reporting unit is less than its carrying value, the Company performswe perform a two-step impairment test, whereby the first step is comparing the fair value of a reporting unit with its carrying amount, including goodwill. The fair value of the reporting unit is determined by estimating the future cash flows of the reporting unit to which the goodwill relates, and then discounting the future cash flows at a market-participant-derived weighted-average cost of capital (“WACC”). In determining the estimated future cash flows, management considerswe consider current and projected future levels of income based on itsour plans for that business; business trends, prospects and market and economic conditions; and market-participant considerations. If the fair value of a reporting unit exceeds its carrying amount, goodwill of the reporting unit is considered to not be impaired and the second step of the test is not performed. The second step of the impairment test is performed whenif the carrying amount of the reporting unit exceeds the fair value, in which case the implied fair value of the reporting unit goodwill is compared with the carrying amount of that goodwill based on a hypothetical allocation of the reporting unit’s fair value to all of its underlying assets and liabilities. If the carrying amount of the reporting unit goodwill exceeds the implied fair value of that goodwill, an impairment loss is recognized in an amount equal to the excess.
The Company evaluatesWe evaluate the recoverability of itsour indefinite lived intangible assets,asset, which consistconsists of itsour Utilimaster and Classic Fire trade names,name, based on estimates of future royalty payments that are avoided through itsour ownership of the trade names,name, discounted to their present value. In determining the estimated fair value of the trade names, management considersname, we consider current and projected future levels of revenue based on itsour plans for Utilimaster, and Classic Fire, business trends, prospects and market and economic conditions.
Significant judgments inherent in these assessments and analyses include assumptions about macroeconomic and industry conditions, appropriate sales growth rates, WACC and the amount of expected future net cash flows. The judgments and assumptions used in the estimate of fair value are generally consistent with the projections and assumptions that are used in current operating plans. Such assumptions are subject to change as a result of changing economic and competitive conditions. The determination of fair value is highly sensitive to differences between estimated and actual cash flows and changes in the related discount rate used to evaluate the fair value of the reporting units and trade names.names.
See Note 6,5, Goodwill and Intangible Assets, for further details on the Company’sour goodwill and other intangible assets.
Warranties. The Company’sOur policy is to record a provision for the estimated cost of warranty-related claims at the time of the sale, and periodically adjust the warranty liability to reflect actual experience. The amount of warranty liability accrued reflects management’s best estimate of the expected future cost of honoring the Company’sour obligations under the warranty agreements. The Company’sExpense related to warranty liabilities accrued for product sales, as well as adjustments to pre-existing warranty liabilities, are reflected within Cost of products sold on our Consolidated Statements of Operations. Our estimates are based on historical experience, the number of units involved and the extent of features and components included in product models. See Note 12,10, Commitments and Contingent Liabilities, for further information regarding warranties.
Deposits from Customers. The Company receivesWe sometimes receive advance payments from customers for future product orders and recordsrecord these amounts as liabilities. SuchWe accept such deposits are accepted by the Company when presented by customers seeking improved pricing in connection with orders that are placed for products to be manufactured and sold at a future date. Deposits from customers was $18,006 and $6,386 at December 31, 2013 and 2012. The increase in 2013 is due to the election of certain customers to make deposits on orders, including a $5,000 deposit on a 70 unit fire truck order from Peru. Revenue associated with these deposits is deferred and recognized upon shipment of the related product to the customer.
SPARTAN MOTORS, INC. AND SUBSIDIARIES
NOTES TO CONSOLIDATED FINANCIAL STATEMENTS
(Dollar amounts in thousands, except per share data)
Research and Development. The Company’sOur research and development costs, which consist of compensation costs, travel and entertainment, administrative expenses and new product development among other items, are expensed as incurred.
Taxes on Income. The Company accounts for income taxes under a method that requiresWe recognize deferred income tax assets and liabilities to be recognized using enacted tax rates for the effect of temporary differences between the book and tax bases of recorded assets and liabilities. Authoritative guidance also requiresDeferred tax liabilities generally represent tax expense recognized for which payment has been deferred, or expenses which have been deducted in our tax returns but which have not yet been recognized as an expense in our financial statements.
We establish valuation allowances for deferred income tax assets in accordance with GAAP, which include stateprovides that such valuation allowances shall be established unless realization of the income tax credit carryforwards, operating loss carryforwards and deductible temporary differences, be reduced by a valuation allowance if itbenefits is more likely than not that some portion or allnot. The ultimate realization of the deferred income tax assets will not be realized.
The Company evaluatesis dependent upon the likelihood of realizing its deferred income tax assets by assessing its valuation allowance and by adjusting the amount of such allowance, if necessary. The factors used to assess the likelihood of realization are the Company’s forecastgeneration of future taxable income during the projectedperiods in which those temporary differences become deductible. At each reporting period, we consider the scheduled reversal of temporary differences anddeferred tax liabilities, available taxes in carryback periods, tax planning strategies that could be implemented to realize the net deferredand projected future taxable income tax assets.
SPARTAN MOTORS, INC. AND SUBSIDIARIES
NOTES TO CONSOLIDATED FINANCIAL STATEMENTS
(Dollar amounts in thousands, except per share data)making this assessment.
The Company recognizesWe recognize the tax benefit from an uncertain tax position only if it is more likely than not that the tax position will be sustained on examination by the taxing authorities. The determination is based on the technical merits of the position and presumes that each uncertain tax position will be examined by the relevant taxing authority that has full knowledge of all relevant information. Although management believeswe believe the estimates are reasonable, no assurance can be given that the final outcome of these matters will not be different than what is reflected in the historical income tax provisions and accruals.
Interest and penalties attributable to income taxes are recorded as a component of income taxes.
See Note 8, Taxes on Income, for further details on our income taxes.
Earnings (Loss) Per Share. Basic earnings per share is based on the weighted average number of common shares, share equivalents of stock appreciation rights (“SAR”s) and participating securities outstanding during the period. Diluted earnings per share also include the dilutive effect of additional potential common shares issuable from stock options and are determined using the treasury stock method. Basic earnings per share represents net earnings divided by basic weighted average number of common shares outstanding during the period, including the average dilutive effect of the Company’sour SARs outstanding during the period determined using the treasury stock method. Diluted earnings per share represents net earnings divided by diluted weighted average number of common shares outstanding, which includes the average dilutive effect of the Company’sour stock options outstanding during the period. The Company’sOur unvested stock awards are included in the number of shares outstanding for both basic and diluted earnings per share calculations, unless a net loss is reported, in which situation unvested stock awards are excluded from the number of shares outstanding for both basic and diluted earnings per share calculations. See Note 14,15, Earnings Per Share, for further details.
Stock Incentive Plans. Share based payment compensation costs for equity-based awards is measured on the grant date based on the fair value of the award at that date, and is recognized over the requisite service period, net of estimated forfeitures. Fair value of stock option and stock appreciation rights awards are estimated using a closed option valuation (Black-Scholes) model. Fair value of restricted stock awards is based upon the quoted market price of the common stock on the date of grant. OurThe Company’s incentive stock plans are described in more detail in Note 11,13, Stock Based Compensation.
Fair Value. The Company isWe are required to disclose the estimated fair value of itsour financial instruments. The carrying value at December 31, 20132016 and 20122015 of cash and cash equivalents, accounts receivable and accounts payable approximate their fair value due to their short term nature. The carrying value of variable rate debt instruments approximate their fair value based on their relative terms and market rates.
Reclassifications. Certain engineering costs related to routine product changes, that, prior to 2015, were classified within Research and development expense, have been classified within Cost of products sold on the Condensed Consolidated Statements of Operations in order to more consistently align the results of our individual business units. Expenses of $7,825 for 2014 have been reclassified accordingly. See our discussion on Accounting Standards Update 2015-17 below for information on reclassifications related to our adoption of this standard in 2016. Certain other immaterial amounts in the prior years’periods’ financial statements have been reclassified to conform to the current year’speriod’s presentation. These reclassifications had no impact on previously reported Net earnings (loss), Total assets, Total shareholders’ equity or cash flows.
SPARTAN MOTORS, INC. AND SUBSIDIARIES
NOTES TO CONSOLIDATED FINANCIAL STATEMENTS
(Dollar amounts in thousands, except per share data)
Segment Reporting.Reporting. The Company identifies itsWe identify our reportable segments based on itsour management structure and the financial data utilized by the chief operating decision makermakers to assess segment performance and allocate resources among the Company’sour operating units. The Company hasWe have three reportable segments: Emergency Response Vehicles, DeliveryFleet Vehicles and Service Vehicles,Services, and Specialty Chassis and Vehicles. More detailed information about theour reportable segments can be found in Note 15 -16, Business Segments.
Supplemental Disclosures of Cash Flow Information.Cash paid for interest was $311, $273$309, $374 and $273$327 for 2013, 20122016, 2015 and 2011.2014. Cash paid (received) for income taxes, net of refunds, was $370, $3,873$2,232, $(18) and $629$1,168 for 2013, 20122016, 2015 and 2011. Non-cash investing activities in 2011 included the issuance of common stock valued at $1,029 in conjunction with the acquisition of Classic Fire, LLC.2014.
New Accounting Standards
In July 2013,January 2017, the Financial Accounting Standards Board (“FASB”) issued Accounting Standards Update No. 2013-11, “Presentation of an Unrecognized Tax Benefit When a Net Operating Loss Carryforward, a Similar Tax Loss, or a Tax Credit Carryforward Exists”2017-4, Intangibles—Goodwill and Other (Topic 350): Simplifying the Test for Goodwill Impairment (“ASU 2013-11”2017-4”). ASU 2013-11 amends2017-4 eliminates the guidance relatedrequirement to determine the presentationfair value of unrecognized tax benefitsindividual assets and allowsliabilities of a reporting unit to measure goodwill impairment. Under the amendments in the new ASU, goodwill impairment testing will be performed by comparing the fair value of the reporting unit with its carrying amount and recognizing an impairment charge for the reduction of a deferred tax asset for a net operating loss (“NOL”) carryforward wheneveramount by which the NOL or tax credit carryforward would be available to reducecarrying amount exceeds the additional taxable income or tax due if the tax position is disallowed. ASU 2013-11reporting unit’s fair value. The new standard is effective for annual and interim periods forgoodwill impairment tests in fiscal years beginning after December 15, 2013,2019, and earlyshould be applied on a prospective basis. Early adoption is permitted.permitted for annual or interim goodwill impairment testing performed after January 1, 2017. We believe that that the adoption of the provisions of ASU 2017-04 will not have a material impact on our consolidated financial position, results of operations or cash flows.
In January 2017, the FASB issued Accounting Standards Update 2017-01, Business Combinations (Topic 805): Clarifying the Definition of a Business (“ASU 2017-01”), which provides guidance to entities to assist with evaluating when a set of transferred assets and activities (collectively, the "set") is a business and provides a screen to determine when a set is not a business. Under the new guidance, when substantially all of the fair value of gross assets acquired (or disposed of) is concentrated in a single identifiable asset, or group of similar assets, the assets acquired would not represent a business. Also, to be considered a business, an acquisition would have to include an input and a substantive process that together significantly contribute to the ability to produce outputs. The Company doesnew standard is effective for fiscal years, and interim periods within those fiscal years, beginning after December 15, 2017, and should be applied on a prospective basis to any transactions occurring within the period of adoption. Early adoption is permitted for interim or annual periods in which the financial statements have not been issued. We believe that the adoption of the provisions of ASU 2013-112017-01 will not have a material impact on itsour consolidated financial position, results of operations or cash flows.
In August 2016, the FASB issued Accounting Standards Update No. 2016-15, Statement of Cash Flows (Topic 230) (“ASU 2016-15”). ASU 2016-15 is intended to reduce diversity in current practice regarding the manner in which certain cash receipts and cash payments are presented and classified in the cash flow statement. ASU 2016-15 is effective for fiscal years beginning after December 15, 2017, including interim periods within those fiscal years. Early adoption is permitted. We believe that that the adoption of the provisions of ASU 2016-15 will not have a material impact on our consolidated financial position, results of operations or cash flows.
In June 2016, the FASB issued Accounting Standards Update 2016-13, Financial Instruments - Credit Losses: Measurement of Credit Losses on Financial Instruments ("ASU 2016-13"). ASU 2016-13 is intended to introduce a revised approach to the recognition and measurement of credit losses, emphasizing an updated model based on expected losses rather than incurred losses. The provisions of this standard are effective for reporting periods beginning after December 15, 2019 and early adoption is permitted. We believe that that the adoption of the provisions of ASU 2016-13 will not have a material impact on our consolidated financial position, results of operations or cash flows.
In March 2016, the FASB issued Accounting Standards Update No. 2016-09, Compensation – Stock Compensation (“ASU 2016-09”). ASU 2016-09 simplifies the accounting for a stock payment’s tax consequences by requiring the recognition of the income tax effects of awards in the income statement when the awards vest or are settled. It also allows a company to elect to account for forfeitures as they occur rather than on an estimated basis and revises the classification of certain tax payments related to stock compensation on the statement of cash flows. ASU 2016-09 is effective for fiscal years beginning after December 15, 2016, including interim periods within those fiscal years. Early adoption is permitted. The impact of our adoption of ASU 2016-09 for the year ending December 31, 2017 will depend on market factors and the timing and intrinsic value of future stock based compensation award vesting.
SPARTAN MOTORS, INC. AND SUBSIDIARIESSUBSIDIARIES
NOTES TO CONSOLIDATED FINANCIAL STATEMENTSSTATEMENTS
(Dollar amounts in thousands, except per share data)data)
In February 2016, the Financial Accounting Standards Board (“FASB”) issued Accounting Standards Update No. 2016-02, Leases (“ASU 2016-02”). The new standard establishes a right-of-use (“ROU”) model that requires a lessee to record a ROU asset and a lease liability on the balance sheet for all leases with terms longer than 12 months. Leases will be classified as either finance or operating, with classification affecting the pattern of expense recognition in the income statement. The new standard is effective for fiscal years beginning after December 15, 2018, including interim periods within those fiscal years. A modified retrospective transition approach is required for lessees for capital and operating leases existing at, or entered into after, the beginning of the earliest comparative period presented in the financial statements, with certain practical expedients available. We are currently evaluating the impact of our pending adoption of ASU 2016-02 on our consolidated financial position, results of operations or cash flows.
In November 2015, the FASB issued Accounting Standards Update 2015-17, Income Taxes (Topic 740), Balance Sheet Classification of Deferred Taxes (“ASU 2015-17”). ASU 2015-17 requires net deferred tax assets and liabilities to be classified as non-current on the Consolidated Balance Sheets. Prior to adoption of the new standard, net deferred tax assets and liabilities were presented separately as current and non-current on the Consolidated Balance Sheets. ASU 2015-17 is effective for financial statements issued for annual periods beginning after December 15, 2016 and interim periods within those annual periods. Early adoption is permitted. We retrospectively adopted ASU 2015-17 as of the second quarter of 2016. As a result, we reclassified $3,164 of Deferred income tax assets (current) to Deferred income taxes, net (non-current) and $2,520 from Deferred income tax liabilities to Deferred income taxes, net. The December 31, 2015 balances in Total current assets decreased by $3,164, Other assets increased by $644 and Total assets and Total liabilities both decreased by $2,520.
In July 2015, the FASB issued Accounting Standards Update 2015-11, Inventory (Topic 330) – Simplifying the Measurement of Inventory (“ASU 2015-11”). ASU 2015-11 requires entities that measure inventory using the FIFO or average cost methods to measure inventory at the lower of cost or net realizable value to more closely align the measurement of inventory in GAAP with International Financial Reporting Standards. Net realizable value is defined as estimated selling price in the ordinary course of business less reasonably predictable costs of completion and disposal. ASU 2015-11 is effective for public business entities for fiscal years, and for interim periods within those fiscal years, beginning after December 15, 2016. We do not believe the adoption of ASU 2015-11 will have a material impact on our consolidated financial position, results of operations or cash flows.
In February 2015, the FASB issued Accounting Standards Update 2015-02Consolidation (Topic 810), Amendments to the Consolidation Analysis (“ASU 2015-02”). ASU 2015-02 modifies the analysis that a reporting entity must perform to determine whether it should consolidate certain types of legal entities. The amendments under the new guidance modify the evaluation of whether limited partnerships and similar legal entities are variable interest entities (“VIEs”) or voting interest entities, eliminate the presumption that a general partner should consolidate a limited partnership and affect the consolidation analysis of reporting entities that are involved with VIEs. ASU 2015-02 is effective for public business entities for fiscal years, and for interim periods within those fiscal years, beginning after December 15, 2015. Early adoption is permitted. The adoption of the provisions of ASU 2015-02 had no impact on our consolidated financial position, results of operations or cash flows.
In May 2014, the FASB issued Accounting Standards Update 2014-09, Revenue from Contracts with Customers (Topic 606) (“ASU 2014-09”). ASU 2014-09 is based on the principle that revenue should be recognized to depict the transfer of goods or services to customers in an amount that reflects the consideration to which the entity expects to be entitled in exchange for those goods or services. The new standard also requires additional disclosure about the nature, amount, timing and uncertainty of revenue and cash flows arising from customer contracts, including significant judgments and changes in judgments and assets recognized from costs incurred to obtain or fulfill a contract. ASU 2014-09 is effective for annual reporting periods beginning after December 15, 2017, including interim periods within that reporting period, and may be applied retrospectively to each prior period presented or retrospectively with the cumulative effect recognized as of the date of initial application. Early adoption for annual reporting periods beginning after December 15, 2016 is permitted. On August 12, 2015, FASB delayed the effective date to give companies an extra year to implement the standard. The standard will be effective in 2018, but companies will have the option of adopting it as of the original 2017 effective date. We have begun the process of analyzing the impact of ASU 2014-09 and the related ASU’s across all revenue streams to evaluate the impact of the new standard on revenue contracts. Based on the analysis completed to date, we expect the impact on our accounting for revenue to remain substantially unchanged. We currently expect to adopt the new standard using the modified retrospective approach, under which the cumulative effect of the initial application of the new guidance will be recognized as an adjustment to the opening balance of retained earnings, in the first quarter of 2018.
SPARTAN MOTORS, INC. AND SUBSIDIARIES
NOTES TO CONSOLIDATED FINANCIAL STATEMENTS
(Dollar amounts in thousands, except per share data)
In March 2016, the FASB issued Accounting Standards Update No. 2016-08, Revenue from Contracts with Customers (Topic 606), Principal versus Agent Considerations (Reporting Revenue Gross versus Net) (“ASU 2016-08”). ASU 2016-08 clarifies the implementation guidance for principal-versus-agent considerations in the revenue recognition standard. A principal-versus-agent consideration applies to sales that involve two or more suppliers to a customer. Each participant in the sale must determine whether they control the good or service and are entitled to the gross amount of the transaction or are acting as an agent and should collect only a fee or commission for arranging the sale. ASU 2016-08 will go into effect when the revenue standard issued in ASU 2014-09 becomes effective.
In April 2016, the FASB issued Accounting Standards Update No. 2016-10, Revenue from Contracts with Customers (Topic 606), Identifying Performance Obligations and Licensing (“ASU 2016-10”). ASU 2016-10 clarifies the implementation guidance in Topic 606 for identifying performance obligations and determining when to recognize revenue on licensing agreements for intellectual property. ASU 2016-10 removes the requirement to assess whether promised goods or services are performance obligations if they are immaterial to the contract with the customer and allows an entity to elect to account for shipping and handling activities that occur after the customer has obtained control of a good as an activity to fulfill the promise to transfer the good rather than as an additional promised service. ASU 2016-10 also includes implementation guidance on determining whether a license granted by an entity provides a customer with a right to use the intellectual property, which is satisfied at a point in time, or a right to access the intellectual property, which is satisfied over time. ASU 2016-10 will go into effect when the revenue standard issued in ASU 2014-09 becomes effective.
In May 2016, the FASB issued Accounting Standards Update No. 2016-12, Revenue from Contracts with Customers (Topic 606), Narrow-Scope Improvements and Practical Expedients (“ASU 2016-12”). ASU 2016-12 clarifies the implementation guidance on assessing collectability, presentation of sales taxes, non-cash consideration and completed contracts and contract modifications at transition. ASU 2016-12 will go into effect when the revenue standard issued in ASU 2014-09 becomes effective.
NOTE 2 – ACQUISITION ACTIVITIES (Subsequent Event)
On AprilJanuary 1, 2011,2017, we completed the Company completed its acquisition of substantially all of the assets and relatedcertain liabilities of ClassicSmeal Fire Apparatus Co., Smeal Properties, Inc., Ladder Tower Co., and U.S. Tanker Co. pursuant to a manufacturer of emergency response vehiclesPurchase Agreement dated December 12, 2016. When used in these Notes, “ Smeal” refers to the assets, liabilities and fire apparatus. The acquisition of Classic Fire has allowed the Company to expand its offerings in the emergency response vehicles market into segments and price points that complement its offeringsoperations acquired from Spartan Chassis, Crimson and Crimson Aerials, as well as provide strategic sourcing of pump modules and other technology. Classic Fire is reported as a component of the Company’sthese entities. Smeal will be included within our Emergency Response Vehicles segment.
This acquisition will bring significant scale to our Emergency Response Vehicles segment, expand the geographic reach of our dealer network and add complementary products to our existing emergency response product portfolio.
SPARTAN MOTORS, INC. AND SUBSIDIARIES
NOTES TO CONSOLIDATED FINANCIAL STATEMENTS
(Dollar amounts in thousands, except per share data)
Purchase Price
The pro forma effectestimated total purchase price paid for our acquisition of Smeal was $42,550. The consideration paid consisted of $28,958 in cash, net of cash acquired of $3,825, and the acquisition onforgiveness of certain liabilities owed by the Company’s resultsformer owners of operationsSmeal to the Company in the amount of $7,397. Pursuant to the purchase agreement, the sellers may receive additional consideration in the form of a tax gross-up payment, which is payable no later than April 1, 2018, and is not material.expected to exceed $2,400. The consideration paid is subject to certain post-closing adjustments, including a net working capital adjustment that we expect to finalize in the second quarter of 2017.
The revenue and earnings of Classic Fire, included in the Company’s results since the April 1, 2011 acquisition, and acquisition related expenses included in the Company’s Consolidated Statements of Operations are not material.
This acquisition waswill be accounted for using the purchase method of accounting andwith the purchase price was allocated to the assets purchased and liabilities assumed based upon their estimated fair values at the date of acquisition. Identifiable intangible assets acquired include a trade name, customer and dealer relationships, unpatented technology and certain non-compete agreements. The excess purchase price over the net tangible and intangible assets acquired of $2,397 was recorded as goodwill, which is expected to be deductible for tax purposes. See Note 6Goodwill and Intangible Assets for further information on the Company’s goodwill. The purchase price consisted of cash consideration of $3,975, net of cash acquired of $25, paid by the Company at closing; a working capital adjustment of $771; Spartan Motors, Inc. common stock valued at $1,029 and a contingency for certain performance-based earn out payments recorded at $180, discounted to April 1, 2011. The performance-based earn out payments provided for additional consideration, up to a maximum amount of $1,000 that could have been paid to the sellers of Classic Fire. No payments were made, and no payments will be required to be made under this earn-out agreement. During the year ended December 31, 2012, the Company recorded an adjustment to operating expenses of $(83) to bring the contingent liability to $0 based on the expected future payment amounts. During the year ended December 31, 2011, the Company recorded an adjustment to operating expenses of $(97) to bring the contingent liability to $83 based on the expected future payment amounts, discounted to December 31, 2011.
The purchase price was allocatedWe are unable to present the supplemental pro forma revenue and earnings of the Spartan and Smeal combined entity as of January 1, 2016 because the full year 2016 financial statements for Smeal Fire Apparatus Co. and subsidiaries are not yet available. We are unable to present the amounts of the assets acquired and liabilities assumed recognized at the acquisition date as follows:
Cash and cash equivalents | | $ | 25 | |
Accounts receivable | | | 635 | |
Inventory | | | 1,352 | |
Other current assets | | | 7 | |
Property, plant and equipment | | | 451 | |
Intangible assets | | | 1,650 | |
Goodwill | | | 2,397 | |
Total assets acquired | | | 6,517 | |
| | | | | |
| | | | | |
Accounts payable | | | 186 | |
Accrued warranty | | | 140 | |
Other current liabilities | | | 31 | |
Other non-current liabilities | | | 180 | |
Total liabilities assumed | | | 537 | |
| | | | | |
Total purchase price | | $ | 5,980 | |
The Company leases the land and building that houses the operations of Classic Fire, from an entity that is controlled by the sellers of Classic Fire, under an operating lease with an initial term of three years. The lease contains options allowing the Company to renew the lease for an additional three year term, or purchase the property at a fixed price at any time during the initial lease period or the renewal period, if any. For purchase accounting purposes, the Company recorded an unfavorable lease liability valued at $180 at April 1, 2011. For the years ended December 31, 2013, 2012 and 2011, the Company accreted $60, $60valuation are in a preliminary stage and $45 to earnings as amortization of this liability.have not been audited.
SPARTAN MOTORS, INC. AND SUBSIDIARIESSUBSIDIARIES
NOTES TO CONSOLIDATED FINANCIAL STATEMENTSSTATEMENTS
(Dollar amounts in thousands, except per share data)data)
Financing for the Acquisition
Our acquisition ofNOTE 3 – INVENTORIES Smeal was financed using $32,800 borrowed from our existing $100 million line of credit, as set forth in the Second Amended and Restated Credit Agreement, dated as of October 31, 2016, by and among us and our affiliates, as borrowers; certain lenders; Wells Fargo Bank, National Association, as Administrative Agent; and Wells Fargo Securities, LLC, as Sole Lead Arranger and Sole Bookrunner.
Acquisition Related Expenses
During 2016, we recorded pretax charges totaling $882 for legal expenses and other transaction costs related to the acquisition. These charges, which were expensed in accordance with the accounting guidance for business combinations, were recorded in “Selling, general and administrative” and reflected within the “Other” column in the 2016 business segment table in Note 16, Business Segments. We expect to incur expenses totaling approximately $600 during 2017 for additional transaction and integration costs related to the acquisition.
Inventories are summarized as follows:
| | | December 31, | |
| | | 2013 | | | 2012 | |
| | | | | | | | | |
Finished goods | | $ | 17,168 | | | $ | 15,276 | |
Work in process | | | 25,453 | | | | 11,967 | |
Raw materials and purchased components | | | 41,093 | | | | 43,404 | |
Reserve for slow-moving inventory | | | (2,295 | ) | | | (3,056 | ) |
| | | | | | | | | |
Total Inventory | | $ | 81,419 | | | $ | 67,591 | |
NOTE 3 – INVENTORIES
Inventories are summarized as follows: | | December 31, | |
| | | 2016 | | | 2015 | |
| | | | | | | | | |
Finished goods | | $ | 12,743 | | | $ | 16,812 | |
Work in process | | | 14,063 | | | | 11,691 | |
Raw materials and purchased components | | | 35,458 | | | | 35,285 | |
Reserve for slow-moving inventory | | | (3,368 | ) | | | (3,230 | ) |
| | | | | | | | | |
Total Inventory | | $ | 58,896 | | | $ | 60,558 | |
Included in the “Raw materials and purchased components” line item above at December 31, 2013 and 2012 is $423 and $9,626, for transitional engines purchased for the 2013 engine emissions change.
The CompanyWe also hashave a number of demonstration units as part of itsour sales and training program. These demonstration units are included in the “Finished goods” line item above, and amounted to $8,861$3,558 and $9,653$2,857 at December 31, 20132016 and 2012.2015. When the demonstration units are sold, the cost related to the demonstration unit is included in Cost of products sold on the Company’sour Consolidated Statements of Income.
Work in process inventory increased from December 31, 2012 primarily due to supplier issues that delayed the final production of units in the Delivery and Service Vehicle segment.
NOTE 4 - PROPERTY, PLANT AND EQUIPMENTOperations.
Property, plant and equipment are summarized by major classifications as follows:
| | | December 31, | |
| | | 2013 | | | 2012 | |
| | | | | | | | | |
Land and improvements | | $ | 4,778 | | | $ | 4,570 | |
Buildings and improvements | | | 59,170 | | | | 56,931 | |
Plant machinery and equipment | | | 35,357 | | | | 28,401 | |
Furniture and fixtures | | | 15,899 | | | | 15,959 | |
Vehicles | | | 2,888 | | | | 3,034 | |
Construction in process | | | 2,947 | | | | 10,355 | |
Subtotal | | | 121,039 | | | | 119,250 | |
Less accumulated depreciation | | | (66,761 | ) | | | (60,128 | ) |
Total property, plant and equipment, net | | $ | 54,278 | | | $ | 59,122 | |
At December 31, 2013 and December 31, 2012, one building at the Wakarusa, Indiana facility was recorded as held-for-sale at its estimated selling price less costs to sell.
During the year ended December 31, 2013, the Company incurred impairment charges of $344, which is recorded within Selling, general and administrative expense on the Company’s Consolidated Statement of Operations, to write down the value of its remaining building in Wakarusa, Indiana, which is classified as held-for-sale, to its current estimated selling price, less costs to sell.
During 2012, the Company engaged in certain restructuring activities related to the move of its Delivery and Service Vehicles operations from its Wakarusa, Indiana campus to a leased facility in Bristol, Indiana. These restructuring activities included the write down of $5,468 for buildings and equipment at the Company’s Wakarusa, Indiana campus that were reclassified as held-for-sale in 2012. On December 31, 2012 the Company completed the sale of certain buildings and the associated land at its Wakarusa, Indiana facility and recorded an immaterial loss on the sale. The terms of the sale include the receipt by the Company of a note receivable of $2,500, recorded within other current assets on the Company’s Consolidated Balance Sheet at December 31, 2012. The note matured, and was collected, during the first half of 2013, leaving a balance of $0 at December 31, 2013.
There were no capitalized interest costs in 2013 or 2012.
SPARTAN MOTORS, INC. AND SUBSIDIARIESSUBSIDIARIES
NOTES TO CONSOLIDATED FINANCIAL STATEMENTSSTATEMENTS
(Dollar amounts in thousands, except per share data)data)
NOTE 4 – RESTRUCTURING CHARGES
During NOTE 5 - LEASESeach of 2016, 2015 and 2014, we incurred restructuring charges related to the relocation of our Ocala, Florida manufacturing operations to our Charlotte, Michigan and Brandon, South Dakota facilities, along with efforts undertaken to upgrade production processes at our Brandon, South Dakota and Ephrata, Pennsylvania locations.
The Company leases certain office equipment, computer hardware, manufacturing equipment and manufacturing and warehouse space under operating lease agreements. These lease agreements include manufacturing and office spaceRestructuring charges included in Bristol, Indiana that is leased under a ten year lease agreement commencing March 1, 2012 at a rental rateour Consolidated Statements of $60 per month. Leases generally provide that the Company shall pay the cost of utilities, insurance, taxes and maintenance. Rent expenseOperations for the years ended December 31, 2013, 20122016, 2015 and 2011 was $ 2,600, $2,205 and $1,201.
Future minimum operating lease commitments under non-cancelable leases2014, which were all related to our Emergency Response Vehicles segment, are as follows:
Year | | Future Minimum Operating Lease Payments | |
2014 | | $ | 1,687 | |
2015 | | | 1,297 | |
2016 | | | 1,059 | |
2017 | | | 1,038 | |
2018 | | | 873 | |
Thereafter | | | 2,264 | |
| | | | | |
Total | | $ | 8,218 | |
| | | December 31, 2016 | | | December 31, 2015 | | | December 31, 2014 | |
Cost of products sold | | | | | | | | | | | | |
Inventory impairment | | $ | - | | | $ | 345 | | | $ | 584 | |
Relocation/retention costs | | | - | | | | - | | | | 93 | |
Production relocation/equipment impairment | | | 136 | | | | 174 | | | | - | |
Accrual for severance | | | - | | | | - | | | | 131 | |
Total cost of products sold | | | 136 | | | | 519 | | | | 808 | |
| | | | | | | | | | | | | |
General and Administrative | | | | | | | | | | | | |
Manufacturing process reengineering | | | 959 | | | | 2,336 | | | | 1,017 | |
Relocation/retention costs | | | - | | | | - | | | | 298 | |
Accrual for severance | | | - | | | | - | | | | 34 | |
Total general and administrative | | | 959 | | | | 2,336 | | | | 1,349 | |
Total restructuring | | $ | 1,095 | | | $ | 2,855 | | | $ | 2,157 | |
The Company leases certain office equipment, computer hardware and material handling equipment under capital lease agreements. Cost and accumulated depreciation of capitalized leased assets included in machinery and equipment are $732 and $393, respectively, at December 31, 2013. Future minimum capital lease commitments under non-cancelable leases are as follows:
Year | | Future Minimum Capital Lease Payments | |
2014 | | $ | 96 | |
2015 | | | 71 | |
2016 | | | 71 | |
2017 | | | 71 | |
2018 | | | 44 | |
Thereafter | | | 33 | |
| | | | | |
Total lease obligations, including imputed interest | | | 386 | |
| | | | | |
Less imputed interest charges | | | (46 | ) |
| | | | | |
Total outstanding capital lease obligations | | $ | 340 | |
NOTE 65 – GOODWILL AND INTANGIBLE ASSETS
Goodwill
WeThe Company tests test goodwill for impairment at the reporting unit level on an annual basis as of October 1, or whenever an event or change in circumstances occurs that would more likely than not reduce the fair value of a reporting unit below its carrying amount. See “Goodwill and Other Intangible Assets” within Note 1,General and Summary of Accounting Policies for a description of the Company’sour accounting policies regarding goodwill and other intangible assets.
SPARTAN MOTORS, INC. AND SUBSIDIARIES
NOTES TO CONSOLIDATED FINANCIAL STATEMENTS
(Dollar amounts in thousands, except per share data)
At December 31, 2012 the Company2016 and 2015, we had recorded goodwill at its Crimson, Classic Fireour Fleet Vehicles and Utilimaster subsidiaries. Crimson and Classic Fire are components of the Company’s Emergency Response Vehicles reportable segment, which was determined to be a reporting unit for goodwill impairment testing under relevant authoritative guidance. Utilimaster comprises the Delivery and Service VehiclesServices reportable segment, which was also determined to be a reporting unit for goodwill impairment testing. The goodwill recorded in the Emergency ResponseFleet Vehicles and Delivery and Service Vehicles& Services reporting unitsunit was evaluated for impairment as of October 1, 20132016 using a discounted cash flow valuation.
The estimated fair value of the Company’s Deliveryour Fleet Vehicles and Service VehiclesServices reporting unit exceeded its carrying value by approximately 12%115% in 2013,2016, indicating that the goodwill was not impaired. Based on the discounted cash flow valuation at October 1, 2013,2016, an increase in the weighted average cost of capital (“WACC”) used for the DeliveryFleet Vehicles and Service VehiclesServices reporting unit of approximately 160500 basis points would not result in impairment. As discussed in Note 1,General and Summary of Accounting Policies, there are significant judgments inherent in the Company’sour impairment assessments and discounted cash flow analyses. These discounted cash flow analyses are most sensitive to the WACC assumption.
The Company’s 2012 goodwill impairment test for the Emergency Response Vehicles reporting unit indicated no impairment. However, its 2013 impairment test, as of October 1, 2013, indicated that the reporting unit’s carrying cost exceeded its estimated fair value, requiring the Company to compare the carrying value of this goodwill to its implied fair value, resulting
SPARTAN MOTORS, INC. AND SUBSIDIARIES
NOTES TO CONSOLIDATED FINANCIAL STATEMENTS
(Dollar amounts in a non-cash impairment charge of $4,854 being recorded during the quarter ended December 31, 2013. While the Company believes that the future profitability of its Emergency Response Vehicles reporting unit is likely, the impairment reflects the failure of the Company to reverse the ongoing operating losses of this reporting unit over the past three years, and the inability to definitively demonstrate the reporting unit’s ability to generate sufficient cash flow, on a discounted basis, to cover the carrying cost of its assets. The assumptions used to estimate the fair value of the Emergency Response Vehicles reporting unit in 2013 reflect our current outlook for the reporting unit, which was revised as a result of the failure to meet forecasts. This revised outlook reflects lowered expectations for future growth in revenue and operating income than the estimates used in the 2012 goodwill impairment analysis for this reporting unit.thousands, except per share data)
The Company’sOur goodwill by reportable segment is as follows (amounts in thousands):follows:
| | | Emergency Response Vehicles | | | Fleet Vehicles & Services | | | Total | |
| | | December 31, | | | December 31, | | | December 31, | |
| | | 2016 | | | 2015 | | | 2016 | | | 2015 | | | 2016 | | | 2015 | |
Goodwill, beginning of year | | $ | - | | | $ | - | | | $ | 15,961 | | | $ | 15,961 | | | $ | 15,961 | | | $ | 15,961 | |
| | | | | | | | | | | | | | | | | | | | | | | | | |
Impairment losses during the year | | | - | | | | - | | | | - | | | | - | | | | - | | | | - | |
Goodwill, end of year | | $ | - | | | $ | - | | | $ | 15,961 | | | $ | 15,961 | | | $ | 15,961 | | | $ | 15,961 | |
| | | | | | | | | | | | | | | | | | | | | | | | | |
Acquired goodwill | | $ | 4,854 | | | $ | 4,854 | | | $ | 15,961 | | | $ | 15,961 | | | $ | 20,815 | | | $ | 20,815 | |
Accumulated impairment | | | (4,854 | ) | | | (4,854 | ) | | | - | | | | - | | | | (4,854 | ) | | | (4,854 | ) |
Goodwill, net | | $ | - | | | $ | - | | | $ | 15,961 | | | $ | 15,961 | | | $ | 15,961 | | | $ | 15,961 | |
| | | Emergency Response Vehicles December 31, | | | Delivery and Service Vehicles December 31, | | | Total December 31, | |
| | | 2013 | | | 2012 | | | 2013 | | | 2012 | | | 2013 | | | 2012 | |
Goodwill, beginning of period | | $ | 4,854 | | | $ | 4,854 | | | $ | 15,961 | | | $ | 15,961 | | | $ | 20,815 | | | $ | 20,815 | |
Impairment losses during the period | | | (4,854 | ) | | | - | | | | - | | | | - | | | | (4,854 | ) | | | - | |
Goodwill, end of period | | $ | - | | | $ | 4,854 | | | $ | 15,961 | | | $ | 15,961 | | | $ | 15,961 | | | $ | 20,815 | |
| | | | | | | | | | | | | | | | | | | | | | | | | |
Acquired goodwill | | $ | 4,854 | | | $ | 4,854 | | | $ | 15,961 | | | $ | 15,961 | | | $ | 20,815 | | | $ | 20,815 | |
Accumulated impairment | | | (4,854 | ) | | | - | | | | - | | | | - | | | | (4,854 | ) | | | - | |
Goodwill, net | | $ | - | | | $ | 4,854 | | | $ | 15,961 | | | $ | 15,961 | | | $ | 15,961 | | | $ | 20,815 | |
Fleet Vehicles and Services segment intangible assets
The Company hasAt December 31, 2016, we had other intangible assets associated with its Utilimasterour Fleet Vehicles and Classic Fire subsidiaries,Services segment, including customer and dealer relationships, non-compete agreements, unpatented technology, an acquired product development project and a trade names.name. The non-compete agreement, unpatented technology, in-process research andacquired product development project and certain other intangible assets resulting from the Classic Fire and Utilimaster acquisitions are being amortized over their expected remaining useful lives based on the pattern of estimated of after-tax operating income generated, or on a straight-line basis. The Company’sOur Utilimaster trade name has an indefinite life, and Classic Fire trade names have indefinite lives, and areis not amortized. The Company tests itsWe test our trade namesname for impairment at least annually, and teststest other intangible assets for impairment if impairment indicators are present.
SPARTAN MOTORS, INC. AND SUBSIDIARIES
NOTES TO CONSOLIDATED FINANCIAL STATEMENTS
(Dollar amounts in thousands, except per share data)
As described above, during its annual goodwill impairment test at October 1, 2013 the Company determined that the goodwill of its Emergency Response Vehicles reporting unit was impaired, which the Company considered to be an impairment indicator for the intangible assets, and other long-lived assets, of the Emergency Response Vehicles reporting unit. During the fourth quarter of 2013, the Company conducted an impairment analysis on these assets, including the intangible assets of its Classic Fire subsidiary and found that the carrying cost of these assets was recoverable, and that the assets, accordingly, are not impaired.
The CompanyWe tested itsour Utilimaster and Classic Fire trade namesname for impairment, as of October 1, 20132016 and 2012,2015, by estimating the fair value of the trade namesname based on estimates of future royalty payments that are avoided through itsour ownership of the trade names,name, discounted to their present value. The estimated fair value of the Company’sour Utilimaster trade name at October 1, 20132016 exceeded its carrying cost by 85%. The estimated fair value of the Company’s Classic Fire trade name at October 1, 2013 exceeded its carrying cost by 187%505%. Accordingly, there was no impairment recorded on eitherthis trade name. Based on the discounted cash flow valuation at October 1, 2016, an increase in the WACC used for this impairment analysis of 500 basis points would not result in impairment of the trade name.
Emergency Response Vehicles segment intangible assets
During the three months ended September 30, 2015, we determined that, based on updated sales forecasts for our Classic line of emergency response vehicles, it is more likely than not that our Classic Fire trade name intangible asset was impaired. Accordingly, we conducted an impairment test by comparing the discounted future cash flows expected to result from our ownership of the trade name with its carrying cost at September 30, 2015. The result of this analysis showed that the carrying cost of the Classic Fire trade name exceeded its fair value and the balance was entirely written off.
During the three months ended September 30, 2015, we determined that an asset group related to certain locations of our Emergency Response Vehicles segment may be impaired due to operating losses recorded in recent years, along with uncertainty regarding future financial performance at these locations. Accordingly, we conducted an impairment test on this asset group as of September 30, 2015 by comparing the non-discounted cash flows expected to result from the use and eventual disposition of the asset group with its carrying value, which resulted in a determination that the asset group was impaired.
SPARTAN MOTORS, INC. AND SUBSIDIARIES
NOTES TO CONSOLIDATED FINANCIAL STATEMENTS
(Dollar amounts in thousands, except per share data)
We estimated the fair value of the intangible assets of this asset group by determining the discounted cash flows associated with benefits that we will receive or expenses we will avoid as a result of our ownership of these trade names.intangible assets. Impairment charges recorded within General and administrative in the Condensed Consolidated Statement of Operations to adjust the carrying cost of these long-lived intangible assets to their estimated fair value at September 30, 2015 are as follows:
Asset Description | | Impairment Charge | |
Customer relationships | | $ | 224 | |
Non-patented technology | | | 209 | |
Classic Fire trade name | | | 560 | |
Total General and administrative | | $ | 993 | |
The Company recorded $958, $891 and $653 of intangible asset amortization expense during 2013, 2012 and 2011.
The following table provides information regarding the Company’sour other intangible assets:
| | | | | | | As of December 31, 2013 | | | As of December 31, 2012 | | | As of December 31, 2016 | | | As of December 31, 2015 | |
| | | Weighted average amortization period (years) | | | Gross carrying amount | | | Accumulated amortization | | | Net | | | Gross carrying amount | | | Accumulated amortization | | | Net | | | Gross carrying amount | | | Accumulated amortization | | | Net | | | Gross carrying amount | | | Accumulated amortization | | | Net | |
Customer and dealer relationships | | | 18 | | | $ | 6,760 | | | $ | 2,268 | | | $ | 4,492 | | | $ | 6,760 | | | $ | 1,522 | | | $ | 5,238 | | | $ | 6,170 | | | $ | 3,348 | | | $ | 2,822 | | | $ | 6,170 | | | $ | 2,986 | | | $ | 3,184 | |
Acquired product development project | | | 20 | | | | 1,860 | | | | 128 | | | | 1,732 | | | | 1,860 | | | | 51 | | | | 1,809 | | | | 1,860 | | | | 1,167 | | | | 693 | | | | 1,860 | | | | 821 | | | | 1,039 | |
Unpatented technology | | | 10 | | | | 380 | | | | 105 | | | | 275 | | | | 380 | | | | 67 | | | | 313 | | |
Non-compete agreements | | | 6 | | | | 520 | | | | 355 | | | | 165 | | | | 520 | | | | 258 | | | | 262 | | | | 400 | | | | 400 | | | | - | | | | 400 | | | | 400 | | | | - | |
| | | | | | | | | | | | | | | | | | | | |
Backlog | | less than 1 | | | | 320 | | | | 320 | | | | - | | | | 320 | | | | 320 | | | | - | | | | 320 | | | | 320 | | | | - | | | | 320 | | | | 320 | | | | - | |
| | | | | | | | | | | | | | | | | | | | |
Trade Names | | indefinite | | | | 3,430 | | | | - | | | | 3,430 | | | | 3,430 | | | | - | | | | 3,430 | | | | 2,870 | | | | - | | | | 2,870 | | | | 2,870 | | | | - | | | | 2,870 | |
| | | | | | | $ | 13,270 | | | $ | 3,176 | | | $ | 10,094 | | | $ | 13,270 | | | $ | 2,218 | | | $ | 11,052 | | | | | | | | | | | | | | | | | | | | | | | | | |
| | | | $ | 11,620 | | | $ | 5,235 | | | $ | 6,385 | | | $ | 11,620 | | | $ | 4,527 | | | $ | 7,093 | |
We recorded $708, $872 and $1,136 of intangible asset amortization expense during 2016, 2015 and 2014.
The estimated remaining amortization associated with finite-lived intangible assets is expected to be expensed as follows:
| | | Amount | | | Amount | |
| | | | | | | | | |
2014 | | $ | 870 | | |
2015 | | | 776 | | |
2016 | | | 599 | | |
2017 | | | 570 | | |
2018 | | | 548 | | |
2017 | | | $ | 683 | |
2018 | | | | 666 | |
2019 | | | | 299 | |
2020 | | | | 273 | |
2021 | | | | 249 | |
Thereafter | | | 3,301 | | | | 1,345 | |
| | | $ | 6,664 | | |
Total | | | $ | 3,515 | |
SPARTAN MOTORS, INC. AND SUBSIDIARIESSUBSIDIARIES
NOTES TO CONSOLIDATED FINANCIAL STATEMENTSSTATEMENTS
(Dollar amounts in thousands, except per share data)data)
NOTE 6 - PROPERTY, PLANT AND EQUIPMENT
Property, plant and equipment are summarized by major classifications as follows:
| | | December 31, | |
| | | 2016 | | | 2015 | |
Land and improvements | | $ | 8,049 | | | $ | 5,538 | |
Buildings and improvements | | | 63,418 | | | | 59,371 | |
Plant machinery and equipment | | | 34,879 | | | | 35,395 | |
Furniture and fixtures | | | 12,954 | | | | 15,897 | |
Vehicles | | | 2,912 | | | | 2,949 | |
Construction in process | | | 7,876 | | | | 5,566 | |
Subtotal | | | 130,088 | | | | 124,716 | |
Less accumulated depreciation | | | (76,972 | ) | | | (77,396 | ) |
Total property, plant and equipment, net | | $ | 53,116 | | | $ | 47,320 | |
We recorded depreciation expense of $7,195, $6,565 and $7,242 during 2016, 2015 and 2014. There were no capitalized interest costs in 2016 or 2015.
Construction in progress includes $6,624 and $4,604 at December 31, 2016 and 2015 for the implementation of our ERP system, which has been delayed from its original targeted go-live dates of 2013 through 2015. Work continues on the system, which is now expected to go live in phases in 2017 and 2018.
We review our long-lived assets that have finite lives for impairment whenever events or changes in circumstances indicate that their carrying amounts may not be recoverable.
When reviewing long-lived assets for impairment, we group our long-lived assets with other assets and liabilities at the lowest level for which identifiable cash flows are largely independent of the cash flows of other assets and liabilities. During the three months ended September 30, 2016 and 2015, we determined that an asset group related to certain locations of our Emergency Response Vehicles segment may be impaired due to operating losses recorded in recent years, along with uncertainty regarding future financial performance at these locations. Accordingly, we conducted an impairment test on this asset group as of September 30, 2016 and 2015 by comparing the non-discounted cash flows expected to result from the use and eventual disposition of the asset group with its carrying value, resulting in a determination that the asset group was impaired.
We estimated the fair value of our tangible long-lived assets of this asset group based on assessments or recent sale prices of similar assets. Impairment charges recorded within Cost of goods sold and General and administrative in the Condensed Consolidated Statement of Operations to adjust the carrying cost of these long-lived tangible assets to their estimated fair value at September 30 are as follows:
| | | 2016 | | | 2015 | |
Cost of goods sold | | | | | | | | |
Machinery & equipment | | $ | 406 | | | $ | 1,013 | |
| | | | | | | | | |
General and administrative | | | | | | | | |
Office & computer equipment | | | - | | | | 228 | |
Total asset impairment | | $ | 406 | | | $ | 1,241 | |
SPARTAN MOTORS, INC. AND SUBSIDIARIES
NOTES TO CONSOLIDATED FINANCIAL STATEMENTS
(Dollar amounts in thousands, except per share data)
NOTE 7 - LEASES
We lease certain office equipment, computer hardware, manufacturing equipment and manufacturing and warehouse space under operating lease agreements. Building leases generally provide that we pay the cost of utilities, insurance, taxes and maintenance. Rent expense for the years ended December 31, 2016, 2015 and 2014 was $3,086, $2,876 and $2,286.
Future minimum operating lease commitments under non-cancelable leases are as follows:
Year | | Future Minimum Operating Lease Payments | |
2017 | | $ | 2,247 | |
2018 | | | 1,843 | |
2019 | | | 1,541 | |
2020 | | | 1,455 | |
2021 | | | 1,130 | |
Thereafter | | | 73 | |
| | | | | |
Total | | $ | 8,289 | |
We lease certain office equipment, computer hardware and material handling equipment under capital lease agreements. Cost and accumulated depreciation of capitalized leased assets included in machinery and equipment are $609 and $483, respectively, at December 31, 2016. Future minimum capital lease commitments under non-cancelable leases are as follows:
Year | | Future Minimum Capital Lease Payments | |
2017 | | $ | 71 | |
2018 | | | 45 | |
2019 | | | 33 | |
2020 | | | - | |
2021 | | | - | |
Thereafter | | | - | |
| | | | | |
Total lease obligations, including imputed interest | | | 149 | |
| | | | | |
Less imputed interest charges | | | (10 | ) |
| | | | | |
Total outstanding capital lease obligations | | $ | 139 | |
SPARTAN MOTORS, INC. AND SUBSIDIARIES
NOTES TO CONSOLIDATED FINANCIAL STATEMENTS
(Dollar amounts in thousands, except per share data)
NOTE 8 - TAXES ON INCOME
Income taxes consist of the following:
| | | Year Ended December 31, | | | Year Ended December 31, | |
| | | 2013 | | | 2012 | | | 2011 | | | 2016 | | | 2015 | | | 2014 | |
Current: | | | | | | | | | | | | | |
Current (credit): | | | | | | | | | | | | | |
Federal | | $ | 111 | | | $ | 2,156 | | | $ | 452 | | | $ | 2,203 | | | $ | (520 | ) | | $ | 269 | |
State | | | (302 | ) | | | 715 | | | | 546 | | | | 563 | | | | 253 | | | | (107 | ) |
Total current | | | (191 | ) | | | 2,871 | | | | 998 | | | | 2,766 | | | | (267 | ) | | | 162 | |
Deferred (credit): | | | | | | | | | | | | | | | | | | | | | | | | |
Federal | | | (1,499 | ) | | | (2,762 | ) | | | (71 | ) | | | (2,666 | ) | | | 3,994 | | | | (1,426 | ) |
State | | | (191 | ) | | | (9 | ) | | | (417 | ) | | | - | | | | 1,153 | | | | (839 | ) |
Total deferred | | | (1,690 | ) | | | (2,771 | ) | | | (488 | ) | | | (2,666 | ) | | | 5,147 | | | | (2,265 | ) |
| | | | | | | | | | | | | | |
TOTAL TAXES ON INCOME | | $ | (1,881 | ) | | $ | 100 | | | $ | 510 | | | $ | 100 | | | $ | 4,880 | | | $ | (2,103 | ) |
The above current tax expense amounts differ from the actual amounts payable to the taxing authorities due to the tax impact associated with stock incentive plan transactions under the plans described in Note 11,13, Stock Based Compensation. These adjustments were an addition of $118, $134$123, $44 and $222$100 in 2013, 20122016, 2015 and 2011.2014. The adjustments to current taxes on income were recognized as adjustments of additional paid-in capital.
The American Taxpayer Relief Act of 2012 (the “Act”) was signed into law in 2013. Among other things the Act renewed the federal research and developmentdeferred income tax credit for calendar years 2012 and 2013. The Company included the credit in its 2012 federal incomeat December 31, 2016 represents a net increase of our deferred tax return and therefore reflected it in the computation of taxes on income in 2012.assets to their realizable value.
Differences between the expected income tax expense derived from applying the federal statutory income tax rate to earnings from continuing operations before taxes on income and the actual tax expense are as follows:
| | | Year Ended December 31, | |
| | | 2013 | | | 2012 | | | 2011 | |
| | | Amount | | | Percentage | | | Amount | | | Percentage | | | Amount | | | Percentage | |
| | | | | | | | | | | | | | | | | | | | | | | | | |
Federal income taxes at thestatutory rate | | $ | (2,669 | ) | | | 34.00 | % | | $ | (801 | ) | | | 34.00 | % | | $ | 436 | | | | 34.00 | % |
Increase (decrease) in income taxes resulting from: | | | | | | | | | | | | | | | | | | | | | | | | |
Deferred income tax adjustment | | | 654 | | | | (8.33 | ) | | | - | | | | - | | | | - | | | | - | |
Non-deductible goodwill impairment | | | 525 | | | | (6.69 | ) | | | - | | | | - | | | | - | | | | - | |
Nondeductible earn-out expense | | | 63 | | | | (0.80 | ) | | | 961 | | | | (40.77 | ) | | | 357 | | | | 27.82 | |
Other nondeductible expenses | | | 141 | | | | (1.80 | ) | | | 108 | | | | (4.58 | ) | | | 61 | | | | 4.75 | |
State tax expense, net of federal
income tax benefit | | | (371 | ) | | | 4.73 | | | | 423 | | | | (17.95 | ) | | | 46 | | | | 3.59 | |
Net impact of adjustment of valuation allowance | | | (19 | ) | | | 0.24 | | | | 40 | | | | (1.70 | ) | | | (103 | ) | | | (8.02 | ) |
Section 199 production deduction | | | (70 | ) | | | 0.89 | | | | (182 | ) | | | 7.72 | | | | (85 | ) | | | (6.62 | ) |
Federal research and development
tax credit | | | (135 | ) | | | 1.72 | | | | (294 | ) | | | 12.47 | | | | (327 | ) | | | (25.48 | ) |
Other | | | - | | | | - | | | | (155 | ) | | | 6.57 | | | | 125 | | | | 9.71 | |
TOTAL | | $ | (1,881 | ) | | | 23.96 | % | | $ | 100 | | | | (4.24 | )% | | $ | 510 | | | | 39.75 | % |
| | | Year Ended December 31, | |
| | | 2016 | | | 2015 | | | 2014 | |
| | | Amount | | | Percentage | | | Amount | | | Percentage | | | Amount | | | Percentage | |
| | | | | | | | | | | | | | | | | | | | | | | | | |
Federal income taxes at the statutory rate | | $ | 2,959 | | | | 34.00 | % | | $ | (4,284 | ) | | | 34.00 | % | | $ | (365 | ) | | | 34.00 | % |
Increase (decrease) in income taxes resulting from: | | | | | | | | | | | | | | | | | | | | | | | | |
Deferred income tax adjustment | | | (51 | ) | | | (0.59 | ) | | | (156 | ) | | | 1.24 | | | | (275 | ) | | | 25.61 | |
Non-deductible compensation | | | 459 | | | | 5.27 | | | | - | | | | - | | | | - | | | | - | |
Non-deductible NHTSA penalty | | | - | | | | - | | | | 340 | | | | (2.70 | ) | | | - | | | | - | |
Other nondeductible expenses | | | 226 | | | | 2.60 | | | | 176 | | | | (1.39 | ) | | | 449 | | | | (41.80 | ) |
State tax expense, net of federal income tax benefit | | | 68 | | | | 0.78 | | | | (79 | ) | | | 0.63 | | | | (201 | ) | | | 18.72 | |
Valuation allowance adjustment | | | (2,932 | ) | | | (33.69 | ) | | | 9,472 | | | | (75.17 | ) | | | (505 | ) | | | 47.02 | |
| | | | | | | | | | | | | | | | | | | | | | | | | |
Unrecognized tax benefit adjustment, settlement and expiration of statute | | | - | | | | - | | | | (172 | ) | | | 1.36 | | | | (765 | ) | | | 71.23 | |
Federal research and development tax credit | | | (801 | ) | | | (9.20 | ) | | | (364 | ) | | | 2.89 | | | | (296 | ) | | | 27.56 | |
Other | | | 172 | | | | 1.98 | | | | (53 | ) | | | 0.41 | | | | (145 | ) | | | 13.47 | |
TOTAL | | $ | 100 | | | | 1.15 | % | | $ | 4,880 | | | | (38.73 | )% | | $ | (2,103 | ) | | | 195.81 | % |
SPARTAN MOTORS, INC. AND SUBSIDIARIESSUBSIDIARIES
NOTES TO CONSOLIDATED FINANCIAL STATEMENTSSTATEMENTS
(Dollar amounts in thousands, except per share data)data)
Temporary differences which give rise to deferred income tax assets (liabilities) are as follows:
| | | December 31, | |
| | | 2013 | | | 2012 | |
Current asset (liability): | | | | | | | | |
State tax credit and net operating loss carry-forwards, net of federal income tax benefit | | $ | 3,932 | | | $ | 4,038 | |
Warranty reserve | | | 3,315 | | | | 2,718 | |
Inventory costs and reserves | | | 1,840 | | | | 1,979 | |
Compensation related accruals | | | 817 | | | | 980 | |
Workers compensation accrual | | | 231 | | | | 93 | |
Prepaid insurance | | | (147 | ) | | | (427 | ) |
Other | | | 315 | | | | 496 | |
Total - Current | | | 10,303 | | | | 9,877 | |
Valuation Allowance | | | (3,567 | ) | | | (3,586 | ) |
| | | | | | | | | |
Total - Current, Net | | $ | 6,736 | | | $ | 6,291 | |
| | | | | | | | | |
Noncurrent asset (liability): | | | | | | | | |
Goodwill | | $ | (2,181 | ) | | $ | (3,740 | ) |
Depreciation | | | (2,172 | ) | | | (3,514 | ) |
Stock based compensation | | | 1,082 | | | | 2,723 | |
Other | | | 62 | | | | 77 | |
Total – Noncurrent, net | | $ | (3,209 | ) | | $ | (4,454 | ) |
| | | December 31, | |
| | | 2016 | | | 2015 | |
Deferred income tax assets: | | | | | | | | |
Warranty reserve | | $ | 7,246 | | | $ | 6,286 | |
Credit carry-forwards, net of federal income tax benefit | | | 3,199 | | | | 3,170 | |
Inventory costs and reserves | | | 2,194 | | | | 2,163 | |
Compensation related accruals | | | 1,512 | | | | 1,030 | |
Net operating loss carry-forwards, net of federal income tax benefit | | | 1,029 | | | | 1,108 | |
Stock based compensation | | | 615 | | | | 626 | |
Other intangible assets | | | 232 | | | | (209 | ) |
Other | | | 773 | | | | 921 | |
Total deferred tax assets | | $ | 16,800 | | | $ | 15,095 | |
| | | | | | | | | |
| | | | | | | | | |
Deferred income tax liabilities: | | | | | | | | |
Depreciation | | $ | (2,294 | ) | | $ | (551 | ) |
Trade name | | | (1,072 | ) | | | (999 | ) |
Prepaid insurance | | | (522 | ) | | | (367 | ) |
Total deferred income tax liabilities | | $ | (3,888 | ) | | $ | (1,917 | ) |
| | | | | | | | | |
Net deferred income tax assets | | $ | 12,912 | | | $ | 13,178 | |
Valuation allowance | | | (9,602 | ) | | | (12,534 | ) |
Net deferred tax asset | | $ | 3,310 | | | $ | 644 | |
We assessed the available positive and negative evidence to determine whether sufficient future taxable income will be generated to realize the benefit of the deferred tax assets as of December 31, 2016 and 2015, and recorded a valuation allowance of $9,602 and $12,534 against a portion of the deferred tax assets. A significant portion of negative evidence considered was the cumulative loss incurred over the three-year periods ending December 31, 2016 and 2015. The remaining residual value of $3,310 represents that portion of our deferred income tax assets that could generate future tax losses and be successfully carried back and offset against current year taxable income to recover taxes paid.
The determination of this valuation allowance took into account our deferred tax liability for a trade name assigned an indefinite life for book purposes in the amount of $1,072 and $999 at December 31, 2016 and 2015. This deferred tax liability was excluded from sources of future taxable income as the timing of its reversal cannot be predicted due to the indefinite life of the trade name, and thus cannot be used to offset the valuation allowance. However, we have also considered prudent and feasible tax planning strategies on certain appreciated property that may be entered into in the future.
At December 31, 20132016 and 2012, the Company2015, we had state deferred income tax assets related to state tax net operating loss carry-forwards, of approximately $1,202$1,560 and $1,183,$1,678, which begin expiring in 2018. Also, as of December 31, 20132016 and 2012, the Company2015, we had state deferred income tax assets related to federal and state tax credit carry-forwards of approximately $4,848$4,846 and $5,030,$4,824, which begin expiring in 2019. The Company hasDue to accumulated losses in several state jurisdictions, we had recorded valuation allowances against thesecertain deferred income tax assets which are reflectedaggregating $4,228 and $4,278 at December 31, 2016 and 2015.
SPARTAN MOTORS, INC. AND SUBSIDIARIES
NOTES TO CONSOLIDATED FINANCIAL STATEMENTS
(Dollar amounts in the above table net of federal income taxes, and expects to maintain these allowances on future tax benefits of state net operating losses and tax credits until an appropriate level of profitability is sustained or the Company is able to develop tax strategies that will enable it to conclude that, more likely than not, a portion of the deferred tax assets will be realizable in the particular states.thousands, except per share data)
A reconciliation of the change in the unrecognized tax benefits (“UTB”) for the three years ended December 31, 2013, 20122016, 2015 and 20112014 is as follows:
| | | 2013 | | | 2012 | | | 2011 | |
Balance at January 1, | | $ | 1,166 | | | $ | 990 | | | $ | 987 | |
Increase (decrease) related to prior year tax positions | | | 16 | | | | 245 | | | | (62 | ) |
Increase related to current year tax positions | | | 42 | | | | 76 | | | | 150 | |
Settlements | | | - | | | | (25 | ) | | | 176 | |
Expiration of statute | | | (391 | ) | | | (120 | ) | | | (261 | ) |
Balance at December 31, | | $ | 833 | | | $ | 1,166 | | | $ | 990 | |
SPARTAN MOTORS, INC. AND SUBSIDIARIES
NOTES TO CONSOLIDATED FINANCIAL STATEMENTS
(Dollar amounts in thousands, except per share data)
| | | 2016 | | | 2015 | | | 2014 | |
Balance at January 1, | | $ | 349 | | | $ | 481 | | | $ | 833 | |
Increase (decrease) related to prior year tax positions | | | (24 | ) | | | (73 | ) | | | 73 | |
Increase related to current year tax positions | | | 20 | | | | 91 | | | | 99 | |
Settlement | | | - | | | | (110 | ) | | | - | |
Expiration of statute | | | - | | | | (40 | ) | | | (524 | ) |
Balance at December 31, | | $ | 345 | | | $ | 349 | | | $ | 481 | |
As of December 31, 2013, the Company2016, we had an ending UTB balance of $833$345 along with $283$188 of interest and penalties, for a total liability of $1,116. Of this total, $753 was$533, with $82 recorded as a current liability and $363$451 recorded as a non-current liability based on the applicable statutestatutes of limitations. The change in interest and penalties amounted to an increase of $133 in 2016, a decrease of $176$30 in 2013, an increase of $165 in 2012,2015, and a decrease of $49$198 in 2011,2014, which were reflected in taxes on incomeIncome tax expense (benefit) within theour Consolidated Statements of Income.
In 2013 the Company’s 2011 federal income tax return was selected for examination by federal taxing authorities. Although the examination is ongoing, management believes adequate provision for federal income taxes has been recorded.Operations.
As of December 31, 2013, the Company is2016, we are no longer subject to examination by federal taxing authorities for 20062012 and earlier years.
The CompanyWe also filesfile tax returns in a number of states and those jurisdictions remain subject to audit in accordance with relevant state statutes. These audits can involve complex issues that may require an extended period of time to resolve and may cover multiple years. To the extent the Company prevailswe prevail in matters for which reserves have been established, or isare required to pay amounts in excess of itsour reserves, the Company’sour effective income tax rate in a given fiscal period could be materially affected.impacted. However, we do not expect such impacts to be material to our financial statements. An unfavorable tax settlement would require use of the Company’sour cash and could result in an increase in the Company’sour effective income tax rate in the period of resolution. A favorable tax settlement could result in a reduction in the Company’sour effective income tax rate in the period of resolution. The Company doesWe do not expect the total amount of unrecognized tax benefits to significantly increase or decrease over the next twelve months.
On September 13, 2013,
NOTE 9 - TRANSACTIONS WITH MAJOR CUSTOMERS
Major customers are defined as those with sales greater than 10 percent of consolidated sales in a given year.
We had one customer classified as a major customer in 2016, 2015 and 2014 (Customer A), which was a customer of the U.S. Treasury DepartmentSpecialty Chassis and Vehicles segment. Information about our major customer is as follows:
| | | 2016 | | | 2015 | | | 2014 | |
Customer
| |
Sales
| | | Accounts
Receivable
(at year end) | | |
Sales
| | | Accounts
Receivable
(at year end) | | |
Sales
| | | Accounts
Receivable
(at year end) | |
| | | | | | | | | | | | | | | | | | | | | | | | | |
Customer A | | $ | 70,954 | | | $ | 7,169 | | | $ | 78,759 | | | $ | 8,512 | | | $ | 57,093 | | | $ | 7,541 | |
NOTE 10 - COMMITMENTS AND CONTINGENT LIABILITIES
Under the IRS issuedterms of our credit agreement with our banks, we have the ability to issue letters of credit totaling $20,000. At December 31, 2016 and 2015, we had outstanding letters of credit totaling $1,599 and $1,337 related to certain emergency response vehicle contracts and our workers compensation insurance.
At December 31, 2016, we and our subsidiaries were parties, both as plaintiff and defendant, to a number of lawsuits and claims arising out of the normal course of our business. In the opinion of management, our financial position, future operating results or cash flows will not be materially affected by the final regulations that address costs incurred in acquiring, producing, or improving tangible property (the "tangible property regulations"). The tangible property regulations are generally effective for tax years beginning on or after January 1, 2014. The tangible property regulations will most likely require the Company to make additional tax accounting method changes as of January 1, 2014; however, management does not anticipate the impactoutcome of these changes will be material to the Company’s consolidated financial position or results of operations.legal proceedings.
SPARTAN MOTORS, INC. AND SUBSIDIARIESSUBSIDIARIES
NOTES TO CONSOLIDATED FINANCIAL STATEMENTSSTATEMENTS
(Dollar amounts in thousands, except per share data)data)
Spartan-Gimaex joint venture
In February 2015, Spartan USA and Gimaex Holding, Inc. mutually agreed to begin discussions regarding the dissolution of the Spartan-Gimaex joint venture. In June 2015, Spartan USA and Gimaex Holding, Inc. entered into court proceedings to determine the terms of the dissolution. In February 2017, by agreement of the parties, the court proceeding was dismissed with prejudice and the judge entered an order to this effect as the parties agreed to seek a dissolution plan on their own. No dissolution terms have been determined as of the date of this Form 10-K. In the fourth quarters of 2015 and 2014, we accrued charges totaling $982 and $235 to write down certain inventory items associated with this joint venture to their estimated fair values. Costs associated with the wind-down will be impacted by the final dissolution agreement. In accordance with accounting guidance, the costs we have accrued so far represent the low end of the range of the estimated total charges that we believe we may incur related to the wind-down. While we are unable to determine the final cost of the wind-down with certainty at this time, we may incur additional charges, depending on the final terms of the dissolution, and such charges could be material to our results.
National Highway Traffic Safety Administration (“NHTSA”) penalty
In July 2015, we entered into a settlement agreement with the NHTSA pertaining to our early warning and defect reporting. Under the terms of the agreement we will pay a fine of $1,000 in equal installments over three years, and will complete performance obligations including compliance and regulatory practice improvements, industry outreach, and recalls to remedy safety defects in certain of our chassis. The following table presents the charges recorded in the Condensed Consolidated Statement of Operations during the year ended December 31, 2015 as a result of this agreement:
Cost of products sold | | $ | 1,269 | |
Selling, general and administrative | | | 1,000 | |
| | | $ | 2,269 | |
Chassis Agreements
Our Fleet Vehicles and Services segment assembles van and truck bodies onto original equipment manufacturer (“OEM”) chassis. The majority of such OEM chassis are purchased directly by our customers from the OEM and drop-shipped to our facilities. We are a bailee of most other chassis under converter pool agreements with the OEMs, as described below. Chassis possessed under converter pool agreements are invoiced to the customer by the OEM or its affiliated financial institution based upon the terms of the converter pool agreements. On an annual basis, we purchase and take title to an immaterial number of chassis that ultimately are recorded as sales and cost of sales. Converter pool chassis obtained from the OEMs are based upon estimated future requirements and, to a lesser extent, confirmed orders from customers. Although each manufacturer’s agreement has different terms and conditions, the agreements generally provide that the manufacturer will provide a supply of chassis to be maintained at our production facility under the conditions that we will store such chassis, will not make any additions or modifications to such chassis and will not move, sell or otherwise dispose of such chassis, except under the terms of the agreement. The manufacturer does not transfer the certificate of origin to us and, accordingly, we account for the chassis in our possession as bailed inventory belonging to the manufacturer.
We are party to chassis bailment inventory agreements with General Motors Company (“GM”) and Chrysler Group, LLC (“Chrysler”) which allow GM and Chrysler to draw up to $10,000 against our revolving credit line for chassis placed at our facilities. As a result of these agreements, there was $784 and $3,795 outstanding on our revolving credit line at December 31, 2016 and 2015. Under the terms of the bailment inventory agreements, these chassis never become our property, and the amount drawn against the credit line will be repaid by a GM or Chrysler dealer at the time an order is placed for one of our bodies, utilizing a GM or Chrysler chassis. As such, the chassis, and the related draw on the line of credit, are not reflected in the accompanying Consolidated Balance Sheets. See Note 12 Debt, for further information on our revolving line of credit.
Warranty Related
We provide limited warranties against assembly/construction defects for periods generally ranging from two years to the life of the product. These warranties generally provide for the replacement or repair of defective parts or workmanship for a specified period following the date of sale. The end users also may receive limited warranties from suppliers of components that are incorporated into our chassis and vehicles.
Our policy is to record a provision for the estimated cost of warranty-related claims at the time of the sale and periodically adjust the provision and liability to reflect actual experience. The amount of warranty liability accrued reflects our best estimate of the expected future cost of honoring our obligations under the warranty agreements. Historically, the cost of fulfilling our warranty obligations has principally involved replacement parts and labor for field retrofit campaigns. Our estimates are based on historical experience, the number of units involved and the extent of features and components included in product models.
Certain warranty and other related claims involve matters of dispute that ultimately are resolved by negotiation, arbitration or litigation. Material warranty issues can arise which are beyond the scope of our historical experience. We provide for any such warranty issues as they become known and are estimable. It is reasonably possible that additional warranty and other related claims could arise from disputes or other matters beyond the scope of our historical experience.
Changes in our warranty liability during the years ended December 31, 2016 and 2015 were as follows:
| | | 2016 | | | 2015 | |
Balance of accrued warranty at January 1 | | $ | 16,610 | | | $ | 9,237 | |
Warranties issued during the period | | | 5,705 | | | | 5,027 | |
Cash settlements made during the period | | | (10,265 | ) | | | (8,015 | ) |
Changes in liability for pre-existing warranties during the period, including expirations | | | 7,284 | | | | 10,361 | |
Balance of accrued warranty at December 31 | | $ | 19,334 | | | $ | 16,610 | |
Changes in liability for pre-existing warranties during the years ended December 31, 2016 and 2015 includes $3,968 and $7,100 for campaigns and recalls outside of our normal warranty programs.
NOTE 8 11 - COMPENSATION INCENTIVE PLANS
We sponsor defined contribution retirement plans which cover all associates who meet length of service and minimum age requirements. Our matching contributions vest over 5 years and were $796, $707 and $625 in 2016, 2015 and 2014. These amounts are expensed as incurred.
The Spartan Motors, Inc. Incentive Compensation Plan encompasses a quarterly and an annual bonus program. The quarterly program covers certain of our full-time employees. The cash bonuses paid under the quarterly program are equal for all participants. Amounts expensed for the quarterly bonus were $3,298, $1,898 and $1,789 for 2016, 2015 and 2014.
The annual bonus provides that executive officers and certain designated managers may earn cash bonuses based on our achievement of pre-defined financial and operational objectives. Amounts expensed for the annual bonus were $6,470, $1,789 and $1,644 for 2016, 2015 and 2014.
NOTE 12- DEBT
Long-term debt consists of the following:
| | | December 31,
2013 | | | December 31,
2012 | | | December 31,
2016 | | | December 31,
2015 | |
Note payable to Prudential Investment Management, Inc.Principal due December 1, 2016 with quarterly interestonly payments of $68 at 5.46%. Unsecured debt. (1) | | $ | 5,000 | | | $ | 5,000 | | |
| Note payable to Prudential Investment Management, Inc. | | | | | | | | | |
Principal due December 1, 2016 with quarterly interest only payments of $68 at 5.46%. Unsecured debt. (1) | | | $ | -- | | | $ | 5,000 | |
Line of credit revolver (2): | | | -- | | | | -- | | | | -- | | | | -- | |
Capital lease obligations (See Note 5 – Leases) | | | 340 | | | | 289 | | |
Capital lease obligations (See Note 7 – Leases) | | | | 139 | | | | 187 | |
Total debt | | | 5,340 | | | | 5,289 | | | | 139 | | | | 5,187 | |
Less current portion of long-term debt | | | (79 | ) | | | (82 | ) | | | (65 | ) | | | (63 | ) |
Total long-term debt | | $ | 5,261 | | | $ | 5,207 | | | $ | 74 | | | $ | 5,124 | |
The long-term debt due is as follows; $79 in 2014; $59 in 2015; $5,062 in 2016; $65 in 2017 and $75 thereafter.
| | (1) | The Company has a private shelf agreement with Prudential Investment Management, Inc., which allows the Company to borrow up to $50,000 to be issued in $5,000 minimum increments. On November 30, 2012, we entered into an amendment to our existing amended and restated private shelf agreement with Prudential Investment Management, Inc. The amended agreement extended the period during which we may issue private notes by three years to November 30, 2015 and increased the limit of the uncommitted shelf facility up to $50,000. The interest rate is determined based on applicable rates at the time of issuance. The CompanyWe had $5,000 of private placement notes outstanding at December 31, 2013 and 20122015 with Prudential Investment Management, Inc., with principal due December 1, 2016. On October 31, 2016 we repaid the $5,000 principal outstanding on our Series B Senior Notes due December 1, 2016, with cash on hand. We had initially planned to fund the December 1, 2016 principal payment with borrowings available under our primary line of credit agreement with Wells Fargo Bank and JPMorgan Chase Bank. Accordingly, this debt was classified as long-term at December 31, 2015.
|
| | (2) | On October 31, 2016, we entered into a Second Amended and Restated The Company’s primary lineCredit Agreement (the "Credit Agreement") by and among us, certain of credit is a $70,000 unsecured revolving line with Wellour subsidiaries, Wells Fargo Bank, National Association, as administrative agent ("Wells Fargo"), and the lenders party thereto consisting of Wells Fargo, JPMorgan Chase Bank, expiring on December 16, 2016. Both lending institutions equally share this commitment. The terms of thisN.A. and PNC Bank (the "Lenders"). Under the Credit Agreement, we may borrow up to $100,000 from the Lenders under a three-year unsecured revolving credit agreement allow the Company tofacility. We may also request an increase in the facility of up to $35,000 in the aggregate, subject to customary terms.conditions. This line carries an interest rate of the higher of either (i) the highest of prime rate, the federal funds effective rate plus 0.5%, or the one month adjusted LIBOR plus 1.00%; or (ii) adjusted LIBOR plus margin based upon the Company’sour ratio of debt to earnings from time to time. The CompanyWe had no borrowings on this line at December 31, 20132016 or 2012. General Motors Company (“GM”) has2015. In January 2017, we borrowed $32.8 million from our credit line to fund our acquisition of Smeal. GM and Chrysler have the ability to draw up to $5,000$10,000 against the Company’sour primary line of credit in relation to chassis supplied to UtilimasterSpartan USA under a chassis bailment inventory program, resulting in net available borrowings of $65,000 at December 31, 2013.programs. See Note 12,10, Commitments and Contingent Liabilities for further information about this chassis bailment inventory program. The applicable borrowing rate including margin was 3.25%1.86672% (or one-month LIBOR plus 1.25%) at December 31, 2013.2016. |
Under the terms of the primary line of credit agreement and the private shelf agreement, the Company iswe are required to maintain certain financial ratios and other financial conditions, which limited the Company’sour available borrowings under itsour line of credit to a total of approximately $23,800$73,600 and $36,500 at December 31, 2013.2016 and 2015. The agreementsagreement also prohibit the Companyprohibits us from incurring additional indebtedness; limitlimits certain acquisitions, investments, advances or loans; limits our ability to pay dividends in certain circumstances; and restrictrestricts substantial asset sales. At December 31, 20132016 and 2012, the Company was2015, we were in compliance with all debt covenants.
NOTE 9 - TRANSACTIONS WITH MAJOR CUSTOMERS
Major customers are defined as those with sales greater than 10 percent of consolidated sales in a given year. For comparative purposes, amounts are presented for those customers in the other years presented.
1SPARTAN MOTORS, INC. AND SUBSIDIARIES
NOTES TO CONSOLIDATED FINANCIAL STATEMENTS
(Dollar amounts in thousands, except per share data)
The Company had one customer classified as a major customer in 2013 (Customer A), which was a customer of the Specialty Chassis and Vehicles segment, while the customer classified as major in 2012 and 2011 (Customer B) was from the Delivery and Service Vehicles segment. Information about our major customers is as follows:
| | | 2013 | | | 2012 | | | 2011 | |
Customer
| |
Sales
| | | Accounts
Receivable
(at year end) | | |
Sales
| | | Accounts
Receivable
(at year end) | | |
Sales
| | | Accounts
Receivable
(at year end) | |
| | | | | | | | | | | | | | | | | | | | | | | | | |
Customer A | | $ | 65,144 | | | $ | 6,684 | | | $ | 41,792 | | | $ | 4,824 | | | $ | 12,986 | | | $ | 1,868 | |
Customer B | | | 27,152 | | | | 209 | | | | 59,074 | | | | 331 | | | | 73,508 | | | | 2,272 | |
NOTE 10 - COMPENSATION INCENTIVE PLANS
The Company sponsors defined contribution retirement plans which cover all associates who meet length of service and minimum age requirements. The Company’s matching contributions vest over 5 years and were $604, $380 and $271 in 2013, 2012 and 2011. These amounts were expensed as incurred.
The Spartan Motors, Inc. Economic Value Add Plan (the “EVA Plan”) encompasses a quarterly and an annual bonus program. The quarterly program covers certain full-time employees of the Company. The cash bonuses paid under the quarterly program are equal for all participants. Amounts expensed for the quarterly bonus were $867, $1,134 and $1,024 for 2013, 2012 and 2011.
The annual bonus provides that executive officers and certain designated managers may earn cash bonuses based on the Company’s achievement of a target amount of net operating profit after tax for a given year, less a capital charge based upon the tangible net operating assets employed in the business, along with achievement of certain pre-defined management objectives. Amounts expensed for the annual bonus were $236, $1,698 and $1,149 for 2013, 2012 and 2011.
NOTE 113 - STOCK BASED COMPENSATION
The Company hasWe have stock incentive plans covering certain employees and non-employee directors. Shares reserved for stock awards under these plans total 4,725,000.2,856,250. Total shares remaining available for stock incentive grants under these plans totaled 2,740,0002,856,250 at December 31, 2013. The Company is2016. We are currently authorized to grant new stock options, restricted stock, restricted stock units, stock appreciation rights and common stock under itsour various stock incentive plans which include itsour Stock Incentive Plan of 2005,2016 and our Directors’ Stock Incentive Plan of 2007 and Stock Incentive Plan of 2012.Purchase Plan. The stock incentive plans allow certain employees, officers and non-employee directors to purchase common stock of Spartan Motors at a price established on the date of grant. Incentive stock options granted under these plans must have an exercise price equal to or greater than 100% of the fair market value of Spartan Motors stock on the grant date.
Stock Options and Stock Appreciation Rights.Granted options and Stock Appreciation Rights (SARs) vest immediately and are exercisable for a period of 10 years from the grant date. The exercise price for all options and the base price for all SARs granted have been equal to the market price at the date of grant. Dividends are not paid on unexercised options or SARs. SARs arehave historically been settled with shares of common stock upon exercise.
The Company receivesWe receive a tax deduction for certain stock option exercises during the period the options are exercised, generally for the excess of the fair value of the stock on the date of exercise over the exercise price of the options. As required, the Company reportswe report any excess tax benefits in itsour Consolidated Statement of Cash Flows as financing cash flows. Excess tax benefits derive from the difference between the tax deduction and the fair market value of the option as determined by the Black-Scholes valuation model.
SPARTAN MOTORS, INC. AND SUBSIDIARIES
NOTES TO CONSOLIDATED FINANCIAL STATEMENTS
(Dollar amounts in thousands, except per share data)
Option activity for the year ended December 31, 2013 is as follows for all plans:
| | |
Total
Number
of Options (000) | | |
Weighted
Average
Exercise
Price
| | |
Total
Intrinsic
Value
| | | Weighted
Average
Remaining
Contractual
Term (Years) | |
| | | | | | | | | | | | | | | | | |
Options outstanding and exercisable at December 31, 2012 | | | 438 | | | $ | 4.84 | | | | | | | | | |
Granted and vested | | | -- | | | | -- | | | | | | | | | |
Exercised | | | (200 | ) | | | 4.45 | | | | | | | | | |
Cancelled | | | (5 | ) | | | 4.59 | | | | | | | | | |
Options outstanding and exercisable at December 31, 2013 | | | 233 | | | | 5.18 | | | $ | 353 | | | | 1.1 | |
No options were granted in 2013, 20122016, 2015 or 2011; accordingly,2014, and there was no related compensation expense nor income tax benefit recognized in the corresponding income statements. We have had no outstanding options since December 31, 2015. The total intrinsic value of options exercised during years ended December 31, 2016, 2015 and 2014, were $0, $0 and $10.
SARs activity for the year ended December 31, 2016 is as follows for all plans:
| | |
Total Number
of SARs
(000) | | |
Weighted
Average
Grant Date
Fair Value
| | |
Total
Intrinsic
Value
| | | Weighted
Average
Remaining
Contractual
Term (Years) | |
SARs outstanding and exercisable at December 31, 2015 | | | 221 | | | $ | 3.30 | | | | | | | | | |
Granted and vested | | | - | | | | - | | | | | | | | | |
Exercised | | | (16 | ) | | | 3.20 | | | | | | | | | |
Cancelled | | | (112 | ) | | | 3.39 | | | | | | | | | |
SARs outstanding and exercisable at December 31, 2016 | | | 93 | | | | 3.20 | | | $ | 150 | | | | 1.0 | |
No SARs were granted in 2016, 2015 or 2014, and there was no related compensation expense nor income tax benefit recognized in the corresponding income statements. The total intrinsic value of options exercised during years ended December 31, 2013, 2012 and 2011, were $339, $30 and $147.
SARs activity for the year ended December 31, 2013 is as follows for all plans:
| | |
Total
Number
of SARs (000) | | |
Weighted
Average
Grant Date
Fair Value
| | |
Total
Intrinsic
Value
| | | Weighted
Average
Remaining
Contractual
Term (Years) | |
SARs outstanding and exercisable at December 31, 2012 | | | 343 | | | $ | 3.06 | | | | | | | | | |
Granted and vested | | | -- | | | | -- | | | | | | | | | |
Exercised | | | (3 | ) | | | 2.03 | | | | | | | | | |
Cancelled | | | (35 | ) | | | 3.30 | | | | | | | | | |
SARs outstanding and exercisable at December 31, 2013 | | | 305 | | | | 3.04 | | | $ | 131 | | | | 3.2 | |
No SARs were granted in 2013, 2012 or 2011; accordingly, there was no related compensation expense nor income tax benefit recognized in the corresponding income statements. These SARS could have been exercised for the issuance of 19,596 shares of the Company’s common stock at December 31, 2013. The total intrinsic value of SARs exercised during the years ended December 31, 2013, 20122016, 2015 and 20112014 was $4, $7$14, $0 and $3.
SPARTAN MOTORS, INC. AND SUBSIDIARIES
NOTES TO CONSOLIDATED FINANCIAL STATEMENTS
(Dollar amounts in thousands, except per share data)$0.
Restricted Stock Awards. The Company issues We issue restricted stock, at no cash cost, to our directors, officers and key employees of the Company.employees. Shares awarded entitle the shareholder to all rights of common stock ownership except that the shares are subject to the risk of forfeiture and may not be sold, transferred, pledged, exchanged or otherwise disposed of during the vesting period, which is generally three to five years. The unearned stock-based compensation related to restricted stock awards, using the market price on the date of grant, is being amortized to compensation expense over the applicable vesting periods. Cash dividends are paid on unvested restricted stock grants and all such dividends vest immediately.
The Company receivesWe receive an excess tax benefit or liability during the period the restricted shares vest. The excess tax benefit (liability) is determined by the excess (shortfall) of the market price of the stock on date of vesting over (under) the grant date market price used to amortize the awards to compensation expense. As required, any excess tax benefits or liabilities are reported in the Consolidated Statements of Cash Flows as financing cash flows.
Restricted stock activity for the year ended December 31, 2013,2016, is as follows:
| | | Total
Number of
Non-vested
Shares (000) | | |
Weighted
Average
Grant Date
Fair Value
| | | Weighted
Average
Remaining
Vesting Life
(Years) | |
Non-vested shares outstanding at December 31, 2012 | | | 562 | | | $ | 5.39 | | | | | |
Granted | | | 274 | | | | 5.24 | | | | | |
Vested | | | (261 | ) | | | 5.36 | | | | | |
Cancelled | | | (89 | ) | | | 5.30 | | | | | |
Non-vested shares outstanding at December 31, 2013 | | | 486 | | | | 5.34 | | | | 0.9 | |
| | | Total
Number of
Non-vested
Shares (000) | | |
Weighted
Average
Grant Date
Fair Value
| | | Weighted
Average
Remaining
Vesting Life
(Years) | |
Non-vested shares outstanding at December 31, 2015 | | | 379 | | | $ | 4.93 | | | | | |
Granted | | | 630 | | | | 4.01 | | | | | |
Vested | | | (272 | ) | | | 4.59 | | | | | |
Forfeited | | | (71 | ) | | | 4.47 | | | | | |
Non-vested shares outstanding at December 31, 2016 | | | 666 | | | | 4.25 | | | | 1.08 | |
The weighted-average grant date fair value of non-vestednon-vested shares granted was $5.24, $5.43$4.01, $4.86 and $4.30$5.09 for the years ended December 31, 2013, 20122016, 2015 and 2011.2014.
During 2013, 20122016, 2015 and 2011, the Company2014, we recorded compensation expense, net of cancellations, of $1,624, $1,645$1,536, $1,198 and $1,780,$1,624, related to restricted stock awards and direct stock grants. The total income tax benefit recognized in the Consolidated Statements of IncomeOperations related to restricted stock awards was $538, $419 and $568 $576for 2016, 2015 and $623 for 2013, 2012 and 2011.2014. For the years ended December 31, 2013, 20122016, 2015 and 2011,2014, restricted shares vested with a fair market value of $1,397, $1,603$1,248, $1,528 and $1,134.$1,785. When the fair value of restricted shares is lower on the date of vesting than that previously expensed for book purposes, an excess tax liability is booked. As of December 31, 2013, the Company2016, we had unearned stock-based compensation of $1,531$1,978 associated with these restricted stock grants, which will be recognized over a weighted average of 0.91.08 years.
Employee Stock Purchase Plan.Plan. The CompanyWe instituted an employee stock purchase plan (“ESPP”) beginning on October 1, 2011 whereby essentially all employees who meet certain service requirements can purchase the Company’sour common stock on quarterly offering dates at 95% of the fair market value of the shares on the purchase date. A maximum of 750,000 shares are authorized for purchase until the ESPP termination date of February 24, 2021, or earlier termination of the ESPP. During the years ended December 31, 20132016 and 2012, the Company2015, we received proceeds of $81$86 and $104$61 for the purchase of 16,00013,000 and 21,00016,000 shares under the ESPP.
NOTE 12 - COMMITMENTS AND CONTINGENT LIABILITIES14 – SHAREHOLDERS EQUITY
UnderIn October 2011, our Board of Directors authorized the termsrepurchase of its credit agreement with its banks, the Company has the ability to issue letters of credit totaling $15,000. At December 31, 2013 and 2012, the Company had outstanding letters of credit totaling $10,429 and $200 related to certain emergency response vehicle contracts and the Company’s workers compensation insurance. The increase in the outstanding letters of credit at December 31, 2013 is mainly due to performance bonds issued in relation to the award of an order from Peru for 70 emergency response vehicles.
In December, 2011, the Company reached a settlement with a customer regarding certain supply contracts Spartan Chassis had completed but for which the customer claimed a post-delivery price adjustment. An adjustment for the excess amount accrued over the settlement amount is reflected in sales for the year ended December 31, 2011.
SPARTAN MOTORS, INC. AND SUBSIDIARIES
NOTES TO CONSOLIDATED FINANCIAL STATEMENTS
(Dollar amounts in thousands, except per share data)
At December 31, 2013, the Company and its subsidiaries were parties, both as plaintiff and defendant, to a number of lawsuits and claims arising out of the normal course of their businesses. In the opinion of management, the financial position, future operating results or cash flows of the Company will not be materially affected by the final outcome of these legal proceedings.
Chassis Agreements
Utilimaster assembles van and truck bodies onto original equipment manufacturer (“OEM”) chassis. The majority of such OEM chassis are purchased directly by Utilimaster’s customers from the OEM and drop-shipped to Utilimaster’s premises. Utilimaster is a bailee of most other chassis under converter pool agreements with the OEMs, as described below. Chassis possessed under converter pool agreements are invoiced to the customer by the OEM or its affiliated financial institution based upon the terms of the converter pool agreements. On an annual basis, Utilimaster purchases and takes title to an immaterial number of chassis that ultimately are recorded as sales and cost of sales. Converter pool chassis obtained from the OEMs are based upon estimated future requirements and, to a lesser extent, confirmed orders from customers. Although each manufacturer’s agreement has different terms and conditions, the agreements generally provide that the manufacturer will provide a supply of chassis to be maintained at Utilimaster’s production facility under the conditions that Utilimaster will store such chassis, will not make any additions or modifications to such chassis and will not move, sell or otherwise dispose of such chassis, except under the terms of the agreement. The manufacturer does not transfer the certificate of origin to Utilimaster and, accordingly, Utilimaster accounts for the chassis in the Company’s possession as bailed inventory belonging to the manufacturer.
Utilimaster is party to a chassis bailment inventory agreement with GM which allows GM to draw up to $5,000 against the Company’s revolving credit line for chassis placed at Utilimaster. As a result of this agreement, there was $1,865 and $3,718 outstanding on the Company’s revolving credit line on December 31, 2013 and 2012. Under the terms of the bailment inventory agreement, these chassis never become the property of Utilimaster, and the amount drawn against the credit line will be repaid by a GM dealer at the time an order is placed for a Utilimaster body, utilizing a GM chassis. As such, the chassis, and the related draw on the line of credit, are not reflected in the accompanying Consolidated Balance Sheets. See Note 8Debt for further information on the Company’s revolving line of credit.
Warranty Related
The Company’s subsidiaries all provide limited warranties against assembly/construction defects. These warranties generally provide for the replacement or repair of defective parts or workmanship for a specified period following the date of sale. The end users also may receive limited warranties from suppliers of components that are incorporated into the Company’s chassis and vehicles.
The Company’s policy is to record a provision for the estimated cost of warranty-related claims at the time of the sale and periodically adjust the provision and liability to reflect actual experience. The amount of warranty liability accrued reflects management’s best estimate of the expected future cost of honoring the Company’s obligations under the warranty agreements. Historically, the cost of fulfilling the Company’s warranty obligations has principally involved replacement parts and labor for field retrofit campaigns. The Company’s estimates are based on historical experience, the number of units involved and the extent of features and components included in product models.
Certain warranty and other related claims involve matters of dispute that ultimately are resolved by negotiation, arbitration or litigation. Infrequently, a material warranty issue can arise which is beyond the scope1 million shares of the Company’s historical experience.common stock. In April 2016, our Board of Directors authorized the repurchase of up to 1 million additional shares of our common stock, and terminated the October 2011 authorization effective June 30, 2016. The Company provides for any such warranty issues as they become known and are estimable. It is reasonably possible that additional warranty and other related claims could arise from disputes or other matters beyond the scopefollowing table represents our purchases of the Company’s historical experience.
Changes in the Company’s warranty liabilityour common stock during the years ended December 31, 20132016 and 2012 were as follows:
| | | 2013 | | | 2012 | |
Balance of accrued warranty at January 1 | | $ | 6,062 | | | $ | 5,802 | |
Warranties issued during the period | | | 3,915 | | | | 3,515 | |
Cash settlements made during the period | | | (4,394 | ) | | | (4,842 | ) |
Changes in liability for pre-existing warranties during the period, including expirations | | | 1,996 | | | | 1,587 | |
Balance of accrued warranty at December 31 | | $ | 7,579 | | | $ | 6,062 | |
SPARTAN MOTORS, INC. AND SUBSIDIARIES
NOTES TO CONSOLIDATED FINANCIAL STATEMENTS
(Dollar amounts in thousands, except per2015 under these share data)
Contingent Consideration
In connection with the acquisition of Utilimaster in November, 2009, the Company incurred contingent obligations through 2014 in the form of certain performance-based earn-out payments, up to an aggregate maximum amount of $7,000. During the years ended December 31, 2013 and 2012, the Company made earn out payments totaling $2,720 and $2,100, leaving an aggregate maximum amount of future payments of $2,180 as of December 31, 2013. The Company has made payments of $1,720 in February 2013 and $1,100 in March 2012 based on 2012 and 2011 sales that exceeded target levels and $1,000 in November 2013 and $1,000 in November 2012 as the result of meeting targeted sales levels for the ReachTM commercial van.At December 31, 2013, the Company has recorded a contingent liability for the estimated fair value of the future consideration of $1,007, with $247 recorded within Other current liabilities and $760 recorded within Other non-current liabilities on the Company’s Consolidated Balance Sheet, based upon the likelihood of the payments, discounted to December 31, 2013.repurchase programs.
In connection with the acquisition of Classic Fire in April, 2011, the Company incurred contingent obligations through 2013 in the form of certain performance-based earn-out payments, up to an aggregate maximum amount of $1,000. No payments were made, and no payments will be required to be made under this earn-out agreement. During the year ended December 31, 2012, the Company recorded an adjustment to operating expenses of $(83) to bring the contingent liability to $0 based on the expected future payment amounts. During the year ended December 31, 2011, the Company recorded an adjustment to operating expenses of $(97) to bring the contingent liability to $83 based on the expected future payment amounts, discounted to December 31, 2011.
During the years ended December 31, 2013, 2012 and 2011, the Company recorded additional expense reflecting changes in the present value of the contingent liability as detailed below:
Share purchase programs | | | 2016 | | | 2015 | |
Authorized amount (shares) (000) | | | Date approved by board | | | Program termination
date | | | Shares purchased (000) | | | Purchase value | | | Shares purchased (000) | | | Purchase value | |
| 1,000 | | | | October, 2011 | | | | June 30, 2016 | | | | 422 | | | $ | 2,000 | | | | - | | | $ | - | |
| 1,000 | | | | April, 2016 | | | | N/A | | | | - | | | $ | - | | | | - | | | $ | - | |
| | | | | | | | | | | | | | | | | | | | | | | | | | |
| | | Contingent Liability | |
Contingent liability fair value at January 1, 2011 | | $ | 1,771 | |
Contingent liability from Classic Fire acquisition | | | 180 | |
Expense from discount amortization | | | 346 | |
Expense from changes in estimated fair value of contingent payments (1) | | | 637 | |
Contingent liability fair value at December 31, 2011 | | | 2,934 | |
Expense from discount amortization | | | 483 | |
Expense from changes in estimated fair value of contingent payments (1) | | | 2,389 | |
Payments made | | | (2,100 | ) |
Contingent liability fair value at December 31, 2012 | | | 3,706 | |
Expense from discount amortization | | | 215 | |
Credit from changes in estimated fair value of contingent payments (1) | | | (194 | ) |
Payments made | | | (2,720 | ) |
Contingent liability fair value at December 31, 2013 | | $ | 1,007 | |
| (1)
| Represents adjustments to the contingent consideration liability based on expected or actual Classic Fire or Utilimaster sales levels for 2011, 2012, 2013 and 2014, along with the expectation of or success in meeting the targeted sales levels for the Reach TM commercial van in 2012 and 2013.
|
Management believes that the Company has sufficient liquidity to fund the contingent obligations as they become due.
NSPARTAN MOTORS, INC. AND SUBSIDIARIES
NOTES TO CONSOLIDATED FINANCIAL STATEMENTS
(Dollar amounts in thousands, except per share data)
NOTE 13 – RESTRUCTURING CHARGES
During 2012, the Company incurred restructuring charges within its Delivery and Service Vehicles segment, including asset impairments, as the result of its planned relocation of its Utilimaster operations from Wakarusa, Indiana to Bristol, Indiana and the relocation of its ReachTM manufacturing from Wakarusa, Indiana to Charlotte, Michigan, along with certain severance charges incurred within its Specialty Chassis and Vehicles and Emergency Response Vehicles segments to help align expenses with current and future revenue expectations.
During 2011, the Company undertook restructuring activities, pertaining to continuing operations, to help align expenses with current and future revenue expectations.
There were no restructuring charges recorded during the year ended December 31, 2013.
The following table provides a summary of the compensation related charges incurred through December 31, 2013, along with the related outstanding balances to be paid in relation to those expenses.
| | | Severance | |
| | | | | |
Balance January 1, 2011 | | $ | 116 | |
Accrual for severance | | | 278 | |
Payments and adjustments made in period | | | (394 | ) |
Balance December 31, 2011 | | | - | |
Accrual for severance | | | 1,642 | |
Payments made in period | | | (1,012 | ) |
Balance December 31, 2012 | | $ | 630 | |
Accrual for severance | | | - | |
Payments made in period | | | (630 | ) |
Balance December 31, 2013 | | $ | - | |
SPARTAN MOTORS, INC. AND SUBSIDIARIES
NOTES TO CONSOLIDATED FINANCIAL STATEMENTS
(Dollar amounts in thousands, except per share data)
Restructuring charges included in the Consolidated Statements of Operations for the years ended December 31, 2012 and 2011, broken down by segment, are as follows:
| | | Year ended December 31, 2012 | |
| | | Emergency Response | | | Delivery and Service Vehicles | | | Specialty Chassis and Vehicles | | | Other | | | Total | |
Cost of products sold | | | | | | | | | | | | | | | | | | | | |
Asset impairment | | $ | - | | | $ | 4,315 | | | $ | - | | | $ | - | | | $ | 4,315 | |
Accrual for severance | | | 74 | | | | - | | | | 158 | | | | - | | | | 232 | |
Production relocation costs | | | - | | | | 1,967 | | | | - | | | | - | | | | 1,967 | |
Total cost of products sold | | | 74 | | | | 6,282 | | | | 158 | | | | - | | | | 6,514 | |
| | | | | | | | | | | | | | | | | | | | | |
General and Administrative | | | | | | | | | | | | | | | | | | | | |
Asset impairment | | | - | | | | 1,153 | | | | - | | | | - | | | | 1,153 | |
Accrual for severance | | | 454 | | | | 259 | | | | 638 | | | | 59 | | | | 1,410 | |
Production relocation costs | | | - | | | | 56 | | | | - | | | | - | | | | 56 | |
Total general and administrative | | | 454 | | | | 1,468 | | | | 638 | | | | 59 | | | | 2,619 | |
Total restructuring | | $ | 528 | | | $ | 7,750 | | | $ | 796 | | | $ | 59 | | | $ | 9,133 | |
| | | Year ended December 31, 2011 | |
| | | Emergency Response | | | Delivery and Service Vehicles | | | Specialty Chassis and Vehicles | | | Other | | | Total | |
Cost of products sold | | | | | | | | | | | | | | | | | | | | |
Asset impairment | | $ | 409 | | | $ | - | | | $ | - | | | $ | - | | | $ | 409 | |
Inventory impairment | | | 214 | | | | - | | | | 1,103 | | | | - | | | | 1,317 | |
Accrual for severance | | | - | | | | - | | | | 5 | | | | - | | | | 5 | |
Total cost of products sold | | | 623 | | | | - | | | | 1,108 | | | | - | | | | 1,731 | |
| | | | | | | | | | | | | | | | | | | | | |
General and Administrative | | | | | | | | | | | | | | | | | | | | |
Asset impairment | | | 10 | | | | - | | | | - | | | | 767 | | | | 777 | |
Accrual for severance | | | - | | | | - | | | | 160 | | | | 113 | | | | 273 | |
Total general and administrative | | | 10 | | | | - | | | | 160 | | | | 880 | | | | 1,050 | |
| | | | | | | | | | | | | | | | | | | | | |
Total restructuring | | $ | 633 | | | $ | - | | | $ | 1,268 | | | $ | 880 | | | $ | 2,781 | |
SPARTAN MOTORS, INC. AND SUBSIDIARIES
NOTES TO CONSOLIDATED FINANCIAL STATEMENTS
(Dollar amounts in thousands, except per share data)
NOTE 14OTE 15 – EARNINGS PER SHARE
The table below reconciles basic weighted average common shares outstanding to diluted weighted average shares outstanding for 2013, 20122016, 2015 and 20112014 (in thousands). The stock awards noted as antidilutive were not included in the diluted (in the case of stock options) or basic (in the case of unvested restricted stock awards) weighted average common shares outstanding. Although these stock awards were not included in the Company’sour calculation of basic or diluted earnings per share (“EPS”), they may have a dilutive effect on the EPS calculation in future periods if the price of theour common stock increases or we report net earnings.increases.
| | | Year Ended December 31, | | | Year Ended December 31, | |
| | | 2013 | | | 2012 | | | 2011 | | | 2016 | | | 2015 | | | 2014 | |
Basic weighted average common shares outstanding | | | 33,550 | | | | 33,165 | | | | 33,438 | | | | 34,405 | | | | 33,826 | | | | 34,251 | |
Effect of dilutive stock options | | | - | | | | - | | | | 50 | | | | - | | | | - | | | | 5 | |
Diluted weighted average common shares outstanding | | | 33,550 | | | | 33,165 | | | | 33,488 | | | | 34,405 | | | | 33,826 | | | | 34,256 | |
| | | | | | | | | | | | | | | | | | | | | | | | | |
Antidilutive stock awards: | | | | | | | | | | | | | | | | | | | | | | | | |
Stock options | | | 45 | | | | 250 | | | | 65 | | | | - | | | | - | | | | 175 | |
Unvested restricted stock awards | | | 531 | | | | 637 | | | | - | | | | - | | | | 403 | | | | - | |
NOTE 1516 - BUSINESS SEGMENTS
The Company identifies itsWe identify our reportable segments based on itsour management structure and the financial data utilized by itsour chief operating decision makermakers to assess segment performance and allocate resources among the Company’sour operating units. The Company hasWe have three reportable segments: Emergency Response Vehicles, DeliveryFleet Vehicles and Service Vehicles,Services, and Specialty Chassis and Vehicles.
The Emergency Response Vehicles segment consists of the emergency response chassis operations of Spartan Chassisat our Charlotte, Michigan location and theour operations of Crimson, Crimson Aerials, Classic Fireat our Brandon, South Dakota and Spartan-Gimaex.Ephrata, Pennsylvania locations, along with our Spartan-Gimaex joint venture. This segment engineers and manufactures emergency response chassis and bodies.vehicles and distributes related aftermarket parts and accessories.
The DeliveryFleet Vehicles and Service VehiclesServices segment consists of Utilimasterour operations at our Bristol, Indiana location and focuses on designing and manufacturing walk-in vans forused in the parcel delivery, mobile retail, and service markettrades and construction industries, along with the production of commercial truck bodies, along withand supplies related aftermarket parts and assemblies.accessories.
The Specialty Chassis and Vehicles segment consists of the Spartan Chassisour Charlotte, Michigan operations that engineer and manufacture motor home chassis, defense vehicles and other specialty chassis and distribute related aftermarket parts and assemblies.accessories.
As a result of a realignment of our operating segments completed during the second quarter of 2016, aftermarket parts and accessories related to emergency response vehicles, which were formerly reported under the Specialty Chassis and Vehicles segment, are now included in the Emergency Response Vehicles segment. Segment results from 2015 and 2014 are shown reflecting the change. Appropriate expense amounts are allocated to the three reportable segments and are included in their reported operating income or loss.
The accounting policies of the segments are the same as those described, or referred to, in Note 1 - , General and Summary of Accounting Policies.Policies. Assets and related depreciation expense in the column labeled “Other” pertain to capital assets maintained at the corporate level. Segment loss from operations in the “Other” column contains corporate related expenses not allocable to the reportable segments. Interest expense and Taxes on income are not included in the information utilized by the chief operating decision makermakers to assess segment performance and allocate resources, and accordingly, are excluded from the segment results presented below. Intercompany transactions between reportable segments were immaterial in all periods presented.
Sales to customers outside the United States were $33,150, $44,205$31,716, $40,058 and $22,675$55,919 for the years ended December 31, 2013, 20122016, 2015 and 2011,2014, or 7.1%5.4%, 9.4%7.3% and 5.3%11.0%, respectively, of sales for those years. All of the Company’sour long-lived assets are located in the United States.
SPARTAN MOTORS, INC. AND SUBSIDIARIES
NOTES TO CONSOLIDATED FINANCIAL STATEMENTS
(Dollar amounts in thousands, except per share data)
Sales and other financial information by business segment are as follows:
Year Ended December 31, 20132016
| | | Segment | | | | | |
| | | Emergency Response Vehicles | | | Fleet Vehicles and Services | | | Specialty Chassis and Vehicles | | | Other | | | Consolidated | |
Emergency response vehicles sales | | $ | 175,730 | | | $ | - | | | $ | - | | | $ | - | | | $ | 175,730 | |
Fleet vehicles sales | | | - | | | | 206,248 | | | | - | | | | - | | | | 206,248 | |
Motor home chassis sales | | | - | | | | - | | | | 97,999 | | | | - | | | | 97,999 | |
Other specialty vehicles sales | | | - | | | | - | | | | 21,074 | | | | - | | | | 21,074 | |
Aftermarket parts and accessories sales | | | 7,251 | | | | 72,141 | | | | 10,334 | | | | - | | | | 89,726 | |
Total sales | | $ | 182,981 | | | $ | 278,389 | | | $ | 129,407 | | | $ | - | | | $ | 590,777 | |
Depreciation and amortization expense | | $ | 1,143 | | | $ | 3,455 | | | $ | 519 | | | $ | 2,786 | | | $ | 7,903 | |
Operating income (loss) | | | (13,660 | ) | | | 28,740 | | | | 6,846 | | | | (13,301 | ) | | | 8,625 | |
Segment assets | | | 77,887 | | | | 65,277 | | | | 28,825 | | | | 71,305 | | | | 243,294 | |
Capital expenditures | | | 1,558 | | | | 2,011 | | | | 6,842 | | | | 2,999 | | | | 13,410 | |
Year Ended December 31, 2015
| | | Emergency Response Vehicles | | | Deliveryand Service Vehicles | | | Specialty Chassis and Vehicles | | | Other | | | Consolidated | | | Segment | | | | | |
Emergency response chassis sales | | $ | 83,399 | | | $ | - | | | $ | - | | | $ | - | | | $ | 83,399 | | |
Emergency response bodies sales | | | 81,688 | | | | - | | | | - | | | | - | | | | 81,688 | | |
Delivery and service vehicles sales | | | - | | | | 157,291 | | | | - | | | | - | | | | 157,291 | | |
| | | | Emergency Response Vehicles | | | Fleet Vehicles and Services | | | Specialty Chassis and Vehicles | | | Other | | | Consolidated | |
Emergency response vehicles sales | | | $ | 187,127 | | | $ | - | | | $ | - | | | $ | - | | | $ | 187,127 | |
Fleet vehicles sales | | | | - | | | | 193,772 | | | | - | | | | - | | | | 193,772 | |
Motor home chassis sales | | | - | | | | - | | | | 90,008 | | | | - | | | | 90,008 | | | | - | | | | - | | | | 103,264 | | | | - | | | | 103,264 | |
Other specialty vehicles sales | | | - | | | | - | | | | 10,678 | | | | - | | | | 10,678 | | | | - | | | | - | | | | 13,849 | | | | - | | | | 13,849 | |
Aftermarket parts and assemblies sales | | | - | | | | 21,918 | | | | 24,556 | | | | - | | | | 46,474 | | |
Aftermarket parts and accessories sales | | | | 6,093 | | | | 33,911 | | | | 12,398 | | | | - | | | | 52,402 | |
Total sales | | $ | 165,087 | | | $ | 179,209 | | | $ | 125,242 | | | $ | - | | | $ | 469,538 | | | $ | 193,220 | | | $ | 227,683 | | | $ | 129,511 | | | $ | - | | | $ | 550,414 | |
Depreciation and amortization expense | | $ | 1,390 | | | $ | 3,781 | | | $ | 1,498 | | | $ | 2,569 | | | $ | 9,238 | | | $ | 914 | | | $ | 3,631 | | | $ | 408 | | | $ | 2,487 | | | $ | 7,440 | |
Operating income (loss) | | | (7,664 | ) | | | (3,942 | ) | | | 10,030 | | | | (6,622 | ) | | | (8,198 | ) | | | (23,722 | ) | | | 14,530 | | | | 4,906 | | | | (8,193 | ) | | | (12,479 | ) |
Segment assets | | | 80,540 | | | | 78,654 | | | | 24,399 | | | | 69,689 | | | | 253,282 | | | | 76,030 | | | | 70,491 | | | | 24,032 | | | | 60,118 | | | | 230,671 | |
Capital expenditures | | | | 1,010 | | | | 1,323 | | | | 859 | | | | 1,703 | | | | 4,895 | |
Year Ended December 31, 2012
| | | Emergency Response Vehicles | | | Delivery and Service Vehicles | | | Specialty Chassis and Vehicles | | | Other | | | Consolidated | |
Emergency response chassis sales | | $ | 83,576 | | | $ | - | | | $ | - | | | $ | - | | | $ | 83,576 | |
Emergency response bodies sales | | | 78,744 | | | | - | | | | - | | | | - | | | | 78,744 | |
Delivery and service vehicles sales | | | - | | | | 150,255 | | | | - | | | | - | | | | 150,255 | |
Motor home chassis sales | | | - | | | | - | | | | 72,127 | | | | - | | | | 72,127 | |
Other specialty vehicles sales | | | - | | | | - | | | | 7,426 | | | | - | | | | 7,426 | |
Aftermarket parts and assemblies sales | | | - | | | | 57,975 | | | | 20,474 | | | | - | | | | 78,449 | |
Total sales | | $ | 162,320 | | | $ | 208,230 | | | $ | 100,027 | | | $ | - | | | $ | 470,577 | |
Depreciation and amortization expense | | $ | 1,711 | | | $ | 2,648 | | | $ | 1,945 | | | $ | 2,686 | | | $ | 8,990 | |
Operating income (loss) | | | (2,951 | ) | | | 6,035 | | | | 2,198 | | | | (7,873 | ) | | | (2,591 | ) |
Segment assets | | | 77,806 | | | | 73,567 | | | | 27,565 | | | | 66,213 | | | | 245,151 | |
SPARTAN MOTORS, INC. AND SUBSIDIARIES
NOTES TO CONSOLIDATED FINANCIAL STATEMENTS
(Dollar amounts in thousands, except per share data)
Year Ended December 31, 20112014
| | | Emergency Response Vehicles | | | Delivery and Service Vehicles | | | Specialty Chassis and Vehicles | | | Other | | | Consolidated | | | Segment | | | | | |
Emergency response chassis sales | | $ | 80,817 | | | $ | - | | | $ | - | | | $ | - | | | $ | 80,817 | | |
Emergency response bodies sales | | | 73,949 | | | | - | | | | - | | | | - | | | | 73,949 | | |
Delivery and service vehicles sales | | | - | | | | 118,810 | | | | - | | | | - | | | | 118,810 | | |
| | | | Emergency Response Vehicles | | | Fleet Vehicles and Services | | | Specialty Chassis and Vehicles | | | Other | | | Consolidated | |
Emergency response vehicles sales | | | $ | 184,532 | | | $ | - | | | $ | - | | | $ | - | | | $ | 184,532 | |
Fleet vehicles sales | | | | - | | | | 189,016 | | | | - | | | | - | | | | 189,016 | |
Motor home chassis sales | | | - | | | | - | | | | 65,778 | | | | - | | | | 65,778 | | | | - | | | | - | | | | 86,186 | | | | - | | | | 86,186 | |
Other specialty vehicles sales | | | - | | | | - | | | | 16,271 | | | | - | | | | 16,271 | | | | - | | | | - | | | | 9,165 | | | | - | | | | 9,165 | |
Aftermarket parts and assemblies sales | | | - | | | | 46,716 | | | | 23,669 | | | | - | | | | 70,385 | | |
Aftermarket parts and accessories sales | | | | 5,471 | | | | 21,482 | | | | 10,912 | | | | - | | | | 37,865 | |
Total sales | | $ | 154,766 | | | $ | 165,526 | | | $ | 105,718 | | | $ | - | | | $ | 426,010 | | | $ | 190,003 | | | $ | 210,498 | | | $ | 106,263 | | | $ | - | | | $ | 506,764 | |
| | | | | | | | | | | | | | | | | | | | | | |
Depreciation and amortization expense | | $ | 2,322 | | | $ | 2,442 | | | $ | 2,186 | | | $ | 3,060 | | | $ | 10,010 | | | $ | 1,030 | | | $ | 4,297 | | | $ | 669 | | | $ | 2,382 | | | $ | 8,378 | |
Operating income (loss) | | | (95 | ) | | | 10,040 | | | | (2,300 | ) | | | (6,314 | ) | | | 1,331 | | | | (6,280 | ) | | | 8,324 | | | | 6,619 | | | | (9,814 | ) | | | (1,151 | ) |
Segment assets | | | 68,044 | | | | 80,674 | | | | 23,163 | | | | 76,728 | | | | 248,609 | | | | 81,748 | | | | 65,827 | | | | 21,269 | | | | 69,669 | | | | 238,813 | |
Capital expenditures | | | | 516 | | | | 989 | | | | 412 | | | | 1,546 | | | | 3,463 | |
NOTE 1617 – RELATED PARTY TRANSACTIONS
On January 1, 2017, we completed the acquisition of substantially all of the assets and certain liabilities of Smeal Fire Apparatus Co., Smeal Properties, Inc., Ladder Tower Co., and U.S. Tanker Co. pursuant to a Purchase Agreement dated December 12, 2016 (see Note 2, Acquisition Activities (Subsequent Event) for further information). As of December 31, 2016, the total amount of receivables due from from the former owners of Smeal was $7,397. This balance was forgiven as part of the acquisition on January 1, 2017. Sales to the former owners of Smeal were $30,748, $32,600, and $17,785 in 2016, 2015, and 2014.
John Forbes, the President of our Fleet Vehicles and Services segment serves on the Board of Directors of Patrick Industries, Inc. During the years ended December 31, 2016 and 2015, we made purchases of $4,009 and $300 from subsidiaries of Patrick Industries, Inc. for parts used in the manufacture of our products. These purchases were made through a competitive bid process at arms-length.
Richard Dauch, who serves on the Spartan Motors Board of Directors, is the Chief Executive Officer of Accuride, Inc. During the years ended December 31, 2016 and 2015, we made purchases of $836 and $1,000 from Accuride Distributing, a subsidiary of Accuride, Inc., for parts used in the manufacture of our products. These purchases were made through a competitive bid process at arms-length.
NOTE 18 - QUARTERLY FINANCIAL DATA (UNAUDITED)
Summarized quarterly financial data for the yearsyears ended December 31, 20132016 and 20122015 is as follows (full year amounts may not sum due to rounding):
| | | 2013 Quarter Ended | | | 2012 Quarter Ended | |
| | | Mar 31 | | | June 30 | | | Sept 30 | | | Dec 31 | | | Mar 31 | | | June 30 | | | Sept 30 | | | Dec 31 | |
Sales | | $ | 96,136 | | | $ | 120,874 | | | $ | 126,074 | | | $ | 126,454 | | | $ | 118,812 | | | $ | 114,419 | | | $ | 112,857 | | | $ | 124,489 | |
| | | | | | | | | | | | | | | | | | | | | | | | | | | | | | | | | |
Gross profit | | | 6,347 | | | | 15,626 | | | | 16,131 | | | | 14,960 | | | | 13,744 | | | | 18,745 | | | | 12,968 | | | | 13,152 | |
| | | | | | | | | | | | | | | | | | | | | | | | | | | | | | | | | |
Net earnings (loss) attributable to Spartan Motors, Inc. | | | (4,254 | ) | | | 691 | | | | 563 | | | | (2,970 | ) | | | (2,015 | ) | | | 2,351 | | | | (327 | ) | | | (2,466 | ) |
| | | | | | | | | | | | | | | | | | | | | | | | | | | | | | | | | |
Basic net earnings (loss) per share | | | (0.13 | ) | | | 0.02 | | | | 0.02 | | | | (0.09 | ) | | | (0.06 | ) | | | 0.07 | | | | (0.01 | ) | | | (0.07 | ) |
| | | | | | | | | | | | | | | | | | | | | | | | | | | | | | | | | |
Diluted net earnings (loss) per share | | | (0.13 | ) | | | 0.02 | | | | 0.02 | | | | (0.09 | ) | | | (0.06 | ) | | | 0.07 | | | | (0.01 | ) | | | (0.07 | ) |
During the first, second, third and fourth quarters of 2012, the Company incurred restructuring charges of $5,408, $685, $1,643 and $1,397, respectively. The Company did not incur any restructuring charges during 2013.
| | | 2016 Quarter Ended | | | 2015 Quarter Ended | |
| | | Mar 31 | | | June 30 | | | Sept 30 | | | Dec 31 | | | Mar 31 | | | June 30 | | | Sept 30 | | | Dec 31 | |
Sales | | $ | 133,726 | | | $ | 162,537 | | | $ | 148,664 | | | $ | 145,850 | | | $ | 128,372 | | | $ | 144,824 | | | $ | 136,572 | | | $ | 140,647 | |
| | | | | | | | | | | | | | | | | | | | | | | | | | | | | | | | | |
Gross profit | | | 15,820 | | | | 20,807 | | | | 18,010 | | | | 17,890 | | | | 11,533 | | | | 17,442 | | | | 12,808 | | | | 5,329 | |
| | | | | | | | | | | | | | | | | | | | | | | | | | | | | | | | | |
Restructuring charges | | | 339 | | | | 227 | | | | 304 | | | | 224 | | | | 1,155 | | | | 811 | | | | 462 | | | | 427 | |
| | | | | | | | | | | | | | | | | | | | | | | | | | | | | | | | | |
Net earnings (loss) attributable to Spartan Motors, Inc. | | | 543 | | | | 4,379 | | | | 2,745 | | | | 942 | | | | (2,880 | ) | | | 1,177 | | | | (5,818 | ) | | | (9,450 | ) |
| | | | | | | | | | | | | | | | | | | | | | | | | | | | | | | | | |
Basic net earnings (loss) per share | | | 0.02 | | | | 0.13 | | | | 0.08 | | | | 0.03 | | | | (0.09 | ) | | | 0.03 | | | | (0.17 | ) | | | (0.28 | ) |
| | | | | | | | | | | | | | | | | | | | | | | | | | | | | | | | | |
Diluted net earnings (loss) per share | | | 0.02 | | | | 0.13 | | | | 0.08 | | | | 0.03 | | | | (0.09 | ) | | | 0.03 | | | | (0.17 | ) | | | (0.28 | ) |
Item 9. | Changes in and Disagreements with Accountants on Accounting and Financial DisclosureItem 9. Changes in and Disagreements with Accountants on Accounting and Financial Disclosure. |
None.
Item 9A. | Controls and ProceduresItem 9A. Controls and Procedures. |
Evaluation of Disclosure Controls and Procedures.
An evaluation was performed under the supervision and with the participation of the Company’sour management, including the Chief Executive Officer and Chief Financial Officer, of the effectiveness of the design and operation of the Company’sour disclosure controls and procedures (as defined in Rule 13a-15(e) under the Securities Exchange Act of 1934) as of December 31, 2013.2016. Based on and as of the time of such evaluation, the Company’sour management, including the Chief Executive Officer and Chief Financial Officer, concluded that the Company’sour disclosure controls and procedures were effective as of the end of the period covered by this report to ensure that information required to be disclosed by us in the reports that we file or submit is recorded, processed, summarized and reported within the time periods specified in the Securities and Exchange Commission’s rules and forms. Disclosure controls and procedures include, without limitation, controls and procedures designed to ensure that information required to be disclosed by us in the reports that we file or submit under the Securities Exchange Act of 1934 is accumulated and communicated to our management, including our Chief Executive Officer and Chief Financial Officer, as appropriate to allow timely decisions regarding required disclosure.
ManagementManagement’s’s Report on Internal Control Over Financial Reporting.
Management is responsible for establishing and maintaining adequate internal control over financial reporting, as such term is defined in Exchange Act Rules 13a-15(f) and 15d-15(f). Under the supervision and with the participation of our management, including our Chief Executive Officer and Chief Financial Officer, we conducted an evaluation of the effectiveness of our internal control over financial reporting as of December 31, 2013,2016, based on the framework inInternal Control - Integrated Framework (1992) (2013)issued by the Committee of Sponsoring Organizations of the Treadway Commission. Based on that evaluation our management concluded that our internal control over financial reporting was effective as of December 31, 2013.2016. The effectiveness of our internal control over financial reporting as of December 31, 20132016 has been audited by BDO USA, LLP, an independent registered public accounting firm, as stated in its attestation report, which is included in Item 8 and is incorporated into this Item 9A by reference.
Changes in Internal Control Over Financial Reporting.
No changes in our internal control over financial reporting were identified as having occurred during the quarter ended December 31, 20132016 that have materially affected, or are reasonably likely to materially affect, our internal control over financial reporting.
Item 9B. | Other InformationItem 9B. Other Information. |
None.
PART III
Item 10. | Directors, Executive Officers, and Corporate GovernanceItem 10. Directors, Executive Officers, and Corporate Governance. |
The information required by this item, with respect to directors, executive officers, audit committee, and audit committee financial experts of the Company and Section 16(a) beneficial ownership reporting compliance is contained under the captions “Spartan Motors’ Board of Directors and Executive Officers” and “Section 16(a) Beneficial Ownership Reporting Compliance” in the Company’sour definitive proxy statement for itsour annual meeting of shareholders to be held on May 21, 2014,24, 2017, to be filed with the Securities and Exchange Commission no later than 120 days after December 31, 2013,2016, and is incorporated herein by reference.
WeThe Company has have adopted a Code of Ethics that applies to the Company’sour principal executive officer, principal financial officer and principal accounting officer. This Code of Ethics is posted under “Code of Ethics” on the Company’sour website atwww.spartanmotors.com. The Company hasWe have also adopted a Code of Ethics and Compliance applicable to all directors, officers and associates, which is posted under “Code of Conduct” on the Company’sour website atwww.spartanmotors.com. Any waiver from or amendment to a provision of either code will be disclosed on the Company’sour website.
Item 11. | Executive CompensationItem 11. Executive Compensation. |
The information required by this item is contained under the captions “Executive Compensation,” “Compensation of Directors,” “Compensation Committee Report” and “Compensation Committee Interlocks and Insider Participation” in the Company’sour definitive proxy statement for itsour annual meeting of shareholders to be held on May 21, 2014,24, 2017, to be filed with the Securities and Exchange Commission no later than 120 days after December 31, 2013,2016, and is incorporated herein by reference.
Item 12. | Security Ownership of Certain Beneficial Owners and Management and Related Shareholder MattersItem 12. Security Ownership of Certain Beneficial Owners and Management and Related Shareholder Matters. |
The information required by this item (other than that set forth below) is contained under the caption “Ownership of Spartan Motors Stock” in the Company’sour definitive proxy statement for itsour annual meeting of shareholders to be held on May 21, 2014,24, 2017, to be filed with the Securities and Exchange Commission no later than 120 days after December 31, 2013,2016, and is incorporated herein by reference.
The following table provides information about the Company’sour equity compensation plans regarding the number of securities to be issued under these plans upon the exercise of outstanding options, the weighted-average exercise prices of options outstanding under these plans, and the number of securities available for future issuance as of December 31, 2013.2016.
Equity Compensation Plan Information
| | | | | | | | | |
Plan category
| | Number of securities to
be issued upon exercise
of outstanding options,
warrants and rights | | | Weighted average
exercise price of
outstanding options,
warrants and rights | | |
Number of securities
remaining available for
future issuance (3)
| | Number of securities to be issued upon exercise of outstanding options,
warrants and rights | | | Weighted average
exercise price of
outstanding options,
warrants and rights | | | Number of securities
remaining available for
future issuance under equity compensation plans (excluding securities reflected in column (a)) (3) | |
| | | (a) | | | (b) | | | (c) | | (a) | | | (b) | | | (c) | |
Equity compensation plans approved by security holders(1) | | | 538,000 | | | $ | 6.81 | | | | 2,715,000 | | |
Equity compensation plans approved by security holders (1) | | | | 93,000 | | | $ | 7.64 | | | | 2,800,000 | |
Equity compensation plans not approved by security holders (2) | | | -- | | | N/A | | | | 25,000 | | | | -- | | | | N/A | | | | 56,250 | |
Total | | | 538,000 | | | $ | 6.81 | | | | 2,740,000 | | | | 93,000 | | | $ | 7.64 | | | | 2,856,250 | |
(1) | Consists of the Spartan Motors, Inc. Stock Incentive Plan of 20122016 (the “2012“2016 Plan”), and the Spartan Motors, Inc. Stock Incentive Plan of 2007 (the “2007 Plan”), Spartan Motors, Inc. Stock Incentive Plan of 2005 (the “2005 Plan”), the Spartan Motors, Inc. Stock Option and Restricted Stock Plan of 2003 (the “2003 Plan”), the Spartan Motors, Inc. Stock Option and Restricted Stock Plan of 1998 (the “1998 Plan”), and the Spartan Motors, Inc. 1996 Stock Option and Restricted Stock Plan for Outside Market Advisors (the “1996 Plan”). |
| | |
(2) | Consists of the Spartan Motors, Inc. Directors’Directors’ Stock Purchase Plan. This plan provides that non-employee directors of the Company may elect to receive at least 25% and up to 100% of their “director’s fees” in the form of the Company’s common stock. The term “director’s fees” means the amount of income payable to a non-employee director for his or her service as a director of the Company, including payments for attendance at meetings of the Company’s Board of Directors or meetings of committees of the board, and any retainer fee paid to such persons as members of the board. A non-employee director who elects to receive Company common stock in lieu of some or all of his or her director’s fees will, on or shortly after each “applicable date,” receive a number of shares of common stock (rounded down to the nearest whole share) determined by dividing (1) the dollar amount of the director’s fees payable to him or her on the applicable date that he or she has elected to receive in common stock by (2) the market value of common stock on the applicable date. The term “applicable date” means any date on which a director’s fee is payable to the participant. To date, no shares have been issued under this plan. |
| | |
(3) | Each of the plans reflected in the above table contains customary anti-dilution provisions that are applicable in the event of a stock split or certain other changes in the Company’sCompany’s capitalization. Furthermore, each of the 2012 Plan, the 2007 Plan, the 2005 Plan, the 2003 Plan, the 1998 Plan, the 19962016 Plan and the 19942007 Plan provides that if a stock option is canceled, surrendered, modified, expires or is terminated during the term of the plan but before the exercise of the option, the shares subject to the option will be available for other awards under the plan. |
| | |
| | The numbers of shares reflected in column (c) in the table above with respect to the 20122016 Plan (1,731,000 shares), 2007 Plan (777,000 shares) and the 2005 Plan (207,000(2,800,000 shares) represent new shares that may be granted by the Company, and not shares issuable upon the exercise of an existing option, warrant or right. |
Item 13. | Certain Relationships and Related Transactions, and Director IndependenceItem 13. Certain Relationships and Related Transactions, and Director Independence. |
The information required by this item is contained under the captions “Transactions with Related Persons” and “Spartan Motors’Motors’ Board of Directors and Executive Officers” in the Company’sour definitive proxy statement for itsour annual meeting of shareholders to be held on May 21, 2014,24, 2017, to be filed with the Securities and Exchange Commission no later than 120 days after December 31, 2013,2016, and is incorporated herein by reference.
Item 14.
Item 14. | Principal AccountingPrincipal Accounting Fees and Services. |
The information required by this item is contained under the caption “Independent Auditor Fees” in the Company’sour definitive proxy statement for itsour annual meeting of shareholders to be held on May 21, 2014,24, 2017, to be filed with the Securities and Exchange Commission no later than 120 days after December 31, 2013,2016, and is incorporated herein by reference.
PART IV
Item 15. | Exhibits, Financial Statement SchedulesItem 15. Exhibits, Financial Statement Schedules. |
| Item 15(a)(1). | List of Financial Statements.List of Financial Statements. |
The following consolidated financial statements of the Company and its subsidiaries, and reports of our registered independent public accounting firm, are filed as a part of this report under Item 8 - Financial Statements and Supplementary Data:
| | Independent Registered Public Accounting Firm’sFirm’s Report on Consolidated Financial Statements – Years Ended December 31, 2013, 20122016, 2015 and 20112014 |
| | |
| | Independent Registered Public Accounting Firm’sFirm’s Report on Internal Control Over Financial Reporting – December 31, 20132016 |
| | |
| Consolidated Balance Sheets - December 31, 20132016 and December 31, 20122015 |
| |
| Consolidated Statements of Operations - Years Ended December 31, 2013, 20122016, 2015 and 20112014 |
| |
| Consolidated Statements of Shareholders’Shareholders’ Equity - Years Ended December 31, 2013, 20122016, 2015 and 20112014 |
| |
| Consolidated Statements of Cash Flows - Years Ended December 31, 2013, 20122016, 2015 and 20112014 |
| |
| Notes to Consolidated Financial Statements |
| | |
| Item 15(a)(2). | Financial Statement SchedulesItem 15(a)(2). Financial Statement Schedules. Attached as Appendix A. |
The following consolidated financial statement schedule of the Company and its subsidiaries is filed as part of this report:
| | Schedule II-Valuation and Qualifying Accounts |
All other financial statement schedules are not required under the related instructions or are inapplicable and therefore have been omitted.
| Item 15(a)(3).List of Exhibits. The following exhibits are filed as a part of this report: | List of Exhibits. The following exhibits are filed as a part of this report: |
Exhibit
Number | |
Document
|
| | |
3.1 | | Spartan Motors, Inc. Restated Articles of Incorporation, as amended to date. Previously filed as an exhibit to the Company’sCompany’s Form 10-Q Quarterly Report for the period ended June 30, 2007 (Commission File No. 001-33582), and incorporated herein by reference. |
| | |
3.2 | | Spartan Motors, Inc. Bylaws, as amended to date. Previously filed as an exhibit to the Company’sCompany’s Current Report on Form 8-K filed on February 27, 2013 (Commission File No. 001-33582), and incorporated herein by reference. |
| | |
4.1 | | Spartan Motors, Inc. Restated Articles of Incorporation. See Exhibit 3.1 above. |
| | |
4.2 | | Spartan Motors, Inc. Bylaws. See Exhibit 3.2 above. |
| | |
4.3 | | Form of Stock Certificate. Previously filed as an exhibit to the Registration Statement on Form S-18 (Registration No. 2-90021-C) filed on March 19, 1984, and incorporated herein by reference. |
| | |
4.4 | | Rights Agreement dated July 7, 2007, between Spartan Motors, Inc. and American Stock Transfer and Trust Company, which includes the form of Certificate of Designation, Preferences and Rights of Series B Preferred Stock as Exhibit A, the form of Rights Certificate as Exhibit B and the Summary of Rights to Purchase Series B Preferred Stock as Exhibit C. Previously filed as Exhibit 1 to the Company’s Form 8-A (Commission File No. 001-33582) filed on July 10, 2007, and incorporated herein by reference. |
| | | |
4.5 | | The Registrant has several classes of long-term debt instruments outstanding. Theoutstanding, none of which represents an authorized amount of none of these classes of debt exceedsexceeding 10% of the Company’s total consolidated assets, except as furnished under Exhibit 10.13 and Exhibit 10.1510.1 to this Form 10-K below. The Company agrees to furnish copies of any other agreements defining the rights of holders of other such long-term indebtedness to the Securities and Exchange Commission upon request. |
| | |
10.110.1
| | Spartan Motors, Inc. 1996 Stock OptionEmployment Letter Agreement dated October 23, 2015, between the Company and Restricted Stock Plan for Outside Market Advisors, as amended.John W. Slawson. Previously filed as an exhibitExhibit 10.1 to the Company’s Annual Report on Form 10-K for the period ended December 31, 20052015 (Commission File No. 001-13611),001-33582) and incorporated herein by reference.*
|
| | |
10.210.2
| | Spartan Motors, Inc. Stock Option and Restricted StockIncentive Plan of 1998, as amended.2016. Previously filed as an exhibitAppendix A to the Company’s Annual Reportdefinitive proxy statement on Form 10-K forSchedule 14A filed with the period ended December 31, 2005SEC on April 8, 2016 (Commission File No. 001-13611)001-33582), and incorporated herein by reference.* |
| | |
10.3
| | Spartan Motors, Inc. Stock Option and Restricted Stock Plan of 2003, as amended. Previously filed as an exhibit to the Company’s Annual Report on Form 10-K for the period ended December 31, 2005 (Commission File No. 001-13611), and incorporated herein by reference.*
|
| | |
10.410.3
| | Spartan Motors, Inc. Stock Incentive Plan of 2005,2007, as amended. Previously filed as Appendix A to the Company’s 2007 Proxy Statement filed April 23, 2007 (Commission File No. 000-13611) and incorporated herein by reference.* |
| | |
10.4 | | Spartan Motors, Inc. Leadership Team Compensation Plan. Previously filed as an exhibit to the Company’s Quarterly Report on Form 10-Q for the period ended SeptemberJune 30, 2005 (Commission File No. 001-13611), and incorporated herein by reference.* |
Exhibit
Number | | Document |
| | |
10.5
| | Spartan Motors, Inc. Stock Incentive Plan of 2007, as amended. Previously filed as Appendix A to the Company’s 2007 Proxy Statement filed April 23, 2007 and incorporated herein by reference.*
|
| | |
10.6
| | Spartan Motors, Inc. Executive Leadership Team Incentive Compensation Framework. Previously filed as an exhibit to the Company’s Annual Report on Form 10-K for the period ended December 31, 20112015 (Commission File No. 001-33582), and incorporated herinherein by reference.*
|
| | |
10.710.5
| | Spartan Motors, Inc. Directors’Directors’ Stock Purchase Plan. Previously filed as an exhibit to the Company’s Form S-8 Registration Statement (Registration No. 333-98083) filed on August 14, 2002, and incorporated herein by reference.* |
Exhibit
Number | | Document |
| | |
| | |
10.810.6
| | Form of Stock Appreciation Rights Agreement. Previously filed as an exhibit to the Company’sCompany’s Annual Report on Form 10-K for the period ended December 31, 2007 (Commission File No. 001-33582) and incorporated herein by reference.* |
| | |
10.910.7
| | Form of Restricted Stock Agreement. Previously filed as an exhibit to the Company’sCompany’s Quarterly Report on Form 10-Q for the period ended June 30, 2009 (Commission File No. 001-33582), and incorporated herein by reference.* |
| | |
10.1010.8
| | Form of Indemnification Agreement. Previously filed as an exhibit to the Company’sCompany’s Annual Report on Form 10-K for the period ended December 31, 2005 (Commission File No. 001-13611)000-13611), and incorporated herein by reference.* |
| | | |
10.1110.9
| | Supplemental Executive Retirement Plan. Previously filed as an exhibit to the Company’sCompany’s Annual Report on Form 10-K for the period ended December 31, 2007 (Commission File No. 001-33582), and incorporated herein by reference. * |
| | | |
10.12
| | Amended and Restated Note Purchase and Private Shelf Agreement with Prudential Investment Management, Inc. and certain of its affiliates and managed accounts, dated November 30, 2009. Previously filed as an exhibit to the Company’s Annual Report on Form 10-K for the period ended December 31, 2009 (Commission File No. 001-33582), and incorporated herein by reference. Amendment No. 1 to Amended and Restated Note Purchase and Private Shelf Agreement with Prudential Investment Management, Inc. and certain of its affiliates and managed accounts, dated February 12, 2012. Previously filed as an exhibit to the Company’s Annual Report on Form 10-K for the period ended December 31, 2012 (Commission File No. 001-33582), and incorporated herein by reference. Amendment No. 2 to Amended and Restated Note Purchase and Private Shelf Agreement with Prudential Investment Management, Inc. and certain of its affiliates and managed accounts, dated November 30, 2012. Previously filed as an exhibit to the Company’s Annual Report on Form 10-K for the period ended December 31, 2012 (Commission File No. 001-33582), and incorporated herein by reference.
|
| | |
10.13
| | Agreement and Plan of Merger, dated as of November 18, 2009, by and among Spartan Motors, Inc.; SMI Sub, Inc.; Utilimaster Holdings, Inc.; Utilimaster Corporation; and John Hancock Life Insurance Company; as amended by a First Amendment to Agreement and Plan of Merger dated as of November 30, 2009. Previously filed as an exhibit to the Company’s Annual Report on Form 10-K for the period ended December 31, 2009 (Commission File No. 001-33582), and incorporated herein by reference.
|
Exhibit
Number | | Document |
| | |
10.14
| | Amended and Restated Credit Agreement, dated December 16, 2011, by and among the Company, Wells Fargo Bank, National Association, as administrative agent, and the lenders party thereto. Previously filed as an exhibit to the Company’s Annual Report on Form 10-K for the period ended December 31, 2011 (Commission File No. 001-33582), and incorporated herein by reference.
|
| | |
10.1510.10
| | Spartan Motors, Inc. Stock Incentive Plan of 2012. Previously filed as Exhibit 10.1 to the Company's Current Report on Form 8-K filed May 15, 2012 (Commission File No. 001-33582), and incorporated herein by reference.* |
| | | |
10.1610.11
| | Lease agreement dated February 13, 2012 between the Company and Fruit Hills Investments, LLC. Previously filed as Exhibit 10.1 to the Company's Quarterly Report on Form 10-Q for the period ended March 31, 2012 (Commission File No. 001-33582) and incorporated herein by reference. |
| | | |
10.12 | | Second Amended and Restated Credit Agreement, dated October 31, 2016, by and among the Company, Wells Fargo Bank, National Association, as administrative agent, and the lenders party thereto. |
Exhibit
Number | | Document |
| | |
10.13 | | Employment Letter Agreement dated July 22, 2014, between Spartan Motors, Inc. and Daryl M. Adams. Previously filed as Exhibit 10.1 to the Company’s Quarterly Report on Form 10-Q for the period ended September 30, 2014 (Commission File No. 001-33582), and incorporated herein by reference.* |
| | |
10.14 | | Employment Letter Agreement dated September 15, 2015, between Spartan Motors, Inc. and Frederick J. Sohm. Previously filed as Exhibit 10.1 to the Company’s Quarterly Report on Form 10-Q for the period ended September 30, 2015 (Commission File No. 001-33582), and incorporated herein by reference.* |
| | |
10.15 | | Employment Letter Agreement Dated January 6, 2005 between Spartan Motors, Inc. and Arthur D. Ickes. Previously filed as Exhibit 10.21 to the Company’s Annual Report on Form 10-K for the period ended December 31, 2015 (Commission File No. 001-33582) and incorporated herein by reference.* |
| | |
10.16 | | Employment Letter Agreement dated October 30, 2008 between Spartan Motors, Inc. and Thomas T. Kivell. Previously filed as Exhibit 10.22 to the Company’s Annual Report on Form 10-K for the period ended December 31, 2015 (Commission File No. 001-33582) and incorporated herein by reference.* |
| | |
10.17 | | Employment Agreement dated May 7, 2009, between Utilimaster Holdings, Inc. and John A. Forbes. Previously filed as Exhibit 10.23 to the Company’s Annual Report on Form 10-K for the period ended December 31, 2015 (Commission File No. 001-33582) and incorporated herein by reference.* |
| | |
10.18 | | Employment Letter Agreement dated December 23, 2014 between Spartan Motors, Inc. and Steve Guillaume. Previously filed as Exhibit 10.24 to the Company’s Annual Report on Form 10-K for the period ended December 31, 2015 (Commission File No. 001-33582) and incorporated herein by reference.* |
| | |
10.19 | | Employment Letter Agreement dated May 11, 2015 between Spartan Motors, Inc. and Steve Guillaume. Previously filed as Exhibit 10.25 to the Company’s Annual Report on Form 10-K for the period ended December 31, 2015 (Commission File No. 001-33582) and incorporated herein by reference.* |
| | |
| 10.20 | | Employment Letter Agreement dated July 14, 2014 between Spartan Motors, Inc. and Thomas C. Schultz.* |
| | |
| 10.21 | | Asset Purchase Agreement, dated as of December 12, 2016, by and among Spartan Motors USA, Inc., Smeal Fire Apparatus Co., Smeal Properties, Inc., Ladder Tower Co., U.S. Tanker Co., and Rodney Cerny, as Representative. Previously filed as Exhibit 99.1 to the Company's Current Report on Form 8-K filed with the SEC on January 5, 2017, and incorporated herein by reference. |
| | |
21 | | Subsidiaries of Registrant. |
| | |
23 | | Consent of BDO USA, LLP, Independent Registered Public Accounting firm. |
Exhibit
Number | | Document |
| | | |
24 | | Limited Powers of Attorney. |
| | |
31.1 | | Certification of President and Chief Executive Officer pursuant to Section 302 of the Sarbanes-Oxley Act. |
| | |
31.2 | | Certification of Chief Financial Officer, Secretary and Treasurer pursuant to Section 302 of the Sarbanes-Oxley Act. |
| | |
32
| | Certification pursuant to 18 U.S.C. § 1350.
|
| | |
101.INS
| | XBRL Instance Document
|
| | |
101.SCH
| | XBRL Schema Document
|
| | |
101.CAL
| | XBRL Calculation Linkbase Document
|
| | |
101.DEF
| | XBRL Definition Linkbase Document
|
| | |
101.LAB
| | XBRL Label Linkbase Document
|
| | |
101.PRE
| | XBRL Presentation Linkbase Document
|
*Management contract or compensatory plan or arrangement.
The Company will furnish a copy of any exhibit listed above to any shareholder of the Company without charge upon written request to: Chief Financial Officer, Spartan Motors, Inc., 1541 Reynolds Road, Charlotte, Michigan 48813.
SIGNATURES
Pursuant to the requirements of Section 13 or 15(d) of the Securities Exchange Act of 1934, the registrant has duly caused this report to be signed on its behalf by the undersigned, thereunto duly authorized.
| SPARTAN MOTORS, INC.
|
| | |
March 13, 2014
| By
| /s/ Lori L. Wade
|
| | Lori L. Wade
Chief Financial Officer
(Principal Financial and Accounting Officer)
|
Pursuant to the requirements of the Securities Exchange Act of 1934, this report has been signed below by the following persons on behalf of the registrant and in the capacities and on the dates indicated.
March 13, 2014
| By
| /s/ John E. Sztykiel
|
| | John E. Sztykiel
Director, President and Chief Executive Officer
(Principal Executive Officer)
|
| | |
| | |
March 13, 2014
| By
| /s/ Lori L. Wade
|
| | Lori L. Wade
Chief Financial Officer
(Principal Financial and Accounting Officer)
|
| | |
| | |
March 13, 2014
| By
| * /s/ Lori L. Wade
|
| | Richard R. Current, Director
|
| | |
| | |
March 13, 2014
| By
| * /s/ Lori L. Wade
|
| | Richard F. Dauch, Director
|
| | |
| | |
March 13, 2014
| By
| * /s/ Lori L. Wade
|
| | Ronald Harbour, Director
|
| | |
| | |
March 13, 2014
| By
| * /s/ Lori L. Wade
|
| | Kenneth Kaczmarek, Director
|
| | |
| | |
March 13, 2014
| By
| * /s/ Lori L. Wade
|
| | Andrew Rooke, Director
|
| | |
March 13, 2014
| By
| * /s/ Lori L. Wade
|
| | Hugh W. Sloan, Director
|
| | |
| | |
March 13, 2014
| *By
| /s/ Lori L. Wade
|
| | Lori L. Wade
Attorney-in-Fact
|
APPENDIX A
SCHEDULE II
VALUATION AND QUALIFYING ACCOUNTS
SPARTAN MOTORS, INC. AND SUBSIDIARIES
Column A | | Column B | | | Column C | | | Column D | | | Column E | |
| | | | | | | | | | | | | | | | | | | | | |
Description
| |
Balance at
Beginning
of Period
| | |
Additions
Charged to
Costs and
Expenses
| | | Additions
Charged to
Other
Accounts
(Acquisition) | | |
Deductions
| | |
Balance
at End
of Period
| |
| | | | | | | | | | | | | | | | | | | | | |
Year ended December 31, 2013: | | | | | | | | | | | | | | | | | | | | |
| | | | | | | | | | | | | | | | | | | | | |
Allowance for doubtful accounts | | $ | 1,021 | | | $ | 15 | | | $ | -- | | | $ | (267 | ) | | $ | 769 | |
| | | | | | | | | | | | | | | | | | | | | |
Reserve for slow-moving inventory | | | 3,056 | | | | 2,645 | | | | -- | | | | (3,406 | ) | | | 2,295 | |
| | | | | | | | | | | | | | | | | | | | | |
Accrued warranty | | | 6,062 | | | | 5,911 | | | | -- | | | | (4,394 | ) | | | 7,579 | |
| | | | | | | | | | | | | | | | | | | | | |
Valuation allowance for deferred tax assets | | | 3,586 | | | | 110 | | | | -- | | | | (130 | ) | | | 3,567 | |
| | | | | | | | | | | | | | | | | | | | | |
Year ended December 31, 2012: | | | | | | | | | | | | | | | | | | | | |
| | | | | | | | | | | | | | | | | | | | | |
Allowance for doubtful accounts | | $ | 749 | | | $ | 324 | | | $ | -- | | | $ | (52 | ) | | $ | 1,021 | |
| | | | | | | | | | | | | | | | | | | | | |
Reserve for slow-moving inventory | | | 3,565 | | | | 671 | | | | -- | | | | (1,180 | ) | | | 3,056 | |
| | | | | | | | | | | | | | | | | | | | | |
Accrued warranty | | | 5,802 | | | | 5,102 | | | | -- | | | | (4,842 | ) | | | 6,062 | |
| | | | | | | | | | | | | | | | | | | | | |
Valuation allowance for deferred tax assets | | | 3,546 | | | | 50 | | | | -- | | | | (10 | ) | | | 3,586 | |
| | | | | | | | | | | | | | | | | | | | | |
Year ended December 31, 2011: | | | | | | | | | | | | | | | | | | | | |
| | | | | | | | | | | | | | | | | | | | | |
Allowance for doubtful accounts | | $ | 996 | | | $ | 15 | | | $ | -- | | | $ | (262 | ) | | $ | 749 | |
| | | | | | | | | | | | | | | | | | | | | |
Reserve for slow-moving inventory | | | 3,687 | | | | 2,741 | | | | 35 | | | | (2,898 | ) | | | 3,565 | |
| | | | | | | | | | | | | | | | | | | | | |
Accrued warranty | | | 5,702 | | | | 2,750 | | | | 140 | | | | (2,790 | ) | | | 5,802 | |
| | | | | | | | | | | | | | | | | | | | | |
Valuation allowance for deferred tax assets | | | 3,649 | | | | 111 | | | | -- | | | | (214 | ) | | | 3,546 | |
EXHIBIT INDEX
Exhibit
Number
| |
Document
|
| | |
3.1
| | Spartan Motors, Inc. Restated Articles of Incorporation, as amended to date. Previously filed as an exhibit to the Company’s Form 10-Q Quarterly Report for the period ended June 30, 2007 (Commission File No. 001-33582), and incorporated herein by reference.
|
| | |
3.2
| | Spartan Motors, Inc. Bylaws, as amended to date. Previously filed as an exhibit to the Company’s Current Report on Form 8-K filed on February 27, 2013 (Commission File No. 001-33582), and incorporated herein by reference.
|
| | |
4.1
| | Spartan Motors, Inc. Restated Articles of Incorporation. See Exhibit 3.1 above.
|
| | |
4.2
| | Spartan Motors, Inc. Bylaws. See Exhibit 3.2 above.
|
| | |
4.3
| | Form of Stock Certificate. Previously filed as an exhibit to the Registration Statement on Form S-18 (Registration No. 2-90021-C) filed on March 19, 1984, and incorporated herein by reference.
|
| | |
4.4
| | Rights Agreement dated July 7, 2007, between Spartan Motors, Inc. and American Stock Transfer and Trust Company, which includes the form of Certificate of Designation, Preferences and Rights of Series B Preferred Stock as Exhibit A, the form of Rights Certificate as Exhibit B and the Summary of Rights to Purchase Series B Preferred Stock as Exhibit C. Previously filed as Exhibit 1 to the Company’s Form 8-A filed on July 10, 2007, and incorporated herein by reference.
|
| | |
4.5
| | The Registrant has several classes of long-term debt instruments outstanding. The authorized amount of none of these classes of debt exceeds 10% of the Company’s total consolidated assets, except as furnished under Exhibit 10.13 and Exhibit 10.15 to this Form 10-K below. The Company agrees to furnish copies of any other agreements defining the rights of holders of other such long-term indebtedness to the Securities and Exchange Commission upon request.
|
| | |
10.1
| | Spartan Motors, Inc. 1996 Stock Option and Restricted Stock Plan for Outside Market Advisors, as amended. Previously filed as an exhibit to the Company’s Annual Report on Form 10-K for the period ended December 31, 2005 (Commission File No. 001-13611), and incorporated herein by reference.*
|
| | |
10.2
| | Spartan Motors, Inc. Stock Option and Restricted Stock Plan of 1998, as amended. Previously filed as an exhibit to the Company’s Annual Report on Form 10-K for the period ended December 31, 2005 (Commission File No. 001-13611), and incorporated herein by reference.*
|
| | |
10.3
| | Spartan Motors, Inc. Stock Option and Restricted Stock Plan of 2003, as amended. Previously filed as an exhibit to the Company’s Annual Report on Form 10-K for the period ended December 31, 2005 (Commission File No. 001-13611), and incorporated herein by reference.*
|
| | |
10.4
| | Spartan Motors, Inc. Stock Incentive Plan of 2005, as amended. Previously filed as an exhibit to the Company’s Quarterly Report on Form 10-Q for the period ended September 30, 2005 (Commission File No. 001-13611), and incorporated herein by reference.*
|
10.5
| | Spartan Motors, Inc. Stock Incentive Plan of 2007, as amended. Previously filed as Appendix A to the Company’s 2007 Proxy Statement filed April 23, 2007 and incorporated herein by reference.*
|
| | |
10.6
| | Spartan Motors, Inc. Executive Leadership Team Incentive Compensation Framework. Previously filed as an exhibit to the Company’s Annual Report on Form 10-K for the period ended December 31, 2011 (Commission File No. 001-33582), and incorporated herin by reference.*
|
| | |
10.7
| | Spartan Motors, Inc. Directors’ Stock Purchase Plan. Previously filed as an exhibit to the Company’s Form S-8 Registration Statement (Registration No. 333-98083) filed on August 14, 2002, and incorporated herein by reference.*
|
| | |
10.8
| | Form of Stock Appreciation Rights Agreement. Previously filed as an exhibit to the Company’s Annual Report on Form 10-K for the period ended December 31, 2007 (Commission File No. 001-33582), and incorporated herein by reference.*
|
| | |
10.9
| | Form of Restricted Stock Agreement. Previously filed as an exhibit to the Company’s Quarterly Report on Form 10-Q for the period ended June 30, 2009 (Commission File No. 001-33582), and incorporated herein by reference.*
|
| | |
10.10
| | Form of Indemnification Agreement. Previously filed as an exhibit to the Company’s Annual Report on Form 10-K for the period ended December 31, 2005 (Commission File No. 001-13611), and incorporated herein by reference.*
|
| | |
10.11
| | Supplemental Executive Retirement Plan.* Previously filed as an exhibit to the Company’s Annual Report on Form 10-K for the period ended December 31, 2007 (Commission File No. 001-33582) and incorporated herein by reference.
|
| | |
10.12
| | Amended and Restated Note Purchase and Private Shelf Agreement with Prudential Investment Management, Inc. and certain of its affiliates and managed accounts, dated November 30, 2009. Previously filed as an exhibit to the Company’s Annual Report on Form 10-K for the period ended December 31, 2009 (Commission File No. 001-33582), and incorporated herein by reference. Amendment No. 1 to Amended and Restated Note Purchase and Private Shelf Agreement with Prudential Investment Management, Inc. and certain of its affiliates and managed accounts, dated February 12, 2012. Previously filed as an exhibit to the Company’s Annual Report on Form 10-K for the period ended December 31, 2012 (Commission File No. 001-33582), and incorporated herein by reference. Amendment No. 2 to Amended and Restated Note Purchase and Private Shelf Agreement with Prudential Investment Management, Inc. and certain of its affiliates and managed accounts, dated November 30, 2012. Previously filed as an exhibit to the Company’s Annual Report on Form 10-K for the period ended December 31, 2012 (Commission File No. 001-33582), and incorporated herein by reference.
|
| | |
10.13
| | Agreement and Plan of Merger, dated as of November 18, 2009, by and among Spartan Motors, Inc.; SMI Sub, Inc.; Utilimaster Holdings, Inc.; Utilimaster Corporation; and John Hancock Life Insurance Company; as amended by a First Amendment to Agreement and Plan of Merger dated as of November 30, 2009. Previously filed as an exhibit to the Company’s Annual Report on Form 10-K for the period ended December 31, 2009 (Commission File No. 001-33582), and incorporated herein by reference.
|
| | |
10.14
| | Amended and Restated Credit Agreement, dated December 16, 2011, by and among the Company, Wells Fargo Bank, National Association, as administrative agent, and the lenders party thereto. Previously filed as an exhibit to the Company’s Annual Report on Form 10-K for the period ended December 31, 2011 (Commission File No. 001-33582), and incorporated herein by reference.
|
10.15
| | Spartan Motors, Inc. Stock Incentive Plan of 2012. Previously filed as Exhibit 10.1 to the Company's Current Report on Form 8-K filed May 15, 2012 (Commission File No. 001-33582), and incorporated herein by reference.*
|
| | |
10.16
| | Lease agreement dated February 13, 2012 between the Company and Fruit Hills Investments, LLC. Previously filed as Exhibit 10.1 to the Company's Quarterly Report on Form 10-Q for the period ended March 31, 2012 (Commission File No. 001-33582) and incorporated herein by reference.
|
| | |
21
| | Subsidiaries of Registrant.
|
| | |
23
| | Consent of BDO USA, LLP, Independent Registered Public Accounting firm.
|
| | |
24
| | Limited Powers of Attorney.
|
| | |
31.1
| | Certification of President and Chief Executive Officer pursuant to Section 302 of the Sarbanes-Oxley Act.
|
| | |
31.2
| | Certification of Chief Financial Officer, Secretary and Treasurer pursuant to Section 302 of the Sarbanes-Oxley Act.
|
| | |
32 | | Certification pursuant to 18 U.S.C. § 1350. |
| | | |
101.INS | | XBRL Instance Document |
| | | |
101.SCH | | XBRL Schema Document |
| | | |
101.CAL | | XBRL Calculation Linkbase Document |
| | | |
101.DEF | | XBRL Definition Linkbase Document |
| | | |
101.LAB | | XBRL Label Linkbase Document |
| | | |
101.PRE | | XBRL Presentation Linkbase Document |
_________________________
*Management contract or compensatory plan or arrangement.
The Company will furnish a copy of any exhibit listed above to any shareholder of the Company without charge upon written request to: Chief Financial Officer, Spartan Motors, Inc., 1541 Reynolds Road, Charlotte, Michigan 48813.
Item 16. | Form 10-K Summary |
None.
SIGNATURES
Pursuant to the requirements of Section 13 or 15(d) of the Securities Exchange Act of 1934, the registrant has duly caused this report to be signed on its behalf by the undersigned, thereunto duly authorized.
| SPARTAN MOTORS, INC. |
| | |
March 3, 2017 | By | /s/ Frederick J. Sohm |
| | Frederick J. Sohm
Chief Financial Officer (Principal Financial and Accounting Officer) |
Pursuant to the requirements of the Securities Exchange Act of 1934, this report has been signed below by the following persons on behalf of the registrant and in the capacities and on the dates indicated.
March 3, 2017 | By | /s/ Daryl M. Adams |
| | Daryl M. Adams Director, President and Chief Executive Officer
(Principal Executive Officer) |
| | |
| | |
March 3, 2017 | By | /s/ Frederick J. Sohm |
| | Frederick J. Sohm
Chief Financial Officer (Principal Financial and Accounting Officer) |
| | |
| | |
March 3, 2017 | By | * /s/ Frederick J. Sohm |
| | Richard R. Current, Director |
| | |
| | |
March 3, 2017 | By | * /s/ Frederick J. Sohm |
| | Ronald Harbour, Director |
| | |
| | |
March 3, 2017 | By | * /s/ Frederick J. Sohm |
| | Hugh W. Sloan, Director |
| | |
| | |
March 3, 2017 | By | * /s/ Frederick J. Sohm |
| | James A. Sharman, Director |
| | |
| | |
March 3, 2017 | By | * /s/ Frederick J. Sohm |
| | James C. Orchard, Director |
| | |
| | |
March 3, 2017 | * By | /s/ Frederick J. Sohm |
| | Frederick J. Sohm Attorney-in-Fact |
APPENDIX A
SCHEDULE II
VALUATION AND QUALIFYING ACCOUNTS
SPARTAN MOTORS, INC. AND SUBSIDIARIES
Column A | | Column B | | | Column C | | | Column D | | | Column E | |
| | | | | | | | | | | | | | | | | | | | | |
Description
| |
Balance at
Beginning
of Period
| | |
Additions
Charged to
Costs and
Expenses
| | | Additions
Charged to
Other
Accounts
(Acquisition) | | |
Deductions
| | |
Balance
at End
of Period
| |
| | | | | | | | | | | | | | | | | | | | | |
Year ended December 31, 2016: | | | | | | | | | | | | | | | | | | | | |
| | | | | | | | | | | | | | | | | | | | | |
Allowance for doubtful accounts | | $ | 130 | | | $ | 368 | | | $ | - | | | $ | (11 | ) | | $ | 487 | |
| | | | | | | | | | | | | | | | | | | | | |
Reserve for slow-moving inventory | | | 3,230 | | | | 2,984 | | | | - | | | | (2,846 | ) | | | 3,368 | |
| | | | | | | | | | | | | | | | | | | | | |
Accrued warranty | | | 16,610 | | | | 12,989 | | | | - | | | | (10,265 | ) | | | 19,334 | |
| | | | | | | | | | | | | | | | | | | | | |
Valuation allowance for deferred tax assets | | | 12,534 | | | | - | | | | - | | | | (2,932 | ) | | | 9,602 | |
| | | | | | | | | | | | | | | | | | | | | |
Year ended December 31, 2015: | | | | | | | | | | | | | | | | | | | | |
| | | | | | | | | | | | | | | | | | | | | |
Allowance for doubtful accounts | | $ | 144 | | | $ | 12 | | | $ | - | | | $ | (26 | ) | | $ | 130 | |
| | | | | | | | | | | | | | | | | | | | | |
Reserve for slow-moving inventory | | | 3,588 | | | | 3,973 | | | | - | | | | (4,331 | ) | | | 3,230 | |
| | | | | | | | | | | | | | | | | | | | | |
Accrued warranty | | | 9,237 | | | | 15,388 | | | | - | | | | (8,015 | ) | | | 16,610 | |
| | | | | | | | | | | | | | | | | | | | | |
Valuation allowance for deferred tax assets | | | 3,062 | | | | 9,472 | | | | - | | | | - | | | | 12,534 | |
| | | | | | | | | | | | | | | | | | | | | |
Year ended December 31, 2014: | | | | | | | | | | | | | | | | | | | | |
| | | | | | | | | | | | | | | | | | | | | |
Allowance for doubtful accounts | | $ | 769 | | | $ | 71 | | | $ | - | | | $ | (696 | ) | | $ | 144 | |
| | | | | | | | | | | | | | | | | | | | | |
Reserve for slow-moving inventory | | | 2,295 | | | | 5,343 | | | | - | | | | (4,050 | ) | | | 3,588 | |
| | | | | | | | | | | | | | | | | | | | | |
Accrued warranty | | | 7,579 | | | | 6,533 | | | | - | | | | (4,875 | ) | | | 9,237 | |
| | | | | | | | | | | | | | | | | | | | | |
Valuation allowance for deferred tax assets | | | 3,567 | | | | - | | | | - | | | | (505 | ) | | | 3,062 | |
EXHIBIT INDEX
Exhibit
Number | |
Document
|
| | |
3.1 | | Spartan Motors, Inc. Restated Articles of Incorporation, as amended to date. Previously filed as an exhibit to the Company’s Form 10-Q Quarterly Report for the period ended June 30, 2007 (Commission File No. 001-33582), and incorporated herein by reference. |
| | |
3.2 | | Spartan Motors, Inc. Bylaws, as amended to date. Previously filed as an exhibit to the Company’s Current Report on Form 8-K filed on February 27, 2013 (Commission File No. 001-33582), and incorporated herein by reference. |
| | |
4.1 | | Spartan Motors, Inc. Restated Articles of Incorporation. See Exhibit 3.1 above. |
| | |
4.2 | | Spartan Motors, Inc. Bylaws. See Exhibit 3.2 above. |
| | |
4.3 | | Form of Stock Certificate. Previously filed as an exhibit to the Registration Statement on Form S-18 (Registration No. 2-90021-C) filed on March 19, 1984, and incorporated herein by reference. |
| | |
4.4 | | Rights Agreement dated July 7, 2007, between Spartan Motors, Inc. and American Stock Transfer and Trust Company, which includes the form of Certificate of Designation, Preferences and Rights of Series B Preferred Stock as Exhibit A, the form of Rights Certificate as Exhibit B and the Summary of Rights to Purchase Series B Preferred Stock as Exhibit C. Previously filed as Exhibit 1 to the Company’s Form 8-A (Commission File No. 001-33582) filed on July 10, 2007, and incorporated herein by reference. |
| | |
4.5 | | The Registrant has several classes of long-term debt instruments outstanding, none of which represents an authorized amount of debt exceeding 10% of the Company’s total consolidated assets, except as furnished under Exhibit 10.1 to this Form 10-K below. The Company agrees to furnish copies of any other agreements defining the rights of holders of other such long-term indebtedness to the Securities and Exchange Commission upon request. |
| | |
10.1 | | Employment Letter Agreement dated October 23, 2015, between the Company and John W. Slawson. Previously filed as Exhibit 10.1 to the Company’s Annual Report on Form 10-K for the period ended December 31, 2015 (Commission File No. 001-33582) and incorporated herein by reference.* |
| | |
10.2 | | Spartan Motors, Inc. Stock Incentive Plan of 2016. Previously filed as Appendix A to the Company’s definitive proxy statement on Schedule 14A filed with the SEC on April 8, 2016 (Commission File No. 001-33582), and incorporated herein by reference.* |
| | |
10.3 | | Spartan Motors, Inc. Stock Incentive Plan of 2007, as amended. Previously filed as Appendix A to the Company’s 2007 Proxy Statement filed April 23, 2007 (Commission File No. 000-13611) and incorporated herein by reference.* |
| | |
10.4 | | Spartan Motors, Inc. Leadership Team Compensation Plan. Previously filed as an exhibit to the Company’s Quarterly Report on Form 10-Q for the period ended June 30, 2015 (Commission File No. 001-33582), and incorporated herein by reference.* |
| | |
10.5 | | Spartan Motors, Inc. Directors’ Stock Purchase Plan. Previously filed as an exhibit to the Company’s Form S-8 Registration Statement (Registration No. 333-98083) filed on August 14, 2002, and incorporated herein by reference.* |
Exhibit
Number | | Document |
| | |
10.6 | | Form of Stock Appreciation Rights Agreement. Previously filed as an exhibit to the Company’s Annual Report on Form 10-K for the period ended December 31, 2007 (Commission File No. 001-33582) and incorporated herein by reference.* |
| | |
10.7 | | Form of Restricted Stock Agreement. Previously filed as an exhibit to the Company’s Quarterly Report on Form 10-Q for the period ended June 30, 2009 (Commission File No. 001-33582), and incorporated herein by reference.* |
| | |
10.8 | | Form of Indemnification Agreement. Previously filed as an exhibit to the Company’s Annual Report on Form 10-K for the period ended December 31, 2005 (Commission File No. 000-13611), and incorporated herein by reference.* |
| | |
10.9 | | Supplemental Executive Retirement Plan. Previously filed as an exhibit to the Company’s Annual Report on Form 10-K for the period ended December 31, 2007 (Commission File No. 001-33582), and incorporated herein by reference. * |
| | |
10.10 | | Spartan Motors, Inc. Stock Incentive Plan of 2012. Previously filed as Exhibit 10.1 to the Company's Current Report on Form 8-K filed May 15, 2012 (Commission File No. 001-33582), and incorporated herein by reference.* |
| | |
10.11 | | Lease agreement dated February 13, 2012 between the Company and Fruit Hills Investments, LLC. Previously filed as Exhibit 10.1 to the Company's Quarterly Report on Form 10-Q for the period ended March 31, 2012 (Commission File No. 001-33582) and incorporated herein by reference. |
| | |
10.12 | | Second Amended and Restated Credit Agreement, dated October 31, 2016, by and among the Company, Wells Fargo Bank, National Association, as administrative agent, and the lenders party thereto. |
Exhibit
Number | | Document |
| | |
10.13 | | Employment Letter Agreement dated July 22, 2014, between Spartan Motors, Inc. and Daryl M. Adams. Previously filed as Exhibit 10.1 to the Company’s Quarterly Report on Form 10-Q for the period ended September 30, 2014 (Commission File No. 001-33582), and incorporated herein by reference.* |
| | |
10.14 | | Employment Letter Agreement dated September 15, 2015, between Spartan Motors, Inc. and Frederick J. Sohm. Previously filed as Exhibit 10.1 to the Company’s Quarterly Report on Form 10-Q for the period ended September 30, 2015 (Commission File No. 001-33582), and incorporated herein by reference.* |
| | |
10.15 | | Employment Letter Agreement Dated January 6, 2005 between Spartan Motors, Inc. and Arthur D. Ickes. Previously filed as Exhibit 10.21 to the Company’s Annual Report on Form 10-K for the period ended December 31, 2015 (Commission File No. 001-33582) and incorporated herein by reference.* |
| | |
10.16 | | Employment Letter Agreement dated October 30, 2008 between Spartan Motors, Inc. and Thomas T. Kivell. Previously filed as Exhibit 10.22 to the Company’s Annual Report on Form 10-K for the period ended December 31, 2015 (Commission File No. 001-33582) and incorporated herein by reference.* |
| | |
10.17 | | Employment Agreement dated May 7, 2009, between Utilimaster Holdings, Inc. and John A. Forbes. Previously filed as Exhibit 10.23 to the Company’s Annual Report on Form 10-K for the period ended December 31, 2015 (Commission File No. 001-33582) and incorporated herein by reference.* |
| | |
10.18 | | Employment Letter Agreement dated December 23, 2014 between Spartan Motors, Inc. and Steve Guillaume. Previously filed as Exhibit 10.24 to the Company’s Annual Report on Form 10-K for the period ended December 31, 2015 (Commission File No. 001-33582) and incorporated herein by reference.* |
| | |
10.19 | | Employment Letter Agreement dated May 11, 2015 between Spartan Motors, Inc. and Steve Guillaume. Previously filed as Exhibit 10.25 to the Company’s Annual Report on Form 10-K for the period ended December 31, 2015 (Commission File No. 001-33582) and incorporated herein by reference.* |
| | |
| 10.20 | | Employment Letter Agreement dated July 14, 2014 between Spartan Motors, Inc. and Thomas C. Schultz.* |
| | |
| 10.21 | | Asset Purchase Agreement, dated as of December 12, 2016, by and among Spartan Motors USA, Inc., Smeal Fire Apparatus Co., Smeal Properties, Inc., Ladder Tower Co., U.S. Tanker Co., and Rodney Cerny, as Representative. Previously filed as Exhibit 99.1 to the Company's Current Report on Form 8-K filed with the SEC on January 5, 2017, and incorporated herein by reference. |
| | |
21 | | Subsidiaries of Registrant. |
| | |
23 | | Consent of BDO USA, LLP, Independent Registered Public Accounting firm. |
Exhibit
Number | | Document |
| | |
24 | | Limited Powers of Attorney. |
| | |
31.1 | | Certification of President and Chief Executive Officer pursuant to Section 302 of the Sarbanes-Oxley Act. |
| | |
31.2 | | Certification of Chief Financial Officer, Secretary and Treasurer pursuant to Section 302 of the Sarbanes-Oxley Act. |
| | |
32 | | Certification pursuant to 18 U.S.C. § 1350. |
| | |
101.INS | | XBRL Instance Document |
| | |
101.SCH | | XBRL Schema Document |
| | |
101.CAL | | XBRL Calculation Linkbase Document |
| | |
101.DEF | | XBRL Definition Linkbase Document |
| | |
101.LAB | | XBRL Label Linkbase Document |
| | |
101.PRE | | XBRL Presentation Linkbase Document |
_________________________
*Management contract or compensatory plan or arrangement.
iv
