Table of Contents
United States Securities and Exchange Commission
Washington, D.C. 20549
FORM 10-K
[✓] Annual Report Pursuant to Section 13 or 15(d) of the Securities Exchange Act of 1934
For the fiscal year ended May 2, 2015April 28, 2018
or
[ ] Transition Report Pursuant to Section 13 or 15(d) of the Securities Exchange Act of 1934
For the transition period from __________ to _________
Commission file number 1-14170
NATIONAL BEVERAGE CORP.
(Exact name of Registrant as specified in its charter)

Delaware | | 59-2605822 |
(State of incorporation) | | (I.R.S. Employer Identification No.) |
8100 SW Tenth Street, Suite 4000, FortFort Lauderdale, FloridaFlorida 33324
(Address of principal executive offices including zip code)
Registrant’s telephone number, including area code: (954) 581-0922
Securities registered pursuant to Section 12(b) of the Act:
Title of each class | | Name of each exchange on which registered |
Common Stock, par value $.01 per share | | The NASDAQ Global Select Market |
Securities registered pursuant to Section 12(g) of the Act: None
Indicate by check mark if the Registrant is a well-known seasoned issuer, as defined in Rule 405 of the Securities Act. Yes ( )No) No (✓)
Indicate by check mark if the Registrant is not required to file reports pursuant to Section 13 or Section 15(d) of the Exchange Act. Yes ( ) No (✓)
Indicate by check mark whether the Registrant (1) has filed all reports required to be filed by Section 13 or 15(d) of the Securities Exchange Act of 1934 during the preceding 12 months and (2) has been subject to such filing requirements for the past 90 days.Yesdays. Yes (✓) No ( )
Indicate by check mark whether the Registrant has submitted electronically and posted on its corporate Web site, if any, every Interactive Data File required to be submitted and posted pursuant to Rule 405 of Regulation S-T during the preceding 12 months. Yes (✓) No ( )
Indicate by check mark if disclosure of delinquent filers pursuant to Item 405 of Regulation S-K is not contained herein, and will not be contained, to the best of Registrant’s knowledge, in definitive proxy or information statements incorporated by reference in Part III of this Form 10-K or any amendment to this Form 10-K. (✓)
Indicate by check mark whether the Registrant is a large accelerated filer, an accelerated filer, a non-accelerated filer, or a smaller reporting company. See the definitions of “large accelerated filer,” “accelerated filer” and “smaller reporting company” in Rule 12b-2 of the Exchange Act.: Large accelerated filer ( (✓) Accelerated filer (✓( ) Non-accelerated filer ( ) Smaller reporting company ( ) Emerging growth company ( )
If an emerging growth company, indicate by check mark if the registrant has elected not to use the extended transition period for complying with any new or revised financial accounting standards provided pursuant to Section 13(a) of the Exchange Act. ( )
Indicate by check mark whether the Registrant is a shell company (as defined in Rule 12b-2 of the Exchange Act). Yes ( ) No (✓)
The aggregate market value of the common stock held by non-affiliates of Registrant computed by reference to the closing sale price of $25.12$95.28 on October 31, 201427, 2017 was approximately $288.1 million.$1.1 billion.
The number of shares of Registrant’s common stock outstanding as of July 10, 2015June 22, 2018 was 46,398,035.46,618,240.
DOCUMENTS INCORPORATED BY REFERENCE
Portions of the Registrant’s Proxy Statement for the 20152018 Annual Meeting of Shareholders are incorporated by reference in Part III of this report.
table of contents
PART I
ITEM 1. BUSINESS
GENERAL
Currently celebrating its 30th anniversary, National Beverage Corp. is an acknowledged leaderinnovatively refreshes America with a distinctive portfolio of sparkling waters, juices and, to a lesser degree, energy drinks. Over the past few years, our carbonated soft drink brands continue to be modified as we endeavor to make them more adaptable to our consumers. We believe our ingenious product designs, innovative packaging and imaginative flavors, along with our corporate culture and philosophy, make National Beverage unique as a stand-alone entity in the development, manufacturing, marketingbeverage industry.
Points of differentiation include the following:
 Healthy Transformation – We focus on developing and
 saledelighting consumers with healthier beverages in response to the global shift in consumer buying habits. We are committed to tailoring the variety and types of beverages in our portfolio to satisfy the preferences of a diverse portfoliomix of flavoredconsumers including ‘crossover consumers’ – a growing group desiring a healthier alternative to artificially sweetened or high-calorie beverages.
Flavor Innovation –Building on a rich tradition of flavor and brand innovation with more than a 125 year history of development with iconic brands such as Shasta® and Faygo®, we have extended our flavor and essence leadership and technical expertise to the sparkling water category. Proprietary flavors and essences are developed and tested in-house and only made commercially available after extensive concept and sensory evaluation. Our variety of distinctive flavors provides us a unique advantage with today’s consumers who demand variety and refreshing beverage products. Ouralternatives.
Innovation Ethic – We believe that innovative marketing, packaging and consumer engagement is more effective in today’s marketplace than traditional higher-cost national advertising. In addition to our cost-effective social media platforms, we utilize regionally-focused marketing programs and in-store “brand ambassadors” to interact and obtain feedback from our consumers. We also believe the design of our packages and the overall optical effect of their placement on the shelf (“shelf marketing”) has become more important as millennials and younger generations become increasingly influential consumers, and are now influencing baby boomers and older generations.
 Creative Dynamics – In a beverage industry that is dominated by the “cola giants”, we pride ourselves on being smaller, faster and stronger. We believe we are able to respond faster and more creatively to consumer trends than competitors who are burdened by legacy production and distribution complexity and costs. The ability to identify consumer trends and create new product concepts to lead the market defines our new product development model. Speed to market with the appropriate concept, unique flavor creation and trend-forward ‘better-for-you’ ingredients continues to be our goal. Internal development teams are responsible for concept creation, packaging and design, which allow for rapid ‘go to market’ timing and reduced development costs.
Presently, our primary market focus is the United States butand Canada. Certain of our products are also distributed on a limited basis in Canada, Mexico, the Caribbean, Latin America, the Pacific Rim, Asia,other countries and Europe. A holding company for various operating subsidiaries, options to expand distribution to other regions are being considered.
National Beverage Corp. wasis incorporated in Delaware in 1985 and began trading as a public company on the NASDAQ Stock Market in 1991. In this report, the terms “we,” “us,” “our,” “Company” and “National Beverage” mean National Beverage Corp. and its subsidiaries unless indicated otherwise.
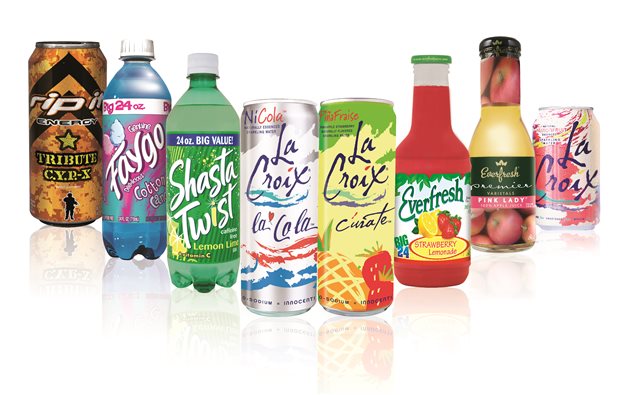
BRANDS
Our brands consist of (i) beverages geared towardto the active and health-conscious consumer (“Power+ Brands”), including sparkling waters, energy drinks, and shots, juices,juices. Our portfolio of Power+ Brands includes LaCroix®, LaCroix Cúrate®, LaCroix NiCola® and enhanced beverages,Shasta® Sparkling Water products; Rip It® energy drinks and (ii) Carbonated Soft Drinks in a variety of flavors including regular, sugar-freeshots; and reduced-calorie options. In addition,Everfresh®, Everfresh Premier Varietals™ and Mr. Pure® 100% juice and juice-based products. Additionally, we produce and distribute carbonated soft drinks for certain retailers (“Allied Brands”) that endorse the “Strategic Alliance” concept of having ourincluding Shasta® and Faygo®, iconic brands and Allied Brands marketed to effectuate enhanced growth of both. We employ a philosophy that emphasizes vertical integration; our manufacturing model integrates the procurement of raw materials and production of concentrates with the manufacture of finished products in our twelve manufacturing facilities. To service a diverse customer base that includes numerous national retailers as well as thousands of smaller “up-and-down-the-street” accounts, we have developed a hybrid distribution system that promotes and utilizes customer warehouse distribution facilities and our own direct-store delivery fleet plus the direct-store delivery systems of independent distributors and wholesalers.
We believe that the combination of our business strategies and philosophies is key to giving us a greater competitive advantage and differentiating us from our competitors. These points of differentiation include the following:
Lifestyle Focus –We focus on developing healthier and functional beverages in response to a global shift inwhose consumer buying habits. As health and wellness awareness grows, consumers are turning to drinks with reduced calories, wholesome ingredients and efficacy to meet their specific lifestyle needs. We are committed to tailoring the variety and types of beverages in our portfolio to satisfy changing preferences of an increasingly diverse mix of ‘crossover consumers’– a growing group who desire a change from Carbonated Soft Drinks and other artificially flavored, artificially sweetened beverages.
Fantasy of Flavors– Throughout our product lines, we emphasize distinctly flavored beverages. Although cola drinks account for approximately 49% of the soft drink industry’s domestic grocery channel volume, colas account for less than 20% of our total volume. In the higher margin convenience store channel, flavors represent 55% of soft drink sales and are outpacing colas. Our flavor developmentloyalty spans more than 125 years and originated with our flagship brands, Shasta® and Faygo®, each of which offers more than 30 flavor varieties.
Regional Share Dynamics – This is our term for the philosophy we employ for the development and support of our brands that have significant regional presence. Because we tailor our marketing and promotion programs by locale, we believe many of our brands enjoy a regional identification that fosters long-term consumer loyalty and make them less vulnerable to competitive substitution. In addition, “home-town” products often generate more aggressive retailer sponsored promotional activities and receive media exposure through community activities rather than costly national advertising.
Quality-Value Ethic–We believe that consumers demand value as the purchase default option in volatile economic times, and we are intent on producing and developing products of the highest quality that appeal to the value expectations of the family consumer. We believe we can leverage our cost-effective manufacturing and distribution systems, and our efficient regionally focused marketing programs, to profitably deliver products to the consumer at a lower price-point than our national competitors.
Creative Agility – In a beverage industry that is dominated by the “cola giants”, we pride ourselves on our ability to respond faster and more creatively to consumer trends than many of our competitors who are burdened by distribution complexity and legacy costs. We strive to build long-term brand value by developing creative marketing programs, propriety flavors and distinctive packaging. In recent years, we have introduced numerous new flavors or package sizes and have won many package design awards. We continue to develop products and package sizes designed to expand distribution. We believe that the most dynamic validation of our strategy is our competitors’ efforts to replicate our creative business model.
PRODUCTS
The National Beverage Corp. brand portfolio contains a wide variety of beverages to meet consumer needs in a multitude of market segments. National Beverage employs its flavor expertise with beverage offerings including, but not limited to, the following non-alcoholic beverage segments:
Sparkling Waters
Spring Water
Enhanced Wateryears.
Energy Drinks and Shots
Functional Beverages and Sports Drinks
Juice and Juice Drinks
Teas and Lemonades
Carbonated Soda: Sugar Free, Regular, and Reduced Calorie
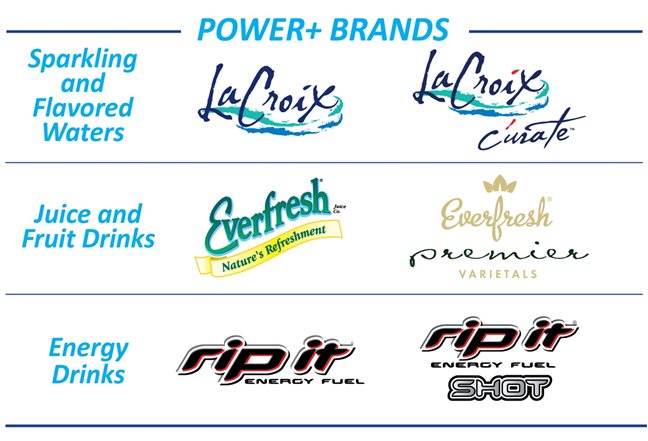
Power+ Brands –
LaCroix
100% all natural LaCroix® Sparkling Water is setting the pace in the Sparkling Water category that is fast becoming the alternative to traditional carbonated soda. Withzero calories,zero sweeteners andzero sodium, theinnocence of LaCroix has the support of major national chains and is the top-selling domestic Sparkling Water packaged in cans.
LaCroix’s dynamic ‘theme’ LaCroix Cúrate™ (cure yourself) celebrates French sophistication with Spanish zest with three bold flavors: Piña Fraíse (pineapple strawberry), Cerise Limon (cherry lime) and Pomme Baya (apple berry) naturally refresh in tall 12 oz. consumer-favored cans. Brilliant graphics, robust aroma, naturally ‘essenced’ and premium-priced, Cúrate is a trendsetting addition to a brand that is the healthy alternative for trend-forward consumers.
NiCola™ by LaCroix, a new innovative sparkling water with the essence and flavor of cola, is ‘innocent’ of calories, sodium, sweetener or any ingredient that the health-conscious consumer avoids. Since its initial Chicago launch in October 2014, NiCola has received positive response from cola and diet cola drinkers looking to ‘crossover’ to a beverage that complements a healthier lifestyle.
| 100% naturally-essenced LaCroix® Sparkling Water, our most significant and dominant brand, has uniquely redefined the Sparkling Water category that is rapidly becoming the alternative to traditional carbonated soda. With zero calories, zero sweeteners and zero sodium, the innocence of LaCroix has propelled it to the top-selling domestic sparkling water. Naturally essenced, LaCroix has gained the support of national retailers in multiple channels, including mass merchants, mainstream supermarkets and natural and specialty food retailers. |
|
| LaCroix’s dynamic ‘theme’ LaCroix Cúrate® (‘Cure Yourself’) celebrates French sophistication with Spanish zest and bold flavors. Cúrate naturally refreshes in tall 12 oz. consumer-favored cans. Eloquent graphics, robust aroma, naturally ‘essenced’ and premium-priced, Cúrate is a trendsetting addition to a brand that is the healthy alternative for trend-forward consumers. |
|
| NiCola® by LaCroix, an innovative sparkling water captures the ‘crossover’ cola consumers with its ‘innocent’ effect of no calories, sodium, sweetener or any ingredient that the health-conscious consumer avoids. NiCola is designed for those cola and diet cola consumers within the $82 billion U.S. carbonated soft drink market who are looking to continue to quench their cola-craving taste without negative health consequences. |
Additional LaCroix themes are in development and feature unique packaging, ground-breaking flavor concepts, and a go-to-market strategy designed to provide additional placements within the retail environment outside the traditional grocery shelf.maximize cultural demographic concepts.
RipItShasta Sparkling
Rip It® energy fuel is
 Shasta® Sparkling Water duplicates the
 flavor innovator iniconic flavors that have charmed its loyal consumers over the growing energy category with 14 unique flavors including six sugar free, bringing variety and value to the widening consumer base. Rip It “Tribute” themed energy is a successful military inspired addition to the lineuppast 125 plus years with the latest addition Tribute CYP-X Orange Crème. Building on the flavor tradition of original Rip It, a 2 oz. sugar free shot version with seven flavorsfirst genuine soft-drink alternative (SDA). Shasta Sparkling is marketed through ournaturally-essenced without calories, sodium and sweeteners. ‘Simply Natural and Smartly Healthy,’ Shasta Sparkling continues to gain focused distribution system in multiple displayable package configurations.progressive retailers backed by enthusiastic consumer and brand experiences.
EverfreshThis innovative beverage provides consumers nostalgic Shasta flavors in an entirely “innocent” and exciting alternative, including Lemon-Lime Splash, Draft Root Beer, Shasta Cola, California Orange, Original Pure and Big Black Cherry. Shasta Sparkling complements a healthier lifestyle with its eloquent design and packaging in tall 10.5 ounce cans with an industry-first “clean” label.
Everfresh® and Mr. Pure
 Everfresh® and Mr. Pure® 100% juice and juice drinks are available in
 more than 35a variety of flavors, from such classics as Orange, Cranberry and flavored lemonades to exotics that include Premium Papaya, Pineapple Mango, Peach Watermelon and Pineapple Mango. OriginatingIsland Punch. Distributed primarily in the Midwest, the Everfreshbrands’ signature package is a hot-filled, 16 oz. glass bottle primarily for single-serve consumption. Additional consumer-friendly packages range from 10 oz. to 64 oz.
Everfresh Premier Varietals™, a unique theme from Everfresh, is positioned as a stand-alone brand for display in the produce section of supermarkets. Everfresh Premier Varietals is a premium line of 100% natural apple juice derived from a variety of apples specific to the taste of the varietal, such as Granny Smith, McIntosh, Honey Crisp, Golden Delicious, Fuji and Pink Lady. Premier Varietals are packaged in award-winning 12 oz. glass bottles with decorative tamper-evident neck seals.

Rip It
 Rip It® Energy Fuel is ‘Real Energy for Real People’ offering flavor freedom in 14 exceptional flavors with 6 sugar free options. With its unique positioning, Rip It continues to gain fans in the growing energy category. Rip It “Tribute” themed energy is a successful military-inspired addition to the lineup. Building on the flavor tradition of original Rip It, a 2 oz. sugar-free shot version in eight flavors is marketed through our distribution system in displayable package configurations.
Carbonated Soft Drinks –
 More than 125 years old,
 and distributed nationally, Shasta® is recognized as a bottling industry pioneer and innovator. As our largest volume brand, Shasta features multiple flavors, including products targeted to the growing Hispanic and other ethnic markets, and continues to earn consumer loyalty by delivering value, convenience and such unique tastes as California Dreamin’,Raspberry Crème, Pineapple Orange and Very Cherry Twist and Fiesta Punch. Honoring its origin as a sparkling water company, Shasta will soon introduce a new theme featuring Shasta’s classic flavors in an unsweetened, zero-calorie, refreshing sparkling water concept.
Twist. More than 100110 years old, Faygo® products are primarily distributed east of the Mississippi River and include numerous unique flavors including RedPop®Red Pop®, Moon Mist®, and Rock’n’Rye®.
We also producetailor our marketing and market Ritz®promotion programs by locale; many of our carbonated soft drinksdrink brands enjoy a regional identification that fosters long-term consumer loyalty and seltzers, primarily in the southeastern U.S., distribute Big Shot® in New Orleansmakes them more competitive as a consumer choice. In addition, products produced locally may generate retailer-sponsored promotional activities and surrounding areas, and offer St. Nick’s® soft drinks during the holiday season. receive media exposure through community activities rather than costly national advertising.
 During recent years, we reformulated many of our brands to reduce the caloric content while still preserving their time-tested flavor profiles.
Our Brands,brands, optically and content-wise,ingredient-wise, are always a work in process. We continually strive to make all our drinks healthier while still maintaining their iconic taste profiles. As often as innovation develops, we endeavor to significantly improve them, striving forour products, always seeking quality and authenticity over cost.
MANUFACTURING
PRODUCTION
 We employ a philosophy that emphasizes vertical integration; our production model integrates the procurement of raw materials and crafting of essences and concentrates with the production of finished products. Our twelve
 manufacturingstrategically-located production facilities are strategically located near major metropolitan markets across the continental United States. The locations of our plantsfacilities enable us to efficiently manufactureproduce and distribute beverages to substantially all geographic markets in the United States, including all of the top 25 metropolitan statistical areas. Each manufacturing facility is generally equipped to produce both canned and bottled beverage products in a variety of package sizes. We utilize numerous package types and sizes, including cans ranging from eight to sixteen ounces and bottles ranging from ten ounces to three liters.
We believe that the innovative and controlled vertical integration of our bottlingproduction facilities provides an advantage over certain of our competitors that rely uponon independent third partythird-party bottlers to manufacture and market their products. Since we control theall national production, distribution and marketing of our brands, we believe we can more effectively manage product quality control and customer service and respondconsumer appeal while responding quickly to changing market conditions.
We produce a substantial portionsubstantially all of the flavor concentrates and essences used in our branded products. By controlling our own formulas throughout our bottling network, we can manufacturecraft our products in accordance with uniform quality standards while tailoringinnovating flavors to regional tastemeet changing consumer preferences. We believe that the combination of a Company-owned bottling network, together with uniform standards for packaging, formulations and customer service, provides us with a strategic advantage in servicing national retailers and mass-merchandisers. We also maintain research and development laboratories at multiple locations. These laboratories continually test products for compliance with our strict quality control standards as well as conduct research for new products and flavors.
DISTRIBUTION
WeTo service a diverse customer base that includes numerous national retailers, as well as thousands of smaller “up-and-down-the-street” accounts, we utilize a hybrid distribution system to deliver our products through three primary distribution channels: take-home, convenience and food-service.
 The take-home distribution channel consists of national and regional grocery stores, warehouse clubs, mass-merchandisers, wholesalers and dollar stores. We distribute our products to this channel primarily through the warehouse distribution system and to a lesser extent, the direct-store delivery system.
Under the warehouse distribution system, products are shipped from our manufacturingproduction facilities to the retailer’s centralized distribution centers and then distributed by the retailer to each of its outletstore locations with other goods. This method allows our retail partners to further maximize assets by utilizing their ability to pick-up product at our warehouses, thus further lowering their/our product costs. Products sold through the direct-store delivery system are distributed directly to the customer’s retail outlets by our direct-store delivery fleet and by independent distributors.
We distribute our products to the convenience channel through our own direct-store delivery fleet and those of independent distributors. The convenience channel consists of convenience stores, gas stations and other smaller “up-and-down-the-street” accounts. Because of the higher retail prices and margins that typically prevail, we have undertaken several measures to expand convenience channel distribution. These include development of products,developed packaging and graphics specifically targeted to this market.
Our food-service division distributes products to independent, specialized distributors who sell to hospitals, schools, military bases, airlines, hotels and food-service wholesalers. Also, our Company-owned direct-store delivery fleet distributes products to certain schools and other food-service customers.
Our take-home, convenience and food-service operations use vending machines and glass-door coolers as marketing and promotional tools for our brands. We provide vending machines and coolers on a placement or purchase basis to our customers. We believe vending and cooler equipment increases beveragemagnifies on-site visual trial thus increasing sales enhancesand enhancing brand awareness and develops brand loyalty.awareness.
 SALES AND MARKETING
We sell and market our products through an internal sales force as well as specialized broker networks. Our sales force is organized to serve a specific market, focusing on one or more geographic territories, distribution channels or product lines. We believe this focus allows our sales group to provide high level, responsive service and support to our customers and markets.
The emphasis of our salesmarketing consists of programs to reach consumers directly through innovative digital marketing, digital social marketing, social media engagement and marketing programs iscreative content. We are focused on increasing our digital presence and capabilities to further enhance the consumer experience across our brands. We may retain agencies to assist with social media content creative and platform selection for our brands.
Additionally, we maintain and enhance consumer brand recognition and loyalty typically through a combination of regional advertising,event participation, special event marketing, endorsements, sponsorships and social media, along with consumer coupon distribution and product sampling. We retain advertising agencies to assist with media advertising programs for our brands. Additionally, we offer numerous promotional programs to retail customers, including cooperative advertising support, ‘BrandED’ ambassadors, in-store advertising materialspromotional activities and other incentives. These elements allow us to tailor our marketing and advertisingother consumer programs to be tailored to meet local and regional economic conditions and demographics. Additionally, we sponsor special holiday promotions which feature St. Nick’s soft drink and special holiday flavors and packaging.
Raw Materials
Our centralized procurement group maintains relationships with numerous suppliers of raw materialsingredients and packaging goods.packaging. By consolidating the purchasing function for our manufacturingproduction facilities, we believe we are able to procure more competitive arrangements with our suppliers, thereby enhancing our ability to compete as a low-costan efficient producer of beverages.
The products we produce and sell are made from various materials including sweeteners, juice concentrates, carbon dioxide, water,aluminum cans, glass and plastic bottles, aluminum canswater, carbon dioxide, juice and ends, paper,flavor concentrates, sweeteners, cartons and closures. Most of our low-calorie soft drink products use sucralose, aspartame, stevia or acesulfame potassium. We manufacturecraft a substantial portion of our flavor essences and concentrates and purchasewhile purchasing the remaining raw materials from multiple suppliers.
Substantially all of the materials and ingredients we purchase are presently available from several suppliers, although strikes, weather conditions, utility shortages, governmental control or regulations, national emergencies, quality, price or supply fluctuations or other events outside our control could adversely affect the supply of specific materials. A significant portion of our raw material purchases, including aluminum cans, plastic bottles, high fructose corn syrup, corrugated packaging and juice concentrates, are derived from commodities. Therefore, pricing and availability tend to fluctuate based upon worldwide commodity market conditions. Our ability to recover increased costs through higher pricing may be limited by the competitive environment in which we operate. In certain cases, we may elect to enter into multi-year agreements for the supply of these materials with one or more suppliers, the terms of which may include variable or fixed pricing, minimum purchase quantities and/or the requirement to purchase all supplies for specified locations. Additionally, we use derivative financial instruments to partially mitigate our exposure to changes in certain raw material costs.
Seasonality
The majorityOur operating results are affected by numerous factors, including fluctuations in costs of ourraw materials, holiday and seasonal programming and weather conditions. While yesteryear witnessed more seasonality, higher sales are seasonal with the highest volume typically realized during the summer months. We have sufficient production capacity to meet seasonal increases without maintaining significant quantitieswhen outdoor activities are more prevalent.
Competition
Competition
The While LaCroix® Sparkling Water achieved double-digit growth in all of the 52 Nielsen metropolitan statistical areas in fiscal 2018 and is the significant brand of choice as the number one sparkling water in 42 of those markets, the beverage industry is highly competitive and our competitive position
 varies in each of ourmay vary by market areas.area. Our products compete with many varieties of liquid refreshment, including water products, soft drinks, water products, juices, fruit drinks, energy drinks and sports drinks, as well as powdered drinks, coffees, teas, energy drinks, sports drinks, dairy-based drinks, functional beverages and various other nonalcoholic beverages. We compete with bottlers and distributors of national, regional and private label products. Several competitors, including the twothose that dominate the soft drinkbeverage industry, such as Nestlé S.A., PepsiCo and The Coca-Cola Company, have greater financial resources than we have and aggressive promotion of their products canmay adversely affect sales of our brands.
Principal methods of competition in the beverage industry are price and promotional activity, advertising and marketing programs, point-of-sale merchandising, retail space management, customer service, product differentiation, packaging innovations and distribution methods. We believe our Company differentiates itself through a diversified product portfolio, strong regionalnovel methods of innovation, key brand recognition, focused social media, innovative flavor variety, attractive packaging, efficient distribution methods, specialized advertising and, for some product lines, value pricing.
 Trademarks
We own numerous trademarks for our brands that are significant to our business. We intend to continue to maintain all registrations of our significant trademarks and use the trademarks in the operation of our businesses.
Governmental Regulation
The production, distribution and sale of our products in the United States are subject to the Federal Food, Drug and Cosmetic Act; the Dietary Supplement Health and Education Act of 1994; the Occupational Safety and Health Act; the Lanham Act; various environmental statutes; and various other federal, state and local statutes regulating the production, transportation, sale, safety, advertising, labeling and ingredients of such products. We believe that we are in compliance, in all material respects, with such existing legislation.
Certain states and localities prohibitrequire a deposit or tax on the sale of certain beverages unless a deposit or tax is charged for containers.beverages. These requirements vary by each jurisdiction. Similar legislation has been proposed in certain other states and localities, as well as by Congress. We are unable to predict whether such legislation will be enacted or what impact its enactment would have on our business, financial condition or results of operations.
All of our facilities in the United States are subject to federal, state and local environmental laws and regulations. Compliance with these provisions has not had any material adverse effect on our financial or competitive position. We believe that our current practices and procedures for the control and disposition of toxic or hazardous substances comply in all material respects with applicable law. Compliance with or violation of any current or future regulations and legislation could require material expenditures or have a material adverse effect on our financial results.
Employees
As of May 2, 2015,April 28, 2018, we employed approximately 1,2001,500 people, of which approximately 300370 are covered by collective bargaining agreements. We believe thatwe maintain good relations with our employees are generally good.employees.
AVAILABLE INFORMATION
Our Annual Reports on Form 10-K, Quarterly Reports on Form 10-Q, Current Reports on Form 8-K, proxy statements and amendments to those reports are available free of charge on our website at www.nationalbeverage.com as soon as reasonably practicable after such reports are electronically filed with the Securities and Exchange Commission. In addition, our Code of Ethics is available on our website. The information on the Company’s website is not part of this Annual Report on Form 10-K or any other report that we file with, or furnish to, the Securities and Exchange Commission.
ITEM 1A. RISK FACTORS
In addition to other information in this Annual Report on Form 10-K, the following risk factors should be considered carefully in evaluating the Company’s business. Our business, financial condition and results of operations could be materially and adversely affected by any of these risks. Additional risks and uncertainties, including risks and uncertainties not presently known to the Company, or that the Company currently deems immaterial, may also impair our business and results of operations.
ChangesBrand image and consumer preferences. Our beverage portfolio is comprised of a number of unique brands with time-tested reputations and consumer loyalty that have been built over time. Our investments in social media and marketing as well as our strong commitment to product quality are intended to have a favorable impact on brand image and consumer preferencespreferences. Unfavorable publicity, or allegations of quality issues, even if false or unfounded, could tarnish our reputation and taste. There has been an increasing focus on healthbrand image and wellness by beveragecould cause consumers which may reduce demand for caloric carbonated soft drinks and increase the consumption of products perceived to deliver health, wellness and/or functionality. Ifchoose other products. In addition, if we do not adequately anticipate and react to changing demographics, consumer trends, health concerns and product preferences, our financial results could be adversely affected.
Competition.The beverage industry is extremely competitive. Our products compete with a broad range of beverage products, most of which are manufactured and distributed by companies with substantially greater financial, marketing and distribution resources. In order to generate future revenues and profits, we must continue to sell products that appeal to our customers and consumers. Discounting and other actions by our competitors may make it more difficult to sustain revenues and profits.
Customer relationships.Our retail customer base has been consolidating over the last several years resulting in fewer customers with increased purchasing power. This increased purchasing power can limit our ability to increase pricing for our products with certain of our customers. Additionally, e-commerce transactions and value stores are experiencing rapid growth. Our inability to meet the demands of our larger customersadapt to customer requirements could lead to a loss of business and adversely affect our financial results.
Raw materials and energy. The production of our products is dependent on certain raw materials, including aluminum, resin, corn, linerboard, water and fruit juice. In addition, the production and distribution of our products is dependent on energy sources, including natural gas, fuel and electricity. These items are subject to price volatility caused by numerous factors. Commodity price increases ultimately result in a corresponding increase in the cost of raw materials and energy. We may be limited in our ability to pass these increases on to our customers or may incur a loss in sales volume to the extent price increases are taken. In addition, strikes, weather conditions, governmental controls, tariffs, national emergencies, natural disasters, supply shortages or other events could affect our continued supply and cost of raw materials and energy. If raw materials or energy costs increase, or the availability is limited, our financial results could be adversely affected.
Governmental regulation.Our business and properties are subject to various federal, state and local laws and regulations, including those governing the production, packaging, quality, labeling and distribution of beverage products. In addition, various governmental agencies have considered limiting the consumption of and imposingenacted or are considering additional taxes on soft drinks and other sweetened beverages, including those sweetened with high fructose corn syrup.beverages. Changes in existing laws or regulations could require material expenses and negatively affect our financial results through lower sales or higher costs.
Sustained increases in the cost of employee benefits. Our profitability is affected by the cost of medical and retirement benefits provided to employees.employees, including employees covered under collective bargaining agreements and multi-employer pension plans. In recent years, we have experienced significant increases in these costs as a result of certain factors beyond our control. Although we seek to limit these cost increases, continued upward pressure in these costs could reduce our profitability.
UnfavorableUnfavorable weather conditions. conditions. Unfavorable weather conditions could have an adverse impact on our revenue and profitability. Unusually cold or rainy weather may temporarily reduce demand for our products and contribute to lower sales, which could adversely affect our profitability for such periods. Prolonged drought conditions in the geographic regions in which we do business could lead to restrictions on the use of water, which could adversely affect our ability to manufactureproduce and distribute products.
We are dependentDependence on key personnel.personnel. Our performance significantly depends upon the continued contributions of our executive officers and key employees, both individually and as a group, and our ability to retain and motivate them. Our officers and key personnel have many years of experience with us and in our industry and it may be difficult to replace them. If we lose key personnel or are unable to recruit qualified personnel, our operations and ability to manage our business may be adversely affected.
ITEM 1B. UNRESOLVED STAFF COMMENTS
None.
ITEM 2. PROPERTIES
Our principal properties include twelve manufacturingproduction facilities located in ten states, which aggregate approximately two million square feet. We own ten manufacturingproduction facilities in the following states: California (2), Georgia, Kansas, Michigan (2), Ohio, Texas, Utah and Washington. Two manufacturingproduction facilities, located in Maryland and Florida, are leased subject to agreements that expire through 2020. We believe our facilities are generally in good condition and sufficient to meet our present needs.
The production of beverages is capital intensive but is not characterized by rapid technological change. The technological advances that have occurred have generally been of an incremental cost-saving nature, such as the industry’s conversion to lighter weight containers or improved blending processes that enhance ingredient yields. WeAlthough we are continually investing in more efficient equipment, we are not aware of any anticipated industry-wide changes in technology that would adversely impact our current physical production capacity or cost of production.
We own and lease trucks, vans and automobiles used in the sale, delivery and distribution of our products. In addition, we lease officewarehouse and warehouseoffice space, transportation equipment, office equipment and certain manufacturing equipment.
ITEM 3. LEGAL PROCEEDINGS
From time to time, we are a party to various litigation matters and claims arising in the ordinary course of business. We do not expect the ultimate disposition of such matters to have a material adverse effect on our consolidated financial position or results of operations.
ITEM 4. MINE SAFETY DISCLOSURES
Not applicable.
PART II
ITEM 5. | MARKET FOR REGISTRANT’S COMMON EQUITY, RELATED STOCKHOLDER MATTERS AND ISSUER PURCHASES OF EQUITY SECURITIES |
The common stock of National Beverage Corp., par value $.01 per share, (“Common Stock”) is listed on The NASDAQ Global Select Market under the symbol “FIZZ”. The following table shows the range of high and low prices per share of the Common Stock for the fiscal quarters indicated:
| | | Fiscal Year Ended | |
| | | May 2, 2015 | | | May 3, 2014 | |
| | | High | | | Low | | | High | | | Low | |
First Quarter | | $ | 19.97 | | | $ | 15.42 | | | $ | 18.66 | | | $ | 14.48 | |
Second Quarter | | $ | 25.50 | | | $ | 17.58 | | | $ | 18.96 | | | $ | 15.63 | |
Third Quarter | | $ | 27.32 | | | $ | 21.00 | | | $ | 21.71 | | | $ | 18.06 | |
Fourth Quarter | | $ | 25.00 | | | $ | 21.00 | | | $ | 22.26 | | | $ | 18.58 | |
| | | Fiscal Year Ended | |
| | | April 28, 2018 | | | April 29, 2017 | |
| | | High | | | Low | | | High | | | Low | |
| | | | | | | | | | | | | | | | | |
First Quarter | | $ | 110.64 | | | $ | 81.65 | | | $ | 64.73 | | | $ | 46.50 | |
| | | | | | | | | | | | | | | | | |
Second Quarter | | | 129.82 | | | | 91.50 | | | | 58.30 | | | | 39.14 | |
| | | | | | | | | | | | | | | | | |
Third Quarter | | | 113.70 | | | | 93.01 | | | | 54.65 | | | | 44.21 | |
| | | | | | | | | | | | | | | | | |
Fourth Quarter | | | 114.77 | | | | 83.78 | | | | 92.85 | | | | 48.81 | |
At JulyJune 6, 2015,2018 there were approximately 8,00028,000 holders of our Common Stock, the majority of which hold their shares in the names of various dealers and/or clearing agencies.
The Company paid special cash dividends on Common Stock of $118.1$69.9 million ($2.551.50 per share) on Decemberboth August 4, 2017 (Fiscal 2018) and January 27, 2012.2017 (Fiscal 2017).
In April 2012, the Board of DirectorsThe Company is authorized an increase in the Company’s Stock Buyback Program from 800,000under its stock buyback program to repurchase 1.6 million shares of Common Stock. As of May 2, 2015,April 28, 2018, 502,060 shares were purchased under the program and 1,097,940 shares were available for purchase. There were noNo shares of Common Stock purchasedhave been repurchased during the last three fiscal years.
On January 25, 2013, the Company sold 400,000 shares
13
Table of Special Series D Preferred Stock, par value $1 per share (“Series D Preferred”) for an aggregate purchase price of $20 million. Series D Preferred has a liquidation preference of $50 per share and accrues dividends on this amount at an annual rate of 3% through April 30, 2014 and, thereafter, at an annual rate equal to 370 basis points above the 3-Month LIBOR. Dividends are cumulative and payable quarterly. The Series D Preferred is nonvoting and redeemable at the option of the Company since May 1, 2014 at $50 per share. Upon a change of control, as such term is defined in the Certificate of Designation of the Special Series D Preferred Stock, the holder shall have the right to convert the Series D Preferred into shares of Common Stock at a conversion price equal to the tender price per share offered to the holders of the Common Stock. The net proceeds of $19.7 million were used to repay borrowings under the Credit Facilities. The Series D Preferred was issued by the Company pursuant to the exemption from registration provided by Section 4(2) of the Securities Act of 1933.On May 2, 2014, the Company redeemed 160,000 shares of Series D Preferred, representing 40% of the amount outstanding, for an aggregate price of $8 million plus accrued dividends. In conjunction with the partial redemption, the annual dividend rate on the outstanding Series D Preferred was reduced to 2.5% for the twelve-month period beginning May 1, 2014. On May 1, 2015, the Company and the holders of the Series D Preferred agreed to extend the 2.5% annual dividend rate on the outstanding Series D Preferred through April 30, 2016.
On August 1, 2014, the Company redeemed 120,000 shares of Series D Preferred, representing 50% of the amount outstanding, for an aggregate price of $6 million plus accrued dividends.
Performance Graph
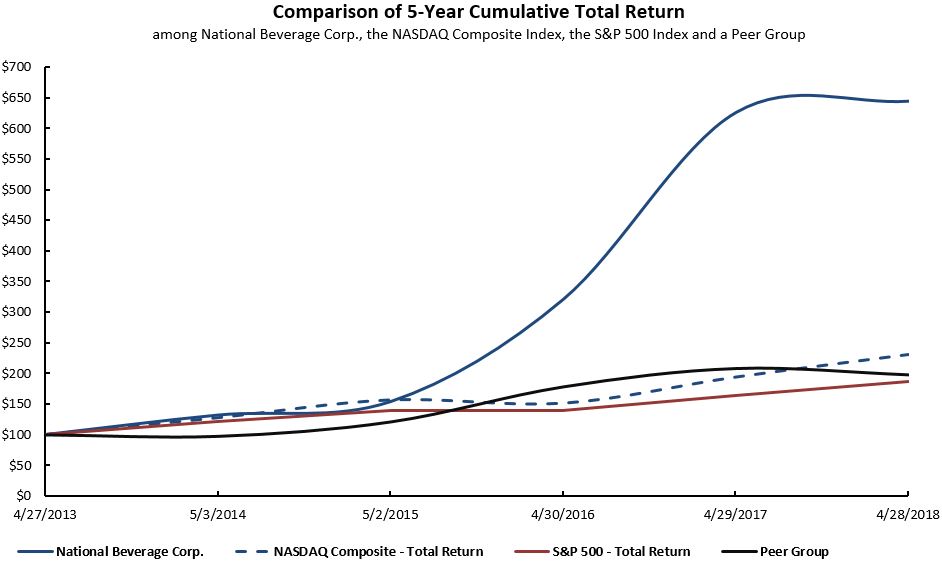
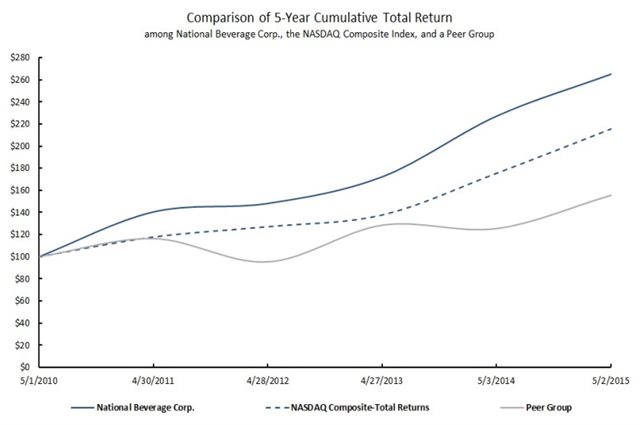
The following graph shows a comparison of the five-year cumulative returns of an investment of $100 cash on May 1, 2010,April 27, 2013, assuming reinvestment of dividends, in (i) Common Stock, (ii) the NASDAQ Composite Index, (iii) the S&P 500 Index, and (iii)(iv) a Company-constructed peer group consisting of Coca-Cola Bottling Company Consolidated and Cott Corporation. Based on the cumulative total return below, an investment in our Common Stock on May 1, 2010April 27, 2013 provided a compounded annual return of approximately 21.5%45% as of May 2, 2015.April 28, 2018.
| | | | 4/27/2013 | | | 5/3/2014 | | | 5/2/2015 | | | 4/30/2016 | | | 4/29/2017 | | | 4/28/2018 | |
| | | 5/1/10 | | | 4/30/11 | | | 4/28/12 | | | 4/27/13 | | | 5/3/14 | | | 5/2/15 | | | | | | | | | | | | | | | | | | | | | | | | | |
National Beverage Corp. | | $ | 100.00 | | | $ | 140.51 | | | $ | 148.18 | | | $ | 172.25 | | | $ | 227.11 | | | $ | 265.06 | | | $ | 100.00 | | | $ | 131.85 | | | $ | 153.88 | | | $ | 320.80 | | | $ | 625.93 | | | $ | 644.46 | |
NASDAQ Composite | | | 100.00 | | | | 117.84 | | | | 127.17 | | | | 137.74 | | | | 175.48 | | | | 215.51 | | |
| | | | | | | | | | | | | | | | | | | | | | | | | | |
NASDAQ Composite - Total Return | | | | 100.00 | | | | 127.40 | | | | 156.45 | | | | 151.07 | | | | 193.65 | | | | 230.40 | |
| | | | | | | | | | | | | | | | | | | | | | | | | | |
S&P 500 - Total Return | | | | 100.00 | | | | 121.43 | | | | 138.89 | | | | 139.05 | | | | 163.96 | | | | 187.24 | |
| | | | | | | | | | | | | | | | | | | | | | | | | | |
Peer Group | | | 100.00 | | | | 116.43 | | | | 95.35 | | | | 128.54 | | | | 125.48 | | | | 155.57 | | | | 100.00 | | | | 97.62 | | | | 121.03 | | | | 178.03 | | | | 207.92 | | | | 197.64 | |
ITEM 6. SELECTED FINANCIAL DATA
The following selected financial data should be read in conjunction with "Item 7. Management's Discussion andAnalysis of Financial Condition and Results of Operations" and consolidated financial statements and notesthereto contained in "Item 8. Financial Statements and Supplementary Data" of this Annual Report on Form 10-K.
The following selected financial data should be read in conjunction with "Item 7. Management's Discussion and Analysis of Financial Condition and Results of Operations" and consolidated financial statements and notes thereto contained in "Item 8. Financial Statements and Supplementary Data" of this Annual Report on Form 10-K. |
NATIONAL BEVERAGE CORP. AND SUBSIDIARIES |
(In thousands, except per share and footnote amounts) |
| | | Fiscal Year Ended | | | Fiscal Year Ended | |
| | | May 2, | | | May 3, | | | April 27, | | | April 28, | | | April 30, | | | April 28, | | | April 29, | | | April 30, | | | May 2, | | | May 3, | |
| | | 2015 | | | | 2014 (3) | | | | 2013 | | | | 2012 | | | | 2011 | | | 2018 | | | 2017 | | | 2016 | | | 2015 | | | 2014(4) | |
SUMMARY OF OPERATIONS: | | | | | | | | | | | | | | | | | | | | | SUMMARY OF OPERATIONS: | | | | | | | | | | | | | | | | | |
Net sales | | $ | 645,825 | | | $ | 641,135 | | | $ | 662,007 | | | $ | 628,886 | | | $ | 600,193 | | | $ | 975,734 | | | $ | 826,918 | | | $ | 704,785 | | | $ | 645,825 | | | $ | 641,135 | |
Cost of sales | | | 426,685 | | | | 423,480 | | | | 444,757 | | | | 415,629 | | | | 381,539 | | | | 584,599 | | | | 500,841 | | | | 463,348 | | | | 426,685 | | | | 423,480 | |
Gross profit | | | 219,140 | | | | 217,655 | | | | 217,250 | | | | 213,257 | | | | 218,654 | | | | 391,135 | | | | 326,077 | | | | 241,437 | | | | 219,140 | | | | 217,655 | |
Selling, general and administrative expenses | | | 145,157 | | | | 153,220 | | | | 146,223 | | | | 146,169 | | | | 155,885 | | | | 186,947 | | | | 163,600 | | | | 148,384 | | | | 145,157 | | | | 153,220 | |
Interest expense | | | 371 | | | | 660 | | | | 403 | | | | 107 | | | | 99 | | | | 201 | | | | 189 | | | | 203 | | | | 371 | | | | 660 | |
Other (income) expense - net | | | (1,101 | ) | | | 666 | | | | 173 | | | | 85 | | | | 20 | | | | (1,502 | ) | | | (537 | ) | | | 145 | | | | (1,101 | ) | | | 666 | |
Income before income taxes | | | 74,713 | | | | 63,109 | | | | 70,451 | | | | 66,896 | | | | 62,650 | | | | 205,489 | | | | 162,825 | | | | 92,705 | | | | 74,713 | | | | 63,109 | |
Provision for income taxes | | | 25,402 | | | | 19,474 | | | | 23,531 | | | | 22,903 | | | | 21,896 | | | | 55,715 | | | | 55,780 | | | | 31,507 | | | | 25,402 | | | | 19,474 | |
Net income | | $ | 49,311 | | | $ | 43,635 | | | $ | 46,920 | | | $ | 43,993 | | | $ | 40,754 | | | $ | 149,774 | | | $ | 107,045 | | | $ | 61,198 | | | $ | 49,311 | | | $ | 43,635 | |
| | | | | | | | | | | | | | | | | | | | | | | | | | | | | | | | | | | | | | | | | |
PER SHARE DATA: | | | | | | | | | | | | | | | | | | | | | PER SHARE DATA: | | | | | | | | | | | | | | | | | |
Basic earnings per common share (1) | | $ | 1.06 | | | $ | .93 | | | $ | 1.01 | | | $ | .95 | | | $ | .88 | | | $ | 3.21 | | | $ | 2.30 | | | $ | 1.31 | | | $ | 1.06 | | | $ | .93 | |
Diluted earnings per common share (1) | | | 1.05 | | | | .92 | | | | 1.01 | | | | .95 | | | | .88 | | | | 3.19 | | | | 2.29 | | | | 1.31 | | | | 1.05 | | | | .92 | |
Closing stock price | | | 22.42 | | | | 19.21 | | | | 14.57 | | | | 14.68 | | | | 13.92 | | | | 89.78 | | | | 88.59 | | | | 46.74 | | | | 22.42 | | | | 19.21 | |
Dividends paid on common stock (2) | | | - | | | | - | | | | 2.55 | | | | - | | | | 2.30 | | | | 1.50 | | | | 1.50 | | | | - | | | | - | | | | - | |
| | | | | | | | | | | | | | | | | | | | | | | | | | | | | | | | | | | | | | | | | |
BALANCE SHEET DATA: | | | | | | | | | | | | | | | | | | | | | BALANCE SHEET DATA: | | | | | | | | | | | | | | | | | |
Cash and equivalents (2) | | $ | 52,456 | | | $ | 29,932 | | | $ | 18,267 | | | $ | 35,626 | | | $ | 7,372 | | | $ | 189,864 | | | $ | 136,372 | | | $ | 105,577 | | | $ | 52,456 | | | $ | 29,932 | |
Working capital (2) | | | 101,478 | | | | 78,618 | | | | 67,504 | | | | 69,818 | | | | 30,930 | | |
Working capital (2) (3) | | | | 248,297 | | | | 181,115 | | | | 143,603 | | | | 97,130 | | | | 75,933 | |
Property, plant and equipment - net | | | 60,182 | | | | 59,494 | | | | 57,307 | | | | 56,729 | | | | 55,337 | | | | 85,807 | | | | 65,150 | | | | 61,932 | | | | 60,182 | | | | 59,494 | |
Total assets (2) | | | 247,750 | | | | 222,841 | | | | 208,642 | | | | 222,988 | | | | 182,810 | | |
Total assets (2) (3) | | | | 458,832 | | | | 353,983 | | | | 301,044 | | | | 243,402 | | | | 220,156 | |
Long-term debt | | | 10,000 | | | | 30,000 | | | | 50,000 | | | | - | | | | - | | | | - | | | | - | | | | - | | | | 10,000 | | | | 30,000 | |
Deferred income tax liability | | | 15,245 | | | | 13,873 | | | | 14,327 | | | | 14,214 | | | | 14,548 | | | | 14,502 | | | | 12,087 | | | | 10,020 | | | | 10,897 | | | | 11,188 | |
Shareholders' equity (2) | | | 147,782 | | | | 106,201 | | | | 70,316 | | | | 121,636 | | | | 80,336 | | | | 331,440 | | | | 245,618 | | | | 206,152 | | | | 147,782 | | | | 106,201 | |
Dividends paid on common stock (2) | | | - | | | | - | | | | 118,139 | | | | - | | | | 106,314 | | | | 69,878 | | | | 69,850 | | | | - | | | | - | | | | - | |
(1) | Basic earnings per common share is computed by dividing earnings available to common shareholders by the weighted average number of common shares outstanding. Diluted earnings per common share includes the dilutive effect of stock options. |
(2) | The Company paid special cash dividends on Common Stock of $118.1$69.9 million ($2.551.50 per share) on DecemberAugust 4, 2017 and January 27, 2012 and $106.3 million ($2.30 per share) on February 14, 2011.2017. |
(3) | Deferred taxes have been reclassified from current assets to non-current liabilities in accordance with ASU 2015-17. See Note 1 of Notes to Consolidated Financial Statements. |
(4) | Fiscal 2014 consisted of 53 weeks. |
ITEM 7. MANAGEMENT’S DISCUSSION AND ANALYSIS OF FINANCIAL CONDITION AND RESULTS OF OPERATIONS
OVERVIEW
National Beverage Corp. is an acknowledged leaderinnovatively refreshes America with a distinctive portfolio of sparkling waters, juices and, to a lesser degree, energy drinks. Over the past few years, our carbonated soft drink brands continue to be modified as we endeavor to make them more adaptable to our consumers. We believe our ingenious product designs, innovative packaging and imaginative flavors, along with our corporate culture and philosophy, make National Beverage unique as a stand-alone entity in the beverage industry.
January 1986 found our infant company in possession of a month-old, typical soda pop manufacturer whose acquisition cost had not yet been determined. One, at the time, could have described it as a ‘Hail Mary’ attempt to thwart another corporate 1980’s raider takeover.
January 2018 ushered in a corporate marvel of focus that we believe not only defies the beverage giants’ power and might, but finds that its creativity and innovation transformed the entire soft drink industry!
We primarily employ the warehouse delivery system, which due to the bricks and mortar costs to all retailers, allows our retail partners to further maximize assets by utilizing their ability to pick up product at our warehouses, thus further lowering their/our product costs.
Within the final quarter of FY2018, with the exception of the warehouse delivery system, National Beverage Corp. has completed its transformation from that typical soda pop manufacturer of January 1986 to the master innovator of this healthier refreshment company! From our corporate philosophy, development of products, marketing to manufacturing, marketingwe are converting consumers to a ‘Better for You’ thirst quencher that compassionately cares for their nutritional health. We are in our infancy and salehave only begun in our quest to innovate for the joy, benefit and enjoyment of our consumers’ healthier lifestyle!
As the cornerstone relative to the lead-in paragraph emphasizing National Beverage’s uniqueness:
Many believe that if you put good in – Great comes out . . .
We believe that if we put excellent in – You get magical out!
Presently, National Beverage Corp. is uniquely positioned in three distinctive ways:
| (1) | The retail grocery industry is in revolution. Yesteryear, each retailer induced their consumer with a proprietary brand (especially soft drinks), but today understands that the well-informed, smart consumer is demanding that retailers provide recognizable brands that have earned their respective consumer standing on their merits. |
| (2) | The retail grocer today is in the most competitive-indexed service industry, without exception. Innovation, plus the urgent time demands on the consumer, is requiring quick, expedient shopping and home delivery is even more of a current shoppers’ choice. Retailers cannot carry slower-moving items that home delivery will not support. |
| (3) | The new Millennial consumer is the most competent/knowledgeable product analyzer ever, and personal mental/physical lifestyles demand that healthier is their preferred choice. Calories must qualify as worthy; sugar being enemy #1 in the life of the Millennial. |
Our strategy seeks the profitable growth of our products by (i) developing healthier beverages in response to the global shift in consumer buying habits and tailoring our beverage portfolio to the preferences of a diverse portfoliomix of flavored beverage products. Our‘crossover consumers’ – a growing group desiring a healthier alternative to artificially sweetened and high-caloric beverages; (ii) emphasizing unique flavor development and variety throughout our brands that appeal to multiple demographic groups; (iii) maintaining points of difference through innovative marketing, packaging and consumer engagement and (iv) responding faster and more creatively to changing consumer trends that larger competitors who are burdened by legacy production, distribution complexity and costs cannot quickly comply with.
Presently, our primary market focus is the United States butand Canada. Certain of our products are also distributed on a limited basis in Canada, Mexico,other countries and options to expand distribution to other regions are being considered. To service a diverse customer base that includes numerous national retailers, as well as thousands of smaller “up-and-down-the-street” accounts, we utilize a hybrid distribution system to deliver our products primarily through the Caribbean, Latin America, the Pacific Rim, Asiawarehouse delivery system and Europe. A holding company for various operating subsidiaries, distributors.
National Beverage Corp. wasis incorporated in Delaware in 1985 and began trading as a public company on the NASDAQ Stock Market in 1991. In this report, the terms “we,” “us,” “our,” “Company” and “National Beverage” mean National Beverage Corp. and its subsidiaries unless indicated otherwise.
Our brands consist of (i) beverages geared toward the active and health-conscious consumer (“Power+ Brands”), including sparkling waters, energy drinks and shots, juices, and enhanced beverages, and (ii) Carbonated Soft Drinks in a variety of flavors including regular, sugar-free and reduced-calorie options. In addition, we produce soft drinks for certain retailers (“Allied Brands”) that endorse the “Strategic Alliance” concept of having our brands and Allied Brands marketed to effectuate enhanced growth of both. We employ a philosophy that emphasizes vertical integration; our manufacturing model integrates the procurement of raw materials and production of concentrates with the manufacture of finished products in our twelve manufacturing facilities. To service a diverse customer base that includes numerous national retailers as well as thousands of smaller “up-and-down-the-street” accounts, we have developed a hybrid distribution system that promotes and utilizes customer warehouse distribution facilities and our own direct-store delivery fleet plus the direct-store delivery systems of independent distributors and wholesalers.
We consider ourselves to be a leader in the development and sale of flavored beverage products. The National Beverage Corp. brand portfolio contains a wide variety of beverages to meet consumer needs in a multitude of market segments. Our portfolio of Power+ Brands is targeted to consumers seeking healthier and functional alternatives to complement their active lifestyles, and includes LaCroix®, LaCroix Cúrate™ and LaCroix NiCola™ sparkling water products; Rip It® energy drinks and shots; and Everfresh® and Everfresh Premier Varietals™, 100% juice and juice-based products. Our carbonated soft drink flavor development spans more than 125 years originating with our flagship brands, Shasta® and Faygo®.
Our strategy emphasizes the growth of our products by (i) expanding our focus on healthier and functional beverages tailored toward healthy, active lifestyles, (ii) offering a beverage portfolio of proprietary flavors with distinctive packaging and broad demographic appeal, (iii) supporting the franchise value of regional brands, (iv) appealing to the “quality-value” expectations of the family consumer, and (v) responding to demographic trends by developing innovative products designed to expand distribution.
The majority of our sales are seasonal with the highest volume typically realized during the summer months. As a result, our operating results from one fiscal quarter to the next may not be comparable. Additionally, our operating results are affected by numerous factors, including fluctuations in the costs of raw materials, changes in consumer preference for beverage products, competitive pricing in the marketplaceholiday and seasonal programming and weather conditions. While yesteryear witnessed more seasonality, higher sales are realized during the summer when outdoor activities are more prevalent.
Our highly innovative business, where new beverages are developed and produced for selective holidays and ceremonial dates, should not be analyzed on the common three-month (quarterly) periods, traditionally found acceptable. Today, costly development projects and seasonal weather periods plus promotional packaging, make quarter-to-quarter comparisons unworthy statistics and forces companies to decision making for that purpose, not truly beneficial for investors and shareholders alike.
Traditional and typical are not a part of an innovator’s vocabulary.
RESULTS OF OPERATIONS
Net Sales
Net sales for the fiscal year ended May 2, 2015April 28, 2018 (“Fiscal 2015”2018”) increased .7%18.0% to $645.8$975.7 million as compared to $641.1$826.9 million for the fiscal year ended May 3, 2014April 29, 2017 (“Fiscal 2014”2017”). The higher sales resulted from a 1.1% increase in case volume partially offset by a .4% decline in average selling price per unit. The increase in case volume reflectssales resulted primarily from a 2.9%19.8% increase in branded volume, including a 15.3% case volume growth for ourand, to a lesser extent, a higher average selling price. Power+ Brands partially offsetvolume increased 38.9%; branded carbonated soft drinks volume declined by a decline6.2%. The Company discontinued its lower-margin, private-label carbonated soft drink business in Allied Brands. The decline in selling price per unit is relatedthe third quarter of Fiscal 2018, allowing future performance to changes in product mix.be more focused on brand equity appreciation.
Net sales for the fiscal year ended May 3, 2014 decreased 3.2%Fiscal 2017 increased 17.3% to $641.1$826.9 million as compared to $662.0$704.8 million for the fiscal year ended April 27, 201330, 2016 (“Fiscal 2013”2016”). The lowerincrease in sales resulted primarily from a 7.5% volume decline16.6% increase in Carbonated Soft Drinks, principally due to extended periods of unfavorable weather conditions and industry-wide consumption decline. This volume decline was partially offset by case volume growth of 8.2% for ourand, to a lesser extent, a higher average selling price. Power+ Brands. Average net selling price per caseBrands volume increased 42.6%; branded carbonated soft drinks volume was approximately the same for both years.flat.
Gross Profit
Gross profit approximated 33.9% of net sales for Fiscal 20152018 increased 20.0% to $391.1 million compared to $326.1million for Fiscal 2017. The increase in gross profit is due to increased volume and Fiscal 2014.growth in higher margin Power+ Brands, offset in part by increased cost of sales per case. Cost of sales per unit declined .3%case increased 1.0% primarily due to product mix changes.higher aluminum costs. Gross margin expanded to 40.1%.
Gross profit was 33.9% of net sales for Fiscal 2014, which represents a 1.1% margin improvement2017 increased 35.1% to $326.1 million compared to $241.4 million for Fiscal 2013.2016. The increase in gross profit was due to increased volume, growth in higher margin improvement is primarilyPower+ Brands and a decline in cost of sales per case of 5.7%. The decrease in cost of sales per case was due to favorable product mix changes and lower raw material costs. Cost of sales decreased 1.7% on a per case basis.Gross margin expanded to 39.4%.
Shipping and handling costs are included in selling, general and administrative expenses, the classification of which is consistent with many beverage companies. However, our gross margin may not be comparable to companies that include shipping and handling costs in cost of sales. See Note 1 of Notes to Consolidated Financial Statements.
Selling, General and Administrative Expenses
Selling, general and administrative expenses were $145.2$186.9 million or 22.5%19.2% of net sales for Fiscal 2015 compared2018, increasing $23.3 million from Fiscal 2017. The increase was primarily due to $153.2 million or 23.9%shipping and other volume-related expenses and marketing spending increases. As a percent of net sales, for Fiscal 2014. Fiscal 2015selling, general and administrative expenses reflect lower selling and marketingdecreased primarily due to the leveraging effects of higher volume on fixed costs.
Selling, general and administrative expenses were $153.2$163.6 million or 23.9%19.8% of net sales for Fiscal 20142017 compared to $146.2$148.4 million or 22.1%21.1% of net sales for Fiscal 2013. Fiscal 2014 expenses reflect higher selling and marketing costs,2016. The increase was primarily due to increased advertising expenses.shipping and other volume-related expenses and marketing spending increases. As a percent of net sales, selling, general and administrative expenses decreased primarily due to the leveraging effects of higher volume on fixed costs and growth of products distributed by customer pick-up.
Interest Expense and Other Expense (Income)Expense-Net
Interest expense is comprised of interest on borrowings and fees related to maintaining lines of credit. The Company paid a special cash dividendcredit and, for part of $118.1 million ($2.55 per common share)Fiscal 2016, interest on December 27, 2012 from available cash and borrowings under our credit facilities. Due to repayments on borrowings, interestborrowings. Interest expense decreased to $371,000 in Fiscal 2015 from $660,000 in Fiscal 2014 and $403,000 in Fiscal 2013.was essentially flat for all years presented. Other expense is net of interest income of $30,000$1.6 million for Fiscal 2015, $15,0002018, $.6 million for Fiscal 20142017 and $37,000$.1 million for Fiscal 2013.2016. The change in interest income for Fiscal 2015, Fiscal 2014 and Fiscal 2013 is due to changes in average invested balances. Other income for Fiscal 2015 includes a $1.3 million gainbalances and increased return on sale of property.investments.
Income Taxes
Our effective tax rate was approximately27.1% for Fiscal 2018, 34.3% for Fiscal 2017 and 34% for Fiscal 2015, 30.9%2016. The reduction in the effective tax rate was due to the statutory rate decreases set forth in the Tax Cuts and Jobs Act (the “Tax Act”) enacted into law on December 22, 2017. Under the Tax Act, the applicable federal statutory rate was 30.4% for Fiscal 2014 and 33.4%2018. Included in the effective tax rate for Fiscal 2013. The2018 is a one-time adjustment reducing income tax expense to remeasure previous deferred tax liabilities of $4.3 million. In all years, the difference between the effective rate and the federal statutory rate of 35% was primarily due to the effects of state income taxes, the domestic manufacturing deduction and share-based payment awards. The applicable federal statutory rate under the Tax Act will be reduced to 21% for Fiscal 2014, adjustment of unrecognized tax benefits related to the resolution of certain open tax years.fiscal 2019. See Note 7 of Notes to Consolidated Financial Statements.
LIQUIDITY AND FINANCIAL CONDITION
Liquidity and Capital Resources
Our principal source of funds is cash generated from operations and borrowings available under our credit facilities.operations. At May 2, 2015,April 28, 2018, we maintained $100 million unsecured revolving credit facilities, ofunder which $10 million ofno borrowings were outstanding and $2.2$2.1 million werewas reserved for standby letters of credit. We believe that existing capital resources will be sufficient to meet our liquidity and capital requirements for the next twelve months. See Note 4 of Notes to Consolidated Financial Statements.
We continually evaluate capital projects to expand our production capacity, enhance packaging capabilities or improve efficiencies at our manufacturingproduction facilities. Expenditures for property, plant and equipment amounted to $11.6$32.0 million for Fiscal 2015. There were no material capital expenditure commitments at May 2, 2015.
On January 25, 2013, the Company sold 400,000 shares of Special Series D Preferred Stock (“Series D Preferred”), par value $1 per share for an aggregate purchase price of $20 million. On May 2, 2014, the Company redeemed 160,000 shares of Series D Preferred, representing 40% of the amount outstanding, for an aggregate price of $8 million. On August 1, 2014,2018 primarily to expand production capacity. The Company redeemed 120,000 shares of Series D Preferred, representing 50% of the amount outstanding, for an aggregate price of $6 million. See Note 5 of Notesexpects capital expenditures to Consolidated Financial Statements.increase in Fiscal 2019 to support volume growth.
The Company paid special cash dividends on common stockCommon Stock of $118.1$69.9 million ($2.551.50 per share) on Decemberboth August 4, 2017 and January 27, 2012.2017. The Company has announced it plans to develop a program to increase distribution to shareholders based on the length of time they have owned their shares.
Pursuant to a management agreement, we incurred a fee to Corporate Management Advisors, Inc. (“CMA”) of $6.5$9.8 million for Fiscal 2015, $6.42018, $8.3 million for Fiscal 20142017 and $6.6$7.0 million for Fiscal 2013.2016. At May 2, 2015,April 28, 2018, management fees payable to CMA were $1.6$2.4 million. See Note 5 of Notes to Consolidated Financial Statements.
Cash Flows
During Fiscal 2015, $58.02018, $154.7 million was provided by operating activities, $9.7$31.9 million was used in investing activities and $25.8$69.3 million was used in financing activities. Cash provided by operating activities increased $5.6$40.5 million primarily due to increased earnings.earnings offset in part by increased working capital. Cash used in investing activities decreased $2.3 million reflecting lowerincreased due to increased capital expendituresexpenditures. Spending on property, plant and proceeds of $1.9 from the sale of property.equipment exceeded depreciation expense, our typical investment level, in order to support volume growth. Cash used in financing activities was $25.8includes the $69.9 million which included a $6 million redemption of preferred stock and $20 million in principal repayments under credit facilities.($1.50 per share) special cash dividend paid on August 4, 2017.
During Fiscal 2014, $52.42017, $114.3 million was provided by operating activities, $12.1$14.0 million was used in investing activities and $28.7$69.5 million was used in financing activities. Cash provided by operating activities increased $12.1$33.8 million primarily due to increased earnings and favorable changes in working capital. Cash used in investing activities increased $2.4$2.0 million reflecting higher capital expenditures in Fiscal 2014.and lower proceeds from the sale of property. Cash used in financing activities was $28.7includes the $69.9 million reflecting an $8 million redemption of preferred stock and $20 million in principal repayments under credit facilities.
($1.50 per share) special cash dividend paid on January 27, 2017.
Financial Position
During Fiscal 2015,2018, our working capital increased $22.9to $248.3 million to $101.5from $181.1 million primarily due toat April 29, 2017. The increase in working capital resulted from higher cash, generated from operating activities.trade receivables and inventory, partially offset by higher accounts payable and accrued liabilities. Trade receivables increased $1.7$13.0 million or 18.3% due to higherincreased sales, activity and days sales outstanding improvedincreased to 31.4 days from 34.7 days to 33.130.6 days. Inventories decreased $1.0increased $7.6 million or 14.2% as a result of increased finished goods and annualraw materials to support sales increases. Annual inventory turns improved from 9.4 to 10.2remained unchanged at 9.5 times. At May 2, 2015,As of April 28, 2018, the current ratio was 2.53.4 to 1 as compared to 2.23.1 to 1 at May 3, 2014.April 29, 2017.
During Fiscal 2014,2017, our working capital increased $11.1to $181.1 million to $78.6from $143.6 million primarilyat April 30, 2016. The increase in working capital resulted from higher cash, trade receivables and inventory, partially offset by higher accounts payable and accrued liabilities. Trade receivables increased $10.3 million or 17% due to cash generated from operating activities. Trade receivables decreased $5.9 million due to lowerincreased sales activity andwhile days sales outstanding remain unchanged at 34.7improved to 30.6 days from 31.0 days. Inventories increased $4.7$5.4 million primarily due toas a result of higher quantities related to new products andfinished goods levels to support more frequent customer promotions.sales increases. Annual inventory turns remained unchanged at 9.5 times. At May 3, 2014,April 29, 2017, the current ratio was 2.23.1 to 1 as compared to 2.12.9 to 1 at April 27, 2013.30, 2016.
CONTRACTUAL OBLIGATIONS
Contractual obligations at May 2, 2015April 28, 2018 are payable as follows:
| | | (In thousands) | |
| | | Total | | | Less Than 1 Year | | | 1 to 3 Years | | | 3 to 5 Years | | | More Than 5 Years | |
Long-term debt | | $ | 10,000 | | | $ | - | | | $ | 10,000 | | | $ | - | | | $ | - | |
Operating leases | | | 22,194 | | | | 5,399 | | | | 8,409 | | | | 5,980 | | | | 2,406 | |
Purchase commitments | | | 53,990 | | | | 53,990 | | | | - | | | | - | | | | - | |
Total | | $ | 86,184 | | | $ | 59,389 | | | $ | 18,409 | | | $ | 5,980 | | | $ | 2,406 | |
As of May 2, 2015, we guaranteed the residual value of certain leased equipment in the amount of $4.9 million. If the proceeds from the sale of such equipment are less than the balance required by the lease when the lease terminates on August 1, 2017, the Company shall be required to pay the difference up to such guaranteed amount. The Company expects to have no loss on such guarantee.
| | | (In thousands) | |
| | | Total | | | Less Than 1 Year | | | 1 to 3 Years | | | 3 to 5 Years | | | More Than 5 Years | |
Operating leases | | $ | 28,448 | | | $ | 9,182 | | | $ | 12,856 | | | $ | 4,879 | | | $ | 1,531 | |
Purchase commitments | | | 15,875 | | | | 11,287 | | | | 3,540 | | | | 1,048 | | | | - | |
Total | | $ | 44,323 | | | $ | 20,469 | | | $ | 16,396 | | | $ | 5,927 | | | $ | 1,531 | |
We contribute to certain pension plans under collective bargaining agreements and to a discretionary profit sharing plan. TotalAnnual contributions were $2.7$3.4 million for Fiscal 2015, $2.72018, $3.1 million for Fiscal 20142017 and $2.6$2.9 million for Fiscal 2013.2016. See Note 9 of Notes to Consolidated Financial Statements.
We maintain self-insured and deductible programs for certain liability, medical and workers’ compensation exposures. Other long-term liabilities include known claims and estimated incurred but not reported claims not otherwise covered by insurance, based on actuarial assumptions and historical claims experience. Since the timing and amount of claim payments vary significantly, we are not able to reasonably estimate future payments for specific periods and therefore such payments have not been included in the table above. Standby letters of credit aggregating $2.2$2.1 million have been issued in connection with our self-insurance programs. These standby letters of credit expire through March 20162019 and are expected to be renewed.
OFF-BALANCE SHEET ARRANGEMENTS
We do not have any off-balance sheet arrangements that have, or are reasonably likely to have, a current or future material effect on our financial condition.
CRITICAL ACCOUNTING POLICIES
The preparation of financial statements in conformity with generally accepted accounting principles requires management to make estimates and assumptions that affect the amounts reported in the financial statements and accompanying notes. Although these estimates are based on management’s knowledge of current events and actions it may undertake in the future, they may ultimately differ from actual results. We believe that the critical accounting policies described in the following paragraphs comprise the most significant estimates and assumptions used in the preparation of our consolidated financial statements. For these policies, we caution that future events rarely develop exactly as estimated and the best estimates routinely require adjustment.
Credit Risk
We sell products to a variety of customers and extend credit based on an evaluation of each customer’s financial condition, generally without requiring collateral. Exposure to credit losses varies by customer principally due to the financial condition of each customer. We monitor our exposure to credit losses and maintain allowances for anticipated losses based on specific customer circumstances, credit conditions and historical write-offs.
Impairment of Long-Lived Assets
All long-lived assets, excluding goodwill and intangible assets not subject to amortization, are evaluated for impairment on the basis of undiscounted cash flows whenever events or changes in circumstances indicate that the carrying amount of an asset may not be recoverable. An impaired asset is written down to its estimated fair market value based on the best information available. Estimated fair market value is generally measured by discounting future cash flows. Goodwill and intangible assets not subject to amortization are evaluated for impairment annually or sooner if we believe such assets may be impaired. An impairment loss is recognized if the carrying amount or, for goodwill, the carrying amount of its reporting unit, is greater than its fair value.
Income Taxes
Our effective income tax rate is based on estimates of taxes which will ultimately be payable. Deferred taxes are recorded to give recognition to temporary differences between the tax bases of assets or liabilities and their reported amounts in the financial statements. Valuation allowances are established to reduce the carrying amounts of deferred tax assets when it is deemed, more likely than not, that the benefit of deferred tax assets will not be realized.
Insurance Programs
We maintain self-insured and deductible programs for certain liability, medical and workers’ compensation exposures. Accordingly, we accrue for known claims and estimated incurred but not reported claims not otherwise covered by insurance based on actuarial assumptions and historical claims experience.
Sales IncentivesRevenue Recognition
We recognize revenue upon delivery to our customers, based on written sales terms that do not allow a right of return except in rare instances. Our products are typically sold on credit, however smaller direct-store delivery accounts may be sold on a cash basis. Our credit terms typically require payment within 30 days of delivery and may allow discounts for early payment. We estimate and reserve for bad debt exposure based on our experience with past due accounts, collectability and our analysis of customer data.
We offer various sales incentive arrangements to our customers that require customer performance or achievement of certain sales volume targets. Sales incentives are accrued over the period of benefit or expected sales. When the incentive is paid in advance, we amortize the amount paidaggregate incentive is recorded as a prepaid and amortized over the period of benefit or contractual sales volume; otherwise, we accrue the expected amount to be paid over the period of benefit or expected sales volume.benefit. The recognition of these incentives involves the use of judgment related to performance and sales volume estimates that are made based on historical experience and other factors. Sales incentives are accounted for as a reduction of sales and actual amounts ultimately realized may vary from accrued amounts. Such differences are recorded once determined and have historically not been significant. We will adopt ASU 2014-09, Revenue from Contracts with Customers, and its amendments on April 29, 2018. See Note 1 to our consolidated financial statements for additional information on revenue recognition and the transition to the new revenue recognition guidance.
FORWARD-LOOKING STATEMENTS
National Beverage and its representatives may make written or oral statements relating to future events or results relative to our financial, operational and business performance, achievements, objectives and strategies. These statements are "forward-looking" within the meaning of the Private Securities Litigation Reform Act of 1995 and include statements contained in this report and other filings with the Securities and Exchange Commission and in reports to our stockholders. Certain statements including, without limitation, statements containing the words "believes," "anticipates," "intends," "plans," "expects," and "estimates" constitute "forward-looking statements" and involve known and unknown risk, uncertainties and other factors that may cause the actual results, performance or achievements of our Company to be materially different from any future results, performance or achievements expressed or implied by such forward-looking statements. Such factors include, but are not limited to, the following: general economic and business conditions, pricing of competitive products, success in acquiring other beverage businesses, success of new product and flavor introductions, fluctuations in the costs of raw materials and packaging supplies, ability to pass along cost increases to our customers, labor strikes or work stoppages or other interruptions in the employment of labor, continued retailer support for our products, changes in brand image, consumer preferences and our success in creating products geared toward consumers’ tastes, success in implementing business strategies, changes in business strategy or development plans, government regulations, taxes or fees imposed on the sale of our products, unseasonably cold ,wetunfavorable weather conditions or droughts and other factors referenced in this report, filings with the Securities and Exchange Commission and other reports to our stockholders. We disclaim an obligation to update any such factors or to publicly announce the results of any revisions to any forward-looking statements contained herein to reflect future events or developments.
ITEM 7A. QUANTITATIVE AND QUALITATIVE DISCLOSURES ABOUT MARKET RISK
Commodities
We purchase various raw materials, including aluminum cans, plastic bottles, high fructose corn syrup, corrugated packaging and juice concentrates, the prices of which fluctuate based on commodity market conditions. Our ability to recover increased costs through higher pricing may be limited by the competitive environment in which we operate. At times, we manage our exposure to this risk through the use of supplier pricing agreements that enable us to establish all, or a portion of, the purchase prices for certain commodities.raw materials. Additionally, we use derivative financial instruments to partially mitigate our exposure to changes in certain raw material costs.
Interest Rates
At May 2, 2015,April 28, 2018, the Company had $10 million inno borrowings outstanding under its credit facilities with a weighted averageoutstanding. We had no debt-related interest rate of 1.0%. Interest rate hedging products are not currently used to mitigate risk from interest fluctuations. If the interest rate on our debt changed by 100 basis points (1%), our interest expense forexposure during Fiscal 2015 would have changed by approximately $200,000.2018.
ITEM 8. FINANCIAL STATEMENTS AND SUPPLEMENTARY DATA |
NATIONAL BEVERAGE CORP. AND SUBSIDIARIES |
CONSOLIDATED BALANCE SHEETS |
(In thousands, except share data) |
| | | May 2, | | | May 3, | | | April 28, | | | April 29, | |
| | | 2015 | | | 2014 | | | 2018 | | | 2017 | |
| Assets | | | | | | | | | | | | | | | | |
| Current assets: | | | | | | | | | | | | | | | | |
Cash and equivalents | | $ | 52,456 | | | $ | 29,932 | | | $ | 189,864 | | | $ | 136,372 | |
Trade receivables - net | | | 59,951 | | | | 58,205 | | | | 84,360 | | | | 71,319 | |
Inventories | | | 42,924 | | | | 43,914 | | | | 60,920 | | | | 53,355 | |
Deferred income taxes - net | | | 4,348 | | | | 2,685 | | |
Prepaid and other assets | | | 8,050 | | | | 8,405 | | | | 17,823 | | | | 7,275 | |
Total current assets | | | 167,729 | | | | 143,141 | | | | 352,967 | | | | 268,321 | |
| Property, plant and equipment - net | | | 60,182 | | | | 59,494 | | | | 85,807 | | | | 65,150 | |
| Goodwill | | | 13,145 | | | | 13,145 | | | | 13,145 | | | | 13,145 | |
| Intangible assets | | | 1,615 | | | | 1,615 | | | | 1,615 | | | | 1,615 | |
| Other assets | | | 5,079 | | | | 5,446 | | | | 5,298 | | | | 5,752 | |
| Total assets | | $ | 247,750 | | | $ | 222,841 | | | $ | 458,832 | | | $ | 353,983 | |
| | | | | | | | | | | | | | | | | |
| Liabilities and Shareholders' Equity | | | | | | | | | | | | | | | | |
| Current liabilities: | | | | | | | | | | | | | | | | |
Accounts payable | | $ | 44,896 | | | $ | 45,606 | | | $ | 74,853 | | | $ | 58,100 | |
Accrued liabilities | | | 21,257 | | | | 18,873 | | | | 29,718 | | | | 29,017 | |
Income taxes payable | | | 98 | | | | 44 | | | | 99 | | | | 89 | |
Total current liabilities | | | 66,251 | | | | 64,523 | | | | 104,670 | | | | 87,206 | |
| Long-term debt | | | 10,000 | | | | 30,000 | | |
| Deferred income taxes - net | | | 15,245 | | | | 13,873 | | | | 14,502 | | | | 12,087 | |
| Other liabilities | | | 8,472 | | | | 8,244 | | | | 8,220 | | | | 9,072 | |
| Shareholders' equity: | | | | | | | | | | | | | | | | |
| Preferred stock, $1 par value - 1,000,000 shares authorized | | | | | | | | | | | | | | | | |
Series C - 150,000 shares issued | | | 150 | | | | 150 | | | | 150 | | | | 150 | |
Series D - 120,000 shares (2015) and 240,000 shares (2014) issued, aggregate liquidation preference of $6,000 (2015) and $12,000 (2014) | | | 120 | | | | 240 | | |
Common stock, $.01 par value - 75,000,000 shares authorized; 50,418,019 shares (2015) and 50,367,799 shares (2014) issued | | | 504 | | | | 504 | | |
Common stock, $.01 par value - 75,000,000 shares authorized; 50,650,784 shares (2018) and 50,616,134 shares (2017) issued | | | | 507 | | | | 506 | |
| Additional paid-in capital | | | 37,759 | | | | 42,775 | | | | 36,358 | | | | 35,638 | |
| Retained earnings | | | 129,773 | | | | 80,737 | | | | 307,824 | | | | 227,928 | |
| Accumulated other comprehensive loss | | | (2,524 | ) | | | (205 | ) | |
Accumulated other comprehensive income (loss) | | | | 4,601 | | | | (604 | ) |
| Treasury stock - at cost: | | | | | | | | | | | | | | | | |
Series C preferred stock - 150,000 shares | | | (5,100 | ) | | | (5,100 | ) | | | (5,100 | ) | | | (5,100 | ) |
Common stock - 4,032,784 shares | | | (12,900 | ) | | | (12,900 | ) | | | (12,900 | ) | | | (12,900 | ) |
| Total shareholders' equity | | | 147,782 | | | | 106,201 | | | | 331,440 | | | | 245,618 | |
| Total liabilities and shareholders' equity | | $ | 247,750 | | | $ | 222,841 | | | $ | 458,832 | | | $ | 353,983 | |
See accompanying Notes to Consolidated Financial Statements. |
NATIONAL BEVERAGE CORP. AND SUBSIDIARIES |
CONSOLIDATED STATEMENTS OF INCOME |
(In thousands, except per share amounts) |
| | | Fiscal Year Ended | | | Fiscal Year Ended | |
| | | May 2, | | | May 3, | | | April 27, | | | April 28, | | | April 29, | | | April 30, | |
| | | 2015 | | | 2014 | | | 2013 | | | 2018 | | | 2017 | | | 2016 | |
| | | | | | | | | | | | | | | | | | | | | | | | | |
Net sales | | $ | 645,825 | | | $ | 641,135 | | | $ | 662,007 | | | $ | 975,734 | | | $ | 826,918 | | | $ | 704,785 | |
| | | | | | | | | | | | | | | | | | | | | | | | | |
Cost of sales | | | 426,685 | | | | 423,480 | | | | 444,757 | | | | 584,599 | | | | 500,841 | | | | 463,348 | |
| | | | | | | | | | | | | | | | | | | | | | | | | |
Gross profit | | | 219,140 | | | | 217,655 | | | | 217,250 | | | | 391,135 | | | | 326,077 | | | | 241,437 | |
| | | | | | | | | | | | | | | | | | | | | | | | | |
Selling, general and administrative expenses | | | 145,157 | | | | 153,220 | | | | 146,223 | | | | 186,947 | | | | 163,600 | | | | 148,384 | |
| | | | | | | | | | | | | | | | | | | | | | | | | |
Interest expense | | | 371 | | | | 660 | | | | 403 | | | | 201 | | | | 189 | | | | 203 | |
| | | | | | | | | | | | | | | | | | | | | | | | | |
Other (income) expense - net | | | (1,101 | ) | | | 666 | | | | 173 | | | | (1,502 | ) | | | (537 | ) | | | 145 | |
| | | | | | | | | | | | | | | | | | | | | | | | | |
Income before income taxes | | | 74,713 | | | | 63,109 | | | | 70,451 | | | | 205,489 | | | | 162,825 | | | | 92,705 | |
| | | | | | | | | | | | | | | | | | | | | | | | | |
Provision for income taxes | | | 25,402 | | | | 19,474 | | | | 23,531 | | | | 55,715 | | | | 55,780 | | | | 31,507 | |
| | | | | | | | | | | | | | | | | | | | | | | | | |
Net income | | | 49,311 | | | | 43,635 | | | | 46,920 | | | | 149,774 | | | | 107,045 | | | | 61,198 | |
| | | | | | | | | | | | | | | | | | | | | | | | | |
Less preferred dividends and accretion | | | (275 | ) | | | (726 | ) | | | (153 | ) | | | - | | | | - | | | | (238 | ) |
| | | | | | | | | | | | | | | | | | | | | | | | | |
Earnings available to common shareholders | | $ | 49,036 | | | $ | 42,909 | | | $ | 46,767 | | | $ | 149,774 | | | $ | 107,045 | | | $ | 60,960 | |
| | | | | | | | | | | | | | | | | | | | | | | | | |
Earnings per common share: | | | | | | | | | | | | | | | | | | | | | | | | |
Basic | | $ | 1.06 | | | $ | .93 | | | $ | 1.01 | | | $ | 3.21 | | | $ | 2.30 | | | $ | 1.31 | |
Diluted | | $ | 1.05 | | | $ | .92 | | | $ | 1.01 | | | $ | 3.19 | | | $ | 2.29 | | | $ | 1.31 | |
| | | | | | | | | | | | | | | | | | | | | | | | | |
Weighted average common shares outstanding: | | | | | | | | | | | | | | | | | | | | | | | | |
Basic | | | 46,353 | | | | 46,331 | | | | 46,310 | | | | 46,598 | | | | 46,564 | | | | 46,452 | |
Diluted | | | 46,559 | | | | 46,519 | | | | 46,482 | | | | 46,921 | | | | 46,770 | | | | 46,671 | |
See accompanying Notes to Consolidated Financial Statements. |
NATIONAL BEVERAGE CORP. AND SUBSIDIARIES |
CONSOLIDATED STATEMENTS OF COMPREHENSIVE INCOME |
(In thousands) |
| | | Fiscal Year Ended | | | Fiscal Year Ended | |
| | | May 2, | | | May 3, | | | April 27, | | | April 28, | | | April 29, | | | April 30, | |
| | | 2015 | | | 2014 | | | 2013 | | | 2018 | | | 2017 | | | 2016 | |
| | | | | | | | | | | | | | | | | | | | | | | | | |
Net income | | $ | 49,311 | | | $ | 43,635 | | | $ | 46,920 | | | $ | 149,774 | | | $ | 107,045 | | | $ | 61,198 | |
| | | | | | | | | | | | | | | | | | | | | | | | | |
Other comprehensive income (loss), net of tax: | | | | | | | | | | | | | | | | | | | | | | | | |
| | | | | | | | | | | | | | | | | | | | | | | | | |
| Cash flow hedges | | | (2,350 | ) | | | 610 | | | | (295 | ) | | | 5,227 | | | | 1,110 | | | | 783 | |
| | | | | | | | | | | | | | | | | | | | | | | | | |
| Other | | | 31 | | | | 149 | | | | (27 | ) | | | (22 | ) | | | 93 | | | | (66 | ) |
| | | | | | | | | | | | | | | | | | | | | | | | | |
| Total | | | (2,319 | ) | | | 759 | | | | (322 | ) | | | 5,205 | | | | 1,203 | | | | 717 | |
| | | | | | | | | | | | | | | | | | | | | | | | | |
Comprehensive income | | $ | 46,992 | | | $ | 44,394 | | | $ | 46,598 | | | $ | 154,979 | | | $ | 108,248 | | | $ | 61,915 | |
See accompanying Notes to Consolidated Financial Statements. |
NATIONAL BEVERAGE CORP. AND SUBSIDIARIES |
CONSOLIDATED STATEMENTS OF SHAREHOLDERS' EQUITY |
(In thousands) |
| | | Fiscal Year Ended | | | Fiscal Year Ended | |
| | | May 2, 2015 | | | May 3, 2014 | | | April 27, 2013 | | | April 28, 2018 | | | April 29, 2017 | | | April 30, 2016 | |
| | | Shares | | | Amount | | | Shares | | | Amount | | | Shares | | | Amount | | | Shares | | | Amount | | | Shares | | | Amount | | | Shares | | | Amount | |
| | | | | | | | | | | | | | | | | | | | | | | | | | | | | | | | | | | | | | | | | | | | | | | | | |
Series C Preferred Stock | | | | | | | | | | | | | | | | | | | | | | | | �� | | | | | | | | | | | | | | | | | | | | | | | | |
Beginning and end of year | | | 150 | | | $ | 150 | | | | 150 | | | $ | 150 | | | | 150 | | | $ | 150 | | | | 150 | | | $ | 150 | | | | 150 | | | $ | 150 | | | | 150 | | | $ | 150 | |
Series D Preferred Stock | | | | | | | | | | | | | | | | | | | | | | | | | | | | | | | | | | | | | | | | | | | | | | | | |
Beginning of year | | | 240 | | | | 240 | | | | 400 | | | | 400 | | | | - | | | | - | | | | - | | | | - | | | | - | | | | - | | | | 120 | | | | 120 | |
Series D preferred (redeemed) issued | | | (120 | ) | | | (120 | ) | | | (160 | ) | | | (160 | ) | | | 400 | | | | 400 | | |
Series D preferred redeemed | | | | - | | | | - | | | | - | | | | - | | | | (120 | ) | | | (120 | ) |
End of year | | | 120 | | | | 120 | | | | 240 | | | | 240 | | | | 400 | | | | 400 | | | | - | | | | - | | | | - | | | | - | | | | - | | | | - | |
Common Stock | | | | | | | | | | | | | | | | | | | | | | | | | | | | | | | | | | | | | | | | | | | | | | | | |
Beginning of year | | | 50,368 | | | | 504 | | | | 50,362 | | | | 504 | | | | 50,322 | | | | 503 | | | | 50,616 | | | | 506 | | | | 50,589 | | | | 506 | | | | 50,418 | | | | 504 | |
Stock options exercised | | | 50 | | | | - | | | | 6 | | | | - | | | | 40 | | | | 1 | | | | 35 | | | | 1 | | | | 27 | | | | - | | | | 171 | | | | 2 | |
End of year | | | 50,418 | | | | 504 | | | | 50,368 | | | | 504 | | | | 50,362 | | | | 504 | | | | 50,651 | | | | 507 | | | | 50,616 | | | | 506 | | | | 50,589 | | | | 506 | |
Additional Paid-In Capital | | | | | | | | | | | | | | | | | | | | | | | | | | | | | | | | | | | | | | | | | | | | | | | | |
Beginning of year | | | | | | | 42,775 | | | | | | | | 50,398 | | | | | | | | 30,425 | | | | | | | | 35,638 | | | | | | | | 34,570 | | | | | | | | 37,759 | |
Series D preferred (redeemed) issued | | | | | | | (5,791 | ) | | | | | | | (7,722 | ) | | | | | | | 19,304 | | |
Series D preferred redeemed | | | | | | | | - | | | | | | | | - | | | | | | | | (5,791 | ) |
Stock options exercised | | | | | | | 228 | | | | | | | | 47 | | | | | | | | 238 | | | | | | | | 559 | | | | | | | | 365 | | | | | | | | 846 | |
Stock-based compensation | | | | | | | 307 | | | | | | | | 95 | | | | | | | | 230 | | | | | | | | 161 | | | | | | | | 208 | | | | | | | | 228 | |
Other | | | | | | | 240 | | | | | | | | (43 | ) | | | | | | | 201 | | |
Stock-based tax benefits | | | | | | | | - | | | | | | | | 495 | | | | | | | | 1,528 | |
End of year | | | | | | | 37,759 | | | | | | | | 42,775 | | | | | | | | 50,398 | | | | | | | | 36,358 | | | | | | | | 35,638 | | | | | | | | 34,570 | |
Retained Earnings | | | | | | | | | | | | | | | | | | | | | | | | | | | | | | | | | | | | | | | | | | | | | | | | |
Beginning of year | | | | | | | 80,737 | | | | | | | | 37,828 | | | | | | | | 109,200 | | | | | | | | 227,928 | | | | | | | | 190,733 | | | | | | | | 129,773 | |
Net income | | | | | | | 49,311 | | | | | | | | 43,635 | | | | | | | | 46,920 | | | | | | | | 149,774 | | | | | | | | 107,045 | | | | | | | | 61,198 | |
Common stock dividends | | | | | | | - | | | | | | | | - | | | | | | | | (118,139 | ) | |
Common stock cash dividend | | | | | | | | (69,878 | ) | | | | | | | (69,850 | ) | | | | | | | - | |
Preferred stock dividends & accretion | | | | | | | (275 | ) | | | | | | | (726 | ) | | | | | | | (153 | ) | | | | | | | - | | | | | | | | - | | | | | | | | (238 | ) |
End of year | | | | | | | 129,773 | | | | | | | | 80,737 | | | | | | | | 37,828 | | | | | | | | 307,824 | | | | | | | | 227,928 | | | | | | | | 190,733 | |
Accumulated Other Comprehensive Loss | | | | | | | | | | | | | | | | | | | | | | | | | |
Accumulated Other Comprehensive Income (Loss) | | Accumulated Other Comprehensive Income (Loss) | | | | | | | | | | | | | | | | | | | | | |
Beginning of year | | | | | | | (205 | ) | | | | | | | (964 | ) | | | | | | | (642 | ) | | | | | | | (604 | ) | | | | | | | (1,807 | ) | | | | | | | (2,524 | ) |
Cash flow hedges | | | | | | | (2,350 | ) | | | | | | | 610 | | | | | | | | (295 | ) | | | | | | | 5,227 | | | | | | | | 1,110 | | | | | | | | 783 | |
Other | | | | | | | 31 | | | | | | | | 149 | | | | | | | | (27 | ) | | | | | | | (22 | ) | | | | | | | 93 | | | | | | | | (66 | ) |
End of year | | | | | | | (2,524 | ) | | | | | | | (205 | ) | | | | | | | (964 | ) | | | | | | | 4,601 | | | | | | | | (604 | ) | | | | | | | (1,807 | ) |
Treasury Stock - Series C Preferred | | | | | | | | | | | | | | | | | | | | | | | | | | | | | | | | | | | | | | | | | | | | | | | | |
Beginning and end of year | | | 150 | | | | (5,100 | ) | | | 150 | | | | (5,100 | ) | | | 150 | | | | (5,100 | ) | | | 150 | | | | (5,100 | ) | | | 150 | | | | (5,100 | ) | | | 150 | | | | (5,100 | ) |
Treasury Stock - Common | | | | | | | | | | | | | | | | | | | | | | | | | | | | | | | | | | | | | | | | | | | | | | | | |
Beginning and end of year | | | 4,033 | | | | (12,900 | ) | | | 4,033 | | | | (12,900 | ) | | | 4,033 | | | | (12,900 | ) | | | 4,033 | | | | (12,900 | ) | | | 4,033 | | | | (12,900 | ) | | | 4,033 | | | | (12,900 | ) |
| | | | | | | | | | | | | | | | | | | | | | | | | | | | | | | | | | | | | | | | | | | | | | | | | |
Total Shareholders' Equity | | | | | | $ | 147,782 | | | | | | | $ | 106,201 | | | | | | | $ | 70,316 | | | | | | | $ | 331,440 | | | | | | | $ | 245,618 | | | | | | | $ | 206,152 | |
See accompanying Notes to Consolidated Financial Statements. |
NATIONAL BEVERAGE CORP. AND SUBSIDIARIES |
CONSOLIDATED STATEMENTS OF CASH FLOWS |
(In thousands) |
| | | Fiscal Year Ended | | | Fiscal Year Ended | |
| | | May 2, | | | May 3, | | | April 27, | | | April 28, | | | April 29, | | | April 30, | |
| | | 2015 | | | 2014 | | | 2013 | | | 2018 | | | 2017 | | | 2016 | |
Operating Activities: | | | | | | | | | | | | | | | | | | | | | | | | |
Net income | | $ | 49,311 | | | $ | 43,635 | | | $ | 46,920 | | | $ | 149,774 | | | $ | 107,045 | | | $ | 61,198 | |
Adjustments to reconcile net income to net cash provided by (used in) operating activities: | | | | | | | | | | | | | | | | | | | | | | | | |
| Depreciation and amortization | | | 11,580 | | | | 11,708 | | | | 11,002 | | | | 13,226 | | | | 12,834 | | | | 12,056 | |
| Deferred income tax provision | | | 1,076 | | | | 79 | | | | 172 | | |
| (Gain) loss on disposal of property, net | | | (1,188 | ) | | | 51 | | | | 63 | | |
Deferred income tax provision (benefit) | | | | 676 | | | | 1,358 | | | | (1,299 | ) |
Loss on disposal of property, net | | | | 149 | | | | 72 | | | | 129 | |
| Stock-based compensation | | | 307 | | | | 95 | | | | 230 | | | | 161 | | | | 208 | | | | 228 | |
Stock-based tax benefits | | | | - | | | | 495 | | | | 1,528 | |
| Changes in assets and liabilities: | | | | | | | | | | | | | | | | | | | | | | | | |
| Trade receivables | | | (1,746 | ) | | | 5,864 | | | | (2,478 | ) | | | (13,041 | ) | | | (10,273 | ) | | | (1,095 | ) |
| Inventories | | | 990 | | | | (4,680 | ) | | | 1,628 | | | | (7,565 | ) | | | (5,433 | ) | | | (4,998 | ) |
| Prepaid and other assets | | | (605 | ) | | | (2,548 | ) | | | (2,466 | ) | | | (5,437 | ) | | | (2,205 | ) | | | (485 | ) |
| Accounts payable | | | (710 | ) | | | 1,345 | | | | (10,614 | ) | | | 16,753 | | | | 8,709 | | | | 4,495 | |
| Accrued and other liabilities | | | (995 | ) | | | (3,167 | ) | | | (4,193 | ) | | | 25 | | | | 1,457 | | | | 8,726 | |
Net cash provided by operating activities | | | 58,020 | | | | 52,382 | | | | 40,264 | | | | 154,721 | | | | 114,267 | | | | 80,483 | |
| | | | | | | | | | | | | | | | | | | | | | | | | |
Investing Activities: | | | | | | | | | | | | | | | | | | | | | | | | |
Additions to property, plant and equipment | | | (11,630 | ) | | | (12,124 | ) | | | (9,693 | ) | | | (31,974 | ) | | | (14,015 | ) | | | (12,140 | ) |
Proceeds from sale of property, plant and equipment | | | 1,905 | | | | 62 | | | | 77 | | | | 63 | | | | 28 | | | | 116 | |
Net cash used in investing activities | | | (9,725 | ) | | | (12,062 | ) | | | (9,616 | ) | | | (31,911 | ) | | | (13,987 | ) | | | (12,024 | ) |
| | | | | | | | | | | | | | | | | | | | | | | | | |
Financing Activities: | | | | | | | | | | | | | | | | | | | | | | | | |
Dividends paid on common stock | | | - | | | | - | | | | (118,139 | ) | | | (69,878 | ) | | | (69,850 | ) | | | - | |
Dividends paid on preferred stock | | | (239 | ) | | | (659 | ) | | | (12 | ) | | | - | | | | - | | | | (186 | ) |
(Repayments) borrowings under credit facilities, net | | | (20,000 | ) | | | (20,000 | ) | | | 50,000 | | |
(Redemption) issuance of preferred stock | | | (6,000 | ) | | | (8,000 | ) | | | 19,704 | | |
Repayments under credit facilities, net | | | | - | | | | - | | | | (10,000 | ) |
Redemption of preferred stock | | | | - | | | | - | | | | (6,000 | ) |
Proceeds from stock options exercised | | | 228 | | | | 47 | | | | 239 | | | | 560 | | | | 365 | | | | 848 | |
Other | | | 240 | | | | (43 | ) | | | 201 | | |
Net cash used in financing activities | | | (25,771 | ) | | | (28,655 | ) | | | (48,007 | ) | | | (69,318 | ) | | | (69,485 | ) | | | (15,338 | ) |
| | | | | | | | | | | | | | | | | | | | | | | | | |
Net Increase (Decrease) in Cash and Equivalents | | | 22,524 | | | | 11,665 | | | | (17,359 | ) | |
Net Increase in Cash and Equivalents | | | | 53,492 | | | | 30,795 | | | | 53,121 | |
| | | | | | | | | | | | | | | | | | | | | | | | | |
Cash and Equivalents - Beginning of Year | | | 29,932 | | | | 18,267 | | | | 35,626 | | | | 136,372 | | | | 105,577 | | | | 52,456 | |
| | | | | | | | | | | | | | | | | | | | | | | | | |
Cash and Equivalents - End of Year | | $ | 52,456 | | | $ | 29,932 | | | $ | 18,267 | | | $ | 189,864 | | | $ | 136,372 | | | $ | 105,577 | |
| | | | | | | | | | | | | | | | | | | | | | | | | |
Other Cash Flow Information: | | | | | | | | | | | | | | | | | | | | | | | | |
Interest paid | | $ | 380 | | | $ | 723 | | | $ | 341 | | | $ | 101 | | | $ | 202 | | | $ | 116 | |
Income taxes paid | | $ | 24,745 | | | $ | 23,079 | | | $ | 24,327 | | | $ | 56,737 | | | $ | 55,901 | | | $ | 29,473 | |
See accompanying Notes to Consolidated Financial Statements. | | | | | |
NATIONAL BEVERAGE CORP. AND SUBSIDIARIES
Notes to Consolidated Financial Statements
National Beverage Corp. innovatively develops, manufactures,produces, markets and sells a diversedistinctive portfolio of flavored beverage productssparkling waters, juices, energy drinks and carbonated soft drinks primarily in North America.the United States and Canada. Incorporated in Delaware in 1985, National Beverage Corp. is a holding company for various operating subsidiaries. When used in this report, the terms “we,” “us,” “our,” “Company” and “National Beverage” mean National Beverage Corp. and its subsidiaries.
1. | significant accounting policies |
Basis of Presentation
The consolidated financial statements have been prepared in accordance with United States generally accepted accounting principles (“GAAP”) and rules and regulations of the Securities and Exchange Commission. The consolidated financial statements include the accounts of National Beverage Corp. and all subsidiaries. All significant intercompany transactions and accounts have been eliminated. Our fiscal year ends the Saturday closest to April 30 and, as a result, an additional week is added every five or six years. Fiscal 2015 and Fiscal 2013All fiscal years presented consisted of 52 weeks while Fiscal 2014 consisted of 53 weeks.
Cash and Equivalents
Cash and equivalents are comprised of cash and highly liquid securities (consisting primarily of short-term money-market investments) with an original maturity of three months or less.
Derivative Financial Instruments
We use derivative financial instruments to partially mitigate our exposure to changes in raw material costs. All derivative financial instruments are recorded at fair value in our Consolidated Balance Sheets. We do not use derivative financial instruments for trading or speculative purposes. Credit risk related to derivative financial instruments is managed by requiring high credit standards for counterparties and frequent cash settlements. See Note 6.
Earnings PerCommonShare
Basic earnings per common share is computed by dividing earnings available to common shareholders by the weighted average number of common shares outstanding during the period. Diluted earnings per common share is calculated in a similar manner, but includes the dilutive effect of stock options amounting to 323,000 shares in Fiscal 2018, 206,000 shares in Fiscal 2015, 188,0002017 and 219,000 shares in Fiscal 2014 and 172,000 shares in Fiscal 2013.2016.
Fair Value
The fair value of long-term debt approximates its carrying value due to its variable interest rate and lack of prepayment penalty. The estimated fair values of derivative financial instruments are calculated based on market rates to settle the instruments. These values represent the estimated amounts we would receive upon sale, taking into consideration current market prices and credit worthiness. See Note 6.
Impairment of Long-Lived Assets
All long-lived assets, excluding goodwill and intangible assets not subject to amortization, are evaluated for impairment on the basis of undiscounted cash flows whenever events or changes in circumstances indicate that the carrying amount of an asset may not be recoverable. An impaired asset is written down to its estimated fair market value based on the best information available. Estimated fair value is generally measured by discounting future cash flows. Goodwill and intangible assets not subject to amortization are evaluated for impairment annually or sooner if we believe such assets may be impaired. An impairment loss is recognized if the carrying amount or, for goodwill, the carrying amount of its reporting unit, is greater than its fair value.
Income Taxes
Our effective income tax rate is based on estimates of taxes which will ultimately be payable. Deferred taxes are recorded to give recognition to temporary differences between the tax bases of assets or liabilities and their reported amounts in the financial statements. Valuation allowances are established to reduce the carrying amounts of deferred tax assets when it is deemed, more likely than not, that the benefit of deferred tax assets will not be realized.
Insurance Programs
We maintain self-insured and deductible programs for certain liability, medical and workers’ compensation exposures. Accordingly, we accrue for known claims and estimated incurred but not reported claims not otherwise covered by insurance based on actuarial assumptions and historical claims experience. At May 2, 2015April 28, 2018 and May 3, 2014,April 29, 2017, other liabilities included accruals of $5.9$6.5 million and $6.1$6.9 million, respectively, for estimated non-current risk retention exposures, of which $4.7$5.0 million and $5.1$5.4 million were covered by insurance.
Intangible Assets
Intangible assets as of May 2, 2015April 28, 2018 and May 3, 2014April 29, 2017 consisted of non-amortizable trademarks.
Inventories
Inventories are stated at the lower of first-in, first-out cost or market. Inventories at May 2, 2015April 28, 2018 were comprised of finished goods of $24.9$37.6 million and raw materials of $18.0$23.3 million. Inventories at May 3, 2014April 29, 2017 were comprised of finished goods of $27.2$35.0 million and raw materials of $16.7$18.4 million.
Marketing Costs
We are involved in a variety of marketing programs, including cooperative advertising programs with customers, to advertise and promote our products to consumers. Marketing costs are expensed when incurred, except for prepaid advertising and production costs which are expensed when the advertising takes place. Marketing costs, which are included in selling, general and administrative expenses, totaled $42.4$49.7 million in Fiscal 2015, $50.22018, $44.9 million in Fiscal 20142017 and $44.6$38.8 million in Fiscal 2013.2016.
New Accounting PronouncementPronouncements - adopted
In March 2016, the Financial Accounting Standards Board (“FASB”) issued Accounting Standards Update No. 2016-09, “Compensation-Stock Compensation: Improvements to Employee Share-Based Payment Accounting” (“ASU 2016-09”). The updated guidance simplifies and changes how companies account for certain aspects of share-based payment awards to employees, including accounting for income taxes and forfeitures, as well as classification of certain items in the statement of cash flows. The Company adopted ASU 2016-09 effective April 30, 2017 and elected to apply the cash flow guidance retrospectively; therefore, cash flow from operating activities increased and cash flow from financing activities decreased by $495 thousand and $1.5 million for the twelve months ended April 29, 2017 and April 30, 2016, respectively. The Company also elected to continue to estimate the number of awards that are expected to vest using the forfeiture option. The adoption of ASU 2016-09 reduced the Company’s income tax expense by $886 thousand for the twelve months ended April 28, 2018.
In November 2015, the FASB issued Accounting Standards Update No. 2015-17, “Balance Sheet Classification of Deferred Taxes” (“ASU 2015-17”). ASU 2015-17 requires companies to classify all deferred tax liabilities and assets as noncurrent on the balance sheet. We adopted ASU 2015-17 effective for our fiscal year beginning April 30, 2017, electing to apply it retrospectively to all periods presented. As a result, $3.9 million of deferred taxes was reclassified from current to non-current on the consolidated balance sheet as of April 29, 2017.
In February 2018, the FASB issued Accounting Standards Update 2018-02, “Reclassification of Certain Tax Effects from Accumulated Other Comprehensive Income” (“ASU 2018-02”). This update permits the impact of lower corporate income tax rates related to items classified in accumulated other comprehensive income to be reclassified directly to retained earnings. We adopted ASU 2018-02 effective for our third quarter ended January 27, 2018. We elected not to reclassify the income tax effects of the Tax Cuts and Jobs Act from accumulated other comprehensive income to retained earnings.
New Accounting Pronouncements – not yet adopted
In May 2014, the FASB issued Accounting Standards Update No. 2014-09, “Revenue from Contracts with Customers (Topic 606)”Customers” (“ASU 2014-09”). ASU 2014-09 requires an entity to recognize revenue in an amount that reflects the consideration to which the entityit expects to receive in exchange for goods or services. On August 12, 2015, the FASB issued ASU 2015-14 which deferred the effective date of ASU 2014-09 by one year and is effective for our fiscal year beginning April 30, 2017.29, 2018. Management has completed its evaluation and adoption is not expected to have a material impact on our financial position, results of operations or cash flows. Disclosure requirements under the new guidance have been significantly expanded.
In February 2016, the FASB issued Accounting Standards Update No. 2016-02, “Leases” (“ASU 2016-02”). ASU 2016-02 requires the lease rights and obligations arising from lease contracts, including existing and new arrangements, to be recognized as assets and liabilities on the balance sheet. ASU 2016-02 is effective for our fiscal year beginning April 28, 2019. We are currently evaluating the potential impact of adopting this guidance on our consolidated financial statements.
In August 2017, the FASB issued Accounting Standards Update 2017-12, “Targeted Improvements to Accounting for Hedge Activities” (“ASU 2017-12”). This amendment simplifies the application of hedge accounting and enables companies to better portray the economics of risk management activities in their financial statements. ASU 2017-12 is effective for our fiscal year beginning April 28, 2019. We are currently evaluating the potential impact of adopting this guidance on our consolidated financial statements.
Property, Plant and Equipment
Property, plant and equipment are recorded at cost. Additions, replacements and betterments are capitalized, while maintenance and repairs that do not extend the useful life of an asset are expensed as incurred. Depreciation is recorded using the straight-line method over estimated useful lives of 75 to 30 years for buildings and improvements and 3 to 15 years for machinery and equipment. Leasehold improvements are amortized using the straight-line method over the shorter of the remaining lease term or the estimated useful life of the improvement. When assets are retired or otherwise disposed, the cost and accumulated depreciation are removed from the respective accounts and any related gain or loss is recognized.
Revenue Recognition
Revenue from productWe recognize revenue upon delivery to our customers, based on written sales is recognized when title and risk of loss pass to the customer, which generally occurs upon delivery. Our policy is not to allow the return of products once they have been accepted by the customer. However, on occasion, we have accepted returns or issued credit to customers, primarily for damaged goods. The amounts have been immaterial and, accordingly, weterms that do not provideallow a specific valuation allowanceright of return except in rare instances. Our products are typically sold on credit, however smaller accounts are sold on a cash basis. Our credit terms typically require payment within 30 days of delivery and may allow discounts for sales returns.early payment. We estimate and reserve for bad debt exposure based on our experience with past due accounts, collectability and our analysis of customer data.
Sales Incentives
We offer various sales incentive arrangements to our customers that require customer performance or achievement of certain sales volume targets. When the incentive is paid in advance, we amortize the amount paid over the period of benefit or contractual sales volume; otherwise, we accrue the expected amount to be paidSales incentives are accrued over the period of benefit or expected sales volume. When the incentive is paid in advance, the aggregate incentive is recorded as a prepaid and amortized over the period of benefit. The recognition of these incentives involves the use of judgment related to performance and sales volume estimates that are made based on historical experience and other factors. Sales incentives are accounted for as a reduction of sales and actual amounts ultimately realized may vary from accrued amounts. Such differences are recorded once determined and have historically not been significant. We will adopt ASU 2014-09, Revenue from Contracts with Customers, and its amendments on April 29, 2018 using the modified retrospective approach, with no anticipated material impact to the consolidated financial statements.
Segment Reporting
We operate as a single operating segment for purposes of presenting financial information and evaluating performance. As such, the accompanying consolidated financial statements present financial information in a format that is consistent with the internal financial information used by management. We do not accumulate revenues by product classification and, therefore, it is impractical to present such information.
Shipping and Handling Costs
Shipping and handling costs are reported in selling, general and administrative expenses in the accompanying consolidated statements of income. Such costs aggregated $44.4$63.3 million in Fiscal 2015 and Fiscal 2014 and $44.22018, $50.0 million in Fiscal 2013.2017 and $44.6 million in Fiscal 2016. Although our classification is consistent with many beverage companies, our gross margin may not be comparable to companies that include shipping and handling costs in cost of sales.
Stock-Based Compensation
Compensation expense for stock-based compensation awards is recognized over the vesting period based on the grant-date fair value estimated using the Black-Scholes model. See Note 8.
Trade Receivables
We record trade receivables at net realizable value, which includes an appropriateestimated allowance for doubtful accounts. We extend credit based on an evaluation of each customer’s financial condition, generally without requiring collateral. Exposure to credit losses varies by customer principally due to the financial condition of each customer. We monitor our exposure to credit losses and maintain allowances for anticipated losses based on specificour experience with past due accounts, collectability and our analysis of customer circumstances, credit conditions and historical write-offs.data. Activity in the allowance for doubtful accounts was as follows:
| | | (In thousands) | | | (In thousands) | |
| | | Fiscal 2015 | | | Fiscal 2014 | | | Fiscal2013 | | | Fiscal 2018 | | | Fiscal 2017 | | | Fiscal 2016 | |
Balance at beginning of year | | $ | 399 | | | $ | 454 | | | $ | 399 | | | $ | 468 | | | $ | 484 | | | $ | 330 | |
Net charge to expense | | | 117 | | | | 95 | | | | 96 | | | | 34 | | | | 74 | | | | 232 | |
Net charge-off | | | (186 | ) | | | (150 | ) | | | (41 | ) | | | (50 | ) | | | (90 | ) | | | (78 | ) |
Balance at end of year | | $ | 330 | | | $ | 399 | | | $ | 454 | | | $ | 452 | | | $ | 468 | | | $ | 484 | |
As of May 2, 2015April 28, 2018 and May 3, 2014,April 29, 2017, we did not have any customer that comprised more than 10% of trade receivables. No one customer accounted for more than 10% of net sales during any of the last three fiscal years.
Use of Estimates
The preparation of financial statements in conformity with United States generally accepted accounting principles requires management to make estimates and assumptions that affect the amounts reported in the financial statements and accompanying notes. Although these estimates are based on management’s knowledge of current events and anticipated future actions, actual results may vary from reported amounts.
2. | PROPERTY, PLANT AND EQUIPMENT |
Property, plant and equipment as of May 2, 2015April 28, 2018 and May 3, 2014April 29, 2017 consisted of the following:
| | | (In thousands) | | | (In thousands) | |
| | | 2015 | | | 2014 | | | 2018 | | | 2017 | |
Land | | $ | 9,500 | | | $ | 9,779 | | | $ | 9,500 | | | $ | 9,500 | |
Buildings and improvements | | | 50,405 | | | | 51,494 | | | | 56,947 | | | | 51,157 | |
Machinery and equipment | | | 156,702 | | | | 148,699 | | | | 194,241 | | | | 172,257 | |
Total | | | 216,607 | | | | 209,972 | | | | 260,688 | | | | 232,914 | |
Less accumulated depreciation | | | (156,425 | ) | | | (150,478 | ) | | | (174,881 | ) | | | (167,764 | ) |
Property, plant and equipment – net | | $ | 60,182 | | | $ | 59,494 | | | $ | 85,807 | | | $ | 65,150 | |
Depreciation expense was $10.2$11.1 million for Fiscal 2015, $9.82018, $10.7 million for Fiscal 20142017 and $9.0$10.1 million for Fiscal 2013.2016.
Accrued liabilities as of May 2, 2015April 28, 2018 and May 3, 2014April 29, 2017 consisted of the following:
| | | (In thousands) | | | (In thousands) | |
| | | 2015 | | | 2014 | | | 2018 | | | 2017 | |
Accrued compensation | | $ | 7,473 | | | $ | 7,049 | | | $ | 9,790 | | | $ | 9,967 | |
Accrued promotions | | | 3,801 | | | | 3,812 | | | | 7,011 | | | | 8,403 | |
Accrued insurance | | | 1,651 | | | | 2,238 | | |
Accrued freight | | | | 5,984 | | | | 2,279 | |
Other | | | 8,332 | | | | 5,774 | | | | 6,933 | | | | 8,368 | |
Total | | $ | 21,257 | | | $ | 18,873 | | | $ | 29,718 | | | $ | 29,017 | |
At May 2, 2015,April 28, 2018, a subsidiary of the Company maintained unsecured revolving credit facilities with banks aggregating $100 million (the “Credit Facilities”). The Credit Facilities expire from October 10, 20173, 2020 to June 18, 20182021 and currentany borrowings would currently bear interest at .9% above one-month LIBOR (1.0% at May 2, 2015). BorrowingsLIBOR. There were no borrowings outstanding under the Credit Facilities were $10 million at May 2, 2015 and $30 million at May 3, 2014.April 28, 2018 or April 29, 2017. At May 2, 2015, $2.2April 28, 2018, $2.1 million of the Credit Facilities werewas reserved for standby letters of credit and $87.8$97.9 million werewas available for borrowings.
The Credit Facilities require the subsidiary to maintain certain financial ratios, principallyincluding debt to net worth and debt to EBITDA (as defined in the Credit Facilities), and contain other restrictions, none of which are expected to have a material effect on our operations or financial position. At May 2, 2015,April 28, 2018, we were in compliance with all loan covenants.
5. | CAPITAL STOCK AND TRANSACTIONS WITH RELATED PARTIES |
The Company paid a special cash dividendsdividend on common stockCommon Stock of $118.1$69.9 million ($2.551.50 per share) on DecemberAugust 4, 2017 and January 27, 2012.2017.
On January 25, 2013, the Company sold 400,000 shares of Special Series D Preferred Stock, par value $1 per share (“Series D Preferred”) for an aggregate purchase price of $20 million. On April 29, 2016, the Company redeemed the final remaining 120,000 shares of Series D Preferred has a liquidation preferencefor an aggregate price of $50 per share and accrues dividends on this amount at an annual rate of 3% through April 30, 2014 and, thereafter, at an annual rate equal to 370 basis points above the 3-Month LIBOR. Dividends are cumulative and payable quarterly. Accrued dividends at May 2, 2015 and May 3, 2014 were $37,000 and $90,000, respectively. The Series D Preferred is nonvoting and redeemable at the option of the Company beginning May 1, 2014 at $50 per share. The net proceeds of $19.7$6 million were used to repay borrowings under the Credit Facilities.plus accrued dividends. In addition, the Company has 150,000 shares of Series C Preferred Stock, par value $1 per share, which are held as treasury stock and, therefore, such shares have no liquidation value.stock.
On May 2, 2014, theThe Company redeemed 160,000 shares of Series D Preferred, representing 40% of the amount outstanding, for an aggregate price of $8 million plus accrued dividends. In connection therewith, the Company accreted and chargedis authorized under its stock buyback program to retained earnings $118,000 of original issuance costs, which was deducted from income available to common shareholders for earnings per share calculation. In conjunction with the partial redemption, the annual dividend rate on the outstanding Series D Preferred was reduced to 2.5% for the twelve month period beginning May 1, 2014. In evaluating the impact of the rate change, the Company determined that the related fair value change was immaterial and that no adjustment was required.
On August 1, 2014, the Company redeemed 120,000 shares of Series D Preferred, representing 50% of the amount outstanding, for an aggregate price of $6 million plus accrued dividends. In connection therewith, the Company accreted and charged to retained earnings $89,000 of original issuance costs, which was deducted from income available to common shareholders for earnings per share calculation.
On May 1, 2015, the Company and the holders of the Series D Preferred agreed to extend the 2.5% annual dividend rate on the outstanding Series D Preferred through April 30, 2016. In evaluating the impact of the rate change, the Company determined that the related fair value change was immaterial and that no adjustment was required.
In April 2012, the Board of Directors authorized an increase in the Company’s Stock Buyback Program from 800,000 torepurchase 1.6 million shares of common stock.Common Stock. As of May 2, 2015,April 28, 2018, 502,060 shares were purchased under the program and 1,097,940 shares were available for purchase. There were noNo shares purchasedof Common Stock have been repurchased during the last three fiscal years.
The Company is a party to a management agreement with Corporate Management Advisors, Inc. (“CMA”), a corporation owned by our Chairman and Chief Executive Officer. This agreement was originated in 1991 for the efficient use of management of two public companies at the time. In 1994, one of those public entities, through a merger, no longer was managed in this manner. Under the terms of the agreement, CMA provides, subject to the direction and supervision of the Board of Directors of the Company, (i) senior corporate functions (including supervision of the Company’s financial, legal, executive recruitment, internal audit and management information systems departments) as well as the services of a Chief Executive Officer and Chief Financial Officer, and (ii) services in connection with acquisitions, dispositions and financings by the Company, including identifying and profiling acquisition candidates, negotiating and structuring potential transactions and arranging financing for any such transaction. CMA, through its personnel, also provides, to the extent possible, the stimulus and creativity to develop an innovative and dynamic persona for the Company, its products and corporate image. In order to fulfill its obligations under the management agreement, CMA employs numerous individuals, whom, acting as a unit, provide management, administrative and creative functions for the Company. The management agreement provides that the Company will pay CMA an annual base fee equal to one percent of the consolidated net sales of the Company, and further provides that the Compensation and Stock Option Committee and the Board of Directors may from time to time award additional incentive compensation to CMA.CMA or its personnel. The Board of Directors on numerous occasions contemplated incentive compensation and, while shareholder value has increased over 2,000%$4.8 billion (or 11,000%) since the inception of this agreement, no incentive compensation has been paid. We incurred management fees to CMA of $6.5$9.8 million for Fiscal 2015, $6.42018, $8.3 million for Fiscal 20142017 and $6.6$7.0 million for Fiscal 2013.2016. Included in accounts payable were amounts due CMA of $1.6$2.4 million at May 2, 2015April 28, 2018 and $2.1 million at May 3, 2014.
April 29, 2017.
6. | DERIVATIVE FINANCIAL INSTRUMENTS |
From time to time, we enter into aluminum swap contracts to partially mitigate our exposure to changes in the cost of aluminum cans. Such financial instruments are designated and accounted for as a cash flow hedge. Accordingly, gains or losses attributable to the effective portion of the cash flow hedge are reported in Accumulated Other Comprehensive Income (Loss) (“AOCI”) and reclassified into earnings through cost of sales in the period in which the hedged transaction affects earnings. The ineffective portion of the change in fair value of our cash flow hedge was immaterial. The following summarizes the gains (losses) recognized in the Consolidated Statements of Income and AOCI relative to the cash flow hedge for Fiscal 2015,2018, Fiscal 20142017 and Fiscal 2013:2016:
| | | (In thousands) | | | (In thousands) | |
| | | Fiscal | | | Fiscal | | | Fiscal | | | Fiscal | | | Fiscal | | | Fiscal | |
| | | 2015 | | | 2014 | | | 2013 | | | 2018 | | | 2017 | | | 2016 | |
Recognized in AOCI- | | | | | | | | | | | | | | | | | | | | | | | | |
Loss before income taxes | | $ | (3,488 | ) | | $ | (1,059 | ) | | $ | (2,521 | ) | |
Less income tax benefit | | | (1,294 | ) | | | (393 | ) | | | (935 | ) | |
Gain (loss) before income taxes | | | $ | 9,498 | | | $ | (984 | ) | | $ | (5,743 | ) |
Less income tax provision (benefit) | | | | 3,085 | | | | (365 | ) | | | ( 2,131 | ) |
Net | | | (2,194 | ) | | | (666 | ) | | | (1,586 | ) | | | 6,413 | | | | (619 | ) | | | (3,612 | ) |
Reclassified from AOCI to cost of sales- | | | | | | | | | | | | | | | | | | | | | | | | |
Gain (loss) before income taxes | | | 248 | | | | (2,028 | ) | | | (2,060 | ) | | | 2,569 | | | | (2,749 | ) | | | (6,987 | ) |
Less income tax provision (benefit) | | | 92 | | | | (752 | ) | | | (769 | ) | | | 1,383 | | | | (1,020 | ) | | | (2,592 | ) |
Net | | | 156 | | | | (1,276 | ) | | | (1,291 | ) | | | 1,186 | | | | (1,729 | ) | | | (4,395 | ) |
| | | | | | | | | | | | | | |
Net change to AOCI | | $ | (2,350 | ) | | $ | 610 | | | $ | (295 | ) | | $ | 5,227 | | | $ | 1,110 | | | $ | 783 | |
As of May 2, 2015,April 28, 2018, the notional amount of our outstanding aluminum swap contracts was $38.0$37.5 million and, assuming no change in the commodity prices, $3.0$6.2 million of unrealized lossgain before tax will be reclassified from AOCI and recognized in earnings over the next 12 months. See Note 1.
As of May 2, 2015, the fair value of the derivative liability and derivative long-term liability was $3.0 million and $751,000, which was included in accrued liabilities and other liabilities, respectively. As of May 3, 2014,April 28, 2018, the fair value of the derivative asset was $5,000,$6.2 million, which was included in prepaid and other assets. As of April 29, 2017, the fair value of the derivative asset, derivative liability and derivative long-term liability was $602 thousand, $848 thousand and $476 thousand, which was included in prepaid and other assets, accrued liabilities and other liabilities, respectively. Such valuation does not entail a significant amount of judgment and the inputs that are significant to the fair value measurement are Level 2 as defined by the fair value hierarchy as they are observable market based inputs or unobservable inputs that are corroborated by market data.
The provision (benefit) for income taxes consisted of the following:
| | | (In thousands) | | | (In thousands) | |
| | | Fiscal | | | Fiscal | | | Fiscal | | | Fiscal | | | Fiscal | | | Fiscal | |
| | | 2015 | | | 2014 | | | 2013 | | | 2018 | | | 2017 | | | 2016 | |
Current | | $ | 24,326 | | | $ | 19,395 | | | $ | 23,359 | | | $ | 55,039 | | | $ | 54,422 | | | $ | 32,806 | |
Deferred | | | 1,076 | | | | 79 | | | | 172 | | | | 676 | | | | 1,358 | | | | (1,299 | ) |
Total | | $ | 25,402 | | | $ | 19,474 | | | $ | 23,531 | | | $ | 55,715 | | | $ | 55,780 | | | $ | 31,507 | |
Deferred taxes are recorded to give recognition to temporary differences between the tax bases of assets or liabilities and their reported amounts in the financial statements. Valuation allowances are established to reduce the carrying amounts of deferred tax assets when it is deemed more likely than not that the benefit of deferred tax assets will not be realized. Deferred tax assets and liabilities as of May 2, 2015April 28, 2018 and May 3, 2014April 29, 2017 consisted of the following:
| | | (In thousands) | | | (In thousands) | |
| | | 2015 | | | 2014 | | | 2018 | | | 2017 | |
Deferred tax assets: | | | | | | | | | | | | | | | | |
Accrued expenses and other | | $ | 5,281 | | | $ | 4,126 | | | $ | 2,900 | | | $ | 4,740 | |
Inventory and amortizable assets | | | 417 | | | | 400 | | | | 331 | | | | 538 | |
Total deferred tax assets | | | 5,698 | | | | 4,526 | | | | 3,231 | | | | 5,278 | |
Deferred tax liabilities: | | | | | | | | | | | | | | | | |
Property | | | 16,497 | | | | 15,616 | | | | 14,858 | | | | 15,157 | |
Intangibles and other | | | 98 | | | | 98 | | | | 2,875 | | | | 2,208 | |
Total deferred tax liabilities | | | 16,595 | | | | 15,714 | | | | 17,733 | | | | 17,365 | |
Net deferred tax liabilities | | $ | 10,897 | | | $ | 11,188 | | | $ | 14,502 | | | $ | 12,087 | |
Current deferred tax assets – net | | $ | 4,348 | | | $ | 2,685 | | |
Noncurrent deferred tax liabilities – net | | $ | 15,245 | | | $ | 13,873 | | |
The reconciliation of the statutory federal income tax rate to our effective tax rate is as follows:
| | | Fiscal | | | Fiscal | | | Fiscal | | | Fiscal | | | Fiscal | | | Fiscal | |
| | | 2015 | | | 2014 | | | 2013 | | | 2018 | | | 2017 | | | 2016 | |
Statutory federal income tax rate | | | 35.0 | % | | | 35.0 | % | | | 35.0 | % | | | 30.4 | % | | | 35.0 | % | | | 35.0 | % |
State income taxes, net of federal benefit | | | 2.3 | | | | 2.3 | | | | 1.6 | | | | 2.4 | | | | 2.2 | | | | 2.2 | |
Manufacturing deduction benefit | | | (3.0 | ) | | | (3.0 | ) | | | (3.1 | ) | |
| Adjustment of unrecognized tax benefit | | | (.2 | ) | | | (3.3 | ) | | | (.2 | ) | |
Domestic manufacturing deduction benefit | | | | (2.4 | ) | | | (3.0 | ) | | | (3.0 | ) |
Remeasurement of deferred taxes | | | | (2.9 | ) | | | - | | | | - | |
Other differences | | | (.1 | ) | | | (.1 | ) | | | .1 | | | | (.4 | ) | | | .1 | | | | (.2 | ) |
Effective income tax rate | | | 34.0 | % | | | 30.9 | % | | | 33.4 | % | | | 27.1 | % | | | 34.3 | % | | | 34.0 | % |
During April 2014, the Company reached an agreement with the Internal Revenue Service with respect to its review of the Company’s federal income tax returns for the three years ended April 2013. No material adjustments were proposed and, accordingly, the Company adjusted the related unrecognized tax benefits during the fourth quarter of Fiscal 2014.
As of May 2, 2015,April 28, 2018, the gross amount of unrecognized tax benefits was $1.8$1.7 million and $191,000$191 thousand was recognized as a tax benefitexpense in Fiscal 2015.2018. If we were to prevail on all uncertain tax positions, the net effect would be to reduce our tax expense by approximately $1.2$1.4 million. A reconciliation of the changes in the gross amount of unrecognized tax benefits, which amounts are included in other liabilities in the accompanying consolidated balance sheets, is as follows:
| | | (In thousands) | |
| | | Fiscal | | | Fiscal | | | Fiscal | |
| | | 2015 | | | 2014 | | | 2013 | |
Beginning balance | | $ | 2,123 | | | $ | 4,349 | | | $ | 4,548 | |
Increases due to current period tax positions | | | 122 | | | | 268 | | | | 415 | |
Decreases due to lapse of statute of limitations and audit resolutions | | | (444 | ) | | | (2,494 | )* | | | (614 | ) |
Ending balance | | $ | 1,801 | | | $ | 2,123 | | | $ | 4,349 | |
* Includes $1,907 related to the Internal Revenue Service review of the Company’s federal income tax returns for the three years ended April 2013 noted above.
| | | (In thousands) | |
| | | Fiscal | | | Fiscal | | | Fiscal | |
| | | 2018 | | | 2017 | | | 2016 | |
Beginning balance | | $ | 1,743 | | | $ | 1,678 | | | $ | 1,801 | |
Increases due to current period tax positions | | | 204 | | | | 150 | | | | 145 | |
Decreases due to lapse of statute of limitations and audit resolutions | | | (214 | ) | | | (85 | ) | | | (268 | ) |
Ending balance | | $ | 1,733 | | | $ | 1,743 | | | $ | 1,678 | |
We recognize accrued interest and penalties related to unrecognized tax benefits in income tax expense. As of May 2, 2015,April 28, 2018, unrecognized tax benefits included accrued interest of $269,000,$238 thousand.
On December 22, 2017, the Tax Cuts and Jobs Act (the “Tax Act”) was recognized asenacted into law. The Tax Act makes changes to the U.S. tax code, including reducing the U.S. federal tax rate from 35% to 21% effective January 1, 2018. The phasing in of the lower corporate income tax rate results in a blended federal statutory rate of 30.4% for our fiscal 2018, compared with the previous 35% rate. The federal statutory tax benefitrate will be reduced to 21% in subsequent fiscal years. Included in the effective tax rate for Fiscal 2015.2018 is a one-time adjustment reducing income tax expense to remeasure previous deferred tax liabilities of $4.3 million.
We file annual income tax returns in the United States and in various state and local jurisdictions. A number of years may elapse before an uncertain tax position, for which we have unrecognized tax benefits, is resolved. While it is often difficult to predict the final outcome or the timing of resolution of any particular uncertain tax position, we believe that our unrecognized tax benefits reflect the most probable outcome. We adjust these unrecognized tax benefits, as well as the related interest, in light of changing facts and circumstances. The resolution of any particular uncertain tax position could require the use of cash and an adjustment to our provision for income taxes in the period of resolution. Federal income tax returns for fiscal years subsequent to 20132015 are subject to examination. Generally, the income tax returns for the various state jurisdictions are subject to examination for fiscal years ending after fiscal 2010.2011.
8. | STOCK-BASED COMPENSATION |
Our stock-based compensation program is a broad-based program designed to attract and retain employeespersonnel while also aligning employees’participant’s interests with the interests of the shareholders.
The 1991 Omnibus Incentive Plan (the “Omnibus Plan”) provides for compensatory awards consisting of (i) stock options or stock awards for up to 4,800,000 shares of common stock, (ii) stock appreciation rights, dividend equivalents, other stock-based awards in amounts up to 4,800,000 shares of common stock and (iii) performance awards consisting of any combination of the above. The Omnibus Plan is designed to provide an incentive to officers and certain other key employees and consultants by making available to them an opportunity to acquire a proprietary interest or to increase such interest in National Beverage. The number of shares or options which may be issued under stock-based awards to an individual is limited to 1,680,000 during any year. Awards may be granted for no cash consideration or such minimal cash consideration as may be required by law. Options generally have an exercise price equal to the fair market value of our common stock on the date of grant, vest over a five-year period and expire after ten years.
The Special Stock Option Plan provides for the issuance of stock options to purchase up to an aggregate of 1,800,000 shares of common stock. Options may be granted for such consideration as determined by the Board of Directors. The vesting schedule and exercise price of these options are tied to the recipient’s ownership level of common stock and the terms generally allow for the reduction in exercise price upon each vesting period. Also, the Board of Directors authorized the issuance of options to purchase up to 50,000 shares of common stock to be issued at the direction of the Chairman.
The Key Employee Equity Partnership Program (“KEEP Program”) provides for the granting of stock options to purchase up to 240,000 shares of common stock to key employees, consultants, directors and officers. Participants who purchase shares of stock in the open market receive grants of stock options equal to 50% of the number of shares purchased, up to a maximum of 6,000 shares in any two-year period. Options under the KEEP Program are forfeited in the event of the sale of shares used to acquire such options. Options are granted at an initial exercise price of 60% of the purchase price paid for the shares acquired and the exercise price reduces to the stock par value at the end of the six-year vesting period.
We account for stock options under the fair value method of accounting using a Black-Scholes valuation model to estimate the stock option fair value at date of grant. The fair value of stock options is amortized to expense over the vesting period. Stock options granted were 276,800500 shares in Fiscal 2015, 5,2452018, no shares in Fiscal 20142017 and 2,0003,500 shares in Fiscal 2013.2016. The weighted average Black-Scholes fair value assumptions for stock options granted are as follows: weighted average expected life of 7.48.0 years for Fiscal 2015, 82018 and 8.0 years for Fiscal 2014 and 8 years for Fiscal 2013;2016; weighted average expected volatility of 32.8%23.8% for Fiscal 2015, 35.8%2018 and 29.0% for Fiscal 2014 and 38.1% for Fiscal 2013;2016; weighted average risk free interest rates of 2.2%2.4% for Fiscal 2015, 1.9%2018 and 2.1% for Fiscal 2014 and 1.6% for Fiscal 2013;2016; and expected dividend yield of 4.6%1.6% for Fiscal 2015, 4.6%2018 and 3.3% for Fiscal 2014 and 5.0% for Fiscal 2013.2016. The expected life of stock options was estimated based on historical experience. The expected volatility was estimated based on historical stock prices for a period consistent with the expected life of stock options. The risk free interest rate was based on the U.S. Treasury constant maturity interest rate whose term is consistent with the expected life of stock options. ForfeituresThere were no forfeitures estimated based on historical experience and ranged from 0% to 16% for Fiscal 2015, Fiscal 20142018 and Fiscal 2013.2016.
The following is a summary of stock option activity for Fiscal 2015:2018:
| | | Number of Shares | | | Price(a) | | | Number of Shares | | | Price (a) | |
Options outstanding, beginning of year | | | 404,355 | | | $ | 6.67 | | | | 383,595 | | | $ | 11.47 | |
Granted | | | 276,800 | | | | 17.84 | | | | 500 | | | | 29.61 | |
Exercised | | | (50,220 | ) | | | 4.55 | | | | (34,650 | ) | | | 16.15 | |
Cancelled | | | (17,800 | ) | | | 16.26 | | | | (4,500 | ) | | | 17.59 | |
Options outstanding, end of year | | | 613,135 | | | | 11.23 | | | | 344,945 | | | | 10.84 | |
Options exercisable, end of year | | | 265,437 | | | | 5.93 | | | | 209,579 | | | | 8.49 | |
(a) Weighted average exercise price.
Stock-based compensation expense was $307,000$161 thousand for Fiscal 2015, $95,0002018, $208 thousand for Fiscal 20142017 and $230,000$228 thousand for Fiscal 2013.2016. The total fair value of shares vested was $371,000$140 thousand for Fiscal 2015, $90,0002018, $362 thousand for Fiscal 20142017 and $453,000$652 thousand for Fiscal 2013.2016. The total intrinsic value for stock options exercised was $917,000$3.0 million for Fiscal 2015, $76,0002018, $1.5 million for Fiscal 20142017 and $406,000$5.2 million for Fiscal 2013.2016. Net cash proceeds from the exercise of stock options were $228,000$560 thousand for Fiscal 2015, $47,0002018, $365 thousand for Fiscal 20142017 and $239,000$848 thousand for Fiscal 2013.2016. Stock based income tax benefits aggregated $240,000$886 thousand for Fiscal 2015, $17,0002018, $495 thousand for Fiscal 20142017 and $201,000$1.5 million for Fiscal 2013.2016. The weighted average fair value for stock options granted was $8.30$44.50 for Fiscal 2015, $12.50 for Fiscal 2014 and $8.76 for Fiscal 2013.2018.
As of May 2, 2015,April 28, 2018, unrecognized compensation expense related to the unvested portion of our stock options was $872,000,$268 thousand, which is expected to be recognized over a weighted average period of 5.73.3 years. The weighted average remaining contractual term and the aggregate intrinsic value for options outstanding as of May 2, 2015April 28, 2018 was 4.34.4 years and $6.9$27.3 million, respectively. The weighted average remaining contractual term and the aggregate intrinsic value for options exercisable as of May 2, 2015April 28, 2018 was 2.73.5 years and $4.4$17 million, respectively.
We have a stock purchase plan which provides for the purchase of up to 1,536,000 shares of common stock by employees who (i) have been employed for at least two years, (ii) are not part-time employees and (iii) are not owners of five percent or more of our common stock. As of May 2, 2015,April 28, 2018, no shares have been issued under the plan.
The Company contributes to certain pension plans under collective bargaining agreements and to a discretionary profit sharing plan. TotalAnnual contributions (including contributions to multi-employer plans reflected below) were $2.7$3.4 million for Fiscal 2015, $2.72018, $3.1 million for Fiscal 20142017 and $2.6$2.9 million for Fiscal 2013.2016.
The Company participates in variousthree multi-employer defined benefit pension plans coveringwith respect to certain employees whose employment is covered under collective bargaining agreements. If the Company chooses to stop participating in the multi-employer plan or if other employers choose to withdraw to the extent that a mass withdrawal occurs, the Company could be required to pay the plan a withdrawal liability based on the underfunded status of the plan. During Fiscal 2017, a subsidiary of the Company reached a settlement with respect to a notification of withdrawal liability by one of the multi-employer pension plans not considered significant. The settlement did not have a material effect on its financial position or results of operations.
Summarized below is certain information regarding the Company’s participation in significant multi-employer pension plans including the financial improvement plan or rehabilitation plan status (“FIP/RP Status”) and the zone status under the Pension Protection Act (“PPA”). The most recent PPA zone status available in Fiscal 20152018 and Fiscal 20142017 is for the plans’ years ending December 31, 20132016 and 2012,2015, respectively.
| | | PPA Zone Status | | | | | | PPA Zone Status | | | | | |
| | | Fiscal | | Fiscal | | | | Surcharge | | Fiscal | | Fiscal | | | | Surcharge | |
Pension Fund | | 2015 | | 2014 | | FIP/RP Status | | Imposed | | 2018 | | 2017 | | FIP/RP Status | | Imposed | |
Central States, Southeast and Southwest Areas Pension Plan (EIN no. 36-6044243) (the “CSSS Fund”) | | Red | | Red | | Implemented | | No | | Red | | Red | | Implemented | | Yes | |
Western Conference of Teamsters Pension Trust Fund (EIN no. 91-6145047) (the “WCT Fund”) | | Green | | Green | | Not applicable | | No | | Green | | Green | | Not applicable | | No | |
For the plan years ended December 31, 20132016 and December 31, 2012,2015, the Company was not listed in the Form 5500 Annual Returns as providing more than 5% of the total contributions for the above plans. The collective bargaining agreements for employees in the CSSS Fund and the WCT Fund expire on October 18, 2016 for the CSSS Fund2021 and May 14, 2016 for the WCT Fund.2021, respectively.
The Company’s contributions for all multi-employer pension plans for the last three fiscal years are as follow:follows:
| | | (In thousands) | | | (In thousands) | |
| | | Fiscal | | | Fiscal | | | Fiscal | | | Fiscal | | | Fiscal | | | Fiscal | |
Pension Fund | | 2015 | | | 2014 | | | 2013 | | | 2018 | | | 2017 | | | 2016 | |
CSSS Fund | | $ | 1,103 | | | $ | 1,079 | | | $ | 1,051 | | | $ | 1,370 | | | $ | 1,262 | | | $ | 1,172 | |
WCT Fund | | | 637 | | | | 476 | | | | 471 | | | | 619 | | | | 477 | | | | 485 | |
| Other multi-employer pension funds | | | 306 | | | | 295 | | | | 262 | | | | 228 | | | | 201 | | | | 448 | |
Total | | $ | 2,046 | | | $ | 1,850 | | | $ | 1,784 | | | $ | 2,217 | | | $ | 1,940 | | | $ | 2,105 | |
The trustees of one of the multi-employer pension plans that is not considered individually significant have notified a subsidiary of the Company that a mass withdrawal has occurred and have provided the subsidiary with a notice of withdrawal liability. The Company disputes various aspects of the withdrawal liability calculations and intends to challenge them in accordance with applicable Federal laws. The Company anticipates that the amount of its liability, if any, will not have a material effect on its financial position or results of operations.
10. | COMMITMENTS AND CONTINGENCIES |
We lease buildings, machinery and equipment under various non-cancelable operating lease agreements expiring at various dates through 2023.2029. Certain of these leases contain scheduled rent increases and/or renewal options. Contractual rent increases are taken into account when calculating the minimum lease payment and recognized on a straight-line basis over the lease term. Rent expense under operating lease agreements totaled approximately $8.2$13.3 million for Fiscal 2015, $7.92018, $12.0 million for Fiscal 20142017 and $8.9$9.2 million for Fiscal 2013.2016.
Our minimum lease payments under non-cancelable operating leases as of May 2, 2015April 28, 2018 were as follows:
| | | (In thousands) | | | (In thousands) | |
Fiscal 2016 | | $ | 5,399 | | |
Fiscal 2017 | | | 4,620 | | |
Fiscal 2018 | | | 3,789 | | |
Fiscal 2019 | | | 3,341 | | | $ | 9,182 | |
Fiscal 2020 | | | 2,639 | | | | 7,615 | |
Fiscal 2021 | | | | 5,241 | |
Fiscal 2022 | | | | 3,223 | |
Fiscal 2023 | | | | 1,656 | |
Thereafter | | | 2,406 | | | | 1,531 | |
Total minimum lease payments | | $ | 22,194 | | | $ | 28,448 | |
As of May 2, 2015, we guaranteed the residual value of certain leased equipment in the amount of $4.9 million. If the proceeds from the sale of such equipment are less than the balance required by the lease when the lease terminates on August 1, 2017, the Company shall be required to pay the difference up to such guaranteed amount. The Company expects to have no loss on such guarantee.
We enter into various agreements with suppliers for the purchase of raw materials, the terms of which may include variable or fixed pricing and minimum purchase quantities. As of May 2, 2015,April 28, 2018, we had purchase commitments for raw materials of $54.0$11.2 million through 2022.
As of April 28, 2018, we had purchase commitments for plant and equipment of $4.7 million for Fiscal 2016.2019.
From time to time, we are a party to various litigation matters and claims arising in the ordinary course of business. We do not expect the ultimate disposition of such matters to have a material adverse effect on our consolidated financial position or results of operations.
11. | QUARTERLY FINANCIAL DATA (UNAUDITED) |
| | | (In thousands, except per share amounts) | | | (In thousands, except per share amounts) | |
| | | First Quarter | | | Second Quarter | | | Third Quarter | | | Fourth Quarter | | | First Quarter | | | Second Quarter | | | Third Quarter | | | Fourth Quarter | |
Fiscal 2015 | | | | | | | | | | | | | | | | | |
Fiscal 2018 | | | | | | | | | | | | | | | | | |
Net sales | | $ | 174,637 | | | $ | 163,575 | | | $ | 143,021 | | | $ | 164,592 | | | $ | 259,832 | | | $ | 244,119 | | | $ | 227,477 | | | $ | 244,306 | |
Gross profit | | | 59,842 | | | | 57,732 | | | | 46,090 | | | | 55,476 | | | | 104,503 | | | | 96,080 | | | | 91,193 | | | | 99,359 | |
Net income | | | 15,363 | | | | 12,958 | | | | 8,808 | | | | 12,182 | | | | 38,272 | | | | 33,980 | | | | 41,080 | | | | 36,442 | |
Earnings per common share – basic | | $ | .33 | | | $ | .28 | | | $ | .19 | | | $ | .26 | | | $ | .82 | | | $ | .73 | | | $ | .88 | | | $ | .78 | |
Earnings per common share – diluted | | $ | .33 | | | $ | .28 | | | $ | .19 | | | $ | .26 | | | $ | .82 | | | $ | .72 | | | $ | .88 | | | $ | .78 | |
| | | | | | | | | | | | | | | | | | |
Fiscal 2017 | | | | | | | | | | | | | | | | | |
Net sales | | | $ | 217,108 | | | $ | 203,180 | | | $ | 194,564 | | | $ | 212,066 | |
Gross profit | | | | 85,494 | | | | 78,717 | | | | 75,920 | | | | 85,946 | |
Net income | | | | 28,995 | | | | 24,604 | | | | 24,285 | | | | 29,161 | |
Earnings per common share – basic | | | $ | .62 | | | $ | .53 | | | $ | .52 | | | $ | .63 | |
Earnings per common share – diluted | | | $ | .62 | | | $ | .53 | | | $ | .52 | | | $ | .62 | |
Fiscal 2014(1) | | | | | | | | | | | | | | | | |
Net sales | | $ | 172,353 | | | $ | 167,666 | | | $ | 136,774 | | | $ | 164,342 | |
Gross profit | | | 58,749 | | | | 58,830 | | | | 44,688 | | | | 55,388 | |
Net income | | | 12,070 | | | | 12,497 | | | | 7,136 | | | | 11,932 | |
Earnings per common share – basic | | $ | .26 | | | $ | .27 | | | $ | .15 | | | $ | .25 | |
Earnings per common share – diluted | | $ | .26 | | | $ | .27 | | | $ | .15 | | | $ | .25 | |
42
(1) The fourth quarter
REPORT OF INDEPENDENT REGISTERED PUBLIC ACCOUNTING FIRM
To the Board of Directors and Shareholders of
National Beverage Corp.
Opinions on the Financial Statements and Internal Control Over Financial Reporting
We have audited the accompanying consolidated balance sheets of National Beverage Corp. (the Company) as of May 2, 2015April 28, 2018 and May 3, 2014April 29, 2017, and the related consolidated statements of income, comprehensive income, shareholders'stockholders' equity and cash flows for each of the three years in the period ended April 28, 2018, and the related notes (collectively, the financial statements). We also have audited the Company’s internal control over financial reporting as of April 28, 2018, based on criteria established in Internal Control — Integrated Framework issued by the Committee of Sponsoring Organizations of the Treadway Commission in 2013.
In our opinion, the financial statements referred to above present fairly, in all material respects, the financial position of the Company as of April 28, 2018 and April 29, 2017, and the results of their operations and their cash flows for each of the years in the three-year period ended May 2, 2015. We also have audited National Beverage Corp.’sApril 28, 2018, in conformity with accounting principles generally accepted in the United States of America. Also in our opinion, the Company maintained, in all material respects, effective internal control over financial reporting as of May 2, 2015,April 28, 2018, based on criteria established in Internal Control — Integrated Framework issued by the Committee of Sponsoring Organizations of the Treadway Commission (COSO) in 2013. National Beverage Corp.’s
Basis for Opinions
The Company's management is responsible for these financial statements, for maintaining effective internal control over financial reporting, and for its assessment of the effectiveness of internal control over financial reporting, included in the accompanying Management’s Report on Internal Control over Financial Reporting. Our responsibility is to express an opinion on thesethe Company's financial statements and an opinion on the Company'scompany's internal control over financial reporting based on our audits. We are a public accounting firm registered with the Public Company Accounting Oversight Board (United States) (PCAOB) and are required to be independent with respect to the Company in accordance with U.S. federal securities laws and the applicable rules and regulations of the Securities and Exchange Commission and the PCAOB.
We conducted our audits in accordance with the standards of the Public Company Accounting Oversight Board (United States).PCAOB. Those standards require that we plan and perform the audits to obtain reasonable assurance about whether the financial statements are free of material misstatement, whether due to error or fraud, and whether effective internal control over financial reporting was maintained in all material respects.
Our audits of the financial statements included performing procedures to assess the risks of material misstatement of the financial statements, whether due to error or fraud, and performing procedures that respond to those risks. Such procedures included examining, on a test basis, evidence supportingregarding the amounts and disclosures in the financial statements, assessingstatements. Our audits also included evaluating the accounting principles used and significant estimates made by management, andas well as evaluating the overall presentation of the financial statement presentation.statements. Our audit of internal control over financial reporting included obtaining an understanding of internal control over financial reporting, assessing the risk that a material weakness exists, and testing and evaluating the design and operating effectiveness of internal control based on the assessed risk. Our audits also included performing such other procedures as we considered necessary in the circumstances. We believe that our audits provide a reasonable basis for our opinions.
Definition and Limitations of Internal Control Over Financial Reporting
A company's internal control over financial reporting is a process designed to provide reasonable assurance regarding the reliability of financial reporting and the preparation of financial statements for external purposes in accordance with generally accepted accounting principles. A company's internal control over financial reporting includes those policies and procedures that (1) pertain to the maintenance of records that, in reasonable detail, accurately and fairly reflect the transactions and dispositions of the assets of the company; (2) provide reasonable assurance that transactions are recorded as necessary to permit preparation of financial statements in accordance with generally accepted accounting principles, and that receipts and expenditures of the company are being made only in accordance with authorizations of management and directors of the company; and (3) provide reasonable assurance regarding prevention or timely detection of unauthorized acquisition, use or disposition of the company's assets that could have a material effect on the financial statements.
Because of its inherent limitations, internal control over financial reporting may not prevent or detect misstatements. Also, projections of any evaluation of effectiveness to future periods are subject to the risk that controls may become inadequate because of changes in conditions, or that the degree of compliance with the policies or procedures may deteriorate.
In our opinion, the consolidated financial statements referred to above present fairly, in all material respects, the financial position of National Beverage Corp. as of May 2, 2015 and May 3, 2014 and the results of their operations and their cash flows for each of the years in the three-year period ended May 2, 2015, in conformity with accounting principles generally accepted in the United States of America. Also in our opinion, National Beverage Corp. maintained, in all material respects, effective internal control over financial reporting as of May 2, 2015, based on criteria established in Internal Control—Integrated Framework issued by the Committee of Sponsoring Organizations of the Treadway Commission (COSO) in 2013./s/ RSM US LLP
/s/ McGladrey LLPWe have served as the Company's auditor since 2006.
West Palm Beach,
Fort Lauderdale, Florida
July 16, 2015
June 27, 2018
ITEM 9. CHANGES IN AND DISAGREEMENTS WITH ACCOUNTANTS ON ACCOUNTING AND FINANCIAL DISCLOSURE
ITEM 9. | CHANGES IN AND DISAGREEMENTS WITH ACCOUNTANTS ON ACCOUNTING AND FINANCIAL DISCLOSURE |
Not applicable.
ITEM 9A. | CONTROLS AND PROCEDURES |
ITEM 9A. CONTROLS AND PROCEDURES
Disclosure Controls and Procedures
As of the end of the period covered by this Annual Report on Form 10-K, we carried out an evaluation, under the supervision and with the participation of the Company’s management, including our Chief Executive Officer and Principal Financial Officer, of the effectiveness of the design and operation of our “disclosure controls and procedures” (as defined in Rule 13a-15(e) of the Securities Exchange Act of 1934, as amended (the “Exchange Act”)). Based upon that evaluation, the Chief Executive Officer and Principal Financial Officer concluded that our disclosure controls and procedures were effective to ensure information required to be disclosed by us in reports we file or submit under the Exchange Act is (1) recorded, processed, summarized and reported within the time periods specified in SEC rules and forms and (2) accumulated and communicated to our management, including our Chief Executive Officer and Principal Financial Officer, to allow timely decisions regarding required disclosure.
Report on Internal Control over Financial Reporting
Our management is responsible for establishing and maintaining adequate internal control over financial reporting, as such term is defined in Rule 13a-15(f) of the Exchange Act. Under the supervision and with the participation of our management, including our Chief Executive Officer and Principal Financial Officer, we conducted an evaluation of the effectiveness of our internal control over financial reporting based on the framework inInternal Control – Integrated Frameworkissued by the Committee of Sponsoring Organizations of the Treadway Commission in 2013. Based on that evaluation, our management concluded that our internal control over financial reporting was effective as of May 2, 2015.April 28, 2018.
Management recognizes that there are inherent limitations in the effectiveness of any internal control over financial reporting, including the possibility of human error and the circumvention or overriding of internal control. Accordingly, even effective internal control over financial reporting can provide only reasonable assurance with respect to financial statement preparation. Further, because of changes in conditions, the effectiveness of internal control may vary over time.
McGladreyRSM US LLP, an independent registered public accounting firm, has audited the consolidated financial statements included in this Annual Report on Form 10-K and, as part of their audit, has issued their report, included herein, on the effectiveness of our internal control over financial reporting.
Changes in Internal Control over Financial Reporting
There were no changes in our internal control over financial reporting during the quarter ended May 2, 2015April 28, 2018 that have materially affected, or are reasonably likely to materially affect, our internal control over financial reporting.
ITEM 9B. OTHER INFORMATION
Not applicable.
PART III
ITEM 10. DIRECTORS, EXECUTIVE OFFICERS AND CORPORATE GOVERNANCE
The information required by Item 10 will be included under the captions “Election of Directors”, “Information as to Nominees and Other Directors”, “Information Regarding Meetings and Committees of the Board” and “Section 16(a) Beneficial Ownership Reporting Compliance” in the Company’s 20152018 Proxy Statement and is incorporated herein by reference.
The following table sets forth certain information with respect to the officers of the Registrant as of May 2, 2015:April 28, 2018:
Name | Age | Position with Company |
| | | |
Nick A. Caporella(1) | 7982 | Chairman of the Board and Chief Executive Officer |
| | |
| | |
Joseph G. Caporella(2) | 5558 | President |
| | |
| | |
George R. Bracken(3) | 7072 | Executive Vice President – Finance |
| | |
| | |
Gregory P. Cook(4) | 5760 | Vice President – Controller and Chief Accounting Officer |
((1)1)
| Mr. Nick A. Caporella has served as Chairman of the Board, Chief Executive Officer and Director since the Company’s inception in 1985. Also, he serves as Chairman of the Nominating Committee. Since 1992, Mr. Caporella’s services have been provided to the Company by Corporate Management Advisors, Inc., a company which he owns. |
(2) | Mr. Joseph G. Caporella has served as President since September 2002 and, prior to that, as Executive Vice President and Secretary since January 1991. Also, he has served as a Director since January 1987. Joseph G. Caporella is the son of Nick A. Caporella. |
(3) | Mr. George R. Bracken has served as Executive Vice President - Finance since July 2012. Previously, he served as Senior Vice President – Finance from October 2000 to July 2012 and Vice President and Treasurer from October 1996 to October 2000. Since 1992, Mr. Bracken’s services have been provided to the Company by Corporate Management Advisors, Inc. |
(4) | Mr. Gregory P. Cook has served as Vice President – Controller and Chief Accounting Officer since July 15, 2014. Previously, he served as Vice-President – Controller since September 2012 and, prior to that date, as Controller since August 2007. On July 15, 2014, he was named Vice President – Controller and Chief Accounting Officer. |
All officers serve until their successors are chosen and may be removed at any time by the Board of Directors. Officers are normally appointed each year at the first meeting of the Board of Directors after the annual meeting of shareholders.
ITEM 11. EXECUTIVE COMPENSATION
The information required by Item 11 will be included under the captions “Executive Compensation and Other Information” and “Compensation Committee Interlocks and Insider Participation” in the Company’s 20152018 Proxy Statement and is incorporated herein by reference.
ITEM 12. SECURITY OWNERSHIP OF CERTAIN BENEFICIAL OWNERS AND MANAGEMENTMANAGEMENT AND RELATED STOCKHOLDER MATTERS
The information required by Item 12 will be included under the captions “Security Ownership” and “Equity Compensation Plan Information” in the Company’s 20152018 Proxy Statement and is incorporated herein by reference.
ITEM 13. CERTAIN RELATIONSHIPS AND RELATED TRANSACTIONS,TRANSACTION, AND DIRECTOR INDEPENDENCE
The information required by Item 13 will be included under the captions “Certain Relationships and Related Party Transactions” and “Information Regarding Meetings and Committees of the Board” in the Company’s 20152018 Proxy Statement and is incorporated herein by reference.
ITEM 14. PRINCIPAL ACCOUNTINGACCOUNTING FEES AND SERVICES
The information required by Item 14 will be included under the caption “Independent Auditors” in the Company’s 20152018 Proxy Statement and is incorporated herein by reference.
PART IV
ITEM 15. EXHIBITS,, FINANCIAL STATEMENT SCHEDULES
EXHIBIT INDEX
ExhibitNo.Exhibit
No. | | Description |
| | | |
3.1 | | 3.1
| Restated Certificate of Incorporation(1) |
| | | |
3.2 | 3.2 | Amended and Restated By-Laws(1) |
| | | |
3.3 | | 3.3
| Certificate of Designation of the Special Series D Preferred Stock of the Company((2)2) |
| | | |
| 10.1 | | Management Agreement between the Company and Corporate Management Advisors, Inc.(3)(3) * |
| | | |
| 10.2 | | National Beverage Corp. Investment and Profit Sharing Plan(1) * |
| | | |
| 10.3 | | National Beverage Corp. 1991 Omnibus Incentive Plan(3)(3) * |
| | | |
| 10.4 | | National Beverage Corp. 1991 Stock Purchase Plan(3)(3) * |
| | | |
| 10.5 | | Amendment No. 1 to the National Beverage Corp. Omnibus Incentive Plan(4)(4) * |
| | | |
| 10.6 | | National Beverage Corp. Special Stock Option Plan(5)(5) * |
| | | |
| 10.7 | | Amendment No. 2 to the National Beverage Corp. Omnibus Incentive Plan(6)(6) * |
| | | |
| 10.8 | | National Beverage Corp. Key Employee Equity Partnership Program(6)(6) * |
| | | |
| 10.9 | | Second Amended and Restated Credit Agreement, dated June 30, 2008, between NewBevCo, Inc. and lender therein((7)7) |
| | | |
| 10.10 | | Amendment to National Beverage Corp. Special Stock Option Plan(8)(8) * |
| | | |
| 10.11 | | Amendment to National Beverage Corp. Key Employee Equity Partnership Program(8)(8)* |
| | | |
| 10.12 | Credit Agreement, dated July 8, 2011, between NewBevCo, Inc. and lender therein(9) |
| | |
| 10.13 | First Amendment to Credit Agreement, dated November 23, 2012, between NewBevCo, Inc. and lender therein(10) |
| | |
| 10.14 | First Amendment to SecondedSecond Amended and Restated Credit Agreement, dated January 16, 2013, between NewBevCo, Inc. and lender therein((9)11) |
| | | |
10.13 | 10.15 | SubscriptionCredit Agreement, dated January 25, 2013,June 18, 2015, between the CompanyNewBevCo, Inc. and 8100 Partners, LLClender therein((10)2) |
| | | |
| 10.14 | 21 | Subsidiaries of RegistrantSecond Amendment to Second Amended and Restated Credit Agreement, dated July 7, 2015, between NewBevCo, Inc. and lender therein((10)12) |
| | | |
| 10.15 | 23 | Consent of Independent Registered Public Accounting FirmThird Amendment to Second Amended and Restated Credit Agreement, dated June 29, 2017, between NewBevCo, Inc. and lender therein((11)12) |
_________________________________
*Indicates management contract or compensatory plan or arrangement.
* | Indicates management contract or compensatory plan or arrangement. |
(1) | Previously filed with the Securities and Exchange Commission as an exhibit to the Form S-1 Registration Statement (File No. 33-38986) on February 19, 1991 and is incorporated herein by reference. |
(2) | Previously filed with the Securities and Exchange Commission as an exhibit to Form 8-K Current Report dated January 31, 2013 and is incorporated herein by reference. |
(3) | Previously filed with the Securities and Exchange Commission as an exhibit to Amendment No. 1 to Form S-1 Registration Statement (File No. 33-38986) on July 26, 1991 and is incorporated herein by reference. |
((4)4)
| Previously filed with the Securities and Exchange Commission as an exhibit to Annual Report on Form 10-K for the fiscal year ended April 27, 1996 and is incorporated herein by reference. |
((5)5)
| Previously filed with the Securities and Exchange Commission as an exhibit to Registration Statement on Form S-8 (File No. 33-95308) on August 1, 1995 and is incorporated herein by reference. |
((6)6)
| Previously filed with the Securities and Exchange Commission as an exhibit to Annual Report on Form 10-K for the fiscal year ended May 3, 1997 and is incorporated herein by reference. |
((7)7)
| Previously filed with the Securities and Exchange Commission as an exhibit to Quarterly Report on Form 10-Q for the fiscal period ended January 29, 2011 and is incorporated herein by reference. |
((8)8)
| Previously filed with the Securities and Exchange Commission as an exhibit to Quarterly Report on Form 10-Q for the fiscal period ended January 31, 2009 and is incorporated herein by reference. |
(9) | Previously filed with the Securities and Exchange Commission as an exhibit to Annual Report on Form 10-K for the fiscal year ended April 30, 2011 and is incorporated herein by reference. |
(10) | Previously filed with the Securities and Exchange Commission as an exhibit to Quarterly Report on Form 10-Q for the fiscal period ended October 27, 2012 and is incorporated herein by reference. |
(11) | Previously filed with the Securities and Exchange Commission as an exhibit to Quarterly Report on Form 10-Q for the fiscal period ended January 26, 2013 and is incorporated herein by reference. |
((10)12)
| Previously filed with the Securities and Exchange Commission as an exhibit to Quarterly Report on Form 10-Q for the fiscal period ended August 1, 2015 and is incorporated herein by reference. |
(11) | Previously filed with the Securities and Exchange Commission as an exhibit to Annual Report on Form 10-K for the fiscal year ended April 29, 2017 and is incorporated herein by reference. |
(12) | Previously filed with the Securities and Exchange Commission as an exhibit to Quarterly Report on Form 10-Q for the fiscal period ended October 28, 2017 and is incorporated herein by reference. |
SIGNATURES
Pursuant to the requirements of Section 13 or 15(d) of the Securities Exchange Act of 1934, the Registrant has duly caused this report to be signed on its behalf by the undersigned, thereunto duly authorized.
| NATIONAL BEVERAGE CORP. | |
| | | |
| By: | /s/ Gregory P. Cook | |
| | Gregory P. Cook | |
| | Vice President – Controller and | |
| | Vice President – Controller and Chief Accounting Officer
| |
| | | | |
| | | | |
| Date: July 16, 2015June 27, 2018 | |
Pursuant to the requirements of the Securities Exchange Act of 1934, this report has been signed below by the following persons on behalf of the Registrant and in the capacities indicated on July 16, 2015.June 27, 2018.
| | | | |
/s/Nick A. Caporella | | | /s/ Cecil D. Conlee | |
Nick A. Caporella | | | Cecil D. Conlee | |
Chairman of the Board and | | Director | |
Chief Executive Officer | | | Director
| |
| | | | |
/s/Joseph G. Caporella | | | /s/Samuel C. Hathorn, Jr. | |
Joseph G. Caporella | | | Samuel C. Hathorn, Jr. | |
President and Director | | Director | |
| | | Director
| |
| | | | |
/s/George R. Bracken | | | /s/Stanley M. Sheridan | |
George R. Bracken | | | Stanley M. Sheridan | |
Executive Vice President – Finance | | Director | |
(Principal Financial Officer) | | | Director
| |
(Principal Financial Officer) | | | | |
| | | | |
/s/Gregory P. Cook
| | | | | |
/s/ Gregory P. Cook | | | | | |
Vice President – Controller andChief Accounting Officer
| ��
| Gregory P. Cook | | | |
Vice President – Controller and | | | |
Chief Accounting Officer | | | |
50
45