| |
| x | ANNUAL REPORT PURSUANT TO SECTION 13 OR 15(d) OF THE SECURITIES EXCHANGE ACT OF 1934 |
| |
| ☐ | TRANSITION REPORT PURSUANT TO SECTION 13 OR 15(d) OF THE SECURITIES EXCHANGE ACT OF 1934 |
|
| |
| Delaware | 74-1335253 | |
| (State or other jurisdiction of incorporation or organization) | (IRS Employer Identification Number) | |
| Title of Each Class | Name of Each Exchange onwhich registered | |
Common Stock ($0.32 par value per share) | New York Stock Exchange | |
| Common Stock Purchase Rights | New York Stock Exchange | |
x
x
x
| Large accelerated filer ☐ | Accelerated filer |
Non-accelerated filer ☐ | Smaller reporting company x |
| Emerging growth company ☐ | |
| If an emerging growth company, indicate by check mark if the registrant has elected not to use the extended transition period for complying with any new or revised financial accounting standards provided pursuant to Section 13(a) of the Exchange Act. ☐ | |
x
26, 201529, 2018PagePart IPage Item 1Business6Risk Factors102020434479797980808080808185
Additional Information
We file reports with the Securities and Exchange Commission (“SEC”), including annual reports on Form 10-K, quarterly reports on Form 10-Q, and current reports on Form 8-K. The public may read and copy any materials we file with the SEC at the SEC’s Public Reference Room at 100 F Street, N.E., Washington, D.C. 20549. The public may obtain information on the operation of the Public Reference Room by calling the SEC at 1-800-SEC-0330. We are an electronic filer, and the SEC maintains an Internet site athttp://www.sec.gov that contains the reports, proxy and information statements, and other information that we file electronically. Our website address iswww.lubysinc.com. Please note that our website address is provided as an inactive textual reference only. We make available free of charge through our website the annual report on Form 10-K, quarterly reports on Form 10-Q, current reports on Form 8-K, and all amendments to those reports as soon as reasonably practicable after such material is electronically filed with or furnished to the SEC. The information provided on our website is not part of this report, and is therefore not incorporated by reference unless such information is specifically referenced elsewhere in this report.
FORWARD-LOOKING STATEMENTS
This Annual Report on “Form(this "Form 10-K”) contains statements that are “forward-looking statements” within the meaning of Section 27A of the Securities Act of 1933, as amended, and Section 21E of the Securities Exchange Act of 1934, as amended. All statements contained in this Form 10-K, other than statements of historical facts, are “forward-looking statements” for purposes of these provisions, including any statements regarding:
|
| |
|
| |
|
| |
|
| |
|
| |
|
| |
|
| |
|
| |
|
| |
|
|
|
| |
|
| |
|
| |
|
| |
|
| |
|
| |
|
| |
|
| |
|
| |
|
| |
|
| |
|
| |
|
| |
|
| |
|
| |
|
| |
|
| |
|
| |
|
|
PART I
San Antonio Metro Rio Grande Valley Dallas/Fort Worth Metro Austin Arizona orders which comprise approximately 13% of our Luby's Cafeteria restaurant sales. the area supervised. Food-to-go sales comprise approximately 8% of Fuddruckers restaurant sales. governmental facility, one medical office building, one senior living facility, and one freestanding coffee venue located inside an office building. We have the unique ability to deliver quality services that include facility design and procurement as well as nutrition and branded food services to our clients. 2017. Luby’s, Inc. owns or is licensed to use valuable intellectual property including trademarks, service marks, patents, copyrights, trade secrets and other proprietary information, including the Luby’s and Fuddruckers logos, trade names and trademarks, which are of material importance to our business. Depending on the jurisdiction, trademarks, and service marks generally are valid as long as they are used and/or registered. Patents, copyrights, and licenses are of varying durations. The success of our business depends on the continued ability to use existing trademarks, service marks, and other components of our brands in order to increase brand awareness and further develop branded products. We take prudent actions to protect our intellectual property. event our cost estimates differ from actual costs, we could incur additional unplanned costs, which could adversely impact our financial condition. In addition, we have previously been the victim of a cyber attack by hackers who deployed a version of the SamSam ransomware that encrypted electronic files, locking us out of many of our point-of-sale and other systems. These hackers requested a “ransom” payment in exchange for restoring access to these encrypted files. Such attacks, while they did not provide the hackers with access to confidential customer and employee information, did adversely affect our profits due to our temporary inability to operate our restaurants and increased costs associated further protecting and restoring our computer systems. While we have taken preventative measures, no assurances can be provided that we will not be the subject of cyber attacks again in the future. December 2021. Fiscal Quarter Ended High Low November 20, 2013 February 12, 2014 May 7, 2014 August 27, 2014 November 19, 2014 February 11, 2015 May 6, 2015 August 26, 2015 $1.41. (a) (b) (c) Plan Category Number of Securitiesto be Issued Upon Exercise of Outstanding Options, Rights Weighted- Average Options, Rights Number of Securities Available for Future Issuance Under Equity Compensation Plans Excluding Securities Reflected in Column (a) Equity compensation plans previously approved by security holders Equity compensation plans not previously approved by security holders(1) Total 2010 2011 2012 2013 2014 2015 Luby’s, Inc. S&P 500 Index—Total Return S&P 500 Restaurant Index New Peer Group Index Only New Peer Group Index + Luby’s Inc. Old Peer Group Index Only Old Peer Group Index + Luby’s Inc. Fiscal Year Ended August 26, August 27, August 28, August29, August31, (364 days) (364 days) (364 days) (364 days) (371days) (In thousands, except per share data) Sales Restaurant sales Culinary contract services Franchise revenue Vending revenue Total sales Income (loss) from continuing operations ) ) Income (loss) from discontinued operations (a) ) ) ) ) Net income (loss) ) ) Income (loss) per share from continuing operations: Basic ) ) Assuming dilution ) ) Income (loss) per share from discontinued operation: Basic ) ) ) ) Assuming dilution ) ) ) ) Net income (loss) per share: Basic ) ) Assuming dilution ) ) Weighted-average shares outstanding: Basic Assuming dilution Total assets Total debt Number of restaurants at fiscal year end Number of franchised restaurants at fiscal year end Number of Culinary Contract Services contracts at fiscal year end Costs and Expenses (As a percentage of restaurant sales) Cost of food % % % % % Payroll and related costs % % % % % Other operating expenses % % % % % Occupancy costs % % % % % FiscalYear Ended August 26, August 27, August 28, (52 weeks) (52 weeks) (52 weeks) Restaurant sales % % % Culinary contract services % % % Franchise revenue % % % Vending revenue % % % TOTAL SALES % % % STORE COSTS AND EXPENSES: (As a percentage of restaurant sales) Cost of food % % % Payroll and related costs % % % Other operating expenses % % % Occupancy costs % % % Vending revenue )% )% )% Store level profit % % % COMPANY COSTS AND EXPENSES: (As a percentage of total sales) Opening costs % % % Depreciation and amortization % % % Selling, general and administrative expenses % % % Provision for asset impairments % % % Net gain on disposition of property and equipment )% )% )% Culinary Contract Services Costs (As a percentage ofculinary contract servicessales) Cost of culinary contract services % % % Culinary income % % % Franchise Operations Costs (As a percentage offranchise operations) Cost of franchise operations % % % Franchise income % % % (As a percentage of total sales) INCOME (LOSS) FROM OPERATIONS )% )% % Interest income % % % Interest expense )% )% )% Other income, net % % % Income (loss) before income taxes and discontinued operations )% )% % Provision (benefit) for income taxes )% )% % Income (loss) from continuing operations )% )% % Loss from discontinued operations, net of income taxes )% )% )% NET INCOME (LOSS) )% )% % FiscalYear Ended August 26, August 27, August 28, (52 weeks) (52 weeks) (52 weeks) Store level profit Plus: Sales from culinary contract services Sales from franchise revenue Less: Opening costs Cost of culinary contract services Cost of franchise operations Depreciation and amortization Selling, general and administrative expenses Provision for asset impairments Net gain on disposition of property and equipment ) ) ) Interest income ) ) ) Interest expense Other income, net ) ) ) Provision (benefit) for income taxes ) ) Income (loss) from continuing operations ) ) 30, 2017. Fiscal2015 Year Begin Fiscal 2015 Openings Fiscal 2015 Closings Fiscal2015 Year End Luby’s Cafeterias(1) ) Fuddruckers Restaurants(1) ) Cheeseburger in Paradise Other restaurants(2) Total ) Description of the business sales through retail grocery outlets. associated other overhead costs. 2016. % )% % )% )% % % )% % )% )% % Fiscal Year 2015 Ended Fiscal Year 2014 Ended Fiscal 2015 vs Fiscal 2014 Fiscal Year 2013 Ended Fiscal 2014 vs Fiscal 2013 ($000s) August 26, 2015 August 27, 2014 Increase/ (Decrease) August 28, 2013 Increase/ (Decrease) (52 weeks) (52 vs 52 weeks) Restaurant sales % % Culinary contract services )% % Franchise revenue )% % Vending revenue )% )% Total )% % were generated. Restaurant Brand Fiscal 2015 ($000s) Fiscal 2014 ($000s) Fiscal 2015 H/(L) Than Fiscal 2014 $ Amount % Change Luby’s Cafeterias ) )% Fuddruckers % Combo locations % Cheeseburger in Paradise ) )% Koo Koo Roo ) )% Total Restaurant Sales % 2017. Fiscal Year 2015Ended Fiscal Year 2014 Ended Fiscal 2015 vs Fiscal 2014 Fiscal Year 2013 Ended Fiscal 2014 vs Fiscal 2013 ($000s) August 26, 2015 August 27, 2014 Increase/ (Decrease) August 28, 2013 Increase/ (Decrease) (52 weeks) (52 vs 52 weeks) (52 weeks) (52 vs 52 weeks) Cost of food % % As a percent of restaurant sales % % % % % Payroll and Related Costs Fiscal Year 2015 Ended Fiscal Year 2014 Ended Fiscal 2015 vs Fiscal 2014 Fiscal Year 2013 Ended Fiscal 2014 vs Fiscal 2013 ($000s) August 26, 2015 August 27, 2014 Increase/ (Decrease) August 28, 2013 Increase/ (Decrease) (52 weeks) (52 vs 52 weeks) (52 weeks) (52 vs 52 weeks) Payroll and related costs % % As a percent of restaurant sales % % % % % hourly wage rates reflective of market pressures; and (3) an approximate $1.0 million increase in workers' compensation expense. (mainly management labor) with lower same-store sales levels; (2) higher average hourly wage rates reflective of market pressures; (3) higher average restaurant management compensation; partially offset by (4) lower workers' compensation insurance expense. Fiscal Year 2015 Ended Fiscal Year 2014 Ended Fiscal 2015 vs Fiscal 2014 Fiscal Year 2013 Ended Fiscal 2014 vs Fiscal 2013 August 26, 2015 August 27, 2014 Increase/ (Decrease) August 28, 2013 Increase/ (Decrease) Other operating expenses % % As a percent of restaurant sales % % % % % supplies expense with typical inflationary cost increases on lower same-store sales volumes. Fiscal Year 2015 Ended Fiscal Year 2014 Ended Fiscal 2015 vs Fiscal 2014 Fiscal Year 2013 Ended Fiscal 2014 vs Fiscal 2013 August 26, 2015 August 27, 2014 Increase/ (Decrease) August 28, 2013 Increase/ (Decrease) Occupancy cost )% % As a percent of restaurant sales % % )% % )% Franchise Operations Segment Profit Fiscal Year 2015 Ended Fiscal Year 2014 Ended Fiscal 2015 vs Fiscal 2014 Fiscal Year 2013 Ended Fiscal 2014 vs Fiscal 2013 August 26, 2015 August 27, 2014 Increase/ (Decrease) August 28, 2013 Increase/ (Decrease) Franchise revenue )% % Cost of franchise revenue )% % Franchise profit )% )% Franchise profit as percent of franchise revenue % % % % )% Fiscal Year 2015 Ended Fiscal Year 2014 Ended Fiscal 2015 vs Fiscal 2014 Fiscal Year 2013 Ended Fiscal 2014 vs Fiscal 2013 ($000s) August 26, 2015 August 27, 2014 Increase/ (Decrease) August 28, 2013 Increase/ (Decrease) Culinary contract services sales % Cost of culinary contract services % Culinary contract profit % Culinary contract profit as percent of culinary contract sales % % % % (3) the closure of nine locations which reduced sales by $3.1 million. Cost of 2016. Fiscal Year 2015 Ended Fiscal Year 2014 Ended Fiscal 2015 vs Fiscal 2014 Fiscal Year 2013 Ended Fiscal 2014 vs Fiscal 2013 August 26, 2015 August 27, 2014 Increase/ (Decrease) August 28, 2013 Increase/ (Decrease) Depreciation and amortization % % As a percent of total sales % % % % % lives. Fiscal Year 2015 Ended Fiscal Year 2014 Ended Fiscal 2015 vs Fiscal 2014 Fiscal Year 2013 Ended Fiscal 2014 vs Fiscal 2013 August 26, 2015 August 27, 2014 Increase/ (Decrease) August 28, 2013 Increase/ (Decrease) Selling, general and administrative expenses Marketing and advertising expenses Selling, general and administrative expenses As percent of total sales approximately $0.5 million. the lease terms. at operating locations and costs associated with disposal of assets at one leased property we operated up until the time of lease termination. 2016. balances and higher average interest rates. 2017 compared to fiscal 2016 primarily related to (1) recording a net reduction in the fair value of our interest rate swap agreement; (2) lower rental net income; and (3) a decrease in sales tax discounts as we did not participate in state tax prepayment programs to the full extent in fiscal 2017. FiscalYear Ended August 26, August 27, August 28, (52 weeks) (52 weeks) (52 weeks) Discontinued operating losses ) ) ) Impairments ) ) ) Net gains (losses) ) Pretax loss ) ) ) Income tax benefit from discontinued operations Loss from discontinued operations ) ) ) properties. Based upon our level of past and projected capital requirements, we expect that proceeds from the sale of assets and cash flows from operations, combined with other financing alternatives in place or available, will be sufficient to meet our capital expenditures and working capital requirements during the next twelve months. Fiscal Year Ended August 26, August 27, August 27, (In thousands) Total cash provided by (used in): Operating activities Investing activities ) ) ) Financing activities ) Increase (decrease) in cash and cash equivalents ) the fair value of our interest rate swap. 2017. costs. November 8, 2021. For this section of the form 10-K, capitalized terms that are used but not otherwise defined shall have the meanings given to such terms in the 2016 Credit Agreement. Agreement, initial extensions of credit under the 2016 Credit Agreement, and (iii) for working capital and general corporate purposes of the Company. our subsidiaries. The other indebtedness. Payments due by Period Contractual Obligations Total Less than 1 Year 1-3 Years 3-5 Years After (In thousands) Long-term debt(a) Capital lease and other obligations(b) Operating lease obligations(c) Uncertain tax positions liability(d) Total Amount of Commitment by Expiration Period Other Commercial Commitments Total Fiscal Fiscal Fiscal Thereafter (In thousands) Letters of credit Capital lease obligations contain leases FiscalYear Ended August 26, August 27, August 28, (364 days) (364 days) (364 days) (In thousands) AFFILIATED COSTS INCURRED: Selling, general and administrative expenses—professional and other costs Capital expenditures—custom-fabricated and refurbished equipment Other operating expenses, occupancy costs and opening costs, including property leases Total RELATIVE TOTAL COMPANY COSTS: Selling, general and administrative expenses Capital expenditures Other operating expenses, occupancy costs and opening costs Total AFFILIATED COSTS INCURRED AS A PERCENTAGE OF RELATIVE TOTAL COMPANY COSTS % % % one dollar. the Company. the Company. Our income tax expense, deferred tax assets and liabilities, and liabilities for unrecognized tax benefits reflect management’s best estimate of current and future taxes to be paid. We are subject to income taxes in the United States and a limited number of foreign jurisdictions, involving franchised locations in South America, Mexico, Dominican Republic, Canada, Poland and Italy. Significant judgments and estimates are required in the determination of the consolidated income tax expense. On December 22, 2017, President Donald J. Trump signed into law U.S. tax reform legislation that is commonly referred to as the Tax Cuts and Jobs Act (the “Tax Act”). The enactment date occurred during the second quarter of fiscal 2018 and the impact on our income tax accounts of the Tax Act are accounted for in the period of enactment, in accordance with ASC 740. The Tax Act makes broad and complex changes to the U.S. tax code and most notably to the Company, the Tax Act lowered the federal statutory tax rate from 35% to 21% effective January 1, 2018. In accordance with the application of IRC Section 15, the Company's federal statutory tax rate for fiscal 2018 was 25 percent, representing a blended tax rate for the current fiscal year based on the number of days in the fiscal year before and after the effective date. For subsequent years, the Company's federal statutory tax rate is anticipated to be 21%. The Company was also required to remeasure its deferred tax assets and liabilities using the new federal statutory tax rate in the second quarter of fiscal year 2018, upon enactment of the Tax Act. At that time, the Company's net deferred tax asset balance was $7.8 million, and the Tax Act reduction in the federal statutory tax rate resulted in a one-time non-cash reduction to the Company's net deferred tax balance of approximately $3.2 million with a corresponding income tax provision increase in the second quarter of fiscal 2018. Deferred income taxes arise from temporary differences between the tax basis of assets and liabilities and their reported amounts in the financial statements, which will result in taxable or deductible amounts in the future, as well as from tax Net Operating Losses ("NOL") and tax credit carryovers. We establish a valuation allowance when we no longer consider it more likely than not that a deferred tax asset will be realized. In evaluating our ability to recover our deferred tax assets, we consider available positive and negative evidence, including scheduled reversals of deferred tax liabilities, tax-planning strategies rd party insurance carriers. Our self-insurance expense is accrued based upon the aggregate of the expected liability for reported claims and the estimated liability for claims incurred but not reported, based on historical claims experience provided by our 3rd party insurance advisors, adjusted as necessary based upon management’s reasoned judgment. Actual employee medical claims expense may differ from estimated loss provisions based on historical experience. The liabilities for these claims are included as a component of Accrued expenses and other liabilities on our consolidated balance sheets. It is generally our policy to maintain stable menu prices without regard to seasonal variations in food costs. Certain increases in costs of food, wages, supplies, transportation and services may require us to increase our menu prices from time to time. To the extent prevailing market conditions allow, we intend to adjust menu prices to maintain profit margins. We are a public accounting firm registered with the PCAOB and are required to be independent with respect to the Company in accordance with the U.S. federal securities laws and the applicable rules and regulations of the Securities and Exchange Commission and the PCAOB. 2013 Internal Control-Integrated Framework issued by COSO. We are a public accounting firm registered with the PCAOB and are required to be independent with respect to the Company in accordance with the U.S. federal securities laws and the applicable rules and regulations of the Securities and Exchange Commission and the PCAOB. August 26, August 27, (In thousands, except share data) ASSETS Current Assets: Cash and cash equivalents Trade accounts and other receivables, net Food and supply inventories Prepaid expenses Assets related to discontinued operations Deferred income taxes Total current assets Property held for sale Assets related to discontinued operations Property and equipment, net Intangible assets, net Goodwill Deferred income taxes Other assets Total assets LIABILITIES AND SHAREHOLDERS’ EQUITY Current Liabilities: Accounts payable Liabilities related to discontinued operations Accrued expenses and other liabilities Total current liabilities Credit facility debt Liabilities related to discontinued operations Other liabilities Total liabilities Commitments and Contingencies SHAREHOLDERS’ EQUITY Common stock, $0.32 par value; 100,000,000 shares authorized; Shares issued were 29,134,603 and 28,949,523, respectively; Shares outstanding were 28,634,603 and 28,449,523, respectively Paid-in capital Retained earnings Less cost of treasury stock, 500,000 shares ) ) Total shareholders’ equity Total liabilities and shareholders’ equity Year Ended August 26, August 27, August 28, (In thousands, except per share data) SALES: Restaurant sales Culinary contract services Franchise revenue Vending revenue TOTAL SALES COSTS AND EXPENSES: Cost of food Payroll and related costs Other operating expenses Occupancy costs Opening costs Cost of culinary contract services Cost of franchise operations Depreciation and amortization Selling, general and administrative expenses Provision for asset impairments Net gain on disposition of property and equipment ) ) ) Total costs and expenses INCOME (LOSS) FROM OPERATIONS ) ) Interest income Interest expense ) ) ) Other income, net Income (loss) before income taxes and discontinued operations ) ) Provision (benefit) for income taxes, net ) ) Income (loss) from continuing operations ) ) Loss from discontinued operations, net of income taxes ) ) ) NET INCOME (LOSS) ) ) Income (loss) per share from continuing operations: Basic ) ) Assuming dilution ) ) Loss per share from discontinued operations: Basic ) ) ) Assuming dilution ) ) ) Net income (loss) per share: Basic ) ) Assuming dilution ) ) Weighted-average shares outstanding: Basic Assuming dilution Common Stock Issued Treasury Shares Amount Shares Amount Paid-In Retained Total Balance at August 29, 2012 ) ) Net income for the year Common stock issued under nonemployee director benefit plans Common stock issued under employee benefit plans Increase in excess tax benefits from share-based compensation Share-based compensation expense Balance at August 28, 2013 ) ) Net loss for the year ) ) Common stock issued under nonemployee director benefit plans Common stock issued under employee benefit plans Increase in excess tax benefits from share-based compensation Share-based compensation expense Balance at August 27, 2014 ) ) Net loss for the year ) ) Common stock issued under nonemployee director benefit plans ) Common stock issued under employee benefit plans Increase in excess tax benefits from share-based compensation Share-based compensation expense Balance at August 26, 2015 ) ) Year Ended August 26, August 27, August 28, (In thousands) CASH FLOWS FROM OPERATING ACTIVITIES: Net income (loss) ) ) Adjustments to reconcile net income to net cash provided by operating activities: Provision for asset impairments and gains on property sales ) ) Depreciation and amortization Amortization of debt issuance cost Non-cash compensation expense Share-based compensation expense Tax benefit on share-based compensation ) ) ) Deferred tax expense (benefit) ) ) Cash provided by operating activities before changes in operating asset and liabilities Changes in operating assets and liabilities: Decrease (increase) in trade accounts and other receivables ) ) Decrease (increase) in food and supply inventories ) ) Decrease (increase) in prepaid expenses and other assets ) Increase (decrease) in accounts payable, accrued expenses and other liabilities ) Net cash provided by operating activities CASH FLOWS FROM INVESTING ACTIVITIES: Repayment of note receivable Acquisition of Cheeseburger in Paradise – ) Proceeds from disposal of assets and property held for sale Purchases of property and equipment ) ) ) Net cash used in investing activities ) ) ) CASH FLOWS FROM FINANCING ACTIVITIES: Credit facility borrowings Credit facility repayments ) ) ) Debt issuance costs ) ) ) Tax benefit on share-based compensation Proceeds received on the exercise of employee stock options Net cash provided by (used in) financing activities ) Net increase (decrease) in cash and cash equivalents ) Cash and cash equivalents at beginning of year Cash and cash equivalents at end of year Year Ended August 27, August 28, (364 days) (364 days) (In thousands) Payroll and related costs Payroll and related costs (previous classification) Management training reclassification ) ) Payroll and related costs (as reported) Other operating expenses Other operating expenses (previous classification) Restaurant level marketing expense reclassification ) ) Non-store specific travel and insurance expense reclassification1 ) ) Other operating expenses (as reported) Occupancy costs Occupancy costs (previous classification) Property insurance expense reclassification Centralized Bakery and Facility Service Center occupancy reclassification ) ) Occupancy costs Selling, general and administrative General and administrative costs (previous classification) Restaurant level marketing expense reclassification Management training reclassification Centralized bakery and Facility Service Center occupancy reclassification Non-store specific travel and insurance expense reclassification Culinary services administration costs reclassification ) ) Franchise administration costs reclassification ) ) Selling, general and administrative (as reported) Cost of culinary contract services Cost of culinary contract services (previous classification) Culinary services administration costs reclassification2 Cost of culinary contract services (as reported) Cost of franchise operations Cost of franchise operations (previous reclassification) Franchise administration costs reclassification3 Cost of franchise operations (as reported) Principles of Consolidation net realizable value. During fiscal 2018, management concluded to increase their valuation allowance to reduce fully the Company’s net deferred tax asset balances, net of deferred tax liabilities, including through the fiscal year ended August 29, 2018. Share-based compensation expense is estimated for equity awards at fair value at the grant date. The Company determines fair value of restricted stock awards based on the average of the high and low price of its common stock on the date awarded by the Board of Directors. The Company determines the fair value of stock option awards using a consolidated financial statements. Management's Assessment of Going Concern Cash and cash equivalents Accounts receivable Inventories Other current assets Property and equipment Liquor licenses and permits Favorable leases License agreement and trade name Goodwill Accrued liabilities ) Net acquisition cost Fiscal Year Ended August 31, August 30, August 29, August 28, August 26, (In thousands) Favorable Year Ended August 28, 2013 August 29, 2012 (Unaudited) (Unaudited) (In thousands, except per share data) Pro forma total sales Pro forma income from continuing operations Pro forma net income Pro forma income from continuing operations per share Basic Diluted Pro forma net income per share Basic Diluted The total number of Fisal Year Ended August 26, August 27, August 28, (In thousands) Sales: Company-owned restaurants(1) Culinary contract services Franchise operations Total Segment level profit: Company-owned restaurants Culinary contract services Franchise operations Total Depreciation and amortization: Company-owned restaurants Culinary contract services Franchise operations Corporate Total Total assets: Company-owned restaurants(2) Culinary contract services Franchise operations (3) Corporate(4) Total Capital expenditures: Company-owned restaurants Culinary contract services Franchise operations Corporate Total Income (loss) before income taxes and discontinued operations: Segment level profit Opening costs ) ) ) Depreciation and amortization ) ) ) Selling, general and administrative expenses ) ) ) Provision for asset impairments ) ) ) Net gain on disposition of property and equipment Interest income Interest expense ) ) ) Other income, net Total ) ) Fair Value FiscalYear Ended August 26, 2015 Quoted Significant Significant Total (In thousands) Continuing Operations Property and equipment related to company-owned restaurants ) Discontinued Operations Property and equipment related to corporateassets ) Fair Value FiscalYear Ended August 27, 2014 Quoted Significant Significant Total (In thousands) Continuing Operations Property and equipment related to company-owned restaurants ) ) Discontinued Operations Property and equipment related to corporate assets ) Fair Value FiscalYear Ended August 28, 2013 Quoted Significant Significant Total (In thousands) Continuing Operations Property and equipment related to company-owned restaurants ) Property and equipment related to corporate assets ) ) Discontinued Operations Property and equipment related to corporate assets ) August 26, August 27, (In thousands) Trade and other receivables Franchise royalties and marketing and advertising receivables Trade receivables, unbilled Allowance for doubtful accounts ) ) Total, net Unbilled revenue, was approximately $1.6 million at August 29, 2018 and approximately $1.6 million at August 30, 2017. CCS contracts are billed on a calendar month end basis and represent the total balance of Unbilled revenue. FiscalYear Ended August 26, August 27, August 28, (In thousands) Beginning balance Provisions for doubtful accounts ) Write-offs ) ) ) Ending balance August 26, August 27, (In thousands) Deferred income tax assets: Workers’ compensation, employee injury, and general liability claims Deferred compensation Net operating losses General business and foreign tax credits Depreciation, amortization and impairments Straight-line rent, dining cards, accruals, and other Total deferred income tax assets Deferred income tax liabilities: Property taxes and other Total deferred income tax liabilities Net deferred income tax asset ended August 29, 2018. August 26, August 27, August 28, (In thousands) Current federal and state income tax expense Current foreign income tax expense Deferred income tax expense (benefit) ) ) Total income tax expense (benefit) ) ) FiscalYear Ended August 26, August 27, August 28, Amount % Amount % Amount % (In thousands and as a percent of pretax income from continuing operations) Income tax expense (benefit) from continuing operations at the federal rate ) % ) % % Permanent and other differences: Federal jobs tax credits (wage deductions) ) ) Stock options and restricted stock ) ) Other permanent differences ) ) State income tax, net of federal benefit ) ) General Business Tax Credits ) ) ) ) Other ) ) ) ) Income tax expense (benefit) from continuing operations ) % ) % % 2016, respectively. Balance at August 29, 2012 Decrease based on prior year tax positions ) Interest Expense Balance as of August 28, 2013 Decrease based on prior year tax positions ) Interest Expense Balance as of August 27, 2014 Interest Expense Balance as of August 26, 2015 expense. 29, 2018. August 26, August 27, Estimated (In thousands) Land Restaurant equipment and furnishings Buildings Leasehold and leasehold improvements Lesser of lease term or estimated useful life Office furniture and equipment Construction in progress Less accumulated depreciation and amortization ) ) Property and equipment, net Intangible assets, net Goodwill August 26, 2015 August 27, 2014 (In thousands) (In thousands) Gross Carrying Amount Accumulated Amortization Net Carrying Amount Gross Carrying Amount Accumulated Amortization Net Carrying Amount Intangible Assets Subject to Amortization: Fuddruckers trade name and franchise agreements ) ) Cheeseburger in Paradise trade name and license agreements ) ) Intangible assets, net ) ) the goodwill from the Fuddruckers acquisition in 2010. The Company performs a goodwill impairment test annually as of the end of the second quarter of each year and more frequently when negative conditions or a triggering event arise. August 26, August 27, (In thousands) Salaries, compensated absences, incentives, and bonuses Operating expenses Unredeemed gift cards and certificates Taxes, other than income Accrued claims and insurance Income taxes, legal and other Total August 26, August 27, (In thousands) Workers’ compensation and general liability insurance reserve Capital leases Deferred rent and unfavorable leases Deferred compensation Other Total 30, 2017: The the Company’s personal property, including without limitation the equity interest in each subsidiary of the Company. The Agreement. other indebtedness. FiscalYear Ended August 26, August 27, August 28, (In thousands, except per share data) Provision for asset impairments Net gain on disposition of property and equipment ) ) ) ) ) Effect on EPS: Basic Assuming dilution property locations, ten properties held for sale written down to their fair value, and a reserve for 15 restaurant closings of approximately $1.3 million. fiscal approximately $1.0 million partially offset by routine asset retirements. operations in this plan. August 26, August 27, (In thousands) Prepaid expenses Assets related to discontinued operations—current Property and equipment Other assets Assets related to discontinued operations—non-current Deferred income taxes Accrued expenses and other liabilities Liabilities related to discontinued operations—current Other liabilities Liabilities related to discontinued operations—non-current FiscalYear Ended August 26, August 27, August 28, (In thousands, except locations) Sales Pretax loss ) ) ) Income tax benefit on discontinued operations Loss on discontinued operations ) ) ) Discontinued locations closed during the period FiscalYear Ended August 26, August 27, August 28, (In thousands, except per share data) Discontinued operating losses ) ) ) Impairments ) ) ) Gains (losses) ) Net loss ) ) ) Income tax benefit from discontinued operations Loss from discontinued operations ) ) ) Effect on EPS from discontinued operations—decrease—basic ) ) ) 2016: Balance as of August 29, 2012 Disposals Net impairment charges ) Balance as of August 28, 2013 Disposals ) Net transfers to property held for sale Balance as of August 27, 2014 Disposals ) Net transfers to property held for sale Balance as of August 26, 2015 From time to time, the Company enters into non-cancelable contracts for the construction of its new Year Ending: (In thousands) August 31, 2016 August 30, 2017 August 29, 2018 August 28, 2019 August 26, 2020 Thereafter Total minimum lease payments As of August 29, 2018, aggregate future minimum rentals to be received under non-cancelable subleases was approximately $3.9 million. Year Ended August 26, August 27, August 28, (In thousands, except percentages) Minimum rent-facilities Contingent rentals Minimum rent-equipment Total rent expense (including amounts in discontinued operations) Percent of sales % % % Included in these costs for fiscal 2016 was approximately $252 thousand, which represented accelerated share-based compensation expense as a result of the rescission of 312,663 stock options. 29, 2018. 29, 2018. The fair value of each option award is estimated on the date of the grant using the Black-Scholes option pricing model which determine inputs as shown in the following table for options granted under the Employee Stock Plan: FiscalYear Ended August 26, August 27, August 28, (In thousands, except percentages) Dividend yield % % Volatility % % Risk-free interest rate % % Expected life (in years) Shares Under Options Weighted- Average Price Weighted- Average Term Aggregate Intrinsic (Years) (In thousands) Outstanding at August 29, 2012 Granted Exercised ) Forfeited/Expired ) Outstanding at August 28, 2013 Exercised ) Forfeited/Expired ) Outstanding at August 27, 2014 Granted Exercised ) Forfeited/Expired ) Outstanding at August 26, 2015 Exercisable at August 26, 2015 $82 thousand. Restricted Stock Weighted Weighted- (Per share) (In years) Unvested at August 29, 2012 Granted – Vested ) – Unvested at August 28, 2013 Granted – Vested ) – Forfeited ) – Unvested at August 27, 2014 Granted – Vested ) – Forfeited – – Unvested at August 26, 2015 The Company has a voluntary 401(k) employee savings plan to provide substantially all employees of the Company an opportunity to accumulate personal funds for their retirement. The Company matches 25% of participants’ contributions made to the plan up to 6% of their salary. The net expense recognized in connection with the employer match feature of the voluntary 401(k) employee savings plan for the years ended August This facility matured and was refunded on November 8, 2016, through the entering of the 2016 Credit Agreement, and there were no amounts outstanding under the 2013 Credit Facility at August 30, 2017. FiscalYear Ended August 26, August 27, August 28, (In thousands, except per share data) Numerator: Income (loss) from continuing operations ) ) Net income (loss) ) ) Denominator: Denominator for basic earnings per share—weighted-average shares Effect of potentially dilutive securities: Employee and non-employee stock options Denominator for earnings per share assuming dilution Income (loss) from continuing operations: Basic ) ) Assuming dilution(a) ) ) Net income (loss) per share: Basic ) ) Assuming dilution(a) ) ) Quarter Ended(a) August 26, May6, February 11, November19, (112 days) (84 days) (84 days) (84 days) (In thousands, except per share data) Restaurant sales Franchise revenue Culinary contract services Vending revenue Total sales Income (loss) from continuing operations ) ) Loss from discontinued operations ) ) ) ) Net income (loss) ) ) ) Net income (loss) per share: Basic ) ) Assuming dilution ) ) Costs and Expenses (As a percentage of restaurant sales) Cost of food % % % % Payroll and related costs % % % % Other operating expenses % % % % Occupancy costs % % % % Quarter Ended(a) August 27, May 7, February 12, November 20, (112 days) (84 days) (84 days) (84 days) (In thousands, except per share data) Restaurant sales Franchise revenue Culinary contract services Vending revenue Total sales Income (loss) from continuing operations ) ) ) Loss from discontinued operations ) ) ) ) Net income (loss) ) ) ) Net income (loss) per share: Basic ) ) ) Assuming dilution ) ) ) Costs and Expenses (As a percentage of restaurant sales) Cost of food % % % % Payroll and related costs % % % % Other operating expenses % % % % Occupancy costs % % % % 29, 2018. Financial Statements Financial Statement Schedules Exhibits 3(b) 3(c) 14(b) 21 23.1 31.1 31.2 32.1 32.2 99(a) 101.SCH XBRL Schema Document 101.CAL XBRL Calculation Linkbase Document 101.DEF XBRL Definition Linkbase Document 101.LAB XBRL Label Linkbase Document 101.PRE XBRL Presentation Linkbase Document Pursuant to the requirements of Section 13 or 15(d) of the Securities Exchange Act of 1934, the registrant has duly caused this report to be signed on its behalf by the undersigned, thereunto duly authorized. LUBY’S, INC. Christopher J. Pappas President and Chief Executive Officer /S/ GASPER MIR, III November Gasper Mir, III, Director and Chairman of the Board /S/ CHRISTOPHER J. PAPPAS November /S/ K. SCOTT GRAY November Other brands weWe also operate includeanother brand named Cheeseburger in Paradise and Bob Luby’s Seafood.Paradise.LFRLuby's Fuddruckers Restaurants, LLC, a Texas Limited Liability Company ("LFR") and the consolidated subsidiaries of Luby’s, Inc. References to “Luby’s Cafeteria” refer specifically to the Luby’s Cafeteria brand restaurant.are extremelystay loyal to our restaurant brands and value them as a significant part of their lives. We want our company’s performance to make it a leader wherever it operates and in its sector of our industry.3, 2015,7, 2018, we operated 179142 restaurants located throughout the United States, as set forth in the table below. These establishments are located in close proximity to retail centers, business developments and residential areas. Of the 179142 restaurants, 9377 are located on property that we own and 8665 are located on property that we lease. Six locations consist of a side-by-side Luby’s Cafeteria and Fuddruckers restaurant, to which we refer herein to as a “Combo location”. Total Total Texas:47 Houston Metro5416 1712 1312 149 Other Texas Markets 16 California 10 Other Texas Markets20California10Maryland65Illinois4 Virginia4GeorgiaIllinois 3 Indiana3 Mississippi 2 Mississippi8 2Wisconsin142 2Other States13Total1793, 2015,7, 2018, we operated 2530 locations through our Culinary Contract Services (“CCS”). Of the 25 locations, 18 are in Texas: 15 in Houston, 2 in Austin and 1 in Dallas. For the remaining 7 CCS locations, we operate 2 in Louisiana and 1 each in Florida, Massachusetts, Missouri, North Carolina and Oklahoma. CCS provides food service management to healthcare, educational and corporate dining facilities.Total Texas: Houston Metro 22 San Antonio Metro 2 Rio Grande Valley 3 Dallas/Fort Worth Metro 2 Greensboro, NC 1 Total 30 3, 2015,7, 2018, we had 5141 franchisees operating 107104 Fuddruckers restaurants in locations as set forth in the table below. Our largest fivesix franchisees own five to eleven12 restaurants each. ThirteenFourteen franchise owners each own two to four restaurants. The thirty-threetwenty-one remaining franchise owners each own one restaurant. FuddruckersFranchises Texas:8 Other Texas Markets 10 California 7 Connecticut 1 Delaware 1 Florida 10 Georgia 3 Iowa 1 Louisiana 3 Maryland 1 Massachusetts 4 Michigan 4 Missouri 3 Montana 4 Nebraska 1 Nevada 3 New Jersey 2 New Mexico 4 North Carolina 1 North Dakota 1 Oklahoma 1 Oregon 1 Pennsylvania 5 South Carolina 8 South Dakota 1 Tennessee 2 Virginia 3 International: Dallas/Fort Worth Metro2 10Other Texas Markets2 10California8Florida7GeorgiaMexico 3 LouisianaPanama 3 Maryland2Massachusetts4Michigan4Missouri3Montana4NebraskaPuerto Rico 1 Nevada104 2New Jersey2New Mexico4North Carolina2North Dakota2Oregon1Pennsylvania4South Carolina7South Dakota2Tennessee3Virginia2Wisconsin2Other States4International:Canada1Chile1Colombia1Dominican Republic1Italy3Mexico1Panama1Poland1Puerto Rico1Total1073, 2015,7, 2018, this licensee operates 3533 restaurants that are licensed to use the Fuddruckers Proprietary Marksproprietary marks in Saudi Arabia, Egypt, Lebanon, United Arab Emirates, Qatar, Jordan, Bahrain, Kuwait, Morocco and Malaysia.Kuwait. The Company does not receive revenue or royalties from these restaurants.New York Stock ExchangeNYSE in 1982.Luby’s Fuddruckers Restaurants, LLC, a Texas limited liability company (“LFR”).LFR. All restaurant operations are conducted by LFR.(“Koo Koo Roo”) locations with franchisees operating an additional 130 Fuddruckers locations.to orderin small batches from scratch using real food, real ingredients prepared fresh daily, and our employees and our company get involved and support the fabric of our local communities. We buy local produce as much as possible. We promise to breathe life into the experience of dining out and make every meal meaningful. We were founded in San Antonio, Texas in 1947.Americana-themed home-style classic made-from-scratch favorites priced to appeal to a broad range of customers, including those customers that focus on fast wholesome choices, quality, variety, and affordability. We have had particular success among families with children, shoppers, travelers, seniors, and business people looking for a quick, freshly prepared meal at a fair price. All of our restaurants sell food-to-go orders.of oneled by a general manager, onean associate manager and one to two assistant managers including wait staff.managers. We grant authority to our restaurant managers to direct the daily operations of their stores and, in turn, we compensate them on the basis of their performance. We believe this strategy is a significant factor contributing to the profitability of our restaurants. Each general manager is supervised by an area leader. Each area leader is responsible for approximately 7 to 10 units, depending on location.restaurants, which includes one Bob Luby’s Seafood restaurant,Cafeterias was 9484 at fiscal year-end 2015.New Luby’s RestaurantsIn 2007, we developed and opened an updated prototype ground-up new construction Luby's Cafeteria. Since then we have rebuilt three locations and newly developed four locations according to this prototype.In 2012, we opened a prototype ground-up new construction combination Luby’s and Fuddruckers restaurant location featuring a Luby’s Cafeteria and a Fuddruckers Restaurant on the same property with a common wall but separate kitchens and dining areas (“Combo location”). Since 2012, we have built five more Combo locations; four in fiscal year 2014 and one in fiscal year 2015.
FuddruckersWe anticipate using and further modifying both of these prototype designs as we execute our strategy to build new restaurants in markets where we believe we can achieve superior restaurant cash flows.Fuddruckersburgerburgers and fries accountsaccount for the majority of its restaurant sales, its menu also includes exotic burgers, such as buffalo and elk, steak sandwiches, various grilled and breaded chicken breast sandwiches, hot dogs, a variety of salads, chicken tenders, fish sandwiches, hand breaded onion rings, soft drinks, handmade milkshakes, and bakery items. BeerA variety of over 100 carbonated soft drinks including our own unique Sweet Cherry Cream Soda, which is exclusively offered at Fuddruckers restaurants, along with other varieties such as Powerade®, and flavored waters are offered through Coke Freestyle® self-service dispensers. Additionally, beer and wine are served and, generally, account for less than 2% of restaurant sales.a total staff of one general manager with two or three assistant managers and 25 to 45 other associates, includinga number of full-time and part-time associates working in overlapping shifts. Since Fuddruckers generally utilizes a self-service concept, similar to fast casual, it typically does not employ waiters or waitresses. Fuddruckers restaurant operations are currently divided into a total of ten geographic areas, each supervised by an area leader. On average, each area leader supervises five to nine restaurants.year 2015,2018, we opened nine newclosed 11 Company-owned Fuddruckers restaurants. The number of Fuddruckers restaurants was 60 at fiscal year-end 2015, was 75.In 2014,2018.openedoperated two of the original Cheeseburger in Paradise locations.prototype ground-up new construction Fuddruckers Restaurant in Houston, Texas.106105 at fiscal year-end 20152018 and 110113 at fiscal year-end 2014.Cheeseburger in ParadiseAt fiscal year-end 2015, we operated eight of the original Cheeseburger in Paradise locations, completed six conversions to Fuddruckers restaurants, have selected four additional locations expected to be converted into Fuddruckers, two locations sub-leased to franchisees and another three locations which we expect to dispose. Cheeseburger in Paradise is known for its inviting beach-party atmosphere, its big, juicy burgers, salads, coastal fare and other tasty and unique items. Cheeseburger in Paradise is a full-service island-themed restaurant and bar developed ten years ago in collaboration with legendary entertainer Jimmy Buffet based on one of his most popular songs. The restaurants also feature a unique tropical-themed island bar with many televisions and tasty “boat drinks.”24 to the consolidated financial statements included in Part II, Item 8 of this Form 10-K.1. Consistently successful execution: Every day, with every guest, at every restaurant we operate. 2. Growing our human capital: Our team members are the most critical factor in ensuring our Company’s success. Our relentless focus as a company must be inspiring and developing our team members to delight our guests. 3. Raising awareness of our brand: Our restaurants provide guests in our local communities with memories of family, friends, childhood, a great date, a memorable birthday, or a significant accomplishment. The most reliable ways to grow and sustain our business is to perpetuate word of mouth and remain involved in the community. We must share our story with our guests in our restaurants. This allows new guests to learn our brand story and also reaffirms it with legacy and loyal guests. Loyal guests spread and preach the word about our brand. Our most loyal guests typically agree to be in our E-club so we can communicate with them and reward them. 4. Improving restaurant appearances: We recognize the importance of remodeling our legacy restaurants to remain relevant and appealing to keep loyal guests coming back and draw in new guests. 5. Effective cost management: We evaluate each area of our business to assess that we are spending and investing at appropriate levels. This includes restaurant operating costs and corporate overhead costs. Within our restaurants, we seek opportunities with our food and supplies purchasing, menu offerings, labor productivity, and contracts with restaurant service providers to maintain an appropriate restaurant level cost structure. Within our corporate overhead, we seek opportunities to leverage technology and efficient work processes to maintain a stream-lined corporate overhead. Intellectual PropertyCulinary Contract ServicesOur Culinary Contract Services segment consists of a business line servicing healthcare, higher education and corporate dining clients. The healthcare accounts are full service and typically include in-room delivery, catering, vending, coffee service and retail dining. Our mission is to re-define the contract food industry by providing tasty and healthy menus with customized solutions for healthcare, senior living, business and industry and higher education facilities. We seek to provide the quality of a restaurant dining experience in an institutional setting. 3, 2015, we had contracts with 16 long-term acute care hospitals, three acute care hospitals, one behavioral hospital, one children’s hospital, two business and industry clients, one medical office building and one freestanding coffee venue located inside an office building. We have the unique ability to deliver quality services that include facility design and procurement as well as nutrition and branded food services to our clients. We anticipate allocating capital expenditures as needed to further develop our CCS business in fiscal year 2016.EmployeesAs of November 3, 2015,7, 2018, we had an active workforce of 8,3526,589 employees consisting of restaurant management employees, non-management restaurantsrestaurant employees, CCS management employees, CCS non-management employees, and office and facility service employees. Employee relations are considered to be good. We have never had a strike or work stoppage, and we are not subject to collective bargaining agreements.General economicOur ability to service our debt obligations is primarily dependent upon our future financial performance.As of August 26, 2015, we had shareholders’ equity of approximately $175 million compared to approximately:●$37.5 million of long-term debt;●$63.4 million of minimum operating and capital lease commitments; and●$1.1 million of standby letters of credit.Our ability to meet our debt service obligations depends on our ability to generate positive cash flows from operations and proceeds for assets held for sale.If we are unable to service our debt obligations, we may have to:●delay spending on maintenance projects and other capital projects, including new restaurant development;●sell assets;●restructure or refinance our debt; or●sell equity securities.Our debt, and the covenants contained in the instruments governing our debt, could:●result in a reduction of our credit rating, which would make it more difficult for us to obtain additional financing on acceptable terms;●require us to dedicate a substantial portion of our cash flows from operating activities to the repayment of our debt and the interest associated with our debt;●limit our operating flexibility due to financial and other restrictive covenants, including restrictions on incurring additional debt and creating liens on our properties;●place us at a competitive disadvantage compared with our competitors that have relatively less debt;●expose us to interest rate risk because certain of our borrowings are at variable rates of interest; and●make us more vulnerable to downturns in our business.If we are unable to service our debt obligations, we may not be able to sell equity securities, sell additional assets or restructure or refinance our debt. Our ability to generate sufficient cash flow from operating activities to pay the principal of and interest on our indebtedness is subject to market conditions and other factors which are beyond our control.Healthcoverage is provided through fully-insured contracts with insurance carriers. Insurance premiumspremiums. Self-insurance costs are a shared cost betweenaccrued based upon the Company and covered employees. Theaggregate of the expected liability for covered healthreported claims is borneand the estimated liability for claims incurred but not reported, based on information on historical claims experience provided by our third party insurance advisors, adjusted as necessary based upon management’s reasoned judgment. Actual employee medical claims expense may differ from estimated loss provisions based on historical experience. In the insurance carriers per the terms of each policy contract.Compensationcompensation coverage is provided through “self-insurance” by Luby’s Fuddruckers Restaurants, LLC.LFR. We record expenses under the plan based on estimates of the costs of expected claims, administrative costs, stop-loss insurance premiums, and expected trends. These estimates are then adjusted each year to reflect actual costs incurred. Actual costs under these plans are subject to variability that is dependent upon demographics and the actual costs of claims made. In the event our cost estimates differ from actual costs, we could incur additional unplanned costs, which could adversely impact our financial condition.( the(the "Affordable Care Act") and Healthcare Education and Affordability Reconciliation Act was passed and signed into law. Among other things, the healthcare reform legislation includes mandated coverage requirements, eliminates pre-existing condition exclusions and annual and lifetime maximum limits, restricts the extent to which policies can be rescinded, and imposes new and significant taxes on health insurers and healthcare benefits. Although requirements were phased in over a period of time, the most impactful provisions began in the third quarter of fiscal 2015.and Fuddruckers brandsbrand offer a large variety of entrées, side dishes and desserts and our continued success depends, in part, on the popularity of our cuisine and cafeteria-style dining. A change away from this cuisine or dining style could have a material adverse effect on our results of operations. Our Fuddruckers brand offers grilled-to-order burgers that feature always fresh and never frozen, 100% premium-cut beef with no fillers or additives and sesame-topped buns baked from scratch on-site throughout the day. While burgers are the signature, the engaging menu offers variety for many tastes with an array of sandwiches, and salads. Changing customer preferences, tastes and dietary habits can adversely affect our business and financial performance. We compete on quality, variety, value, service, concept, price, and location with well-established national and regional chains, as well as with locally owned and operated restaurants. We face significant competition from family-style restaurants, fast-casual restaurants, and buffets as well as fast food restaurants. In addition, we also face growing competition as a result of the trend toward convergence in grocery, delicatessen, and restaurant services, particularly in the supermarket industry, which offers “convenient meals” in the form of improved entrées and side dishes from the delicatessen section. Many of our competitors have significantly greater financial resources than we do. We also compete with other restaurants and retail establishments for restaurant sites and personnel. We anticipate that intense competition will continue. If we are unable to compete effectively, our business, financial condition, and results of operations may be adversely affected.Non-performance under the debt covenants in our revolving credit facility could adversely affect our ability to respond to changes in our business.As of August 26, 2015, we had outstanding long-term debt of $37.5 million. Our debt covenants require certain minimum levels of financial performance as well as certain financial ratios, which can limit our credit availability. To provide for our reduced credit requirements going forward, we amended our credit agreement on October 2, 2015, to, among other things, reduce the facility size to $60.0 million. For a more detailed discussion of our credit facility please review the footnotes to our financial statements located in Part II, Item 8 of this Form 10-K. Our failure to comply with these covenants could result in an event of default that, if not cured or waived, could result in the acceleration of our loans outstanding and affect our ability to refinance by the termination date of September 1, 2017.We may not be able to realize our deferred tax assets.Our ability to realize our deferred tax assets is dependent on our ability to generate taxable income in the future. If we are unable to generate enough taxable income in the future, we may be required to establish a valuation allowance related to our net deferred tax assets which would reduce expected earnings for the periods in which they are recorded.2015,fiscal 2018, approximately 70%73% of our restaurant sales were attributable to credit and debit card transactions, and credit and debit card usage could continue to increase. A number of retailers have experienced actual or potential security breaches in which credit and debit card information may have been stolen, including a number of highly publicized incidents with well-known retailers in recent years.We might not fully realize the benefits from the acquisition of Cheeseburger in Paradise.On December 6, 2012, we completed the acquisition of all the Membership Units of Paradise Restaurants Group, LLC and certain of their affiliates, collectively known as Cheeseburger in Paradise. The integration of the Cheeseburger in Paradise restaurants into our operations has presented significant difficulties and has not resulted in realization of the full benefits of synergies, cost savings and operational efficiencies that we expected. We closed 15 locations in fiscal 2014. Additionally, we converted three locations in each fiscal year, 2014 and 2015, to Fuddruckers restaurants and plan to convert four more locations into Fuddruckers restaurants.Several factors could result in not realizing the benefits from the acquisition of Cheeseburger in Paradise: (1) the remaining eight Cheeseburger in Paradise locations that we continue to operate do not achieve sufficient cash flows; (2) the locations that we select to convert from Cheeseburger in Paradise restaurants to Fuddruckers restaurants do not realize cash flows sufficient to justify the additional investment of capital necessary to renovate the restaurants and if the cash flows operating as Fuddruckers restaurants do not achieve cash flows commensurate with other company-operated Fuddruckers restaurants; and (3) locations that we select for disposal result in “carrying costs” (generally lease, property, tax, and maintenance expenses) for a significant period of time prior to disposal, or we are not able to dispose the locations on favorable terms.Peter Tropoli,Benjamin T. Coutee, our Chief Operating Officer. The loss of the services of any key management personnel could have a material adverse effect upon our business.Our existing revolvingfacilityagreement. The 2016 Credit Agreement, as amended, matures in September 2017 and weMay 1, 2019. We may not be able to amend or renew the new facility with terms and conditions consistent with the existing facility.3, 2015,7, 2018, we operated 179142 restaurants at 173136 property locations. Six of the operating locations are Combo locations and are considered two restaurants. Two operating locations are primarily Luby’s Cafeterias, but also serve Fuddruckers hamburgers. One operating location is a Bob Luby’s Seafood Grill. Luby’s Cafeterias have seating capacity for 250 to 300 customers at each location while Fuddruckers locations generally seat 125 to 200 customers and Cheeseburger in Paradise locations generally seat 180 to 220.7059 of our Luby’s Cafeteria and 2318 of our Fuddruckers restaurants are located. FiveTwo of these restaurant properties contain excess building space or an extra building on the property which have 127 tenants unaffiliated with Luby’s, Inc.2423 Luby’s Cafeteria restaurants, 5441 Fuddruckers restaurants, and 81 Cheeseburger in Paradise restaurants are held under 8564 leases. One of the 64 leases includes two restaurants at one Combo location: one Luby's Cafeteria and one Fuddruckers restaurant. The majority of the leases are fixed-dollar rentals, which require us to pay additional amounts related to property taxes, hazard insurance, and maintenance of common areas. Of the 8564 restaurant leases, the current terms of 26thirteen expire in less than one year, 35 expire between 2015one and 2017,five years, and 5916 expire thereafter. Additionally, 6847 leases can be extended beyond their current terms at our option. One of the leased properties has extra building space and currently has one tenant that offsets approximately $99,895 of lease and other expenses annually.3, 2015, we have 3 leased properties we plan to develop for future use.As of November 3, 2015,7, 2018, we had threefour owned non-operating properties with a carrying value of approximately $3.1$3.9 million and 11 operating properties with a carrying value of approximately $15.6 million related to continuing operations recorded in property held for sale. In addition, we havehad one owned and two leased propertiesproperty with a carrying value of approximately $1.9$1.8 million that are included in assets related to discontinued operations. Leased properties in discontinued operations have a carrying value of zero.twoone owned other-use properties; oneproperty which is used as a bake shop that supports the baked products forcentral bakery supporting our operating restaurants. The other owned property is leased to a Fuddruckers franchisee.threefour leased locations that have twothree third party tenants and twothree Fuddruckers franchisees.In addition to the two owned other-use properties, we have31,00026,000 square feet of corporate office space under leaseruns through 2016. The space is located on the Northwest Freeway in Houston, Texas in close proximity to many of our Houston restaurant locations.3,200630 square feet of warehouse and office space in Arlington, Texas.We also leaseFarmers Branch, Texas and an executive suite in North Andover, MA forwhere we have additional legal personnel.Not applicable. 8.23 6.49 9.15 6.00 6.91 4.93 6.01 4.83 5.58 4.75 5.33 4.37 5.93 4.78 5.30 4.52 Fiscal Quarter Ended High Low December 21, 2016 4.50 4.03 March 15, 2017 4.33 3.30 June 7, 2017 3.41 2.46 August 30, 2017 3.12 2.63 December 20, 2017 2.87 2.36 March 14, 2018 3.20 2.60 June 6, 2018 3.06 2.35 August 29, 2018 2.89 2.00 3, 2015,7, 2018, there were 2,2011,975 holders of record of our common stock. No cash dividends have been paid on our common stock since fiscal year 2000, and we currently have no intention to pay a cash dividend on our common stock. On November 3, 2015,7, 2018, the closing price of our common stock on the NYSE was $4.91.26, 2015,29, 2018, were as follows:
Warrants and
Exercise Price of
Outstanding
Warrants and
Remaining 594,549 $ 4.94 789,952 29,627 0 0 624,176 $ 4.71 789,952 (a) (b) (c) Plan Category Equity compensation plans previously approved by security holders 1,066,103 $ 4.53 1,612,652 17,801 0 0 Total 1,083,904 $ 4.47 1,612,652 Non-employeeNonemployee Director Phantom Stock Plan.14,16, “Share-Based Compensation,” to our Consolidated Financial Statements included in Item 8 of Part II of this report.26, 2015,29, 2018, with the cumulative total return on the S&P SmallCap 600 Index and an industry peer group index. The old peer group index consists of Bob Evans Farms, Inc., CBRL Group, Inc., Darden Restaurants, Inc., Denny’s Corporation, FrischDiversified Restaurant Group,Holdings, Inc., and Red Robin Gourmet Burgers and Ruby Tuesday Inc. The new peer group index consists of Bob Evans Farms, Inc., CBRL Group, Inc., Denny’s Corporation, Frisch Restaurant Group, Red Robin Gourmet Burgers, Ruby Tuesday Inc. as well as Darden Restaurants, Inc.Burgers. These companies are multi-unit family and casual dining restaurant operators in the mid-price range.25, 2010,29, 2013, and the reinvestment of all dividends. The returns of each company in the peer group index have been weighed according to that company’s stock market capitalization.
100.00 92.87 128.79 147.97 110.62 95.11 100.00 118.50 140.20 166.15 207.51 205.46 100.00 134.54 146.65 175.32 191.32 223.83 100.00 119.15 139.86 155.90 160.34 229.81 100.00 118.69 139.65 155.74 159.45 227.34 100.00 115.38 145.42 207.55 204.13 280.64 100.00 114.28 144.55 204.65 199.66 271.60 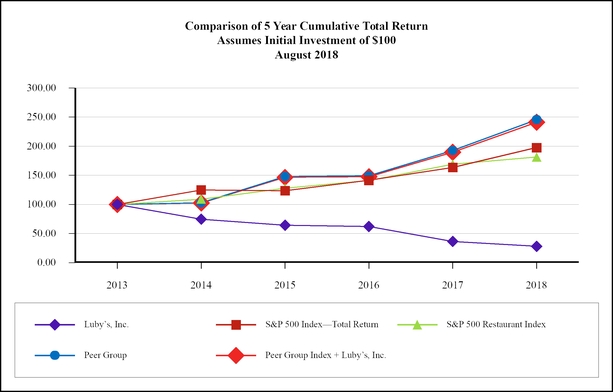
2013 2014 2015 2016 2017 2018 Luby’s, Inc. 100.00 74.76 64.28 62.07 36.41 28.14 S&P 500 Index—Total Return 100.00 124.89 123.66 141.50 163.53 197.61 S&P 500 Restaurant Index 100.00 109.12 127.67 141.05 169.16 181.31 Peer Group Index Only 100.00 102.87 148.01 149.08 192.47 245.57 Peer Group Index + Luby’s, Inc. 100.00 102.39 146.51 147.52 189.49 241.33 Five-Year Summary of Operations
2015
2014
2013
2012
2011 $ 370,192 $ 368,267 $ 360,001 $ 324,536 $ 325,383 16,401 18,555 16,693 17,711 15,619 6,961 7,027 6,937 7,232 7,092 531 532 565 618 654 394,085 394,381 384,196 350,097 348,748 (1,372 (1,613 4,547 7,398 2,572 (702 (1,834 (1,386 (645 301 $ (2,074 $ (3,447 $ 3,161 $ 6,753 $ 2,873 $ (0.05 $ (0.06 $ 0.16 $ 0.26 $ 0.09 $ (0.05 $ (0.06 $ 0.16 $ 0.26 $ 0.09 $ (0.02 $ (0.06 $ (0.05 $ (0.02 $ 0.01 $ (0.02 $ (0.06 $ (0.05 $ (0.02 $ 0.01 $ (0.07 $ (0.12 $ 0.11 $ 0.24 $ 0.10 $ (0.07 $ (0.12 $ 0.11 $ 0.24 $ 0.10 28,974 28,812 28,618 28,351 28,237 28,974 28,812 28,866 28,429 28,297 $ 264,258 $ 275,435 $ 250,645 $ 230,889 $ 228,102 $ 37,500 $ 42,000 $ 19,200 $ 13,000 $ 21,500 177 174 180 154 156 106 110 116 125 122 23 25 21 18 22 28.9 28.9 28.6 27.9 28.9 34.5 34.2 34.1 34.3 35.2 17.0 16.8 16.4 15.4 16.1 5.7 5.9 6.0 5.9 5.9 (a)For comparison purposes, fiscal 2013 and 2012 results have been adjusted to reflect the reclassification of certain Cheeseburger in Paradise leasehold locations to discontinued operations. See Note 11 to our consolidated financial statements in Part II, Item 8 in this Form 10-K for further discussion of discontinued operations. Fiscal Year Ended August 29, 2018 August 30, 2017 August 31, 2016 August 26, 2015 August 27, 2014 (364 days) (364 days) (371 days) (364 days) (364 days) (In thousands, except per share data) Sales Restaurant sales $ 332,518 $ 350,818 $ 378,111 $ 370,192 $ 369,808 Culinary contract services 25,782 17,943 16,695 16,401 18,555 Franchise revenue 6,365 6,723 7,250 6,961 7,027 Vending revenue 531 547 583 531 532 Total sales 365,196 376,031 402,639 394,085 395,922 Provision for asset impairments and restaurant closings 8,917 10,567 1,442 636 2,717 Loss from continuing operations (32,954 ) (22,796 ) (10,256 ) (1,616 ) (2,011 ) Loss from discontinued operations (614 ) (466 ) (90 ) (458 ) (1,436 ) Net Loss $ (33,568 ) $ (23,262 ) $ (10,346 ) $ (2,074 ) $ (3,447 ) Loss per share from continuing operations: Basic $ (1.10 ) $ (0.77 ) $ (0.35 ) $ (0.05 ) $ (0.06 ) Assuming dilution $ (1.10 ) $ (0.77 ) $ (0.35 ) $ (0.05 ) $ (0.06 ) Loss per share from discontinued operation: Basic $ (0.02 ) $ (0.02 ) $ (0.00 ) $ (0.02 ) $ (0.06 ) Assuming dilution $ (0.02 ) $ (0.02 ) $ (0.00 ) $ (0.02 ) $ (0.06 ) Loss per share: Basic $ (1.12 ) $ (0.79 ) $ (0.35 ) $ (0.07 ) $ (0.12 ) Assuming dilution $ (1.12 ) $ (0.79 ) $ (0.35 ) $ (0.07 ) $ (0.12 ) Weighted-average shares outstanding: Basic 29,901 29,476 29,226 28,974 28,812 Assuming dilution 29,901 29,476 29,226 28,974 28,812 Total assets $ 199,989 $ 226,457 $ 252,225 $ 264,258 $ 275,435 Total debt $ 39,506 $ 30,985 $ 37,000 $ 37,500 $ 42,000 Number of restaurants at fiscal year end 146 167 175 177 174 Number of franchised restaurants at fiscal year end 105 113 113 106 110 Number of Culinary Contract Services contracts at fiscal year end 28 25 24 23 25 Costs and Expenses (As a percentage of restaurant sales) Cost of food 28.3 % 28.1 % 28.3 % 28.9 % 28.9 % Payroll and related costs 37.4 % 35.9 % 35.2 % 34.5 % 34.3 % Other operating expenses 18.7 % 17.7 % 16.1 % 17.1 % 16.8 % Occupancy costs 6.1 % 6.2 % 5.9 % 5.7 % 6.0 % 26, 201529, 2018 (“fiscal 2015”2018”), August 27, 2014,30, 2017, (“fiscal 2014”2017”), and August 28, 201331, 2016 (“fiscal 2013”2016”) included in Part II, Item 8 of this Form 10-K.tablepage sets forth selected operating data as a percentage of total revenues (unless otherwise noted) for the periods indicated. All information is derived from the accompanying Consolidated Statements of Operations. Percentages may not add due to rounding.
2015
2014
2013 93.9 93.4 93.7 4.2 4.7 4.3 1.8 1.8 1.8 0.1 0.1 0.1 100 100 100 28.9 28.9 28.6 34.5 34.2 34.1 17.0 16.8 16.4 5.7 5.9 6.0 (0.1 (0.1 (0.2 14.0 14.4 15.0 0.7 0.5 0.2 5.4 5.1 4.8 9.8 10.3 9.4 0.2 0.6 0.2 (1.0 (0.6 (0.4 90.1 90.8 93.5 9.9 9.2 6.5 24.0 24.7 23.5 76.0 75.3 76.5 (0.1 (0.8 1.6 0.0 0.0 0.0 (0.6 (0.3 (0.2 0.1 0.3 0.3 (0.6 (0.8 1.6 (0.3 (0.4 0.5 (0.3 (0.4 1.2 (0.2 (0.5 (0.4 (0.5 (0.9 0.8 August 29,
2018 August 30,
2017 August 31,
2016 (52 weeks) (52 weeks) (53 weeks) Restaurant sales 91.1 % 93.3 % 93.9 % Culinary contract services 7.1 % 4.8 % 4.1 % Franchise revenue 1.7 % 1.8 % 1.8 % Vending revenue 0.1 % 0.1 % 0.1 % TOTAL SALES 100.0 % 100.0 % 100.0 % STORE COSTS AND EXPENSES: (As a percentage of restaurant sales) Cost of food 28.3 % 28.1 % 28.3 % Payroll and related costs 37.4 % 35.9 % 35.2 % Other operating expenses 18.7 % 17.7 % 16.1 % Occupancy costs 6.1 % 6.2 % 5.9 % Vending revenue (0.2 )% (0.2 )% (0.2 )% Store level profit 9.5 % 12.2 % 14.7 % Opening costs 0.2 % 0.1 % 0.2 % Depreciation and amortization 4.8 % 5.4 % 5.4 % Selling, general and administrative expenses 10.6 % 10.1 % 10.5 % Provision for asset impairments and restaurant closings 2.7 % 3.0 % 0.4 % Net Gain on disposition of property and equipment (1.6 )% (0.5 )% (0.2 )% Cost of culinary contract services 93.7 % 87.9 % 89.6 % Culinary income 6.3 % 12.1 % 10.4 % Cost of franchise operations 24.0 % 25.8 % 25.9 % Franchise income 76.0 % 74.2 % 74.1 % (As a percentage of total sales) LOSS FROM OPERATIONS (6.1 )% (4.6 )% (0.8 )% Interest income 0.0 % 0.0 % 0.0 % Interest expense (0.9 )% (0.6 )% (0.6 )% Other income (expense), net 0.1 % (0.1 )% 0.0 % Loss before income taxes and discontinued operations (6.9 )% (5.3 )% (1.4 )% Provision for income taxes 2.1 % 0.6 % 1.2 % Loss from continuing operations (9.0 )% (5.9 )% (2.6 )% Loss from discontinued operations, net of income taxes (0.2 )% (0.1 )% 0.0 % NET LOSS (9.2 )% (6.0 )% (2.6 )% incomeloss from continuing operations, a GAAP measure:
2015
2014
2013 (In thousands) $ 51,909 $ 52,918 $ 53,984 16,401 18,555 16,693 6,961 7,027 6,937 2,686 2,164 783 14,786 16,847 15,604 1,668 1,733 1,629 21,367 20,062 18,376 38,758 40,686 36,123 636 2,498 615 (3,994 (2,357 (1,723 (4 (6 (9 2,336 1,247 920 (520 (1,101 (1,026 (1,076 (1,660 1,775 $ (1,372 $ (1,613 $ 4,547 August 29, 2018 August 30, 2017 August 31, 2016 (52 weeks) (52 weeks) (53 weeks) (In thousands) Store level profit $ 31,648 $ 42,943 $ 55,419 Plus: Sales from culinary contract services 25,782 17,943 16,695 Sales from franchise operations 6,365 6,723 7,250 Less: Opening costs 554 492 787 Cost of culinary contract services 24,161 15,774 14,955 Cost of franchise operations 1,528 1,733 1,877 Depreciation and amortization 17,453 20,438 21,889 38,725 37,878 42,422 Provision for asset impairments and restaurant closings 8,917 10,567 1,442 Net Gain on disposition of property and equipment (5,357 ) (1,804 ) (684 ) Interest income (12 ) (8 ) (4 ) Interest expense 3,348 2,443 2,247 Other income (expense), net (298 ) 454 (186 ) Provision for income taxes 7,730 2,438 4,875 Loss from continuing operations $ (32,954 ) $ (22,796 ) $ (10,256 ) 26, 201529, 2018 and August 27, 2014. 94 1 (2 93 71 9 (5 75 8 — — 8 1 — — 1 174 10 (7 177 Fiscal 2018 Year Begin Fiscal 2018 Openings Fiscal 2018 Closings Fiscal 2018 Year End 88 — (4 ) 84 71 — (11 ) 60 Cheeseburger in Paradise 8 — (6 ) 2 Total 167 — (21 ) 146 (1)Includes 6 restaurants that are part of Combo locations(2)Other restaurants include one Bob Luby’s SeafoodOverview9484 Luby’s branded restaurants located mostly in Texas, 7560 Fuddruckers restaurants located throughout the United States, 82 Cheeseburger in Paradise restaurants primarily located in the eastern United States,New Jersey and 106Nebraska, and 105 Fuddruckers franchises located primarily in the United States. On July 26, 2010, we became a multi-brand restaurant company with a national footprint through the acquisition of substantially all of the assets of Fuddruckers. The Fuddruckers acquisition added 59 Company-operated restaurants and a franchise network of 130 franchisee-operated units. This acquisition further expanded our family-friendly, value-oriented portfolio of restaurants located in close proximity to retail centers, business developments and residential areas. On December 6, 2012, we further expanded our brand family with the addition of the Cheeseburger in Paradise brand. This added full service restaurant and bar locations that complemented our core family-friendly brands and provided an entry point to operate at, or acquire a valuable leasehold interest in, 23 new locations at a cost of less than $0.5 million per location. In addition to our restaurant business model, we also provide culinary contract services for organizations that offer on-site food service, such as healthcare facilities, colleges and universities, sports stadiums, businesses and institutions, as well as businesses and institutions.2015,2018, we continued our focus on enhancing the guest experience at each of our restaurant brands, executing our growth plan for our Culinary Contract Services segment, and supporting our Fuddruckers franchise network for future growth. In the latter part of the fiscal year, in light of continued sales weakness at our Fuddruckers brand and further profitability declines at each restaurant brand, it became necessary to address short-term liquidity. Management's short-term action plan included accelerating the closure of underperforming restaurant locations, selling owned property at certain locations, and taking other steps in order to re-finance our debt load and provide financial liquidity. All steps taken in accordance with the short-term action plan are with the aim of re-establishing a solid foundation with a portfolio of restaurants and business segments that can successfully restore future profitability.strategic focus centered around constructing, staffing, opening,advertising and operatingmessaging away from traditional medium such as television advertising toward digital media as we transition to the next phase of our loyalty and recognition programs. We continue to make these investments as part of our long-term strategy to increase our brand awareness and motivate new and more frequent guest visits. As we continued to evaluate our portfolio of restaurant locations, we closed 21 restaurants so that resources could be focused on the locations that exhibit the most promise for enhanced profitability. Over the long term, our strategy is to continue to refine our restaurant protoype design and build new restaurants in our coremarkets where we believe we can achieve superior restaurant brands. Of particular focus was the opening ofcash flows. sixth Combo location with a side-by-side Luby’s Cafeteria and Fuddruckers. To support improvement in guest traffic and sales we continued to re-invest in our core restaurant brands through exterior and interior remodels. Our Fuddruckers franchise business segment continued supporting our loyal franchisees and developingwe continued to pursue opportunities to re-franchise company-owned Fuddruckers locations as part of our franchisee pipeline both domestically and internationally.strategy to grow franchise revenues. Our contractCulinary Contract Services segment continues its focus on expanding the number of locations that we serve and developing business partnerships for the long-term.To improvelong-term, while servicing our performance inexisting agreements with our Company-operated restaurants,customized and high-level of client service. We are working to ensure that we are strengtheninghave the right corporate headcount and overhead to support each of our business through leadership development ofsegments while balancing our restaurant employees. To complement focuscorporate overhead costs: on our people,this front, we have continued to enhance our product offerings to drive frequencymade significant strides in reducing overhead costs, including reduced headcount, corporate travel expense, and loyalty. This included steps taken to improve the customer experience through enacted process improvements aimed at increasing our guest satisfaction. We have also taken additional steps to manage selling, general, and administrative expenses through enhanced cost controls company-wide leading to improved profitability. We also reduced our debt levels in fiscal 2015 through moderating our capital investments and through the sale of under-performing assets.2015Financial Performance●Total Company sales decreased approximately $0.3 million, or 0.1%, in fiscal 2015 compared to fiscal 2014, consisting primarily of a $2.2 million decrease in culinary contract services sales mostly offset by a $1.9 million increase in restaurant sales. The other components of total sales are franchise revenue and vending revenue. The $1.9 million increase in restaurant sales consisted of a $13.1 million increase in sales at Combo locations and a $7.2 million increase in sales at stand-alone Fuddruckers restaurants locations, partially offset by a $13.3 million decrease in sales at Cheeseburger in Paradise locations and a $4.2 million decrease in sales at stand-alone Luby’s Cafeterias largely due to unit closures. Fiscal 2014 also included a $0.9 million sales contribution from Koo Koo Roo locations that ceased operations prior to start of fiscal 2015.●Total segment profit decreased $1.1 million to $58.8 million in fiscal 2015 compared to $59.9 million in fiscal 2014. The $1.1 million decrease in total segment profit resulted from a decrease of $1.0 million in Company-owned restaurant segment profit and a $0.1 million decrease in culinary contract services segment profit. The $1.0 million decrease in Company-owned restaurant segment profit resulted from restaurant sales and vending income increasing $1.9 million and the cost of food, payroll and related costs, other operating expenses, and occupancy costs increasing $2.9 million.●Income or loss from Continuing Operations was a loss of $1.4 million in fiscal 2015 compared to a loss of $1.6 million in fiscal 2014.MilestoneMilestones●Core restaurant brands.Our core Luby’s Cafeteria and Fuddruckers brands continued to develop and evolve. While our core menu remains stable at our Luby’s Cafeterias, we introduce and rotate new menu offerings throughout the year to remain relevant to both our existing customer base and attract new customers. We offer a range of price points which include premium items featured on weekend nights as well as more price-sensitive manager specials throughout the week. In fiscal 2015, we also continued to promote our made-from-scratch cooking with many locally-sourced “from the farm” ingredients at our Luby’s Cafeterias with our “The Luby’s Way” slogan. “The Luby’s Way” signifies that we are dedicated to serving our guests only the best hand-crafted recipes, prepared fresh each day in our kitchens. We support local farmers and use only the freshest produce and highest quality ingredients. At Fuddruckers, we continue to evolve The World’s Greatest Hamburgers®, with new specialty burger combinations and toppings and expanded offerings beyond the core hamburger. In fiscal 2015, we continued our enhanced guest service program whereby a designated restaurant employee engages guests throughout the dining room and ensures that all elements of the dining experience occur at our high standard. We continued to focus on speed of service and an enhanced ordering experience. To elevate the Fuddruckers brand, we partnered with the Houston Texans National Football League team, which has provided Fuddruckers with increased media mentions and exposure to past, present and future customers. We are also making investments in new technologies through the introduction of a new point of sale system which accepts Apple Pay, features kitchen displays programmed to measure speed of service consistently across all locations, and has been integrated with the new Fuddruckers online ordering app. We continued to measure guest satisfaction through a number of survey and other guest interactions that helped us identify areas of excellence and areas for improvement. In total, we opened nine company-owned Fuddruckers in fiscal 2015 and sales at same-store Fuddruckers restaurants grew 1.1% in fiscal year 2015 compared to fiscal year 2014. We continued to invest in training and leadership development programs to further enhance our service culture throughout each of our restaurant brands. We are confident the focus on great food and enhanced service will in the long run lead to increased guest frequency and loyalty.●Franchise Network.As of August 26, 2015, we supported a franchise network of 106 Fuddruckers franchise locations with 77 locations under development agreements, of which 23 are scheduled to open by the end of fiscal 2017. For fiscal 2015, our franchisees opened eight new Fuddruckers restaurants (two of which were acquired from us as the franchisor). Five of the opened locations were in the United States, one in Panama, one in Chile, and one in Poland. For fiscal 2015, there were 12 Fuddruckers franchise locations that closed as franchise-operated restaurants (two of which were acquired by us as the franchisor). Our franchise network generated approximately $7.0 million in revenue in fiscal year 2015.●Culinary Contract Services.Our CCS business generated $16.4 million in revenue during fiscal 2015 compared to $18.6 million in revenue during fiscal 2014. The $2.2 million decrease in CCS revenue was a result of operating fewer locations and ceasing operations at two high sale volume locations. We view this area as a long-term growth business that generally requires less capital investment and produces favorable percentage returns on invested capital.●Cheeseburger in Paradise Location Strategy.At Cheeseburger in Paradise, we initiated a strategic plan in fiscal 2014 to revitalize the brand and improve results that included closing underperforming units, converting certain locations to Fuddruckers and launching initiatives to improve restaurant performance at the remaining units. As of our fiscal year-end, we operated eight of the original Cheeseburger in Paradise locations, completed six conversions to Fuddruckers restaurants, selected four additional locations expected to be converted into Fuddruckers, two locations sub-leased to franchisees and another three locations which we expect to dispose. At the core eight locations that we operate with the Cheeseburger in Paradise brand, our focus is on building customer loyalty step by step.●New RestaurantOpenings.In fiscal year 2015, we opened ten restaurants. Two of these restaurants were at our sixth Combo location, located in Jackson, Mississippi. These six Combo locations are a key component of our long term growth strategy. In addition to the Combo locations, we opened eight stand-alone Fuddruckers restaurants. These eight Fuddruckers locations consisted of (1) three locations that were previously operated as Cheeseburger in Paradise restaurants; (2) one location that was converted from our previously operated Koo Koo Roo brand; (3) three locations acquired from our franchisees and (4) one location in newly constructed retail space. During fiscal 2015, we also closed a total of seven restaurants. These seven closures consisted of two Luby’s Cafeteria locations and five Fuddruckers restaurant locations (two of which were acquired by one of our franchisees). ●Capital Spending. Purchases of property and equipment were $20.4 million in fiscal 2015 down from $46.2 million in fiscal 2014. These capital investments were funded through a combination of cash from operations, sale of property and utilization of our revolving credit facility. Capital investments in fiscal 2015 included (1) $2.4 million on new restaurant development; (2) $3.2 million on the purchase of parcels of land for current and future development; (3) $7.8 million on the remodeling of existing restaurants and conversion of Cheeseburger in Paradise restaurants and one Koo Koo Roo restaurant into Fuddruckers restaurants and (4) $7.0 million for recurring capital expenditures and technology infrastructure investments. Our debt balance at the end of fiscal 2015 was $37.5 million. We remain committed to maintaining the attractiveness of all of our restaurant locations where we anticipate operating over the long term. In fiscal 2016, we anticipate making capital investments of up to $20 million, excluding the purchase of land, for recurring maintenance of all of our restaurant properties, for point of sale hardware associated with our technology infrastructure, and to fund our on-going remodeling program.CCSculinary contract service business. We are also committed to reducing our debt balances and making capital investments with suitable return characteristics. We plan to use cash generated from operations, combined with our borrowing capacity, when necessary, in order to seize these capital investment opportunities. We believeAs we improve and elevate our operational execution has improved through our commitment to higher operating standards, and we believe that we are well-positioned to enhance shareholder value over the long term.2011 was the last2016 is such fiscala year that contained 53 weeks.weeks, accounting for 371 days in the aggregate. In fiscal year 2015, and prior, each of the first three quarters of each fiscal year consisted of three four-week periods, while the fourth quarter normally consisted of four four-week periods. Beginning in fiscal year 2016, the first quarter will consistconsisted of four four-week periods, while the last three quarters will normally consist of three four-week periods. However, fiscal year 2016 is a fiscal year consisting of 53 weeks, accounting for 371 days in the aggregate. As such, the fourth quarter of fiscal year 2016 will contain one five-week period, resulting in a 13-week fourth quarter, or 91 days in the aggregate. Comparability between quarters may be affected by the varying lengths of the quarters, as well as the seasonality associated with the restaurant business.The Cheeseburger in Paradise stores that were acquired in December 2012 were included in the same store metric beginning with the first quarter fiscal 2015. Stores that close on a permanent basis (or on a temporary basis for remodeling) are removed from the group in the fiscal quarter when operations cease at the restaurant, but remain in the same-store group for previously reported fiscal quarters. Although management believes this approach leads to more effective year-over-year comparisons, neither the time frame nor the exact practice may be similar to those used by other restaurant companies. Same-store sales at our restaurant units increaseddecreased 0.5% for fiscal 2015 and were unchanged2018, decreased 3.4% for fiscal 20142017, and increased 0.7% for fiscal 2013. Fiscal 2015 Fiscal 2014 Fiscal 2013 Increase (Decrease) Q4 Q3 Q2 Q1 Q4 Q3 Q2 Q1 Q4 Q3 Q2 Q1 Same-store sales 0.7 (1.1 2.5 (0.1 (1.0 0.3 2.5 (1.3 0.5 (0.1 (0.6 0.2 Discontinued OperationsOn March 24, 2014, the Company announced that it has initiated a plan focused on improving cash flow from the recently acquired Cheeseburger in Paradise leasehold units. This underperforming Cheeseburger in Paradise leasehold disposal plan called for five or more locations to be closed by the end of fiscal 2014. In accordance with the plan, the entire fiscal activity of the applicable locations closed after the inception of the plan has been classified as discontinued operations. Results related to these same locations have also been classified as discontinued operations for all periods presented. Fiscal 2018 Fiscal 2017 Fiscal 2016 Increase (Decrease) Q4 Q3 Q2 Q1 Q4 Q3 Q2 Q1 Q4 Q3 Q2 Q1 Same-store sales 1.2 % (0.9 )% (3.7 )% 0.8 % (5.2 )% (2.7 )% (3.8 )% (2.3 )% (0.5 )% (0.6 )% 2.2 % 1.4 % 20152018 (52 weeks) compared to Fiscal 20142017 (52 weeks) and Fiscal 2016 (53 weeks)Sales (52 weeks) (52 weeks) (52 vs 52 weeks) $ 370,192 $ 368,267 0.5 $ 360,001 2.3 16,401 18,555 (11.6 16,693 11.2 6,961 7,027 (0.9 6,937 1.3 531 532 (0.3 565 (5.7 $ 394,085 $ 394,381 (0.1 $ 384,196 2.7 Fiscal Year 2018 Ended Fiscal Year 2017 Ended Fiscal 2018 vs Fiscal 2017 Fiscal Year 2016 Ended Fiscal 2017 vs Fiscal 2016 ($000s) August 29, 2018 August 30, 2017 Higher/(Lower) August 31, 2016 Higher/(Lower) (52 weeks) (52 weeks) (52 vs 52 weeks) (53 weeks) (52 vs 53 weeks) Restaurant sales $ 332,518 $ 350,818 (5.2 )% $ 378,111 (7.2 )% Culinary contract services 25,782 17,943 43.7 % 16,695 7.5 % Franchise revenue 6,365 6,723 (5.3 )% 7,250 (7.3 )% Vending revenue 531 547 (2.9 )% 583 (6.2 )% TOTAL SALES $ 365,196 $ 376,031 (2.9 )% $ 402,639 (6.6 )% $0.3$10.8 million, or 0.1%2.9%, in fiscal 20152018 compared to fiscal 2014,2017, consisting primarily of a $2.2an approximate $18.3 million decrease in restaurant sales, an approximate $7.8 million increase in Culinary contract services sales, offset by a $1.9an approximate $0.4 million increasedecrease in restaurant sales. The other components of total sales are franchise revenue, and less than a $0.1 million decrease in vending revenue.increased $10.2decreased approximately $26.6 million, or 2.7%6.6%, in fiscal 20142017 compared to fiscal 2013,2016, consisting primarily of an $8.3approximate $27.3 million decrease in restaurant sales, an approximate $0.5 million decrease in franchise revenue, an approximate $1.2 million increase in restaurantCulinary contract service sales, and a $1.9less than $0.1 million increasedecrease in culinary contract service sales. The other componentsvending revenue. Fiscal 2016 contained one additional week of operations during which approximately $6.7 million in restaurant sales were generated and approximately $7.1 million in total sales are franchise revenue and vending revenue.restaurants, franchise operations,Restaurants, Franchise Operations, and Culinary Contract Services. $ 226,970 $ 231,131 $ (4,161 (1.8 101,290 94,101 7,189 7.6 23,734 10,603 13,131 123.8 18,198 31,515 (13,317 (42.3 — 917 (917 (100.0 $ 370,192 $ 368,267 $ 1,925 0.5 Restaurant Brand Fiscal Year 2018 Ended Fiscal Year 2017 Ended Fiscal 2018 vs Fiscal 2017 Fiscal Year 2016 Ended Fiscal 2017 vs Fiscal 2016 August 29, 2018 August 30, 2017 Higher/(Lower) August 31, 2016 Higher/(Lower) (52 weeks) (52 weeks) (52 vs 52 weeks) (53 weeks) (52 vs 53 weeks) Luby’s Cafeterias $ 210,972 $ 214,976 (1.9 )% $ 229,880 (6.5 )% Fuddruckers Restaurants 87,618 98,115 (10.7 )% 106,456 (7.8 )% Combo locations 20,886 21,304 (2.0 )% 23,107 (7.8 )% Cheeseburger in Paradise 13,042 16,423 (20.6 )% 18,668 (12.0 )% Restaurant Sales $ 332,518 $ 350,818 (5.2 )% $ 378,111 (7.2 )% increaseddecreased approximately $1.9$18.3 million in fiscal 20152018 compared to fiscal 2014.2017. The increasedecrease in restaurant sales included a $13.1an approximate $4.0 million increasedecrease in sales at stand-alone Luby’s Cafeterias, an approximate $10.5 million decrease in sales at stand-alone Fuddruckers restaurants, an approximate $0.4 million decrease in sales from Combo locations, and a $7.2 million increase in sales at stand-alone Fuddruckers restaurants, mostly offset by a $13.3an approximate $3.4 million decrease at sales from our Cheeseburger in Paradise restaurants and a $4.2restaurants.Cafeterias. Fiscal 2014 also includedreflects the reduction of eight operating restaurants, partially offset by a $0.91.5% increase in same-store stand-alone Luby's Cafeteria sales. The 1.5% increase in same-store sales includes a 7.8% increase in average spend per guest partially offset by a 5.8% decrease in guest traffic.contributionat stand-alone Fuddruckers restaurants reflects a net reduction of 15 operating restaurants and a 3.6% decrease in same-store stand-alone Fuddruckers sales. The 3.6% decrease in same-store sales includes a 8.2% decrease in guest traffic partially offset by a 5.0% increase in average spend per guest.Koo Koo RooCombo locations that ceased operations prior to startreflects a 2.0% decrease in sales at the six locations in operation throughout fiscal 2018 and fiscal 2017.2015.2018 and two stores in the fourth quarter of fiscal 2018). The $13.1closure of six stores reduced sales by approximately $2.1 million increase in Combo locationwhereby five of the six closures took place near the end of fiscal 2018.reflects a greater number of weeks of operations for these locationsdecreased approximately $27.3 million in fiscal 20152017 compared to fiscal 2014 as our Combo locations grew from one at the beginning of fiscal 2014 to a total of six locations by the third quarter fiscal 2015.2016. The $7.2decrease in restaurant sales included an approximate $14.9 million increasedecrease in sales at Fuddruckers includes a $5.2stand-alone Luby’s Cafeterias, an approximate $8.4 million increasedecrease in sales at seven locations that were previously operated as one of our other restaurant brands (six previously operated as Cheeseburgerstand-alone Fuddruckers restaurants, an approximate $1.8 million decrease in Paradisesales from Combo locations, and one previously operated as a Koo Koo Roo location). The $13.3an approximate $2.2 million decrease at sales from our Cheeseburger in Paradise restaurants primarilyrestaurants. The approximate $27.3 million decrease in total restaurant sales reflects fewercomparison to fiscal 2016 which included one additional week of operations. Fiscal 2017 was comprised of a typical 52 weeks of operation for this brand in fiscal 2015 compared to fiscal 2014 as 15 Cheeseburger in Paradise in restaurants were closed for conversion or disposal at various points2016 which was comprised of 53 weeks. The additional week of operations in fiscal 2014. 2016 generated approximately $6.7 million in restaurant sales.$4.2approximate $14.9 million decrease in sales at our stand-alone Luby’s Cafeterias primarily reflects the closurethat fiscal 2016 included one additional week of three locationsoperations which generated approximately $4.1 million in sales in fiscal 2014 and one location2016, a 3.3% decrease in fiscal 2015, partially offset by the opening of one new location in fiscal 2014same-store stand-alone Luby's Cafeteria sales, and a 0.6% increasereduction of six operating restaurants. The 3.3% decrease in same-store Luby’s Cafeteria sales.On a same store basis, restaurant sales increased 0.5% for fiscal 2015 compared to fiscal 2014. Same store sales at our Luby’s Cafeterias increased 0.6% and same store sales at our Fuddruckers restaurants increased 1.1% in fiscal 2015 compared to fiscal 2014, while same store sales at our Cheeseburger in Paradise location decreased 2.9% and our one Combo included in the same-store group decreased 1.8%. The 0.6% increase in same store sales at our Luby’s Cafeteria restaurants includes a 1.6% increase in average guest spend offset by a 1.0%5.6% decrease in guest traffic for fiscal 2015 compared to fiscal 2014. The 1.1% increase in same-store sales at our Fuddruckers restaurants reflects anpartially offset by a 2.3% increase in average guest spend with a constant level of guest traffic for fiscal 2015 compared to fiscal 2014.Restaurant sales increased approximately $8.3 million in fiscal 2014 compared to fiscal 2013. per guest.increase in restaurant sales included a $5.3 million increase in sales from Combo locations, a $4.0 million increase in sales at stand-alone Luby’s Cafeteria branded restaurants and a $1.4approximate $8.4 million decrease in sales at stand-alone Fuddruckers restaurants. Also includedrestaurants includes approximately $1.9 million in sales generated in the additional week in fiscal 2016, a 1.8% decrease in same-store stand-alone Fuddruckers sales, and a net reduction of six operating restaurants. The 1.8% decrease in same-store sales includes a 4.6% decrease in guest traffic partially offset by a 2.8% increase in restaurantaverage spend per guest.isfrom Combo locations includes approximately $0.4 million in sales generated in the additional week in fiscal 2016 and a $1.95.3% decrease in sales at the six locations in operation throughout fiscal 2016 and fiscal 2017.increase atdecrease in sales from our Cheeseburger in Paradise restaurants which primarily reflects more weeks of operation for this brandincludes approximately $0.3 million in sales generated in the additional week in fiscal 2014 compared to fiscal 2013;2016 and a $1.6 million10.5% decrease in sales at our Koo Koo Roo brand reflecting fewer weeks ofthe eight locations in operation for this brand inthroughout fiscal 2014 compared to2016 and fiscal 2013.On a same store basis, restaurant sales were unchanged for fiscal 2014 compared to fiscal 2013. Same store sales at our Luby’s Cafeteria restaurants increased 1.4% in fiscal 2014 compared to fiscal 2013 while same store sales at our Fuddruckers restaurants decreased 3.5%. The increase in same store sales at our Luby’s Cafeteria restaurants reflects the benefits realized from remodeled stores and the relocation of one store into a newly constructed building on a pad site in front of the previous mall location as well as favorable customer responses to our new and existing menu offerings. The decline in same-store sales at our Fuddruckers restaurants partially reflects a continued very competitive burger segment of the restaurant industry despite increased marketing efforts and service improvements. The decrease in same store sales followed three years of increasing same stores for the Fuddruckers brand. (52 weeks) $ 107,053 $ 106,254 0.8 $ 103,052 3.1 28.9 28.9 0.0 28.6 0.3 Fiscal Year 2018 Ended Fiscal Year 2017 Ended Fiscal 2018 vs Fiscal 2017 Fiscal Year 2016 Ended Fiscal 2017 vs Fiscal 2016 ($000s) August 29, 2018 August 30, 2017 Higher/(Lower) August 31, 2016 Higher/(Lower) (52 weeks) (52 weeks) (52 vs 52 weeks) (53 weeks) (52 vs 53 weeks) Cost of food $ 94,238 $ 98,714 (4.5 )% $ 106,980 (7.7 )% As a percentage of restaurant sales 28.3 % 28.1 % 0.2 % 28.3 % (0.2 )% increaseddecreased approximately $0.8$4.5 million, or 0.8%4.5%, in fiscal 20152018 compared to fiscal 2014.2017. Cost of food is variable and generally fluctuates with sales volume. As a percentage of restaurant sales, food costs was 28.9%increased 0.2% to 28.3% in fiscal 2015 and2018 compared to 28.1% in fiscal 2014.2017. The Cost of food as percentage of sales was unchanged as we were able to offsetimpacted by several offsetting factors: (1) higher food commodity costs driven in large part by higher freight charges and (2) changes in product offerings (for a portion of the fiscal year) with generally higher food ingredient costs, partially offset by (3) higher menu price increasespricing.3% increase1% decrease in the cost of our basket of food commodity purchases, occurring as a result of significantdecreases in the cost in our primary commodities of beef and poultry as well as in our other commodities of eggs and oils and shortenings partially offset by increases in the cost of seafood, dairy and butter, and fresh produce. At our Fuddruckers, the cost of our basket of food commodity purchases was stable, with modest increases in the cost of beef, cheese and to a lesser extent poultrydairy, and eggs, partiallyproduce offset by the reductionsdecreases in the cost of seafood, cheese, oilspoultry, pork, and shortening. Average spend per Luby’s Cafeteria guest increased 1.6% as the result of selected menu price increases and changesdough used in the mixproduction of menu items offered and selected by our guests, thus offsetting the higher food commodity costs. At our Fuddruckers restaurants we experienced an approximate 8% increase in our basket of food commodity purchases, with significant increases in the cost of beef having the greatest impact. Our cost of food, however, was also impacted by significantly higher poultry, and eggs costs, partially offset by lower costs for seafood, pork, and oils and shortenings. Average spend per Fuddruckers guest increased 1.1% as the result of selected menu price increases and changes in the mix of menu items offered and selected by our guests which partially offset the higher food commodity costs.Cost of food increased approximately $3.2 million, or 3.1%, in fiscal 2014 compared to fiscal 2013. Cost of food is variable and generally fluctuate with sales volume. As a percentage of restaurant sales, food costs increased 0.3% to 28.9% in fiscal 2014 compared to 28.6% in fiscal 2013. The Cost of food as percentage of sales increased primarily from higher food commodity costs which impacted each of our restaurant brands. At our Luby’s Cafeteria restaurants we were able to offset a 3% increase in our basket of food commodity purchases with effective food controls on the cafeteria line and managing the mix of menu items offered by us and selected by our guests. The 3% increase in our basket of food commodity purchases at our Luby’s Cafeteria restaurants occurred as a result of commodity price increase in beef, poultry, dairy, butter, and cheese; these increases were partially offset by decrease in seafood and oils and shortenings. At Fuddruckers, our basket of food commodity purchases also increased 3%, driven almost entirely from beef prices increasing approximately 10% for the fiscal year as beef prices spiked in the last several months of fiscal 2014. Cost of food as a percentage of sales increased 60 basis points at our Fuddruckers restaurants and are attributed to this increase in food commodity prices offset by careful control of food product. (52 weeks) $ 127,694 $ 126,046 1.3 $ 122,865 2.6 34.5 34.2 0.3 34.1 0.1 Fiscal Year 2018 Ended Fiscal Year 2017 Ended Fiscal 2018 vs Fiscal 2017 Fiscal Year 2016 Ended Fiscal 2017 vs Fiscal 2016 ($000s) August 29, 2018 August 30, 2017 Higher/(Lower) August 31, 2016 Higher/(Lower) (52 weeks) (52 weeks) (52 vs 52 weeks) (53 weeks) (52 vs 53 weeks) Payroll and related costs $ 124,478 $ 125,997 (1.2 )% $ 132,960 (5.2 )% As a percentage of restaurant sales 37.4 % 35.9 % 1.5 % 35.2 % 0.7 % increaseddecreased approximately $1.6$1.5 million, or 1.3%1.2%, in fiscal 20152018 compared to fiscal 2014.2017 due in part to (1) operating 29 fewer restaurants (net reduction of eight restaurants in fiscal 2017 and reduction of 21 restaurants in fiscal 2018); partially offset by (2) an approximate $1.0 million increase in workers' compensation expense; and (3) higher average wage rates reflective of market pressures. Payroll and related costs as a percentage of restaurant sales increased 0.3%,1.5% due to (1) primarily as a resultthe fixed cost component of higher management labor costs as management positions were filled to ensure management coverage necessary to meet our guest service levels andwith lower same-store sales levels; (2) due to higher average management wages.increaseddecreased approximately $3.2$7.0 million, or 2.6%5.2%, in fiscal 20142017 compared to fiscal 2013. Hourly labor costs increased approximately $0.9 million2016 due in part to (1) operating ten fewer restaurants; (2) an additional week of operations in fiscal 2014 compared to fiscal 2013 due to (1) the addition of four new restaurants2016; (3) an approximate $0.7 million decrease in the side-by-side Luby’s Cafeterias and Fuddruckers configuration; (2) more operating weeks for the Cheeseburger in Paradise brand and (3) higher group health insurance costsworkers' compensation expense; partially offset by (4) the closure of four Luby’s Cafeteria restaurants and (5) continued enhanced labor scheduling processes at each of our restaurant brands with Fuddruckers realizing the greatest impact from these improvements. Management labor costs increased approximately $2.3 million in fiscal 2014 compared to fiscal 2013 due to the store openings and increased operating weeks for the Cheeseburger in Paradise brand, offset by store closures as enumerated above.higher average wage rates. Payroll and related costs also included an approximate $0.4 million increase in group health insurance costs. Asas a percentage of restaurant sales payroll and relatedincreased 0.7% due to (1) the fixed cost component of labor costs increased 0.1% to 34.2% in fiscal 2014 compared to 34.1% in fiscal 2013. ($000s) (52 weeks) (52 weeks) (52 vs 52 weeks) (52 weeks) (52 vs 52 weeks) $ 63,090 $ 61,700 2.3 $ 58,985 4.6 17.0 16.8 0.2 16.4 0.4 Fiscal Year 2018 Ended Fiscal Year 2017 Ended Fiscal 2018 vs Fiscal 2017 Fiscal Year 2016 Ended Fiscal 2017 vs Fiscal 2016 ($000s) August 29, 2018 August 30, 2017 Higher/(Lower) August 31, 2016 Higher/(Lower) (52 weeks) (52 weeks) (52 vs 52 weeks) (53 weeks) (52 vs 53 weeks) Other operating expenses $ 62,286 $ 61,924 0.6 % $ 60,961 1.6 % As a percentage of restaurant sales 18.7 % 17.7 % 1.0 % 16.1 % 1.6 % $1.4$0.4 million, or 2.3%0.6%, in fiscal 20152018 compared to fiscal 2014.2017. As a percentage of restaurant sales, Other operating expenses increased 0.2%1.0% to 17.0 %18.7% in fiscal 20152018 compared to 16.8%17.7% in fiscal 2014.2017. The 0.2% increase in Other operating expenses as a percentage of restaurant sales was due to a 0.5% increase in repairs and maintenance cost and a 0.1% increase in marketing and advertising costs, partially offset by a decrease of 0.4% in utilities costs as a percentage of restaurant sales due to lower average utility rates.Other operating expenses increased approximately $2.7 million, or 4.6%, in fiscal 2014 compared to fiscal 2013. As a percentage of restaurant sales, Other operating expenses increased 0.4% to 16.8% in fiscal 2014 compared to 16.4% in fiscal 2013. The 0.4%1.0% increase in Other operating expenses as a percentage of restaurant sales was due to (1) a 0.5% increase in restaurant supplies related to efforts within fiscal 2018 to refresh, restock, and upgrade kitchen and dining room supplies in order to enhance the guest experience as well as increased food-to-go packaging costs with the growth in food-to-go sales through third party delivery services; (2) a 0.3% increase in repairs and maintenance expense; (3) a 0.2% increase in utilities expense on higher electricity utility rates; and (4) 0.2% increase in other expenses primarily related to post-hurricane Harvey related costs as well as increased reserves for doubtful accounts.dueOther operating expenses increased 1.6% to higher average utility rates; (2) a 0.3%17.7% in fiscal 2017 compared to 16.1% in fiscal 2016. The 1.6% increase in restaurant services and other restaurantOther operating expenses as a percentage of restaurant sales was due primarily to higher credit card transaction fees from increased credit card usage; increased restaurant network and technology costs; offset by (3)(1) a 0.2% decrease0.6% increase in restaurant services including higher computer network connectivity, point of sale software, food-to-go delivery charges to third parties, increased store security costs, and higher fees associated with armored car services; (2) a 0.6% increase in repairs and maintenance costs; (3) a 0.3% increase in utilities costs due to higher average utility rates; and certain property insurance costs as(4) a percentage of0.1% increase in restaurant sales. ($000s) (52 weeks) (52 weeks) (52 vs 52 weeks) (52 weeks) (52 vs 52 weeks) $ 20,977 $ 21,881 (4.1 $ 21,680 0.9 5.7 5.9 (0.2 6.0 (0.1 Fiscal Year 2018 Ended Fiscal Year 2017 Ended Fiscal 2018 vs Fiscal 2017 Fiscal Year 2016 Ended Fiscal 2017 vs Fiscal 2016 ($000s) August 29, 2018 August 30, 2017 Higher/(Lower) August 31, 2016 Higher/(Lower) (52 weeks) (52 weeks) (52 vs 52 weeks) (53 weeks) (52 vs 53 weeks) Occupancy costs $ 20,399 $ 21,787 (6.4 )% $ 22,374 (2.6 )% As a percentage of restaurant sales 6.1 % 6.2 % (0.1 )% 5.9 % 0.3 % $0.9$1.4 million in fiscal 20152018 compared to fiscal 2014, in large part2017 due to closureprimarily operating 29 fewer restaurants (net reduction of eight restaurants in fiscal 2017 and reduction of 21 restaurants in fiscal 2018). Of the net reduction of 29 restaurants, 19 were properties that we leased.locations.restaurant locations (one of which is now sub-leased to a Fuddruckers franchise operator) and one additional week of operations in fiscal 2016. The occupancy costs of closed locations previously operated as Cheeseburger in Paradise, but selected for conversion to Fuddruckers restaurants in fiscal 20152017 or beyond have beenwere classified as a pre-opening costscost and reflected in our Opening costs expense line.Occupancy costs increased approximately $0.2 million in fiscal 2014 compared to fiscal 2013, in large part due to higher property tax expenses at certain locations offset by lower overall rental expenses. The lower overall rental expenses were due in large part to closing three Koo Koo Roo branded restaurant locations and recording accelerated rental expense in prior fiscal 2013. Permitting and licensing expenses were also reduced in fiscal 2014 compared to fiscal 2013. ($000s) (52 weeks) (52 weeks) (52 vs 52 weeks) (52 weeks) (52 vs 52 weeks) $ 6,961 $ 7,027 (0.9 $ 6,937 1.3 1,668 1,733 (3.7 1,629 6.3 $ 5,293 $ 5,294 (0.0 $ 5,308 (0.2 76.0 75.3 0.7 76.5 (1.2 Fiscal Year 2018 Ended Fiscal Year 2017 Ended Fiscal 2018 vs Fiscal 2017 Fiscal Year 2016 Ended Fiscal 2017 vs Fiscal 2016 ($000s) August 29, 2018 August 30, 2017 Higher/(Lower) August 31, 2016 Higher/(Lower) (52 weeks) (52 weeks) (52 vs 52 weeks) (53 weeks) (52 vs 53 weeks) Franchise revenue $ 6,365 $ 6,723 (5.3 )% $ 7,250 (7.3 )% Cost of franchise operations 1,528 1,733 (11.8 )% 1,877 (7.7 )% Franchise profit $ 4,837 $ 4,990 (3.1 )% $ 5,373 (7.1 )% Franchise profit as percent of Franchise revenue 76.0 % 74.2 % 1.8 % 74.1 % 0.1 % $66 thousandapproximately $0.4 million, or 5.3%, in fiscal 20152018 compared to fiscal 20142017 which included a $131 thousandan approximate $0.2 million decrease in franchise royalties offset by a $65 thousand increaseand an approximate $0.2 million decrease in franchise fees. During the year,The approximate $0.2 million decrease in franchise royalties was due primarily to a net decrease of eight franchise locations openedin operation and there were tena 1.4% decrease in domestic franchise units that closed on a permanent basissame-store sales. The approximate $0.2 million decrease in franchise fees was due to fewer openings and two that were converted to company operated locations. We ended fiscal 2015lower fees earned associated with 106 Fuddruckersfranchisees not fully achieving timetables for store openings under development agreements. Cost of franchise restaurants.Franchise revenue increased $91 thousandoperations decreased approximately $0.2 million, or 11.8%, in fiscal 20142018 compared to fiscal 2013 which included2017, primarily as a $125 thousand increaseresult of decreased overhead cost to support franchise operations and the opening of fewer franchise locations. Franchisees opened four locations in fiscal 2018 (two in Florida, one in Pennsylvania, and one in Mexico). Franchise profit, defined as Franchise revenue less Cost of franchise feesoperations, decreased approximately $0.2 million in fiscal 2018 compared to fiscal 2017. During fiscal 2018, we opened the four franchise locations enumerated above and a $34 thousand decrease in franchise royalties. During the year, there were 12 franchise units that closed on a permanent basis. We ended fiscal 20142018 with 110105 Fuddruckers franchise restaurants. Two franchisee-operatedtwo franchisee-operated locationsthere were also eight franchise units that closed subsequent to the end of theon a permanent basis. We ended fiscal year on August 27, 2014. As of November 4, 2014, we had 1102017 with 113 Fuddruckers franchise restaurants.CCS Segment Profithigher education, and corporate dining clients.clients, government buildings, sports stadiums, and sales through retail grocery outlets. The healthcare accounts are full service and typically include in-room delivery, catering, vending, coffee service and retail dining. Retail grocery outlet sales are through H-E-B stores, a Texas-born retailer, where we sell family-sized versions of Luby's Famous Macaroni & Cheese (two varieties) and Luby's famous Fried Fish in the freezer section.linesegment varied between 22 and 28 client locations in fiscal 2018 and between 23 and 25 client locations through fiscal 2015 and between 21 and 26 client locations in fiscal 2014.2017. In fiscal 2015,2018 and fiscal 2017, we continued concentrating on clients able to enter into agreements where all operating costs are reimbursed to us and we generally charge a generally fixed fee. These agreements typically present lower financial risk to the company. Fiscal Year 2018 Ended Fiscal Year 2017 Ended Fiscal 2018 vs Fiscal 2017 Fiscal Year 2016 Ended Fiscal 2017 vs Fiscal 2016 ($000s) August 29, 2018 August 30, 2017 Higher/(Lower) August 31, 2016 Higher/(Lower) (52 weeks) (52 weeks) (52 vs 52 weeks) (53 weeks) (52 vs 53 weeks) Culinary contract services $ 25,782 $ 17,943 43.7 % $ 16,695 7.5 % Cost of culinary contract services 24,161 15,774 53.2 % 14,955 5.5 % Culinary contract profit $ 1,621 $ 2,169 (25.3 )% $ 1,740 24.7 % Culinary contract profit as percent of Culinary contract services sales 6.3 % 12.1 % (5.8 )% 10.4 % 1.7 % Contract Services Revenue (52 weeks) (52 weeks) (52 vs 52 weeks) (52 weeks) (52 vs 52 weeks) $ 16,401 $ 18,555 (11.6 )% $ 16,693 11.2 14,786 16,847 (12.2 )% 15,604 8.0 $ 1,615 $ 1,708 (5.4 )% $ 1,089 56.9 9.9 9.2 0.6 % 6.5 2.7 Culinary Contract Servicescontract services revenue decreased $2.2increased $7.8 million, or 11.6%43.7%, in fiscal 20152018 compared to fiscal 2014. While the number of locations has varied, we believe we now operate with a stronger mix of clients.2017. The decrease$7.8 million increase in revenue was primarily due to ceasing operations(1) 15 new locations opening since the beginning of fiscal 2017 contributing a total of $10.4 million in increased sales; and (2) an increase of $0.5 million at two higher volume locations onlythat were in operation throughout fiscal 2017 and fiscal 2018; partially offset by newer smaller volume locations.Culinary Contract Servicesculinary contract services includes the food, payroll and related costs, other direct operating expenses associated with generating culinary contract sales, and the direct overhead costs (primarily salary and related costs) associated with the management of this business segment. Cost of Culinary Contract Services decreasedculinary contract services increased approximately $2.1$8.4 million, or 12.2%53.2%, in fiscal 20152018 compared to fiscal 20142017 due primarily to a decreasenet increase in culinary contract sales volume.volume and an increase in corporate overhead supporting the Culinary Contract Services business segment. Profit in our culinary contract servicesCulinary Contract Services business segment (defined as Culinary Contract Servicescontract cervices revenue less costCost of Culinary Contract Services)culinary contract services) decreased in dollar terms by approximately $0.1$0.5 million but increasedand decreased as a percent of Culinary contract services revenue to 6.3% in fiscal 2018 from 12.1% in fiscal 2017.9.9%12.1% in fiscal 20152017 from 9.2%10.4% in fiscal year 2014.$2.7$0.6 million in fiscal 20152018 compared to approximately $2.2$0.5 million in fiscal 2014. 2017 and approximately $0.8 million in fiscal 2016.20152018 included the costre-opening costs associated with one Fuddruckers location that was damaged during Hurricane Harvey and subsequently restored and re-opened for business in fiscal 2018 as well as the carrying costs for one location where we previously operated a Cheeseburger in Paradise restaurant and one location that we lease for a potential future Fuddruckers opening.ComboFuddruckers location comprising a total of 2 restaurants, 9 stand-alone Fuddruckers restaurants, including one that opened just prior to the start of fiscal 2015. Opening costs in fiscal 2015 also includedand the carrying costs (mainly rent, property taxes, and utilities) for seventwo locations that were selected for possible conversion from Cheeseburger in Paradise restaurants to Fuddruckers; three of these locations opened as a Fuddruckers during fiscal 2015, two of these locations opened as a Fuddruckers subsequent to end of fiscal 2016. restaurants.2014,2016 included the cost associated withcosts of opening four Combothree Fuddruckers locations comprising a total of eight restaurants, six stand-alone Fuddruckers restaurants, and one stand-alone Luby’s Cafeteria. Also included in Opening costs were the carrying costs (mainly rent, property taxes, and utilities) for property slatedtwo locations that were selected for development. Opening costspossible conversion from Cheeseburger in fiscal 2013 included the cost associated with opening one Combo location, comprising twoParadise restaurants and five stand-aloneto Fuddruckers restaurants. Also included in Opening costs are the carrying costs for property slated for development. ($000s) (52 weeks) (52 weeks) (52 vs 52 weeks) (52 weeks) (52 vs 52 weeks) $ 21,367 $ 20,062 6.5 $ 18,376 9.2 5.4 5.1 0.3 4.8 0.3 Fiscal Year 2018 Ended Fiscal Year 2017 Ended Fiscal 2018 vs Fiscal 2017 Fiscal Year 2016 Ended Fiscal 2017 vs Fiscal 2016 ($000s) August 29, 2018 August 30, 2017 Higher/(Lower) August 31, 2016 Higher/(Lower) (52 weeks) (52 weeks) (52 vs 52 weeks) (53 weeks) (52 vs 53 weeks) Depreciation and amortization $ 17,453 $ 20,438 (14.6 )% $ 21,889 (6.6 )% As a percentage of total sales 4.8 % 5.4 % (0.6 )% 5.4 % 0.0 % increased $1.3decreased $3.0 million in fiscal 20152018 compared to fiscal 20142017 due primarily to certain assets reaching the investments madeend of their depreciable lives and the removal of certain assets upon sale.new locations as well as the capital we have used for remodeling existing locations as well as depreciation associated with additional infrastructure and technology assets. The increase in depreciationfiscal 2017 compared to fiscal 2016 due primarily to investments made in new locations as well as the capital we have used for remodeling existing locations was mostly offset by certain existing assets reaching the end of their depreciable lives during fiscal 2015.Depreciation and amortization expense increased $1.7 million in fiscal 2014 compared to fiscal 2013 due primarily to the investments made in new locations as well as the capital we have used for remodeling existing locations and to a lesser extent the full year impact of depreciating assets acquired with the Cheeseburger in Paradise brand in prior fiscal 2013 as well as depreciation associated with additional infrastructure and technology assets. The increase in depreciation due to investments made in new locations as well as the capital we have used for remodeling existing locations was mostly offset by certain existing assets reaching the end of their depreciable lives during fiscal 2014. ($000s) (52 weeks) (52 weeks) (52 vs 52 weeks) (52 weeks) (52 vs 52 weeks) $ 35,557 $ 36,814 (3.4 )% $ 33,017 11.5 % 3,201 3,872 (17.3 )% 3,106 24.7 % $ 38,758 $ 40,686 (4.7 )% $ 36,123 12.6 % 9.8 % 10.3 % (0.5 )% 9.4 % 0.9 % Fiscal Year 2018 Ended Fiscal Year 2017 Ended Fiscal 2018 vs Fiscal 2017 Fiscal Year 2016 Ended Fiscal 2017 vs Fiscal 2016 ($000s) August 29, 2018 August 30, 2017 Higher/(Lower) August 31, 2016 Higher/(Lower) (52 weeks) (52 weeks) (52 vs 52 weeks) (53 weeks) (52 vs 53 weeks) General and administrative expenses $ 35,201 $ 32,746 7.5 % $ 36,808 (11.0 )% Marketing and advertising expenses 3,524 5,132 (31.3 )% 5,614 (8.6 )% Selling, general and administrative expenses $ 38,725 $ 37,878 2.2 % $ 42,422 (10.7 )% As percent of total sales 10.6 % 10.1 % 0.5 % 10.5 % (0.4 )% $1.9$4.5 million, or 4.7%10.7%, in fiscal 20152017 compared to fiscal 2014. The2016. Decreases in Selling, general and administrative expenses include (1) an approximate $3.5 million decrease wasin salaries, benefits, and other compensation expenses due primarilyto reduced headcount, significantly reduced bonus and incentive expense (including an adjustment to the estimated fair value of performance awards under an incentive compensation plan), and to a lesser extent, one less operating week in fiscal 2017 compared to fiscal 2016; (2) an approximate $0.7 million decrease in corporate employee travel costs; and (3) an approximate $0.5 million reduction in marketing and advertising costs, partially offset by (4) an approximate $0.1 million increase in corporate supplies expense and other overhead expenses, net of a reduction in outside professional services costs, decreased marketing and advertising expense, lower expenditures for corporate supplies, lower health insurance costs, lower general liability insurance costs and a reduction in other corporate overhead costs; these cost reductions were partially offset by higher compensation expenses.service fees As a percentage of total sales, Selling, general and administrative expenses decreased to 9.8%10.1% in fiscal 20152017 compared to 10.3%10.5% in fiscal 20142016 primarily due to net decreases in the expenses enumerated above while total revenue remained relatively constant.Selling, generalabove.administrative expenses increased byRestaurant Closings$4.6$8.9 million or 12.6% in fiscal 2014 compared2018 is primarily related to fiscal 2013. The increase was due primarilyassets impaired at 21 property locations, goodwill at three property locations, ten properties held for sale written down to an increase in salarytheir fair value, and benefits expense, outside professional services costs, technology and infrastructure costs and corporate travel costs. As a percentagereserve for 15 restaurant closings of total sales, selling, general and administrative expenses increased to 10.3% in fiscal 2014 compared to 9.4% in fiscal 2013 primarily due to increases in the expenses enumerated above increasing at a greater rate than our ability to grow total sales in fiscal 2014.Provision for asset impairments$0.6$10.6 million in fiscal 2015 reflects the impairment2017 is primarily related to assets impaired at 17 property locations, goodwill at six property locations, five properties held for sale written down to their fair value, and a reserve for 10 restaurant closings of three leased Fuddruckers locations.$2.5$1.4 million in fiscal 20142016 reflects the(1) a $1.2 million impairment for one owned Fuddruckers location and three leased Fuddruckers locations; (2) a $0.2 million charge for restaurant closings related to three Fuddruckers locations and one Luby's Cafeteria location; and (3) a $38 thousand impairment of one operating Luby’s Cafeteria, two operating Fuddruckers restaurants, two operating Cheeseburger in Paradise restaurantsGoodwill. The $0.2 million charge for restaurant closings includes the total amount of rent and nine closed Cheeseburger in Paradise restaurants.The asset impairmentother direct costs for the remaining period of approximately $0.6 million in fiscal 2013 is related to one property held for sale, one operating Fuddruckers restaurant and one operating Koo Koo Roo Chicken Bistro ®restaurant as well as a reductiontime the properties will be unoccupied plus the value of the estimated fair valueamount by which the rent we pay to the landlord exceeds any rent paid to us by a tenant under a sublease over the remaining period of used assets to be refurbished and reused.Loss (Gain)Gain on Disposition of Property and Equipment20152017 resulted in a net gain of approximately $4.0$1.8 million, which included (1) the gain on the dispositionsale of three owned Luby’s Cafeteria locations; (2)properties where we operated a cafeteria up until the gain ontime of the sale of two owned properties which we previously leased to a tenant offset by (3)(2) normal asset retirement activity in our restaurants.20142016 resulted in a net gain of approximately $2.4$0.7 million, which included (1) the gain on the dispositionsale of two owned Luby’s Cafeteria locationsone property where we operated a cafeteria up until the time of the sale offset by (2) normal asset retirement activity in our restaurants.The disposition of property and equipmentactivity.2013 resulted2018 compared to $8 thousand in a net gain of approximately $1.7 million, which included (1) proceeds from the eminent domain disposition of part of a parking lot at a Luby’s Cafeteria location; (2) the gain on disposal at a Koo Koo Roo leased locationfiscal 2017, and (3) a payment received for exiting a lease at one cafeteria location priorcompared to the contractual lease expiration date offset by (4) normal asset retirement activity in our restaurants.Interest IncomeInterest income was $4 thousand in fiscal 2015 compared to $6 thousand in fiscal 2014, and compared to $9 thousand in fiscal 2013.20152018 increased approximately $1.1$0.9 million compared to fiscal 2014onhigher2017 on higher average debt balances.balances and higher average interest rates inherent in our amended credit agreement and acceleration of deferred financing fees related to shortening the maturity in our amended credit agreement in the quarter ended June 6, 2018 exceeding the acceleration of deferred financing fees related to the extinguishment of debt in the quarter ended March 15, 2017. Interest expense in fiscal 20142017 increased approximately $0.3$0.2 million compared to fiscal 20132016 on marginally higher average debt balances.discounts earned through our participation in state tax prepayment programs; anddiscounts; oil and gas royalty income; and dining card sales discounts. 20152017 and $1.1income of approximately $0.2 million in fiscal 2014. The decrease was2016. Other income (expense), net, increased approximately $0.8 million in fiscal 2018 compared to fiscal 2017 primarily related to (1) an increase in discountsthe fair value of our interest rate swap; and (2) higher net rental income; partially offset by (3) greater gift card related expense and comparison to sale of pre-paida fiscal 2017 reduction in our gift cards.card liability. Other income (expense), net, wasdecreased approximately $1.0$0.6 million in fiscal 2013.benefitprovision related to continuing operations for fiscal 20152018 was approximately $1.1$7.7 million compared to an income tax benefitprovision of approximately $1.7$2.4 million for fiscal 2014.2017 and an income tax provision of approximately $4.9 million for fiscal 2016. The income tax benefitprovision in fiscal 20152018, reflects the impact of U.S. tax effectreform that is commonly referred to as Tax Cuts and Jobs Act (the "Tax Act"), of $3.2 million in deferred income taxes, and additional $4.1 million of deferred income tax provision including a valuation allowance increase and $0.4 million of current state income taxes. The income tax provision in fiscal 2017 reflects recording a deferred tax asset valuation allowance of $9.5 million partially offset by recording a tax benefit related to the pre-tax loss for the year adjusted for state income taxes and general business tax credits. The income tax provision in fiscal 2016 reflects recording a deferred tax asset valuation allowance of $6.9 million partially offset by recording a tax benefit related to the pre-tax loss for the year adjusted for state income taxes, and general business and foreign tax credits.incomeeffective tax expense related torate ("ETR") from continuing operations was a negative 30.6%, a negative 12.0%, and a negative 90.4% for fiscal 20132018, 2017, and 2016, respectively. The Tax Act lowered the federal statutory tax rate from 35% to 21% effective January 1, 2018. In accordance with the application of IRC Section 15, the Company's federal statutory tax rate for fiscal 2018 was $1.8 million.25%, representing a blended tax rate for the current fiscal year. The ETR for the year ended August 29, 2018 differs from the blended federal statutory rate of 25%, due to the change in valuation allowance, the impact upon enactment of the Tax Act, the federal job credits, state income taxes, and other discrete items. The ETR for the year ended August 30, 2017 and the year ended August 31, 2016 differs from the federal statutory rate of 34% due to the change in valuation allowance, federal jobs credits, state income taxes and other discrete items. August 29, 2018 August 30, 2017 August 31, 2016 (52 weeks) (52 weeks) (53 weeks) Discontinued operating losses $ (21 ) $ (28 ) $ (161 ) Impairments (59 ) — — Gains — — 25 Pretax loss $ (80 ) $ (28 ) $ (136 ) Income tax benefit (expense) from discontinued operations (534 ) (438 ) 46 Loss from discontinued operations, net of income taxes $ (614 ) $ (466 ) $ (90 ) Discontinued Operations ($000s)
2015
2014
2013 $ (1,135 $ (1,608 $ (1,268 (90 (1,199 (663 117 (6 5 $ (1,108 $ (2,813 $ (1,926 406 979 540 $ (702 $ (1,834 $ (1,386 $0.7approximately $0.6 million in fiscal 20152018 compared to a loss of $1.8approximately $0.5 million in fiscal 2014.2017 and a loss of approximately $0.1 million in fiscal 2016. The loss of $0.7approximately $0.6 million in fiscal 20152018 included (1) $1.1less than $0.1 million in “carrying costs” (typically rent, property taxes, utilities, and maintenance) associated with assets that were related to discontinued operations; (2) less than $0.1 million impairment charges of approximately $0.1 million for certain assets related to discontinued operations; and (3) approximatelyan approximate $0.5 million income tax provision related to increasing the deferred tax asset valuation allowance associated with discontinued operations. The loss of $0.5 million in fiscal 2017 included (1) less than $0.1 million gain on sale of assetin “carrying costs” associated with assets that were related to discontinued operations; offset by (4) aoperations and (2) an approximate $0.4 million income tax benefitprovision related to increasing the deferred tax asset valuation allowance associated with discontinued operations. The loss of $1.8approximately $0.1 million in fiscal 20142016 included (1) $1.6approximately $0.2 million in “carrying costs” (typically rent, property taxes, utilities, and maintenance)carrying costs associated with assets that were related to discontinued operations; partially offset by (2) impairment chargesa less than $0.1 million gain on sale of $1.2 million for certain assets that were related to discontinued operations; offset byand (3) a $1.0less than $0.1 million income tax benefit related to discontinued operations. The loss of $1.4 million in fiscal 2013 included (1) $1.3 million in “carrying costs” (typically rent, property taxes, utilities, and maintenance) associated with assets that were related to discontinued operations; (2) impairment charges of $0.6 million for certain assets related to discontinued operations; offset by (3) a $0.5 million income tax benefit related to discontinued operations.General.Our primary sources of short-term and long-term liquidity are cash flows from operations and our revolving credit facility.decreasedincreased approximately $1.3$2.6 million as of the end of fiscal 20152018 compared to the end of fiscal 2014.2017. Cash provided by operatinginvesting activities of approximately $10.3$3.0 million and cash provided by financing activities of approximately $8.1 million was offset by cash used in operating activities of approximately $8.5 million.$7.0$3.2 million in fiscal 2017. Cash flows from financing activities was a source of cash, in fiscal 2018, of approximately $8.1 million and cash used in financing activitiesan increase of approximately $4.6 million.Cash flow$14.7 million from operations was favorably impacted by increased restaurant salesthe use of cash of approximately $6.6 million in fiscal 2015 compared2017. Our total outstanding debt increased to approximately $39.5 million at the end of fiscal 2014 but unfavorably impacted by increased cost2018 from approximately $31.0 million at the end of food, payroll and related costs and other operating costs. We decreased our net borrowings from our revolving credit facility in fiscal 2015 compared to fiscal 20142017 primarily due to decreasesthe use of cash and decline in our capital expenditurescash provided by operating activities before changes in operating assets and the utilizationliabilities of netapproximately $12.3 million partially offset by proceeds from property sales. We plan to continue the level of capital expenditures necessary to keep our restaurants attractive and operating efficiently.increaseddecreased approximately $1.3$0.2 million as of the end of fiscal 20142017 compared to the end of fiscal 2013.2016. Cash provided by operating activities of approximately $20.4 million and cash provided by financing activities of $22.9$9.6 million was offset by cash used in investing activities of approximately $42.0$3.2 million and cash used in financing activities of approximately $6.6 million.increased total revenue in fiscal 2014 compared to fiscal 2013 but unfavorably impacted by increaseddecreased cost of food, payroll and related costs, occupancy costs and other operatingoccupancy costs. We increaseddecreased our net borrowings from our revolving credit2016 Credit facility in fiscal 20142017 compared to fiscal 20132016 primarily due to increasesdecreases in our capital expenditures. We plan to continueexpenditures and proceeds on the levelsale of capital expenditures necessary to keep our restaurants attractive and operating efficiently.20152018 consisted principally of:●payments to reduce our debt;●capital expenditures for construction, restaurant renovations and upgrades, information technology and culinary contract services development; and●working capital primarily for our company-owned restaurants and culinary contract services agreements.for culinary contract servicesin our CCS business segment and franchises.Franchise Operations business segment. We also continually invest in our business through the addition of new restaurant units and refurbishment of existing restaurant units, which are reflected as long-term assets.
2015
2014
2013 $ 10,316 $ 20,439 $ 29,442 (7,043 (42,031 (35,467 (4,560 22,852 6,330 $ (1,287 $ 1,260 $ 305 Fiscal Year Ended August 29, 2018 August 30, 2017 August 31, 2016 (52 weeks) (52 weeks) (53 weeks) (In thousands) Total cash provided by (used in): Operating activities $ (8,453 ) $ 9,640 $ 13,859 Investing activities 3,014 (3,216 ) (13,442 ) Financing activities 8,065 (6,667 ) (579 ) Increase (Decrease) in cash and cash equivalents $ 2,626 $ (243 ) $ (162 ) $20.4$9.6 million in fiscal 20142017 to a use of cash of approximately $10.3$8.5 million in fiscal 2015.2018. The $10.1$18.1 million decrease in operating cash provided by operating activitiesflow was primarily due to a $0.3an approximate $12.3 million decrease in cash provided by operations before changes in operating assets and liabilities and a $9.8an approximate $5.8 million decreaseincrease in cash provided byused in changes in operating assets and liabilities.$0.3$12.3 million decrease in cash provided by operating activities before changes in operating assets and liabilities was primarily due to a $1.0uses of cash from an approximate $12.0 million decrease total in company-owned restauranttotal segment level profit, $1.1an approximate $0.9 million increase in interest expense, an approximate $0.2 million increase in discounts on the sale of gift cards, and an approximately $0.1approximate $0.2 million decrease in CCS segment level profitsales tax discounts as a result of discontinuing the prepayment of certain sales taxes partially offset $1.9by a source of cash of an approximate $1.0 million decreaseincrease in selling, general and administrative expenses.$9.8$5.8 million decreaseincrease in cash provided byused in changes in operating assets and liabilities was primarily due to approximately $9.2an approximate $7.7 million decrease in the change of accounts payable, accrued expenses and other liabilities, approximately $1.2partially offset by an approximate $1.3 million increasedecrease in prepaid expenses and other liabilities and approximately $1.0 million increase inthe change of trade accounts receivable and other receivables, offset by approximately $1.6an approximate $0.3 million decrease in the change of food and supply inventories, and an approximate $0.3 million decrease in the change of prepaid expenses and other assets, in fiscal 20152018 compared to fiscal 2014.$29.4approximately $13.8 million in fiscal 20132016 to $20.4approximately $9.6 million in fiscal 2014.2017. The $9.0$4.2 million decrease in cash flow fromprovided by operating activities was primarily due to approximately $7.2an approximate $8.3 million decrease in cash provided by operations before changes in operating assets and liabilities and approximately $1.8offset by an approximate $4.1 million decrease in cash provided byused in changes in operating assets and liabilities.culinary contract services. Cash used by investing activities was approximately $7.0 million in fiscal 2015 compared to cash used in investing activities of approximately $42.0 million in fiscal 2014. In fiscal 2015, proceeds from disposal of assets and property held for sale was $13.3 million including $1.6 million related to discontinued operations. In fiscal 2015, purchases of property and equipment was approximately $20.4 million, including $19.7 million in capital expenditures related to company-owned restaurants and $0.7 million in corporate related capital expenditures. Company-owned restaurant capital expenditures included purchases of new equipment and new restaurant construction.CCS. Our capital expenditure program includes, among other things, investments in new restaurants, restaurant remodeling, and information technology enhancements. Company-owned restaurant capital expenditures included purchases of new equipment, restaurant renovations and upgrades and new restaurant construction.usedprovided by investing activities was approximately $42.0$3.0 million in fiscal 20142018, an increase of approximately $6.2 million compared to cash used in investing activities of approximately $35.5$3.2 million in fiscal 2013. In fiscal 2014,2017, primarily due to the proceeds from disposal of assets and property held for sale and proceeds from property and equipment insurance claims. We invested approximately $13.2 million in the purchase of property and equipment in fiscal 2018, an increase of $0.7 million from our investment of approximately $12.5 million in fiscal 2017. Proceeds from disposal of assets and property held for sale was approximately $4.1$14.2 million including $0.4in fiscal 2018, an increase of $4.9 million from proceeds of approximately $9.3 million in fiscal 2017. Proceeds on property and equipment insurance claims of approximately $2.1 million was a source of cash in fiscal 2018. The purchases of property and equipment of approximately $13.2 million in fiscal 2018 included approximately $11.1 million in capital expenditures related to discontinued operations.Company-owned restaurants, approximately $1.9 million in corporate related capital expenditures, and approximately $0.2 million in Culinary Contract Services. The purchases of property and equipment of approximately $12.5 million in fiscal 2017 included $11.4 million in capital expenditures related to Company-owned restaurants and $1.1 million in corporate related capital expenditures.2014,2017, proceeds from disposal of assets and property held for sale was approximately $9.3 million. In fiscal 2017, purchases of property and equipment was approximately $46.2$12.5 million, including $42.5$11.4 million in capital expenditures related to company-ownedCompany-owned restaurants $3.6and approximately $1.1 million in corporate related capital expenditures and $0.1 million in capital expenditures related to CCS. Company-owned restaurant capital expenditures included purchases of new equipment and new restaurant construction. Our capital expenditure program includes, among other things, investments in new restaurants and CCS locations, restaurant remodeling, and information technology enhancements. used in financing activities was approximately $4.6 million in fiscal 2015 and in fiscal 2014 cash provided by financing activities was approximately $22.9$8.1 million in fiscal 2018, an increase of $14.7 million from cash used in financing activities of approximately $6.6 million in fiscal 2017. Cash flows from financing activities was primarily the result of borrowings and repayments related to the 2016 Credit facility, as amended; our Revolver and our Term Loan. During fiscal 2018, cash provided by Revolver borrowings was approximately $15.6 million, our Term Loan repayments was approximately $7.0 million, cash used for debt issuance costs was approximately $0.4 million, and cash used for equity shares withheld to cover taxes was approximately $0.1 million.2015,2017, we decreased debt from $42.0$37.0 million at August 27, 2014the end of fiscal 2016 to $37.5$31.0 million at August 26, 2015.the end of fiscal 2017. In fiscal 2015,2017, we paid approximately $0.3 million$652 thousand in debt issuance costs and received approximately $0.2 million in proceeds from the exercise of employee stock options.In fiscal 2014 we increased debt from $19.2 million at August 28, 2013 to $42.0 million at August 27, 2014. In fiscal 2014, we paid approximately $0.1 million in debt issuance costs and received approximately $0.1 million in proceeds from the exercise of employee stock options.Status of Long-Term Investments and Liquidity26, 2015,29, 2018, we did not hold any long-term investments.Status of Trade Accounts and Other Receivables, NetWorking CapitalCurrentdecreased $0.8increased approximately $2.8 million including a $1.3an increase of approximately $2.6 million decrease in cash. Trade accounts and other receivables increased approximately $1.7 million while insurance receivables, food and supply inventory, and prepaid expenses increased $1.1decreased approximately $0.9 million, $0.4 million and $0.5$0.2 million, respectively. Food and supply inventories decreased $1.1 million. The $1.1$1.7 million increase in trade accounts and other receivables was primarily due to increases in receivables related to our culinary contract services. The $0.5$0.9 million increasedecrease in prepaid expenses was primarily dueinsurance receivables related to prepayment of sales taxes and discountsinsurance proceeds received on the sale of gift cards.two properties damaged by flooding during Hurricane Harvey. The $1.1$0.4 million decrease in food and supply inventory was primarily due to a reduction inlower spending for restaurant supplies.Current liabilities decreased $5.6 million due to a $6.1supplies and food supplies on lower sales volumes and the $0.2 million decrease in accounts payableprepaid expenses was primarily due to reduction in prepayments of expenses.$0.5 million.approximately $39.3 million in Credit facility debt was due to the reclassification of Credit facility debt from long-term to short-term due to the maturity of the loans on May 1, 2019 and the approximate $3.3 million increase in accrued expenses and other liabilities is primarily a result of lease termination costs reserves of approximately $1.5 million, self-insured medical claims reserves of approximately $0.9 million, accrued salaries and incentives of approximately $0.7 million, accrued professional fees of approximately $0.4 million, insurance claims of approximately $0.4 million, accrued interest expense of approximately $0.3 million, worker's compensation claims reserves of approximately $0.2 million, and accrued travel costs of approximately $0.1 million, partially offset by decreases in deferred income taxes of approximately $0.4 million, accrued property taxes of approximately $0.2 million, accrued legal and professional fees of approximately $0.1 million, and unredeemed gift cards of approximately $0.1 million, The $6.1$5.4 million decrease in accounts payable was due to a $1.5an approximate $1.9 million decrease in checks in transit, an approximate $3.2 million decrease in trade payables, and a $4.6an approximate $0.3 million decrease in accrued purchases. The increase of $0.5 million in accrued expenses and other liabilities is a result of increases in unredeemed gift cards of $1.3 million, taxes other than income taxes of $0.6 million partially offset by decreases in accruals for expenses in salaries and incentives of $1.1 million and income taxes, legal and other of $0.3 million.CApital Expenditures20152018 were approximately $20.4$13.2 million consisting of (1) approximately $1.1 million in information technology infrastructure maintenance and upgrade projects; (2) approximately $2.1 million in the rebuilding and refurbishing and updating of restaurants, mostly related primarily to existing restaurant remodels,restorations after hurricane and flood damage incurred in August 2017; and (3) approximately $10.0 million in recurring capital expenditures. In fiscal 2019, we expect to invest up to $8.0 million for recurring maintenance offor our existing units, investments in newrestaurant properties and information technology and new restaurant construction.investments. We expect to be able to fund all capital expenditures in fiscal 20162019 using cash flows from operations, proceeds from the sale of assets, and our available credit. In fiscal year we expect to invest less than $20.0 million, excluding the purchase of land for development, and not to exceed $25.0 million in capital expenditures.DEBTRevolving Credit FacilityIn August 2013, we entered into a $70.0$65.0 million revolving credit facilitySenior Secured Credit Facility with Wells Fargo Bank, National Association, as Administrative Agent and AmegyCadence Bank, National Association,NA and Texas Capital Bank, NA, as Syndication Agent. The following description summarizes the material terms of the revolving credit facility, as subsequently amended on March 21, 2014, November 7, 2014 and October 2, 2015, (the revolving credit facility is referred to as the “2013lenders (“2016 Credit Facility”Agreement”). The 20132016 Credit FacilityAgreement, prior to amendments discussed below, is governed by the credit agreement dated ascomprised of August 14, 2013a $30.0 million 5-year Revolver (the “2013 Credit Agreement”“Revolver”) among us, the lenders from time to time party thereto, Wells Fargo Bank, National Association, as Administrative Agent, and Amegy Bank, National Association, as Syndication Agent.a $35.0 million 5-year Term Loan (the “Term Loan”). The maturity date of the 20132016 Credit FacilityAgreement is September 1, 2017.2013Term Loan and/or Revolver commitments may be increased by up to an additional $10 million in the aggregate.FacilityAgreement also provides for the issuance of letters of credit in a maximuman aggregate amount equal to the lesser of $5.0 million outstandingand the Revolving Credit Commitment, which was $30 million as of August 14, 2013 and $15.0 million outstanding at any one time with prior written consent of the Administrative Agent and the Issuing Bank. At August 26, 2015, under the 2013November 8, 2016. The 2016 Credit Facility, the total available borrowing capacity was up to $30.7 million after applying the Lease Adjusted Leverage Ratio limitation.Pursuant to the October 2, 2015 amendment, the total aggregate amount of the lenders’ commitments was lowered to $60.0 million from $70.0 million. After applying the Lease Adjusted Leverage Ratio Limitation, the available borrowing capacity was $20.7 million.The 2013 Credit FacilityAgreement is guaranteed by all of our present subsidiaries and will be guaranteed by our future subsidiaries. In addition to the bank’s increased commitment under the 2013 Credit Agreement, it may be increased to a maximum commitment of $90.0 million.20132016 Credit Facility,Agreement, we have the option to elect one of two basisbases of interest rates. One interest rate option is the greaterhighest of (a) the Prime Rate, (b) the Federal Funds Effective Rate plus 0.50% and (c) 30-day LIBOR plus 1%, or (b) prime, plus, in eithereach case, an applicable spread thatthe Applicable Margin, which ranges from 0.75%1.50% to 2.25%2.50% per annum. The other interest rate option is LIBOR plus the London InterBank Offered Rate plus a spread thatApplicable Margin, which ranges from 2.50% to 4.00%3.50% per annum. The applicable spreadApplicable Margin under each option is dependent upon the ratio of our debt to EBITDAConsolidated Total Lease Adjusted Leverage Ratio ("CTLAL") at the most recent quarterly determination date.0.40%0.35% per annum depending on the Total Leverage RatioCTLAL at the most recent quarterly determination date.20132016 Credit FacilityAgreement are available for our general corporate purposes and general working capital purposes and capital expenditures.Borrowingsus to (i) pay in full all indebtedness outstanding under the 2013 Credit Facility are subject to mandatoryAgreement as of November 8, 2016, (ii) pay fees, commissions, and expenses in connection with our repayment with the proceeds of sales of certain of our real property, subject to certain exceptions.The 2013 Credit Facility is secured by a perfected first priority lien on certain of our real property and all of the material personal property owned by us or any of our subsidiaries, other than certain excluded assets (as defined in the Credit Agreement). At August 26, 2015, the carrying value of the collateral securing the 2013 Credit Facility was $116.7 million.20132016 Credit Agreement, as amended, contains the following covenants among others:●Debt Service Coverage Ratio of not less than (i) 1.10 to 1.00 at all times during the first, second and third fiscal quarters of the Borrower’s fiscal year 2015, (ii) 1.25 to 1.00 at all times during the fourth fiscal quarter of the Borrower’s fiscal year 2015, and (iii) 1.50 to 1.00 at all times thereafter.●Lease Adjusted Leverage Ratio of not more than (i) 5.75 to 1.00 at all times during the first, second and third fiscal quarters of the Borrower’s fiscal year 2015, (ii) 5.50 to 1.00 at all times during the fourth fiscal quarter of the Borrower’s fiscal year 2015, (iii) 5.25 to 1.00 at all times during the first fiscal quarter of the Borrower’s fiscal year 2016, (iv) 5.00 to 1.00 at all times during the second fiscal quarter of the Borrower’s fiscal year 2016, and (v) 4.75 to 1.00 at all times thereafter.●capital expenditures limited to $25.0 million per year, ●restrictions on incurring liens on certain of our property and the property of our subsidiaries,●restrictions on transactions with affiliates and materially changing our business,●restrictions on making certain investments, loans, advances and guarantees,●restrictions on selling assets outside the ordinary course of business,●prohibitions on entering into sale and leaseback transactions,●restrictions on certain acquisitions of all or a substantial portion of the assets, property and/or equity interests of any person, including share repurchases and dividends.At February 12, 2014,resultCTLAL is at least 0.25X less than the then-applicable permitted maximum CTLAL,losses incurred fromdividends, redemption of stock, and other distributions,recently acquired leaseholds operating as Cheeseburger in Paradise restaurants, we reportedproperty and the property of our second consecutive quarterly net profit belowsubsidiaries,required minimum net profit as defined inbusiness,credit agreement. As partordinary course of business,March 21, 2014 amendment we received a waiverassets, property and/or equity interests of non-compliance related to this minimum consecutive quarterly net profit debt covenant for the second quarter fiscal 2014. any person, including share repurchases and dividends.November 2014 amendment revised the net profit, debt service, lease adjusted leverage ratio, borrowing rates, provided for a $25.0 million annual capital expenditure limit, and required liens to be perfected on2016 Credit Agreement is secured by substantially all real property by January 31, 2015. As part of the October 2, 2015 amendment,personal property, including without limitation the Net Profit – Two Consecutive Quarters covenant was removed.We wereequity interest in compliance with the covenants contained in the 2013 Credit Agreement as amended aseach of August 26, 2015.20132016 Credit Agreement also includes customary events of default. If a default occurs and is continuing, the lenders’ commitments under the 20132016 Credit FacilityAgreement may be immediately terminated and/or we may be required to repay all amounts outstanding under the 20132016 Credit Facility.◦ LIBOR + 4.50% April 20, 2018 - June 30, 2018 ◦ LIBOR + 4.75% July 1, 2018 - September 30, 2018 ◦ LIBOR + 5.00% October 1, 2018 - December 31, 2018 ◦ LIBOR + 5.25% January 1, 2019 - March 31, 2019 ◦ LIBOR + 5.50% April 1, 2019 - Maturity Date ◦ 100 basis points less than the Applicable Margin for LIBOR Rate Loans 26, 2015,29, 2018, under the 2016 Credit Agreement, we had $37.5$39.5 million in total outstanding loans and $1.1approximately $1.3 million committed under letters of credit, which were issuedis used as security for the payment of insurance obligations, and $0.7approximately $0.2 million in capital lease commitments.restaurants.restaurants and restaurant remodels. This construction activity exposes us to the risks inherent in new constructionthis industry including but not limited to rising material prices, labor shortages, delays in getting required permits and inspections, adverse weather conditions, and injuries sustained by workers.26, 2015,29, 2018, we had contractual obligations and other commercial commitments as described below:
5 Years $ 37,500 $ — $ 37,500 $ — $ — 750 459 291 — — 62,657 11,996 16,971 11,844 21,846 63 63 — — — $ 100,970 $ 12,518 $ 54,762 $ 11,844 $ 21,846
2016
2017-2018
2018-2019 $ 1,085 $ 1,085 $ — $ — $ — Payments due by Period Contractual Obligations Total 1-3 Years 3-5 Years (In thousands) Revolver $ 20,000 $ 20,000 $ — $ — $ — Term Loan 19,506 19,506 — — — 201 64 132 5 — 52,815 10,790 15,464 9,921 16,640 25 25 — — — Total $ 92,547 $ 50,385 $ 15,596 $ 9,926 $ 16,640 Amount of Commitment by Expiration Period Other Commercial Commitments Total Thereafter (In thousands) Letters of credit $ 1,287 $ 1,287 $ — $ — $ — (a)Long-term debt consists of amounts owed on the 2013CreditFacility.(b)for equipment ranging from one to two years and note relating to Fuddruckers Tulsa purchase plus interestnotes on note.(c)(2) Operating lease obligations contain rent escalations and renewal options ranging from one to twenty-five years. (d)(3) The timing and amounts of future cash payments related to these liabilities are uncertain. 26, 201529, 2018 included amounts accrued for benefit payments under our supplemental executive retirement plan of $0.1 million,$39 thousand, accrued non-cash compensation of $0.1 million,approximately $21 thousand, accrued insurance reserves of $0.8approximately $1.0 million, and deferred rent liabilities of $2.6approximately $2.1 million.maycontinue to provide specialized (customized) equipment fabrication, primarily for new construction, and basic equipment maintenance, including stainless steel stoves, shelving, rolling carts, and chef tables. The total costs under the Amended and Restated Master Sales Agreement of custom-fabricated and refurbished equipment were zero, $4,000, and zero in fiscal 2015, 20142018, 2017, and 2013,2016 were approximately $31 thousand, $4 thousand, and $2 thousand, respectively. The Company also incurred $2 thousand of other operating expenses in fiscal 2018 from the Pappas entities. Services provided under this agreement are subject to review and approval by the Finance and Audit Committee of ourthe Company’s Board of Directors.the fiscal year 2004, Messrs. Pappas became partners in a limited partnership which purchased a retail strip center in Houston, Texas. Messrs. Pappas collectively own a 50% limited partner interest and a 50% general partner interest in the limited partnership. An independentA third party company manages the center. One of the Company’s restaurants has rented approximately 7% of the space in that center since July 1969. No changes were made to the Company’s lease terms as a result of the transfer of ownership of the center to the new partnership. due to the approaching expiration of the previous lease, the Company executed a new lease agreement with respect to this property, which provides, effectiveproperty. Effective upon the Company’s relocation and occupancy into the new space in July 2008, the new lease agreement provides for a primary term of approximately 12 years with two subsequent five-year options. The new lease also givesgave the landlord an option to buy out the tenant on or after the calendar year 2015 by paying the then unamortized cost of improvements to the tenant. The Company is currently obligated to paypaid rent of $22.00 per square foot plus maintenance, taxes, and insurance for the remaining primary term of the lease. Thereafter, the lease provides for reasonable increases in rent at set intervals. The Company has made payments of approximately $416,000, $388,000$460 thousand, $419 thousand, and $425,000 during$417 thousand, in fiscal years 2015, 20142018, 2017, and 2013,2016, respectively. The new lease agreement was approved by the Finance and Audit Committee of our Board of Directors.the fiscal year 2014, on March 12, 2014, the Company executed a new lease agreement whichfor one of the Company’s Houston Fuddruckers location was purchased from a prior landlord bylocations with Pappas Restaurants, Inc., a 100% undivided interest. No changes were made to our lease terms as a result of the transfer of ownership. The lease provides for a primary term of approximately 6six years with two subsequent five-year options. Pursuant to the new ground lease agreement, the Company is currently obligated to pay $27.56paid $28.06 per square foot plus maintenance, taxes, and insurance from March 12, 2014 until November 30, 2016.May 31, 2020. Thereafter, the new ground lease agreement provides for reasonable increases in rent at set intervals. The Company made payments of $159,900$168 thousand, $162 thousand, and $79,950 during$160 thousand, in fiscal years 20152018, 2017, and 2014,2016, respectively.2.1% and 2.0%2.6% of the total rents for continuing operations in fiscal 2015, 20142018, 2017, and 2013,2016, respectively.selling,Selling, general and administrative expenses, and other operating expenses included in continuing operations:
2015
2014
2013 $ 1 $ — $ 46 — 4 — 576 468 425 $ 577 $ 472 $ 471 $ 38,758 $ 40,686 $ 36,123 20,378 46,184 31,339 86,753 85,745 81,448 $ 145,889 $ 172,615 $ 148,910 0.40 0.27 0.32 August 29,
2018 August 30,
2017 August 31,
2016 (364 days) (364 days) (371 days) (In thousands, except percentages) AFFILIATED COSTS INCURRED: Selling, general and administrative expenses—professional and other costs $ — $ 1 $ 1 Capital expenditures—custom-fabricated and refurbished equipment 31 4 2 Other operating expenses, occupancy costs and opening costs, including property leases 628 581 577 Total $ 659 $ 586 $ 580 RELATIVE TOTAL COMPANY COSTS: Selling, general and administrative expenses $ 38,725 $ 37,878 $ 42,422 Capital expenditures 13,247 12,502 18,253 Other operating expenses, occupancy costs and opening costs 83,239 84,203 84,122 Total $ 135,211 $ 134,583 $ 144,797 AFFILIATED COSTS INCURRED AS A PERCENTAGE OF RELATIVE TOTAL COMPANY COSTS 0.49 % 0.44 % 0.40 % December 1, 2014,August 2, 2017, to extend the termination date thereof to August 31, 2016, unless earlier terminated.29, 2018. The employment agreement was restated on December 11, 2017 to extend the termination date thereof to August 28, 2019. Mr. Pappas continues to devote his primary time and business efforts to the Company while maintaining his role at Pappas Restaurants, Inc. The Employment Agreement was unanimously approved by the Executive Compensation Committee (the “Committee”) of the Board as well as by the full Board.On January 25, 2013, the Board approved the renewal of a consultant agreement with Ernest Pekmezaris, the Company’s former Chief Financial Officer. Under the agreement, Mr. Pekmezaris furnished to Effective August 1, 2018, the Company advisory and consulting services relatedChristopher J. Pappas agreed to finance and accounting matters and other related consulting services. The agreement expired on July 31, 2013. Mr. Pekmezaris is also the Treasurer of Pappas Restaurants, Inc. Compensation for the services provided by Mr. Pekmezarisreduce his fixed annual base salary to Pappas Restaurants, Inc. is paid entirely by that entity.oura director of the Company served as the Company's Chief Operating Officer a member of our Board, and formerly our Senior Vice President, Administration,until October 22, 2018. On October 22, 2018, he was appointed as General Counsel and Secretary, which was a role he formerly served. He continues to serve as a director of the Company. He is an attorney and stepson of Frank Markantonis, who is a director of Luby’s, Inc.Luby’s, Inc.Income Taxesprojected future taxable income,and existing business conditions, including amendment to our credit agreement(s) to avoid default and results of recent operations.Positivethat we consider includesduring the third quarter of fiscal 2018, in connection with our response to a default in certain of the Company’s historyCredit Agreement financial covenants, a condition that raised substantial doubt as to the Company continuing as a going concern for a reasonable period of realizing fullytime. This circumstance and its tax NOL and tax credit carryovers prior to expiration andadded negative evidence, supported management’s conclusion that a full valuation allowance on the considered use of tax-planning strategies. The latter includes the acceleration of unrealized gains from our owned property locations through sale or exchange, if and when necessary on a selective basis, which we consider to be a significant piece of positive evidence. We regularly evaluate our portfolio owned properties, long-lived assets and their relative values, for many different business purposes, and have estimated the resulting unrealizedCompany’s net gains thereon to be of sufficient measure to recover our deferred tax assets includingin the amount of $25.3 million was necessary during the third quarter of fiscal 2018. Management's conclusion for a full valuation allowance reduces fully the Company’s net deferred tax NOL and tax credit carryovers. Assessments regarding our owned property locations involve the usebalances, net of significant judgment and are consistent with the plans and estimates we are using to manage the underlying businesses. Tax-planning strategies involving the acceleration of unrealized gains, as well as the reversals of our deferred tax liabilities, arethrough and including the fiscal year ended August 29, 2018.same character and should reverse in both the same period and jurisdiction as the temporary differences giving rise to the deferred tax. In evaluating negative evidence, we consider three years of cumulative operating income (loss). A significant contributor to the Company’s three year cumulative loss involves a number of underperforming locations, principally all of which have been disposed of under the Company’s disposal plan.The Company has recorded a deferred tax assetassets, excluding the offsetting impact of $10.8the valuation allowance, includes income tax NOL’s and tax credits of approximately $16.5 million, reflecting the benefit of $0.8approximately $4.4 million inrelating to income tax NOLNOL’s and $10.0$12.1 million relating to tax credit carryover, which expire in varying amounts between fiscal year 2022 through 2034. Realization2038. At this time, the management is uncertain as to the realization of these deferred tax assets, which is otherwise dependent on generatingnumerous factors, including our ability to generate sufficient taxable income prospectively, and if necessary gain on sale of owned property locations, prior to expiration of the tax NOLNOL’s and tax credit carryovers. Although realization is not assured, management believes it is more likely than not that all of the deferred tax asset will be realized. The amount of the deferred tax asset considered realizable, however, could be reduced in the near term if estimates of unrealized appreciation of owned properties during the carryforward period are reduced or we are unable to generate positive cash flows from operations and proceeds from assets held for sale. Tangible Property RegulationsIn September 2013, the U.S. Treasury issued final regulations addressing the tax consequences associated with the acquisition, production and improvement of tangible property and which are generally effective for taxable years beginning on or after January 1, 2014, which for the Company is its year beginning August 28, 2014. We believe our accounting policies comply with the requirements of the repair regulations and there is no materials impact on our Consolidated Financial Statements.179142 restaurants as of November 3, 20157, 2018 and periodically experience unanticipated changes in our assumptions and estimates. Those changes could have a significant impact on discounted cash flow models with a corresponding significant impact on the measurement of an impairment. Gains are not recognized until the assets are disposed.Share-Based CompensationPrior to January 1, 2018, employee health insurance coverage was offered through fully-insured contracts with insurance carriers and the liability for covered health claims was borne by the insurance carriers per the terms of each policy contract. Effective January 1, 2018, we maintain a self-insured health benefit plan which provides medical and prescription drug benefits to certain of our employees electing coverage under the plan. Our exposure is limited by individual and aggregate stop loss limits per 3In July 2012,Accounting Standards Board (”FASB”) issued Accounting Standards Update (“ASU”) No. 2012-02, Testing Indefinite-Lived Intangible AssetsStatements for Impairment (Topic 350). This pronouncement was issued to simplify how entities test for impairmenta discussion of indefinite-lived intangible assets. Under this pronouncement, an entity has the option first to assess qualitative factors to determine whether it is more likely thanrecent accounting guidance adopted and not that an indefinite-lived intangible asset is impaired. In conclusion of this assessment, if an entity finds that it is not more likely that not than an indefinite-lived intangible asset is impaired, then the entity is not required to take further action. However, if an entity concludes otherwise, then it is required to determine the fair value of the indefinite-lived intangible asset and perform the quantitative impairment test by comparing the fair value with the carrying amountyet adopted. The adopted accounting guidance discussed in accordance with Accounting Standards Codification (“ASC”) Topic 350, “Intangibles—Goodwill and Other.” This pronouncement is effective for annual and interim impairment tests performed for fiscal years beginning after September 15, 2012 with early adoption permitted. The adoption of this pronouncementNote 1 did not have a materialsignificant impact on our consolidated financial position or results of operations. The Company either expects that the accounting guidance not yet adopted will not have a significant impact on the Company’s consolidated financial statements.In February 2013, the FASB issued ASU No. 2013-02, Comprehensive Income (Topic 220), which updated guidance amending the reportingposition or results of amounts reclassified out of accumulated other comprehensive income. These amendments do not change the current requirements for reporting net incomeoperations or other comprehensive income in the financial statements. However, the guidance requires an entity to provide information about the amounts reclassified out of accumulated other comprehensive income by component, either on the face of the financial statement where net income is presented or in the notes to the financial statements. This guidance is effective for fiscal periods beginning after December 15, 2012, and is to be applied prospectively. The adoption of this pronouncement did not have a material impact on the Company’s consolidated financial statements.In February 2013, the FASB issued ASU No. 2013-04, Liabilities (Topic 405), which provides guidance for the recognition, measurement and disclosure of obligations resulting from joint and several liability arrangements for which the total amount of the obligation within the scope of this guidance is fixed at the reporting date. Examples of obligations within this guidance are debt arrangements, other contractual obligations and settled litigation and judicial rulings. The pronouncement is effective for fiscal years and interim periods within those fiscal years, after December 15, 2013. The adoption of this pronouncement did not have a material impact on the Company’s consolidated financial statements.In April 2013, the FASB issued ASU No. 2013-007, Liquidation Basis of Accounting (Topic 205), which requires a company to prepare its financial statements using liquidation basis of accounting (LBA) when liquidation is imminent. The pronouncement is effective for entities that determine liquidation is imminent during annual reporting periods beginning after December 15, 2013. The adoption of this pronouncement did not have a material impact on the Company’s consolidated financial statements.In July 2013, the FASB issued ASU No. 2013-11, Income Taxes (Topic 740), which provides that an unrecognized tax benefit, or a portion thereof, should be presented in the financial statements as a reduction to a deferred tax asset for a net operating loss carryforward, a similar tax loss or a tax credit carryforward, except to the extent that a net operating loss carryforward, a similar tax loss or a tax credit carryforward is not available at the reporting date to settle any additional income taxes that would result from disallowance or a tax provision or the tax law does not require the entity to use and the entity does not intend to use the deferred tax asset for such purposes, then the unrecognized tax benefit should be presented as a liability. The pronouncement is effective for fiscal years and interim periods within those fiscal years, after December 15, 2013. The adoption of this pronouncement did not have a material impact on the Company’s consolidated financial statements.In April 2014, the FASB issued ASU No 2014-08. The amendments in ASU 2014-08 change the criteria for reporting discontinued operations while enhancing disclosures in this area. It also addresses sources of confusion and inconsistent application related to financial reporting of discontinued operations guidance in U.S. GAAP. Under the new guidance, only disposals representing a strategic shift in operations should be presented as discontinued operations. Those strategic shifts should have a major effect on the organization’s operations and financial results. Examples include a disposal of a major geographic area, a major line of business, or a major equity method investment. In addition, the new guidance requires expanded disclosures about discontinued operations that will provide financial statement users with more information about the assets, liabilities, income, and expenses of discontinued operations. The pronouncement is effective for fiscal years and interim periods within those fiscal years, after December 31, 2015. We arecurrently evaluating the impact onof adopting the Company’s consolidated financial statements.In May 2014, the FASB issued ASU 2014-09, Revenue from Contracts with Customers (Topic 606). This update provides a comprehensive new revenue recognition model that requires a company to recognize revenue to depict the transfer of goods or services to a customer at an amount that reflects the consideration it expects to receive in exchange for those goods or services. The guidance also requires additional disclosure about the nature, amount, timing and uncertainty of revenue and cash flows arising from customer contracts. This update is effective for annual and interim periods beginning after December 15, 2016, which will require us to adopt these provisions in the first quarter of fiscal 2018. Early application is not permitted. This update permits the use of either the retrospective or cumulative effect transition method. We are evaluating the effect this guidance will have on our consolidated financial statements and related disclosures. We are evaluating the impact on the Company’s consolidated financial statements and have not yet selected a transition method.In August 2014, the FASB issued ASU No 2014-15. The amendments in ASU 2014-15 are intended to define management’s responsibility to evaluate whether there is substantial doubt about an organization’s ability to continue as a going concern and to provide related footnote disclosures. Under GAAP, financial statements are prepared under the presumption that the reporting organization will continue to operate as a going concern, except in limited circumstances. The going concern basis of accounting is critical to financial reporting because it establishes the fundamental basis for measuring and classifying assets and liabilities. Currently, GAAP lacks guidance about management’s responsibility to evaluate whether there is substantial doubt about the organization’s ability to continue as a going concern or to provide related footnote disclosures. This ASU provides guidance to an organization’s management, with principles and definitions that are intended to reduce diversity in the timing and content of disclosures that are commonly provided by organizations today in the financial statement footnotes. The pronouncement is effective for fiscal years and interim periods within those fiscal years, after December 31, 2016. The adoption of this pronouncement is not expected to have a material impact on the Company’s financial statements.INFLATIONmarketinterest rate risk fromdue to changes in interest rates affecting our variable-rate debt.debt, Term Loan and borrowings under our 2016 Revolver. As of fiscal year-end 2015,2018, the total amount of debt subject to interest rate fluctuations outstanding under our Amended New Credit FacilityRevolver and Term Loan was $37.5approximately $22.0 million. Assuming an average debt balance with interest rate exposure of $37.5approximately $22.0 million, a 1.0%100 basis point increase in prevailing interest rates would increase our annual interest expense by $0.4approximately $0.2 million.We The interest rate on our remaining $17.5 million in outstanding debt is fixed plus an applicable margin based on our CTLAL at each determination date, beginning December 14, 2016, under the terms of our interest rate swap agreement. Under the terms of our 2016 Credit Agreement, we are required to manage interest rate risk, utilizing interest rate swaps, on at least 50% of our 2016 Credit Agreement variable rate debt ("Term Loan"). Prior to November 8, 2016, we did not currently usingutilize any interest rate swaps to manage interest rate risk on our variable-ratevariable rate 2013 Credit Facility debt.0.08% and 0.06%0.14% of our total revenues in 2015, 2014fiscal 2018, 2017, and 2013,2016, respectively, were derived from sales to customers and royalties from franchisees outside the contiguous United States. All of this business is conducted in the local currency of the country the franchise operates. We do not enter into financial instruments to manage this foreign currency exchange risk.dependantdependent on a single vendor for our ingredients. Report of Independent Registered Public Accounting Firm(and subsidiaries)and subsidiaries (the "Company") as of August 26, 201529, 2018 and August 27, 2014, and30, 2017, the related consolidated statements of operations, shareholders’ equity, and cash flows for each of the three years in the period ended August 26, 2015. 29, 2018, and the related notes (collectively referred to as the “financial statements”). In our opinion, the financial statements present fairly, in all material respects, the financial position of the Company as of August 29, 2018 and August 30, 2017, and the results of its operations and its cash flows for each of the three years in the period ended August 29, 2018, in conformity with accounting principles generally accepted in the United States of America.thesethe Company’s financial statements based on our audits.Public Company Accounting Oversight Board (United States).PCAOB. Those standards require that we plan and perform the audit to obtain reasonable assurance about whether the financial statements are free of material misstatement. An audit includesmisstatement, whether due to error or fraud. Our audits included performing procedures to assess the risks of material misstatement of the financial statements, whether due to error or fraud, and performing procedures that respond to those risks. Such procedures included examining, on a test basis, evidence supporting the amounts and disclosures in the financial statements. An auditOur audits also includes assessingincluded evaluating the accounting principles used and significant estimates made by management, as well as evaluating the overall presentation of the financial statement presentation.statements. We believe that our audits provide a reasonable basis for our opinion.consolidated financial statements referred to above present fairly,Company maintained, in all material respects, theeffective internal control over financial position of Luby’s, Inc. and subsidiariesreporting as of August 26, 2015 and August 27, 2014, and the results of their operations and their cash flows for each of the three years29, 2018, based on criteria established in the period ended August 26, 2015 in conformity with accounting principles generally accepted in the United States of America.Company's internal control overconsolidated financial reportingstatements of the Company as of and for the year ended August 26, 2015, based on criteria established inInternal Control—Integrated Framework-2013 issued by the Committee of Sponsoring Organizations of the Treadway Commission (COSO),29, 2018, and our report dated November 9, 201516, 2018 expressed an unqualified opinion./s/ GRANT THORNTON LLPHouston, TexasNovember 9, 2015Report of Independent Registered Public Accounting Firm Board of Directors and ShareholdersLuby’s, Inc.We have audited the internal control over financial reporting of Luby’s, Inc. (a Delaware corporation) (and its subsidiaries) (the "Company") as of August 26, 2015, based on criteria established inInternal Control—Integrated Framework-2013 issued by the Committee of Sponsoring Organizations of the Treadway Commission (COSO). Company'sCompany’s management is responsible for maintaining effective internal control over financial reporting and for its assessment of the effectiveness of internal control over financial reporting, included in the accompanying Management’s Report on Internal Control Overover Financial Reporting. Our responsibility is to express an opinion on the Company'sCompany’s internal control over financial reporting based on our audit.Public Company Accounting Oversight Board (United States).PCAOB. Those standards require that we plan and perform the audit to obtain reasonable assurance about whether effective internal control over financial reporting was maintained in all material respects. Our audit included obtaining an understanding of internal control over financial reporting, assessing the risk that a material weakness exists, testing and evaluating the design and operating effectiveness of internal control based on the assessed risk, and performing such other procedures as we considered necessary in the circumstances. We believe that our audit provides a reasonable basis for our opinion.In our opinion, the Company maintained, in all material respects, effective internal control over financial reporting as of August 26, 2015, based on criteria established inInternal Control—Integrated Framework-2013 issued by the Committee of Sponsoring Organization of the Treadway Commission (COSO).We also have audited, in accordance with the standards of the Public Company Accounting Oversight Board (United States), the consolidated financial statements of the Company as of and for the year ended August 26, 2015, and our report dated November 9, 2015 expressed an unqualified opinion on those financial statements.Houston, TexasNovember 9, 2015
2015
2014 $ 1,501 $ 2,788 5,175 4,112 4,483 5,556 3,388 2,815 24 52 577 587 15,148 15,910 4,536 991 4,014 4,204 199,859 213,492 22,570 24,014 1,643 1,681 12,917 11,294 3,571 3,849 $ 264,258 $ 275,435 $ 20,173 $ 26,269 417 590 23,958 23,107 44,548 49,966 37,500 42,000 190 278 7,361 8,167 89,599 100,411 9,323 9,264 29,006 27,356 141,105 143,179 (4,775 (4,775 174,659 175,024 $ 264,258 $ 275,435 August 29,
2018August 30,
2017 (In thousands, except share data) ASSETS Current Assets: Cash and cash equivalents $ 3,722 $ 1,096 Trade accounts and other receivables, net 8,787 8,011 Food and supply inventories 4,022 4,453 Prepaid expenses 3,219 3,431 Total current assets 19,750 16,991 Property held for sale 19,469 3,372 Assets related to discontinued operations 1,813 2,755 Property and equipment, net 138,287 172,814 Intangible assets, net 18,179 19,640 Goodwill 555 1,068 Deferred income taxes — 7,254 Other assets 1,936 2,563 Total assets $ 199,989 $ 226,457 LIABILITIES AND SHAREHOLDERS’ EQUITY Current Liabilities: Accounts payable $ 10,457 $ 15,937 Liabilities related to discontinued operations 14 367 Current portion of credit facility debt 39,338 — Accrued expenses and other liabilities 31,755 28,076 Total current liabilities 81,564 44,380 Credit facility debt, less current portion — 30,698 Liabilities related to discontinued operations 16 16 Other liabilities 5,781 7,311 Total liabilities 87,361 82,405 Commitments and Contingencies SHAREHOLDERS’ EQUITY Common stock, $0.32 par value; 100,000,000 shares authorized; Shares issued were 30,003,642 and 29,624,083, respectively; Shares outstanding were 29,503,642 and 29,124,083, respectively 9,602 9,480 Paid-in capital 33,872 31,850 Retained earnings 73,929 107,497 Less cost of treasury stock, 500,000 shares (4,775 ) (4,775 ) Total shareholders’ equity 112,628 144,052 Total liabilities and shareholders’ equity $ 199,989 $ 226,457
2015
2014
2013 $ 370,192 $ 368,267 $ 360,001 16,401 18,555 16,693 6,961 7,027 6,937 531 532 565 394,085 394,381 384,196 107,053 106,254 103,052 127,694 126,046 122,865 63,090 61,700 58,985 20,977 21,881 21,680 2,686 2,164 783 14,786 16,847 15,604 1,668 1,733 1,629 21,367 20,062 18,376 38,758 40,686 36,123 636 2,498 615 (3,994 (2,357 (1,723 394,721 397,514 377,989 (636 (3,133 6,207 4 6 9 (2,336 (1,247 (920 520 1,101 1,026 (2,448 (3,273 6,322 (1,076 (1,660 1,775 (1,372 (1,613 4,547 (702 (1,834 (1,386 $ (2,074 $ (3,447 $ 3,161 $ (0.05 $ (0.06 $ 0.16 $ (0.05 $ (0.06 $ 0.16 $ (0.02 $ (0.06 $ (0.05 $ (0.02 $ (0.06 $ (0.05 $ (0.07 $ (0.12 $ 0.11 $ (0.07 $ (0.12 $ 0.11 28,974 28,812 28,618 28,974 28,812 28,866 Year Ended August 29, 2018 August 30, 2017 August 31, 2016 SALES: Restaurant sales $ 332,518 $ 350,818 $ 378,111 Culinary contract services 25,782 17,943 16,695 Franchise revenue 6,365 6,723 7,250 Vending revenue 531 547 583 TOTAL SALES 365,196 376,031 402,639 COSTS AND EXPENSES: Cost of food 94,238 98,714 106,980 Payroll and related costs 124,478 125,997 132,960 Other operating expenses 62,286 61,924 60,961 Occupancy costs 20,399 21,787 22,374 Opening costs 554 492 787 Cost of culinary contract services 24,161 15,774 14,955 Cost of franchise operations 1,528 1,733 1,877 Depreciation and amortization 17,453 20,438 21,889 Selling, general and administrative expenses 38,725 37,878 42,422 Provision for asset impairments and restaurant closings 8,917 10,567 1,442 Net Gain on disposition of property and equipment (5,357 ) (1,804 ) (684 ) Total costs and expenses 387,382 393,500 405,963 LOSS FROM OPERATIONS (22,186 ) (17,469 ) (3,324 ) Interest income 12 8 4 Interest expense (3,348 ) (2,443 ) (2,247 ) Other income (expense), net 298 (454 ) 186 Loss before income taxes and discontinued operations (25,224 ) (20,358 ) (5,381 ) Provision for income taxes 7,730 2,438 4,875 Loss from continuing operations (32,954 ) (22,796 ) (10,256 ) Loss from discontinued operations, net of income taxes (614 ) (466 ) (90 ) NET LOSS $ (33,568 ) $ (23,262 ) $ (10,346 ) Loss per share from continuing operations: Basic $ (1.10 ) $ (0.77 ) $ (0.35 ) Assuming dilution $ (1.10 ) $ (0.77 ) $ (0.35 ) Loss per share from discontinued operations: Basic $ (0.02 ) $ (0.02 ) $ (0.00 ) Assuming dilution $ (0.02 ) $ (0.02 ) $ (0.00 ) Net loss per share: Basic $ (1.12 ) $ (0.79 ) $ (0.35 ) Assuming dilution $ (1.12 ) $ (0.79 ) $ (0.35 ) Weighted-average shares outstanding: Basic 29,901 29,476 29,226 Assuming dilution 29,901 29,476 29,226
Capital
Earnings
Shareholders’
Equity 28,677 $ 9,176 (500 $ (4,775 $ 24,532 $ 143,465 $ 172,398 — — — — — 3,161 3,161 28 9 — — 19 — 28 80 26 — — 350 — 376 — — — — 64 — 64 19 6 — — 1,100 — 1,106 28,804 $ 9,217 (500 $ (4,775 $ 26,065 $ 146,626 $ 177,133 — — — — — (3,447 (3,447 31 10 — — 17 — 27 63 20 — — 78 — 98 — — — — 50 — 50 52 17 — — 1,146 — 1,163 28,950 $ 9,264 (500 $ (4,775 $ 27,356 $ 143,179 $ 175,024 — — — — — (2,074 (2,074 40 13 — — (13 — — 82 26 — — 164 — 190 — — — — 5 — 5 63 20 — — 1,494 — 1,514 29,135 $ 9,323 (500 $ (4,775 $ 29,006 $ 141,105 $ 174,659 Common Stock Issued Treasury Shares Amount Shares Amount Balance at August 26, 2015 29,135 $ 9,323 (500 ) $ (4,775 ) $ 29,006 $ 141,105 $ 174,659 Net loss for the year — — — — — (10,346 ) (10,346 ) Common stock issued under nonemployee director benefit plans 60 19 — — (19 ) — — Common stock issued under employee benefit plans 177 57 — — 25 — 82 Increase in excess tax benefits from share-based compensation — — — — (119 ) — (119 ) Share-based compensation expense 68 22 — — 1,455 — 1,477 Balance at August 31, 2016 29,440 $ 9,421 (500 ) $ (4,775 ) $ 30,348 $ 130,759 $ 165,753 Net loss for the year — — — — — (23,262 ) (23,262 ) Common stock issued under nonemployee director benefit plans 83 26 — — (26 ) — — Common stock issued under employee benefit plans 7 2 — — (2 ) — — Share-based compensation expense 94 31 — — 1,530 — 1,561 Balance at August 30, 2017 29,624 $ 9,480 (500 ) $ (4,775 ) $ 31,850 $ 107,497 $ 144,052 Net loss for the year — — — — — (33,568 ) (33,568 ) Common stock issued under nonemployee director benefit plans 87 28 — — (28 ) — — Common stock issued under employee benefit plans 183 59 — — (59 ) — — Share-based compensation expense 109 35 — — 2,109 — 2,144 Balance at August 29, 2018 30,003 $ 9,602 (500 ) $ (4,775 ) $ 33,872 $ 73,929 $ 112,628
2015
2014
2013 $ (2,074 $ (3,447 $ 3,161 (3,385 1,347 (451 21,431 20,221 18,571 204 123 112 190 125 404 1,514 1,163 1,106 (5 (50 (64 (1,996 (3,348 522 15,879 16,134 23,361 (1,063 (29 10 1,073 (530 (903 (268 917 356 (5,305 3,947 6,618 10,316 20,439 29,442 57 23 80 — (10,169 13,278 4,130 5,961 (20,378 (46,184 (31,339 (7,043 (42,031 (35,467 108,000 105,900 69,700 (112,500 (83,100 (63,500 (255 (123 (338 5 50 64 190 125 404 (4,560 22,852 6,330 (1,287 1,260 305 2,788 1,528 1,223 $ 1,501 $ 2,788 $ 1,528 Year Ended August 29, 2018 August 30, 2017 August 31, 2016 (In thousands) CASH FLOWS FROM OPERATING ACTIVITIES: Net loss $ (33,568 ) $ (23,262 ) $ (10,346 ) Adjustments to reconcile net loss to net cash provided (used) in operating activities: Provision for asset impairments and net loss (gain) on property dispositions 3,619 8,762 734 Depreciation and amortization 17,453 20,438 21,906 Amortization of debt issuance cost 534 348 313 Share-based compensation expense 2,144 1,561 1,477 Excess tax deficit from share-based compensation — — 119 Deferred tax provision 8,192 2,792 4,707 Cash provided (used) in operating activities before changes in operating assets and liabilities (1,626 ) 10,639 18,910 Changes in operating assets and liabilities: Increase in trade accounts and other receivables (775 ) (2,092 ) (744 ) Decrease (increase) in food and supply inventories 432 143 (616 ) Decrease in prepaid expenses and other assets 808 504 215 Increase (decrease) in accounts payable, accrued expenses and other liabilities (7,292 ) 446 (3,906 ) Net cash provided (used) in operating activities (8,453 ) 9,640 13,859 CASH FLOWS FROM INVESTING ACTIVITIES: Proceeds from disposal of assets and property held for sale 14,191 9,286 4,794 Insurance proceeds 2,070 — — Repayment of note receivable — — 17 Purchases of property and equipment (13,247 ) (12,502 ) (18,253 ) Net cash provided (used) in investing activities 3,014 (3,216 ) (13,442 ) CASH FLOWS FROM FINANCING ACTIVITIES: Revolver borrowings 147,600 107,800 106,000 Revolver repayments (132,000 ) (140,400 ) (106,500 ) Debt issuance costs (386 ) (652 ) (42 ) Proceeds on term loan — 35,000 — Term loan repayments (7,079 ) (8,415 ) — Excess tax deficit from share-based compensation — — (119 ) Tax paid on equity withheld (70 ) — — Proceeds received on the exercise of employee stock options — — 82 Net cash provided (used) in financing activities 8,065 (6,667 ) (579 ) Net increase (decrease) in cash and cash equivalents 2,626 (243 ) (162 ) Cash and cash equivalents at beginning of period 1,096 1,339 1,501 Cash and cash equivalents at end of period $ 3,722 $ 1,096 $ 1,339 Cash paid for: Income taxes $ 426 $ 411 $ 357 Interest 2,499 1,787 1,873 2015, 20142018, 2017, and 2013201626, 2015,29, 2018, the Company owned and operated 177146 restaurants, with 128114 in Texas and the remainder in other states. In addition, the Company received royalties from 106105 franchises as of August 26, 201529, 2018 located primarily throughout the United States. The Company’s owned and franchised restaurant locations are convenient to shopping and business developments, as well as, to residential areas. Accordingly, the restaurants appeal to a variety of customers at breakfast, lunch, and dinner. Culinary Contract Services consists of contract arrangements to manage food services for clients operating in primarily threefour lines of business: healthcare, higher educationhealthcare; senior living; business; and corporate dining.Reclassification of Certain ExpensesMarketing expenses and other certain non-store specific restaurant business segment costs have been reclassified from Payroll and related costs and Other operating expenses to Selling, general, and administrative expenses. The occupancy costs (mainly rent expense and property tax expense) for our centralized bakery and facility service center locations have also moved to Selling, general, and administrative expenses. Insurance costs directly associated with our restaurant property locations have been reclassified from Other operating expenses to Occupancy costs. Direct costs associated with our Culinary Contract Services business segment have been reclassified to Cost of culinary contract services. Direct costs associated with our Franchise Operations business segment have bene reclassified to a new expense line Cost of franchise operations.Below is a summary of the reclassified expenses:
2014
2013 $ 127,792 $ 123,864 (1,746 (999 126,046 122,865 68,820 64,918 (3,775 (3,043 (3,345 (2,890 61,700 58,985 21,060 21,012 1,107 979 (286 (311 21,881 21,680 35,038 32,217 3,775 3,043 1,699 999 286 311 2,186 1,895 (618 (707 (1,680 (1,635 40,686 36,123 16,177 14,874 670 730 16,847 15,604 — — 1,733 1,629 1,733 1,629 1Reflects property and general liability insurance reclassified to Other operating expenses and corporate insurance reclassified to Selling, general and administrative expenses2Includes costs previously classified in General and administrative expenses ($618 and $707 in fiscal 2014 and 2013, respectively) and costs previously in Payroll and related costs, Other operating expenses and Occupancy costs3 Includes costs previously classified in General and administrative expenses ($1,680 and $1,635 in fiscal 2014 and 2013, respectively) and costs previously in Payroll and related costs and Other operating expensesAll of theThe Company’s bank account balances are insured by the Federal Deposit Insurance Corporation.Corporation (“FDIC”) up to $250,000 at each institution. However, balances in money market fund accounts are not insured. Amounts in transit from credit card companies are also considered cash equivalents because they are both short-term and highly liquid in nature and are typically converted to cash within three days of the sales transaction.contract serviceCCS clients, catering customers and restaurant sales to corporations. The Company determines the allowancecorporations and, for CCS receivables and franchise royalty and marketing and advertising receivables, based onthe Company also considers the franchisees’ and CCS clients’ unsecured default status. The Company periodically reviews its allowance for doubtful accounts. Account balances are charged off against the allowance after all means of collection have been exhausted and the potential for recovery is considered remote.market. GainsDepreciation on assets moved to property held for sale is discontinued and gains are not recognized until the properties are sold.dininggift cards that have been sold but not yet redeemed and are recorded at their expected redemption value. When dininggift cards are redeemed, revenue is recognized, and unearned revenue is reduced.Advertising$4.4$4.1 million, $4.7$5.7 million, and $3.9$6.3 million in fiscal 2015, 20142018, 2017, and 2013,2016, respectively. We record advertising attributable to local store marketing and local community involvement efforts in other operating expenses; we record advertising attributable to our brand identity, our promotional offers, and our other marketing messages intended to drive guest awareness of our brands, in selling, general, and administrative expenses. We believe this separation of our marketing and advertising costs assists with measurement of the profitability of individual restaurant locations by associating only the local store marketing efforts with the operations of each restaurant.Advertising$1.2$0.6 million, $0.8$0.6 million, and $0.8$0.7 million in fiscal 2015, 20142018, 2017, and 2013,2016, respectively.Advertising$3.2$3.5 million, $3.9$5.1 million, and $3.1$5.6 million in fiscal 2015, 20142018, 2017, and 2013,2016, respectively.GAAP provides that a company may adopt a policy of presenting sales taxes either gross within revenue or on a net basis. thesesales taxes on a net basis (excluded from revenue).Share-Based CompensationBlack-SholesBlack-Scholes option pricing model. The Black-SholesBlack-Scholes option pricing model requires various judgmental assumptions including the expected dividend yield, stock price volatility, and the expected life of the award. If any of the assumptions used in the model change significantly, share-based compensation expense may differ materially in the future, from that recorded in the current period. The fair value of performance share based award liabilities are estimated based on a Monte Carlo simulation model. For further discussion, see Note 14,16, “Share-Based Compensation,” below.year 2016 will bewas such a year. Each of the first three quarters of each fiscal year, consistsprior to fiscal 2016, consisted of three four-week periods, while the fourth quarter normally consists of four four-week periods. However, the fourth quarter of fiscal year 2011, as a result of the additional week, consisted of three four-week periods and one five-week period, accounting for 17 weeks, or 119 days, in the aggregate. Fiscal 2013 and 2012 both contained 52 weeks. Comparability between quarters may be affected by the varying lengths of the quarters, as well as the seasonality associated with the restaurant business.will changechanged our fiscal quarter ending dates with the first fiscal quarter end beingwas extended by one accounting period and the fiscal fourth quarter beingwas reduced by one accounting period. The purpose of this change is in part to minimize the Thanksgiving calendar shift by extending the first fiscal quarter until after Thanksgiving. With this change in fiscal quarter ending dates, our first quarter will beis 16 weeks, and the remaining three quarters will typically be 12 weeks in length. The fourth fiscal quarter will be 13 weeks in certain fiscal years to adjust for our standard 52 week, or 364 day, fiscal year compared to the 365 day calendar year. Fiscal 2016 iswas such a year where the fourth quarter will haveincluded 13 weeks, resulting in a 53 week fiscal year. Comparability between quarters may be affected by varying lengths of the quarters, as well as the seasonality associated with the restaurant business.26, 201529, 2018 through the date of issuance of the financial statements are evaluated to determine if the nature and significance of the event warrantsevents warrant inclusion in the Company’s annual report.AcquisitionsCheeseburger in Paradisethroughsustained a subsidiary, Paradise Cheeseburgers, LLC, purchased 100%net loss of approximately $33.6 million and cash flow from operations was a use of cash of approximately $8.5 million in fiscal 2018. The working capital deficit is magnified by the reclassification of the membership unitsCompany's approximate $39.5 million debt under its Credit Agreement (as defined below) from long-term to short-term due to the debt's May 1, 2019 maturity date. Pursuant to the Third Amendment, the lenders agreed to waive the existing events of Paradisedefault as of the effective date of the Third Amendment resulting from any breach of certain financial covenants or the limitation on maintenance capital expenditures, in each case that may have occurred during the period from and including May 9, 2018 until the effective date of the Third Amendment, and any related events of default. Additionally, the lenders agreed to waive the requirements that the Company comply with certain financial covenants until December 31, 2018, at which time the Company will be in default without an additional waiver or alternative financing.◦ the lenders agreed to waive the existing conditions of default through the date of the Third Amendment, ◦ the lenders agreed to waive the requirement to comply with certain financial covenants until December 31, 2018, ◦ the Company is required to make partial mandatory prepayments from the proceeds of certain asset dispositions from and after the effective date of the Third Amendment, and ◦ The Company has engaged a third-party financial advisor to assist management in pursuing financing transactions per conditions set forth in the debt waiver. Group, LLCsales were negatively impacted by approximately 200 operating days in the aggregate. Two Fuddruckers locations, in the Houston region, were closed on a more than temporary basis, due to extensive flooding which required reconstruction and affiliated companies which operate Cheeseburger in Paradise brand restaurants (collectively, “Cheeseburger in Paradise”) on December 6, 2012 for $10.2renovation. The Company estimates that it incurred over approximately $2.0 million in cash.lost sales from the store closures in fiscal 2017. The Company assumed $2.4estimates that Loss before income taxes and discontinued operations was negatively impacted by approximately $1.5 million in fiscal 2017 due to the reduced sales and increased costs incurred as a result of Cheeseburgerthe hurricane. In fiscal 2018, the Company additionally incurred an approximate $0.7 million in Paradise obligations, real estate leasesdirect costs for repairs and contracts. Theother costs related to the hurricane. As of August 29, 2018, the Company funded the purchase with existing cash reserves and borrowings from its credit facility.The Company has accounted forfiscal 2013 acquisitionstorm and 3) approximately $1.3 million that was recognized, less the net book value of Cheeseburger in Paradise using the acquisition method and, accordingly, the results of operations related to this acquisition have been included in the consolidated results of the Company since the acquisition date. The Company incurred $0.4 million in acquisition costs which were expensed as incurred and classified as selling, general and administrative expenses on the consolidated statements of operations.The allocation of the purchase price for the acquisition requires extensive use of accounting estimates and judgments to allocate the purchase price to tangible and intangible assets acquired and liabilities assumed based on respective fair values. The purchase price for the Company’s acquisition of Cheeseburger in Paradise and the assumption of liabilities is based on estimates of fair values at the acquisition date. The Company’s fair value estimates for the purchase price allocation may change during the allowable period, which is up to one year from the acquisition date to provide sufficient time to develop fair value estimates. The fair values that take longer to estimate and are more likely to change include property and equipment, intangible assets and leases.Such valuations require significant estimates and assumptions. The Company believes the fair values assigned to the assets acquired and liabilities assumed are basedas Net gain on reasonable assumptions.The following table summarizes the estimated fair values of net assets acquired and liabilities assumed, in thousands: $ 58 93 561 376 6,374 188 2,646 254 1,975 (2,356 $ 10,169 The license agreement and trade name relates to a perpetual license to use intangible assets including trademarks, service marks and publicity rights related to Cheeseburger in Paradise owned by Jimmy Buffett and affiliated entities. In return, the Company will pay a royalty fee of 2.5% of gross sales, less discounts, at acquired Cheeseburger in Paradise locations to an entity owned or controlled by Jimmy Buffett. The trade name represents a respected brand with positive customer loyalty, and the Company intends to cultivate and protect the use of the trade name.The Company will amortize the fair value allocated to the license agreement and trade name over an expected accounting life of 15 years based on the expected use of its assets and the restaurant environment in which it is being used. The Company recorded approximately $14 thousand of amortization expense for the fiscal year ended August 26, 2015, which is classified as depreciation and amortization expense in the accompanying consolidated statement of operations. Because the value of these assets will be amortized using the straight-line method over 15 years, the annual amortization will be $14 thousand in future years.A portion of the acquired lease portfolio contained favorable leases. Acquired lease terms were compared to current market lease terms to determine if the acquired leases were below or above the current rates tenants would pay for similar leases. The favorable lease assets totaled $2.4 million, $2.6 million and $2.6 million in fiscal years 2015, 2014 and 2013, respectively, and are recorded in other assets. After considering renewal periods, the favorable lease assets have an estimated weighted average life of approximately 18.1 years, 19.1 years and 20.3 years at the end of the fiscal years 2015, 2014 and 2013, respectively. There were determined to be no unfavorable leases. The favorable leases are amortized to rent expense on a straight line basis over the lives of the related leases. The Company recorded $120 thousand, $126 thousand and $88 thousand of amortization for fiscal years ended 2015, 2014 and 2013, respectively, which is classified as additional rent expense in the accompanying consolidated statement of operations.The following table shows the prospective amortization of the favorable lease asset:
2016
2017
2018
2019
2020 $ 121 $ 121 $ 121 $ 121 $ 121 Annual depreciation expense will be approximately $0.5 million of the $6.4 milliondisposition of property and equipment.The Company also recorded an intangible asset for goodwill in the amount of $2.0 million. In fiscal 2015, the Company impaired goodwill $38 thousand. Goodwill is considered to have an indefinite useful life and is not amortized but is tested for impairment at least annually. The total amount of goodwill is expected to be deductible for income tax purposes.The following unaudited pro forma information assumes the Cheeseburger in Paradise acquisition occurred as of the beginning of the fiscal year ended August 29, 2012. The unaudited pro forma data is presented for informational purposes only and does not purport to be indicative of the results of future operations of the Company or of the results that would have actually been attained had the acquisition taken place at the beginning of the fiscal year ended August 29, 2012. $ 401,960 $ 403,572 3,397 8,494 2,274 7,734 0.12 0.30 0.12 0.30 0.08 0.27 0.08 0.27 Included in the Consolidated Statement of Operations for fiscal 2013 were actual restaurant sales for Cheeseburger in Paradise of $35.7 million and loss from operations for Cheeseburger in Paradise of $1.8 million. Excluding first year integration costs of $0.7 million after-tax, the loss from operations related to Cheeseburger in Paradise included in the Consolidated Statement of Operations for the year ended August 28, 2013 was $1.1 million.3.4. Reportable Segmentsdue to the following:because of the nature of the products and services, the production processes, the customers, the methods used to distribute the products and services, the nature of the regulatory environment, and store level profit margin isare similar. The chief operating decision maker analyzes Company-owned restaurant store level profit which is defined as restaurant sales and vending revenue, less cost of food, payroll and related costs, and other operating expenses, and occupancy costs. The primary brands are Luby’s Cafeteria, Fuddruckers - World’s Greatest Hamburgers®, and Cheeseburger in Paradise with a couple of non-core restaurant locations under other brand names. Both Luby’s Cafeteria and FuddruckersParadise. All Company-owned restaurants are casual dining counter service restaurants. Each restaurant is an operating segment because operating results and cash flow can be determined for each restaurant.years 2015, 20142018, 2017, and 20132016 were 177, 174146, 167, and 180,175, respectively. operation, branded as Luby’s Culinary Contract Services, consists of a business line servicing healthcare, higher education andsport stadiums, corporate dining clients.clients, and sales through retail grocery stores. The healthcare accounts are full service and typically include in-room delivery, catering, vending, coffee service, and retail dining. CCS had contracts with long-term acute care hospitals, acute care medical centers, ambulatory surgical centers, retail grocery stores, behavioral hospitals, a senior living facility, sports stadiums, government, and business and industry clients, and higher education institutions. Culinary Contract Servicesclients. CCS has the unique ability to deliver quality services that include facility design and procurement as well as nutrition and branded food services to our clients. The costsCost of Culinary Contract Services on the Consolidated Statements of Operations includes all food, payroll and related costs, other operating expenses, and other direct general and administrative expenses related to Culinary Contract ServicesCCS sales.Culinary Contract ServicesCCS contracts at the end of fiscal 2015, 20142018, 2017, and 20132016 were 23,28, 25, and 21,24, respectively.Franchising2015, 20142018, 2017, and 20132016 were 106, 110, 116,105, 113, and 113, respectively.belowon the following page shows financial information as required by ASC 280 for segment reporting. ASC 280 requires depreciation and amortization be disclosed for each reportable segment, even if not used by the chief operating decision maker. The table also lists total assets for each reportable segment. Corporate assets include cash and cash equivalents, tax refunds receivable, property and equipment, assets related to discontinued operations, property held for sale, deferred tax assets, and prepaid expenses.
2015
2014
2013 $ 370,723 $ 368,799 $ 360,566 16,401 18,555 16,693 6,961 7,027 6,937 $ 394,085 $ 394,381 $ 384,196 $ 51,909 $ 52,918 $ 53,984 1,615 1,708 1,089 5,293 5,294 5,308 $ 58,817 $ 59,920 $ 60,381 $ 18,080 $ 17,357 $ 16,417 164 409 440 767 767 767 2,356 1,529 752 $ 21,367 $ 20,062 $ 18,376 $ 218,492 $ 220,793 $ 203,850 1,644 2,724 3,547 13,034 13,906 14,674 31,088 38,012 28,574 $ 264,258 $ 275,435 $ 250,645 $ 19,726 $ 43,075 $ 30,741 18 64 95 — — — 634 3,045 503 $ 20,378 $ 46,184 $ 31,339 $ 58,817 $ 59,920 $ 60,381 (2,686 (2,164 (783 (21,367 (20,062 (18,376 (38,758 (40,686 (36,123 (636 (2,498 (615 3,994 2,357 1,723 4 6 9 (2,336 (1,247 (920 520 1,101 1,026 $ (2,448 $ (3,273 $ 6,322 (1) Includes vending revenue of $531, $532 and $565 thousand for the year ended August 26, 2015, August 27, 2014 and August 28, 2013, respectively. (2) Company-owned restaurants segment includes $10.6 million of Fuddruckers trade name, Cheeseburger in Paradise liquor licenses, and Jimmy Buffett intangibles.(3) Franchise operations segment includes approximately $12.2 million in royalty intangibles.(4) Goodwill was disclosed in corporate segment in our fiscal 2014 Annual Report on Form 10-K and our first quarter fiscal 2015 Quarterly Report on Form 10-Q. The current draft reflects a revised classification of goodwill into the Company-owned restaurants segment. August 29, 2018 August 30, 2017 August 31, 2016 (In thousands) Sales: $ 333,049 $ 351,365 $ 378,694 Culinary contract services 25,782 17,943 16,695 Franchise operations 6,365 6,723 7,250 Total $ 365,196 $ 376,031 $ 402,639 Segment level profit: Company-owned restaurants $ 31,648 $ 42,943 $ 55,419 Culinary contract services 1,621 2,169 1,740 Franchise operations 4,837 4,990 5,373 Total $ 38,106 $ 50,102 $ 62,532 Depreciation and amortization: Company-owned restaurants $ 14,741 $ 16,948 $ 18,181 Culinary contract services 71 64 103 Franchise operations 769 770 784 Corporate 1,872 2,656 2,821 Total $ 17,453 $ 20,438 $ 21,889 Total assets: $ 151,511 $ 189,990 $ 211,182 Culinary contract services 4,569 3,342 3,390 10,982 11,325 12,266 Corporate 32,927 21,800 25,387 Total $ 199,989 $ 226,457 $ 252,225 Capital expenditures: Company-owned restaurants $ 11,109 $ 11,374 $ 17,258 Culinary contract services 235 3 28 Corporate 1,903 1,125 967 Total $ 13,247 $ 12,502 $ 18,253 Loss before income taxes and discontinued operations: Segment level profit $ 38,106 $ 50,102 $ 62,532 Opening costs (554 ) (492 ) (787 ) Depreciation and amortization (17,453 ) (20,438 ) (21,889 ) Selling, general and administrative expenses (38,725 ) (37,878 ) (42,422 ) Provision for asset impairments and restaurant closings (8,917 ) (10,567 ) (1,442 ) Net gain on disposition of property and equipment 5,357 1,804 684 Interest income 12 8 4 Interest expense (3,348 ) (2,443 ) (2,247 ) Other income (expense), net 298 (454 ) 186 Total $ (25,224 ) $ (20,358 ) $ (5,381 ) 4.6. Fair Value Measurementassetassets or liabilities to be measured at fair value.tiers include:●Level 1: Defined as observable inputs such as quoted prices in active markets for identical assets or liabilities as of the reporting date. Active markets are those in which transactions for the asset or liability occur in sufficient frequency and volume to provide pricing information on an ongoing basis.●Level 2: Defined as pricing inputs other than quoted prices in active markets included in Level 1, which are either directly or indirectly observable as of the reporting date. Level 2 includes those financial instruments that are valued using models or other valuation methodologies. These models are primarily industry-standard models that consider various assumptions, including quoted forward prices for commodities, time value, volatility factors, and current market and contractual prices for the underlying instruments, as well as other relevant economic measures.●Level 3: Defined as pricing inputs that are unobservable from objective sources. These inputs may be used with internally developed methodologies that result in management’s best estimate of fair value. Fair Value
Measurement Using Fiscal Year Ended August 29, 2018 Quoted
Prices in
Active
Markets for
Identical
Assets
(Level 1) Significant
Other
Observable
Inputs
(Level 2) Significant
Unobservable
Inputs
(Level 3) Valuation Method Recurring Fair Value - Assets (In thousands) Continuing Operations: $ 435 $ — $ 435 $ — Discounted Cash Flow Fair Value
Measurement Using Fiscal Year Ended August 29, 2018 Quoted
Prices in
Active
Markets for
Identical
Assets
(Level 1) Significant
Other
Observable
Inputs
(Level 2) Significant
Unobservable
Inputs
(Level 3) Valuation Method Recurring Fair Value - Liabilities (In thousands) Continuing Operations: $ 21 $ — $ 21 $ — Monte Carlo Approach Fair Value
Measurement Using Fiscal Year Ended August 30, 2017 Quoted
Prices in
Active
Markets for
Identical
Assets
(Level 1) Significant
Other
Observable
Inputs
(Level 2) Significant
Unobservable
Inputs
(Level 3) Valuation Method Recurring Fair Value - Liabilities (In thousands) Continuing Operations: $ 831 $ — $ 831 $ — Monte Carlo Approach $ 266 $ — $ 266 $ — Discounted Cash Flow consistedconsist of the following:
Measurement Using
Prices in
Active
Markets for
Identical
Assets
(Level 1)
Other
Observable
Inputs
(Level 2)
Unobservable
Inputs
(Level 3)
Impairments $ 5,282 $ — $ — $ 5,282 $ (636 $ 903 $ — $ — $ 903 $ (90 Fiscal Year Ended August 29, 2018 Nonrecurring Fair Value Measurements (In thousands) Continuing Operations: $ 1,519 $ — $ — $ 1,519 $ (4,052 ) — — — — (513 ) 5,132 — — 5,132 (3,062 ) Total Nonrecurring Fair Value Measurements $ 6,651 $ — $ — $ 6,651 $ (7,627 )
Measurement Using
Prices in
Active
Markets for
Identical
Assets
(Level 1)
Other
Observable
Inputs
(Level 2)
Unobservable
Inputs
(Level 3)
Impairments $ 6,446 — — $ 6,446 $ (2,498 $ (2,498 $ 1,144 — — $ 1,144 $ (1,200
Measurement Using
Prices in
Active
Markets for
Identical
Assets
(Level 1)
Other
Observable
Inputs
(Level 2)
Unobservable
Inputs
(Level 3)
Impairments $ 722 $ — $ — $ 722 $ (462 $ 447 $ — $ — $ 447 $ (153 $ (615 $ 3,159 $ — $ — $ 3,159 $ (663 Fair Value
Measurement Using Fiscal Year Ended August 30, 2017 Quoted
Prices in
Active
Markets for
Identical
Assets
(Level 1) Significant
Other
Observable
Inputs
(Level 2) Significant
Unobservable
Inputs
(Level 3)
Impairments(4)Nonrecurring Fair Value Measurements (In thousands) Continuing Operations: $ 5,519 $ — $ — $ 5,519 $ (8,571 ) — — — — (537 ) 3,372 — — 3,372 (977 ) Total Nonrecurring Fair Value Measurements $ 8,891 $ — $ — $ 8,891 $ (10,085 ) 5.7. Trade Receivables and Other
2015
2014 $ 4,150 $ 2,940 706 705 874 979 (555 (512 $ 5,175 $ 4,112 August 29,
2018 August 30,
2017 (In thousands) Trade and other receivables $ 6,697 $ 5,966 Franchise royalties and marketing and advertising receivables 764 687 Unbilled revenue 1,557 1,633 Allowance for doubtful accounts (231 ) (275 ) Total Trade accounts and other receivables, net $ 8,787 $ 8,011 The Company does not have a concentration of credit risk in total trade and other receivables, net. 26, 201529, 2018 was $3.0$6.7 million, primarily the result of 1012 contracts with balances of $0.01approximately $0.1 million to $0.1approximately $3.6 million per contract entity. The Company had certain customer’s contracts whose accounts receivable balancesThese 12 collectively represented approximately 30%67% of the Company’s total accounts receivables. Contract payment terms for its CCS customers’ receivables are due within 30 to 45 days.26, 201529, 2018 was $0.7approximately $0.8 million. At August 26, 2015,29, 2018, the Company had 106105 operating franchise restaurants with no concentration of accounts receivable.
2015
2014
2013 $ 512 $ 586 $ 678 51 61 (1 (8 (135 (91 $ 555 $ 512 $ 586 August 29,
2018 August 30,
2017 August 31,
2016 (In thousands) Beginning balance $ 275 $ 81 $ 555 Provisions (reversal) for doubtful accounts 464 200 (18 ) (508 ) (6 ) (456 ) Ending balance $ 231 $ 275 $ 81 6.8. Income Taxes
2015
2014 $ 342 $ 158 137 354 808 5 10,011 8,911 1,484 1,379 3,930 3,719 16,712 14,526 1,765 1,576 1,765 1,576 $ 14,947 $ 12,950 August 29,
2018 August 30,
2017 (In thousands) Deferred income tax assets: Workers’ compensation, employee injury, and general liability claims $ 507 $ 486 Deferred compensation 280 437 Net operating losses 4,401 2,140 General business and foreign tax credits 12,105 11,599 Depreciation, amortization and impairments 6,796 7,515 Straight-line rent, dining cards, accruals, and other 2,917 4,392 Subtotal 27,006 26,569 Valuation allowance (25,873 ) (16,871 ) Total deferred income tax assets 1,133 9,698 Deferred income tax liabilities: Property taxes and other 1,133 1,916 Total deferred income tax liabilities 1,133 1,916 Net deferred income tax asset $ — $ 7,782 hadwas also required to remeasure its deferred tax assets and liabilities using the new federal statutory tax rate in the second quarter of fiscal 2018, upon enactment of the Tax Act. At that time, the Company's deferred tax balance was $7.8 million, and the Tax Act reduction in the federal statutory tax rate resulted in a one-time non-cash reduction to the Company's net deferred tax balance of approximately $3.2 million with a corresponding increase to the provision for income taxes in the second quarter of fiscal 2018.26, 2015 of approximately $16.7 million, the29, 2018. The most significant of which includedeferred tax asset prior to valuation allowance is the Company’s general business tax credits carryovers to future years of approximately $9.6 million of deferred tax assets, combined.$11.6 million. This item may be carried forward up to twenty years for possible utilization in the future. The carryover of general business tax credits, beginning in fiscal 2002, will begin to expire at the end of fiscal 2022 through 2034,2038, if not utilized by then.Management has evaluated both positive and negative evidence, including its forecasts of the Company’s future operational performance and taxable income, adjusted by varying probability factors, in making a determination as to whether it is more likely than not that all or some portion of the deferred tax assets will be realized. NOLnet operating losses and tax credit carryovers. We establish a valuation allowance when we no longer consider it more likely than not that a deferred tax asset will be realized. In evaluating our ability to recover our deferred tax assets, we consider available positive and negative evidence, including scheduled reversals of deferred tax liabilities, tax-planning strategies projected future taxable income,and existing business conditions, including amendment to our credit agreement(s) to avoid default and results of recent operations.Positivethat we consider includesduring the third quarter of fiscal 2018, in connection with our response to a default in certain of the Company’s historyCredit Agreement financial covenants, a condition that raised substantial doubt as to the Company continuing as a going concern for a reasonable period of realizing fullytime. This circumstance and its tax NOL and tax credit carryovers prior to expiration andadded negative evidence, supported management’s conclusion that a full valuation allowance on the considered use of tax-planning strategies. The later includes the acceleration of unrealized gains from our owned property locations through sale or exchange, if and when necessary on a selective basis, which we consider to be a significant piece of positive evidence. We regularly evaluate our portfolio of owned properties, long-lived assets and their relative values, for many different business purposes, and have estimated the resulting unrealizedCompany’s net gains thereon to be of sufficient measure to recover our deferred tax assets includingin the amount of $25.3 million was necessary during the third quarter of fiscal 2018. Management's conclusion for a full valuation allowance reduces fully the Company’s net deferred tax NOL and tax credit carryovers. Tax-planning strategies involving the accelerationbalances, net of unrealized gains, as well as the reversals of our deferred tax liabilities, are ofthrough and including the same character and should reverse in both the same period and jurisdiction as the temporary differences giving rise to the deferred tax. In evaluating negative evidence, we consider three years of cumulative operating income (loss). A significant contributor to the Company’s threefiscal year cumulative loss involves a number of underperforming locations, principally all of which have been disposed of under the Company’s disposal plan. The Company has recorded a deferred tax asset of $10.8 million reflecting the benefit of $0.8 million in tax NOL and $10.0 tax credit carryovers, which expire in varying amounts between fiscal 2022 and 2034. Realization is dependent on generating sufficient taxable income, and if necessary gain on sale of owned properties, prior to expiration of the tax NOL and tax credit carryovers. Management believes it is more likely than not that all of the deferred tax asset will be realized.
2015
2014
2013 $ 523 $ 371 $ 614 63 87 89 (1,662 (2,118 1,072 $ (1,076 $ (1,660 $ 1,775 August 29,
2018 August 30,
2017 August 31,
2016 (In thousands) Current federal and state income tax expense $ 405 $ 329 $ 128 Current foreign income tax expense 71 84 82 Deferred income tax expense 7,254 2,025 4,665 Provision for income taxes $ 7,730 $ 2,438 $ 4,875 (benefit) for income taxes to the expected income tax expense, (benefit), computed using the statutory tax rate, was as follows:
2015
2014
2013 $ (832 34.0 $ (1,120 34.0 $ 2,149 34.0 302 (12.3 404 (12.3 355 5.6 74 (3.0 54 (1.7 50 0.8 60 (2.5 185 (5.6 68 1.1 200 (8.2 52 (1.6 338 5.3 (888 36.3 (1,187 36.1 (1,043 (16.5 8 (0.3 (48 1.5 (142 (2.2 $ (1,076 44.0 $ (1,660 50.4 $ 1,775 28.1 August 29,
2018 August 30,
2017 August 31,
2016 Amount % Amount % Amount % (In thousands and as a percent of pretax loss from continuing operations) Income tax benefit from continuing operations at the federal rate $ (6,405 ) 25.4 % $ (6,922 ) 34.0 % $ (1,830 ) 34.0 % Permanent and other differences: Federal jobs tax credits (wage deductions) 129 (0.5 ) 200 (1.0 ) 226 (4.2 ) Stock options and restricted stock 67 (0.3 ) 129 (0.6 ) 165 (3.1 ) Other permanent differences 41 (0.2 ) 62 (0.3 ) 74 (1.4 ) State income tax, net of federal benefit 145 (0.6 ) (45 ) 0.2 94 (1.7 ) General Business Tax Credits (506 ) 2.0 (589 ) 2.9 (665 ) 12.4 Impact of U.S. Tax Reform 3,167 (12.6 ) — — — — Other 487 (1.8 ) 84 (0.4 ) (94 ) 1.7 Change in valuation allowance 10,605 (42.0 ) 9,519 (46.8 ) 6,905 (128.3 ) Provision for income taxes from continuing operations $ 7,730 (30.6 )% $ 2,438 (12.0 )% $ 4,875 (90.6 )% 26, 2015,29, 2018, including both continuing and discontinued operations, the Company is estimated to report a federal taxable incomeloss of approximately $4.7$14.2 million. The Company will be able to utilize NOL carryovers from prior years to reduce the current year federal income tax liability to zero.27, 2014,30, 2017, including both continuing and discontinued operations, the Company generated federal taxable loss of approximately $6.5$3.0 million.28, 2013,31, 2016, including both continuing and discontinued operations, the Company generated federal taxable income of approximately $4.1$3.1 million. The Company utilized NOL carryovers from prior years to reduce the current year federal tax liability to zero.The IRS has periodically reviewed the Company’s federalreturns. The IRS concluded a review of thefilings are periodically examined by various federal income tax return for fiscal year 2008 on March 12, 2011. The IRS made no changes to the return. The State of Texas examined the franchise tax filings for report years 2008 through 2011 based on accounting years 2007 through 2010 resulting in additional taxes of $33,000.and state jurisdictions. The State of Louisiana is currently examining income tax returns for fiscal years 20132014 and 2014.Prior to fiscal 2010, the Company operated in five states and was subject to state and local2015.addition to federal income taxes. With the acquisition of Fuddruckers restaurants at the end of fiscal 2010 and Cheeseburger in Paradise in fiscal 2013, the2016, 2017 or 2018. The Company has income tax filing requirements in over 30 states.There were no payments of federal income taxes in fiscal 2013, 2014 or 2015. State income tax payments were approximately $0.5$0.4 million, each year during$0.4 million, and $0.4 million in fiscal 2013, 20142018, 2017, and 2015.years 2013, 20142016, 2017 and 20152018 (in thousands): $ 970 (273 72 $ 769 (707 — $ 62 1 $ 63 Balance as of August 26, 2015 $ 63 Decrease based on prior year tax positions (18 ) Interest Expense — Balance as of August 31, 2016 $ 45 Decrease based on prior year tax positions (20 ) Interest Expense — Balance as of August 30, 2017 $ 25 Decrease based on prior year tax positions — Interest Expense — Balance as of August 29, 2018 $ 25 The estimate ofThere is no interest associated with unrecognized benefits is approximately $1 thousand as of August 26, 2015.29, 2018. The Company has included interest or penalties related to income tax matters as part of income tax expense (or benefit).26, 2015.Tangible Property RegulationsIn September 2013, the U.S. Treasury issued final regulations addressing the tax consequences associated with the acquisition, production and improvement of tangible property and which are generally effective for taxable years beginning on or after January 1, 2014, which for the Company was its year beginning August 28, 2014. The Company plans to timely adopt these regulations and, at this time, has not evaluated the impact of these regulations on its consolidated financial statements.7.9. Property and Equipment, Intangible Assets and Goodwill26, 201529, 2018 and August 27, 2014,30, 2017, together with the related estimated useful lives used in computing depreciation and amortization, were as follows:
2015
2014
Useful Lives (years) $ 63,298 $ 69,767 — 85,642 77,967 3 to 15 159,391 156,308 20 to 33 29,229 26,389 3,559 2,997 3 to 10 504 10,313 — 341,623 343,741 (141,764 (130,249 $ 199,859 $ 213,492 $ 22,570 $ 24,014 21 $ 1,643 $ 1,681 August 29, 2018 August 30, 2017 (In thousands) Land $ 46,817 $ 60,414 — Restaurant equipment and furnishings 69,678 73,411 3 to 15 Buildings 131,557 153,041 20 to 33 Leasehold and leasehold improvements 27,172 26,953 Lesser of lease term or
estimated useful life Office furniture and equipment 3,596 3,684 3 to 10 Construction in progress — 35 — 278,820 317,538 Less accumulated depreciation and amortization (140,533 ) (144,724 ) Property and equipment, net $ 138,287 $ 172,814 Intangible assets, net $ 18,179 $ 19,640 15 to 21 Goodwill $ 555 $ 1,068 6, 2012.years 2015, 20142018, 2017, and 20132016 was approximately $1.4 million, $1.5$1.4 million, and $1.6$1.4 million, respectively. The aggregate amortization expense related to intangible assets subject to amortization is expected to be approximately $1.4 million in each of the next five successive years.26, 201529, 2018 and August 27, 2014: $ 29,607 $ (7,166 $ 22,441 $ 29,607 $ (5,767 $ 23,840 $ 416 $ (287 $ 129 $ 416 $ (242 $ 174 $ 30,023 $ (7,453 $ 22,570 $ 30,023 $ (6,009 $ 24,014 August 29, 2018 August 30, 2017 (In thousands) (In thousands) Accumulated Amortization Accumulated Amortization Intangible Assets Subject to Amortization: Fuddruckers trade name and franchise agreements $ 29,486 $ (11,350 ) $ 18,136 $ 29,486 $ (9,943 ) $ 19,543 Cheeseburger in Paradise trade name and license agreements $ 421 $ (378 ) $ 43 $ 421 $ (324 ) $ 97 Intangible assets, net $ 29,907 $ (11,728 ) $ 18,179 $ 29,907 $ (10,267 ) $ 19,640 The Company recorded an intangible asset for goodwill in the amount$0.2$1.6 million relatedand $1.1 million in fiscal 2018 and 2017, respectively, was approximately $0.6 million as of August 29, 2018 and $1.1 million as of August 30, 2017 and relates to our Company-owned restaurants reportable segment. Goodwill has been allocated to and impairment is assessed at the reporting unit level, which is the individual restaurants within our Fuddruckers and Cheeseburger in Paradise brands that were acquired in fiscal 2010 and fiscal 2013, respectively. The net Goodwill balance at the end of fiscal 2018 is comprised of amounts assigned to the acquisition of substantially all of the assets of Fuddruckers. The Company also recorded an intangible asset for goodwill in the amount of approximately $2.0 million related to the acquisition ofone Cheeseburger in Paradise. GoodwillParadise restaurant that is consideredstill operated by us, two Cheeseburger in Paradise restaurants that were converted to have an indefinite useful lifeFuddruckers restaurants, and is not amortized.After an assessmentManagement prepares valuations for each of certain qualitative factors, if it is determined to be more likely than not that the fair value of a reporting unit is less than its carrying amount, entities must perform the quantitative analysis of the goodwill impairment test. Otherwise, the quantitative test(s) become optional. For the annual analysis in fiscal years 2014 and 2015, the Company elected to bypass the qualitative assessment and proceeded directly to performing the first step of the goodwill impairment test. In future periods, the Company may determine that facts and circumstances indicate use of the qualitative assessment may be the most reasonable approach. Management performed its formal annual assessment as of the second quarter each fiscal year. The individual restaurant level is the level at which goodwill is assessed for impairment under ASC 350. In accordance with our understanding of ASC 350, we have allocated the goodwill value to each reporting unit in proportion to each location’s fair value at the date of acquisition. The result of these assessments were impairment of goodwill of $38 thousand and $0.5 million in fiscal years 2015 and 2014, respectively. The Company will formally perform additional assessments on an interim basis if an event occurs or circumstances exist that indicate that it is more likely than not that a goodwill impairment exists. As of November 3, 2015, of the 23 locations that were acquired, eight locations remain operating as Cheeseburger in Paradise restaurants eight locations were closed and converted to Fuddruckers restaurants, two locations where the option to extend the lease was not exercised, two locations subleased to franchisees and three closed and held for future use. The remaining three locations closed may also be converted to Fuddruckers, which continues as a contingency strategy from when the acquisition was initially consummated. As we are not moving any of the former Cheeseburger in Paradise restaurants out of their respective market, the goodwill associated with the acquired location and market area is expected to be realized through operating these former Cheeseburger in Paradise branded restaurants as Fuddruckers branded restaurants. The Company has experience converting and opening new restaurant locations and the Fuddruckers brand units have positive cash flow history. This historical data was considered when completing our fair value estimates for recovery of the remaining net book value including goodwill. In addition, we included the incremental conversion costs in our cash flow projections when completing our routine impairment of long-lived assets testing. Management has therefore performed valuations using a discounted cash flow analysis for each of its restaurants(Level 3 inputs) to determine the fair value of each reporting unit for comparison with the reporting unit’s carrying value.Goodwill wasvalue in determining if there has been an impairment of goodwill at the reporting unit level.$1.6 million as of August 26, 2015$513 thousand, $537 thousand, and approximately $1.7 million as of August 27, 2014$38 thousand in fiscal 2018, 2017, and relates to our Company-owned restaurants reportable segment.2016, respectively.8.10. Current Accrued Expenses and Other Liabilities26, 201529, 2018 and August 27, 2014:
2015
2014 $ 5,435 $ 6,504 1,118 1,280 5,472 4,144 7,760 6,943 1,267 1,076 2,906 3,160 $ 23,958 $ 23,107 August 29,
2018 August 30,
2017 (In thousands) $ 6,073 $ 5,339 Operating expenses 1,068 1,041 Unredeemed gift cards 7,213 7,298 Taxes, other than income 9,247 9,423 Accrued claims and insurance 2,958 1,505 5,196 3,470 Total $ 31,755 $ 28,076 9.11. Other Long-Term Liabilities26, 201529, 2018 and August 27, 2014:
2015
2014 $ 846 $ 729 291 758 5,849 6,450 222 125 153 105 $ 7,361 $ 8,167 August 29,
2018 August 30,
2017 (In thousands) Workers’ compensation and general liability insurance reserve $ 1,002 $ 923 Capital leases 137 109 Deferred rent and unfavorable leases 4,380 5,297 106 426 Fair value derivative - Interest Rate Swap — 266 Other 156 290 Total $ 5,781 $ 7,311 10.12. DebtRevolving August 29,
2018 August 30, 2017 (In thousands) Long-Term Debt 2016 Credit Agreement - Revolver 20,000 4,400 2016 Credit Agreement - Term Loan 19,506 26,585 Total credit facility debt 39,506 30,985 Less unamortized debt issue costs (168 ) (287 ) Total credit facility debt, less unamortized debt issuance costs 39,338 30,698 Current portion of credit facility debt 39,338 — Total Credit facility debt, less current portion $ — $ 30,698 FacilityIn August 2013,Agreementrevolving credit facility$65.0 million Senior Secured Credit Facility with Wells Fargo Bank, National Association, as Administrative Agent and AmegyCadence Bank, National Association,NA and Texas Capital Bank, NA, as Syndication Agent. The following description summarizes the material terms of the revolving credit facility, as subsequently amended on March 21, 2014, November 7, 2014 and October 2, 2015, (the revolving credit facility is referred to as the “2013lenders (“2016 Credit Facility”Agreement”). The 20132016 Credit FacilityAgreement, prior to the amendments discussed below, is governed by the credit agreement dated ascomprised of August 14, 2013a $30.0 million 5-year Revolver (the “2013 Credit Agreement”“Revolver”) among the Company, the lenders from time to time party thereto, Wells Fargo Bank, National Association, as Administrative Agent, and Amegy Bank, National Association, as Syndication Agent.a $35.0 million 5-year Term Loan (the “Term Loan”). The maturity date of the 20132016 Credit FacilityAgreement is September 1, 2017.The aggregate amountNovember 8, 2021. For this section of the lenders’form 10-K, capitalized terms that are used but not otherwise defined shall have the meanings give to such terms in the 2016 Credit Agreement.undermay be increased by up to an additional $10.0 million in the 2013aggregate.Facility was $70.0 million as of August 28, 2013. The 2013 Credit FacilityAgreement also provides for the issuance of letters of credit in a maximuman aggregate amount equal to the lesser of $5.0 million outstandingand the Revolving Credit Commitment, which was $30.0 million as of August 14, 2013 and $15.0 million outstanding at any one time with prior written consent of the Administrative Agent and the Issuing Bank. At August 26, 2015, under the 2013November 8, 2016. The 2016 Credit Facility, the total available borrowing capacity was up to $30.7 million after applying the Lease Adjusted Leverage Ratio Limitation.Pursuant to the October 2, 2015 amendment, the total aggregate amount of lenders’ commitments was lowered to $60.0 million from $70.0 million. After applying the Lease Adjusted Leverage Ratio Limitation, the available borrowing capacity was $20.7 million.The 2013 Credit FacilityAgreement is guaranteed by all of the Company’s present subsidiaries and will be guaranteed by ourthe Company's future subsidiaries. In addition to the bank’s increased commitment under the 2013 Credit Agreement, it may be increased to a maximum commitment of $90 million.20132016 Credit Facility,Agreement, the Company has the option to elect one of two bases of interest rates. One interest rate option is the greaterhighest of (a) the Prime Rate, (b) the Federal Funds Effective Rate plus 0.50% and (c) 30-day LIBOR plus 1.00%, or (b) prime, plus, in eithereach case, an applicable spread thatthe Applicable Margin, which ranges from 0.75%1.50% to 2.25%2.50% per annum. The other interest rate option is LIBOR plus the London InterBank Offered Rate plus a spread thatApplicable Margin, which ranges from 2.50% to 4.0%3.50% per annum. The applicable spreadApplicable margin under each option is dependent upon the ratio of our debt to EBITDACompany's Consolidated Total Lease Adjusted Leverage Ratio ("CTLAL") at the most recent quarterly determination date.0.40%0.35% per annum depending on the Total Leverage RatioCTLAL at the most recent quarterly determination date.20132016 Credit FacilityAgreement are available for the Company’s general corporate purposes and general working capital purposes and capital expenditures.BorrowingsCompany to (i) pay in full all indebtedness outstanding under the 2013 Credit Facility are subject to mandatory repaymentAgreement as of November 8, 2016, (ii) pay fees, commissions, and expenses in connection with the proceedsCompany's repayment of sales of certain of the Company’s real property, subject to certain exceptions.The 2013 Credit Facility is secured by a perfected first priority lien on certain of the Company’s real property and all of the material personal property owned by the Company or any of its subsidiaries, other than certain excluded assets (as defined in the 2013 Credit Agreement). At August 26, 2015,Agreement, initial extensions of credit under the carrying value2016 Credit Agreement, and (iii) for working capital and general corporate purposes of the collateral securing the 2013 Credit Facility was $116.7 million.20132016 Credit Agreement, as amended, contains the following covenants among others:●Debt Service Coverage Ratio of not less than (i) 1.10 to 1.00 at all times during the first, second and third fiscal quarters of the Borrower’s fiscal year 2015, (ii) 1.25 to 1.00 at all times during the fourth fiscal quarter of the Borrower’s fiscal year 2015, and (iii) 1.50 to 1.00 at all times thereafter.●Lease Adjusted Leverage Ratio of not more than (i) 5.75 to 1.00 at all times during the first, second and third fiscal quarters of the Borrower’s fiscal year 2015, (ii) 5.50 to 1.00 at all times during the fourth fiscal quarter of the Borrower’s fiscal year 2015, (iii) 5.25 to 1.00 at all times during the first fiscal quarter of the Borrower’s fiscal year (iv) 5.00 to 1.00 at all times during the second fiscal quarter of the Borrower’s fiscal year 2016, and (v) 4.75 to 1.00 at all times thereafter.●capital expenditures limited to $25.0 million per year,●restrictions on incurring indebtedness, including certain guarantees and capital lease obligations,●restrictions on incurring liens on certain of our property and the property of our subsidiaries,●restrictions on transactions with affiliates and materially changing our business,●restrictions on making certain investments, loans, advances and guarantees,●restrictions on selling assets outside the ordinary course of business,●prohibitions on entering into sale and leaseback transactions,●restrictions on certain acquisitions of all or a substantial portion of the assets, property and/or equity interests of any person, including share repurchases and dividends.The Company was in compliance with the covenants contained in the Credit Agreement asis secured by substantially all of August 26, 2015.20132016 Credit Agreement also includes customary events of default. If a default occurs and is continuing, the lenders’ commitments under the 20132016 Credit FacilityAgreement may be immediately terminated and/or the companyCompany may be required to repay all amounts outstanding under the 20132016 Credit Facility.◦ ◦ ◦ ◦ ◦ ◦ 100 basis points less than the Applicable Margin for LIBOR Rate Loans 26, 2015,29, 2018, under the 2016 Credit Agreement, the Company had $37.5$39.5 million in total outstanding loans and $1.1approximately $1.3 million committed under letters of credit, which the company reissuedis used as security for the payment of insurance obligations, and $0.7approximately $0.2 million in capital lease commitments.2015, 20142018, 2017, and 20132016 was $2.3approximately $3.3 million, $1.2$2.4 million, and $0.9$2.2 million, respectively. Interest paid was approximately $2.1$2.5 million, $1.4$1.8 million, and $0.8$1.9 million in fiscal 2015, 20142018, 2017, and 2013,2016, respectively. No interest expense was allocated to discontinued operations in fiscal 2015, 20142018, 2017, or 2013. Interest2016. No interest was capitalized on properties in fiscal 2015, 2014 and 2013, in the amounts of $80, $269 thousand and zero, respectively.2018, 2017, or 2016.11.13. Impairment of Long-Lived Assets, Store Closings, Discontinued Operations and Property Held for Sale
2015
2014
2013 $ 636 $ 2,498 $ 615 (3,994 (2,357 (1,723 $ (3,358 $ 141 $ (1,108 $ 0.12 $ — $ 0.04 $ 0.12 $ — $ 0.04 August 29, 2018 August 30, 2017 August 31, 2016 (In thousands, except per share data) Provision for asset impairments and restaurant closings $ 8,917 $ 10,567 $ 1,442 Net gain on disposition of property and equipment (5,357 ) (1,804 ) (684 ) Total $ 3,560 $ 8,763 $ 758 Effect on EPS: Basic $ (0.12 ) $ (0.29 ) $ (0.03 ) Assuming dilution $ (0.12 ) $ (0.29 ) $ (0.03 ) $0.6approximate $8.9 million impairment charge in fiscal 20152018 is primarily related to assets impaired at 21 property locations, goodwill at three operating Fuddruckers restaurants.$2.5approximate $5.4 million net gain on disposition of property and equipment in fiscal 2018 is primarily related to the gain on the sale of ten properties of approximately $4.9 million, and approximately $1.3 million of insurance proceeds received for property and equipment damaged by Hurricane Harvey, partially offset by asset retirements at eight restaurant location closures. 20142017 is primarily related to one operating Luby’s Cafeteria, two operating Fuddruckers restaurants, two operating Cheeseburgerassets impaired at 17 property locations, goodwill at six property location, five properties held for sale written down to their fair value, and a reserve for ten restaurant closings of approximately $482 thousand.Paradise restaurants and nine closed Cheeseburger in Paradise restaurants.$0.6approximate $1.4 million impairment charge in fiscal 20132016 is primarily related to four property locations, goodwill at one property heldlocation, and a reserve for four restaurant closings of approximately $202 thousand.one operating Fuddruckers restaurant and one operating Koo Koo Roo Chicken Bistro ®restaurant as well as a reduction of the estimated fair valuetwo properties of used assets to be refurbished and reused.On March 24, 2014, the Company announced that it has initiated a plan focused on improving cash flow from the recently acquired Cheeseburger in Paradise leasehold locations. This underperforming Cheeseburger in Paradise leasehold disposal plan called for five or more units to be closed by the end of Fiscal 2014 and disposed of within 12 months.or converted to Fuddruckers restaurants. As of August 26, 2015, five29, 2018, no locations have been closed for disposal and reclassified toremain classified as discontinued operations. year 2010 adoption of the Company’s Cash Flow Improvement and Capital Redeployment Plan, the Company reclassified 24 Luby’s Cafeterias to discontinued operations. As of August 26, 2015, two locations remain,29, 2018, one is under lease to a third party and onelocation remains held for sale.We believe the majority of cash flows lost will not be recovered by ongoing operations and the majority of sales lost by closing will not be recovered. In addition, there will not be any ongoing involvement or significant cash flows from the closed stores. Stores we close, but do not classify as discontinued operations, follow the implementation guidance in ASC 205-20-55 because cash flows are expected to be generated by the ongoing entity. There is some migration of customer traffic to existing or new locations, and ultimately the majority of sales lost by closing these stores are expected to be eventually replaced by sales from new locations.The results of operations, assets and liabilities for all units included in the Plan have been reclassified to discontinued operations in the statement of operations and balance sheets for all periods presented.Assets related to discontinued operations include accounts receivable, accrued liabilities, prepaid expenses, deferred taxes, unimproved land, closed restaurant properties and related equipment for locations classified as discontinued operations. The following table sets forth the assets and liabilities for all discontinued operations:
2015
2014 $ 24 $ 52 $ 24 $ 52 $ 2,211 $ 2,817 1,803 1,387 $ 4,014 $ 4,204 $ 343 $ 308 74 282 $ 417 $ 590 $ 190 $ 278 $ 190 $ 278 August 29,
2018 August 30,
2017 (In thousands) Property and equipment $ 1,813 $ 1,872 Deferred tax assets — 883 Assets related to discontinued operations—non-current $ 1,813 $ 2,755 Deferred income taxes $ — $ 354 Accrued expenses and other liabilities 14 13 Liabilities related to discontinued operations—current $ 14 $ 367 Other liabilities $ 16 $ 16 Liabilities related to discontinued operations—non-current $ 16 $ 16 26, 2015,29, 2018, under both closure plans, the Company had six propertiesone property classified as discontinued operations assets and theoperations. The asset carrying value of the owned propertiesproperty was $1.9approximately $1.8 million and is included in assets related to discontinued operations. The asset carrying values of theCompany is actively marketing this property for sale and has one property with a ground leases werelease previously impaired to zero.The Company is actively marketing all but one of these properties for sale and the Company’s results of discontinued operations will be affected by the disposal of properties related to discontinued operations to the extent proceeds from the sales exceed or are less than net book value.
2015
2014
2013 $ — $ 4,691 $ 6,153 $ (1,108 $ (2,813 $ (1,926 $ 406 $ 979 $ 540 $ (702 $ (1,834 $ (1,386 0 5 0 August 29,
2018 August 30,
2017 August 31,
2016 (In thousands, except locations) Sales $ — $ — $ — Pretax loss $ (80 ) $ (28 ) $ (136 ) Income tax benefit on discontinued operations $ (534 ) $ (438 ) $ 46 Loss on discontinued operations $ (614 ) $ (466 ) $ (90 ) Discontinued locations closed during the period 0 0 0 2015, 20142018, 2017, and 2013:
2015
2014
2013 $ (1,135 $ (1,607 $ (1,268 (90 (1,199 (663 117 (7 5 $ (1,108 $ (2,813 $ (1,926 406 979 540 $ (702 $ (1,834 $ (1,386 $ (0.02 $ (0.06 $ (0.05 August 29,
2018 August 30,
2017 August 31,
2016 (In thousands, except per share data) Discontinued operating losses $ (21 ) $ (28 ) $ (161 ) Impairments (59 ) — — Gains — — 25 Net loss $ (80 ) $ (28 ) $ (136 ) Income tax benefit (expense) from discontinued operations (534 ) (438 ) 46 Loss from discontinued operations, net of income taxes $ (614 ) $ (466 ) $ (90 ) Effect on EPS from discontinued operations—decrease—basic $ (0.02 ) $ (0.02 ) $ (0.00 ) 26, 2015,29, 2018, the Company had 15 owned properties recorded at approximately $19.5 million in property held for sale. The pretax profit (loss) for the disposal group of locations operating in fiscal 2018, 2017, and 2016 was approximately $(1.2) million, $1.3 million, and $2.2 million, respectively.$4.5$3.4 million in property held for sale.At August 27, 2014, the Company had one owned properties recorded at approximately $1.0 million in property held for sale.At August 28, 2013, the Company had one owned property recorded at approximately $0.4 million in property held for sale.2015, 20142018, 2017, and 20132016 is provided below(in thousands): $ 602 0 (153 $ 449 (449 991 $ 991 (3,203 6,748 $ 4,536 Balance as of August 26, 2015 $ 4,536 Disposals (1,488 ) Net transfers to property held for sale 2,937 Adjustment to fair value $ (463 ) Balance as of August 31, 2016 $ 5,522 Disposals (1,173 ) Net transfers to property held for sale 0 Adjustment to fair value (977 ) Balance as of August 30, 2017 $ 3,372 Disposals (7,916 ) Net transfers to property held for sale 27,075 Adjustment to fair value (3,062 ) Balance as of August 29, 2018 $ 19,469 12.14. Commitments and ContingenciesConstruction Activityrestaurants.restaurants or restaurant remodels. This construction activity exposes the Company to the risks inherent in new constructionthis industry including but not limited to rising material prices, labor shortages, delays in getting required permits and inspections, adverse weather conditions, and injuries sustained by workers. The Company hashad no non-cancelable contracts as of August 26, 2015.13.15. Operating Leases26, 2015,29, 2018, the Company has lease agreements for 9588 properties which include the Company’s corporate office, facility service warehouseswarehouse, two remote office spaces, and restaurant properties. The leasing terms of the 9588 properties consist of 1013 properties expiring in less than one year, 6050 properties expiring between one and five years and the remaining 25 properties having current terms that are greater than five years. Of the 9588 leased properties, 7374 properties have options remaining to renew or extend the lease.26, 2015,29, 2018, the Company has entered into noncancelable operating lease agreements for certain office equipment with terms ranging from 36 to 7260 months.26, 201529, 2018 are as follows: 11,996 9,232 7,739 6,808 5,036 21,846 $ 62,657 Fiscal Year Ending: (In thousands) August 28, 2019 $ 10,790 August 26, 2020 8,572 August 25, 2021 6,892 August 31, 2022 5,522 August 30, 2023 4,399 Thereafter 16,640 Total minimum lease payments $ 52,815 fifteenfive to thirty30 years and some leases provide for contingent rentals based on sales in excess of a base amount.the last three fiscal years2018, 2017, and 2016 was as follows:
2015
2014
2013 $ 12,521 $ 13,160 $ 13,718 129 251 182 805 829 818 $ 13,455 $ 14,240 $ 14,718 3.4 3.6 3.8 See Note 15, “Related Parties,” for Year Ended August 29,
2018 August 30,
2017 August 31,
2016 (In thousands, except percentages) Minimum rent-facilities $ 10,584 $ 11,849 $ 12,341 Contingent rentals 77 86 164 Minimum rent-equipment 801 758 712 Total rent expense (including amounts in discontinued operations) $ 11,462 $ 12,693 $ 13,217 Percent of sales 3.1 % 3.4 % 3.3 % payments associatedpayment table and the total rent expense table above include amounts related to two leases with related parties.14.16. Share-Based CompensationEmployeeLuby's Incentive Stock Plan, as amended and restated effective December 5, 2015 (the "Employee Stock Plan") and the Nonemployee Director Stock Plan. Both plans authorize the granting of stock options, restricted stock, and other types of awards consistent with the purpose of the plans.1.1aggregate 2.1 million shares approved for issuance under the Nonemployee Director Stock Plan, 0.8(which amount includes shares authorized under the original plan and shares authorized pursuant to the amended and restated plan effective as of February 9, 2018), 1.3 million options, restricted stock units and restricted stock awards were granted, 0.1 million options were cancelled or expired and added back into the plan.plan, since the plans inception. Approximately 0.40.9 million shares remain available for future issuance as of August 26, 2015. In 2015, the Company approved a Total Shareholder Return, “TSR”, Performance Based Incentive Plan which provides for a right to receive an unspecified number of shares of common stock under the Employee Stock Plan based on the total shareholder return ranking compared to a selection of peer companies over a three-year cycle. The award value varies from 0% to 200% of a base amount, as a result of the Company’s TSR performance in comparison to its peers over the measurement period. The fair value of the performance shares liability at the end of Fiscal 2017, of $0.5 million, has been determined based on a Monte Carlo simulation model. Based on this estimate, management will accrue expense ratably over the three-year service period. As of August 26, 2015, the Company has recorded $0.1 million in non-cash compensation expense in selling, general and administrative expenses related to its TSR Performance Based Incentive Plan. The number of shares at the end of the three-year period will be determined as the award value divided by the closing stock price on the last day of fiscal 2017. A valuation estimate of the future liability associated with each fiscal year's performance award plan will be performed periodically with adjustments made to the outstanding liability at each reporting period, as appropriate.29, 2018. Compensation cost for share-based payment arrangements under the Nonemployee Director Stock Plan, recognized in selling, general and administrative expenses for fiscal years 2015, 20142018, 2017, and 20132016 was approximately $0.5 million, $0.7 million, $0.6and $0.7 million, and $0.3 million, respectively.2.64.1 million shares approved for issuance under the Employee Stock Plan 5.2(which amount includes shares authorized under the original plan and shares authorized pursuant to the amended and restated plan effective as of December 5, 2015), 7.2 million options and restricted stock units were granted, 3.03.8 million options and restricted stock units were cancelled or expired and added back into the plan.plan, since the plans inception in 2005. Approximately 0.40.7 million shares remain available for future issuance as of August 26, 2015.29, 2018. Compensation cost for share-based payment arrangements under the Employee Stock Plan, recognized in selling, general and administrative expenses for fiscal years 2015, 20142018, 2017, and 20132016 was approximately $0.9 million, $0.7$0.9 million, and $0.8$1.0 million, respectively.years 2015, 20142018, 2017, or 2013.2016. No options to purchase shares remain outstanding under this plan, as of August 26, 2015.25% on the anniversary date of each grant and expire six years from the date of the grant. However, options granted to executive officers under the Employee Stock Plan vest 50% on the first anniversary date of the grant date, 25% on the second anniversary of the grant date and the remaining 25% vest on the third anniversary of the grant date, and expirewith all options expiring ten years from the grant date. All options granted in fiscal years 2015, 20142018, 2017, and 20132016 were granted under the Employee Stock Plan. Options to purchase 1,288,0991,653,414 shares at options prices from $3.44$2.82 to $11.10$5.95 per share remain outstanding as of August 26, 2015.PlansPlan and the Nonemployee Director Stock Option Plan. The assumptions are as follows:●The Company estimated volatility using its historical share price performance over the expected life of the option. Management believes the historical estimated volatility is materially indicative of expectations about expected future volatility.●The Company uses an estimate of expected lives for options granted during the period based on historical data.●The risk-free interest rate is based on the U.S. Treasury yield curve in effect at the time of grant for the expected term of the option.●The expected dividend yield is based on the Company’s current dividend yield and the best estimate of projected dividend yield for future periods within the expected life of the option.
2015
2014
2013 0 — 0 42.30 — 44.49 1.41 — 0.72 5.61 — 4.25 No options were granted during fiscal year ended August 27, 2014. August 29,
2018 August 30,
2017 August 31,
2016 (In thousands, except percentages) Dividend yield 0 % 0 % 0 % Volatility 34.80 % 37.65 % 39.64 % Risk-free interest rate 2.19 % 1.99 % 1.82 % Expected life (in years) 5.87 5.87 5.58 the three fiscal years ended August 26, 2015, August 27, 20142018, 2017, and August 28, 20132016 is presented in the following table:
Fixed
Exercise
Remaining
Contractual
Value 1,177,769 $ 6.30 3.1 $ 1,500 109,335 5.95 0 0 (93,973 4.29 0 0 (310,363 9.85 0 0 882,768 $ 5.23 4.7 $ 2,042 (29,253 4.27 0 0 (52,761 10.30 0 0 800,754 $ 4.95 4.1 $ 583 628,060 4.49 0 0 (57,007 3.45 0 0 (83,708 5.47 0 0 1,288,099 $ 4.76 6.5 $ 350 594,549 $ 4.94 3.7 $ 240 Shares
Under
Fixed
Options Weighted-
Average
Exercise
Price Weighted-
Average
Remaining
Contractual
Term Aggregate
Intrinsic
Value (Years) (In thousands) Outstanding at August 26, 2015 1,288,099 $ 4.76 6.5 $ 350 Granted 279,944 4.89 — — Exercised (21,249 ) 3.51 — — Forfeited (55,893 ) 4.80 — — Expired (9,000 ) 3.44 — — Outstanding at August 31, 2016 1,169,238 $ 4.76 6.6 $ 178 Granted 295,869 4.26 — — Cancelled (9,290 ) 4.49 — — Forfeited (55,893 ) 4.80 — — Expired (37,689 ) 5.39 — — Outstanding at August 30, 2017 1,345,916 $ 4.64 6.4 $ 0 Granted 449,410 2.82 — — Forfeited (97,111 ) 4.02 — Expired (44,801 ) 7.89 — — Outstanding at August 29, 2018 1,653,414 $ 4.10 6.5 $ 0 Exercisable at August 29, 2018 1,066,103 $ 4.53 5.2 $ 0 current market value at August 29, 2018 and the grant price.26, 2015,29, 2018, there was approximately $0.7$0.3 million of total unrecognized compensation cost related to unvested options that are expected to be recognized over a weighted-average period of 2.21.7 years.years 20152018, 2017, and 20132016 was $1.83$1.05, $1.66, and $2.44$1.92 per share, respectively. There was no grant of options during fiscal year 2014.years 2015, 20142017 and 2013,2018, no options were exercised. During fiscal 2016 cash received from options exercised was approximately $190,000, $125,000 and $404,000, respectively.
Units
Average
Fair Value
Average
Remaining
Contractual Term 163,946 $ 4.83 1.8 274,290 6.17 (14,000 3.46 424,236 $ 5.74 2.1 63,238 7.09 (80,233 5.39 (9,404 5.79 397,837 $ 6.03 1.6 84,495 4.54 (72,915 4.55 0 409,417 $ 5.98 1.6 (Per share) (In years) Unvested at August 26, 2015 409,417 $ 5.98 1.6 Granted 172,212 4.87 — Vested (257,482 ) 6.19 — Forfeited (9,314 ) 5.37 — Unvested at August 31, 2016 314,833 $ 5.23 1.9 Granted 200,549 4.26 — Vested (92,058 ) 6.30 — Forfeited (18,960 ) 4.55 — Unvested at August 30, 2017 404,364 $ 4.54 1.8 Granted 244,748 2.83 — Vested (99,495 ) 4.42 — Forfeited (32,326 ) 3.87 — Unvested at August 29, 2018 517,291 $ 3.79 1.8 26, 2015,29, 2018, there was approximately $1.8$0.8 million of total unrecognized compensation cost related to unvested restricted stock units that is expected to be recognized over a weighted-average period of 1.61.8 years. Units Weighted Average Fair Value (Per share) Unvested at August 30, 2017 — — Granted 561,177 3.33 Vested (187,883 ) 2.64 Forfeited — — Unvested at August 29, 2018 373,294 3.68 optreceive a 20% premium of additional restricted stock by opting to receive 20% more shares of restricted stock awards by accepting more than theover a minimum required amount of stock, insteadin lieu of cash. The number of shares granted is valued at the average of the high and low price of the Company’s stock at the date of the grant. Restricted stock awards vest when granted because they are granted in lieu of a cash payment. However, directors are restricted from selling their shares until after the third anniversary of the date of the grant.aan unfunded Supplemental Executive Retirement Plan (“SERP”) designed to provide benefits for selected officers at normal retirement age with 25 years of service equal to 50% of their final average compensation offset by Social Security, profit sharing benefits, and deferred compensation. None of the Company’s executive officers participates in the Supplemental Executive Retirement Plan. Some of the officers designated to participate in the plan have retired and are receiving benefits under the plan. Accrued benefits of all actively employed participants become fully vested upon termination of the plan or a change in control (as defined in the plan). The plan is unfunded and the Company is obligated to make benefit payments solely on a current disbursement basis. On December 6,In 2005, the Board of Directors voted to amend the SERP and suspend the further accrual of benefits and participation. As a result, a curtailment gain of approximately $88,000 was recognized. The net benefit recognized for the SERP for the years ended August 26, 2015,29, 2018, August 27, 201430, 2017, and August 28, 2013,31, 2016, was zero, and the unfunded accrued liability included in “Other Liabilities” on the Company’s consolidated Balance Sheets as of August 26, 201529, 2018 and August 27, 201430, 2017 was approximately $71,000$39 thousand and $83,000,$45 thousand, respectively.Under the, nonemployee directors deferred portions of their retainer and meeting fees which, along with certain matching incentives, were credited to phantom stock accounts in the form of phantom shares priced at the market value of the Company’s common stock on the date of grant. Additionally, the phantom stock accounts were credited with dividends, if any, paid on the common stock represented by phantom shares.. Authorized shares (100,000 shares) under the Phantom Stock Plan were fully depleted in early fiscal year 2003; since that time, no deferrals, incentives or dividends have been credited to phantom stock accounts. As participants cease to be directors, their phantom shares are converted into an equal number of shares of common stock and issued from the Company’s treasury stock. As of August 26, 2015, 29,62729, 2018, 17,801 phantom shares remained unissuedoutstanding and unconverted under the Phantom Stock Plan.401(k) Plan26, 2015,29, 2018, August 27, 201430, 2017, and August 28, 2013,31, 2016, was $261,000, $501,000approximately $243 thousand, $359 thousand, and $421,000,$350 thousand, respectively.15.17. Related PartiesDecember 9, 2005August 2, 2017 among the Company and the Pappas entities.2015, 20142018, 2017, and 20132016 were approximately zero, $4,000$31 thousand, $4 thousand, and zero,$2 thousand, respectively. The decreaseCompany also incurred $2 thousand of other operating expenses in fiscal 2013 was primarily due to fewer restaurant openings in fiscal year 2013 than fiscal 2012.2018 from the Pappas entities. Services provided under this agreement are subject to review and approval by the Finance and Audit Committee of the Company’s Board of Directors. The Company made payments of approximately $416,000 $388,000 and $426,000 in fiscal years 2015, 2014 and 2013, respectively, under the lease agreement which currently includes an annual base rate of $22.00 per square foot.is currently obligated to paypaid rent of $22.00 per square foot plus maintenance, taxes, and insurance during the remaining primary term of the lease. Thereafter, the lease provides for reasonable increases in rent at set intervals. The Company made payments of approximately $460 thousand, $419 thousand, and $417 thousand, in fiscal 2018, 2017, and 2016, respectively, under the lease agreement. The new lease agreement was approved by the Finance and Audit Committee. year 2014, on March 12, 2014, the Company executed a new lease agreement whichfor one of the Company’s Houston Fuddruckers location was purchased from a prior landlord bylocations with Pappas Restaurants, Inc., a 100% undivided interest. No changes were made to our lease terms as a result of the transfer of ownership. The lease provides for a primary term of approximately six years with two subsequent five-year options. Pursuant to the new ground lease agreement, the Company is currently obligated to pay $27.56paid rent of $28.06 per square foot plus maintenance, taxes, and insurance from March 12, 2014 until November 30. 2016.May 31, 2020. Thereafter, the new ground lease agreement provides for reasonable increases in rent at set intervals. The Company made payments of $159,900$168 thousand, $162 thousand, and $79,950 during$160 thousand, in fiscal years 20152018, 2017, and 2014,2016, respectively.2.1% and 2.0%2.6% of total rents for continuing operations for fiscal years 2015, 20142018, 2017, and 2013,2016, respectively. of Directors of Amegy Bank, National Association,a Division of ZB, N.A. (formerly, Amegy Bank, N.A.), which iswas a lender and syndication agent under the Company’s 2013 Revolving Credit Facility.In December 2014, Christopher Pappas and thean amendment to Mr. Pappas’ existinga new employment agreement to extend thewith Christopher Pappas on December 11, 2017. The new employment agreement contains a termination date thereof toof August 2016.28, 2019. Mr. Pappas continues to devote his primary time and business efforts to the Company while maintaining his role at Pappas Restaurants, Inc.On December 20, 2011, the Board of Directors of the Company approved the renewal of a consultant agreement with Ernest Pekmezaris, the Company’s former Chief Financial Officer. The agreement expired on July 31, 2013. Under the agreement, Mr. Pekmezaris furnished to the Company advisory and consulting services related to finance and accounting matters and other related consulting services. Mr. Pekmezaris is also the Treasurer of Pappas Restaurants, Inc. Compensation for the services provided by Mr. Pekmezaris to Pappas Restaurants, Inc. is paid entirely by that entity. Chief Operating Officer, and formerly the Company’s Senior Vice President, Administration, General Counsel and Secretary, is an attorney and stepson of Frank Markantonis, who is a director of the Company.16.18. Common Stock26, 2015,29, 2018, the Company had 500,000 shares of common stock reserved for issuance upon the exercise of outstanding stock options.17.19. Earnings Per Share
2015
2014
2013 $ (1,372 $ (1,613 $ 4,547 $ (2,074 $ (3,447 $ 3,161 28,974 28,812 28,618 — — 248 28,974 28,812 28,866 $ (0.05 $ (0.06 $ 0.16 $ (0.05 $ (0.06 $ 0.16 $ (0.07 $ (0.12 $ 0.11 $ (0.07 $ (0.12 $ 0.11 (a)Potentially dilutive shares not included in the computation of net income per share because to do so would have been antidilutive amounted to77,000 in fiscal year 2015,180,000 in fiscal year 2014 and zero shares in fiscal year 2013. Additionally, stock options with exercise prices exceeding market close prices that were excluded from the computation of net income per share amounted to415,000 shares in fiscal year 2015,143,000 shares in fiscal year 2014 and67,000 shares in fiscal year 2013. August 29,
2018 August 30,
2017 August 31,
2016 (In thousands, except per share data) Numerator: Loss from continuing operations $ (32,954 ) $ (22,796 ) $ (10,256 ) NET LOSS $ (33,568 ) $ (23,262 ) $ (10,346 ) Denominator: Denominator for basic earnings per share—weighted-average shares 29,901 29,476 29,226 Effect of potentially dilutive securities: Employee and non-employee stock options — — — Denominator for earnings per share assuming dilution 29,901 29,476 29,226 Loss from continuing operations: Basic $ (1.10 ) $ (0.77 ) $ (0.35 ) $ (1.10 ) $ (0.77 ) $ (0.35 ) Net loss per share: Basic $ (1.12 ) $ (0.79 ) $ (0.35 ) $ (1.12 ) $ (0.79 ) $ (0.35 ) 18.21. Quarterly Financial Informationyears 20152018 and 2014.
2015
2015
2015
2014 $ 115,361 $ 88,788 $ 85,486 $ 80,557 2,197 1,578 1,605 1,581 4,408 3,624 3,771 4,598 175 112 119 125 122,141 94,102 90,981 86,861 141 2,532 (1,229 (2,816 (190 (179 (130 (203 (49 2,353 (1,359 (3,019 — 0.08 (0.05 (0.11 — 0.08 (0.05 (0.11 28.5 28.4 29.8 29.2 34.3 33.8 34.5 35.6 17.7 16.1 16.6 17.6 5.4 5.4 5.8 6.1
2014
2014
2014
2013 $ 115,375 $ 90,010 $ 82,930 $ 79,952 2,284 1,684 1,545 1,514 5,772 4,534 3,979 4,270 174 131 115 112 123,605 96,359 88,569 85,848 (1,081 1,742 (1,581 (693 (366 (12 (603 (853 (1,447 1,730 (2,184 (1,546 (0.05 0.06 (0.08 (0.05 (0.05 0.06 (0.08 (0.05 29.1 28.6 29.0 28.6 34.5 32.9 34.9 34.7 17.5 15.8 16.3 17.2 6.1 5.5 6.2 6.0
2017.(a)The quarters endedAugust 26, 2015 and August27, 2014 consists of four four-week periods. All other quarters presented represent three four-week periods. August 29,
2018 June 6,
2018 March 14,
2018 December 20,
2017 (84 days) (84 days) (84 days) (112 days) (In thousands, except per share data) Restaurant sales $ 75,782 $ 77,803 $ 74,351 $ 104,582 Franchise revenue 1,633 1,444 1,401 1,887 Culinary contract services 6,369 6,639 5,889 6,885 Vending revenue 119 118 151 143 Total sales $ 83,903 $ 86,004 $ 81,792 $ 113,497 Loss from continuing operations (1,858 ) (14,133 ) (11,461 ) (5,502 ) Loss from discontinued operations (6 ) (463 ) (110 ) (35 ) Net loss $ (1,864 ) $ (14,596 ) $ (11,571 ) $ (5,537 ) Net loss per share: Basic $ (0.06 ) $ (0.48 ) $ (0.39 ) $ (0.19 ) Assuming dilution $ (0.06 ) $ (0.48 ) $ (0.39 ) $ (0.19 ) Cost of food 27.8 % 28.6 % 28.5 % 28.5 % Payroll and related costs 37.5 % 37.8 % 38.3 % 36.5 % Other operating expenses 17.7 % 19.3 % 19.3 % 18.6 % Occupancy costs 6.4 % 5.9 % 6.3 % 6.0 % Quarter Ended August 30, 2017 June 7,
2017 March 15,
2017 December 21,
2016 (91 days) (84 days) (84 days) (112 days) (In thousands, except per share data) Restaurant sales $ 79,078 $ 82,594 $ 81,064 $ 108,082 Franchise revenue 1,556 1,477 1,819 1,871 Culinary contract services 5,825 4,515 3,306 4,297 Vending revenue 130 133 125 159 Total sales $ 86,589 $ 88,719 86,314 $ 114,409 Loss from continuing operations (4,069 ) (377 ) (12,836 ) (5,514 ) Loss from discontinued operations (32 ) (19 ) (343 ) (72 ) Net loss $ (4,101 ) $ (396 ) $ (13,179 ) $ (5,586 ) Net loss per share: Basic $ (0.14 ) $ (0.01 ) $ (0.45 ) $ (0.19 ) Assuming dilution $ (0.14 ) $ (0.01 ) $ (0.45 ) $ (0.19 ) Cost of food 28.3 % 27.8 % 27.9 % 28.5 % Payroll and related costs 36.1 % 35.7 % 36.1 % 35.8 % Other operating expenses 18.6 % 16.7 % 17.0 % 18.2 % Occupancy costs 6.4 % 6.0 % 6.6 % 6.0 % 26, 2015.29, 2018. Based on that evaluation, our Chief Executive Officer and Chief Financial Officer have concluded that, as of August 26, 2015,29, 2018, our disclosure controls and procedures were effective in providing reasonable assurance that information required to be disclosed by us in the reports that we file or submit under the Exchange Act is (i) recorded, processed, summarized and reported within the time periods specified in the SEC’s rules and forms and (ii) accumulated and communicated to the issuer’s management, including its principal executive and principal financial officers, or persons performing similar functions, as appropriate to allow timely decisions regarding required disclosure.26, 2015.26, 2015,29, 2018, as stated in their attestation report which is included under Item 8 of this report.26, 201529, 2018 that have materially affected, or are reasonably likely to materially affect, our internal control over financial reporting.None 20162019 annual meeting of shareholders appearing therein under the captions “Election of Directors,” “Corporate Governance,” “Section 16(a) Beneficial Ownership Reporting Compliance,” “Executive Officers,” and “Certain Relationships and Related Transactions.”boardBoard of directors,Directors, and Supplemental Standards of Conduct and Ethics for the Chief Executive Officer, Chief Financial Officer, Controller, and all senior financial officers. This Policy Guide and the Supplemental Standards were filed as exhibits to the Annual Report on Form 10-K for the fiscal year ended August 26, 2003 and can be found on our website at www.lubys.com. We intend to satisfy the disclosure requirement under Item 5.05 of Form 8-K regarding amendments to or waivers from the code of ethics or supplementary code of ethics by posting such information on our website at www.lubys.com.20162019 annual meeting of shareholders appearing therein under the captions “Compensation Discussion and Analysis—Executive Compensation,” “—Executive Compensation Committee Report,” “—Compensation Tables and Information,” “—Director Compensation,” and “Corporate Governance—Executive Compensation Committee—Compensation Committee Interlocks.”20162019 annual meeting of shareholders appearing therein under the captions “Ownership of Equity Securities in the Company” and “Principal Shareholders.”20162019 annual meeting of shareholders appearing therein under the captions, “Corporate Governance Guidelines—Director Independence” and “Certain Relationships and Related Transactions.”20162019 annual meeting of shareholders appearing therein under the caption “Fees Paid To The Independent Registered Public Accounting Firm.” PART IVThe following financial statements are filed as part of this Report: Consolidated balance sheets at August 26, 201529, 2018 and August 27, 2014.30, 2017.Consolidated statements of operations for each of the three years in the period ended August 26, 2015.29, 2018.Consolidated statements of shareholders’ equity for each of the three years in the period ended August 26, 2015. 29, 2018. Consolidated statements of cash flows for each of the three years in the period ended August 26, 2015.29, 2018.Notes to consolidated financial statements Reports of Independent Registered Public Accounting Firm Grant Thornton LLP 3(a)3(a) 4(a)Rights Agreement dated January 27, 2011 between4(b)First Amendment to Rights Agreement, dated as of December 3, 2013, between Luby’s, Inc. and American Stock Transfer & Trust Company, LLC (incorporated by reference to Exhibit 4.2 to the Company’s Current Report on Form 8-K filed on December 3, 2013 (File No. 001-08308)).10(a)Credit Agreement dated as of November 9, 2009, among the Company, the lenders party thereto, Wells Fargo Bank, National Association, as Administrative Agent, and Amegy Bank, National Association, as Syndication Agent (incorporated by reference to Exhibit 4(l) to the Company’s Annual Report on Form 10-K for the fiscal year ended August 26, 2009, filed November 9, 2009 (File No. 001-08308)).10(b)First Amendment to Credit Agreement, dated as of January 31, 2010, among the Company, the lenders from time to time party thereto, Wells Fargo Bank, National Association, as Administrative Agent, and Amegy Bank National Association, as Syndication Agent (incorporated by reference to Exhibit 4.1 to the Company’s Quarterly Report on Form 10-Q for the quarter ended February 10, 2010, filed on March 19, 2010 (File No. 001-08308)).10(c)Second Amendment to Credit Agreement, dated as of July 26, 2010, among the Company, the lenders from time to time party thereto, Wells Fargo Bank, National Association, as administrative agent, and Amegy Bank National Association, as syndication agent (incorporated by reference to Exhibit 10.3 to the Company’s Current Report on Form 8-K filed on July 27, 2010 (File No. 001-08308)).10(d)Third Amendment to Credit Agreement, dated as of September 30, 2010, among the Company, the lenders from time to time party thereto, Wells Fargo Bank, National Association, as administrative agent, and Amegy Bank National Association, as syndication agent (incorporated by reference to Exhibit 4(f) to the Company’s Annual Report on Form 10-K for the fiscal year ended August 25, 2010, filed on November 8, 2010 (File No. 001-08308)).10(e)Fourth Amendment to Credit Agreement, dated as of October 30, 2010, among the Company, the lenders from time to time party thereto, Wells Fargo Bank, National Association, as administrative agent, and Amegy Bank National Association, as syndication agent (incorporated by reference to Exhibit 4(g) to the Company’s Annual Report on Form 10-K for the fiscal year ended August 25, 2010, filed on November 8, 2010 (File No. 001-08308)).10(f)Fifth Amendment to Credit Agreement, dated, effective as of August 25, 2011, among the Company, the lenders from time to time party thereto, Wells Fargo Bank, National Association, as administrative agent, and Amegy Bank National Association, as syndication agent31, 2018 (incorporated by reference to Exhibit 10.1 to the Company’s Current Report on Form 8-K filed on August 30, 201131, 2018 (File No. 001-08308)). 10(g)Sixth Amendment to Credit 10(h)Seventh Amendment to Credit Agreement, dated as of February 14, 2013, among the Company, the lenders from time to time party thereto, Wells Fargo Bank, National Association, as administrative agent, and Amegy Bank National Association, as syndication agent (incorporated by reference to Exhibit 10.2 to the Company’s Quarterly Report on Form 10-Q for the quarter ended February 13, 2013, filed on March 25, 2013 (File No. 001-08308)).10(i)Credit Agreement, dated as of August 14, 2013, among the Company, the lenders from time to time party thereto, Wells Fargo Bank, National Association, as administrative agent, and Amegy Bank National Association, as syndication agent (incorporated by reference to Exhibit 10.1 to the Company’s Current Report on Form 8-K filed August 19, 2013 (File No. 001-08308)).10(j)First Amendment to Credit Agreement, dated as March 21, 2014, among the Company, the lenders from time to time party thereto, Wells Fargo Bank, National Association, as administrative agent, and Amegy Bank National Association, as syndication agent (incorporated by reference to Exhibit 10.1 to the Company's Current Report on Form 8-K filed on March 27, 2014 (File No. 001-08308)).10(k)Second Amendment to Credit Agreement, dated as November 7, 2014, among the Company, the lenders from time to time party thereto, Wells Fargo Bank, National Association, as administrative agent, and Amegy Bank National Association, as syndication agent (incorporated by reference to Exhibit 10.1 to the Company's Current Report on Form 8-K filed on November 12, 2014 (File No. 001-08308)).10(l)Third Amendment to Credit Agreement, dated as October 2, 2015, among the Company, the lenders from time to time party thereto, Wells Fargo Bank, National Association, as administrative agent, and Amegy Bank National Association, as syndication agent (incorporated by reference to Exhibit 10.1 to the Company's Current Report on Form 8-K filed on October 6, 2015 (File No. 001-08308)).10(m)Nonemployee Director Deferred Compensation Plan of Luby’s Cafeterias, Inc. adopted October 27, 1994 (incorporated by reference to Exhibit 10(g) to the Company’s Quarterly Report on Form 10-Q for the quarter ended November 30, 1994, filed on January 11, 1995 (File No. 001-08308)).*10(n)Amendment to Nonemployee Director Deferred Compensation Plan of Luby’s Cafeterias, Inc. adopted January 14, 1997 (incorporated by reference to Exhibit 10(m) to the Company’s Quarterly Report on Form 10-Q for the quarter ended February 28, 1997, filed on April 11, 1997 (File No. 001-08308)).*10(o)Amendment to Nonemployee Director Deferred Compensation Plan of Luby’s Cafeterias, Inc. adopted March 19, 1998 (filed as Exhibit 10(o) to the Company’s Quarterly Report on Form 10-Q for the quarter ended February 28, 1998, filed on April 13, 1998 (File No. 001-08308)).*10(p)Amended and Restated Nonemployee Director Stock Plan of Luby’s, Inc. adopted January 20, 2005, as amended January 24, 2007, as amended April 14, 2008 (filed as Exhibit 10(f) to the Company’s Annual Report on Form 10-K for the fiscal year ended August 27, 2008, filed on November 7, 2008 (File No. 001-08308)).*10(q)10(r)Luby’s Cafeterias, Inc. Supplemental Executive Retirement Plan dated May 30, 1996 (incorporated by reference to Exhibit 10(j) to the Company’s Annual Report on Form 10-K for the fiscal year ended August 31, 1996, filed on November 26, 1996 (File No. 001-08308)).*10(s)Amendment to Luby’s Cafeterias, Inc. Supplemental Executive Retirement Plan adopted January 14, 1997 (incorporated by reference to Exhibit 10(r) to the Company’s Quarterly Report on Form 10-Q for the quarter ended February 28, 1997, filed on April 11, 1997 (File No. 001-08308)).*10(t)Amendment to Luby’s Cafeterias, Inc. Supplemental Executive Retirement Plan adopted January 9, 1998 (incorporated by reference to Exhibit 10(u) to the Company’s Quarterly Report on Form 10-Q for the quarter ended February 28, 1998, filed April 13, 1998 (File No. 001-08308)).*10(u)Amendment to Luby’s Cafeterias, Inc. Supplemental Executive Retirement Plan adopted May 21, 1999 (incorporated by reference to Exhibit 10(q) to the Company’s Quarterly Report on Form 10-Q for the quarter ended May 31, 1999, filed July 14, 1999 (File No. 001-08308)).*10(v)Luby’s Incentive Stock Plan adopted October 16, 1998 (incorporated by reference to Exhibit 10(cc) to the Company’s Annual Report on Form 10-K for the fiscal year ended August 31, 1998, filed November 25, 1998 (File No. 001-08308)).*10(w)Amended and Restated Luby’s Incentive Stock Plan adopted January 19, 2006 (incorporated by reference to Exhibit 10(ee) to the Company’s Quarterly Report on Form 10-Q for the quarter ended February 15, 2006, filed March 28, 2006 (File No. 001-08308)).*10(x)10(y)Asset Purchase Agreement, dated as of June 23, 2010, by and among Luby’s, Inc., Fuddruckers, Inc., Magic Brands, LLC, Atlantic Restaurant Ventures, Inc., R. Wes, Inc., Fuddruckers of Howard County, LLC and Fuddruckers of White Marsh, LLC (incorporated by reference to Exhibit 10.1 to the Company’s Current Report on Form 8-K filed on June 29, 2010 (File No. 001-08308)). 10(z)Amendment to Asset Purchase Agreement, dated as of July 26, 2010, by and among Luby’s Fuddruckers Restaurants, LLC, Fuddruckers, Inc., Magic Brands, LLC, Atlantic Restaurant Ventures, Inc., R. Wes, Inc., Fuddruckers of Howard County, LLC and Fuddruckers of White Marsh, LLC (incorporated by reference to Exhibit 10.1 to the Company’s Current Report on Form 8-K filed on July 27, 2010 (File No. 001-08308)).10(aa)10(bb)10(cc)10(dd)10(ee)Amended and Restated Master Sales Agreement effective May 28, 2015, by and among Luby’s, Inc., Pappas Restaurants, L.P., and Pappas Restaurants, Inc. 10(ff)10(gg)First Amendment to Employment Agreement dated December 1, 2014, between Luby’s, Inc. and Christopher J. Pappas (incorporated by reference to Exhibit 10.1 to the Company’sCompany's Current Report on Form 8-K filed on December 3, 201412, 2017 (File No. 001-08308)).* 10(hh)10(ii)1114(a)10(l) 10(m) 10(n) 10(o) 10(p) 10(q) 10(r) 10(s) 10(t) 14(a) 101.INS101.INS XBRL Instance Document ** Denotes management contract or compensatory plan or arrangement. **Information required to be presented in Exhibit 11 is provided in Note 17 “Earnings Per Share” of the Notes to Consolidated Financial Statements under Part II, Item 8 of this Form 10-K in accordance with the provisions of FASB Statement of Financial Accounting Standards (SFAS) No. 128, Earnings per Share.SIGNATURESNovember 9, 2015DateLUBY’S, INC.(Registrant)November 16, 2018 By:Date (Registrant) By: /s/ CHRISTOPHER J. PAPPAS Signature and Title 9, 20159, 2015/S/ PETER TROPOLI November 9, 2015Peter Tropoli, Director and Chief Operating Officer9, 2015/S/ HARRIS J. PAPPASNovember 9, 2015Harris J. Pappas, Director/S/ JUDITH B. CRAVENNovember 9, 2015Judith B. Craven, Director/S/ ARTHUR R. EMERSON November 9, 2015Arthur R. Emerson, Director/S/ JILL GRIFFINNovember 9, 2015Jill Griffin, Director/S/ J.S.B. JENKINSNovember 6 2015J.S.B. Jenkins, Director/S/ FRANK MARKANTONIS November 9, 2015Frank Markantonis, Director/S/ JOE C. MCKINNEY November 9, 2015Joe C. McKinney, DirectorEXHIBIT INDEX3(a)Amended and Restated Certificate of Incorporation of Luby’s, Inc. (incorporated by reference to Exhibit 3.1 to the Company’s Quarterly Report on Form 10-Q for the quarter ended February 11, 2009, filed on March 20, 2009 (File No. 001-08308)).3(b)Bylaws of Luby’s, Inc., as amended through July 9, 2008 (incorporated by reference to Exhibit 3.1 to the Company’s Current Report on Form 8-K filed on July 14, 2008 (File No. 001-08308)). 3(c)Amendment to Bylaws of Luby’s, Inc. (incorporated by reference to Exhibit 3.1 to the Company’s Current Report on Form 8-K filed on October 6, 2015 (File No. 001-08308)).Peter Tropoli, Director 4(a)Rights Agreement dated January 27, 2011 between Luby’s, Inc. and American Stock Transfer & Trust Company, LLC, as Rights Agent (incorporated by reference to Exhibit 4.1 to the Company’s Current Report on Form 8-K filed on February 2, 2011 (File No. 001-08308)).Harris J. Pappas, Director 4(b)First Amendment to Rights Agreement, dated as of December 3, 2013, between Luby’s, Inc. and American Stock Transfer & Trust Company, LLC (incorporated by reference to Exhibit 4.2 to the Company’s Current Report on Form 8-K filed on December 3, 2013 (File No. 001-08308)).10(a)Credit Agreement dated as of November 9, 2009, among the Company, the lenders party thereto, Wells Fargo Bank, National Association, as Administrative Agent, and Amegy Bank, National Association, as Syndication Agent (incorporated by reference to Exhibit 4(l) to the Company’s Annual Report on Form 10-K for the fiscal year ended August 26, 2009, filed November 9, 2009 (File No. 001-08308)). 10(b)First Amendment to Credit Agreement, dated as of January 31, 2010, among the Company, the lenders from time to time party thereto, Wells Fargo Bank, National Association, as Administrative Agent, and Amegy Bank National Association, as Syndication Agent (incorporated by reference to Exhibit 4.1 to the Company’s Quarterly Report on Form 10-Q for the quarter ended February 10, 2010, filed on March 19, 2010 (File No. 001-08308)).Gerald W. Bodzy, Director 10(c)Second Amendment to Credit Agreement, dated as of July 26, 2010, among the Company, the lenders from time to time party thereto, Wells Fargo Bank, National Association, as administrative agent, and Amegy Bank National Association, as syndication agent (incorporated by reference to Exhibit 10.3 to the Company’s Current Report on Form 8-K filed on July 27, 2010 (File No. 001-08308)).Judith B. Craven, Director 10(d)Third Amendment to Credit Agreement, dated as of September 30, 2010, among the Company, the lenders from time to time party thereto, Wells Fargo Bank, National Association, as administrative agent, and Amegy Bank National Association, as syndication agent (incorporated by reference to Exhibit 4(f) to the Company’s Annual Report on Form 10-K for the fiscal year ended August 25, 2010, filed on November 8, 2010 (File No. 001-08308)).Jill Griffin, Director 10(e)Fourth Amendment to Credit Agreement, dated as of October 30, 2010, among the Company, the lenders from time to time party thereto, Wells Fargo Bank, National Association, as administrative agent, and Amegy Bank National Association, as syndication agent (incorporated by reference to Exhibit 4(g) to the Company’s Annual Report on Form 10-K for the fiscal year ended August 25, 2010, filed on November 8, 2010 (File No. 001-08308)).Frank Markantonis, Director 10(f)Fifth Amendment to Credit Agreement, dated as of August 25, 2011, among the Company, the lenders from time to time party thereto, Wells Fargo Bank, National Association, as administrative agent, and Amegy Bank National Association, as syndication agent (incorporated by reference to Exhibit 10.1 to the Company’s Current Report on Form 8-K filed on August 30, 2011 (File No. 001-08308)).Joe C. McKinney, Director 10(g)Sixth Amendment to Credit Agreement, dated as of October 20, 2011, among the Company, the lenders from time to time party thereto, Wells Fargo Bank, National Association, as administrative agent, and Amegy Bank National Association, as syndication agent (incorporated by reference to Exhibit 4(i) to the Company’s Annual Report on Form 10-K for the fiscal year ended August 29, 2012, filed on November 13, 2012 (File No. 001-08308)).10(h)Seventh Amendment to Credit Agreement, dated as of February 14, 2013, among the Company, the lenders from time to time party thereto, Wells Fargo Bank, National Association, as administrative agent, and Amegy Bank National Association, as syndication agent (incorporated by reference to Exhibit 10.2 to the Company’s Quarterly Report on Form 10-Q for the quarter ended February 13, 2013, filed on March 25, 2013 (File No. 001-08308)).10(i)Credit Agreement, dated as of August 14, 2013, among the Company, the lenders from time to time party thereto, Wells Fargo Bank, National Association, as administrative agent, and Amegy Bank National Association, as syndication agent (incorporated by reference to Exhibit 10.1 to the Company’s Current Report on Form 8-K filed August 19, 2013 (File No. 001-08308)).10(j)First Amendment to Credit Agreement, dated as March 21, 2014, among the Company, the lenders from time to time party thereto, Wells Fargo Bank, National Association, as administrative agent, and Amegy Bank National Association, as syndication agent (incorporated by reference to Exhibit 10.1 to the Company's Current Report on Form 8-K filed on March 27, 2014 (File No. 001-08308)).10(k)Second Amendment to Credit Agreement, dated as November 7, 2014, among the Company, the lenders from time to time party thereto, Wells Fargo Bank, National Association, as administrative agent, and Amegy Bank National Association, as syndication agent (incorporated by reference to Exhibit 10.1 to the Company's Current Report on Form 8-K filed on November 12, 2014 (File No. 001-08308)).10(l)Third Amendment to Credit Agreement, dated as October 2, 2015, among the Company, the lenders from time to time party thereto, Wells Fargo Bank, National Association, as administrative agent, and Amegy Bank National Association, as syndication agent (incorporated by reference to Exhibit 10.1 to the Company's Current Report on Form 8-K filed on October 6, 2015 (File No. 001-08308)).10(m)Nonemployee Director Deferred Compensation Plan of Luby’s Cafeterias, Inc. adopted October 27, 1994 (incorporated by reference to Exhibit 10(g) to the Company’s Quarterly Report on Form 10-Q for the quarter ended November 30, 1994, filed on January 11, 1995 (File No. 001-08308)).*10(n)Amendment to Nonemployee Director Deferred Compensation Plan of Luby’s Cafeterias, Inc. adopted January 14, 1997 (incorporated by reference to Exhibit 10(m) to the Company’s Quarterly Report on Form 10-Q for the quarter ended February 28, 1997, filed on April 11, 1997 (File No. 001-08308)).*10(o)Amendment to Nonemployee Director Deferred Compensation Plan of Luby’s Cafeterias, Inc. adopted March 19, 1998 (filed as Exhibit 10(o) to the Company’s Quarterly Report on Form 10-Q for the quarter ended February 28, 1998, filed on April 13, 1998 (File No. 001-08308)).*10(p)Amended and Restated Nonemployee Director Stock Plan of Luby’s, Inc. adopted January 20, 2005, as amended January 24, 2007, as amended April 14, 2008 (filed as Exhibit 10(f) to the Company’s Annual Report on Form 10-K for the fiscal year ended August 27, 2008, filed on November 7, 2008 (File No. 001-08308)).*10(q)Second Amended and Restated Nonemployee Director Stock Plan of Luby’s, Inc. adopted January 25, 2013 (incorporated by reference to Exhibit 10.1 to the Company’s Quarterly Report on Form 10-Q for the quarter ended February 13, 2013, filed March 25, 2013 (File No. 001-08308)).*10(r)Luby’s Cafeterias, Inc. Supplemental Executive Retirement Plan dated May 30, 1996 (incorporated by reference to Exhibit 10(j) to the Company’s Annual Report on Form 10-K for the fiscal year ended August 31, 1996, filed on November 26, 1996 (File No. 001-08308)).*10(s)Amendment to Luby’s Cafeterias, Inc. Supplemental Executive Retirement Plan adopted January 14, 1997 (incorporated by reference to Exhibit 10(r) to the Company’s Quarterly Report on Form 10-Q for the quarter ended February 28, 1997, filed on April 11, 1997 (File No. 001-08308)).*10(t)Amendment to Luby’s Cafeterias, Inc. Supplemental Executive Retirement Plan adopted January 9, 1998 (incorporated by reference to Exhibit 10(u) to the Company’s Quarterly Report on Form 10-Q for the quarter ended February 28, 1998, filed April 13, 1998 (File No. 001-08308)).*10(u)Amendment to Luby’s Cafeterias, Inc. Supplemental Executive Retirement Plan adopted May 21, 1999 (incorporated by reference to Exhibit 10(q) to the Company’s Quarterly Report on Form 10-Q for the quarter ended May 31, 1999, filed July 14, 1999 (File No. 001-08308)).*10(v)Luby’s Incentive Stock Plan adopted October 16, 1998 (incorporated by reference to Exhibit 10(cc) to the Company’s Annual Report on Form 10-K for the fiscal year ended August 31, 1998, filed November 25, 1998 (File No. 001-08308)).*10(w)Amended and Restated Luby’s Incentive Stock Plan adopted January 19, 2006 (incorporated by reference to Exhibit 10(ee) to the Company’s Quarterly Report on Form 10-Q for the quarter ended February 15, 2006, filed March 28, 2006 (File No. 001-08308)).*
9810(x)Registration Rights Agreement dated March 9, 2001, by and among Luby’s, Inc., Christopher J. Pappas, and Harris J. Pappas (incorporated by reference to Exhibit 10.4 to the Company’s Current Report on Form 8-K filed March 15, 2001 (File No. 001-08308)).10(y)Asset Purchase Agreement, dated as of June 23, 2010, by and among Luby’s, Inc., Fuddruckers, Inc., Magic Brands, LLC, Atlantic Restaurant Ventures, Inc., R. Wes, Inc., Fuddruckers of Howard County, LLC and Fuddruckers of White Marsh, LLC (incorporated by reference to Exhibit 10.1 to the Company’s Current Report on Form 8-K filed on June 29, 2010 (File No. 001-08308)).10(z)Amendment to Asset Purchase Agreement, dated as of July 26, 2010, by and among Luby’s Fuddruckers Restaurants, LLC, Fuddruckers, Inc., Magic Brands, LLC, Atlantic Restaurant Ventures, Inc., R. Wes, Inc., Fuddruckers of Howard County, LLC and Fuddruckers of White Marsh, LLC (incorporated by reference to Exhibit 10.1 to the Company’s Current Report on Form 8-K filed on July 27, 2010 (File No. 001-08308)).10(aa)Luby’s, Inc. Amended and Restated Nonemployee Director Phantom Stock Plan effective September 28, 2001 (incorporated by reference to Exhibit 10(dd) to the Company’s Quarterly Report on Form 10-Q for the quarter ended February 13, 2002, filed on March 29, 2002 (File No. 001-08308)).*10(bb)Form of Indemnification Agreement entered into between Luby’s, Inc. and each member of its Board of Directors initially dated July 23, 2002 (incorporated by reference to Exhibit 10(gg) to the Company’s Annual Report on Form 10-K for the fiscal year ended August 28, 2002, filed on November 27, 2002 (File No. 001-08308)).10(cc)Amended and Restated Master Sales Agreement effective November 16, 2011, by and among Luby’s, Inc., Pappas Restaurants, L.P., and Pappas Restaurants, Inc. (incorporated by reference to Exhibit 10.1 to the Company’s Quarterly Report on Form 10-Q for the quarter ended May 9, 2012, filed on June 15, 2012 (File No. 001-08308)).10(dd)Amended and Restated Master Sales Agreement effective November 8, 2013, by and among Luby’s, Inc., Pappas Restaurants, L.P., and Pappas Restaurants, Inc. (incorporated by reference to Exhibit 10 (u) to the Company’s Annual Report on Form 10-K for the fiscal year ended August 28, 2013, filed on November 12, 2013 (File No. 001-08308)).10(ee)Amended and Restated Master Sales Agreement effective May 28, 2015, by and among Luby’s, Inc., Pappas Restaurants, L.P., and Pappas Restaurants, Inc.10(ff)Employment Agreement dated January 24, 2014, between Luby’s, Inc. and Christopher J. Pappas (incorporated by reference to Exhibit 10.1 to the Company’s Current Report on Form 8-K filed on January 27, 2014 (File No. 001-08308)).*10(gg)First Amendment to Employment Agreement dated December 1, 2014, between Luby’s, Inc. and Christopher J. Pappas (incorporated by reference to Exhibit 10.1 to the Company’s Current Report on Form 8-K filed on December 3, 2014 (File No. 001-08308)).*10(hh)Form of Restricted Stock Award Agreement pursuant to the Luby’s Incentive Stock Plan (incorporated by reference to Exhibit 10.1 to the Company’s Current Report on Form 8-K filed on November 16, 2007 (File No. 001-08308)).10(ii)Form of Incentive Stock Option Award Agreement pursuant to the Luby’s Incentive Stock Plan (incorporated by reference to Exhibit 10.2 to the Company’s Current Report on Form 8-K filed on November 16, 2007 (File No. 001-08308)).11Statement regarding computation of Per Share Earnings.**14(a)Policy Guide on Standards of Conduct and Ethics applicable to all employees, as well as the board of directors (incorporated by reference to Exhibit 14(a) to the Company’s Annual Report on Form 10-K for the fiscal year ended August 26, 2003, filed on November 25, 2003 (File No. 001-08308)).14(b)Supplemental Standards of Conduct and Ethics for the Chief Executive Officer, Chief Financial Officer, Controller, and all senior financial officers (incorporated by reference to Exhibit 14(b) to the Company’s Annual Report on Form 10-K for the fiscal year ended August 26, 2003, filed on November 25, 2003 (File No. 001-08308)).21Subsidiaries of the Company.23.1Consent of Grant Thornton LLP.31.1Rule 13a-14(a)/15d-14(a) certification of the Principal Executive Officer pursuant to Section 302 of the Sarbanes-Oxley Act of 2002.31.2Rule 13a-14(a)/15d-14(a) certification of the Principal Financial Officer pursuant to Section 302 of the Sarbanes-Oxley Act of 2002.32.1Section 1350 certification of the Principal Executive Officer pursuant to Section 906 of the Sarbanes-Oxley Act of 2002.32.2Section 1350 certification of the Principal Financial Officer pursuant to Section 906 of the Sarbanes-Oxley Act of 2002.99(a)Corporate Governance Guidelines of Luby’s, Inc., as amended October 28, 2004 (incorporated by reference to Exhibit 99(a) to the Company’s Annual Report on Form 10-K for the fiscal year ended August 29, 2007, filed on November 9, 2007 (File No. 001-08308)).101.INSXBRL Instance Document101.SCHXBRL Schema Document101.CALXBRL Calculation Linkbase Document101.DEFXBRL Definition Linkbase Document101.LABXBRL Label Linkbase Document101.PREXBRL Presentation Linkbase Document*Denotes management contract or compensatory plan or arrangement.**Information required to be presented in Exhibit 11 is provided in Note 17 “Earnings Per Share” of the Notes to Consolidated Financial Statements under Part II, Item 8 of this Form 10-K in accordance with the provisions of FASB Statement of Financial Accounting Standards (SFAS) No. 128, Earnings per Share. 89