Tural
UNITED STATES
SECURITIES AND EXCHANGE COMMISSION
Washington, D.C. 20549
Form10-K
ANNUAL REPORT PURSUANT TO SECTION 13 OR 15(D)15(d)
OF THE SECURITIES EXCHANGE ACT OF 1934
FOR THE FISCAL YEAR ENDED SEPTEMBER 30, 20162019
COMMISSION FILE NUMBER: 001-35608


Natural
Natural Grocers by Vitamin Cottage,Inc.
(Exact name of registrant as specified in its charter)
Delaware | 45-5034161 | |
(State or other jurisdiction of | (I.R.S. Employer | |
incorporation or organization) | Identification Number) |
12612 West Alameda Parkway
Lakewood, Colorado 80228
(Address of principal executive offices)
(303)986-4600
(Registrant’s telephone number, including area code)
Securities registered pursuant to Section 12(b) of the Act:
Title of each class | Trading symbol | Name of each exchange on which registered |
Common Stock, $0.001 par value | NGVC | New York Stock Exchange |
Securities registered pursuant to Section 12(g) of the Act:
None
Indicate by check mark if the registrant is a well-known seasoned issuer, as defined in Rule 405 of the Securities Act. Yes ☐ No ☒
Indicate by check mark if the registrant is not required to file reports pursuant to Section 13 or Section 15(d) of the Act. Yes ☐ No ☒
Indicate by check mark whether the registrant (1) has filed all reports required to be filed by Section 13 or 15(d) of the Securities Exchange Act of 1934 during the preceding 12 months (or for such shorter period that the registrant was required to file such reports), and (2) has been subject to such filing requirements for the past 90 days. Yes ☒ No ☐
Indicate by check mark whether the registrant has submitted electronically and posted on its corporate Web site, if any, every Interactive Data File required to be submitted and posted pursuant to Rule 405 of Regulation S-T during the preceding 12 months (or for such shorter period that the registrant was required to submit and post such files).
Yes ☒ No ☐
Indicate by check mark if disclosure of delinquent filers pursuant to Item 405 of Regulation S-K is not contained herein, and will not be contained, to the best of registrant’s knowledge, in definitive proxy or information statements incorporated by reference in Part III of this Form 10-K or any amendment to this Form 10-K. ☐
Indicate by check mark whether the registrant is a large accelerated filer, an accelerated filer, a non-accelerated filer, or a smaller reporting company, or an emerging growth company. See the definitions of “large accelerated filer,” “accelerated filer”filer,” “smaller reporting company,” and “smaller reporting“emerging growth company” in Rule 12b-2 of the Exchange Act.
Large accelerated filer ☐ | Accelerated filer ☒ | |
Non-accelerated filer ☐ | Smaller reporting company | |
| ||
Emerging growth company ☐ |
If an emerging growth company, indicate by check mark if the registrant has elected not to use the extended transition period for complying with any new or revised financial accounting standards provided pursuant to Section 13(a) of the Exchange Act. ☐
Indicate by check mark whether the registrant is a shell company (as defined in Rule 12b-2 of the Exchange Act). Yes ☐ No ☒
Based on the closing price of the registrant’s common stock on March 31, 2016,2019, the aggregate market value of the voting and non-voting common stock held by non-affiliates was approximately $204,601,384.$95,130,018.
The number of shares of the registrant’s common stock, $0.001 par value, outstanding as of December 2, 20162019 was 22,453,463.22,475,718.
DOCUMENTS INCORPORATED BY REFERENCE
The information required by Part III of this Annual Report on Form 10-K, to the extent not set forth herein, is incorporated by reference from the registrant’s Definitive Proxy Statement on Schedule 14A for the 20172020 Annual Meeting of the Stockholders, which will be filed with the Securities and Exchange Commission not later than 120 days after September 30, 2016.2019.
Natural Grocers by Vitamin Cottage, Inc.
Annual Report on Form 10-K
For the Fiscal Year Ended September 30, 20162019
Page | ||||||
Item 1. | 1 | |||||
Item 1A. | 16 | |||||
Item 1B. |
| |||||
Item 2. |
| |||||
Item 3. |
| |||||
Item 4. | 35 | |||||
Item 5. |
| |||||
Item 6. | 37 | |||||
Item 7. | Management’s Discussion and Analysis of Financial Condition and Results of Operations |
| ||||
Item 7A. |
| |||||
Item 8. |
| |||||
Item 9. | Changes in and Disagreements with Accountants on Accounting and Financial Disclosure |
| ||||
Item 9A. |
| |||||
Item 9B. |
| |||||
Item 10. |
| |||||
Item 11. |
| |||||
Item 12. | Security Ownership of Certain Beneficial Owners and Management and Related Stockholder Matters |
| ||||
Item 13. | Certain Relationships and Related Transactions, and Director Independence |
| ||||
Item 14. |
| |||||
Item 15. |
| |||||
| ||||||
Except where the context otherwise requires or where otherwise indicated:indicated: (i) all references herein to ‘‘we,’’ ‘‘us,’’ ‘‘our,’’ ‘‘Natural Grocers’’ andor the “Company’ “Company’’ refer collectively to NaturalNatural Grocers by Vitamin Cottage,Inc. and its consolidated subsidiariesand (ii) all references to a “fiscal year” refer to a year beginning on October 1 of the previous year and ending on September 30 of such year (for example “fiscal year 2016”2019” refers to the year from October 1, 20152018 to September 30, 2016)2019).
FORWARD-LOOKING STATEMENTS
This Annual Report on Form 10-K (this Form 10-K) includes forward-looking statements within the meaning of the Private Securities Litigation Reform Act of 1995 in addition to historical information. These forward-looking statements are included throughout this Form 10-K, including in the sections entitled “Business,” “Risk Factors” and “Management’s Discussion and Analysis of Financial Condition and Results of Operations.” All statements that are not statements of historical fact, including those that relate to matters such as our industry, business strategy, goals and expectations concerning our market position, future operations, margins, profitability, capital expenditures, liquidity and capital resources, future growth, pending legal proceedings and other financial and operating information, are forward looking statements. We may use the words “anticipate,” “assume,” “believe,” “continue,” “could,” “estimate,” “expect,” “intend,” “may,” “plan,” “potential,” “predict,” “project,” “future,” “target” and similar terms and phrases to identify forward-looking statements in this Form 10-K.
The forward-looking statements contained in this Form 10-K are based on management’s current expectations and are subject to uncertainty and changes in circumstances. We cannot assure you that future developments affecting us will be those that we have anticipated. Actual results may differ materially from these expectations due to changes in global, national, regional or local political, economic, business, competitive, market, regulatory and other factors, many of which are beyond our control. We believe that these factors include those described in “Risk Factors.” Should one or more of these risks or uncertainties materialize, or should any of our assumptions prove incorrect, our actual results may vary in material respects from those projected in these forward-looking statements.
Any forward-looking statement made by us in this Form 10-K speaks only as of the date of this report. Factors or events that could cause our actual results to differ may emerge from time to time, and it is not possible for us to predict all of them. We undertake no obligation to publicly update any forward-looking statement, whether as a result of new information, future developments or otherwise, except as may be required by applicable securities laws. You are advised, however, to consult any disclosures we may make in our future reports filed with the Securities and Exchange Commission (the SEC). SuchOur reports may be read and copiedother filings with the SEC are available at the SEC’s Public Reference Roomwebsite at 100 F Street, N.E., Washington, D.C. 20549 and may also be accessed on the SEC’s website atwww.sec.gov. Our reports and other filings with the SEC are also available, free of charge, through our website atwww.naturalgrocers.com.
PARTPART I
ItemItem 1. Business.
General
Natural Grocers is an expanding specialty retailer of natural and organic groceries and dietary supplements. We focus on providing high-quality products at affordable prices, exceptional customer service, nutrition education and community outreach. We strive to generate long-term relationships with our customers based on transparency and trust by:
● | selling only natural and organic groceries, body care products and dietary supplements that meet our strict quality guidelines - we do not approve for sale grocery products that are known to contain artificial colors, flavors, preservatives or sweeteners or partially hydrogenated or hydrogenated oils; |
● | utilizing an efficient and flexible smaller-store format to offer affordable prices and a shopper-friendly retail environment; |
● | enhancing our customers’ shopping experience by providing free science-based nutrition education to help our customers make well-informed health and nutrition |
● | incorporating principles of ecological sustainability into our product standards and company practices. |
Our History and Founding Principles
Our founders, Margaret and Philip Isely, were early proponents of the connection between health and the use of natural and organic products and dietary supplements. In the mid-1950’s, Margaret transformed her health and the health of her family by applying concepts and principles she learned from books on nutrition. This inspired the Iselys to provide the same type of nutrition education to their community. The Iselys started by lending books on nutrition and providing samples of whole grain bread door-to-door in Golden, Colorado and subsequently concluded they could develop a viable business that would also improve their customers’ well-being. Over time, they fostered relationships through nutrition education and began taking orders for dietary supplements, whole grain bread and unprocessed foods. As their customers gained more knowledge about nutrition, they were empowered to make changes to their diets with the objective of supporting their health. Using this model as the foundation for their business, the Iselys opened their first store in 1958, which they later moved to a modest cottage.1958.
We are committed to maintaining the following founding principles, which have helped foster our growth:
● | Nutrition Education.We provide nutrition education in the communities we serve. Empowering our customers and our employees to take charge of their lives and their health is the foundation upon which our business is built. |
● | Quality.Every product on our shelves must go through a rigorous screening and approval process. Our mission includes providing the highest quality groceries and supplements, Natural Grocers branded products and only United States Department of Agriculture (USDA) certified organic, fresh |
● | EDAP -Every Day Affordable Price®.We work hard to secure the best possible prices on all of our customers’ favorite natural and organic foods and supplements. We believe everyone should be able to afford to help take care of their health by buying high quality competitively priced natural and organic products. |
● | Community.From free nutrition education lectures, to bag-free checkouts, to sourcing local products, to our fundraising and donation |
● | Employees.Our employees make our company great. We work hard to ensure that our employees are able to live a healthy, balanced lifestyle. We support them with free nutrition education programs, good pay and excellent benefits. |
In 1998, the second generation of the Isely family, including Kemper Isely, Zephyr Isely, Heather Isely and Elizabeth Isely, purchased our predecessor and theVitamin Cottage® trademark and assumed control of the business. Since then, we have grown our store count from 11 stores in Colorado to 126153 stores in 19 states as of September 30, 2016.2019. We have also implemented numerous organizational and operational improvements that have enhanced our ability to scale our operations. We believe that by staying true to our founding principles, we have been able to continue to attract new customers, extend our geographic reach and further solidify our competitive position.
Our Markets
We operate within the natural products retail industry, which is a subset of the United States grocery industry and the dietary supplement business. This industry includes conventional supermarkets, natural, gourmet and specialty food markets, domestic and foreign-based mass and discount retailers, warehouse clubs, independent health food stores, dietary supplement retailers, drug stores, farmers’ markets, food co-ops, online retailers, meal delivery services and multi-level marketers. Industry-wide sales of natural and organic foods and dietary supplements have experienced meaningful growthgrown over the past several years, and we believe that growth will continue for the foreseeable future.
We believe the growth in sales of natural and organic foods and dietary supplements continues to be driven by numerous factors, including:
● | greater consumer focus on high-quality nutritional products; |
● | an increased awareness of the importance of good nutrition to long-term wellness; |
● | an aging United States population seeking to support healthy aging; |
● | heightened consumer awareness about the importance of food quality and a desire to avoid |
● | concerns regarding antibiotic resistance caused by industrial livestock production practices; |
● | growing consumer concerns over the use of harmful chemical additives in body care and household cleaning supplies; |
● | well-established natural and organic brands, which generate additional industry awareness and credibility with consumers; |
● | the growth in the number of consumers with unique dietary requirements as a result of allergies, chemical sensitivities, auto-immune disorders and other |
● | concerns about the cumulative environmental impact of relying on non-renewable resources and the effects on the global climate of carbon release from conventional agriculture. |
Our Competitive Strengths
We believe we are well-positioned to capitalize on favorable natural and organic grocery and dietary supplement industry dynamics as a result of the following competitive strengths:
Strict focus on high-quality natural and organic grocery products and dietary supplements. We offer high-quality products and brands, including an extensive selection of widely-recognized natural and organic food, dietary supplements, body care products, pet care products and books. We offer our customers an average of approximately 21,10022,000 Stock Keeping Units (SKUs) of natural and organic products per comparable store (stores open for 13 months or longer), including an average of approximately 6,5006,700 SKUs of dietary supplements. We believe our broad product offering enables our customers to shop our stores for substantially all of their grocery and dietary supplement purchases. In our grocery departments, we only sell USDA certified organic produce and do not approve for sale grocery products that are known to contain artificial colors, flavors, preservatives or sweeteners or partially hydrogenated or hydrogenated oils. In addition, we only sell pasture-raised, non-confinement dairy products, free-range eggs (i.e., from chickens that are not only cage-free but also provided with sufficient space to move) and free-range eggs.naturally raised meats (i.e., from animals that are not known to have been treated with antibiotics, hormones or growth promoters, or fed animal by-products). Consistent with this strategy, our product selection does not include items that do not meet our strict quality guidelines. Our store managers enhance our robust product offering by customizing their stores’ selections to address the preferences of local customers. All products undergo a stringent review process to ensure the products we sell meet our strict quality guidelines, which we believe helps us generate long-term relationships with our customers based on transparency and trust.
Engaging customer service experience based on education and empowerment. We strive to offer consistently exceptional customer service in a shopper-friendly environment, which we believe creates a differentiated shopping experience, enhances customer loyalty and generates repeat visits from our clientele. A key aspect of our customer service model is to provide free nutrition education to our customers. We believe this focus provides an engaging retail experience while also empowering our customers to make informed decisions about their health. We offer our science-based nutrition education through our trained employees, ourHealth Hotline® newsletter and sales flyer,magazine, community out-reachoutreach programs, one-on-one nutrition health coaching, nutrition classes, cooking demonstrations and our website. Our commitment to nutrition education and customer empowerment is emphasized throughout our entire organization, from executive management to store employees. Every store also maintains a Nutritional Health Coach or NHC,(NHC) position. The NHC is responsible for educating our customers about good nutrition and for training our store employees and educating ouron how to assist customers about nutrition in accordancecompliance with applicable local, state and federal regulations. Each NHC must have earned a degree or certificate in nutrition or a related field from an accredited school, complete continuing education in nutrition, and be thoroughly committed to fulfilling our mission. Substantially all of our NHCs are full-time employees. We believe our NHC position represents a key element of our customer service model.
Scalable operations and replicable, cost-effective store model. We believe our scalable operating structure, attractive new store model, flexible real estate strategy and disciplined approach to new store development allow us to maximize store performance and continue to grow our store base. Our store model has been successful in highly competitive markets and has supported significant growth outside of our original Colorado geography. We believe our supply chain and infrastructure are scalable and will accommodate significant growth based on the ability of our primary distribution relationships to effectively service our planned store locations. Our investments in overhead and information technology infrastructure, including purchasing, receiving, inventory, point of sale, warehousing, distribution, accounting, reporting and financial systems, support this growth. We also have a comprehensive human resources information and learning management system (HRIS) to further support the scalability of our operations. In addition, we have established effective site selection guidelines, as well as scalable procedures, to enable us to open a new store within approximately nine months from the time of lease execution. The smaller-store footprint made possible by our limited offering of prepared foods reduces real estate costs, labor costs and perishable inventory shrink and allows us to leverage our new store opening costs.
Commitment to sustainable products and practices. We have put in place product standards for dairy, eggs, meat, seafood and produce that support sustainable and ecologically responsible production methods. We believe our standards help to enhance the health of our customers, promote animal welfare, reduce antibiotic resistance and protect the environment. We have also instituted measures to eliminate food waste, divert usable products to food banks, reduce single use plastic bags and reduce the use of toxic pesticides and antimicrobial products. We believe these efforts reflect our commitment to corporate social responsibility and demonstrate our support for sustainable regenerative agricultural practices.
Experienced and committedmanagementteam with proven track record. Our executive management team has an average of 3834 years of experience in the natural grocery industry, while our entire management team has an average of over 3031 years of relevant experience. Since the second generation of the Isely family assumed control of the business in 1998, we have grown our store count from 11 stores to 126153 stores as of September 30, 20162019 by remaining dedicated to our founding principles. Over their tenure, members of our executive management team have been instrumental in establishing a successful, scalable operating model, generating consistently strong financial results and developing an effective site selection and store opening process. The depth of our management experience extends beyond our home office. As of September 30, 2016,2019, approximately 48.0%50% of our store managers at comparable stores had tenures of over four years with us, and our store and department managers at these stores had average tenures of over threefour years with us. In addition, we have a track record of promoting store management personnel from within. We believe our management’s experience at all levels will allow us to continue to grow our store base while maintaining operational excellence by driving efficiencies in store and back room operations, managing inventory levels and focusing on exceptional customer service.
Our Growth Strategies
We are pursuing several strategies to continue our profitable growth, including:
Expand our store base. We intend to continue expanding our store base through new store openings in existing markets, as well as penetrating new markets, by leveraging our core competencies of site selection and efficient store openings. Based upon our operating experience and research conducted for us by The Buxton Company, a customer analytics firm, we believe the entire United States market can support over 1,100 Natural Grocers stores, including approximately 200 additional Natural Grocers stores in the 19 states in which we currently operate or have signed leases. In fiscal years 20162019 and 2015,2018, we opened 23six and 16eight new stores, respectively, and we plan to open 15five to 20six new stores in fiscal year 2017,2020, of which threeone opened during the first quarter of fiscal year 20172020 prior to the filing of this Form 10-K.
Current store locations,signed leasesandnew store locations.
|
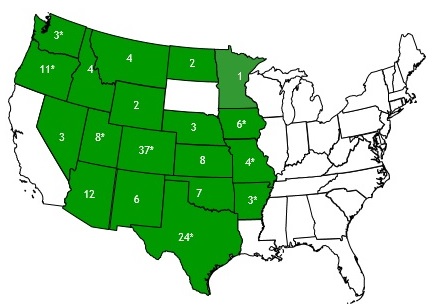
*Includes We have signed leases for an additional five new stores, to be opened subsequent to fiscal year 2016. Between September 30, 2016 and have purchased the date of this Form 10-K,property for an additional two new stores, that we opened three new stores. Additionally, we have 18 signed leases for stores plannedexpect to open in fiscal year 2017years 2020 and 2018.beyond.
Store locations as of September 30, 2019.
Increase sales from existing customers. We have achieved positive comparable store sales growth for over 57 consecutive quarters. In order to increase our average ticket and the number of customer transactions, we plan to continue offering an engaging customer experience by providing science-based nutrition education and a differentiated merchandising strategy that delivers affordable, high-quality natural and organic grocery products and dietary supplements. We also plan to continue to utilize targeted marketing efforts to reach our existing customers, including through the {N}power® customer loyalty program, which we anticipate will drive customer transactions, increase the average ticket and convert occasional, single-category customers into core, multi-category customers.
Grow our customer base. We plan to continue building our brand awareness, which we anticipate will grow our customer base. During fiscal year 2016,2019, the measures we implemented several measurestook that were aimed at enhancing our brand awareness including:included: (i) increasing the Company’s presencefrequency and range of offerings under the {N}power customer loyalty program; (ii) making our Health Hotline magazine available to customers in both print and electronic format; (iii) entering into a sponsorship arrangement with the Steamboat and Winter Park ski resorts pursuant to which we were designated, on Facebook, Twitter and other social media platforms; (ii)an exclusive basis, the official grocery store of those resorts; (iv) organizing special monthly promotions andto coincide with certain calendar events, such as Resolution Reset Day® in January, Earth Day in April, on the anniversary of the Company’s founding in August and during the entire month of September to coincide with Nationalfor Organic Harvest Month; (iii)(v) expanding our social media reach through increased investment in paid and organic placements on platforms such as Facebook, Twitter and Instagram; (vi) conducting television, radio, outdoor advertising and targeted direct mail campaigns in select markets; (iv) entering into sponsorship arrangements with a US speed skater and a health and fitness expert; (v) teaming with a Grammy Music Educator Award-nominated musician to produce original Natural Grocers organic-themed songs and music videos; (vi)(vii) extending home delivery services from 118 to select additional markets; and (vii) developing new collateral marketing materials. 151 stores.
We believe offering nutrition education has historically been one of our most effective marketing strategies for reaching new customers and increasing the demand for natural and organic groceries and dietary supplements in our markets. To maximize thetheir impact, ofwe encourage our Nutritional Health Coaches, we have increased theirNHCs to focus on relationship-building opportunities in our communities and with our customers, including promotions, and additional educational cooking events, lectures and classes in our stores. Additionally, we seek to attract new customers by enhancing their nutrition knowledge through the distribution of printed and digital versions of our broad range of educational resources, including the distribution of ourHealth Hotlinenewsletter and sales flyer, and via the internet and social media.magazine. In addition to offering nutrition education, our strategy is to attract new customers with ourEDAP -Every Day Affordable Price and to build community awareness through our support of local vendors and charities.
Improve operating margins. We expect to continue our focus on improving our operating margins as we benefit from investments we have made or are making in fixed overhead and information technology. We anticipate these investments will support our long-term growth strategy with only a modest amount of additional capital. We expect to achieve greater economies of scale through sourcing and distribution asstrategy. To improve operating margins, we add more stores. In addition, to achieve additional operating margin expansion, wealso intend to further optimize performance, maintain appropriate store labor levels, reduce inventory shrink and effectively manage product selection and pricing. In addition, we expect to achieve greater economies of scale through sourcing and distribution as we add more stores.
Our Stores
Our stores offer a comprehensive selection of natural and organic groceries and dietary supplements in a smaller-store format that aims to provide a convenient, easily shopped and relaxed environment for our customers. Our store design emphasizes a clutter-free, organized feel, a quiet ambience accented with warm lighting and the absence of aromas from meat and seafood counters present in many of our competitors’ stores. We believe our core customers consider us a destination stop for their nutritional education and information, natural and organic products and dietary supplements.
Our Store Format. Our stores range from approximately 5,000 to 16,000 selling square feet, and average approximately 11,000 selling square feet. In fiscal year 2016,2019, our 23six new stores averaged approximately 11,00010,000 selling square feet. Approximately one quarter of our stores’ selling square footage is dedicated to dietary supplements. SomeMost of our stores also include a dedicated community room available for public gatherings, a demonstration kitchen for cooking education and/or lecture space. Our comparable stores sell an average of approximately 21,10022,000 SKUs of natural and organic products per store, including an average of approximately 6,5006,700 SKUs of dietary supplements. Set out below is the layout for our new stores:
The following diagram depicts a typical new store layout: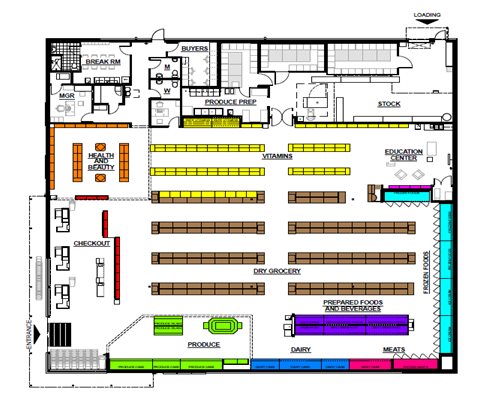
Site Selection. Our real estate strategy is adaptable to a variety of market conditions. When selecting locations for new stores, we use analytical models, based on research provided by The Buxton Company and Forum Analytics, LLC and our extensive experience, to identify promising store locations. We typically locate new stores in prime locations which offer easy customer access and high visibility. Many of our stores are near other supermarkets or gourmet food retailers, and we complement their conventional product offerings with high-quality, affordable natural and organic groceries and dietary supplements in an efficient and convenient retail setting. Our model for selecting viable new store locations incorporates factors such as target demographics, community characteristics, nearby retail activity and other measures and is based on first-hand observation of the community’s characteristics surrounding each site. We have teams of employees dedicated to opening new stores efficiently and quickly, typically within approximately nine months from the time of lease execution.
Store-LevelStore-Level Economics. Since January 1, 2005, openingOur new stores has requiredtypically require an average upfront capital investment of approximately $2.1 million. We anticipate that our fiscal year 2017 new stores will require an average upfront capital investment of approximately $2.2 million, consisting of capital expenditures of approximately $1.6 million, net of tenant allowances, initial inventory of approximately $0.3 million, net of payables, and pre-opening expenses of approximately $0.3$0.2 million. We target approximately fourfive years to recoup our initial net cash investments and approximately 30% cash-on-cash returns by the end of the fifthsixth year following the opening. Our actual payback period averages approximately six years.
Individual new store investment levels and the performance of new store locations may differ widely from originally targeted levels and from store-to-store due to competitive considerations and a variety of other factors, and these differences may be material. In particular, investments in individual stores, store-level sales, profit margins, payback periods and cash-on-cash return levels are impacted by a range of risks and uncertainties beyond our control, including those described under the caption “Risk Factors.”
Our Focus on Nutrition Education
Nutrition education is one of our founding principles and is a primary focus for all employees. We believe our emphasis on science-based nutrition education differentiates us from our competitors and creates a unique shopping experience for our customers.
Our Nutritional Health Coaches or NHCs, are a core element of our nutrition education program. Every store has a full-time NHC position to educate customers and train employees on nutrition. NHCs must have earned a degree or certificate in nutrition or a related field from an accredited school, complete continuing education in nutrition, and be thoroughly committed to fulfilling our mission. To educate and empower customers to make informed nutrition choices, our NHCs are available for complimentary one-on-one nutrition health coaching sessions. Each NHC is also responsible for various relationship-building opportunities in our communities and with our customers, including educational activities such as nutrition classes, lectures, seminars, health fairs and store tours. To maximize the impact of our NHCs, we have increasedstress the importance of their focusfocusing on hosting cookingin-store educational events, (atoffering health coaching sessions and holding nutrition classes in the community by partnering with school, municipal and corporate wellness programs. During fiscal year 2019, our stores with demonstration kitchens) and haveNHCs increased the number of their health coaching sessions and community nutrition classes while continuing to offer a variety of in-store educational events they conduct.education events. We believe that our NHCs’ focus on relationship-building opportunities in our communities and with our customers helps to enhance our marketing and branding initiatives. Additionally, our NHCs are an onsite resource for nutrition training and education for our employees. Each NHC trains our employees to use a compliant educational approach to customer service without attempting to diagnose or treat specific conditions or ailments. We believe our NHC position is a competitive differentiator and represents a key element of our customer service model.
Our training and education programs are supplemented by outside experts, online materials and printed handouts. We also use ourHealth Hotline magazine to educate our customers. TheHealth Hotline is a newsletter and sales flyermagazine, which was published ten11 times in fiscal year 2016. Each issue of theHealth Hotline2019, includes in-depth articles on health and nutrition, along with a selection of sale items. The printed version of the Health Hotline magazine is mailed to subscribers and distributed in our stores. In addition, an electronic version of the Health Hotline magazine is also distributed to subscribers via the internet and social media. Consistent withposted on our strategy to shift a greater portion of our marketing efforts from print to digital, the printedHealthHotline newsletter is scheduled to be published seven times in fiscal year 2017. During fiscal year 2015, we redesigned thewww.naturalgrocers.com website to enhance functionality and create a more engaging user experience, including readily accessible additional nutritional education information and resources.website.
Our Products
Product Selection Guidelines. We have a set of strict quality guidelines covering all products we sell. For example:
● | we do not approve for sale food known to contain artificial colors, flavors, preservatives or sweeteners or partially hydrogenated or hydrogenated oils, regardless of the proportion of its natural or organic ingredients; |
● | we only sell USDA certified organic produce; |
● | we only sell |
● | we only sell meats from naturally raised |
● | we only sell seafood from sustainable fisheries or ecologically responsible farm-raised operations; and |
● | we do not sell |
Our product review team analyzes all new products and approves them for sale based on ingredients, price and uniqueness within the current product set. We actively research new products in the marketplace through our product vendors, private label manufacturers, scientific findings, customer requests and general trends in popular media. Our stores are able to fully merchandise all departments by providing an extensive assortment of natural and organic products. We do not believe we need to sell conventional products to fill our selection, increase our margins or attract more customers.
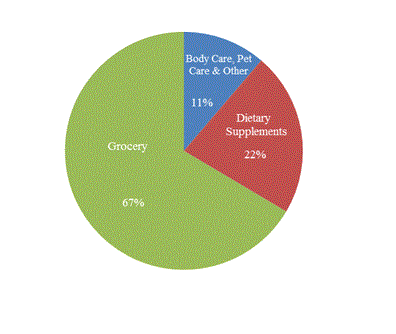
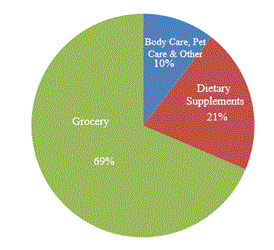
What We Sell. We operate both a full-service natural and organic grocery store and a dietary supplement store within a single retail location. The following is a breakdown of our sales mix for the fiscal year ended September 30, 2016:2019:
The products in our stores include:
● | Grocery.We offer a broad selection of natural and organic grocery products with an emphasis on minimally processed and single ingredient products that are not known to contain artificial colors, flavors, preservatives or sweeteners or partially hydrogenated or hydrogenated oils. Additionally, we carry a wide variety of products associated with special diets such as gluten free, vegetarian and non-dairy. Our grocery products include: |
■ | Produce.We sell only USDA certified organic produce and source from local, organic producers whenever feasible. Our selection varies based on seasonal availability, and we strive to offer a variety of organic produce offerings that are not typically found at conventional food retailers. |
■ | Bulk |
■ | Natural Grocers Brand Products. We sell an expanding range of Natural Grocers brand private label products, including pasta, pasta sauce, canned beans and vegetables, bread, olive oil, coconut oil, honey, maple syrup, preserves, chocolate, coffee, beef jerky, tortilla chips, eggs, and other products. |
■ | Dry, Frozen and Canned Groceries.We offer a wide variety of natural and organic dry, frozen and canned groceries, including cereals, soups, baby foods, frozen entrees and snack items. We offer a broad selection of natural chocolate bars and energy, protein and food bars. |
■ | Meats and Seafood.We only offer naturally-raised or organic meat products. The naturally raised meat products we offer come from animals that are not known to have been treated with antibiotics, |
■ | Dairy Products, |
■ | Prepared Foods.Our stores have a convenient selection of refrigerated prepared fresh food items, including salads, sandwiches, salsa, |
■ | Bread and Baked Goods.We receive regular deliveries of a wide selection of bakery products for our bakery section, which includes an extensive selection of gluten-free items. |
■ | Beverages.We offer a wide variety of beverages containing natural and organic ingredients. We also offer low-cost, self-serve filtered drinking water that is dispensed into one-gallon or larger containers provided by our customers. We offer kombucha on tap at substantially all of our stores. |
| Beer, wine and hard cider. As of September 30, 2019, we sold craft beer, craft hard cider and/or organic and biodynamic wine at certain stores in Colorado, Oklahoma and Oregon. In fiscal year 2020, we plan to start selling craft beer, craft hard cider and/or organic and biodynamic wine at additional stores in Colorado, Oklahoma and Oregon. |
● | Dietary Supplements.Our dietary supplement department primarily sells name-brand supplements, as well as a line of private label dietary supplements. The department is carefully organized to help both employees and customers find products efficiently. We generally offer several different formulations and potencies for each type of product in order to meet our customers’ varying needs. |
● | Other. |
■ | Body Care.We offer a full range of cosmetics, skin care, hair care, fragrance and personal care products containing natural and organic ingredients. Our body care offerings range from bargain-priced basics to high-end formulations. |
■ | Pet Care.We offer a full line of natural pet care and food products that comply with our human food guidelines. |
■ | Household and General Merchandise.Our offerings include sustainable, hypo-allergenic and fragrance-free household products, including cleaning supplies, paper products, dish and laundry soap and other common household products, including diapers. |
■ | Books and Handouts.We stock approximately |
Quality Assurance. We endeavor to ensure the quality of the products we sell. We work with reputable suppliers we believe are compliant with established regulatory and industry guidelines. Our purchasing department requires a complete supplier and product profile as part of the approval process. Our dietary supplement suppliers must follow Food and Drug Administration (FDA) current good manufacturing practices supported by quality assurance testing for both the base ingredients and the finished product. We expect our suppliers to comply with industry best practices for food safety.
Many of our suppliers are inspected and certified under the USDA National Organic Program, through voluntary industry associations,standards and by other third party auditing programs with regard to additional ingredients, manufacturing and handling standards. Each Natural Grocers store is certified as an organic handler and processor by an accredited USDA certifier in the calendar year after it opens, and annually thereafter. We operate all our stores in compliance with the National Organic Program standards, which restrictsrestrict the use of certain substances for cleaning and pest control and requiresrequire rigorous recordkeeping and methods to prevent co-mingling and contamination, among other requirements.
Our Pricing Strategy
We have anEDAP -Every Day Affordable Price designation on many products, while also providing special sale pricing on hundreds of additional items. We believe our pricing strategy allows our customers to shop our stores on a regular basis for their groceries and dietary supplements.
The key elements of our pricing strategy include:
● | EDAP -Every Day Affordable Price throughout our stores; |
● | heavily advertisedHealth Hotline deals supported by manufacturer participation; |
● | discounts offered to {N}power members; |
● | short term price promotions related to holidays, targeted campaigns and other events; |
● | in-store specials generally lasting for one month and not advertised outside the store; |
● | managers’ specials, such as clearance, overstock, short-dated or promotional incentives; and |
● | specials on seasonally harvested produce. |
As we continue to expand our store base, we believe there are opportunities for increased leverage in fixed costs, such as administrative expenses, as well as increased economies of scale in sourcing products. We strive to keep our product, operating and general and administrative costs low, which allows us to continue to offer attractive pricing for our customers.
Our Store Operations
Store Hours. Our stores typically are open from 8:0030 a.m. to 9:0405 p.m., Monday through Saturday, and from 8:9:00 a.m. to 7:358:05 p.m. on Sunday.
Store Management and Staffing. Our typical store staffing includes a manager and assistant manager, with department managers in each of the dietary supplement, grocery, dairy and frozen, produce, body care and receiving departments, as well as several non-management employees. Each store manager is responsible for monthly store profit and loss, including labor, merchandising and inventory costs. We also employ regional managers to oversee all store operations for regions consisting of approximately 13nine to 1514 stores. Each regional manager reports to, and is supported by, a director of store operations.operations and other staff.
To ensure a high level of service, all employees receive training and guidance on customer service skills, product attributes and nutrition education. Employees are carefully trained and evaluated based on a requirement that they present nutrition information in an appropriate and legally compliant educational context while interacting with customers. Additionally, store employees are cross-trained in various functions, including cashier duties, stocking and receiving product.
Every store also maintains a Nutritional Health Coach or NHC,(NHC) position. The NHC is responsible for training our store employees and educating our customers in accordance with applicable local, state and federal regulations. Each NHC must have earned a degree or certificate in nutrition or a related field from an accredited school, complete continuing education in nutrition and be thoroughly committed to fulfilling our mission. Substantially all of our NHCs are full-time employees. The NHCs are overseen by Regional Nutritional Health Coach Managers.
Bulk Food Repackaging Facility and Distribution Center. We lease a 150,000 square foot bulk food repackaging facility and distribution center located in Golden, Colorado. That facility also houses a training center and certain administrative support functions.
Inventory. We use a robust merchandise management and perpetual inventory system that values goods at moving average cost. We manage most shelf stock based on weeks-on-hand relative to sales, resupply time and minimum economic order quantity.
Sourcing and Vendors. We source from approximately 1,2001,100 suppliers, and offer over 3,1003,300 brands. These suppliers range from small independent businesses to multi-national conglomerates. As of September 30, 2016,2019, we purchased approximately 80%77% of the goods we sell from our top 20 suppliers. For the fiscal year ended September 30, 2016,2019, approximately 59%65% of our total purchases were from United Natural Foods Inc. and its subsidiaries (UNFI). In fiscal year 2016, we extended our long-term relationship with UNFI as our primary supplier of dry grocery and frozen food products through May 31, 2021. In May 2018, we entered into an amendment to our agreement with UNFI pursuant to which we appointed Albert’s Organics, a wholly owned subsidiary of UNFI, as our primary supplier of organic produce products for the majority of our stores. We maintain good relations with UNFI and believe we have adequate alternative supply methods, including self-distribution.
We contracthave contracts with third-party manufacturers to produce groceries and dietary supplements under our private labels, which include the Natural Grocers andVitamin Cottagebrands. brand. We have longstanding relationships with our suppliers, and we require disclosure from them regarding quality, freshness, potency and safety data information. Our bulk food private label products are packaged by us in pre-packed sealed bags to help prevent contamination while in transit and in our stores. Unlike most of our competitors, most of our private label nuts, trail mix and flours are refrigerated in our warehouse and stores to maintain freshness.
Our Employees
OurEmployees
We refer to our employees as our “Good4u Crew.” Commitment to our employees is one of our five founding principles. Employees are eligible for health, long-term disability, vision and dental insurance coverage, as well as Company paid short-term disability and life insurance benefits, after they meet eligibility requirements. Additionally, our employees are offered a 401(k) retirement savings plan with discretionary contribution matching opportunities. We believe we pay above average retail wages, andwages. In addition, all employees receive in store discounts and earn an additional $1.00 per hour, up to $40 per week, in “Vitamin Bucks”Bucks,” which can be used to purchase products in our stores. It is important to us that our employees live a healthy, balanced lifestyle, and we believe that the discounts we offer our employees and the Vitamin Bucks incentive providesbenefit provide an additional resource for our employees to purchase natural and organic products. This further offers our employees the opportunity to become more familiar with the products we sell, which we believe improves the customer service our employees are able to provide. We believe these and other factors result in higherhave a positive impact on employee retention rates and encourage our employees to appreciate our culture, which helps them better promote our brand.
All employees are eligible to participate in our discretionary pay-for-performance incentive compensation plan after meeting certain length of service requirements. The pay-for-performance incentive compensation plan sets certain Company-level financial goals that must be met before it can be funded. If the financial goals are achieved, additional criteria for store-level incentive compensation include meeting sales projections, sales to labor hour goals and cost of goods sold metrics. We believe these criteria help align all store employees with both corporate and store-level financial goals. We have an established set of standard operating procedures, including hiring and human resource policies, training practices and operational instruction manuals. This allows each store to operate with strict accountability and still maintain independence to respond to its unique circumstances.
As of September 30, 2016,2019, we employed 2,6513,029 full-time and 423652 part-time (less than 30 hours per week) employees, including a total of 278345 employees at our home office and our bulk food repackaging facility and distribution center. None of our employees is subject to a collective bargaining agreement. We believe we have good relations with our employees.
Our Customers
The growth in the natural and organic grocery and dietary supplement industries and growing consumer interest in health and nutrition have led to an increase in our core customer base. We believe the demands for affordable, nutritious food and dietary supplements are shared attributes of our core customers, regardless of their socio-economic status. Additionally, we believe our core customers prefer a retail store environment that offers carefully selected natural and organic products and dietary supplements.supplements and supports environmentally sustainable products and practices. Our customers tend to be interested in health and nutrition, and expect our store employees to be highly knowledgeable about these topics and related products.
An analysis of ourHealth Hotline subscriber list indicates that our customers come from broad geographic segments, including urban, suburban and rural areas, which reflects the varied characteristics and portability of our store locations.
Our Communities
One of our founding principles is to be an active member and steward of the communities we serve. As a commitment to this principle, we:
● | provide extensive free educational services to customers in the form of lectures, classes, printed resources, online resources, publications and one-on-one nutrition coaching; |
● | participate in health fairs, school outreach, community wellness events and other activities to engage with and educate the community; |
● | partner with city and corporate wellness programs; |
● | disseminate new research on nutrition information; |
● | participate in the legislative and regulatory process at local, state and national levels so that our customers have access to quality food and dietary supplements and the educational resources to guide their own wellness; |
● | continually strive to source products and services from local producers and vendors; |
● | carefully collect all of our excess or distressed food and merchandise and donate it to local non-profit organizations; |
● | do not provide single-use paper or plastic bags at our registers and encourage the use of reusable totes; |
● | provide cash to local food banks, making donation determinations based on the number of customers who shop our stores with their own bags; |
|
|
● | reduce our energy costs and carbon footprint using efficient heating, ventilation and air conditioning, lighting, and refrigerating systems; |
● | implement strategies to eliminate excess packaging, energy and transportation costs; |
● | recycle and reuse paper, plastic, glass and electronic products whenever possible; |
● | manage the waste stream services at all of our stores in order to optimize our diversion of waste to recycling and compost and increase the environmental sustainability of our operations; |
● | offer compostable paper bags for produce purchases; |
● | use healthy and environmentally responsible building materials and finishes in our new stores and |
● | promote environmentally responsible and sustainable practices in our supply chain; |
● | undertake fundraisers for organizations whose missions align with ours; and |
● | support the economic vitality of small producers and agricultural communities. |
Marketing andAdvertising
A significant portion of our marketing efforts is focused on educating our customers on the benefits of natural and organic grocery products, dietary supplements and dietary supplements.our quality standards. Our customer outreach programs provide practical general nutrition knowledge to a variety of groups and individuals, schools, businesses, families and seniors. These educational efforts fulfill one of our founding principles and also offer us the opportunity to build relationships with customers and community influencers.
{N}powerCustomerLoyalty Program. We introduced the {N}power customer loyalty program in fiscal year 2015. {N}power members receive digital coupons, discounted pricing on certain staple items (such as free-range eggs), personalized offers and other rewards, all by providing their phone number at the time of checkout. We believe the {N}power program has enhanced customer loyalty and increased customer traffic and engagement levels. During fiscal year 2019, we continued to increase the frequency and range of our {N}power offerings. We believe these steps helped to increase membership in the {N}power program during fiscal year 2019. We had over 1.0 million registered {N}power members as of September 30, 2019 compared to approximately 750,000 {N}power members as of September 30, 2018.
Health Hotline. OurThe Health Hotline is a 20-page newsletter and sales flyer whichfour color magazine that contains a mix of in-depth health and nutrition articles, along with a selection of popular sale items. The articles aim to be relevant, science-based and written to reflect the most recent research findings. In fiscal year 2016, the full version of theThe Health Hotline magazine was published ten11 times during fiscal year 2019, and we expect the same publication frequency fiscal year 2020. The printed version of the Health Hotline magazine is mailed to subscribers and distributed in our stores. In fiscal year 2016, a condensed version of theHealth Hotline, which typically emphasizes only one article or topic,was inserted into the newspaper in many of our communities approximately 34 times. In addition, an electronic version of the condensedHealth Hotline wasmagazine and a weekly electronic Health Hotline newsletter are distributed to subscribers in fiscal year 2016. Consistent with our strategy to shift a greater portion of our marketing efforts from print to digital, we expect to publishvia the printedHealthHotline newsletter seven times and the condensedHealth Hotline17 times in fiscal year 2017.internet. Generally, we negotiate with our suppliers for significantly lower costs onHealth Hotline featured sale items, which in turn allows us to offer lowlower sale prices to our customers. Focused staff training at all locations occurs concurrently with the release of eachHealth Hotline to ensure that store staff are familiar with the content in each issue.
Web SitesSponsorships and Special Promotions. In May 2019, we entered into a sponsorship arrangement with Alterra Mountain Company, the owner of the Steamboat and Winter Park ski resorts in Colorado, pursuant to which: (i) the Company has been designated, on an exclusive basis, the official grocery store of those resorts and (ii) the Company is receiving a variety of marketing and brand exposure at those resorts. During fiscal year 2019, we also sponsored a number of nutrition experts. In addition, in September 2019, 2018 and 2017, to coincide with Organic Harvest Month, we collected donations from our customers on behalf of the Organic Farmers Association.
During fiscal year 2019, we organized special promotions to coincide with certain calendar events, such as Resolution Reset Day in January, Earth Day in April, on the anniversary of the Company’s founding in August and during the entire month of September to coincide with Organic Harvest Month. Promotions included product discounts, sweepstakes drawings and nutrition education classes. We expect to continue offering similar special promotions and events in the future.
Website and Social Media. We maintainwww.naturalgrocers.com as our official company website to host store information, sales flyers,sale and discount offers, educational materials, product and standards information, policies and contact forms, advocacy and news items and e-commerce activities. We redesigned ourcapabilities. Our website in fiscal year 2015 to enhance functionality, create a more engaging user experience and increase its reach and effectiveness. The website redesign wasis intended to be part of an overall enhanced branding strategy to more effectively communicate our brand’s unique and compelling attributes, including our founding principles. In September 2018, we launched a new website that was designed to offer a more personalized and convenient online experience for our customers. The website features enhanced product and recipe search interfaces and improved functionality with mobile and tablet devices. We believe the continued growth of site visitors, page views and other metrics of our website activity indicates that our content is timely and informative to the communities we serve. Our website is interlinked with other online and social media outlets, including Facebook, Instagram, Twitter, Pinterest and YouTube. During fiscal year 2016,2019, we created an individualcontinued to increase our investment in paid and organic placements on platforms such as Facebook, page for each of our stores.Twitter and Instagram, resulting in enhanced social media reach. We expect to increase suchcontinue investing in digital engagement activities during fiscal year 2017.2020.
{N}Power®Customer Appreciation Program.Advertising. DuringOur advertising activities in fiscal year 2015, we completed the introduction2019 included: (i) conducting television advertising campaigns in 12 markets; (ii) conducting radio advertising campaigns in support of the{N}Power customer appreciation program at all our stores. We believe{N}Power has enhanced customer loyalty and increased customer engagement levels. Registered users of{N}Power receive digital coupons, personalized offers and other rewards, all by providing their phone number at the time of checkout.
Special Promotions. During fiscal year 2016, we organized special monthly promotions and events, such as Earth Day in April, on the anniversary of the Company’s founding in August and during the entire month of September to coincide with National Organic Harvest Month. Promotions included contests in connection with “good4u” nutrition challenges and nutrition education classes. We expect to continue offering similar promotions and special events in the future.
Sponsorships. During fiscal year 2016, we entered into sponsorship arrangements with a US speed skater and a health and fitness expert. Under these arrangements, the sponsored individuals attend “meet and greet” events at our stores, contribute articles to the Health Hotlinenewsletter and sales flyer, share recipes and fitness tips on our website and participate in social media and other promotional activities on our behalf.
Original Music.During fiscal year 2016, we entered into an agreement with a Grammy Music Educator Award-nominated musician to produce original organic-themed songs and music videos for us. Under this agreement, the musician also performed at new store openings and participatedstore relocations; (iii) conducting outdoor advertising campaigns in social mediaapproximately 80 markets; (iv) conducting targeted direct mail campaigns in select markets, and other promotional activities during fiscal year 2016.(v) utilizing organic search, search engine marketing, search engine optimization and display advertisements to deliver more customer traffic to our website and stores.
Home Delivery Services. We offer online ordering and home delivery services in select markets in partnership with a third party. We currently provideDuring fiscal year 2019, we expanded our home delivery services in the Portland, Oregon and Denver and Boulder, Colorado markets.offering from 118 to 151 stores.
Other Marketing Activities.During fiscal year 2016, we implemented an outdoor advertising campaign in five markets. In addition, we occasionally use television and radio advertising as part of our marketing activities.
New StoreOpenings. We use various targeted marketing efforts to support the successful introduction of our new stores in their individual markets. In addition to the distribution of ourHealth Hotlinenewslettermagazine and Internet and social media efforts targeted to the region, we utilize direct mail distribution of a series of introductory postcards promoting our brand and providing discounts and other incentives for new customers. We also focus on community relationship-building activities, including a series of lectures and cooking and other demonstrations in each new store’s community room and/or demonstration kitchen. Other new store promotional activities include gift card and prize giveaways, musical performances, appearances by our sponsorship partners and participation by local community leaders and organizations.
Online Pre-Ordering of Holiday Turkeys. We offer an online process to pre-order organic and free-range turkeys for the Thanksgiving and Christmas holidays.
Competition
The grocery and dietary supplement retail business is a large, fragmented and highly competitive industry, with few barriers to entry. Our competition varies by market and includes conventional supermarkets such as Kroger and Safeway,Safeway; domestic mass or discount retailers such as Wal-Mart and Target,Target; natural and gourmet markets such as Whole Foods and The Fresh Market,Market; foreign-based discount retailers such as Aldi and Lidl; specialty food retailers such as Sprouts and Trader Joe’s,Joe’s; warehouse clubs such as Sam’s Club and Costco,Costco; dietary supplement retailers such as GNC and The Vitamin Shoppe; online retailers such as Amazon; meal delivery services; independent health food stores, dietary supplement retailers,stores; drug stores,stores; farmers’ markets,markets; food co-ops, online retailersco-ops; and multi-level marketers. Competition in the grocery industry is likely to intensify, and shopping dynamics may shift, as a result of, among other things, industry consolidation, expansion by existing competitors and the increasing availability of grocery ordering, pick-up and delivery options. These businesses compete with us for customers on the basis of price, selection, quality, customer service, convenience, location, store format, shopping experience, ease of ordering and delivery or any combination of these or other factors. They also compete with us for products and locations. In addition, some of our competitors are expanding to offer a greater range of natural and organic foods.Wefoods. We also face internally generated competition when we open new stores in markets we already serve. We believe our commitment to carrying only carefully vetted, affordably priced and high-quality natural and organic products and dietary supplements, as well as our focus on providing nutritional education, differentiate us in the industry and provide a competitive advantage. In addition, we face internally generated competition when we open new stores in markets we already serve.
Seasonality
Our business is active throughout the calendar year and does not experience significant fluctuation caused by seasonal changes in consumer purchasing.
Insurance and Risk Management
We use a combination of insurance and self-insurance to cover workers’ compensation, general liability, product liability, director and officers’ liability, cyber risk, employment practices liability, employee healthcare benefits and other casualty and property risks. Changes in legal trends and interpretations, variability in inflation rates, changes in the nature and method of claims settlement, benefit level changes due to changes in applicable laws, insolvency of insurance carriers and changes in discount rates could all affect ultimate settlements of claims. We evaluate our insurance requirements and providers on an ongoing basis.
Trademarks and Other Intellectual Property
We believe that our intellectual property is important to the success of our business. We have received the registration of trademarks not only forVitamin Cottage andHealth Hotline but also for our logo,Natural Grocers by Vitamin Cottage®®andVitamin Cottage Natural Grocers®® for appropriate categories of trade. In addition, we have received the registration of service marks forEDAP –Every Day Affordable Price and, {N}power, Organic HeadquartersPower®, Organic Month Headquarters®, Organic Produce Headquarters®, Natural Grocers Cottage Wine and Craft Beer® and Resolution Reset Day and the registration of a trademark forThese Came First®. We do not own or license for use any patents, franchises or concessions that are material to our business. Our trademarks are generally valid and may be renewed indefinitely as long as they are in use and their registrations are properly maintained.
Information Technology Systems
We have made significant investments in overhead and information technology infrastructure, including purchasing, receiving, inventory, point of sale, warehousing, distribution, accounting, reporting and financial systems. We use an ERP system with an integrated merchandise management, reporting and accounting system at all of our stores, as well as at our bulk food repackaging facility and distribution center and for corporate functions including accounting, reporting and purchasing. Our ERP system application support and hardware functions are outsourced, which allows us to focus on our core business. We also have an enterprise-wide HRIS, which has enabled us to more efficiently and effectively onboardmanage our human resources and train our employeespayroll needs at all locations. During fiscal year 2018, we implemented a company-wide scheduling system for our stores, deployed new handheld technology at all our stores and started to deploy VoiP telephony solutions at our stores. During fiscal year 2019, we began to leverage cloud technology in our information technology systems and continued the deployment of VoiP telephony solutions at our stores. We plan to continue investing in our information technology infrastructure with systems that scale with and add efficiencies to our operations as we continue to grow.
Regulatory Compliance
We are subject to various federal, state and local laws, regulations and administrative practices that affect our business. The safety, formulation, manufacturing, processing, packaging, importation, labeling, promotion, advertising and distribution of products we sell in our stores, including private label products, are subject to regulation by several federal agencies, including the FDA, the Federal Trade Commission (the FTC), the USDA, the Consumer Product Safety Commission (the CPSC) and the Environmental Protection Agency (the EPA), as well as by various state and various agencies of the states and localities. Pursuant to the Food, Drug, and Cosmetic Act (the FDCA), the FDA regulates the safety, formulation, manufacturing, processing, packaging, labeling, importation and distribution of food and dietary supplements (including vitamins, minerals, amino acids and herbs). In addition, the FTC has jurisdiction to regulate the promotion and advertising of these products.
Dietary Supplements. The FDCA has been amended several times with respect to dietary supplements, in particular by the Dietary Supplement Health and Education Act of 1994 (DSHEA). DSHEA established a framework governing the composition, safety, labeling, manufacturing and marketing of dietary supplements, defined “dietary supplement” and “new dietary ingredient” (NDI) and established new statutory criteria for evaluating the safety of substances meeting the respective definitions. In the process, DSHEA removed dietary supplements and NDIs from pre-market approval requirements that apply to food additives and pharmaceuticals and established a combination of “notification” and “post marketing controls” for regulating product safety. Notwithstanding, non-dietary ingredients in a dietary supplement remain subject to the FDA’s food additive authorities. The FDA does not require notification to market a dietary supplement if it contains only dietary ingredients that were present in the United States food supply prior to DSHEA’s enactment on October 15, 1994. However, for a dietary ingredient not present in the food supply prior to this date, or NDIs, the manufacturer must provide the FDA with information supporting the conclusion that the ingredient will reasonably be expected to be safe at least 75 days before introducing a new dietary ingredient into interstate commerce. As required by the Food Safety Modernization Act (FSMA), the FDA issued draft guidance in July 2011 and August 2016, which attempted to clarify when an ingredient would be considered an NDI, the evidence needed to document the safety of an NDI and appropriate methods for establishing the identity of an NDI. The draft guidance has not been finalized. If finalized, the draft guidance may cause dietary supplement products available in the market before DSHEA to be classified to include an NDI if the dietary supplement product was produced using manufacturing processes different from those used in 1994.local agencies.
In certain circumstances, the FDA’s guidance regarding applications for approval of Investigational New Drugs (INDs) applies to the food and dietary supplement industry. The FDA’s guidance states that certain dietary supplements should not be marketed if they contain a substance that is undergoing substantial clinical investigations intended to evaluate the dietary supplement’s ability to diagnose, cure, mitigate, treat, or prevent a disease when such investigations are public knowledge, unless the article was marketed as a dietary supplement before the IND application became effective and before any such investigations began. Although the boundaries of the FDA’s enforcement activities regarding alleged violations of its guidance are not clear at this time, some dietary supplements might have to be immediately withdrawn from the market even if they were marketed as a dietary supplement before initiation of substantial clinical investigations, the existence of which has been made public. The potential need for withdrawal could negatively affect the supply chain for certain products.
DSHEA empowered the FDA to establish good manufacturing practice regulations governing key aspects of the production of dietary supplements, including quality control, packaging and labeling. DSHEA also expressly permits dietary supplements to bear statements describing how a product affects the structure, function and general well-being of the body, if accompanied by a required disclaimer. Currently, although manufacturers must be able to substantiate any such statement, no pre-market approval authorization is required for such statements and manufacturers need only notify FDA that they are employing a given claim within 30 days of first marketing the product. No statement may expressly or implicitly represent that a dietary supplement will diagnose, cure, mitigate, treat or prevent a disease. DSHEA does, however, authorize supplement sellers to provide “third-party literature,” (e.g., a reprint of a peer-reviewed scientific publication linking a particular dietary ingredient with health benefits) in connection with the sale of a dietary supplement to consumers. This provision is an exception to the FDA’s broad powers over the promotion of regulated products. Accordingly, the authorization is limited and applies only if the publication is printed in its entirety, is not false or misleading, presents a balanced view of the available scientific information and does not “promote” a particular manufacturer or brand of dietary supplement and is displayed in an area physically separate from the dietary supplements.
Food.Food Products. The FDA has comprehensive authority to regulate the safety of food and food ingredients other than dietary supplements.(including pet food and pet food ingredients but excluding meat, poultry, catfish and certain egg products, which are regulated by USDA) under the Federal Food, additivesDrug, and food contact substancesCosmetic Act (the FDCA). The USDA’s Food Safety Inspection Service regulates and regularly inspects meat, poultry, catfish and certain egg products to assure that these products are subject to pre-market approvals or notification requirements. safe, wholesome and correctly labeled and packaged under the Federal Meat Inspection Act and the Poultry Products Inspection Act.
The FDA’s overallFood Safety Modernization Act (the FSMA), enacted in 2011, amended the FDCA and significantly expanded food safety requirements and the FDA’s regulatory authority was dramatically enhanced in 2011 with the passage of FSMA.over food safety. The FSMA requiredrequires the FDA to issue regulations mandating that risk-based preventiveimpose comprehensive, prevention-based controls be observed byacross the majority of food producers. Regulations and rules issued under FSMA are in varying degrees of finalization and implementation. Regardless, the FDA’s authority under FSMA applies to all domesticsupply chain, further regulates food facilities and, by way of imported food supplier verification requirements, to all foreign facilities that supply us with food products. In addition, FSMA required the FDA to establish science-based minimum standards for the safe production and harvesting of produce, identify “high risk” foods and “high risk” facilities, set goals for the frequency of FDA inspections of such high risk facilities as well as non-high risk facilities and foreign facilities from which food isproducts imported into the United States. With respectStates and provides the FDA with mandatory recall authority. In addition, the FSMA requires the FDA to both foodsundertake numerous rulemakings and dietary supplements, FSMA meaningfully augmented the FDA’s ability to access both producers’ and suppliers’ records,issue numerous guidance documents, as well as added new records that must be createdreports, plans, standards, notices and maintained. This increased access could cause the FDA to identify areas of concern it had not previously considered to be problematic for our suppliers and contract manufacturers. FSMA also gives the FDA authority to require food producers, distributors and sellers to recall adulterated or misbranded food if the FDA determines that there is a reasonable probability that the food will cause serious adverse health consequences to persons or animals. Additionally, FSMA increases the FDA’s authority for administrative detentions of adulterated and misbranded foods. FSMA also could cause enhanced tracking and tracing of food requirements and, asother tasks. As a result, added recordkeeping burdens upon our suppliersimplementation of the legislation is ongoing and contract manufacturers.likely to take several years.
The FDA also exercises broad jurisdiction over the labeling and promotion of food.food and dietary supplements. Labeling is a broad concept that, under certainmost circumstances, extends even to product-related claims and representations made on a company’s website or similar printed or graphic medium. All foods, including dietary supplements, must bear labeling that provides consumers with essential information with respect to standards of product identification,identity, net quantity/weight, nutritionalnutrition facts ingredients, manufacturerlabeling, ingredient statements, identity and the identitylocation of certain allergens (if present).manufacturer/packer/distributor, and allergen disclosures. The FDA administers a pre-market authorization program applicable to foods and supplements alike regardingalso regulates the use of “nutrient content”structure/function claims (e.g.(e.g., “calcium builds strong bones”), qualified health claims (e.g., "adequate calcium throughout life may reduce the risk of osteoporosis"), nutrient content claims (e.g., “high in antioxidants,” “low in fat,” etc.antioxidants”), “health” claims (claims describing the relationship between a food substance and a health or disease condition) and “natural“natural” and “all natural” claims. “Organic” claims, however, are primarily regulated by the USDA. In addition, the FDA has authority over products falselyCertain new food labeling requirements, including disclosure of calories and other nutrient information, are scheduled to go into effect on January 1, 2020 for manufacturers with $10.0 million or misleadingly labeled “organic.” Products labeled “organic” must be certified by an accredited agent as compliantmore in annual food sales and on January 1, 2021 for manufacturers with USDA-established standards.less than $10.0 million in annual food sales.
Dietary Supplements. The FDA also has comprehensive authority to regulate the safety of dietary supplements, dietary ingredients, labeling and current good manufacturing practices. The Dietary Supplement Health and Education Act (DSHEA), enacted in 1994, greatly expanded the FDA’s regulatory authority over dietary supplements. Through DSHEA, dietary supplements became a separately regulated subcategory of food and the FDA was empowered to establish good manufacturing practice regulations governing key aspects of the production of dietary supplements, including quality control, packaging and labeling. DSHEA also expressly permits dietary supplements to make label claims and promotional statements describing how a product affects the structure, function and general well-being of the body, although no statement may expressly or implicitly represent that a dietary supplement will diagnose, cure, treat or prevent a disease, which are claims reserved for drug products that are regulated separately by the FDA.
FDA Enforcement. The FDA has broad authority to enforce the provisions of the FDCA applicable to the safety, labeling, manufacturing, transport and promotion of foods and dietary supplements, including powers to issue a public warning letter to a company, publicize information about illegal products, institute an administrative detention of food, request or order a recall of illegal food products from the market, and request the Department of Justice to initiate a seizure action, an injunction action or a criminal prosecution in the United States courts.prosecution. Pursuant to the FSMA, the FDA also has the power to refusedeny the import of any food or dietary supplement from a foreign supplier that is not appropriately verified as being in compliance with all FDA laws and regulations. Moreover, the FDA has the authority to administratively suspend the registration of any facility producingthat produces or processes food, including supplements, deemedthat it deems to present a reasonable probability of causing serious adverse health consequences. In the past year, the FDA has dramatically increased enforcement actions against nutritional supplement companies, issuing dozens of warning letters regarding products that make impermissible drug claims related to treatments and cures for various diseases.
Food and Dietary Supplement Advertising. TheIn addition to the FDA’s regulatory control over product labeling, the FTC also exercises jurisdiction over the advertising of foods and dietary supplements.supplements, including the use of “green” claims on products, general claims about environmental benefits, claims about the geographic origin of products (e.g. “Made in the USA”) and claims about whether product packaging is recyclable or compostable. The FTC has the power to institute monetary sanctions and the imposition of “consent decrees” and penalties that can severely limit a company’s business practices. In recent years, the FTC has instituted numerous enforcement actions against dietary supplement companies for failure to have adequate substantiation for claims made in advertising or for the use of false or misleading advertising claims. In addition, private parties are increasingly initiating legal actionbroad consumer class actions against food and dietary supplement manufacturers for false or misleading labeling and/or advertising.
The FTC and FDA have authority to regulate the marketing and label claims of foods, functional foods, dietary supplements, probiotic preparations and homeopathic remedies. The agencies have suggested in published comments and court filings that health claims for these products should be based on two Random Controlled Trials (RTCs) or similar investigational research methods. It is not clear that RTCs designed to measure the effects and side effects of a medical drug on a human population suffering a disease are appropriate for measuring the efficacy of foods, functional foods, dietary supplements, probiotic preparations and homeopathic remedies to help maintain an individual’s healthy non-diseased state. If the FTC and FDA final guidance do not reflect these concerns, and if RTCs or similar methods are required in the future, the high cost and delays of RTCs or other investigational methods may disrupt the supply chain for these products or cause their removal from the market.
Compliance. As is common in our industry, we rely on our suppliers and contract manufacturers to ensure that the products they manufacture and sell to us comply with all applicable regulatory and legislativestatutory requirements. In general, we seek certifications of compliance, representations and warranties, indemnification and insurance from our suppliers and contract manufacturers. However, even with adequate certifications, representations and warranties, insurance and indemnification, any claims of non-compliance could significantly damage our reputation and consumer confidence in the products we sell. In addition, the failure of such products to comply with applicable regulatory and legislative requirements could prevent us from marketing the products or require us to recall or remove such products from our stores. In order to comply with applicable statutes and regulations, our suppliers and contract manufacturers have from time to time reformulated, eliminated or relabeled certain of their products and we have revised certain provisions of our sales and marketing program.
Furthermore, to ensure compliant practices,We regularly train our in-store employees working in our stores are trained regularly on how to provide an educational customer service using an educational approach that is ethical, honest and accurate and that does not cross over into a scope of practice reserved for licensed healthcare professionals. For instance, we doexample, our employees are not allow discussion ofallowed to discuss any “disease” or “cure.“cures.” Instead, we focus on how the structure and function of the body is affected by lifestyle choices and the different nutritional components of an individual’s diet, including those contained in dietary supplements. Our customers are encouraged to make informed decisions about their diet, lifestyle and possible need for supplementation. We also conduct internalOur NHCs are responsible for overseeing compliance reviews on all free nutrition literature that we make available to our customers upon request with the goal of ensuring that these materials only reference relevant dietary supplement ingredients and not any particular brands or products. One responsibility of the Nutritional Health Coach is to oversee our FDA, USDA and FTC compliance measures. Weregulations. While we believe that our nutrition education practices are in compliance with federal and state requirements, but a finding to the contrary could pose significant issues with respect to our business and our reputation among our customers or otherwise have a material adverse effect on our business.
New or revised governmentfederal, state and local laws and regulations affecting our business or our industry, such as those relating to industrial hemp products and genetically modified (bioengineered) foods, could result in additional compliance costs and civil remedies. The risks associated with these laws and regulations are further described under the caption “Risk Factors.”
Segment Information
We have one reporting segment, natural and organic retail stores, through which we conduct all of our business. Please see the Consolidated Financial Statements of the Company for the fiscal year ended September 30, 2016,2019, set forth in Part IV of this Form 10-K, for financial information regarding this segment.
Available Information
Our website is located atwww.naturalgrocers.com. We make our periodic reports and other information filed with or furnished to the SEC available, free of charge, through our website as soon as reasonably practicable after those reports and other information are electronically filed with or furnished to the SEC. In addition, our Corporate Governance Guidelines, the charters for our Audit Committee and Compensation Committee, and our Code of Ethics are publicly available on our website atwww.naturalgrocers.com under the “Investor Relations – Corporate Governance” section, and we will post any amendments to, or waivers from, a provision of this Code of Ethics on our website at the address and location specified above.A printed copy of this information is also available without charge by sending a written request to Corporate Secretary, Natural Grocers by Vitamin Cottage, Inc., 12612 West Alameda Parkway, Lakewood, CO 80228. You may read and copy any materials we file with the SEC at the Securities and Exchange Commission Public Reference Room at 100 F Street, N.E., Washington, D.C. 20549. The SEC also maintains a website that contains our reports and other information atwww.sec.gov. Information on our website or any other website is not incorporated by reference into this Form 10-K.
ItemItem 1A. Risk Factors.
Our business, financial condition and results of operations can bemateriallyimpacted by a number of factors which could cause our actual results to vary materially from recent results or from our anticipated future results. If any of the following risks actually occurs, our business, financial condition, results of operations, cash flow and prospects could be materially and adversely affected. As a result, the trading price of our common stock could decline and you could lose all or part of your investment in our common stock. Accordingly, you should carefully consider the risks described below as well as the other information and data included in this Form 10-K.
Risks related to our business
We may not be successful in our efforts to grow.
Our continued growth largely depends on our ability to increase sales in our existing stores and successfully open and operate new stores on a profitable basis. Our comparable store sales growth could be lower than our historical average for various reasons, including the opening of new stores that cannibalize sales in existing stores, increased competition, general economic conditions, regulatory changes, price changes as a result of competitive factors and product pricing and availability.
During fiscal years 20162019 and 2015,2018, we opened 23six and 16eight new stores, respectively. We plan to open 15five to 20six new stores and relocate threeone to two existing stores in fiscal year 2017.2020. We expect our rate of new store unit growth in the foreseeable future to be comparable to recent years, depending on economic and business conditions and other factors. Delays or failures in opening new stores, or achieving lower than expected sales in new stores, could materially and adversely affect our growth. Our plans for continued expansion could place increased demands on our financial, managerial, operational and administrative resources. For example, our planned expansion will require us to increase the number of people we employ and may require us to upgrade our management information system and our distribution infrastructure. We currently operate a single bulk food repackaging facility and distribution center, which houses our bulk food repackaging operation. In order to support our recent and expected future growth and to maintain the efficient operation of our business, we may need to add additional capacity in the future. These increased demands and operating complexities could cause us to operate our business less efficiently, which could materially and adversely affect our operations, financial performance and future growth.
We may not be able to open new stores on schedule or operate them successfully. Our ability to successfully open new stores depends upon a number of factors, including our ability to select suitable sites for our new store locations; to negotiate and execute leases on acceptable terms; to coordinate the contracting work on our new stores; to identify, recruit and train store managers, Nutritional Health Coaches and other staff; to secure and manage the inventory necessary for the launch and successful operation of our new stores; and to effectively promote and market our new stores. If we are ineffective in performing these activities, our efforts to open and operate new stores may be unsuccessful or unprofitable, which could materially and adversely affect our operations, financial performance and future growth.
Our newly opened stores may negatively impact our financial results in the short-term, and may not achieve sales and operating levels consistent with our more mature stores on a timely basis or at all.
We have actively pursued new store growth and plan to continue doing so in the future (although the rate of new store unit growth in the foreseeable future is expected to moderate somewhat comparedbe comparable to recent years, depending on economic and business conditions and other factors). Our new store openings may not be successful or reach the sales and profitability levels of our existing stores.Althoughstores. Although we target particular levels of cash-on-cash returns and capital investment for each of our new stores, new stores may not meet these targets. Any store we open may not be profitable or achieve operating results similar to those of our existing stores. New store openings may negatively impact our financial results in the short-term due to the effect of store opening costs and lower sales and contribution to overall profitability during the initial period following opening. New stores build their sales volume and their customer base over time and, as a result, generally have lower margins and higher operating expenses, as a percentage of net sales, than our existing stores. New stores may not achieve sustained sales and operating levels consistent with our more mature store base on a timely basis or at all. This may have an adverse effect on our business, financial condition and operating results.
In addition, we may not be able to successfully integrate new stores into our existing store base and those new stores may not be as profitable as our existing stores. Further, we have experienced in the past, and expect to experience in the future, some sales volume transfer from our existing stores to our new stores as some of our existing customers switch to new, closer locations. If our new stores are less profitable than our existing stores, or if we experience sales volume transfer from our existing stores, our business, financial condition and operating results may be adversely affected.
If we are unable to successfully identify market trends and react to changing consumer preferences in a timely manner, our sales may decrease.
We believe our success depends, in substantial part, on our ability to:
● | anticipate, identify and react to natural and organic grocery and dietary supplement trends and changing consumer preferences in a timely manner; |
● | translate market trends into appropriate, saleable product and service offerings in our stores; and |
● | develop and maintain vendor relationships that provide us access to the newest merchandise, and products that satisfy our standards, on reasonable terms. |
Consumer preferences often change rapidly and without warning, moving from one trend to another among many product or retail concepts. Our performance is impacted by trends regarding healthy lifestyles, dietary preferences, convenient meal options, natural and organic products, dietary supplements, ingredient transparency and sustainability and at-home meal preparation. Consumer preferences towards dietary supplements or natural and organic food products might shift as a result of, among other things, economic conditions, food safety perceptions, scientific research or findings regarding the benefits or efficacy of these products, reduced or changed consumer choices and the cost or sustainability of these products. Our store offerings are comprised of natural and organic products and dietary supplements. A change in consumer preferences away from our offerings, including as a result of, among other things, reductions or changes in our offerings, could have a material adverse effect on our business. Additionally, negative publicity regarding the safety of natural and organic products or dietary supplements, or new or upgraded regulatory standards, may adversely affect demand for the products we sell and could result in lower customer traffic, sales and results of operations.
If we are unable to anticipate and satisfy consumer merchandise preferences in the regions where we operate, our net sales may decrease, and we may be forced to increase markdowns of slow-moving merchandise, either of which could have a material adverse effect on our business, financial condition and results of operations.
Our store sales growth and quarterly financial performance may fluctuate for a variety of reasons.
Our store sales growth and quarterly results of operations have fluctuated in the past, and we expect them to continue to fluctuate in the future. A variety of other factors affect our store sales growth and quarterly financial performance, including:
● | changes in our merchandising strategy or product mix; |
● | the performance of our newer and remodeled stores; |
● | the effectiveness of our inventory management; |
● | the timing and concentration of new store openings, and the related additional human resource requirements and pre-opening and other start-up costs; |
● | slowing in the natural and organic retail sector; |
● | the cannibalization of existing store sales by our new store openings; |
● | levels of pre-opening expenses associated with new stores; |
● | the timing and effectiveness of our marketing activities; |
● | consumer preferences, buying trends and spending levels; |
● | food and commodity price inflation or deflation; |
● | the number and dollar amount of customer transactions in our stores; |
● | seasonal fluctuations due to weather conditions and extreme weather-related disruptions; |
● | our ability to generate new and repeat visits to our stores and adequate levels of customer engagement; |
● | actions by our existing or new competitors, including pricing |
● | regulatory changes affecting availability and marketability of products; |
|
|
● | supply shortages or other operational disruptions; and |
● | general United States economic conditions and, in particular, the retail sales environment. |
Accordingly, our results for any one fiscal year or quarter are not necessarily indicative of the results to be expected for any other year or quarter, andquarter. Our comparable store sales growth during any particular future period may decrease. In the event of such aany future decrease, the price of our common stock could decline. For more information on our results of operations for fiscal year 2016,years 2018 and 2019, see “Management’s Discussion and Analysis of Financial Condition and Results of Operations.”
Disruptions in thenational orworldwide economyAdverse economic conditions and political instabilitymay could adversely affect our business, results of operations and financial condition and could negatively impact our ability to execute our growth strategy.
Adverse and uncertain economic conditions maycould adversely impact demand for the products we sell in our stores. Consumer spending and levels of disposable income, including spending for natural and organic grocery and dietary supplement products that we sell, are affected by, among other things, prevailing economic conditions, levels of employment, salaries and wages, inflation, interest rates, the availability of credit, tax rates, fuel and energy costs, housing market conditions, general business conditions, consumer confidence and consumer perceptionperceptions of economic conditions. Economic conditions and consumer spending may also be adversely impacted by political instability. Natural disasters, the outbreak or escalation of war, the occurrence of terrorist acts or other hostilities in or affecting the United States, or concern regarding epidemics in the United States or in international markets could also lead to a decrease in spending by consumers. In the event of an economic slowdown or recession, consumer spending could be adversely affected, and we could experience lower net sales than expected. We could be forced to delay or slow our new store growth plans, which could have a material adverse effect on our business, financial condition and results of operations. In addition, our ability to manage normal commercial relationships with our suppliers, manufacturers of our private label products, distributors, customers and creditors may suffer. Customers may shift purchases to lower-priced or other perceived value offerings during economic downturns. In particular, customers may reduce the amount of natural and organic products that they purchase and instead purchase conventional offerings, which generally have lower retail prices, at other stores. In addition, consumers may choose to purchase private label products at other stores rather than branded products because they are generally less expensive. Suppliers may become more conservative in response to these conditions and seek to reduce their production.
Economic conditions and consumer spending may also be adversely impacted by political instability. The outbreak or escalation of war, the occurrence of terrorist acts or other hostilities in or affecting the United States, or concerns regarding epidemics in the United States or in international markets could also lead to a decrease in spending by consumers or may cause our customers to avoid visiting our stores.
Our results of operations depend upon, among other things, our ability to maintain and increase sales volume with our existing customers, to attract new customers and to provide products that appeal to customers at prices they are willing and able to pay. Prolonged unfavorable economic conditions or political instability may have an adverse effect on our sales and profitability.
We may be unable to compete effectively in ourmarkets, which arehighly competitive.
The markets for natural and organic groceries and dietary supplements are large, fragmented and highly competitive, with few barriers to entry. Our competition varies by market and includes conventional supermarkets, natural, gourmet and specialty food markets, mass and discount retailers, foreign-based discount retailers, warehouse clubs, independent health food stores, dietary supplement retailers, drug stores, farmers’ markets, food co-ops, and online retailers and multi-level marketers. These businesses compete with us for customers on the basis of price, product selection, quality, customer service, convenience, location, store format, shopping experience, ease of ordering and delivery or any combination of these or other factors. They also compete with us for products and locations. To the extent our competitors lower their prices, our ability to maintain sales levels and operating margins may be negatively impacted. In addition, some of our competitors are expanding their natural and organic food offerings, or increasing the space allocated to natural and organic foods.Manyfoods and enhancing options of engaging with and delivering their products to customers. Many of our competitors are larger, more established and have greater financial, marketing and other resources than we do, and may be able to adapt to changes in consumer preferences more quickly, devote greater resources to the marketing and sale of their products, or generate greater brand recognition. In addition, we face internally generated competition when we open new stores in markets we already serve. An inability to compete effectively may cause us to lose market share to our competitors and could have a material adverse effect on our business, financial condition and results of operations.
An inability to maintain or increase our operating margins could adversely affect our results of operations.
We intend to continue our focus on improving our operating margins by leveraging more efficiencies of scale, additional improved systems, further cost discipline, added focus on appropriate store labor levels and even more disciplined product selection. If we are unable to successfully manage the potential difficulties associated with store growth, we may not be able to capture the efficiencies of scale that we expect from expansion. If we are not able to capture greater efficiencies of scale, improve our systems, further enhance our cost discipline and increase our focus on appropriate store labor levels and disciplined product selection, we may not be able to achieve our goals with respect to operating margins. In addition, if we do not adequately refine and improve our various ordering, tracking and allocation systems, we may not be able to increase sales and reduce inventory shrink. Further, pricing pressures from competitors and the impact of the product discounts offered by the{N}Power {N}power customer loyalty program may also adversely impact our operating margins. As a result, our operating margins may stagnate or decline, which could have a material adverse effect on our business, financial condition and results of operations and adversely affect the price of our common stock.
A reduction in traffic to anchor stores in the shopping areas in close proximity to our stores could significantly reduce our sales and leave us with unsold inventory, which could have a material adverse effect on our business, financial condition and results of operations.
Many of our stores are located in close proximity to shopping areas that may also accommodate other well-known anchor stores. Sales at our stores are derived, in part, from the volume of traffic generated by the other anchor stores in the shopping areas where our stores are located. Customer traffic may be adversely affected by enhanced customer reliance on ecommerce to meet their shopping needs, regional economic downturns, a general downturn in the local area where our store is located, long-term nearby road construction projects, the closing of nearby anchor stores or other nearby stores or the decline of the shopping environment in a particular shopping area. Any of these events could reduce our sales and leave us with excess inventory, which could have a material adverse effect on our business, financial condition and results of operations. In response to such events, we may be required to increase markdowns or initiate marketing promotions to reduce excess inventory, which could further decrease our gross profits and net income.
If we or our third-party suppliers fail to comply with regulatory requirements, or are unable to provide products that meet our specifications, our business and our reputation could suffer.
If we or our third-party suppliers, including suppliers of ourNatural Grocers brand private label products, fail to comply with applicable regulatory requirements or to meet our quality specifications, we could be required to take costly corrective action and our reputation could suffer. We do not own or operate any manufacturing facilities, except for our bulk food repackaging facility and distribution center discussed below, and therefore depend upon independent third-party vendors to produce our private label branded products, such as vitamins, minerals, dietary supplements, body care products, food products and bottled water. Third-party suppliers may not maintain adequate controls, including USDA and FDA mandated good manufacturing practices, with respect to product specifications and quality. Such suppliers may be unable to produce products on a timely basis or in a manner consistent with regulatory requirements. We depend upon our bulk food repackaging facility and distribution center for the majority of our private label bulk food products. We may also be unable to maintain adequate product specification and quality controls at our bulk food repackaging facility and distribution center, or produce products on a timely basis and in a manner consistent with regulatory requirements. In addition, we may be required to find new third-party suppliers of our private label products or to find third-party suppliers to source our bulk foods. There can be no assurance that we would be successful in finding such third-party suppliers that meet our quality guidelines.
We, as well as our vendors,suppliers, are subject to numerousfederal, state and local laws and regulations and our compliance with these laws and regulations, as they currently exist or as modified in the future, may increase our costs, limit or eliminate our ability to sell certain products,require recalls of certain products, raise regulatory enforcement risks not present in the past or otherwise adversely affect our business, results of operations and financial condition.
As a retailer of food and dietary supplements and a seller of many of our own private label products, weWe are subject to numerousvarious federal, state and state healthlocal laws, regulations and safety laws and regulations.administrative practices that affect our business. Our suppliers and contract manufacturers are also subject to such laws and regulations. These lawsThe safety, formulation, manufacturing, processing, packaging, importation, labeling, promotion, advertising and regulations apply to many aspectsdistribution of our business, including the sourcing of ingredients, manufacturing, packaging, labeling, distribution, advertising, sale, quality and safety of the products we sell as well as the health and safety ofin our employees and the protection of the environment. In the United States, westores, including private label products, are subject to regulation by variousseveral federal government agencies, including the FDA, the FTC, the USDA, the FTC, the Occupational Safety and Health Administration, the Consumer Product Safety CommissionCPSC and the Environmental Protection Agency,EPA, as well as by various state and local agencies. We are also
Dietary Supplement Risks. Our sale of dietary supplements is subject to the USDA’s Organic Rule, which facilitates interstate and international commerce and the marketing of certain organically produced products, and provides assurance to our customers that such products meet consistent and uniform minimum base standards. Compliance with the USDA’s Organic Rule also places a significant burden on some of our suppliers, which may cause a disruption in some of our product offerings. In addition, our sales of dietary supplements are regulatedFDA’s comprehensive regulatory authority under the FDCA, as revisedamended by FSMA and DSHEA. The FDCA expressly permitsDSHEA greatly expanded the FDA’s regulatory authority over dietary supplements and empowered the FDA to bear statements describing how a product affects the structure, function and general well-beingestablish good manufacturing practice regulations governing key aspects of the body, if accompanied byproduction of dietary supplements, including quality control, packaging and labeling. Under DSHEA, no dietary supplement may bear a required disclaimer. However, no statement maythat expressly or implicitly representrepresents that a dietarysuch supplement will diagnose, cure, mitigate, treat or prevent a disease. If these laws and regulations were violated by our management, employees, suppliers, distributors or vendors, we could be subject to regulatory enforcement action, public warning letters, product recalls, fines, penalties and sanctions, including injunctions against the future shipment and sale of products, seizure and confiscation of products, prohibition on the operation of our stores, restitution and disgorgement of profits, operating restrictions and even criminal prosecution in some circumstances. In addition, other public and private actors are increasingly targeting dietary supplement retailers and manufacturers with class action lawsuits for selling products that allegedly fail to adhere to the requirements of FDCA and DSHEA, including for failing to adhere to current good manufacturing practices and for false or misleading product statements, as well as state common and statutory laws regarding deceptive trade practices.
In addition, DSHEA differentiates between old dietary ingredients, or ODIs (i.e., those ingredients present in the food supply prior to October 15, 1994, which require no pre-market notification to the FDA), and new dietary ingredients, or NDIs (i.e., those ingredients not present in the food supply prior to October 15, 1994, which do require pre-market notification to the FDA). The FDA has not yet issued final guidance regarding the identification of a NDI or the evidence needed to document a NDI’s safety, but when it does such guidance may increase the cost of compliance in establishing the identity and safety of a NDI. In addition, the FDA has not yet promulgated a definitive list of ODIs, but when it does, such a list of ODIs could disrupt the supply of any dietary supplements made from ingredients that are currently believed to pre-date DSHEA but are not ultimately classified as a ODI. Accordingly, changes in dietary supplement regulation could also materially adversely affect the cost and availability of the dietary supplement products that we sell.
InAdvertising and Products Claims Risks. We could also be the target of claims relating to false or deceptive advertising in connection with the marketing and advertisement of the products we sell, we could be the target of claims relating to false or deceptive advertising, including under the auspices of the FTC, the consumer protection statutes of some states and some non-government watchdog groups. In addition, the FDA has aggressively enforced its regulations with respect to structure/function claims (e.g., “calcium builds strong bones”), health claims (e.g., "adequate calcium throughout life may reduce the risk of osteoporosis"), nutrient content claims (e.g., “high in antioxidants”) and other claims that impermissibly suggest therapeutic benefits for certain foods or food components. In addition, the number of private consumer class actions relating to false or deceptive advertising against food, beverage and nutritional supplement manufacturers has increased in recent years. These events could interrupt the marketing and sales of products in our stores, including our private label products, severely damage our brand reputation and public image, increase the cost of products in our stores, result in product recalls or litigation, and impede our ability to deliver merchandise in sufficient quantities or quality to our stores, which could result in a material adverse effect on our business, financial condition, and results of operations.
New or revised government lawsoperations and regulations have been adopted in recent years, such as those relating to genetically modified foods, could result in additional compliance costs and the increased use of civil remedies to enforce such laws and regulations. Additionally, increased enforcement by government agencies could result in such costs and remedies, as well as the payment of fines or penalties imposed by such agencies.cash flows.
FSMA grantsOur reputation could also suffer from real or perceived issues involving the labeling or marketing of products we sell as “natural.” Although the FDA greaterand the USDA have each issued statements regarding the appropriate use of the word “natural,” and the FDA has indicated it intends to define the term, there is currently no single U.S. government-regulated definition of the term “natural” for use in the food industry. The resulting uncertainty has led to consumer confusion, distrust and a growing number of legal challenges. Plaintiffs have commenced class action litigation against a number of food companies and retailers that market “natural” products, asserting false, misleading and deceptive advertising and labeling claims. Should we become subject to similar lawsuits or claims, consumers may avoid purchasing products from us or seek alternatives, even if the basis for the claim is ultimately determined to be unfounded. Adverse publicity about these matters may discourage consumers from buying our products. Further, the cost of defending against any such class actions could be significant. Any loss of confidence on the part of consumers in the truthfulness of our labeling or ingredient claims would be difficult and costly to overcome and may significantly reduce our brand value. Any of these events could adversely affect our reputation and brand and decrease our sales, which could have a material adverse effect on our business, financial condition, results of operations and cash flows.
Organic and GMO Claims. We are also subject to the requirements of the USDA’s National Organic Program (NOP), which establishes national standards for organically produced agricultural products. The NOP regulations assure our customers that products with the “USDA Organic” seal meet consistent and uniform standards. The failure of one or more of our suppliers to comply with the NOP regulations could cause a disruption in the supply of our product offerings. In addition, the USDA has recently set forth final rules on the labeling of food containing genetically modified ingredients. Since voluntary compliance with these rules does not begin until January 2020 and the deadline for mandatory compliance is not until January 1, 2022, we and our suppliers have some time to comply with these new labeling requirements.
FSMA Implementation Risks. The FSMA significantly expanded food safety requirements and the FDA’s regulatory authority over the safety of the national food supply and required the FDA to issue regulations mandating that risk-based preventive controls be observed by the majority of food producers and dietary supplement makers.safety. Voluminous regulations and rules issued under the FSMA are in varying degrees of finalization and implementation. Regardless, the FDA’s authority under FSMA applies to all domestic food facilities and, by way of imported food supplier verification requirements, to all foreign facilities that supply food products. In addition, the FSMA required the FDA to establish science-based minimum standards for the safe production and harvesting of produce identify “high risk” foods and “high risk” facilitiesincrease inspection of foreign and goals for the frequency of FDA inspections of such high risk facilities as well as non-high risk facilities and foreign facilities from which food is imported into the United States.domestic facilities. With respect to both food products and dietary supplements, the FSMA meaningfully augmented the FDA’s ability to access both producers’ and suppliers’ records as well asand added new records that must be created and maintained. This increased access could permit the FDA to identify areas of concern it had not previously considered to be problematic either for us or for our suppliers.The FSMA also requires the implementation of enhanced tracking and tracing of food and dietary supplements through production and distribution and, as a result, added recordkeeping burdens upon our suppliers. In addition, under the FSMA, the FDA now has the authority to inspect facilities, certifications and thereforesupplier documentation to evaluate whether foods and ingredients from our suppliers are compliant with the FDA’sapplicable regulatory requirements. Such FDA inspections, and regulatory actions resulting therefrom, may require product recalls, delay the supply of certain products or result in certain products being unavailable to us for sale in our stores. The implementation of the FSMA requirements may be too expensive or too complicated for some of our suppliers, which may result inincrease the cost, or curtail or eliminate the supply, of certain products that we purchase from small and/or local suppliers being unavailable to us for sale in our stores.suppliers.
DSHEA established that no notification to the FDA is required to market a dietary supplement if it contains only dietary ingredients that were present in the United States food supply prior to October 15, 1994. However, a dietary ingredient not present in the food supply prior to that date is considered an NDI and the manufacturer is required to provide the FDA with information supporting the conclusion that the ingredient will reasonably be expected to be safe at least 75 days before introducing an NDI into interstate commerce. As required by the FSMA, the FDA issued draft guidance in July 2011 and August 2016, which attempted to clarify when an ingredient could be considered an NDI, the evidence needed to document the safety
The FDA also issued draft guidance on INDs in 2015. The guidance could classify a food or dietary supplement ingredient as an investigational new drug and simultaneously forceHomeopathic Products. In recent years, the ingredient to be removed from commerce if the ingredient is being investigated as a potential drug treatment for a disease. The guidance has not been finalized. If the guidance is finalized in its present form, some food and dietary supplement products containing certain ingredients may not be available to us to sell in our stores.
The FDA and FTC have increased their regulatory scrutiny of homeopathic products. In October 2019, the FDA released new draft guidance on homeopathic products, throughstating that the agency intends to take a public stakeholder workgroup process.risk-based approach to homeopathic products under which it will prioritize enforcement and regulatory actions involving certain categories of homeopathic products marketed without the required FDA approval. Although no final guidance has yet been issued, at this time, the stakeholder processsuch guidance may result in guidance that reclassifies homeopathic products as drugs, requiresrequire homeopathic products to be approved for sale under a new approval or review regimen or otherwise lessenslessen their availability tofor us to sell in our stores.
Furthermore,Third-Party Risks. We rely on our suppliers and contract manufacturers to ensure that the products they manufacture and sell to us comply with all applicable regulatory requirements and are made using FDA-mandated good manufacturing practices. In general, we seek certifications of compliance, representations and warranties, indemnification and/or insurance from our suppliers and contract manufacturers. However, even with adequate insurance and indemnification, the failure of any products to comply with applicable regulatory requirements could prevent us from marketing such products or require us to recall or remove such products from our stores. In addition, any claims of non-compliance could significantly damage our reputation and consumer confidence in recent years, the FDA has been and continues to be aggressive in enforcing its regulations with respect to nutrient content claims (e.g., “low fat,” “good source of,” “calorie free,” etc.), unauthorized “health claims” (claims that characterize the relationship between a food or food ingredient and a disease or health condition) and other claims that impermissibly suggest therapeutic benefits for certain foods or food components. Such FDA enforcement with respect to such promotional practices could result in costly product changes, potential private litigation, bad publicity and loss of consumer goodwill.products we sell.
Other Regulatory Risks. We are also subject to laws and regulations more generally applicable to retailers, including labor and employment, taxation, zoning and land use. In addition, changes in federaluse, environmental protection, workplace safety, public health, alcoholic beverage sales and state minimum wage lawshandling and other laws relating to employee benefits could cause us to incur additional wage and benefits costs, which could hurt our profitability.
transport of products derived from industrial hemp. We cannot predict the nature of future laws, regulations, interpretations or applications, or determine what effect either additional government regulations or administrative orders, when and if promulgated, or disparate federal, state and local regulatory schemes could have on our business in the future. They could, however, require the reformulation of certain products to meet new standards, the recall or discontinuance of certain products not able to be reformulated, additional recordkeeping, expanded documentation of the properties of certain products, expanded or different labeling and scientific substantiation. Any or all of such requirements could have an adverse effect onmaterially and adversely affect our operating results.business, financial condition and results of operations.
We may experience product recalls, withdrawals or seizures which could reduce our sales and adversely affect our results of operationsoperations..
We may be subject to product recalls, withdrawals or seizures if any of the products we sell is believed to cause injury or illness or if we are alleged to have violated governmental regulations in the labeling, promotion, sale or distribution of thoseany such products. A significant recall, withdrawal or seizure of any of the products we sell may require significant management attention, could result in substantial and unexpected costs and may adversely affect our business, financial condition or results of operations. Furthermore, a recall, withdrawal or seizure of any of the products we sell may adversely affect consumer confidence in our brands and thus decrease consumer demand for the products we sell. We rely on our suppliers to ensure that the products they manufacture and sell to us comply with all applicable regulatory and legislative requirements. In general, we seek representation and warranties, indemnification and/or insurance from our suppliers. However, even with adequate insurance and indemnification, any claims of non-compliance could significantly damage our reputation and consumer confidence in the products we sell. In addition, the failure of those products to comply with applicable regulatory and legislative requirements could prevent us from marketing the products or require us to recall or remove such products from the market, which in certain cases could materially and adversely affect our business, financial condition and results of operations.
The activities of our Nutritional Health Coaches and our nutrition education services may be impacted by government regulation oran inability to secure adequate liability insurance.
Some of the activities of our NHCs, who, among other duties, provide nutrition oriented educational services to our customers, may be subject to state and federal regulation and oversight by professional organizations.organizations, or may be misconstrued by our customers as medical advice. In the past, the FDA has expressed concerns regarding summarized health and nutrition-related information that: (i) does not, in the FDA’s view, accurately present such informationinformation; (ii) diverts a consumer’s attention and focus from FDA-required nutrition labeling and information; or (iii) impermissibly promotes drug-type disease-related benefits. Although we provide training to our NHCs on relevant regulatory requirements, we cannot control the actions of such individuals, and our NHCs may not act in accordance with such regulations. If our NHCs or other employees do not act in accordance with regulatory requirements, we may become subject to penalties or litigation, which could have a material adverse effect on our business. We believe we are currently in compliance with relevant regulatory requirements, and we maintain professional liability insurance on behalf of our NHCs in order to mitigate risks associated with our NHCs’ nutrition oriented educational activities. However, we cannot predict the nature of future government regulation and oversight, including the potential impact of any such regulation on the services currently provided by our NHCs. Furthermore, the availability of professional liability insurance or the scope of such coverage may change, or our insurance coverage may prove inadequate, which may adversely impact the ability of our NHCs to provide some services to our customers. The occurrence of any such developments could negatively impact the perception of our brand, our sales and our ability to attract new customers.
Our future business, results of operations and financial condition may be adversely affected by reduced availability of certified organic products or products that meet our other internal standardsstandards..
Our ability to ensure a continuing supply of products and ingredients at competitive prices that satisfy our minimum standards depends on many factors beyond our control, such as the number and size of farms that grow organic crops, operate pasture-based dairies, maintain free-range laying hens and undertake to raise livestock without the use of growth hormones, antibiotics andor concentrated confinement feeding; the vagaries of these farming businesses; and our ability to accurately forecast our sourcing requirements. The organic ingredients used in many of the products we sell are vulnerable to adverse weather conditions and natural disasters, such as floods, droughts, frosts, earthquakes, tornadoes, hurricanes and pestilences. Adverse weather conditions and natural disasters can lower herd, flock and crop yields and reduce size and quality, which in turn could reduce the available supply of, or increase the price of, organic ingredients. Certain products we purchase from our suppliers include organic ingredients sourced offshore, and the availability of such ingredients may be affected by events in other countries.
For our organic produce suppliers, there is some concern that implementation of the FSMA may impact the ability of produce growers to farm organically. In the final Produce Safety Regulation, the FDA stated that it would exercise enforcement discretion against farmers complying with NOP standards for the application of biological soil amendments, a significant source of fertility input for organic production. But at the same time, the FDA stated that the NOP standard is not a food safety standard and that it would study and set a science based minimum standard at a later date and may promulgate a standard for the application of biological soil amendments that limits the ability of organic growers to use these inputs. The increased regulation and cost of growing produce due to the Produce Safety Regulation may impact organic produce suppliers.
The Trump administration has delayed or cancelled certain proposed rules designed to strengthen the NOP standard and proposed to ease existing restrictions on the use of certain substances on the National List of Allowed and Prohibited Substances for use in organic farming. These changes may affect consumer confidence in the NOP standard, which may adversely affect our business.
In addition, we and our suppliers compete with other food producers in the procurement of products that satisfy our minimum standards for organic produce, dairy products, eggs and meat, which are often less plentiful in the open market than conventional ingredients and products. This competition may increase in the future if consumer demand increases for organic produce, pasture-raised dairy products from pasture-raised animals, eggs from free-range eggsor pastured hens, and meat from naturally raised meat.livestock. If supplies of these products are reduced, or there is greater demand for such ingredients and products from us and others, we may not be able to obtain sufficient supply on favorable terms, or at all, which could impact our ability to supply products to our stores and may adversely affect our business, results of operations and financial condition.
The certified organic products we sell must be produced in compliance with government regulations and must comply with the requirements of USDA accredited independent certifiers in order to be labeled as such. Certain products we sell in our stores cancould lose their “organic” certification if their operation does not comply with the applicable standards and required practices of the USDA National Organic Program.NOP. The loss of any certifications could reduce the availability of organic products that we can sell in our stores and harm our business.
Disruptions affecting our significant suppliers, or our relationships with such suppliers, could negatively affect our business.
UNFI is our single largest third-party supplier, accounting for approximately 59%65% of our total purchases in fiscal year 2016.2019. In fiscal year 2016, we extended our long-term relationship with UNFI as our primary supplier of dry grocery and frozen food products through May 31, 2021. In May 2018, we entered into an amendment to our agreement with UNFI pursuant to which we appointed Albert’s Organics, a wholly owned subsidiary of UNFI, as our primary supplier of organic produce products for the majority of our stores. If our distribution agreement with UNFI were terminated or not renewed, we may be unable to establish alternative distribution channels on reasonable terms or at all. Due to this concentration of purchases from a single third-party supplier, the cancellation or non-renewal of our distribution agreement with UNFI, or the disruption, delay or inability of UNFI to deliver product to our stores, could materially and adversely affect our business, financial condition and results of operations. In addition, if UNFI or any of our other suppliers fail to comply with food safety, labeling or other laws and regulations, or face allegations of non-compliance, that supplier’s operations may be disrupted, which in turn couldhavecould have a material adverse effect on our business, financial condition and results of operations.
CertainWe and certain of our vendors use overseas sourcing to varying degrees to manufacture some or all of their products.the products we sell. Any event causing a sudden disruption of manufacturing or imports from such foreign countries, including the imposition of additional import restrictions, unanticipated political changes, increased customs duties or tariffs, labor disputes, health epidemics, adverse weather conditions, crop failure, acts of war or terrorism, legal or economic restrictions on overseas suppliers’ ability to produce and deliver products, and natural disasters, could increase our costs and materially harm our business, financial condition and results of operations. Our business is also subject to a variety of other risks generally associated with indirectly sourcing goods from abroad, such as political instability, disruption of imports by labor disputes, currency fluctuations and local business practices. In addition, requirements imposed by the FSMA compel importers to verify that food products and ingredients produced by a foreign supplier comply with all applicable legal and regulatory requirements enforced by the FDA, which could result in certain products being deemed inadequateineligible for import. In addition, the Department of Homeland Security may at times prevent the importation or customs clearance of certain products and ingredients for reasons unrelated to food safety.
Adverse weather conditions, natural disasters and the effects of climate change could disrupt our supply chain and adversely impact our sales and financial performance.
Adverse weather conditions and natural disasters could impact customer traffic at our stores, make it more difficult to fully staff our stores and, in more severe cases, such as hurricanes, earthquakes, floods, droughts, tornadoes or blizzards, eliminate the availability, or significantly increase the cost, of the products we sell, reduce or eliminate our ability to deliver supplies to the affected stores and cause closures of the affected stores, sometimes for prolonged periods of time. In addition, climate change could reduce or eliminate the availability, or significantly increase the cost, of the products we sell at our stores. The increasing frequency and unpredictability of adverse weather conditions may result in decreased customer traffic, less accurate year-to-year comparisons in sales, supply disruptions and other factors affecting our financial performance. Any of these situations could have a material adverse effect on our business, financial condition and results of operations.
Acts of violence at or threatened against our stores or the shopping centers in which they are located, including active shooter situations and terrorist acts, could adversely impact our sales, which could materially adversely affect our financial performance.
Any act of violence at or threatened against our stores or the shopping centers in which they are located, including active shooter situations and terrorist acts, may result in restricted access to our stores or store closures in the short-term and, in the long-term, may cause our customers and employees to avoid our stores. Any such situation could adversely impact customer traffic and make it more difficult to fully staff our stores, which could have a material adverse effect on our business, financial condition and results of operations.
If the United States were to withdraw from or materially modify the North American Free Trade Agreement (NAFTA) or certain international trade agreements, or if the United States were to withdraw from the World Trade Organization (the WTO), our business, financial condition and results of operations could be materially adversely affected.
Certain of the produce and other products that we sell at our stores are purchased, or contain ingredients sourced, from suppliers in Mexico, Canada and other foreign countries. President Donald Trump has expressed antipathy towards certain existing international trade agreements and organizations, including NAFTA and the United States’ membership in the WTO. In November 2018, the United States, Mexico and Canada signed the renamed United States-Mexico-Canada Agreement (USMCA), which is designed to overhaul and update NAFTA. The USMCA requires ratification by legislative bodies in all three countries before it can take effect. The USMCA has been ratified by the Mexican Senate, but remains subject to ratification in Canada and the United States. Although the USMCA is not yet effective, we believe that its provisions, as currently drafted, will not have a material adverse effect on our business, financial condition and results of operations. It remains unclear what actions, if any, President Trump will take with respect to NAFTA, other international trade agreements to which the United States is a party and the WTO. If the USMCA is not ratified and the United States were to withdraw from NAFTA, or if the United States were to withdraw from or materially modify other international trade agreements to which it is a party, or if the United States were to withdraw from the WTO, certain foreign-sourced goods that we sell may no longer be available at a commercially attractive price or at all, which in turn could have a material adverse effect on our business, financial condition and results of operations.
New or increased tariffs on the foreign-sourced goods that we sell or the foreign-sourced materials incorporated into such goods could have a material adverse effect on our business, financial condition and results of operations.
The Trump Administration has imposed tariffs on a broad range of foreign-sourced products and materials. In response, various trading partners of the United States have imposed retaliatory tariffs and other measures on goods manufactured in the United States and weakened their currencies against the United States Dollar. As of the date of this Form 10-K, it remains unclear what additional actions, if any, the Trump Administration will take with respect to tariffs on goods imported into the United States. The tariffs that have been imposed have resulted in higher costs for certain metal products that we purchase, such as store shelving and cans for our private label products. Although the tariffs imposed to date have not had a material impact on the cost or availability of the foreign-sourced goods that we sell or the foreign-sourced materials that are incorporated into such goods, there can be no assurance that this will continue to be the case. If existing tariffs were raised, or if new tariffs were imposed, on the foreign-sourced goods that we sell or the foreign-sourced materials that are incorporated into such goods, such goods and materials may no longer be available at a commercially attractive price or at all, which in turn could have a material adverse effect on our business, financial condition and results of operations.
Executive, legislative or regulatory action that restricts or closes access to the United States market from Mexico or Canada could have a material adverse effect on our business, financial condition and results of operations.
Certain of the produce and other products that we sell at our stores are purchased, or contain ingredients sourced, from suppliers in Mexico and Canada. Since President Trump took office, tensions with Mexico and Canada over trade, immigration and other issues have increased. Such tensions could lead to executive, legislative or regulatory action to restrict or close access to the United States market from Mexico or Canada. If action were taken to restrict or close access to the United States market from Mexico or Canada, the produce and other products that we source from those countries may no longer be available or may not be available at commercially attractive prices, which in turn could have a material adverse effect on our business, financial condition and results of operations.
The current geographic concentration of our stores creates exposure to local economies, regional downturns,,severe weather and other catastrophic occurrences.
As of September 30, 2016,2019, we had primary store concentration in Colorado and Texas, operating 3639 stores and 1825 stores in those states, respectively. As a result, our business is currently more susceptible to regional conditions than the operations of more geographically diversified competitors, and we are vulnerable to economic downturns in those regions. Any unforeseen events or circumstances that negatively affect these areas could materially adversely affect our revenues and profitability. These factors include, among other things, changes in demographics, population, competition, consumer preferences, wage increases, new or revised laws or regulations, fires, floods or other natural disasters in these regions. Such conditions may result in reduced customer traffic and spending in our stores, physical damage to our stores, loss of inventory, closure of one or more of our stores, inadequate work force in our markets, temporary disruption in the supply of products, delays in the delivery of goods to our stores and a reduction in the availability of products in our stores. Any of these factors may disrupt our business and materially adversely affect our business, financial condition and results of operations.
If we fail to maintain our reputation and the value of our brand, our sales may decline.
We believe our continued success depends on our ability to maintain and grow the value of theNatural Grocers by Vitamin Cottagebrand. Maintaining, promoting and positioning our brand and reputation will depend largely on the success of our marketing and merchandising efforts and our ability to provide a consistent, high quality customer experience. Brand value is based in large part on perceptions of subjective qualities, and evenbusiness incidents, whether isolated incidentsor recurring, can erode consumer trust and confidence, particularly if they result in adverse publicity, governmental investigations or litigation. Our brand could be adversely affected if we failfailure, or perceived failure, to achieve these objectives, or ifthe tarnishing of our public image or reputation were to be tarnished by negative publicity.publicity, could significantly reduce our brand value, trigger boycotts of our stores or products or demonstrations at our stores and have a materially adverse effect on our business, financial condition and results of operations. Sources of negative publicity may include, among others, social media posts, investment or financial community posts, concerns regarding the safety of natural and organic products or dietary supplements and poor reviews of our stores, products, customer service and employment environment.
Consumers or regulatory agencies may challenge certain claims made regarding the products we sell.
Our reputation could also suffer from real or perceived issues involving the labeling or marketing of the products we sell. Products that we sell may carry claims as to their origin, ingredients, efficacy or health benefits, including, by way of example, the use of the term “natural.” Although the FDA and USDA each has issued statements regarding the appropriate use of the word “natural,” there is no single United States government regulatedgovernment-regulated definition of the term “natural” for use in the food industry. The resulting uncertainty has led to consumer confusion, distrust and legal challenges. Plaintiffs have commenced legal actions against a number of food companies that market “natural” products, asserting false, misleading and deceptive advertising and labeling claims, including claims related to genetically modified ingredients. In limited circumstances, the FDA hasand state attorneys general have taken regulatory action against products labeled “natural” but that nonetheless contain synthetic ingredients or components. Products not made from animal ingredients but identified on their labels as “meat” or “milk” or similar terms may also be subject to new regulatory constraints or legal challenges regarding the accuracy and legality of these terms. Should we become subject to similar claims, consumers may avoid purchasing products from us or seek alternatives, even if the basis for the claim is unfounded. Adverse publicity about these matters may discourage consumers from buying the products we sell. The cost of defending against any such claims could be significant. Any loss of confidence on the part of consumers in the truthfulness of our labeling or ingredient claims could be difficult and costly to overcome and may significantly reduce our brand value. Any of these events could adversely affect our reputation and brand and decrease our sales, which could have a material adverse effect on our business, financial condition and results of operations.
Perishable food product losses could materially impact our results of operations.
Our stores offer a significant number of perishable products. Our offering of perishable products may result in significant product inventory losses in the event of extended power or other utility outages, natural disasters or other catastrophic occurrences.
The decision by certain of our suppliers to distribute their specialty products through other retail distribution channels could negatively impact our revenue from the sale of such products.
Some of the specialty retail products that we sell in our stores are not generally available through other retail distribution channels such as drug stores, conventional grocery stores or mass merchandisers. In the future, our suppliers could decide to distribute such products through other retail distribution channels, and allowing more of our competitors to offer these products to our core customers, which could negatively impact our revenues.
Our ability to operate our business effectively could be impaired if we fail to retain or attract key personnel or are unable to attract, train and retain qualified employees.
Our business requires disciplined execution at all levels of our organization. This execution requires an experienced and talented management team. The loss of any member of our senior management team, particularly Kemper Isely or Zephyr Isely, our Co-Presidents since 1998, or Heather Isely or Elizabeth Isely, our Executive Vice Presidents since 1998, could have a material adverse effect on our ability to operate our business, financial condition and results of operations, unless, and until, we are able to find a qualified replacement. Furthermore, our ability to manage our new store growth will require us to attract, motivate and retain qualified managers, NHCs and store employees who understand and appreciate our culture and are able to represent our brand effectively in our stores. Competition for such personnel is intense, and we may be unable to attract, assimilate and retain the personnel required to grow and operate our business profitably. Our ability to meet our labor needs, while controlling wage and labor-related costs, is subject to numerous external factors, including the availability of a sufficient number of qualified persons in the work force in the markets in which we are located, unemployment levels within those markets, prevailing wage rates, changing demographics, health and other insurance costs and changes in employment legislation. If we are unable to offer competitive wages, it may be more difficult for us identify, hire and retain qualified personnel or the quality of our workforce could decline, causing customer service to suffer.
Any significant interruption in the operations of our bulk food repackaging facility and distribution centeror our supply chain networkcould disrupt our ability to deliver our merchandise in a timely manner.
We repackage and distribute some of the products we sell through our bulk food repackaging facility and distribution center in Golden, Colorado. Any significant interruption in the operation of our bulk food repackaging and distribution center infrastructure, such as disruptions due to fire, severe weather or other catastrophic events, power outages, labor disagreements, pathogen or toxic contamination, or shipping problems, could adversely impact our ability to receive and process orders, and distribute products to our stores. Such interruptions could result in lost sales, cancelled sales and a loss of customer loyalty to our brand. While we maintain business interruption and property insurance, if the operation of our distribution facility were interrupted for any reason causing delays in shipment of merchandise to our stores, our insurance may not be sufficient to cover losses we experience. This could have a material adverse effect on our business, financial condition and results of operations.
In addition, unexpected, prolonged delays in deliveries from vendors that ship directly to our stores or increases in transportation costs (including as a result of increased fuel costs) could have a material adverse effect on our business, financial condition and results of operations. Further, labor shortages or work stoppages in the transportation industry, long-term disruptions to the national and international transportation infrastructure, reductions in capacity and industry-specific regulations such as hours-of-service rules that lead to delays or interruptions of deliveries could adversely affect our business, financial condition and results of operations.
A widespread health epidemic could materially impact our business.
Our business could be severely impacted by a widespread regional, national or global health epidemic. A widespread health epidemic may cause customers to avoid public gathering places such as our stores or otherwise change their shopping behaviors. Additionally, a widespread health epidemic could adversely impact our business by disrupting production and delivery of products to our stores and by impacting our ability to appropriately staff our stores.
Higher wage and benefit costs could adversely affect our business.
Changes in federal and state minimum wage laws and other laws relating to employee benefits, including the Patient Protection and Affordable Care Act (or its successor or replacement), could cause us to incur additional wage and benefits costs. Increased labor costs brought about by changes in minimum wage laws, other regulations or prevailing market conditions could increase our expenses, which could have an adverse impact on our profitability, or decrease the number of employees we are able to employ, which could decrease customer service levels and therefore adversely impact sales.
Union activity at third-party transportation companies or labor organizing activities among our employees could disrupt our operations and harm our business.
Independent third-party transportation companies deliver the majority of our merchandise to our stores and to our customers. Some of these third parties employ personnel represented by labor unions. Disruptions in the delivery of merchandise or work stoppages by employees of these third parties could delay the timely receipt of merchandise, which could result in reduced sales, a loss of loyalty to our stores and excess inventory.
While all of our employees are currently non-union, our employees may attempt to organize and join a union. In late fiscal year 2015 and early fiscal year 2016,recent years, the United Food and Commercial Workers Union (UFCW) sought unsuccessfully to organize workers at onetwo of our stores in Idaho. In October 2016, the UFCW filed a petition requesting certification as the exclusive bargaining representative of the workers at one of our stores in Washington State. In November 2016, the employees at that store voted against joining the UFCW. The UFCW subsequently filed objections regarding the conduct of that election with the National Labor Relations Board. Although we believe the UFCW’s objections are without merit, we have stipulated and agreed (without admitting any wrongdoing) to conduct a new election at the store in question on or about December 16, 2016.
stores. We could face union organizing activities at other locations. The unionization of all or a portion of our workforce could result in work slowdowns, could increase our overall costs and reduce the efficiency of our operations at the affected locations, couldadverselycould adversely affect our flexibility to run our business competitively, and could otherwise have a material adverse effect on our business, financial condition and results of operations.
Future events could result in impairment of long-lived assets, which may result in charges that adversely affect our results of operations and capitalization.
Long-lived assets are evaluated for impairment whenever events or changes in circumstances indicate that the carrying amount of an asset may not be recoverable. Our impairment evaluations require use of financial estimates of future cash flows. Application of alternative assumptions could produce significantly different results. We may be required to recognize impairments of long-lived assets based on future economic factors such as unfavorable changes in estimated future undiscounted cash flows of an asset group.
We have significant lease obligations, which mayadversely affect our liquidity and require us to raise additional capitalor continue paying rent for store locations that we no longer operate.
We lease our stores, administrative facility and bulk food repackaging facility and distribution center. Our significant level of fixed lease obligations requires us to use a portion of cash generated by our operations to satisfy these obligations, which could create liquidity problems and require us to raise additional capital through debt or equity financings, which may not be availableonavailable on terms satisfactory to us or at all. We require substantial cash flows from operations to make payments under our leases, all of which provide for periodic increases in rent. If we are unable to make the required payments under the leases, the owners of the relevant locations may, among other things, repossess those assets, which could adversely affect our ability to conduct our operations. Further, the termination of a lease due to the non-payment of rent under such lease would trigger an event of default under our Credit Facilitycredit facility if such termination could reasonably be expected to have a material adverse effect on our business or our ability to meet our obligations thereunder.
In addition, our lease costs could increase because of changes in the real estate markets and supply or demand for real estate sites. We generally cannot cancel our leases, so if we decide to close or relocate a location, we may nonetheless be committed to perform our obligations under the applicable lease including paying the base rent for the remaining lease term. As each lease expires, we may fail to negotiate renewals, either on commercially acceptable terms or any terms at all, and may not be able to find replacement locations that will provide for the same success as current store locations. Of the current leases for our stores, two expire in fiscal year 2017 (with respect to which two leases for store relocations have been signed), four expire in fiscal year 2018 (with respect to which two leases for store relocations have been signed), seven2020, nine expire in fiscal year 2019, six2021, three expire in fiscal year 20202022, four expire in fiscal year 2023 and the remainder expire between fiscal years 20212024 and 2062.
Any material disruption to or failure of our information systems could negatively impact our operations.
We are increasingly dependentrely extensively on a variety of information systems to effectively manage the operations of our growing store base, including for point-of-sale processing in our stores, supply chain, financial reporting, human resources and various other processes and transactions. Our information systems are subject to damage or interruption from power outages, computer and telecommunications failures, computer viruses, security breaches, catastrophic events and usage errors by our team members.employees. In addition, our information technology systems may also fail to perform as anticipated, and we may encounter difficulties in implementing new systems, adapting these systems to changing technologies or expanding them to meet the future needs and growth of our business. If our information systems are breached, disrupted, damaged, encrypted by ransomware, or fail to perform as designed, we may have to make significant investments to repair or replace them,them; suffer interruptions in our operationsoperations; experience data loss; incur liability to our customers, employees and others; face costly litigation. In addition, our failurelitigation, enforcement actions and penalties; and suffer harm to successfully address these risks could damage our reputation with our customers. Additionally,Furthermore, changes in technology could cause our information systems to become obsolete, as a result of which it may be necessary to incur additional costs to upgrade such systems. If our information systems prove inadequate to handle our growth, we could lose customers, which could have a material adverse effect on our business, financial condition and results of operations. We are also vulnerable to certain risks and uncertainties associated with our website, including changes in required technology interfaces, website downtime and other technical failures and consumer privacy concerns.
Various third parties, such as our suppliers and payment processors, also rely heavily on information technology systems, and any failure of these third-party systems could also cause loss of sales, transactional or other data and significant interruptions to our business. Any material interruption in the information technology systems we rely on could have a material adverse effect on our business, operating results and financial condition.
Failure to protect our information systems against cyber-attacks or information security breaches, including failure to protect the integrity and security of individually identifiable data of our customers and employees, could expose us to litigation, damage our reputation and have a material adverse effect on our business.
We rely on computer systems and information technology to conduct our business, including to securely transmit data associated with cashless payments. These systems and technology are increasingly complex and vital to our operations, which has resulted in an expansion of our technological presence and corresponding risk exposure. In addition, these systems are inherently vulnerable to disruption or failure, as well as internal and external security breaches, denial of service attacks and other disruptive problems caused by hackers. If we were to experience difficulties maintaining or operating existing systems or implementing new systems, or were subject to a significant security breach or attack, we could incur significant losses due to disruptions in our operations.
In addition, we receive and maintain certain personal information about our customers and employees. The use of this information by us is regulated by applicable law. Privacy and information security laws and regulations change, and compliance with updates may result in cost increases due to necessary systems changes and the development of new administrative processes.
As of September 30, 2016,Although we had commenced the deployment of EMV, or chiphave implemented procedures to protect our information, we cannot be certain that our security systems will successfully defend against rapidly evolving, increasingly sophisticated cyber-attacks as they become more difficult to detect and PIN, point-of-sales terminals atdefend against. Our continued investment in our stores. We expect the process of deploying chip and PIN point-of-sales terminals at all our stores will be completed by the second quarter of fiscal year 2017. Pending completion of the chip and PIN deployment process, our point-of-salesinformation technology systems may be more vulnerablenot effectively insulate us from potential attacks, breaches or disruptions to external security breaches and other data security incidents.
our business operations. If our security and information systems are breached or compromised, or if our employees fail to comply with applicable laws and regulations, and personal or other confidential information is obtained by unauthorized persons or used inappropriately, it could interrupt our business, resulting in a slowdown of our normal business activities or limitations on our ability to process credit card transactions, and could adversely affect our reputation, ability to compete in the food retail marketplace, financial condition and results of operations. Additionally, a data security breach could subject us to litigation, customer demands for indemnification for third party claims and/or the imposition of penalties, fines or other assessments. In such event, our liability could exceed our insurance coverage or our ability to pay. In addition, a data security breach could require that we expend significant amounts to remediate the breach, including changes in our information security systems.
We were affected by a data security incident during fiscal year 2015. Since that incident,In recent years, we have implemented numerous additional security protocols in order to further tightenenhance security, althoughincluding the installation of EMV, or chip and PIN, point-of-sale terminals at all our stores. However, there can be no assurance that data security breaches will not occur in the future, or that any such data security breach will be detected in a timely manner.
Claims under our self-insurance program may differ from our estimates, which couldnegatively impact our results of operations.
We currently maintain insurance customary for businesses of our size and type using a combination of insurance and self-insurance plans to provide for the potential liabilities for workers’ compensation, general liability, professional liability, property insurance, director and officers’ liability insurance, cyber risk, vehicle liability and employee health-care benefits. There are types of losses we may incur that cannot be insured against or that we believe are not economically reasonable to insure. Such losses could have a material adverse effect on our business and results of operations. In addition, liabilities associated with the risks that are retained by us are estimated, in part, by considering historical claims experience, demographic factors, severity factors and other actuarial assumptions. Our results could be materially impacted by claims and other expenses related to such plans if future occurrences and claims differ from these assumptions and historical trends.
If we are unable to protect our intellectual property rights, our ability to compete and the value of our brand could be harmed.
We believe that our trademarks or service marks, trade dress, copyrights, trade secrets, know-how and similar intellectual property are important to our success. In particular, we believe that theNatural Grocers by Vitamin Cottage name is important to our business, as well as to the implementation of our growth strategy. Our principal intellectual property rights include registered marks onVitamin Cottage,Health Hotline, Natural Grocers by Vitamin Cottage,Vitamin Cottage Natural Grocers,EDAP-Every Day Affordable Price, {N}power, Organic Headquarters, Organic Month Headquarters, Organic Produce Headquarters, Natural Grocers Cottage Wine and Craft Beer, Resolution Reset Day , {N}PowerandThese Came First, common law intellectual property rights in certain other marks used in our business, copyrights of our website content, rights to our domain names, includingwww.naturalgrocers.comandwww.vitamincottage.com, and trade secrets and know-how with respect to our product sourcing, sales and marketing and other aspects of our business. As such, we rely on trademark or service mark and copyright law, trade secret protection and confidentiality agreements with our employees and certain of our consultants, suppliers and others to protect our proprietary rights. If we are unable to defend or protect or preserve the value of our trademarks or service marks, copyrights, trade secrets or other proprietary rights for any reason, our brand and reputation could be impaired and we could lose customers.
Although several of our brand names are registered in the United States, we may not be successful in asserting trademark or service mark or trade name protection and the costs required to protect our trademarks or service marks and trade names may be substantial. In addition, the relationship between regulations governing domain names and laws protecting trademarks or service marks and similar proprietary rights is unclear. Therefore, we may be unable to prevent third parties from acquiring domain names that are similar to, infringe upon or otherwise decrease the value of our trademarks or service marks and other proprietary rights. Additionally, other parties may infringe on our intellectual property rights and may thereby dilute our brand in the marketplace. Third parties could also bring additional intellectual property infringement suits against us from time to time to challenge our intellectual property rights. Any such infringement of our intellectual property rights by others, or claims by third parties against us, could likely result in a commitment of our time and resources to protect these rights through litigation or otherwise. If we were to receive an adverse judgment in such a matter, we could suffer further dilution of our trademarks or service marks and other rights, which could harm our ability to compete as well as our business prospects, financial condition and results of operations.
The products we sell couldsuffer from real or perceived quality or food safety concerns and maycause unexpected side effects, illness, injury or death that could result in their discontinuance or expose us to lawsuits,any of which could result in unexpected costs and damage to our reputation.
We could be materially, adversely affected if consumers lose confidence in the safety and quality of products we sell. There is substantial governmental scrutiny of and public awareness regarding food, cosmetics and dietary supplement safety. We believe that many customers hold us to a higher quality standard than other retailers. Many of the products we sell are vitamins, herbs and other ingredients that are classified as foods or dietary supplements and are not subject to pre-market regulatory approval in the United States. The products we sell could contain contaminated substances, and some of the products we sell contain ingredients that do not have long histories of human consumption. Previously unknown adverse reactions resulting from human use or consumption of these ingredients could occur. Unexpected side effects, illness, injury or death caused by the products we sell could result in the discontinuance of sales of the products we sell or prevent us from achieving market acceptance of the affected products. Such side effects, illnesses, injuries and death could also expose us to product liability or negligence lawsuits. Any claims brought against us may exceed our existing or future insurance policy coverage or limits. Any judgment against us that is in excess of our policy limits would have to be paid from our cash reserves, which would reduce our capital resources. Further, we may not have sufficient capital resources to pay a judgment in which case our creditors could levy against our assets. The real or perceived sale of contaminated or harmful products could result in government enforcement action, private litigation and product recalls. Such an occurrence could also cause negative publicity regarding our company, brand or products, including negative publicity in social media. The real or perceived sale of contaminated or harmful products could therefore harm our reputation and net sales, have a material adverse effect on our business, financial condition and results of operations, or result in our insolvency.
IncreasesIncreases in the cost of raw materials could hurt our sales and profitability.
Costs of the raw agricultural commodities used in our private label products, including our bulk repackaged products, could increase. Such commodities are generally subject to availability constraints and price volatility caused by weather, supply conditions, government regulations, tariffs, energy prices, price inflation and general economic conditions and other unpredictable factors. An increase in the demand for or a reduced supply of raw agricultural commodities could cause our vendors to seek price increases from us, which could cause the retail price we charge for certain products to increase, in turn decreasing our sales of such products. Supply shortages may cause certain items to be unavailable, which could negatively affect our sales. Our profitability may be adversely impacted as a result of such developments through reduced gross margins or a decline in the number and average size of customer transactions. The cost of construction materials we use to build and remodel our stores is also subject to significant price volatility based on market and economic conditions. Higher construction material prices could increase the capital expenditures needed to construct a new store or remodel an existing store and, as a result, could increase the rent payable by the Company under its leases.
Deflation could adversely affect our business.
In addition to inflation, our business could be affected by deflationary pressures. Decreases in food and commodity prices could negatively impact sales growth, operating margins and earnings if we or our competitors react by lowering their retail pricing.prices. As a result, our operating results and financial condition could be materially adversely affected.
Energy costs are a significant component of our operating expenses and increasing energy costs, unless offset by more efficient usage or other operational responses, may impact our profitability.
We utilize natural gas, water, sewer and electricity in our stores and use gasoline and diesel in our trucks that deliver products to our stores. Increases in energy costs, whether driven by increased demand, decreased or disrupted supply or an anticipation of any such events will increase the costs of operating our stores. Our shipping costs have also increased due to fuel and freight prices, and these costs may continue to increase. We may not be able to recover these rising costs through increased prices charged to our customers, and any increased prices may exacerbate the risk of customers choosing lower-cost alternatives. In addition, if we are unsuccessful in attempts to protect against these increases in energy costs through long-term energy contracts, improved energy procurement, improved efficiency and other operational improvements, the overall costs of operating our stores will increase which could impact our profitability, financial condition and results of operations.
Increases in certain costs affecting our marketing, advertising and promotions may adversely impact our ability to advertise effectively and reduce our profitability.
Postal rate increases, and increasingPostage, paper and printing costs affect the cost of our promotional mailings. Previous changes in postal rates increased the cost of ourHealth Hotline mailings and previous increases in paper and printing costs increased the cost of producing ourHealth Hotline newspaper inserts. In response to any future increase in mailing costs, we may consider reducing the number and size of certain promotional pieces. In addition, we rely on discounts from the basic postal rate structure, such as discounts for bulk mailings and sorting by zip code and carrier routes. We are not party to any long-term contracts for the supply of paper.
We are also affected by increases in billboard costs and the cost of producing and broadcasting our television, radio, internet and social media advertising. Previous changes in broadcast rates resulted in an increase in the cost of our television commercials. In response to any future increase in broadcast costs, we may consider reducing the frequency, placement and length of certain promotional pieces. We are not party to any long-term contracts for broadcast time. Future increases in costs affecting our marketing, advertising and promotions could adversely impact our ability to advertise effectively and our profitability.
Legal proceedings could adversely affect ourbusiness,financial condition and results of operationoperations.s.
Our operations, which are characterized by transactions involving a high volume of customer traffic and a wide variety of product selections, carry a higher exposure to consumer litigation risk when compared to the operations of companies operating in certain other industries. Consequently, we have been, are, and may in the future become a party to individual personal injury, product liability and other legal actions in the ordinary course of our business.business, including litigation arising from food-related illness or product labeling. In addition, our employees may from time to time bring lawsuits against us regarding injury, hostile work environment, discrimination, wage and hour disputes, sexual harassment or other employment-related issues. In recent years, there has been an increase in the number of discrimination and harassment claims across the United States generally. While these actions are generally routine in nature, incidental to the operation of our business and immaterial in scope, the outcome of litigation is difficult to assess or quantify. Additionally, we could be exposed to industry-wide or class-action claims arising from the products we carry or industry-specific business practices. Further, we have been, are and may in the future become subject to claims for discrimination, harassment, wages and hours and other federal or state employment matters. While we maintain insurance, such coverage may not be adequate or may not cover a specific legal claim. Moreover, the cost to defend against litigation may be significant. There may also be adverse publicity associated with litigation that may decrease consumer confidence in or perceptions of our business, regardless of whether the allegations are valid or whether we are ultimately found liable. As a result, litigation could have a material adverse effect on our business, financial position and results of operations.
OurOur credit facility could limit our operational flexibility.
On January 28, 2016, we entered intoWe are party to a new $30.0$50.0 million credit facility including a $5.0 million sublimit for standby letters of credit (our Credit Facility). At the time we entered into the Credit Facility, we terminated our prior credit agreement (the Prior Credit Facility). On May 10, 2016, the amount available for borrowing under our Credit Facility was increased to$45.0 million, including a $5.0 million sublimit for standby letters of credit. Our Credit Facility is secured by a lien on substantially all of our assets and contains usual and customary restrictive covenants relating to our management and the operation of our business. These covenants, among other things, restrict our ability to incur additional indebtedness,indebtedness; grant liens,liens; engage in certain merger, consolidation or asset sale transactions,transactions; make certain investments make loans, advances, guarantees or acquisitions,acquisitions; engage in certain transactions with affiliatesaffiliates; pay dividends or repurchase shares of our common stock; or permit certain sale and leaseback transactions without lender consent. We are also required to maintain certain financial measurements under our Credit Facility, including a consolidated leverage ratio. These covenants could restrict our operational flexibility, including our ability to open stores, and any failure to comply with these covenants or our payment obligations could limit our ability to borrow under our Credit Facility and, in certain circumstances, may allow the lender thereunder to require repayment.
We may be unable to generate sufficient cash flow to satisfy our debt service obligations, which could adversely impact our business.
As of September 30, 2016,2019, we had outstanding indebtedness of $27.4$5.7 million under our Credit Facility. We may incur additional indebtedness in the future, including borrowings under our Credit Facility. Satisfying our debt repayment obligations may require us to divert funds identified for other purposes and could impair our liquidity position. Our inability to generate sufficient cash flow to satisfy our debt service obligations could have important consequences, including:
● | reducing our ability to execute our growth strategy and open new stores; |
● | impacting our ability to continue to execute our operational strategies in existing stores; |
● | impairing our liquidity position; |
● | impacting our ability to obtain merchandise from our vendors; |
● | requiring us to delay capital expenditures and divert funds intended for other purposes; |
● | increasing our vulnerability to competitive and general economic conditions; |
● | placing us at a competitive disadvantage compared to our competitors that have less debt; |
● | limiting our flexibility in planning for, or reacting to, changes in our business and the industry in which we operate; and |
● | adversely affecting our ability to borrow additional |
If we cannot generate sufficient cash flow from operations to service our debt, we may need to refinance our debt, dispose of assets or issue equity to obtain necessary funds. We do not know whether we will be able to take any of such actions on a timely basis, on terms satisfactory to us or at all. In addition, if we fail to comply with any of the financial covenants or the other restrictions contained in our Credit Facility, an event of default could occur, which may result in the acceleration of all amounts owing under theour Credit Facility.
Our ability to obtain necessary funds through borrowing will depend on our ability to generate cash flow from operations. Our ability to generate cash is subject to general economic, financial, competitive, legislative, regulatory and other factors that are beyond our control. If our business does not generate sufficient cash flow from operations or if future borrowings are not available to us under our Credit Facility or otherwise in amounts sufficient to enable us to fund our liquidity needs, ourbusiness,our business, financial condition and results of operations may be adversely affected.
Our liquidity needs may require us toraise additional capital through debt or equity financingfinancings.s.
We depend upon cash flow from our operations and borrowings from our Credit Facility to fund our business and execute on our growth strategy. In the absence of sufficient cash flow from operations, available cash and available borrowing capacity under our Credit Facility, we may be unable to meet our liquidity needs.Inneeds. In that event, we may be required to seek additional equity or debt financing in order to fund capital expenditures, to provide additional working capital for our business or to fund the execution of our growth strategy. In addition, changes in economic conditions, or market conditions requiring a shift in our business model could result in our need for additional debt or equity financing. We cannot predict the timing or amount of any such capital requirements. We do not know whether we will be able to take any of such actions on a timely basis, on terms satisfactory to us or at all. If financing is not available to us on satisfactory terms, or at all, we may be unable to operate or expand our business or to successfully pursue our growth strategy, and our results of operations may suffer. Pursuant to the NYSENew York Stock Exchange (NYSE) Listed Company Manual, in order to rely on the “controlled company” corporate governance exemptions, the Isely family is, or entities controlled by the Isely family are, required to retain more than 50% of the total voting power of our shares of common stock for the election of directors. As long as we intend to remain a “controlled company,” these voting requirements will constrain our ability to issue additional shares of our common stock in the future.
Our share repurchase program may adversely affect our liquidity and cause fluctuations in our stock price.
OnIn May 5, 2016, our Board of Directors (the Board) authorized a two-year share repurchase program pursuant to which the Company may repurchase up to $10.0 million in shares of our common stock.Westock. In May 2018, our Board authorized a two-year extension of the share repurchase program. As a result of such extension, the share repurchase program will terminate on May 4, 2020. We have financed, and intend to continue financing, the share repurchase program through borrowings under our Credit Facility. Such borrowings will reduce the amount of capital available under theour Credit Facility for other purposes, including our working capital needs, capital expenditures and funding the execution of our growth strategy. Repurchases under the share repurchase program may therefore adversely affect our liquidity, which in turn could impact our profitability, financial condition and results of operations. In addition, repurchases under the share repurchase program will reduce the number of shares of our common stock available for purchase and sale in the public market, which could affect the market price of our common stock.
Our political advocacy activities may reduce our customer count and sales.
We believe our ability to profitably operate our business depends, in part, upon our access to natural and organic products and dietary supplements. We attempt to protect our interest in this access through ongoing and proactive political advocacy campaigns, including participation in education programs, petitions, letter writing, phone calls, policy conferences, advisory boards, industry groups, public commentary and meetings with trade groups, office holders and regulators. We may publicly ally with and support trade groups, political candidates, government officials and regulators who support a particular policy we consider important to our business and in alignment with our principles regarding access to natural and organic products and dietary supplements. We may, from time to time, publicly oppose other trade groups, candidates, officeholders and regulators whose point of view we believe will harm our business, or impede access to nutritious food and dietary supplements. In some cases, we may lose customers and sales because our political advocacy activities are perceived to be contrary to those customers’ points of view, political affiliations, political beliefs or voting preferences.
Effective tax rate changes and results of examinations by taxing authorities could materially impact our results of operations.
Our future effective tax rates could be adversely affected by our earnings mix being lower than historical results in states where we have lower statutory rates and higher than historical results in states where we have higher statutory rates, by changes in the valuation of our deferred tax assets and liabilities or by changes in tax laws or interpretations thereof. In addition, we are subject to periodic audits and examinations by the Internal Revenue Service (IRS) and other state and local taxing authorities. Our results could be materially impacted by the determinations and expenses related to proceedings by the IRS and other state and local taxing authorities.
Failure to maintain adequateeffective internal control over financial and management processes and controlsreporting could lead to errorsmaterial misstatements in our financial reportingstatements, in which case investors may lose confidence in the accuracy and could harmcompleteness of our ability to managefinancial reports and the market price of our expenses.common stock may decline.
Our anticipated growth, and continuing reporting obligations as a public company, are placing a continuing and considerable strain on our financial and management systems, processes and controls, as well as on our personnel. In addition, asAs a public company, we are required to document and test ourmaintain internal controlscontrol over financial reporting pursuantreporting. Pursuant to Section 404 of the Sarbanes-Oxley Act of 2002, as amended (Sarbanes-Oxley), so that ourwe are required to file a report by management can periodically certifyon the effectiveness of such controls. As an “emerging growth company,” we have opted to take advantage of certain exemptions contained in the Jumpstart Our Business Startups Act, or JOBS Act,our internal control over financial reporting, and as a result, our independent registered public accounting firm will not beis required to attest to the effectiveness of our internal control over financial reporting pursuant to Section 404 until the datereporting.
If we are no longer an “emerging growth company” as defined in the JOBS Act. We will remain an “emerging growth company” until the earliest of (a) September 30, 2017, (b) the last day of our fiscal year in which we have annual gross revenue of $1.0 billion or more, (c) the date on which we have, during the previous three-year period, issued more than $1.0 billion in non-convertible debt, or (d) the date on which we are deemed to be a “large accelerated filer,” which will occur at such time as we have: (i) an aggregate worldwide market value of common equity securities held by non-affiliates of $700 million or more as of the last business day of our most recently completed second fiscal quarter, (ii) been required to file annual, quarterly and current reports under the Securities Exchange Act of 1934, as amended (the Exchange Act) for a period of at least 12 calendar months and (iii) filed at least one annual report pursuant to the Exchange Act. As a result, we may qualify as an “emerging growth company” until as late as September 30, 2017. At such time, our independent registered public accounting firm may issue a report that is adverse in the event it is not satisfied with the level at which our controls are documented, designed or operating. If our senior management is unable to conclude that we havemaintain effective internal control over financial reporting, orif we identify any material weaknesses therein, if we are unsuccessful in our efforts to certify the effectiveness ofremediate any such controls,material weakness, if our management is unable to report that our internal control over financial reporting is effective when required, or if our independent registered public accounting firm cannot renderis unable to express an unqualified opinion on management’s assessment andas to the effectiveness of our internal control over financial reporting or if material weaknesseswhen required, investors may lose confidence in the accuracy and completeness of our internal control over financial reporting are identified,reports and the market price of our common stock could be negatively affected. In addition, we could bebecome subject to investigations by the SEC, the NYSE or other regulatory scrutiny and a loss of public confidence,authorities, which could have a material adverse effect on our businessrequire additional financial and our stock price.management resources.
Changes in accounting standards may materially impact reporting of our financial condition and reported resultsreported results of operations.
Generally accepted accounting principles and related accounting pronouncements, implementation guidelines and interpretations for many aspects of our business, such as accounting for leases, inventories, useful lives of long-lived assets for depreciation and amortization, goodwill and intangible assets, store closures, leases, insurance,impairment of finite-lived intangible and long-lived assets, self-insurance reserves, income taxes stock-basedand share-based compensation and mergers and acquisitions,assumptions, are highly complex and involve subjective judgments. Changes in these rules or their interpretation or changes in underlying estimates, assumptions or judgments could significantly change or add significant volatility to our reported earnings without a comparable underlying change in cash flow from operations. As a result, changes in accounting standards may materially impact our reported results of operations. For example, we expect our adoption of Accounting Standards Update 2016-02, “Leases,” Topic 842, effective for our first quarter of fiscal year 2020, will result in a material increase in lease liabilities and right-of-use assets on our consolidated balance sheet. In addition, we anticipate that the transition of several of our financing leases to operating leases under the new standard will result in an increase in rent expense, partially offset by reductions to depreciation and interest expense. However, we do not expect that the adoption of ASU 2016-02 will have an impact on our cash flows. See “Management’s Discussion and Analysis of Financial Condition and Results of Operations – Recent Accounting Pronouncements.”
We are an “emerging growth company” and we cannot be certain if the reduced disclosure requirements applicable to emerging growth companies will make our common stock less attractive to investors in the future.
We are an “emerging growth company,” as defined in the JOBS Act, and may qualify as an “emerging growth company” until as late as September 30, 2017. As an “emerging growth company,” we may take advantage of certain exemptions from various reporting and other requirements that are applicable to other public companies that are not “emerging growth companies.” For so long as we are an “emerging growth company,” we will, among other things:
|
|
|
|
|
|
|
|
|
|
Although we do not now believe that investors have found our common stock less attractive since our initial public offering, or IPO, because we rely on certain of these exemptions, we cannot predict if investors may in the future view our common stock less favorably as a result of our “emerging growth company” status. If some investors in the future find our common stock less attractive as a result, there may be a less active trading market for our common stock and our stock price may be more volatile.
In addition, Section 107 of the JOBS Act provides that an “emerging growth company” can take advantage of the extended transition period provided in Section 7(a)(2)(B) of the Securities Act of 1933, as amended (the Securities Act), for complying with new or revised accounting standards. An “emerging growth company” can delay the adoption of certain accounting standards until those standards would otherwise apply to private companies. However, we chose to “opt out” of such extended transition period, and as a result, we have complied and will comply with new or revised accounting standards on the relevant dates on which adoption of such standards is required for non-emerging growth companies. Section 107 of the JOBS Act provides that our decision to opt out of the extended transition period for complying with new or revised accounting standards is irrevocable.
Risks related to ourcommonstock
The market price of our common stockhas been volatile andmaycontinue tobe volatile, and you may not be able to sell ourcommonstock at a favorable price or at all.
The market price of our common stock is likely to fluctuate significantly from time to time in response to a number of factors, most of which we cannot control, including those described under “—Risks related to our business” and the following:
● | differences between our actual financial and operating results and those expected by investors; |
● | fluctuations in our quarterly comparable store sales growth; |
● |
|
● |
|
● |
|
● | changes in our earnings guidance; |
● | a reduction in the amount of cash dividends on our common stock, the suspension of those dividends or a failure to meet market expectations regarding potential dividend increases; |
● | a change in the recommendation by any research analyst that follows our stock or any failure to meet the estimates made by research analysts; |
● | the level and quality of securities research analyst coverage for our common stock; |
● | investor perceptions of our prospects and the prospects of the grocery and dietary supplement industries; |
● | the performance of our key vendors; |
● | announcements by us, our vendors or our competitors regarding performance, strategy, significant acquisitions, divestitures, strategic partnerships, joint ventures or capital commitments; |
● | introductions of new product or new pricing policies by us or our competitors; and |
● | failure to recruit or retain key personnel. |
In addition, extreme price and volume fluctuations in the stock markets could affect the market price of equity securities.
An inability to maintain or improve levels of sales growth could cause our stock price to decline.
We may not be able to maintain or improve the levels of sales growth that we have experienced in the past. In addition, ourOur overall sales growth has fluctuated in the past and may fluctuate in the future. A variety of factors affect sales growth, including:
● | our ability to execute our business strategy effectively, including successfully opening new stores that achieve sales consistent with our existing stores; |
|
|
|
|
|
|
● | consumer preferences; |
● | competitive conditions in our industry; |
● | general economic conditions; |
● | the impact of the product discounts offered by the |
● | internally generated competition when we open new stores in markets we already serve; |
● | regulatory changes; |
● | product pricing and availability; |
● | in-store merchandising-related activities; |
● | consumer confidence; |
● | initial sales performance at our new stores; and |
● | our ability to source and distribute products efficiently. |
In addition, manyMany specialty retailers have been unable to sustain high levels of store sales growth during and after periods of substantial expansion. These factors may cause our store sales growth results to be materially lower than in recentprior periods, which could have a material adverse effect on our business, financial condition and results of operations, and could result in a decline in the price of our common stock.
Our current principal stockholders have significant influence over us, and they could delay, deter or prevent a change of control or other business combination or otherwise cause us to take action with which you might not agree.
Members of the Isely family and certain persons, entities and accounts subject to a stockholders agreement relating to voting and limitations on the sale of shares, own or control approximately 57.3%59.3% of our common stock. Due to their holdings of common stock, members of the Isely family are able to continue to determine the outcome of virtually all matters submitted to stockholders for approval, including the election of directors, an amendment of our certificate of incorporation (except when a class vote is required by law), any merger or consolidation requiring common stockholder approval, and a sale of all or substantially all of the Company’s assets. Members of the Isely family have the ability to prevent change-in-control transactions as long as they maintain voting control of the Company. In addition, members of the Isely family and trusts controlled by them entered into a stockholders agreement by which they agreed to aggregate their voting power with regard to the election of directors.
In addition, because these holders have the ability to elect all of our directors, they are able to control our policies and operations, including the appointment of management, future issuances of our common stock or other securities, the payments of dividends on our common stock and entering into extraordinary transactions, and their interests may not in all cases be aligned with your interests.
We may not be able to continue paying dividends on our common stock.
On November 13, 2019, our Board approved the initiation of a quarterly cash dividend of $0.07 per share of common stock. The initial quarterly cash dividend will be paid on December 17, 2019 to stockholders of record as of the close of business on December 2, 2019. The timing, declaration, amount and payment of any future cash dividends are at the discretion of the Board and will depend on many factors, including our available cash, working capital, financial condition, earnings, results of operations and capital requirements; the covenants in our credit agreement; applicable law; and other business considerations that our Board considers relevant. A substantial numberreduction in the amount of shares ofcash dividends on our common stock, are eligible for sale, and their salethe suspension of those dividends or a failure to meet market expectations regarding our dividends could adversely affect our stock price and could impair our ability to raise capital through the sale of equity securities.
If certain of our stockholders sell, or the market perceives that certain of our stockholders intend to sell, in the public market, substantial amounts of our common stock,have a material adverse effect on the market price of our common stock. If we do not pay cash dividends on our common stock could decline significantly. These sales also might make it more difficult for us to sell equity or equity-related securities in the future, atrealization of a time and price we deem appropriate. As of December 2, 2016, we had a total of 22,453,463 shares ofgain on an investment in our common stock outstanding,will depend entirely on the appreciation of which 8,214,285 shares of common stock were issued in the IPO and 349,542 shares had been issued in connection with the vesting of restricted stock units issued under the 2012 Omnibus Incentive Plan, are registered and freely tradable without restriction under the Securities Act. The Company is aware that approximately 39,000 shares have been sold, and believes approximately 440,000 additional shares could be sold, in exempt transactions. Up to approximately 13,400,000 additional shares of common stock could be sold, subject to compliance with the requirements of the Securities Act and the stockholders agreement among members of the Isely family and certain persons, entities and accounts related to them. The market price of our common stock, could drop significantly if the holders of restricted stock sell them or are perceived by the market as intending to sell them. Also, in the future, wewhich may issue shares of our common stock as a result of the vesting of up to 92,586 additional restricted stock units or in connection with investments or acquisitions. The number of shares of our common stock issued in connection with an investment or acquisition could constitute a material portion of our then outstanding shares of our common stock. not occur.
We do not anticipate paying dividends on our capital stock in the foreseeable future and capital appreciation may be your sole source of potential gain.
We anticipate that we will retain our future earnings, for the foreseeable future, in order to fund our growth strategy and for general corporate purposes. The declaration and payment of future dividends to holders of our common stock will be at the discretion of our board of directors (our Board) and will depend upon many factors, including our financial condition, earnings, legal requirements, restrictions in our debt agreements and other factors our Board deems relevant. As a result, we can make no assurance that we will pay cash dividends to our stockholders in the future. Capital appreciation, if any, of our common stock will be your sole source of potential gain for the foreseeable future.
If securities or industry analysts do not publish research or reports about our business, if they adversely change their recommendations regarding ourcommonstock or if our operating results do not meet their expectations, ourcommonstock price could decline.
The trading market for our common stock is influenced by the research and reports that industry or securities analysts publish about us or our business. One analyst currently covers our stock. If one or more of these analysts cease to cover our company or fail to publish reports on us regularly, we may lose visibility in the financial markets, which could cause our stock price or trading volume to decline. Moreover, if one or more of the analysts who cover our company downgradesdowngrade our common stock, or if our operating results do not meet their expectations, our common stock price could decline.
Anti-takeover provisions in our organizational documents and Delaware law may discourage or prevent a change in control, even if a sale of the Companycould could be beneficial to our stockholders, which could cause our stock price to decline and prevent attempts by our stockholders to replace or remove our current management.
Several provisions of our certificate of incorporation and amended and restated bylaws could make it difficult for our stockholders to change the composition of our Board, preventing them from changing the composition of management. In addition, the same provisions may discourage, delay or prevent a merger or acquisition that our stockholders may consider favorable.
These provisions include:
● | a staggered, or classified, Board; |
● | authorizing our Board to issue “blank check” preferred stock without stockholder approval; |
● | prohibiting cumulative voting in the election of directors; |
● | limiting the persons who may call special meetings of stockholders; |
● | prohibiting stockholders from acting by written consent after the Isely family ceases to own more than 50% of the total voting power of our shares; and |
● | establishing advance notice requirements for nominations for election to our Board or for proposing matters that can be acted on by stockholders at stockholder meetings. |
These anti-takeover provisions could substantially impede the ability of our common stockholders to benefit from a change in control and, as a result, could materially adversely affect the market price of our common stock and your ability to realize any potential change-in-control premium.
We are a “controlled company” within the meaning of the NYSE Listed CompanyManual,, and, as a result, rely on exemptions from certain corporate governance requirements that provide protection to stockholders of other companies.
The Isely family, or entities controlled by the Isely family, own more than 50% of the total voting power of our common shares for the election of directors, and therefore, we are considered a “controlled company” under the corporate governance standards set forth in the NYSE Listed Company Manual. As a “controlled company,” certain exemptions under NYSE standards free us from the obligation to comply with certain corporate governance requirements of the NYSE, including the requirements:
● | that a majority of our Board consists of “independent directors,” as defined under the rules of the NYSE; |
● | that our director nominees be selected, or recommended for our Board’s selection, either: (i) by a majority of independent directors in a vote by independent directors, pursuant to a nominations process adopted by a Board resolution or (ii) by a nominating and governance committee composed solely of independent directors with a written charter addressing the nominations process; and |
● | that the compensation of our executive officers be determined, or recommended to the Board for determination, by a majority of independent directors in a vote by independent directors, or a compensation committee composed solely of independent directors. |
Accordingly, for so long as we are a “controlled company,” stockholders will not have the same protections afforded to stockholders of companies that are subject to all of the NYSE corporate governance requirements.
ItemItem 1B. Unresolved Staff Comments.
None.
IItem 2. Properties.tem 2. Properties.
As of September 30, 2016,2019, we had 126153 stores located in 19 states, as shown in the following chart:
State | Number | ||
Arizona | 12 | ||
Arkansas |
| ||
Colorado |
| ||
Idaho | 4 | ||
Iowa |
| ||
Kansas | 8 | ||
Minnesota | 1 | ||
Missouri |
| ||
Montana | 4 | ||
Nebraska | 3 | ||
Nevada | 3 | ||
New Mexico | 5 | ||
North Dakota |
| ||
Oklahoma |
| ||
Oregon |
| ||
Texas |
| ||
Utah |
| ||
Washington |
| ||
Wyoming | 2 |
During the fiscal years ended September 30, 20162019 and 2015,2018, we opened 23six and 16eight new stores, respectively. We plan to open 15five to 20six new stores in fiscal year 2017,2020, of which threeone new storesstore opened during the first quarter of fiscal year 20172020 prior to the filing of this Form 10-K. In addition,During fiscal year 2019, we relocated five existing stores. We plan to relocate threeone to two stores in fiscal year 2017. As of the date of the filing of this Form 10-K, we2020. We have signed leases for 18an additional five new stores, and have purchased the property for an additional two new stores, that we expect to open in fiscal years 20172020 and 2018.beyond.
Our home office is located in Lakewood, Colorado. We occupy our home office under a lease covering approximately 35,000 square feet that expires in 2026;feet; this facility is co-located with one of our stores. Additionally, we lease a 150,000 square foot bulk food repackaging facility and distribution center located in Golden, Colorado. That facility also houses a training center and certain administrative support functions.
Currently,As of September 30, 2019, we ownowned buildings in which threesix of our stores are located;located. Five of those buildings are located on land that is leased pursuant to a ground lease. Alllease; the remaining store is on land owned by the Company. In addition, as of our otherSeptember 30, 2019, the Company had purchased the property for two new stores and facilities are leased.Leasewhich we expect to open in fiscal year 2020. Lease terms typically range between ten10 and 20 years, with additional renewal options. We do not believe that any individual store property is material to our financial condition or results of operations. Of the current leases for our stores, two expire in fiscal year 2017 (with respect to which two leases for store relocations have been signed), four expire in fiscal year 2018 (with respect to which two leases for store relocations have been signed), seven2020, nine expire in fiscal year 2019, six2021, three expire in fiscal year 2020;2022, four expire in 2023 and the remainder will expire between fiscal years 20212024 and 2062. We expect that we will be able to renegotiate these leases or relocate these stores as necessary.
Item 3.3. Legal Proceedings.Proceedings.
We periodically are involved in legal proceedings, including discrimination and other employment-related claims, customer personal injury claims, investigations and other proceedings arising in the ordinary course of business. When the potential liability from a matter can be estimated and the loss is considered probable, we record the estimated loss. Due to uncertainties related to the resolution of lawsuits, investigations and claims, the ultimate outcome may differ from our estimates. Although we cannot predict with certainty the ultimate resolution of any lawsuits, investigations and claims asserted against us, we do not believe any currently pending legal proceeding to which we are a party will have a material adverse effect on our business, prospects, financial condition, cash flows or results of operations.
InBernhard Engl v. Natural Grocers by Vitamin Cottage, Inc. and Vitamin Cottage Natural Food Markets, Inc., filed on September 25, 2015 in the United States District Court for the District of Colorado, the plaintiff filed a lawsuit against the Company in connection with a data security incident that affected the Company during fiscal year 2015. The complaint purported to state an action on behalf of a class of customers who used debit or credit cards at our stores.On June 20, 2016, a Magistrate Judge of the United States District Court for the District of Colorado issued a Recommendation and Order dismissing the plaintiff’s complaint without prejudice. On September 21, 2016, the United States District Court for the District of Colorado issued an Opinion and Order adopting the Magistrate Judge’s Recommendation and dismissing the plaintiff’s complaint without prejudice. On November 10, 2016, the Company and the plaintiff entered into a Settlement Agreement and Release pursuant to which: (i) the plaintiff agreed not to appeal the Court’s dismissal of his complaint and (ii) the Company agreed not to seek reimbursement of its attorneys’ fees and legal costs from the plaintiff.
Item 4. MineSafety Disclosures.
Not applicable.
PART II
Item 5. Marketfor Registrant’s Common Equity, Related Stockholder Matters and Issuer Purchases of Equity Securities.
Market Information
Our common stock is traded on the NYSE under the symbol “NGVC.”
Price Range of Our Common Stock
The following table shows the high and low sale prices per share of our common stock as quoted by the NYSE for the periods indicated:
Fiscal year ended September 30, 2016 | High | Low | ||||||
First Quarter (October 1, 2015 – December 31, 2015) | $ | 25.85 | $ | 19.50 | ||||
Second Quarter (January 1, 2016 – March 31, 2016) | 22.43 | 16.59 | ||||||
Third Quarter (April 1, 2016 – June 30, 2016) | 21.97 | 12.29 | ||||||
Fourth Quarter (July 1, 2016 – September 30, 2016) | 14.21 | 10.63 | ||||||
Fiscal year ended September 30, 2015 | High | Low | ||||||
First Quarter (October 1, 2014 – December 31, 2014) | $ | 28.72 | $ | 15.89 | ||||
Second Quarter (January 1, 2015 – March 31, 2015) | 35.00 | 24.84 | ||||||
Third Quarter (April 1, 2015 – June 30, 2015) | 29.90 | 22.55 | ||||||
Fourth Quarter (July 1, 2015 – September 30, 2015) | 28.67 | 19.82 | ||||||
Holders of Record
As of December 2, 2016,2019, there were 102172 holders of record of our common stock, and the closing price of our common stock was $10.82.$9.23.
Dividend Policy
We anticipate thatTo date, we will retainhave not paid cash dividends on our future earnings, forcommon stock.
On November 13, 2019, our Board approved the foreseeable future, in order to fund our growth strategy and for general corporate purposes.initiation of a quarterly cash dividend per share of common stock. The declaration and paymentinitial quarterly cash dividend of future dividends to holders$0.07 per share of our common stock will be paid on December 17, 2019 to stockholders of record as of the close of business on December 2, 2019. The timing, declaration, amount and payment of any future cash dividends are at the discretion of ourthe Board and will depend uponon many factors, including our available cash, working capital, financial condition, earnings, legal requirements,results of operations and restrictionscapital requirements; the covenants in our debt agreementscredit agreement; applicable law; and other factorsbusiness considerations that our Board deemsconsiders relevant. Additionally, ourOur Credit Facility prohibits the payment of cash dividends, exceptprovides that so long as no default exists or would arise as a result thereof,Vitamin Cottage Natural Food Markets, Inc. (the operating company) may pay cash dividends toNaturalto Natural Grocers by Vitamin Cottage, Inc. (the holding company) forin an amount sufficient to allow the holding company to: (i) pay various audit, accounting, tax, securities, indemnification, reimbursement, insurance and other reasonable expenses incurred in the ordinary course of business and for repurchases of(ii) repurchase shares of common stock and pay dividends on our common stock in an aggregate amount not to exceed $10.0 million.
Performance Graphmillion during any fiscal year. See “We may not be able to continue paying dividends on our common stock” under “Item 1A. Risk Factors.”
The graph below compares the cumulative return to holders of our common stock relative to the cumulative total returns of the NYSE Composite Index and the S&P Food Retail Index from July 25, 2012 to September 30, 2016, which is the amount of time our stock has been trading publicly following our IPO on July 25, 2012. The graph tracks the performance of a $100 investment in our common stock and in each of the indexes from July 25, 2012 to September 30, 2016. The stock price performance included in this graph is not necessarily indicative of future stock price performance.
Use of Proceeds From Registered Securities
None.
Unregistered Sales of Equity Securities
None.
Issuer Purchases of Equity Securities
The following table presentsCertain information with respect to purchases of the Company’s common stock during the fourth quarter ended September 30, 2016 by the Company or any affiliated purchaser, as defined in Rule 10b-18(a)(3)about our share repurchases is set forth under the Exchange Act.
Period | Total Number of Shares Purchased | Average Price Paid Per Share(1) | Total Number of Shares Purchased as Part of Publicly Announced Plans or Programs(2) | Approximate Dollar Value of Shares that May Yet Be Purchased Under the Plans or Programs (in thousands) | ||||||||||||
July 1, 2016 toJuly 31, 2016 | — | $ | — | — | $ | 9,861 | ||||||||||
August 1, 2016 toAugust 31, 2016 | 47,670 | 12.02 | 47,670 | 9,289 | ||||||||||||
September 1, 2016 toSeptember 30, 2016 | 10,000 | 11.77 | 10,000 | 9,171 | ||||||||||||
Total | 57,670 | 11.97 | 57,670 | |||||||||||||
(1) Average price paid per share includes commissions paid.
(2) On May 5, 2016, our Board authorized a two-year share repurchase program pursuantheading "Stockholders’ Equity - Share Repurchases" in Note 13 of Notes to which the Company may repurchase up to $10.0 millionConsolidated Financial Statements included in sharesPart II, Item 8 of the Company’s common stock.this Form 10-K.
Item 6. Selected Financial Data.
The following selected financial data presented below is derived from the Company’s consolidated financial statements and should be read in conjunction with “Item 1A. Risk Factors,” “Item 7. Management’s Discussion and Analysis of Financial Condition and Results of Operations” and “Item 8. Financial Statements and Supplementary Data.” Our historical results set forth below are not necessarily indicative of results to be expected for any future period.
Year ended September 30, | ||||||||||||||||||||
2016 | 2015 | 2014 | 2013 | 2012 | ||||||||||||||||
Statements of Income Data (dollars in thousands): | ||||||||||||||||||||
Net sales | $ | 705,499 | 624,678 | 520,674 | 430,655 | 336,385 | ||||||||||||||
Cost of goods sold and occupancy costs | 503,727 | 442,582 | 369,172 | 304,922 | 237,328 | |||||||||||||||
Gross profit | 201,772 | 182,096 | 151,502 | 125,733 | 99,057 | |||||||||||||||
Store expenses | 156,158 | 132,131 | 108,657 | 89,935 | 72,157 | |||||||||||||||
Administrative expenses | 19,242 | 17,514 | 14,823 | 13,479 | 12,733 | |||||||||||||||
Pre-opening and relocation expenses | 5,993 | 3,822 | 3,774 | 3,231 | 2,173 | |||||||||||||||
Operating income | 20,379 | 28,629 | 24,248 | 19,088 | 11,994 | |||||||||||||||
Other (expense) income: | ||||||||||||||||||||
Interest expense | (3,044 | ) | (2,993 | ) | (2,496 | ) | (2,166 | ) | (568 | ) | ||||||||||
Other income, net | — | — | 2 | 9 | 6 | |||||||||||||||
Income before income taxes | 17,335 | 25,636 | 21,754 | 16,931 | 11,432 | |||||||||||||||
Provision for income taxes | (5,864 | ) | (9,432 | ) | (8,281 | ) | (6,379 | ) | (3,955 | ) | ||||||||||
Net income | 11,471 | 16,204 | 13,473 | 10,552 | 7,477 | |||||||||||||||
Net income attributable to non-controlling interest | — | — | — | — | (828 | ) | ||||||||||||||
Net income attributable to Natural Grocers by Vitamin Cottage, Inc. | $ | 11,471 | 16,204 | 13,473 | 10,552 | 6,649 | ||||||||||||||
Per Share Data: | ||||||||||||||||||||
Net income attributable to Natural Grocers by Vitamin Cottage, Inc. per share of common stock (EPS) | ||||||||||||||||||||
Basic | $ | 0.51 | 0.72 | 0.60 | 0.47 | 0.30 | ||||||||||||||
Diluted | $ | 0.51 | 0.72 | 0.60 | 0.47 | 0.30 | ||||||||||||||
Shares used in computation of EPS | ||||||||||||||||||||
Basic | 22,492,986 | 22,490,260 | 22,466,432 | 22,399,346 | 22,372,184 | |||||||||||||||
Diluted | 22,507,152 | 22,500,833 | 22,479,835 | 22,441,382 | 22,463,093 | |||||||||||||||
Pro Forma Statements of Income Data (Unaudited) (dollars in thousands)(1): | ||||||||||||||||||||
Income before income taxes | $ | 17,335 | 25,636 | 21,754 | 16,931 | 11,432 | ||||||||||||||
Pro forma provision for income taxes | (5,864 | ) | (9,432 | ) | (8,281 | ) | (6,379 | ) | (4,264 | ) | ||||||||||
Pro forma net income | $ | 11,471 | 16,204 | 13,473 | 10,552 | 7,168 | ||||||||||||||
Pro Forma Per Share Data (Unaudited)(2): | ||||||||||||||||||||
Pro forma net income per share of common stock | ||||||||||||||||||||
Basic | $ | 0.51 | 0.72 | 0.60 | 0.47 | 0.32 | ||||||||||||||
Diluted | $ | 0.51 | 0.72 | 0.60 | 0.47 | 0.32 | ||||||||||||||
Other Financial Data (Unaudited) (dollars in thousands): | ||||||||||||||||||||
EBITDA(3) | $ | 45,912 | 49,966 | 41,462 | 32,593 | 21,949 | ||||||||||||||
EBITDA margin(4) | 6.5 | % | 8.0 | 8.0 | 7.6 | 6.5 | ||||||||||||||
Year ended September 30, | ||||||||||||||||||||
2019 | 2018 | 2017 | 2016 | 2015 | ||||||||||||||||
Statements of Income Data (dollars in thousands): | ||||||||||||||||||||
Net sales | $ | 903,582 | 849,042 | 769,030 | 705,499 | 624,678 | ||||||||||||||
Cost of goods sold and occupancy costs | 664,829 | 623,469 | 556,694 | 503,727 | 442,582 | |||||||||||||||
Gross profit | 238,753 | 225,573 | 212,336 | 201,772 | 182,096 | |||||||||||||||
Store expenses | 197,792 | 186,741 | 174,350 | 156,158 | 132,131 | |||||||||||||||
Administrative expenses | 22,837 | 21,506 | 20,089 | 19,242 | 17,514 | |||||||||||||||
Pre-opening and relocation expenses | 1,358 | 2,273 | 3,799 | 5,993 | 3,822 | |||||||||||||||
Operating income | 16,766 | 15,053 | 14,098 | 20,379 | 28,629 | |||||||||||||||
Interest expense, net | (4,952 | ) | (4,560 | ) | (3,793 | ) | (3,044 | ) | (2,993 | ) | ||||||||||
Income before income taxes | 11,814 | 10,493 | 10,305 | 17,335 | 25,636 | |||||||||||||||
(Provision for) benefit from income taxes | (2,398 | ) | 2,168 | (3,414 | ) | (5,864 | ) | (9,432 | ) | |||||||||||
Net income | $ | 9,416 | 12,661 | 6,891 | 11,471 | 16,204 | ||||||||||||||
Per Share Data: | ||||||||||||||||||||
Net income per share of common stock (EPS) | ||||||||||||||||||||
Basic | $ | 0.42 | 0.57 | 0.31 | 0.51 | 0.72 | ||||||||||||||
Diluted | $ | 0.42 | 0.56 | 0.31 | 0.51 | 0.72 | ||||||||||||||
Shares used in computation of EPS | ||||||||||||||||||||
Basic | 22,424,328 | 22,361,898 | 22,453,409 | 22,492,986 | 22,490,260 | |||||||||||||||
Diluted | 22,554,603 | 22,413,038 | 22,463,675 | 22,507,152 | 22,500,833 | |||||||||||||||
Other Financial Data (Unaudited) (dollars in thousands): | ||||||||||||||||||||
EBITDA(1) | $ | 45,743 | 44,483 | 43,609 | 45,912 | 49,966 | ||||||||||||||
EBITDA margin(2) | 5.1 | % | 5.2 | 5.7 | 6.5 | 8.0 | ||||||||||||||
Adjusted EBITDA(1) | $ | 46,123 | 45,068 | 43,609 | 45,912 | 49,966 | ||||||||||||||
Adjusted EBITDA margin(2) | 5.1 | % | 5.3 | 5.7 | 6.5 | 8.0 | ||||||||||||||
Other Operating Data (Unaudited): | ||||||||||||||||||||
Number of stores at end of period | 153 | 148 | 140 | 126 | 103 | |||||||||||||||
Number of stores opened during the period | 6 | 8 | 14 | 23 | 16 | |||||||||||||||
Number of stores relocated and remodeled during the period | 5 | 3 | 2 | 5 | 2 | |||||||||||||||
Change in comparable store sales(3) | 3.1 | % | 5.8 | (0.2 | ) | 1.7 | 5.9 | |||||||||||||
Change in daily average comparable store sales(3) | 3.1 | % | 5.8 | 0.1 | 1.4 | 5.9 | ||||||||||||||
Change in mature store sales(4) | 2.1 | % | 3.0 | (1.9 | ) | (0.7 | ) | 2.6 | ||||||||||||
Change in daily average mature store sales(4) | 2.1 | % | 3.0 | (1.6 | ) | (1.0 | ) | 2.6 | ||||||||||||
Gross square footage at end of period(5) | 2,522,906 | 2,378,240 | 2,260,914 | 2,031,711 | 1,668,534 | |||||||||||||||
Selling square footage at end of period(5) | 1,637,150 | 1,565,498 | 1,483,413 | 1,331,785 | 1,089,020 | |||||||||||||||
Average comparable store size (gross square feet)(6) | 16,297 | 16,149 | 16,125 | 16,239 | 15,579 | |||||||||||||||
Average comparable store size (selling square feet)(6) | 10,663 | 10,596 | 10,570 | 10,581 | 10,250 | |||||||||||||||
Comparable store sales per selling square foot during period(7) | $ | 556 | 547 | 577 | 645 | 678 |
Other Operating Data (Unaudited): | ||||||||||||||||||||
Number of stores at end of period | 126 | 103 | 87 | 72 | 59 | |||||||||||||||
Number of stores opened during the period | 23 | 16 | 15 | 13 | 10 | |||||||||||||||
Number of stores relocated and remodeled during the period | 5 | 2 | 2 | 3 | 1 | |||||||||||||||
Change in comparable store sales(5) | 1.7 | % | 5.9 | 5.6 | 10.8 | 11.6 | ||||||||||||||
Change in daily average comparable store sales(5) | 1.4 | % | 5.9 | 5.6 | 11.1 | 11.3 | ||||||||||||||
Change in mature store sales(6) | (0.7 | )% | 2.6 | 3.4 | 6.1 | 7.6 | ||||||||||||||
Change in daily average mature store sales(6) | (1.0 | )% | 2.6 | 3.4 | 6.4 | 7.3 | ||||||||||||||
Gross square footage at end of period(7) | 2,031,711 | 1,668,534 | 1,354.204 | 1,097,708 | 801,914 | |||||||||||||||
Selling square footage at end of period(7) | 1,331,785 | 1,089,020 | 892,908 | 728,609 | 572,132 | |||||||||||||||
Average comparable store size (gross square feet)(8) | 16,239 | 15,579 | 15,250 | 13,900 | 12,816 | |||||||||||||||
Average comparable store size (selling square feet)(8) | 10,581 | 10,250 | 10,125 | 9,872 | 9,458 | |||||||||||||||
Comparable store sales per selling square foot during period(9) | $ | 645 | 678 | 708 | 729 | 734 |
As of September 30, | ||||||||||||||||||||
2019 | 2018 | 2017 | 2016 | 2015 | ||||||||||||||||
Selected Balance Sheet Data (dollars in thousands): | ||||||||||||||||||||
Cash and cash equivalents | $ | 6,214 | 9,398 | 6,521 | 4,017 | 2,915 | ||||||||||||||
Total assets | 327,114 | 307,083 | 299,991 | 282,246 | 233,924 | |||||||||||||||
Total debt(8) | 58,212 | 54,334 | 61,820 | 59,335 | 27,607 | |||||||||||||||
Total stockholders’ equity | 156,906 | 146,726 | 133,883 | 126,725 | 115,488 | |||||||||||||||
As of September 30, | ||||||||||||||||||||
2016 | 2015 | 2014 | 2013 | 2012 | ||||||||||||||||
Selected Balance Sheet Data (dollars in thousands): | ||||||||||||||||||||
Cash and cash equivalents | $ | 4,017 | 2,915 | 5,113 | 8,132 | 17,291 | ||||||||||||||
Total assets | 282,246 | 233,924 | 188,985 | 159,903 | 125,662 | |||||||||||||||
Total debt(10) | 59,335 | 27,607 | 21,977 | 19,822 | 5,808 | |||||||||||||||
Total stockholders’ equity | 126,725 | 115,488 | 98,854 | 84,533 | 72,949 | |||||||||||||||
(1) |
|
The following table reconciles net income attributable to Natural Grocers by Vitamin Cottage, Inc. to pro forma net income, dollars in thousands, except per share data:
Year ended September 30, | ||||||||||||||||||||
2016 | 2015 | 2014 | 2013 | 2012 | ||||||||||||||||
Net income attributable to Natural Grocers by Vitamin Cottage, Inc. | $ | 11,471 | 16,204 | 13,473 | 10,552 | 6,649 | ||||||||||||||
Net income attributable to non-controlling interest | — | — | — | — | 828 | |||||||||||||||
Net income | 11,471 | 16,204 | 13,473 | 10,552 | 7,477 | |||||||||||||||
Provision for income taxes | 5,864 | 9,432 | 8,281 | 6,379 | 3,955 | |||||||||||||||
Income before income taxes | 17,335 | 25,636 | 21,754 | 16,931 | 11,432 | |||||||||||||||
Pro forma provision for income taxes | (5,864 | ) | (9,432 | ) | (8,281 | ) | (6,379 | ) | (4,264 | ) | ||||||||||
Pro forma net income | $ | 11,471 | 16,204 | 13,473 | 10,552 | 7,168 | ||||||||||||||
Per Share Data: | ||||||||||||||||||||
Pro forma net income per share of common stock | ||||||||||||||||||||
Basic | $ | 0.51 | 0.72 | 0.60 | 0.47 | 0.32 | ||||||||||||||
Diluted | $ | 0.51 | 0.72 | 0.60 | 0.47 | 0.32 | ||||||||||||||
Our effective tax rate increased as a result of the BVC acquisition, as the income attributable to the non-controlling interest was nontaxable income prior to the acquisition, but is included in our taxable income after the acquisition. The following table reconciles our effective tax rate to our pro forma effective tax rate had we owned 100% of BVC for the fiscal year ended September 30, 2012:
Year ended September30, | ||||||||||||||||||||
2016 | 2015 | 2014 | 2013 | 2012 | ||||||||||||||||
Statutory tax rate | 34.0 | % | 35.0 | 35.0 | 34.0 | 34.0 | ||||||||||||||
Nontaxable net income attributable to non-controlling interest | — | — | — | — | (2.7 | ) | ||||||||||||||
State income taxes, net of federal income tax expense | 2.9 | 2.9 | 3.0 | 3.3 | 3.0 | |||||||||||||||
Other, net | (3.0 | ) | (1.1 | ) | 0.1 | 0.4 | 0.3 | |||||||||||||
Effective tax rate | 33.9 | 36.8 | 38.1 | 37.7 | 34.6 | |||||||||||||||
Pro forma adjustment to exclude nontaxable net income attributable to non-controlling interest | — | — | — | — | 2.7 | |||||||||||||||
Pro forma effective tax rate | 33.9 | % | 36.8 | 38.1 | 37.7 | 37.3 | ||||||||||||||
Effective October 31, 2012, BVC merged with and into our operating company and ceased to exist.
|
|
|
|
| Furthermore, management believes some investors use EBITDA and Adjusted EBITDA as supplemental measures to evaluate the overall operating performance of companies in our |
Furthermore, management believes some investors use EBITDA as a supplemental measure to evaluate the overall operating performance of companies in our industry. Management believes that some investors’ understanding of our performance is enhanced by including this non-GAAP financial measure as a reasonable basis for comparing our ongoing results of operations. By providing this non-GAAP financial measure, together with a reconciliation from net income attributable to Natural Grocers by Vitamin Cottage, Inc., we believe we are enhancing investors’ understanding of our business and our results of operations, as well as assisting investors in evaluating how well we are executing our strategic initiatives. Our competitors may define EBITDA differently, and as a result, our measure of EBITDA may not be directly comparable to EBITDA of other companies. Items excluded from EBITDA are significant components in understanding and assessing financial performance. EBITDA is a supplemental measure of operating performance that should not be considered in isolation and that does not represent, and should not be considered as an alternative to, or substitute for, net income or other financial statement data presented in our consolidated financial statements as indicators of financial performance. EBITDA has limitations as an analytical tool, and should not be considered in isolation, or as a substitute for analysis of our results as reported under GAAP. Some of the limitations are:
● | EBITDA |
● | EBITDA |
● | EBITDA |
● | EBITDA |
● | EBITDA |
● | although depreciation and amortization are non-cash charges, the assets being depreciated and amortized will often have to be replaced in the future and EBITDA |
Due to these limitations, EBITDA and Adjusted EBITDA should not be considered as a measure of discretionary cash available to us to invest in the growth of our business. We compensate for these limitations by relying primarily on our GAAP results and using EBITDA and Adjusted EBITDA as supplemental information.
The following table reconciles net income attributable to Natural Grocers by Vitamin Cottage, Inc. toEBITDA and Adjusted EBITDA, dollars in thousands:
Year ended September30, | ||||||||||||||||||||
2016 | 2015 | 2014 | 2013 | 2012 | ||||||||||||||||
Net income attributable to Natural Grocers by Vitamin Cottage, Inc. | $ | 11,471 | 16,204 | 13,473 | 10,552 | 6,649 | ||||||||||||||
Net income attributable to non-controlling interest | — | — | — | — | 828 | |||||||||||||||
Net income | 11,471 | 16,204 | 13,473 | 10,552 | 7,477 | |||||||||||||||
Interest expense | 3,044 | 2,993 | 2,496 | 2,166 | 568 | |||||||||||||||
Provision for income taxes | 5,864 | 9,432 | 8,281 | 6,379 | 3,955 | |||||||||||||||
Depreciation and amortization | 25,533 | 21,337 | 17,212 | 13,496 | 9,949 | |||||||||||||||
EBITDA | $ | 45,912 | 49,966 | 41,462 | 32,593 | 21,949 | ||||||||||||||
Year ended September 30, | ||||||||||||||||||||
2019 | 2018 | 2017 | 2016 | 2015 | ||||||||||||||||
Net income | $ | 9,416 | 12,661 | 6,891 | 11,471 | 16,204 | ||||||||||||||
Interest expense, net | 4,952 | 4,560 | 3,793 | 3,044 | 2,993 | |||||||||||||||
Provision for (benefit from) income taxes | 2,398 | (2,168 | ) | 3,414 | 5,864 | 9,432 | ||||||||||||||
Depreciation and amortization | 28,977 | 29,430 | 29,511 | 25,533 | 21,337 | |||||||||||||||
EBITDA | 45,743 | 44,483 | 43,609 | 45,912 | 49,966 | |||||||||||||||
Impairment of long-lived assets and store closing costs | 380 | 585 | — | — | — | |||||||||||||||
Adjusted EBITDA | $ | 46,123 | 45,068 | 43,609 | 45,912 | 49,966 | ||||||||||||||
| EBITDA margin is defined as the ratio of EBITDA to net sales. Adjusted EBITDA margin is defined as the ratio of Adjusted EBITDA to net sales. We present EBITDA margin and Adjusted EBITDA margin because |
| When calculating change in comparable store sales, we begin to include sales from a store in our comparable store base on the first day of the thirteenth full month following the store’s opening. We monitor the percentage change in comparable store sales by comparing sales from all stores in our comparable store base for a reporting period against sales from the same stores for the same number of operating months in the comparable reporting period of the prior year. When a store that is included in comparable store sales is remodeled or relocated, we continue to consider sales from that store to be comparable store sales. When calculating daily average comparable store sales, we include the comparable store sales divided by the number of selling days in each period. We use this metric to remove the effect of differences in the number of selling days we are open during the comparable periods. |
| When calculating change in mature store sales, we begin to include sales from a store in our mature store base after the store has been open for any part of five fiscal years (for example, our mature stores for fiscal year |
| Gross square footage and selling square footage at the end of the period include the square footage for all stores that were open as of the end of the period presented. |
| Average comparable store size for gross square feet and selling square feet are calculated using the average store size for all stores that were in the comparable store base as of the end of the period presented. |
| Comparable store sales per selling square foot is calculated using comparable store sales for the period divided by the weighted average selling square feet per store based on the amount of time the store was included in the comparable store base during the period. |
| Total debt includes capital and financing lease obligations |
Item 7. Management’sDiscussion and Analysis of Financial Condition and Results of Operations.
The following Management’s Discussion and Analysis of Financial Condition and Results of Operations (MD&A) should be read in conjunction with our consolidated financial statements and notes thereto and “Selected Financial Data,” which are included elsewhere in this Form 10-K. This MD&A contains forward-looking statements. Refer to “Forward-Looking Statements” at the beginning of this Form 10-K for an explanation of these types of statements. Summarized numbers included in this section, and corresponding percentage or basis point changes may not sum due to the effects of rounding.
Company Overview
We operate natural and organic grocery and dietary supplement stores that are focused on providing high quality products at affordable prices, exceptional customer service, nutrition education and community outreach. We offer a variety of natural and organic groceries and dietary supplements that meet our strict quality standards. We believe we have been at the forefront of the natural and organic foods movement since our founding. We are headquartered in Lakewood, Colorado. As of September 30, 2016,2019, we operated 126153 stores in 19 states, including Colorado, Arizona, Arkansas, Idaho, Iowa, Kansas, Minnesota, Missouri, Montana, Nebraska, Nevada, New Mexico, North Dakota, Oklahoma, Oregon, Texas, Utah, Washington and Wyoming. We also operate a bulk food repackaging facility and distribution center in Colorado.
We offer a variety of natural and organic groceries and dietary supplements that meet our strict quality guidelines. The size of our stores varies from approximately 5,000 to 16,000 selling square feet. For the year ended September 30, 2016,2019, our new stores averaged approximately 11,00010,000 selling square feet.
The growth in the organic and natural foods industry and growing consumer interest in health and nutrition have enabled us to continue to open new stores and enter new markets. Over the last five fiscal years, our store base has grown at a compound annual growth rate of 20.79%12%, including 23, 16six, eight and 1514 new stores in fiscal year 2016, 2015years 2019, 2018 and 2014,2017, respectively. We relocated fourfive existing stores and remodeled one store in fiscal year 2016.2019. We plan to open 15five to 20six new stores and relocate threeone to two stores in fiscal year 2017.2020. Between September 30, 20162019 and the date of this Form 10-K, we have opened a total of three storesone new store in Iowa, Missouri and Texas.Louisiana. As of the date of this report, we also have signed leases for an additional 18five new store locations expected to open in fiscal years 20172020 and 2018.beyond. In addition, the Company had purchased the property for two additional new stores.
Performance Highlights
Key highlights of our recent performance are discussed briefly below and are discussed in further detail throughout this MD&A. Key financial metrics, including, but not limited to, comparable store sales, daily average comparable store sales, mature store sales and daily average mature store sales are defined under the caption “Key Financial Metrics in Our Business,” presented later in this MD&A.
● | Net sales.Net sales were |
● | Comparable store sales and daily average comparable store sales.Comparable store sales and daily average comparable store sales for the year ended September 30, |
● |
|
| Mature store sales and daily average mature store sales.Mature store sales and daily average mature store sales for the year ended September 30, |
● |
|
● |
|
|
|
● | Adjusted EBITDA. AdjustedEBITDA was $46.1 million in the year ended September 30, 2019, an increase of $1.0 million, or 2.3%, compared to Adjusted EBITDA of $45.1 million for the year ended September 30, 2018. Adjusted EBITDA is not a measure of financial performance under GAAP. Refer to the “Selected Financial Data” section of this Form 10-K for a definition of Adjusted EBITDA and a reconciliation of the Company’s net income to Adjusted EBITDA. |
● | Liquidity.As of September 30, |
● | New store growth.We |
● | Store Relocations and Remodels.We relocated |
Industry Trends and Economics
We have identified the following recent trends and factors that have impacted and may continue to impact our results of operations and financial condition:
● | Impact of broader economic trends.The grocery industry and our sales are affected by general economic conditions, including, but not limited to, consumer spending, |
● | Opportunities in the growing natural and organic grocery and dietary supplements industry.Our industry, which includes organic and natural foods and dietary supplements, continues to experience growth driven primarily by increased public interest in health and nutrition. Capitalizing on this opportunity, we continue to open new stores and enter new markets. As we open new stores, our results of operations have been and may continue to be materially adversely affected based on the timing and number of new stores we open, their initial sales and new lease costs. The length of time it takes for a new store to become profitable can vary depending on a number of factors, including location, competition, a new market versus an existing market, the strength of store management and general economic conditions. Once a new store is open, it typically grows at a faster rate than mature stores for several years. Mature stores are stores that have been open for any part of five fiscal years or longer. | |
| As we expand across the United States and enter markets where consumers may not be as familiar with our brand, we seek to secure prime real estate locations for our stores to establish greater visibility with consumers in those markets. This strategy has resulted in higher lease costs, and we anticipate these increased costs will continue into the foreseeable future. Our financial results for the year ended September 30, 2019 reflect the effects of these factors, and we anticipate future periods will be similarly impacted. | ||
| Our performance is also impacted by trends regarding natural and organic products, dietary supplements and at-home meal preparation. Consumer preferences towards dietary supplements or natural and organic food products might shift as a result of, among other things, economic conditions, food safety perceptions, changing consumer choices and the cost of these products. A change in consumer preferences away from our offerings, including those resulting from reductions or changes in our offerings, would have a material adverse effect on our business. Additionally, negative publicity regarding the safety of dietary supplements, product recalls or new or upgraded regulatory standards may adversely affect demand for the products we sell and could result in lower consumer traffic, sales and results of operations. |
As we expand across the United States and enter markets where consumers may not be as familiar with our brand, we seek to secure prime real estate locations for our stores to establish greater visibility with consumers in those markets. This strategy has resulted in higher lease costs, and we anticipate these increased costs will continue into the foreseeable future. Our financial results for the year ended September 30, 2016 reflect the effects of these factors, and we anticipate future periods will be similarly impacted.
Our performance is also impacted by trends regarding natural and organic products, dietary supplements and at-home meal preparation. Consumer preferences towards dietary supplements or natural and organic food products might shift as a result of, among other things, economic conditions, food safety perceptions, changing consumer choices and the cost of these products. Our store offerings consist of natural and organic products and dietary supplements. A change in consumer preferences away from our offerings, including those resulting from reductions or changes in our offerings, would have a material adverse effect on our business. Additionally, negative publicity regarding the safety of dietary supplements, product recalls or new or upgraded regulatory standards may adversely affect demand for the products we sell and could result in lower consumer traffic, sales and results of operations.
● | Increased |
Outlook
We believe there are several key factors that have contributed to our success and will enable us to continue to expand profitably and increase our comparable store sales.sales and continue to profitably expand. These factors include a loyal customer base, increasing basket size, growing consumer interest in nutrition and wellness, a differentiated shopping experience that focuses on customer service, nutrition education and a shopper friendlyconvenient shopper-friendly retail environment, and our focus on high quality, affordable natural and organic groceries and dietary supplements.
We plan for the foreseeable future to continue opening new stores and entering new markets. The rate of new store unit growth in the foreseeable future is expected to moderate somewhat comparedbe comparable to recent years, depending on economic and business conditions and other factors. During the past few years, we have expandedenhanced our infrastructure to enable us to support our continued growth. This has included implementing our enterprise resource planning system, hiring key personnel, developing efficient new store opening construction and operations processes and relocating and expanding our bulk food repackaging facility and distribution center. During fiscal year 2015, we redesigned our website (www.naturalgrocers.com) to enhance functionality, create a more engaging user experience and increase its reach and effectiveness. In addition, in fiscal year 2015 we introduced the{N}Power customer appreciation program at all of our stores, whichrecent years we believe haswe have enhanced customer loyalty and increased customer engagement levels.by expanding our digital and social media presence and further developing the {N}power customer loyalty program. In September 2018, we launched a new website (www.naturalgrocers.com) which was designed to offer a more personalized and convenient online experience for our customers, enhanced product and recipe search interfaces and improved functionality with mobile and tablet devices.
We believe there are opportunities for us to continue to expand our store base, expand profitability and increase comparable store sales. However, future sales growth, including comparable store sales, and our profitability could vary due to increasing competitive conditions in the natural and organic grocery and dietary supplement industry and regional and general economic conditions. In this regard, during the fiscal year ended September 30, 2016 the rate of growth in our comparable store sales moderated compared to the prior fiscal years in part due to the impact of increased competition in the natural and organic retail sector and internally generated competition due to opening new stores in our existing markets. To a lesser extent, during fiscal year 2016 we experienced economic pressures in several of the markets we serve due to depressed oil and natural gas prices (which pressures we believe have begun to moderate slightly).
As we continue to expand our store base, we believe there are opportunities for increased leverage in costs, such as administrative expenses, as well as increased economies of scale in sourcing products. However, due to our commitment to providing high-quality products at affordable prices and increased competition, such sourcing economies and efficiencies at our bulk food repackingrepackaging facility and distribution center may not be reflected in our gross margin in the near term. In addition, our ability to leverage costs may be limited due to the fixed nature of our rent obligations and related occupancy expenses.
Our operating results may be affected by a variety of internal and external factors and trends, which are described more fully in the section entitled “Risk Factors” appearing elsewhere in this Form 10-K.
Key Financial Metrics in Our Business
In assessing our performance, we consider a variety of performance and financial measures. The key measures are as follows:
Net sales
Our net sales are comprised of gross sales net of discounts, in-house coupons, returns and allowances. In comparing net sales between periods we monitor the following:
● | Change in comparable store sales.We begin to include sales from a store in comparable store sales on the first day of the thirteenth full month following the store’s opening. We monitor the percentage change in comparable store sales by comparing sales from all stores in our comparable store base for a reporting period against sales from the same stores for the same number of operating months in the comparable reporting period of the prior year. When a store that is included in comparable store sales is remodeled or relocated, we continue to consider sales from that store to be comparable store sales. Our comparable store sales data may not be presented on the same basis as our competitors. We use the term “new stores” to refer to stores that have been open for less than thirteen months. |
● | Change in daily average comparable store sales. Daily average comparable store sales are comparable store sales divided by the number of selling days in each period. We use this metric to remove the effect of differences in the number of selling days we are open during the comparable periods (for example, as a result of leap years or the Easter holiday shift between quarters). |
● | Change in mature store sales.We begin to include sales from a store in mature store sales after the store has been open for any part of five fiscal years (for example, our mature stores for fiscal year |
● | Change in daily average mature store sales.Daily average mature store sales are mature store sales divided by the number of selling days in each period. We use this metric to remove the effect of differences in the number of selling days during the comparable periods (for example, as a result of leap years or the Easter holiday shift between quarters). |
● | Transaction count.Transaction count represents the number of transactions reported at our stores during the period and includes transactions that are voided, return transactions and exchange transactions. |
● | Average transaction size.Average transaction size, or basket size, is calculated by dividing net sales by transaction count for a given time period. We use this metric to track the trends in average dollars spent in our stores per customer transaction. |
Cost of goods sold and occupancy costs
Our cost of goods sold and occupancy costs include the cost of inventory sold during the period (net of discounts and allowances), shipping and handling costs, distribution and supply chain costs (including the costs of our bulk food repackaging facility), buying costs, inventory shrink expense and store occupancy costs. Store occupancy costs include rent, common area maintenance and real estate taxes. Depreciation expense included in cost of goods sold relates to depreciation of assets directly used at our bulk food repackaging facility. The components of our cost of goods sold and occupancy costs may not be identical to those of our competitors, and as a result, our cost of goods sold and occupancy costs data included in this Form 10-K may not be identical to those of our competitors, and may not be comparable to similar data made available by our competitors. Occupancy costs as a percentage of sales typically decrease as new stores mature and increase sales. We do not record in cost of goods sold and occupancy costs rentRent payments for leases classified as capital and financing lease obligations.obligations are not recorded in cost of goods sold and occupancy costs. Rather, these rent payments are recognized as a reduction of the related obligations and as interest expense. Additionally, depreciation expense related to the capitalized asset is recorded in store expenses.
Gross profit and gross margin
Gross profit is equal to our net sales less our cost of goods sold and occupancy costs. Gross margin is gross profit as a percentage of net sales. Gross margin is impacted by changes in retail prices, product costs, occupancy costs and the mix of products sold, as well as the rate at which we open new stores.
Store expenses
Store expenses consist of store levelstore-level expenses, such as salary and benefits, share-based compensation, supplies, utilities, depreciation, advertising, bank credit card charges and other related costs associated with operations and purchasing support. Depreciation expense included in store expenses relates to depreciation for assets directly used at the stores, including depreciation on capitalized real estate leases, land improvements, leasehold improvements, fixtures and equipment and computer hardware and software.Additionally,software. Additionally, store expenses include any gain or loss recorded on the disposal of fixed assets, primarily related to store relocations. The majority of store expenses are comprisedconsist of salary-relatedlabor-related expenses, which we closely manage and which trend closely with sales. Labor-related expenses as a percentage of sales tend to be higher at new stores compared to comparable stores, as new stores require a certainminimum level of staffing in order to maintain adequate levels of customer service combined with lower sales. As new stores increase their sales, labor-related expenses as a percentage of sales typically decrease.
Administrative expenses
Administrative expenses consist of home office-related expenses, such as salary and benefits, share-based compensation, office supplies, hardware and software expenses, depreciation and amortization expense, occupancy costs (including rent, common area maintenance, real estate taxes and utilities), professional services expenses, expenses associated with our Board, expenses related to compliance with the requirements of Sarbanes-Oxley, and other general and administrative expenses. Depreciation expense included in administrative expenses relates to depreciation for assets directly used at the home office including depreciation on land improvements, leasehold improvements, fixtures and equipment and computer hardware and software.
Pre-opening and relocation expenses
Pre-opening and relocation expenses may include rent expense, salaries, advertising, supplies and other miscellaneous costs incurred prior to the store opening. Rent expense is generally incurred from one to four months prior to a store’s opening date for store leases classified as operating. For store leases classified as capital or financing leases, no pre-opening rent expense is recognized. Other pre-opening and relocation expenses are generally incurred in the 60 days prior to the store opening. Certain advertising and promotional costs associated with opening a new store may be incurred both before and after the store opens. All pre-opening and relocation costs are expensed as incurred.
Operating income
Operating income consists of gross profit less store expenses, administrative expenses and pre-opening and relocation expenses. Operating income can be impacted by a number of factors, including the timing of new store openings and store relocations, whether or not a store lease is classified as an operating or a capital or financing lease, as well as increases in store expenses and administrative expenses. The amount of time it takes for new stores to become profitable can vary depending on a number of factors, including location, competition, a new market versus an existing market and the strength of store management.
Interest expense, net
Interest expense consists of the interest associated with capital and financing lease obligations, net of capitalized interest. Interestinterest, and our Credit Facility.
Income tax expense
The Tax Reform Act, enacted on December 22, 2017, changed various corporate income tax provisions within the existing Internal Revenue Code, including reducing the corporate federal income tax rate from 35% to 21%. Income tax expense also includes interest we incur on our outstanding indebtedness, including under our Credit Facility. Asexcess tax benefits and deficiencies related to the vesting of September 30, 2016, $27.4 million was outstanding under the Credit Facility. As of September 30, 2015 and 2014, no amounts were outstanding under our Prior Credit Facility.restricted stock units.
Results of Operations
The following table presents key components of our results of operations expressed as a percentage of net sales for the periods presented:
Year ended September 30, | Year ended September 30, | |||||||||||||||||||||||
2016 | 2015 | 2014 | 2019 | 2018 | 2017 | |||||||||||||||||||
Statements of Income Data:* | ||||||||||||||||||||||||
Net sales | 100.0 | % | 100.0 | 100.0 | 100.0 | % | 100.0 | 100.0 | ||||||||||||||||
Cost of goods sold and occupancy costs | 71.4 | 70.8 | 70.9 | 73.6 | 73.4 | 72.4 | ||||||||||||||||||
Gross profit | 28.6 | 29.2 | 29.1 | 26.4 | 26.6 | 27.6 | ||||||||||||||||||
Store expenses | 22.1 | 21.2 | 20.9 | 21.9 | 22.0 | 22.7 | ||||||||||||||||||
Administrative expenses | 2.7 | 2.8 | 2.8 | 2.5 | 2.5 | 2.6 | ||||||||||||||||||
Pre-opening and relocation expenses | 0.8 | 0.6 | 0.7 | 0.2 | 0.3 | 0.5 | ||||||||||||||||||
Operating income | 2.9 | 4.6 | 4.7 | 1.9 | 1.8 | 1.8 | ||||||||||||||||||
Interest expense | (0.4 | ) | (0.5 | ) | (0.5 | ) | ||||||||||||||||||
Interest expense, net | (0.5 | ) | (0.5 | ) | (0.5 | ) | ||||||||||||||||||
Income before income taxes | 2.5 | 4.1 | 4.2 | 1.3 | 1.2 | 1.3 | ||||||||||||||||||
Provision for income taxes | (0.8 | ) | (1.5 | ) | (1.6 | ) | ||||||||||||||||||
(Provision for) benefit from income taxes | (0.3 | ) | 0.3 | (0.4 | ) | |||||||||||||||||||
Net income | 1.6 | % | 2.6 | 2.6 | 1.0 | % | 1.5 | 0.9 | ||||||||||||||||
__________________________ | ||||||||||||||||||||||||
*Figures may not sum due to rounding. | ||||||||||||||||||||||||
Other Operating Data: | ||||||||||||||||||||||||
Number of stores at end of period | 126 | 103 | 87 | 153 | 148 | 140 | ||||||||||||||||||
Store unit count increase period over period | 22.3 | % | 18.4 | 20.8 | 3.4 | % | 5.7 | 11.1 | ||||||||||||||||
Change in comparable store sales | 1.7 | % | 5.9 | 5.6 | 3.1 | % | 5.8 | (0.2 | ) | |||||||||||||||
Change in daily average comparable store sales | 1.4 | % | 5.9 | 5.6 | 3.1 | % | 5.8 | 0.1 | ||||||||||||||||
Change in mature store sales | (0.7 | )% | 2.6 | 3.4 | 2.1 | % | 3.0 | (1.9 | ) | |||||||||||||||
Change in daily average mature store sales | (1.0 | )% | 2.6 | 3.4 | 2.1 | % | 3.0 | (1.6 | ) | |||||||||||||||
Year ended September30, 2016 compared2019 compared to Year ended September 30, 201830, 2015
The following table summarizes our results of operations and other operating data for the periods presented, dollars in thousands:
Yearended September30, | Change in | Year ended September 30, | Change in | |||||||||||||||||||||||||||||
2016 | 2015 | Dollars | Percent | 2019 | 2018 | Dollars | Percent | |||||||||||||||||||||||||
Statements of Income Data: | ||||||||||||||||||||||||||||||||
Net sales | $ | 705,499 | 624,678 | 80,821 | 12.9 | % | $ | 903,582 | 849,042 | 54,540 | 6.4 | % | ||||||||||||||||||||
Cost of goods sold and occupancy costs | 503,727 | 442,582 | 61,145 | 13.8 | 664,829 | 623,469 | 41,360 | 6.6 | ||||||||||||||||||||||||
Gross profit | 201,772 | 182,096 | 19,676 | 10.8 | 238,753 | 225,573 | 13,180 | 5.8 | ||||||||||||||||||||||||
Store expenses | 156,158 | 132,131 | 24,027 | 18.2 | 197,792 | 186,741 | 11,051 | 5.9 | ||||||||||||||||||||||||
Administrative expenses | 19,242 | 17,514 | 1,728 | 9.9 | 22,837 | 21,506 | 1,331 | 6.2 | ||||||||||||||||||||||||
Pre-opening and relocation expenses | 5,993 | 3,822 | 2,171 | 56.8 | 1,358 | 2,273 | (915 | ) | (40.3 | ) | ||||||||||||||||||||||
Operating income | 20,379 | 28,629 | (8,250 | ) | (28.8 | ) | 16,766 | 15,053 | 1,713 | 11.4 | ||||||||||||||||||||||
Interest expense | (3,044 | ) | (2,993 | ) | (51 | ) | 1.7 | |||||||||||||||||||||||||
Interest expense, net | (4,952 | ) | (4,560 | ) | (392 | ) | 8.6 | |||||||||||||||||||||||||
Income before income taxes | 17,335 | 25,636 | (8,301 | ) | (32.4 | ) | 11,814 | 10,493 | 1,321 | 12.6 | ||||||||||||||||||||||
Provision for income taxes | (5,864 | ) | (9,432 | ) | 3,568 | (37.8 | ) | |||||||||||||||||||||||||
(Provision for) benefit from income taxes | (2,398 | ) | 2,168 | (4,566 | ) | (210.6 | ) | |||||||||||||||||||||||||
Net income | $ | 11,471 | 16,204 | (4,733 | ) | (29.2 | )% | $ | 9,416 | 12,661 | (3,245 | ) | (25.6 | ) | ||||||||||||||||||
Net sales
Net sales increased $80.8$54.5 million, or 12.9%6.4%, to $705.5$903.6 million for the year ended September 30, 20162019 compared to $624.7$849.0 million for the year ended September 30, 2015,2018, primarily due to a $70.5$26.3 million, or 3.1%, increase in comparable store sales, and a $30.8 million increase in new store sales, andpartially offset by a $10.3$2.6 million or 1.7%,decrease in sales from one store that closed during the first quarter of fiscal year 2019. Comparable store sales increased 3.1% for the year ended September 30, 2019 compared to a 5.8% increase in comparable store sales.for the year ended September 30, 2018. Daily average comparable store sales increased 1.4%3.1% for the year ended September 30, 20162019 compared to an increase of 5.8% for the year ended September 30, 2015.2018. The daily average comparable store sales increase in fiscal year 2019 resulted from a 1.1%2.9% increase in average transaction size and a 0.2% increase in daily average transaction count. Comparable store average transaction size was $35.82$36.23 for the year ended September 30, 2016.2019. Daily average mature store sales decreased 1.0%increased 2.1% for the year ended September 30, 20162019 compared to an increase of 3.0% for the year ended September 30, 2015.
Our 1.7% increase in comparable store sales in fiscal year 2016 compares to a 5.9% increase in comparable store sales in fiscal year 2015. The rate of growth in our comparable store sales moderated in fiscal year 2016 in part due to the impact of increased competition in the natural and organic sector, internally generated competition due to opening new stores in our existing markets andthe impact of the product discounts offered by the{N}Power customer loyalty program. To a lesser extent, we experienced economic pressures in several of the markets we serve due to depressed oil and natural gas prices (which pressures we believe have begun to moderate slightly).2018.
Gross profit
Gross profit increased $19.7$13.2 million, or 10.8%5.8%, to $201.8$238.8 million for the year ended September 30, 20162019 compared to $182.1$225.6 million for the year ended September 30, 2015,2018, primarily driven by an increase in the number of comparable stores, comparable store sales growth and one additional selling day due to the leap year.stores. Gross margin decreased to 28.6%26.4% for the year ended September 30, 20162019 from 29.2%26.6% for the year ended September 30, 2015.2018. Gross margin for the year ended September 30, 2016 was negatively impacted2019 reflected lower product margins due to a shift in sales mix to lower margin products, partially offset by an increasea slight decrease in occupancy costsexpense as a percentage of sales. The increase in occupancy costs as a percentage of sales was primarily due to higher average lease expenses at newer and relocated stores and also reflects the decrease in mature store sales and the fixed nature of our rent obligations and related occupancy expenses. Additionally, product margin improved, offset by increased shrink expense, all as a percentage of sales.
For the years ended September 30, 20162019 and 2015,2018, the Company had 1623 and 1320 leases, respectively, for stores which were classified as capital and financing lease obligations. If these leases had qualified as operating leases, the straight-line rent expense would have been included in occupancy costs, and our costs of goods sold and occupancy costs as a percentage of sales during each of the years ended September 30, 20162019 and 20152018 would have been approximately 5560 and 6055 basis points higher, respectively, than as reported.reported for each period.
Store expenses
Store expenses increased $24.0$11.1 million, or 18.2 %,5.9%, to $156.2$197.8 million in the year ended September 30, 2016 from $132.12019 compared to $186.7 million in the year ended September 30, 2015.2018. Store expenses as a percentage of sales were 22.1%21.9% and 21.2%22.0% for the years ended September 30, 20162019 and 2015,2018, respectively. The increasedecrease in store expenses as a percentage of sales in fiscal year 2016 was primarily due to increasesa decrease in salary-relatedlabor-related expenses and depreciation, both as a percentage of sales. Store expenses included long-lived asset impairment charges related to long-lived assets of $0.4 million and other store expenses.$0.5 million in fiscal years 2019 and 2018, respectively.
Administrative expenses
Administrative expenses increased $1.7$1.3 million, or 9.9%6.2%, to $19.2$22.8 million for the year ended September 30, 20162019 compared to $17.5$21.5 million for the year ended September 30, 2015,2018. The increase in administrative expenses was due primarily due to the addition of senior management positions to support our growth, together with increased legalhigher compensation, consulting, and public company costs.software-related expenses. Administrative expenses as a percentage of sales were 2.7% and 2.8%2.5% for each of the years ended September 30, 20162019 and 2015, respectively.2018.
Pre-opening and relocation expenses
Pre-opening and relocation expenses increased $2.2decreased $0.9 million, or 56.8%40.3%, to $6.0$1.4 million for the year ended September 30, 20162019 compared to $3.8$2.3 million for the year ended September 30, 2015.2018. The increasedecrease in pre-opening and relocation expenses was primarily due to the impact of the number and timing of new store openings and relocations. Pre-opening and relocation expenses as a percentage of sales were 0.8%0.2% and 0.6%0.3% for the years ended September 30, 20162019 and 2015,2018, respectively. The numbers of stores opened relocated and remodeledrelocated were as follows for the periods presented:
Year ended September30, | Year ended September 30, | |||||||||||||||
2016 | 2015 | 2019 | 2018 | |||||||||||||
New stores | 23 | 16 | 6 | 8 | ||||||||||||
Relocated stores | 4 | 1 | 5 | 3 | ||||||||||||
Remodeled stores | 1 | 1 | ||||||||||||||
| 28 | 18 | 11 | 11 | |||||||||||||
Interest expense, net
Interest expense, net of capitalized interest, increased $0.1$0.4 million, or 1.7%8.6%, in the year ended September 30, 20162019 compared to the year ended September 30, 2015,2018. The increase in interest expense is primarily due to an increase in interest expense associated with our Credit Facility due to higher average borrowings, partially offset by an increase in capitalized interestthe number of capital leases during the year ended September 30, 2016.2019. If our capital and financing lease obligations had qualified as operating leases, interest expense as a percent of sales would have been approximately 50 basis points lower than as reported in each of the years ended September 30, 2016 and 2015, respectively.
Income taxes
Provision for income taxes decreased $3.6 million, or 37.8%, in the year ended September 30, 2016 compared to the year ended September 30, 2015, primarily due to an $8.3 million decrease in income before income taxes and a decrease in the estimated annual tax rate in the year ended September 30, 2016. The effective tax rate decreased from 36.8% in the year ended September 30, 2015 to 33.9% in the year ended September 30, 2016, primarily due to a revision in our estimated annual federal tax rate from 35% to 34% and federal and state tax credits in our fiscal 2015 tax return that were higher than previously estimated in the provision for the year ended September 30, 2015. For the year ended September 30, 2016,the federal tax rate remained at 35% for our deferred tax assets and liabilities.
Net income
Net income was $11.5 million, or $0.51 in diluted earnings per share, in the year ended September 30, 2016 compared to $16.2 million, or $0.72 in diluted earnings per share, in the year ended September 30, 2015.
Year ended September30, 2015 compared to the year ended September30, 2014
The following table summarizes our results of operations and other operating data for the periods presented, dollars in thousands:
Yearended September30, | Change in | |||||||||||||||
2015 | 2014 | Dollars | Percent | |||||||||||||
Statements of Income Data: | ||||||||||||||||
Net sales | $ | 624,678 | 520,674 | 104,004 | 20.0 | % | ||||||||||
Cost of goods sold and occupancy costs | 442,582 | 369,172 | 73,410 | 19.9 | ||||||||||||
Gross profit | 182,096 | 151,502 | 30,594 | 20.2 | ||||||||||||
Store expenses | 132,131 | 108,657 | 23,474 | 21.6 | ||||||||||||
Administrative expenses | 17,514 | 14,823 | 2,691 | 18.2 | ||||||||||||
Pre-opening and relocation expenses | 3,822 | 3,774 | 48 | 1.3 | ||||||||||||
Operating income | 28,629 | 24,248 | 4,381 | 18.1 | ||||||||||||
Other income (expense): | ||||||||||||||||
Dividends and interest income | — | 2 | (2 | ) | (100.0 | ) | ||||||||||
Interest expense | (2,993 | ) | (2,496 | ) | (497 | ) | 19.9 | |||||||||
Income before income taxes | 25,636 | 21,754 | 3,882 | 17.8 | ||||||||||||
Provision for income taxes | (9,432 | ) | (8,281 | ) | (1,151 | ) | 13.9 | |||||||||
Net income | $ | 16,204 | 13,473 | 2,731 | 20.3 | % | ||||||||||
Net sales
Net sales increased $104.0 million, or 20.0%, to $624.7 million for the year ended September 30, 2015 compared to $520.7 million for the year ended September 30, 2014, primarily due to a $73.3 million increase in new store sales and a $30.7 million, or 5.9%, increase in comparable store sales. The comparable store sales increase was driven by a 3.6% increase in daily average transaction count and a 2.2% increase in average transaction size. Comparable store average transaction size was $35.98 in the year ended September 30, 2015.
Gross profit
Gross profit increased $30.6 million, or 20.2%, to $182.1 million for the year ended September 30, 2015 compared to $151.5 million for the year ended September 30, 2014, primarily driven by positive comparable store sales and an increase in the number of stores. Gross margin increased to 29.2% for the year ended September 30, 2015 from 29.1% for the year ended September 30, 2014. Gross margin was positively impacted by an increase in product gross margin, partially offset by an increase in occupancy costs as a percentage of sales for the year ended September 30, 2015 as compared to the year ended September 30, 2014. The positive impact in product margin is due to increases in product margin across most departments in the year ended September 30, 2015 as compared to the year ended September 30, 2014. Occupancy costs as a percentage of sales increased in the year ended September 30, 2015 as compared to the year ended September 30, 2014, primarily due to increased average lease expenses at newer stores.
For the years ended September 30, 2015 and 2014, the Company had 13 and ten leases respectively, for stores which were classified as capital and financing lease obligations. If these leases had qualified as operating leases, the straight-line rent expense would have been included in occupancy costs, and our costs of goods sold and occupancy costs as a percentage of sales during the years ended September 30, 2015 and 2014 would have been approximately 60 basis points higher than as reported.
Store expenses
Store expenses increased $23.5 million, or 21.6%, to $132.1 million in the year ended September 30, 2015 from $108.7 million in the year ended September 30, 2014, primarily due to increases in salary related expenses, depreciation, and other store expenses related for the most part to increases in store count. Store expenses as a percentage of sales were 21.2% and 20.9% for the years ended September 30, 20152019 and 2014, respectively. The increase in store expenses as a percentage of sales was primarily due to increases in other store expense and depreciation expense, partially offset by decreases in salary related expenses, all as a percentage of sales. The increase in other store expense as a percentage of sales was primarily driven by increases in ongoing facilities maintenance, other promotions and marketing support. Store expenses for the year ended September 30, 2015 were also impacted by higher incentive compensation and other discretionary benefit expense, reflecting our pay-for-performance philosophy.
Administrative expenses
Administrative expenses increased $2.7 million, or 18.2%, to $17.5 million for the year ended September 30, 2015 compared to $14.8 million for the year ended September 30, 2014, primarily due to increases in salary-related expenses, various professional fees and other administrative expenses. Administrative expenses as a percentage of sales were 2.8% for each of the years ended September 30, 2015 and 2014.
Pre-opening and relocation expenses
Pre-opening and relocation expenses were $3.8 million in each of the years ended September 30, 2015 and 2014. Pre-opening and relocation expenses as a percentage of sales were 0.6% and 0.7% for the years ended September 30, 2015 and 2014, respectively. The numbers of stores opened, relocated and remodeled were as follows for the periods presented:
Year ended September30, | ||||||||
2015 | 2014 | |||||||
New stores | 16 | 15 | ||||||
Relocated stores | 1 | ─ | ||||||
Remodeled stores | 1 | 2 | ||||||
| 18 | 17 | |||||||
Interest expense
Interest expense, net of capitalized interest, increased $0.5 million, or 19.9%, in the year ended September 30, 2015 compared to the year ended September 30, 2014, primarily due to a $0.4 million increase in interest expense related to capital and financing lease obligations. If our capital and financing lease obligations had qualified as operating leases, interest expense as a percent of sales2018 would have been approximately 50 and 45 basis points lower than as reported in the years ended September 30, 2015 and 2014,for each period, respectively.
Income taxes
Provision for income taxes increased $1.2$4.6 million or 13.9%,to $2.4 million for the year ended September 30, 2019 compared to a $2.2 million benefit for the year ended September 30, 2018. Income taxes for the year ended September 30, 2018 reflected the favorable impact of a $4.3 million non-cash remeasurement of our deferred tax assets and liabilities as a result of the enactment of the Tax Reform Act. The Company’s effective income tax rate for the year ended September 30, 2019 was approximately 20.3%. Exclusive of the adjustment to deferred tax assets and liabilities, the Company’s effective income tax rate was approximately 20.7% in fiscal year 2018.
Net income
Net income in the year ended September 30, 20152019 was $9.4 million, or $0.42 in diluted earnings per share compared to the year ended September 30, 2014, primarily due to a $3.9 million increase in income before income taxes, partially offset by favorable return to provision adjustments recognized in the year ended September 30, 2015. The effective tax rate decreased from 38.1% in the year ended September 30, 2014 to 36.8% in the year ended September 30, 2015, primarily due to the favorable return to provision adjustments resulting from lower federal taxable income due to the extension of the American Taxpayer Relief Act of 2012, which extended the 50% bonus depreciation on qualifying assets and the special 15 year life for qualified leasehold property and qualified retail improvement property acquired from January 1, 2014 through December 31, 2014. The lower taxable income reduced our actual federal income tax rate for fiscal year 2014 to 34.4%, compared to 35.0% estimated in our fiscal year 2014 tax provision. In addition, our return to provision adjustments were also favorably impacted by extension of the Work Opportunity Tax Credit (WOTC) through December 31, 2014 and other state tax credits.
Net income
Net income increased 20.3% to $16.2$12.7 million, or $0.72$0.56 in diluted earnings per share, in the year ended September 30, 2015 from $13.5 million, or $0.60 in diluted earnings per share, in2018. Excluding the favorable impact of the remeasurement of our deferred tax assets and liabilities, net income for the year ended September 30, 2014.2018 was $8.3 million.
Year ended September 30, 2018 compared to Year ended September 30, 2017
A comparative discussion of our results of operations and other operating data for the years ended September 30, 2018 and September 30, 2017 is set out in our Annual Report on Form 10-K for the year ended September 30, 2018 under the heading “Management’s Discussion and Analysis of Financial Condition and Results of Operations – Results of Operations - Year ended September 30, 2018 compared to Year ended September 30, 2017.”
Non-GAAP financial measuremeasures
EBITDA and Adjusted EBITDA
EBITDA isand Adjusted EBITDA are not a measuremeasures of financial performance under GAAP. We define EBITDA as net income before interest expense, provision for income taxes, depreciation and amortization. We define Adjusted EBITDA as EBITDA as adjusted to exclude the effects of certain income and expense items that management believes make it more difficult to assess the Company’s actual operating performance, including certain items that are generally non-recurring, such as impairment charges and store closing costs. The adjustment to EBITDA for the year ended September 30, 2019 related to impairment of long-lived assets charges. The adjustments to EBITDA for the year ended September 30, 2018 related to impairment of long-lived assets charges and store closing costs.
The following table reconciles net income to EBITDA and Adjusted EBITDA, dollars in thousands:
Year ended September 30, | Year ended September 30, | |||||||||||||||||||
2016 | 2015 | 2014 | 2019 | 2018 | ||||||||||||||||
Net income | $ | 11,471 | 16,204 | 13,473 | $ | 9,416 | 12,661 | |||||||||||||
Interest expense | 3,044 | 2,993 | 2,496 | |||||||||||||||||
Provision for income taxes | 5,864 | 9,432 | 8,281 | |||||||||||||||||
Interest expense, net | 4,952 | 4,560 | ||||||||||||||||||
Provision for (benefit from) income taxes | 2,398 | (2,168 | ) | |||||||||||||||||
Depreciation and amortization | 25,533 | 21,337 | 17,212 | 28,977 | 29,430 | |||||||||||||||
EBITDA | $ | 45,912 | 49,966 | 41,462 | 45,743 | 44,483 | ||||||||||||||
Impairment of long-lived assets and store closing costs | 380 | 585 | ||||||||||||||||||
Adjusted EBITDA | $ | 46,123 | 45,068 | |||||||||||||||||
Year ended September 30, 2019 compared to Year ended September 30, 2018
EBITDA decreased 8.1%increased 2.8% to $45.9$45.7 million in the year ended September 30, 20162019 compared to $50.0$44.5 million in the year ended September 30, 2015.2018. EBITDA as a percentage of sales was 6.5%5.1% and 8.0%5.2% for the years ended September 30, 20162019 and 2015,2018, respectively. The stores with leases that are classified as capital and financing lease obligations, rather than being reflected as operating leases, increased EBITDA as a percentage of sales by approximately 55 and 60 basis points, respectively, for the years ended September 30, 20162019 and 20152018 by approximately 60 and 55 basis points, respectively, due to the impact on cost of goods sold and occupancy costs as discussed above, as well as occupancy costs that would have been included in pre-opening expenses prior to the stores’ opening date if these leases had been accounted for as operating leases.
Adjusted EBITDA increased 20.5%2.3% to $50.0$46.1 million in the year ended September 30, 20152019 compared to $41.5$45.1 million in the year ended September 30, 2014. EBITDA as a percent of sales was 8.0% for each of the years ended September 30, 2015 and 2014, respectively. The stores with leases that are classified as capital and financing lease obligations, rather than being reflected as operating leases, increased2018. Adjusted EBITDA as a percentage of sales by approximately 60 basis pointswas 5.1% and 5.3% for each of the years ended September 30, 20152019 and 2014 due2018, respectively.
Year ended September 30, 2018 compared to Year ended September 30, 2017
A comparative discussion of EBITDA and Adjusted EBITDA for the impactyears ended September 30, 2018 and September 30, 2017 is set out in our Annual Report on costForm 10-K for the year ended September 30, 2018 under the heading “Management’s Discussion and Analysis of goods soldFinancial Condition and occupancy costsResults of Operations – Non-GAAP financial measures – EBITDA and Adjusted EBITDA.”
EBITDA and Adjusted EBITDA as discussed above, as well as occupancy costs that would have been included in pre-opening expenses prior to the stores’ opening date if these leases had been accounted for as operating leases.supplemental measures
Management believes that some investors’ understanding of our performance is enhanced by including EBITDA aand Adjusted EBITDA, non-GAAP financial measure.measures. We believe EBITDA providesand Adjusted EBITDA provide additional information about: (i) our operating performance, because it assists us in comparing the operating performance of our stores on a consistent basis, as it removes the impact of non-cash depreciation and amortization expense as well as items not directly resulting from our core operations such as interest expense and income taxes and (ii) our performance and the effectiveness of our operational strategies. Additionally, EBITDA is a component of a measure in our financial covenants under theour Credit Facility. Further, our incentive compensation plans base incentive compensation payments on EBITDA.
Furthermore, management believes some investors use EBITDA and Adjusted EBITDA as a supplemental measuremeasures to evaluate the overall operating performance of companies in our industry. Management believes that some investors’ understanding of our performance is enhanced by including thisthese non-GAAP financial measuremeasures as a reasonable basis for comparing our ongoing results of operations. By providing thisthese non-GAAP financial measure,measures, together with a reconciliation from net income, we believe we are enhancing analysts’ and investors’ understanding of our business and our results of operations, as well as assisting analysts and investors in evaluating how well we are executing our strategic initiatives.
Our competitors may define EBITDA and Adjusted EBITDA differently, and as a result, our measure of EBITDA and Adjusted EBITDA may not be directly comparable to those of other companies. Items excluded from EBITDA are significant components in understanding and assessing financial performance. EBITDA is aand Adjusted EBITDA are supplemental measuremeasures of operating performance that doesdo not represent, and should not be considered in isolation or as an alternative to, or substitute for, net income or other financial statement data presented in the consolidated financial statements as indicators of financial performance. EBITDA hasand Adjusted EBITDA have limitations as an analytical tool, and should not be considered in isolation, or as an alternative to, or as a substitute for, analysis of our results as reported under GAAP.
For additional discussion of our use of EBITDA and Adjusted EBITDA, and some of thetheir limitations, please refer to the “Selected Financial Data” section of this Form 10-K.
Liquidity and Capital Resources
Our ongoing primary sources of liquidity are cash generated from operations, current balances of cash and cash equivalents and borrowings under our Credit Facility. Our primary uses of cash are for purchases of inventory, operating expenses, capital expenditures predominantly in connection with opening, relocating and remodeling stores, debt service and corporate taxes. As of September 30, 2016,2019, we had $4.0$6.2 million in cash and cash equivalents as well as $16.6and $43.3 million available for borrowing under our Credit Facility.
OnIn May 5, 2016, our Board authorized a new two-year share repurchase program pursuant to which the Company may expend up to $10.0 million to repurchase shares of the Company’s common stock.Duringstock. In May 2018, our Board of Directors authorized a two-year extension of the share repurchase program. As a result of such extension, the share repurchase program will terminate on May 4, 2020. We did not repurchase any shares during the year ended September 30, 2016,2019. During the year ended September 30, 2018, we purchased 67,970repurchased 101,573 shares of our common stock for approximately $0.8 million (an average price of $12.20 per share) under the share repurchase program.program for approximately $0.6 million. The dollar value of the shares of the Company’s common stock that may yet be repurchased under the share repurchase program is approximately $8.3 million. We expect funding of share repurchases will come from operating cash flow, excess cash and/or borrowings under the Credit Facility. The timing and the number of shares purchased will be dictated by our capital needs and stock market conditions.
On November 13, 2019, our Board approved the initiation of a quarterly cash dividend per share of common stock. The initial quarterly cash dividend of $0.07 per share of common stock will be paid on December 17, 2019 to stockholders of record as of the close of business on December 2, 2019.
We plan to continue to open new stores, which has previously required and may continue to require us to borrow additional amounts under our Credit Facility in the future. We believe that cash and cash equivalents, together with the cash generated from operations and the borrowing availability under our Credit Facility will be sufficient to meet our working capital needs and planned capital expenditures, including capital expenditures related to new store needs, repayment of debt, stock repurchases and dividends for at least the next twelve12 months. Our working capital position benefits from the fact that we generally collect cash from sales to customers the same day or, in the case of credit or debit card transactions, within days from the related sale.
The following is a summary of our operating, investing and financing activities for the periods presented, dollars in thousands:
Year ended September30, | Year ended September 30, | |||||||||||||||||||
2016 | 2015 | 2014 | 2019 | 2018 | ||||||||||||||||
Net cash provided by operating activities | $ | 28,827 | 41,003 | 31,749 | $ | 37,382 | 42,863 | |||||||||||||
Net cash used in investing activities | (53,740 | ) | (42,338 | ) | (34,872 | ) | (31,865 | ) | (23,543 | ) | ||||||||||
Net cash provided by (used in) financing activities | 26,015 | (863 | ) | 104 | ||||||||||||||||
Net increase (decrease) in cash and cash equivalents | 1,102 | (2,198 | ) | (3,019 | ) | |||||||||||||||
Net cash used in financing activities | (8,701 | ) | (16,443 | ) | ||||||||||||||||
Net (decrease) increase in cash and cash equivalents | (3,184 | ) | 2,877 | |||||||||||||||||
Cash and cash equivalents, beginning of year | 2,915 | 5,113 | 8,132 | 9,398 | 6,521 | |||||||||||||||
Cash and cash equivalents, end of year | $ | 4,017 | 2,915 | 5,113 | $ | 6,214 | 9,398 | |||||||||||||
Year ended September 30, 2019 compared to Year ended September 30, 2018
Operating Activities
Net cash provided by operating activities consists primarily of net income adjusted for non-cash items, including depreciation and amortization and changes in deferred taxes, and the effect of working capital changes. CashNet cash provided by operating activities decreased $12.2$5.5 million, or 29.7%12.8%, to $28.8$37.4 million in the year ended September 30, 2016,2019, from $41.0$42.9 million in the year ended September 30, 2015.2018. The decrease in cash provided by operating activities was primarily due to a decrease in cash provided by working capital and, to a lesser extent, a decrease in net income as adjusted for non-cash items such as depreciation and amortization resulting from the addition of new stores and deferred tax expense as well as changes in working capital driven by the timing of payment on inventory and other purchases.items. Our working capital requirements for inventory will likely continue to increase as we continue to open new stores.
Cash provided by operating activities increased $9.3 million, or 29.1%, to $41.0 million in the year ended September 30, 2015, from $31.7 million in the year ended September 30, 2014. The increase in cash provided by operating activities was primarily due to an increase in net income, as adjusted for depreciation and amortization resulting from the addition of new stores, offset by changes in working capital driven by the timing of payment on inventory and other purchases. Our working capital requirements for inventory will likely continue to increase as we continue to open new stores.
Investing Activities
Net cash used in investing activities consists primarily of capital expenditures. Net cash used in investing activities increased $11.4$8.3 million, or 26.9%35.3%, to $53.7$31.9 million in the year ended September 30, 20162019 compared to $42.3$23.5 million in the year ended September 30, 2015 due to the increased number and timing of new store openings, relocations and remodels, partially offset by a decrease in the payment for the Store Acquisition described below.2018. Cash paid for capital expenditures increased $17.0$9.0 million in the year ended September 30, 20162019 compared to the year ended September 30, 2015,2018, driven by the number and the timing of new store openings.openings and store relocations and the purchase of three additional store properties.
During the year ended September 30, 2016,2019, we opened 23six new stores and relocated fourfive stores, compared to opening eight new stores and remodeled one store.relocating three stores during the year ended September 30, 2018. We plan to spend approximately $40.0$28 million to $48.0$33 million on capital expenditures during fiscal year 20172020 in connection with the opening of 15five to 20six planned new stores and threeone to two store relocations. We anticipate that our new stores will require, on average, an upfront capital investment of approximately $2.2$2.1 million per store.
Acquisition of property and equipment not yet paid increased $0.4$1.0 million to $6.8$6.3 million in fiscal year 20162019 compared to $6.4$5.2 million in fiscal year 20152018 due to the timing of payments related to new store openings and relocations. We opened eight new stores in the fourth quarter of fiscal year 2016 compared to opening four new stores in the fourth quarter of fiscal year 2015.
In 2015, net cash used in investing activities consisted primarily of capital expenditures. Cash used in investing activities increased $7.5 million, or 21.4%, to $42.3 million in the year ended September 30, 2015 compared to $34.9 million in the year ended September 30, 2014 due to the Company’s purchase of substantially all the assets and assumption of certain liabilities of natural foods retailer Nature’s Pantry, Inc. (the Store Acquisition), which operated one retail store in Independence, Missouri. We paid $5.6 million during the year ended September 30, 2015 related to the Store Acquisition. Cash paid for capital expenditures increased $0.2 million in the year ended September 30, 2015 compared to the year ended September 30, 2014, driven by the number and the timing of new store openings.Financing Activities
Financing Activities
Cash provided by orNet cash used in financing activities consists primarily of borrowings and repayments under our Credit Facility and the Prior Credit Facility and payments of capital and financing lease obligations. Cash provided byNet cash used in financing activities was $26.0$8.7 million for the year ended September 30, 2016,2019 compared to cash used in financing activities of $0.9$16.4 million infor the year ended September 30, 2015.2018. The increasedecrease in cash provided byused in financing activities for the year ended September 30, 20162019 was primarily due to net borrowingsincremental repayments of $27.4$7.5 million under our Credit Facility during the year ended September 30, 2016.2019 compared to net incremental repayments of $15.2 million during the year ended September 30, 2018.
Cash used inYear ended September 30, 2018 compared to Year ended September 30, 2017
A comparative discussion of operating, investing and financing activities was $0.9 millionfor the years ended September 30, 2018 and September 30, 2017 is set out in our Annual Report on Form 10-K for the year ended September 30, 2015, compared to cash provided by financing activities2018 under the heading “Management’s Discussion and Analysis of $0.1 million in the year ended September 30, 2014. The decrease in cash provided by financing activities for the year ended September 30, 2015 was primarily due to the paymentFinancial Condition and Results of $0.5 million of contingent consideration related to the Store AcquisitionOperations – Liquidity and a $0.4 million decrease in the excess tax benefit from share-based compensation.Capital Resources.”
Credit Facility
On January 28, 2016, the Company entered intoThe amount available for borrowing under the Credit Facility.Facility is $50.0 million, including a $5.0 million sublimit for standby letters of credit. The operating company is the borrower under the Credit Facility and its obligations under the Credit Facility are guaranteed by the holding company and Vitamin Cottage Two Ltd. Liability Company (VC2). The Credit Facility is secured by a lien on substantially all of the Company’s assets.
The amount originally available for borrowing under the Credit Facility was $30.0 million, including a $5.0 million sublimit for standby letters of credit. On May 10, 2016, the operating company entered into an amendment to the Credit Facility, pursuant to which the amount available for borrowing thereunder was increased to $45.0 million, including a $5.0 million sublimit for standby letters of credit. The Company has the ability to increase the amount available for borrowing by an additional amount that may not exceed $5.0 million if the existing lenders or other eligible lenders agree to provide an additional commitment or commitments. The Company has the right to borrow, prepay and re-borrow amounts under the Credit Facility at any time prior to the maturity date. The Credit Facility matures on January 31, 2021.November 13, 2024.
For floating rate borrowings under the Credit Facility, interest is determined by the lender’s administrative agent based on the most recent compliance certificate of the operating company and stated at the base rate less the lender spread based upon certain financial measures. For fixed rate borrowings under the Credit Facility, interest is determined by quoted LIBOR rates for the interest period plus the lender spread based upon certain financial measures. The unused commitment fee is based upon certain financial measures.
The Credit Facility requires compliance with certain customary operational and financial covenants, including a leverage ratio. The Credit Facility also contains certain other customary limitations on the Company’s ability to incur additional debt, guarantee other obligations, grant liens on assets and make investments or acquisitions, among other limitations. Additionally, the Credit Facility prohibits the payment of cash dividends exceptto the holding company from the operating company, provided that so long as no default exists or would arise as a result thereof, the operating company may pay cash dividends to the holding company forin an amount sufficient to allow the holding company to: (i) pay various audit, accounting, tax, securities, indemnification, reimbursement, insurance and other reasonable expenses incurred in the ordinary course of business and for repurchases of(ii) repurchase shares of common stock and pay dividends on our common stock in an aggregate amount not to exceed $10.0 million.million during any fiscal year.
At the same time it entered into the Credit Facility, the Company terminated the Prior Credit Facility.
We had $27.4$5.7 and $13.2 million outstanding under the Credit Facility as of September 30, 20162019 and zero outstanding under the Prior Credit Facility asSeptember 30, 2018, respectively. As of each of September 30, 2015. As of2019 and September 30, 2016,2018, we had undrawn, issued and outstanding letters of credit of $1.0 million, which were reserved against the amount available for borrowing under the terms of the Credit Facility. As of September 30, 2015, we had undrawn, issued and outstanding letters of credit of $1.0 million, which were reserved against the amount available for borrowing under the terms of the Prior Credit Facility. We had $16.6$43.3 and $35.8 million available for borrowing under the Credit Facility as of September 30, 20162019 and $14.0 million available for borrowing under the Prior Credit Facility as of September 30, 2015.2018, respectively.
As of each of September 30, 2016,2019 and September 30, 2018, the Company was in compliance with the debt covenants under the Credit Facility. As of September 30, 2015, the Company was in compliance with the debt covenants under the Prior Credit Facility.
Contractual Obligations
The following table summarizes our contractual obligations as of September 30, 2016, dollars in thousands:
Payments Due byPeriod | ||||||||||||||||||||
Total | Less than | 1–3years | 3-5years | More than | ||||||||||||||||
Operating leases(1) | $ | 504,576 | 36,138 | 78,021 | 74,345 | 316,072 | ||||||||||||||
Capital and financing lease obligations, including principal and interest payments(2) | 48,207 | 3,933 | 7,990 | 8,061 | 28,223 | |||||||||||||||
Debt obligations(3) | 27,428 | ─ | ─ | 27,428 | ─ | |||||||||||||||
Interest payments(4) | 1,845 | 425 | 850 | 570 | ─ | |||||||||||||||
Contractual obligations for construction related activities(5) | 4,532 | 4,532 | ─ | ─ | ─ | |||||||||||||||
| $ | 586,588 | 45,028 | 86,861 | 110,404 | 344,295 | |||||||||||||||
|
|
|
|
|
|
|
|
|
|
Off-Balance Sheet Arrangements
As of September 30, 2016,2019, our off-balance sheet arrangements consisted of operating leases and the undrawn portion of our Credit Facility. The majority of our stores and facilities are leased, with varying terms and renewal options. Currently, we own buildings in which three of our stores are located; those buildings are located on land that is leased pursuant to a ground lease.AsAs of September 30, 2016, 162019, 23 store leases were classified as capital and financing lease obligations, and the remaining leases were classified as operating leases in our consolidated financial statements. We have no other off-balance sheet arrangements that have had, or are reasonably likely to have, a material effect on our consolidated financial statements or financial condition.
Recent Accounting Pronouncements
In March 2016, the Financial Accounting Standards Board (FASB) issued Accounting Standards Update (ASU) 2016-09, “Improvements to Employee Share-Based Payment Accounting,” Topic 718, “Compensation-Stock Compensation” (ASU 2016-09). ASU 2016-09 includes provisions intended to simplify various aspects related to how share-based payments are accounted for and presented in the financial statements. The main provision requires all excess tax benefits and tax deficiencies to be recognized as income tax benefit or expense in the statement
In February 2016, the FASB issued ASU 2016-02, “Leases,” Topic 842, “Leases” (ASU 2016-02). ASU 2016-02 intends to improve financial reporting about leasing transactions. The ASU will require organizations that lease assets to recognize on the balance sheet assetsRecent Accounting Pronouncements
For a description of new applicable accounting pronouncements, including those recently adopted, see Note 2, Basis of Presentation and liabilities for the rights and obligations created by those leases. For income statement purposes, the FASB retained a dual model, requiring leases to be classified as either operating or capital. Operating leases will result in straight-line expense while capital leases will result in a front-loaded expense pattern. Classification will be based on criteria that are largely similar to those applied in current lease accounting, but without explicit bright lines. The amendments also require certain quantitative and qualitative disclosures. ASU 2016-02 is effective for fiscal years beginning after December 15, 2018 and interim periods within those years. The provisionsSummary of ASU 2016-02 are effective for the Company’s first quarterSignificant Accounting Policies, of the fiscal year ending September 30, 2020. Early adoption is permitted. The new standard must be adopted using a modified retrospective transition,Notes to Consolidated Financial Statements, included in Item 8, Financial Statements and provides for certain practical expedients. Transition will require applicationSupplementary Data, of the new guidance at the beginning of the earliest comparative period presented. The Company is currently evaluating the impact that the adoption of ASU 2016-02 will havethis Annual Report on its consolidated financial statements but expects it to have a significant impact on its balance sheet due to the number of operating leases to which the Company is a party.Form 10-K.
In November 2015, the FASB issued Accounting Standards Update 2015-17, “Income Taxes,” Topic 740, “Income Taxes” (ASU 2015-17). ASU 2015-17 addresses the balance sheet classification of deferred taxes. The amendments in ASU 2015-17 require that deferred tax liabilities and assets be classified as noncurrent in a classified statement of financial position. The Company elected early adoption of the provisions of ASU 2015-17 prospectively for the periods ended March 31, 2016 and thereafter and has presented its deferred tax liabilities and assets as noncurrent in its consolidated financial statements as of March 31, 2016 and periods ended thereafter.
In July 2015, the FASB issued ASU 2015-11, “Simplifying the Measurement of Inventory,” Topic 330, “Inventory” (ASU 2015-11). The amendments in ASU 2015-11, which apply to inventory that is measured using any method other than the last-in, first-out (LIFO) or retail inventory method, require that entities measure inventory at the lower of cost and net realizable value. The amendments in ASU 2015-11 should be applied on a prospective basis. ASU 2015-11 is effective for fiscal years beginning after December 15, 2016 and interim periods within those years. The provisions of ASU 2015-11 are effective for the Company’s first quarter of the fiscal year ending September 30, 2018. The Company does not expect the adoption of these provisions to have a significant impact on the Company’s consolidated financial statements.
In April 2015, the FASB issued ASU 2015-05, “Customer’s Accounting for Fees Paid in a Cloud Computing Arrangement,” Subtopic 350-40, “Intangibles-Goodwill and Other – Internal-Use Software” (ASU 2015-05). ASU 2015-05 provides guidance as to whether a cloud computing arrangement (such as software as a service, platform as a service, infrastructure as a service, and other similar hosting arrangements) includes a software license and, based on that determination, how to account for such arrangements. The amendments in ASU 2015-05 may be applied on either a prospective or retrospective basis and early adoption is permitted. ASU 2015-05 is effective for fiscal years beginning after December 15, 2015and interim periods within those fiscal years. The provisions ofASU 2015-05 are effective for the Company’s first quarter of the fiscal year ending September 30, 2017. The Company does not expect the adoption of these provisions to have a significant impact on the Company’s consolidated financial statements.
In May 2014, the FASB issued ASU 2014-09, “Revenue from Contracts with Customers,” Topic 606, “Revenue from Contracts with Customers” (ASU 2014-09). ASU 2014-09 provides guidance for revenue recognition and will replace most existing revenue recognition guidance in GAAP when it becomes effective. ASU 2014-09’s core principle is that a company will recognize revenue when it transfers promised goods or services to customers in an amount that reflects the consideration to which the company expects to be entitled for the transfer of those goods or services. ASU 2014-09 permits the use of either the retrospective or cumulative effect transition method. In July 2015, the FASB issued ASU 2015-14, “Revenue from Contracts with Customers – Deferral of the Effective Date.” The FASB approved the deferral of ASU 2014-09, by extending the new revenue recognition standard’s mandatory effective date by one year and permitting public companies to apply the new revenue standard to annual reporting periods beginning after December 15, 2017. However, earlier adoption is permitted only for annual reporting periods beginning after December 15, 2016. The guidance in ASU 2014-09 will be effective for the Company in the first quarter of the fiscal year ending September 30, 2019. The Company is currently evaluating the impact that the adoption of ASU 2014-09 will have on its consolidated financial statements.
Critical Accounting Policies
The preparation of our consolidated financial statements in conformity with GAAP requires us to make estimates and assumptions that affect the reported amounts of assets, liabilities, revenues, expenses and related disclosures of contingent assets and liabilities. Actual amounts may differ from these estimates. We base our estimates on historical experience and on various other assumptions and factors that we believe to be reasonable under the circumstances. We evaluate our accounting policies and resulting estimates on an ongoing basis to make adjustments we consider appropriate under the facts and circumstances.
We have chosen accounting policies that we believe are appropriate to report accurately and fairly our operating results and financial position, and we apply those accounting policies in a consistent manner. Refer to our consolidated financial statements and related notes for a summary of our significant accounting policies. We believe that the following accounting policies are the most critical in the preparation of our consolidated financial statements because they involve the most difficult, subjective or complex judgments about the effect of matters that are inherently uncertain.
Income Taxes
We account for income taxes using the asset and liability method. This method requires recognition of deferred tax assets and liabilities for expected future tax consequences of temporary differences that currently exist between the tax basis and financial reporting basis of our assets and liabilities. Deferred tax assets and liabilities are measured using enacted tax rates in the respective jurisdictions in which we operate. We consider the need to establish valuation allowances to reduce deferred income tax assets to the amounts that we believe are more likely than not to be recovered.
We recognize the effect of income tax positions only if those positions are more likely than not of being sustained by the relevant taxing authority. Recognized income tax positions are measured at the largest amount that is greater than 50% likely of being realized. Changes in recognition or measurement are reflected in the period in which the change in judgment occurs.
Significant accounting judgment is required in determining the provision for income taxes and related accruals, deferred tax assets and liabilities. In the ordinary course of business, there are transactions and calculations where the ultimate tax outcome is uncertain. In addition, we are subject to periodic audits and examinations by the IRS and other state and local taxing authorities. Although we believe that our estimates are reasonable, actual results could differ from these estimates.
To the extent we prevail in matters for which reserves have been established, or are required to pay amounts in excess of our reserves, our effective income tax rate in a given financial statement period could be materially affected. An unfavorable tax settlement would require the use of our cash and would result in an increase in our effective income tax rate in the period of resolution. A favorable tax settlement would be recognized as a reduction in our effective income tax rate in the period of resolution.
Goodwill and Intangible Assets
We assess our goodwill and intangible assets primarily consisting of trademarks, favorable operating leases and covenants-not-to-compete at least annually. The Company’s annual impairment testing of goodwill is performed as of September 30.July 1. In performing the Company’s analysis of goodwill, the Company first evaluates qualitative factors, including relevant events and circumstances, to determine whether it is more likely than not that the fair value of a reporting unit is less than its carrying amount. If it is not more likely than not that the fair value of a reporting unit is less than its carrying amount, the two-step impairment test is not necessary. If it is determined that it is more likely than not that the fair value of a reporting unit is less than its carrying amount, then the Company performs the two-step impairment test. There are significant judgments and estimates within the processes; it is therefore possible that materially different amounts could be recorded if we used different assumptions or if the underlying circumstances were to change.
Impairment of Long-Lived Assets and Store Closing Costs
We assess our long-lived assets, principally property and equipment, for possible impairment at least annually, or whenever events or changes in circumstances indicate the carrying amount of an asset may not be recoverable. Recoverability is measured by a comparison of the carrying amount of the assets to the future undiscounted cash flows expected to be generated by the assets. We aggregate long-lived assets at the store level which we consider to be the lowest level in the organization for which independent identifiable cash flows are available. If the carrying value of the long-lived asset or asset group is not recoverable on an undiscounted cash flow basis, impairment is recognized to the extent the carrying value exceeds its fair value.
Our judgment regarding events or changes in circumstances that indicate an asset’s carrying value may not be recoverable is based on several factors such as historical and forecasted operating results, significant industry trends and other economic factors. Further, determining whether an impairment exists requires that we use estimates and assumptions in calculating the future undiscounted cash flows expected to be generated by the assets. These estimates and assumptions look several years into the future and include assumptions on future store revenue growth, potential impact of operational changes, competitive factors, inflation and the economy. Application of alternative assumptions could produce materially different results.
If the Company commits to a plan to dispose of a long-lived asset before the end of its previously estimated useful life, estimated cash flows are revised accordingly, and the Company may be required to record an asset impairment write-down. Additionally, related liabilities arise, such as severance, contractual obligations and other accruals associated with store closings from decisions to dispose of assets. The Company estimates these liabilities based on the facts and circumstances in existence for each restructuring decision. The amounts the Company will ultimately realize or disburse could differ from the amounts assumed in arriving at the asset impairment and restructuring charge recorded.
Leases
We lease retail stores, a bulk food repackaging facility and distribution center, land and administrative offices under long-term operating leases, capital financing leases or capital leases. Accounting for leased properties requires compliance with technical accounting rules and significant judgment by management. Application of these accounting rules and assumptions made by management will determine whether the lease is accounted for as an operating lease, whether we are considered the owner for accounting purposes or whether the lease is accounted for as a capital lease.
If the lease is classified as an operating lease, it is not recognized on our consolidated balance sheet, and rent expense, including rent holidays and escalating payment terms, is recognized on a straight-line basis over the expected lease term.
If we are determined to be the owner for accounting purposes, we record the fair market value of the leased asset and a related capital lease finance obligation on our consolidated balance sheet. The leased asset is then depreciated over the estimated useful life of the asset. Rent payments for these properties are not recorded as rent expense, but rather are recognized as a reduction of the capital lease finance obligation and as interest expense.
If the lease is classified as a capital lease, we record the present value of the minimum lease payments and a related capital lease obligation on our consolidated balance sheet. The asset is then depreciated over the expected lease term. Rent payments for these properties are not recorded as rent expense, but rather are recognized as a reduction of the capital lease obligation and as interest expense.
Significant accounting judgment and assumptions are required in determining the accounting for leases, including:
● | fair market value of the leased asset, which is generally estimated based on project costs or comparable market data. Fair market value is used as a factor in determining whether the lease is accounted for as an operating or capital lease, and is used for recording the leased asset when we are determined to be the owner for accounting purposes; |
● | minimum lease term that includes contractual lease periods, and may also include the exercise of renewal options if the exercise of the option is determined to be reasonably assured or where failure to exercise such options would result in an economic penalty. The minimum lease term is used as a factor in determining whether the lease is accounted for as an operating lease or a capital lease and in determining the period over which to depreciate the capital lease asset; and |
● | incremental borrowing rate which is estimated based on treasury rates for debt with maturities comparable to the minimum lease term and our credit spread and other premiums. The incremental borrowing rate is used as a factor in determining the present value of the minimum lease payments which is then used in determining whether the lease is accounted for as an operating lease or capital lease, as well as for allocating our rental payments on capital leases between interest expense and a reduction of the outstanding obligation. |
Item 7A. Quantitativeand Qualitative Disclosures about Market RiskRisk..
We are exposed to interest rate changes of our long-term debt. We do not use financial instruments for trading or other speculative purposes.
Interest Rate Risk
Our principal exposure to market risk relates to changes in interest rates with respect to our Credit Facility. As of September 30, 2016, $27.42019, $5.7 million was outstanding under our Credit Facility. Our Credit Facility carries floating interest rates that are tied to the prime rate, and therefore, our statements of income and our cash flows are exposed to changes in interest rates. Based upon a sensitivity analysis at September 30, 2016,2019, a hypothetical 100 basis point change in interest rates would change our annual interest expense by $0.2 million in the year ended September 30, 2016.2019.
Item 8. FinancialStatements and Supplementary Data.
NaturalNatural Grocers by Vitamin Cottage,Inc.
Index to Consolidated Financial Statements
Page | |
|
|
Consolidated Balance Sheets as of September 30, |
|
| |
| |
| |
|
Report of IndependentRegistered Public Accounting Firm
TheTo the Stockholders and Board of Directors and Stockholders
Natural Grocers by Vitamin Cottage, Inc.:
Opinion on the Consolidated Financial Statements
We have audited the accompanying consolidated balance sheets of Natural Grocers by Vitamin Cottage, Inc. and subsidiaries (the Company) as of September 30, 20162019 and 2015, and2018, the related consolidated statements of income, cash flows, and changes in stockholders’ equity for each of the years in the three-year period ended September 30, 2016. 2019, and the related notes (collectively, the consolidated financial statements). In our opinion, the consolidated financial statements present fairly, in all material respects, the financial position of the Company as of September 30, 2019 and 2018, and the results of its operations and its cash flows for each of the years in the three-year period ended September 30, 2019, in conformity with U.S. generally accepted accounting principles.
We also have audited, in accordance with the standards of the Public Company Accounting Oversight Board (United States) (PCAOB), the Company’s internal control over financial reporting as of September 30, 2019, based on criteria established in Internal Control – Integrated Framework (2013) issued by the Committee of Sponsoring Organizations of the Treadway Commission, and our report dated December 5, 2019, expressed an unqualified opinion on the effectiveness of the Company’s internal control over financial reporting.
Change in Accounting Principle
As discussed in Note 2 to the consolidated financial statements, the Company has changed its method of accounting for revenue as of October 1, 2018 due to the adoption of ASU 2014-09, Revenue from Contracts with Customers.
Basis for Opinion
These consolidated financial statements are the responsibility of the Company’s management. Our responsibility is to express an opinion on these consolidated financial statements based on our audits. We are a public accounting firm registered with the PCAOB and are required to be independent with respect to the Company in accordance with the U.S. federal securities laws and the applicable rules and regulations of the Securities and Exchange Commission and the PCAOB.
We conducted our audits in accordance with the standards of the Public Company Accounting Oversight Board (United States).PCAOB. Those standards require that we plan and perform the audit to obtain reasonable assurance about whether the consolidated financial statements are free of material misstatement. An audit includesmisstatement, whether due to error or fraud. Our audits included performing procedures to assess the risks of material misstatement of the consolidatedfinancial statements, whether due to error or fraud, and performing procedures that respond to those risks. Such procedures included examining, on a test basis, evidence supportingregarding the amounts and disclosures in the consolidated financial statements. An auditOur audits also includes assessingincluded evaluating the accounting principles used and significant estimates made by management, as well as evaluating the overall presentation of the consolidated financial statement presentation.statements. We believe that our audits provide a reasonable basis for our opinion.
In our opinion,/s/ KPMG LLP
We have served as the consolidated financial statements referred to above present fairly, in all material respects,Company’s auditor since 2010.
Denver, Colorado
December 5, 2019
Report of Independent Registered Public Accounting Firm
To the financial positionStockholders and Board of Directors
Natural Grocers by Vitamin Cottage, Inc.:
Opinion on Internal Control Over Financial Reporting
We have audited Natural Grocers by Vitamin Cottage, Inc. and subsidiariessubsidiaries’ (the Company) internal control over financial reporting as of September 30, 20162019, based on criteria established in Internal Control – Integrated Framework (2013) issued by the Committee of Sponsoring Organizations of the Treadway Commission. In our opinion, the Company maintained, in all material respects, effective internal control over financial reporting as of September 30, 2019, based on criteria established in Internal Control – Integrated Framework (2013) issued by the Committee of Sponsoring Organizations of the Treadway Commission.
We also have audited, in accordance with the standards of the Public Company Accounting Oversight Board (United States) (PCAOB), the consolidated balance sheets of the Company as of September 30, 2019 and 2015,2018, the related consolidated statements of income, cash flows, and the results of their operations and their cash flowschanges in stockholders’ equity for each of the years in the three-year period ended September 30, 2016,2019, and the related notes (collectively, the consolidated financial statements), and our report dated December 5, 2019 expressed an unqualified opinion on those consolidated financial statements.
Basis for Opinion
The Company’s management is responsible for maintaining effective internal control over financial reporting and for its assessment of the effectiveness of internal control over financial reporting, included in conformitythe accompanying Internal Control Over Financial Reporting. Our responsibility is to express an opinion on the Company’s internal control over financial reporting based on our audit. We are a public accounting firm registered with the PCAOB and are required to be independent with respect to the Company in accordance with the U.S. federal securities laws and the applicable rules and regulations of the Securities and Exchange Commission and the PCAOB.
We conducted our audit in accordance with the standards of the PCAOB. Those standards require that we plan and perform the audit to obtain reasonable assurance about whether effective internal control over financial reporting was maintained in all material respects. Our audit of internal control over financial reporting included obtaining an understanding of internal control over financial reporting, assessing the risk that a material weakness exists, and testing and evaluating the design and operating effectiveness of internal control based on the assessed risk. Our audit also included performing such other procedures as we considered necessary in the circumstances. We believe that our audit provides a reasonable basis for our opinion.
Definition and Limitations of Internal Control Over Financial Reporting
A company’s internal control over financial reporting is a process designed to provide reasonable assurance regarding the reliability of financial reporting and the preparation of financial statements for external purposes in accordance with generally accepted accounting principles. A company’s internal control over financial reporting includes those policies and procedures that (1) pertain to the maintenance of records that, in reasonable detail, accurately and fairly reflect the transactions and dispositions of the assets of the company; (2) provide reasonable assurance that transactions are recorded as necessary to permit preparation of financial statements in accordance with generally accepted accounting principles, and that receipts and expenditures of the company are being made only in accordance with authorizations of management and directors of the company; and (3) provide reasonable assurance regarding prevention or timely detection of unauthorized acquisition, use, or disposition of the company’s assets that could have a material effect on the financial statements.
Because of its inherent limitations, internal control over financial reporting may not prevent or detect misstatements. Also, projections of any evaluation of effectiveness to future periods are subject to the risk that controls may become inadequate because of changes in conditions, or that the degree of compliance with the policies or procedures may deteriorate.
/s/ KPMG LLP
Denver, Colorado
December 8, 20165, 2019
NATURAL GROCERS BY VITAMIN COTTAGE,INC.
ConsolidatedConsolidated Balance Sheets
(Dollars in thousands, except per share data)
September30, | September 30, | |||||||||||||||
2016 | 2015 | 2019 | 2018 | |||||||||||||
Assets | ||||||||||||||||
Current assets: | ||||||||||||||||
Cash and cash equivalents | $ | 4,017 | 2,915 | $ | 6,214 | 9,398 | ||||||||||
Accounts receivable, net | 3,747 | 2,576 | 5,059 | 4,738 | ||||||||||||
Merchandise inventory | 86,330 | 74,818 | 96,179 | 94,228 | ||||||||||||
Prepaid expenses and other current assets | 3,233 | 1,108 | 7,728 | 2,590 | ||||||||||||
Deferred income tax assets | — | 866 | ||||||||||||||
Total current assets | 97,327 | 82,283 | 115,180 | 110,954 | ||||||||||||
Property and equipment, net | 178,297 | 145,219 | 201,635 | 188,768 | ||||||||||||
Other assets: | ||||||||||||||||
Deposits and other assets | 971 | 778 | 1,638 | 1,682 | ||||||||||||
Goodwill and other intangible assets, net | 5,601 | 5,623 | 8,644 | 5,648 | ||||||||||||
Deferred financing costs, net | 50 | 21 | 17 | 31 | ||||||||||||
Total other assets | 6,622 | 6,422 | 10,299 | 7,361 | ||||||||||||
Total assets | $ | 282,246 | 233,924 | $ | 327,114 | 307,083 | ||||||||||
Liabilities and Stockholders’ Equity | ||||||||||||||||
Current liabilities: | ||||||||||||||||
Accounts payable | $ | 53,615 | 49,896 | $ | 63,162 | 61,104 | ||||||||||
Accrued expenses | 12,448 | 19,649 | 19,061 | 17,851 | ||||||||||||
Capital and financing lease obligations, current portion | 478 | 333 | 1,045 | 736 | ||||||||||||
Total current liabilities | 66,541 | 69,878 | 83,268 | 79,691 | ||||||||||||
Long-term liabilities: | ||||||||||||||||
Capital and financing lease obligations, net of current portion | 31,429 | 27,274 | 51,475 | 40,406 | ||||||||||||
Revolving credit facility | 27,428 | — | 5,692 | 13,192 | ||||||||||||
Deferred income tax liabilities | 12,178 | 6,073 | ||||||||||||||
Deferred income tax liabilities, net | 10,420 | 6,447 | ||||||||||||||
Deferred compensation | 757 | 314 | — | 688 | ||||||||||||
Deferred rent | 8,809 | 6,922 | 11,393 | 11,038 | ||||||||||||
Leasehold incentives | 8,379 | 7,975 | 7,960 | 8,895 | ||||||||||||
Total long-term liabilities | 88,980 | 48,558 | 86,940 | 80,666 | ||||||||||||
Total liabilities | 155,521 | 118,436 | 170,208 | 160,357 | ||||||||||||
Commitments (Notes 10 and 17) | ||||||||||||||||
Commitments (Notes 11 and 18) | ||||||||||||||||
Stockholders’ equity: | ||||||||||||||||
Common stock, $0.001 par value. 50,000,000 shares authorized,22,510,279 and 22,496,628 shares issued, at 2016 and 2015, respectively and22,452,609 and 22,496,628 outstanding, at 2016 and 2015, respectively | 23 | 22 | ||||||||||||||
Common stock, $0.001 par value. 50,000,000 shares authorized, 22,510,279 shares issued at 2019 and 2018, and 22,463,057 and 22,373,382 outstanding at 2019 and 2018, respectively | 23 | 23 | ||||||||||||||
Additional paid-in capital | 55,437 | 54,982 | 56,319 | 56,236 | ||||||||||||
Retained earnings | 71,955 | 60,484 | 100,923 | 91,507 | ||||||||||||
Common stock in treasury at cost, 57,670 and no shares, at 2016 and 2015, respectively | (690 | ) | — | |||||||||||||
Common stock in treasury at cost, 47,222 and 136,897 shares at 2019 and 2018, respectively | (359 | ) | (1,040 | ) | ||||||||||||
Total stockholders’ equity | 126,725 | 115,488 | 156,906 | 146,726 | ||||||||||||
Total liabilities and stockholders’ equity | $ | 282,246 | 233,924 | $ | 327,114 | 307,083 | ||||||||||
See accompanying notes to consolidated financial statements.
NATURALNATURAL GROCERS BY VITAMIN COTTAGE,INC.
ConsolidatedConsolidated Statements of Income
(Dollars in thousands, except per share data)
Year ended September30, | Year ended September 30, | |||||||||||||||||||||||
2016 | 2015 | 2014 | 2019 | 2018 | 2017 | |||||||||||||||||||
Net sales | $ | 705,499 | 624,678 | 520,674 | $ | 903,582 | 849,042 | 769,030 | ||||||||||||||||
Cost of goods sold and occupancy costs | 503,727 | 442,582 | 369,172 | 664,829 | 623,469 | 556,694 | ||||||||||||||||||
Gross profit | 201,772 | 182,096 | 151,502 | 238,753 | 225,573 | 212,336 | ||||||||||||||||||
Store expenses | 156,158 | 132,131 | 108,657 | 197,792 | 186,741 | 174,350 | ||||||||||||||||||
Administrative expenses | 19,242 | 17,514 | 14,823 | 22,837 | 21,506 | 20,089 | ||||||||||||||||||
Pre-opening and relocation expenses | 5,993 | 3,822 | 3,774 | 1,358 | 2,273 | 3,799 | ||||||||||||||||||
Operating income | 20,379 | 28,629 | 24,248 | 16,766 | 15,053 | 14,098 | ||||||||||||||||||
Other income (expense): | ||||||||||||||||||||||||
Dividends and interest income | — | — | 2 | |||||||||||||||||||||
Interest expense | (3,044 | ) | (2,993 | ) | (2,496 | ) | ||||||||||||||||||
Total other expense, net | (3,044 | ) | (2,993 | ) | (2,494 | ) | ||||||||||||||||||
Interest expense, net | (4,952 | ) | (4,560 | ) | (3,793 | ) | ||||||||||||||||||
Income before income taxes | 17,335 | 25,636 | 21,754 | 11,814 | 10,493 | 10,305 | ||||||||||||||||||
Provision for income taxes | (5,864 | ) | (9,432 | ) | (8,281 | ) | ||||||||||||||||||
(Provision for) benefit from income taxes | (2,398 | ) | 2,168 | (3,414 | ) | |||||||||||||||||||
Net income | 11,471 | 16,204 | 13,473 | $ | 9,416 | 12,661 | 6,891 | |||||||||||||||||
Net income per share of common stock: | ||||||||||||||||||||||||
Basic | $ | 0.51 | 0.72 | 0.60 | $ | 0.42 | 0.57 | 0.31 | ||||||||||||||||
Diluted | $ | 0.51 | 0.72 | 0.60 | $ | 0.42 | 0.56 | 0.31 | ||||||||||||||||
Weighted average number of shares of common stock outstanding: | ||||||||||||||||||||||||
Basic | 22,492,986 | 22,490,260 | 22,466,432 | 22,424,328 | 22,361,898 | 22,453,409 | ||||||||||||||||||
Diluted | 22,507,152 | 22,500,833 | 22,479,835 | 22,554,603 | 22,413,038 | 22,463,675 | ||||||||||||||||||
See accompanying notes to consolidated financial statements.
NATURALNATURAL GROCERS BY VITAMIN COTTAGE,INC.
ConsolidatedConsolidated Statements of Cash Flows
(Dollars in thousands)
Year ended September 30, | Year ended September 30, | |||||||||||||||||||||||
2016 | 2015 | 2014 | 2019 | 2018 | 2017 | |||||||||||||||||||
Operating activities: | ||||||||||||||||||||||||
Net income | $ | 11,471 | 16,204 | 13,473 | $ | 9,416 | 12,661 | 6,891 | ||||||||||||||||
Adjustments to reconcile net income to net cash provided by operating activities: | ||||||||||||||||||||||||
Depreciation and amortization | 25,533 | 21,337 | 17,212 | 28,977 | 29,430 | 29,511 | ||||||||||||||||||
(Gain) loss on disposal of property and equipment | (3 | ) | 56 | 1 | ||||||||||||||||||||
Impairment of long-lived assets and store closing costs | 380 | 585 | — | |||||||||||||||||||||
Gain on disposal of property and equipment | (131 | ) | — | (21 | ) | |||||||||||||||||||
Share-based compensation | 879 | 573 | 532 | 1,185 | 810 | 758 | ||||||||||||||||||
Excess tax benefit from share-based compensation | — | — | (399 | ) | ||||||||||||||||||||
Deferred income tax expense (benefit) | 6,971 | 630 | (1,186 | ) | 3,973 | (5,972 | ) | 241 | ||||||||||||||||
Non-cash interest expense | 13 | 15 | 19 | 13 | 12 | 12 | ||||||||||||||||||
Interest accrued on investments and amortization of premium | — | — | 9 | |||||||||||||||||||||
Changes in operating assets and liabilities | ||||||||||||||||||||||||
(Increase) decrease in: | ||||||||||||||||||||||||
Accounts receivable, net | (1,171 | ) | (430 | ) | 255 | (315 | ) | 145 | (1,100 | ) | ||||||||||||||
Income tax receivable | (1,776 | ) | — | 612 | (5,174 | ) | 943 | 732 | ||||||||||||||||
Merchandise inventory | (11,512 | ) | (15,711 | ) | (12,909 | ) | (1,951 | ) | (615 | ) | (7,282 | ) | ||||||||||||
Prepaid expenses and other assets | (542 | ) | (533 | ) | (665 | ) | 42 | (390 | ) | (1,049 | ) | |||||||||||||
Increase (decrease) in: | ||||||||||||||||||||||||
Accounts payable | 3,314 | 12,891 | 5,202 | 1,024 | 1,845 | 7,224 | ||||||||||||||||||
Accrued expenses | (7,345 | ) | 3,848 | 6,952 | 1,211 | 3,644 | 1,521 | |||||||||||||||||
Deferred compensation | 443 | 314 | — | (688 | ) | (543 | ) | 474 | ||||||||||||||||
Deferred rent and leasehold incentives | 2,552 | 1,809 | 2,641 | (580 | ) | 308 | 2,937 | |||||||||||||||||
Net cash provided by operating activities | 28,827 | 41,003 | 31,749 | 37,382 | 42,863 | 40,849 | ||||||||||||||||||
Investing activities: | ||||||||||||||||||||||||
Acquisition of property and equipment | (53,759 | ) | (36,750 | ) | (36,512 | ) | ||||||||||||||||||
Acquisition of property and equipment (1) | (30,030 | ) | (23,687 | ) | (41,139 | ) | ||||||||||||||||||
Acquisition of other intangibles (1) | (2,703 | ) | (30 | ) | (92 | ) | ||||||||||||||||||
Proceeds from sale of property and equipment | 19 | 13 | — | 836 | 34 | 2,732 | ||||||||||||||||||
Payment for acquisition | — | (5,601 | ) | — | ||||||||||||||||||||
Proceeds from maturity of available-for-sale securities | — | — | 1,140 | |||||||||||||||||||||
Decrease in restricted cash | — | — | 500 | |||||||||||||||||||||
Proceeds from property insurance settlements | 32 | 140 | — | |||||||||||||||||||||
Net cash used in investing activities | (53,740 | ) | (42,338 | ) | (34,872 | ) | (31,865 | ) | (23,543 | ) | (38,499 | ) | ||||||||||||
Financing activities: | ||||||||||||||||||||||||
Borrowings under credit facility | 234,604 | 202,878 | 46,440 | 405,900 | 376,000 | 291,765 | ||||||||||||||||||
Repayments under credit facility | (207,176 | ) | (202,878 | ) | (46,440 | ) | (413,400 | ) | (391,200 | ) | (290,800 | ) | ||||||||||||
Repurchases of common stock | (829 | ) | — | — | — | (581 | ) | (261 | ) | |||||||||||||||
Capital and financing lease obligations payments | (423 | ) | (247 | ) | (182 | ) | (780 | ) | (573 | ) | (479 | ) | ||||||||||||
Contingent consideration payments for acquisition | — | (514 | ) | — | ||||||||||||||||||||
Excess tax benefit from share-based compensation | — | — | 399 | |||||||||||||||||||||
Payments on withholding tax for restricted stock unit vesting | (119 | ) | (102 | ) | (83 | ) | (421 | ) | (89 | ) | (71 | ) | ||||||||||||
Loan fees paid | (42 | ) | — | (30 | ) | |||||||||||||||||||
Net cash provided by (used in) financing activities | 26,015 | (863 | ) | 104 | ||||||||||||||||||||
Net increase (decrease) in cash and cash equivalents | 1,102 | (2,198 | ) | (3,019 | ) | |||||||||||||||||||
Net cash (used in) provided by financing activities | (8,701 | ) | (16,443 | ) | 154 | |||||||||||||||||||
Net (decrease) increase in cash and cash equivalents | (3,184 | ) | 2,877 | 2,504 | ||||||||||||||||||||
Cash and cash equivalents, beginning of year | 2,915 | 5,113 | 8,132 | 9,398 | 6,521 | 4,017 | ||||||||||||||||||
Cash and cash equivalents, end of year | $ | 4,017 | 2,915 | 5,113 | $ | 6,214 | 9,398 | 6,521 | ||||||||||||||||
Supplemental disclosures of cash flow information: | ||||||||||||||||||||||||
Cash paid for interest | $ | 331 | 63 | 16 | $ | 787 | 878 | 739 | ||||||||||||||||
Cash paid for interest on capital and financing lease obligations, net of capitalized interest of $538, $309 and $364, respectively | 2,637 | 2,809 | 2,423 | |||||||||||||||||||||
Cash paid for interest on capital and financing lease obligations, net of capitalized interest of $268, $187 and $482, respectively | 4,148 | 3,611 | 2,972 | |||||||||||||||||||||
Income taxes paid | 6,370 | 8,194 | 3,762 | 4,734 | 1,958 | 2,656 | ||||||||||||||||||
Deferred compensation paid | 700 | 700 | — | |||||||||||||||||||||
Supplemental disclosures of non-cash investing and financing activities: | ||||||||||||||||||||||||
Acquisition of property and equipment not yet paid | $ | 6,837 | 6,429 | 3,260 | $ | 6,289 | 5,254 | 2,843 | ||||||||||||||||
Property acquired through capital and financing lease obligations | 4,438 | 5,772 | 2,300 | |||||||||||||||||||||
Direct bank to bank payment for a change in credit facility provider | 18,858 | — | — | |||||||||||||||||||||
Proceeds from sale of property and equipment not yet received | 6 | 23 | 12 | |||||||||||||||||||||
Property acquired through capital and capital financing lease obligations | 12,156 | 8,285 | 1,499 | |||||||||||||||||||||
(1) Certain prior year amounts have been separated for consistency with current year presentation.
See accompanying notes to consolidated financial statements.
NATURAL GROCERS BY VITAMIN COTTAGE, INC.
Consolidated Statements of Changes in Stockholders’ Equity
Fiscal Years Ended September 30, 2019, 2018 and 2017
(Dollars in thousands, except per share data)
Common stock –$0.001 par | Additional | Total | ||||||||||||||||||||||
value | paid-in | Retained | Treasury | stockholders’ | ||||||||||||||||||||
Shares outstanding | Amount | capital | earnings | stock | equity | |||||||||||||||||||
Balances September 30, 2016 | 22,452,609 | $ | 23 | $ | 55,437 | $ | 71,955 | $ | (690 | ) | $ | 126,725 | ||||||||||||
Net income | — | — | 6,891 | — | 6,891 | |||||||||||||||||||
Share-based compensation | 25,447 | — | 399 | — | 288 | 687 | ||||||||||||||||||
Tax shortfall related to share-based compensation | — | — | (158 | ) | — | — | (158 | ) | ||||||||||||||||
Repurchase of common stock | (30,000 | ) | — | — | — | (262 | ) | (262 | ) | |||||||||||||||
Balances September 30, 2017 | 22,448,056 | 23 | 55,678 | 78,846 | (664 | ) | 133,883 | |||||||||||||||||
Net income | — | — | — | 12,661 | — | 12,661 | ||||||||||||||||||
Share-based compensation | 26,899 | — | 516 | — | 205 | 721 | ||||||||||||||||||
Tax benefit related to share-based compensation | — | — | 42 | — | — | 42 | ||||||||||||||||||
Repurchase of common stock | (101,573 | ) | — | — | — | (581 | ) | (581 | ) | |||||||||||||||
Balances September 30, 2018 | 22,373,382 | 23 | 56,236 | 91,507 | (1,040 | ) | 146,726 | |||||||||||||||||
Net income | — | — | — | 9,416 | — | 9,416 | ||||||||||||||||||
Share-based compensation | 89,675 | — | 83 | — | 681 | 764 | ||||||||||||||||||
Balances September 30, 2019 | 22,463,057 | $ | 23 | $ | 56,319 | $ | 100,923 | $ | (359 | ) | $ | 156,906 | ||||||||||||
See accompanying notes to consolidated financial statements.
NATURAL GROCERS BY VITAMIN COTTAGE,INC.
Consolidated Statements of Changes in Stockholders’ Equity
Fiscal Years Ended September30, 2016, 2015 and 2014
(Dollars in thousands, except per share data)
Commonstock –$0.001 par |
| |||||||||||||||||||||||
value | Additional |
|
| Total | ||||||||||||||||||||
Shares outstanding | Amount | paid-in capital | Retained earnings | Treasury stock | stockholders’ equity | |||||||||||||||||||
Balances September 30, 2013 | 22,441,253 | $ | 22 | $ | 53,704 | $ | 30,807 | $ | — | $ | 84,533 | |||||||||||||
Net income | — | — | — | 13,473 | — | 13,473 | ||||||||||||||||||
Share-based compensation | 44,235 | — | 449 | — | — | 449 | ||||||||||||||||||
Excess tax benefit from share-based compensation | — | — | 399 | — | — | 399 | ||||||||||||||||||
Balances September 30, 2014 | 22,485,488 | 22 | 54,552 | 44,280 | — | 98,854 | ||||||||||||||||||
Net income | — | — | — | 16,204 | — | 16,204 | ||||||||||||||||||
Share-based compensation | 11,140 | — | 471 | — | — | 471 | ||||||||||||||||||
Tax shortfall related to share-based compensation | — | — | (41 | ) | — | — | (41 | ) | ||||||||||||||||
Balances September 30, 2015 | 22,496,628 | 22 | 54,982 | 60,484 | — | 115,488 | ||||||||||||||||||
Net income | — | — | — | 11,471 | — | 11,471 | ||||||||||||||||||
Share-based compensation | 23,951 | 1 | 609 | — | 139 | 749 | ||||||||||||||||||
Tax shortfall related to share-based compensation | — | — | (154 | ) | — | — | (154 | ) | ||||||||||||||||
Repurchase of common stock | (67,970 | ) | — | — | — | (829 | ) | (829 | ) | |||||||||||||||
Balances September 30, 2016 | 22,452,609 | $ | 23 | $ | 55,437 | $ | 71,955 | $ | (690 | ) | $ | 126,725 | ||||||||||||
See accompanying notes to consolidated financial statements.
NATURAL GROCERS BY VITAMIN COTTAGE, INC.
Notes to ConsolidatedFinancial Statements
September30,2016 2019 and2015 2018
1. Organization
1. Organization
Nature of Business
Natural Grocers by Vitamin Cottage, Inc. (Natural Grocers or the holding company) and its consolidated subsidiaries (collectively, the Company) operate retail stores that specialize in natural and organic groceries and dietary supplements. The Company operates its retail stores under its trademarkNatural Grocers by Vitamin Cottage® with 126153 stores as of September 30, 2016,2019, including 3639 stores in Colorado, 1825 in Texas, 13 in Oregon, 12 in Arizona, eight each in Kansas and Oregon, sevenUtah, six each in Iowa and Oklahoma, five each in Missouri and New Mexico, and Utah, four each in Idaho and Montana, three each in Missouri,Arkansas, Nebraska, and Nevada, two each in Arkansas, North Dakota and Washington, andtwo in Wyoming, and one each in Iowa and Minnesota. The Company also has a bulk food repackaging facility and distribution center in Colorado. The Company had 103148 and 87140 stores as of September 30, 20152018 and 2014,2017, respectively.
2. Basis of Presentation and Summary of Significant Accounting Policies
Principles of Consolidation
The accompanying consolidated financial statements include all the accounts of the holding company’s wholly owned subsidiaries, Vitamin Cottage Natural Food Markets, Inc. (the operating company) and Vitamin Cottage Two Ltd. Liability Company (VC2). All significant intercompany balances and transactions have been eliminated in consolidation.
Use of Estimates
The preparation of financial statements in conformity with generally accepted accounting principles in the United States of America (GAAP) requires management to make estimates and assumptions that affect the reported amounts of assets and liabilities, the disclosure of contingent assets and liabilities at the date of the financial statements and the reported amounts of revenues and expenses during the reporting period. Management reviews its estimates on an ongoing basis, including those related to allowances for self-insurance reserves, valuation of inventories, useful lives of property and equipmentlong-lived assets for depreciation and amortization, impairment of finite-lived intangible, long-lived assets, and goodwill, lease assumptions, allowances for self-insurance reserves, deferred tax assets and liabilities and litigation based on currently available information. Changes in facts and circumstances may result in revised estimates and actual results could differ from those estimates.
Segment Information
The Company has one reporting segment, natural and organic retail stores.
Cash and Cash Equivalents
Cash and cash equivalents include currency on hand, demand deposits with banks, money market funds and credit and debit card transactions which typically settle within three business days. The Company considers all highly liquid investments with a remaining maturity of 90 days or less when acquired to be cash equivalents.
Accounts Receivable
Accounts receivable consists primarily of receivables from vendors for certain promotional programs, newslettermagazine advertising and other miscellaneous receivables and are presented net of any allowances for doubtful accounts. Vendor receivable balances are generally presented on a gross basis separate from any related payable due. Allowance for doubtful accounts is calculated based on historical experience and application of the specific identification method. Allowance for doubtful accounts totaled less than $0.1 million as of each of September 30, 20162019 and 2015.2018.
Concentration of Credit Risk
Financial instruments that potentially subject the Company to a concentration of credit risk consist primarily of investments in cash and cash equivalents and accounts receivable.equivalents. The Company’s cash and cash equivalent account balances, which are held in major financial institutions, exceeded the Federal Deposit Insurance Corporation’s federally insured limits by approximately $3.8$5.3 million as of September 30, 2016.2019.
Vendor Concentration
For the years ended September 30, 2016, 20152019 and 2014,2018, purchases from the Company’s largest vendor and its subsidiaries represented approximately 59%, 57%65% and 56%64%, respectively, of all product purchases made during such periods. However, the Company believes that, if necessary, alternate vendors could supply similar products in adequate quantities to avoid material disruptions to operations.
Merchandise Inventory
Merchandise inventory consists of goods held for sale. The cost of inventory includes certain costs associated with the preparation of inventory for sale, including inventory overhead costs. Merchandise inventory is carried at the lower of cost or marketnet realizable value. Cost is determined using the weighted average cost method.
Property and EquipmentLong-Lived Assets
PropertyDepreciable long-lived assets primarily consist of leasehold and equipment isbuilding improvements, which are stated at historical cost less accumulated depreciation. Depreciation is provided using the straight-line method over the useful life of the relevant asset. For land improvements and leasehold and building improvements, depreciation is recorded over the shorter of the assets’ useful lives or the lease terms. Maintenance, repairs and renewals that neither add to the value of the property nor appreciably prolong its life are charged to expense as incurred. Gains and losses on disposition of property and equipment are included in store expenses in the year of disposition, and primarily relate to store relocations.
The Company capitalizes interest, if applicable, as part of the historical costs of buildings and leasehold and building improvements. The Company capitalizes certain costs incurred with developing or obtaining internal-use software. Capitalized software costs are included in
Impairment of Finite-Lived Intangible and Long-Lived Assets
Long-lived assets, such as property and equipment and purchased intangible assets subject to amortization, are reviewed for impairment whenever events or changes in circumstances indicate that the carrying amount of an asset may not be recoverable. The Company aggregates long-lived assets at the store level, which the Company considers to be the lowest level in the consolidated balance sheets andorganization for which independent identifiable cash flows are amortized overavailable. If circumstances require a long-lived asset or asset group to be tested for possible impairment, the estimated useful livesCompany first compares undiscounted cash flows expected to be generated by that store to its carrying value. If the carrying value of the software. Software costslong-lived asset or asset group is not recoverable on an undiscounted cash flow basis, impairment is recognized to the extent that do not meet capitalization criteria are expensedthe carrying value exceeds its fair value. The Company considers factors such as incurred.historic and forecasted operating results, trends and future prospects, current market value, significant industry trends and other economic and regulatory factors in performing these analyses. The Company recorded impairment charges related to long-lived assets of $0.4 million and $0.5 million in fiscal years 2019 and 2018, respectively and no impairment charges in fiscal year 2017.
Fair Value of Financial Instruments
The Company records its financial assets and liabilities at fair value in accordance with the framework for measuring fair value in authoritative guidance. The framework establishes a fair value hierarchy that distinguishes between assumptions based on market data (observable inputs) and the Company’s own assumptions (unobservable inputs). The three levels are defined as follows:
|
|
|
|
|
|
Transfers between levels of the fair value hierarchy are deemed to have occurred as of the date of the event or transfer.
Goodwill and Intangible Assets
Intangible assets primarily consist of goodwill trademarks, favorable operating leases and covenants-not-to-compete.trademarks. Goodwill and theVitamin Cottage trademark have indefinite lives and are not amortized; rather, they are tested for impairment at least annually. Intangible assets with definite lives are amortized over their estimated useful lives. The Company evaluates the reasonableness of the useful lives of these intangibles at least annually.
The Company’s annual impairment testing of goodwill is performed as of September 30.July 1. In performing the Company’s analysis of goodwill, the Company first evaluates qualitative factors, including relevant events and circumstances, to determine whether it is more likely than not that the fair value of a reporting unit is less than its carrying amount. If it is not more likely than not that the fair value of a reporting unit is less than its carrying amount, the two-step impairment test is not necessary. If it is determined that it is more likely than not that the fair value of a reporting unit is less than its carrying amount, then the Company performs the two-step impairment test. Under the first step, the fair value of the reporting unit is compared with its carrying value (including goodwill). If the fair value of the reporting unit is less than its carrying value, an indication of goodwill impairment exists for the reporting unit and the Company must perform step two of the impairment test (measurement). Under step two, an impairment loss is recognized for any excess of the carrying amount of the reporting unit’s goodwill over the implied fair value of that goodwill. As of September 30, 20162019, the Company has recorded no impairment charges related to goodwill.
The Company capitalizes certain costs incurred with developing or obtaining internal-use software. Capitalized software costs are included in intangible assets in the consolidated balance sheets and are amortized over the estimated useful lives of the software. Software costs that do not meet capitalization criteria are expensed as incurred.
Impairment ofFinite-LivedIntangible and Long-Lived Assets
Long-lived assets, such as property and equipment and purchased intangible assets subject to amortization, are reviewed for impairment whenever events or changes in circumstances indicate that the carrying amount of an asset may not be recoverable. The Company aggregates long-lived assets at the store level, which the Company considers to be the lowest level in the organization for which independent identifiable cash flows are available. If circumstances require a long-lived asset or asset group to be tested for possible impairment, the Company first compares undiscounted cash flows expected to be generated by that store to its carrying value. If the carrying value of the long-lived asset or asset group is not recoverable on an undiscounted cash flow basis, impairment is recognized to the extent that the carrying value exceeds its fair value. The Company considers factors such as historic and forecasted operating results, trends and future prospects, current market value, significant industry trends and other economic and regulatory factors in performing these analyses. As of September 30, 2016, the Company has recorded no impairment charges related to finite-lived intangible or long-lived assets.
Deferred Financing Costs
Certain costs incurred with borrowings or establishment of credit facilities are deferred. These costs are amortized over the life of the credit facility using the straight-line method.
Leases
The Company leases retail stores, a bulk food repackaging facility and distribution center and administrative offices under long-term operating or capital or financing leases. These leases include scheduled increases in minimum rents and renewal provisions at the option of the Company. The lease term for accounting purposes commences with the date the Company takes possession of the space and ends on the later of the primary lease term or the expiration of any renewal periods that are deemed to be reasonably assured at the inception of the lease.
Operating leasesLeases
The Company accounts for operating leases with rent holidays and escalating payment terms by recognizing the associated expense on a straight-line basis over the lease term, and the difference between the average rental amount charged to expense and amounts payable under the leases are included in deferred rent. For certain leases, the Company has also received cash from landlords to compensate for costs incurred by the Company in making the store locations ready for operation (leasehold incentives or tenant allowances)incentives). Leasehold incentives received from a landlord are deferred and recognized on a straight-line basis as a reduction to rent expense over the lease term.
Capital financing leasesFinancing Leases
From time to time, the Company enters into leases with developers for build-to-suit store locations. Upon lease execution, the Company analyzes its involvement during the construction period.Asperiod.As a result of defined forms of lessee involvement, the Company could be deemed the “owner” for accounting purposes during the construction period, and may be required to capitalize the project costs on its balance sheet. If the project costs are capitalized, the Company performs a sale-leaseback analysis upon completion of the constructiontoconstructionto determine if the Company canshould remove the assets from its balance sheet. If the asset cannotshould not be removed from the balance sheet, the fair market value of the building remains recognized as an asset on the balance sheet, along with a corresponding capital lease financing obligation equal to the fair market value of the building less any amount the Company contributed towards construction. The Company does not record rent expense for the rental payments under capital financing leases, but rather payments under the capital financing lease obligations are recognized as a reduction of the capital lease financing obligation and as interest expense. The capital financing lease asset is depreciated on a straight-line basis over the estimated useful life of the asset.
Capital leasesLeases
Occasionally, the Company enters into leases that are deemed to be capital leases. For these leases, the Company capitalizes the lower of the present value of the minimum lease payments or the fair value of the leased asset at inception and records a corresponding capital lease obligation. The Company does not record rent expense for the rental payments under capital leases, but rather payments under the capital lease obligations are recognized as a reduction of the capital lease obligation and as interest expense. The capital lease asset is depreciated on a straight-line basis over the term of the related lease.
Self-Insurance
The Company is self-insured for certain losses relating to employee medical and dental benefits and workers compensation. Stop-loss coverage has been purchased to limit exposure to any significant level of claims. Self-insured losses are accrued based upon the Company’s estimates of the aggregate claims incurred but not reported using historical experience. The estimated accruals for these liabilities could be significantly affected if future occurrences and claims differ from historical trends.
Revenue Recognition
Revenue is recognized at the point of sale, net of in-house coupons, discounts and returns. Sales taxes are not included in sales. The Company charges sales tax on all taxable customer purchases and remits these taxes monthly to the appropriate taxing jurisdiction. The Company records a deferred revenuecontract liability within accrued expenses when it sells the Company’s gift cards and records a sale when a customer redeems the gift card.
Cost of Goods Sold and Occupancy Costs
Cost of goods sold and occupancy costs includes the cost of inventory sold during the period net of discounts and allowances, as well as, distribution, shipping and handling costs, store occupancy costs and costs of the bulk food repackaging facility and distribution center. The amount shown is net of various rebates from third-party vendors in the form of quantity discounts and payments. Vendor consideration associated with product discounts is recorded as either a reduction of merchandise inventory orin the cost of goods sold.the product. Store occupancy costs include rent, common area maintenance and real estate taxes. Store occupancy costs do not include any rent amounts for the store leases classified as capital and financing lease obligations.
Store Expenses
Store expenses consist of store-level expenses such as salaries, benefits and share-based compensation, supplies, utilities, depreciation, gain or loss on disposal of assets, long-lived asset impairment charges, store closing costs and other related costsexpenses associated with operations support. Store expenses also include purchasing support services and advertising and marketing costs.
Administrative Expenses
Administrative expenses consist of salaries, benefits and share-based compensation, occupancy costs, depreciation, office supplies, hardware and software expenses, professional services expenses and other general and administrative expenses.
Pre-Opening and Relocation Expenses
Costs associated with the opening of new stores or relocating existing stores are expensed as incurred.
Advertising and Marketing
Advertising and marketing costs are expensed as incurred and are included in store expenses and pre-opening and relocation expenses in the consolidated statements of income. Total advertising and marketing expenses for the years ended September 30, 2016, 20152019, 2018 and 20142017 were approximately $10.8$8.2 million, $9.3$8.2 million and $7.8$10.7 million, respectively, net of vendor reimbursements received for newsletter advertising of approximately $3.2$4.6 million, $2.5$4.1 million and $1.9$3.2 million for the years ended September 30, 2016, 20152019, 2018 and 2014,2017, respectively.
SShare-Based Compensationhare-BasedCompensation
The Company adopted the 2012 Omnibus Incentive Plan in connection with its initial public offering on July 25, 2012. Restricted common stock units are granted at the market price of the Company’s common stock on the date of grant and expensed over the applicable vesting period.
The excess tax benefits for recognized compensation costs are reported as a credit to additional-paid-in capitalincome tax expense and as operating cash outflows when such excess tax benefits are realized by a reduction to current taxes payable.
Income Taxes
The Company accounts for income taxes using the asset and liability method. This method requires recognition of deferred tax assets and liabilities for expected future tax consequences of temporary differences that currently exist between the tax basis and financial reporting basis of the Company’s assets and liabilities. Deferred tax assets and liabilities are measured using enacted tax rates in the respective jurisdictions in which the Company operates.
The Company considers the need to establish valuation allowances to reduce deferred income tax assets to the amounts the Company believes are more likely than not to be recovered.
The Company recognizes the effect of income tax positions only if those positions are more likely than not of being sustained. Recognized income tax positions are measured at the largest amount that is greater than 50% likely of being realized. Changes in recognition or measurement are reflected in the period in which the change in judgment occurs. Although the Company believes that its estimates are reasonable, actual results could differ from these estimates. In addition, the Company is subject to periodic audits and examinations by the Internal Revenue Service (IRS) and other state and local taxing authorities.
Any interest or penalties incurred related to income taxes are expensed as incurred and treated as permanent differences for tax purposes.
RecentU.S. Tax Reform
On December 22, 2017, the U.S. government enacted comprehensive tax legislation commonly referred to as the Tax Cuts and Jobs Act (the Tax Reform Act). The Tax Reform Act significantly revised the ongoing federal income tax by, among other things, lowering U.S. corporate income tax rates effective January 1, 2018. The Company had a U.S. federal income tax rate of 21.0% for the fiscal year ended September 30, 2019. The Tax Reform Act resulted in a blended U.S. federal income tax rate of approximately 24.3% for the fiscal year ended September 30, 2018. Remeasurement of the Company’s deferred tax balance under the Tax Reform Act resulted in a non-cash tax benefit of $4.3 million for the year ended September 30, 2018.
Recently Adopted Accounting Pronouncements
In March 2016,May 2014, the Financial Accounting Standards Board (FASB) issued Accounting Standards Update (ASU) 2016-09, “Improvements to Employee Share-Based Payment Accounting,” Topic 718, “Compensation-Stock Compensation” (ASU 2016-09). ASU 2016-09 includes provisions intended to simplify various aspects related to how share-based payments are accounted for and presented in the financial statements. The main provision requires all excess tax benefits and tax deficiencies to be recognized as income tax benefit or expense in the statement of income. The tax effects of exercised or vested awards should be treated as discrete items in the reporting period in which they occur. The ASU also allows an entity to make an entity-wide election to either estimate the number of awards that are expected to vest (current GAAP) or account for forfeitures when they occur. Other provisions in ASU 2016-09 permit tax withholding up to the maximum statutory tax rates in the applicable jurisdictions. Under ASU 2016-09 excess tax benefits must be classified along with other income tax cash flows as an operating activity. The provisions of ASU 2016-09 are effective for the Company’s first quarter of the fiscal year ending September 30, 2018. Early adoption is permitted. The Company is currently evaluating the impact that the adoption of ASU 2016-09 will have on its consolidated financial statements.
In February 2016, the FASB issued ASU 2016-02, “Leases,” Topic 842, “Leases” (ASU 2016-02). ASU 2016-02 intends to improve financial reporting about leasing transactions. The ASU will require organizations that lease assets to recognize on the balance sheet assets and liabilities for the rights and obligations created by those leases. For income statement purposes, the FASB retained a dual model, requiring leases to be classified as either operating or capital. Operating leases will result in straight-line expense while capital leases will result in a front-loaded expense pattern. Classification will be based on criteria that are largely similar to those applied in current lease accounting, but without explicit bright lines. The amendments also require certain quantitative and qualitative disclosures. ASU 2016-02 is effective for fiscal years beginning after December 15, 2018 and interim periods within those years. The provisions of ASU 2016-02 are effective for the Company’s first quarter of the fiscal year ending September 30, 2020. Early adoption is permitted. The new standard must be adopted using a modified retrospective transition, and provides for certain practical expedients. Transition will require application of the new guidance at the beginning of the earliest comparative period presented. The Company is currently evaluating the impact that the adoption of ASU 2016-02 will have on its consolidated financial statements but expects it to have a significant impact on its balance sheet due to the number of operating leases to which the Company is a party.
In November 2015, the FASB issued Accounting Standards Update 2015-17, “Income Taxes,” Topic 740, “Income Taxes” (ASU 2015-17). ASU 2015-17 addresses the balance sheet classification of deferred taxes. The amendments in ASU 2015-17 require that deferred tax liabilities and assets be classified as noncurrent in a classified statement of financial position. The Company elected early adoption of the provisions of ASU 2015-17 prospectively for the period ended March 31, 2016 and thereafter and has presented its deferred tax liabilities and assets as noncurrent in its consolidated financial statements as of March 31, 2016 and periods ended thereafter.
In July 2015, the FASB issued ASU 2015-11, “Simplifying the Measurement of Inventory,” Topic 330, “Inventory” (ASU 2015-11). The amendments in ASU 2015-11, which apply to inventory that is measured using any method other than the last-in, first-out (LIFO) or retail inventory method, require that entities measure inventory at the lower of cost and net realizable value. The amendments in ASU 2015-11 should be applied on a prospective basis. ASU 2015-11 is effective for fiscal years beginning after December 15, 2016 and interim periods within those years. The provisions of ASU 2015-11 are effective for the Company’s first quarter of the fiscal year ending September 30, 2018. The Company does not expect the adoption of these provisions to have a significant impact on the Company’s consolidated financial statements.
In April 2015, the FASB issued ASU 2015-05, “Customer’s Accounting for Fees Paid in a Cloud Computing Arrangement,” Subtopic 350-40, “Intangibles-Goodwill and Other – Internal-Use Software” (ASU 2015-05). ASU 2015-05 provides guidance as to whether a cloud computing arrangement (such as software as a service, platform as a service, infrastructure as a service, and other similar hosting arrangements) includes a software license and, based on that determination, how to account for such arrangements. The amendments in ASU 2015-05 may be applied on either a prospective or retrospective basis and early adoption is permitted. ASU 2015-05 is effective for fiscal years beginning after December 15, 2015and interim periods within those fiscal years. The provisions ofASU 2015-05 are effective for the Company’s first quarter of the fiscal year ending September 30, 2017. The Company does not expect the adoption of these provisions to have a significant impact on the Company’s consolidated financial statements.
In May 2014, the FASB issued ASU 2014-09, “Revenue from Contracts with Customers,” Topic 606, “Revenue from Contracts with Customers” (ASU 2014-09). ASU 2014-09 provides guidance for revenue recognition and will replacereplaced most existing revenue recognition guidance in GAAP when it becomes effective.GAAP. ASU 2014-09’s core principle is that a company will recognizerecognizes revenue when it transfers promised goods or services to customers in an amount that reflects the consideration to which the company expects to be entitled for the transfer of those goods or services. The Company adopted this ASU and related amendments on October 1, 2018, using the modified retrospective approach. Additionally, upon adoption of this ASU, the Company elected the following practical expedients:
- | ASU 2016-09, pursuant to which the incremental costs of obtaining a contract are recognized as an expense when incurred if the amortization period of the asset that the entity otherwise would have recognized is one year or less. |
- | ASU 2016-12, pursuant to which sales taxes and other similar taxes collected from customers are presented net of sales. |
- | ASU 2016-20, pursuant to which the transaction price allocated to performance obligations is not disclosed when the related contract has a duration of one year or less. |
Updated accounting policies and other disclosures are discussed below in Recent Accounting Pronouncements in this Note 2. The adoption of ASU 2014-09 permitsdid not have a material impact on the use of eitherCompany’s consolidated financial statements for the retrospective or cumulative effect transition method. year ended September 30, 2019.
Recent Accounting Pronouncements
In July 2015,January 2017, the FASB issued ASU 2015-14, “Revenue from Contracts with Customers2017-04, “Simplifying the Test for Goodwill Impairment,” Topic 350, “Intangibles – DeferralGoodwill and Other” (ASU 2017-04). The amendments in ASU 2017-04 simplify the accounting for goodwill impairment for all entities by requiring impairment charges to be based on the first step in the current two-step impairment test. An impairment charge for the amount by which the carrying amount exceeds the reporting unit’s fair value should be recognized; however, the loss recognized should not exceed the total amount of the Effective Date.”goodwill allocated to that reporting unit. The FASB approved the deferral of ASU 2014-09, by extending the new revenue recognition standard’s mandatory effective date by one year and permitting public companies to apply the new revenue standard to annual reporting periods beginning after December 15, 2017. However, earlieramendments should be applied on a prospective basis. Early adoption is permitted only for annual reporting periods beginningand interim goodwill impairment testing dates after December 15, 2016. The guidance inJanuary 1, 2017, and the ASU 2014-09 will beis effective for the Company in theCompany’s first quarter of the fiscal year ending September 30, 2019.2020. The Company is currently evaluating the impact that the adoption of ASU 2014-09these provisions will have on its consolidated financial statements.
In February 2016, the FASB issued ASU 2016-02, “Leases,” Topic 842, “Leases” (ASU 2016-02). ASU 2016-02 requires lessees to recognize a right-of-use asset and corresponding lease liability for all leases with terms of more than 12 months. Recognition, measurement and presentation of expenses will depend on classification as a finance or operating lease. ASU 2016-02 also requires certain quantitative and qualitative disclosures. The provisions of ASU 2016-02 are effective for the Company’s first quarter of the fiscal year ending September 30, 2020, with early adoption permitted.
In anticipation of the transition, the Company has made the following elections:
- | The Company will apply the transition provisions of ASU 2016-02 effective October 1, 2019, the first day of fiscal year 2020. Prior periods will continue to be reported in accordance with the historical accounting guidance then in effect. |
- | The Company has elected a transition practical expedient to not assess land easements that exist or expired before the standard’s effective date that were not previously accounted for as leases under ASC 840. |
- | The Company has elected the package of practical expedients to not reassess prior conclusions about lease identification, lease classification and initial direct costs. |
- | The Company has elected not to separate lease and non-lease components for new and modified leases after the adoption date, and instead will account for each separate lease component of a contract and its associated non-lease components as a single lease component, when appropriate. |
- | The Company has elected not to recognize a right-of-use asset and a lease liability for leases with an initial term of 12 months or less. |
- | The Company has not elected to apply the hindsight practical expedient. |
A complete population of contracts that meet the definition of a lease under ASU 2016-02 has been identified and the Company is substantially complete with its implementation efforts. Based on the Company’s portfolio of leases as of September 30, 2019, the Company expects to recognize additional operating liabilities of not more than $390.0 million for existing operating leases, based on the present value of the remaining minimum lease payments. The Company expects to recognize the corresponding right-of-use assets of not more than $370.0 million and derecognize deferred rent and lease incentives. The Company will also recognize finance lease liabilities and assets of not more than $35.0 million and derecognize capital and capital finance lease obligations and assets as reported under ASC 840.
In June 2016, the FASB issued ASU 2016-13, “Financial Instruments - Credit Losses,” Topic 326, “Measurement of Credit Losses on Financial Instruments'' (ASU 2016-13), subsequently amended by various standard updates. ASU 2016-13 replaces the incurred loss impairment methodology in current GAAP with a methodology that reflects expected credit losses and requires consideration of a broader range of reasonable and supportable information when determining credit loss estimates. ASU 2016-13 also requires financial assets to be measured net of expected credit losses at the time of initial recognition. As a smaller reporting company, the provisions of ASU 2016-13 are effective for the Company’s first quarter of the fiscal year ending September 30, 2024. Early adoption is permitted. The Company will evaluate the impact this ASU will have on its consolidated financial statements.
In June 2018, the FASB issued ASU 2018-07, “Compensation-Stock Compensation,” Topic 718, “Improvements to Nonemployee Share-Based Payment Accounting” (ASU 2018-07) as part of its Simplification Initiative to reduce complexity when accounting for share-based payments to non-employees. ASU 2018-07 expands the scope of Topic 718 to more closely align share-based payment transactions for acquiring goods and services from non-employees with the accounting for share-based payments to employees, with certain exceptions. The provisions of ASU 2018-07 are effective for the Company’s first quarter of the fiscal year ending September 30, 2020, with early adoption permitted. This ASU is not expected to have an impact on the Company’s consolidated financial statements.
The Company has reviewed all other recently issued accounting pronouncements and concluded they were either not applicable or not expected to have a significant impact on the Company's consolidated financial statements.
3. Revenue Recognition
The nature of the goods the Company transfers to customers at the point of sale consists of merchandise purchased for resale. In these transactions, the Company acts as a principal and recognizes revenue (net sales) from the sale of goods when control of the promised goods is transferred to the customer. Control refers to the ability of the customer to direct the use of, and obtain substantially all the remaining benefits from, the transferred goods.
The Company’s performance obligations are satisfied upon the transfer of goods to the customer (at the point of sale), and payment from the customer is also due at that time. Transaction prices are considered fixed. Discounts provided to customers at the point of sale are recognized as a reduction in revenue as the goods are sold. Revenue excludes sales and usage-based taxes collected.
Proceeds from the sale of gift cards are recorded as a liability at the time of sale and recognized as revenue when the gift cards are redeemed by the customer and the performance obligation is satisfied by the Company. The Company also recognizes revenue for a portion of gift card values that is not expected to be redeemed (breakage). The estimated breakage takes into consideration several factors, including the laws and regulations applicable to each jurisdiction. The Company determines the amount of breakage income to be recognized on gift cards using historical experience to estimate amounts that will ultimately not be redeemed. The Company recognizes such breakage income in proportion to redemption rates of the overall population of gift cards.
As of each September 30, 2019 and September 30, 2018, the balance of contract liabilities related to unredeemed gift cards was $1.0 million. Revenue for the fiscal year ended September 30, 2019 includes $0.6 million that was included in the contract liability balance of unredeemed gift cards at September 30, 2018.
The following table disaggregates the Company’s revenue by product category for the fiscal years ended September 30, 2019, 2018 and 2017, dollars in thousands:
Year ended September 30, | ||||||||||||
2019 | 2018 | 2017 | ||||||||||
Grocery | $ | 619,825 | 574,311 | 511,753 | ||||||||
Dietary supplements | 188,913 | 183,485 | 170,806 | |||||||||
Body care, pet care and other | 94,844 | 91,246 | 86,471 | |||||||||
| $ | 903,582 | 849,042 | 769,030 | |||||||||
4. Earnings Per Share
Basic earnings per share excludes dilution and is computed by dividing net income by the weighted average number of shares of common stock outstanding during the period. Diluted earnings per share reflects the potential dilution that could occur if the Company’s granted but unvested restricted stock units were to vest, resulting in the issuance of common stock that would then share in the earnings of the Company. Presented below is basic and diluted earnings per share for the years ended September 30, 2016, 20152019, 2018 and 2014,2017, dollars in thousands, except per share data:
Year ended September 30, | Year ended September 30, | |||||||||||||||||||||||
2016 | 2015 | 2014 | 2019 | 2018 | 2017 | |||||||||||||||||||
Net income | $ | 11,471 | 16,204 | 13,473 | $ | 9,416 | 12,661 | 6,891 | ||||||||||||||||
Weighted average number of shares of common stock outstanding | 22,492,986 | 22,490,260 | 22,466,432 | 22,424,328 | 22,361,898 | 22,453,409 | ||||||||||||||||||
Effect of dilutive securities | 14,166 | 10,573 | 13,403 | 130,275 | 51,140 | 10,266 | ||||||||||||||||||
Weighted average number of shares of common stock outstanding including the effect of dilutive securities | 22,507,152 | 22,500,833 | 22,479,835 | 22,554,603 | 22,413,038 | 22,463,675 | ||||||||||||||||||
Basic earnings per share | $ | 0.51 | 0.72 | 0.60 | $ | 0.42 | 0.57 | 0.31 | ||||||||||||||||
Diluted earnings per share | $ | 0.51 | 0.72 | 0.60 | $ | 0.42 | 0.56 | 0.31 | ||||||||||||||||
There were 61,115, 120,67456,510, 207,805 and 3,55852,974 non-vested restricted stock units (RSUs) for the years ended September 30, 2016, 20152019, 2018 and 2014,2017, respectively, excluded from the calculation as they are antidilutive.
The Company did not declare or pay any dividends in the years ended September 30, 2016, 20152019, 2018 or 2014.2017. On November 13, 2019, the Board approved the initiation of a quarterly cash dividend per share of common stock. The initial quarterly cash dividend of $0.07 per share of common stock will be paid on December 17, 2019 to stockholders of record as of the close of business on December 2, 2019.
As of September 30, 2016,2019, the Company had 50,000,000 shares of common stock authorized, of which 22,510,279 shares were issued and 22,452,60922,463,057 were outstanding, as well as 10,000,000 shares of preferred common stock authorized, of which none was issued and outstanding.
4.5. Fair Value Measurements
The Company records its financial assets and liabilities at fair value in accordance with the framework for measuring fair value. The framework establishes a fair value hierarchy that distinguishes between assumptions based on market data (observable inputs) and market participant’s assumptions (unobservable inputs). Non-financial assets, such as goodwill and long-lived assets, are accounted for at fair value on a non-recurring basis. These items are tested for impairment on the occurrence of a triggering event or in the case of goodwill, at least on an annual basis.
AsDuring fiscal year 2019, long-lived assets with a carrying value of September 30, 2016 and 2015, the Company did not have any financial assets or liabilities that$0.8 million were subjectwritten down to their fair value measurements.of $0.4 million, resulting in asset impairment charges of $0.4 million During fiscal year 2018, long-lived assets with a carrying value of $1.2 million were written down to their fair value of $0.7 million, resulting in asset impairment charges of $0.5 million. The carrying amounts of the Company’s financial assets and liabilities, including cash and cash equivalents, restricted cash, accounts receivable, accounts payable and other accrued expenses, approximate fair value because of the short maturity of those assets and liabilities.
5.6. Property and Equipment
The Company had the following property and equipment balances as of September 30, 20162019 and 2015,2018, dollars in thousands:
Useful lives | As of September 30, | Useful lives | As of September 30, | |||||||||||||||||||||||
(in years) | 2016 | 2015 | (in years) | 2019 | 2018 | |||||||||||||||||||||
Construction in process | n/a | $ | 6,561 | 10,150 | n/a | $ | 15,145 | 15,879 | ||||||||||||||||||
Capitalized real estate leases for build-to-suit stores, including unamortized land of $617 and $617, respectively | 40 | 28,393 | 24,774 | |||||||||||||||||||||||
Capitalized real estate leases for build-to-suit stores, including unamortized land of $617 in each year | 40 | 42,320 | 35,700 | |||||||||||||||||||||||
Capitalized real estate leases | 15 | 5,735 | 4,866 | 15 | 7,241 | 5,735 | ||||||||||||||||||||
Land | n/a | 192 | 192 | n/a | 1,230 | 192 | ||||||||||||||||||||
Buildings | 12,546 | 4,980 | 40 | 23,571 | 19,262 | |||||||||||||||||||||
Land improvements | 5 | - | 24 | 1,055 | 1,015 | 5 | - | 24 | 1,498 | 1,016 | ||||||||||||||||
Leasehold and building improvements | 1 | - | 25 | 118,119 | 91,865 | 1 | - | 25 | 144,318 | 131,474 | ||||||||||||||||
Fixtures and equipment | 5 | - | 7 | 103,415 | 83,932 | 5 | - | 7 | 131,491 | 122,984 | ||||||||||||||||
Computer hardware and software | 3 | - | 5 | 16,737 | 13,834 | 3 | - | 5 | 21,672 | 21,181 | ||||||||||||||||
| 292,753 | 235,608 | 388,486 | 353,423 | |||||||||||||||||||||||
Less accumulated depreciation and amortization | (114,456 | ) | (90,389 | ) | (186,851 | ) | (164,655 | ) | ||||||||||||||||||
Property and equipment, net | $ | 178,297 | 145,219 | $ | 201,635 | 188,768 | ||||||||||||||||||||
AsTotal costs capitalized for qualifying construction projects of September 30, 2016leasehold and 2015, construction in processbuilding improvements included $1.1$0.4 million and approximately zero, respectively, related to construction costs for build-to-suit leases in process for which the Company was deemed the owner during the construction period. As of September 30, 2016 and 2015, construction in process included zero and $0.9 million, respectively, for capital real estate leases.
Capitalized costs for computer software development were less than $0.1 million and $0.2$0.5 million, for the years ended September 30, 20162019 and 2015, respectively, primarily due to capitalization of internal staff compensation. Total costs capitalized for qualifying construction projects on leasehold and building improvements and fixtures and equipment included approximately $0.9 million and $0.6 million, for the years ended September 30, 2016 and 2015,2018, respectively, related to internal staff compensation. Depreciation expense related to capitalized internal staff compensation was $0.6 million, $0.5 million and $0.5 million for each of the years ended September 30, 2019, 2018, and 2017, respectively. Interest costs of approximately $0.5 million, $0.3 million, $0.2 million and $0.4$0.5 million were capitalized for the years ended September 30, 2016, 20152019, 2018 and 2014, respectively. Depreciation expense related to capitalized internal staff compensation was approximately $0.5 million, $0.4 million and $0.3 million for the years ended September 30, 2016, 2015, and 2014,2017, respectively.
Depreciation and amortization expense for the years ended September 30, 2016, 20152019, 2018 and 20142017 is summarized as follows, dollars in thousands:
Year ended September 30, | Year ended September 30, | |||||||||||||||||||||||
2016 | 2015 | 2014 | 2019 | 2018 | 2017 | |||||||||||||||||||
Depreciation and amortization expense included in cost of goods sold and occupancy costs | $ | 868 | 796 | 770 | $ | 736 | 768 | 1,063 | ||||||||||||||||
Depreciation and amortization expense included in store expenses | 23,428 | 19,635 | 15,861 | 27,150 | 27,174 | 27,022 | ||||||||||||||||||
Depreciation and amortization expense included in administrative expenses | 1,237 | 906 | 581 | 1,091 | 1,488 | 1,426 | ||||||||||||||||||
Total depreciation and amortization expense | $ | 25,533 | 21,337 | 17,212 | ||||||||||||||||||||
Total depreciation and amortization expenses | $ | 28,977 | 29,430 | 29,511 | ||||||||||||||||||||
7. Impairment of Long-Lived Assets and Store Closing Costs
In determining whether long-lived assets are recoverable, the Company’s estimates of undiscounted future cash flows over the estimated life or lease term of a store is based upon experience, historical results of the store, an estimate of future store profitability and economic conditions. As the Company forecasts future undiscounted cash flows for the remaining useful life of the asset group, estimates are subject to variability as future results can be difficult to predict. If a long-lived asset is found to be non-recoverable, an impairment charge is recorded equal to the difference between the asset’s carrying value and fair value. The Company estimates the fair value of the asset using a valuation method such as discounted cash flow or a relative, market-based approach.
In the fourth quarter of fiscal years 2019 and 2018, the Company concluded, as a result of its review of potential long-lived asset impairment, that certain long-lived assets were impaired. The Company recorded impairments of $0.4 and $0.5 million for the years ended September 30, 2019 and 2018, respectively. Such charges are reflected within store expenses on the consolidated statement of income for the years ended September 30, 2019 and 2018. Other store closing costs related to one-time severance benefit payouts of less than $0.1 million that were recorded as accrued liabilities as of September 30, 2018. There were no store closing costs recorded as of September 30, 2019.
6.8. Goodwill and Other Intangible Assets
Goodwill and other intangible assets as of September 30, 20162019 and 2015,2018, are summarized as follows, dollars in thousands:
Usefullives | As of September30, | Useful lives | As of September 30, | |||||||||||||||||||||||
(inyears) | 2016 | 2015 | (in years) | 2019 | 2018 | |||||||||||||||||||||
Amortizable intangible assets: | ||||||||||||||||||||||||||
Covenants-not-to-compete | 2 | - | 5 | $ | 353 | 353 | ||||||||||||||||||||
Favorable operating lease | 5 | — | 339 | |||||||||||||||||||||||
Other intangibles | 0.5 | - | 1 | 41 | 27 | 0.5 | - | 3 | $ | 2,677 | 138 | |||||||||||||||
Amortizable intangible assets | 394 | 719 | 2,677 | 138 | ||||||||||||||||||||||
Less accumulated amortization | (380 | ) | (683 | ) | (1,592 | ) | (77 | ) | ||||||||||||||||||
Amortizable intangible assets, net | 14 | 36 | 1,085 | 61 | ||||||||||||||||||||||
Other intangibles in process | 1,972 | — | ||||||||||||||||||||||||
Trademark | Indefinite | 389 | 389 | Indefinite | 389 | 389 | ||||||||||||||||||||
Total other intangibles, net | 403 | 425 | 3,446 | 450 | ||||||||||||||||||||||
Goodwill | Indefinite | 5,198 | 5,198 | Indefinite | 5,198 | 5,198 | ||||||||||||||||||||
Total goodwill and other intangibles, net | $ | 5,601 | 5,623 | $ | 8,644 | 5,648 | ||||||||||||||||||||
Amortization expense was less than $0.1 million, less than $0.1 million and $0$0.5 million for the yearsyear ended September 30, 2016, 20152019 and 2014, respectively. The aggregate estimated amortization expense for the years ending September 30, 2017 and 2018 is less than $0.1 million. There is no estimated amortization expense for the years ending September 30, 2019, 2020 and 2021.
7.Accrued Expenses
The composition of accrued expenses as of September 30, 2016 and 2015, is summarized as follows, dollars in thousands:
As of September30, | ||||||||
2016 | 2015 | |||||||
Payroll and employee-related expenses | $ | 4,395 | 7,795 | |||||
Accrued income taxes payable | — | 5,540 | ||||||
Accrued property, sales and use tax payable | 5,648 | 4,365 | ||||||
Accrued marketing expenses | 567 | 532 | ||||||
Deferred revenue related to gift card sales | 866 | 864 | ||||||
Other | 972 | 553 | ||||||
Total accrued expenses | $ | 12,448 | 19,649 | |||||
8. Deferred Financing Costs
The Company has capitalized costs incurred in securing its credit facility (see Note 9). Deferred financing costs, net of accumulated amortization were less than $0.1 million as of September 30, 2016 and 2015. Accumulated amortization was less than $0.1 million and $0.9 million as of September 30, 2016 and 2015, respectively.
Total amortization expense for deferred financing costs was less than $0.1 million for each of the years ended September 30, 2016, 20152018 and 2014.2017.
Capitalized costs for internal-use software development were $2.3 million and $0.6 million for the years ended September 30, 2019 and 2018, respectively, primarily due to capitalization of expenses related to external consultants.
9. Long-Term Debt9. Accrued Expenses
The composition of accrued expenses as of September 30, 2019 and 2018, is summarized as follows, dollars in thousands:
As of September 30, | ||||||||
2019 | 2018 | |||||||
Payroll and employee-related expenses | $ | 8,447 | 6,992 | |||||
Accrued property, sales and use tax payable | 7,761 | 7,043 | ||||||
Accrued marketing expenses | 477 | 335 | ||||||
Deferred revenue related to gift card sales | 1,410 | 1,453 | ||||||
Other | 966 | 2,028 | ||||||
Total accrued expenses | $ | 19,061 | 17,851 | |||||
10. Long-Term Debt
Credit Facility
On January 28, 2016, the Company entered into a new $30.0 million credit facility including a $5.0 million sublimit for standby letters of credit (the Credit Facility). The operating company is the borrower under the Credit Facility and its obligations under the Credit Facility are guaranteed by the holding company and VC2. The Credit Facility is secured by a lien on substantially all of the Company’s assets.
On May 10, 2016, the operating company entered into an amendment to the Credit Facility, pursuant to which theThe amount available for borrowing thereunder was increased to $45.0under the Credit Facility is $50.0 million, including a $5.0 million sublimit for standby letters of credit. The Company has the ability to increase the amount available for borrowing by an additional amount that may not exceed $5.0 million if the existing lenders or other eligible lenders agree to provide an additional commitment or commitments. The Company has the right to borrow, prepay and re-borrow amounts under the Credit Facility at any time prior to the maturity date. The Credit Facility matures on January 31, 2021.
November 13, 2024. For floating rate borrowings under the Credit Facility, interest is determined by the lender’s administrative agent based on the most recent compliance certificate of the operating company and stated at the base rate less the lender spread based upon certain financial measures. For fixed rate borrowings under the Credit Facility, interest is determined by quoted LIBOR rates for the interest period plus the lender spread based upon certain financial measures. The unused commitment fee is based upon certain financial measures.
The Credit Facility requires compliance with certain customary operational and financial covenants, including a leverage ratio. The Credit Facility also contains certain other customary limitations on the Company’s ability to incur additional debt, guarantee other obligations, grant liens on assets and make investments or acquisitions, among other limitations. Additionally, the Credit Facility prohibits the payment of cash dividends to the holding company from the operating company without the administrative agent’s consent, except when no default or event of default exists. Ifprovided that so long as no default or event of default exists or would arise as a result thereof, the operating company may pay cash dividends are allowed forto the holding company in an amount sufficient to allow the holding company to: (i) pay various audit, accounting, tax, securities, indemnification, reimbursement, insurance and other reasonable expenses incurred in the ordinary course of business including cash dividends to the holding company for theand (ii) repurchase of shares of common stock and pay dividends on the Company’s common stock in an aggregate amount not to exceed $10.0 million.million during any fiscal year.
At the same time it entered into the Credit Facility, the Company terminated its prior credit agreement (the Prior Credit Facility).
The Company had $27.4$5.7 million and $13.2 million outstanding under the Credit Facility as of September 30, 20162019 and zero outstanding under the Prior Credit Facility asSeptember 30, 2018, respectively. As of each of September 30, 2015. As of2019 and September 30, 2016,2018, the Company had undrawn, issued and outstanding letters of credit of $1.0 million, which were reserved against the amount available for borrowing under the terms of the Credit Facility. As of September 30, 2015, the Company had undrawn, issued and outstanding letters of credit of $1.0 million, which were reserved against the amount available for borrowing under the terms of the Prior Credit Facility. The Company had $16.6$43.3 million and $35.8 million available for borrowing under the Credit Facility as of September 30, 20162019 and $14.0 million available for borrowing underSeptember 30, 2018, respectively.
On November 13, 2019, the Prioroperating company entered into the third amendment to the Credit Facility as of September 30, 2015.(see Note 20).
Capitaland Financing Lease ObligationsObligations
The Company had 1623 and 1320 leases as of September 30, 20162019 and 2015,2018, respectively, that are included in capital and financing lease obligations (see Notes 2 and 10)11). The Company does not recordNo rent expense is recorded for these capitalized real estate leases, but rather rental payments under the capital leases are recognized as a reduction of the capital and financing lease obligation and as interest expense (see Note 10)11). The interest rate on capital and financing lease obligations is determined at the inception of the lease.
InterInterestest
The Company incurred gross interest expense of approximately $3.5$5.2 million, $3.3$4.7 million and $2.9$4.3 million in the years ended September 30, 2016, 20152019, 2018 and 2014,2017, respectively. Interest expense for the years ended September 30, 2016, 20152019, 2018 and 20142017 relates primarily to interest on capital and financing lease obligations. The Company capitalized interest of approximately $0.5 million, $0.3 million, $0.2 million and $0.4$0.5 million for the years ended September 30, 2016, 20152019, 2018 and 2014,2017, respectively.
11. Lease Commitments
10. Lease Commitments
Operating Leases
The Company leases retail stores, a bulk food repackaging facility and distribution center and administrative offices under long-term operating leases through 2062. These leases include scheduled increases in minimum rents and renewal provisions at the option of the Company. Deferred rent expense as of September 30, 20162019 and 20152018 was approximately $8.8$11.4 million and $6.9$11.0 million, respectively. Tenant improvement allowances received from landlords (leasehold incentives) are recorded as liabilities and recognized evenly as a reduction to rent expense over the lease term. Leasehold incentives at September 30, 20162019 and 20152018 were approximately $8.4$8.0 million and $8.0$8.9 million, respectively. Sublease rental income was less than $0.1$0.4 million, $0.4 million and $0.3 million for each of the years ended September 30, 2016, 20152019, 2018 and 2014,2017, respectively.
The Company has fivefour operating leases with Chalet Properties, LLC (Chalet), one operating lease with the Isely Family Land Trust LLC (Land Trust) and one operating lease with FTVC, LLC, all related parties (see Note 13)14). One additional operating lease with Chalet, for one of the Company’s store locations in Austin, Texas (the Austin Property), terminated on September 9, 2019 concurrently with Chalet’s sale of the Austin Property. The terms and rental rates of these related party leases are similar to leases with nonrelated parties and are at market rental rates. The leases began at various times with the earliest occurring in November 1999, continue for various terms through February 2027 and include various options to renew. Currently, annual lease payments range from less than $0.1 million to approximately $0.3 million per lease.
Minimum rental commitments and sublease rental income under the terms of the Company’s operating leases are as follows, dollars in thousands:
Fiscal Year | Third | Related | Sublease rental income | Total operating | Third | Related | Sublease rental income | Total operating | ||||||||||||||||||||||||
2017 | $ | 35,463 | 1,329 | (315 | ) | 36,477 | ||||||||||||||||||||||||||
2018 | 38,325 | 1,329 | (342 | ) | 39,312 | |||||||||||||||||||||||||||
2019 | 37,412 | 1,329 | (332 | ) | 38,409 | |||||||||||||||||||||||||||
2020 | 36,739 | 1,333 | (296 | ) | 37,776 | $ | 41,646 | 1,081 | (422 | ) | 42,305 | |||||||||||||||||||||
2021 | 35,524 | 1,310 | (283 | ) | 36,551 | 41,484 | 1,058 | (418 | ) | 42,124 | ||||||||||||||||||||||
2022 | 41,081 | 1,056 | (424 | ) | 41,713 | |||||||||||||||||||||||||||
2023 | 40,175 | 1,056 | (413 | ) | 40,818 | |||||||||||||||||||||||||||
2024 | 38,012 | 1,056 | (257 | ) | 38,811 | |||||||||||||||||||||||||||
Thereafter | 319,577 | 6,595 | (928 | ) | 325,244 | 262,086 | 2,062 | (772 | ) | 263,376 | ||||||||||||||||||||||
| Total payments | $ | 503,040 | 13,225 | (2,496 | ) | 513,769 | $ | 464,484 | 7,369 | (2,706 | ) | 469,147 | ||||||||||||||||||||
Total rent expense, including common area expenses and warehouse rent, for the years ended September 30, 2016, 2015,2019, 2018, and 20142017 totaled approximately $34.6$51.6 million, $26.3$48.8 million and $20.5$43.8 million, respectively, which is included in cost of goods sold and occupancy costs and administrative expenses in the consolidated statements of income. In addition, approximately $1.4$0.3 million, $0.8$0.6 million and $1.0$1.4 million is included in pre-opening and relocation expense associated with rent expense for stores prior to their opening date for the years ended September 30, 2016, 20152019, 2018 and 2014,2017, respectively.
Capital and Financing Lease Obligations
Capital and financing lease obligations as of September 30, 20162019 and 2015,2018, were as follows, dollars in thousands:
As of September 30, | As of September 30, | |||||||||||||||
2016 | 2015 | 2019 | 2018 | |||||||||||||
Capital lease finance obligations, due in monthly installments through fiscal year 2031 | $ | 25,619 | 22,096 | |||||||||||||
Capital lease finance obligations, due in monthly installments through fiscal year 2034 | $ | 39,558 | 32,523 | |||||||||||||
Capital lease obligations due in monthly installments through fiscal year 2041 | 5,213 | 4,539 | 5,972 | 4,763 | ||||||||||||
Capital lease finance obligations for assets under construction, due in monthly installments through fiscal year 2032 | 1,075 | — | ||||||||||||||
Capital lease obligations for assets under construction, due in monthly installments through fiscal year 2041 | — | 972 | ||||||||||||||
Capital lease finance obligations for assets under construction, due in monthly installments through fiscal year 2035 | 2,350 | 2,350 | ||||||||||||||
Capital lease obligations for assets under construction, due in monthly installments through fiscal year 2040 | 4,640 | 1,506 | ||||||||||||||
Total capital and financing lease obligations | 31,907 | 27,607 | 52,520 | 41,142 | ||||||||||||
Less current portion | (478 | ) | (333 | ) | (1,045 | ) | (736 | ) | ||||||||
Total capital and financing lease obligations, net of current portion | $ | 31,429 | 27,274 | $ | 51,475 | 40,406 | ||||||||||
Capital lease finance obligations
From time to time, the Company enters into leases with developers for build-to-suit store locations. Upon lease execution, the Company analyzes its involvement during the construction period.As a result of defined forms of lessee involvement, the Company could be deemed the “owner” for accounting purposes during the construction period, and would be required to capitalize construction costs on its balance sheet. If the project costs were capitalized, the Company performs a sale-leaseback analysis upon completion of the project to determine if the Company canshould remove the asset from its balance sheet. If the asset cannotshould not be removed from the balance sheet, the fair market value of the building remains on the balance sheet along with a corresponding capital lease finance obligation equal to the fair market value of the building less any amounts the Companycontributed toward construction. The Company had capital lease finance obligations totaling approximately $25.6$39.6 million and $22.1$32.5 million as of September 30, 20162019 and 2015,2018, respectively. The leases that created the obligations expire or become subject to renewal clauses at various dates through fiscal year 2031.2034. The Company does not record rent expense for capital lease finance obligations, butobligations; rather, rent payments per the leases are recognized as a reduction of the related capital lease finance obligation and as interest expense. Depreciation expense for the related capitalized lease assets is included in store expenses in the consolidated statements of income. At the end of the lease term, the offsetting balances of the capitalized assets, net of accumulated depreciation, and capital lease finance obligation will be derecognized.
During the quarter ended December 31, 2014, the Company amended an existing lease with Chalet Properties, LLC, a related party (see Note 13) to obtain additional square footage at one Company store. Due to the Company’s involvement with construction for the additional space, the amended lease was deemed to be a capital financing lease in the quarter ended December 31, 2014.
Capital lease obligations
The Company had capital lease obligations totaling approximately $5.2$6.0 million and $4.5$4.8 million as of September 30, 20162019 and 2015,2018, respectively. Certain of the Company’s leases for store locations are considered capital leases, and as such, the Company has capitalized the present value of the minimum lease payments under the leases for the stores and recorded related capital lease obligations. The leases that created the obligation expire or become subject to renewal clauses at various dates through fiscal year 2041. The Company does not record rent expense for capital lease obligations, butobligations; rather, rent payments per the leases are recognized as a reduction of the related capital lease obligation and as interest expense. Depreciation expense for the related capitalized lease assets is included in store expenses in the consolidated statements of income.
Capital lease finance obligationsobligations for assets under construction
As of September 30, 2016, theThe Company had $1.1$2.4 million in construction in process related to capital lease finance obligations. Asobligations as of September 30, 2015, the Company had no construction in process related to capital lease finance obligations. The Company will not record2019 and 2018. No rent expense is recorded for these leases, butleases; rather, rental payments under the leases will be recognized as a reduction of the capital lease finance obligation and as interest expense. Depreciation expense for the related capitalized lease assets is included in store expenses in the consolidated statements of income. At the end of the lease term, the offsetting balances of the capitalized assets, net of accumulated depreciation, and the capital lease finance obligation will be derecognized.
Capital lease obligations obligations for assets under construction
The Company had recorded approximately zero$4.6 million and $1.0$1.5 million forin construction in process related to capital lease obligations for assets under construction as of September 30, 20162019 and 2015,2018, respectively. The lease that created the obligation as of September 30, 2015 expires or becomes subject to renewal clauses in fiscal year 2041. The Company will not recordNo rent expense is recorded for these leases, butleases; rather, rental payments under the leases will be recognized as a reduction of the capital lease obligation and as interest expense. Depreciation expense for the related capitalized lease assets is included in store expenses in the consolidated statements of income. At the end of the lease term, the offsetting balances of the capitalized assets, net of accumulated depreciation, and the capital lease obligation will be $0.
Future payments for capital lease finance obligations and capitallease obligations
Future paymentsunderpayments under the terms of the leases for opened stores included in capital lease finance obligations and capital lease obligations as of September 30, 20162019 are as follows, dollars in thousands:
Interest | Principal | Interest | Principal payments on | Total future capital lease finance and capital lease obligations | ||||||||||||||||
2017 | $ | 2,793 | 261 | 528 | 214 | 3,796 | ||||||||||||||
2018 | 2,768 | 300 | 505 | 236 | 3,809 | |||||||||||||||
2019 | 2,737 | 367 | 481 | 261 | 3,846 | |||||||||||||||
2020 | 2,701 | 405 | 453 | 288 | 3,847 | |||||||||||||||
2021 | 2,658 | 479 | 423 | 319 | 3,879 | |||||||||||||||
Thereafter | 14,751 | 5,220 | 2,511 | 3,895 | 26,377 | |||||||||||||||
Non-cash derecognition of capital lease finance obligations at end of lease term | — | 18,587 | — | — | 18,587 | |||||||||||||||
| Total payments | $ | 28,408 | 25,619 | 4,901 | 5,213 | 64,141 | ||||||||||||||
Interest | Principal |
Interest |
Principal payments on | Total future | ||||||||||||||||
2020 | $ | 3,871 | 569 | 605 | 333 | 5,378 | ||||||||||||||
2021 | 3,816 | 656 | 570 | 368 | 5,410 | |||||||||||||||
2022 | 3,751 | 747 | 532 | 407 | 5,437 | |||||||||||||||
2023 | 3,675 | 880 | 488 | 460 | 5,503 | |||||||||||||||
2024 | 3,578 | 1,095 | 439 | 515 | 5,627 | |||||||||||||||
Thereafter | 15,088 | 8,244 | 2,142 | 3,889 | 29,363 | |||||||||||||||
Non-cash derecognition of capital lease finance obligations at end of lease term | — | 27,367 | — | — | 27,367 | |||||||||||||||
Total future payments | $ | 33,779 | 39,558 | 4,776 | 5,972 | 84,085 | ||||||||||||||
Future paymentsunderpayments under the terms of the lease for the store locationlocations at which construction was in progress as of September 30, 2016,2019, based on the store’s planned opening date in the second quarter of fiscal year 2020, are as follows, dollars in thousands:
Interest expense on capital lease finance obligations for assets under construction | Principal payments on | Total future payments on capital lease finance obligations for assets under construction | ||||||||||
2020 | $ | 118 | 18 | 136 | ||||||||
2021 | 161 | 26 | 187 | |||||||||
2022 | 160 | 28 | 188 | |||||||||
2023 | 158 | 30 | 188 | |||||||||
2024 | 155 | 33 | 188 | |||||||||
Thereafter | 1,368 | 756 | 2,124 | |||||||||
Non-cash derecognition of capital lease finance obligations at end of lease term | — | 1,459 | 1,459 | |||||||||
Total future payments | $ | 2,120 | 2,350 | 4,470 | ||||||||
Future payments under the terms of the lease for the store locations at which construction was in progress as of September 30, 2019, based on the store’s opening date in the first quarter of fiscal year 2017,2020, are as follows, dollars in thousands:
Interest expense on capital lease financeobligations for assets under construction | Principal payments on for assets under construction | Total futurepayments on capital leasefinance obligations for assets under construction | ||||||||||
2017 | $ | 135 | 2 | 137 | ||||||||
2018 | 164 | 3 | 167 | |||||||||
2019 | 164 | 4 | 168 | |||||||||
2020 | 163 | 4 | 167 | |||||||||
2021 | 163 | 5 | 168 | |||||||||
Thereafter | 1,450 | 396 | 1,846 | |||||||||
Non-cash derecognition of capital lease finance obligations at end of lease term | — | 661 | 661 | |||||||||
| Total payments | $ | 2,239 | 1,075 | 3,314 | ||||||||
Interest expense on capital lease obligations for assets under construction | Principal payments on | Total future payments on capital lease obligations for assets under construction | ||||||||||
2020 | $ | 237 | 123 | 360 | ||||||||
2021 | 236 | 132 | 368 | |||||||||
2022 | 228 | 139 | 367 | |||||||||
2023 | 221 | 147 | 368 | |||||||||
2024 | 213 | 155 | 368 | |||||||||
Thereafter | 1,827 | 3,944 | 5,771 | |||||||||
Total future payments | $ | 2,962 | 4,640 | 7,602 | ||||||||
11. Share-Based12. Share-Based Compensation
The Company adopted the 2012 Omnibus Incentive Plan (the(as amended, the Plan) on July 17, 2012. Restricted stock unit awards granted pursuant to the Plan, if they vest, will be settled in new shares of the Company’s common stock or shares of common stock held in treasury. At the adoption of the Plan, there were 1,090,151 shares of common stock available for issuance or delivery under the Plan. In March 2019, the Company’s stockholders approved a proposal to amend the Plan to: (i) increase the number of which 599,790shares of common stock reserved for issuance thereunder by 600,000 shares and (ii) extend its term by five years. As of September 30, 2019, 757,645 shares of common stock remain available for grants as of September 30, 2016.under the Plan. The Plan provides for awards of options, stock appreciation rights, stock grants, restricted stock units, other share-based awards and cash-based incentive awards to officers, members of the Board of Directors (the Board) and certain employees who are not named executive officers and consultants. As of September 30, 2016, only2019, restricted stock units had been granted under the Plan, at no out-of-pocket cost to officers, Board members and key employees. These restricted stock units vest subject to requisite service requirements, immediately in part or annually in installments over a one-to-five year period. The award recipients are not entitled to cash dividends or to vote with regard to non-vested restricted stock units, and the units are subject to forfeiture during the vesting period. Restricted stock units are granted at the market price of the Company’s stock on the date of grant and are expensed on a straight-line basis over the vesting period.
The shares of non-vested restricted stock units as of September 30, 20162019 were as follows:
Shares | Weighted average grant date fair value | Shares | Weighted average grant date fair value | |||||||||||||
Non-vested as of September 30, 2014 | 37,194 | $ | 34.77 | |||||||||||||
Non-vested as of September 30, 2017 | 70,346 | $ | 21.56 | |||||||||||||
Granted | 127,751 | 24.14 | 396,949 | 8.88 | ||||||||||||
Forfeited | (17,560 | ) | 25.04 | (15,626 | ) | 12.01 | ||||||||||
Vested | (15,529 | ) | 32.34 | (32,687 | ) | 17.97 | ||||||||||
Non-vested as of September 30, 2015 | 131,856 | 26.05 | ||||||||||||||
Non-vested as of September 30, 2018 | 418,982 | 10.19 | ||||||||||||||
Granted | 20,790 | 20.68 | 28,534 | 14.48 | ||||||||||||
Forfeited | (26,601 | ) | 25.36 | (10,720 | ) | 9.06 | ||||||||||
Vested | (33,459 | ) | 27.50 | (120,440 | ) | 11.31 | ||||||||||
Non-vested as of September 30, 2016 | 92,586 | 24.52 | ||||||||||||||
Non-vested as of September 30, 2019 | 316,356 | 10.18 | ||||||||||||||
During the year ended September 30, 2019, the Company awarded stock grants totaling 8,300 shares of the Company’s common stock to 74 employees who were not named executive officers. Such shares were fully vested on the grant date.
Share-based compensation expense for restricted stock unit awards to certain employees who are not named executive officers was approximately $0.7$0.8 million, $0.4$0.5 million and $0.4$0.6 million for the years ended September 30, 2016, 2015,2019, 2018 and 2014,2017, respectively. Share-based compensation expense for restricted stock unit awards to one named executive officer was $0.2 million and $0.1 million for the years ended September 30, 2019 and 2018, respectively. There was no share-based compensation expense for any named executive officer for the year ended September 30, 2017.
Prior to fiscal year 2015, eachEach independent member of the Board was annually granted a number of non-vested restricted stock units under the Plan equal to the number of shares of common stock having a value equal to $50,000 (based on the closing price of common stock on the New York Stock Exchange on the date of grant). In December 2014, the disinterested members of the Board increased the value of thereceives an annual grant of restricted stock to each independent directorunits equal to $60,000 (based on the closing price of common stock on the New York Stock Exchange on the date of grant). Such grants are made each year on the date of the Company’s annual meeting of stockholders, or on a pro rata basis in the case of a mid-year appointment. Share-based compensation expense for the Company’s awards to its Board members was approximately $0.2 million $0.2 million and $0.1 million for each of the years ended September 30, 2016, 20152019, 2018 and 2014, respectively.2017.
The Company recorded total share-based compensation expense before income taxes of approximately $0.9$1.2 million, $0.6$0.8 million and $0.5$0.8 million in the years ended September 30, 2016, 2015,2019, 2018 and 2014,2017, respectively. The share-based compensation expense is included in cost of goods sold and occupancy expenses, store expenses or administrative expenses in the consolidated statements of income consistent with the manner in which the applicable officer, Board member or key employee’s compensation expense is presented. The Company did not realize a tax benefit from share-based compensation expense in the years ended September 30, 20162019, 2018 and 2015 and realized a tax benefit from share-based compensation expense of approximately $0.4 million in the year ended September 30, 2014.2017.
As of September 30, 2016,2019, there was approximately $1.9$2.3 million of unrecognized share-based compensation expense related to non-vested restricted stock units, net of estimated forfeitures, which the Company anticipates will be recognized over a weighted average period of approximately three years.
13. Stockholders’ Equity
12.Stockholders’ Equity
Share Repurchases
OnIn May 5, 2016, the Board authorized a two-year share repurchase program pursuant to which the Company may repurchase up to $10.0 million in shares of the Company’s common stock.Repurchasesstock. In May 2018, the Board authorized a two-year extension of the share repurchase program. As a result of such extension, the share repurchase program will terminate on May 4, 2020. Repurchases under the Company’s share repurchase program are made from time to time at management’s discretion on the open market or through privately negotiated transactions in compliance with Rule 10b-18 under the Securities Exchange Act of 1934, as amended(theamended (the Exchange Act), subject to market conditions, applicable legal requirements and other relevant factors. Repurchases of common stock may also be made under a Rule 10b5-1 plan, which would permitpermits common stock to be repurchased when the Company might otherwise be precluded from doing so under insider trading laws. The share repurchase program does not obligate the Company to purchase any particular amount of common stock and may be suspended, modified or discontinued by the Company without prior notice.
The following table summarizes share repurchase activity for the periods indicated (in thousands, except number of shares acquired and average per share cost):periods:
As of September 30, | ||||||||
2016 | 2015 | |||||||
Number of common shares acquired | 67,970 | — | ||||||
Average price per common share acquired (including commissions) | $ | 12.20 | — | |||||
Total cost of common shares acquired | $ | 829 | — | |||||
Year ended September 30, | ||||||||
2019 | 2018 | |||||||
Total number of common shares acquired | — | 101,573 | ||||||
Average price per common share acquired (including commissions) | $ | — | 5.72 | |||||
Total cost of common shares acquired (in thousands) | $ | — | 581 | |||||
During fiscal years 20162019 and 2015,2018, the Company reissued 10,30089,675 and 26,899 treasury shares at a cost of $0.1$0.7 million and zero treasury shares,$0.2 million, respectively, to partially satisfy the issuance of common stock pursuant to the vesting of certain restricted stock unit awards.Atawards and the award of stock grants. At September 30, 20162019 and September 30, 2015,2018, the Company held in treasury 57,670 shares47,222 and zero136,897 shares, respectively, totaling approximately $0.7$0.4 million and zero,$1.0 million, respectively.
Between October 1and December 2,2016 (the latest practicable date for making the determination), the Company has not repurchased any additional shares of the Company’s common stock.
13.14. Related Party Transactions
The Company has ongoing relationships with related parties as noted:
Chalet Properties, LLC:LLC: The Company has fivefour operating leases and one capital lease finance obligation (see Note 10)11) with Chalet. One additional operating lease with Chalet, Properties, LLC (Chalet).for the Austin Property, terminated on September 9, 2019 concurrently with Chalet’s sale of the Austin Property. Chalet is owned by the Company’s four non-independent Board members, Kemper Isely, Zephyr Isely, Heather Isely and Elizabeth Isely, and other related family members. Rent paid to Chalet was approximately $1.2 million $1.1, million and $1.3 million for each of the years ended September 30, 2016, 20152019, 2018 and 2014, respectively. During the year ended September 30, 2015, Chalet sold one property to a third party in connection with one of the Company’s planned store relocations for the year ended September 30, 2016. The Company leased a new property with a non-related party for the relocated store’s new location. During the quarter ended December 31, 2014, the Company amended an existing lease with Chalet to obtain additional square footage at one Company store. Due to the Company’s involvement with construction for the additional space, the amended lease was deemed to be a capital financing lease in the quarter ended December 31, 2014.2017.
Isely Family Land TrustLLC: The Company has one operating lease (see Note 10)11) with the Isely Family Land Trust LLC (Land Trust).Trust. The Land Trust is owned by the Isely Children’s Trust and by the Margaret A. Isely Family Trust. Rent paid to the Land Trust was approximately $0.3 million for each of the years ended September 30, 2016, 2015,2019, 2018 and 2014.2017.
FTVC LLC:The Company has one operating lease (see Note 11) for a store location with FTVC LLC, which is owned by the Company’s four non-independent Board members and other related family members. Rent paid to FTVC LLC was less than $0.1 million for each of the years ended September 30, 20162019, 2018 and 2015 and zero for the year ended September 30, 2014.2017.
14.15. Income Taxes
The following are the components of the provision for income taxes as of September 30, 2016, 20152019, 2018 and 2014,2017, respectively, dollars in thousands:
Year ended September30, | Year ended September 30, | |||||||||||||||||||||||
2016 | 2015 | 2014 | 2019 | 2018 | 2017 | |||||||||||||||||||
Current federal income tax (benefit) expense | $ | (853 | ) | 7,769 | 8,304 | $ | (1,981 | ) | 3,083 | 2,837 | ||||||||||||||
Current state income tax (benefit) expense | (254 | ) | 1,033 | 1,163 | ||||||||||||||||||||
Current state income tax expense | 406 | 721 | 336 | |||||||||||||||||||||
| Total current income tax (benefit) expense | (1,107 | ) | 8,802 | 9,467 | (1,575 | ) | 3,804 | 3,173 | ||||||||||||||||
Deferred federal income tax expense (benefit) | 6,103 | 514 | (1,112 | ) | 3,760 | (5,760 | ) | 206 | ||||||||||||||||
Deferred state income tax expense (benefit) | 868 | 116 | (74 | ) | 213 | (212 | ) | 35 | ||||||||||||||||
| Total deferred income tax expense (benefit) | 6,971 | 630 | (1,186 | ) | 3,973 | (5,972 | ) | 241 | ||||||||||||||||
Total provision for income taxes | $ | 5,864 | 9,432 | 8,281 | ||||||||||||||||||||
Total provision for (benefit from) income taxes | $ | 2,398 | (2,168 | ) | 3,414 | |||||||||||||||||||
The differences between the United States federal statutory income tax rate and the Company’s effective tax rate are as follows:
Year ended September30, | Year ended September 30, | |||||||||||||||||||||||
2016 | 2015 | 2014 | 2019 | 2018 | 2017 | |||||||||||||||||||
Statutory tax rate | 34.0 | % | 35.0 | 35.0 | 21.0 | % | 24.3 | 34.0 | ||||||||||||||||
State income taxes, net of federal income tax expense | 2.9 | 2.9 | 3.0 | 3.7 | 3.3 | 2.7 | ||||||||||||||||||
Remeasurement | — | (41.3 | ) | — | ||||||||||||||||||||
Enhanced food deduction | (1.3 | ) | (1.8 | ) | (2.7 | ) | ||||||||||||||||||
Deferred tax liability adjustment | (0.5 | ) | (6.3 | ) | — | |||||||||||||||||||
Other, net | (3.0 | ) | (1.1 | ) | 0.1 | (2.6 | ) | 1.1 | (0.9 | ) | ||||||||||||||
Effective tax rate | 33.9 | % | 36.8 | 38.1 | 20.3 | % | (20.7 | ) | 33.1 | |||||||||||||||
The Company’s effective tax rate decreasedincreased from 36.8%(20.7)% in the year ended September 30, 20152018 to 33.9%20.3% in the year ended September 30, 20162019 primarily due to remeasurement of the Company’s deferred tax balance as a revisionresult of the Tax Reform Act, which resulted in its estimated annual federala non-cash tax rate from 35% to 34% and federal and state tax credits in its fiscal 2015 tax return that were higher than previously estimated in the provisionbenefit of $4.3 million for the year ended September 30, 2015.2018.
The Company has early adopted the requirements of ASU No. 2015-17 and applied the amended provisions prospectively. Deferred taxes have been classified on the consolidated balance sheets as follows, dollars in thousands:
As of September30, | ||||||||
2016 | 2015 | |||||||
Current assets | $ | — | 866 | |||||
Long-term liabilities | (12,178 | ) | (6,073 | ) | ||||
Net deferred tax liabilities | $ | (12,178 | ) | (5,207 | ) | |||
As of September 30, | ||||||||
2019 | 2018 | |||||||
Long-term assets | $ | — | — | |||||
Long-term liabilities | (10,420 | ) | (6,447 | ) | ||||
Net deferred tax liabilities | $ | (10,420 | ) | (6,447 | ) | |||
The tax effects of temporary differences that give rise to significant portions of deferred tax assets and deferred tax liabilities are as follows, dollars in thousands:
As of September30, | As of September 30, | |||||||||||||||
2016 | 2015 | 2019 | 2018 | |||||||||||||
Deferred tax assets | ||||||||||||||||
Capital and financing lease obligations | $ | 12,091 | 10,473 | $ | 12,951 | 10,022 | ||||||||||
Goodwill | 2,222 | 2,582 | 724 | 955 | ||||||||||||
Leasehold incentives | 3,187 | 3,025 | 1,963 | 2,180 | ||||||||||||
Deferred rent | 3,350 | 2,627 | 2,809 | 2,706 | ||||||||||||
Trademarks | 1,021 | 1,018 | 662 | 658 | ||||||||||||
Accrued employee benefits | 734 | 729 | 678 | 642 | ||||||||||||
Deferred compensation | — | 169 | ||||||||||||||
Other | 597 | 363 | 508 | 339 | ||||||||||||
Gross deferred tax assets | 23,202 | 20,817 | 20,295 | 17,671 | ||||||||||||
Deferred tax liabilities | ||||||||||||||||
Property and equipment | (32,103 | ) | (22,909 | ) | (28,380 | ) | (21,489 | ) | ||||||||
Leasehold improvements | (3,195 | ) | (3,087 | ) | (2,088 | ) | (2,407 | ) | ||||||||
Subleases | (203 | ) | (214 | ) | ||||||||||||
Other | (82 | ) | (28 | ) | (44 | ) | (8 | ) | ||||||||
Gross deferred tax liabilities | (35,380 | ) | (26,024 | ) | (30,715 | ) | (24,118 | ) | ||||||||
Net deferred tax liabilities | $ | (12,178 | ) | (5,207 | ) | $ | (10,420 | ) | (6,447 | ) | ||||||
The Company believes that it is more likely than not that it will fully realize all deferred tax assets in the form of future deductions based on the nature of the deductible temporary differences and expected future taxable income.
The Company utilized zero and less than $0.1 million in tax effected state income tax carryforwards in the each of the years ended September 30, 20162019 and 2015, respectively.2018.
The Company did not have any uncertain tax positions as of September 30, 2019 and 2018.
The Company files income tax returns with federal, state and local tax authorities. With limited exceptions, the Company is no longer subject to federal income tax examinations for fiscal years 20122016 and prior and is no longer subject to state and local income tax examinations for fiscal years 20112014 and prior.
15.16. Defined Contribution Plan
The Company has a defined contribution retirement plan (the Retirement Plan) covering substantially all employees who meet certain eligibility requirements as to age and length of service. The Retirement Plan incorporates the salary deferral provisions of Section 401(k) of the Internal Revenue Code of 1986, as amended (the Code). Employees may defer up to the annual maximum limit prescribed by the Code. The Company, on a discretionary basis, may match up to 25% of participant contributions up to a maximum annual employer match of $2,500. ForDuring the year ended September 30, 2016,2019, the Company did not make aaccrued $0.7 million for matching contribution duecontributions to be paid out after the Company’s failureplan year ending December 31, 2019. In January 2019, the Company funded matching contributions of $0.8 million to meet certain targets. In addition, duringparticipants’ accounts for the plan year ended September 30, 2016, the Company reversed a $0.2 million accrual for a matching contribution that was recorded during the year ended September 30, 2015 with respect to the year ended September 30, 2016. For the years ended September 30, 2015 and 2014, the Company’s matching contribution consisted of an expense of approximately $0.6 million and $0.1 million, respectively.December 31, 2018.
16.17. Segment Reporting
The Company has one reporting segment, natural and organic retail stores. The Company’s revenues are derived from the sale of natural and organic products at its stores. All existing operations are domestic.
Sales from the Company’s natural and organic retail stores are derived from sales of the following products which are presented as a percentage of sales for the years ended September 30, 2016, 20152019, 2018 and 20142017 as follows:
As of September30, | As of September 30, | |||||||||||||||||||||||
2016 | 2015 | 2014 | 2019 | 2018 | 2017 | |||||||||||||||||||
Grocery | 66.5 | % | 66.4 | 66.7 | 69 | % | 68 | 67 | ||||||||||||||||
Dietary supplements | 22.2 | 22.5 | 23.2 | 21 | 21 | 22 | ||||||||||||||||||
Body care, pet care and other | 11.3 | 11.1 | 10.1 | 10 | 11 | 11 | ||||||||||||||||||
| 100.0 | % | 100.0 | 100.0 | 100 | % | 100 | 100 | |||||||||||||||||
17.18. Commitments and Contingencies
Self-Insurance
The Company is self-insured for claims under its health benefit plans,certain losses relating to employee medical and dental benefits and workers compensation, subject to a stop loss policy. The self-insurance liability related to claims under the Company’s health benefit plans is determined based on analysis of actual claims. The amounts related to these claims are included as a component of payroll and employee-related expenses in accrued expenses. Liabilities associated with the risks that are retained by the Company are estimated, in part, by considering historical claims experience, demographic factors and other actuarial assumptions. While the Company believes that its assumptions are appropriate, the estimated accrual for these liabilities could be significantly affected if future occurrences and claims materially differ from these assumptions and historical trends.
Legal
The Company is periodically involved in various legal proceedings that are incidental to the conduct of its business, including but not limited to employment discrimination claims, customer injury claims and investigations. When the potential liability from a matter can be estimated and the loss is considered probable, the Company records the estimated loss. Due to uncertainties related to the resolution of lawsuits, investigations and claims, the ultimate outcome may differ from the estimates. Although the Company cannot predict with certainty the ultimate resolution of any lawsuits, investigations and claims asserted against it, management does not believe any currently pending legal proceeding to which the Company is a party will have a material adverse effect on its business, prospects, financial condition, cash flows or results of operations.
InBernhard Engl v. Natural Grocers by Vitamin Cottage, Inc. and Vitamin Cottage Natural Food Markets, Inc., filed on September 25, 2015 in the United States District Court for the District of Colorado, the plaintiff filed a lawsuit against the Company in connection with a data security incident that affected the Company during fiscal year 2015. The complaint purported to state an action on behalf of a class of customers who used debit or credit cards at the Company’s stores.On June 20, 2016, a Magistrate Judge of the United States District Court for the District of Colorado issued a Recommendation and Order dismissing the plaintiff’s complaint without prejudice. On September 21, 2016, the United States District Court for the District of Colorado issued an Opinion and Order adopting the Magistrate Judge’s Recommendation and dismissing the plaintiff’s complaint without prejudice. On November 10, 2016, the Company and the plaintiff entered into a Settlement Agreement and Release pursuant to which: (i) the plaintiff agreed not to appeal the Court’s dismissal of his complaint and (ii) the Company agreed not to seek reimbursement of its attorneys’ fees and legal costs from plaintiff.
18.19. Selected Quarterly Financial Data (Unaudited)
The summarized unaudited quarterly financial data presented below reflect all adjustments, which in the opinion of management are of a normal and recurring nature, necessary to present fairly the results of operations for the periods presented.
Summarized unaudited quarterly financial data for each fiscal year is as follows, dollars in thousands, except per share data:
Fiscal Year Ended September 30, 2016 | Three months ended | |||||||||||||||||||||||||||||||
Fiscal Year Ended September 30, 2019 | Three months ended | |||||||||||||||||||||||||||||||
December 31, | March 31, | June 30, | September 30, | December 31, | March 31, | June 30, | September 30, | |||||||||||||||||||||||||
Net sales | $ | 167,786 | 177,395 | 179,274 | 181,044 | $ | 221,515 | 230,447 | 224,411 | 227,209 | ||||||||||||||||||||||
Cost of goods sold and occupancy costs | 119,491 | 125,792 | 128,344 | 130,100 | 162,369 | 168,233 | 165,986 | 168,241 | ||||||||||||||||||||||||
Gross profit | 48,295 | 51,603 | 50,930 | 50,944 | 59,146 | 62,214 | 58,425 | 58,968 | ||||||||||||||||||||||||
Store expenses | 35,899 | 38,774 | 40,095 | 41,390 | 49,123 | 50,175 | 48,424 | 50,070 | ||||||||||||||||||||||||
Administrative expenses | 4,754 | 4,936 | 4,813 | 4,739 | 5,315 | 5,761 | 5,953 | 5,808 | ||||||||||||||||||||||||
Pre-opening and relocation expenses | 948 | 1,444 | 2,007 | 1,594 | 672 | 157 | 213 | 316 | ||||||||||||||||||||||||
Operating income | 6,694 | 6,449 | 4,015 | 3,221 | 4,036 | 6,121 | 3,835 | 2,774 | ||||||||||||||||||||||||
Interest expense | (653 | ) | (733 | ) | (768 | ) | (890 | ) | ||||||||||||||||||||||||
Interest expense, net | (1,255 | ) | (1,280 | ) | (1,256 | ) | (1,161 | ) | ||||||||||||||||||||||||
Income before income taxes | 6,041 | 5,716 | 3,247 | 2,331 | 2,781 | 4,841 | 2,579 | 1,613 | ||||||||||||||||||||||||
Provision for income taxes | (2,293 | ) | (2,139 | ) | (567 | ) | (865 | ) | (584 | ) | (981 | ) | (581 | ) | (252 | ) | ||||||||||||||||
Net income . | $ | 3,748 | 3,577 | 2,680 | 1,466 | |||||||||||||||||||||||||||
Net income | $ | 2,197 | 3,860 | 1,998 | 1,361 | |||||||||||||||||||||||||||
Basic earnings per share | $ | 0.17 | 0.16 | 0.12 | 0.07 | $ | 0.10 | 0.17 | 0.09 | 0.06 | ||||||||||||||||||||||
Diluted earnings per share | 0.17 | 0.16 | 0.12 | 0.07 | $ | 0.10 | 0.17 | 0.09 | 0.06 | |||||||||||||||||||||||
Fiscal Year Ended September 30, 2015 | Three months ended | |||||||||||||||||||||||||||||||
Fiscal Year Ended September 30, 2018 | Three months ended | |||||||||||||||||||||||||||||||
December 31, | March 31, | June 30, | September 30, | December 31, | March 31, | June 30, | September 30, | |||||||||||||||||||||||||
Net sales | $ | 145,887 | 157,744 | 158,650 | 162,397 | $ | 202,480 | 215,911 | 213,130 | 217,521 | ||||||||||||||||||||||
Cost of goods sold and occupancy costs | 103,593 | 110,874 | 112,508 | 115,607 | 149,321 | 157,630 | 156,299 | 160,219 | ||||||||||||||||||||||||
Gross profit | 42,294 | 46,870 | 46,142 | 46,790 | 53,159 | 58,281 | 56,831 | 57,302 | ||||||||||||||||||||||||
Store expenses | 31,049 | 32,461 | 33,508 | 35,113 | 45,166 | 46,480 | 47,000 | 48,095 | ||||||||||||||||||||||||
Administrative expenses | 4,227 | 4,156 | 4,322 | 4,809 | 5,257 | 5,458 | 5,630 | 5,161 | ||||||||||||||||||||||||
Pre-opening and relocation expenses | 577 | 870 | 1,078 | 1,297 | 543 | 697 | 443 | 590 | ||||||||||||||||||||||||
Operating income | 6,441 | 9,383 | 7,234 | 5,571 | 2,193 | 5,646 | 3,758 | 3,456 | ||||||||||||||||||||||||
Interest expense | (735 | ) | (714 | ) | (768 | ) | (776 | ) | ||||||||||||||||||||||||
Interest expense, net | (1,089 | ) | (1,122 | ) | (1,170 | ) | (1,179 | ) | ||||||||||||||||||||||||
Income before income taxes | 5,706 | 8,669 | 6,466 | 4,795 | 1,104 | 4,524 | 2,588 | 2,277 | ||||||||||||||||||||||||
Provision for income taxes | (2,142 | ) | (3,266 | ) | (2,121 | ) | (1,903 | ) | ||||||||||||||||||||||||
Benefit from (provision for) income taxes | 4,077 | (1,120 | ) | (597 | ) | (192 | ) | |||||||||||||||||||||||||
Net income | $ | 3,564 | 5,403 | 4,345 | 2,892 | $ | 5,181 | 3,404 | 1,991 | 2,085 | ||||||||||||||||||||||
Basic earnings per share | $ | 0.16 | 0.24 | 0.19 | 0.13 | $ | 0.23 | 0.15 | 0.09 | 0.10 | ||||||||||||||||||||||
Diluted earnings per share | 0.16 | 0.24 | 0.19 | 0.13 | $ | 0.23 | 0.15 | 0.09 | 0.09 | |||||||||||||||||||||||
1920. Subsequent Events
On October 7, 2016,November 13, 2019, the Company completedBoard approved the initiation of a sale-leaseback transaction for a store building with an unrelated party for proceedsquarterly cash dividend per share of approximately $2.6 million. Concurrent withcommon stock. The initial quarterly cash dividend of $0.07 per share of common stock will be paid on December 17, 2019 to stockholders of record as of the sale,close of business on December 2, 2019.
On November 13, 2019, the Companyoperating company entered into an agreementthe third amendment to lease the property back fromCredit Facility (the “Third Amendment”). Pursuant to the purchaser over an initial lease term of 15 years. ForThird Amendment: (i) the year ended September 30, 2016, the building is considered to be held for sale. The Company anticipates a loss on the salematurity date of the buildingCredit Facility was extended to November 13, 2024; (ii) the operating company may pay cash dividends to Natural Grocers in an amount sufficient to allow Natural Grocers to repurchase shares of approximately $0.3common stock and pay dividends on its common stock in an aggregate amount not to exceed $10.0 million which will be deferredduring any fiscal year; and recognized over(iii) certain other modifications were made to the initial lease term.Credit Facility.
Item 9.Changes in and Disagreements with Accountants on Accounting and Financial Disclosure.
None.
Item9A. Controls and Procedures.
Internal Control Over Financial Reporting
Management is responsible for establishing and maintaining adequate internal control over financial reporting, as defined in Rule 13a-15(f) promulgated under the Exchange Act. Internal control over financial reporting is designed to provide reasonable assurance regarding the reliability of financial reporting and preparation of consolidated financial statements for external purposes in accordance with GAAP. Our internal control over financial reporting includes those policies and procedures that:
● | pertain to the maintenance of records that, in a reasonable detail, accurately and fairly reflect the dispositions of our transactions and assets; |
● | provide reasonable assurance that transactions are recorded as necessary to permit preparation of consolidated financial statements in accordance with generally accepted accounting principles, and that our receipts and expenditures are being made only in accordance with authorizations of our management and directors; and |
● | provide reasonable assurance regarding prevention or timely detection of unauthorized acquisitions, use or disposition of our assets that could have a material adverse effect on the consolidated financial statements. |
Because of its inherent limitations, internal control over financial reporting may not prevent or detect misstatements. Also, projections of any evaluation of effectiveness to future periods are subject to the risk that controls may become inadequate because of changes in conditions, or that the degree of compliance with the policies or procedures may deteriorate.
We have assessed the effectiveness of our internal control over financial reporting as of September 30, 20162019 using the criteria described in Internal Control – Integrated Framework (2013) issued by the Committee of Sponsoring Organizations of the Treadway Commission. Based on our assessment of the design and related testing of the internal control over financial reporting, management concluded that, as of September 30, 2016,2019, we maintained effective internal control over financial reporting.
Our independent registered public accounting firm, KPMG LLP, audited the effectiveness of our internal control over financial reporting. KPMG LLP’s attestation report is included in “Item 8. Financial Statements and Supplementary Data” of this Form 10-K.
Changes in Internal Control over Financial Reporting
Management implemented additional internal controls over financial reporting to ensure compliance with “Topic 842”, “Leases” (ASU 2016-02). There were no other changes in our internal control over financial reporting during the quarter ended September 30, 2019 that materially affected, or are reasonably likely to materially affect, our internal control over financial reporting.
Evaluation of Disclosure Controls and Procedures
Our management, with the participation of our principal executive officers and principal financial and accounting officer, evaluated the effectiveness of our disclosure controls and procedures pursuant to Rule 13a-15 under the Exchange Act as of the end of the period covered by this Form 10-K. The evaluation included certain internal control areas in which we have made and are continuing to make changes to improve and enhance controls. In designing and evaluating the disclosure controls and procedures, management recognized that any controls and procedures, no matter how well designed and operated, can provide only reasonable assurance of achieving the desired control objectives. In addition, the design of disclosure controls and procedures must reflect the fact that there are resource constraints and that management is required to apply its judgment in evaluating the benefits of possible controls and procedures relative to their costs.
Based on that evaluation, our principal executive officers and principal financial and accounting officer concluded that our disclosure controls and procedures were effective at a reasonable assurance level as of September 30, 2016.2019.
Changes in Internal Control over Financial Reporting
There were no changes in our internal control over financial reporting during the quarter ended September 30, 2016 that materially affected, or are reasonably likely to materially affect, our internal control over financial reporting.
Item9B. 9B. Other Information.
None.
PARTIII
Item 10. Directors,, Executive Officers and Corporate Governance.
The information required by this item is incorporated herein by reference to the information provided under the headings “Executive Officers and Directors,” “Corporate Governance” and “Section 16(a) Beneficial Ownership Reporting Compliance” in our Definitive Proxy Statement on Schedule 14A for the 20162020 Annual Meeting of Stockholders to be filed with the SEC within 120 days of September 30, 20162019 (the “2017“2020 Proxy Statement”). We have adopted a codeCode of business conduct and ethicsEthics that establishes the standards of ethical conduct applicable to all of our directors, officers, including our principal executive, financial and accounting officers, employees, consultants and contractors. Our codeCode of business conduct and ethicsEthics is publicly available on our website atwww.naturalgrocers.com and we will post any amendments to, or waivers from, a provision of this Code of Business Conduct and Ethics by posting such information on our website, at the address and location specified above.
Item 11. ExecutiveCompensation.
The information required by this item is incorporated herein by reference to the information in the 20172020 Proxy Statement under the headings “Executive Compensation” and “Director Compensation.”
Item 12. Security Ownershipof Certain Beneficial Owners and Management and Related Stockholder Matters.
The information required by this item concerning securities authorized for issuance under equity compensation plans and security ownership of certain beneficial owners and management is incorporated by reference to the information in the 20172020 Proxy Statement under the headings “Securities Authorized for Issuance Under Equity Compensation Plans” and “Security Ownership of Certain Beneficial Owners and Management.”
Item 13. CertainRelationships and Related Transactions, and Director Independence.
The information required by this item concerning transactions with related persons and director independence is incorporated by reference to the information in the 20172020 Proxy Statement under the headings “Certain Relationships and Related Party Transactions” and “Corporate Governance.”
Item 14. PrincipalAccounting Fees and Services.
The information required by this item is incorporated by reference to the information in the 20172020 Proxy Statement under the heading “Ratification of Independent Registered Public Accounting Firm—Principal Accounting Fees and Services.”
PARTIV
Item 15. Exhibitsand Financial Statement SchedulesSchedules..
1. | Financial Statements: See Part II, Item 8 of this Form 10-K. |
2. | Financial Statement Schedules: Schedules not listed above have been omitted because the information required to be set forth therein is not applicable or is shown in the financial statements or notes herein. |
|
|
SIGNATURES
Pursuant to the requirements of Section 13 or 15(d) of the Securities Exchange Act of 1934, the registrant has duly caused this report to be signed on its behalf by the undersigned, thereunto duly authorized on December 8, 2016.
| ||
| 3. | ||
|
| |
| ||
| ||
Pursuant to the requirements of the Securities Exchange Act of 1934, this report has been signed below by the following persons in the capacities and on the dates indicated.EXHIBIT INDEX
|
|
| ||
|
| |||
|
|
| ||
|
| |||
|
|
| ||
|
| |||
|
|
| ||
|
| |||
|
| |||
|
| |||
|
| |||
|
| |||
|
| |||
|
| |||
|
| |||
|
| |||
|
|
Exhibit | Description | Form | File No. | Exhibit | Filing Date | ||||||
3.1 | Form S-1 | 333-182186 | 3.1 | July 5, 2012 | |||||||
3.2 | Form S-1 | 333-182186 | 3.2 | July 5, 2012 | |||||||
4.1 | |||||||||||
4.2 | Form S-1 | 333-182186 | 4.2 | July 20, 2012 | |||||||
4.3 | Form S-8 | 333-182886 | 4.2 | July 27, 2012 | |||||||
4.4 | Form S-1 | 333-182186 | 4.3 | July 5, 2012 | |||||||
4.5 | — | — | — | — | |||||||
4.6 | — | — | — | — | |||||||
10.1 | Form 10-Q | 001-35608 | 10.1 | January 29, 2015 | |||||||
10.16 | Form S-1 | 333-182186 | 10.16 | July 5, 2012 | |||||||
10.17 | Summary of Compensation Arrangements for Non-Employee Directors* | Form S-1 | 333-182186 | 10.17 | June 29, 2012 | ||||||
10.18 | Form S-1 | 333-182186 | 10.18 | June 29, 2012 | |||||||
10.19 | Form S-1 | 333-182186 | 10.19 | June 29, 2012 | |||||||
10.20 | Form S-1 | 333-182186 | 10.20 | June 29, 2012 | |||||||
10.21 | Form S-1 | 333-182186 | 10.21 | June 29, 2012 | |||||||
10.22 | Form S-1 | 333-182186 | 10.22 | June 29, 2012 | |||||||
10.23 | Form S-1 | 333-182186 | 10.23 | June 29, 2012 | |||||||
10.24 | Form S-1 | 333-182186 | 10.24 | June 29, 2012 | |||||||
10.25 | Form S-1 | 333-182186 | 10.25 | June 29, 2012 | |||||||
10.26 | Form S-1 | 333-182186 | 10.26 | June 29, 2012 | |||||||
10.27 | Form S-1 | 333-182186 | 10.27 | June 29, 2012 | |||||||
10.28 | Form S-1 | 333-182186 | 10.28 | June 29, 2012 |
EXHIBITINDEX
Exhibit | Description | Form | FileNo. | Exhibit | FilingDate | |||||
3.1 | Amended and Restated Certificate of Incorporation | Form S-1 | 333-182186 | 3.1 | July 5, 2012 | |||||
3.2 | Amended and Restated Bylaws | Form S-1 | 333-182186 | 3.2 | July 5, 2012 | |||||
4.1 | Reference is made to Exhibits 3.1 and 3.2 | |||||||||
4.2 | Specimen Common Stock Certificate | Form S-1 | 333-182186 | 4.2 | July 20, 2012 | |||||
4.3 | Form of Notice of Grant of Stock Unit Award | Form S-8 | 333-182886 | 4.2 | July 27, 2012 | |||||
4.4 | Form of Registration Rights Agreement | Form S-1 | 333-182186 | 4.3 | July 5, 2012 | |||||
10.1 | Second Amended and Restated Employment Agreement by and between Vitamin Cottage Natural Food Markets, Inc., Natural Grocers by Vitamin Cottage, Inc. and Sandra M. Buffa, dated June 26, 2012* | Form 10-Q | 001-35608 | 10.1 | January 29, 2015 | |||||
10.16 | Form of Omnibus Incentive Plan* | Form S-1 | 333-182186 | 10.16 | July 5, 2012 | |||||
10.17 | Summary of Compensation Arrangements for Non-Employee Directors* | Form S-1 | 333-182186 | 10.17 | June 29, 2012 | |||||
10.18 | Form of Indemnification Agreement* | Form S-1 | 333-182186 | 10.18 | June 29, 2012 | |||||
10.19 | Shopping Center Lease by and between Chalet Properties, LLC and Vitamin Cottage Natural Food Markets, Inc., dated January 1, 2010 | Form S-1 | 333-182186 | 10.19 | June 29, 2012 | |||||
10.20 | Ground lease by and between 3801 East Second Avenue, LLC and Vitamin Cottage Natural Food Markets, Inc., dated March 1, 2001 | Form S-1 | 333-182186 | 10.20 | June 29, 2012 | |||||
10.21 | Commercial Lease by and between Chalet Properties, LLC and Vitamin Cottage Natural Food Markets, Inc., dated June 1, 2006 | Form S-1 | 333-182186 | 10.21 | July 5, 2012 | |||||
10.22 | Sublease by and between Chalet Properties, LLC and Vitamin Cottage Natural Food Markets, Inc., dated June 1, 2006 | Form S-1 | 333-182186 | 10.22 | June 29, 2012 | |||||
10.23 | Lease by and between Chalet Properties, LLC and Vitamin Cottage Natural Food Markets, Inc., dated September 1, 2011 | Form S-1 | 333-182186 | 10.23 | June 29, 2012 | |||||
10.24 | Lease by and between Chalet Properties, LLC and Boulder Vitamin Cottage Group, LLC, dated July 1, 2011 | Form S-1 | 333-182186 | 10.24 | June 29, 2012 | |||||
10.25 | Lease by and between Isely Family Land Trust, LLC and Vitamin Cottage Natural Food Markets, Inc., dated February 29, 2012 | Form S-1 | 333-182186 | 10.25 | June 29, 2012 | |||||
10.26 | Lease by and between Chalet Properties, Austin, LLC and Vitamin Cottage Natural Food Markets, Inc., dated February 29, 2012 | Form S-1 | 333-182186 | 10.26 | June 29, 2012 | |||||
10.27 | Building Lease by and between Chalet Properties, LLC and Vitamin Cottage Natural Food Markets, Inc., dated December 8, 2010 | Form S-1 | 333-182186 | 10.27 | June 29, 2012 | |||||
10.28 | Distribution Agreement between United Natural Foods, Inc. and Vitamin Cottage Natural Food Markets, Inc., dated May 20, 2008# | Form S-1 | 333-182186 | 10.28 | June 29, 2012 | |||||
10.29 | Addendum A to Distribution Agreement between United Natural Foods, Inc. and Vitamin Cottage Natural Food Markets, Inc., dated February 27, 2009# | Form S-1 | 333-182186 | 10.29 | June 29, 2012 | |||||
10.30 | Agreement Addendum to Distribution Agreement between United Natural Foods, Inc. and Vitamin Cottage Natural Food Markets, Inc., dated March 10, 2012# | Form S-1 | 333-182186 | 10.30 | June 29, 2012 | |||||
10.31 | Third Amendment to Distribution Agreement between United Natural Foods, Inc. and Vitamin Cottage Natural Food Markets, Inc., dated June 3, 2012# | Form S-1 | 333-182186 | 10.31 | June 29, 2012 | |||||
10.32 | Form of Stockholders Agreement, by, between and among Natural Grocers by Vitamin Cottage, Inc. and the stockholders to be named therein | Form S-1 | 333-182186 | 10.32 | July 12, 2012 | |||||
10.39 | Credit Agreement dated as of January 28, 2016 by and among Vitamin Cottage Natural Food Markets, Inc., the Guarantors party thereto, the Lenders Party thereto and Bank of America, N.A., as Administrative Agent and L/C Issuer | Form 10-Q | 001-35608 | 10.39 | January 28, 2016 |
10.29 | Form S-1 | 333-182186 | 10.29 | June 29, 2012 | |||||||
10.30 | Form S-1 | 333-182186 | 10.30 | June 29, 2012 | |||||||
10.31 | Form S-1 | 333-182186 | 10.31 | June 29, 2012 | |||||||
10.32 | Form S-1 | 333-182186 | 10.32 | July 12, 2012 | |||||||
10.39 | Form 10-Q | 001-35608 | 10.39 | January 28, 2016 | |||||||
10.40 | Form 10-Q | 001-35608 | 10.40 | January 28, 2016 | |||||||
10.41 | Form 10-Q | 001-35608 | 10.41 | July 28, 2016 | |||||||
10.42 | Form 10-Q | 001-35608 | 10.42 | July 28, 2016 | |||||||
10.43 | Form 10-Q | 001-35608 | 10.43 | February 2, 2017 | |||||||
10.44 | Form 10-K | 001-35608 | 10.44 | December 7, 2018 | |||||||
10.45 | Form 10-K | 001-35608 | 10.45 | December 7, 2018 | |||||||
10.46 | Employment offer letter to Todd Dissinger dated December 5, 2017 | Form 10-Q | 001-35608 | 10.46 | February 1, 2018 | ||||||
10.47 | Notice of Grant of Stock Unit Award to Todd Dissinger dated January 2, 2018 | Form 10-Q | 001-35608 | 10.47 | February 1, 2018 | ||||||
10.48 | Form 10-Q | 001-35608 | 10.48 | August 2, 2018 | |||||||
10.49 | Natural Grocers by Vitamin Cottage, Inc. 2012 Omnibus Incentive Plan, as amended* | Form 8-K | 001-35608 | 10.49 | March 8, 2019 | ||||||
10.50 | Form 10-Q | 001-35608 | 10.49 | August 1, 2019 | |||||||
10.51 | — | — | — | — |
| Exhibit Number | Description | Form | FileNo. | Exhibit Number | FilingDate | |||||
10.40 | Security and Pledge Agreement dated as of January 28, 2016 by and among Vitamin Cottage Natural Food Markets, Inc., Natural Grocers by Vitamin Cottage, Inc., Vitamin Cottage Two Ltd. Liability Company, the other Obligors thereunder and Bank of America, N.A. | Form 10-Q | 001-35608 | 10.40 | January 28, 2016 | |||||
10.41 | Customer Distribution Agreement by and among United Natural Foods, Inc., Tony’s Fine Foods, Albert’s Organics and Vitamin Cottage Natural Food Markets, Inc. dated as of June 21, 2016# | Form 10-Q | 001-35608 | 10.41 | July 28, 2016 | |||||
10.42 | First Amendment to Credit Agreement dated as of May 10, 2016, by and among Vitamin Cottage Natural Food Markets, Inc., the Guarantors party thereto, the Lenders Party thereto and Bank of America, N.A., as Administrative Agent and L/C Issuer | Form 10-Q | 001-35607 | 10.42 | July 28, 2016 | |||||
14 | Code of Ethics | Form 10-K | 001-35608 | 14 | December 13, 2012 | |||||
21.1 | List of subsidiaries | Form 10-K | 001-35608 | 21.1 | December 13, 2012 | |||||
23.1 | Consent of KPMG LLP | — | — | — | — | |||||
31.1 | Certification of Kemper Isely, a Principal Executive Officer Required Under Section 302(a) of the Sarbanes-Oxley Act of 2002 | — | — | — | — | |||||
31.2 | Certification of Zephyr Isely, a Principal Executive Officer Required Under Section 302(a) of the Sarbanes-Oxley Act of 2002 | — | — | — | — | |||||
31.3 | Certification of Sandra Buffa, Principal Financial Officer Required Under Section 302(a) of the Sarbanes-Oxley Act of 2002 | — | — | — | — | |||||
32.1 | Certification of Principal Executive Officers and Principal Financial Officer Required Under 18 U.S.C. §1350, as adopted pursuant to Section 906 of the Sarbanes-Oxley Act of 2002† | — | — | — | — |
14 | Form 10-K | 001-35608 | 14 | December 13, 2012 | |||||||
21.1 | Form 10-K | 001-35608 | 21.1 | December 13, 2012 | |||||||
23.1 | — | — | — | — | |||||||
31.1 | — | — | — | — | |||||||
31.2 | — | — | — | — | |||||||
31.3 | — | — | — | — | |||||||
32.1 | — | — | — | — | |||||||
| 101 | The following materials from Natural Grocers by Vitamin Cottage, Inc.’s Annual Report on Form 10-K for the year ended September 30, 2019, formatted in XBRL (eXtensible Business Reporting Language): (i) Consolidated Balance Sheets, (ii) Consolidated Statements of Income, (iii) Consolidated Statements of Cash Flows, (iv) Consolidated Statements of Changes in Stockholders’ Equity, and (v) Notes to Consolidated Financial Statements. | ||||||||||
|
|
*Indicates a management contract or compensatory plan or arrangement
# Confidential portions have been omitted pursuant to a request for confidential treatment.
† The certifications attached as Exhibit 32.1 that accompany this Annual Report on Form 10-K, are not deemed filed with the Securities and Exchange Commission and are not to be incorporated by reference into any filing of Natural Grocers by Vitamin Cottage, Inc. under the Securities Act of 1933, as amended, or the Securities Exchange Act of 1934, as amended, whether made before or after the date of this Form 10-K, irrespective of any general incorporation language contained in such filing.
Pursuant to the requirements of Section 13 or 15(d) of the Securities Exchange Act of 1934, the registrant has duly caused this report to be signed on its behalf by the undersigned, thereunto duly authorized on December 5, 2019.
Natural Grocers by Vitamin Cottage, Inc. | ||
By: | /s/ KEMPER ISELY | |
Kemper Isely, | ||
Its Co-President | ||
Pursuant to the requirements of the Securities Exchange Act of 1934, this report has been signed below by the following persons in the capacities and on the dates indicated.
Name | Title | Date | ||
/s/ KEMPER ISELY | (Principal Executive Officer, Co-President, | |||
Kemper Isely | Director) | December 5, 2019 | ||
/s/ ZEPHYR ISELY | (Principal Executive Officer, Co-President, | |||
Zephyr Isely | Director) | December 5, 2019 | ||
/s/ TODD DISSINGER | (Principal Financial and Accounting Officer, | |||
Todd Dissinger | Chief Financial Officer) | December 5, 2019 | ||
/s/ ELIZABETH ISELY | Director | |||
Elizabeth Isely | December 5, 2019 | |||
/s/ HEATHER ISELY | Director | |||
Heather Isely | December 5, 2019 | |||
Director | ||||
Michael Campbell | ||||
/s/ EDWARD CERKOVNIK | Director | |||
Edward Cerkovnik | December 5, 2019 | |||
/s/ RICHARD HALLé | Director | |||
Richard Hallé | December 5, 2019 |
81