Bankof Commerce Holdings Form 10-K
3 | |||
| |||
| |||
| |||
| |||
| |||
| |||
| |||
| |||
Item 7a - Quantitative and Qualitative Disclosures about Market Risk |
| ||
| |||
Item 9 - Changes In and Disagreements with Accountants on Accounting and Financial Disclosure |
| ||
| |||
| |||
Item 10 - Directors, Executive Officers And Corporate Governance |
| ||
| |||
| |||
Item 13 - Certain Relationships and Related Transactions and Director Independence |
| ||
| |||
| |||
| |||
| |||
Special Note Regarding Forward-Looking Statements
This report includes forward-looking statements within the meaning of the Securities Exchange Act of 1934 (“Exchange Act”) and the Private Securities Litigation Reform Act of 1995. Theseforward-lookingstatements are based on management’smanagement’s currentbeliefs and assumptions, and on information available to management as of the date of this document. Forward-looking statements include the information concerning possible or assumed future results of operations of the Company set forth under the heading “Management’s Discussion and Analysis of Financial Condition and Results of Operations.”
Forward-looking statements may also include statements in which words such as “expects,” “anticipates,” “intends,“intends,” “plans,“plans,” “believes,” “estimates,“estimates,” “considers”“considers” or similar expressions or conditional verbs such as “will,” “should,” “would” and “could,”“could” and other comparable words or phrases of a future- or forward-looking nature,are intended to identify such forward lookingforward-looking statements. Forward-looking statements are not guarantees of future performance. They involve risks, uncertainties and assumptions. The Company’sCompany’s actual future results and shareholder values may differ materially from those anticipated and expressed in these forward-looking statements. Many of the factors that will determine these results and values are beyond the Company’s ability to control or predict. Except as specifically noted herein all references to the “Company” refer to Bank of Commerce Holdings, a California corporation, and its consolidated subsidiaries.
The following factors, among others, could cause our actual results to differ materially fromthe anticipated results (express or implied) or other expectations those expressed in thesuch forward-looking statements, including those set forth in this Annual Report on Form 10-K, or the documents incorporated by reference:statements:
● | The strength of the United States economy in general and the strength of the local economies in California in which we conduct |
● | Our inability to successfully manage our growth or implement our growth strategy; |
● | The effects of, and changes in, trade, monetary and fiscal policies and laws, including interest rate policies of the Board of Governors of the FederalReserve System, or the Federal Reserve Board; |
● | V |
● |
|
| Changes in the financial performance and/or condition of our borrowers; |
● | Our concentration in real estate lending; |
● | Developments and changes in laws and regulations, including the recent federal Tax Cuts and Jobs Act and increased regulation of the banking industry through legislative action and revised rules and standards applied by the Federal Reserve Board, the Federal Deposit Insurance Corporation and the California Department of Business Oversight; |
● | Changes in the cost and scope of insurance from the Federal Deposit Insurance Corporation and other third parties; |
● | Changes in consumer spending, borrowing and savings habits; |
● |
|
● | Changes in the level of our nonperforming assets and |
● |
|
● | Possible other-than-temporary impairment of securities held by us; |
● | The timely development of competitive new products and services and the acceptance of these products and services by new and existing customers; |
● | The willingness of customers to substitute |
● | Technological changes could expose us to new risks, including potential systems failures or fraud; |
● | The effect of changes in accounting policies and practices, as may be adopted from time-to-time by bank regulatory agencies, the Securities and Exchange Commission |
● | The risks presented by continued public stock market volatility, which could adversely affect the market price of the Company's common stock and the ability to raise additional capital; |
● |
|
● | Changes in the competitive environment among financial and bank holding companies and other financial service providers; |
● | Consolidation in the financial services industry in the Company's markets resulting in the creation of larger financial institutions that may have greater resources could change the competitive |
● | The loss of critical personnel and the challenge of hiring qualified personnel at reasonable compensation levels; |
● |
|
● |
|
● | Unauthorized computeraccess, computer hacking, cyber-attacks, electronic fraudulent activity, attempted theft of financial assets, computer viruses, phishing schemes and other security |
● | Geopolitical conditions, including acts or threats of war or terrorism, actions taken by the United States or other governments in response to acts or threats of war or terrorism and/or military conflicts, which could impact business and economic conditions in the United States and abroad; |
● | Our inability to manage the risks involved in the foregoing; and |
● | The effects of any reputational damage to the Company resulting from any of the foregoing. |
If our assumptions regarding one or more of the
Forward-looking statements shouldshould not be viewed as predictions and should not be the primary basis upon which investors evaluate us. Any investor in our common stock should consider all risks and uncertainties discussed in “RISK FACTORS” and in “MANAGEMENT’S DISCUSSION AND ANALYSIS OF FINANCIAL CONDITION AND RESULTS OF OPERATIONS”.
Bank of Commerce Holdings (“Holding(“Company,” “Holding Company,” “we,” or “us”) is a corporation organized under the laws of California and a bank holding company (“BHC”) registered under the Bank Holding Company Act of 1956, as amended (“BHC Act”). with its principal offices in Sacramento, California.. The Holding Company’s principal business is to serve as a holding company for Redding Bank of Commerce (the “Bank” and together with the Holding Company, the “Company”) which operates under two separate names (Redding Bank of Commerce and Sacramento Bank of Commerce, a division of Redding Bank of Commerce) and Bank of Commerce Mortgage (inactive). We have an unconsolidated subsidiary in Bank of Commerce Holdings Trust II, which was organized in connection with our prior issuance of trust preferredtrust-preferred securities. Our common stock is traded on the NASDAQ Global Market under the symbol “BOCH.”
We commenced banking operations in 1982 and with the completion of the purchase of five Bank of America branches during the first quarter of 2016, we now operate nine full service facilities in northern California. We also operate a full service “cyber office” as identified in our summary of deposits reporting filed with the FDIC. We provide a wide range of financial services and products for business and retail customers which are competitive with those traditionally offered by banks of similar size in California. As of December 31, 2016,2017, we operated under one primary business segment: Community Banking. Additional information regarding operating segments can be found in Note 2Summary of Significant Accounting Policies in theNotes to Consolidated Financial Statements in this document.
We continuouslycontinuously seek expansion opportunities through internal growth, strategic alliances, acquisitions, establishing new offices or the delivery of new products and services. Periodically, we reevaluate the short and long termlong-term profitability of all of our lines of business, and do not hesitate to reduce or eliminate unprofitable locations or lines of business. We remain a viable, independent bank committed to enhancing shareholder value. This commitment has been fostered by proactive management and dedication to our staff, customers and the markets we serve.
On March 11, 2016, we completed the purchase of five Bank of America branches in northern California. The acquired branches are located in Colusa, Willows, Orland, Corning, and Yreka. The Bank also acquired three offsite ATM locations in Williams, Orland and Corning. The Bank paid cash consideration of $6.7 million and acquired $155.2 million in assets, primarily cash and premises. The Bank assumed $149.2 million in liabilities, primarily deposits. See Note 2625 Acquisition in theNotes to Consolidated Financial Statements.
2,738,096 shares of our common stock at a public offering price of $10.50 per share, with net proceeds of approximately $26.8 million, after underwriting discounts and estimated expenses.
Our governance structure enables us to manage all major aspects of our business effectively through an integrated process that includes financial, strategic, risk and leadership planning. Our management processes, structures and policies and procedures help to ensure compliance with laws and regulations and provide clear lines of authority for decision-making and accountability. Results are important, but we are equally concerned with how we achieve those results. Our core values and our commitment to high ethical standards are material to sustaining public trust and confidence in our Company.
OurOur primary business strategy is to provide comprehensive banking and related services to businesses, not-for-profit organizations, professional service providers and consumers in northern California. We continue to emphasize the diversity of our product lines and high levels of personal service. Through our technology, we offer convenient access typically associated with larger financial institutions, while maintaining the local decision-making authority and market knowledge, typical of a local community bank. Management intends to continue to pursue our business strategy through the following initiatives:
Utilize the Strength of Our Management Team. We believe the experience, depth and knowledge of our management team represent one of our greatest strengths and competitive advantages.
Leverage Our Existing Foundation for Additional Growth. Based on certain infrastructure investments, we believe that we will be able to take advantage of certain economies of scale typically enjoyed by larger organizations to expand our operations both organically and through strategic cost-effective avenues. We believe that the investments we have made in our data processing, our staff, our risk and compliance function, and our branch network will be able to support a much larger asset base. We are committed, however, to control any additional growth in a manner designed to minimizewithin acceptable risk limits and to maintain appropriate capital ratios.
Maintain Local Decision-Making and Accountability. We believe we have a competitive advantage over larger national and regional financial institutions by providing superior customer service with experienced, knowledgeable management, localized decision-making capabilities and prompt credit decisions. We believe that our customers want to deal directly with the people who make the ultimate credit decisions and have provided our Bank officers and relationship managers and loan officers with the authority commensurate with their experience and historyresponsibilities, which we believe strikes the right balance between local decision-making and sound banking practice.
Focus on Asset Quality and Strong Underwriting. We consider asset quality to be of primary importance and have taken measures to ensure that credit risks are managed effectively to safeguard shareholder value. As part of our efforts, we utilize a third party loan review service to evaluate our loan portfolio on a quarterly basis and recommend action on certain loans if deemed appropriate.
Build a Stable Core Deposit Base. We continue to focus on increasing a stable core deposit base of business and retail customers. Our Branch Acquisition has allowed us to reduce our historic reliance on Federal Home Loan Bank of San Francisco borrowings and our former reliance on nonlocal time deposits. We intend to continue our practice of developing a full deposit relationship with each of our loan customers, their business partners, and key employees.
General
As a bank holding company, the Holding Company is subject to regulation under the BHC Act and to inspection, examination and supervision by its primary regulator, the Board of Governors of the Federal Reserve System (“Federal Reserve Board” or “FRB”). The Holding Company is also subject to the disclosure and regulatory requirements of the Securities Act of 1933, as amended, and the Securities Exchange Act of 1934, as amended, both as administered by the SEC. As a listed company on the NASDAQ Global Market, the Holding Company is subject to the rules of the NASDAQ for listed companies.
The Holding Company’s subsidiary bank is subject to regulations and examinations primarily by the Federal Deposit Insurance Corporation (“FDIC”) and by the California Department of Business Oversight (“CDBO”).
Holding Company Activities
The Holding Company’s primary subsidiary is a bank and, if the Bank receives a rating under the Community Reinvestment Act of 1977, as amended (“CRA”), of less than “satisfactory”, the Holding Company may be prohibited, until the rating is raised to “satisfactory” or better, from engaging in new activities or acquiring companies other than bank holding companies, banks or savings associations. The Bank’s current CRA rating is “satisfactory”.
To qualify as “well-capitalized,” the Company must, on a consolidated basis: (1) maintain a total risk-based capital ratio of 10% or greater, (2) maintain a Tier 1 risk-based capital ratio of 8%, and (3) maintain a Common Equity Tier 1 capital ratio of 4.5% (4) not be subject to any order by the FRB to meet a specified capital level. As of December 31, 2016, the Company’s total risk-based capital ratio was 12.68%, its Tier 1 capital was 10.42% and its Common Equity Tier 1 capital ratio was 9.43% and the Company is not under a FRB order.
As of December 31, 2016, the most recent notification from the FDIC categorized the Bank as “well capitalized”. There are no conditions or events since the notification that management believes have changed the Bank’s rating.
Principal Markets
We operate nine branchesfull service facilities in northern California. We also operate a full service “cyber office” as identified in our summary of deposits reporting filed with the FDIC. InWe operate under the name Redding Bank of Commerce, except in the greater Sacramento region where we operate under the name Sacramento Bank of Commerce, a division of Redding Bank of Commerce.
Principal Products and Services
Most of our current customers are retail consumers and small to medium-sized businesses. No single person or group of persons provides a material portion of the Bank’s deposits or loans, the loss of any one or more of which would have a materially adverse effect on the business of the Bank.
We provide a wide range of financial services and products for business and consumer customers. The services we offer include those traditionally offered by banks of similar size and character in California. Our principal deposit products include the following types of accounts; checking, interest-bearing checking, money market, savings and certificates of deposit, money market deposits.deposit. We also offer sweep arrangements, commercial loans, construction loans, term loans, consumer loans, safe deposit boxes, and electronic banking services. We currently do not offer trust services or international banking services.
The majority of the loans we originate are direct loans made to individuals and small businesses in our principal market. We accept as collateral for loans, real estate, listed and unlisted securities, savings and time deposits, automobiles, machinery and equipment and other general business assets such as accounts receivable and inventory. In addition to direct lending, our loan portfolio includes loans that were purchased as pools of loans, or participations where a portion of a loan was originated by another lending institution.
Dividends
The principal source of the Holding Company’s cash is dividends received from the Bank, which are subject to government regulation and limitations on the Bank’s ability to pay dividends. Regulatory authorities may prohibit banks and bank holding companies from paying dividends in a manner that would constitute an unsafe or unsound banking practice or would reduce capital below an amount necessary to meet minimum applicable regulatory capital requirements. Basel III (discussed below) introduces additional potential restrictions on dividends.
Banks chartered under California law generally may only pay a cash dividend to the extent such payment does not exceed the lesser of (i) retained earnings of the bank or (ii) the bank’s net income for its last three fiscal years (less any distributions to shareholders during such period). As a result, future dividends will generally depend on the level of earnings at the Bank.
The Federal Reserve has issued a policy statement on the payment of cash dividends by bank holding companies which expresses the view that although no specific regulations restrict dividend payments by bank holding companies other than state corporate laws, a bank holding company should not pay cash dividends unless the company’s net income for the past year is sufficient to cover both the cash dividends and a prospective rate of earnings retention that is consistent with the bank holding company’s capital needs, asset quality and overall financial condition.
Regulatory Capital
Our regulators measure capital adequacy by using a risk-based capital framework and by monitoring compliance with minimum leverage ratio guidelines. The guidelines are “risk-based,” meaning that they are designed to make capital requirements more sensitive to differences in risk profiles among banks and bank holding companies.
As of December 31, 2016,2017, the most recent notification from the FDIC categorized the Bank as “well capitalized” under the regulatory framework for prompt corrective action. There are no conditions or events since the notification that management believes have changed the Bank’sBank’s risk category. See Item 7 -Management’s Discussion And Analysis Of Financial Condition And Results Of Operations and Note 2120 Regulatory Capital in theNotes toConsolidated Financial Statements in this document for a discussion of the regulatory capital guidelines.
Competition
We engage in the highly competitive financial services industry. Generally, our market and our the lines of activity involve competition with other banks, thrifts, credit unions and other non-bank financial institutions, such as investment banking firms, investmentinvestment advisory firms, brokerage firms, investment companies and insurance entities which offer financial services, located both domestically and through alternative delivery channels such as the Internet. Many of these competitors enjoy fewer regulatory constraints and some may have lower cost structures. The methods of competition center aroundOur ability to compete is focused on various factors such as customer service, interest rates on loans and deposits, lending limits, customer convenience and technological advances.
Securities firms, insurance companies and brokerage houses that elect to become financial holding companies may acquire banks and other financial institutions. Combinations of this type will significantly change the competitive environment in which we conduct business.
In order to compete with major banks and other competitors in our primary service areas, we rely upon;upon;
● | The |
● | O |
● | T |
● | Third party referral sources. |
Employees
As of December 31, 2016,2017, we employed 191189 full-time equivalent employees. None of the employees are subject to a collective bargaining agreement and management believes its relations with employees to be good. Information regarding employment agreements with our executive officers is contained in Item 11 – Executive Compensation below, which is incorporated by reference to our proxy statement for the 20172018 annual meeting of shareholders.
Government Supervision and Regulation
Supervision and Regulation
The Holding Company and the Bank operateare subject to extensive regulation under an extensivefederal and state law. In general, this regulatory framework. This framework is primarily designed forto protect depositors, the protection of depositors, federal deposit insurance funds,fund (the “DIF”) and the federal and state banking system as a whole, andwhole; it does not exist for the protection of shareholders. As the breadth and scope of regulatory requirements increase, our costs to identify, monitor and comply with these requirements continue to increase.increase, as well.
This section provides a general overview of the federal and state regulatory framework applicable to the Holding Company and the Bank. It is not intended to summarize all applicable laws and regulations. To the extent that this section describes statutory and regulatory provisions, it is qualified by reference to those provisions. These statutes and regulations, as well as related policies, continue to be subject to change (or interpretation) by Congress, state legislatures and federal and state regulators. Changes inNumerous changes to the statutes, regulations orand regulatory policies applicable to us including the(including their interpretation or implementation thereof,implementation) have been proposed but cannot be predicted and could have a material effect on our business or operations.
The Holding Company is subject to regulation and supervision by the Federal Reserve (as a bank holding company) and regulation by the State of California (as a California corporation). The Holding Company is also subject to the disclosure and regulatory requirements of the Securities Act of 1933, as amended, and the Securities Exchange Act of 1934, as amended, both as administered by the SEC. As a listed company on the NASDAQ Global Market, the Holding Company is subject to the rules of the NASDAQ for listed companies. The Bank is subject to regulation and examination by the Federal Deposit Insurance Corporation (“FDIC”) and by the California Department of Business Oversight (“CDBO”).
Federal Bank Holding Company Regulation
General
The Holding Company isGeneral
As a bank holding company, as defined in the BHC Act andHolding Company is therefore subject to regulation under the Bank Holding Company Act of 1956, as amended (the “BHC Act”) and to inspection, examination and supervision and examination by its primary regulator, the Board of Governors of the Federal Reserve.Reserve System (“Federal Reserve” or “FRB”). In general, the BHC Act limits the business of bank holding companies to owning or controlling banks and engaging in other activities closely related to the business of banking. TheIn addition, the Holding Company must file reports with and provide the Federal Reserve with such additional information as it may require.
Holding Company Bank Ownership
The BHC Act requires every bank holding company to obtain the prior approval of the Federal Reserve before (i) acquiring, directly or indirectly, ownership or control of any voting shares of another bank or bank holding company if, after such acquisition, it would own or control more than 5% of such shares; (ii) acquiring all or substantially all of the assets of another bank or bank holding company; or (iii) merging or consolidating with another bank holding company.
Holding Company Control of Nonbanks
With some exceptions, the BHC Act also prohibits a bank holding company from acquiring or retaining direct or indirect ownership or control of more than 5% of the voting shares of any company which is not a bank or bank holding company, or from engaging directly or indirectly in activities other than those of banking, managing or controlling banks, or providing services for its subsidiaries. The principal exceptions to these prohibitions involve certain non-bank activities that, by federal statute, agency regulation or by Federal Reserve regulation or order, have been identified as activities closely related to the business of banking or of managing or controlling banks.
Transactions with Affiliates
Subsidiary banks of a bank holding company are subject to restrictions imposed by the Federal Reserve Act on extensions of credit to the holding company or its subsidiaries, on investments in their securities and on the use of their securities as collateral for loans to any borrower. The Dodd-Frank Wall Street Reform and Consumer Protection Act of 2010 (“Dodd-Frank Act”) further expanded the definition of an “affiliate” and treats credit exposure arising from derivative transactions, securities lending, and borrowing transactions as a covered transaction under the regulations. It also expands the scope of covered transactions required to be collateralized, requires collateral to be maintained at all times for covered transactions required to be collateralized, and places limits on acceptable collateral. These regulations and restrictions may limit the Holding Company’s ability to obtain funds from the Bank for its cash needs, including funds for payment of dividends, interest and operational expenses.
Tying Arrangements
We are prohibited from engaging in certain tie-in arrangements in connection with any extension of credit, sale or lease of property or furnishing of services. For example, with certain exceptions, neither the Holding Company nor its subsidiaries may condition an extension of credit to a customer on either (i) a requirement that the customer obtain additional services provided by us; or (ii) an agreement by the customer to refrain from obtaining other services from a competitor.
Support of Subsidiary Banks
Under Federal Reserve policy and the Dodd-Frank Act, the Holding Company is expectedrequired to act as a source of financial and managerial strength to the Bank. This means that the Holding Company is required to commit, as necessary, capital and resources to support the Bank, including at times when the Holding Company may not be in a financial position to provide such resources, andor when it may not be in the Holding Company's (oror its shareholders') best interestinterests to do so. Any capital loans a bank holding company makes to its subsidiary banks are subordinate to deposits and to certain other indebtedness of those subsidiary banks.
State Law Restrictions
As a California corporation, the Holding Company is subject to certain limitations and restrictions under applicable California corporate law. For example, state law restrictions in California include limitations and restrictions relating to indemnification of directors, distributions to shareholders, transactions involving directors, officers or interested shareholders, maintenance of books, records and minutes and observance of certain corporate formalities.
Federal and State RegulationRegulation of the Bank
General
The deposits ofGeneral
Deposits in the Bank, a California chartered commercial bank, are insured by the FDIC. As a result, the Bank is subject to primary supervision, periodic examination and regulation by the CDBO and the FDIC. These agencies have the authority to prohibit banks from engaging in what they believe constitute unsafe or unsound banking practices. The federal laws that apply to the Bank regulate, among other things, the scope of its business, its investments, its reserves against deposits, the timing of the availability of deposited funds, and the nature, amount of, and collateral for loans. Federal laws also regulate community reinvestment and insider credit transactions and impose safety and soundness standards. As mentioned above, inIn addition to these federal laws, the Bank is also subject to the laws of the State of California.
Consumer Protection
Although the Bank is not supervised directly by the Consumer Financial Protection Bureau (“CFPB”), our consumer banking activities are subject to regulation by the CFPB. The Bank is subject to a variety of federal and state consumer protection laws and regulations that govern its relationships and interactions with consumers including laws and regulations that impose certain disclosure requirements and regulate the manner in which we take deposits, make and collect loans, and provide other services. In recent years, examination and enforcement by state and federal banking agencies for non-compliance with consumer protection laws and their implementing regulations have increased and become more intense. Failure to comply with these laws and regulations may subject the Bank to various penalties, including but not limited to, enforcement actions, injunctions, fines, civil monetary liability,penalties, criminal penalties, punitive damages, and the loss of certain contractual rights. The Bank has established a compliance system to ensure consumer protection.
Community Reinvestment
The Community Reinvestment Act of 1977 (the “CRA”) requires that, in connection with examinations of financial institutions within their jurisdiction, the Federal Reserve or the FDICfederal bank regulators evaluate the record of the financial institutioninstitutions in meeting the credit needs of its local communities, including low and moderate-income neighborhoods, consistent with the safe and sound operation of the institution.those institutions. A bank’s community reinvestment record is also considered by the applicable banking agencies in evaluating mergers, acquisitions and applications to open a branch or facility. In some cases, a bank's failure to comply with the CRA andor CRA protests filed by interested parties during applicable comment periods can result in the denial or delay of such applications.transactions. The Bank received a "satisfactory" rating in its most recent CRA examination.
Insider Credit Transactions
Banks are also subject to certain restrictions imposed by the Federal Reserve Act on extensions of credit to executive officers, directors, principal shareholders or any related interests of such persons. Extensions of credit (i) must be made on substantially the same terms including (including interest rates and collateral,collateral) and follow credit underwriting procedures that are at least as stringent as those prevailing at the time for comparable transactions with persons not related to the lending bank; and (ii) must not involve more than the normal risk of repayment or present other unfavorable features. Banks are also subject to certain lending limits and restrictions on overdrafts to insiders. A violation of these restrictions may result in the assessment of substantial civil monetary penalties, regulatory enforcement actions, and other regulatory sanctions. The Dodd-Frank Act and federal regulations place additional restrictions on loans to insiders and generally prohibit loans to senior officers other than for certain specified purposes.
Regulation of Management
Federal law (i) sets forth circumstances under which officers or directors of a bank may be removed by the institution’sinstitution’s federal supervisory agency; (ii) as discussed above, places restraints on lending by a bank to its executive officers, directors, principal shareholders, and their related interests; and (iii) generally prohibits management personnel of a bank from serving as directors or in other management positions of another financial institution whose assets exceed a specified amount or which has an office within a specified geographic area.
Safety and Soundness Standards
Certain non-capital safety and soundness standards are also imposed upon banks. These standards cover, among other things, internal controls, information systems and internal audit systems, loan documentation, credit underwriting, interest rate exposure, asset growth, compensation, fees and benefits, such other operational and managerial standards as the agency determines to be appropriate, and standards for asset quality, earnings and stock valuation. EachIn addition, each insured depository institution must implement a comprehensive written information security program that includes administrative, technical, and physical safeguards appropriate to the institution’s size and complexity and the nature and scope of its activities. The information security program must be designed to ensure the security and confidentiality of consumercustomer information, protect against unauthorized access to or use of such information and ensure the proper disposal of customer and consumer information. An institution that fails to meet these standards may be required to submit a compliance plan, or be subject to regulatory sanctions, including restrictions on growth. The Bank has established policies and risk management procedures to ensure the safety and soundness of the Bank.
State Law Restrictions
California state-chartered banks are subject to various requirements relating to operations and administration (including the maintenance of branch offices and automated teller machines), capital and reserve requirements, declaration of dividends, deposit taking, shareholder rights and duties, borrowing limits, and investment and lending activities.
Under California law, the amount a bank generally may borrow may not exceed its shareholders’shareholders’ equity without the consent of the CDBO, except for borrowings from the Federal Home Loan Bank of San Francisco and the Federal Reserve Bank. The Bank is required to invest its funds as limited by California law and in investments that are legal investments for banks, subject to any other limitations under general law. The Commissioner of the CDBO may take possession of the Bank if certain conditions exist, such as insufficient shareholders’ equity, unsafe or unauthorized operations, or violations of law.
Interstate Banking and Branching
The Dodd-Frank Act eliminated interstate branching restrictions that were implemented as part of the Riegle-Neal Interstate Banking and Branching Efficiency Act of 1994 (the “Interstate Act”("Interstate Act") together with the Dodd-Frank Act relaxed prior, and removed many restrictions on de novo interstate branching restrictions under federal law by permitting, subject to regulatory approval, state and federally chartered commercialbanks. Federal regulators now have authority to approve applications by such banks to establish de novo branches in states whereother than the laws permitbank's home state if the host state's banks chartered in such states tocould establish branches.a branch at the same location. The Interstate Act requires regulators to consult with community organizations before permitting an interstate institution to close a branch in a low-income area. Federal banking agency regulations prohibit banks from using their interstate branches primarily for deposit production and the federal banking agencies have implemented a loan-to-deposit ratio screen to ensure compliance with this prohibition.
Cash Dividends
Our ability to pay cash dividends is dependent on having sufficient cash and satisfying various regulatory and contractual restrictions. While we currently hold $24.0 million from our May 2017 public offering, our principal source of cash has historically been dividends received from the Bank. Regulatory authorities may prohibit banks and bank holding companies from paying dividends in a manner that would constitute an unsafe or unsound banking practice or would reduce capital below an amount necessary to meet minimum applicable regulatory capital requirements. Basel Ill (discussed below) introduces additional restrictions on dividends.
Our ability to pay dividends from the Bank to the Holding Company is subject to certain requirements under California law. Banks chartered under California law generally may only pay a cash dividend to the extent such payment does not exceed the lesser of (i) retained earnings of the bank or (ii) the bank's net income for its last three fiscal years less any distributions to shareholders during such period. As a result, future dividends from the Bank to the Holding Company will generally depend on the level of earnings at the Bank.
The Federal Reserve has issued a policy statement on the payment of cash dividends by bank holding companies which expresses the view that although no specific regulations restrict dividend payments by bank holding companies other than state corporate laws, a bank holding company should not pay cash dividends unless the company's net income for the past year is sufficient to cover both the cash dividends and a prospective rate of earnings retention that is consistent with the bank holding company's capital needs, asset quality and overall financial condition.
On December 10, 2015, we issued and sold $10.0 million in aggregate principal amount of fixed to floating rate Subordinated Notes pursuant to a private placement with certain institutional investors. On that same date we also entered into a loan agreement pursuant to which we obtained $10.0 million in senior debt secured by a pledge of all of the stock of the Bank. The Notes and debt agreements limit the payment of cash dividends to our common shareholders if the Company is not well capitalized, or if there is an event of default as described by the agreements.
Capital Adequacy and Prompt Corrective Action
Banks and bank holding companies are subject to various regulatory capital requirements administered by state and federal regulatory agencies, which involve quantitative measures of assets, liabilities, and certain off-balance sheet items calculated under regulatory accounting practices. Capital amounts and classifications are also subject to qualitative judgments by regulators about components, risk weighting, and other factors. The capital requirements are intended to ensure that institutions have adequate capital given the risk levels of assets and off-balance sheet financial instruments and are applied separately to the Holding Company and the Bank.
Federal regulations require insured depository institutions and bank holding companies to meet several minimum capital standards, including: (i) a common equity Tier 1 capital to risk-based assets ratio of 4.5%; (ii) a Tier 1 capital to risk-based assets ratio of 6%; (iii) a total capital to risk-based assets ratio of 8%; and (iv) a 4% Tier 1 capital to total assets leverage ratio. These minimum capital requirements became effective in January 2015 and were the result of final rules implementing certain regulatory amendments based on the recommendation of the Basel Committee on Banking Supervision and certain requirements of the Dodd-Frank Act (the "Final Rules").
The Final Rules also require a new capital conservation buffer designed to absorb losses during periods of economic stress. The Bank is required to meet this new buffer requirement by 2019 in order to avoid constraints on capital distributions (e.g., dividends, equity repurchases, and certain bonus compensation for executive officers). The Final Rules change the risk-weights of certain assets for purposes of the risk-based capital ratios and phase out certain instruments as qualifying capital.
The Final Rules also contain revisions to the prompt corrective action framework, which is designed to place restrictions on an insured depository institution if its capital levels begin to show signs of weakness. Under the prompt corrective action requirements, which are designed to complement the capital conservation buffer, insured depository institutions will be required to meet the following increased capital level requirements to qualify as “well capitalized”: (i) a Tier 1 common equity capital ratio of at least 6.5%; (ii) a Tier 1 capital ratio of at least 8%; (iii) a total capital ratio of at least 10%; (iv) a Tier 1 leverage ratio of at least 5%; and (v) not be subject to any order or written directive requiring a specific capital level. The FDIC’s rules (as amended by the Final Rules) contain other capital classification categories, such as “adequately capitalized,” “undercapitalized,” “significantly undercapitalized,” and “critically undercapitalized,” each of which are based on certain capital ratios. An institution may be downgraded to a category lower than indicated by its capital ratios if it is determined to be in an unsafe or unsound condition, or if the institution receives an unsatisfactory examination rating. As of December 31, 2017, the most recent notification from the FDIC categorized the Bank as “well capitalized”.
The application of the Final Rules may result in lower returns on invested capital, require the raising of additional capital or require regulatory action if the Bank were unable to comply with such requirements. In addition, management may be required to modify its business strategy due to the changes to the asset risk-weights for risk-based capital calculations and the requirement to meet the capital conservation buffers. The imposition of liquidity requirements in connection with these rules could also cause the Bank to increase its holdings of liquid assets, change its business strategy, and make other changes to the terms of its funding.
Regulatory Oversight and Examination
Inspections
The Federal Reserve conducts periodic inspections of bank holding companies, which are performed both onsite and offsite. The supervisory objectives of the Federal Reserve's inspection program are to ascertain whether the financial strength of the bank holding company is being maintained on an ongoing basis and to determine the effects or consequences of transactions between a bank holding company or its non-banking subsidiaries and its subsidiary banks. For holding companies under $10.0 billion in assets, the inspection type and frequency typically varies depending on asset size, complexity of the organization, and the bank holding company’scompany’s rating at its last inspection.
Examinations
Banks are subject to periodic examinations by their primary regulators. BankIn assessing a bank's condition, bank examinations have evolved from reliance on transaction testing in assessing a bank’sbank’s condition to a risk-focused approach. These examinations are extensive and cover the entire breadth of operations of the bank. SafetyGenerally, safety and soundness examinations occur on a 12-months12-month cycle. Examinations alternate between the federal and state bank regulatory agency oragencies, and in some cases they may occur on a combined schedule. The frequency of consumer compliance and CRA examinations is linked to the size of the institution and its compliance and CRA ratings at its most recent examinations. However, the examination authority of the Federal Reserve and the FDIC allows them to examine supervised banksinstitutions as frequently as deemed necessary based on the condition of the bank or as a result of certain triggering events.
On December 18, 2015, theCommercial Real Estate Ratios
The federal banking regulators recently issued guidance reminding financial institutions to re-examine existing regulations regarding concentrations in commercial real estate lending. The purpose of the guidance is to guide banks in developing risk management practices and capital levels commensurate with the level and nature of real estate concentrations. The banking agencies are directed to examine each bank’sbank’s exposure to commercial real estate loans that are dependent on cash flow from the real estate held as collateral and to focus their supervisory resources on institutions that may have significant commercial real estate loan concentration risk. The guidance provides that the strength of an institution’s lending and risk management practices with respect to such concentrations will be taken into account in evaluating capital adequacy and does not specifically limit a bank’s commercial real estate lending to a specified concentration level.
Corporate Governance and Accounting
Sarbanes-Oxley Act of 2002
Corporate Governance and Accounting
The Sarbanes-Oxley Act of 2002 (the “SOX Act”) addresses, among other things, corporate governance, auditing and accounting, enhanced and timely disclosure of corporate information, and penalties for non-compliance. Generally the SOX Act (i) requires chief executive officers and chief financial officers to certify to the accuracy of periodic reports filed with the SEC; (ii) imposes specific and enhanced corporate disclosure requirements; (iii) accelerates the time frame for reporting of insider transactions and periodic disclosures by public companies; (iv) requires companies to adopt and disclose information about corporate governance practices, including whether or not they have adopted a code of ethics for senior financial officers and whether the audit committee includes at least one “audit committee financial expert”, and (v) requires the SEC, based on certain enumerated factors, to regularly and systematically review corporate filings, and (vi) requires chief executive officers and chief financial officers to assess the Company’s internal control over financial reporting based on criteria for effective internal control over financial reporting described inInternal Control – Integrated Framework (2013)issued by the Committee of Sponsoring Organizations of the Treadway Commission. filings.
As a publicpublicly reporting company, the Holding Company is subject to the requirements of the SOX Act and related rules and regulations issued by the SEC and NASDAQ. After enactment of the SOX Act, the Holding Company updated its policies and procedures to comply with the SOX Act's requirements and has found that such compliance, including compliance with Section 404 relating to the Holding Company's internal controls over financial reporting, has resulted in additional expenses for the Holding Company. The Holding Company will continue to incur additional expenses in connection with its ongoing compliance with these requirements.
Anti-Money Laundering and Anti-Terrorism
Anti-Terrorism
The Bank Secrecy Act and the USA Patriot Act of 2001
The Bank Secrecy Act (the “BSA”) requires all financial institutions to (among other requirements) establish a risk-based system of internal controls reasonably designed to prevent money laundering and the financing of terrorism. The BSA also sets forth various recordkeeping and reporting requirements (such as reporting suspicious activities that may signal criminal activity), includingand certain due diligence and "know your customer" documentation requirements.
Further, the Uniting and Strengthening America by Providing Appropriate Tools Required to Intercept and Obstruct Terrorism Act of 2001, intended to combat terrorism, was renewed with certain amendments in 2006 (the “Patriot Act”). The Patriot Act, in relevant part, (i) prohibits banks from providing correspondent accounts directly to foreign shell banks; (ii) imposes due diligence requirements on banks opening or holding accounts for foreign financial institutions or wealthy foreign individuals; (iii) requires financial institutions to establish an anti-money-laundering compliance program; and (iv) eliminates civil liability for persons who file suspicious activity reports. The Patriot Act also includes provisions providing the government with power to investigate terrorism, including expanded government access to bank account records. Bank regulatorsRegulators are directed to consider a bank holding company’scompany’s and a bank’s effectiveness in combating money laundering when reviewing and ruling on applications under the BHC Act and the Bank Merger Act. The Holding Company and the Bank have established compliance programs designed to comply with the requirements of the BSA and Patriot Act requirements.Act.
Financial Services Modernization
Gramm-Leach-Bliley Act of 1999
The Gramm-Leach-Bliley Financial Services Modernization Act of 1999 (the “GLBA”) brought about significant changes to the laws affecting banks and bank holding companies. Generally, the GLBA (i) repeals historical restrictions on preventing banks from affiliating with securities firms; (ii) provides a uniform framework for the activities of banks, savings institutions and their holding companies; (iii) broadens the activities that may be conducted by national banks and banking subsidiaries of bank holding companies; (iv) provides an enhanced framework for protecting the privacy of consumer information and requires notification to consumers of bank privacy policies; and (v) addresses a variety of other legal and regulatory issues affecting both day-to-day operations and long-term activities of financial institutions. The Bank is subject to FDIC regulations implementing the privacy protection provisions of the GLBA. These regulations require the Banka bank to disclose its privacy policy, including informing consumers of itsthe bank’s information sharing practices and informing consumers of their rightsright to opt out of certain practices.
Deposit Insurance
FDIC Insured Deposits
The Bank’sBank’s deposits are insured under the Federal Deposit Insurance Act, up to the maximum applicable limits and are subject to deposit insurance assessments by the FDIC, which are designed to tie what banks pay for deposit insurance to the risks they pose. The Dodd-Frank Act redefined the assessment base used for calculating FDIC deposit insurance assessments by requiring the FDIC to determine deposit insurance assessments based on assets instead of deposits. Assessments are now based on the average consolidated total assets less average tangible equity capital of a financial institution. In addition, the Dodd-Frank Act (i) raised the minimum designated reserve ratio (the FDIC is required to set the reserve ratio each year) of the Deposit Insurance Fund (the “DIF”)DIF from 1.15% to 1.35%; requires(ii) required that the DIF reserve ratio meet 1.35% by 2020; and eliminates(iii) eliminated the requirement that the FDIC pay dividends to insured depository institutions when the reserve ratio exceeds certain thresholds. The FDIC has established a higher reserve ratio of 2% as a long-term goal beyond what is required by statute. In October 2015, the FDIC stated that it would offset the effect ofThe Dodd-Frank Act made banks with $10 billion or more in total assets responsible for the increase in the minimum reserve ratio on insured depository institutions with total consolidated assets of less than $10.0 billion by imposing a surcharge on insured depository institutions with total consolidated assets of $10.0 billion dollars or more.from 1.15% to 1.35%. No institution may pay a dividend if it is in default on its federal deposit insurance assessment. The FDIC may also prohibit any insured institution from engaging in any activity determined by regulation or order to pose a serious risk to the DIF.
Safety and Soundness
The FDIC may terminate the deposit insurance of any insured depository institution if itthe FDIC determines after a hearing that the institution has engaged or is engaging in unsafe or unsound practices, is in an unsafe or unsound condition to continue operations, or has violated any applicable law, regulation, order or any condition imposed by an agreement with the FDIC. Management is not aware of any existing circumstances whichthat would result in termination of the Bank's deposit insurance of the Bank.insurance.
Insurance of Deposit Accounts
The Dodd-Frank Act permanently increased FDIC deposit insurance from $100,000 to $250,000 per depositor. The FDIC insurance coverage limit applies per depositor, per insured depository institution for each account ownership category.
Brokered Deposits
On November 13,13, 2015, the FDIC updated guidance on identifying, accepting and reporting brokered deposits (“Deposit Guidance”), which appears to adopt an expansive view on what constitutes “facilitating the placement of deposits.” To the extent the FDIC takes a broader view of what constitutes “brokered deposits”, this could impact our use of brokered deposits in the future. Under FDIC deposit insurance rules, banks may be assessed higher premiums if they have a high level of brokered deposits. At December 31, 2016,2017, we have $65.2$66.3 million in brokered deposits.deposits which we obtained through the CDARS and ICS programs.
The Dodd-Frank Act
General
The Dodd-Frank Act was signed into law in July 2010. The Dodd-Frank Act significantly changed the bank regulatory structure and is affecting the lending, deposit, investment, trading and operating activities of financial institutions and their holding companies, including the Holding Company and the Bank. Some of the provisions of the Dodd-Frank Act that may impact ourthe Company's and the Bank's business and operations are summarized below. However, the new Administration in Washington, D.C., is consideringThere has been recent discussion of providing some relief from certain of the provisions of the Dodd-Frank Act butfor smaller financial institutions. For example, recent bipartisan proposals have been introduced in an effort to roll back key provisions of the Dodd-Frank Act. However, it is too early to predict the likelihood, timing, and scope of any such amendment(s).amendments.
Corporate Governance
The Dodd-Frank Act requires publicly traded companies to provide their shareholders with (i) a non-binding shareholder vote on executive compensation, (ii) a non-binding shareholder vote on the frequency of such vote, (iii) disclosure of “golden parachute” arrangements in connection with specified change in control transactions, and (iv) a non-binding shareholder vote on golden parachute arrangements in connection with these change in control transactions. Effective August 5,In 2015, the SEC adopted a rule mandated by the Dodd-Frank Act that requires a public company to disclose the ratio of the compensation of its Chief Executive Officer ("CEO") to the median compensation of its employees. This rule is intended to provide shareholders with information that they can use to evaluate a CEO's compensation. Companies will be required to provide disclosure of their pay ratios for their first fiscal year beginning on or after January 1, 2017.
Prohibition Against Charter Conversions of Troubled Institutions
The Dodd-Frank Act generally prohibits a depository institution from converting from a state to federal charter, or vice versa, while it is the subject to an enforcement action unless the bankdepository institution seeks prior approval from its primary regulator and complies with specified procedures to ensure compliance with the enforcement action.
Consumer Financial Protection Bureau
The Dodd-Frank Act established the CFPB and empowered it to exercise broad rulemaking, supervision and enforcement authority for a wide range of consumer protection laws. The Bank is subject to consumer protection regulations issued by the CFPB, but as a financial institution with assets of less than $10.0 billion, the Bank is generally not subject to supervision and examination by the CFPB. The CFPB has issued and continues to propose and issue numerous regulations that will increase the compliance burden of the Bank. Significant recent CFPB developments that may affect the Bank’s operations and compliance costs include:
● |
|
| Positions taken by the CFPB on fair lending, including applying the disparate impact theory which could make it more difficult for lenders to charge different rates or to apply different terms to loans to different customers. |
● | The |
● | Positions taken by the CFPB regarding the Electronic Fund Transfer Act and Regulation E, which require companies to obtain consumer authorizations before automatically debiting a |
● |
|
Repeal of Demand Deposit Interest Prohibition
The Dodd-Frank Act repealed federal prohibitions on the payment of interest on demand deposits, thereby permitting depository institutions to pay interest on business transaction and other accounts.
Recent and Proposed Legislation
General
The economic and political environment of the past several years has led to a number of proposed legislative, governmental and regulatory initiatives that may significantly impact ourthe banking industry. Other regulatory initiatives by federal and state banking agenciesagencies may also significantly impact our business. We cannot predict whether these or any other proposals will be enacted or the ultimate impact of any such initiatives on our operations, competitive situation, financial conditions, or results of operations. While recent history has demonstrated that new legislation or changes to existing laws or regulations typically result in a greater compliance burden (and therefore increase the general costs of doing business), the newcurrent Administration has expressed a desire to reduce regulatory burden.
On December 22, 2017, a law commonly known as the Tax Cuts and Jobs Act (“Tax Act”) was signed into law. Among other provisions, the Tax Act reduced the federal corporate tax rate to a flat rate of 21% from the existing maximum graduated rate of 35%. As a result of the Tax Act, the effective tax rate for the Holding Company is expected to be reduced to a range of 17% to 18%. While the Company has evaluated the impact of the Tax Act with respect to the tax rate, it is too early to determine other potential impacts of the Tax Act on the Company.
Effects of Federal Government Monetary Policy
The Holding Company’s earnings and growth are affected not only by general economic conditions, but also by the fiscal and monetary policies of the federal government, particularly the Federal Reserve. The Federal Reserve implements national monetary policy to promote maximum employment, stable prices, and moderate long-term interest rates. Through its open market operations in U.S. government securities, control of the discount rate applicable to borrowings, establishment of reserve requirements against certain deposits, and control of the interest rate applicable to excess reserve balances and reverse repurchase agreements, the Federal Reserve influences the availability and cost of money and credit and, ultimately, a range of economic variables including employment, output, and the prices of goods and services. The nature and impact of future changes in monetary policies and their impact on the Holding Company and the Bank cannot be predicted with certainty.
Available Information
The Company files annual, quarterly and current reports, proxy statements and other business and financial information with the SEC. You may read and copy any materials that the Company files with the SEC at the SEC’sSEC’s Public Reference Room at 100 F Street, N.E., Washington, D.C. 20549. Please call the SEC at 1-800-SEC-0330 or 1-800-732-0330 for further information on the operation of the Public Reference Room. In addition, the SEC maintains an Internet site that contains the Company's SEC filings, as well as reports, proxy and information statements, and other information regarding issuers that file electronically with the SEC, located at http://www.sec.gov. These filings are also accessible free of charge at the Company's website at www.bankofcommerceholdings.com as soon as reasonably practicable after filing with the SEC. By making this reference to the Company's website, the Company does not intend to incorporate into this report any information contained in the website. The website should not be considered part of this report.
Our principal executive office is located at 1901 Churn Creek Road, Redding,555 Capitol Mall, Suite 1255, Sacramento, California 9600295814 and the telephone number is (530) 722-3939.(800) 421-2575.
Annual Disclosure Statement
This Annual Report on Form 10-K also serves as the annual disclosure statement of the Bank pursuant to Part 350 of the FDIC’s rules and regulations. This statement has not been reviewed or confirmed for accuracy or relevance by the FDIC.
An investment in the Company's common stock involves certain risks. Company
The following is a discussion of what the Company believes are the most significant risks and uncertainties that may affect the Company's business, financial condition and future results.
National and global economic and geopolitical conditions could adversely affect our future results of operations or market price of our stock.
Our business is impacted by factors such as economic, political and market conditions, broad trends in industry and finance, and changes in government monetary and fiscal policies, inflation, and market volatility, all of which are beyond our control. National and global economies are constantly in flux, as evidenced by recent market volatility resulting from, among other things, a relatively new Administration in Washington D.C., politicalpresidential administration and new tax and economic issuespolicies associated therewith, the uncertain future relationship between the European Union and United Kingdom, and the ever-changing landscape of the energy industry. Future economic conditions cannot be predicted, and any renewed deterioration in the economies of the nation as a whole or in our market could have an adverse effect, which could be material, on our business, financial condition, results, operations and prospects, and could cause the market price of our stock to decline.
Our business is subject to geographic risks that could adversely impact our results of operationsoperations and financial condition.
We conduct banking operations principally in northern California. As a result, our business results are dependent in large part upon the business activity, population, income levels, deposits and real estate activity in northern California. While both the national economy and local economies in which we operate have improved, there is no assurance the improvement will continue. Additionally, a sluggish recovery in real estate values and an elevated level of unemployment in the principal market we serve could have an adverse effect on our borrowers or their customers, which could adversely affect our financial condition and results of operations.
Any future deterioration in economic conditions, particularly within our geographic region, could result in the following consequences, any of which could have a material adverse effect on our business, prospects, financial condition and results of operations:
● | Loan delinquencies may increase causing increases in our provision for loan and lease losses and in our Allowance for Loan and Lease Losses (“ALLL”); |
● | Financial sector regulators may adopt more restrictive practices or interpretations of existing regulations, or adopt new regulations; |
● | Collateral for loans made by the Bank, especially real estate related, may decline in value, which in turn could reduce a |
● | Consumer confidence levels may decline and cause adverse changes in payment patterns, resulting in increased delinquencies and default rates on loans and other credit facilities and decreased demand for our products and services; |
● | Demand for loans and other products and services may decrease; |
● | Low cost or |
● | Performance of the underlying loans in the private label mortgage backed securities we hold may deteriorate, potentially causing other-than-temporary impairment markdowns to our investment portfolio. |
Our inability to successfully manage our growth or implement our growth strategy could affect our results of operations and financial condition.
We may not be able to successfully implement our growth strategy if we are unable to expand market share in our existing market or identify attractive new markets, locations or opportunities to expand in the future. In addition, our ability to manage growth successfully will depend on whether we can maintain adequate capital levels, maintain cost controls, effectively manage asset quality and successfully integrate any expanded business divisions or acquired businesses into our operations.
AsweAs we continue to implementourimplement our growth strategy by opening new branches or acquiring branches or banks,we expect to incur increased personnel, occupancy, and other operating expenses. In the case of new branches,we must absorb higher expenses whilewewhile we begin to generate new deposits. In the case of acquired branches,we must absorb higher expenses whilewewhile we begin deploying the newly assumed deposit liabilities. With either new branches opened or branches acquired, there could be alaga lag time involved in deploying new deposits into attractively priced loans and other higher yielding earning assets.Thus,assets. Thus, expansion could depress earnings in the shortterm,short-term, even ifan efficientlyexecutedif an efficiently executed branching strategyleadsstrategy leads to long-term financial benefits.
Nonperforming assets take significant time to resolve and adversely affect our results of operations and financial condition.
We generally do not record interest income on nonperforming loans or other real estate owned, thereby adversely affecting our income, and increasing our loan administration costs. When we take collateral in foreclosures and similar proceedings, we are required to mark the related asset to the then fair market value of the collateral, which may result in a loss. An increase in the level of nonperforming assets increases our risk profile and consequently may impact the capital levels our regulators believe are appropriate.
While we reduce problem assets through loan sales, workouts, restructurings and otherwise, decreases in the value of the underlying collateral, or in these borrowers’ performance or financial condition, whether or not due to economic and market conditions beyond our control, could adversely affect our business, results of operations and financial condition. In addition, the resolution of nonperforming assets requires significant commitments of time from management and our directors, which can be detrimental to the performance of their other responsibilities. We expect the level of non-performing assets and losses relating to such assets to continue to decline, however there can be no assurance that we will not experience future increases in nonperforming assets.
The loan portfolio includes a significant amount of purchased loans and a significant amount of loans serviced by another company.
Purchased loans included in the loan portfolio totaled $133.7$134.9 million or 17%14% of gross portfolio loans as of December 31, 2016. 2017. The loans were purchased as a pool of loans, whole loans or purchased participations from another institution. The majority of the loans are outside our principal market. The loans were purchased under several different contracts, however, $92.6$87.7 million or 12%10% of gross portfolio loans are serviced by two separateunrelated third party servicing companies. A disruption to the operations of either of the loan servicing companies could reduce the value of the assets that we own. In addition, if we arewere ever forced to foreclose and service these loans ourselves, we would incur additional monitoring and servicing costs due to the geographic disbursement of the portfolio, both in and outside our market area which would adversely affect our noninterest expense.
We have a concentration risk in real estate related loans.
A substantial portion of our lending is tied to real estate. As of December 31, 2016,2017, approximately 75%77% of our loan portfolio was secured by real estate, the majority of which is commercial real estate. Of that amount, 7%2% of the portfolio consisted of construction and land development, 55%64% in commercial real estate (non-owner occupied and owner-occupied), 6%5% in residential ITIN, 2%3% in residential 1-4 family mortgage and 5%3% in residential equity lines.
A large percentage of our loan portfolio is comprised of commercial real estate loans which generally carry larger loan balances and historically have involved a greater degree of financial and credit risks than residential first mortgage loans. These loans are primarily made based on and repaid from the cash flow of the borrower (which may be unpredictable) and secondarily on the underlying collateral provided by the borrower. Any decline in the economy in general, material increases in interest rates, changes in tax policies, tightening credit or refinancing markets, or a decline in real estate values in our principal market areas in particular, could have an adverse impact on the repayment of these loans. Further, our ability to recover on these loans by selling or disposing of the underlying real estate collateral would be adversely impacted by any decline in real estate values, which increases the likelihood that we would suffer losses on defaulted loans secured by real estate beyond the amounts provided for in the ALLL. Any increase in net charge-offs and in the ALLL could also have a material adverse effect on our business, financial condition, and results of operations and prospects.
operations and financial condition.
We generally do not record interest income on nonperforming loans or other real estate owned, thereby adversely affecting our income, and increasing our loan administration costs. When we take collateral in foreclosures and similar proceedings, we are required to mark the related asset to the then fair market value of the collateral, which may result in a loss. An increase in the level of nonperforming assets increases our risk profile and consequently may impact the capital levels our regulators believe are appropriate.
While we reduce problem assets through loan sales, workouts, restructurings and otherwise, decreases in the value of the underlying collateral or in these borrowers’ performance or financial condition, whether or not due to economic and market conditions beyond our control, could adversely affect our business, results of operations and financial condition. In addition, the resolution of nonperforming assets requires significant commitments of time from management and our directors, which can be detrimental to the performance of their other responsibilities. We expect the level of non-performing assets and losses relating to such assets to continue to decline, however there can be no assurance that we will not experience future increases in nonperforming assets.
Future loan and lease losses may exceed the allowance for loan and lease losses.
We have established an allowance for possible losses expected in connection with loans in the credit portfolio. This allowance reflects estimates of the collectability of certain identified loans, as well as an overall risk assessment of gross loans outstanding.
The determination of the amount of the allowance for loan and lease losses is subjective; althoughsubjective. Although the method for determining the amount of the allowance uses criteria such as risk ratings and historical loss rates, these factors may not be adequate predictors of future loan performance, particularly in the current economic climate.performance. Accordingly, we cannot offer assurances that these estimates ultimately will prove correct or that the loan and lease loss allowance will be sufficient to protect against losses that ultimately may occur. If the allowance for loan and lease losses proves to be inadequate, we will need to make additional provisions to the allowance, which is accounted for as charges to income, which would adversely impact results of operations and financial condition. Moreover, federal and state banking regulators, as an integral part of their supervisory function, periodically review our loan portfolio and the adequacy of our allowance. These regulatory authorities may require us to recognize further loan loss provisions or charge-offs based upon their judgments, which may be different from our judgments. Any increase in the allowance could have an adverse effect, which could be material, on our financial condition and results of operations.
Defaults may negatively impact us.
Risk arises from the possibility that losses will be sustained if a significant number of borrowers, guarantors and related parties fail to perform in accordance with the terms of their loans. We have adopted underwriting and credit monitoring procedures and credit policies, including the establishment and review of the adequacy of the allowance for loan and lease losses, which management believes are appropriate to minimize risk by assessing the likelihood of nonperformance, tracking loan performance and diversifying the loan portfolio. These policies and procedures, however, may not prevent unexpected losses that could materially affect our results of operations.
InterInterestest rate fluctuations, which are out of our control, could harm profitability.
Our income is highly dependent on “interest rate spreads” (i.e., the difference between the interest income earned on our interest earninginterest-earning assets such as loans and securities, and the interest expense paid on our interest-bearing liabilities such as deposits and borrowings). The underlying interest rates are highly sensitive to many factors, many of which are beyond our control, including general economic conditions, inflation, recession and the policies of various governmental and regulatory agencies, in particular, the Federal Reserve Board. Recently, the Federal Reserve Board increased the federal funds target range by 0.25% (0.50% to 0.75%) and has indicated further increases could continue depending on economic conditions. We have positioned the balance sheet into an interest rate risk position that is essentially neutral as we plan for rising interest rates. By extendingIn recent years, we originated higher volumes of longer term fixed rate loans. These loans, combined with the duration of a portion of our liabilities and shortening the durationstructure of our investment portfolio, we have movedthe use of floors in the pricing of our variable rate loans and funding mix caused the Company from a liability sensitive position in a rising rate environment to abecome neutral orto slightly liability sensitive position.
The interest rates we pay on deposits and the interest rates we earn on loans are determined in large part by the rates paid and charged by our competitors. In addition, changes in monetary policy, including changes in interest rates influence the origination of loans, the purchase of investments and the generation of deposits. These changes affect the rates received on loans and securities and paid on deposits, which could have a material adverse effect on our business, financial condition and results of operations.
Changes in the fair value of our securities maymay reduce our shareholders’ equity and net income.
We increase or decrease our shareholders’shareholders’ equity by the amount of change in the unrealized gain or loss (the difference between the fair value and the amortized cost) of our available-for-sale securities portfolio, net of the related tax, under the category of accumulated other comprehensive income (loss). Therefore, aA decline in the fair value of this portfolio will result in a decline in reported shareholders’ equity, as well as book value per common share. This decrease will occur even though the securities are not sold. In the case of debt securities, if these securities are never sold and there are no credit impairments, the decrease will be recovered over the life of the securities. In the event there are credit loss related impairments, the credit loss component is recognized in earnings.
We own shares of Federal Home Loan Bank of San Francisco stock which are recorded in other assets. The stock is carried at cost and is subject to recoverability testing under applicable accounting standards. As of December 31, 2016,2017, we did not recognize an impairment charge related to our Federal Home Loan Bank of San Francisco stock holdings; however, potential negative changes to the financial condition of the Federal Home Loan Bank of San Francisco may require us to recognize an impairment charge with respect to such stock holdings. Any such impairment charge would have an adverse impact on our results of operations and financial condition.
December 31, 2017, we did not recognize an impairment charge related to our QZAB investment holdings; however, potential negative changes to the financial condition of the issuing institution may require us to recognize an impairment charge with respect to such holdings. Any such impairment charge would have an adverse impact on our results of operations and financial condition.
Credit quality for private label mortgage backed securities we hold may deteriorate creating additional credit risk in our investment portfolio.
Our securities portfolio contains private label mortgage backed securities. These securities have more credit risk than the securities in our portfolio that are obligations of the U.S. Government or obligations guaranteed by U.S. Government. We monitor the credit characteristics of the underlying mortgages to identify potential credit losses, if any, in the portfolio. If there is a decline in fair value due to credit quality concerns for a security we may be required to recognize an other-than-temporarily-impairment in earnings. Our Investment Policy requires that at the time of purchase, securities purchased to be rated A3/A- or higher by Moody’s, S&P and Fitch rating agencies.
Conditions in the financial markets may limit our access to additional funding to meet our liquidity needs.
Liquidity is essential to our business, as we must maintain sufficient funds to respond to the needs of depositors and borrowers. An inability to raise funds through deposits, repurchase agreements, federal funds purchased, Federal Home Loan Bank of San Francisco advances, the sale or pledging as collateral of securities, loans, and other assets could have a substantial negative effect on our liquidity. Our access to funding sources in amounts adequate to finance our activities could be impaired by factors that affect us specifically or the financial services industry in general. Factors that could negatively affect our access to liquidity sources include negative operating results, a decrease in the level of our business activity due to a market downturn or negative regulatory action against us. Our ability to borrow could also be impaired by factors that are not specific to us, such as severe disruption of the financial markets or negative news and expectations about the prospects for the financial services industry as a whole. An inability to borrow funds to meet our liquidity needs could have an adverse impact on our results of operations and financial condition.
The condition of other financial institutions could negatively affect us. Financial services institutions are interrelated as a result of trading, clearing, counterparty, public perceptions and other relationships. We have exposure to many different industries and counterparties, and we routinely execute transactions with counterparties in the financial services industry, including commercial banks, brokers and dealers, investment banks and other institutional clients. Many of these transactions expose us to credit risk in the event of a default by a counterparty or client. In addition, our credit risk may be exacerbated when the collateral held by us cannot be realized upon or is liquidated at prices not sufficient to recover the full amount of the credit or derivative exposure due to us. Any such losses could have a material adverse effect on our financial condition and results of operations. Competition in our market areas may limit future success. Community banking is a highly competitive business and a consolidating industry. We compete for loans and deposits with other commercial banks, savings and loans, credit unions, finance, insurance and other non-depository companies operating in our market areas. Derivative financial instruments subject the Company to credit and market risk We may use derivatives to hedge the risk of changes in market interest rates in order to limit the impact on earnings and cash flows relating to specific groups of assets and liabilities. Our use of derivatives in our risk management activities could expose the Company to mark-to-market losses if interest rates move in a materially different way than we expected when we entered into the related derivative contracts. In addition, we would be exposed to credit risk should the counterparty fail to perform under the terms of the derivative contracts. This could cause us to forfeit the payments due to us or result in settlement delays with the attendant credit and operational risk as well as increased costs to us. Derivative contracts may contain a provision which allows the counterparty to terminate the derivative contract if we failed to maintain our status as a well/adequately capitalized institution or if specific regulatory events occurred. If these contracts were terminated by the counterparty, we would be required to settle our obligations under the agreements, which could also cause operational risk and increased costs to us. We rely The valueThere are discussions regarding decreasing the U.S. federal corporate tax rate, which have taken on a new focus and prominence given the new U.S. presidential administration and Congress. While we may benefit on a prospective net income basis from any decrease in corporate tax rates, proposals being discussed currently such as lowering the corporate tax rate could result in a material decrease in the value of our deferred tax assets which would also result in a material reduction to our net income during the period in which the change is enacted and our regulatory capital would also be reduced. Given the number of uncertainties relating to the ultimate form any corporate tax reform may take, it is not possible to quantify the potential negative impact to the Company’s income or regulatory capital.We are subject to substantial competition for loans and deposits from other financial institutions. Some of our competitors are not subject to the same regulations and restrictions as are we, are, and some of our competitors have greater financial resources than we do.resources. If we are unable to effectively compete in our market areas, the Company's business, results of operations, and prospects could be adversely affected.There can be no assurance we will be able to continue paying dividends on the common stock at recent levels.We may not be able to continue paying quarterly dividends commensurate with recent levels given that the ability to pay dividends on our common stock depends on a variety of factors. The payment of quarterly dividends is subject to government regulation in that regulatory authorities may prohibit banks and bank holding companies from paying dividends that would constitute an unsafe or unsound banking practice. Our ability to pay dividends is subject to certain regulatory requirements. The Federal Reserve Board generally prohibits a bank holding company from declaring or paying a cash dividend which would impose undue pressure on the capital of subsidiary banks or would be funded only through borrowing or other arrangements that might adversely affect a financial services holding company’s financial position. The Board of Governors of the Federal Reserve System policy is that a bank holding company should not continue its existing rate of cash dividends on its common stock unless its net income is sufficient to fully fund each dividend and its prospective rate of earnings retention appears consistent with its capital needs, asset quality and overall financial condition. The power of the board of directors of an insured depository institution to declare a cash dividend or other distribution with respect to capital is subject to statutory and regulatory restrictions which limit the amount available for such distribution depending upon the earnings, financial condition and cash needs of the institution, as well as general business conditions.Our ability to pay cash dividends to our shareholders is dependent on our receipt of cash dividends from our subsidiary Bank. In addition to the restrictions imposed under federal law, banks chartered under California law generally may only pay a cash dividend to the extent such payment does not exceed the lesser of (i) retained earnings of the bank or (ii) the bank’s net income for its last three fiscal years (less any distributions to shareholders during such period). As a result, future dividends will generally depend on the level of earnings at the Bank.heavilyheavily on our management team and the loss of key officers may adversely affect operations.
We are dependent on the successful recruitment and retention of highly qualified personnel. Our ability to implement our business strategies is closely tied to the strengths of our chief executive officer and other key officers. Additionally, business banking, one of our principal lines of business, is dependent on relationship banking in which our personnel develop professional relationships with small business owners and officers of larger business customers who are responsible for the financial management of the companies they represent. If management team members or other key employees were to leave the Company and become employed by a competing bank, we could potentially lose business customers. In addition, we rely on our customer service staff to effectively serve the needs of our customers. The loss of key employees to competitors or otherwise could have an adverse effect on our results of operation and financial condition.
Our future performance will depend on our ability to respond to technological change.
The financial services industry is experiencing rapid technological changes with frequent introductions of new technology-driven products and services. Effective use of technology increases efficiency and enables financial institutions to better serve customers and reduce costs. Many of our competitors have substantially greater resources to invest in technological improvements than we do. Our future success will depend, to some degree, on our ability to address the needs of our customers by using technology to provide products and services that will satisfy customer demands for convenience, as well as create additional efficiencies in our operations, We may not be able to effectively implement new technology-driven products or service, or be successful in marketing such products and services. Additionally, the implementation of technological changes and upgrades to maintain current systems and integrate new ones may cause services interruptions, transaction processing errors and system conversion delays and may cause us to fail to comply with applicable laws. There can be no assurance that we will be able to successfully manage the risks associated with increased dependency on technology.
Internal control systems could fail to detect certain events.
We are subject to many operating risks, including, without limitation, data processing system failures and errors, and customer or employee fraud. There can be no assurance that such an event will not occur, and if such an event is not prevented or detected by our internal controls and does occur, and it is uninsured or is in excess of applicable insurance limits, it could have a significant adverse impact on our reputation in the business community and our business, financial condition, and results of operations.
Our operations could be interrupted if third partytechnology service providers experience difficulty, terminate their services or fail to comply with banking regulations.
We depend, and will continue to depend to a significant extent, on a number of relationships with third party technology service providers. Specifically, we utilize software and hardware systems for transaction processing, essential web hosting, debit and credit card processing, merchant bankcard processing, internet banking systems and other processing services from third party service providers. If these third party service providers experience difficulties or terminate their services, and we are unable to replace them with other qualified service providers, our operations could be interrupted. If an interruption were to continue for a significant period of time, our business, financial condition and results of operations could be materially adversely affected.
Confidential customer information transmitted through the Bank’sBank’s online banking service is vulnerable to security breaches and computer viruses which could expose the Bank to litigation and adversely affect its reputation and ability to generate deposits.
We provide our customers the ability to bank online. We rely heavily on the secure processing, storage and transmission of confidential and other information on our computer systems and networks. The secure transmission of confidential information over the Internet is a critical element of online banking. Our network could be vulnerable to unauthorized access, computer hacking, cyber-attacks, electronic fraudulent activity, attempted theft of financial assets, computer viruses, phishing schemes and other security problems. We cannot guarantee that any such failures, interruption or security breaches will not occur, or if they do occur, that they will be adequately addressed. While we have certain protective policies and procedures in place, the nature and sophistication of the threats continue to evolve. We may be required to spend significant capital and other resources to protect against the threat of security breaches and computer viruses, alleviate problems caused by security breaches or viruses or to modify and enhance our protective measures. To the extent that our activities or the activities of our customers involve the storage and transmission of confidential information, security breaches and viruses could expose us to claims, litigation and other possible liabilities. Any inability to prevent cyber-attacks, security breaches or computer viruses could also cause existing customers to lose confidence in our systems and could adversely affect our reputation and our ability to generate deposits.
We are subject to extensive regulation which could adversely affect our business.
Our operations are subject to extensive regulation by federal, state and local governmental authorities and are subject to various laws and judicial and administrative decisions imposing requirements and restrictions on part or all of our operations. Because our business is highly regulated, the laws, rules and regulations applicable to us are subject to modification and change. There are currently proposed laws, rules and regulations that, if adopted, would impact our operations. For more information on these issues, refer to the material set forth above under the heading "Government Supervision and Regulation."
The requirements imposed by our regulators and other laws, rules or regulations applicable to us are designed to ensure the integrity of the financial markets and to protect customers and other third parties that transact business with us, and are not designed to protect our shareholders. Consequently, these regulations may: (1) make compliance much more difficult or expensive, (2) restrict our ability to originate, broker or sell loans or accept certain deposits, (3) further limit or restrict the amount of commissions, interest or other charges earned on loans originated or sold by us, or (4) otherwise adversely affect our business or prospects for business. Moreover, banking regulators have significant discretion and authority to address what regulators perceive to be unsafe or unsound practices or violations of laws or regulations by financial institutions and holding companies in the performance of their supervisory and enforcement duties. The exercise of regulatory authority by banking regulators over us may have a negative impact on our financial condition and results of operations. Additionally, in order to conduct certain activities, including acquisitions, we are required to obtain regulatory approval. There can be no assurance that any required approvals can be obtained, or obtained without conditions or on a timeframe acceptable to us.
Risks RelatedThere are risks related to the Useuse of Brokered Depositsbrokered deposits..
The use of brokered deposits without regulatory approval from the FDIC is limited to banks that are “well capitalized” under applicable federal regulations. A portion of our local deposits are derived through a program known as the Certificate of Deposit Account Registry Service or (“CDARS”) and also through a program known as Insured Cash Sweep or (“ICS”). The CDARS program is a deposit swapping service that enables thousands of participating banks in the U.S. to provide their customers with access to millions of dollars of FDIC-insured certificates of deposit. The ICS service allows banks in the ICS network to place funds through the ICS network and receive matching deposits from other FDIC insured member banks. As of December 31, 2016, $65.22017, $66.3 million in deposits were derived through the CDARS and ICS program.programs. While these deposits share many of the key characteristics of core deposits, the FDIC considers such deposits to be brokered. Furthermore, in November, 2015, the FDIC issued updated regulations which take a more expansive view of what constitutes a brokered deposit. If our capital levels fall below “well capitalized” minimums and unless we obtain the FDIC’sFDIC’s consent, we may not have access to a significant source of funding, including CDARS and ICS deposits, which could force us to use more expensive sources of funding or to sell loans or other assets at a time when pricing for such assets is unfavorable. Should it become necessary, we would seek the FDIC’s consent to utilize CDARS and ICS deposits but there can be no assurance that we would receive their consent. If we could not raise additional capital, our liquidity, results of operations and financial condition could be adversely affected.
Changes in accounting standards may impact how we report our consolidated financial condition and consolidated results of operations.
Our accounting policies and methods are fundamental to how we record and report our financial condition and results of operations. From time to time, the FASB changes the financial accounting and reporting standards that govern the preparation of our financial statements. These changes can be difficult to predict and can materially impact how we record and report our financial condition and results of operations. In some cases, we could be required to apply a new or revised standard retroactively, resulting in a restatement of prior period financial statements.
A natural disaster, or recurring energy shortage, especially in California,such as earthquakes, volcanic eruptions, tsunamis, wildfires, droughts, floods, mudslides, hurricanes, tornados and other geologic processes could harm our business.
Historically, California has been vulnerable to natural disasters. Therefore, weWe are susceptible to the risks of natural disasters such as earthquakes, volcanic eruptions, tsunami, wildfires, droughts, floods, mudslides, hurricanes, tornados and mudslides.other geologic processes. Historically, California has been vulnerable to natural disasters, and in 2017, California experienced extensive rainfall resulting in significant flooding and landslides, followed later in the year by the largest and most destructive wildfire season in state history. Natural disasters could harm our operations directly through interference with communications, including the interruption or loss of our websites, which would prevent us from gathering deposits, originating loans and processing and controlling our flow of business, as well as through the destruction of facilities and our operational, financial and management information systems. California has also historically experienced energy shortages, which, if they recur, could impair our business operation and the value of the real estate in thosethe areas affected.
Although we have implemented several back-up systems and protections and maintain business interruption insurance, these measures may not protect us fully from the effects of a natural disaster. The occurrence of natural disasters or energy shortages in California could have a material adverse effect on our business, prospects, financial condition and results of operations.
The price ofA natural disaster outside California could negatively impact our common stock may fluctuate significantly, and this may make it difficult for you to resell shares of common stock owned by you at timespurchased loan portfolio or at prices you find attractive.
Stock price volatility may make it difficult for you to resell your common stock at the time and prices you find attractive. Our stock price can fluctuate significantly in response to a variety of factors including, among other things:
|
|
|
|
|
|
|
|
|
|
|
|
|
|
|
|
|
|
|
|
General market fluctuations, industry factors and general economic and political conditions and events, such as economic slowdowns or recessions, interest rate changes or credit loss trends, could also cause our stock price to decrease regardless of operating results as evidenced by the recent volatility and disruption of capital and credit markets.third party loan servicers.
Our common stock is tradedpurchased loan portfolio includes a significant amount of loans made to borrowers outside California. We also rely on third party loan servicers located outside of California. Therefore, we are susceptible to the NASDAQ Global Market underrisks of natural disasters outside California. Natural disasters could impact the trading symbol “BOCH”operations of our loan servicers directly through interference with communications, including the interruption or loss of websites, destruction of facilities, operational, financial and historically has been a low trading volume stock. The limited trading marketmanagement information systems which could prevent them from servicing our portfolio. Natural disasters outside California could also impact the underlying collateral and borrower’s ability to repay the loans for our common stock may cause fluctuations in the market value of our common stock to be exaggerated, leading to price volatility in excess of that which would occur in a more active trading market of our common stock. Future sales of substantial amounts of common stock in the public market, or the perception that such sales may occur, could adversely affect the prevailing market price of the common stock. In addition, even if a more active market in our common stock develops, we cannot assure you that such a market will continue.
Anti-takeover provisions in our articles of incorporation could make a third party acquisition of us difficult.purchased loan portfolios.
In order to approve a merger or similar business combination with the owner of 20% or more of our common stock (an “Interested Shareholder”), our Articles of Incorporation contain provisions that require a supermajority vote of 66.7% of the outstanding shares of the common stock (excluding the shares held by the Interested Shareholder or its affiliates). These provisions further require that the per share consideration to be paid in such a transaction would have to equal or exceed the greater of (1) the highest per share price paid by the Interested Shareholder (a) within two years of the transaction proposal announcement date, or (b) the date the Interested Shareholder acquired a 20% -plus ownership interest (if the acquisition occurred less than two years before the transaction announcement) and (2) the fair market value of the Common Stock on (a) the transaction proposal announcement date, or (b) the date the Interested Shareholder acquired a 20% -plus ownership interest (if the acquisition occurred less than two years before the transaction announcement).
The operation of these provisions could result in the Company becoming a less attractive target for a would-be acquirer. As a consequence, it is possible that shareholders would lose an opportunity to be paid a premium for their shares in an acquisition transaction, even in circumstances where such action is favored by a majority of the Company's shareholders.
There may be future sales or other dilutions of our equity which may adversely affect the market price of our common stock.
We are not restricted from issuing additional shares of common stock, including securities that are convertible into or exchangeable for, or that represent the right to receive our common stock. In addition, we are not prohibited from issuing additional securities which are senior to our common stock. Because our decision to issue securities in any future offering will depend in part on market conditions and other factors beyond our control, we cannot predict or estimate the amount, timing or nature of any future offerings.
Shares of our common stock eligible for future sale, including those that may be issued in connection with our various stock option and equity compensation plans, in possible acquisitions, and any other offering of our common stock for cash, could have a dilutive effect on the market for our common stock and could adversely affect our market price. Our Articles of Incorporation authorize 50,000,000 shares of which 13,440,442 shares were outstanding as of December 31, 2016. There are 188,900 shares subject to common stock options outstanding with a weighted average exercise price of $5.08 per share. Any future issuances of shares of our common stock may be dilutive to existing shareholders.
The holders of our trust preferred securities and subordinated notes have rights that are senior to those of our holders of common stock and that may impact our ability to pay dividends on our common stock to our common shareholders and reduce net income available to our common shareholders.
At December 31, 2016, our subsidiary Trust II had outstanding $10.3 million of trust preferred securities. These securities are effectively senior to shares of common stock due to the priority of the underlying junior subordinated debentures. As a result, we must make payments on our trust preferred securities before any dividends can be paid on our common stock; moreover, in the event of our bankruptcy, dissolution, or liquidation, the obligations outstanding with respect to our trust preferred securities must be satisfied before any distributions can be made to our shareholders. While we have the right to defer dividends on the trust preferred securities for a period of up to five years, if any such election is made, no dividends may be paid to our common or preferred shareholders during that time.
On December 10, 2015, the Holding Company issued and sold $10.0 million in aggregate principal amount of fixed to floating rate Subordinated Notes pursuant to a private placement with certain institutional investors. The Subordinated Notes initially bear interest at 6.88% per annum for a five-year term, payable semi-annually on June 20 and December 20 of each year. Thereafter, the Holding Company will pay interest on the Subordinated Notes at a variable rate equal to three month LIBOR plus 526 basis points, payable by the Holding Company quarterly on February 15, May 15, August 15 and November 15 of each year until the maturity date. The Subordinated Notes qualify as Tier 2 Capital under the Final Rules.
The Subordinated Notes are subordinate and junior in right of payment to the prior payment in full of all existing and future claims of creditors and depositors of the Holding Company and its subsidiaries, whether now outstanding or subsequently created. However, the Subordinated Notes rank senior to all future junior subordinated debt obligations, preferred stock and common stock of the Holding Company. This means that we must make payments on the Subordinated Notes before any dividends can be paid on our common stock, and in the event of our bankruptcy, dissolution or liquidation, the holders of the Subordinated Notes must be satisfied before any distributions can be made on our common stock.
The Holding Company is a bank holding company under the BHC Act, and its only significant asset is its wholly owned bank subsidiary. The Holding Company has no other source of funds other than dividends and other distributions from the Bank. As discussed in Note 21Regulatory Capital in theNotes to Consolidated Financial Statements in this document, the Company’s ability to pay dividends to its shareholders will depend on the Bank’s ability to pay dividends to the Holding Company.
No assurance can be given that the SubordinatedSubordinated Notes will continue to qualify as Tier 2 Capital.
We believe that the Subordinated Notes meet the requirements of Tier 2 Capital in accordance with the Final Rules and current statutory guidance provided by the Federal Reserve Board. The Federal Reserve Board does not provide prior approval for the Subordinated Notes to be classified as Tier 2 Capital buthowever, we expectdid not receive any indication that the Subordinated Notes did not qualify as tier 2 capital during our most recent examination process with the Federal Reserve Bank of San Francisco will review the Subordinated Notes as part of its next examination process. Until completion of that examination, we cannot give any assurance that the Subordinated Notes will qualify as Tier 2 Capital. In the event that the Subordinated Notes do not qualify, the Federal Reserve Bank of San Francisco may require the Holding Company to amend certain terms and conditions of the Subordinated Notes in order for such instruments to qualify as Tier 2 Capital. Under the terms of the Subordinated Notes, the Holding Company also has the option to redeem the Subordinated Notes upon the occurrence of such an event.
The Holding CompanyWe cannot give any assurance as to whether the applicable requirements for Tier 2 Capital will change in the future. Even if the Subordinated Notes initially meet the requirements of Tier 2 Capital under the current regulations, if changes are made in the future, and unless the Subordinated Notes are grandfathered into the new regulations, they could become disqualified as Tier 2 Capital.
Potential Volatility of DepositsOur deposits may be subject to volatility
Our depositors could choose to withdraw their deposits from the Bank and place them into alternative investments, which might cause an increase in our funding costs and reduce our net interest income. Checking, savings and money market account balances can decrease when customers perceive that alternative investments such as the bonds or equities provide a better risk/return tradeoff.
At December 31, 2016,2017, time certificates of deposit in excess of $250,000, excluding brokered time deposits, represented approximately 6%5% of our total deposit balances. Because these deposits are not covered by FDIC deposit insurance, they are considered volatile and could be subject to withdrawal. Withdrawal of a material amount of such deposits could adversely affect our liquidity, profitability, business prospects, results of operations and cash flows.
The FDIC has implemented a plan to increase the federal Deposit Insurance Fund, including additional future premium increases and special assessments.
As discussed above under the heading "Government Supervision and Regulation," the FDIC has implemented a plan to increase insurance premiums and has imposed special assessments to rebuild and maintain the DIF, and any additional future premium increases or special assessments could have a material adverse effect on the Company's business, financial condition, and results of operations. To repeat from
The Dodd-Frank Act broadened the above,base for FDIC insurance assessments. In addition, the Dodd-Frank Act redefined the assessment base used for calculating FDIC deposit insurance assessments and raisedestablished 1.35% as the minimum designatedDIF reserve ratio. The FDIC has determined that the fund reserve ratio of the DIF from 1.15% to 1.35%. Further, the FDIC has established a higher reserve ratio of 2% as a long-term goalshould be 2.0% (which is beyond what is required by statute. Aslaw) and has adopted a result,plan under which it will meet the statutory minimum reserve ratio of 1.35% by the statutory deadline of September 30, 2020. Accordingly, the deposit insurance assessments to be paid by the Bank could increase.
The impact of Basel III is uncertainuncertain..
Basel III set forth more robust global regulatory standards on capital adequacy, qualifying capital instruments, leverage ratios, market liquidity risk, and stress testing. The phase-in period for Basel III began on January 1, 2015 and ends will end on January 1, 2019. The implementation of these new standards couldis not expected to have an adverse impact on our financial position and future earnings due to, among other things, the increased Tier 1 capital ratio requirements. Additional information regarding Basel III is set forth below under the heading “Regulatory Capital Guidelines.”
Our exposure to operational, technological, and organization risk may adversely affect usus..
Similar to other financial institutions,we are exposed to many types of operational and technological risk, including reputation, legal and compliance risk.Ourrisk. Our ability to grow and compete is dependent onouron our ability to build or acquire the necessary operational and technological infrastructure and to manage the cost of that infrastructure whilewewhile we expand andintegrateand integrate acquired businesses. Operational risk can manifest itself in many ways, such as errors related to failed or inadequate processes, faulty or disabled computer systems, occurrences of fraud by employees or persons outside our company, and exposure to external events.Weevents. We are dependent onouron our operational infrastructure to help manage these risks. From time to time,we may need to change or upgradeourupgrade our technological infrastructure.Weinfrastructure. We may experience disruption, andweand we may face additional exposure to these risks during the course of making such changes. IfweIf we acquire another financial institution or bank branch operations,we would face additional challenges when integrating different operational platforms, causing integration effortstoefforts to be more disruptive and /or more costly than anticipated.
Item1b - Unresolved Staff Comments
None to report.Shareholders
In addition to risks and uncertainties that may affect the CompanyItem2 - Properties
|
| ||
|
| ||
|
| ||
|
| ||
|
| ||
|
| ||
|
| ||
|
| ||
|
| ||
|
| ||
|
| ||
|
| ||
|
| ||
|
| ||
|
| ||
|
| ||
|
| ||
|
| ||
Item3 - Legal Proceedings’s business, financial condition and the future results, shareholders may also be subject to the following risks:
We are subjectThere can be no assurance we will be able to various pending and threatened legal actions arising in the ordinary course of business and maintain reserves for losses from legal actions that are both probable and estimable. There are no legal proceedings adverse to the Company that we believe will have a material effect on our consolidated financial position or results of operations.
Item4 - Mine Safety Disclosures
Not applicable.
Part II
Item5 - Market for Registrant’s Common Equity, Related Shareholder Matters and Issuer Purchases of Equity Securities
The principal market on which our common stock is traded is the NASDAQ Global Market. The Holding Company’s common stock is listed under the trading symbol “BOCH.” The following table sets forth the high and low closing sales prices of the Holding Company’s common stock on the NASDAQ Global Market for the periods indicated.
Sales Price Per Share | ||||||||||||||||
Quarter Ended: | High | Low | Close | Volume | ||||||||||||
March 31, 2015 | $ | 6.00 | $ | 5.48 | $ | 5.54 | 1,086,600 | |||||||||
June 30, 2015 | $ | 6.20 | $ | 5.51 | $ | 5.70 | 1,246,100 | |||||||||
September 30, 2015 | $ | 5.90 | $ | 5.40 | $ | 5.78 | 1,044,600 | |||||||||
December 31, 2015 | $ | 7.39 | $ | 5.72 | $ | 6.68 | 1,359,900 | |||||||||
March 31, 2016 | $ | 6.93 | $ | 5.05 | $ | 6.35 | 1,415,600 | |||||||||
June 30, 2016 | $ | 6.77 | $ | 6.09 | $ | 6.60 | 1,901,700 | |||||||||
September 30, 2016 | $ | 7.41 | $ | 6.05 | $ | 7.20 | 1,341,500 | |||||||||
December 31, 2016 | $ | 9.67 | $ | 7.00 | $ | 9.50 | 1,114,800 | |||||||||
There were 2,364 shareholders of the Holding Company’s common stock as of December 31, 2016, including those held in street name, and the market price on that date was $9.50 per share.
Dividends
Cash dividends of $0.03 per share were paid on January 12, 2016, April 13, 2016, July 13, 2016, and October 12, 2016 to shareholders of record as of December 31, 2015, April 5, 2016, July 5, 2016, and October 4, 2016, respectively. Cash dividends of $0.03 per share were paid on January 2, 2015, April 8, 2015, July 8, 2015, and October 14, 2015 to shareholders of record as of December 26, 2014, March 27, 2015, June 26, 2015, and October 2, 2015, respectively.
On December 11, 2015, we completed the redemption of all of the outstanding shares of our preferred stock (the “SBLF Redemption”) designated as Senior Non-Cumulative Perpetual Preferred Stock, Series B (“Series B Preferred Stock”), held by the US Treasury Department under the Small Business Lending Fund Program. The Holding Company paid $20.0 million to redeem the Series B Preferred Stock and $39 thousand in accrued but unpaid dividends. The holders of Series B Preferred Stock were entitled to receive non-cumulative dividends payable quarterly, and we could only declare and paycontinue paying cash dividends on our common stock if we had declared and paid dividends for the current dividend period on the Series B Preferred Stock. After the SBLF Redemption, we are no longer subject to the restrictions on dividend payments required by the Series B Preferred Stock.at recent levels.
OurWe may not be able to continue paying quarterly cash dividends commensurate with recent levels, given that the ability to pay cash dividends on our common stock depends on a variety of factors. The payment of dividends is subject to certaingovernment regulation in that regulatory requirements.authorities may prohibit banks and bank holding companies from paying dividends that would constitute an unsafe or unsound banking practice. The Federal Reserve Board generally prohibits a bank holding company from declaring or paying a cash dividend which would impose undue pressure on the capital of subsidiary banks or would be funded only through borrowing or other arrangements that might adversely affect a financial services holding company’s financial position. The Board of Governors of the Federal Reserve System policy is that a bank holding company should not continue its existing rate of cash dividends on its common stock unless its net income is sufficient to fully fund each dividend and its prospective rate of earnings retention appears consistent with its capital needs, asset quality and overall financial condition. The power of the board of directors of an insured depository institution to declare a cash dividend or other distribution with respect to capital is subject to statutory and regulatory restrictions which limit the amount available for such distribution depending upon the earnings, financial condition and cash needs of the institution, as well as general business conditions.
We currently hold $24.0 million from our May 2017 public offering. Historically, our ability to pay cash dividends to our shareholders was dependent on our receipt of cash dividends from our subsidiary Bank. In addition to the restrictions imposed under federal law, banks chartered under California law generally may only pay a cash dividend to the extent such payment does not exceed the lesser of (i) retained earnings of the bank or (ii) the bank’s net income for its last three fiscal years (lessless any distributions to shareholders during such period)period.
The price of our common stock may fluctuate significantly, and this may make it difficult for you to resell shares of our common stock owned by you at times or at prices you find attractive.
Stock price volatility may make it difficult for you to resell your common stock at the time and prices you find attractive. Our stock price can fluctuate significantly in response to a variety of factors including, among other things:
● Actual or anticipated variations in quarterly results of operations;
● Recommendations by securities analysts;
● Operating and stock price performance of other companies that investors deem comparable to us;
● News reports relating to trends, concerns and other issues in the financial services industry, including the failures of other financial institutions;
● Perceptions in the marketplace regarding the Company and/or our competitors;
● Public sentiments toward the financial services and banking industry generally;
● New technology used, or services offered, by competitors;
● Significant acquisitions or business combinations, strategic partnerships, joint ventures or capital commitments by or involving the Company or our competitors;
● Changes in government regulations; and
● Geopolitical conditions such as acts or threats of terrorism or military conflicts.
General market fluctuations, industry factors and general economic and political conditions and events, such as economic slowdowns or recessions, interest rate changes or credit loss trends, could also cause our stock price to decrease regardless of operating results as evidenced by the recent volatility and disruption of capital and credit markets.
Our common stock is traded on the NASDAQ Global Market under the trading symbol “BOCH” and historically has been a low trading volume stock. The limited trading market for our common stock may cause fluctuations in the market value of our common stock to be exaggerated, leading to price volatility in excess of that which would occur in a more active trading market of our common stock. Future sales of substantial amounts of common stock in the public market, or the perception that such sales may occur, could adversely affect the prevailing market price of the common stock. In addition, even if a more active market in our common stock develops, we cannot assure you that such a market will continue.
Anti-takeover provisions in our articles of incorporation could make a third party acquisition of us difficult.
In order to approve a merger or similar business combination with the owner of 20% or more of our common stock (an “Interested Shareholder”), our Articles of Incorporation contain provisions that require a supermajority vote of 66.7% of the outstanding shares of the common stock (excluding the shares held by the Interested Shareholder or its affiliates). These provisions further require that the per share consideration to be paid in such a transaction would have to equal or exceed the greater of (1) the highest per share price paid by the Interested Shareholder (a) within two years of the transaction proposal announcement date, or (b) the date the Interested Shareholder acquired a 20% -plus ownership interest (if the acquisition occurred less than two years before the transaction announcement) and (2) the fair market value of the Common Stock on (a) the transaction proposal announcement date, or (b) the date the Interested Shareholder acquired a 20% -plus ownership interest (if the acquisition occurred less than two years before the transaction announcement).
The operation of these provisions could result in the Company becoming a less attractive target for a would-be acquirer. As a consequence, it is possible that shareholders would lose an opportunity to be paid a premium for their shares in an acquisition transaction, even in circumstances where such action is favored by a majority of the Company's shareholders.
There may be future sales or other dilutions of our equity which may adversely affect the market price of our common stock.
We are not restricted from issuing additional shares of common stock, including securities that are convertible into or exchangeable for, or that represent the right to receive our common stock. In addition, we are not prohibited from issuing additional securities which are senior to our common stock. Because our decision to issue securities in any future offering will depend in part on market conditions and other factors beyond our control, we cannot predict or estimate the amount, timing or nature of any future offerings.
Shares of our common stock eligible for future issuance, including those that may be issued in connection with our various stock option and equity compensation plans, in possible acquisitions or in any other offering of our common stock for cash, could have a dilutive effect on the tangible book value of our common stock and could adversely affect our market price. Any future issuances of shares of our common stock may be dilutive to existing shareholders.
The holders of our trust preferred securities have rights that are senior to those of our holders of common stock and that may impact our ability to pay dividends on our common stock to our common shareholders.
At December 31, 2017, our subsidiary Bank of Commerce Holdings Trust II had outstanding $10.3 million of trust preferred securities. These securities are effectively senior to shares of common stock due to the priority of the underlying junior subordinated debentures. As a result, futurewe must make dividend payments on our trust preferred securities before any dividends will generally dependcan be paid on our common stock; moreover, in the event of our bankruptcy, dissolution, or liquidation, all obligations outstanding with respect to our trust preferred securities must be satisfied before any distributions can be made to our shareholders. While we have the right to defer dividends on the leveltrust preferred securities for a period of earnings atup to five years, no dividends may be paid to our common shareholders during that time if any such election has been made.
Our senior and subordinated debt agreements have provisions that may impact our ability to pay dividends on our common stock to our common shareholders
On December 10, 2015, we issued and sold $10.0 million in aggregate principal amount of fixed to floating rate Subordinated Notes pursuant to a private placement with certain institutional investors. Also on December 10, 2015, we entered into a loan agreement pursuant to which we obtained $10.0 million in senior debt secured by a pledge of all of the stock of the Bank. The Notes and debt agreements limit the payment of cash dividends to our common shareholders if the Company is not well capitalized or if there is an event of default as described by the agreements.
Item 1b - Unresolved Staff Comments
None to report.
● | The Company’s principal executive office consists of 1,594 square feet of leased space located at 555 Capitol Mall, Suite 1255, Sacramento, California 95814; the lease agreement expires on December 31, 2024. |
● | The Bank has nine full service banking offices: |
o | The main office consists of 20,700 square feet of space in a Bank owned building located at 1951 Churn Creek Road, Redding, California 96002. |
o | A branch that consists of 11,650 square feet of space in a Bank owned building located at 1177 Placer Street, Redding, California, 96001. |
o | A branch that consists of 3,787 square feet of leased space located at 3455 Placer Street, Redding, California 96001. The lease agreement expires on July 31, 2027. |
o | A branch that consists of 5,600 square feet of space in a Bank owned building located at 558 Market Street, Colusa, California 95932. |
o | A branch that consists of 7,221 square feet of space in a Bank owned building located at 1222 Solano Street, Corning, California 96021. |
o | A branch that consists of 9,360 square feet of space in a Bank owned building located at 328 Walker Street, Orland, California 95963. |
o | A branch that consists of 8,910 square feet of space in a Bank owned building located at 155 North Tehama Street, Willows, California 95988. |
o | A branch that consists of 8,450 square feet of space in a Bank owned building located at 200 South Broadway Street, Yreka, California 96097. |
o | A branch that consists of 10,488 square feet of leased space located at 1504 Eureka Road, Suite 100, Roseville, California 95661. The space is leased pursuant a lease expiring on January 31, 2023, and month to month thereafter. |
● | The Bank operates three free standing remote ATMs: |
o | An offsite remote ATM that consists of 150 square feet of leased space located at 125 East Walker Street, Orland, California 95963. The space is leased pursuant a lease expiring on November 19, 2019. |
o | An offsite remote ATM that consists of 150 square feet of leased space located at 1920 Solano Street, Corning, California 96021. The space is leased pursuant a lease expiring on January 31, 2023. |
o | An offsite remote ATM that consists of 174 square feet of leased space located at 692 E Street, Williams, California 95987. The space is leased pursuant a lease expiring on August 16, 2018. |
● | The Bank has office space consisting of 12,286 square feet of space in a Bank owned building located at 1901 Churn Creek Road, Redding, California 96002. |
● | The Bank has office space consisting of 6,163 square feet of leased space located at 330 Hartnell Avenue, Redding, California 96002; the lease agreement expires on February 28, 2022. |
● | The Bank has office space consisting of 4,430 square feet of leased space located at 1504 Eureka Road, Suite 120, Roseville, California 95661. The space is leased pursuant to a lease expiring on January 31, 2023, and month to month thereafter. |
● | The Bank has office space consisting of 2,413 square feet of leased space located at 1504 Eureka Road, Suite 130, Roseville, California 95661. The space is leased pursuant to a lease expiring on January 31, 2023, and month to month thereafter. |
We are subject to various pending and threatened legal actions arising in the ordinary course of business and maintain reserves for losses from legal actions that are both probable and estimable. There are no legal proceedings adverse to the Company that we believe will have a material effect on our consolidated financial position or results of operations.
Item 4 - Mine Safety Disclosures
Not applicable.
Item 5 - Market for Registrant’s Common Equity, Related Shareholder Matters and Issuer Purchases of Equity Securities
The principal market on which our common stock is traded is the NASDAQ Global Market. The Holding Company’s common stock is listed under the trading symbol “BOCH.” The following table sets forth the high and low closing sales prices of the Holding Company’s common stock on the NASDAQ Global Market for the periods indicated.
Sales Price Per Share | ||||||||||||||||
Quarter Ended: | High | Low | Close | Volume | ||||||||||||
March 31, 2016 | $ | 6.93 | $ | 5.05 | $ | 6.35 | 1,415,600 | |||||||||
June 30, 2016 | $ | 6.77 | $ | 6.09 | $ | 6.60 | 1,901,700 | |||||||||
September 30, 2016 | $ | 7.41 | $ | 6.05 | $ | 7.20 | 1,341,500 | |||||||||
December 31, 2016 | $ | 9.67 | $ | 7.00 | $ | 9.50 | 1,114,800 | |||||||||
March 31, 2017 | $ | 11.00 | $ | 9.10 | $ | 10.70 | 1,782,200 | |||||||||
June 30, 2017 | $ | 11.90 | $ | 10.30 | $ | 11.05 | 6,094,500 | |||||||||
September 30, 2017 | $ | 11.65 | $ | 9.90 | $ | 11.50 | 2,233,100 | |||||||||
December 31, 2017 | $ | 12.40 | $ | 10.30 | $ | 11.50 | 2,350,900 | |||||||||
There were 2,260 shareholders of the Holding Company’s common stock as of December 31, 2017, including those held in street name, and the market price on that date was $11.50 per share.
Cash Dividends
Cash dividends of $0.03 per share were paid on January 11, 2017, April 12, 2017, July 13, 2017, and October 11, 2017 to shareholders of record as of January 3, 2017, April 4, 2017, July 5, 2017, and October 3, 2017, respectively. Cash dividends of $0.03 per share were paid on January 12, 2016, April 13, 2016, July 13, 2016, and October 12, 2016 to shareholders of record as of December 31, 2015, April 5, 2016, July 5, 2016, and October 4, 2016, respectively.
Our ability to pay dividends is subject to certain regulatory requirements. The Federal Reserve Board generally prohibits a bank holding company from declaring or paying a cash dividend which would impose undue pressure on the capital of subsidiary banks or would be funded only through borrowing or other arrangements that might adversely affect a financial services holding company’s financial position. The Board of Governors of the Federal Reserve System policy is that a bank holding company should not continue its existing rate of cash dividends on its common stock unless its net income is sufficient to fully fund each dividend and its prospective rate of earnings retention appears consistent with its capital needs, asset quality and overall financial condition. The power of the board of directors of an insured depository institution to declare a cash dividend or other distribution with respect to capital is subject to statutory and regulatory restrictions which limit the amount available for such distribution depending upon the earnings, financial condition and cash needs of the institution, as well as general business conditions.
Our ability to pay dividends is subject to certain contractual requirements. Our trust preferred securities, senior and subordinated debt agreements contain provisions that prohibit us from declaring or paying a dividend if the Company is not “well-capitalized” for regulatory purposes or there exists an event of default as defined by the agreements.
Securities Authorized for Issuance Under Equity Compensation Plans
We currently maintain one equity-based compensation plan which was approved by the shareholders in 2008 and amended in 2010 and 2012. The following table sets forth our equity-based compensation plan, the number of shares of common stock subject to outstanding options, the weighted-average exercise price of outstanding options, and the number of shares available for future award grants as of December 31, 2016.2017.
| (c) | |||||||||||||||||||
(a) | (b) | Number of Securities Remaining | |||||||||||||||||
Number of Securities To Be | Weighted Average | Available For Future Issuance Under | |||||||||||||||||
Issued Upon Exercise of | Exercise Price of | Equity Compensation Plans (Excluding | |||||||||||||||||
Plan Category | (a) Number of Securities To Be Issued Upon Exercise of Outstanding Options | (b) Weighted Average Exercise Price of Outstanding Options | (c) Number of Securities Remaining Available For Future Issuance UnderEquity Compensation Plans (Excluding Securities Reflected In Column (a)) | Outstanding Options | Outstanding Options | Securities Reflected In Column (a)) | |||||||||||||
Equity compensation plans approved by security holders | 188,900 | $ | 5.08 | 248,445 | 134,500 | $ | 5.24 | 203,670 | |||||||||||
Equity compensation plans not approved by security holders | None | None |
| None | None | None | None | ||||||||||||
Total | 188,900 | $ | 5.08 | 248,445 | 134,500 | $ | 5.24 | 203,670 | |||||||||||
Stock Performance Graph
The following graph compares the Holding Company’sCompany’s cumulative total return to shareholders during the past five years with that of the NASDAQ Composite Stock Index and the SNL Securities $1.0 billion - $5.0 billion Bank Asset-Size Index (the “SNL Securities Index”). The stock price performance shown on the following graph is not necessarily indicative of future performance of the Holding Company’s Common Stock.our common stock.
Bank of Commerce Holdings
Five – Year Performance Graph (1)

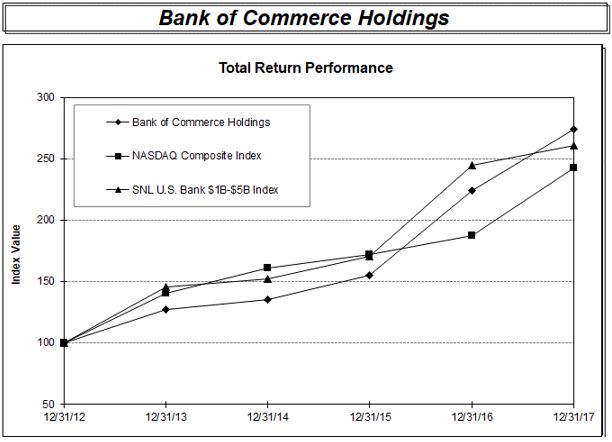
(1) Assumes $100 invested on December 31, 2011,2012, in the Holding Company’s Common Stock,Company’s common stock, the NASDAQ Composite Index, and the SNL Securities Index. The model assumes reinvestment of dividends. Source: SNL Securities (share prices for the Holding Company’s Common Stockcommon stock was furnished to SNL Securities through the NASDAQ).
IItemtem 6 - Selected Financial Data
The selected consolidated financial data set forth below for the five years ended December 31, 2016,2017, have been derived from the Company’s audited Consolidated Financial Statements and should be read in conjunction with “Management’s Discussion and Analysis of Financial Condition and Results of Operations” and the Company’s audited Consolidated Financial Statements and notes thereto, included elsewhere in this report. Income statement data reflects results derived from continuing operations. Balance sheet data has been adjusted for discontinued operations.
Amounts in thousands (except ratios and per share data) | 2016 | 2015 | 2014 | 2013 | 2012 | 2017 | 2016 | 2015 | 2014 | 2013 | ||||||||||||||||||||||||||||||
Statements of income | ||||||||||||||||||||||||||||||||||||||||
Interest income | $ | 41,009 | $ | 38,753 | $ | 36,693 | $ | 37,261 | $ | 40,337 | $ | 45,949 | $ | 41,009 | $ | 38,753 | $ | 36,693 | $ | 37,261 | ||||||||||||||||||||
Net interest income | $ | 36,231 | $ | 33,770 | $ | 32,601 | $ | 33,783 | $ | 35,108 | $ | 41,362 | $ | 36,231 | $ | 33,770 | $ | 32,601 | $ | 33,783 | ||||||||||||||||||||
Provision for loan and lease losses | $ | — | $ | — | $ | 3,175 | $ | 2,750 | $ | 9,400 | $ | 950 | $ | — | $ | — | $ | 3,175 | $ | 2,750 | ||||||||||||||||||||
Noninterest income | $ | 3,595 | $ | 3,183 | $ | 4,315 | $ | 3,542 | $ | 6,593 | $ | 4,824 | $ | 3,486 | $ | 3,183 | $ | 4,307 | $ | 3,412 | ||||||||||||||||||||
Noninterest expense | $ | 32,609 | $ | 24,905 | $ | 26,434 | $ | 21,789 | $ | 21,219 | $ | 30,964 | $ | 32,500 | $ | 24,905 | $ | 26,426 | $ | 21,659 | ||||||||||||||||||||
Net income available to common shareholders | $ | 5,259 | $ | 8,295 | $ | 5,527 | $ | 7,735 | $ | 6,536 | $ | 7,344 | $ | 5,259 | $ | 8,295 | $ | 5,527 | $ | 7,735 | ||||||||||||||||||||
Balance sheets | ||||||||||||||||||||||||||||||||||||||||
Total assets | $ | 1,140,992 | $ | 1,015,441 | $ | 997,192 | $ | 956,342 | $ | 979,424 | $ | 1,269,421 | $ | 1,140,992 | $ | 1,015,441 | $ | 997,192 | $ | 956,342 | ||||||||||||||||||||
Average total assets | $ | 1,079,750 | $ | 992,731 | $ | 973,807 | $ | 953,854 | $ | 952,182 | $ | 1,198,251 | $ | 1,079,750 | $ | 992,731 | $ | 973,807 | $ | 953,854 | ||||||||||||||||||||
Total gross loans | $ | 804,211 | $ | 716,639 | $ | 660,898 | $ | 597,995 | $ | 664,051 | $ | 879,835 | $ | 804,211 | $ | 716,639 | $ | 660,898 | $ | 597,995 | ||||||||||||||||||||
Allowance for loan and lease losses | $ | 11,544 | $ | 11,180 | $ | 10,820 | $ | 14,172 | $ | 11,103 | $ | 11,925 | $ | 11,544 | $ | 11,180 | $ | 10,820 | $ | 14,172 | ||||||||||||||||||||
Total deposits | $ | 1,004,666 | $ | 803,735 | $ | 789,035 | $ | 746,293 | $ | 701,052 | $ | 1,102,732 | $ | 1,004,666 | $ | 803,735 | $ | 789,035 | $ | 746,293 | ||||||||||||||||||||
Total shareholders’ equity | $ | 94,106 | $ | 90,522 | $ | 103,602 | $ | 101,787 | $ | 110,321 | ||||||||||||||||||||||||||||||
Performance ratios1 | ||||||||||||||||||||||||||||||||||||||||
Total shareholders’ equity | $ | 127,264 | $ | 94,106 | $ | 90,522 | $ | 103,602 | $ | 101,787 | ||||||||||||||||||||||||||||||
Ratios 1 | ||||||||||||||||||||||||||||||||||||||||
Return on average assets2 | 0.49 | % | 0.86 | % | 0.59 | % | 0.83 | % | 0.78 | % | 0.61 | % | 0.49 | % | 0.86 | % | 0.59 | % | 0.83 | % | ||||||||||||||||||||
Return on average shareholders’ equity3 | 5.68 | % | 8.10 | % | 5.59 | % | 7.47 | % | 6.66 | % | ||||||||||||||||||||||||||||||
Return on average shareholders’ equity 3 | 6.34 | % | 5.68 | % | 8.10 | % | 5.59 | % | 7.47 | % | ||||||||||||||||||||||||||||||
Average equity to average assets | 8.57 | % | 10.68 | % | 10.51 | % | 11.13 | % | 11.69 | % | 9.67 | % | 8.57 | % | 10.68 | % | 10.51 | % | 11.13 | % | ||||||||||||||||||||
Common equity tier 1 capital ratio4 | 9.43 | % | 10.06 | % | n/a |
| n/a |
| n/a |
| 12.26 | % | 9.43 | % | 10.06 | % | n/a | n/a | ||||||||||||||||||||||
Tier 1 capital ratio4 | 10.42 | % | 11.16 | % | 13.91 | % | 15.94 | % | 14.52 | % | 13.23 | % | 10.42 | % | 11.16 | % | 13.91 | % | 15.94 | % | ||||||||||||||||||||
Total capital ratio4 | 12.68 | % | 13.52 | % | 15.16 | % | 17.20 | % | 15.77 | % | 15.44 | % | 12.68 | % | 13.52 | % | 15.16 | % | 17.20 | % | ||||||||||||||||||||
Tier 1 leverage ratio4 | 9.13 | % | 10.03 | % | 11.60 | % | 12.80 | % | 13.13 | % | 10.86 | % | 9.13 | % | 10.03 | % | 11.60 | % | 12.80 | % | ||||||||||||||||||||
Net interest margin5 | 3.71 | % | 3.77 | % | 3.71 | % | 3.86 | % | 3.99 | % | 3.78 | % | 3.71 | % | 3.77 | % | 3.71 | % | 3.86 | % | ||||||||||||||||||||
Average earning assets to total average assets | 93.34 | % | 93.43 | % | 93.81 | % | 95.00 | % | 95.39 | % | 93.85 | % | 93.34 | % | 93.43 | % | 93.81 | % | 95.00 | % | ||||||||||||||||||||
Nonperforming assets to total assets6 | 1.06 | % | 1.53 | % | 2.22 | % | 3.23 | % | 4.25 | % | 0.46 | % | 1.06 | % | 1.53 | % | 2.22 | % | 3.23 | % | ||||||||||||||||||||
Net (recoveries) charge-offs to average loans | (0.05 | )% | (0.05 | )% | 1.04 | % | (0.13 | )% | 1.48 | % | ||||||||||||||||||||||||||||||
Net charge-offs (recoveries) to average loans | 0.07 | % | (0.05 | %) | (0.05 | %) | 1.04 | % | (0.13 | %) | ||||||||||||||||||||||||||||||
Allowance for loan and lease losses to gross loans | 1.44 | % | 1.56 | % | 1.64 | % | 2.37 | % | 1.67 | % | 1.36 | % | 1.44 | % | 1.56 | % | 1.64 | % | 2.37 | % | ||||||||||||||||||||
Nonperforming loans to allowance for loan and lease losses | 98.64 | % | 126.09 | % | 200.30 | % | 210.25 | % | 347.40 | % | 48.63 | % | 98.64 | % | 126.09 | % | 200.30 | % | 210.25 | % | ||||||||||||||||||||
Efficiency ratio7 | 81.88 | % | 67.40 | % | 71.61 | % | 58.38 | % | 50.88 | % | 67.04 | % | 81.83 | % | 67.40 | % | 71.60 | % | 58.23 | % | ||||||||||||||||||||
Share data |
|
| ||||||||||||||||||||||||||||||||||||||
Average common shares outstanding – basic | 13,367 |
| 13,331 | 13,475 | 14,940 | 16,344 | 15,207 | 13,367 | 13,331 | 13,475 | 14,940 | |||||||||||||||||||||||||||||
Average common shares outstanding – diluted | 13,425 |
| 13,365 | 13,520 | 14,964 | 16,344 | 15,310 | 13,425 | 13,365 | 13,520 | 14,964 | |||||||||||||||||||||||||||||
Book value per common share - tangible | $ | 6.83 |
| $ | 6.76 | $ | 6.29 | $ | 5.86 | $ | 5.66 | $ | 7.70 | $ | 6.83 | $ | 6.76 | $ | 6.29 | $ | 5.86 | |||||||||||||||||||
Basic earnings per share attributable to continuing operations | $ | 0.39 | $ | 0.62 | $ | 0.41 | $ | 0.52 | $ | 0.41 | ||||||||||||||||||||||||||||||
Basic (loss) per share attributable to discontinued operations | $ | — | $ | — | $ | — | $ | — | $ | (0.01 | ) | |||||||||||||||||||||||||||||
Diluted earnings per share attributable to continuing operations | $ | 0.39 | $ | 0.62 | $ | 0.41 | $ | 0.52 | $ | 0.41 | ||||||||||||||||||||||||||||||
Diluted (loss) per share attributable to discontinued operations | $ | — | $ | — | $ | — | $ | — | $ | (0.01 | ) | |||||||||||||||||||||||||||||
Basic earnings per share | $ | 0.48 | $ | 0.39 | $ | 0.62 | $ | 0.41 | $ | 0.52 | ||||||||||||||||||||||||||||||
Diluted earnings per share | $ | 0.48 | $ | 0.39 | $ | 0.62 | $ | 0.41 | $ | 0.52 | ||||||||||||||||||||||||||||||
Cash dividends per common share | $ | 0.12 | $ | 0.12 | $ | 0.12 | $ | 0.14 | $ | 0.12 | $ | 0.12 | $ | 0.12 | $ | 0.12 | $ | 0.12 | $ | 0.14 | ||||||||||||||||||||
1 - Regulatory Capital Ratios and Asset Quality Ratios are end of period ratios. With the exception of end of period ratios, all ratios are based on average daily balances during the indicated period. | ||||||||||||||||||||
2 - Return on average assets is net income divided by average total assets. | ||||||||||||||||||||
3 - Return on average shareholders' equity is net income divided by average | ||||||||||||||||||||
4 - See Item 7 - | ||||||||||||||||||||
5 - Net interest margin equals net interest income on a tax equivalent basis, divided by average | ||||||||||||||||||||
6 - Nonperforming assets include all nonperforming loans (nonaccrual loans, loans 90 days past due and still accruing interest and restructured loans that are nonperforming) and real estate acquired by foreclosure or | ||||||||||||||||||||
7 - The efficiency ratio is calculated by dividing noninterest expense by the sum of net interest income and noninterest income and presented based on results from continuing operations. |
BANK OF COMMERCE HOLDINGS & SUBSIDIARIES
IItem tem 7 - Management’s Discussion And Analysis Of Financial Condition And Results Of Operations
The following discussion of financial condition as of December 31, 2016,2017, and 2015,2016, and results of operations for each of the years in the three-year period ended December 31, 20162017 should be read in conjunction with our Consolidated Financial Statements and related notes, thereto, included in Part II Item 8 of this report. Average balances, including balances used in calculating certain financial ratios, are generally comprised of average daily balances.
The disclosures set forth in this item are qualified by important factors detailed in Part I captionedForward-Looking Statements and Item 1A captionedRisk Factors of this report and other cautionary statements set forth elsewhere in the report.
EXECUTIVE OVERVIEW
Net income for the year ended December 31, 2017 was $7.3 million or $0.48 per share – diluted compared with $5.3 million or $0.39 per share – diluted for the year ended December 31, 2016. Significant items for the year ended December 31, 20162017 were as follows:
Tax Cuts and Jobs Act of 2017
The 2017 results include the $2.5 million negative net impact of the Tax Cuts and Jobs Act of 2017(“PerformanceAct”) for the year ($0.16 per share – diluted). The Act reduced the federal corporate tax rate prospectively from a graduated rate of 35% to a flat rate of 21% and required the Company to revalue its deferred tax assets and liabilities. Management believes that our financial results are more comparative excluding the impact of these deferred tax asset and liability revaluations.
Non-GAAP Financial Measures
In addition to results presented in accordance with generally accepted accounting principles in the United States of America (GAAP), this Annual Report on Form 10-K contains certain non-GAAP financial measures. We believe that these non-GAAP financial measures provide investors with information useful in understanding the Company’s financial performance; however, readers of this document are urged to review these non-GAAP financial measures in conjunction with the GAAP results as reported.
SELECTED NON-GAAP FINANCIAL INFORMATION - UNAUDITED | ||||||||||||
(amounts in thousands except per share data) | ||||||||||||
For The Twelve Months Ended | ||||||||||||
Reconciliation of income available to common shareholders (GAAP) to income available | December 31, | |||||||||||
to common shareholders excluding deferred tax asset write-down (non-GAAP): | 2017 | 2016 | 2015 | |||||||||
Income available to common shareholders (GAAP) | $ | 7,344 | $ | 5,259 | $ | 8,295 | ||||||
Deferred tax asset write-down (GAAP) | 2,490 | 363 | — | |||||||||
Income available to common shareholders excluding deferred tax asset write-down (non-GAAP) | $ | 9,834 | $ | 5,622 | $ | 8,295 | ||||||
Earnings per share - diluted (GAAP) | $ | 0.48 | $ | 0.39 | $ | 0.62 | ||||||
Effect of deferred tax asset write-down | 0.16 | 0.03 | — | |||||||||
Earnings per share - diluted excluding net deferred tax asset write-down (non-GAAP) | $ | 0.64 | $ | 0.42 | $ | 0.62 | ||||||
Non-GAAP Ratios: | ||||||||||||
Return on average assets available to common shareholders excluding net deferred tax asset write-down | 0.82 | % | 0.52 | % | 0.84 | % | ||||||
Return on average equity available to common shareholders excluding net deferred tax asset write-down | 8.48 | % | 6.07 | % | 7.83 | % | ||||||
GAAP Information: | ||||||||||||
Return on average assets available to common shareholders | 0.61 | % | 0.49 | % | 0.84 | % | ||||||
Return on average equity available to common shareholders | 6.34 | % | 5.68 | % | 7.83 | % | ||||||
Performance
● |
| ||
|
| ||
|
| ||
● | Average loans for the year ended December 31, |
● |
|
| |
|
|
● | Net interest income |
BANK OF COMMERCE HOLDINGS & SUBSIDIARIES
● | Net income of $7.3 million or $0.48 per share – diluted for the year ended December 31, 2017 was |
o | Net income for 2017 was negatively impacted by $2.5 million of income tax provision due to a write-down of our deferred tax assets to account for the future impact of lower corporate tax rates resulting from the Tax Cuts and Jobs Act enacted on December 22, 2017. |
o | Net income for 2016 | ||
|
| ||
|
| ||
|
| ||
|
| ||
|
| ||
|
| ||
● | Return on average assets |
● | Return on average equity |
● |
|
Acquisition
On March 11, 2016 we completed the purchase of five Bank of America branches located in northern California. The transaction was most attractive to us because it provided a new source of low cost core deposits and allowed us to execute our plan to reconfigure our balance sheet. The acquisition provided approximately $142.3 million of new liquidity ($149.0 million of new deposits less payments of $6.7 million made to Bank of America). We utilized a portion of that new liquidity to reduce our reliance on wholesale funding sources repaying $75.0 million to the Federal Home Loan Bank of San Francisco and redeeming $17.5 million of brokered time deposits. We utilized the remaining liquidity to fund loan originations and the purchase of moderate term available-for-sale securities.
The branches acquired are located in Colusa, Willows, Orland, Corning, and Yreka. The Bank also acquired three offsite ATM locations in Williams, Orland and Corning. With the completion of the acquisition, we now operate nine branches in northern California.
The Bank paid cash consideration of $6.7 million and acquired $155.2 million in assets, primarily cash and premises. The Bank assumed $149.2 million in liabilities, primarily deposits.
BANK OF COMMERCE HOLDINGS & SUBSIDIARIES
Capital
● | Declared cash dividends of $0.03 per share for each quarter. |
● | Book value per common share was $7.82 at December 31, 2017 compared to $7.00 at December 31, 2016. Tangible book value per common share (non-GAAP) which excludes goodwill and core deposit intangibles from shareholders’ equity was $7.70 at December 31, 2017 compared to $6.83 at December 31, 2016. Management believes that tangible book value per share is meaningful because it is a measure that the Company and investors commonly use to assess capital adequacy. |
● | Average total equity |
● | The Company and the Bank maintained capital levels in excess of the well-capitalized standards for the year ended December 31, |
Credit Quality
● | Nonperforming assets at December 31, |
● |
|
Vision and Objectives
We seek to provide competitive, profitable long termlong-term returns to our shareholders while serving the financial needs of the communities in our market. Management strives to provide those returns while exercising prudent risk management practices and maintainingmaintaining adequate levels of capital and reserves.
Our vision is to remain independent, expanding our presence both throughwith organic growth and through the addition of new strategically important locations. We will pursue attractive opportunities to enter related lines of businessbusiness and to acquire financial institutions with complementary lines of business.business when it is beneficial to do so. During 2016 we executed this vision by completing the purchase five branch locations from Bank of America which are contiguous to2017 our existing four locations.organic growth in average assets totaled $118.5 million or 11%.
Our long term-term success rests on the shoulders of the leadership team and its ability to effectively enhance the performance of the Company. As a financial services company, we are in the business of taking and managing risks. Whether we are successful depends largely upon whether we take the right risks and are rewarded appropriately for those risks. Our governance structure enables us to manage all major aspects of our business effectively through an integrated process that includes financial, strategic, risk and leadership planning.
We define risks to include not only credit, market and liquidity risk, the traditional concerns for financial institutions, but also operational risks, including risks related to systems, processes or external events, as well as legal, regulatory and reputation risks. Our management processes, structures, and policies help to ensure compliance with laws and regulations and provide clear lines for decision-making and accountability. Results are important, but equally important is how we achieve those results. Our core values and commitment to high ethical standards are essential to maintaining and to sustaining public trust and confidence in our Company.
RISK MANAGEMENT
Overview
Through our corporate governance structure, risk and return is evaluated to produce sustainable revenues, reduce risk of earnings volatility and increase shareholder value. The financial services industry is exposed to four major risks; liquidity, credit, market and operational. Liquidity risk is the inability to meet liability maturities and withdrawals, fund asset growth and otherwise meet contractual obligations at reasonable market rates. Credit risk is the inability of a customer to meet their repayment obligations or the inability of a bond issuer to meet their contractual repayment obligations. Market risk is the fluctuation in asset and liability values caused by changes in market prices and yields, and operational risk is the potential for losses resulting from events involving people, processes, technology, legal issues, external events, regulation, or reputation.
BANK OF COMMERCE HOLDINGS & SUBSIDIARIES
Board Committees
Our corporate governance structure begins with our Board of Directors. The Board of Directors evaluates risk through the Chief Executive Officer and a number of Board Committees including the following:
|
|
|
|
|
|
|
|
Management Committees
To ensure that our risk management goals and objectives are accomplished, oversight of our risk taking and risk management activities are conducted through a number of management committees comprised of members of management including the following.
|
|
|
|
|
|
Risk Management Controls
We use various controls to manage risk exposure within the Company. Budgeting and variance analyses provide an early indication of unfavorable results or heightened risk levels. Models are used to estimate market risk and net interest income sensitivity. Segmentation analysis is used to estimate expected and unexpected credit losses. Compliance with regulatory guidelines plays a significant role in risk management as well as corporate culture and the actions of management. Our code of ethics provides guidelines for all employees to use to ensure that they conduct themselves with the highest integrity in the delivery of service to our clients.
BANK OF COMMERCE HOLDINGS & SUBSIDIARIES
Liquidity Risk Management
Liquidity Risk
Liquidity risk is the inability to meet liability maturities and withdrawals, fund asset growth and otherwise meet contractual obligations at reasonable market rates. Liquidity management involves maintaining ample and diverse funding capacity, liquid assets and other sources of cash to accommodate fluctuations in asset and liability levels due to business shocks or unanticipated events. ALCO is responsible for establishing our liquidity policy and the Bank’s internal ALCO Roundtable group is responsible for planning and executing the funding activities and strategies.
At the Bank, liquid assets consist of cash and amounts due from banks, cash from repayments and maturities of loans, short-term money market investments, sales of available-for-sale securities and cash flows from principal repayment and maturities of investments. Liquidity is generated from liabilities through deposit growth and term debt borrowings. Deposit marketing strategies are reviewed for consistency with liquidity policy objectives.
The Bank has secondary sources of liquidity available from correspondent banking lines of credit, a secured line of credit with the Federal Reserve Bank and secured borrowing line with the Federal Home Loan Bank of San Francisco. While these sources are expected to continue to provide significant amounts of secondary liquidity in the future, their availability, as well as the possible use of other sources, is dependent on future economic and market conditions, pledging of acceptable collateral and maintenance of required minimum capital ratios.
The Holding Company’s primary source of liquidity is dividends received from the Bank, which it has consistently received for many years. See Item 1ARisk Factors and Note 21Regulatory Capital in theNotes to Consolidated Financial Statements in this document for a discussion of the restrictions on the Bank’s ability to pay dividends.
To accommodate future growth and business needs, we develop an annual capital expenditure budget during strategic planning sessions. Based on our budgets and forecasts, we believe that our earnings, acquisition of core deposits and wholesale borrowing arrangements will be sufficient to support liquidity needs in 2017.
Term Debt
Federal Home Loan Bank of San Francisco borrowings
We no longer actively use Federal Home Loan Bank of San Francisco advances as a source of wholesale funding to provide liquidity. As of December 31, 2016 the Bank had no Federal Home Loan Bank of San Francisco advances outstanding. As of December 31, 2015 the Bank had $75.0 million in Federal Home Loan Bank of San Francisco advances outstanding. See Note 18,Federal Funds Purchased and Lines of Credit in the Notes to Consolidated Financial Statements for information on our Federal Home Loan Bank of San Francisco borrowings and our remaining line of credit.
During the fourth quarter of 2015, the Holding Company entered into a senior debt loan agreement to borrow $10.0 million from another financial institution and issued $10.0 million of subordinated term debt to redeem $20.0 million of preferred stock. The details are as follows:
Senior Debt
In December of 2015, the Holding Company, entered into a senior debt loan agreement to borrow $10.0 million. The loan is payable in monthly principal installments of $83 thousand, plus accrued and unpaid interest, commencing on January 1, 2016 and continuing to and including December 10, 2020. A final scheduled payment of $5.0 million is due on the maturity date of December 10, 2020. The loan may be prepaid in whole or in part at any time without any prepayment premium or penalty. The principal amount of the loan bears interest at a variable rate, resetting monthly that is equal to the sum of the current three month LIBOR plus 400 basis points. The Holding Company incurred senior debt issuance costs of $15 thousand which are being amortized over the life of the loan as additional interest expense.
Subordinated Debt
In December of 2015, the Holding Company issued $10.0 million in aggregate principal amount of fixed to floating rate subordinated notes due December 10, 2025. The subordinated debt initially bears interest at 6.88% per annum for a five-year term, payable semi-annually. Thereafter, interest on the subordinated debt will be paid at a variable rate equal to three month LIBOR plus 526 basis points, payable quarterly until the maturity date. The notes qualify as Tier 2 capital under the capital adequacy rules and regulations issued by the Federal Reserve. The Holding Company incurred subordinated debt issuance costs of $210 thousand which are being amortized over the initial five year term as additional interest expense.
BANK OF COMMERCE HOLDINGS & SUBSIDIARIES
Term debt at December 31, 2016, 2015 and 2014 consisted of the following:
(Amounts in thousands) | 2016 | 2015 | 2014 | |||||||||
Federal Home Loan Bank of San Francisco borrowings | $ | — | $ | 75,000 | $ | 75,000 | ||||||
Senior debt | 8,917 | 9,917 | — | |||||||||
Less unamortized discount and debt issuance cost | (12 | ) | (15 | ) | — | |||||||
Subordinated debt | 10,000 | 10,000 | — | |||||||||
Less unamortized discount and debt issuance cost | (172 | ) | (208 | ) | — | |||||||
Total term debt at December 31, | $ | 18,733 | $ | 94,694 | $ | 75,000 | ||||||
The following table presents the weighted average contractual interest rates on outstanding borrowings for the years ended December 31, 2016, 2015 and 2014.
2016 | 2015 | 2014 | ||||||||||
Federal Home Loan Bank of San Francisco borrowings | 0.51 | % | 0.29 | % | 0.24 | % | ||||||
Senior debt | 4.68 | % | 4.50 | % | — | % | ||||||
Subordinated debt | 6.88 | % | 6.88 | % | — | % | ||||||
The following table presents the maximum outstanding balance at any month end, average balance during the year and effective weighted average interest rate during the year on outstanding term debt for the years ended December 31, 2016, 2015 and 2014.
(Amounts in thousands) | 2016 | 2015 | 2014 | |||||||||
Federal Home Loan Bank of San Francisco borrowings: | ||||||||||||
Maximum outstanding at any month end | $ | 80,000 | $ | 120,000 | $ | 75,000 | ||||||
Average balance during the year | $ | 18,075 | $ | 87,671 | $ | 77,534 | ||||||
Effective weighted average interest rate during year | 2.73 | % | 1.91 | % | 0.55 | % | ||||||
Senior debt net of unamortized discount and debt issuance costs: |
| |||||||||||
Maximum outstanding at any month end | $ | 9,819 | $ | 9,902 | $ | — |
| |||||
Average balance during the year | $ | 9,400 | $ | 82 | $ | — |
| |||||
Effective weighted average interest rate during year | 4.79 | % | 4.55 | % | — | % | ||||||
Subordinated debt net of unamortized discount and debt issuance costs: |
| |||||||||||
Maximum outstanding at any month end | $ | 9,829 | $ | 9,792 | $ | — |
| |||||
Average balance during the year | $ | 9,811 | $ | 1,121 | $ | — |
| |||||
Effective weighted average interest rate during year | 7.38 | % | 7.38 | % | — | % | ||||||
The Bank’s effective weighted average interest rate on Federal Home Loan Bank of San Francisco borrowings includes the effect of hedge gains or losses reclassified out other comprehensive income. During March of 2016, we terminated all of our interest rate swaps (active and forward starting the “hedging” instrument) and simultaneously paid off the $75.0 million Federal Home Loan Bank of San Francisco borrowing (the “hedged instrument”).
During the first six months of 2014, hedge gains from a previous set of interest rate swaps were reclassified out of other comprehensive income into earnings as a reduction of interest expense. Between July of 2014 and March of 2016, hedge losses were reclassified out other comprehensive income into earnings as an addition to interest expense.
BANK OF COMMERCE HOLDINGS & SUBSIDIARIES
Credit Risk Management
Credit risk arises from the inability of a loan customer to meet their repayment obligations or the inability of a bond issuer to meet their contractual repayment obligations. Credit risk exists in our outstanding loans, letters of credit, Federal Home Loan Bank of San Francisco affordable housing grant sponsorships, unfunded loan commitments, deposits with other institutions and investment bond portfolio. In all of these areas we manage credit risk based on the risk profile of the borrower/grantee/issuer, repayment sources and the nature of the underlying collateral given current events and conditions. We rely on various controls including our underwriting standards, loan policies, internal loan monitoring, ALLL methodology and credit reviews to manage credit risk.
Concentrations of credit risk
We grant real estate construction, commercial, and installment loans to customers throughout northern California. In our judgment, a concentration exists in real estate related loans, which represented approximately 75% and 74% of our gross loan portfolio at December 31, 2016 and December 31, 2015.
Commercial real estate concentrations are managed to assure wide geographic and business diversity. Although management believes such concentrations have no more than the normal risk of collectability, a substantial decline in the economy in general, material increases in interest rates, changes in tax policies, tightening credit or refinancing markets, or a decline in real estate values in our principal market areas in particular, could have an adverse impact on the repayment of these loans. Personal and business incomes, proceeds from the sale of real property, or proceeds from refinancing, represent the primary sources of repayment for a majority of these loans.
We recognize the credit risks inherent in dealing with other depository institutions. Accordingly, to prevent excessive exposure to other depository institutions in aggregate or to any single correspondent, we have established general standards for selecting correspondent banks as well as internal limits for allowable exposure to other depository institutions in aggregate or to any single correspondent. In addition, we have an investment policy that sets forth limitations that apply to all investments with respect to credit rating and concentrations with an issuer.
Loan portfolio
Credit risk management for the loan portfolio begins with an assessment of the credit risk profile of each individual borrower based on an analysis of the borrower’s financial position in light of current industry, economic or geopolitical trends. As part of the overall credit risk assessment of a borrower, each credit is assigned a risk grade and is subject to approval based on our existing credit approval standards. Risk grading is a significant factor in determining the adequacy of the ALLL.
Credit decisions are made by our Credit Administration subject to certain limitations and, when those limitations are encountered, the approvals are made by the Board Loan Committee. Credit risk is continuously monitored by Credit Administration for possible adjustment of a loan risk grade if there has been a change in the borrower’s ability to perform under the terms of their obligation. Additionally, we may manage the size of our credit exposure through loan sales and loan participation agreements.
Our specific underwriting standards and methods for each principal line of lending include industry-accepted analysis and modeling and certain proprietary techniques. Our underwriting criteria are designed to comply with applicable regulatory guidelines, including required loan-to-value ratios. Our credit administration policies contain mandatory lien position and debt service coverage requirements, and we generally require a guarantee from individuals owning 20% or more of the borrowing entity. Our evaluations of our borrowers’ are facilitated by management’s knowledge of local market conditions and periodic reviews by a consultant of our credit administration policies.
Allowance for loan and lease losses
The ALLL represents management’s best estimate of probable losses in the loan portfolio. Within the allowance, reserves are allocated to segments of the portfolio based on specific formula components. Changes to the allowance for loan and lease losses are reported in theConsolidated Statements of Income in the line item provision for loan and lease losses.
BANK OF COMMERCE HOLDINGS & SUBSIDIARIES
We perform periodic and systematic detailed evaluations of our lending portfolio to identify and estimate the inherent risks and assess the overall collectability. We evaluate the following:
|
|
|
|
|
|
Our ALLL is the accumulation of various components that are calculated based upon independent methodologies. All components of the ALLL represent an estimation based on certain observable data that management believes most reflects the underlying credit losses being estimated. Changes in the amount of each component of the ALLL are directionally consistent with changes in the observable data, taking into account the interaction of the components over time.
An essential element of the methodology for determining the ALLL is our credit risk evaluation process, which includes credit risk grading of individual, commercial, construction, commercial real estate, and consumer loans. Loans are assigned credit risk grades based on our assessment of conditions that affect the borrower’s ability to meet its contractual obligations under the loan agreement. That process includes reviewing borrower’s current financial information, historical payment experience, credit documentation, public information, and other information specific to each individual borrower. Loans are reviewed on an annual or rotational basis or as management becomes aware of information affecting the borrower’s ability to fulfill its obligations. Credit risk grades carry a dollar weighted risk percentage.
For individually impaired loans, we measure impairment based on the present value of expected future principal and interest cash flows discounted at the loan’s effective interest rate, except that as a practical expedient, a creditor may measure impairment based on a loan’s observable market price or the fair value of collateral, if the loan is collateral dependent. When developing the estimate of future cash flows for a loan, we consider all available information reflecting past events and current conditions, including the effect of existing environmental factors. In addition to the ALLL, an allowance for unfunded loan commitments and letters of credit is determined using estimates of the probability of funding and the associated inherent credit risk. This reserve is carried as a liability on theConsolidated Balance Sheets.
We make provisions to the ALLL as necessary through charges to operations that are reflected in ourConsolidated Statements of Income as provision for loan and lease loss expense. When a loan is deemed uncollectible, it is charged against the allowance. Any recoveries of previously charged off loans and leases are credited back to the allowance. There is no precise method of predicting specific losses or amounts that ultimately may be charged off on particular categories of the loan and lease portfolio.
Various regulatory agencies periodically review our ALLL as an integral part of their examination process. Such agencies may require us to provide additions to the allowance based on their judgment of information available to them at the time of their examination. There is uncertainty concerning future economic trends. Accordingly, it is not possible to predict the effect future economic trends may have on the level of the provisions for loan and lease losses in future periods. The ALLL should not be interpreted as an indication that charge-offs in future periods will occur in the stated amounts or proportions.
Federal Home Loan Bank of San Francisco Affordable Housing Grant Sponsorships
As part of satisfying our CRA responsibilities, we are a sponsor for various nonprofit organizations which receive cash grants from the Federal Home Loan Bank of San Francisco. Those grants require the nonprofit organization to comply with stipulated conditions of the grant over specified periods of time which typically vary from 10 to 15 years. If the nonprofit organization fails to comply, Federal Home Loan Bank of San Francisco can require us to refund the amount of the grant to Federal Home Loan Bank of San Francisco. To mitigate this contingent credit risk, Credit Administration underwrites the financial strength of the nonprofit organization and reviews their systems of internal control to determine, as best as is possible, that they will not fail to comply with the conditions of the grant.
Securities Portfolio
To manage credit risk in the securities portfolio, we have an investment policy that sets forth limitations that apply to all investments with respect to credit rating and concentrations with an issuer. We perform a pre-purchase analysis on all bonds not secured by the U.S. Government or Agency of the U.S. Government to ensure that the investment meets our credit risk requirements and repayment expectations. We perform annual and quarterly credit reviews to ensure our investments continue to meet our credit risk requirements and repayment expectations.
BANK OF COMMERCE HOLDINGS & SUBSIDIARIES
Deposits With Other Institutions
We recognize the credit risks inherent in dealing with other depository institutions. Accordingly, to prevent excessive exposure to other depository institutions in aggregate or to any single correspondent, we have established general standards for selecting correspondent banks as well as internal limits for allowable exposure to other depository institutions in aggregate or to any single correspondent.
Market Risk Management
General
Market risk is the potential loss due to adverse changes in market prices and interest rates. Market risk is inherent in our operating positions and activities including customers’ loans, deposit accounts, securities and long-term debt. Loans and deposits generate income and expense, respectively, and the value of cash flows changes based on general economic levels, and most importantly, the level of interest rates.
The goal for managing our assets and liabilities is to maximize shareholder value and earnings while maintaining a high quality balance sheet without exposing the Company to undue interest rate risk. The absolute level and volatility of interest rates can have a significant impact on our profitability. Market risk arises from exposure to changes in interest rates, exchange rates, commodity prices, and other relevant market rate or price risk. We do not operate a trading account, and do not hold a position with exposure to foreign currency exchange.
We face market risk through interest rate volatility. Net interest income, or margin risk, is measured based on rate shocks over varying time horizons versus a current stable interest rate environment. Assumptions used in these calculations are similar to those used in the planning and budgeting model. The overall interest rate risk position and strategies are reviewed on an ongoing basis with ALCO.
Securities Portfolio
The securities portfolio is central to our asset liability management strategies. The decision to purchase or sell securities is based upon our assessment of current and projected economic and financial conditions, including the interest rate environment, liquidity, changes in a security’s credit rating, the risk weighting of a security and other regulatory requirements. We classify our securities as “available-for-sale” or “held-to-maturity” at the time of purchase. We do not engage in trading activities. Securitiesheld-to-maturity are carried at amortized cost. Securitiesavailable-for-sale may be sold to implement our asset liability management strategies and in response to changes in interest rates, prepayment rates, and similar factors. Securitiesavailable-for-sale are recorded at fair value and unrealized gains or losses, net of income taxes, are reported as a component of accumulated other comprehensive income, in a separate component of shareholders’ equity. Gain or loss on sale of securities is calculated on the specific identification method.
Operational Risk Management
Operational risk is the potential for loss resulting from events involving people, processes, technology, legal or regulatory issues, external events, and reputation. In keeping with the corporate governance structure, the Senior Leadership committee is responsible for operational risk controls. Operational risks are managed through specific policies and procedures, controls and monitoring tools. Examples of these include reconciliation processes, transaction monitoring and analysis and system audits. Operational risks fall into two major categories, business specific and company-wide. The Senior Leadership committee works to ensure consistency in policies, processes and assessments. With respect to company-wide risks, the Senior Leadership committee works directly with members of our Board of Directors to develop policies and procedures for information security, business resumption plans, compliance and legal issues.
SUMMARY OF CRITICAL ACCOUNTING POLICIES
Our significant accounting policies are described in Note 2Summary of Significant Accounting Policies in theNotes to Consolidated Financial Statements in this document. Some of these significant accounting policies are considered critical and require management to make difficult, subjective or complex judgments or estimates. Management believes that the following policies would be considered critical under the SEC’s definition.
BANK OF COMMERCE HOLDINGS & SUBSIDIARIES
Valuation of Investments and Impairment of Securities
At the time of purchase, we designate a security as held-to-maturity or available-for-sale, based on our investment objectives, operational needs and intent to hold. We do not engage in trading activity. Securities designated as held-to-maturity are carried at amortized cost. We have the ability and intent to hold these securities to maturity. Securities designated as available-for-sale may be sold to implement our asset/liability management strategies and in response to changes in interest rates, prepayment rates and similar factors. Securities designated as available-for-sale are recorded at fair value and unrealized gains or losses, net of income taxes, are reported as part of accumulated other comprehensive income (loss), a separate component of shareholders’ equity. Gains or losses on sale of securities are based on the specific identification method. The market value and underlying rating of the security is monitored for quality.
Securities may be adjusted to reflect changes in valuation as a result of other-than-temporary declines in value. Investments with fair values that are less than amortized cost are considered impaired. Impairment may result from either a decline in the financial condition of the issuing entity or, in the case of fixed rate investments, from changes in interest rates. At each financial statement date, management assesses each investment to determine if impaired investments are temporarily impaired or if the impairment is other-than-temporary based upon the positive and negative evidence available. Evidence evaluated includes, but is not limited to, industry analyst reports, credit market conditions, and interest rate trends.
When an investment is other-than-temporarily impaired, we assess whether we intend to sell the security, or it is more likely than not that we will be required to sell the security before recovery of its amortized cost basis less any current-period credit losses. If we intend to sell the security or if it is more likely than not that we will be required to sell security before recovery of the amortized cost basis, the entire amount of other-than-temporary impairment is recognized in earnings.
For debt securities that are considered other-than-temporarily impaired and that we do not intend to sell and will not be required to sell prior to recovery of our amortized cost basis, we separate the amount of the impairment into the amount that is credit related (credit loss component) and the amount due to all other factors. The credit loss component is recognized in earnings and is calculated as the difference between the investment’s amortized cost basis and the present value of its expected future cash flows.
The remaining differences between the investment’s fair value and the present value of future expected cash flows is deemed to be due to factors that are not credit related and is recognized in other comprehensive income. Significant judgment is required in the determination of whether other-than-temporary impairment has occurred for an investment. We follow a consistent and systematic process for determining other-than-temporary impairment loss. We have designated the ALCO responsible for the other-than-temporary evaluation process.
The ALCO’s assessment of whether other-than-temporary impairment loss should be recognized incorporates both quantitative and qualitative information including, but not limited to: (1) the length of time and the extent of which the fair value has been less than amortized cost, (2) the financial condition and near term prospects of the issuer, (3) our intent and ability to retain the investment for a period of time sufficient to allow for an anticipated recovery in value, (4) whether the debtor is current on interest and principal payments, and (5) general market conditions and industry or sector specific outlook. See Note 4Securities in theNotes to Consolidated Financial Statements in this document for further detail on other-than-temporary impairment and the securities portfolio.
Allowance for Loan and Lease Losses
The ALLL is based upon estimates of loan and lease losses and is maintained at a level considered adequate to provide for probable losses inherent in the outstanding loan portfolio. The allowance is increased by provisions charged to expense and reduced by net charge-offs. In periodic evaluations of the adequacy of the allowance balance, management considers our past loan and lease loss experience by type of credit, known and inherent risks in the portfolio, adverse situations that may affect the borrower's ability to repay, the estimated value of any underlying collateral, current economic conditions and other factors.
Management reviews the ALLL on a monthly basis and conducts a formal assessment of the adequacy of the ALLL on a quarterly basis. These assessments include the periodic re-grading of classified loans based on changes in their individual credit characteristics including delinquency, seasoning, recent financial performance of the borrower, economic factors, changes in the interest rate environment and other factors as warranted. Loans are initially graded when originated. They are reviewed as they are renewed, when there is a new loan to the same borrower and/or when identified facts demonstrate heightened risk of default. Confirmation of the quality of our grading process is obtained by independent reviews conducted by outside consultants specifically hired for this purpose and by periodic examination by various bank regulatory agencies. Management monitors delinquent loans continuously and identifies problem loans to be evaluated individually for impairment testing. For loans that are determined impaired, formal impairment measurement is performed at least quarterly on a loan-by-loan basis.
Our method for assessing the appropriateness of the allowance includes specific allowances for identified problem loans, an allowance factor for categories of credits and allowances for changing environmental factors (e.g., portfolio trends, concentration of credit, growth, economic factors). Allowances for identified problem loans are based on specific analysis of individual credits. Loss estimation factors for unimpaired loan categories are based on analysis of historical losses adjusted for changing environmental factors applicable to each loan category. Allowances for changing environmental factors are management's best estimate of the probable impact these changes would have on the loan portfolio as a whole. See Note 5Loans in theNotes to Consolidated Financial Statements in this document for further detail on the ALLL and the loan portfolio.
BANK OF COMMERCE HOLDINGS & SUBSIDIARIES
Income Taxes
Income taxes reported in the consolidated financial statements are computed based on an asset and liability approach. We recognize the amount of taxes payable or refundable for the current year, and deferred tax assets and liabilities for the expected future tax consequences that have been recognized in the consolidated financial statements. Under this method, deferred tax assets and liabilities are determined based on the differences between the consolidated financial statements and the tax basis of assets and liabilities using enacted tax rates in effect for the year in which the differences are expected to reverse. We record net deferred tax assets to the extent it is more likely than not that they will be realized. In evaluating our ability to recover the deferred tax assets, management considers all available positive and negative evidence, including projected future taxable income, tax planning strategies and recent financial operations.
In projecting future taxable income, management develops assumptions including the amount of future state and federal pre-tax operating income, the reversal of temporary differences and the implementation of feasible and prudent tax planning strategies. These assumptions require significant judgment about the forecasts of future taxable income and are consistent with the plans and estimates being used to manage the underlying business. We file consolidated federal and combined state income tax returns.
ASC 740-10-55Income Taxes requires a two-step process that separates recognition from measurement of tax positions. We recognize the financial statement effect of a tax position when it is more likely than not, based on the technical merits, that the position will be sustained upon examination by a taxing authority. The measurement process is applied only after satisfying the recognition requirement and determines what amount of a tax position will be sustainable upon a potential examination or settlement. If upon measuring, the tax position produces a range of potential tax benefits, we may claim the highest tax benefit from that range as long as it is over 50% likely to be realized using a probability analysis.
We believe that all of the tax positions we have taken, meet the more likely than not recognition threshold. To the extent tax authorities disagree with these tax positions, our effective tax rates could be materially affected in the period of settlement with the taxing authorities. See Note 24Income Taxes in theNotes to Consolidated Financial Statements in this document for further detail on our income taxes.
Derivative Financial Instruments and Hedging Activities
During March of 2016, we terminated all of our interest rate swaps (active and forward starting the “hedging instrument”) and simultaneously paid off the $75.0 million Federal Home Loan Bank of San Francisco borrowing (the “hedged instrument”). At the time of termination, the interest rate swaps were carried at a $2.3 million loss in ourConsolidated Balance Sheets. Accordingly, we immediately reclassified $1.4 million in unrealized losses from other comprehensive income into earnings resulting in a pre-tax loss of $2.3 million recorded in noninterest expense.
We used derivatives to hedge the risk of changes in market interest rates to limit the impact on earnings and cash flows relating to specific groups of assets and liabilities. During 2015 and the first quarter of 2016, we utilized interest rate swaps (the “hedging instrument”) with other major financial institutions (counterparties) to hedge interest expenses associated with certain Federal Home Loan Bank of San Francisco borrowings (the “hedged instrument”). We do not use derivative instruments for trading or speculative purposes.
For derivative financial instruments accounted for as hedging instruments, we formally designate and document, at inception, the financial instrument as a hedge of a specific underlying exposure, the risk management objective, and the manner in which effectiveness of the hedge will be assessed. We formally assess both at inception and at each reporting period thereafter, whether the derivative financial instruments used in hedging transactions are effective in offsetting changes in fair value or cash flows of the related underlying exposures. Any ineffective portion of the change in cash flows of the instruments is recognized immediately into earnings.
ASC 815-10,Derivatives and Hedging (“ASC 815”) requires companies to recognize all derivative instruments as assets or liabilities at fair value in theConsolidated Balance Sheets. In accordance with ASC 815, we designated our interest rate swaps as cash flow hedges of certain active and forecasted variable rate Federal Home Loan Bank of San Francisco advances. Changes in the fair value of the hedging instrument in cash flow hedges were recorded in accumulated other comprehensive income until earnings were impacted by the hedged instrument. No components of our hedging instruments were excluded from the assessment of hedge effectiveness in hedging exposure to variability in cash flows.
BANK OF COMMERCE HOLDINGS & SUBSIDIARIES
Classification of the gain or loss in theConsolidated Statements ofIncome upon release from accumulated other comprehensive income is the same as that of the underlying exposure. We discontinue the use of hedge accounting prospectively when (1) the derivative instrument is no longer effective in offsetting changes in fair value or cash flows of the underlying hedged item; (2) the derivative instrument expires, is sold, terminated, or exercised; or (3) designating the derivative instrument as a hedge is no longer appropriate. When we discontinue hedge accounting because it is no longer probable that an anticipated transaction will occur in the originally expected period, or within an additional two-month period thereafter, changes to fair value that were in accumulated other comprehensive income are recognized immediately in earnings.
At December 31, 2015, we had one active interest rate swap, and one forward starting interest rate swap to hedge interest rate risk associated with current and forecasted variable rate Federal Home Loan Bank of San Francisco advances. The hedge strategy converted LIBOR based variable rate of interest on active and forecasted Federal Home Loan Bank of San Francisco advances to fixed interest rates.
The following table summarizes our interest rate swap contracts with counterparties outstanding at December 31, 2015. The interest rate swap contracts were made with a single issuer and included the right of offset.
(Amounts in thousands) | |||||||||||||||
Description | We Pay Fixed | We Receive Variable (1) | Notional Amount | Effective Date | Maturity Date | ||||||||||
Interest rate swap | 2.64 | % | 0.33 | % | $ | 75,000 | August 3, 2015 | August 1, 2016 | |||||||
| Forward starting interest rate swap | 3.22 | % | Variable | $ | 75,000 | August 1, 2016 | August 1, 2017 | ||||||||
(1)Rate floats to three month LIBOR payable quarterly on February 1, May 1, August 1, and November 1.
Fair Value Measurements
We use fair value measurements to record fair value adjustments to certain assets and liabilities, and to determine fair value disclosures. We base our fair values on the price that would be received to sell an asset or paid to transfer a liability in an orderly transaction between market participants at the measurement date. Securities available-for-sale and derivatives are recorded at fair value on a recurring basis. Additionally, from time to time, we may be required to record certain assets at fair value on a nonrecurring basis, such as certain impaired loans held for investment, (“OREO”) and goodwill. These nonrecurring fair value adjustments typically involve write-downs of individual assets due to application of lower of cost or market accounting.
We have established and documented a process for determining fair value. We maximize the use of observable inputs and minimize the use of unobservable inputs when developing fair value measurements. Whenever there is no readily available market data, we use our best estimate and assumptions in determining fair value, but these estimates involve inherent uncertainties and the application of management’s judgment. As a result, if other assumptions had been used, our recorded earnings or disclosures could have been materially different from those reflected in these consolidated financial statements. Additional information on our use of fair value measurements and our related valuation methodologies is provided in Note 23Fair Values in theNotes to Consolidated Financial Statements incorporated in this document.
SOURCES OF INCOME
We derive our income primarily from net interest income, which is the difference between the interest income we receive on interest-earning assets and the interest expense we pay on interest-bearing liabilities. Sources of noninterest income include fees earned on deposit related services, ATM and point of sale fees, payroll processing, gain on sale of available-for-sale securities, earnings on bank-owned life insurance and dividends on Federal Home Loan Bank of San Francisco stock.
Net interest income is impacted by many factors that are beyond our control, including general economic conditions inflation, recession, and the policies of various governmental and regulatory agencies, the Federal Reserve Board in particular. In recent years, we originated higher volumes of longer term fixed rate loans. These loans, combined with the structure of our investment portfolio, the use of floors in the pricing of our variable rate loans and funding mix caused the Company to become neutral to slightly liability sensitive, which could negatively impact earnings in a rapidly rising interest rate environment.
Net interest income reflects both the amount of earning assets we hold and our net interest margin, which is the difference between the yield we on our earning assets and the interest rate we pay to fund those assets. As a result, changes in either our net interest margin or the amount of earning assets we hold will affect our net interest income and earnings.
BANK OF COMMERCE HOLDINGS & SUBSIDIARIES
Increases or decreases in interest rates could adversely affect our net interest margin. Although our asset yields and funding costs tend to move in the same direction in response to changes in interest rates, one can rise or fall faster than the other, and cause our net interest margin to expand or contract. Many of our assets are tied to prime rate, so they may adjust faster in response to changes in interest rates. As a result, when interest rates fall, the yield we earn on our assets may fall faster than our ability to reprice a large portion of our liabilities, causing our net interest margin to contract.
Changes in the slope of the yield curve, the spread between short termshort-term and long termlong-term interest rates, could also reduce our net interest margin. Normally, the yield curve is upward sloping, which means that short termshort-term rates are lower than long termlong-term rates. Because our liabilities tend to be shorter in duration than our assets, when the yield curve flattens or even inverts, we could experience pressure on our net interest margin as our cost of funds increases relative to the yield we can earn on our assets.
BANK OF COMMERCE HOLDINGS & SUBSIDIARIES
We assess our interest rate risk by estimating the effect on our earnings under various simulated scenarios that differ based on assumptions including the direction, magnitude and speed of interest rate changes, and the slope of the yield curve.
There is always the risk that changes in interest rates could reduce our net interest income and earnings in material amounts, especially if actual conditions turn out to be materially different than simulated scenarios. For example, if interest rates rise or fall faster than we assumed or the slope of the yield curve changes, we may incur significant losses on debt securities we hold as investments. To reduce our interest rate risk, we may rebalance our investment and loan portfolios, refinance our debt and take other strategic actions, which may result in losses or expenses.
Sources of noninterest income include fees earned on deposit related services, ATM and point of sale fees, payroll and benefit processing fees, earnings on bank-owned life insurance, gain on sale of available-for-sale securities, and dividends on Federal Home Loan Bank of San Francisco stock.
RESULTS OF OPERATIONS
The following discussiondiscussion and analysis provides a comparison of the results of operations for the three years ended December 31, 2016.2017. This discussion should be read in conjunction with the Consolidated Financial Statements and related notes.
Overview
Overview
For the Year Ended December 31, 2017 Compared to the Year Ended December 31, 2016
Net income available to common shareholders was $7.3 million for the year ended December 31, 2017, compared to $5.3 million for the year ended December 31, 2016. For 2017, increases in net interest income, noninterest income and decreases in noninterest expense were offset by an increased provision for income taxes compared to the prior year. The increased provision for income taxes included a $2.5 million write-down of our deferred tax assets resulting from the Tax Cuts and Jobs Act enacted on December 22, 2017
Diluted earnings per share were $0.48 for the year ended December 31, 2017 compared with $0.39 for the same period a year previous. Changes in earnings per share are the result of changes in net income and the issuance of 2,738,096 shares common stock during 2017.
We continued our quarterly cash dividends of $0.03 per share for all four quarters in 2017. In determining the amount of dividend to be paid, we give consideration to capital preservation objectives, expected asset growth, projected earnings, the overall dividend pay-out ratio and the dividend yield.
For the Year Ended December 31, 2016 Compared to the Year Ended December 31, 2015
Net income available to common shareholders was $5.3 million for the year ended December 31, 2016, compared to $8.3 million for the year ended December 31, 2015. For 2016, various increases in net interest income and noninterest income and decreases in provision for income taxes were offset by increased noninterest expense, compared to the prior year.
Diluted earnings per share were $0.39 for the year ended December 31, 2016 compared with $0.62 for the same period a year previous. Changes in earnings per share are the result of changes in net income.
We continued our paid a quarterly cash dividendsdividend of $0.03 per share for all four quarters in 2016. In determining the amount of dividend to be paid, we give consideration to capital preservation objectives, expected asset growth, projected earnings, the overall dividend pay-out ratio and the dividend yield.
Year Ended December 31, 2015 Compared to Year Ended December 31, 2014
Net income available to common shareholders was $8.3 million for the year ended December 31, 2015, compared to $5.5 million for the year ended December 31, 2014. For 2015 increases in net interest income and decreases in provision for loan and lease loss expense and noninterest expense were partially offset by decreases in noninterest income and increases in provision for income taxes, compared to the prior year.
Diluted earnings per share from operations were $0.62 for the year ended December 31, 2015 compared with $0.41 for the year ended December 31, 2014. This increase in diluted earnings per share resulted from increased earnings and decreased weighted average shares. The decrease in weighted average shares resulted from common stock repurchases during 2014.
We continued our quarterly cash dividends of $0.03 per share for all four quarters in 2015. In determining the amount of dividend to be paid, we give consideration to capital preservation objectives, expected asset growth, projected earnings, the overall dividend pay-out ratio, and the dividend yield.
BANK OF COMMERCE HOLDINGS & SUBSIDIARIES
Return on Average Assets, Average Total Equity and Average Common Shareholders' Equity
The following table presents the returns on average assets, average total equity and average common shareholders' equity for the years ended December 31, 2017, 2016 2015 and 2014.2015. For each of the periods presented, the table includes the calculated ratios based on reported net income and net income available to common shareholders as shown in the Consolidated Statements of Income incorporated in this document.
2016 | 2015 | 2014 | 2017 | 2016 | 2015 | |||||||||||||||||||
Return on average assets: | ||||||||||||||||||||||||
Net income | 0.49 | % | 0.86 | % | 0.59 | % | 0.61 | % | 0.49 | % | 0.86 | % | ||||||||||||
Income available to common shareholders | 0.49 | % | 0.84 | % | 0.57 | % | 0.61 | % | 0.49 | % | 0.84 | % | ||||||||||||
Return on average total equity: |
|
|
| |||||||||||||||||||||
Net income | 5.68 | % | 8.10 | % | 5.59 | % | 6.34 | % | 5.68 | % | 8.10 | % | ||||||||||||
Income available to common shareholders | 5.68 | % | 7.83 | % | 5.40 | % | 6.34 | % | 5.68 | % | 7.83 | % | ||||||||||||
Return on average common shareholders’ equity: |
|
|
| |||||||||||||||||||||
Return on average common shareholders’ equity: | ||||||||||||||||||||||||
Net income | 5.68 | % | 9.85 | % | 6.95 | % | 6.34 | % | 5.68 | % | 9.85 | % | ||||||||||||
Income available to common shareholders | 5.68 | % | 9.51 | % | 6.70 | % | 6.34 | % | 5.68 | % | 9.51 | % | ||||||||||||
BANK OF COMMERCE HOLDINGS & SUBSIDIARIES
Net Interest Income and Net Interest Margin
Net interest income is theour largest source of our operating income. Net interest income for the years ended December 31, 2017, 2016 and 2015 and 2014 was $41.4 million, $36.2 million and $33.8 million, respectively.
For the Year Ended December 31, 2017 Compared to the Year Ended December 31, 2016
Interest income for the year ended December 31, 2017 was $45.9 million, an increase of $4.9 million or 12% compared to the same period a year previous. The increase in interest income was due to increased volume and $32.6yield in the loan portfolio, increased volume in the securities portfolio and increased volume and yield on interest-bearing deposits in other banks. These increases were partially offset by decreased yields on the securities portfolio.
Interest income recognized from the investment securities portfolio increased $823 thousand during the year ended December 31, 2017 compared to the same period a year previous. The increase in investment securities interest income was due to increased average balances in the securities portfolio. Average securities balances and weighted average tax equivalent yields were $239.6 million and 2.99% compared to $196.2 million and 3.26% for 2017 and 2016, respectively.
Interest expense for the year ended December 31, 2017 was $4.6 million, a decrease of $191 thousand or 4% compared to the prior year.
● | Interest on interest-bearing deposits increased $256 thousand during 2017. Average interest bearing core deposit balances increased $67.1 million while average time deposit balances decreased $15.4 million. The cost of all deposits decreased by one basis point to 0.30% for 2017 compared to the prior year. |
● | Interest on senior and subordinated term debt decreased $9 thousand, interest on FHLB term debt decreased $482 thousand and interest on other borrowings decreased $8 thousand during 2017. Average term debt balances were $18.3 million for 2017 compared to $37.7 million for 2016. |
● | Interest on junior subordinated debentures increased $52 thousand during 2017. |
The net interest margin on a fully tax-equivalent basis was 3.78% for the year ended December 31, 2017, an increase of seven basis points as compared to the same period a year previous. The increase in our net interest margin resulted mostly from a decrease in the cost of funding average earning assets. These lower funding costs are the result of reductions in term debt and the termination of an interest rate hedge in 2016.
Maintaining our net interest margin has been challenging in a low interest rate environment and while confronted with increased borrowing costs from our term debt. We anticipate that maintaining our net interest margin will be easier in an increasing rate environment. During 2017, we deployed liquidity provided by strong core deposit growth into loan originations and the purchase of intermediate term available-for-sale securities. We have accelerated repayment of our senior debt.
For the Year Ended December 31, 2016 Compared to the Year Ended December 31, 2015
Interest income for the year ended December 31, 2016 was $41.0 million, an increase of $2.3 million or 6% comparedcompared to the same period a year previous. The increase in interest income was primarily driven by increased volume and yield in the loan portfolio and increased volume of interest bearing deposits in other banks. These increases were partially offset by decreased volume and yields on the securities portfolio and decreased yield on interest bearing deposits in other banks.
Interest income for the year ended December 31, 2015 was $38.8 million, an increase of $2.1 million or 6% compared to the same period a year previous. The increase in interest income was primarily driven by increased volume in the loan portfolio, partially offset by decreased yield in the loan portfolio and decreased volume and yields on the securities portfolio and on interest bearing deposits in other banks.
Interest income recognized from the investment securities portfolio decreased $434 thousand during the year ended December 31, 2016 comparedcompared to the same period a year previous. TheThis decrease in investment securities interest income was due to decreased yields on the securities portfolio and decreased volume on the tax exempt securities portfolio. Average securities balances and weighted average tax equivalent yields were $196.2 million and 3.26% compared to $198.0 million and 3.49% for 2016 and 2015, respectively.
Interest income recognized from the investment securities portfolio decreased $1.1 million during the year ended December 31, 2015 compared to the year ended December 31, 2014. The decrease in investment securities interest income was primarily attributable to decreased volume on the securities portfolio and decreased yields on the taxable securities portfolio, partially offset by increased yields on the tax exempt securities. Average securities balances and weighted average tax equivalent yields were $198.0 million and 3.49% compared to $231.9 million and 3.47% for 2015 and 2014, respectively.
Interest expense for the year ended December 31, 2016 was $4.8 million, a decrease of $205 thousand or 4% compared to the prior year.
● | Interest on FHLB term debt decreased $1.2 million during 2016. During the first quarter of 2016 all FHLB term debt was repaid and an interest rate hedge associated with $75.0 million of that debt was terminated. |
● | Interest on senior and subordinated term debt increased $1.1 million during 2016. We entered into a senior debt loan agreement to borrow $10.0 million from another financial institution and issued $10.0 million of subordinated term debt during the fourth quarter of 2015 to redeem $20.0 million of preferred stock. |
● | Interest on interest bearing deposits decreased $153 thousand during 2016. Interest bearing deposits increased $100.0 million compared to the prior year, but the rate paid on all interest bearing deposits decreased by |
● | Interest on junior subordinated debentures |
BANK OF COMMERCE HOLDINGS & SUBSIDIARIES
Interest expense for the year ended December 31, 2015 was $5.0 million, an increase of $891 thousand or 22% compared to the year ended December 31, 2014.
|
|
|
|
|
|
The net interest margin on a fully tax-equivalent basis was 3.71% for the year ended December 31, 2016, a decrease of six basis points as compared to the same period a year previous. The decrease in net interest margin resulted from a 12 basis point decrease in tax equivalent yield on average earning assets partially offset by a six basis point decrease in interest expense to average earning assets. The decrease in tax equivalent yield on average earning assets was driven by decreased yields on investment securities. The decrease in interest expense resulted from our acquisition of low cost core deposits and our ability to restructure our balance sheet.
While maintaining our net interest margin in a historically low interest rate environment and while confronted with increased borrowing costs due to our term debt has been challenging. We anticipate that maintaining our net interest margin will be easier in an increasing rate environment. During 2016, we deployed liquidity provided by the March 2016 branch acquisition and strong organic deposit growth into loan originations and the purchase of moderate term available-for-sale securities.
The net interest margin on a fully tax-equivalent basis was 3.77% for the year ended December 31, 2015, an increase of six basis points as compared to the prior year. The increase in net interest margin resulted from a 15 basis point increase in tax equivalent yield on average earning assets and a nine basis point increase in interest expense to average earning assets. The increase in net interest margin was primarily driven by increase in loan volume.
BANK OF COMMERCE HOLDINGS & SUBSIDIARIES
The following table presents condensed average balance sheet information, together withinformation, interest income and yields earned on average interest earninginterest-earning assets and interest expense and rates paid on average interest-bearing liabilities for the years ended December 31, 2017, 2016 2015 and 2014.2015.
Average Balances, Interest Income/Expense and Yields/Rates Paid
Years Ended December 31, | Years Ended December 31, | |||||||||||||||||||||||||||||||||||||||||||||||||||||||||||||||||||||||
2016 | 2015 | 2014 | 2017 | 2016 | 2015 | |||||||||||||||||||||||||||||||||||||||||||||||||||||||||||||||||||
Average | Yield/ | Average | Yield/ | Average | Yield/ | Average | Yield/ | Average | Yield/ | Average | Yield/ | |||||||||||||||||||||||||||||||||||||||||||||||||||||||||||||
(Amounts in thousands) | Balance | Interest(1) | Rate | Balance | Interest(1) | Rate | Balance | Interest(1) | Rate | Balance | Interest(1) | Rate(5) | Balance | Interest(1) | Rate(5) | Balance | Interest(1) | Rate(5) | ||||||||||||||||||||||||||||||||||||||||||||||||||||||
Interest-earning assets | ||||||||||||||||||||||||||||||||||||||||||||||||||||||||||||||||||||||||
Net loans (2) | $ | 752,938 | $ | 35,435 | 4.71 | % | $ | 699,227 | $ | 32,871 | 4.70 | % | $ | 625,166 | $ | 29,464 | 4.71 | % | $ | 818,119 | $ | 39,112 | 4.78 | % | $ | 752,938 | $ | 35,435 | 4.71 | % | $ | 699,227 | $ | 32,871 | 4.70 | % | ||||||||||||||||||||||||||||||||||||
Taxable securities | 120,884 | 2,986 | 2.47 | % | 120,897 | 3,284 | 2.72 | % | 147,916 | 4,214 | 2.85 | % | 165,333 | 3,921 | 2.37 | % | 120,884 | 2,986 | 2.47 | % | 120,897 | 3,284 | 2.72 | % | ||||||||||||||||||||||||||||||||||||||||||||||||
Tax-exempt securities | 75,303 | 2,256 | 3.00 | % | 77,089 | 2,392 | 3.10 | % | 83,973 | 2,536 | 3.02 | % | 74,231 | 2,144 | 2.89 | % | 75,303 | 2,256 | 3.00 | % | 77,089 | 2,392 | 3.10 | % | ||||||||||||||||||||||||||||||||||||||||||||||||
Interest-bearing deposits in other banks | 58,668 | 332 | 0.57 | % | 30,323 | 206 | 0.68 | % | 56,465 | 479 | 0.85 | % | 66,872 | 772 | 1.15 | % | 58,668 | 332 | 0.57 | % | 30,323 | 206 | 0.68 | % | ||||||||||||||||||||||||||||||||||||||||||||||||
Average interest-earning | 1,007,793 | 41,009 | 4.07 | % | 927,536 | 38,753 | 4.18 | % | 913,520 | 36,693 | 4.02 | % | 1,124,555 | 45,949 | 4.09 | % | 1,007,793 | 41,009 | 4.07 | % | 927,536 | 38,753 | 4.18 | % | ||||||||||||||||||||||||||||||||||||||||||||||||
Cash and due from banks | 15,831 |
| 11,220 |
| 11,246 |
| 18,301 | 15,831 | 11,220 | |||||||||||||||||||||||||||||||||||||||||||||||||||||||||||||||
Premises and equipment, net | 15,078 |
| 11,552 |
| 12,105 |
| 15,567 | 15,078 | 11,552 | |||||||||||||||||||||||||||||||||||||||||||||||||||||||||||||||
Other assets | 41,048 |
| 42,423 |
| 36,936 |
| 39,828 | 41,048 | 42,423 | |||||||||||||||||||||||||||||||||||||||||||||||||||||||||||||||
Average total assets | $ | 1,079,750 |
| $ | 992,731 |
| $ | 973,807 |
| $ | 1,198,251 | $ | 1,079,750 | $ | 992,731 | |||||||||||||||||||||||||||||||||||||||||||||||||||||||||
|
|
| ||||||||||||||||||||||||||||||||||||||||||||||||||||||||||||||||||||||
Interest-bearing liabilities |
|
|
| |||||||||||||||||||||||||||||||||||||||||||||||||||||||||||||||||||||
Interest-bearing demand | $ | 374,170 | 523 | 0.14 | % | $ | 283,105 | 460 | 0.16 | % | $ | 272,383 | 471 | 0.17 | % | $ | 434,705 | 744 | 0.17 | % | $ | 374,170 | 523 | 0.14 | % | $ | 283,105 | 460 | 0.16 | % | ||||||||||||||||||||||||||||||||||||||||||
Savings deposits | 104,771 | 174 | 0.17 | % | 92,659 | 213 | 0.23 | % | 91,108 | 228 | 0.25 | % | ||||||||||||||||||||||||||||||||||||||||||||||||||||||||||||
Savings | 111,376 | 200 | 0.18 | % | 104,771 | 174 | 0.17 | % | 92,659 | 213 | 0.23 | % | ||||||||||||||||||||||||||||||||||||||||||||||||||||||||||||
Certificates of deposit | 221,074 | 2,179 | 0.99 | % | 238,626 | 2,356 | 0.99 | % | 259,445 | 2,608 | 1.01 | % | 205,648 | 2,188 | 1.06 | % | 221,074 | 2,179 | 0.99 | % | 238,626 | 2,356 | 0.99 | % | ||||||||||||||||||||||||||||||||||||||||||||||||
Net term debt | 37,286 | 1,667 | 4.47 | % | 88,874 | 1,759 | 1.98 | % | 77,534 | 422 | 0.54 | % | 18,283 | 1,168 | 6.39 | % | 37,286 | 1,667 | 4.47 | % | 88,874 | 1,759 | 1.98 | % | ||||||||||||||||||||||||||||||||||||||||||||||||
Junior subordinated debentures | 10,310 | 235 | 2.28 | % | 10,310 | 195 | 1.89 | % | 15,239 | 363 | 2.38 | % | 10,310 | 287 | 2.78 | % | 10,310 | 235 | 2.28 | % | 10,310 | 195 | 1.89 | % | ||||||||||||||||||||||||||||||||||||||||||||||||
Average interest-bearing liabilities | 747,611 | 4,778 | 0.64 | % | $ | 713,574 | 4,983 | 0.70 | % | $ | 715,709 | 4,092 | 0.57 | % | 780,322 | 4,587 | 0.59 | % | $ | 747,611 | 4,778 | 0.64 | % | $ | 713,574 | 4,983 | 0.70 | % | ||||||||||||||||||||||||||||||||||||||||||||
Noninterest-bearing | 226,368 |
| 156,578 |
| 139,792 |
| 289,735 | 226,368 | 156,578 | |||||||||||||||||||||||||||||||||||||||||||||||||||||||||||||||
Other liabilities | 13,217 |
| 16,588 |
| 15,934 |
| 12,293 | 13,217 | 16,588 | |||||||||||||||||||||||||||||||||||||||||||||||||||||||||||||||
Shareholders’ equity | 92,554 |
| 105,991 |
| 102,372 |
| ||||||||||||||||||||||||||||||||||||||||||||||||||||||||||||||||||
Average liabilities and shareholders’ equity | $ | 1,079,750 |
| $ | 992,731 |
| $ | 973,807 |
| |||||||||||||||||||||||||||||||||||||||||||||||||||||||||||||||
Shareholders’ equity | 115,901 | 92,554 | 105,991 | |||||||||||||||||||||||||||||||||||||||||||||||||||||||||||||||||||||
Average liabilities and shareholders’ equity | $ | 1,198,251 | $ | 1,079,750 | $ | 992,731 | ||||||||||||||||||||||||||||||||||||||||||||||||||||||||||||||||||
Net interest income and net interest margin(4) | $ | 36,231 | 3.60 | % | $ | 33,770 | 3.64 | % | $ | 32,601 | 3.57 | % | $ | 41,362 | 3.68 | % | $ | 36,231 | 3.60 | % | $ | 33,770 | 3.64 | % | ||||||||||||||||||||||||||||||||||||||||||||||||
Tax equivalent net interest margin (3) | 3.71 | % | 3.77 | % | 3.71 | % | 3.78 | % | 3.71 | % | 3.77 | % | ||||||||||||||||||||||||||||||||||||||||||||||||||||||||||||
(1) | Interest income on loans |
(2) |
|
(3) | Tax-exempt income has been adjusted to tax equivalent basis at a 34% tax rate. The amount of such adjustments was an addition to recorded income of approximately |
(4) | Net interest margin is net interest income expressed as a percentage of average interest-earning assets. |
(5) | Yields and rates are calculated by dividing income or expense by the average balance of the respective assets or liabilities. |
BANK OF COMMERCE HOLDINGS & SUBSIDIARIES
The following table sets forth a summary of the changes in tax equivalent net interest income due to changes in average asset and liability balances (volume)(volume variance) and changes in average rates (rate)(rate variance) for 2017 compared to 2016 and 2016 compared to 2015 and 2015 compared to 2014.2015. Changes in tax equivalent interest income and expense, which are not specifically attributable specifically to either volume or rate, are allocated proportionately between both variances.
Analysis of Changes in Net Interest Income
Years Ended December 31, | Years Ended December 31, | |||||||||||||||||||||||||||||||||||||||||||||||
2016 over 2015 | 2015 over 2014 | 2017 over 2016 | 2016 over 2015 | |||||||||||||||||||||||||||||||||||||||||||||
(Amounts in thousands) | Volume | Rate | Net Change | Volume | Rate | Net Change | Volume | Rate | Net Change | Volume | Rate | Net Change | ||||||||||||||||||||||||||||||||||||
Increase (decrease) in interest income: | ||||||||||||||||||||||||||||||||||||||||||||||||
Net loans | $ | 2,528 | $ | 36 | $ | 2,564 | $ | 3,482 | $ | (75 | ) | $ | 3,407 | $ | 3,109 | $ | 568 | $ | 3,677 | $ | 2,528 | $ | 36 | $ | 2,564 | |||||||||||||||||||||||
Taxable securities | — | (298 | ) | (298 | ) | (741 | ) | (189 | ) | (930 | ) | 1,049 | (114 | ) | 935 | — | (298 | ) | (298 | ) | ||||||||||||||||||||||||||||
Tax-exempt securities (1) | (83 | ) | (123 | ) | (206 | ) | (321 | ) | 103 | (218 | ) | (48 | ) | (122 | ) | (170 | ) | (83 | ) | (123 | ) | (206 | ) | |||||||||||||||||||||||||
Interest-bearing deposits in other banks | 153 | (27 | ) | 126 | (191 | ) | (82 | ) | (273 | ) | 52 | 388 | 440 | 153 | (27 | ) | 126 | |||||||||||||||||||||||||||||||
Total increase (decrease) | 2,598 | (412 | ) | 2,186 | 2,229 | (243 | ) | 1,986 | 4,162 | 720 | 4,882 | 2,598 | (412 | ) | 2,186 | |||||||||||||||||||||||||||||||||
| �� | ||||||||||||||||||||||||||||||||||||||||||||||||
Increase (decrease) in interest expense: | ||||||||||||||||||||||||||||||||||||||||||||||||
Interest-bearing demand | 111 | (48 | ) | 63 | 18 | (29 | ) | (11 | ) | 93 | 128 | 221 | 111 | (48 | ) | 63 | ||||||||||||||||||||||||||||||||
Savings accounts | 35 | (74 | ) | (39 | ) | 4 | (19 | ) | (15 | ) | ||||||||||||||||||||||||||||||||||||||
Savings deposits | 11 | 15 | 26 | 35 | (74 | ) | (39 | ) | ||||||||||||||||||||||||||||||||||||||||
Certificates of deposit | (173 | ) | (4 | ) | (177 | ) | (206 | ) | (46 | ) | (252 | ) | (65 | ) | 74 | 9 | (173 | ) | (4 | ) | (177 | ) | ||||||||||||||||||||||||||
Net term debt | (1,021 | ) | 929 | (92 | ) | 70 | 1,267 | 1,337 | (3,150 | ) | 2,651 | (499 | ) | (1,021 | ) | 929 | (92 | ) | ||||||||||||||||||||||||||||||
Junior subordinated debentures | — | 40 | 40 | (103 | ) | (65 | ) | (168 | ) | — | 52 | 52 | — | 40 | 40 | |||||||||||||||||||||||||||||||||
Total increase | (1,048 | ) | 843 | (205 | ) | (217 | ) | 1,108 | 891 | (3,111 | ) | 2,920 | (191 | ) | (1,048 | ) | 843 | (205 | ) | |||||||||||||||||||||||||||||
Net increase (decrease) | $ | 3,646 | $ | (1,255 | ) | $ | 2,391 | $ | 2,446 | $ | (1,351 | ) | $ | 1,095 | $ | 7,273 | $ | (2,200 | ) | $ | 5,073 | $ | 3,646 | $ | (1,255 | ) | $ | 2,391 | ||||||||||||||||||||
(1) Tax-exempt income has been adjusted to tax equivalent basis at a 34% tax rate. |
Noninterest Income
The following table presents the key components of noninterest income for the years ended December 31, 2017, 2016 2015 and 2014.2015.
Years Ended December 31, | Years Ended December 31, | |||||||||||||||||||||||||||||||||||||||||||||||||||||||||||||||
2016 Compared to 2015 | 2015 Compared to 2014 | 2017 Compared to 2016 | 2016 Compared to 2015 | |||||||||||||||||||||||||||||||||||||||||||||||||||||||||||||
Change | Change | Change | Change | Change | Change | Change | Change | |||||||||||||||||||||||||||||||||||||||||||||||||||||||||
(Amounts in thousands) | 2016 | 2015 | Amount | Percent | 2015 | 2014 | Amount | Percent | 2017 | 2016 | Amount | Percent | 2016 | 2015 | Amount | Percent | ||||||||||||||||||||||||||||||||||||||||||||||||
Noninterest income: | ||||||||||||||||||||||||||||||||||||||||||||||||||||||||||||||||
Service charges on deposit accounts | $ | 413 | $ | 204 | $ | 209 | 102 | % | $ | 204 | $ | 186 | $ | 18 | 10 | % | $ | 542 | $ | 413 | $ | 129 | 31 | % | $ | 413 | $ | 204 | $ | 209 | 102 | % | ||||||||||||||||||||||||||||||||
ATM and point of sale fees | 995 | 383 | 612 | 160 | % | 383 | 330 | 53 | 16 | % | 1,093 | 995 | 98 | 10 | % | 995 | 383 | 612 | 160 | % | ||||||||||||||||||||||||||||||||||||||||||||
Payroll and benefit processing fees | 593 | 555 | 38 | 7 | % | 555 | 508 | 47 | 9 | % | 658 | 593 | 65 | 11 | % | 593 | 555 | 38 | 7 | % | ||||||||||||||||||||||||||||||||||||||||||||
Earnings on cash surrender value – life insurance | 613 | 641 | (28 | ) | (4 | )% | 641 | 628 | 13 | 2 | % | |||||||||||||||||||||||||||||||||||||||||||||||||||||
Gain (loss) on sales of investment securities, net | 244 | 443 | (199 | ) | (45 | )% | 443 | (159 | ) | 602 | 379 | % | ||||||||||||||||||||||||||||||||||||||||||||||||||||
Other than temporary impairment on investment securities | (546 | ) | — | (546 | ) | (100 | )% | — | — | — | — | % | ||||||||||||||||||||||||||||||||||||||||||||||||||||
Life insurance | 1,050 | 613 | 437 | 71 | % | 613 | 641 | (28 | ) | (4 | %) | |||||||||||||||||||||||||||||||||||||||||||||||||||||
Gain on sales of investment securities, net | 137 | 244 | (107 | ) | (44 | %) | 244 | 443 | (199 | ) | (45 | %) | ||||||||||||||||||||||||||||||||||||||||||||||||||||
Other-than-temporary impairment on investment securities | — | (546 | ) | 546 | 100 | % | (546 | ) | — | (546 | ) | (100 | %) | |||||||||||||||||||||||||||||||||||||||||||||||||||
Federal Home Loan Bank of San Francisco dividends | 644 | 630 | 14 | 2 | % | 630 | 345 | 285 | 83 | % | 318 | 644 | (326 | ) | (51 | %) | 644 | 630 | 14 | 2 | % | |||||||||||||||||||||||||||||||||||||||||||
Other - hedge gain | — | — | — | — | % | — | 1,617 | (1,617 | ) | (100 | )% | |||||||||||||||||||||||||||||||||||||||||||||||||||||
Gain (loss) on sale of OREO | 368 | (109 | ) | 477 | 438 | % | (109 | ) | 13 | (122 | ) | (938 | %) | |||||||||||||||||||||||||||||||||||||||||||||||||||
Insured cash sweep fees | 197 | 3 | 194 | 6,467 | % | 3 | — | 3 | 100 | % | ||||||||||||||||||||||||||||||||||||||||||||||||||||||
Other | 639 | 327 | 312 | 95 | % | 327 | 860 | (533 | ) | (62 | )% | 461 | 636 | (175 | ) | (28 | %) | 636 | 314 | 322 | 103 | % | ||||||||||||||||||||||||||||||||||||||||||
Total noninterest income | $ | 3,595 | $ | 3,183 | $ | 412 | 13 | % | $ | 3,183 | $ | 4,315 | $ | (1,132 | ) | (26 | )% | $ | 4,824 | $ | 3,486 | $ | 1,338 | 38 | % | $ | 3,486 | $ | 3,183 | $ | 303 | 10 | % | |||||||||||||||||||||||||||||||
For the Year Ended December 31, 2017 Compared to the Year Ended December 31, 2016
Noninterest income in 2017 was $4.8 million, an increase of $1.3 million or 38% compared to 2016.
BANK OF COMMERCE HOLDINGS & SUBSIDIARIES
December 31, 2016 compared to December 31, 2015
Noninterest income in 2016 was $3.6 million, an increase of $412 thousand or 13% compared to 2015.
For the year ended December 31, 20162017 compared to the same period a year ago:
● |
|
|
|
● | During |
● | During the second quarter of 2016, we recorded a $546 thousand other-than-temporary impairment on an investment security. See Note 4Securities in theNotes to Consolidated Financial Statementsfor further detail on other-than-temporary impairment. |
● | Dividends on Federal Home Loan Bank of San Francisco stock decreased $326 thousand primarily due to a special dividend recorded in the prior year. |
● | During the current year gains on sale of OREO properties were $368 thousand, compared to a loss of $109 thousand in the prior year. Net gains on sale of OREO property in the current year were primarily due to one nonfarm nonresidential property. |
● | During 2017 we received fees totaling $197 thousand from ICS one-way sales, which are not anticipated to continue in the future. |
The major components of other noninterest income are fees earned on merchant bankcard processing, check orders, safe deposit box rental and wire transfers. Other noninterest income for the year ended December 31, 2017 was $461 thousand, a decrease of $175 thousand compared to the same period a year previous. During the first quarter of 2016 we recorded a $176 thousand gain on payoff of an impaired loan in other noninterest income.
For the Year Ended December 31, 2016 Compared to the Year Ended December 31, 2015
Noninterest income in 2016 was $3.5 million, an increase of $303 thousand or 10% compared to 2015.
For the year ended December 31, 2016 compared to the year ended December 31, 2015:
● | Service charges increased $209 thousand due to the branch acquisition completed in the first quarter of 2016. |
● | ATM and point of sale fees increased $612 thousand as a result of the branch and offsite ATM acquisition completed in the first quarter of 2016. |
● | During the second quarter of 2016, we recorded a $546 thousand other-than-temporary impairment on an investment security. See Note 4Securities in the Notes to Consolidated Financial Statements for further detail on other-than-temporary impairment. |
The major components of other noninterest income are fees earned on merchant bankcard processing, check orders, safe deposit box rental and wire transfers. Other noninterest income for the year ended December 31, 2016 was $639 thousand, an increase of $312 thousand compared to the same period a year previous. The increase in the current year2016 compared to the same period a year previousin 2015 is primarily driven by a $176 thousand gain on payoff of a purchased impaired loan.
December 31, 2015 compared to December 31, 2014
Noninterest income in 2015 was $3.2 million, a decrease of $1.1 million or 26%, compared to 2014.
Gains on the sale of investment securities increased by $602 thousand, to a gain of $443 thousand for the year ended December 31, 2015, compared to losses of $159 thousand for the year ended 2014. During 2015, we purchased 52 securities with weighted average yields of 2.30%. During the same period we sold 61 securities with weighted average yields 2.49%.
During 2014 we recorded $1.6 million in hedge gains and gain on extinguishment of debt of $406 thousand in other noninterest income. See Note 21 Derivatives in the Notes to Consolidated Financial Statements in this document for additional information on our derivatives
Noninterest Expense
The following table presents the key elements of noninterest expense for the years ended December 31, 2017, 2016 2015 and 2014.2015.
Years Ended December 31, | Years Ended December 31, | |||||||||||||||||||||||||||||||||||||||||||||||||||||||||||||||
2016 Compared to 2015 | 2015 Compared to 2014 | 2017 Compared to 2016 | 2016 Compared to 2015 | |||||||||||||||||||||||||||||||||||||||||||||||||||||||||||||
Change | Change | Change | Change | Change | Change | Change | Change | |||||||||||||||||||||||||||||||||||||||||||||||||||||||||
(Amounts in thousands) | 2016 | 2015 | Amount | Percent | 2015 | 2014 | Amount | Percent | 2017 | 2016 | Amount | Percent | 2016 | 2015 | Amount | Percent | ||||||||||||||||||||||||||||||||||||||||||||||||
Noninterest expense: | ||||||||||||||||||||||||||||||||||||||||||||||||||||||||||||||||
Salaries & related benefits | $ | 16,425 | $ | 14,303 | $ | 2,122 | 15 | % | $ | 14,303 | $ | 14,965 | $ | (662 | ) | (4 | )% | $ | 17,819 | $ | 16,425 | $ | 1,394 | 8 | % | $ | 16,425 | $ | 14,303 | $ | 2,122 | 15 | % | |||||||||||||||||||||||||||||||
Premises & equipment | 3,869 | 2,894 | 975 | 34 | % | 2,894 | 2,784 | 110 | 4 | % | 4,242 | 3,869 | 373 | 10 | % | 3,869 | 2,894 | 975 | 34 | % | ||||||||||||||||||||||||||||||||||||||||||||
Federal Deposit Insurance Corporation insurance premium | 615 | 717 | (102 | ) | (14 | )% | 717 | 798 | (81 | ) | (10 | )% | 318 | 615 | (297 | ) | (48 | %) | 615 | 717 | (102 | ) | (14 | %) | ||||||||||||||||||||||||||||||||||||||||
Data processing fees | 1,675 | 1,016 | 659 | 65 | % | 1,016 | 926 | 90 | 10 | % | 1,749 | 1,675 | 74 | 4 | % | 1,675 | 1,016 | 659 | 65 | % | ||||||||||||||||||||||||||||||||||||||||||||
Professional service fees | 1,690 | 1,628 | 62 | 4 | % | 1,628 | 1,398 | 230 | 16 | % | 1,398 | 1,690 | (292 | ) | (17 | %) | 1,690 | 1,628 | 62 | 4 | % | |||||||||||||||||||||||||||||||||||||||||||
Telecommunications | 751 | 449 | 302 | 67 | % | 449 | 372 | 77 | 21 | % | 879 | 751 | 128 | 17 | % | 751 | 449 | 302 | 67 | % | ||||||||||||||||||||||||||||||||||||||||||||
Branch acquisition costs | 580 | 347 | 233 | 67 | % | 347 | — | 347 | 100 | % | — | 580 | (580 | ) | (100 | %) | 580 | 347 | 233 | 67 | % | |||||||||||||||||||||||||||||||||||||||||||
Loss on cancellation of interest rate swap | 2,325 | — | 2,325 | 100 | % | — | — | — | — | % | — | 2,325 | (2,325 | ) | (100 | %) | 2,325 | — | 2,325 | 100 | % | |||||||||||||||||||||||||||||||||||||||||||
Other | 4,679 | 3,551 | 1,128 | 32 | % | 3,551 | 5,191 | (1,640 | ) | (32 | )% | 4,559 | 4,570 | (11 | ) | (0 | %) | 4,570 | 3,551 | 1,019 | 29 | % | ||||||||||||||||||||||||||||||||||||||||||
Total noninterest expense | $ | 32,609 | $ | 24,905 | $ | 7,704 | 31 | % | $ | 24,905 | $ | 26,434 | $ | (1,529 | ) | (6 | )% | $ | 30,964 | $ | 32,500 | $ | (1,536 | ) | (5 | %) | $ | 32,500 | $ | 24,905 | $ | 7,595 | 30 | % | ||||||||||||||||||||||||||||||
For the Year Ended December 31, 2017 Compared to the Year Ended December 31, 2016
Noninterest expense for the year ended December 31, 2017 was $31.0 million, a decrease of $1.5 million or 5% compared to 2016.
For the year ended December 31, 2017 compared to the same period a year ago:
| ● | Expenses associated with our branch acquisition ($580 thousand) in 2016 and cancellation of our interest rate swap ($2.3 million) in 2016 did not recur. |
● | Salaries and occupancy costs increased $1.8 million including $438 thousand directly related to the branch and offsite ATM locations acquired late in the first quarter of 2016. |
● | During 2017 a $208 thousand software development project was terminated and written off. |
BANK OF COMMERCE HOLDINGS & SUBSIDIARIES
For the Year Ended December 31, 2016 comparedCompared to the Year Ended December 31, 2015
Noninterest expense for the year ended December 31, 2016 was $32.6 million, an increase of $7.7 million or 31% compared to 2015.
For the year ended December 31, 2016 compared to the prior year:year ended December 31, 2015:
● | Noninterest expenses for 2016 | ||
|
| ||
|
| ||
|
|
● | Salaries and related benefits increased $2.1 million including the following |
o | $823 thousand due to increased group insurance costs and investment in our Sacramento marketplace commercial banking group. |
o | $1.3 million in costs directly related to the newly acquired branch locations. |
● | Increased costs related to the acquired branches also contributed to the following: |
o | Premise and equipment expense increased $975 thousand. |
o | Data processing fees increased $659 thousand. |
o | Telecommunications expense increased $302 thousand. |
o | ATM processing fees increased |
The major components of other noninterest expense are stationary and supplies, directors’directors’ fees, advertising and promotion, amortization of core deposit intangible. Other noninterest expense for the year ended December 31, 2016 was $4.7$4.6 million, an increase of $1.1$1.0 million, compared to the same period a year previous.
December 31, 2015 compared to December 31, 2014in 2015.
Salaries and related benefits expense for the year ended December 31, 2015 were $14.3 million, a decrease of $662 thousand or 4% compared to the year ended December 31, 2014. The decrease is primarily due to severance costs associated with the retirement of a former executive recorded in the fourth quarter of 2014 and the recording of increased deferred loan origination costs in the current year.
Professional service fees for the year ended December 31, 2015 were $1.6 million, an increase of $230 thousand or 16% compared to the same period a year previous. Increases in professional service fees for 2015 compared to 2014 were primarily driven by increased usage of outside services.
Branch Acquisition costs of $347 thousand were recognized during 2015. The branch acquisition costs included $200 thousand paid for investment banking advisory services.
Other noninterest expense for the year ended December 31, 2015 was $3.6 million, a decrease of $1.6 million, compared to the same period a year previous. During 2014, we negotiated the settlement of a note receivable from our former mortgage subsidiary which resulted in a loss of $1.4 million.
Income Taxes
Our provision for income taxes includes both federal and state income taxes and reflects the application of federal and state statutory rates to our income before taxes. The following table reflects our tax provision and the related effective tax rate for the periods indicated.indicated.
Years Ended December 31, | Years Ended December 31, | |||||||||||||||||||||||
(Amounts in thousands) | 2016 | 2015 | 2014 | 2017 | 2016 | 2015 | ||||||||||||||||||
Income before provision for income taxes | $ | 14,272 | $ | 7,217 | $ | 12,048 | ||||||||||||||||||
Provision for income taxes | $ | 1,958 | $ | 3,462 | $ | 1,580 | $ | 6,928 | $ | 1,958 | $ | 3,462 | ||||||||||||
Effective tax rate | 27.13 | % | 28.74 | % | 21.62 | % | 48.54 | % | 27.13 | % | 28.74 | % | ||||||||||||
BANK OF COMMERCE HOLDINGS & SUBSIDIARIES
The effective tax rates differed from the federal statutory rate of 34% and the state rate of 10.84% principally because of the deferred tax asset write down, non-taxable income arising from bank-owned life insurance, income on tax-exempt investment securities, and tax credits arising from investments in Low Income Housing Tax Credit partnerships. For the year ended December 31, 2017, the effective tax rate was impacted by the $2.5 million deferred tax asset write down recognized as a result of the Tax Cuts and Jobs Act of 2017(“Act”). The Act reduced the federal corporate tax rate prospectively from a graduated rate of 35% to a flat rate of 21% and required the Company to revalue its deferred tax assets and liabilities.
DuringManagement believes that the following table, which is a non-GAAP presentation, provides a helpful disclosure and comparison of our effective tax rates for the periods presented.
Years Ended December 31, | ||||||||||||
(Amounts in thousands) | 2017 | 2016 | 2015 | |||||||||
Income before provision for income taxes (GAAP) | $ | 14,272 | $ | 7,217 | $ | 12,048 | ||||||
Life insurance death benefit - not taxable (non-GAAP) | (502 | ) | — | — | ||||||||
Income before provision for income taxes excluding life insurance death benefit (non-GAAP) | $ | 13,770 | $ | 7,217 | $ | 12,048 | ||||||
Provision for income taxes (GAAP) | $ | 6,928 | $ | 1,958 | $ | 3,462 | ||||||
Deferred tax asset write-down (GAAP) | (2,490 | ) | (363 | ) | — | |||||||
Provision for income taxes - excluding DTA write-down (non-GAAP) | $ | 4,438 | $ | 1,595 | $ | 3,462 | ||||||
Effective tax rate - excluding life insurance death benefit and DTA write-down (non-GAAP) | 32.23 | % | 22.10 | % | 28.74 | % | ||||||
Effective tax rate (GAAP) | 48.54 | % | 27.13 | % | 28.74 | % | ||||||
As shown in the non-GAAP table above, the Company’s effective tax rate on the taxable income excluding the life insurance death benefit and the DTA write-down is approximately 32.23%, 22.10% and 28.74% for the years ended December 31, 2017, 2016 and 2015, respectively. The changes have occurred as permanent deductions remain essentially unchanged in amount from year to year, but compromise a significantly smaller or larger percentage of pre-tax income.
See Note 23 Income Taxes in the Notes to Consolidated Financial Statements for further details regarding our provision for income taxes and the differences between the federal statutory rate and the actual effective rate.
Amended Tax Returns
In September of 2016, we filed amended federal and state tax returns for fiscaltax years 2014,2011, 2012, 2013, 2012 and 2014. The amendments were filed to properly recognize tax events in years 2011 and wrote off a deferred tax asset. The net effect from filing2013, that were improperly recognized in years 2011 through 2014. The IRS rejected the 2011 amended tax returns andreturn citing the reversalstatute for assessment had expired. Accordingly, $988 thousand of taxes due to the taxing authorities pursuant to the 2011 amended federal tax return was returned to us. As of December 31, 2017 we continue to recognize 100% of the deferred tax asset resultedliability relating to our 2011 amended federal tax return because we believe it is more likely than not, our tax position would be sustained upon reexamination by the IRS or through the litigation process. We do not expect to reconsider or reverse our tax position until the statute of limitations expires on the 2014 amended federal tax return in $407September of 2018, and until we believe it is more likely than not that the taxes due cannot be recouped. If we reverse our tax position, we will recognize the $988 thousand of additionalin our provision for income tax expense. Despite the increased income tax expense recognized from filing our amended returnstaxes and writing off the deferred tax asset, our effective tax rate decreased in 2016 compared to 2015. During 2016 our pre-tax income decreased while our anticipated tax credits and our tax exempt income remained consistent with amounts recorded in 2015, resulting in a decreased effective tax rate.will be reduced.
BANK OF COMMERCE HOLDINGS & SUBSIDIARIES
While pre-tax income increased during 2015 compared to 2014, our anticipated tax credits (from qualified low income housing investments) and tax exempt income (from municipal bonds and BOLI) did not increase. As these items comprised a decreased percentage of pre-tax income, our income tax provision as a percent of pre-tax income increased.
See Note 2423 Income Taxesin theNotes to Consolidated Financial Statements for further details regarding our provision for income taxes and the differences between the federal statutory rate and the actual effective rate.
BANK OF COMMERCE HOLDINGS & SUBSIDIARIES
FINANCIAL CONDITION
Consolidated Balance SheetSheets
As of December 31, 2016,2017, we had total consolidated assets of $1.1$1.3 billion, gross loans of $804.2$879.8 million, allowance for loan and lease losses (“ALLL”) of $11.5$11.9 million, total deposits of $1.0$1.1 billion, and shareholders’shareholders’ equity of $94.1$127.3 million.
We continued to maintain a strong liquidity position during the reporting period. As of December 31, 2016,2017, we maintained noninterest-bearing cash positions at the Federal Reserve Bank and correspondent banks in the amount of $16.4$18.0 million. We also held interest-bearing deposits in the amount of $52.0$49.0 million.
Available-for-sale investment securities totaled $268.0 million at December 31, 2017, compared with $175.2 million at December 31, 2016, compared with $159.02016. Held-to-maturity securities totaling $31.2 million at December 31, 2015.2016 were transferred to available-for-sale during 2017. Our available-for-sale investment portfolio provides a secondary source of liquidity to fund other higher yielding asset opportunities, such as loan originations and wholesale loan purchases.
During 2016,2017, we purchased 70 100 securities with a par value of $99.1$146.3 million and weighted average yield of 2.12%2.58% and sold 4360 securities with a par value of $48.5$61.9 million and weighted average yield of 2.61%2.10%. The sales and call activity on available-for-sale securities and calls on two held to maturity securities resulted in $244$137 thousand in net realized gains for the year ended December 31, 2016.2017. During 20162017 we also received $31.7 million and $5.0$24.7 million in proceeds from principal payments, calls and maturities within the available-for-sale and held-to-maturity investment securities portfolios, respectively.portfolio.
At December 31, 2016,2017, our net unrealized losses on available-for-sale securities were $1.3 million$452 thousand compared with $1.6$1.3 million net unrealized gainslosses at December 31, 2015.2016. The decreasechanges in the net unrealized gains compared tolosses on the prior year isinvestment securities portfolio are primarily due to significantchanges in market interest rate changesrates and the reclassification of all held-to-maturity securities to available-for-sale during the year.fourth quarter of 2017.
We recorded gross loan balances of $879.8 million at December 31, 2017, compared with $804.2 million at December 31, 2016, compared with $716.6 million at December 31, 2015, an increase of $87.6$75.6 million. The increase in gross loans duringoccurred primarily in the year ended December 31, 2016 was driven by strong organic loan originations in ourBank’s Sacramento marketplace and is the result of investments in our SBA division and in our expanded Sacramento commercial banking group.
The ALLL at December 31, 20162017 increased $364$569 thousand to $11.5$11.9 million compared to $11.2$11.5 million at December 31, 2015. During2016. A combination of loan portfolio growth and net loan losses supported management’s decision to record a $950 thousand provision for loan and lease losses during the yearsyear ended December 31, 2017. During the year ended December 31, 2016, and 2015, there were no provisions for loan and lease losses. Net recoveriesloan charge-offs were $364$569 thousand during the year ended December 31, 2016,2017, compared with net recoveries of $360$364 thousand during the prior year. At December 31, 2016,2017, relying on our ALLL methodology, which uses criteria such as risk weightingfactors and historical loss rates, and given the ongoing improvements in asset quality, we believe the ALLL is adequate. There is, however, no assurance that future loan and lease losses will not exceed the levels provided for in the ALLL and could possibly result in additional charges to the provision for loan and lease losses.
Nonperforming loans, which include nonaccrual loans and accruing loans past due over 90 days, decreased by $2.7$5.6 million to $5.8 million, or 0.66% of gross loans, as of December 31, 2017, compared to $11.4 million, or 1.42% of gross loans as of December 31, 2016, compared 2016. The decrease in nonperforming loans was primarily due to $14.1 million, or 1.97% of gross loans as of December 31, 2015. repayments from three relationships and one commercial loan that was moved back to accrual status.
Past due loans as of December 31, 20162017 decreased to $2.3 million, compared to $4.6 million compared to $11.2 million as of December 31, 2015.2016. The decrease in past due loans was primarily occurred indue to the repayment of a nonaccrual commercial real estate loan portfolio.for $1.2 million and the transfer of a nonaccrual residential real estate loan to OREO for $803 thousand. We believe that risk grading for past due and nonperforming loans appropriately reflects the risk associated with the past due loans. See Note 5Loans in theNotes to Consolidated Financial Statements in this document for further detail on the ALLL and the loan portfolio.
Premises and equipment totaled $14.7 million at December 31, 2017, a decrease of $1.5 million compared to $16.2 million at December 31, 2016, an increase of $5.2 million compared to $11.1 million at December 31, 2015.2016. The increase in premises and equipment isdecrease was primarily due to provision for depreciation and amortization recognized during the recent branch acquisition, which includes a $2.4 million positive fair value adjustment on the purchased properties.current year.
Our OREO balance at December 31, 20162017 was $759$35 thousand compared to $1.4 million$759 thousand at December 31, 2015.2016. For the year ended December 31, 2016,2017, we transferred threeseven foreclosed properties in the amount of $147$981 thousand to OREO and capitalized $42$90 thousand in costs for properties already in OREO. During 20162017, we sold nineeleven properties with balances of $745 thousand$1.7 million for a net lossgain of $109 thousand.$368 thousand and recognized a write-down of $52 thousand on one OREO property. See Note 8,Other Real Estate Owned in theNotes to Consolidated Financial Statements in this document, for further details relating to our OREO portfolio. We remain committed to working with customers who are experiencing financial difficulties to find potential solutions.
Bank-owned life insurance increased $613 thousanddecreased $1.2 million during the year ended December 31, 20162017 to $23.1$21.9 million compared to $22.5$23.1 million at December 31, 2015. 2016. During the first quarter of 2017, we received $2.2 million from life insurance death benefit proceeds, of which $502 thousand was recorded in noninterest income.
Our net deferred tax assets were $6.5 million at December 31, 2017 compared to $9.5 million at December 31, 2016 compared to $9.8 million at December 31, 2015. As part of the branch acquisition,2016. During 2017 we recorded a core deposit intangible$2.5 million write-down of $1.8 millionour deferred tax asset when we revalued our deferred tax assets and goodwillliabilities to account for the future impact of $665 thousand. lower corporate tax rates resulting from the Tax Cuts and Jobs Act enacted on December 22, 2017.
Other assets which include the Bank’sBank’s investment in low income housing tax credit partnerships and investment inqualified zone academy bonds, Federal Home Loan Bank of San Francisco stock and low income housing tax credit partnerships totaled $19.7 million at December 31, 2017 compared to $20.4 million at December 31, 2016 compared to $18.3 million at December 31, 2015.
BANK OF COMMERCE HOLDINGS & SUBSIDIARIES2016.
Total deposits at December 31, 2016,2017, increased $200.9$98.1 million or 25%10% to $1.0$1.1 billion compared December 31, 2015. Total2016. During 2017, total non-maturing deposits increased $209.6$124.2 million or 36%16% and Certificates of deposit decreased $26.1 million or 12% compared to December 31, 2015. Certificates of deposit decreased $8.7 million or 4% compared to December 31, 2015. During the first quarter of 2016, the branch acquisition provided an additional $149.0 million of deposits and we called and redeemed $17.5 million of brokered certificates of deposit. At December 31, 2016, the deposits in the acquired branches totaled $145.6 million.
During the first quarter of 2016, we paid off $75.0 million of Federal Home Loan Bank of San Francisco hedged term debt and terminated the interest rate hedge associated with that debt eliminating future contractual interest payments on $75.0 million at 2.64% for the period from payoff to August 1, 2016; and at 3.22% for the period August 1, 2016 to August 1, 2017.2016.
Other liabilities which include the Bank’sBank’s supplemental executive retirement plan and funding obligation for investments in qualified affordable housing partnerships decreased $3.0$1.0 million to $13.2$12.2 million as of December 31, 20162017 compared to $16.2$13.2 million at December 31, 2015. The decrease in other liabilities is primarily caused by a $2.3 million decrease related to the termination2016.
BANK OF COMMERCE HOLDINGS & SUBSIDIARIES
Investment SecuritiesSecurities
The composition of our investment securities portfolio reflects management’smanagement’s investment strategy of maintaining an appropriate level of liquidity while providing a relatively stable source of interest income.
The investment securities portfolio also:
● | Mitigates interest rate risk; |
● | Mitigates a portion of credit risk inherent in the loan portfolio; |
● | Provides a vehicle for the investment of excess liquidity; |
● | Provides a source of liquidity when pledged as collateral for lines of credit; |
● |
|
Available-for-saleOur available-for-sale investment securities totaled $268.0 million at December 31, 2017, compared to $175.2 million at December 31, 2016, compared to $159.0 million at December 31, 2015.2016. During the 2016 a portion of the excess cash from the Bank of America branch acquisition and core deposit growth was used to fund loan growth and the purchase of moderate term available-for-sale securities.
Our held-to-maturity investment portfolio is generally utilized to hold longer term securities that may have greater price risk many of which are pledged as collateral for our local agency deposit program. This portfolio includes securities with longer durations and higher coupons than securities held in the available-for-sale securities portfolio. Held-to-maturity investment securities had amortized costs of $31.2 million at December, 2016, compared to $35.9 million at December 31, 2015. There were no held-to-maturity securities sold or purchased during the year ended December 31, 2016. There2017, we deployed liquidity provided by strong core deposit growth into organic loan originations, interest bearing deposits at other banks and purchase of available for sale securities.
During the fourth quarter, we reclassified the entire HTM securities portfolio to AFS. At the date of the reclassification the HTM securities portfolio was $4.9 million in bookcarried at an amortized cost of $30.3 million. The reclassification of securities between categories was accounted for at fair value. At the date of the reclassification, the securities had a fair value of $31.4 million and unrealized holding gains of $1.2 million which were recorded in other comprehensive income. We reclassified the held-to-maturity securities called duringportfolio to available-for-sale to provide increased flexibility to support the year ended December 31, 2016.
BANK OF COMMERCE HOLDINGS & SUBSIDIARIESopportunities to improve the overall structure and yield of the investment portfolio. As a result of this transfer we are precluded from classifying any investment securities as held-to-maturity for two years from the date of the transfer.
The following table presents the carrying value of the investment securities portfolio by classification and major type as of December 31, for each of the last three years.
(Amounts in thousands) | 2016 | 2015 | 2014 | 2017 | 2016 | 2015 | ||||||||||||||||||
Available-for-sale securities: (1) | ||||||||||||||||||||||||
U.S. government & agencies | $ | — | $ | 3,943 | $ | 6,393 | $ | 40,369 | $ | 10,354 | $ | 10,668 | ||||||||||||
Obligations of state and political subdivisions | 59,428 | 61,104 | 54,363 | 78,844 | 59,428 | 61,104 | ||||||||||||||||||
Mortgage backed securities and collateralized mortgage obligations | 69,604 | 32,137 | 47,015 | |||||||||||||||||||||
Residential mortgage-backed securities and collateralized mortgage obligations | 114,592 | 69,604 | 32,137 | |||||||||||||||||||||
Corporate securities | 16,116 | 33,778 | 37,734 | 4,992 | 16,116 | 33,778 | ||||||||||||||||||
Commercial mortgage backed securities | 15,514 | 12,769 | 10,389 | |||||||||||||||||||||
Other asset backed securities | 14,512 | 15,299 | 31,092 | |||||||||||||||||||||
Commercial mortgage-backed securities | 26,641 | 15,514 | 12,768 | |||||||||||||||||||||
Other asset-backed securities | 2,516 | 4,158 | 8,575 | |||||||||||||||||||||
Total | $ | 175,174 | $ | 159,030 | $ | 186,986 | $ | 267,954 | $ | 175,174 | $ | 159,030 | ||||||||||||
Held-to-maturity securities: (1) | ||||||||||||||||||||||||
Obligations of state and political subdivisions | $ | 31,187 | $ | 35,899 | $ | 36,806 | $ | — | $ | 31,187 | $ | 35,899 | ||||||||||||
(1) Available-for-sale securities are reported at fair value, and held-to-maturity securities are reported at amortized cost. |
The following table presents information regarding the amortized cost, and maturity structure of the investment portfolio at December 31, 2016.2017.
Over One Through | Over Five Through | Over One Through | Over Five Through | |||||||||||||||||||||||||||||||||||||||||||||||||||||||||||||||||||||||||||||
Within One Year | Five Years | Ten Years | Over Ten Years | Total | Within One Year | Five Years | Ten Years | Over Ten Years | Total | |||||||||||||||||||||||||||||||||||||||||||||||||||||||||||||||||||||||
(Amounts in thousands) | Amount | Yield | Amount | Yield | Amount | Yield | Amount | Yield | Amount | Yield | Amount | Yield | Amount | Yield | Amount | Yield | Amount | Yield | Amount | Yield | ||||||||||||||||||||||||||||||||||||||||||||||||||||||||||||
Available-for-sale securities: |
| |||||||||||||||||||||||||||||||||||||||||||||||||||||||||||||||||||||||||||||||
U.S. government & agencies | $ | — | — | % | $ | — | — | % | $ | 3,871 | 2.13 | % | $ | 36,448 | 2.33 | % | $ | 40,319 | 2.31 | % | ||||||||||||||||||||||||||||||||||||||||||||||||||||||||||||
Obligations of state and political subdivisions | $ | 828 | 2.93 | % | $ | 5,270 | 2.56 | % | $ | 24,561 | 2.81 | % | $ | 28,188 | 2.48 | % | $ | 58,847 | 2.63 | % | 296 | 2.99 | % | 16,121 | 3.29 | % | 28,521 | 3.02 | % | 32,474 | 2.88 | % | 77,412 | 3.02 | % | |||||||||||||||||||||||||||||||||||||||||||||
Mortgage backed securities and collateralized mortgage obligations | 799 | 0.14 | % | 53,834 | 2.04 | % | 16,284 | 2.83 | % | 151 | 3.98 | % | 71,068 | 2.20 | % | |||||||||||||||||||||||||||||||||||||||||||||||||||||||||||||||||
Residential mortgage-backed securities and collateralized mortgage obligations | 126 | 3.77 | % | 68,691 | 2.42 | % | 45,237 | 2.81 | % | 2,007 | 2.55 | % | 116,061 | 2.58 | % | |||||||||||||||||||||||||||||||||||||||||||||||||||||||||||||||||
Corporate securities | 3,009 | 1.19 | % | 9,460 | 2.83 | % | 1,000 | 2.00 | % | 2,684 | 2.65 | % | 16,153 | 2.45 | % | 1,003 | 1.74 | % | 3,076 | 3.42 | % | 1,000 | 2.00 | % | — | — | % | 5,079 | 2.81 | % | ||||||||||||||||||||||||||||||||||||||||||||||||||
Commercial mortgage backed securities | — | — | % | 1,130 | 1.27 | % | 1,406 | 1.65 | % | 13,250 | 2.49 | % | 15,786 | 2.33 | % | |||||||||||||||||||||||||||||||||||||||||||||||||||||||||||||||||
Other asset backed securities | — | — | % | — | — | % | 99 | 3.04 | % | 14,565 | 2.34 | % | 14,664 | 2.35 | % | |||||||||||||||||||||||||||||||||||||||||||||||||||||||||||||||||
Commercial mortgage-backed securities | — | — | % | — | — | % | 4,821 | 2.21 | % | 22,174 | 2.49 | % | 26,995 | 2.44 | % | |||||||||||||||||||||||||||||||||||||||||||||||||||||||||||||||||
Other asset-backed securities | — | — | % | — | — | % | — | — | % | 2,540 | 2.24 | % | 2,540 | 2.24 | % | |||||||||||||||||||||||||||||||||||||||||||||||||||||||||||||||||
Total | $ | 4,636 | 1.32 | % | $ | 69,694 | 2.18 | % | $ | 43,350 | 2.76 | % | $ | 58,838 | 2.46 | % | $ | 176,518 | 2.39 | % | $ | 1,425 | 2.18 | % | $ | 87,888 | 2.61 | % | $ | 83,450 | 2.81 | % | $ | 95,643 | 2.55 | % | $ | 268,406 | 2.65 | % | ||||||||||||||||||||||||||||||||||||||||
Held-to-maturity securities: |
|
|
|
|
| |||||||||||||||||||||||||||||||||||||||||||||||||||||||||||||||||||||||||||
Obligations of state and political subdivisions | $ | — | — | % | $ | 4,604 | 3.27 | % | $ | 13,469 | 2.91 | % | $ | 13,114 | 3.38 | % | $ | 31,187 | 3.16 | % | ||||||||||||||||||||||||||||||||||||||||||||||||||||||||||||
BANK OF COMMERCE HOLDINGS & SUBSIDIARIES
The maturities for the collateralized mortgage obligations and mortgage backed securities are presented by expected average life, rather than contractual maturity. The yield on tax-exempt securities has not been adjusted to a tax-equivalent yield basis.Loan Portfolio
Loan Concentrations
Historically, we have concentrated our loan origination activities primarily within El Dorado, Placer, Sacramento, and Shasta counties in California. In recent years, our loan origination activity has expanded to include other portions of California and northern Nevada. We manage our credit risk through various diversifications of our loan portfolio, the application of sound underwriting policies and procedures, and ongoing credit monitoring practices. Generally, the loans are secured by real estate or other assets located in California. Repayment is expected from the borrower’sborrower’s cash flows or cash flows from real estate investments.
BANK OF COMMERCE HOLDINGS & SUBSIDIARIES
The following table presentspresents the composition of the loan portfolio as of December 31 for each of the last five years.
(Amounts in thousands) | As of December 31, | As of December 31, | ||||||||||||||||||||||||||||||||||||||||||||||||||||||||||||||||||||||||||||||
Loan Portfolio | 2016 | % | 2015 | % | 2014 | % | 2013 | % | 2012 | % | 2017 | % | 2016 | % | 2015 | % | 2014 | % | 2013 | % | ||||||||||||||||||||||||||||||||||||||||||||||||||||||||||||
Commercial | $ | 153,844 | 19 | % | $ | 132,805 | 19 | % | $ | 150,253 | 23 | % | $ | 170,429 | 29 | % | $ | 232,276 | 34 | % | $ | 149,088 | 17 | % | $ | 153,844 | 19 | % | $ | 132,805 | 19 | % | $ | 150,253 | 23 | % | $ | 170,264 | 28 | % | ||||||||||||||||||||||||||||||||||||||||
Commercial real estate: | ||||||||||||||||||||||||||||||||||||||||||||||||||||||||||||||||||||||||||||||||
Real estate – construction and land development | 57,771 | 7 | % | 28,319 | 4 | % | 30,099 | 5 | % | 18,545 | 3 | % | 16,863 | 3 | % | 15,902 | 2 | % | 36,792 | 5 | % | 28,319 | 4 | % | 30,099 | 5 | % | 18,545 | 3 | % | ||||||||||||||||||||||||||||||||||||||||||||||||||
Real estate – commercial non-owner occupied | 287,455 | 36 | % | 243,374 | 33 | % | 213,883 | 32 | % | 200,315 | 33 | % | 206,046 | 31 | % | 377,668 | 43 | % | 292,615 | 36 | % | 228,174 | 31 | % | 195,563 | 30 | % | 171,138 | 29 | % | ||||||||||||||||||||||||||||||||||||||||||||||||||
Real estate – commercial owner occupied | 151,516 | 19 | % | 156,299 | 22 | % | 120,324 | 18 | % | 89,045 | 15 | % | 80,357 | 12 | % | 185,340 | 21 | % | 167,335 | 21 | % | 171,499 | 24 | % | 138,644 | 20 | % | 118,387 | 20 | % | ||||||||||||||||||||||||||||||||||||||||||||||||||
Residential real estate: | ||||||||||||||||||||||||||||||||||||||||||||||||||||||||||||||||||||||||||||||||
Real estate – residential - ITIN | 45,566 | 6 | % | 49,106 | 7 | % | 52,830 | 8 | % | 56,101 | 9 | % | 60,105 | 9 | % | 41,188 | 5 | % | 45,566 | 6 | % | 49,106 | 7 | % | 52,830 | 8 | % | 56,101 | 9 | % | ||||||||||||||||||||||||||||||||||||||||||||||||||
Real estate – residential - 1-4 family mortgage | 12,866 | 2 | % | 13,640 | 2 | % | 13,156 | 2 | % | 14,590 | 2 | % | 18,452 | 3 | % | 30,377 | 3 | % | 20,425 | 3 | % | 17,268 | 2 | % | 14,183 | 2 | % | 15,676 | 3 | % | ||||||||||||||||||||||||||||||||||||||||||||||||||
Real estate – residential - equity lines | 43,512 | 5 | % | 43,223 | 6 | % | 44,981 | 7 | % | 45,462 | 8 | % | 45,181 | 7 | % | 30,347 | 3 | % | 35,953 | 4 | % | 39,595 | 6 | % | 43,954 | 7 | % | 44,376 | 7 | % | ||||||||||||||||||||||||||||||||||||||||||||||||||
Consumer and other | 51,681 | 6 | % | 49,873 | 7 | % | 35,372 | 5 | % | 3,508 | 1 | % | 4,771 | 1 | % | 49,925 | 6 | % | 51,681 | 6 | % | 49,873 | 7 | % | 35,372 | 5 | % | 3,508 | 1 | % | ||||||||||||||||||||||||||||||||||||||||||||||||||
Gross loans | 804,211 | 100 | % | 716,639 | 100 | % | 660,898 | 100 | % | 597,995 | 100 | % | 664,051 | 100 | % | 879,835 | 100 | % | 804,211 | 100 | % | 716,639 | 100 | % | 660,898 | 100 | % | 597,995 | 100 | % | ||||||||||||||||||||||||||||||||||||||||||||||||||
Deferred loan fees, net | 1,324 | 870 | 157 | 303 | 312 | |||||||||||||||||||||||||||||||||||||||||||||||||||||||||||||||||||||||||||
Deferred fees and costs | 1,710 | 1,324 | 870 | 157 | 303 | |||||||||||||||||||||||||||||||||||||||||||||||||||||||||||||||||||||||||||
Loans, net of deferred fees and costs | 805,535 | 717,509 | 661,055 | 598,298 | 664,363 | 881,545 | 805,535 | 717,509 | 661,055 | 598,298 | ||||||||||||||||||||||||||||||||||||||||||||||||||||||||||||||||||||||
Allowance for loan and lease losses | (11,544 | ) | (11,180 | ) | (10,820 | ) | (14,172 | ) | (11,103 | ) | (11,925 | ) | (11,544 | ) | (11,180 | ) | (10,820 | ) | (14,172 | ) | ||||||||||||||||||||||||||||||||||||||||||||||||||||||||||||
Net loans | $ | 793,991 | $ | 706,329 | $ | 650,235 | $ | 584,126 | $ | 653,260 | $ | 869,620 | $ | 793,991 | $ | 706,329 | $ | 650,235 | $ | 584,126 | ||||||||||||||||||||||||||||||||||||||||||||||||||||||||||||
BANK OF COMMERCE HOLDINGS & SUBSIDIARIES
The following table sets forth the maturity and interest rate sensitivityre-pricing distribution of our gross loans outstanding as of December 31, 2016,2017, which, based on remaining scheduled repayments of principal, wereare due within the periods indicated.
After One | After One | |||||||||||||||||||||||||||||||
Within One | Through | After Five | Within One | Through | After Five | |||||||||||||||||||||||||||
(Amounts in thousands) | Year | Five Years | Years | Total | Year | Five Years | Years | Total | ||||||||||||||||||||||||
Commercial | $ | 50,939 | $ | 47,980 | $ | 54,925 | $ | 153,844 | $ | 52,480 | $ | 44,205 | $ | 52,403 | $ | 149,088 | ||||||||||||||||
Commercial real estate: | ||||||||||||||||||||||||||||||||
Real estate - construction and land development | 6,600 | 25,539 | 25,632 | 57,771 | 4,601 | 6,795 | 4,506 | 15,902 | ||||||||||||||||||||||||
Real estate - commercial non-owner occupied | 3,350 | 30,004 | 254,101 | 287,455 | 8,259 | 60,092 | 309,317 | 377,668 | ||||||||||||||||||||||||
Real estate - commercial owner occupied | 3,713 | 17,558 | 130,245 | 151,516 | 10,241 | 15,922 | 159,177 | 185,340 | ||||||||||||||||||||||||
Residential real estate: | ||||||||||||||||||||||||||||||||
Real estate - residential - ITIN | — | — | 45,566 | 45,566 | — | — | 41,188 | 41,188 | ||||||||||||||||||||||||
Real estate - residential - 1-4 family mortgage | 560 | 2,115 | 10,191 | 12,866 | 103 | 3,068 | 27,206 | 30,377 | ||||||||||||||||||||||||
Real estate - residential - equity lines | 743 | 5,598 | 37,171 | 43,512 | 46 | 3,904 | 26,397 | 30,347 | ||||||||||||||||||||||||
Consumer and other | 48,024 | 904 | 2,753 | 51,681 | 832 | 47,070 | 2,023 | 49,925 | ||||||||||||||||||||||||
Gross loans | $ | 113,929 | $ | 129,698 | $ | 560,584 | $ | 804,211 | $ | 76,562 | $ | 181,056 | $ | 622,217 | $ | 879,835 | ||||||||||||||||
Loans due after one year with: | ||||||||||||||||||||||||||||||||
Fixed rates | $ | 60,115 | 177,128 | 237,243 | $ | 114,092 | 193,531 | 307,623 | ||||||||||||||||||||||||
Variable rates | 69,583 | 383,456 | 453,039 | 66,964 | 428,686 | 495,650 | ||||||||||||||||||||||||||
Total | $ | 129,698 | $ | 560,584 | $ | 690,282 | $ | 181,056 | $ | 622,217 | $ | 803,273 | ||||||||||||||||||||
Loans with unique credit characteristics
In April of 2009, we completed a loan ‘swap’ transaction, which included the purchase ofWe own a pool of Individual Tax Identification Number (“ITIN”) residential mortgage loans. The ITIN loans are geographically disbursed throughout the United States and are made to legal United States residents who do not possess a social security number, and are geographically dispersed throughout the United States.number. The ITIN loan portfolio is serviced throughby a third parties.party. The majority of the ITIN loans are variable rate loans and may have an increased default risk in a rising rate environment. Worsening economic conditions in the United States may cause us to suffer higher default rates on our ITIN loans and reduce the value of the assets that we hold as collateral. In addition, if we are forced to foreclose and servicebecome responsible for servicing of these ITIN properties ourselves,loans, then we may realize additional monitoring, servicing and appraisal costs due to the geographic disbursement of the portfolio which will adversely affect our noninterest expense.
Purchased Loans
In addition to loans we have originated, the loan portfolio includes purchased loan pools and purchased participations. Purchased loans are recorded at their fair value at the acquisition date. Credit discounts are included in the determination of fair value; therefore, an ALLL is not recorded at the acquisition date. Additional information regarding the individual purchased loan pools can be found in Note 6Purchase of Financial Assets in theNotes to Consolidated Financial Statements in this document.
The following table presents the recorded investment in purchased loans at December 31, 2017 and 2016 and 2015.that were not originated by us.
For The Years Ended | For The Years Ended | |||||||||||||||||||||||||||||||
December 31, | December 31, | |||||||||||||||||||||||||||||||
(Amounts in thousands) | 2016 | 2015 | 2017 | 2016 | ||||||||||||||||||||||||||||
Purchased Loans | Balance | % of Gross Loan Portfolio | Balance | % of Gross Loan Portfolio | ||||||||||||||||||||||||||||
Loan Type | Balance | % of Gross Loan Portfolio | Balance | % of Gross Loan Portfolio | ||||||||||||||||||||||||||||
Commercial | $ | 109 | — | % | $ | — | — | % | $ | 108 | — | % | $ | 109 | — | % | ||||||||||||||||
Commercial real estate | 31,662 | 4 | % | 46,999 | 7 | % | 30,195 | 3 | % | 31,662 | 4 | % | ||||||||||||||||||||
Residential real estate | 52,888 | 7 | % | 58,471 | 8 | % | 56,735 | 6 | % | 52,888 | 7 | % | ||||||||||||||||||||
Consumer and other | 49,057 | 6 | % | 46,783 | 7 | % | 47,836 | 5 | % | 49,057 | 6 | % | ||||||||||||||||||||
Total purchased loans | $ | 133,716 | 17 | % | $ | 152,253 | 22 | % | $ | 134,874 | 14 | % | $ | 133,716 | 17 | % | ||||||||||||||||
Many of the loans that we have acquired from third party originators are made to borrowers who are located throughout the United States, other than in California. Some of those borrowers were undoubtedly impacted by the hurricanes which caused destruction in Texas, Florida, Georgia and Puerto Rico during the third quarter of 2017. As part of our discussion of the ALLL elsewhere in this document, we have provided the preliminary information we have about these loans.
BANK OF COMMERCE HOLDINGS & SUBSIDIARIES
Asset Quality
Nonperforming Assets
Our loan portfolio is heavily concentrated in real estate, and a significant portion of our borrowers’borrowers’ ability to repay their loans is dependent upon the professional services, commercial real estate market and the residential real estate development industry sectors. Loans secured by real estate or other assets primarily located in California are expected to be repaid from cash flows of the borrower or proceeds from the sale of collateral. As such, our dependence on real estate secured loans could increase the risk of loss in our loan portfolio in a market of declining real estate values. Furthermore, declining real estate values would negatively impact holdings of OREO.
We manage asset quality and mitigate credit risk through the application of policies designed to promote sound underwriting and loan monitoring practices. Our Loan Committee is charged with monitoring asset quality, establishing credit policies and procedures and enforcing the consistent application of these policies and procedures across the Bank. The provision for loan and lease losses charged to earnings is based upon management’smanagement’s judgment of the amount necessary to maintain the allowance at a level adequate to absorb probable incurred losses. The amount of provision charge is dependent upon many factors, including loan growth, net charge-offs, changes in the composition of the loan portfolio, delinquencies, management’s assessment of loan portfolio quality, general economic conditions that can impact the value of collateral, and other trends. The evaluation of these factors is performed through an analysis of the adequacy of the ALLL. Reviews of nonperforming, past due loans and larger credits, designed to identify potential charges to the ALLL, and to determine the adequacy of the allowance, are conducted on a monthly basis. These reviews consider such factors as the financial strength of borrowers, the value of the applicable collateral, loan and lease loss experience, estimated loan and lease losses, growth in the loan portfolio, prevailing economic conditions and other factors.
A loan is considered impaired when, based on current information and events, we determine it is probable that we will not be able to collect all amounts due according to the loan contract, including scheduled interest payments. Generally, when we identify a loan as impaired, we measure the loan for potential impairment using discount cash flows, except when the sole remaining source of the repayment for the loan is the liquidation of the collateral. In these cases, we use the current fair value of collateral, less selling costs. The starting point for determining the fair value of collateral is through obtaining external appraisals. Generally, external appraisals are updated every twelve months. We obtain appraisals from a pre-approved list of independent, third party, local appraisal firms. Approval and addition to the list is based on experience, reputation, character, consistency and knowledge of the respective real estate market. At a minimum, it is ascertained that the appraiser is: (1) currently licensed in the state in which the property is located, (2) is experienced in the appraisal of properties similar to the property being appraised, (3) is actively engaged in the appraisal work, (4) has knowledge of current real estate market conditions and financing trends, (5) is reputable, and (6) is not on Freddie Mac’sMac’s nor our Exclusionary List of appraisers and brokers. In most cases, appraisals will be reviewed by another independent third party to ensure the quality of the appraisal and the expertise and independence of the appraiser. Upon receipt and review, an external appraisal is utilized to measure a loan for potential impairment.
Our impairment analysis documents the date of the appraisal used in the analysis, whether the officer preparing the report deems it current, and, if not, allows for internal valuation adjustments with justification. Typical justified adjustments might include discounts for continued market deterioration subsequent to appraisal date, adjustments for the release of collateral contemplated in the appraisal, or the value of other collateral or consideration not contemplated in the appraisal. An appraisal over one year old in most cases will be considered stale dated and an updated or new appraisal will be required. Any adjustments from appraised value to net realizable value are detailed and justified in the impairment analysis, which is reviewed and approved by our Chief Credit Officer. Although an external appraisal is the primary source to value collateral dependent loans, we may also utilize values obtained through purchase and sale agreements, negotiated short sales, broker price opinions, or the sales price of the note. These alternative sources of value are used only if deemed to be more representative of value based on updated information regarding collateral resolution. Impairment analyses are updated, reviewed and approved on a quarterly basis at or near the end of each reporting period. Based on these processes, we do not believe there are significant time lapses for the recognition of additional provision for loan and lease loss or charge-offs from the date they become known.
Loans are classified as nonaccrual when collection of principal or interest is doubtful; generally these are loans that are past due as to maturity or payment of principal or interest by 90 days or more, unless such loans are well-secured and in the process of collection. Additionally, all loans that are impaired are considered for nonaccrual status. Loans placed on nonaccrual will typically remain on nonaccrual status until all principal and interest payments are brought current and the prospects for future payments in accordance with the loan agreement appear certain.
BANK OF COMMERCE HOLDINGS & SUBSIDIARIES
Upon acquisition of real estate collateral, typically through the foreclosure process, we promptly begin to market the property for sale. If we do not begin to receive offers or indications of interest within a reasonable timeframe, we will analyze the price and review market conditions to assess the pricing level that would enable us to sell the property. At the time of foreclosure, OREO is recorded at fair value less costs to sell (“cost”), which becomes the property’sproperty’s new basis. Unless a current appraisal is available, an appraisal will be ordered prior to a loan migrating to OREO. Any write-downs based on the asset’s fair value at the date of acquisition are charged to the ALLL. After foreclosure, management periodically performs valuations and the property is carried at the lower of the cost or fair value less expected selling costs. We obtain updated appraisals on OREO property every six to twelve months. Increases in valuationValuation adjustments recorded in a period are primarily based on (1) updated appraisals received during the period, or (2) management’s authorization to reduce the selling price of the property during the period. Unless a current appraisal is available, an appraisal will be ordered prior to a loan migrating to OREO.
BANK OF COMMERCE HOLDINGS & SUBSIDIARIES
The following table summarizes our nonperforming assets as of December 31 for each of the last five years.
(Amounts in thousands) | As of December 31, | As of December 31, | ||||||||||||||||||||||||||||||||||||||
Nonperforming Assets | 2016 | 2015 | 2014 | 2013 | 2012 | 2017 | 2016 | 2015 | 2014 | 2013 | ||||||||||||||||||||||||||||||
Commercial | $ | 2,749 | $ | 1,994 | $ | 5,112 | $ | 6,527 | $ | 2,935 | $ | 1,603 | $ | 2,749 | $ | 1,994 | $ | 5,112 | $ | 6,527 | ||||||||||||||||||||
Commercial real estate: | ||||||||||||||||||||||||||||||||||||||||
Real estate - commercial non-owner occupied | 1,196 | 5,488 | 8,318 | 8,767 | 17,258 | — | 1,196 | 5,488 | 6,909 | 8,767 | ||||||||||||||||||||||||||||||
Real estate - commercial owner occupied | 784 | 1,071 | 1,378 | 5,772 | 6,750 | 600 | 784 | 1,071 | 2,787 | 5,772 | ||||||||||||||||||||||||||||||
Total commercial real estate | 1,980 | 6,559 | 9,696 | 14,539 | 24,008 | 600 | 1,980 | 6,559 | 9,696 | 14,539 | ||||||||||||||||||||||||||||||
Residential real estate: | ||||||||||||||||||||||||||||||||||||||||
Real estate - residential - ITIN | 3,576 | 3,649 | 4,647 | 6,895 | 9,825 | 2,909 | 3,576 | 3,649 | 4,647 | 6,895 | ||||||||||||||||||||||||||||||
Real estate - residential - 1-4 family mortgage | 1,914 | 1,775 | 2,135 | 1,322 | 1,805 | 606 | 1,914 | 1,775 | 2,135 | 1,322 | ||||||||||||||||||||||||||||||
Real estate - residential - equity lines | 917 | — | 24 | 513 | — | 45 | 917 | — | 24 | 513 | ||||||||||||||||||||||||||||||
Total residential real estate | 6,407 | 5,424 | 6,806 | 8,730 | 11,630 | 3,560 | 6,407 | 5,424 | 6,806 | 8,730 | ||||||||||||||||||||||||||||||
Consumer and other | 250 | 32 | 35 | — | — | 36 | 250 | 32 | 35 | — | ||||||||||||||||||||||||||||||
Total nonaccrual loans | 11,386 | 14,009 | 21,649 | 29,796 | 38,573 | 5,799 | 11,386 | 14,009 | 21,649 | 29,796 | ||||||||||||||||||||||||||||||
90 days past due and still accruing | — | 88 | 23 | — | — | — | — | 88 | 23 | — | ||||||||||||||||||||||||||||||
Total nonperforming loans | 11,386 | 14,097 | 21,672 | 29,796 | 38,573 | 5,799 | �� | 11,386 | 14,097 | 21,672 | 29,796 | |||||||||||||||||||||||||||||
Other real estate owned | 759 | 1,423 | 502 | 913 | 3,061 | 35 | 759 | 1,423 | 502 | 913 | ||||||||||||||||||||||||||||||
Total nonperforming assets | $ | 12,145 | $ | 15,520 | $ | 22,174 | $ | 30,709 | $ | 41,634 | $ | 5,834 | $ | 12,145 | $ | 15,520 | $ | 22,174 | $ | 30,709 | ||||||||||||||||||||
Nonperforming loans to loans, net of deferred fees and costs | 1.41 | % | 1.96 | % | 3.28 | % | 4.98 | % | 5.81 | % | ||||||||||||||||||||||||||||||
Nonperforming loans to gross loans | 0.66 | % | 1.42 | % | 1.97 | % | 3.28 | % | 4.98 | % | ||||||||||||||||||||||||||||||
Nonperforming assets to total assets | 1.06 | % | 1.53 | % | 2.22 | % | 3.23 | % | 4.25 | % | 0.46 | % | 1.06 | % | 1.53 | % | 2.22 | % | 3.23 | % | ||||||||||||||||||||
We are continually performing extensiveperform thorough reviews of the commercial real estate portfolio, including stress testing. These reviews are performed on both our non-owner and owner occupied credits. These reviews are completed to verify leasing status, to ensure the accuracy of risk ratings, and to develop proactive action plans with borrowers on projects. Stress testing is performed to determine the effect of rising cap rates, interest rates, and vacancy rates on the portfolio. Based on our analysis, we believe our lending teamswe are effectively managing the risks in this portfolio. There can be no assurance that any further declines in economic conditions, such as potential increases in retail or office vacancy rates, will not exceed the projected assumptions utilized in stress testing resulting in additional nonperforming loans in the future.
Loans are reported as troubled debt restructurings when we grant a concession(s) to a borrower experiencing financial difficulties that we would not otherwise consider. Examples of such concessions include a reduction in the loan rate, forgiveness of principal or accrued interest, extending the maturity date(s) significantly, or providing a lower interest rate than would be normally available for a transaction of similar risk. As a result of these concessions, restructured loans are impaired as we will not collect all amounts due, either principal or interest, in accordance with the terms of the original loan agreement. Impairment reserves on non-collateral dependent troubled debt restructured loans are measured by comparing the present value of expected future cash flows of the restructured loans, discounted at the effective interest rate of the original loan agreement to the loans carrying value. These impairment reserves are recognized as a specific component to be provided for in the ALLL.
As of December 31, 2016,2017, we had $12.1$10.9 million in troubled debt restructurings compared to $15.9$12.1 million as of December 31, 2015.2016. As of December 31, 2016,2017, we had 121116 restructured loans that qualified as troubled debt restructurings, of which 112110 were performing according to their restructured terms. Troubled debt restructurings represented 1.50%1.24% of gross loans as of December 31, 2016,2017, compared with 2.22%1.50% at December 31, 2015.
BANK OF COMMERCE HOLDINGS & SUBSIDIARIES2016.
Impaired loans of $7.1$7.3 million and $6.9$7.1 million were classified as accruing troubled debt restructurings at December 31, 20162017 and December 31, 2015,2016, respectively. The restructured loans on accrual status represent the majority of impaired loans accruing interest at each respective date. For a restructured loan to be on accrual status, the loan’sloan’s collateral coverage must generally will be greater than or equal to 100% of the loan balance, the loan ispayments must be current, on payments, and the borrower must either prefund an interest reserve or demonstrate the ability to make payments from a verified source of cash flow. As of December 31, 2017, we had one restructured commercial line of credit in nonaccrual status that had $33 thousand in available credit. We had no obligation to lend additional funds on theany troubled debt restructured loans as of December 31, 2016.
BANK OF COMMERCE HOLDINGS & SUBSIDIARIES
The following table sets forth a summary of our restructured loans that qualify as troubled debt restructurings for each of the last five years.
(Amounts in thousands) | As of December 31, | As of December 31, | ||||||||||||||||||||||||||||||||||||||
Troubled Debt Restructurings | 2016 | 2015 | 2014 | 2013 | 2012 | 2017 | 2016 | 2015 | 2014 | 2013 | ||||||||||||||||||||||||||||||
Accruing troubled debt restructurings | ||||||||||||||||||||||||||||||||||||||||
Commercial | $ | 776 | $ | 49 | $ | 1,485 | $ | 63 | $ | 523 | $ | 1,551 | $ | 776 | $ | 49 | $ | 1,485 | $ | 63 | ||||||||||||||||||||
Commercial real estate: | ||||||||||||||||||||||||||||||||||||||||
Real estate - commercial non-owner occupied | 808 | 824 | 840 | 2,983 | 3,701 | 803 | 808 | 824 | 840 | 854 | ||||||||||||||||||||||||||||||
Real estate - commercial owner occupied | — | — | 858 | 881 | 897 | — | — | — | 858 | 3,010 | ||||||||||||||||||||||||||||||
Residential real estate: | ||||||||||||||||||||||||||||||||||||||||
Real estate - residential - ITIN | 5,033 | 5,458 | 5,462 | 4,303 | 2,934 | 4,614 | 5,033 | 5,458 | 5,462 | 4,303 | ||||||||||||||||||||||||||||||
Real estate - residential - equity lines | 454 | 558 | 579 | 598 | 561 | 380 | 454 | 558 | 579 | 598 | ||||||||||||||||||||||||||||||
Total accruing troubled debt restructurings | 7,071 | 6,889 | 9,224 | 8,828 | 8,616 | 7,348 | 7,071 | 6,889 | 9,224 | 8,828 | ||||||||||||||||||||||||||||||
Nonaccruing troubled debt restructurings | ||||||||||||||||||||||||||||||||||||||||
Commercial | 1,940 | 863 | 2,136 | 6,458 | 50 | 863 | 1,940 | 863 | 2,136 | 6,458 | ||||||||||||||||||||||||||||||
Commercial real estate: | ||||||||||||||||||||||||||||||||||||||||
Real estate - commercial non-owner occupied | — | 4,292 | 8,317 | 8,252 | 4,796 | — | — | 4,292 | 6,909 | 8,252 | ||||||||||||||||||||||||||||||
Real estate - commercial owner occupied | — | 1,071 | 1,080 | 5,772 | 5,862 | — | — | 1,071 | 2,488 | 5,772 | ||||||||||||||||||||||||||||||
Residential real estate: | ||||||||||||||||||||||||||||||||||||||||
Real estate - residential - ITIN | 2,691 | 2,538 | 2,420 | 3,855 | 5,065 | 2,396 | 2,691 | 2,538 | 2,420 | 3,855 | ||||||||||||||||||||||||||||||
Real estate - residential - 1-4 family mortgage | 335 | 219 | 242 | 259 | 277 | 296 | 335 | 219 | 242 | 259 | ||||||||||||||||||||||||||||||
Consumer and other | 29 | 32 | 35 | — | — | 26 | 29 | 32 | 35 | — | ||||||||||||||||||||||||||||||
Total nonaccruing troubled debt restructurings | 4,995 | 9,015 | 14,230 | 24,596 | 16,050 | 3,581 | 4,995 | 9,015 | 14,230 | 24,596 | ||||||||||||||||||||||||||||||
Total troubled debt restructurings | ||||||||||||||||||||||||||||||||||||||||
Commercial | 2,716 | 912 | 3,621 | 6,521 | 573 | 2,414 | 2,716 | 912 | 3,621 | 6,521 | ||||||||||||||||||||||||||||||
Commercial real estate: | ||||||||||||||||||||||||||||||||||||||||
Real estate - commercial non-owner occupied | 808 | 5,116 | 9,157 | 11,235 | 8,497 | 803 | 808 | 5,116 | 7,749 | 9,106 | ||||||||||||||||||||||||||||||
Real estate - commercial owner occupied | — | 1,071 | 1,938 | 6,653 | 6,759 | — | — | 1,071 | 3,346 | 8,782 | ||||||||||||||||||||||||||||||
Residential real estate: | ||||||||||||||||||||||||||||||||||||||||
Real estate - residential - ITIN | 7,724 | 7,996 | 7,882 | 8,158 | 7,999 | 7,010 | 7,724 | 7,996 | 7,882 | 8,158 | ||||||||||||||||||||||||||||||
Real estate - residential - 1-4 family mortgage | 335 | 219 | 242 | 259 | 277 | 296 | 335 | 219 | 242 | 259 | ||||||||||||||||||||||||||||||
Real estate - residential - equity lines | 454 | 558 | 579 | 598 | 561 | 380 | 454 | 558 | 579 | 598 | ||||||||||||||||||||||||||||||
Consumer and other | 29 | 32 | 35 | — | — | 26 | 29 | 32 | 35 | — | ||||||||||||||||||||||||||||||
Total troubled debt restructurings | $ | 12,066 | $ | 15,904 | $ | 23,454 | $ | 33,424 | $ | 24,666 | $ | 10,929 | $ | 12,066 | $ | 15,904 | $ | 23,454 | $ | 33,424 | ||||||||||||||||||||
Total troubled debt restructuring to gross loans outstanding at period end | 1.50 | % | 2.22 | % | 3.55 | % | 5.59 | % | 3.71 | % | 1.24 | % | 1.50 | % | 2.22 | % | 3.55 | % | 5.59 | % | ||||||||||||||||||||
Allowance for Loan and Lease Losses and Reserve for Unfunded Commitments
The ALLL at December 31, 20162017 increased $364$569 thousand to $11.5$11.9 million compared to $11.2$11.5 million at December 31, 2015.2016. A combination of loan portfolio growth and net loan losses supported management’s decision to record a $950 thousand provision for loan and lease losses during the year ended December 31, 2017. During the yearsyear ended December 31, 2016, and 2015, there were no provisionprovisions for loan and lease losses.
We recorded net loan charge-offs of $569 thousand for the year ended December 31, 2017 compared to net loan loss recoveries of $364 thousand for the year ended December 31, 2016 compared to net loan loss recoveries of $360 thousand for the year ended December 31, 2015. 2016. The recoveriescharge-offs occurred primarily in one commercial real estate relationship for $2.5 million, one commercial relationship for $277 thousand andfrom purchased consumer loans for $93 thousand. Charge-offs occurred primarily in$954 thousand and were partially offset by recoveries from two commercial loan relationships for $1.1 million, residential real estate relationships for $829 thousand and purchased consumer loans for $758$374 thousand. During 2016 and 2015 net loan loss recoveries combined with continuing improved asset quality resulted in no provision for loan and lease losses. Our ALLL as a percentage of gross loans outstanding was 1.44%1.36% and 1.56%1.44% as of December 31, 2016,2017, and December 31, 2015,2016, respectively.
BANK OF COMMERCE HOLDINGS & SUBSIDIARIES
The following table summarizes the ALLL roll forward for each of the five years ended December 31. This table also includes impaired loan information for each of the five years endedas of December 31.
For the Years Ended December 31, | For the Years Ended December 31, | |||||||||||||||||||||||||||||||||||||||
(Amounts in thousands) | 2016 | 2015 | 2014 | 2013 | 2012 | 2017 | 2016 | 2015 | 2014 | 2013 | ||||||||||||||||||||||||||||||
Beginning balance ALLL | $ | 11,180 | $ | 10,820 | $ | 14,172 | $ | 11,103 | $ | 10,622 | $ | 11,544 | $ | 11,180 | $ | 10,820 | $ | 14,172 | $ | 11,103 | ||||||||||||||||||||
Provision for loan and lease loss charged to expense | — | — | 3,175 | 2,750 | 9,400 | 950 | — | — | 3,175 | 2,750 | ||||||||||||||||||||||||||||||
Loans charged offs | (2,784 | ) | (2,376 | ) | (7,319 | ) | (2,770 | ) | (9,862 | ) | ||||||||||||||||||||||||||||||
Loans charged off | (1,502 | ) | (2,784 | ) | (2,376 | ) | (7,319 | ) | (2,770 | ) | ||||||||||||||||||||||||||||||
Loan and lease loss recoveries | 3,148 | 2,736 | 792 | 3,089 | 943 | 933 | 3,148 | 2,736 | 792 | 3,089 | ||||||||||||||||||||||||||||||
Ending balance ALLL | 11,544 | 11,180 | 10,820 | 14,172 | 11,103 | 11,925 | 11,544 | 11,180 | 10,820 | 14,172 | ||||||||||||||||||||||||||||||
At December 31, | At December 31, | |||||||||||||||||||||||||||||||||||||||
2016 | 2015 | 2014 | 2013 | 2012 | 2017 | 2016 | 2015 | 2014 | 2013 | |||||||||||||||||||||||||||||||
Nonaccrual loans: | ||||||||||||||||||||||||||||||||||||||||
Commercial | 2,749 | 1,994 | 5,112 | 6,527 | 2,935 | 1,603 | 2,749 | 1,994 | 5,112 | 6,527 | ||||||||||||||||||||||||||||||
Real estate - commercial non-owner occupied | 1,196 | 5,488 | 8,318 | 8,766 | 17,258 | — | 1,196 | 5,488 | 6,909 | 8,766 | ||||||||||||||||||||||||||||||
Real estate - commercial owner occupied | 784 | 1,071 | 1,378 | 5,773 | 6,750 | 600 | 784 | 1,071 | 2,787 | 5,773 | ||||||||||||||||||||||||||||||
Real estate - residential - ITIN | 3,576 | 3,649 | 4,647 | 6,895 | 9,825 | 2,909 | 3,576 | 3,649 | 4,647 | 6,895 | ||||||||||||||||||||||||||||||
Real estate - residential - 1-4 family mortgage | 1,914 | 1,775 | 2,135 | 1,322 | 1,805 | 606 | 1,914 | 1,775 | 2,135 | 1,322 | ||||||||||||||||||||||||||||||
Real estate - residential - equity lines | 917 | — | 24 | 513 | — | 45 | 917 | — | 24 | 513 | ||||||||||||||||||||||||||||||
Consumer and other | 250 | 32 | 35 | — | — | 36 | 250 | 32 | 35 | — | ||||||||||||||||||||||||||||||
Total nonaccrual loans | 11,386 | 14,009 | 21,649 | 29,796 | 38,573 | 5,799 | 11,386 | 14,009 | 21,649 | 29,796 | ||||||||||||||||||||||||||||||
Accruing troubled-debt restructured loans | ||||||||||||||||||||||||||||||||||||||||
Commercial | 776 | 49 | 1,485 | 63 | 523 | 1,551 | 776 | 49 | 1,485 | 63 | ||||||||||||||||||||||||||||||
Real estate - commercial non-owner occupied | 808 | 824 | 840 | 2,983 | 3,701 | 803 | 808 | 824 | 840 | 854 | ||||||||||||||||||||||||||||||
Real estate - commercial owner occupied | — | — | 858 | 881 | 897 | — | — | — | 858 | 3,010 | ||||||||||||||||||||||||||||||
Real estate - residential - ITIN | 5,033 | 5,458 | 5,462 | 4,303 | 2,934 | 4,614 | 5,033 | 5,458 | 5,462 | 4,303 | ||||||||||||||||||||||||||||||
Real estate - residential - equity lines | 454 | 558 | 579 | 598 | 561 | 380 | 454 | 558 | 579 | 598 | ||||||||||||||||||||||||||||||
Total accruing restructured loans | 7,071 | 6,889 | 9,224 | 8,828 | 8,616 | 7,348 | 7,071 | 6,889 | 9,224 | 8,828 | ||||||||||||||||||||||||||||||
All other accruing impaired loans | 337 | 492 | 535 | 3,517 | 471 | — | 337 | 492 | 535 | 3,517 | ||||||||||||||||||||||||||||||
Total impaired loans | 18,794 | 21,390 | 31,408 | 42,141 | 47,660 | 13,147 | 18,794 | 21,390 | 31,408 | 42,141 | ||||||||||||||||||||||||||||||
Gross loans outstanding | $ | 804,211 | $ | 716,639 | $ | 660,898 | $ | 597,995 | $ | 664,051 | $ | 879,835 | $ | 804,211 | $ | 716,639 | $ | 660,898 | $ | 597,995 | ||||||||||||||||||||
Ratio of ALLL to gross loans outstanding | 1.44 | % | 1.56 | % | 1.64 | % | 2.37 | % | 1.67 | % | 1.36 | % | 1.44 | % | 1.56 | % | 1.64 | % | 2.37 | % | ||||||||||||||||||||
Nonaccrual loans to gross loans outstanding | 1.42 | % | 1.95 | % | 3.28 | % | 4.98 | % | 5.81 | % | 0.66 | % | 1.42 | % | 1.95 | % | 3.28 | % | 4.98 | % | ||||||||||||||||||||
As of December 31, 2016,2017, impaired loans totaled $18.8$13.1 million, of which $11.4$5.8 million were in nonaccrual status. Of the total impaired loans, $8.6$7.5 million or 118110 were ITIN loans with an average balance of approximately $73$68 thousand per loan. The remaining impaired loans consist of tennine commercial loans, fivetwo commercial real estate loans, sixfour residential mortgages, threetwo consumer loanloans and eleveneight home equity loans.
At December 31, 2016,2017, impaired loans had a corresponding valuationspecific allowance of $1.5$1.2 million. The valuationspecific allowance on impaired loans represents the impairment reserves on performing restructured loans, other accruing loans, and nonaccrual loans.
BANK OF COMMERCE HOLDINGS & SUBSIDIARIES
The following table sets forth the allocation of the ALLL and percent of loans in each category to gross loans for each of the five years endedas of December 31.
As of December 31, | ||||||||||||||||||||||||||||||||||||||||||||||||||||||||||||||||||||||||||||||||
2016 | 2015 | 2014 | 2013 | 2012 | At December 31, | |||||||||||||||||||||||||||||||||||||||||||||||||||||||||||||||||||||||||||
(Amounts in thousands) | % Loan | % Loan | % Loan | % Loan | % Loan | 2017 | 2016 | 2015 | 2014 | 2013 | ||||||||||||||||||||||||||||||||||||||||||||||||||||||||||||||||||||||
ALLL | Amount | Category | Amount | Category | Amount | Category | Amount | Category | Amount | Category | Amount | Percent | Amount | Percent | Amount | Percent | Amount | Percent | Amount | Percent | ||||||||||||||||||||||||||||||||||||||||||||||||||||||||||||
Commercial | $ | 2,849 | 25 | % | $ | 2,493 | 23 | % | $ | 3,503 | 33 | % | $ | 7,057 | 50 | % | $ | 4,168 | 38 | % | $ | 2,492 | 21 | % | $ | 2,849 | 25 | % | $ | 2,493 | 22 | % | $ | 3,503 | 33 | % | $ | 7,054 | 50 | % | ||||||||||||||||||||||||||||||||||||||||
Commercial real estate: | ||||||||||||||||||||||||||||||||||||||||||||||||||||||||||||||||||||||||||||||||
Real estate - construction and land development | 281 | 2 | % | 246 | 2 | % | 388 | 4 | % | 173 | 1 | % | 184 | 2 | % | 82 | 1 | % | 177 | 2 | % | 246 | 2 | % | 388 | 4 | % | 173 | 1 | % | ||||||||||||||||||||||||||||||||||||||||||||||||||
Real estate - commercial non-owner occupied | 3,759 | 34 | % | 3,262 | 29 | % | 2,741 | 25 | % | 2,001 | 14 | % | 1,764 | 16 | % | 4,698 | 40 | % | 3,637 | 32 | % | 3,014 | 27 | % | 2,138 | 19 | % | 1,250 | 8 | % | ||||||||||||||||||||||||||||||||||||||||||||||||||
Real estate - commercial owner occupied | 1,538 | 13 | % | 2,276 | 20 | % | 1,746 | 16 | % | 610 | 4 | % | 828 | 7 | % | 1,639 | 14 | % | 1,764 | 15 | % | 2,524 | 23 | % | 2,348 | 22 | % | 1,365 | 10 | % | ||||||||||||||||||||||||||||||||||||||||||||||||||
Residential real estate: | ||||||||||||||||||||||||||||||||||||||||||||||||||||||||||||||||||||||||||||||||
Real estate - residential - ITIN | 973 | 8 | % | 998 | 9 | % | 836 | 8 | % | 1,276 | 9 | % | 1,515 | 13 | % | 602 | 5 | % | 973 | 8 | % | 998 | 9 | % | 836 | 8 | % | 1,276 | 9 | % | ||||||||||||||||||||||||||||||||||||||||||||||||||
Real estate - residential - 1-4 family mortgage | 56 | — | % | 93 | 1 | % | 150 | 1 | % | 409 | 3 | % | 611 | 6 | % | 151 | 1 | % | 106 | 1 | % | 111 | 1 | % | 155 | 1 | % | 417 | 3 | % | ||||||||||||||||||||||||||||||||||||||||||||||||||
Real estate - residential - equity lines | 687 | 6 | % | 486 | 4 | % | 684 | 6 | % | 808 | 6 | % | 1,216 | 11 | % | 416 | 3 | % | 637 | 5 | % | 469 | 4 | % | 679 | 6 | % | 799 | 6 | % | ||||||||||||||||||||||||||||||||||||||||||||||||||
Consumer and other | 955 | 8 | % | 770 | 7 | % | 450 | 4 | % | 35 | — | % | 31 | — | % | 1,435 | 12 | % | 955 | 8 | % | 770 | 7 | % | 450 | 4 | % | 35 | — | % | ||||||||||||||||||||||||||||||||||||||||||||||||||
Unallocated | 446 | 4 | % | 556 | 5 | % | 322 | 3 | % | 1,803 | 13 | % | 786 | 7 | % | 410 | 3 | % | 446 | 4 | % | 556 | 5 | % | 322 | 3 | % | 1,803 | 13 | % | ||||||||||||||||||||||||||||||||||||||||||||||||||
Total ALLL | $ | 11,544 | 100 | % | $ | 11,180 | 100 | % | $ | 10,820 | 100 | % | $ | 14,172 | 100 | % | $ | 11,103 | 100 | % | $ | 11,925 | 100 | % | $ | 11,544 | 100 | % | $ | 11,181 | 100 | % | $ | 10,819 | 100 | % | $ | 14,172 | 100 | % | ||||||||||||||||||||||||||||||||||||||||
The unallocated portion of ALLL provides for coverage of credit losses inherent in the loan portfolio but not captured in the credit loss factors that are utilized in the risk grading-based component, or in the specific impairment reserve component of the ALLL, and acknowledges the inherent imprecision of all loss prediction models. As of December 31, 2016,2017, the unallocated allowance amount represented 4%3% of the ALLL, compared to 5%4% at December 31, 2015.2016. While the ALLL composition is an indication of specific amounts or loan categories in which future charge-offs may occur, actual amounts may differ.
Natural Disasters
Wildfires
We have extended credit to borrowers in California's Napa and Sonoma counties where devastating fires recently caused widespread destruction. In those two counties we have made ten commercial real estate loans totaling $12.8 million. None of the real estate collateralizing our loans was burned. It is however too soon to approximate the economic impact of the fires on the general economy of the region or on our borrowers’ businesses specifically.
Hurricanes
Many of the loans that we have acquired from third party originators were made to borrowers who are located throughout the United States, other than in California. Some of those borrowers reside in portions of Texas, Florida, Georgia and Puerto Rico where hurricanes caused severe damage during the third quarter of 2017. The loans that could be affected are ITIN loans which are secured by 1st deeds of trust and consumer home improvement loans which are unsecured. These loans are not serviced by us and we are dependent on third party servicers for collection efforts, processing payment deferral requests and obtaining loss information. In accordance with disaster relief guidelines, extensions have been granted to 29 borrowers with loans totaling $461 thousand. Although we do not currently know the extent of damage to our loan collateral, the amounts of available insurance coverage, the availability of government assistance for our borrowers or whether our borrower's ability to repay their loans has been diminished, we have increased our ALLL for purchased loan pools through increases to the qualitative factors in our ALLL calculation by $372 thousand.
BANK OF COMMERCE HOLDINGS & SUBSIDIARIES
Deposits
Total deposits as of December 31, 20162017 were $1.0$1.1 billion compared to $803.7 million$1.0 billion at December 31, 2015,2016, an increase of $200.9$98.1 million or 25%10%. During the first quarter of 2016, the branch acquisition provided an additional $149.0 million of deposits and we called and redeemed $17.5 million of brokered certificates of deposit. The following table presents the deposit balances by major category as of December 31 for the last two years.
(Amounts in thousands) | 2016 | 2015 | 2017 | 2016 | ||||||||||||||||||||||||||||
Deposits | Amount | Percentage | Amount | Percentage | Amount | Percentage | Amount | Percentage | ||||||||||||||||||||||||
Noninterest-bearing demand | $ | 270,398 | 27 | % | $ | 169,507 | 21 | % | $ | 305,650 | 28 | % | $ | 270,398 | 27 | % | ||||||||||||||||
Interest-bearing demand | 198,328 | 20 | % | 165,316 | 20 | % | 260,221 | 24 | % | 198,328 | 20 | % | ||||||||||||||||||||
Money market accounts | 207,241 | 20 | % | 150,342 | 19 | % | 236,769 | 21 | % | 207,241 | 20 | % | ||||||||||||||||||||
Savings | 113,309 | 11 | % | 94,503 | 12 | % | 110,837 | 10 | % | 113,309 | 11 | % | ||||||||||||||||||||
Certificates of deposit, $100,000 or greater | 167,962 | 17 | % | 189,969 | 24 | % | 148,438 | 13 | % | 167,962 | 17 | % | ||||||||||||||||||||
Certificates of deposit, less than $100,000 | 47,428 | 5 | % | 34,098 | 4 | % | 40,817 | 4 | % | 47,428 | 5 | % | ||||||||||||||||||||
Total | $ | 1,004,666 | 100 | % | $ | 803,735 | 100 | % | $ | 1,102,732 | 100 | % | $ | 1,004,666 | 100 | % | ||||||||||||||||
BANK OF COMMERCE HOLDINGS & SUBSIDIARIES
The following table sets forth the distribution of our year-to-date average daily balances and their respective rates for the periods indicated.
Years Ended December 31, | Years Ended December 31, | |||||||||||||||||||||||||||||||||||||||||||||||
2016 | 2015 | 2014 | 2017 | 2016 | 2015 | |||||||||||||||||||||||||||||||||||||||||||
(Amounts in thousands) | Average Balance | Rate | Average Balance | Rate | Average Balance | Rate | Average Balance | Rate | Average Balance | Rate | Average Balance | Rate | ||||||||||||||||||||||||||||||||||||
Interest-bearing demand | $ | 172,011 | 0.12 | % | $ | 145,106 | 0.16 | % | $ | 138,547 | 0.16 | % | $ | 209,792 | 0.13 | % | $ | 172,011 | 0.12 | % | $ | 145,106 | 0.16 | % | ||||||||||||||||||||||||
Money market accounts | 202,159 | 0.16 | % | 137,999 | 0.17 | % | 133,836 | 0.25 | % | 224,913 | 0.21 | % | 202,159 | 0.16 | % | 137,999 | 0.17 | % | ||||||||||||||||||||||||||||||
Savings | 104,771 | 0.17 | % | 92,659 | 0.23 | % | 91,108 | 0.19 | % | 111,376 | 0.18 | % | 104,771 | 0.17 | % | 92,659 | 0.23 | % | ||||||||||||||||||||||||||||||
Certificates of deposit | 221,074 | 0.99 | % | 238,626 | 0.99 | % | 259,445 | 1.01 | % | 205,648 | 1.06 | % | 221,074 | 0.99 | % | 238,626 | 0.99 | % | ||||||||||||||||||||||||||||||
Interest-bearing deposits | 700,015 | 0.41 | % | 614,390 | 0.49 | % | 622,936 | 0.53 | % | 751,729 | 0.42 | % | 700,015 | 0.41 | % | 614,390 | 0.49 | % | ||||||||||||||||||||||||||||||
Noninterest-bearing demand | 226,368 |
| 156,578 |
| 139,792 |
| 289,735 | 226,368 | 156,578 | |||||||||||||||||||||||||||||||||||||||
Average total deposits | 926,383 |
| 770,968 |
| 762,728 |
| 1,041,464 | 0.30 | % | 926,383 | 0.31 | % | 770,968 | 0.39 | % | |||||||||||||||||||||||||||||||||
|
|
| ||||||||||||||||||||||||||||||||||||||||||||||
Term debt(1) | 37,286 | 4.47 | % | 88,874 | 1.98 | % | 77,534 | 0.54 | % | 18,283 | 6.39 | % | 37,286 | 4.47 | % | 88,874 | 1.98 | % | ||||||||||||||||||||||||||||||
Junior subordinated debentures | 10,310 | 2.28 | % | 10,310 | 1.89 | % | 15,239 | 2.38 | % | 10,310 | 2.78 | % | 10,310 | 2.28 | % | 10,310 | 1.89 | % | ||||||||||||||||||||||||||||||
Average total borrowings | $ | 47,596 | 4.00 | % | $ | 99,184 | 1.97 | % | $ | 92,773 | 0.85 | % | $ | 28,593 | 5.09 | % | $ | 47,596 | 4.00 | % | $ | 99,184 | 1.97 | % | ||||||||||||||||||||||||
(1) Includes impact of interest rate swaps and senior and subordinated term debt. During the first quarter of 2016, all Federal Home Loan Bank of San Francisco term debt was repaid and an interest rate hedge associated with $75.0 million of that debt was terminated. During the fourth quarter of 2015, we entered into a senior debt loan agreement to borrow $10.0 million from another financial institution and issued $10.0 million of subordinated | ||||||||||||||||||
Deposit Maturity Schedule
The following table sets forth the remaining maturities of certificates of deposit in the amounts of $100,000 or more as of December 31, 2016.2017.
(Amounts in thousands) | ||||||||
Maturing in: | 2016 | 2017 | ||||||
Three months or less | $ | 22,018 | $ | 28,539 | ||||
Three through six months | 23,646 | 21,555 | ||||||
Six through twelve months | 34,694 | 25,986 | ||||||
Over twelve months | 87,604 | 72,358 | ||||||
Total | $ | 167,962 | $ | 148,438 | ||||
We have an agreement with Promontory Interfinancial Network LLC (“Promontory”) allowing our Bank to provideprovision of FDIC deposit insurance to balances in excess of current FDIC deposit insurance limits. Promontory’sPromontory’s Certificate of Deposit Account Registry Service (“CDARS”) and Insured Cash Sweep (“ICS”) use a deposit-matching program to exchange Bank deposits in excess of the current deposit insurance limits for excess balances at other participating banks, on a dollar-for-dollar basis, that would be fully insured at the Bank. These products are designed to enhance our ability to attract and retain customers and increase deposits, by providing additional FDIC coverage to customers. CDARS and ICS deposits can be reciprocal or one-way;one-way and are considered brokered deposits by the FDIC.
Included in our certificate of deposit balances are $34.3 million of subscription time deposits obtained in years past through online deposit listing services. We no longer utilize online deposit listing services. These legacy deposits are not being renewed as they mature.
In accordance with regulatory Call Report instructions, we filed quarterly Call Reports, which listed brokered deposits of $65.2$66.3 million, and $94.4$65.2 million at December 31, 20162017 and December 31, 2015,2016, respectively. These amounts included depositswere obtained through the CDARS and ICS programsprograms.
BANK OF COMMERCE HOLDINGS & SUBSIDIARIES
Borrowings
Term Debt
At December 31, 2016,2017, we had term debt outstanding with a carrying value of $18.7$17.0 million compared to $94.7$18.7 million at December 31, 2015.2016. Term debt consisted of the following:
FedeFederalral Home Loan Bank of San Francisco Borrowings
We utilized a portion of the new liquidity from our branch acquisition to repay $75.0 million of Federal Home Loan Bank of San Francisco hedged term debt during the first quarter of 2016. As of December 31,2017 and 2016, the Bank had no Federal Home Loan Bank of San Francisco advances outstanding. Advances from theThe average balances outstanding on Federal Home Loan Bank of San Francisco term advances during 2017 and 2016 were $75.0$302 thousand and $18.0 million, at December 31, 2015.respectively, See Note 1817 Federal Funds Purchased and Lines of CreditCredit in the Notes to Consolidated Financial Statements for information on our Federal Home Loan Bank of San Francisco borrowings and our remaining line of credit.borrowings.
BANK OF COMMERCE HOLDINGS & SUBSIDIARIES
Senior Debt
In December of 2015, the Holding Company,we entered into a senior debt loan agreement to borrow $10.0 million. The debt is secured by a pledge from the Holding Company of all of the outstanding stock of Redding Bank of Commerce. AtCommerce, matures in 2020, and at December 31, 2016 the Senior Debt2017, had a balance of $8.9$7.1 million net of unamortized debt issuance costs. Interest on the senior debt is paid at a variable rate of equal to three month LIBOR plus 400 basis points, and matures in 2020.resetting monthly. The effective interest rate at December 31, 2016,2017, was 4.96%5.34%.
Subordinated Debt
In December of 2015, the Holding Companywe issued $10.0 million of fixed to floating rate subordinated notes.Subordinated Notes. The subordinated debt initially bears interest at 6.88% per annum for a five-year term. Thereafter, interest on the subordinated debt will be paid at a variable raterate equal to three month LIBOR plus 526 basis points.points, resetting quarterly. At December 31, 20162017, the Subordinated Debtsubordinated debt had a balance of $10.0$9.9 million net of unamortized debt issuance costs. The notes are due in 2025.
Junior Subordinated Debentures
Junior SubordiBank of Commerce Holdings Trustnated Debentures
During March 2003, the Holding Company participated in a private $5.0 million placement of fixed rate trust preferred securities (the “Trust Preferred Securities”) through a newly formed wholly-owned Delaware trust affiliate, Bank of Commerce Holdings Trust (the “Trust”). The Trust simultaneously issued $155 thousand common securities to the Holding Company. The Trust Preferred Securities paid distributions on a quarterly basis at three month LIBOR plus 3.30%. The rate increase was capped at 2.75% annually and the lifetime cap was 12.5%. The final maturity on the Trust Preferred Securities was April 7, 2033, and the covenants allowed for redemption after five years on the quarterly payment date.
During December 2014, we paid $4.6 million in complete satisfaction of the Notes. Simultaneously, the Trust redeemed the Trust Preferred Securities by distributing $4.6 million to the institutional investor. The transaction resulted in a gain of $406 thousand and a $155 thousand reduction of the Holding Company’s common stock investment in the Trust.
Bank of Commerce Holdings Trust II
During July 2005, the Holding Companywe participated in a $10.0 million private placement of fixed rate trust preferredtrust-preferred securities (the "Trust Preferred"Trust-Preferred Securities") through a newly formed wholly owned Delaware trust affiliate, Bank of Commerce Holdings Trust II (the "Trust II"). Trust II simultaneously issued $310 thousand common securities to the Holding Company. Rates paid on the Trust PreferredTrust-Preferred Securities have transitioned from fixed to floating and are now paid on a quarterly basis at a rate equal to three month LIBOR plus 158 basis points. The effective interest ratepoints (3.17% at December 31, 2016, was 2.54%2017).
The final maturityTrust-Preferred Securities mature on the Trust Preferred Securities is September 15, 2035, and the covenants allow for redemption of the securities at the Holding Company’sour option during any quarter untilprior to maturity.
The proceeds from the sale of the Trust PreferredTrust-Preferred Securities were used by the Trust II to purchase from the Holding Company the aggregate principal amount of $10.3 million of the Holding Company’sCompany’s junior subordinate debentures (the "Notes"). The net proceeds to the Holding Company from the sale of the Notes to the Trust II were partially distributed to the Bank for general corporate purposes, including funding the growth of the Bank’s various financial services.Bank. The proceeds from the Notes qualify as Tier 1 capital under Federal Reserve Board guidelines.
LIQUIDITY AND CASH FLOW
ReddingBank of Commerce
On March 11, 2016, we completed the purchase of five Bank of America branches located in northern California. The transaction was attractive to us because it provided a new source of low cost core deposits and allowed us to execute our plan to reconfigure our balance sheet.Balance Sheet. The acquisition provided approximately $142.3 million of new liquidity ($149.0 million of new deposits less payments of $6.7 million made to Bank of America). As we previously announced, on March 14, 2016, weWe utilized a portion of that new liquidity to reduce our reliance on wholesale funding sources, repaying $75.0 million of Federal Home Loan Bank of San Francisco hedged term debt and redeeming $17.5 million of brokered time deposits. We utilized the remaining liquidity to fund loan growth and the purchase of moderate term available-for-sale securities.
BANK OF COMMERCE HOLDINGS & SUBSIDIARIESgrowth.
The principal objective of our liquidity management program is to maintain our ability to meet the day-to-day cash flow requirements of our customers who either wish to withdraw funds on deposit or to draw upon their credit facilities.
We monitor the sources and uses of funds on a daily basis to maintain an acceptable liquidity position. One source of funds includes public deposits. We may be required to collateralize a portion of public deposits that exceed FDIC insurance limitations based on the state of California’sCalifornia’s risk assessment of the Bank. Public deposits represent 2% of total deposits at December 31, 20162017 and 3% at December 31, 2015.2016. In addition to liquidity from core deposits, loan repayments and maturities ofcash flows from securities, the Bank can utilize established uncommitted federal funds lines of credit, sell securities, borrow on a secured basis from the Federal Home Loan Bank of San Francisco, borrow on a secured basis from the Federal Reserve Bank or issue subscription / brokered certificates of deposit.
TheAt December 31, 2017, the Bank had available lines of credit:the following credit arrangements:
● |
|
● |
|
BANK OF COMMERCE HOLDINGS & SUBSIDIARIES
● |
|
Bank of Commerce Holdings
The Holding Company is a separate entity from the Bank and must provide for its own liquidity. Substantially allWe currently hold $24.0 million from our May 2017 public offering. Historically, our principal source of the Holding Company's cash flows are obtainedhas been dividends received from dividends declared and paid by the Bank. There areare statutory and regulatory provisions that could limit the ability of the Bank to pay dividends to the Holding Company.
Consolidated Statements of Cash Flows
As disclosed in theConsolidated Statements of Cash Flows, net cash of $11.9$13.6 million was provided by operating activities for the year ended December 31, 2016.2017. The material differencesprimary difference between net income and cash provided by operating activities and net income was due to a $2.3 million in loss on the cancellation of interest rate swap andare non-cash items including depreciation and amortization and increased($4.3 million), a deferred tax assetsasset write-down ($2.5 million) and a provision for loan and lease losses of $3.3 million.$950 thousand.
Net cash of $31.2$136.5 million providedused by investing activities consisted principally of $142.4$151.9 million in purchases of available-for-sale investment securities and $77.2 million in net loan purchases and originations partially offset by $64.3 million in proceeds from the acquisitionsale of Bank of America branches and $31.7available-for-sale investment securities, $23.6 million in proceeds from maturities and payments of available-for-sale securities. These sources were partially offset by $2.6 million in payments to derivative counterparties for the termination of interest rate swaps, $53.1 million in net purchases of available-for-sale investment securities and $87.2$2.2 million in net loan purchases and originations.of life insurance proceeds.
Net cash of $25.9$121.5 million used forprovided by financing activities consisted principally of $76.2a $124.2 million increase in demand and savings deposits and $26.8 million in net repaymentproceeds from issuance of term debt and $32.8 millioncommon stock partially offset by a decrease in certificates of deposit partially offset by an increase in demand deposits and savings accounts of $84.7$26.1 million.
CAPITAL RESOURCES
We use capital to support organic growth and pay dividends. The objective of effective capital management is to produce above market long termlong-term returns by using capital when investment returns are perceived to be high and issuing capital when costs are perceived to be low. Our sources of capital include retained earnings, common and preferred stock issuance, and issuance of subordinated debt or trust notes.
On September 28, 2011, the Holding Company entered into a Securities Purchase Agreement with the Secretary of the Treasury, pursuant to which the Holding Company issued and sold to the Treasury 20,000 shares of its Senior Non-Cumulative Perpetual Preferred Stock, Series B (the “Series B Preferred Stock”), having a liquidation preference of $1,000 per share, for aggregate proceeds net of issuance costs of $19.9 million. The issuance was pursuant to the Treasury’s SBLF program, a $30.0 billion fund established under the Small Business Jobs Act of 2010, which encourages lending to small businesses by providing capital to qualified community banks with assets of less than $10.0 billion.
BANK OF COMMERCE HOLDINGS & SUBSIDIARIES
On December 10, 2015, the Holding Company entered into a Loan Agreement pursuant to which the Holding Company obtained a $10.0 million loan from another financial institution. The Holding Company also entered into a Subordinated Note Purchase Agreement with certain institutional investors for the issuance and sale to the Investors of $10.0 million in aggregate principal amount of fixed to floating rate Subordinated Notes due 2025. The proceeds of the loan and the private placement of the Subordinated Notes were used to redeem, on December 11, 2015, all of the outstanding shares of the Series B Preferred Stock. The Holding Company paid $20.0 million to redeem the Series B Preferred Stock and $39 thousand in accrued but unpaid dividends. As a result of the SBLF redemption, the Holding Company’s obligations under the Securities Purchase Agreement have been terminated.
REGULATORY CAPITAL GUIDELINES
Federal bank regulatory agencies use capital adequacy guidelines in the examination and regulation of bank holding companies and banks. The guidelines are “risk-based,” meaning that they are designed to make capital requirements more sensitive to differences in risk profiles among banks and bank holding companies. On July 2, 2013, the federal banking agencies approved the final rules (the “Final Rules”) implementing the Basel Committee's December 2010 final capital framework (commonly known as Basel III). The Final Rules substantially amended the regulatory risk-based capital rules applicable to the Holding Company and the Bank. The phase-in period for the Final Rules began for the Company on January 1, 2015 with full compliance with the Final Rules phased in by January 1, 2019.
Generally speaking, effective January 1, 2015, the Final Rules did the following:
● | Created “Common |
● | Established a required minimum risk-based capital ratio for |
● | Increased the required minimum risk-based |
● | Increased the required minimum risk-based |
● | Increased the required minimum |
● | Added a |
● | Allowed for permanent grandfathering of non-qualifying instruments, such as our |
The Final Rules require the Bank and the Company to meet the capital conservation buffer requirement in order to avoid constraints on capital distributions, such as dividends and equity repurchases, and certain bonus compensation for executive officers. The capital conservation buffer of 2.5% was2.50% is added to the minimum capital ratios will beand is being phased in between 2016 and 2019. For 2017, the partially phased in buffer is 1.25%.
When the new capital rule is fully phased in, the minimum capital requirements plus the conservation buffer will exceed the well-capitalized thresholds.thresholds by 0.5 percentage points. This 0.5-percentage-point cushion allowswill allow institutions to dip into a portion of their capital conservation buffer before reaching a status that is considered less than well capitalized for prompt corrective action purposes.
These new capital rules also change the risk-weights of certain assets for purposes of the risk-based capital ratios and phase out certain instruments as qualifying capital. The Final Rules also contain revisions to the prompt corrective action framework, which is designed to place restrictions on insured depository institutions, if their capital levels begin to show signs of weakness.
Under the prompt corrective action requirements, which are designed to complement the capital conservation buffer, insured depository institutions are required to meet the following increased capital level requirements in order to qualify as “well-capitalized:” (i) a new Common equity tier 1 capital ratio
● | a “Common Equity Tier 1 Capital Ratio” of at least 6.5%; |
BANK OF COMMERCE HOLDINGS & SUBSIDIARIES
● | a “Tier 1 Capital Ratio” of at least 8%; |
● | a “Total Capital Ratio” of at least 10%; |
● | a “Tier 1 Leverage Ratio” of at least 5%; and |
● | not be subject to any order or written directive requiring a specific capital level. |
The FDIC's rules (as amended by the Final Rules) also contain other capital classification categories, such as "adequately capitalized," "undercapitalized," "significantly undercapitalized," and "critically undercapitalized," which are based on an institution's specific capital ratios.
CAPITAL ADEQUACY
Overall capital adequacy is monitored on a day-to-day basis by management and reported to our Board of Directors on a monthly basis. Our regulators measure capital adequacy by using a risk-based capital framework and by monitoring compliance with minimum leverage ratio guidelines. Based on management’smanagement’s review and analysis of Basel III, management believes that the Holding Company and the Bank will exceed the standards under these new rules.
BANK OF COMMERCE HOLDINGS & SUBSIDIARIES
As of December 31, 2016,2017, the most recent notification from the FDIC categorized the Bank as “well capitalized” under the regulatory framework for prompt corrective action. There are no conditions or events since the notification that management believes have changed the Bank’sBank’s risk category. The Holding Company and the Bank’s capital amounts and ratios as of December 31, 2016,2017, are presented in the following table.
December 31, 2017 | ||||||||||||||||||||||||||||||||||||||||||||
Applicable | Minimum | |||||||||||||||||||||||||||||||||||||||||||
Well | Minimum | 2017 Capital | Capital | |||||||||||||||||||||||||||||||||||||||||
December 31, 2016 | Actual | Capitalized | Capital | Conservation | Ratio plus Capital | |||||||||||||||||||||||||||||||||||||||
(Amounts in thousands) | Capital | Actual Ratio | Well Capitalized Requirement | Minimum Capital Ratio plus Capital Conservation Buffer | Minimum Capital Requirement | Capital | Ratio | Requirement | Requirement | Buffer | Conservation Buffer | |||||||||||||||||||||||||||||||||
Company: | ||||||||||||||||||||||||||||||||||||||||||||
Holding Company: | ||||||||||||||||||||||||||||||||||||||||||||
Common equity tier 1 capital ratio | $ | 92,757 | 9.43 | % | n/a | n/a | 4.50 | % | $ | 125,745 | 12.26 | % | n/a | 4.50 | % | 1.25 | % | 5.750 | % | |||||||||||||||||||||||||
Tier 1 capital ratio | $ | 102,496 | 10.42 | % | n/a | n/a | 6.00 | % | $ | 135,745 | 13.23 | % | n/a | 6.00 | % | 1.25 | % | 7.250 | % | |||||||||||||||||||||||||
Total capital ratio | $ | 124,735 | 12.68 | % | n/a | n/a | 8.00 | % | $ | 158,365 | 15.44 | % | n/a | 8.00 | % | 1.25 | % | 9.250 | % | |||||||||||||||||||||||||
Tier 1 leverage ratio | $ | 102,496 | 9.13 | % | n/a | n/a | 4.00 | % | $ | 135,745 | 10.86 | % | n/a | 4.00 | % | n/a | n/a | |||||||||||||||||||||||||||
|
| |||||||||||||||||||||||||||||||||||||||||||
Bank: |
|
| ||||||||||||||||||||||||||||||||||||||||||
Common equity tier 1 capital ratio | $ | 121,098 | 12.31 | % | 6.50 | % | 5.125 | % | 4.50 | % | $ | 129,139 | 12.58 | % | 6.50 | % | 4.50 | % | 1.25 | % | 5.750 | % | ||||||||||||||||||||||
Tier 1 capital ratio | $ | 121,098 | 12.31 | % | 8.00 | % | 6.625 | % | 6.00 | % | $ | 129,139 | 12.58 | % | 8.00 | % | 6.00 | % | 1.25 | % | 7.250 | % | ||||||||||||||||||||||
Total capital ratio | $ | 133,337 | 13.55 | % | 10.00 | % | 8.625 | % | 8.00 | % | $ | 141,760 | 13.81 | % | 10.00 | % | 8.00 | % | 1.25 | % | 9.250 | % | ||||||||||||||||||||||
Tier 1 leverage ratio | $ | 121,098 | 10.80 | % | 5.00 | % | n/a | 4.00 | % | $ | 129,139 | 10.33 | % | 5.00 | % | 4.00 | % | n/a | n/a | |||||||||||||||||||||||||
On December 10, 2015, the Holding Company issued $10.0 million in aggregate principal amount of Subordinated Notes to certain institutional investors. The Subordinated Notes qualify as Tier 2 Capital under the Final Rules. See Item 1a -Risk Factors, no assurance can be given thatin our Annual Report on Form 10-K for the Subordinated Notes will qualify as Tier 2 Capital in this documentyear ended December 31, 2017 for further detail on potential risks relating to the Subordinated Notes.
AsDuring 2016, as part of thea branch acquisition, we recorded a core deposit intangible of $1.8 million and goodwill of $665 thousand. When calculating capital ratios, goodwill and a portion of the core deposit intangibles are subtracted from Tier 1 capital. The deduction for core deposit intangibles is subject to a phase in period under the Basel III risk based capital rules. During 2016, 60%2017, 80% of the core deposit intangible will bewas deducted from Tier 1 capital 80% for 2017 and 100% will be deducted thereafter. Both of these intangible assets are subtracted from tangible equity as part of the calculation of tangible book value per share.
Capital ratios for the Holding Company include the benefit of $26.8 million net proceeds from the sale of 2,738,096 shares of common stock in the second quarter of 2017.
CASH DIVIDENDS AND PAYOUT RATIOS PER COMMON SHARE
During the years ended December 31, 2017 and, 2016, and, 2015 the Holding Company’s Board of Directorswe declared a quarterly cash dividenddividends of $0.03 per common share.
These dividends were made pursuant to our existing dividend policy and in consideration of, among other things, earnings, regulatory capital levels, capital preservation and expected growth. The dividend rate will be reassessed periodically by the Board of Directors in accordance with the dividend policy. There is no assurance that future cash dividends on common shares will be declared or increased.
The following table presents cash dividends declared and dividend payoutpay-out ratios (dividends declared per common share divided by basic earnings per common share) for the years ended December 31.
2016 | 2015 | 2014 | 2017 | 2016 | 2015 | |||||||||||||||||||
Dividends declared per common share | $ | 0.12 | $ | 0.12 | $ | 0.12 | $ | 0.12 | $ | 0.12 | $ | 0.12 | ||||||||||||
Dividend payout ratio | 31 | % | 19 | % | 29 | % | 25 | % | 31 | % | 19 | % | ||||||||||||
BANK OF COMMERCE HOLDINGS & SUBSIDIARIES
OFF-BALANCE SHEET ARRANGEMENTS
Information regarding Off-Balance Sheet Arrangements is included in Note 16,15, Commitments and Contingencies in theNotes to Consolidated Financial Statements in this document.
CONCENTRATION OF CREDIT RISK
Information regarding Concentration of Credit Risk is included inNote 16,15, Commitments and Contingencies,in theNotes to Consolidated Financial Statements incorporated in this document.
BANK OF COMMERCE HOLDINGS & SUBSIDIARIES
LENDING TRANSACTIONS WITH RELATED PARTIES
The business we conduct with directors, officers, significant shareholders and other related parties (collectively, “Related Parties”) is restricted and governed by various laws and regulations, including 12 CFR Part 215 (Regulation O). Furthermore, it is our policy to conduct business with Related Parties on an arm’s length basis at current market prices with terms and conditions no more favorable than we provide in the normal course of business. See Note 28,27, Related Party Transactions in theNotes to Consolidated Financial Statements in this document for additional detail on lending transactions with related parties.
IMPACT OF INFLATION
Inflation affects ourour financial position as well as operating results. It is our opinion that the effects of inflation for the three years ended December 31, 20162017 on the financial statements have not been material.
CONTRACTUAL OBLIGATIONS AS OF DECEMBER 31, 2016:2017:
The following table presents a summary of significant contractual obligations as of December 31, 2016,2017, which mature as indicated.
Less Than | More Than | Indeterminate | Less Than | More Than | Indeterminate | |||||||||||||||||||||||||||||||||||||||||||
(Amounts in thousands) | One Year | 1 - 3 Years | 3 – 5 Years | 5 Years | Maturity (1) | Total | One Year | 1 - 3 Years | 3 – 5 Years | 5 Years | Maturity | Total | ||||||||||||||||||||||||||||||||||||
Deposits(1) | $ | 114,084 | $ | 72,200 | $ | 29,032 | $ | 74 | $ | 789,276 | $ | 1,004,666 | $ | 105,219 | $ | 60,642 | $ | 23,305 | $ | 89 | $ | 913,477 | $ | 1,102,732 | ||||||||||||||||||||||||
Term debt(2) | 917 | 2,000 | 6,000 | 10,000 | — | 18,917 | 1,000 | 6,096 | — | 10,000 | — | 17,096 | ||||||||||||||||||||||||||||||||||||
Junior subordinated debentures (3) | — | — | — | 10,310 | — | 10,310 | — | — | — | 10,310 | — | 10,310 | ||||||||||||||||||||||||||||||||||||
Operating lease obligations | 645 | 1,032 | 1,040 | 962 | — | 3,679 | 845 | 1,749 | 1,707 | 1,367 | — | 5,668 | ||||||||||||||||||||||||||||||||||||
Total | $ | 115,646 | $ | 75,232 | $ | 36,072 | $ | 21,346 | $ | 789,276 | $ | 1,037,572 | $ | 107,064 | $ | 68,487 | $ | 25,012 | $ | 21,766 | $ | 913,477 | $ | 1,135,806 | ||||||||||||||||||||||||
(1) Represents interest-bearing and noninterest-bearing checking, money market, savings and certificate of deposit accounts. |
RISK MANAGEMENT
Overview
Through our corporate governance structure, risk and return is evaluated to produce sustainable revenues, reduce risk of earnings volatility and increase shareholder value. The financial services industry is exposed to four major risks; liquidity, credit, market and operational. Liquidity risk is the inability to meet liability maturities and withdrawals, fund asset growth and otherwise meet contractual obligations at reasonable market rates. Credit risk is the inability of a customer to meet their repayment obligations or the inability of a bond issuer to meet their contractual repayment obligations. Market risk is the fluctuation in asset and liability values caused by changes in market prices and yields, and operational risk is the potential for losses resulting from events involving people, processes, technology, legal issues, external events, regulation, or reputation.
Board Committees
Our corporate governance structure begins with our Board of Directors. The Board of Directors evaluates risk through the Chief Risk Officer and our Enterprise Risk Management reporting and monitoring process (ERM). Our ERM is updated quarterly and compares our risk appetite and key risk indicators to actual results and to peer data. The Board of Directors also evaluates risk through a number of Board Committees including the following:
● | Audit and Qualified Legal Compliance Committee reviews the scope and coverage of internal and external audit activities. |
| ● | Loan Committee reviews credit risks in the loan portfolio and the adequacy of the Allowance for Loan and Lease Losses (“ALLL”). |
| ● | Asset/Liability Management Committee (“ALCO”) reviews liquidity risk, credit risk in the investment bond portfolio and market risk. |
| ● | Nominating and Corporate Governance Committee evaluates corporate governance structure, committee performance and evaluates recommendations for the appointment of director nominees. |
These committees review reports from management, our auditors, and other outside sources. On the basis of materials that are available to them and on which they rely, the committees review the performance of our management and personnel, and establish policies, but neither the committees nor their individual members (in their capacities as members of the Board of Directors) is responsible for daily operations of the Company.
BANK OF COMMERCE HOLDINGS & SUBSIDIARIES
Management Committees
To ensure that our risk management goals and objectives are accomplished, oversight of our risk taking and risk management activities are conducted through a number of management committees comprised of members of management including the following.
● | The Senior Management Committee establishes short and long-term strategies and operating plans. The committee establishes performance measures and reviews performance to plan on a monthly basis. The committee is also responsible for evaluating operational risk assessments and approving and implementing mitigating action plans. |
| ● | The Asset Liability Roundtable establishes and monitors liquidity ranges, pricing, maturities, investment goals, and interest spread on balance sheet accounts. |
| ● | The SOX 404 Compliance Committee has established the master plan for full documentation of our internal controls and compliance with Section 404 of the Sarbanes-Oxley Act of 2002. |
Risk Management Controls
We use various controls and our ERM to manage risk exposure within the Company. Budgeting and variance analyses and key performance indicators provide an early indication of unfavorable results or heightened risk levels. Models are used to estimate market risk and net interest income sensitivity. Segmentation analysis is an important tool used to estimate expected and unexpected credit losses. Compliance with regulatory guidelines plays a significant role in risk management as well as corporate culture and the actions of management. Our code of ethics provides guidelines for all employees to use to ensure that they conduct themselves with the highest integrity in the delivery of service to our clients.
Liquidity Risk Management
Liquidity Risk
Liquidity risk is the inability to meet liability maturities, deposit withdrawals, fund asset growth or otherwise meet contractual obligations at reasonable market rates. Liquidity management involves maintaining ample and diverse funding capacity, liquid assets and other sources of cash to accommodate fluctuations in asset and liability levels due to business shocks or unanticipated events. ALCO is responsible for establishing our liquidity policy and the Bank’s internal ALCO Roundtable group is responsible for planning and executing the funding activities and strategies.
The Bank’s liquid assets consist of cash and amounts due from banks, cash from repayments and maturities of loans, short-term money market investments, sales of available-for-sale securities and cash flows from principal repayment and maturities of investments. Liquidity is generated from liabilities through deposit growth and term debt borrowings. Deposit marketing strategies are reviewed for consistency with liquidity policy objectives.
The Bank has secondary sources of liquidity available from correspondent banking lines of credit, a secured line of credit with the Federal Reserve Bank and a secured borrowing line with the Federal Home Loan Bank of San Francisco. While these sources are expected to continue to provide significant amounts of secondary liquidity in the future, their availability, as well as the possible use of other sources, is dependent on future economic and market conditions, pledging of acceptable collateral and maintenance of required minimum capital ratios.
The Holding Company currently holds $24.0 million from our May 2017 public offering. Historically, the Holding Company’s principal source of cash has been dividends received from the Bank, which it has consistently received for many years. See Item 1A Risk Factors and Note 20 Regulatory Capital in the Notes to Consolidated Financial Statements in this document for a discussion of the restrictions on the Bank’s ability to pay dividends.
To accommodate future growth and business needs, we develop an annual capital expenditure budget during strategic planning sessions. Based on our budgets and forecasts, we believe that our earnings, acquisition of core deposits and wholesale borrowing arrangements will be sufficient to support liquidity needs in 2018.
Term Debt
Federal Home Loan Bank of San Francisco borrowings
We periodically utilize Federal Home Loan Bank of San Francisco advances as a source of wholesale funding to provide temporary liquidity. As of December 31, 2017, the Bank had no Federal Home Loan Bank of San Francisco advances outstanding. See Note 17, Federal Funds Purchased and Lines of Credit in the Notes to Consolidated Financial Statements for information on our Federal Home Loan Bank of San Francisco borrowings and our remaining line of credit.
During the fourth quarter of 2015, the Holding Company redeemed $20.0 million of preferred stock by entering into a senior debt loan agreement to borrow $10.0 million from another financial institution and issuing $10.0 million of Subordinated Notes. The details are as follows:
Senior Debt
In December of 2015, the Holding Company, entered into a senior debt loan agreement to borrow $10.0 million. The original loan terms required monthly principal installments of $83 thousand, plus accrued and unpaid interest, commencing on January 1, 2016 and continuing to and including December 10, 2020. A final scheduled payment of $5.0 million is due on the maturity date of December 10, 2020. The loan may be prepaid in whole or in part at any time without any prepayment premium or penalty. The principal amount of the loan bears interest at a variable rate, resetting monthly that is equal to the sum of the current three month LIBOR plus 400 basis points. The Holding Company incurred senior debt issuance costs of $15 thousand which are being amortized over the life of the loan as additional interest expense.
BANK OF COMMERCE HOLDINGS & SUBSIDIARIES
Subordinated Debt
In December of 2015, the Holding Company issued $10.0 million in aggregate principal amount of fixed to floating rate Subordinated Notes due December 10, 2025. The Subordinated Debt initially bears interest at 6.88% per annum for a five-year term, payable semi-annually. Thereafter, interest on the Subordinated Debt will be paid at a variable rate equal to three month LIBOR plus 526 basis points, payable quarterly until the maturity date. The notes qualify as Tier 2 capital under the capital adequacy rules and regulations issued by the Federal Reserve. The Holding Company incurred subordinated debt issuance costs of $210 thousand which are being amortized over the initial five year term as additional interest expense.
Term debt at December 31, 2017, 2016 and capital lease.(3) Represents2015 consisted of the issued amountfollowing:
(Amounts in thousands) | 2017 | 2016 | 2015 | |||||||||
Federal Home Loan Bank of San Francisco borrowings | $ | — | $ | — | $ | 75,000 | ||||||
Senior debt | 7,096 | 8,917 | 9,917 | |||||||||
Less unamortized debt issuance cost | (6 | ) | (12 | ) | (15 | ) | ||||||
Subordinated debt | 10,000 | 10,000 | 10,000 | |||||||||
Less unamortized debt issuance cost | (132 | ) | (172 | ) | (208 | ) | ||||||
Total term debt at December 31, | $ | 16,958 | $ | 18,733 | $ | 94,694 | ||||||
The following table presents the weighted average contractual interest rates on outstanding borrowings for the years ended December 31, 2017, 2016 and 2015.
2017 | 2016 | 2015 | ||||||||||
Federal Home Loan Bank of San Francisco borrowings | 0.88 | % | 0.51 | % | 0.29 | % | ||||||
Senior debt | 5.21 | % | 4.68 | % | 4.50 | % | ||||||
Subordinated debt | 6.88 | % | 6.88 | % | 6.88 | % | ||||||
The following table presents the maximum outstanding balance at any month end, average balance during the year and effective weighted average interest rate during the year on outstanding term debt for the years ended December 31, 2017, 2016 and 2015.
(Amounts in thousands) | 2017 | 2016 | 2015 | |||||||||
Federal Home Loan Bank of San Francisco borrowings: | ||||||||||||
Maximum outstanding at any month end | $ | 10,000 | $ | 80,000 | $ | 120,000 | ||||||
Average balance during the year | $ | 302 | $ | 18,075 | $ | 87,671 | ||||||
Effective weighted average interest rate during year | 0.88 | % | 2.73 | % | 1.91 | % | ||||||
Senior debt net of unamortized debt issuance costs: | ||||||||||||
Maximum outstanding at any month end | $ | 8,822 | $ | 9,819 | $ | 9,902 | ||||||
Average balance during the year | $ | 8,132 | $ | 9,400 | $ | 82 | ||||||
Effective weighted average interest rate during year | 5.34 | % | 4.79 | % | 4.55 | % | ||||||
Subordinated debt net of unamortized debt issuance costs: | ||||||||||||
Maximum outstanding at any month end | $ | 9,868 | $ | 9,829 | $ | 9,792 | ||||||
Average balance during the year | $ | 9,849 | $ | 9,811 | $ | 1,121 | ||||||
Effective weighted average interest rate during year | 7.38 | % | 7.38 | % | 7.38 | % | ||||||
The Bank’s effective weighted average interest rate on Federal Home Loan Bank of San Francisco borrowings includes the effect of hedge losses reclassified out other comprehensive income. During March of 2016, we terminated all junior subordinated debentures.of our interest rate swaps (active and forward starting, the “hedging” instrument) and simultaneously paid off the $75.0 million Federal Home Loan Bank of San Francisco borrowing (the “hedged instrument”).
Credit Risk Management
Credit risk arises from the inability of a loan customer to meet their repayment obligations or the inability of a bond issuer to meet their contractual repayment obligations. Credit risk exists in our outstanding loans, letters of credit, Federal Home Loan Bank of San Francisco affordable housing grant sponsorships, unfunded loan commitments, deposits with other institutions and investment bond portfolio. In all of these areas we manage credit risk based on the risk profile of the borrower/grantee/issuer, repayment sources and the nature of the underlying collateral given current events and conditions. We rely on various controls including our underwriting standards, loan policies, internal loan monitoring, ALLL methodology and credit reviews to manage credit risk.
Concentrations of credit risk
We grant real estate construction, commercial, and installment loans to customers throughout northern California. In our judgment, a concentration exists in real estate related loans, which represented approximately 77% and 75% of our gross loan portfolio at December 31, 2017 and December 31, 2016.
Commercial real estate concentrations are managed to assure wide geographic and business diversity. Although management believes such concentrations have no more than the normal risk of collectability, a substantial decline in the economy in general, material increases in interest rates, changes in tax policies, tightening credit or refinancing markets, or a decline in real estate values in our principal market areas in particular, could have an adverse impact on the repayment of these loans. Personal and business incomes, proceeds from the sale of real property, or proceeds from refinancing, represent the primary sources of repayment for a majority of these loans.
We recognize the credit risks inherent in dealing with other depository institutions. Accordingly, to prevent excessive exposure to other depository institutions in aggregate or to any single correspondent, we have established general standards for selecting correspondent banks as well as internal limits for allowable exposure to other depository institutions in aggregate or to any single correspondent. In addition, we have an investment policy that sets forth limitations that apply to all investments with respect to credit rating and concentrations with an issuer.
BANK OF COMMERCE HOLDINGS & SUBSIDIARIES
Loan portfolio
Credit risk management for the loan portfolio begins with an assessment of the credit risk profile of each individual borrower based on an analysis of the borrowerItem’s financial position in light of current industry, economic or geopolitical trends. As part of the overall credit risk assessment of a borrower, each credit is assigned a risk grade and is subject to approval based on our existing credit approval standards. Risk grading is a significant factor in determining the adequacy of the ALLL.
Credit decisions are made by our Credit Administration subject to certain limitations and, when those limitations are encountered, the approvals are made by the Board Loan Committee. Credit risk is continuously monitored by Credit Administration for possible adjustment of a loan risk grade if there has been a change in the borrower’s ability to perform under the terms of their obligation. Additionally, we may manage the size of our credit exposure through loan sales and loan participation agreements.
Our specific underwriting standards and methods for each principal line of lending include industry-accepted analysis and modeling and certain proprietary techniques. Our underwriting criteria are designed to comply with applicable regulatory guidelines, including required loan-to-value ratios. Our credit administration policies contain mandatory lien position and debt service coverage requirements, and we generally require a guarantee from individuals owning 20% or more of the borrowing entity. Our evaluations of our borrowers’ are facilitated by management’s knowledge of local market conditions and periodic reviews by a consultant of our credit administration policies.
Allowance for loan and lease losses
The ALLL represents management’s best estimate of probable losses in the loan portfolio. Within the allowance, reserves are allocated to segments of the portfolio based on specific formula components. Changes to the ALLL are reported in the Consolidated Statements of Income in the line item provision for loan and lease losses.
We perform periodic and systematic detailed evaluations of our lending portfolio to identify and estimate the inherent risks and assess the overall collectability. We evaluate the following:
● | General conditions such as the portfolio composition, size and maturities of various segmented portions of the portfolio such as secured, unsecured, construction, and Small Business Administration. |
| ● | Concentrations of borrowers, industries, geographical sectors, loan product, loan classes and collateral types. |
| ● | Volume and trends in the aggregate of loan delinquencies, nonaccruals, and watch, criticized and classified loans |
Our ALLL is the accumulation of various components that are calculated based upon independent methodologies. All components of the ALLL represent an estimation based on certain observable data that management believes most reflects the underlying credit losses being estimated. Changes in the amount of each component of the ALLL are directionally consistent with changes in the observable data, taking into account the interaction of the components over time.
An essential element of the methodology for determining the ALLL is our credit risk evaluation process, which includes credit risk grading of individual, commercial, construction, commercial real estate, and consumer loans. Loans are assigned credit risk grades based on our assessment of conditions that affect the borrower’s ability to meet its contractual obligations under the loan agreement. That process includes reviewing borrower’s current financial information, historical payment experience, credit documentation, public information, and other information specific to each individual borrower. Loans are reviewed on an annual or rotational basis or as management becomes aware of information affecting the borrower’s ability to fulfill its obligations. Credit risk grades carry a dollar weighted risk percentage.
For individually impaired loans, we measure impairment based on the present value of expected future principal and interest cash flows discounted at the loan’s effective interest rate, except that as a practical expedient, a creditor may measure impairment based on a loan’s observable market price or the fair value of collateral, if the loan is collateral dependent. When developing the estimate of future cash flows for a loan, we consider all available information reflecting past events and current conditions, including the effect of existing environmental factors. In addition to the ALLL, an allowance for unfunded loan commitments and letters of credit is determined using estimates of the probability of funding and the associated inherent credit risk. This reserve is carried as a liability on the Consolidated Balance Sheets.
We make provisions to the ALLL as necessary through charges to operations that are reflected in our Consolidated Statements of Income as provision for loan and lease loss expense. When a loan is deemed uncollectible, it is charged against the allowance. Any recoveries of previously charged off loans and leases are credited back to the allowance. There is no precise method of predicting specific losses or amounts that ultimately may be charged off on particular categories of the loan and lease portfolio.
Various regulatory agencies periodically review our ALLL as an integral part of their examination process. Such agencies may require us to provide additions to the allowance based on their judgment of information available to them at the time of their examination. There is uncertainty concerning future economic trends. Accordingly, it is not possible to predict the effect future economic trends may have on the level of the provisions for loan and lease losses in future periods. The ALLL should not be interpreted as an indication that charge-offs in future periods will occur in the stated amounts or proportions.
Federal Home Loan Bank of San Francisco Affordable Housing Grant Sponsorships
As part of satisfying our CRA responsibilities, we are a sponsor for various nonprofit organizations which receive cash grants from the Federal Home Loan Bank of San Francisco. Those grants require the nonprofit organization to comply with stipulated conditions of the grant over specified periods of time which typically vary from 10 to 15 years. If the nonprofit organization fails to comply, Federal Home Loan Bank of San Francisco can require us to refund the amount of the grant to Federal Home Loan Bank of San Francisco. To mitigate this contingent credit risk, Credit Administration underwrites the financial strength of the nonprofit organization and reviews their systems of internal control to determine, as best as is possible, that they will not fail to comply with the conditions of the grant.
BANK OF COMMERCE HOLDINGS & SUBSIDIARIES
Securities Portfolio
To manage credit risk in the securities portfolio, we have an investment policy that sets forth limitations that apply to all investments with respect to credit rating and concentrations with an issuer. We perform a pre-purchase analysis on all bonds not secured by the U.S. Government or Agency of the U.S. Government to ensure that the investment meets our credit risk requirements and repayment expectations. We perform annual and quarterly credit reviews to ensure our investments continue to meet our credit risk requirements and repayment expectations.
Deposits With Other Institutions
We recognize the credit risks inherent in dealing with other depository institutions. Accordingly, to prevent excessive exposure to other depository institutions in aggregate or to any single correspondent, we have established general standards for selecting correspondent banks as well as internal limits for allowable exposure to other depository institutions in aggregate or to any single correspondent.
Market Risk Management
General
Market risk is the potential loss due to adverse changes in market prices and interest rates. Market risk is inherent in our operating positions and activities including customers’ loans, deposit accounts, securities and long-term debt. Loans and deposits generate income and expense, respectively, and the value of cash flows changes based on general economic levels, and most importantly, the level of interest rates.
The goal for managing our assets and liabilities is to maximize shareholder value and earnings while maintaining a high quality balance sheet without exposing the Company to undue interest rate risk. The absolute level and volatility of interest rates can have a significant impact on our profitability. Market risk arises from exposure to changes in interest rates, exchange rates, commodity prices, and other relevant market rate or price risk. We do not operate a trading account, and do not hold a position with exposure to foreign currency exchange.
We face market risk through interest rate volatility. Net interest income, or margin risk, is measured based on rate shocks over varying time horizons versus a current stable interest rate environment. Assumptions used in these calculations are similar to those used in the planning and budgeting model. The overall interest rate risk position and strategies are reviewed on an ongoing basis with ALCO.
Securities Portfolio
The securities portfolio is central to our asset liability management strategies. The decision to purchase or sell securities is based upon our assessment of current and projected economic and financial conditions, including the interest rate environment, liquidity, changes in a security’s credit rating, the risk weighting of a security and other regulatory requirements. We classify our securities as “available-for-sale” or “held-to-maturity” at the time of purchase. We do not engage in trading activities. Securities held-to-maturity are carried at amortized cost. Securities available-for-sale may be sold to implement our asset liability management strategies and in response to changes in interest rates, prepayment rates, and similar factors. Securities available-for-sale are recorded at fair value and unrealized gains or losses, net of income taxes, are reported as a component of accumulated other comprehensive income (loss), in a separate component of shareholders’ equity. Gain or loss on sale of securities is calculated on the specific identification method.
Operational Risk Management
Operational risk is the potential for loss resulting from events involving people, processes, technology, legal or regulatory issues, external events, and reputation. In keeping with the corporate governance structure, the Senior Leadership committee is responsible for operational risk controls. Operational risks are managed through specific policies and procedures, controls and monitoring tools. Examples of these include reconciliation processes, transaction monitoring and analysis and system audits. Operational risks fall into two major categories, business specific and company-wide. The Senior Leadership committee works to ensure consistency in policies, processes and assessments. With respect to company-wide risks, the Senior Leadership committee works directly with members of our Board of Directors to develop policies and procedures for information security, business resumption plans, compliance and legal issues.
SUMMARY OF CRITICAL ACCOUNTING POLICIES
Our significant accounting policies are described in Note 2 Summary of Significant Accounting Policies in the Notes to Consolidated Financial Statements in this document. Some of these significant accounting policies are considered critical and require management to make difficult, subjective or complex judgments or estimates. Management believes that the following policies would be considered critical under the SEC’s definition.
Valuation of Investments and Impairment of Securities
At the time of purchase, we designate a security as held-to-maturity or available-for-sale, based on our investment objectives, operational needs and intent to hold. We do not engage in trading activity. Securities designated as held-to-maturity are carried at amortized cost. We have the ability and intent to hold these securities to maturity. Securities designated as available-for-sale may be sold to implement our asset/liability management strategies and in response to changes in interest rates, prepayment rates and similar factors. Securities designated as available-for-sale are recorded at fair value and unrealized gains or losses, net of income taxes, are reported as part of accumulated other comprehensive income (loss), a separate component of shareholders’ equity. Gains or losses on sale of securities are based on the specific identification method. The market value and underlying rating of the security is monitored to identify changes in quality.
Securities may be adjusted to reflect changes in valuation as a result of other-than-temporary declines in value. Investments with fair values that are less than amortized cost are considered impaired. Impairment may result from either a decline in the financial condition of the issuing entity or, in the case of fixed rate investments, from changes in interest rates. At each financial statement date, management assesses each investment to determine if impaired investments are temporarily impaired or if the impairment is other-than-temporary based upon the positive and negative evidence available. Evidence evaluated includes, but is not limited to, industry analyst reports, credit market conditions, and interest rate trends.
BANK OF COMMERCE HOLDINGS & SUBSIDIARIES
When an investment is other-than-temporarily impaired, we assess whether we intend to sell the security, or it is more likely than not that we will be required to sell the security before recovery of its amortized cost basis less any current-period credit losses. If we intend to sell the security or if it is more likely than not that we will be required to sell security before recovery of the amortized cost basis, the entire amount of other-than-temporary impairment is recognized in earnings.
For debt securities that are considered other-than-temporarily impaired and that we do not intend to sell and will not be required to sell prior to recovery of our amortized cost basis, we separate the amount of the impairment into the amount that is credit related (credit loss component) and the amount due to all other factors. The credit loss component is recognized in earnings and is calculated as the difference between the investment’s amortized cost basis and the present value of its expected future cash flows.
The remaining differences between the investment’s fair value and the present value of future expected cash flows is deemed to be due to factors that are not credit related and is recognized in other comprehensive income. Significant judgment is required in the determination of whether other-than-temporary impairment has occurred for an investment. We follow a consistent and systematic process for determining other-than-temporary impairment loss. We have designated the ALCO responsible for the other-than-temporary evaluation process.
The ALCO’s assessment of whether other-than-temporary impairment loss should be recognized incorporates both quantitative and qualitative information including, but not limited to: (1) the length of time and the extent of which the fair value has been less than amortized cost, (2) the financial condition and near term prospects of the issuer, (3) our intent and ability to retain the investment for a period of time sufficient to allow for an anticipated recovery in value, (4) whether the debtor is current on interest and principal payments, and (5) general market conditions and industry or sector specific outlook. See Note 4 Securities in the Notes to Consolidated Financial Statements in this document for further detail on other-than-temporary impairment and the securities portfolio.
Allowance for Loan and Lease Losses
The ALLL is based upon estimates of loan and lease losses and is maintained at a level considered adequate to provide for probable losses inherent in the outstanding loan portfolio. The allowance is increased by provisions charged to expense and reduced by net charge-offs. In periodic evaluations of the adequacy of the allowance balance, management considers our past loan and lease loss experience by type of credit, known and inherent risks in the portfolio, adverse situations that may affect the borrower's ability to repay, the estimated value of any underlying collateral, current economic conditions and other factors.
Management reviews the ALLL on a monthly basis and conducts a formal assessment of the adequacy of the ALLL on a quarterly basis. These assessments include the periodic re-grading of classified loans based on changes in their individual credit characteristics including delinquency, seasoning, recent financial performance of the borrower, economic factors, changes in the interest rate environment and other factors as warranted. Loans are initially graded when originated. Loans are reviewed as they are renewed, when there is a new loan to the same borrower and/or when identified facts demonstrate heightened risk of default. Confirmation of the quality of our grading process is obtained by independent reviews conducted by outside consultants specifically hired for this purpose and by periodic examination by various bank regulatory agencies. Management monitors delinquent loans continuously and identifies problem loans to be evaluated individually for impairment testing. For loans that are determined impaired, formal impairment measurement is performed at least quarterly on a loan-by-loan basis.
Our method for assessing the appropriateness of the allowance includes specific allowances for identified problem loans, an allowance factor for categories of credits and allowances for changing environmental factors (e.g., portfolio trends, concentration of credit, growth, economic factors). Allowances for identified problem loans are based on specific analysis of individual credits. Loss estimation factors for unimpaired loan categories are based on analysis of historical losses adjusted for changing environmental factors applicable to each loan category. Allowances for changing environmental factors are management's best estimate of the probable impact these changes would have on the loan portfolio as a whole. See Note 5 Loans in the Notes to Consolidated Financial Statements in this document for further detail on the ALLL and the loan portfolio.
Income Taxes
Income taxes reported in the consolidated financial statements are computed based on an asset and liability approach. We recognize the amount of taxes payable or refundable for the current year, and deferred tax assets and liabilities for the expected future tax consequences that have been recognized in the consolidated financial statements. Under this method, deferred tax assets and liabilities are determined based on the differences between the consolidated financial statements and the tax basis of assets and liabilities using enacted tax rates in effect for the year in which the differences are expected to reverse. We record net deferred tax assets to the extent it is more likely than not that they will be realized. In evaluating our ability to recover the deferred tax assets, management considers all available positive and negative evidence, including projected future taxable income, tax planning strategies and recent financial operations.
In projecting future taxable income, management develops assumptions including the amount of future state and federal pre-tax operating income, the reversal of temporary differences and the implementation of feasible and prudent tax planning strategies. These assumptions require significant judgment about the forecasts of future taxable income and are consistent with the plans and estimates being used to manage the underlying business. We file consolidated federal and state income tax returns.
BANK OF COMMERCE HOLDINGS & SUBSIDIARIES
ASC 740-10-55 Income Taxes requires a two-step process that separates recognition from measurement of tax positions. We recognize the financial statement effect of a tax position when it is more likely than not, based on the technical merits, that the position will be sustained upon examination by a taxing authority. The measurement process is applied only after satisfying the recognition requirement and determines what amount of a tax position will be sustainable upon a potential examination or settlement. If upon measuring, the tax position produces a range of potential tax benefits, we may claim the highest tax benefit from that range as long as it is over 50% likely to be realized using a probability analysis.
We believe that all of the tax positions we have taken, meet the more likely than not recognition threshold. To the extent tax authorities disagree with these tax positions, our effective tax rates could be materially affected in the period of settlement with the taxing authorities. See Note 23 Income Taxes in the Notes to Consolidated Financial Statements in this document for further detail on our income taxes.
Fair Value Measurements
We use fair value measurements to record fair value adjustments to certain assets and liabilities, and to determine fair value disclosures. We base our fair values on the price that would be received to sell an asset or paid to transfer a liability in an orderly transaction between market participants at the measurement date. Securities available-for-sale and derivatives are recorded at fair value on a recurring basis. Additionally, from time to time, we may be required to record certain assets at fair value on a nonrecurring basis, such as certain impaired loans held for investment, (“OREO”), core deposit intangible and goodwill. These nonrecurring fair value adjustments typically involve write-downs of individual assets due to application of lower of cost or market accounting.
We have established and documented a process for determining fair value. We maximize the use of observable inputs and minimize the use of unobservable inputs when developing fair value measurements. Whenever there is no readily available market data, we use our best estimate and assumptions in determining fair value, but these estimates involve inherent uncertainties and the application of management’s judgment. As a result, if other assumptions had been used, our recorded earnings or disclosures could have been materially different from those reflected in these consolidated financial statements. Additional information on our use of fair value measurements and our related valuation methodologies is provided in Note 22 Fair Values in the Notes to Consolidated Financial Statements incorporated in this document.
Item 7a - Quantitative and Qualitative Disclosures about Market Risk
Market risk is the risk that values of assets and liabilities or revenues will be adversely affected by changes in market conditions such as interest rates. The risk is inherent in the financial instruments associated with our operations and activities includingincluding loans, deposits, securities, short-term borrowings and long-term debtdebt. We do not operate a securities trading account and derivatives.do not hold a position with exposure to foreign currency exchange or commodities. Market-sensitive assets and liabilities are generated through loans and deposits associated with our banking business, our asset liability management process, and credit risk mitigation activities. Traditional loan and deposit products are reported at amortized cost for assets or the amount owed for liabilities. These positions are subject to changes in economic value based on varying market conditions. Interest rate risk is the effect of changes in economic value of our loans and deposits, as well as our other interest rate sensitive instruments and is reflected in the levels of future income and expense produced by these positions versus levels that would be generated by current levels of interest rates. We seek to mitigate interest rate risk as part of the asset liability management process.
Interest rate risk represents the most significant market risk exposure to our financial instruments. Our overall goal is to manage interest rate sensitivity so that movements in interest rates do not adversely affect net interest income. Interest rates risk is measured as the potential volatility in our net interest income caused by changes in market interest rates. Lending and deposit gathering creates interest rate sensitive positions on our balance sheet. Interest rate risk from these activities as well as the impact of ever changing market conditions is mitigated using the asset liability management process. We do not operate a trading account and do not hold a position with exposure to foreign currency exchange or commodities. We face market risk through interest rate volatility.
The Board of Directors has overall responsibility for our interest rate risk management policies. We have an Asset/Liability Management Committee (“ALCO”) which establishes and monitors guidelines to control theour sensitivity of earnings to changes in interest rates. TheOur internal ALCO Roundtable group maintains aforecasts net interest income forecast using different rate scenarios via a simulation model. This group updates the net interest income forecast for changing assumptions and differing outlooks based on economic and market conditions.
The simulation model used includes measures of the expected re-pricing characteristics of administeredour rate (interest-bearing demand, savings and money market accounts) and non-related products (demand deposit accounts, othersensitive assets and other liabilities).liabilities. These measuresre-pricing characteristics recognize the relative sensitivity of these accountsassets and liabilities to changes in market interest rates, as demonstrated through current and historical experience and recognizing the timing differences of rate changes. In the simulation of net interest margin and net interest income the forecast balance sheet is processed against fivenine possible rate scenarios. These fivenine rate scenarios include a flat rate environment, which assumes interest rates are unchanged in the future and foureight additional rate ramp scenarios ranging for + 400from +400 to - 400-400 basis points in 100 basis point increments, unless the rate environment cannot move in these basis point increments before reachingincrements. The model does not simulate for rates below zero.
BANK OF COMMERCE HOLDINGS & SUBSIDIARIES
The formal policies and practices we have adopted to monitor and manage interest rate risk exposure measurerely on measuring risk in two ways: (1) re-pricing opportunities for earning assets and interest-bearing liabilities, and (2)the impact of changes in net interest income for declining interest rate shocks of 100 to 400 basis points. Because of our predisposition to variable rate pricing and noninterest-bearing demand deposit accounts, we are normally considered asset sensitive. However, with the current low interest rate environment, the market rates on many of our variable-rate loans are below their respective floors. Consequently, we would not immediately benefit in a rising rate environment. Additionally, we have some variable rate term debt. As such, we are currently considered neutral to slightly liability sensitive in the 100bp to 300bp upward rate shock and liability sensitive in a 400bp upward rate shock. As a result, management anticipates that, in a rising interest rate environment, our net interest income, and margin would generally be expected to decline, as well as(2) the impact of changes in a decliningrates on the fair value of equity. In moderately rising interest rate environment. However, givenscenarios the model indicates that the company is essentially interest rate neutral. In more rapidly rising interest rate scenarios however, the model assumes a static balance sheet, no assurance can be givenindicates that under such circumstances we would experience the described relationships to declining or increasing interest rates.company is slightly liability sensitive.
To estimate the effect
BANK OF COMMERCE HOLDINGS & SUBSIDIARIES
The Federal Reserve currently has the federal funds rate targeted between 50125 and 75150 basis points. Accordingly, we are focused on the effects of increasing interest rate shocks on our net interest income during a rising rate environment. The most recent model results as of December 31, 2016,2017, indicate the estimated annualized increase in net interest income attributable to a 100 or 200 basis point increase in the federal funds rate was $193$510 thousand and $410$231 thousand, respectively. The model also shows an annualized decrease in net interest income attributable to a 300 or 400 basis point increase in the fed funds rate of $1.9$2.1 million and $4.4$4.8 million, respectively.
The model we utilize to create the analysis described It is currently unlikely that interest rates will decline in the preceding paragraphs uses balance sheet simulation to estimate the impact of changing rates on our projected annual net interest income Actual results will differ from simulated results due to timing, magnitude, and frequency of interest rate changes as well as changes in market conditions and management strategies.
The ALCO has established a policy limitation to interest rate risk of -28% of net interest income and -30% of the present value of equity in a rising 400 basis point scenario. The securities portfolio is integral to our asset liability management process. The decision to purchase or sell securities is based upon the current assessment of economic and financial conditions, including the interest rate environment, liquidity, regulatory requirements and the relative mix of our cash positions.
BANK OF COMMERCE HOLDINGS & SUBSIDIARIES
The following table sets forthnear future. However, the most recent model results as of December 31, 2016 relating2017, indicate the estimated annualized reduction in net interest income attributable to a 100, or 200 basis point decline in the distribution of re-pricing opportunities for our earning assetsfederal funds rate was $986 thousand and interest-bearing liabilities. It also reports$2.0 million, respectively. Given that the GAP (different volumes ofmodel assumes a static balance sheet, relies on historic betas and assumes immediate parallel rate sensitive assets and liabilities) re-pricing interest earning assets and interest-bearing liabilities at different time intervals,changes, no assurance can be given that future performance will mirror the cumulative GAP, the ratio of rate sensitive assets to rate sensitive liabilities for each re-pricing interval, and the cumulative GAP to total assets.
Gap Analysis | ||||||||||||||||||||
Within 3 | 3 Months To | One Year To | Over Five | |||||||||||||||||
(Amounts in thousands) | Months | One Year | Five Years | Years | Total | |||||||||||||||
Interest earning assets | ||||||||||||||||||||
Total AFS securities | $ | 34,898 | $ | 18,604 | $ | 89,921 | $ | 31,751 | $ | 175,174 | ||||||||||
Total other investments | 52,209 | 1,008 | 10,528 | 19,431 | 83,176 | |||||||||||||||
Total Loans, net of deferred fees and costs | 112,797 | 140,715 | 408,076 | 143,947 | 805,535 | |||||||||||||||
Total earning assets | 199,904 | 160,327 | 508,525 | 195,129 | $ | 1,063,885 | ||||||||||||||
Interest bearing liabilities | ||||||||||||||||||||
Total demand – interest | 405,569 | — | — | — | $ | 405,569 | ||||||||||||||
Total savings accounts | 113,309 | — | — | — | 113,309 | |||||||||||||||
Total certificates of deposit | 37,536 | 77,061 | 100,719 | 74 | 215,390 | |||||||||||||||
Term debt and junior subordinated debentures, net | 19,216 | (32 | ) | 9,859 | — | 29,043 | ||||||||||||||
Total interest bearing deposits and borrowings | $ | 575,630 | $ | 77,029 | $ | 110,578 | $ | 74 | $ | 763,311 | ||||||||||
Re-pricing GAP | $ | (375,726 | ) | $ | 83,298 | $ | 397,947 | $ | 195,055 | $ | 300,574 | |||||||||
Cumulative re-pricing GAP | $ | (375,726 | ) | $ | (292,428 | ) | $ | 105,519 | $ | 300,574 | ||||||||||
Gap ratio | 0.35 | 2.08 | 4.60 | 2,636.88 | 1.39 | |||||||||||||||
Cumulative gap ratio | 0.35 | 0.55 | 1.14 | 1.39 | ||||||||||||||||
Gap as % of earning assets | (35 | )% | 8 | % | 37 | % | 18 | % | 28 | % | ||||||||||
Cumulative GAP as % of earning assets | (35 | )% | (27 | )% | 10 | % | 28 | % | ||||||||||||
model.
We believe that the short duration of our rate-sensitive assets and liabilities contributes to our ability to re-price a significant amount of our rate-sensitive assets and liabilities and mitigate the impact of rate changes inin excess of 100, 200, 300, or 400 basis points. The model’s primary benefit to management is its assistance in evaluating the impact that future strategies with respect to our mix and level of rate-sensitive assets and liabilities will have on our net interest income.
Our approach to managing interest rate risk may include the use of derivatives, including interest rate swaps, caps and floors. This helps to minimize significant, unplanned fluctuations in earnings, fair values of assets and liabilities and cashcash flows caused by interest rate volatility. This approach involves a financial instrument with the same characteristics of certain assets and liabilities so that changes in interest rates do not have a significant adverse effect on the net interest margin and cash flows. As a result of interest rate fluctuations, hedged assets and liabilities will gain or lose market value. In a fair value hedging strategy, the effect of this unrealized gain or loss will generally be offset by income or loss on the derivatives linked to the hedged assets and liabilities. For a cash flow hedge, the change in the fair value of the derivative to the extent that it is effective is recorded through other comprehensive income.
At inception, the relationship between hedging instrumentsinstruments and hedged items is formally documented with our risk management objective, strategy and our evaluation of effectiveness of the hedge transactions. This includes linking all derivatives designated as fair value or cash flow hedges to specific assets and liabilities on the balance sheet or to specific transactions. Periodically, as required, we formally assess whether the derivative we designated in the hedging relationship is expected to be and has been highly effective in offsetting changes in fair values or cash flows of the hedged item.
The following table sets forth as of December 31, 2017 the distribution of re-pricing opportunities for our earning assets and interest-bearing liabilities. It also reports the GAP (different volumes of rate sensitive assets and liabilities) re-pricing interest-earning assets and interest-bearing liabilities at different time intervals, the cumulative GAP, the ratio of rate sensitive assets to rate sensitive liabilities for each re-pricing interval, and the cumulative GAP to total assets.
BANK OF COMMERCE HOLDINGS & SUBSIDIARIES
Gap Analysis | ||||||||||||||||||||
Within 3 | 3 Months To | One Year To | Over Five | |||||||||||||||||
(Amounts in thousands) | Months | One Year | Five Years | Years | Total | |||||||||||||||
Interest-earning assets | ||||||||||||||||||||
Total AFS securities | $ | 50,067 | $ | 20,843 | $ | 113,568 | $ | 83,476 | $ | 267,954 | ||||||||||
Total other investments | 48,991 | — | — | — | 48,991 | |||||||||||||||
Total Loans, net of deferred fees and costs | 208,771 | 116,492 | 397,091 | 159,191 | 881,545 | |||||||||||||||
Total earning assets | 307,829 | 137,335 | 510,659 | 242,667 | $ | 1,198,490 | ||||||||||||||
Interest-bearing liabilities | ||||||||||||||||||||
Total demand – interest | 496,990 | — | — | — | $ | 496,990 | ||||||||||||||
Total savings accounts | 110,837 | — | — | — | 110,837 | |||||||||||||||
Total certificates of deposit | 53,353 | 53,751 | 82,062 | 89 | 189,255 | |||||||||||||||
Term debt and junior subordinated debentures, net | 10,899 | 1,765 | 14,604 | — | 27,268 | |||||||||||||||
Total interest-bearing deposits and borrowings | $ | 672,079 | $ | 55,516 | $ | 96,666 | $ | 89 | $ | 824,350 | ||||||||||
Re-pricing GAP | $ | (364,250 | ) | $ | 81,819 | $ | 413,993 | $ | 242,578 | $ | 374,140 | |||||||||
Cumulative re-pricing GAP | $ | (364,250 | ) | $ | (282,431 | ) | $ | 131,562 | $ | 374,140 | ||||||||||
Gap ratio | 0.46 | 2.47 | 5.28 | 2,726.60 | 1.45 | |||||||||||||||
Cumulative gap ratio | 0.46 | 0.61 | 1.16 | 1.45 | ||||||||||||||||
Gap as % of earning assets | (30 | %) | 7 | % | 35 | % | 20 | % | 31 | % | ||||||||||
Cumulative GAP as % of earning assets | (30 | %) | (24 | %) | 11 | % | 31 | % | ||||||||||||
BANK OF COMMERCE HOLDINGS & SUBSIDIARIES
IItemtem 8 - Financial Statements and Supplementary Data
Index to Consolidated Financial Statements
BANK OF COMMERCE HOLDINGS & SUBSIDIARIES
Reportof Independent Registered Public Accounting Firm OPEN PENDING UPDATE FROM MOSS ADAMS
The Board of Directors and Shareholders
Bank of Commerce Holdings
Opinions on the Financial Statements and Internal Control over Financial Reporting
We have audited the accompanying Consolidated Balance Sheetsconsolidated balance sheets of Bank of Commerce Holdings and subsidiaries (the “Company”“Company”) as of December 31, 20162017 and 2015, and2016, the related Consolidated Statementsconsolidated statements of Income, Comprehensive Income, Shareholders’ Equity,income, comprehensive income, shareholders’ equity and Cash Flowscash flows for each of the three years in the period ended December 31, 2016.2017, and the related notes (collectively referred to as the “consolidated financial statements”). We also have audited the Company’s internal control over financial reporting as of December 31, 2016,2017, based on criteria established inInternal Control - Integrated Framework(2013) (2013) issued by the Committee of Sponsoring Organizations of the Treadway Commission. Commission (COSO).
In our opinion, the consolidated financial statements referred to above present fairly, in all material respects, the consolidated financial position of the Company as of December 31, 2017 and 2016, and the consolidated results of its operations and its cash flows for each of the three years in the period ended December 31, 2017, in conformity with accounting principles generally accepted in the United States of America. Also in our opinion, the Company maintained, in all material respects, effective internal control over financial reporting as of December 31, 2017, based on criteria established in Internal Control - Integrated Framework (2013) issued by COSO.
Basis for Opinions
The Company’sCompany’s management is responsible for these Consolidated Financial Statements,consolidated financial statements, for maintaining effective internal control over financial reporting, and for its assessment of the effectiveness of internal control over financial reporting, included in the accompanying Management’s Report on Internal Control over Financial Reporting. Our responsibility is to express an opinion on these Consolidated Financial Statementsthe Company’s consolidated financial statements and an opinion on the Company’s internal control over financial reporting based on our audits. We are a public accounting firm registered with the Public Company Accounting Oversight Board (United States) (“PCAOB”) and are required to be independent with respect to the Company in accordance with the U.S. federal securities laws and the applicable rules and regulations of the Securities and Exchange Commission and the PCAOB.
We conducted our audits in accordance with the standards of the Public Company Accounting Oversight Board (United States).PCAOB. Those standards require that we plan and perform the audits to obtain reasonable assurance about whether the Consolidated Financial Statementsconsolidated financial statements are free of material misstatement, whether due to error or fraud, and whether effective internal control over financial reporting was maintained in all material respects.
Our audits of the Consolidated Financial Statementsconsolidated financial statements included performing procedures to assess the risks of material misstatement of the consolidated financial statements, whether due to error or fraud, and performing procedures to respond to those risks. Such procedures included examining, on a test basis, evidence supportingregarding the amounts and disclosures in the Consolidated Financial Statements, assessingconsolidated financial statements. Our audits also included evaluating the accounting principles used and significant estimates made by management, andas well as evaluating the overall presentation of the consolidated financial statement presentation.statements. Our audit of internal control over financial reporting included obtaining an understanding of internal control over financial reporting, assessing the risk that a material weakness exists, and testing and evaluating the design and operating effectiveness of internal control based on the assessed risk. Our audits also included performing such other procedures as we considered necessary in the circumstances. We believe that our audits provide a reasonable basis for our opinions.
Definition and Limitations of Internal Control Over Financial Reporting
A company’scompany’s internal control over financial reporting is a process designed to provide reasonable assurance regarding the reliability of financial reporting and the preparation of financial statements for external purposes in accordance with generally accepted accounting principles. A company’s internal control over financial reporting includes those policies and procedures that (1) pertain to the maintenance of records that, in reasonable detail, accurately and fairly reflect the transactions and dispositions of the assets of the company; (2) provide reasonable assurance that transactions are recorded as necessary to permit preparation of financial statements in accordance with generally accepted accounting principles, and that receipts and expenditures of the company are being made only in accordance with authorizations of management and directors of the company; and (3) provide reasonable assurance regarding prevention or timely detection of unauthorized acquisition, use, or disposition of the company’s assets that could have a material effect on the financial statements.
Because of its inherent limitations, internal control over financial reporting may not prevent or detect misstatements. Also, projectionsprojections of any evaluation of effectiveness to future periods are subject to the risk that controls may become inadequate because of changes in conditions, or that the degree of compliance with the policies or procedures may deteriorate.
In our opinion, the Consolidated Financial Statements referred to above present fairly, in all material respects, the consolidated financial position of Bank of Commerce Holdings and subsidiaries as of December 31, 2016 and 2015, and the consolidated results of their operations and their cash flows for each of the three years in the period ended December 31, 2016, in conformity with generally accepted accounting principles in the United States of America. Also in our opinion, Bank of Commerce Holdings and subsidiaries maintained, in all material respects, effective internal control over financial reporting as of December 31, 2016, based on criteria established inInternal Control - IntegratedFramework (2013) issued by the Committee of Sponsoring Organizations of the Treadway Commission.
/s/ Moss Adams LLP |
Sacramento, California |
March |
We have served as the Company’s auditor since 2004. |
BANK OF COMMERCE HOLDINGS & SUBSIDIARIES
To the Shareholders:
ManagementManagement’s’s Report on Internal Control over Financial Reporting
Management of Bank of Commerce Holdings and its subsidiaries (“the Company”) is responsible for establishing and maintaining internal control over financial reporting as defined in Rule 13a-15(f) under the Securities Exchange Act of 1934. The Company’s internal control system is designed to provide reasonable assurance to our management and Board of Directors regarding the reliability of financial reporting and the preparation of financial statements for external purposes in accordance with generally accepted accounting principles. The Company’s internal control over financial reporting includes those policies and procedures that:
● | Pertain to the maintenance of records that, in reasonable detail, accurately and fairly reflect the transactions and dispositions of the |
● | Provide reasonable assurance that transactions are recorded as necessary to permit preparation of financial statements in accordance with generally accepted accounting principles, and that receipts and expenditures of the Company are being made only in accordance with the authorizations of management and directors of the Company; and |
● | Provide reasonable assurance regarding prevention or timely detection of unauthorized acquisition, use or disposition of the |
Because of its inherent limitations, internal control over financial reporting may not prevent or detect misstatements. Also projections of any evaluation of effectiveness to future periods are subject to the risk that controls may become inadequate because of changes in conditions, or that the degree of compliance with the policies or procedures may deteriorate.
Management assessed the effectiveness of the Company’sCompany’s internal control over financial reporting as of December 31, 2016.2017. In making this assessment, we used the criteria set forth by the Committee of Sponsoring Organizations of the Treadway Commission in Internal Control - Integrated Framework (2013). Based on our assessment and those criteria, we believe that, as of December 31, 2016,2017, the Company maintained effective internal control over financial reporting.
The Company’sCompany’s independent registered public accounting firm has audited the Company’s consolidated financial statements that are included in this annual report and the effectiveness of our internal control over financial reporting as of December 31, 20162017 and issued their Report of Independent Registered Public Accounting Firm, which appears on the previous page. The audit report expresses an unqualified opinion on the effectiveness of the Company’s internal control over financial reporting as of December 31, 2016.
2017.
/s/ Randall S. Eslick |
Randall S. Eslick, President and Chief Executive Officer |
/s/ James A. Sundquist |
James A. Sundquist, EVP and Chief Financial Officer |
BANK OF COMMERCE HOLDINGS & SUBSIDIARIES
December 31,20162017 and20152016
(Amounts in thousands, except share information) | 2016 | 2015 | 2017 | 2016 | ||||||||||||
Assets: | ||||||||||||||||
Cash and due from banks | $ | 16,419 | $ | 9,730 | $ | 17,979 | $ | 16,419 | ||||||||
Interest-bearing deposits in other banks | 51,988 | 41,462 | 48,991 | 51,988 | ||||||||||||
Total cash and cash equivalents | 68,407 | 51,192 | 66,970 | 68,407 | ||||||||||||
Securities available-for-sale, at fair value | 175,174 | 159,030 | 267,954 | 175,174 | ||||||||||||
Securities held-to-maturity, at amortized cost | 31,187 | 35,899 | — | 31,187 | ||||||||||||
Loans, net of deferred fees and costs | 805,535 | 717,509 | 881,545 | 805,535 | ||||||||||||
Allowance for loan and lease losses | (11,544 | ) | (11,180 | ) | (11,925 | ) | (11,544 | ) | ||||||||
Net loans | 793,991 | 706,329 | 869,620 | 793,991 | ||||||||||||
Premises and equipment, net | 16,226 | 11,072 | 14,748 | 16,226 | ||||||||||||
Other real estate owned | 759 | 1,423 | 35 | 759 | ||||||||||||
Life insurance | 23,098 | 22,485 | 21,898 | 23,098 | ||||||||||||
Deferred tax asset, net | 9,542 | 9,760 | 6,505 | 9,542 | ||||||||||||
Goodwill and core deposit intangible, net | 2,252 | — | 2,030 | 2,252 | ||||||||||||
Other assets | 20,356 | 18,251 | 19,661 | 20,356 | ||||||||||||
Total assets | $ | 1,140,992 | $ | 1,015,441 | $ | 1,269,421 | $ | 1,140,992 | ||||||||
Liabilities and shareholders' equity: | ||||||||||||||||
Liabilities: | ||||||||||||||||
Demand - noninterest bearing | $ | 270,398 | $ | 169,507 | ||||||||||||
Demand - interest bearing | 405,569 | 315,658 | ||||||||||||||
Demand - noninterest-bearing | $ | 305,650 | $ | 270,398 | ||||||||||||
Demand - interest-bearing | 496,990 | 405,569 | ||||||||||||||
Savings | 113,309 | 94,503 | 110,837 | 113,309 | ||||||||||||
Certificates of deposit | 215,390 | 224,067 | 189,255 | 215,390 | ||||||||||||
Total deposits | 1,004,666 | 803,735 | 1,102,732 | 1,004,666 | ||||||||||||
Term debt: | ||||||||||||||||
Principal | 18,917 | 94,917 | 17,096 | 18,917 | ||||||||||||
Less unamortized debt issuance costs | (184 | ) | (223 | ) | (138 | ) | (184 | ) | ||||||||
Net term debt | 18,733 | 94,694 | 16,958 | 18,733 | ||||||||||||
Junior subordinated debentures | 10,310 | 10,310 | 10,310 | 10,310 | ||||||||||||
Other liabilities | 13,177 | 16,180 | 12,157 | 13,177 | ||||||||||||
Total liabilities | 1,046,886 | 924,919 | 1,142,157 | 1,046,886 | ||||||||||||
Commitments and contingencies (Note 16) | ||||||||||||||||
Shareholders’ equity: | ||||||||||||||||
Common stock, no par value, 50,000,000 shares authorized; 17,162,996 issued; 13,440,422 outstanding as of December 31, 2016 and 13,385,154 outstanding as of December 31, 2015 | 24,547 | 24,214 | ||||||||||||||
Commitments and contingencies (Note 15) | ||||||||||||||||
Shareholders’ equity: | ||||||||||||||||
Common stock, no par value, 50,000,000 shares authorized; issued and outstanding - 16,271,563 as of December 31, 2017 and 13,440,422 as of December 31, 2016 | 51,830 | 24,547 | ||||||||||||||
Retained earnings | 70,218 | 66,562 | 75,700 | 70,218 | ||||||||||||
Accumulated other comprehensive loss | (659 | ) | (254 | ) | ||||||||||||
Total shareholders’ equity | 94,106 | 90,522 | ||||||||||||||
Total liabilities and shareholders’ equity | $ | 1,140,992 | $ | 1,015,441 | ||||||||||||
Accumulated other comprehensive loss, net of tax | (266 | ) | (659 | ) | ||||||||||||
Total shareholders’ equity | 127,264 | 94,106 | ||||||||||||||
Total liabilities and shareholders’ equity | $ | 1,269,421 | $ | 1,140,992 | ||||||||||||
See accompanyingNotes to Consolidated Financial Statements.
BANK OF COMMERCE HOLDINGS & SUBSIDIARIES
ConsolidatedStatements of Income
For the years ended December 31,2017, 2016, and 2015 and2014
(Amounts in thousands, except per share information) | 2016 | 2015 | 2014 | 2017 | 2016 | 2015 | ||||||||||||||||||
Interest income: | ||||||||||||||||||||||||
Interest and fees on loans | $ | 35,435 | $ | 32,871 | $ | 29,464 | $ | 39,112 | $ | 35,435 | $ | 32,871 | ||||||||||||
Interest on taxable securities | 2,986 | 3,284 | 4,214 | 3,921 | 2,986 | 3,284 | ||||||||||||||||||
Interest on tax-exempt securities | 2,256 | 2,392 | 2,536 | 2,144 | 2,256 | 2,392 | ||||||||||||||||||
Interest on interest-bearing deposits in other banks | 332 | 206 | 479 | 772 | 332 | 206 | ||||||||||||||||||
Total interest income | 41,009 | 38,753 | 36,693 | 45,949 | 41,009 | 38,753 | ||||||||||||||||||
Interest expense: | ||||||||||||||||||||||||
Interest on demand deposits | 523 | 460 | 471 | 744 | 523 | 460 | ||||||||||||||||||
Interest on savings deposits | 174 | 213 | 228 | 200 | 174 | 213 | ||||||||||||||||||
Interest on certificates of deposit | 2,179 | 2,356 | 2,608 | 2,188 | 2,179 | 2,356 | ||||||||||||||||||
Interest on term debt | 1,667 | 1,759 | 422 | 1,168 | 1,667 | 1,759 | ||||||||||||||||||
Interest on junior subordinated debentures | 235 | 195 | 363 | 287 | 235 | 195 | ||||||||||||||||||
Total interest expense | 4,778 | 4,983 | 4,092 | 4,587 | 4,778 | 4,983 | ||||||||||||||||||
Net interest income | 36,231 | 33,770 | 32,601 | 41,362 | 36,231 | 33,770 | ||||||||||||||||||
Provision for loan and lease losses | — | — | 3,175 | 950 | — | — | ||||||||||||||||||
Net interest income after provision for loan and lease losses | 36,231 | 33,770 | 29,426 | 40,412 | 36,231 | 33,770 | ||||||||||||||||||
Noninterest income: | ||||||||||||||||||||||||
Service charges on deposit accounts | 413 | 204 | 186 | 542 | 413 | 204 | ||||||||||||||||||
ATM and point of sale fees | 995 | 383 | 330 | 1,093 | 995 | 383 | ||||||||||||||||||
Fees on payroll and benefit processing | 593 | 555 | 508 | 658 | 593 | 555 | ||||||||||||||||||
Earnings on cash surrender value – life insurance | 613 | 641 | 628 | |||||||||||||||||||||
Gain (loss) on sale of investment securities, net | 244 | 443 | (159 | ) | ||||||||||||||||||||
Life insurance | 1,050 | 613 | 641 | |||||||||||||||||||||
Gain on sale of investment securities, net | 137 | 244 | 443 | |||||||||||||||||||||
Impairment losses on investment securities | (546 | ) | — | — | — | (546 | ) | — | ||||||||||||||||
Federal Home Loan Bank of San Francisco dividends | 644 | 630 | 345 | 318 | 644 | 630 | ||||||||||||||||||
Gain (loss) on sale of OREO | 368 | (109 | ) | 13 | ||||||||||||||||||||
Insured cash sweep fees | 197 | 3 | — | |||||||||||||||||||||
Other income | 639 | 327 | 2,477 | 461 | 636 | 314 | ||||||||||||||||||
Total noninterest income | 3,595 | 3,183 | 4,315 | 4,824 | 3,486 | 3,183 | ||||||||||||||||||
Noninterest expense: | ||||||||||||||||||||||||
Salaries and related benefits | 16,425 | 14,303 | 14,965 | 17,819 | 16,425 | 14,303 | ||||||||||||||||||
Premises and equipment | 3,869 | 2,894 | 2,784 | 4,242 | 3,869 | 2,894 | ||||||||||||||||||
Federal Deposit Insurance Corporation insurance premium | 615 | 717 | 798 | 318 | 615 | 717 | ||||||||||||||||||
Data processing fees | 1,675 | 1,016 | 926 | 1,749 | 1,675 | 1,016 | ||||||||||||||||||
Professional service fees | 1,690 | 1,628 | 1,398 | 1,398 | 1,690 | 1,628 | ||||||||||||||||||
Telecommunications | 751 | 449 | 372 | 879 | 751 | 449 | ||||||||||||||||||
Branch acquisition costs | 580 | 347 | — | — | 580 | 347 | ||||||||||||||||||
Loss on cancellation of interest rate swap | 2,325 | — | — | — | 2,325 | — | ||||||||||||||||||
Other expenses | 4,679 | 3,551 | 5,191 | 4,559 | 4,570 | 3,551 | ||||||||||||||||||
Total noninterest expense | 32,609 | 24,905 | 26,434 | 30,964 | 32,500 | 24,905 | ||||||||||||||||||
Income before provision for income taxes | 7,217 | 12,048 | 7,307 | 14,272 | 7,217 | 12,048 | ||||||||||||||||||
Provision for income taxes | 1,958 | 3,462 | 1,580 | 6,928 | 1,958 | 3,462 | ||||||||||||||||||
Net income | $ | 5,259 | $ | 8,586 | $ | 5,727 | $ | 7,344 | $ | 5,259 | $ | 8,586 | ||||||||||||
Less: Preferred stock extinguishment costs | — | 102 | — | — | — | 102 | ||||||||||||||||||
Less: Preferred stock dividends | — | 189 | 200 | — | — | 189 | ||||||||||||||||||
Income available to common shareholders | $ | 5,259 | $ | 8,295 | $ | 5,527 | $ | 7,344 | $ | 5,259 | $ | 8,295 | ||||||||||||
Earnings per share - basic | $ | 0.39 | $ | 0.62 | $ | 0.41 | $ | 0.48 | $ | 0.39 | $ | 0.62 | ||||||||||||
Weighted average shares - basic | 13,367 | 13,331 | 13,475 | 15,207 | 13,367 | 13,331 | ||||||||||||||||||
Earnings per share - diluted | $ | 0.39 | $ | 0.62 | $ | 0.41 | $ | 0.48 | $ | 0.39 | $ | 0.62 | ||||||||||||
Weighted average shares - diluted | 13,425 | 13,365 | 13,520 | 15,310 | 13,425 | 13,365 | ||||||||||||||||||
See accompanyingNotes toConsolidated Financial Statements.
BANK OF COMMERCE HOLDINGS & SUBSIDIARIES
ConsolidatedStatements of Comprehensive Income
For the years ended December 31,2017,20162015 and and20142015
(Amounts in thousands) | 2016 | 2015 | 2014 | 2017 | 2016 | 2015 | ||||||||||||||||||
Net income | $ | 5,259 | $ | 8,586 | $ | 5,727 | $ | 7,344 | $ | 5,259 | $ | 8,586 | ||||||||||||
Available-for-sale securities: | ||||||||||||||||||||||||
Unrealized (losses) gains arising during the period | (3,286 | ) | (551 | ) | 6,129 | |||||||||||||||||||
Unrealized losses arising during the period | (179 | ) | (3,286 | ) | (551 | ) | ||||||||||||||||||
Unrealized gains from securities transferred from held-to-maturity to available-for-sale | 1,208 | — | — | |||||||||||||||||||||
Income taxes | 1,353 | 227 | (2,523 | ) | (423 | ) | 1,353 | 227 | ||||||||||||||||
Change in unrealized (losses) gains, net of tax | (1,933 | ) | (324 | ) | 3,606 | |||||||||||||||||||
Change in unrealized gains (losses), net of tax | 606 | (1,933 | ) | (324 | ) | |||||||||||||||||||
Reclassification adjustment for realized (gains) losses included in net income | (224 | ) | (443 | ) | 159 | (137 | ) | (224 | ) | (443 | ) | |||||||||||||
Income taxes | 92 | 184 | (54 | ) | 55 | 92 | 184 | |||||||||||||||||
Realized (gains) losses, net of tax | (132 | ) | (259 | ) | 105 | (82 | ) | (132 | ) | (259 | ) | |||||||||||||
Reclassification adjustment for other than temporary impairment included in net income | 546 | — | — | |||||||||||||||||||||
Reclassification adjustment for other-than-temporary impairment included in net income | — | 546 | — | |||||||||||||||||||||
Income taxes | (225 | ) | — | — | — | (225 | ) | — | ||||||||||||||||
Realized impairment, net of tax | 321 | — | — | — | 321 | — | ||||||||||||||||||
Net change in unrealized (losses) gains on available-for-sale securities | (1,744 | ) | (583 | ) | 3,711 | |||||||||||||||||||
Net change in unrealized gains (losses) on available-for-sale securities | 524 | (1,744 | ) | (583 | ) | |||||||||||||||||||
Held-to-maturity securities: | ||||||||||||||||||||||||
Amortization of held-to-maturity fair value adjustment | (97 | ) | (144 | ) | (155 | ) | ||||||||||||||||||
Accretion of held-to-maturity fair value adjustment from other comprehensive income to interest income | (56 | ) | (97 | ) | (144 | ) | ||||||||||||||||||
Income taxes | 40 | 59 | 64 | 23 | 40 | 59 | ||||||||||||||||||
Net accretion of held-to-maturity fair value adjustment from other comprehensive income to interest income | (33 | ) | (57 | ) | (85 | ) | ||||||||||||||||||
Fair value adjustment for held-to-maturity securities transferred to available-for-sale | (167 | ) | — | — | ||||||||||||||||||||
Income taxes | 69 | — | — | |||||||||||||||||||||
Net fair value adjustment for held-to-maturity securities transferred to available-for-sale | (98 | ) | — | — | ||||||||||||||||||||
Net change in fair value adjustment on held-to-maturity securities | (57 | ) | (85 | ) | (91 | ) | (131 | ) | (57 | ) | (85 | ) | ||||||||||||
Derivatives: | ||||||||||||||||||||||||
Unrealized (losses) arising during the period | (348 | ) | (584 | ) | (333 | ) | — | (348 | ) | (584 | ) | |||||||||||||
Income taxes | 143 | 242 | 136 | — | 143 | 242 | ||||||||||||||||||
Change in unrealized (losses), net of tax | (205 | ) | (342 | ) | (197 | ) | — | (205 | ) | (342 | ) | |||||||||||||
Reclassification adjustment for net losses (gains) on derivatives included in net income | 2,721 | 1,435 | (1,900 | ) | ||||||||||||||||||||
Reclassification adjustment for net losses on derivatives included in net income | — | 2,721 | 1,435 | |||||||||||||||||||||
Income taxes | (1,120 | ) | (592 | ) | 782 | — | (1,120 | ) | (592 | ) | ||||||||||||||
Reclassification adjustment for net losses (gains) included in net income, net of tax | 1,601 | 843 | (1,118 | ) | ||||||||||||||||||||
Net change in unrealized losses (gains) on derivatives | 1,396 | 501 | (1,315 | ) | ||||||||||||||||||||
Other comprehensive (loss) income | (405 | ) | (167 | ) | 2,305 | |||||||||||||||||||
Reclassification adjustment for net losses on derivatives included in net income, net of tax | — | 1,601 | 843 | |||||||||||||||||||||
Net change in unrealized losses on derivatives | — | 1,396 | 501 | |||||||||||||||||||||
Other comprehensive income (loss) | 393 | (405 | ) | (167 | ) | |||||||||||||||||||
Comprehensive income – Bank of Commerce Holdings | $ | 4,854 | $ | 8,419 | $ | 8,032 | $ | 7,737 | $ | 4,854 | $ | 8,419 | ||||||||||||
See accompanying Notes to Consolidated Financial Statements.Statements.
BANK OF COMMERCE HOLDINGS & SUBSIDIARIES
ConsolidatedStatements of Shareholders’Shareholders’ Equity
For the years ended December 31,2014,2015 and, 2016 and 2017
Accumulated | Accumulated | |||||||||||||||||||||||||||||||||||||||||||||||
Preferred | Common | Other Comp- | Preferred | Common | Other Comprehensive | |||||||||||||||||||||||||||||||||||||||||||
| (Amounts in thousands except per share | Stock | Common | Stock | Retained | Income (Loss) | |||||||||||||||||||||||||||||||||||||||||||
| information) | Amount | Shares | Amount | Earnings | Net of Tax | Total | ||||||||||||||||||||||||||||||||||||||||||
Balance at January 1, 2014 | $ | 19,931 | 13,977 | $ | 28,304 | $ | 55,944 | $ | (2,392 | ) | $ | 101,787 | ||||||||||||||||||||||||||||||||||||
Stock | Common | Stock | Retained | Income (Loss) | ||||||||||||||||||||||||||||||||||||||||||||
(Amounts in thousands except per share information) | Amount | Shares | Amount | Earnings | Net of Tax | Total | ||||||||||||||||||||||||||||||||||||||||||
Balance at January 1, 2015 | $ | 19,931 | 13,294 | $ | 23,891 | $ | 59,867 | $ | (87 | ) | $ | 103,602 | ||||||||||||||||||||||||||||||||||||
Net income | — | — | — | 5,727 | — | 5,727 | — | — | — | 8,586 | — | 8,586 | ||||||||||||||||||||||||||||||||||||
Other comprehensive income, net of tax | — | — | — | — | 2,305 | 2,305 | ||||||||||||||||||||||||||||||||||||||||||
Other comprehensive loss, net of tax | — | — | — | — | (167 | ) | (167 | ) | ||||||||||||||||||||||||||||||||||||||||
Comprehensive income | — | — | — | — | — | 8,032 | — | — | — | — | — | 8,419 | ||||||||||||||||||||||||||||||||||||
Dividend on preferred stock | — | — | — | (200 | ) | — | (200 | ) | — | — | — | (189 | ) | — | (189 | ) | ||||||||||||||||||||||||||||||||
Repurchase of common stock | — | (700 | ) | (4,562 | ) | — | — | (4,562 | ) | |||||||||||||||||||||||||||||||||||||||
Dividend on common stock ($0.12 per share) | — | — | — | (1,604 | ) | — | (1,604 | ) | — | — | — | (1,600 | ) | — | (1,600 | ) | ||||||||||||||||||||||||||||||||
Common stock issued under employee plans | — | 14 | 66 | — | — | 66 | — | 9 | 36 | — | — | 36 | ||||||||||||||||||||||||||||||||||||
Stock options exercised | 3 | 23 | 23 | — | 39 | 156 | — | — | 156 | |||||||||||||||||||||||||||||||||||||||
Compensation expense associated with stock options | — | — | 54 | — | — | 54 | — | — | 42 | — | — | 42 | ||||||||||||||||||||||||||||||||||||
Compensation expense associated with restricted stock | — | — | 6 | — | — | 6 | — | — | 89 | — | — | 89 | ||||||||||||||||||||||||||||||||||||
Balance at December 31, 2014 (1) | $ | 19,931 | 13,294 | $ | 23,891 | $ | 59,867 | $ | (87 | ) | $ | 103,602 | ||||||||||||||||||||||||||||||||||||
Preferred stock redemption | (20,000 | ) | — | — | (33 | ) | — | (20,033 | ) | |||||||||||||||||||||||||||||||||||||||
Preferred stock accretion | 69 | — | — | (69 | ) | — | — | |||||||||||||||||||||||||||||||||||||||||
Balance at December 31, 2015 (1) | $ | — | 13,342 | $ | 24,214 | $ | 66,562 | $ | (254 | ) | $ | 90,522 | ||||||||||||||||||||||||||||||||||||
(1) Excludes |
BANK OF COMMERCE HOLDINGS & SUBSIDIARIES
20172016Consolidated Statements of Shareholders’ Equity (Continued)
Accumulated | ||||||||||||||||||||||||||||||||||||||||||||
Common | Other Comprehensive | |||||||||||||||||||||||||||||||||||||||||||
Common | Stock | Retained | (Loss) | |||||||||||||||||||||||||||||||||||||||||
| (Amounts in thousands except per shareinformation) | Preferred Stock Amount | Common Shares | Common Stock Amount | Retained Earnings | Accumulated Other Comp- (Loss) Net of Tax | Total | Shares | Amount | Earnings | Net of Tax | Total | |||||||||||||||||||||||||||||||||
Balance at January 1, 2015 | $ | 19,931 | 13,294 | $ | 23,891 | $ | 59,867 | $ | (87 | ) | $ | 103,602 | ||||||||||||||||||||||||||||||||
Balance at January 1, 2016 | 13,342 | $ | 24,214 | $ | 66,562 | $ | (254 | ) | $ | 90,522 | ||||||||||||||||||||||||||||||||||
Net income | — | — | — | 8,586 | — | 8,586 | — | — | 5,259 | — | 5,259 | |||||||||||||||||||||||||||||||||
Other comprehensive loss, net of tax | — | — | — | — | (167 | ) | (167 | ) | — | — | — | (405 | ) | (405 | ) | |||||||||||||||||||||||||||||
Comprehensive income | — | — | — | — | — | 8,419 | — | — | — | — | 4,854 | |||||||||||||||||||||||||||||||||
Dividend on preferred stock | — | — | — | (189 | ) | — | (189 | ) | ||||||||||||||||||||||||||||||||||||
Dividend on common stock ($0.12 per share) | — | — | — | (1,600 | ) | — | (1,600 | ) | — | — | (1,603 | ) | — | (1,603 | ) | |||||||||||||||||||||||||||||
Common stock issued under employee plans | — | 9 | 36 | — | — | 36 | 29 | 84 | — | — | 84 | |||||||||||||||||||||||||||||||||
Stock options exercised | — | 39 | 156 | — | — | 156 | 2 | 10 | — | — | 10 | |||||||||||||||||||||||||||||||||
Compensation expense associated with stock options | — | — | 42 | 42 | — | 24 | — | — | 24 | |||||||||||||||||||||||||||||||||||
Compensation expense associated with restricted stock | — | — | 89 | — | — | 89 | — | 215 | — | — | 215 | |||||||||||||||||||||||||||||||||
Preferred stock redemption | (20,000 | ) | — | — | (33 | ) | — | (20,033 | ) | |||||||||||||||||||||||||||||||||||
Preferred stock accretion | 69 | — | — | (69 | ) | — | ||||||||||||||||||||||||||||||||||||||
Balance at December 31, 2015(1) | $ | — | 13,342 | $ | 24,214 | $ | 66,562 | $ | (254 | ) | $ | 90,522 | ||||||||||||||||||||||||||||||||
Balance at December 31, 2016 (1) | 13,373 | $ | 24,547 | $ | 70,218 | $ | (659 | ) | $ | 94,106 | ||||||||||||||||||||||||||||||||||
(1) |
| (Amounts in thousands except per shareinformation) | Common Shares | Common Stock Amount | Retained Earnings | Accumulated Other Comp- (Loss) Net of Tax | Total | |||||||||||||||
Balance at January 1, 2016 | 13,342 | $ | 24,214 | $ | 66,562 | $ | (254 | ) | $ | 90,522 | ||||||||||
Net income | — | — | 5,259 | — | 5,259 | |||||||||||||||
Other comprehensive loss, net of tax | — | — | — | (405 | ) | (405 | ) | |||||||||||||
Comprehensive income | — | — | — | — | 4,854 | |||||||||||||||
Dividend on common stock ($0.12 per share) | — | — | (1,603 | ) | — | (1,603 | ) | |||||||||||||
Common stock issued under employee plans | 29 | 84 | — | — | 84 | |||||||||||||||
Stock options exercised | 2 | 10 | — | — | 10 | |||||||||||||||
Compensation expense associated with stock options | — | 24 | — | — | 24 | |||||||||||||||
Compensation expense associated with restricted stock | — | 215 | — | — | 215 | |||||||||||||||
Balance at December 31, 2016(1) | 13,373 | $ | 24,547 | $ | 70,218 | $ | (659 | ) | $ | 94,106 | ||||||||||
|
Accumulated | ||||||||||||||||||||
Common | Other Comprehensive | |||||||||||||||||||
Common | Stock | Retained | (Loss) | |||||||||||||||||
(Amounts in thousands except per share information) | Shares | Amount | Earnings | Net of Tax | Total | |||||||||||||||
Balance at January 1, 2017 | 13,373 | $ | 24,547 | $ | 70,218 | $ | (659 | ) | $ | 94,106 | ||||||||||
Net income | — | — | 7,344 | — | 7,344 | |||||||||||||||
Other comprehensive income, net of tax | — | — | — | 393 | 393 | |||||||||||||||
Comprehensive income | — | — | — | — | 7,737 | |||||||||||||||
Dividend on common stock ($0.12 per share) | — | — | (1,862 | ) | — | (1,862 | ) | |||||||||||||
Stock issued pursuant to public offering, net of underwriting discounts and expenses of $1.7 million | 2,738 | 26,778 | — | — | 26,778 | |||||||||||||||
Stock compensation grants | 4 | 41 | 41 | |||||||||||||||||
Common stock issued under employee plans | 30 | — | — | — | — | |||||||||||||||
Stock options exercised | 52 | 245 | — | — | 245 | |||||||||||||||
Compensation expense associated with stock options | — | 23 | — | — | 23 | |||||||||||||||
Compensation expense associated with restricted stock | — | 196 | — | — | 196 | |||||||||||||||
Balance at December 31, 2017 (1) | 16,197 | $ | 51,830 | $ | 75,700 | $ | (266 | ) | $ | 127,264 | ||||||||||
(1) Excludes 74 unvested restricted shares |
See accompanyingNotes toConsolidated Financial Statements.
BANK OF COMMERCE HOLDINGS & SUBSIDIARIES
ConsolidatedStatements of Cash Flows
For the years ended December 31,2017, 2016, and 2015 and2014
(Amounts in thousands) | 2016 | 2015 | 2014 | 2017 | 2016 | 2015 | ||||||||||||||||||
Cash flows from operating activities: | ||||||||||||||||||||||||
Net income | $ | 5,259 | $ | 8,586 | $ | 5,727 | $ | 7,344 | $ | 5,259 | $ | 8,586 | ||||||||||||
Adjustments to reconcile net income to net cash provided by operating activities: | ||||||||||||||||||||||||
Provision for loan and lease losses | — | — | 3,175 | 950 | — | — | ||||||||||||||||||
Provision for depreciation and amortization | 1,908 | 1,524 | 1,320 | 2,061 | 1,908 | 1,524 | ||||||||||||||||||
Amortization of core deposit intangible | 185 | — | — | 221 | 185 | — | ||||||||||||||||||
Amortization of debt issuance costs | 40 | 4 | — | 45 | 40 | 4 | ||||||||||||||||||
Compensation expense associated with stock options | 24 | 42 | 54 | 23 | 24 | 42 | ||||||||||||||||||
Compensation expense associated with restricted stock | 215 | 89 | 6 | 196 | 215 | 89 | ||||||||||||||||||
Net (gain) loss on sale or call of securities | (244 | ) | (443 | ) | 159 | |||||||||||||||||||
Other than temporary impairment on investment securities | 546 | — | — | |||||||||||||||||||||
Tax benefits from vesting of restricted stock | (53 | ) | — | — | ||||||||||||||||||||
Net gain on sale or call of securities | (137 | ) | (244 | ) | (443 | ) | ||||||||||||||||||
Other-than-temporary impairment on investment securities | — | 546 | — | |||||||||||||||||||||
Amortization of investment premiums and accretion of discounts, net | 1,715 | 1,876 | 1,662 | 2,031 | 1,715 | 1,876 | ||||||||||||||||||
Amortization of held-to-maturity fair value adjustments | (97 | ) | (144 | ) | (155 | ) | ||||||||||||||||||
Accretion of held-to-maturity fair value adjustments | (56 | ) | (97 | ) | (144 | ) | ||||||||||||||||||
Loss on cancellation of interest rate swap | 2,325 | — | — | — | 2,325 | — | ||||||||||||||||||
Loss (gain) on disposal of fixed assets | 1 | (4 | ) | 7 | ||||||||||||||||||||
Write-down of fixed assets | — | 238 | — | — | — | 238 | ||||||||||||||||||
Write-down of other real estate owned | 66 | — | 290 | 52 | 66 | — | ||||||||||||||||||
Loss on sale of other real estate owned | 109 | 26 | 8 | |||||||||||||||||||||
(Gain) loss on sale of other real estate owned | (368 | ) | 109 | (13 | ) | |||||||||||||||||||
Increase in cash surrender value of life insurance | (613 | ) | (641 | ) | (628 | ) | (548 | ) | (613 | ) | (641 | ) | ||||||||||||
(Decrease) increase in deferred compensation and salary continuation plans | (19 | ) | 28 | 1,388 | ||||||||||||||||||||
(Increase) decrease in deferred loan fees and costs | (454 | ) | (713 | ) | 146 | |||||||||||||||||||
Gain on repayment of junior subordinated debentures | — | — | (406 | ) | ||||||||||||||||||||
Increase (decrease) in deferred income taxes | 495 | 584 | (191 | ) | ||||||||||||||||||||
Decrease (increase) in other assets | 117 | 505 | (946 | ) | ||||||||||||||||||||
Increase (decrease) in other liabilities | 306 | (1,219 | ) | 2,464 | ||||||||||||||||||||
Life insurance death benefit | (502 | ) | — | — | ||||||||||||||||||||
Increase (decrease) in deferred compensation and salary continuation plans | 18 | (19 | ) | 28 | ||||||||||||||||||||
Increase in deferred loan fees and costs | (386 | ) | (454 | ) | (713 | ) | ||||||||||||||||||
Decrease in deferred income taxes | 271 | 132 | 584 | |||||||||||||||||||||
Deferred tax asset write down | 2,490 | 363 | — | |||||||||||||||||||||
Decrease in other assets | 863 | 118 | 538 | |||||||||||||||||||||
(Decrease) increase in other liabilities | (961 | ) | 306 | (1,219 | ) | |||||||||||||||||||
Net cash provided by operating activities | 11,884 | 10,338 | 14,080 | 13,554 | 11,884 | 10,336 | ||||||||||||||||||
Cash flows from investing activities: | ||||||||||||||||||||||||
Proceeds from maturities and payments of available-for-sale securities | 31,685 | 23,426 | 20,248 | 23,551 | 31,685 | 23,426 | ||||||||||||||||||
Proceeds from sale of available-for-sale securities | 51,025 | 71,277 | 93,545 | 64,349 | 51,025 | 71,277 | ||||||||||||||||||
Purchases of available-for-sale securities | (104,134 | ) | (69,362 | ) | (79,852 | ) | (150,888 | ) | (104,134 | ) | (69,362 | ) | ||||||||||||
Proceeds from maturities and payments of held-to-maturity securities | 4,963 | 1,099 | 311 | 1,098 | 4,963 | 1,099 | ||||||||||||||||||
Purchases of held-to-maturity securities | — | — | (244 | ) | ||||||||||||||||||||
Investment in Qualified Zone Academy Bonds | (2,000 | ) | — | — | (1,000 | ) | (2,000 | ) | — | |||||||||||||||
Investment in qualified affordable housing partnerships | (697 | ) | (1,133 | ) | (2,371 | ) | (124 | ) | (697 | ) | (1,133 | ) | ||||||||||||
Net redemption (purchase) of Federal Home Loan Bank of San Francisco stock | — | 1,263 | (1,198 | ) | ||||||||||||||||||||
Net (purchase) redemption of Federal Home Loan Bank of San Francisco stock | (72 | ) | — | 1,263 | ||||||||||||||||||||
Loan (originations), net of principal repayments | (105,892 | ) | (46,554 | ) | (21,344 | ) | (76,016 | ) | (105,892 | ) | (46,554 | ) | ||||||||||||
Net repayment on (purchase of) purchased loans | 18,666 | (12,715 | ) | (48,775 | ) | |||||||||||||||||||
Purchase of life insurance | — | — | (5,000 | ) | ||||||||||||||||||||
Net (purchase of) repayment on purchased loans | (1,158 | ) | 18,666 | (12,715 | ) | |||||||||||||||||||
Purchase of premises and equipment | (2,873 | ) | (705 | ) | (2,729 | ) | (584 | ) | (2,873 | ) | (705 | ) | ||||||||||||
Proceeds from the sale of other real estate owned | 636 | 3,111 | 802 | 2,111 | 636 | 3,111 | ||||||||||||||||||
Proceeds from settlement of note to former mortgage subsidiary | — | — | 686 | |||||||||||||||||||||
Proceeds from life insurance policy | 2,249 | — | — | |||||||||||||||||||||
Payments to derivative counterparties for the termination of interest rate swaps | (2,578 | ) | — | — | — | (2,578 | ) | — | ||||||||||||||||
Acquisition of branches, net of cash paid | 142,411 | — | — | — | 142,411 | — | ||||||||||||||||||
Net cash provided (used) by investing activities | 31,212 | (30,293 | ) | (45,921 | ) | |||||||||||||||||||
Net cash (used) provided by investing activities | (136,484 | ) | 31,212 | (30,293 | ) | |||||||||||||||||||
See accompanyingNotes toConsolidated Financial Statements.
BANK OF COMMERCE HOLDINGS & SUBSIDIARIES
Consolidated Statements of Cash Flows (Continued)
(Amounts in thousands) | 2016 | 2015 | 2014 | 2017 | 2016 | 2015 | ||||||||||||||||||
Cash flows from financing activities: | ||||||||||||||||||||||||
Net increase in demand deposits and savings accounts | $ | 84,722 | $ | 35,382 | $ | 46,470 | $ | 124,201 | $ | 84,722 | $ | 35,382 | ||||||||||||
Net decrease in certificates of deposit | (32,838 | ) | (20,682 | ) | (3,728 | ) | (26,135 | ) | (32,838 | ) | (20,682 | ) | ||||||||||||
Advances on term debt | 55,000 | 260,000 | 250,000 | 30,260 | 55,000 | 260,000 | ||||||||||||||||||
Repayment of term debt | (131,172 | ) | (240,083 | ) | (250,000 | ) | (32,080 | ) | (131,172 | ) | (240,083 | ) | ||||||||||||
Repayment of junior subordinated debentures | — | — | (4,629 | ) | ||||||||||||||||||||
Debt issuance costs paid | — | (225 | ) | — | — | — | (223 | ) | ||||||||||||||||
Proceeds from stock options exercised | 10 | 156 | 23 | 245 | 10 | 156 | ||||||||||||||||||
Repurchase of common stock | — | — | (4,562 | ) | ||||||||||||||||||||
Net proceeds from issuance of common stock | 26,778 | — | — | |||||||||||||||||||||
Redemption of preferred stock | — | (20,000 | ) | — | — | — | (20,000 | ) | ||||||||||||||||
Preferred stock extinguishment costs | — | (33 | ) | — | — | — | (33 | ) | ||||||||||||||||
Cash dividends paid on preferred stock | — | (189 | ) | (200 | ) | — | — | (189 | ) | |||||||||||||||
Cash dividends paid on common stock | (1,603 | ) | (1,601 | ) | (1,626 | ) | (1,776 | ) | (1,603 | ) | (1,601 | ) | ||||||||||||
Net cash provided by (used in) financing activities | (25,881 | ) | 12,725 | 31,748 | 121,493 | (25,881 | ) | 12,727 | ||||||||||||||||
Net increase (decrease) cash and cash equivalents | 17,215 | (7,230 | ) | (93 | ) | (1,437 | ) | 17,215 | (7,230 | ) | ||||||||||||||
Cash and cash equivalents at the beginning of year | 51,192 | 58,422 | 58,515 | 68,407 | 51,192 | 58,422 | ||||||||||||||||||
Cash and cash equivalents at the end of year | $ | 68,407 | $ | 51,192 | $ | 58,422 | $ | 66,970 | $ | 68,407 | $ | 51,192 | ||||||||||||
See accompanyingNotes toConsolidated Financial Statements.
BANK OF COMMERCE HOLDINGS & SUBSIDIARIES
Consolidated Statements of Cash Flows (Continued)
(Amounts in thousands) | 2016 | 2015 | 2014 | 2017 | 2016 | 2015 | ||||||||||||||||||
Supplemental disclosures of cash flow activity: | ||||||||||||||||||||||||
Cash paid during the period for: | ||||||||||||||||||||||||
Income taxes | $ | 2,705 | $ | 4,123 | $ | 419 | $ | 3,846 | $ | 2,705 | $ | 4,123 | ||||||||||||
Interest | $ | 5,142 | $ | 4,628 | $ | 4,192 | $ | 4,581 | $ | 5,142 | $ | 4,628 | ||||||||||||
Supplemental disclosures of non cash investing activities: | ||||||||||||||||||||||||
Transfer of loans to other real estate owned | $ | 147 | $ | 3,888 | $ | 689 | $ | 981 | $ | 147 | $ | 3,888 | ||||||||||||
Transfer of fixed asset to other real estate owned | $ | — | $ | 170 | $ | — | $ | — | $ | — | $ | 170 | ||||||||||||
Changes in unrealized (loss) gain on investment securities available-for-sale | $ | (2,964 | ) | $ | (985 | ) | $ | 6,307 | ||||||||||||||||
Changes in unrealized gain (loss) on investment securities available-for-sale | $ | 892 | $ | (2,964 | ) | $ | (985 | ) | ||||||||||||||||
Changes in net deferred tax asset related to changes in unrealized (loss) gain on investment securities available-for-sale | 1,220 | 402 | (2,596 | ) | (368 | ) | 1,220 | 402 | ||||||||||||||||
Changes in accumulated other comprehensive income due to changes in unrealized (loss) gain on investment securities available-for-sale | $ | (1,744 | ) | $ | (583 | ) | $ | 3,711 | ||||||||||||||||
Changes in accumulated other comprehensive income (loss) due to changes in unrealized gain (loss) on investment securities available-for-sale | $ | 524 | $ | (1,744 | ) | $ | (583 | ) | ||||||||||||||||
Accretion of held-to-maturity investment securities from other comprehensive income to interest income | $ | (97 | ) | $ | (144 | ) | $ | (155 | ) | |||||||||||||||
Accretion of held-to-maturity fair value adjustment from other comprehensive income to interest income | $ | (56 | ) | $ | (97 | ) | $ | (144 | ) | |||||||||||||||
Changes in deferred tax related to accretion of held-to-maturity investment securities | 40 | 59 | 64 | 23 | — | — | ||||||||||||||||||
Changes in accumulated other comprehensive income due to accretion of held-to-maturity investment securities | $ | (57 | ) | $ | (85 | ) | $ | (91 | ) | |||||||||||||||
Changes in accumulated other comprehensive income (loss) due to accretion of held-to-maturity investment securities | (33 | ) | (97 | ) | (144 | ) | ||||||||||||||||||
Fair value adjustment for held-to-maturity securities transferred to available-for-sale | (167 | ) | — | — | ||||||||||||||||||||
Changes in deferred tax related to transfer of held-to-maturity investment securities to available-for-sale | 69 | — | — | |||||||||||||||||||||
Net fair value adjustment for held-to-maturity securities transferred to available-for-sale | (98 | ) | — | — | ||||||||||||||||||||
Changes in accumulated other comprehensive income (loss) related held-to-maturity investment securities | $ | (131 | ) | $ | (97 | ) | $ | (144 | ) | |||||||||||||||
Changes in unrealized loss on derivatives | $ | (348 | ) | $ | (584 | ) | $ | (333 | ) | $ | — | $ | (348 | ) | $ | (584 | ) | |||||||
Changes in net deferred tax asset related to changes in unrealized loss on derivatives | 143 | 242 | 136 | — | 143 | 242 | ||||||||||||||||||
Changes in accumulated other comprehensive income due to changes in unrealized loss on derivatives | $ | (205 | ) | $ | (342 | ) | $ | (197 | ) | |||||||||||||||
Changes in accumulated other comprehensive income (loss) due to changes in unrealized loss on derivatives | $ | — | $ | (205 | ) | $ | (342 | ) | ||||||||||||||||
Reclassification of losses (gains) on derivatives | $ | 2,721 | $ | 1,435 | $ | (1,900 | ) | |||||||||||||||||
Changes in net deferred tax asset related to reclassification of losses (gains) on derivatives | (1,120 | ) | (592 | ) | 782 | |||||||||||||||||||
Changes in accumulated other comprehensive income due to reclassification of losses (gains) on derivatives | $ | 1,601 | $ | 843 | $ | (1,118 | ) | |||||||||||||||||
Reclassification of losses on derivatives | $ | — | $ | 2,721 | $ | 1,435 | ||||||||||||||||||
Changes in net deferred tax asset related to reclassification of losses on derivatives | — | (1,120 | ) | (592 | ) | |||||||||||||||||||
Changes in accumulated other comprehensive income (loss) due to reclassification of losses on derivatives | $ | — | $ | 1,601 | $ | 843 | ||||||||||||||||||
Supplemental disclosures of non cash financing activities: | ||||||||||||||||||||||||
Vested restricted stock issued under employee plans | $ | 84 | $ | 36 | $ | 66 | ||||||||||||||||||
Vested and granted restricted stock issued under employee plans | $ | — | $ | 84 | $ | 36 | ||||||||||||||||||
Stock compensation grants for the 2016 compensation plan | $ | 41 | $ | — | $ | — | ||||||||||||||||||
Preferred stock accretion | $ | — | $ | 69 | $ | — | $ | — | $ | — | $ | 69 | ||||||||||||
Transfer of HTM to AFS | $ | 30,330 | $ | — | $ | — | ||||||||||||||||||
Cash dividend declared on common stock and payable after period-end | $ | 401 | $ | 400 | $ | 399 | $ | 486 | $ | 401 | $ | 400 | ||||||||||||
Cash dividend declared on preferred stock and payable after period-end | $ | — | $ | — | $ | 50 | ||||||||||||||||||
Transactions Related to Acquisition: | ||||||||||||||||||||||||
Assets acquired - fair value | $ | 155,230 | $ | — | $ | — | $ | — | $ | 155,230 | $ | — | ||||||||||||
Goodwill | $ | 665 | $ | — | $ | — | $ | — | $ | 665 | $ | — | ||||||||||||
Liabilities assumed - fair value | $ | 149,239 | $ | — | $ | — | $ | — | $ | 149,239 | $ | — | ||||||||||||
See accompanyingNotes toConsolidated Financial Statements.
BANK OF COMMERCE HOLDINGS & SUBSIDIARIES
Notesto Consolidated Financial Statements
NOTE 1. THE BUSINESS OF THE COMPANY
Bank of Commerce Holdings (“HoldingCompany,” “Holding Company,” “we,” or “us”), is a corporation organized under the laws of California and a bank holding company (“BHC”) registered under the Bank Holding Company Act of 1956, as amended (“BHC Act”) with its principal offices in Redding,Sacramento, California. The Holding Company’s principal business is to serve as a holding company for Redding Bank of Commerce (the “Bank” and together with the Holding Company, the “Company”) which operates under two separate names (Redding Bank of Commerce and Sacramento Bank of Commerce, a division of Redding Bank of Commerce) and for Bank of Commerce Mortgage (inactive). The Company has an unconsolidated subsidiary in Bank of Commerce Holdings Trust II. The Bank is principally supervised and regulated by the California Department of Business Oversight (“CDBO”) and the Federal Deposit Insurance Corporation (“FDIC”). Substantially all of the Company’s activities are carried out through the Bank. The Bank was incorporated as a California banking corporation on November 25, 1981.1981 and opened for business on October 22, 1982.
We operate nine full service offices and consider northern California to be our major market. We also operate a full service “cyber office” as identified in our summary of deposits reporting filed with the FDIC. The services offered by the Bank include those traditionally offered by commercial banks of similar size and character in California. Our principal deposit products include the following types of accounts; checking, interest-bearing checking, savings, money market deposits and certificates of deposit, money market deposits.. We also offer sweep arrangements, commercial loans, construction loans, term loans, consumer loans, safe deposit boxes, collection services and electronic banking services. The primary focus of the Bank is to provide banking services to the communities in our major market area, including Small Business Administration loans and payroll processing. The Bank does not offer trust services or international banking services. Our customers are mostly retail customers and small to medium sized businesses.
On March 11, 2016, we completed the purchase of five Bank of America branches in northern California. The acquired branches are located in Colusa, Willows, Orland, Corning, and Yreka. The Bank also acquired three offsite ATM locations in Williams, Orland and Corning. The Bank paid cash consideration of $6.7 million and acquired $155.2 million in assets, primarily cash and premises. The Bank assumed $149.2 million in liabilities, primarily deposits. See Note 26Acquisition in theseNotes to Consolidated Financial Statements.
NOTE 2. SUMMARY OF SIGNIFICANT ACCOUNTING POLICIES
Basis of Financial Statement Presentation -The Consolidated Financial Statements have been prepared in accordance with accounting principles generally accepted in the United States (“GAAP”) and with prevailing practices within the banking and securities industries. In preparing such financial statements, management is required to make certain estimates and judgments that affect the reported amounts of assets and liabilities and disclosure of contingent assets and liabilities as of the date of the balance sheet and the reported amounts of revenues and expenses for the reporting periods. Actual results could differ significantly from those estimates. Material estimates that are particularly susceptible to significant change relate to the valuation of investments and impairments of securities, the determination of the allowance for loan and lease losses (“ALLL”), income taxes, the valuation of other real estate owned (“OREO”), and fair value measurements. Certain amounts for prior periods have been reclassified to conform to the current financial statement presentation. The results of reclassifications are not considered material and have no effect on previously reported equity or net income.
Principles of Consolidation - -The accompanying Consolidated Financial Statements include the accounts of the Holding Company and its subsidiaries. All significant intercompany balances and transactions have been eliminated in consolidation. As of December 31, 2016 2017 and 2015,2016, the Company had one wholly-owned trust formed in 2005 to issue trust preferred securities and related common securities. We have not consolidated the accounts of the Trust in our Consolidated Financial Statements in accordance with Financial Accounting Standards Board Accounting Standards Codification (“FASB”) ASC 810,Consolidation (“ASC 810”). We are not considered the primary beneficiary of the Trust (variable interest entity). As a result, the junior subordinated debentures issued by the Holding Company to the Trust are reflected on the Company’sConsolidated Balance Sheets.
Application of new accounting guidance - In January of 2017, the Company adopted the Financial Accounting Standards Board's (“FASB”) Accounting Standard Update ("ASU") No.2016-09, Compensation - Stock Compensation (Topic 718): Improvements to Employee Share-Based Payment Accounting. ASU 2016-09, seeks to simplify several aspects of the accounting for employee share-based payment transactions, including income tax consequences, classification of awards as either equity or liabilities, and classification on the consolidated statement of cash flows. By applying this ASU, the Company no longer adjusts common stock for the tax impact of shares released, instead the tax impact is recognized as tax expense in the period the shares are released. This simplifies the tracking of the tax benefits and deficiencies, but could cause volatility in tax expense for the periods presented. The consolidated statement of cash flows has been adjusted to reflect the provisions of this ASU. The application of this ASU did not have a material impact on the consolidated financial statements.
Subsequent events – We have evaluated events and transactions subsequent to December 31, 2016 2017 for potential recognition or disclosure.
Cash and Cash Equivalents – For purposes of reporting cash flows, cash and cash equivalents include amounts due from correspondent banks including interest-bearing deposits in correspondent banks and the Federal Reserve Bank, and federal funds sold. Generally, federal funds sold are for a one-day period and securities purchased under agreements to resell are for no more than a 90-day period.
BANK OF COMMERCE HOLDINGS & SUBSIDIARIES
Notes to Consolidated Financial StatementsBank..
Investment Securities –Debt securitiesSecurities are classified as held-to-maturity if we have both the intent and ability to hold those securities to maturity regardless of changes in market conditions, liquidity needs or changes in general economic conditions. These securities are carried at cost adjusted for amortization of premium and accretion of discount, computed by the effective interest method over their contractual lives. Unrealized holding gains or losses are excluded from other comprehensive income (loss). Realized gains or losses, determined on the basis of the cost of specific securities sold or called, are included in earnings. Dividend and interest income are recognized when earned.
Securities are classified as available-for-sale if we intend and have the ability to hold those securities for an indefinite period of time, but not necessarily to maturity. Any decision to sell a security classified as available-for-sale would be based on various factors, including significant movements in interest rates, changes in the maturity mix of assets and liabilities, liquidity needs, regulatory capital considerations and other similar factors. Securities available-for-sale are carried at fair value. Unrealized holding gains or losses are included in other comprehensive income (loss) as a separate component of shareholders’ equity, net of tax. Realized gains or losses, determined on the basis of the cost of specific securities sold, are included in earnings. Premiums and discounts are amortized or accreted over the estimated life of the related investment security as an adjustment to yield using the effective interest method. Dividend and interest income are recognized when earned.
BANK OF COMMERCE HOLDINGS & SUBSIDIARIES
Notes to Consolidated Financial Statements
Transfers of securities from available-for-sale to held-to-maturity are accounted for at fair value as of the date of the transfer. The difference between the fair value and the amortized cost at the date of transfer is considered a premium or discount and is accounted for accordingly. Any unrealized gain or loss at the date of the transfer is reported in other comprehensive income (loss), and is amortized over the estimated remaining life of the security as an adjustment of yield in a manner consistent with the amortization of any premium or discount, and will offset or mitigate the effect on interest income of the amortization of the premium or discount for that held-to-maturity security. Transfers of securities from held-to-maturity to available-for-sale to are accounted for at fair value at the date of the reclassification. Any remaining unamortized fair value adjustments are reclassified from other comprehensive income (loss) and the unrealized holding gain (loss) at the date of transfer is recorded in other comprehensive income net of tax.
We review investment securities on an ongoing basis for the presence of other-than-temporary impairment or permanent impairment, taking into consideration current market conditions, fair value in relationship to cost, extent and nature of the change in fair value, issuer rating changes and trends, whether we intend to sell a security or if it is more likely than not that we will be required to sell the security before recovery of our amortized cost basis of the investment, which may be maturity, and other factors. For debt securities, if we intend to sell the security or it is more likely than not we will be required to sell the security before recovering its cost basis, the entire impairment loss would be recognized in earnings as an other-than-temporary impairment. If we do not intend to sell the security and it is more likely than not we will not be required to sell the security but we do not expect to recover the entire amortized cost basis of the security, only the portion of the impairment loss representing credit losses would be recognized in earnings. The credit loss on a security is measured as the difference between the amortized cost basis and the present value of the cash flows expected to be collected. Projected cash flows are discounted by the original or current effective interest rate depending on the nature of the security being measured for potential other-than-temporary impairment. The remaining impairment related to all other factors, the difference between the present value of the cash flows expected to be collected and fair value, is recognized as a charge to other comprehensive income (loss). Impairment losses related to all other factors are presented as separate categories within other comprehensive income (loss). For investment securities held-to-maturity, this amount is accreted over the remaining life of the debt security prospectively based on the amount and timing of future estimated cash flows. The accretion of the other-than-temporary impairment amount recorded in other comprehensive income (loss) will increase the carrying value of the investment, and would not affect earnings. If there is an indication of additional credit losses the security is re-evaluated according to the procedures described above.
Loans – Loans are stated at the principal amounts outstanding, net of deferred loan fees, deferred loan costs, and the ALLL. Interest on loans is accrued daily based on the principal outstanding. Loan origination and commitment fees and certain origination costs are deferred and the net amount is amortized or accreted over the contractual life of the loans as an adjustment of their yield.
A loan is impaired when, based on current information and events, management believes it is probable that we will not be able to collect all amounts due according to the original contractual terms of the loan agreement. Impairment is measured based upon the present value of expected future cash flows discounted at the loan’s effective rate, the loan’s observable market price, or the fair value of collateral if the loan is collateral dependent. Interest on impaired loans is recognized on a cash basis, and only when the principal is not considered impaired. The CCO reviews and approves loans recommended for impaired status or their removal from impaired status.
Our practice is to place an asset on nonaccrual status when one of the following events occurs: (1)(1) any installment of principal or interest is 90 days or more past due (unless in management’smanagement’s opinion the loan is well-secured and in the process of collection), (2)(2) management determines the ultimate collection of the original principal or interest to be unlikely or, (3)(3) the terms of the loan have been renegotiated due to a serious weakening of the borrower’s financial condition. Nonperforming loans are loans which may be on nonaccrual, 90 days past due and still accruing, or have been restructured. Accruals are resumed on loans only when they are brought fully current with respect to interest and principal and when the loan is estimated to be fully collectible. One exception to the 90 days past due policy for nonaccruals is our purchased pool of home equity loans and purchased consumer loans. For these specific loan pools, we will charge-off any loans that go more than 90 days past due. We believe that at the time these loans become 90 days past due, it is likely that we will not collect the remaining principal balance on the loan. In accordance with this policy, we do not expect to classify any of the loans from these pools as nonaccrual.
Nonperforming loans are loans which may be on nonaccrual, 90 days past due and still accruing, or have been restructured.
Restructured loans are those loans where concessions in terms have been granted because of the borrower’sborrower’s financial or legal difficulties. Interest is generally accrued on such loans in accordance with the new terms, after a period of sustained performance by the borrower.
BANK OF COMMERCE HOLDINGS & SUBSIDIARIES
Notes to Consolidated Financial Statements
One exception to the 90 days past due policy for nonaccruals is our pool of home equity loans and lines that were purchased from a private equity firm. For this specific home equity loan pool, we will charge-off any loans that go more than 90 days past due. We believe that at the time these loans become 90 days past due, it is likely that we will not collect the remaining principal balance on the loan. In accordance with this policy, we do not expect to classify any of the loans from this pool as nonaccrual.
Purchased Loans-Purchased loans are recorded at their fair value at the acquisition date. Credit discounts are included in the determination of fair value; therefore, an ALLL is not recorded at the acquisition date. None of the purchased loans were credit impaired when purchased.
Allowance for Loan and Lease Losses –The adequacy of the ALLL is monitored on a regular basis and is based on management’s evaluation of numerous factors. These factors include the quality of the current loan portfolio; the trend in the loan portfolio’s risk ratings; current economic conditions; loan concentrations; loan growth rates; past-due and non-performing trends; evaluation of specific loss estimates for all impaired loans; historical charge-off and recovery experience; and other pertinent information.
We perform regular credit reviews of the loan portfolio to determine the credit quality of the portfolio and the adherence to underwriting standards. When loans are originated, they are assigned a risk rating that is reassessed periodically during the term of the loan through the credit review process. Our risk rating methodology assigns risk ratings ranging from 1 to 8, where a higher rating represents higher risk. The 8 risk rating categories are a primary factor in determining an appropriate amount for the ALLL. Our Chief Credit Officer (CCO) is responsible for regularly reviewing the ALLL methodology, including loss factors, and ensuring that it is designed and applied in accordance with generally accepted accounting principles. The Board of Directors reviews and approves the adequacy of the ALLL quarterly. The CCO reviews and approves loans recommended for impaired status. The CCO also approves removing loans from impaired status.
BANK OF COMMERCE HOLDINGS & SUBSIDIARIES
Notes to Consolidated Financial Statements
We have divided the loan portfolio into sub-categories of similar type loans. Each category is assigned an historical loss factor and additional qualitative factors. The sub-categories are also further segmented by risk rating. Each risk rating is assigned an additional loss factor to account for the additional risk in those loans with higher risk levels.
Regular credit reviews of the portfolio also identify loans that are considered potentially impaired. Potentially impaired loans are referred to the CCO who reviews and approves designated loans as impaired. A loan is considered impaired when, based on current information and events, we determine that it is probable that we will not be able to collect all amounts due according to the original loan contract, including scheduled interest payments. When we identify a loan as impaired, we measure the impairment using discounted cash flows, except when the sole remaining source of the repayment for the loan is the liquidation of the collateral. In these cases, we use the current fair value of the collateral, less selling costs, instead of discounted cash flows. If we determine that the value of the impaired loan is less than the recorded investment in the loan when using the cash flow method, we recognize this impairment reserve as a specific component to be provided for in the ALLL. If the value of the impaired loan is less than the recorded investment in the loan when using the collateral dependent method, we charge-off the impaired balance. The combination of the risk rating-based allowance component and the impairment reserve allowance component leads to an allocated ALLL.
Wemay also maintain an unallocated allowance amount to provide for other credit losses inherent in a loan and lease portfolio that may not have been contemplated in the credit loss factors. This unallocated amount generally comprises less than 4% of the allowance, but may be maintained at higher levels during times of economic conditions characterized by unstable real estate values. The unallocated amount is reviewed periodicallyquarterly based on trends in credit losses, the results of credit reviews and overall economic trends.
As adjustments to the ALLL become necessary, they are reported in earnings in the periods in which they become known as a charge or credit to the provision for loan and lease losses. Loans, or portions thereof, deemed uncollectible are charged to the ALLL. Recoveries on loans previously charged-off, are added to the ALLL.
We believe that the ALLL was adequate as of December 31, 2016. 2017. There is, however, no assurance that future loan and lease losses will not exceed the levels provided for in the ALLL and could possibly result in additional charges to the provision for loan and lease losses. In addition, bank regulatory authorities, as part of their periodic examination of the Company, may require additional charges to the provision for loan and lease losses in future periods if warranted as a result of their review. Approximately 75%77% of our loan portfolio is secured by real estate, and a significant decline in real estate market values may require an increase in the ALLL.
BANK OF COMMERCE HOLDINGS & SUBSIDIARIES
Notes to Consolidated Financial Statements
Reserve for Unfunded Commitments –A reserve for unfunded commitments is maintained at a level that, in our opinion, is adequate to absorb probable losses associated with our commitment to lend funds under existing agreements such as letters or lines of credit. We determine the adequacy of the reserve for unfunded commitments based upon the category of loan, current economic conditions, the risk characteristics of the various categories of commitments and other relevant factors. The reserve is based on estimates, and ultimate losses may vary from the current estimates.
These estimates are evaluated on a regular basis and, as adjustments become necessary, they are reported in earnings in the periods in which they become known. Draws on unfunded commitments that are considered uncollectible at the time funds are advanced are charged to the reserve for unfunded commitments. Provisions for unfunded commitment losses, and recoveries on loan and lease commitments previously charged off, are added to the reserve for unfunded commitments, which is included in theOther Liabilities line item of theConsolidated Balance Sheets.See Note 16,15,Commitments and Contingencies in theseNotes to Consolidated Financial Statementsfor additional disclosures on the reserve for unfunded commitments.
Premises and Equipment – Premises and equipment are recorded at cost. Depreciation for equipment is provided over the estimated useful lives of the related assets, generally three to seven years, using the straight-line method for financial statement purposes. Depreciation for premises is provided over the estimated useful life of premises, up to 39 years, on a straight-line basis. We use other depreciation methods (generally accelerated depreciation methods) for tax purposes where appropriate. Amortization of leasehold improvements is computed using the straight-line method over the shorter of the remaining lease term or the estimated useful lives of the improvements. Repairs and maintenance are expensed as incurred. Expenditures that increase the value or productive capacity of assets are capitalized. When premises and equipment are retired, sold, or otherwise disposed of, the asset’s carrying amount and related accumulated depreciation are removed from the accounts and any gain or loss is recorded inothernoninterest income orothernoninterest expense in theConsolidatedStatements of Income, respectively.
Goodwill and Other Intangibles-Intangible assets are comprised of goodwill and other intangibles acquired in business combinations. Goodwill and intangible assets with indefinite useful lives are not amortized. Intangible assets with definite useful lives are amortized to their estimated residual values over their respective estimated useful lives, and also reviewed for impairment. Amortization of intangible assets is included innon-interest expense in theConsolidated Statements of Income. We perform a goodwill impairment analysis on an annual basis. Additionally, we perform a goodwill impairment evaluation on an interim basis when events or circumstances indicate impairment potentially exists.
Other Real Estate Owned –Represents real estate of which we have taken control in partial or full satisfaction of loans. At the time of foreclosure, OREO is recorded at fair value less costs to sell, plus costs for improvements that prepare the property for sale, which becomes the property’s new basis. Any write-downs based on the asset’s fair value at the date of acquisition are charged to the ALLL. After foreclosure, management periodically performs valuations and the property is carried at the lower of the cost or fair value less expected selling costs.
Subsequent valuation adjustments are recognized under the line itemother expenses in theConsolidated Statements of Income. Revenue and expenses incurred from OREO property are recorded innoninterest income ornoninterest expense, in theConsolidatedStatements of Income, respectively. In some instances, we may make loans to facilitate the sale of OREO. We review all sales for which we are the lending institution for compliance with sales treatment under provisions established within FASB ASC 360-20,Real Estate Sales. Any gains related to sales of OREO may be deferred until the buyer has a sufficient initial and continuing investment in the property.
Income Taxes –Income taxes reported in theConsolidated Financial Statements are computed based on an asset and liability approach. We recognize the amount of taxes payable or refundable for the current year, and deferred tax assets and liabilities for the expected future tax consequences. Under this method, deferred tax assets and liabilities are determined based on the differences between the financial statements and tax basis of assets and liabilities using enacted tax rates in effect for the year in which the differences are expected to reverse. We record net deferred tax assets to the extent it is more likely than not that they will be realized. In evaluating our ability to recover the deferred tax assets, management considers all available positive and negative evidence, including scheduled reversals of deferred tax liabilities, projected future taxable income, tax planning strategies and recent financial operations.
BANK OF COMMERCE HOLDINGS & SUBSIDIARIES
Notes to Consolidated Financial Statements
In projecting future taxable income, management develops assumptions including the amount of future state and federal pre-taxpre-tax operating income, the reversal of temporary differences and the implementation of feasible and prudent tax planning strategies. These assumptions require significant judgment about the forecasts of future taxable income and are consistent with the plans and estimates being used to manage the underlying business. We file consolidated federal and combined state income tax returns.
BANK OF COMMERCE HOLDINGS & SUBSIDIARIES
Notes to Consolidated Financial Statements
We recognize the financial statement effect of a tax position when it is more likely than not, based on the technical merits, that the position will be sustained upon examination. For tax positions that meet the more likely than not threshold, we may recognize only the largest amount of tax benefit that is greater than fifty percent likely to be realized upon ultimate settlement with the taxing authority. We believe that all of our tax positions taken meet the more likely than not recognition threshold. To the extent tax authorities disagree with these tax positions, our effective tax rates could be materially affected in the period of settlement with the taxing authorities.Seeauthorities.See Note 24,23,Income Taxes in theseNotes to Consolidated Financial Statementsfor more information on income taxes.
Derivative Financial Instruments and Hedging Activities –Prior to March of 2016, we used derivatives to hedge the risk of changes in market interest rates to limit the impact on earnings and cash flows relating to specific groups of assets and liabilities. All of our derivative instruments were designated in qualifying hedge accounting relationships. In accordance with applicable accounting standards, all derivative financial instruments, whether designated for hedge accounting or not, are required to be recorded on theConsolidated Balance Sheets as assets or liabilities and measured at fair value. Additionally, we generally reported derivative financial instruments on a gross basis. However, in certain instances we reported our position on a net basis where we had asset and liability derivative positions with a single counterparty, we had a legally enforceable right of offset, and we intended to settle the position on a net basis. For additional detail on derivative instruments and hedging activities, refer to Note 22,Derivatives in theseNotes to Consolidated Financial Statements.
At the inception of a hedging relationship, we designate each qualifying derivative financial instrument as either a hedge of the fair value of a specifically identified asset or liability (fair value hedge) or; as a hedge of the variability of cash flows to be received or paid related to a recognized asset or liability (cash flow hedge). We formally document all relationships between hedging instruments and hedged items and risk management objectives for undertaking various hedge transactions. Both at the hedge’s inception and on an ongoing basis, we formally assess whether the derivatives that are used in hedging relationships are highly effective in offsetting changes in fair values or cash flows of hedged items.
Changes in the fair value of derivative financial instruments that are designated and qualify as fair value hedges along with the gain or loss on the hedged asset or liability attributable to the hedged risk, are recorded in the current period earnings. For qualifying cash flow hedges, the effective portion of the change in the fair value of the derivative financial instruments is recorded in accumulated other comprehensive income (loss), as a component of equity, and recognized in theConsolidatedStatements of Income when the hedged cash flows affect earnings.
The hedge accounting treatment described herein is no longer applied if a derivative financial instrument is terminated or the hedge designation is removed or is assessed to be no longer highly effective. For these terminated fair value hedges, any changes to the hedged asset or liability remain as part of the basis of the asset or liability and are recognized into income over the remaining life of the asset or liability. For terminated cash flow hedges, unless it is probable that the forecasted cash flows will not occur within a specified period, any changes in fair value of the derivative financial instrument previously recognized remain in other comprehensive income, as a component of equity, and are reclassified into earnings in the same period that the hedged cash flows affect earnings.
Operating Segments –Public enterprises are required to report certain information about their operating segments in a complete set of financial statements to shareholders. They are also required to report certain enterprise-wide information about their products and services, their activities in different geographic areas, and their reliance on major customers. The basis for determining operating segments is the manner in which management operates the business. As of December 31, 2016, 2017, we operated under one primary business segment: Community Banking.
Share Based Payments –We have one active stock-based compensation plan that provides for the granting of stock options and restricted stock to eligible employees and directors. The 2008 Stock Option Plan was approved by the Holding Company’s shareholders on May 15, 2007 (“(“the Plan”). The Plan was amended and restated by the 2010 Equity Incentive Plan which was approved by the Holding Company’s shareholders on May 18, 2010. The latest amendment and restatement of the Plan was approved by the Holding Company’s shareholders on May 15, 2012.
The Plan provides for awardsto key personnel, including directors of incentive and nonqualified stock options, restricted stock units and restricted stock, which may constitute incentive stock options (“Incentive Options”) under Section 422(a)422(a) of the Internal Revenue Code of 1986, as amended (the “Code”), non-statutory stock options (“NSOs”), or restricted stock to key personnel, including directors.stock. The Plan provides that Incentive Options under the Plan may not be granted at less than 100% of fair value of the Holding Company’s common stock on the date of the grant. Nonqualified stock options must have an exercise price of no less than 85% of the fair value of the stock at the date of the grant, a term of no more than ten years, and generally become exercisable over five years from the date of the grant. Restricted shares vest over a three to five year service period. Unvested restricted shares have no dividend or voting rights. Additional disclosure of the payment activity and shares available for future grants is available in Note 19,18,Shareholders’ Equity, in these Notes to the Consolidated Financial Statements.
BANK OF COMMERCE HOLDINGS & SUBSIDIARIES
Notes to Consolidated Financial Statements
In accordance with FASB ASC 718,Stock Compensation,we recognize in theConsolidatedStatements of Income the grant-date fair value of stock options, restricted stock and other equity-based forms of compensation issued to employees over the employees’ requisite service period (generally the vesting period).
BANK OF COMMERCE HOLDINGS & SUBSIDIARIES
Notes to Consolidated Financial Statements
The fair value of each option grant is estimated as of the grant date using the Black-Scholes option-pricing model using the following assumptions:
● | Volatility represents the historical volatility in the Holding Company’s common stock price, for a period consistent with the expected life of the option. |
● | Risk free rate was derived from the U.S. Treasury rate at the time of the grant, which coincides with the expected life of the option. |
● | Expected dividend yield is based on dividend trends and the market value of the Holding Company’s common stock at the time of grant. |
● | Annual dividend rate is the ratio of the expected annual dividends to the Holding |
● | Assumed forfeiture rate |
● | Expected life is estimated based on the history of the Holding |
The following weighted average assumptions were used to determine the fair value of stock option grants as of the grant date to determine compensation cost for the years ended December 31, 2015 and 2014. 2015. There were no stock option grants during 2017 or 2016.
2015 | 2014 | 2015 | ||||||||||
Volatility | 26.44 | % | 27.37 | % | 26.44 | % | ||||||
Risk free interest rate | 1.64 | % | 1.68 | % | 1.64 | % | ||||||
Expected dividends | $ | 0.12 |
| $ | 0.14 |
| $ | 0.12 | ||||
Annual dividend rate | 2.05 | % | 2.22 | % | 2.05 | % | ||||||
Assumed forfeiture rate | — |
| — |
| — | |||||||
Expected life (years) | 7 | 7 | ||||||||||
Expected life (in years) | 7 | |||||||||||
Earnings per Share -Earnings per share is an important measure of our performance for investors and other users of financial statements. Certain of our securities, such as unvested restricted stock and stock options, permit the holders to become common shareholders or add to the number of shares of common stock already held. Because there is potential reduction, calleddilution, of earnings per share figures inherent in our capital structure, we are required to present a dual presentation of earnings per share - basic earnings per share and diluted earnings per share.
Basic earnings per share excludes dilution and is computed by dividing income available to common shareholders by the weighted-average number of common shares outstanding for the period, excluding unvested restricted stock awards which do not have voting rights or share in dividends. Diluted earnings per share reflects the potential dilution that could occur if securities or other contracts to issue common stock were exercised or converted into common stock or resulted in the issuance of common stock that then shared in the earnings of the Holding Company. The computation of diluted earnings per share does not assume conversion, exercise, or contingent issuance of securities that would have an anti-dilutive effect on earnings per share.
We present both basic and diluted earnings per share on the face of theConsolidated Statements of Income. In addition, a detailed presentation of the earnings per share calculation is provided in Note 27,26,Earnings Per Common Share in theseNotes to Consolidated Financial Statements.
Advertising Costs –For the years ended December 31, 2017, 2016, 2015, and 2014,2015, advertising costs were $171$61 thousand, $64$171 thousand, and $90$64 thousand, respectively. Advertising costs were expensed as incurred.
BANK OF COMMERCE HOLDINGS & SUBSIDIARIES
Notes to Consolidated Financial Statements
Fair Value Measurements –FASB ASC 820, Fair Value Measurements and Disclosures, defines fair value as the price that would be received to sell an asset or paid to transfer a liability in an orderly transaction between market participants at the measurement date. FASB ASC 820 establishes a three-levelthree-level hierarchy for disclosure of assets and liabilities recorded at fair value. The classification of assets and liabilities within the hierarchy is based on whether the inputs to the valuation methodology used for measurement are observable or unobservable. Observable inputs reflect market-derived or market-based information obtained from independent sources, while unobservable inputs reflect our estimates about market data. In general, fair values determined by Level 1 inputs utilize quoted prices for identical assets or liabilities traded in active markets that we have the ability to access. Fair values determined by Level 2 inputs utilize inputs other than quoted prices included in Level 1 that are observable for the asset or liability, either directly or indirectly. Level 2 inputs include quoted prices for similar assets and liabilities in active markets, and inputs other than quoted prices that are observable for the asset or liability, such as interest rates and yield curves that are observable at commonly quoted intervals. Level 3 inputs are unobservable inputs for the asset or liability, and include situations where there is little, if any, market activity for the asset or liability. In certain cases, the inputs used to measure fair value may fall into different levels of the fair value hierarchy. In such cases, the level in the fair value hierarchy within which the fair value measurement in its entirety falls has been determined based on the lowest level input that is significant to the fair value measurement in its entirety. Our assessment of the significance of a particular input to the fair value measurement in its entirety requires judgment, and considers factors specific to the asset or liability.
Recent Accounting Pronouncements
ASU No.2016-13
Description - In June of 2016, the FASB issued ASU No.2016-13, Financial Instruments – Credit Losses (Topic 326): Measurement of Credit Losses on Financial Instruments. The amendments are intended to improve financial reporting by requiring timelier recording of credit losses on loans and other financial instruments held by financial institutions and other organizations. The ASU requires the measurement of all expected credit losses for financial assets held at the reporting date based on historical experience, current conditions, and reasonable and supportable forecasts. Financial institutions and other organizations will now use forward-looking information to better inform their credit loss estimates.
|
|
The amendments also eliminate the requirements for any reporting unit with a zero or negative carrying amount to perform a qualitative assessment and, if it fails that qualitative test, to perform Step 2 of the goodwill impairment test. An entity still has the option to perform the qualitative assessment for a reporting unit to determine if the quantitative impairment test is necessary.BANK OF COMMERCE HOLDINGS & SUBSIDIARIES
The amendments should be applied on a prospective basis. The nature of and reason for the change in accounting principle should be disclosed upon transition. The amendment is effective for fiscal years, and interim periods within those fiscal years, beginning after December 15, 2019. Early adoption is permitted for interim or annual goodwill impairment tests performed on testing dates after January 1, 2017. The Company does not expect this ASUNotes to have a material impact on the Company's consolidated financial statements.Consolidated Financial Statements
|
|
Many of the loss estimation techniques applied today will still be permitted, although the inputs to those techniques will change to reflect the full amount of expected credit losses. Organizations will continue to use judgment to determine which loss estimation method is appropriate for their circumstances.
The ASU requires enhanced disclosures to help investors and other financial statement users to better understand significant estimates and judgments used in estimating credit losses, as well as the credit quality and underwriting standards of an organization’sorganization’s portfolio. These disclosures include qualitative and quantitative requirements that provide additional information about the amounts recorded in the financial statements. In addition, the ASU amends the accounting guidance for credit losses on available-for-sale debt securities and purchased financial assets with credit deterioration.
BANK OF COMMERCE HOLDINGS & SUBSIDIARIES
Notes to Consolidated Financial Statements
Methods and timing of adoption – The amendment is effective for fiscal years, and interim periods within those fiscal years, beginning after December 15, 2019. Early application will be permitted for fiscal years, and interim periods within those fiscal years, beginning after December 15, 2018.
Expected financial statement impact – We are currently evaluating the provisions of the ASU and have formed a committee for the purpose of developing a model that is compliant with the requirements under the ASU. The committee is also gathering pertinent data, consulting with outside professionals and evaluating our IT systems. Management expects to recognize a one–time cumulative effect adjustment to the allowance for loan and lease losses as of the first reporting period in which the new standard is effective. An estimate of the magnitude of the one-time adjustment or the overall impact of this standard has not yet been determined; however, the impact may be significant.determined.
ASU No.2016-02 |
|
|
|
|
|
Methods and timing of adoption – For public companies, the amendments in this update are effective for fiscal years beginning after December 15, 2018, including interim periods within those fiscal years.
Expected financial statement impact – The Company has performed an initial analysis of our existing leases and expects a significant new lease asset and related lease liability on the balance sheet due to the number of leased properties the Company currently has that are accounted for under current operating lease guidance.
ASU No.2016-01
Description - In January 2016, the FASB issued ASU No.2016-01, Financial Instruments – Overall (Subtopic 825-10): Recognition and Measurement of Financial Assets and Financial Liabilities. The new guidance is intended to improve the recognition and measurement of financial instruments. This ASU requires equity investments (except those accounted for under the equity method of accounting, or those that result in consolidation of the investee) to be measured at fair value with changes in fair value recognized in net income. In addition, the amendment requires public business entities to use the exit price notion when measuring the fair value of financial instruments for disclosure purposes and requires separate presentation of financial assets and financial liabilities by measurement category and form of financial asset (i.e., securities or loans and receivables) on the balance sheet or the accompanying notes to the financial statements. This ASU also eliminates the requirement for public business entities to disclose the method(s) and significant assumptions used to estimate the fair value that is required to be disclosed for financial instruments measured at amortized cost on the balance sheet. The amendment also requires a reporting organization to present separately in other comprehensive income the portion of the total change in the fair value of a liability resulting from a change in the instrument specific credit risk (also referred to as "own credit") when the organization has elected to measure the liability at fair value in accordance with the fair value option for financial instruments.
Methods and timing of adoption – ASU No.2016-01 is effective for financial statements issued for fiscal years beginning after December 15, 2017, and interim periods within those fiscal years. Early adoption is permitted for certain provisions.
Expected financial statement impact – The Company has evaluated the potential impact of this ASU on the Company's consolidated financial statements and we do not expect adoption of this ASU to have a material impact on the Company’s financial statements.
ASU No.2014-09
Description - In May of 2014, the FASB issued ASU No.2014-09, Revenue from Contracts with Customers, which creates Topic 606 and supersedes Topic 605, Revenue Recognition. The core principle of Topic 606 is that an entity recognizes revenue to depict the transfer of promised goods or services to customers in an amount that reflects the consideration to which the entity expects to be entitled in exchange for those goods or services. In general, the new guidance requires companies to use more judgment and make more estimates than under current guidance, including identifying performance obligations in the contract, estimating the amount of variable consideration to include in the transaction price and allocating the transaction price to each separate performance obligation.
Methods and timing of adoption – The standard is effective for public entities for interim and annual periods beginning after December 15, 2017 as deferred by ASU No. 2015-14;2015-14; early adoption is not permitted. For financial reporting purposes, the standard allows for either full retrospective adoption, meaning the standard is applied to all of the periods presented, or modified retrospective adoption, meaning the standard is applied only to the most current period presented in the financial statements with the cumulative effect of initially applying the standard recognized at the date of initial application.adoption. As a bank, key revenue sources, such as interest income have been identified as out of scope of this new guidance. The Company has not yet determinedplans to adopt ASU No.2014-09 on January 1, 2018 utilizing the modified retrospective approach.
BANK OF COMMERCE HOLDINGS & SUBSIDIARIES
Notes to Consolidated Financial Statements
Expected financial statement impact this– Since the guidance does not apply to revenue associated with financial instruments, including loans and securities that are accounted for under other GAAP, we do not expect the new guidance to have a material impact on interest income. We have completed our overall assessment of noninterest income revenue streams and reviewing contracts potentially affected by the ASU including fees on payroll and benefit processing, deposit related fees, interchange fees, and merchant income, and determined that the new guidance will have.not have a material impact on the Company’s financial position, results of operations or cash flows.
NOTE 3. RESTRICTIONS ON CASH AND DUE FROM BANKS
We maintainhave a Fed Funds line of credit with one correspondent bank which requires us to hold compensating cash balances with two primary correspondent banks, which totaled $700of $450 thousand. We maintained the required compensating balance of $450 thousand at December 31, 2017 and December 31, 2016.
The Bank is required by federal regulations to set aside specified amounts of cash as reserves against transaction and time deposits. The cash reserve required as of December 31, 2017 and December 31, 2016 was $1.7 million and 2015.
BANK OF COMMERCE HOLDINGS & SUBSIDIARIES
Notes to Consolidated Financial Statements$1.5 million, respectively which was satisfied by vault cash balances.
NOTE 4. SECURITIES
The following table presents the amortized costs, unrealized gains, unrealized losses and approximateestimated fair values of our investment securities as of December 31, 2016, 2017, and December 31, 2015.2016.
As of December 31, 2016 | As of December 31, 2017 | |||||||||||||||||||||||||||||||
Gross | Gross | Gross | Gross | |||||||||||||||||||||||||||||
Amortized | Unrealized | Unrealized | Estimated | Amortized | Unrealized | Unrealized | Estimated | |||||||||||||||||||||||||
(Amounts in thousands) | Costs | Gains | Losses | Fair Value | Costs | Gains | Losses | Fair Value | ||||||||||||||||||||||||
Available-for-sale securities: | ||||||||||||||||||||||||||||||||
U.S. government & agencies | $ | 40,319 | $ | 196 | $ | (146 | ) | $ | 40,369 | |||||||||||||||||||||||
Obligations of state and political subdivisions | $ | 58,847 | $ | 1,001 | $ | (420 | ) | $ | 59,428 | 77,412 | 1,910 | (478 | ) | 78,844 | ||||||||||||||||||
Residential mortgage backed securities and collateralized mortgage obligations | 71,068 | 33 | (1,497 | ) | 69,604 | |||||||||||||||||||||||||||
Residential mortgage-backed securities and collateralized mortgage obligations | 116,061 | 69 | (1,538 | ) | 114,592 | |||||||||||||||||||||||||||
Corporate securities | 16,153 | 103 | (140 | ) | 16,116 | 5,079 | 18 | (105 | ) | 4,992 | ||||||||||||||||||||||
Commercial mortgage backed securities | 15,786 | 9 | (281 | ) | 15,514 | |||||||||||||||||||||||||||
Other asset backed securities | 14,664 | 18 | (170 | ) | 14,512 | |||||||||||||||||||||||||||
Commercial mortgage-backed securities | 26,995 | 24 | (378 | ) | 26,641 | |||||||||||||||||||||||||||
Other asset-backed securities | 2,540 | 4 | (28 | ) | 2,516 | |||||||||||||||||||||||||||
Total | $ | 176,518 | $ | 1,164 | $ | (2,508 | ) | $ | 175,174 | $ | 268,406 | $ | 2,221 | $ | (2,673 | ) | $ | 267,954 | ||||||||||||||
Held-to-maturity securities: | ||||||||||||||||||||||||||||||||
Obligations of state and political subdivisions | $ | 31,187 | $ | 710 | $ | (523 | ) | $ | 31,374 | |||||||||||||||||||||||
As of December 31, 2015 | ||||||||||||||||
Gross | Gross | |||||||||||||||
Amortized | Unrealized | Unrealized | Estimated | |||||||||||||
(Amounts in thousands) | Costs | Gains | Losses | Fair Value | ||||||||||||
Available-for-sale securities: | ||||||||||||||||
U.S. government & agencies | $ | 3,886 | $ | 57 | $ | — | $ | 3,943 | ||||||||
Obligations of state and political subdivisions | 59,332 | 1,811 | (39 | ) | 61,104 | |||||||||||
Residential mortgage backed securities and collateralized mortgage obligations | 32,215 | 192 | (270 | ) | 32,137 | |||||||||||
Corporate securities | 33,775 | 194 | (191 | ) | 33,778 | |||||||||||
Commercial mortgage backed securities | 12,893 | 10 | (134 | ) | 12,769 | |||||||||||
Other asset backed securities | 15,331 | 82 | (114 | ) | 15,299 | |||||||||||
Total | $ | 157,432 | $ | 2,346 | $ | (748 | ) | $ | 159,030 | |||||||
Held-to-maturity securities: | ||||||||||||||||
Obligations of state and political subdivisions | $ | 35,899 | $ | 966 | $ | (220 | ) | $ | 36,645 | |||||||
As of December 31, 2016 | ||||||||||||||||
Gross | Gross | |||||||||||||||
Amortized | Unrealized | Unrealized | Estimated | |||||||||||||
(Amounts in thousands) | Costs | Gains | Losses | Fair Value | ||||||||||||
Available-for-sale securities: | ||||||||||||||||
U.S. government & agencies | $ | 10,427 | $ | 10 | $ | (83 | ) | $ | 10,354 | |||||||
Obligations of state and political subdivisions | 58,847 | 1,001 | (420 | ) | 59,428 | |||||||||||
Residential mortgage-backed securities and collateralized mortgage obligations | 71,068 | 33 | (1,497 | ) | 69,604 | |||||||||||
Corporate securities | 16,153 | 103 | (140 | ) | 16,116 | |||||||||||
Commercial mortgage-backed securities | 15,786 | 9 | (281 | ) | 15,514 | |||||||||||
Other asset-backed securities | 4,237 | 8 | (87 | ) | 4,158 | |||||||||||
Total | $ | 176,518 | $ | 1,164 | $ | (2,508 | ) | $ | 175,174 | |||||||
Held-to-maturity securities: | ||||||||||||||||
Obligations of state and political subdivisions | $ | 31,187 | $ | 710 | $ | (523 | ) | $ | 31,374 | |||||||
During the fourth quarter, we reclassified the entire HTM securities portfolio to AFS. At the date of the reclassification the HTM securities portfolio was carried at an amortized cost of $30.3 million. The reclassification of securities between categories was accounted for at fair value. At the date of the reclassification, the securities had a fair value of $31.4 million and unrealized holding gains of $1.2 million which were recorded net of tax in other comprehensive income. The remaining net unrealized gain of $167 thousand which was recorded in other comprehensive income (OCI) net of tax was included in the amortized cost of the securities when transferred.
BANK OF COMMERCE HOLDINGS & SUBSIDIARIES
Notes to Consolidated Financial Statements
We reclassified the held-to-maturity securities portfolio to available-for-sale to provide increased flexibility to support the loan pipeline and take advantage of opportunities to improve the overall structure and yield of the investment portfolio. As a result of this transfer we have are precluded from classifying any investment securities as held-to-maturity for two years from the date of the transfer. Management does not expect to designate acquired securities as held-to-maturity in the near future.
The following table presents the expected maturities of investment securities at December 31, 2016.2017.
Available-For-Sale | Held-To-Maturity | |||||||||||||||
(Amounts in thousands) | Amortized Cost | Fair Value | Amortized Cost | Fair Value | ||||||||||||
Amounts maturing in: | ||||||||||||||||
One year or less | $ | 4,636 | $ | 4,641 | $ | — | $ | — | ||||||||
One year through five years | 69,694 | 68,698 | 4,604 | 4,723 | ||||||||||||
Five years through ten years | 43,350 | 43,287 | 13,469 | 13,572 | ||||||||||||
After ten years | 58,838 | 58,548 | 13,114 | 13,079 | ||||||||||||
Total | $ | 176,518 | $ | 175,174 | $ | 31,187 | $ | 31,374 | ||||||||
Available-For-Sale | ||||||||
(Amounts in thousands) | Amortized Cost | Fair Value | ||||||
Amounts maturing in: | ||||||||
One year or less | $ | 1,425 | $ | 1,430 | ||||
One year through five years | 87,888 | 87,424 | ||||||
Five years through ten years | 83,450 | 83,430 | ||||||
After ten years | 95,643 | 95,670 | ||||||
Total | $ | 268,406 | $ | 267,954 | ||||
BANK OF COMMERCE HOLDINGS & SUBSIDIARIES
Notes to Consolidated Financial Statements
The amortized cost and fair value of residential mortgage backedmortgage-backed securities, collateralized mortgage obligations and commercial mortgage securities are presented by their expected average life, rather than contractual maturity, because the underlying loans may be repaid without prepayment penalties.
The following table presents theAt December 31, 2017 and 2016, securities with a fair value of the securities held$62.6 million and $39.2 million, respectively, were pledged as collateral to secure public fund deposits, Federal Home Loan Bank of San Francisco borrowings and for pledging, segregatedother purposes as required by purpose, as of December 31, 2016.law.
(Amounts in thousands) | Pledged | Available To Be Pledged | Total Held For Pledging Purposes | |||||||||
Public funds collateral | $ | 17,281 | $ | 6,854 | $ | 24,135 | ||||||
Federal Home Loan Bank of San Francisco borrowings | — | 15,080 | 15,080 | |||||||||
Total | $ | 17,281 | $ | 21,934 | $ | 39,215 | ||||||
The following table presents the cash proceeds from sales of securities and the associated gross realized gains and gross realized losses that have been included in earnings for the years ended December 31, 2017, 2016 2015 and 2014.2015.
For Years Ended December 31, | For Years Ended December 31, | |||||||||||||||||||||||
(Amounts in thousands) | 2016 | 2015 | 2014 | 2017 | 2016 | 2015 | ||||||||||||||||||
Proceeds from sales of securities | $ | 51,025 | $ | 71,277 | $ | 93,545 | $ | 64,349 | $ | 51,025 | $ | 71,277 | ||||||||||||
Gross realized gains on sales of securities: | ||||||||||||||||||||||||
U.S. government & agencies | $ | — | $ | — | $ | 32 | $ | — | $ | 25 | $ | 16 | ||||||||||||
Obligations of state and political subdivisions | 188 | 97 | 268 | 161 | 188 | 97 | ||||||||||||||||||
Residential mortgage backed securities and collateralized mortgage obligations | 17 | 142 | 102 | |||||||||||||||||||||
Residential mortgage-backed securities and collateralized mortgage obligations | 52 | 17 | 142 | |||||||||||||||||||||
Corporate securities | 105 | 161 | 317 | 79 | 105 | 161 | ||||||||||||||||||
Commercial mortgage backed securities | 4 | 14 | 4 | |||||||||||||||||||||
Other asset backed securities | 38 | 142 | 73 | |||||||||||||||||||||
Commercial mortgage-backed securities | 3 | 4 | 14 | |||||||||||||||||||||
Other asset-backed securities | 20 | 13 | 126 | |||||||||||||||||||||
Total gross realized gains on sales of securities | 352 | 556 | 796 | 315 | 352 | 556 | ||||||||||||||||||
Gross realized losses on sales of securities | ||||||||||||||||||||||||
U.S. government & agencies | — | (4 | ) | (114 | ) | — | (13 | ) | (33 | ) | ||||||||||||||
Obligations of state and political subdivisions | (3 | ) | (29 | ) | (209 | ) | (102 | ) | (3 | ) | (29 | ) | ||||||||||||
Residential mortgage backed securities and collateralized mortgage obligations | (64 | ) | (12 | ) | (570 | ) | ||||||||||||||||||
Residential mortgage-backed securities and collateralized mortgage obligations | (56 | ) | (64 | ) | (12 | ) | ||||||||||||||||||
Corporate securities | (27 | ) | (14 | ) | (8 | ) | (3 | ) | (27 | ) | (14 | ) | ||||||||||||
Commercial mortgage backed securities | (1 | ) | — | (32 | ) | |||||||||||||||||||
Other asset backed securities | (13 | ) | (54 | ) | (22 | ) | ||||||||||||||||||
Commercial mortgage-backed securities | (17 | ) | (1 | ) | — | |||||||||||||||||||
Other asset-backed securities | — | — | (25 | ) | ||||||||||||||||||||
Total gross realized losses on sales of securities | (108 | ) | (113 | ) | (955 | ) | (178 | ) | (108 | ) | (113 | ) | ||||||||||||
Gain (loss) on investment securities, net | $ | 244 | $ | 443 | $ | (159 | ) | |||||||||||||||||
Gain on investment securities, net | $ | 137 | $ | 244 | $ | 443 | ||||||||||||||||||
BANK OF COMMERCE HOLDINGS & SUBSIDIARIES
Notes to Consolidated Financial Statements
Investment securities that were in an unrealized loss position as of December 31, 2017 and December 31, 2016 and December 31, 2015 are presented in the following tables, based on the length of time individual securities have been in an unrealized loss position.
As of December 31, 2017 | ||||||||||||||||||||||||
Less Than 12 Months | 12 Months or More | Total | ||||||||||||||||||||||
Fair | Unrealized | Fair | Unrealized | Fair | Unrealized | |||||||||||||||||||
(Amounts in thousands) | Value | Losses | Value | Losses | Value | Losses | ||||||||||||||||||
Available-for-sale securities: | ||||||||||||||||||||||||
U.S. government & agencies | $ | 18,140 | $ | (102 | ) | $ | 2,131 | $ | (44 | ) | $ | 20,271 | $ | (146 | ) | |||||||||
Obligations of states and political subdivisions | 15,030 | (255 | ) | 8,368 | (223 | ) | 23,398 | (478 | ) | |||||||||||||||
Residential mortgage-backed securities and collateralized mortgage obligations | 75,323 | (827 | ) | 31,036 | (711 | ) | 106,359 | (1,538 | ) | |||||||||||||||
Corporate securities | — | — | 2,934 | (105 | ) | 2,934 | (105 | ) | ||||||||||||||||
Commercial mortgage-backed securities | 11,162 | (151 | ) | 10,026 | (227 | ) | 21,188 | (378 | ) | |||||||||||||||
Other asset-backed securities | 2,167 | (28 | ) | — | — | 2,167 | (28 | ) | ||||||||||||||||
Total temporarily impaired securities | $ | 121,822 | $ | (1,363 | ) | $ | 54,495 | $ | (1,310 | ) | $ | 176,317 | $ | (2,673 | ) | |||||||||
As of December 31, 2016 | ||||||||||||||||||||||||
Less Than 12 Months | 12 Months or More | Total | ||||||||||||||||||||||
Fair | Unrealized | Fair | Unrealized | Fair | Unrealized | |||||||||||||||||||
(Amounts in thousands) | Value | Losses | Value | Losses | Value | Losses | ||||||||||||||||||
Available-for-sale securities: | ||||||||||||||||||||||||
U.S. government & agencies | $ | 9,139 | $ | (83 | ) | $ | — | $ | — | $ | 9,139 | $ | (83 | ) | ||||||||||
Obligations of states and political subdivisions | 20,329 | (420 | ) | — | — | 20,329 | (420 | ) | ||||||||||||||||
Residential mortgage-backed securities and collateralized mortgage obligations | 52,345 | (1,396 | ) | 4,108 | (101 | ) | 56,453 | (1,497 | ) | |||||||||||||||
Corporate securities | 8,908 | (140 | ) | — | — | 8,908 | (140 | ) | ||||||||||||||||
Commercial mortgage-backed securities | 12,041 | (191 | ) | 2,849 | (90 | ) | 14,890 | (281 | ) | |||||||||||||||
Other asset-backed securities | 2,280 | (28 | ) | 1,346 | (59 | ) | 3,626 | (87 | ) | |||||||||||||||
Total temporarily impaired securities | $ | 105,042 | $ | (2,258 | ) | $ | 8,303 | $ | (250 | ) | $ | 113,345 | $ | (2,508 | ) | |||||||||
Held-to-maturity securities: | ||||||||||||||||||||||||
Obligations of states and political subdivisions | $ | 11,639 | $ | (425 | ) | $ | 933 | $ | (98 | ) | $ | 12,572 | $ | (523 | ) | |||||||||
At December 31, 2017 and December 31, 2016, the number of securities that were in unrealized loss position was 138 and 119, respectively. In the opinion of management, these securities are considered only temporarily impaired due to changes in market interest rates or widening of market spreads subsequent to the initial purchase of the securities, and not due to concerns regarding the underlying credit of the issuers or the underlying collateral. Management monitors the published credit ratings of our available-for-sale investment portfolio for material rating or outlook changes. For all private-label securities collateralized by mortgages, management also monitors the credit characteristics of the underlying mortgages to identify potential credit losses, if any, in the portfolio. Because the decline in fair value is not due to credit quality concerns, and because we have no plans to sell the securities before the recovery of their amortized cost, and we believe the bank has the ability to hold the securities to maturity these investments are not considered other-than-temporarily impaired.
Our Investment Policy requires that at the time of purchase, securities purchased to be rated A3/A- or higher by Moody’s, S&P and Fitch rating agencies.
BANK OF COMMERCE HOLDINGS & SUBSIDIARIES
Notes to Consolidated Financial Statements
As of December 31, 2016 | ||||||||||||||||||||||||
Less Than 12 Months | 12 Months or More | Total | ||||||||||||||||||||||
Fair | Unrealized | Fair | Unrealized | Fair | Unrealized | |||||||||||||||||||
(Amounts in thousands) | Value | Losses | Value | Losses | Value | Losses | ||||||||||||||||||
Available-for-sale securities: | ||||||||||||||||||||||||
Obligations of states and political subdivisions | $ | 20,329 | $ | (420 | ) | $ | — | $ | — | $ | 20,329 | $ | (420 | ) | ||||||||||
Residential mortgage backed securities and collateralized mortgage obligations | 52,345 | (1,396 | ) | 4,108 | (101 | ) | 56,453 | (1,497 | ) | |||||||||||||||
Corporate securities | 8,908 | (140 | ) | — | — | 8,908 | (140 | ) | ||||||||||||||||
Commercial mortgage backed securities | 12,041 | (191 | ) | 2,849 | (90 | ) | 14,890 | (281 | ) | |||||||||||||||
Other asset backed securities | 11,419 | (111 | ) | 1,346 | (59 | ) | 12,765 | (170 | ) | |||||||||||||||
Total temporarily impaired securities | $ | 105,042 | $ | (2,258 | ) | $ | 8,303 | $ | (250 | ) | $ | 113,345 | $ | (2,508 | ) | |||||||||
Held-to-maturity securities: | ||||||||||||||||||||||||
Obligations of states and political subdivisions | $ | 11,639 | $ | (425 | ) | $ | 933 | $ | (98 | ) | $ | 12,572 | $ | (523 | ) | |||||||||
As of December 31, 2015 | ||||||||||||||||||||||||
Less Than 12 Months | 12 Months or More | Total | ||||||||||||||||||||||
Fair | Unrealized | Fair | Unrealized | Fair | Unrealized | |||||||||||||||||||
(Amounts in thousands) | Value | Losses | Value | Losses | Value | Losses | ||||||||||||||||||
Available-for-sale securities: | ||||||||||||||||||||||||
Obligations of states and political subdivisions | $ | 7,682 | $ | (39 | ) | $ | — | $ | — | $ | 7,682 | $ | (39 | ) | ||||||||||
Residential mortgage backed securities and collateralized mortgage obligations | 16,279 | (210 | ) | 4,931 | (60 | ) | 21,210 | (270 | ) | |||||||||||||||
Corporate securities | 18,707 | (191 | ) | — | — | 18,707 | (191 | ) | ||||||||||||||||
Commercial mortgage backed securities | 7,557 | (62 | ) | 1,516 | (72 | ) | 9,073 | (134 | ) | |||||||||||||||
Other asset backed securities | 4,734 | (13 | ) | 3,430 | (101 | ) | 8,164 | (114 | ) | |||||||||||||||
Total temporarily impaired securities | $ | 54,959 | $ | (515 | ) | $ | 9,877 | $ | (233 | ) | $ | 64,836 | $ | (748 | ) | |||||||||
Held-to-maturity securities: | ||||||||||||||||||||||||
Obligations of states and political subdivisions | $ | 1,513 | $ | (63 | ) | $ | 4,831 | $ | (157 | ) | $ | 6,344 | $ | (220 | ) | |||||||||
At December 31, 2016, 119The following table presents the characteristics of our securities werethat are in unrealized loss positions and at December 31, 2015, 59 securities were in an unrealized loss position.2017 and December 31, 2016.
Characteristics of securities in unrealized loss positions at | ||
Available-for-sale securities: | December 31, 2017 and December 31, 2016 | |
U.S. government & agencies | Direct obligations of the U.S. Government or obligations guaranteed by U.S. Government agencies. | |
Obligations of states and political subdivisions | General obligation issuances or revenue securities secured by revenues from specific sources issued by municipalities and political subdivisions located within the U.S. | |
Residential mortgage-backed securities and collateralized mortgage obligations | Obligations of U.S. government sponsored entities or non-governmental entities collateralized by high quality mortgages on residential properties. Issuances by non-governmental entities usually include good credit enhancements. Of the residential mortgage-backed securities and collateralized mortgage obligations that we owned at December 31, 2017 and December 31, 2016, 56% and 49% were issued or guaranteed by U.S. government sponsored entities, respectively. | |
Corporate securities | Debt obligations generally issued or guaranteed by large U.S. corporate institutions. | |
Commercial mortgage-backed securities | Obligations of U.S. government sponsored entities or non-governmental entities collateralized by high quality mortgages on commercial properties. Issuances by non-governmental entities usually include good credit enhancements. Of the commercial mortgage-backed securities that we owned at December 31, 2017 and December 31, 2016, 90% and 91% were issued or guaranteed by U.S. government sponsored entities, respectively. | |
Other asset-backed securities | Obligations secured by high quality loans with good credit enhancements issued by non-governmental issuers. |
Other-Than-Temporary Impairment
At June 30, 2016, we held $3.2 million par value of AgriBank subordinated notes due July 15, 2019. On April 28, 2016, AgriBank announced that, on July 15, 2016, it would redeem the entire outstanding principal amount of these notes at 100% of the principal amount together with all accrued and unpaid interest. During the second quarter of 2016, we determined that the present value of the expected cash flows on our AgriBank investment was $546 thousand less than our amortized cost basis and recorded an other-than-temporary impairment for that amount. We did not recognize any additional, other-than-temporary impairment losses forFor the year ended December 31, 2017, we did not recognize any other-than-temporary impairment losses. We recognized one impairment loss of $546 thousand during the second quarter of 2016 or for related to our investment in AgriBank and there were no other impairment losses recognized during the year ended December 31, 2015.
BANK OF COMMERCE HOLDINGS & SUBSIDIARIES
Notes to Consolidated Financial Statements2016.
NOTE 5. LOANS
Outstanding loan balances consist of the following at December 31, 2016, 2017, and December 31, 2015.2016.
As of | As of | |||||||||||||||
(Amounts in thousands) | December 31, | December 31, | ||||||||||||||
Loan Portfolio | 2016 | 2015 | 2017 | 2016 | ||||||||||||
Commercial | $ | 153,844 | $ | 132,805 | $ | 149,088 | $ | 153,844 | ||||||||
Commercial real estate: | ||||||||||||||||
Real estate – construction and land development | 57,771 | 28,319 | 15,902 | 36,792 | ||||||||||||
Real estate – commercial non-owner occupied | 287,455 | 243,374 | 377,668 | 292,615 | ||||||||||||
Real estate – commercial owner occupied | 151,516 | 156,299 | 185,340 | 167,335 | ||||||||||||
Residential real estate: | ||||||||||||||||
Real estate – residential - Individual Tax Identification Number ("ITIN") | 45,566 | 49,106 | 41,188 | 45,566 | ||||||||||||
Real estate – residential - 1-4 family mortgage | 12,866 | 13,640 | 30,377 | 20,425 | ||||||||||||
Real estate – residential - equity lines | 43,512 | 43,223 | 30,347 | 35,953 | ||||||||||||
Consumer and other | 51,681 | 49,873 | 49,925 | 51,681 | ||||||||||||
Gross loans | 804,211 | 716,639 | 879,835 | 804,211 | ||||||||||||
Deferred fees and costs | 1,324 | 870 | 1,710 | 1,324 | ||||||||||||
Loans, net of deferred fees and costs | 805,535 | 717,509 | 881,545 | 805,535 | ||||||||||||
Allowance for loan and lease losses | (11,544 | ) | (11,180 | ) | (11,925 | ) | (11,544 | ) | ||||||||
Net loans | $ | 793,991 | $ | 706,329 | $ | 869,620 | $ | 793,991 | ||||||||
Past Due Loans
When we purchase loans they are typically purchased at a discount to enhance yield and compensate for credit risk. Gross loan balances in the table above include net purchase discounts of $2.9$2.8 million and $2.3$2.9 million as of December 31, 2017, and December 31, 2016, and December 31, 2015, respectively.
Loans are reported as past due when any portion of the principal and interest are not received by the due date. The days past due will continue to increase for each day until full principal and interest are received (i.e. if payment is not received within 30 days of the due date, the loan will be considered 30 days past due; if payment is not received within 60 days of the due date, the loan will be considered 60 days past due, etc.). Loans that become 90 days past due will be placed in nonaccrual status unless well secured and in the process of collection.
BANK OF COMMERCE HOLDINGS & SUBSIDIARIES
Notes to Consolidated Financial Statements
AgeAn age analysis of gross loan balances,past due loans (gross), segregated by loan class,portfolio, as of December 31, 2017, and December 31, 2016, and December 31, 2015, was as follows.
Greater | Recorded | Greater | Recorded | |||||||||||||||||||||||||||||||||||||||||||||||||||||
(Amounts in thousands) | 30-59 | 60-89 | Than 90 | Investment > | 30-59 | 60-89 | Than 90 | Investment > | ||||||||||||||||||||||||||||||||||||||||||||||||
Past Due Loans at | Days Past | Days Past | Days Past | Total Past | 90 Days and | Days Past | Days Past | Days Past | Total Past | 90 Days and | ||||||||||||||||||||||||||||||||||||||||||||||
December 31, 2016 | Due | Due | Due | Due | Current | Total | Accruing | |||||||||||||||||||||||||||||||||||||||||||||||||
December 31, 2017 | Due | Due | Due | Due | Current | Total | Accruing | |||||||||||||||||||||||||||||||||||||||||||||||||
Commercial | $ | 51 | $ | — | $ | — | $ | 51 | $ | 153,793 | $ | 153,844 | $ | — | $ | — | $ | — | $ | — | $ | — | $ | 149,088 | $ | 149,088 | $ | — | ||||||||||||||||||||||||||||
Commercial real estate: | ||||||||||||||||||||||||||||||||||||||||||||||||||||||||
Real estate - construction and land development | — | — | — | — | 57,771 | 57,771 | — | — | — | — | — | 15,902 | 15,902 | — | ||||||||||||||||||||||||||||||||||||||||||
Real estate - commercial non-owner occupied | — | — | 1,196 | 1,196 | 286,259 | 287,455 | — | — | — | — | — | 377,668 | 377,668 | — | ||||||||||||||||||||||||||||||||||||||||||
Real estate - commercial owner occupied | — | — | 114 | 114 | 151,402 | 151,516 | — | 142 | — | — | 142 | 185,198 | 185,340 | — | ||||||||||||||||||||||||||||||||||||||||||
Residential real estate: | ||||||||||||||||||||||||||||||||||||||||||||||||||||||||
Real estate - residential - ITIN | 567 | 80 | 1,149 | 1,796 | 43,770 | 45,566 | — | 555 | 122 | 462 | 1,139 | 40,049 | 41,188 | — | ||||||||||||||||||||||||||||||||||||||||||
Real estate - residential - 1-4 family mortgage | 147 | — | 856 | 1,003 | 11,863 | 12,866 | — | 290 | 173 | — | 463 | 29,914 | 30,377 | — | ||||||||||||||||||||||||||||||||||||||||||
Real estate - residential - equity lines | 68 | 36 | 48 | 152 | 43,360 | 43,512 | — | 141 | — | — | 141 | 30,206 | 30,347 | — | ||||||||||||||||||||||||||||||||||||||||||
Consumer and other | 166 | 70 | 11 | 247 | 51,434 | 51,681 | — | 281 | 123 | — | 404 | 49,521 | 49,925 | — | ||||||||||||||||||||||||||||||||||||||||||
Total | $ | 999 | $ | 186 | $ | 3,374 | $ | 4,559 | $ | 799,652 | $ | 804,211 | $ | — | $ | 1,409 | $ | 418 | $ | 462 | $ | 2,289 | $ | 877,546 | $ | 879,835 | $ | — | ||||||||||||||||||||||||||||
Greater | Recorded | |||||||||||||||||||||||||||
(Amounts in thousands) | 30-59 | 60-89 | Than 90 | Investment > | ||||||||||||||||||||||||
Past Due Loans at | Days Past | Days Past | Days Past | Total Past | 90 Days and | |||||||||||||||||||||||
December 31, 2015 | Due | Due | Due | Due | Current | Total | Accruing | |||||||||||||||||||||
Commercial | $ | — | $ | 30 | $ | 634 | $ | 664 | $ | 132,141 | $ | 132,805 | $ | — | ||||||||||||||
Commercial real estate: | ||||||||||||||||||||||||||||
Real estate - construction and land development | — | — | — | — | 28,319 | 28,319 | — | |||||||||||||||||||||
Real estate - commercial non-owner occupied | 64 | — | 5,665 | 5,729 | 237,645 | 243,374 | — | |||||||||||||||||||||
Real estate - commercial owner occupied | — | — | 1,071 | 1,071 | 155,228 | 156,299 | — | |||||||||||||||||||||
Residential real estate: | ||||||||||||||||||||||||||||
Real estate - residential - ITIN | 1,018 | 118 | 850 | 1,986 | 47,120 | 49,106 | — | |||||||||||||||||||||
Real estate - residential - 1-4 family mortgage | — | 404 | 871 | 1,275 | 12,365 | 13,640 | — | |||||||||||||||||||||
Real estate - residential - equity lines | 137 | 97 | — | 234 | 42,989 | 43,223 | — | |||||||||||||||||||||
Consumer and other | 150 | 50 | 88 | 288 | 49,585 | 49,873 | 88 | |||||||||||||||||||||
Total | $ | 1,369 | $ | 699 | $ | 9,179 | $ | 11,247 | $ | 705,392 | $ | 716,639 | $ | 88 | ||||||||||||||
A loan is considered impaired when, based on current information and events we determine it is probable that we will not be able to collect all amounts due according to the original loan contract, including scheduled interest payments. Generally, when we identify a loan as impaired, we measure the loan for potential impairment using discounted cash flows, except when the sole remaining source of the repayment for the loan is the liquidation of the collateral. In these cases, the current fair value of collateral, less selling costs is used.
Greater | Recorded | |||||||||||||||||||||||||||
(Amounts in thousands) | 30-59 | 60-89 | Than 90 | Investment > | ||||||||||||||||||||||||
Past Due Loans at | Days Past | Days Past | Days Past | Total Past | 90 Days and | |||||||||||||||||||||||
December 31, 2016 | Due | Due | Due | Due | Current | Total | Accruing | |||||||||||||||||||||
Commercial | $ | 51 | $ | — | $ | — | $ | 51 | $ | 153,793 | $ | 153,844 | $ | — | ||||||||||||||
Commercial real estate: | ||||||||||||||||||||||||||||
Real estate - construction and land development | — | — | — | — | 36,792 | 36,792 | — | |||||||||||||||||||||
Real estate - commercial non-owner occupied | — | — | 1,196 | 1,196 | 291,419 | 292,615 | — | |||||||||||||||||||||
Real estate - commercial owner occupied | — | — | 114 | 114 | 167,221 | 167,335 | — | |||||||||||||||||||||
Residential real estate: | ||||||||||||||||||||||||||||
Real estate - residential - ITIN | 567 | 80 | 1,149 | 1,796 | 43,770 | 45,566 | — | |||||||||||||||||||||
Real estate - residential - 1-4 family mortgage | 147 | — | 856 | 1,003 | 19,422 | 20,425 | — | |||||||||||||||||||||
Real estate - residential - equity lines | 68 | 36 | 48 | 152 | 35,801 | 35,953 | — | |||||||||||||||||||||
Consumer and other | 166 | 70 | 11 | 247 | 51,434 | 51,681 | — | |||||||||||||||||||||
Total | $ | 999 | $ | 186 | $ | 3,374 | $ | 4,559 | $ | 799,652 | $ | 804,211 | $ | — | ||||||||||||||
BANK OF COMMERCE HOLDINGS & SUBSIDIARIES
Notes to Consolidated Financial Statements
Nonaccrual Loans
Nonaccrual loans, segregated by loan portfolio, were as follows as of December 31, 2017, and December 31, 2016.
The starting point for determining the fair value of collateral is through obtaining external appraisals. Generally, external appraisals are updated every twelve months. We obtain appraisals from a pre-approved list of independent, third party, local appraisal firms. Approval and addition to the list is based on experience, reputation, character, consistency and knowledge of the respective real estate market. At a minimum, it is ascertained that the appraiser is: (1) currently licensed in the state in which the property is located, (2) is experienced in the appraisal of properties similar to the property being appraised, (3) is actively engaged in the appraisal work, (4) has knowledge of current real estate market conditions and financing trends, (5) is reputable, and (6) is not on Freddie Mac’s nor our Exclusionary List of appraisers and brokers. In most cases appraisals will be reviewed by another independent third party to ensure the quality of the appraisal and the expertise and independence of the appraiser.
Upon receipt and review, an external appraisal is utilized to measure a loan for potential impairment. Our impairment analysis documents the date of the appraisal used in the analysis, whether the officer preparing the report deems it current, and, if not, allows for internal valuation adjustments with justification. Typical justified adjustments might include discounts for continued market deterioration subsequent to appraisal date, adjustments for the release of collateral contemplated in the appraisal, or the value of other collateral or consideration not contemplated in the appraisal. An appraisal over one year old in most cases will be considered stale dated and an updated or new appraisal will be required. Any adjustments from appraised value to net realizable value are detailed and justified in the impairment analysis, which is reviewed and approved by our Chief Credit Officer.
Although an external appraisal is the primary source to value collateral dependent loans, we may also utilize values obtained through purchase and sale agreements, negotiated short sales, broker price opinions, or the sales price of the note. These alternative sources of value are used only if deemed to be more representative of value based on updated information regarding collateral resolution. Impairment analyses are updated, reviewed and approved on a quarterly basis at or near the end of each reporting period. Based on these processes, we do not believe there are significant time lapses for the recognition of additional losses on collateral dependent loans.
As of | ||||||||
(Amounts in thousands) | December 31, | |||||||
Nonaccrual Loans | 2017 | 2016 | ||||||
Commercial | $ | 1,603 | $ | 2,749 | ||||
Commercial real estate: | ||||||||
Real estate - commercial non-owner occupied | — | 1,196 | ||||||
Real estate - commercial owner occupied | 600 | 784 | ||||||
Residential real estate: | ||||||||
Real estate - residential - ITIN | 2,909 | 3,576 | ||||||
Real estate - residential - 1-4 family mortgage | 606 | 1,914 | ||||||
Real estate - residential - equity lines | 45 | 917 | ||||||
Consumer and other | 36 | 250 | ||||||
Total | $ | 5,799 | $ | 11,386 | ||||
BANK OF COMMERCE HOLDINGS & SUBSIDIARIES
Notes to Consolidated Financial Statements
The following tables summarize impaired loans by loan class as of December 31, 2016, and December 31, 2015.
As of December 31, 2016 | ||||||||||||
Unpaid | ||||||||||||
(Amounts in thousands) | Recorded | Principal | Related | |||||||||
Impaired Loans | Investment | Balance | Allowance | |||||||||
With no related allowance recorded: | ||||||||||||
Commercial | $ | 1,573 | $ | 2,438 | $ | — | ||||||
Commercial real estate: | ||||||||||||
Real estate - commercial non-owner occupied | 1,196 | 1,196 | — | |||||||||
Real estate - commercial owner-occupied | 784 | 841 | — | |||||||||
Residential real estate: | ||||||||||||
Real estate - residential - ITIN | 6,047 | 7,685 | — | |||||||||
Real estate - residential - 1-4 family mortgage | 1,914 | 2,722 | — | |||||||||
Real estate - residential - equity lines | 917 | 1,342 | — | |||||||||
Consumer and other | 210 | 216 | — | |||||||||
Total with no related allowance recorded | $ | 12,641 | $ | 16,440 | $ | — | ||||||
With an allowance recorded: | ||||||||||||
Commercial | $ | 1,952 | $ | 1,957 | $ | 641 | ||||||
Commercial real estate: | ||||||||||||
Real estate - commercial non-owner occupied | 808 | 808 | 21 | |||||||||
Real estate - commercial owner-occupied | 337 | 337 | 64 | |||||||||
Residential real estate: | ||||||||||||
Real estate - residential - ITIN | 2,562 | 2,617 | 494 | |||||||||
Real estate - residential - equity lines | 454 | 454 | 227 | |||||||||
Consumer and other | 40 | 40 | 14 | |||||||||
Total with an allowance recorded | $ | 6,153 | $ | 6,213 | $ | 1,461 | ||||||
By loan class: | ||||||||||||
Commercial | $ | 3,525 | $ | 4,395 | $ | 641 | ||||||
Commercial real estate | 3,125 | 3,182 | 85 | |||||||||
Residential real estate | 11,894 | 14,820 | 721 | |||||||||
Consumer and other | 250 | 256 | 14 | |||||||||
Total impaired loans | $ | 18,794 | $ | 22,653 | $ | 1,461 | ||||||
BANK OF COMMERCE HOLDINGS & SUBSIDIARIES
Notes to Consolidated Financial Statements
As of December 31, 2015 | ||||||||||||
Unpaid | ||||||||||||
(Amounts in thousands) | Recorded | Principal | Related | |||||||||
Impaired Loans | Investment | Balance | Allowance | |||||||||
With no related allowance recorded: | ||||||||||||
Commercial | $ | 1,282 | $ | 1,519 | $ | — | ||||||
Commercial real estate: | ||||||||||||
Real estate - commercial non-owner occupied | 5,488 | 6,226 | — | |||||||||
Real estate - commercial owner-occupied | 1,071 | $ | 1,794 | — | ||||||||
Residential real estate: | ||||||||||||
Real estate - residential - ITIN | 7,063 | 8,662 | — | |||||||||
Real estate - residential - 1-4 family mortgage | 1,775 | 2,775 | — | |||||||||
Real estate - residential - equity lines | 142 | 142 | — | |||||||||
Total with no related allowance recorded | $ | 16,821 | $ | 21,118 | $ | — | ||||||
With an allowance recorded: | ||||||||||||
Commercial | $ | 761 | $ | 820 | $ | 122 | ||||||
Commercial real estate: | ||||||||||||
Real estate - commercial non-owner occupied | 824 | 824 | 35 | |||||||||
Real estate - commercial owner-occupied | 350 | 350 | 62 | |||||||||
Residential real estate: | ||||||||||||
Real estate - residential - ITIN | 2,044 | 2,089 | 321 | |||||||||
Real estate - residential - equity lines | 558 | 558 | 279 | |||||||||
Consumer and other | 32 | 32 | 13 | |||||||||
Total with an allowance recorded | $ | 4,569 | $ | 4,673 | $ | 832 | ||||||
By loan class: | ||||||||||||
Commercial | $ | 2,043 | $ | 2,339 | $ | 122 | ||||||
Commercial real estate | 7,733 | 9,194 | 97 | |||||||||
Residential real estate | 11,582 | 14,226 | 600 | |||||||||
Consumer and other | 32 | 32 | 13 | |||||||||
Total impaired loans | $ | 21,390 | $ | 25,791 | $ | 832 | ||||||
BANK OF COMMERCE HOLDINGS & SUBSIDIARIES
Notes to Consolidated Financial Statements
Had nonaccrual loans performed in accordance with their contractual terms, we would have recognized additional interest income, net of tax, of approximately $353$226 thousand, $228$353 thousand, and $649$228 thousand for the years ended December 31, 2017, 2016, 2015, and 2014,2015, respectively.
Nonaccrual
BANK OF COMMERCE HOLDINGS & SUBSIDIARIES
Notes to Consolidated Financial Statements
Impaired Loans
The following tables summarize impaired loans segregated by loan class, were as followsportfolio as of December 31, 2016, 2017, and December 31, 2015.2016.
As of December 31, 2017 | ||||||||||||||||||||
As of | Unpaid | |||||||||||||||||||
(Amounts in thousands) | December 31, | Recorded | Principal | Related | ||||||||||||||||
Nonaccrual Loans | 2016 | 2015 | ||||||||||||||||||
Impaired Loans | Investment | Balance | Allowance | |||||||||||||||||
With no related allowance recorded: | ||||||||||||||||||||
Commercial | $ | 2,749 | $ | 1,994 | $ | 672 | $ | 1,205 | $ | — | ||||||||||
Commercial real estate: | ||||||||||||||||||||
Real estate - commercial non-owner occupied | 1,196 | 5,488 | — | — | — | |||||||||||||||
Real estate - commercial owner occupied | 784 | 1,071 | ||||||||||||||||||
Real estate - commercial owner-occupied | 600 | 665 | — | |||||||||||||||||
Residential real estate: | ||||||||||||||||||||
Real estate - residential - ITIN | 3,576 | 3,649 | 5,895 | 7,516 | — | |||||||||||||||
Real estate - residential - 1-4 family mortgage | 1,914 | 1,775 | 414 | 897 | — | |||||||||||||||
Real estate - residential - equity lines | 917 | — | 45 | 49 | — | |||||||||||||||
Consumer and other | 250 | 32 | — | — | — | |||||||||||||||
Total | $ | 11,386 | $ | 14,009 | ||||||||||||||||
Total with no related allowance recorded | $ | 7,626 | $ | 10,332 | $ | — | ||||||||||||||
With an allowance recorded: | ||||||||||||||||||||
Commercial | $ | 2,482 | $ | 2,540 | $ | 690 | ||||||||||||||
Commercial real estate: | ||||||||||||||||||||
Real estate - commercial non-owner occupied | 803 | 803 | 77 | |||||||||||||||||
Real estate - commercial owner-occupied | — | — | — | |||||||||||||||||
Residential real estate: | ||||||||||||||||||||
Real estate - residential - ITIN | 1,628 | 1,678 | 199 | |||||||||||||||||
Real estate - residential - 1-4 family mortgage | 192 | 226 | 2 | |||||||||||||||||
Real estate - residential - equity lines | 380 | 380 | 190 | |||||||||||||||||
Consumer and other | 36 | 36 | 11 | |||||||||||||||||
Total with an allowance recorded | $ | 5,521 | $ | 5,663 | $ | 1,169 | ||||||||||||||
By loan portfolio: | ||||||||||||||||||||
Commercial | $ | 3,154 | $ | 3,745 | $ | 690 | ||||||||||||||
Commercial real estate | 1,403 | 1,468 | 77 | |||||||||||||||||
Residential real estate | 8,554 | 10,746 | 391 | |||||||||||||||||
Consumer and other | 36 | 36 | 11 | |||||||||||||||||
Total impaired loans | $ | 13,147 | $ | 15,995 | $ | 1,169 | ||||||||||||||
BANK OF COMMERCE HOLDINGS & SUBSIDIARIES
Notes to Consolidated Financial Statements
As of December 31, 2016 | ||||||||||||
Unpaid | ||||||||||||
(Amounts in thousands) | Recorded | Principal | Related | |||||||||
Impaired Loans | Investment | Balance | Allowance | |||||||||
With no related allowance recorded: | ||||||||||||
Commercial | $ | 1,573 | $ | 2,438 | $ | — | ||||||
Commercial real estate: | ||||||||||||
Real estate - commercial non-owner occupied | 1,196 | 1,196 | — | |||||||||
Real estate - commercial owner-occupied | 784 | $ | 841 | — | ||||||||
Residential real estate: | ||||||||||||
Real estate - residential - ITIN | 6,047 | 7,685 | — | |||||||||
Real estate - residential - 1-4 family mortgage | 1,914 | 2,722 | — | |||||||||
Real estate - residential - equity lines | 917 | 1,342 | — | |||||||||
Consumer and other | 210 | 216 | — | |||||||||
Total with no related allowance recorded | $ | 12,641 | $ | 16,440 | $ | — | ||||||
With an allowance recorded: | ||||||||||||
Commercial | $ | 1,952 | $ | 1,957 | $ | 641 | ||||||
Commercial real estate: | ||||||||||||
Real estate - commercial non-owner occupied | 808 | 808 | 21 | |||||||||
Real estate - commercial owner-occupied | 337 | 337 | 64 | |||||||||
Residential real estate: | ||||||||||||
Real estate - residential - ITIN | 2,562 | 2,617 | 494 | |||||||||
Real estate - residential - equity lines | 454 | 454 | 227 | |||||||||
Consumer and other | 40 | 40 | 14 | |||||||||
Total with an allowance recorded | $ | 6,153 | $ | 6,213 | $ | 1,461 | ||||||
By loan portfolio: | ||||||||||||
Commercial | $ | 3,525 | $ | 4,395 | $ | 641 | ||||||
Commercial real estate | 3,125 | 3,182 | 85 | |||||||||
Residential real estate | 11,894 | 14,820 | 721 | |||||||||
Consumer and other | 250 | 256 | 14 | |||||||||
Total impaired loans | $ | 18,794 | $ | 22,653 | $ | 1,461 | ||||||
BANK OF COMMERCE HOLDINGS & SUBSIDIARIES
Notes to Consolidated Financial Statements
The following table summarizes average recorded investment and interest income recognized on impaired loans by loan classportfolio for the years ended December 31, 2017, 2016 2015 and 2014.2015.
2016 | 2015 | 2014 | 2017 | 2016 | 2015 | |||||||||||||||||||||||||||||||||||||||||||
Average | Interest | Average | Interest | Average | Interest | Average | Interest | Average | Interest | Average | Interest | |||||||||||||||||||||||||||||||||||||
(Amounts in thousands) | Recorded | Income | Recorded | Income | Recorded | Income | Recorded | Income | Recorded | Income | Recorded | Income | ||||||||||||||||||||||||||||||||||||
Average Recorded Investment and Interest Income | Investment | Recognized | Investment | Recognized | Investment | Recognized | Investment | Recognized | Investment | Recognized | Investment | Recognized | ||||||||||||||||||||||||||||||||||||
Commercial | $ | 2,605 | $ | 23 | $ | 3,533 | $ | 22 | $ | 6,222 | $ | 33 | $ | 3,211 | $ | 46 | $ | 2,605 | $ | 23 | $ | 3,533 | $ | 22 | ||||||||||||||||||||||||
Commercial real estate: | ||||||||||||||||||||||||||||||||||||||||||||||||
Real estate - commercial non-owner occupied | 2,013 | 47 | 7,306 | 49 | 11,277 | 165 | 1,548 | 46 | 2,013 | 47 | 7,306 | 49 | ||||||||||||||||||||||||||||||||||||
Real estate - commercial owner- occupied | 1,281 | 25 | 2,212 | 59 | 5,233 | 78 | 670 | 2 | 1,281 | 25 | 2,212 | 59 | ||||||||||||||||||||||||||||||||||||
Residential real estate: | ||||||||||||||||||||||||||||||||||||||||||||||||
Real estate - residential - ITIN | 8,939 | 165 | 9,679 | 141 | 10,668 | 114 | 7,961 | 162 | 8,939 | 165 | 9,679 | 141 | ||||||||||||||||||||||||||||||||||||
Real estate - residential - 1-4 family mortgage | 1,788 | — | 1,786 | — | 1,561 | — | 1,019 | — | 1,788 | — | 1,786 | — | ||||||||||||||||||||||||||||||||||||
Real estate - residential - equity lines | 1,535 | 26 | 750 | 27 | 1,141 | 33 | 1,104 | 19 | 1,535 | 26 | 750 | 27 | ||||||||||||||||||||||||||||||||||||
Consumer and other | 162 | — | 33 | — | 17 | — | 72 | — | 162 | — | 33 | — | ||||||||||||||||||||||||||||||||||||
Total | $ | 18,323 | $ | 286 | $ | 25,299 | $ | 298 | $ | 36,119 | $ | 423 | $ | 15,585 | $ | 275 | $ | 18,323 | $ | 286 | $ | 25,299 | $ | 298 | ||||||||||||||||||||||||
The impaired loans foron which these interest income amounts were recognized are primarily relate to accruing troubled debt restructured loans.Loansloans. Loans are reported as troubled debt restructurings when we grant a concession(s) to a borrower experiencing financial difficulties that we would not otherwise consider. Examples of such concessions include a reduction in the loan rate, forgiveness of principal or accrued interest, extending the maturity date(s) significantly, or providing a lower interest rate than would be normally available for a transaction of similar risk. As a result of these concessions, restructured loans are impaired as we will not collect all amounts due, either principal or interest, in accordance with the terms of the original loan agreement.
Troubled Debt Restructurings
At December 31, 2017 and December 31, 2016, and December 31, 2015, impairedimpaired loans of $7.1$7.3 million and $6.9$7.1 million, respectively, were classified as performing restructured loans, respectively.loans.
In order forFor a restructured loan to be on accrual status, the loan’sloan’s collateral coverage must generally be greater than or equal to 100% of the loan balance, the loan payments must be current, and the borrower must demonstrate the ability to make payments from a verified source of cash flow. As of December 31, 2017, we had one restructured commercial line of credit in nonaccrual status that had $33 thousand in available credit. We had no obligation to lend additional funds on any troubled debt restructured loans as of December 31, 2016 or December 31, 2015.
BANK OF COMMERCE HOLDINGS & SUBSIDIARIES2016.
Notes to Consolidated Financial Statements
As ofDecemberof December 31, 2016, 2017, we had $12.1$10.9 million in troubled debt restructurings compared to $15.9$12.1 million as of December 31, 2015. 2016. As of December 31, 2016, 2017, we had 121116 loans that qualified as troubled debt restructurings, of which 112110 loans were performing according to their restructured terms. Troubled debt restructurings represented 1.50%1.24% of gross loans as of December 31, 2016, 2017, compared with 2.22%1.50% at December 31, 2015.2016.
The types of modifications offered can generally be described in the following categories:
Rate– A modification in which the interest rate is modified.changed.
Maturity– A modification in which the maturity date timing of payments or frequency of payments is modified.changed.
Payment deferral– A modification in which a portion of the principal is deferred.
Principalreduction – A modification in which a portion of the owing principal is deceased.
The following tables present the period ended balances of newly restructured loans and the types of modifications that occurred during the years ended December 31, 2017, 2016 2015 and 2014.2015.
For The Year Ended December 31, 2016 | ||||||||||||||||||||||||
| (Amounts in thousands) | Rate & | Principal | Rate & Payment | Payment | ||||||||||||||||||||
Troubled Debt Restructuring ModificationTypes | Maturity | Reduction | Deferral | Maturity | Deferral | Total | ||||||||||||||||||
Commercial | $ | 905 | $ | — | $ | — | $ | 1,120 | $ | — | $ | 2,025 | ||||||||||||
Residential real estate: | ||||||||||||||||||||||||
Real estate - residential - ITIN | — | 81 | — | 197 | 278 | |||||||||||||||||||
Real estate - residential - 1-4 family mortgage | 144 | — | — | — | — | 144 | ||||||||||||||||||
Total | $ | 1,049 | $ | 81 | $ | — | $ | 1,120 | $ | 197 | $ | 2,447 | ||||||||||||
For The Year Ended December 31, 2015 | ||||||||||||||||||||||||
| (Amounts in thousands) | Rate & | Rate & Payment | Payment | |||||||||||||||||||||
Troubled Debt Restructuring ModificationTypes | Rate | Maturity | Deferral | Maturity | Deferral | Total | ||||||||||||||||||
Commercial | $ | — | $ | 39 | $ | — | $ | — | $ | 708 | $ | 747 | ||||||||||||
Residential real estate: | ||||||||||||||||||||||||
Real estate - residential - ITIN | 115 | — | 264 | — | 379 | 758 | ||||||||||||||||||
Total | $ | 115 | $ | 39 | $ | 264 | $ | — | $ | 1,087 | $ | 1,505 | ||||||||||||
For The Year Ended December 31, 2017 | ||||||||||||||||||||||||||||||||||||||||||||||||
For The Year Ended December 31, 2014 | Rate & | |||||||||||||||||||||||||||||||||||||||||||||||
| (Amounts in thousands) | Rate & | Rate & Payment | Payment | Rate & | Principal | Payment | Payment | |||||||||||||||||||||||||||||||||||||||||
Troubled Debt Restructuring ModificationTypes | Rate | Maturity | Deferral | Maturity | Deferral | Total | Maturity | Reduction | Deferral | Maturity | Deferral | Total | ||||||||||||||||||||||||||||||||||||
Commercial | $ | — | $ | 3,396 | $ | — | $ | — | $ | — | $ | 3,396 | ||||||||||||||||||||||||||||||||||||
Residential real estate: | ||||||||||||||||||||||||||||||||||||||||||||||||
Real estate - residential - ITIN | 207 | — | 39 | — | — | 246 | $ | — | $ | — | $ | 60 | $ | — | $ | — | $ | 60 | ||||||||||||||||||||||||||||||
Consumer and other | — | 35 | — | — | — | 35 | ||||||||||||||||||||||||||||||||||||||||||
Total | $ | 207 | $ | 3,431 | $ | 39 | $ | — | $ | — | $ | 3,677 | $ | — | $ | — | $ | 60 | $ | — | $ | — | $ | 60 | ||||||||||||||||||||||||
BANK OF COMMERCE HOLDINGS & SUBSIDIARIES
Notes to Consolidated Financial Statements
For The Year Ended December 31, 2016 | ||||||||||||||||||||||||
Rate & | ||||||||||||||||||||||||
(Amounts in thousands) | Rate & | Principal | Payment | Payment | ||||||||||||||||||||
Troubled Debt Restructuring Modification Types | Maturity | Reduction | Deferral | Maturity | Deferral | Total | ||||||||||||||||||
Commercial | $ | 905 | $ | — | $ | — | $ | 1,120 | $ | — | $ | 2,025 | ||||||||||||
Residential real estate: | ||||||||||||||||||||||||
Real estate - residential - ITIN | — | 81 | — | — | 197 | 278 | ||||||||||||||||||
Real estate - residential - 1-4 family mortgage | 144 | — | — | — | — | 144 | ||||||||||||||||||
Total | $ | 1,049 | $ | 81 | $ | — | $ | 1,120 | $ | 197 | $ | 2,447 | ||||||||||||
For The Year Ended December 31, 2015 | ||||||||||||||||||||||||
Rate & | ||||||||||||||||||||||||
(Amounts in thousands) | Rate & | Payment | Payment | |||||||||||||||||||||
Troubled Debt Restructuring Modification Types | Rate | Maturity | Deferral | Maturity | Deferral | Total | ||||||||||||||||||
Commercial | $ | — | $ | 39 | $ | — | $ | — | $ | 708 | $ | 747 | ||||||||||||
Residential real estate: | ||||||||||||||||||||||||
Real estate - residential - ITIN | 115 | — | 264 | — | 379 | 758 | ||||||||||||||||||
Total | $ | 115 | $ | 39 | $ | 264 | $ | — | $ | 1,087 | $ | 1,505 | ||||||||||||
TheFor the years ended December 31, 2017, 2016, and 2015, the tables below provide information regarding the number of loans where the contractual terms have been restructured in a manner which grants a concession to a borrower experiencing financial difficulties for the years ended December 31, 2016, 2015, and 2014.restructured.
2016 | ||||||||||||
Pre-Modification | Post-Modification | |||||||||||
(Amounts in thousands) | Number of | Outstanding Recorded | Outstanding Recorded | |||||||||
Troubled Debt Restructurings | Contracts | Investment | Investment | |||||||||
Commercial | 4 | 2,244 | $ | 2,266 | ||||||||
Residential real estate: | ||||||||||||
Real estate - residential - ITIN | 3 | 372 | 342 | |||||||||
Real estate - residential - 1-4 family mortgage | 1 | 144 | 144 | |||||||||
Total | 8 | $ | 2,760 | $ | 2,752 | |||||||
2015 | ||||||||||||
Pre-Modification | Post-Modification | |||||||||||
(Amounts in thousands) | Number of | Outstanding Recorded | Outstanding Recorded | |||||||||
Troubled Debt Restructurings | Contracts | Investment | Investment | |||||||||
Commercial | 2 | $ | 872 | $ | 872 | |||||||
Residential real estate: | ||||||||||||
Real estate - residential - ITIN | 11 | 1,237 | 1,023 | |||||||||
Total | 13 | $ | 2,109 | $ | 1,895 | |||||||
2014 | 2017 | |||||||||||||||||||||||
Pre-Modification | Post-Modification | Pre-Modification | Post-Modification | |||||||||||||||||||||
(Amounts in thousands) | Number of | Outstanding Recorded | Outstanding Recorded | Number of | Outstanding Recorded | Outstanding Recorded | ||||||||||||||||||
Troubled Debt Restructurings | Contracts | Investment | Investment | Contracts | Investment | Investment | ||||||||||||||||||
Commercial | 2 | $ | 9,070 | $ | 9,070 | |||||||||||||||||||
Residential real estate: | ||||||||||||||||||||||||
Real estate - residential - ITIN | 4 | 263 | 267 | 1 | $ | 81 | $ | 61 | ||||||||||||||||
Consumer and other | 1 | 35 | 35 | |||||||||||||||||||||
Total | 7 | $ | 9,368 | $ | 9,372 | 1 | $ | 81 | $ | 61 | ||||||||||||||
The following table presents
2016 | ||||||||||||
Pre-Modification | Post-Modification | |||||||||||
(Amounts in thousands) | Number of | Outstanding Recorded | Outstanding Recorded | |||||||||
Troubled Debt Restructurings | Contracts | Investment | Investment | |||||||||
Commercial | 4 | $ | 2,244 | $ | 2,266 | |||||||
Residential real estate: | ||||||||||||
Real estate - residential - ITIN | 3 | 372 | 342 | |||||||||
Real estate - residential - 1-4 family mortgage | 1 | 144 | 144 | |||||||||
Total | 8 | $ | 2,760 | $ | 2,752 | |||||||
2015 | ||||||||||||
Pre-Modification | Post-Modification | |||||||||||
(Amounts in thousands) | Number of | Outstanding Recorded | Outstanding Recorded | |||||||||
Troubled Debt Restructurings | Contracts | Investment | Investment | |||||||||
Commercial | 2 | $ | 872 | $ | 872 | |||||||
Residential real estate: | ||||||||||||
Real estate - residential - ITIN | 11 | 1,237 | 1,023 | |||||||||
Total | 13 | $ | 2,109 | $ | 1,895 | |||||||
BANK OF COMMERCE HOLDINGS & SUBSIDIARIES
Notes to Consolidated Financial Statements
There were no loans modified as troubled debt restructurings withinrestructuring during the previous 12 months endedDecember 31, 2017, 2016 and 2015, for which there was a subsequent payment default during the twelve months ended December 31, 2017, 2016 2015 and 2014,2015, respectively.
2016 | 2015 | 2014 | ||||||||||||||||||||||
| (Amounts in thousands) | Number of | Recorded | Number of | Recorded | Number of | Recorded | ||||||||||||||||||
Troubled Debt Restructurings That SubsequentlyDefaulted | Contracts | Investment | Contracts | Investment | Contracts | Investment | ||||||||||||||||||
Commercial | — | $ | — | — | $ | — | 1 | $ | 1,923 | |||||||||||||||
Residential real estate: | ||||||||||||||||||||||||
Real estate - residential - ITIN | — | — | — | — | 2 | 109 | ||||||||||||||||||
Total | — | $ | — | — | $ | — | 3 | $ | 2,032 | |||||||||||||||
Performing and Nonperforming Loans
We define a performing loan as a loan where any installment of principal or interest is not90 days or more past due, and management believes the ultimate collection of original contractual principal and interest is likely. We define a nonperforming loan as an impaired loan, which may be on nonaccrual, 90 days past due and still accruing, or has been restructured and is does not in compliance comply with its modified terms, and our ultimate collection of original contractual principal and interest is uncertain.
BANK OF COMMERCE HOLDINGS & SUBSIDIARIES
Notes to Consolidated Financial Statements
Performing and nonperforming loans, segregated by loan class,portfolio, are as follows at December 31, 2016 2017 and 2015.2016.
(Amounts in thousands) | December 31, 2016 | December 31, 2017 | ||||||||||||||||||||||
Performing and Nonperforming Loans | Performing | Nonperforming | Total | Performing | Nonperforming | Total | ||||||||||||||||||
Commercial | $ | 151,095 | $ | 2,749 | $ | 153,844 | $ | 147,485 | $ | 1,603 | $ | 149,088 | ||||||||||||
Commercial real estate: | ||||||||||||||||||||||||
Real estate - construction and land development | 57,771 | — | 57,771 | 15,902 | — | 15,902 | ||||||||||||||||||
Real estate - commercial non-owner occupied | 286,259 | 1,196 | 287,455 | 377,668 | — | 377,668 | ||||||||||||||||||
Real estate - commercial owner occupied | 150,732 | 784 | 151,516 | 184,740 | 600 | 185,340 | ||||||||||||||||||
Residential real estate: | ||||||||||||||||||||||||
Real estate - residential - ITIN | 41,990 | 3,576 | 45,566 | 38,279 | 2,909 | 41,188 | ||||||||||||||||||
Real estate - residential - 1-4 family mortgage | 10,952 | 1,914 | 12,866 | 29,771 | 606 | 30,377 | ||||||||||||||||||
Real estate - residential - equity lines | 42,595 | 917 | 43,512 | 30,302 | 45 | 30,347 | ||||||||||||||||||
Consumer and other | 51,431 | 250 | 51,681 | 49,889 | 36 | 49,925 | ||||||||||||||||||
Total | $ | 792,825 | $ | 11,386 | $ | 804,211 | $ | 874,036 | $ | 5,799 | $ | 879,835 | ||||||||||||
(Amounts in thousands) | December 31, 2015 | December 31, 2016 | ||||||||||||||||||||||
Performing and Nonperforming Loans | Performing | Nonperforming | Total | Performing | Nonperforming | Total | ||||||||||||||||||
Commercial | $ | 130,811 | $ | 1,994 | $ | 132,805 | $ | 151,095 | $ | 2,749 | $ | 153,844 | ||||||||||||
Commercial real estate: | ||||||||||||||||||||||||
Real estate - construction and land development | 28,319 | — | 28,319 | 36,792 | — | 36,792 | ||||||||||||||||||
Real estate - commercial non-owner occupied | 237,886 | 5,488 | 243,374 | 291,419 | 1,196 | 292,615 | ||||||||||||||||||
Real estate - commercial owner occupied | 155,228 | 1,071 | 156,299 | 166,551 | 784 | 167,335 | ||||||||||||||||||
Residential real estate: | ||||||||||||||||||||||||
Real estate - residential - ITIN | 45,457 | 3,649 | 49,106 | 41,990 | 3,576 | 45,566 | ||||||||||||||||||
Real estate - residential - 1-4 family mortgage | 11,865 | 1,775 | 13,640 | 18,511 | 1,914 | 20,425 | ||||||||||||||||||
Real estate - residential - equity lines | 43,223 | — | 43,223 | 35,036 | 917 | 35,953 | ||||||||||||||||||
Consumer and other | 49,753 | 120 | 49,873 | 51,431 | 250 | 51,681 | ||||||||||||||||||
Total | $ | 702,542 | $ | 14,097 | $ | 716,639 | $ | 792,825 | $ | 11,386 | $ | 804,211 | ||||||||||||
Credit Quality Ratings
Management assigns a credit quality rating (risk grade) to each loan. The foundation or primary factor in determining the appropriate credit quality indicatorsrating is the degree of a debtor’sdebtor’s willingness and ability to perform as agreed. In conjunction with evaluating the performing versus nonperforming nature of our loan portfolio, management evaluates the following credit risk and other relevant factors in determining the appropriate credit quality indicator (rating) for each loan class:portfolio:
Pass Grade: A Pass loan is a strong credit with no existing or known weaknesses that may require management’s close attention. Some pass loans require short termshort-term enhanced monitoring to determine when the credit relationship would merit either an upgrade or a downgrade. Loans classified as Pass Grade specifically demonstrate:
● | Strong Cash Flows – borrower’s cash flows must meet or exceed our minimum debt service coverage ratio. |
● | Collateral Margin – generally, the borrower must have pledged an acceptable collateral class with an adequate collateral margin. |
● | Qualitative Factors – in addition to meeting our minimum cash flow and collateral requirements, a number of other qualitative factors are also factored into assigning a Pass Grade including the borrower’s level of leverage (debt to equity), prospects, history and experience in their industry, credit history, and any other relevant factors including a borrower’s character. |
BANK OF COMMERCE HOLDINGS & SUBSIDIARIES
Notes to Consolidated Financial Statements
Those borrowers who qualify for unsecured loans must fully demonstrate above average cash flows and strong secondary sources of repayment to mitigate the lack of unpledged collateral.
BANK OF COMMERCE HOLDINGS & SUBSIDIARIES
Notes to Consolidated Financial Statements
Watch Grade: The credit is acceptable but the borrower has experienced a temporary setback or adverse information has been received, and may exhibit one or more of the characteristics shown in the list below. This risk grade could apply to credits on a temporary basis pending a full review. Credits with this risk grade will require more handling time and increased management. The list below contains characteristics of this risk grade, but individually do not automatically cause the loan to be assigned a Watch Grade.
● | The primary source of repayment may be weakening causing greater reliance on the secondary source of repayment or |
● | The primary source of repayment is adequate, but the secondary source of repayment is insufficient |
● | In-depth financial analysis would compare to the lower quartile in two or more of the major components of the Risk Management Association Annual Statement Studies |
● | Volatile or deteriorating collateral |
● | Management decisions may be called into question |
● | Delinquencies in bank credits or other financial/trade creditors |
● | Frequent overdrafts |
● | Significant change in management/ownership |
Special Mention Grade: Credits in this grade are potentially weak and deserve management's close attention. If left uncorrected, these potential weaknesses may result in deterioration of the repayment prospects of the credit. Special Mention credits are not adversely classified and do not expose the Bank to sufficient risk to warrant adverse classification. The list below exhibits the characteristics of this grade, but individually do not automatically cause the borrower to be assigned a grade of Special Mention:
● | Inadequate or incomplete loan documentation or perfection of collateral, or any other deviation from prudent lending practices |
● | Credit is structured in a manner in which the timing of the repayment source does not match the payment schedule or maturity, materially jeopardizing repayment |
● | Current economic or market conditions exist which may affect the borrower's ability to perform or affect the Bank's collateral position |
● | Adverse trends in the borrower's operations or continued deterioration in the |
● | The borrower is less than cooperative or unable to produce current and adequate financial information |
Substandard Grade: A Substandard credit is inadequately protected by the current net worth and paying capacity of the borrower or of the collateral pledged, if any. Substandard credits have a well-defined weakness or weaknesses that jeopardize the liquidation or timely collection of the debt. Substandard credits are characterized by the distinct possibility that we will sustain some loss if the deficiencies are not corrected. However, a potential loss does not have to be recognizable in an individual credit for it to be considered a substandard credit. As such, substandard credits may or may not be graded as impaired.
The following represents, but is not limited to, the potential characteristics of a Substandard Grade and do not necessarily generate automatic reclassification into this loan grade:
● | Sustained or substantial deteriorating financial trends, |
● | Unresolved management problems, |
● | Collateral is insufficient to repay debt; collateral is not sufficiently supported by independent sources, such as asset-based financial audits, appraisals, or equipment evaluations, |
● | Improper perfection of lien position, which is not readily correctable, |
● | Unanticipated and severe decline in market values, |
● | High reliance on secondary source of repayment, |
● | Legal proceedings, such as bankruptcy or a divorce, which has substantially decreased the |
● | Fraud committed by the borrower, |
● | IRS liens that take precedence, |
● | Forfeiture statutes for assets involved in criminal activities, |
BANK OF COMMERCE HOLDINGS & SUBSIDIARIES
Notes to Consolidated Financial Statements
● | Protracted repayment terms outside of policy that are for longer than the same type of credit in our portfolio, |
● | Any other relevant quantitative or qualitative factor that negatively affects the current net worth and paying capacity of the borrower or of the collateral pledged, if any. |
Doubtful Grade: A Doubtful loan has all the weaknesses inherent in one classified Substandard with the added characteristic that the weaknesses make collection or liquidation in full, on the basis of currently existing facts, conditions and values, highly questionable and improbable. The possibility of loss is extremely high, but because of certain pending factors that may work to the advantage and strengthening of the credit, its classification as an estimated loss is deferred until its more exact status may be determined. Pending factors may include, but are not limited to:
● | Proposed merger(s), |
● | Acquisition or liquidation procedures, |
● | Capital injection, |
● | Perfecting liens on additional collateral, |
● | Refinancing plans. |
Generally, a Doubtful Grade does not remain outstanding for a period greater than six months. After Within six months, the pending events should have either occurred or not occurred. Thebeen resolved. Based on resolution of the pending events, the credit grade should have improved or the principal balance charged against the ALLL.
The following table summarizes internal risk grades by loan class as of December 31, 2016, and December 31, 2015.
December 31, 2016 | ||||||||||||||||||||||||
Special | ||||||||||||||||||||||||
(Amounts in thousands) | Pass | Watch | Mention | Substandard | Doubtful | Total | ||||||||||||||||||
Commercial | $ | 124,089 | $ | 21,684 | $ | 4,570 | $ | 3,501 | $ | — | $ | 153,844 | ||||||||||||
Commercial real estate: | ||||||||||||||||||||||||
Real estate - construction and land development | 57,761 | 10 | — | — | — | 57,771 | ||||||||||||||||||
Real estate - commercial non-owner occupied | 277,765 | 5,398 | 1,321 | 2,971 | 287,455 | |||||||||||||||||||
Real estate - commercial owner occupied | 142,419 | 7,301 | 496 | 1,300 | — | 151,516 | ||||||||||||||||||
Residential real estate: | ||||||||||||||||||||||||
Real estate - residential - ITIN | 38,279 | — | — | 7,287 | — | 45,566 | ||||||||||||||||||
Real estate - residential - 1-4 family mortgage | 10,442 | 510 | — | 1,914 | 12,866 | |||||||||||||||||||
Real estate - residential - equity lines | 41,082 | 1,163 | — | 1,267 | — | 43,512 | ||||||||||||||||||
Consumer and other | 51,398 | 2 | — | 281 | — | 51,681 | ||||||||||||||||||
Total | $ | 743,235 | $ | 36,068 | $ | 6,387 | $ | 18,521 | $ | — | $ | 804,211 | ||||||||||||
BANK OF COMMERCE HOLDINGS & SUBSIDIARIES
Notes to Consolidated Financial Statements
The following table summarizes loans by internal risk grades and by loan portfolio as of December 31, 2017, and December 31, 2016
December 31, 2017 | ||||||||||||||||||||||||
Special | ||||||||||||||||||||||||
(Amounts in thousands) | Pass | Watch | Mention | Substandard | Doubtful | Total | ||||||||||||||||||
Commercial | $ | 117,087 | $ | 28,896 | $ | 40 | $ | 3,065 | $ | — | $ | 149,088 | ||||||||||||
Commercial real estate: | ||||||||||||||||||||||||
Real estate - construction and land development | 14,762 | — | 1,140 | — | — | 15,902 | ||||||||||||||||||
Real estate - commercial non-owner occupied | 364,230 | 9,160 | 2,900 | 1,378 | — | 377,668 | ||||||||||||||||||
Real estate - commercial owner occupied | 171,005 | 8,515 | 3,907 | 1,913 | — | 185,340 | ||||||||||||||||||
Residential real estate: | ||||||||||||||||||||||||
Real estate - residential - ITIN | 34,923 | — | — | 6,265 | — | 41,188 | ||||||||||||||||||
Real estate - residential - 1-4 family mortgage | 28,981 | 791 | — | 605 | — | 30,377 | ||||||||||||||||||
Real estate - residential - equity lines | 28,457 | 1,501 | 63 | 326 | — | 30,347 | ||||||||||||||||||
Consumer and other | 49,887 | — | 2 | 36 | — | 49,925 | ||||||||||||||||||
Total | $ | 809,332 | $ | 48,863 | $ | 8,052 | $ | 13,588 | $ | — | $ | 879,835 | ||||||||||||
December 31, 2015 | December 31, 2016 | |||||||||||||||||||||||||||||||||||||||||||||||
Special | Special | |||||||||||||||||||||||||||||||||||||||||||||||
(Amounts in thousands) | Pass | Watch | Mention | Substandard | Doubtful | Total | Pass | Watch | Mention | Substandard | Doubtful | Total | ||||||||||||||||||||||||||||||||||||
Commercial | $ | 108,696 | $ | 10,240 | $ | 9,587 | $ | 4,282 | $ | — | $ | 132,805 | $ | 124,089 | $ | 21,684 | $ | 4,570 | $ | 3,501 | $ | — | $ | 153,844 | ||||||||||||||||||||||||
Commercial real estate: | ||||||||||||||||||||||||||||||||||||||||||||||||
Real estate - construction and land development | 28,291 | 28 | — | — | — | 28,319 | 36,782 | 10 | — | — | — | 36,792 | ||||||||||||||||||||||||||||||||||||
Real estate - commercial non-owner occupied | 234,177 | 917 | 1,588 | 6,692 | 243,374 | 284,099 | 5,398 | 1,321 | 1,797 | — | 292,615 | |||||||||||||||||||||||||||||||||||||
Real estate - commercial owner occupied | 149,327 | 3,864 | 1,687 | 1,421 | — | 156,299 | 157,064 | 7,301 | 496 | 2,474 | — | 167,335 | ||||||||||||||||||||||||||||||||||||
Residential real estate: | ||||||||||||||||||||||||||||||||||||||||||||||||
Real estate - residential - ITIN | 41,480 | — | — | 7,626 | — | 49,106 | 38,279 | — | — | 7,287 | — | 45,566 | ||||||||||||||||||||||||||||||||||||
Real estate - residential - 1-4 family mortgage | 11,291 | — | 575 | 1,774 | 13,640 | 17,696 | 815 | — | 1,914 | — | 20,425 | |||||||||||||||||||||||||||||||||||||
Real estate - residential - equity lines | 38,899 | 1,760 | 1,682 | 882 | — | 43,223 | 33,828 | 858 | — | 1,267 | — | 35,953 | ||||||||||||||||||||||||||||||||||||
Consumer and other | 49,551 | — | 256 | 66 | — | 49,873 | 51,398 | 2 | — | 281 | — | 51,681 | ||||||||||||||||||||||||||||||||||||
Total | $ | 661,712 | $ | 16,809 | $ | 15,375 | $ | 22,743 | $ | — | $ | 716,639 | $ | 743,235 | $ | 36,068 | $ | 6,387 | $ | 18,521 | $ | — | $ | 804,211 | ||||||||||||||||||||||||
The recorded investment in consumer mortgage loans collateralized by residential real estate property that are in the process of foreclosure was $530 thousand at December 31, 2017.
Allowance for Loan and Lease Losses
The following tables below summarize the ALLL by loan classportfolio for the years ended December 31, 2017, 2016, and December 31, 2015.
As of December 31, 2016 | ||||||||||||||||||||||||
(Amounts in thousands) | Commercial | Residential | ||||||||||||||||||||||
ALLL by Loan Class | Commercial | Real Estate | Real Estate | Consumer | Unallocated | Total | ||||||||||||||||||
Beginning balance | $ | 2,493 | $ | 5,784 | $ | 1,577 | $ | 770 | $ | 556 | $ | 11,180 | ||||||||||||
Charge-offs | (1,106 | ) | (37 | ) | (829 | ) | (812 | ) | — | (2,784 | ) | |||||||||||||
Recoveries | 427 | 2,480 | 114 | 127 | — | 3,148 | ||||||||||||||||||
Provision | 1,035 | (2,649 | ) | 854 | 870 | (110 | ) | — | ||||||||||||||||
Ending balance | $ | 2,849 | $ | 5,578 | $ | 1,716 | $ | 955 | $ | 446 | $ | 11,544 | ||||||||||||
As of December 31, 2015 | As of December 31, 2017 | |||||||||||||||||||||||||||||||||||||||||||||||
(Amounts in thousands) | Commercial | Residential | Commercial | Residential | ||||||||||||||||||||||||||||||||||||||||||||
ALLL by Loan Class | Commercial | Real Estate | Real Estate | Consumer | Unallocated | Total | ||||||||||||||||||||||||||||||||||||||||||
ALLL by Loan Portfolio | Commercial | Real Estate | Real Estate | Consumer | Unallocated | Total | ||||||||||||||||||||||||||||||||||||||||||
Beginning balance | $ | 3,503 | $ | 4,875 | $ | 1,670 | $ | 450 | $ | 322 | $ | 10,820 | $ | 2,849 | $ | 5,578 | $ | 1,716 | $ | 955 | $ | 446 | $ | 11,544 | ||||||||||||||||||||||||
Charge-offs | (700 | ) | (428 | ) | (749 | ) | (499 | ) | — | (2,376 | ) | (51 | ) | — | (483 | ) | (968 | ) | — | (1,502 | ) | |||||||||||||||||||||||||||
Recoveries | 1,692 | 771 | 273 | — | — | 2,736 | 512 | 27 | 178 | 216 | — | 933 | ||||||||||||||||||||||||||||||||||||
Provision | (2,002 | ) | 566 | 383 | 819 | 234 | — | (818 | ) | 814 | (242 | ) | 1,232 | (36 | ) | 950 | ||||||||||||||||||||||||||||||||
Ending balance | $ | 2,493 | $ | 5,784 | $ | 1,577 | $ | 770 | $ | 556 | $ | 11,180 | $ | 2,492 | $ | 6,419 | $ | 1,169 | $ | 1,435 | $ | 410 | $ | 11,925 | ||||||||||||||||||||||||
BANK OF COMMERCE HOLDINGS & SUBSIDIARIES
Notes to Consolidated Financial Statements
As of December 31, 2016 | ||||||||||||||||||||||||
(Amounts in thousands) | Commercial | Residential | ||||||||||||||||||||||
ALLL by Loan Portfolio | Commercial | Real Estate | Real Estate | Consumer | Unallocated | Total | ||||||||||||||||||
Beginning balance | $ | 2,493 | $ | 5,784 | $ | 1,577 | $ | 770 | $ | 556 | $ | 11,180 | ||||||||||||
Charge-offs | (1,106 | ) | (37 | ) | (829 | ) | (812 | ) | — | (2,784 | ) | |||||||||||||
Recoveries | 427 | 2,480 | 114 | 127 | — | 3,148 | ||||||||||||||||||
Provision | 1,035 | (2,649 | ) | 854 | 870 | (110 | ) | — | ||||||||||||||||
Ending balance | $ | 2,849 | $ | 5,578 | $ | 1,716 | $ | 955 | $ | 446 | $ | 11,544 | ||||||||||||
As of December 31, 2015 | ||||||||||||||||||||||||
(Amounts in thousands) | Commercial | Residential | ||||||||||||||||||||||
ALLL by Loan Portfolio | Commercial | Real Estate | Real Estate | Consumer | Unallocated | Total | ||||||||||||||||||
Beginning balance | $ | 3,503 | $ | 4,875 | $ | 1,670 | $ | 450 | $ | 322 | $ | 10,820 | ||||||||||||
Charge-offs | (700 | ) | (428 | ) | (749 | ) | (499 | ) | — | (2,376 | ) | |||||||||||||
Recoveries | 1,692 | 771 | 273 | — | — | 2,736 | ||||||||||||||||||
Provision | (2,002 | ) | 566 | 383 | 819 | 234 | — | |||||||||||||||||
Ending balance | $ | 2,493 | $ | 5,784 | $ | 1,577 | $ | 770 | $ | 556 | $ | 11,180 | ||||||||||||
The following tables summarize the ALLL and the recorded investment in loans and leases as of December 31, 2017, 2016 and December 31, 2015.2015
As of December 31, 2016 | ||||||||||||||||||||||||
Commercial | Residential | |||||||||||||||||||||||
(Amounts in thousands) | Commercial | Real Estate | Real Estate | Consumer | Unallocated | Total | ||||||||||||||||||
ALLL: | ||||||||||||||||||||||||
Individually evaluated for impairment | $ | 641 | $ | 85 | $ | 721 | $ | 14 | $ | — | $ | 1,461 | ||||||||||||
Collectively evaluated for impairment | 2,208 | 5,493 | 995 | 941 | 446 | 10,083 | ||||||||||||||||||
Total | 2,849 | 5,578 | 1,716 | 955 | 446 | 11,544 | ||||||||||||||||||
Gross loans: | ||||||||||||||||||||||||
Individually evaluated for impairment | $ | 3,525 | $ | 3,125 | $ | 11,894 | $ | 250 | $ | — | $ | 18,794 | ||||||||||||
Collectively evaluated for impairment | 150,319 | 493,617 | 90,050 | 51,431 | — | 785,417 | ||||||||||||||||||
Total gross loans | $ | 153,844 | $ | 496,742 | $ | 101,944 | $ | 51,681 | $ | — | $ | 804,211 | ||||||||||||
As of December 31, 2017 | ||||||||||||||||||||||||
Commercial | Residential | |||||||||||||||||||||||
(Amounts in thousands) | Commercial | Real Estate | Real Estate | Consumer | Unallocated | Total | ||||||||||||||||||
ALLL: | ||||||||||||||||||||||||
Individually evaluated for impairment | $ | 690 | $ | 77 | $ | 391 | $ | 11 | $ | — | $ | 1,169 | ||||||||||||
Collectively evaluated for impairment | 1,802 | 6,342 | 778 | 1,424 | 410 | 10,756 | ||||||||||||||||||
Total | 2,492 | 6,419 | 1,169 | 1,435 | 410 | 11,925 | ||||||||||||||||||
Gross loans: | ||||||||||||||||||||||||
Individually evaluated for impairment | $ | 3,154 | $ | 1,403 | $ | 8,554 | $ | 36 | $ | — | $ | 13,147 | ||||||||||||
Collectively evaluated for impairment | 145,934 | 577,507 | 93,358 | 49,889 | — | 866,688 | ||||||||||||||||||
Total gross loans | $ | 149,088 | $ | 578,910 | $ | 101,912 | $ | 49,925 | $ | — | $ | 879,835 | ||||||||||||
As of December 31, 2016 | ||||||||||||||||||||||||
Commercial | Residential | |||||||||||||||||||||||
(Amounts in thousands) | Commercial | Real Estate | Real Estate | Consumer | Unallocated | Total | ||||||||||||||||||
ALLL: | ||||||||||||||||||||||||
Individually evaluated for impairment | $ | 641 | $ | 85 | $ | 721 | $ | 14 | $ | — | $ | 1,461 | ||||||||||||
Collectively evaluated for impairment | 2,208 | 5,493 | 995 | 941 | 446 | 10,083 | ||||||||||||||||||
Total | 2,849 | 5,578 | 1,716 | 955 | 446 | 11,544 | ||||||||||||||||||
Gross loans: | ||||||||||||||||||||||||
Individually evaluated for impairment | $ | 3,525 | $ | 3,125 | $ | 11,894 | $ | 250 | $ | — | $ | 18,794 | ||||||||||||
Collectively evaluated for impairment | 150,319 | 493,617 | 90,050 | 51,431 | — | 785,417 | ||||||||||||||||||
Total gross loans | $ | 153,844 | $ | 496,742 | $ | 101,944 | $ | 51,681 | $ | — | $ | 804,211 | ||||||||||||
BANK OF COMMERCE HOLDINGS & SUBSIDIARIES
Notes to Consolidated Financial Statements
As of December 31, 2015 | ||||||||||||||||||||||||
Commercial | Residential | |||||||||||||||||||||||
(Amounts in thousands) | Commercial | Real Estate | Real Estate | Consumer | Unallocated | Total | ||||||||||||||||||
ALLL: | ||||||||||||||||||||||||
Individually evaluated for impairment | $ | 122 | $ | 97 | $ | 600 | $ | 13 | $ | — | $ | 832 | ||||||||||||
Collectively evaluated for impairment | 2,371 | 5,687 | 977 | 757 | 556 | 10,348 | ||||||||||||||||||
Total | 2,493 | 5,784 | 1,577 | 770 | 556 | 11,180 | ||||||||||||||||||
Gross loans: | ||||||||||||||||||||||||
Individually evaluated for impairment | $ | 2,043 | $ | 7,733 | $ | 11,582 | $ | 32 | $ | — | $ | 21,390 | ||||||||||||
Collectively evaluated for impairment | 130,762 | 420,259 | 94,387 | 49,841 | — | 695,249 | ||||||||||||||||||
Total gross loans | $ | 132,805 | $ | 427,992 | $ | 105,969 | $ | 49,873 | $ | — | $ | 716,639 | ||||||||||||
The ALLL totaled $11.5$11.9 million or 1.44%1.36% of total gross loans at December 31, 2017 and $11.5 million or 1.44% at December 31, 2016. As of December 31, 2017 and December 31, 2016, and $11.2 million or 1.56% at December 31, 2015. As of December 31, 2016 and December 31, 2015, we had $229.4 million and $230.6 million in commitments to extend credit of $227.7 million and $229.4 million, respectively. The reserve for unfunded commitments recorded inOther Liabilitiesin theConsolidated Balance Sheetsat December 31, 2016 2017 and 20152016 was $695$695 thousand.
The ALLL is based upon estimates of future loan and lease losses and is maintained at a level considered adequate to provide for probable losses inherent in the outstanding loan portfolio. Our ALLL methodology significantly incorporates management’smanagement’s current judgments, and reflects the reserve amount that is necessary for estimatedmanagement’s estimate of future loan and lease losses and risks inherent in the loan portfolio in accordance with ASC Topic 450Contingencies and ASC Topic 310Receivables.
The allowance is increased by provisions charged to expense and reduced by net charge-offs. In periodic evaluations of the adequacy of the allowance balance, management considers past loan and lease loss experience by type of credit, known and inherent risks in the portfolio, adverse situations that may affect a borrower’sborrower’s ability to repay, the estimated value of any underlying collateral, current economic conditions and other factors. We formally assess the adequacy of the ALLL on a monthly basis. These assessments include the periodic re-grading of classified loans based on changes in their individual credit characteristics including delinquency, seasoning, recent financial performance of the borrower, economic factors, changes in the interest rate environment and other factors as warranted. Loans are initially rated when originated. They are reviewed as they are renewed, when there is a new loan to the same borrower and/or when identified facts demonstrate heightened risk of default. Confirmation of the quality of our grading process is obtained by independent reviews conducted by outside consultants specifically hired for this purpose and by periodic examination by various bank regulatory agencies.
Management monitors delinquent loans continuously and identifies problem loans to be evaluated individually for impairment testing. For loans that are determined impaired, a formal impairment measurement is performed at least quarterly on a loan-by-loan basis.
BANK OF COMMERCE HOLDINGS & SUBSIDIARIES
Notes to Consolidated Financial Statements
Our method for assessing the appropriateness of the allowance includes specific allowances for identified problem loans, an allowance factor for categories of credits and allowances for changing environmental factors (e.g., portfolio trends, concentration of credit, growth, economic factors). Allowances for identified problem loans are based on specific analysis of individual credits. Loss estimation factors for unimpaired loan categories are based on analysis of historical losses adjusted for changing environmentallocal economic factors applicable to each loan category. Allowances for changing environmental factors are management’smanagement’s best estimate of the probable impact these changes have had on the loan portfolio as a whole.
We believe that the ALLL was adequate as of December 31, 2016. 2017. There is, however, no assurance that future loan and lease losses will not exceed the levels provided for in the ALLL and could possibly result in additional charges to the provision for loan and lease losses. In addition, bank regulatory authorities, as part of their periodic examination of the Company, may require additional charges to the provision for loan and lease losses in future periods if warranted as a result of their review.
As of December 31, 2016, 75%2017, 77% of our gross loan portfolio is secured by real estate, and a significant decline in real estate market values may require an increase in the ALLL. Deterioration in economic conditions particularly in our markets may adversely affect our loan portfolio and may lead to additional charges to the provision for loan and lease losses.
All impairedImpaired loans are individually evaluated for impairment. If the measurement of each impaired loans’loans’ value is less than the recorded investment in the loan, we recognize this impairment and adjust the carrying value of the loan to fair value through the ALLL. For collateral dependent loans, this iscan be accomplished by charging off the impaired portion of the loan based on the underlying value of the collateral. For non-collateral dependent loans, we establish a specific component within the ALLL based on the present value of the future cash flows. For collateral dependent loan, ifIf we determine the sources of repayment will not result in a reasonable probability that the carrying value of a loan can be recovered, the amount of a loan’s specific impairment is charged off against the ALLL. Impairment reserves on non-collateral dependent restructured loans are measured by comparing the present value of expected future cash flows on the restructured loans discounted at the interest rate of the original loan agreement to the loan’s carrying value. These impairment reserves are recognized as a specific component to be provided for in the ALLL.
The unallocated portion of the ALLL provides for coverage of credit losses inherent in the loan portfolio but not captured in the credit loss factors that are utilized in the risk rating-based component, or in the specific impairment reserve component of the ALLL, and acknowledges the inherent imprecision of all loss prediction models. As of December 31, 2016, 2017, the unallocated allowance amount represented 4%3% of the ALLL, compared to 5%4% at December 31, 2015.2016.
BANK OF COMMERCE HOLDINGS & SUBSIDIARIES
Notes to Consolidated Financial Statements
While the ALLL composition is an indication of specific amounts or loan categories in which future charge-offs may occur, actual amounts may differ.
We have lending policies and procedures in place with the objective of optimizing loan income within an accepted risk tolerance level. We review and approve these policies and procedures annually. Monitoring and reporting systems supplement the review process with regular frequency as related to loan production, loan quality, concentrations of credit, potential problem loans, loan delinquencies, and nonperforming loans.
The following is a brief summary, by loan type, of management’smanagement’s evaluation of the general risk characteristics and underwriting standards:
Commercial Loans –Commercial loans are underwritten after evaluating the borrower’s financial ability to maintain profitability including future expansion objectives. In addition, the borrower’s qualitative qualities are evaluated, such as management skills and experience, ethical traits, and overall business acumen. Commercial loans are primarily extended based on the cash flows of the borrower and secondarily on the underlying collateral provided by the borrower. The borrower’s cash flow may deviate from initial projections, and the value of collateral securing these loans may vary.change.
Most commercial loans are generally secured by the assets being financed and other business assets such as accounts receivable or inventory. However,Management may also incorporate a personal guarantee; however, some short termshort-term loans may be extended on an unsecured basis. We generally require personal guarantees from business owners. Repayment of commercial loans secured by accounts receivable may be substantially dependent on the ability of the borrower to collect amounts due from its customers.
Commercial Real Estate (“CRE”) Loans – CRE loans are subject to similar underwriting standards and processes as commercial loans. CRE loans are viewed predominantly as cash flow loans and secondarily as loans collateralized by real estate. Generally, CRE lending involves larger principal amounts with repayment largely dependent on the successful operation of the property securing the loan or the business conducted on the collateralized property. CRE loans tend to be more adversely affected by conditions in the real estate markets or by general economic conditions.
BANK OF COMMERCE HOLDINGS & SUBSIDIARIES
Notes to Consolidated Financial Statements
The properties securing the CRE portfolio are diverse in terms of type and primary source of repayment. This diversity helps reduce our exposure to adverse economic events that affect any single industry. We monitor and evaluate CRE loans based on occupancy status (investor versus owner occupied), collateral, geography, and risk grade criteria.
Generally, CRE loans are made to developers and builders that are secured by non-owner occupied properties require the borrower to have had an existing relationship with the Company and a proven record of success. Construction loans are underwritten utilizing feasibility studies, sensitivity analysis of absorption and lease rates, and financial analysis of the developers and property owners. Construction loans are generally based upon estimates of cost and value associated with the complete project (as-is value). These estimates may be inaccurate. Construction loans often involve the disbursement of substantial funds with repayment largely dependent on the success of the ultimate project. Sources of repayment for these types of loans may be pre-committed permanent loans from approved long termlong-term lenders, sales of developed property, or an interim loan commitment from the Company until permanent financing is secured. These loans are closely monitored by on-site inspections, and are considered to have higher inherent risks than other CRE loans due to their ultimate repayment sensitivity to interest rate changes, governmental regulation of real property, general economic conditions, and the availability of long termlong-term financing.
Residential Real Estate Loans – We do not originate consumer real estate mortgage loans. The majority of our loans secured by non owner occupied residential real estate are made either as part of a commercial relationship and subject to similar underwriting standards and processes as the CRE portfolio, or loans that were purchased in a prior year as part of a pool of loans. Purchased loan pools are evaluated based on risk characteristics established for each segmented group of loans. These characteristics include a significant emphasis on historical losses within each loan group, inherent risks for each, and specific loan class characteristics such as trends related to nonaccrual loans, past due loans, criticized loans, net charge-offs or recoveries, among other relevant credit risk factors. Residential equity lines of credit are included in the discussion of consumer loans below.
We originate some single family residence construction loans. The loan amounts are no greater than $1 million and are short term real estate secured financing for the construction of a single family residence to be occupied by the owner. The loans have a draw down feature with interest only payments, and a balloon payment at the 12-month maturity. All of these loans are refinanced and paid-off by the borrower’s permanent mortgage lender who provided the initial pre-approved mortgage financing. These loans are underwritten utilizing financial analysis of the borrower and are generally based upon estimates of cost and value associated with the complete project (as-is value). These estimates may be inaccurate. The loan disbursement and monitoring process is controlled utilizing similar processes as our CRE construction loans.
Consumer Loans – Our consumer loan originations are generally limited to home equity loans with nominal originations in unsecured personal loans. The portfolio also includes unsecured consumer home improvement loans and residential solar panel loans secured by UCC filings. We are highly dependent on third party credit scoring analysis to supplement the internal underwriting process. To monitor and manage consumer loan risk, policies and procedures are developed and modified, as needed, jointly by management and staff personnel. This activity, coupled with relatively small loan amounts that are spread across many individual borrowers, minimizes risk. Additionally, trend and outlook reports are reviewed by management on a regular basis. Underwriting standards for home equity loans are heavily influenced by statutory requirements, which include, but are not limited to, a maximum loan-to-value percentage of 80%, collection remedies, the number of such loans a borrower can have at one time, and documentation requirements.
BANK OF COMMERCE HOLDINGS & SUBSIDIARIES
Notes to Consolidated Financial Statements
We maintain an independent loan review program that reviews and validates the credit risk program on a periodic basis. Results of these reviews are presented to the Board of Directors and Audit Committee. The loan review process complements and reinforces the risk identification and assessment decisions made by lenders and credit personnel, as well as our policies and procedures.
Management’sManagement’s continuing evaluation of all known relevant quantitative and qualitative internal and external risk factors provides the foundation for the three major components of the ALLL: (1)(1) historical valuation allowances established in accordance with ASC 450, Contingencies (“ASC 450”) for groups of similarly situated loan pools; (2)(2) general valuation allowances established in accordance with ASC 450 and that are based on qualitative credit risk factors; and (3)(3) specific valuation allowances established in accordance with ASC 310, Receivables (“ASC 310”) andthat are based on estimated probable losses on specific impaired loans. All three components are aggregated and constitute the ALLL; while portions of the allowance may be allocated to specific credits, the allowance net of specific reserves is available for the remaining credits that management deems as “loss.” It is our policy to classify a credit as loss with a concurrent charge-off when management considers the credit uncollectible and of such little value that its continuance as a bankable asset is not warranted. A loss classification does not mean that the loan has absolutely no recovery or salvage value, but rather it is not practical or desirable to defer recognizing the likely credit loss of a valueless asset even though partial recovery may occur in the future.
Our loan portfolio is evaluated by general loan class including commercial, commercial real estate (which includes construction and other real estate), residential real estate (which includes 1-41-4 family and home equity loans), consumer and other loans. In accordance with ASC 450, historical valuation allowances are established for loan pools with similar risk characteristics common to each loan grouping. These loan pools are similarly risk-graded and each portfolio is evaluated by identifying all relevant risk characteristics that are common to these segmented groups of loans. These characteristics include a significant emphasis on historical losses within each loan group, inherent risks for each, and specific loan class characteristics such as trends related to nonaccrual loans, past due loans, criticized loans, net charge-offs or recoveries, among other relevant credit risk factors. We periodically review and update our historical loss ratios based on net charge-off experience for each loan and lease class. Other credit risk factors are also reviewed periodically and adjusted as necessary to account for any changes in potential loss exposure.
General valuation allowances, as prescribed by ASC 450, are based on qualitative factors such as changes in asset quality trends, concentrations of credit or changes in concentrations of credit, changes in underwriting standards, changes in experience or depth of lending staff or management, the effectiveness of loan grading and the internal loan review function, and any other relevant factors. Management evaluates each qualitative component quarterly to determine the associated risks to the quality of our loan portfolio.
BANK OF COMMERCE HOLDINGS & SUBSIDIARIES
Notes to Consolidated Financial Statements
NOTE 6. PURCHASE OF FINANCIAL ASSETS
We have agreedan ongoing agreement to purchase a maximum par value of $50.0$50.0 million in unsecured consumer home improvement loans.loans from a third party originator. The loans wereare purchased without recourse or servicing rights. As we receive principal payments on these purchased loans, new loans are purchased and the outstanding par value remains at approximately $50.0 million. For the period from May 12, 2014 throughDecember 31, 2016, 2017, we have purchased $95.9paid aggregate cash totaling $118.3 million, of these loans, and received aggregate cash repayments of $48.9$71.9 million for $47.0$46.4 million in net loans outstanding at December 31, 2016.outstanding. We initially measuredrecord the acquired loan portfolioloans at a fair equal to the price paid to acquire the portfolio as the difference between the par value and cash purchase price represents the fair value adjustment.at the time of the purchase.
NOTE 7. PREMISES AND EQUIPMENT
The following table presents the major components of premises and equipment at December 31, 2016 2017 and 2015.2016.
(Amounts in thousands) | ||||||||||||||||
Premises and Equipment | 2016 | 2015 | 2017 | 2016 | ||||||||||||
Land | $ | 2,063 | $ | 1,508 | $ | 2,063 | $ | 2,063 | ||||||||
Land improvements | 223 | 195 | 241 | 223 | ||||||||||||
Bank buildings | 12,931 | 9,099 | 12,976 | 12,931 | ||||||||||||
Furniture, fixtures and equipment | 12,130 | 9,743 | 12,639 | 12,130 | ||||||||||||
Software | 1,637 | 1,625 | 1,634 | 1,637 | ||||||||||||
Assets not yet placed in service | 429 | 295 | 337 | 429 | ||||||||||||
Total premises and equipment | 29,413 | 22,465 | 29,890 | 29,413 | ||||||||||||
Less: accumulated depreciation and amortization | (13,187 | ) | (11,393 | ) | (15,142 | ) | (13,187 | ) | ||||||||
Premises and equipment, net | $ | 16,226 | $ | 11,072 | $ | 14,748 | $ | 16,226 | ||||||||
We record depreciation expense on a straight-line basis for all depreciable assets. Depreciation expense totaled $1.9$2.1 million, $1.5$1.9 million, and $1.3$1.5 million, for the years ended December 31, 2017, 2016 2015 and 2014,2015, respectively. We have entered into a number of non-cancelable lease agreements with respect to various premises. See Note 16,15,Commitments and Contingencies in theseNotes to Consolidated Financial Statements for more information regarding rental expense, rent income and minimum annual rental commitments under non-cancelable lease agreements.
NOTE 8. OTHER REAL ESTATE OWNED (OREO)
OREO represents real estate to which we have taken controllegal title in partial or full satisfaction of loans and properties originally acquired for branch expansion but no longer intended to be used for that purpose. OREO is recorded at fair value less costs to sell plus costssell. Additional expenditures for improvements that prepareincrease the fair value of the property as it is prepared for sale which becomesare added to the property’s new cost basis. Any write-downs based on the asset’s fair value at the date of acquisition are charged to the ALLL. Any write-up in the fair value of the asset at the date of acquisition is reported as noninterest income unless there has been a prior charge-off, in which case a recovery is credited to the ALLL. Thereafter, management periodically performs valuations and the property is carried at the lower of the cost or fair value less expected selling costs. Subsequent valuation adjustments and net expenses incurred from OREO property are recorded innoninterest expense, in theConsolidatedStatements of Income.
BANK OF COMMERCE HOLDINGS & SUBSIDIARIES
Notes to Consolidated Financial Statements
The following table presents the changes in OREO for the years ended December 31, 2017, 2016, 2015, and 2014.2015.
(Amounts in thousands) | Years Ended December 31, | |||||||||||
OREO | 2016 | 2015 | 2014 | |||||||||
Balance at beginning of year | $ | 1,423 | $ | 502 | $ | 913 | ||||||
Additions to other real estate owned | 147 | 4,059 | 688 | |||||||||
Dispositions of other real estate owned | (745 | ) | (3,138 | ) | (809 | ) | ||||||
Valuation adjustments in the period | (66 | ) | — | (290 | ) | |||||||
Total | $ | 759 | $ | 1,423 | $ | 502 | ||||||
(Amounts in thousands) | Years Ended December 31, | |||||||||||
OREO | 2017 | 2016 | 2015 | |||||||||
Balance at beginning of year | $ | 759 | $ | 1,423 | $ | 502 | ||||||
Additions | 1,071 | 189 | 4,059 | |||||||||
Dispositions | (1,743 | ) | (745 | ) | (3,138 | ) | ||||||
Valuation adjustments | (52 | ) | (108 | ) | — | |||||||
Total | $ | 35 | $ | 759 | $ | 1,423 | ||||||
For the year ended December 31, 2016, 2017, we transferred threeseven foreclosed properties in the amount of $147$981 thousand to OREO.OREO and capitalized $90 thousand in costs. During this period, we sold nineeleven properties with balances of $745 thousand$1.7 million for a net lossgain of $109$368 thousand. During this period, we recognized a write-down in OREO for four propertiesone property totaling $108 thousand and capitalized $42 thousand in costs.$52 thousand. The December 31, 2016 2017 OREO balance consists of two 1-4one1-4 family residential real estate properties in the amount of $66 thousand, two nonfarm nonresidential properties in the amount of $581 thousand and one undeveloped commercial property in the amount of $112$35 thousand. The recorded investment in consumer mortgage loans collateralized by residential real estate property that are in the process of foreclosure is $1.2 million.
NOTE 9. NOTE RECEIVABLE
Pursuant to the terms of a note receivable held by the Holding Company in conjunction with our disposal of the former mortgage subsidiary, we received note payments(the “Note”) that commenced in 2013 and were due quarterly over a consecutive five year period. The Note carried a zero rate of interest and the obligation was guaranteed by the continuing shareholder of the Mortgage Company. As of March 31, 2014, we had received all principal amounts due through that date under the original Note agreement, and the Note carried an outstanding principal balance of $2.7 million.
During the first quarter of 2014, we became increasingly concerned about whether remaining principal due under the original terms of the Note would be collectible. As a result, during April 2014, we executed a promissory note compromise settlement agreement (the “Agreement”) with the Mortgage Company. The Agreement settled and determined all the respective rights and obligations under the Note.
Under the terms of the Agreement, the Mortgage Company paid cash in the amount of $686 thousand and transferred a 1-4 family mortgage note with a principal balance of $560 thousand to the Company. Simultaneously, we applied a portion of the cash proceeds to pay off the outstanding balance of the Mortgage Company’s warehouse line of credit held with the Bank. The Mortgage Company’s line of credit was subsequently closed during 2014. As a result of the Agreement, we recognized a loss of $1.4 million in other noninterest expensein theConsolidated Statements of Income in full and complete satisfaction of the Note during the first quarter of 2014.
The table below presents the details of the closing transaction.
(Amounts in thousands) | Amount | |||
Proceeds: | ||||
Cash received | $ | 686 | ||
1-4 family mortgage note (fair value) | 560 | |||
Net proceeds received | 1,246 | |||
Assets derecognized: | ||||
Note due from the mortgage company | 2,753 | |||
Discount on the note | (374 | ) | ||
Warehouse line of credit | 259 | |||
Total assets derecognized | 2,638 | |||
Loss on settlement of the note | $ | 1,392 | ||
BANK OF COMMERCE HOLDINGS & SUBSIDIARIES
Notes to Consolidated Financial Statements
NOTE 10 – 9.INTANGIBLE ASSETS
InMarch of 2016, as part of our branch acquisition, we recorded a core deposit intangible of $1.8$1.8 million and goodwill of $665$665 thousand. The acquired core deposit base provides value as a source of below market rate funds and the realization of interest cost savings is a fundamental rationale for assuming these deposit liabilities. The cost savings is defined as the difference between the cost of funds on our new deposits (i.e., interest and net maintenance costs) and the cost of an equal amount of funds from an alternative source having a similar term as the new deposit base. Our core deposit intangible was recorded at fair value which was derived by using the income approach and represents the present value of the cost savings over the projected term of our new deposit base.
The core deposit intangible is being amortized on a straight-line basis over the estimated useful life of the deposits, which is eight years, with no expected residual value. For tax purposes, the core deposit intangible will beis being amortized over 15 years.
As of December 31, 2016, 2017, we have recorded the following amounts related to the core deposit intangible.
(Amounts in thousands) | December 31, | |||
Intangibles | 2016 | |||
Gross carrying amount | $ | 1,772 | ||
Accumulated amortization | (185 | ) | ||
Core deposit intangible, net | $ | 1,587 | ||
(Amounts in thousands) | December 31, | |||
Intangibles | 2017 | |||
Gross carrying amount | $ | 1,772 | ||
Accumulated amortization | (407 | ) | ||
Core deposit intangible, net | $ | 1,365 | ||
The following table sets forth, as of December 31, 2016, 2017, the total estimated future amortization of intangible assets:
(Amounts in thousands) | ||||||||
For the year ended December 31, | Amount | Amount | ||||||
2017 | $ | 221 | ||||||
2018 | 221 | $ | 221 | |||||
2019 | 221 | 221 | ||||||
2020 | 221 | 221 | ||||||
2021 | 221 | 221 | ||||||
2022 and thereafter | 482 | |||||||
2022 | 221 | |||||||
2023 and thereafter | 260 | |||||||
Total | $ | 1,587 | $ | 1,365 | ||||
Goodwill is calculated as the amount of cash paid in excess of the fair value of the net assets acquired in the transaction. Goodwill is not amortized, but is annually reviewed for impairment. No impairment of goodwill was deemed necessary based on the 2017 annual review for impairment. For tax purposes, the goodwill will beis being amortized over 15 years. See Note2625 Branch Acquisitionin thethese Notes toConsolidated Financial Statementsin this document for further detail on the branch acquisition.
BANK OF COMMERCE HOLDINGS & SUBSIDIARIES
Notes to Consolidated Financial Statements
NOTE NOTE1110. OTHER ASSETS
Other assets consist of the following at December 31, 2016, 2017 and 2015.2016.
(Amounts in thousands) | 2016 | 2015 | 2017 | 2016 | ||||||||||||
Investments in affordable housing partnerships | $ | 4,217 | $ | 4,815 | ||||||||||||
Qualified Zone Academy Bonds | $ | 4,740 | $ | 4,740 | ||||||||||||
Federal Home Loan Bank of San Francisco stock | 4,465 | 4,465 | 4,537 | 4,465 | ||||||||||||
Interest receivable | 4,044 | 3,881 | 4,462 | 4,044 | ||||||||||||
Qualified Zone Academy Bonds | 4,740 | 2,740 | ||||||||||||||
Investments in affordable housing partnerships | 3,529 | 4,217 | ||||||||||||||
Prepaid expenses | 772 | 731 | 1,132 | 772 | ||||||||||||
Investment in unconsolidated trusts | 310 | 310 | ||||||||||||||
Loan servicing receivables | 643 | 841 | ||||||||||||||
Investment in Bank of Commerce Holdings Trust II | 310 | 310 | ||||||||||||||
SBA payments in process | 179 | 50 | ||||||||||||||
Other | 1,808 | 1,309 | 129 | 917 | ||||||||||||
Total | $ | 20,356 | $ | 18,251 | $ | 19,661 | $ | 20,356 | ||||||||
NOTE 1NOTE121. DEPOSITS
The following table presents the major types of interest-bearing deposits at December 31, 20162017 and 2015.2016.
(Amounts in thousands) | As of December 31, | As of December 31, | ||||||||||||||
Interest-bearing deposits | 2016 | 2015 | 2017 | 2016 | ||||||||||||
Interest-bearing demand | $ | 198,328 | $ | 165,316 | $ | 260,221 | $ | 198,328 | ||||||||
Money market | 207,241 | 150,342 | 236,769 | 207,241 | ||||||||||||
Savings | 113,309 | 94,503 | 110,837 | 113,309 | ||||||||||||
Certificates of deposit, less than $250,000 | 159,092 | 155,470 | 130,681 | 159,092 | ||||||||||||
Certificates of deposit, $250,000 and over | 56,298 | 68,597 | 58,574 | 56,298 | ||||||||||||
Total interest-bearing deposits | $ | 734,268 | $ | 634,228 | $ | 797,082 | $ | 734,268 | ||||||||
The following table presents interest expense for the major types of interest-bearing deposits for the years ended December 31, 2017, 2016 2015 and 2014.
(Amounts in thousands) | For the year ended December 31, | |||||||||||
Deposit Interest Expense | 2016 | 2015 | 2014 | |||||||||
Interest-bearing demand | $ | 201 | $ | 228 | $ | 221 | ||||||
Money market | 322 | 232 | 250 | |||||||||
Savings | 174 | 213 | 228 | |||||||||
Certificates of deposit, less than $250,000 | 1,537 | 1,744 | 1,897 | |||||||||
Certificates of deposit, $250,000 and over | 642 | 612 | 711 | |||||||||
Total interest-bearing deposits | $ | 2,876 | $ | 3,029 | $ | 3,307 | ||||||
BANK OF COMMERCE HOLDINGS & SUBSIDIARIES2015.
Notes to Consolidated Financial Statements
(Amounts in thousands) | For the year ended December 31, | |||||||||||
Deposit Interest Expense | 2017 | 2016 | 2015 | |||||||||
Interest-bearing demand | $ | 274 | $ | 201 | $ | 228 | ||||||
Money market | 470 | 322 | 232 | |||||||||
Savings | 200 | 174 | 213 | |||||||||
Certificates of deposit, less than $250,000 | 1,429 | 1,537 | 1,744 | |||||||||
Certificates of deposit, $250,000 and over | 759 | 642 | 612 | |||||||||
Total interest-bearing deposits | $ | 3,132 | $ | 2,876 | $ | 3,029 | ||||||
The following table presents the scheduled maturities of all certificates of deposit as of December 31, 2016.2017.
(Amounts in thousands) | ||||
Amounts due in: | ||||
One year or less | $ | 114,084 | ||
One to three years | 72,200 | |||
Three to five years | 29,032 | |||
Over five years | 74 | |||
Total certificates of deposit | $ | 215,390 |
(Amounts in thousands) | ||||
Amounts due in: | ||||
2018 | $ | 105,219 | ||
2019 | 37,248 | |||
2020 | 23,394 | |||
2021 | 12,925 | |||
2022 | 10,380 | |||
Thereafter | 89 | |||
Total certificates of deposit | $ | 189,255 |
BANK OF COMMERCE HOLDINGS & SUBSIDIARIES
Notes to Consolidated Financial Statements
The following table presents the scheduled maturities of certificates of deposit of $250$250 thousand or more as of December 31, 2016.2017.
(Amounts in thousands) | ||||
Amounts due in: | ||||
Three months or less | $ | 8,467 | ||
Over three months through six months | 6,505 | |||
Over six months through twelve months | 11,009 | |||
Over twelve months | 30,317 | |||
Total certificates of deposit of $250 thousand or more | $ | 56,298 |
(Amounts in thousands) | ||||
Amounts due in: | ||||
Three months or less | $ | 7,872 | ||
Over three months through six months | 8,268 | |||
Over six months through twelve months | 8,725 | |||
Over twelve months | 33,709 | |||
Total certificates of deposit of $250 thousand or more | $ | 58,574 |
NOTE 1NOTE132. TERM DEBT
Term debt at December 31, 2016 2017 and 20152016 consisted of the following.
(Amounts in thousands) | 2016 | 2015 | 2017 | 2016 | ||||||||||||
Federal Home Loan Bank of San Francisco borrowings | $ | — | $ | 75,000 | ||||||||||||
Senior debt | 8,917 | 9,917 | $ | 7,096 | $ | 8,917 | ||||||||||
Unamortized debt issuance costs | (12 | ) | (15 | ) | (6 | ) | (12 | ) | ||||||||
Subordinated debt | 10,000 | 10,000 | 10,000 | 10,000 | ||||||||||||
Unamortized debt issuance costs | (172 | ) | (208 | ) | (132 | ) | (172 | ) | ||||||||
Net term debt | $ | 18,733 | $ | 94,694 | $ | 16,958 | $ | 18,733 | ||||||||
Future contractual maturities of term debt at December 31, 2016 2017 are as follows.
(Amounts in thousands) | 2017 | 2018 | 2019 | 2020 | 2021 | Thereafter | Total | 2018 | 2019 | 2020 | 2021 | 2022 | Thereafter | Total | ||||||||||||||||||||||||||||||||||||||||||
Senior debt | $ | 917 | $ | 1,000 | $ | 1,000 | $ | 6,000 | $ | — | $ | — | $ | 8,917 | $ | 1,000 | $ | 1,000 | $ | 5,096 | $ | — | $ | — | $ | — | $ | 7,096 | ||||||||||||||||||||||||||||
Subordinated debt | — | — | — | — | — | 10,000 | 10,000 | — | — | — | — | — | 10,000 | 10,000 | ||||||||||||||||||||||||||||||||||||||||||
Total future maturities | $ | 917 | $ | 1,000 | $ | 1,000 | $ | 6,000 | $ | — | $ | 10,000 | $ | 18,917 | $ | 1,000 | $ | 1,000 | $ | 5,096 | $ | — | $ | — | $ | 10,000 | $ | 17,096 | ||||||||||||||||||||||||||||
Federal Home Loan Bank of San Francisco borrowings
The average balance outstanding on Federal Home Loan Bank of San Francisco term advances during the year ended December 31, 2017 and the year ended December 31, 2016 was $302 thousand and $18.0 million, respectively. The maximum amount outstanding from the Federal Home Loan Bank of San Francisco under term advances at any month end during the year ended December 31, 2017 and the year ended December 31, 2016 and 2015 was $80.0$10.0 million and $120.0$80.0 million, respectively. The average balance outstanding on Federal Home Loan Bank of San Francisco term advances during 2016 and 2015 was $18.0 million and $87.6 million, respectively. During the three months ended March 31, 2016, allThere were no outstanding Federal Home Loan Bank of San Francisco term advances were repaid. The weighted average interest rate on the borrowings outstanding at December 31, 2015, was 0.33%.
BANK OF COMMERCE HOLDINGS & SUBSIDIARIES2017 or December 31, 2016.
Notes to Consolidated Financial Statements
The Federal Home Loan Bank of San Francisco line of credit is secured by an investment in Federal Home Loan Bank of San Francisco stock, certain real estate mortgage loans which have been specifically pledged to the Federal Home Loan Bank of San Francisco pursuant to collateral requirements, and pledged securities held in the Bank’s investment securities portfolio. As of December 31, 2016, the Bank was required to hold an investment in Federal Home Loan Bank of San Francisco stock of $4.5 million recorded in other assets in theConsolidated Balance Sheets. Our investments in Federal Home Loan Bank of San Francisco stock are restricted investment securities, carried at cost, evaluated for impairment, and excluded from securities accounted for underASC Topic 320 and ASC Topic 321. Furthermore, we have $373.0 million of our commercial and real estate mortgage loans held for the line of credit with the Federal Home Loan Bank of San Francisco for pledging purposes. As of December 31, 2016, we held $15.1 million in securities with the Federal Home Loan Bank of San Francisco for pledging purposes. All of the securities held for pledging purposes with the Federal Home Loan Bank of San Francisco were unused as collateral as of December 31, 2016.
Senior Debt
In December of 2015, the Holding Company entered into a senior debt loan agreement to borrow $10.0$10.0 million from another financial institution.institution. The original loan is payable interms required monthly principal installments of $83$83 thousand, principal, plus accrued and unpaid interest, commencing on January 1, 2016, and continuing to, and including December 10, 2020. A2020 and a final scheduled payment of $5.0$5.0 million is due on the maturity date of December 10, 2020. The loan may be prepaid in whole or in part at any time without any prepayment penalty. The principal amount of the loan bears interest at a variable rate, resetting monthly that is equal to the sum of the current three month-month LIBOR plus 400 basis points. In December of 2015, the Holding Company incurred senior debt issuance costs of $15$15 thousand, which are being amortized over the life of the loan as additional interest expense. The loan is secured by a pledge from the Holding Company of all of the outstanding stock of Redding Bank of Commerce.
Subordinated Debt
In December of 2015, the Holding Company issued $10.0$10.0 million in aggregate principal amount of fixed to floating rate subordinated notesSubordinated Notes due in 2025. The subordinated debtSubordinated Debt initially bears interest at 6.88% per annum for a five-yearfive-year term, payable semi-annually. Thereafter, interest on the subordinated debtSubordinated Debt will be paid at a variable rate equal to three month LIBOR plus 526 basis points, payable quarterly until the maturity date. In December of 2015, the Holding Company incurred subordinated debt issuance costs of $210$210 thousand, which are being amortized over the initial five year term-year-term as additional interest expense.
The subordinated debtSubordinated Debt is subordinate and junior in right of payment to the prior payment in full of all existing and future claims of creditors and depositors of the Holding Company and its subsidiaries, whether now outstanding or subsequently created. The subordinated debtSubordinated Debt ranks equally with all other unsecured subordinated debt, except any which by its terms is expressly stated to be subordinated to the subordinated debt.Subordinated Debt. The subordinated debtSubordinated Debt ranks senior to all future junior subordinated debt obligations, preferred stock and common stock of the Holding Company. The subordinated debtSubordinated Debt is recorded as term debt on the Holding Company’s balance sheet; however, for regulatory purposes, it is treated as Tier 2 capital by the Holding Company.
BANK OF COMMERCE HOLDINGS & SUBSIDIARIES
Notes to Consolidated Financial Statements
The subordinated debtSubordinated Debt will mature on December 10, 2025 but may be prepaid at the Holding Company’s option and with regulatory approval at any time on or after five years after the Closing Date or at any time upon certain events, such as a change in the regulatory capital treatment of the subordinated debtSubordinated Debt or the interest on the subordinated debtSubordinated Debt is no longer deductible by the Holding Company for United States federal income tax purposes.
BANK OF COMMERCE HOLDINGS & SUBSIDIARIES
Notes to Consolidated Financial Statements
NOTE 1NOTE143. JUNIOR SUBORDINATED DEBENTURES
As of December 31, 2016 2017 and 2015,2016, the Company had one wholly-owned trust formed in 2005 to issue trust preferred securities and related common securities.securities. The following table presents information about the Trust as of December 31, 2016 2017 and 2015.2016.
(Amounts in thousands) | |||||||||||||||||||||||||||||||||||
Issued | Effective | Redemption | Issued | Effective | Redemption | ||||||||||||||||||||||||||||||
Trust Name | Issue Date | Amount | Rate (1) | Rate | Maturity Date | Date | Issue Date | Amount | Rate | Rate | Maturity Date | Date | |||||||||||||||||||||||
Bank of Commerce Holdings Trust II | July 29, 2005 | $ | 10,310 | Floating(3) | (2) | September 15, 2035 | (4) | July 29, 2005 | $ | 10,310 | Floating (2) | (1) | September 15, 2035 | (3) | |||||||||||||||||||||
(1) Effective rate as of December 31, 2017 and 2016 of 3.17% and 2.54%, respectively. | ||||||||||||||||
| ||||||||||||||||
(3) | ||||||||||||||||
| ||||||||||||||||
|
The $10.3$10.3 million of junior subordinated debentures issued to Trust II as of December 31, 2016 2017 and 2015,2016, are reflected in theConsolidated Balance Sheets. The common stock issued by Trust II in the amount of $310$310 thousand is recorded in other assetsOther Assets in theConsolidated Balance Sheets, at December 31, 2016 2017 and 2015.2016. All of the debentures issued to Trust II, less the common stock of Trust II, qualified as Tier 1 capital as of December 31, 2016 2017 and 2015,2016, under guidance issued by the Federal Reserve Board.
During the year ended December 31, 2014, the Holding Company redeemed all $5.2 million of junior subordinated debentures from a separate wholly-owned trust formed in 2003. The Holding Company received net cash payment of $4.6 million resulting in a $406 thousand gain on extinguishment of debt recorded in other income and a $155 thousand reduction of the common stock investment in trusts.
NOTE 1NOTE154. OTHER LIABILITIES
Other liabilities consist of the following at December 31, 20162017 and 2015.2016.
(Amounts in thousands) | 2016 | 2015 | ||||||
Deferred compensation – directors fees | $ | 3,753 | $ | 3,661 | ||||
Deferred compensation – salary continuation | 3,410 | 3,458 | ||||||
Deferred compensation – severance payable | 820 | 850 | ||||||
Derivatives | — | 2,369 | ||||||
Delayed equity contributions - affordable housing tax credit partnerships | 485 | 1,182 | ||||||
Accrued employee incentives | 1,109 | 1,059 | ||||||
Deferred income | 520 | 885 | ||||||
Reserve for unfunded commitments | 695 | 695 | ||||||
Other loan servicing liabilities | 576 | 569 | ||||||
Dividend payable on common stock | 401 | 400 | ||||||
Other | 1,408 | 1,052 | ||||||
Total | $ | 13,177 | $ | 16,180 | ||||
(Amounts in thousands) | 2017 | 2016 | ||||||
Deferred compensation – directors fees | $ | 3,823 | $ | 3,753 | ||||
Salary continuation | 3,387 | 3,410 | ||||||
Severance payable | 790 | 820 | ||||||
Accrued employee incentives | 1,170 | 1,109 | ||||||
Reserve for unfunded commitments | 695 | 695 | ||||||
Dividend payable on common stock | 486 | 401 | ||||||
Delayed equity contributions - affordable housing tax credit partnerships | 361 | 485 | ||||||
Deferred income | 315 | 520 | ||||||
Other loan servicing liabilities | 235 | 576 | ||||||
Other | 895 | 1,408 | ||||||
Total | $ | 12,157 | $ | 13,177 | ||||
NOTE NOTE1165. COMMITMENTS AND CONTINGENCIES
Lease Commitments –We lease eightnine sites under non-cancelable operating leases. The leases contain various provisions for increases in rental rates, based on predetermined escalation schedules. Substantially all of the leases include the option to extend the lease term one or more times following expiration of the initial term.We had one capital lease associated with our Branch Acquisition during 2016 that was terminated on December 29, 2016.
BANK OF COMMERCE HOLDINGS & SUBSIDIARIES
Notes to Consolidated Financial Statements
The following table sets forth rent expense and rent income for the years ended December 31, 2016 2017 and 2015.2016.
December 31, | ||||||||
(Amounts in thousands) | 2016 | 2015 | ||||||
Rent income | $ | 78 | $ | 26 | ||||
Rent expense | 707 | 569 | ||||||
Net rent expense | $ | 629 | $ | 543 | ||||
December 31, | ||||||||
(Amounts in thousands) | 2017 | 2016 | ||||||
Rent income(1) | $ | 46 | $ | 78 | ||||
Rent expense | 841 | 707 | ||||||
Net rent expense | $ | 795 | $ | 629 | ||||
(1) Rental income is derived from OREO properties The following table (Amounts in thousands) Amounts due in: 2017 2018 2019 2020 2021 Thereafter Total (Amounts in thousands) Amounts due in: 2018 2019 2020 2021 2022 Thereafter Total Financial Instruments with Off-Balance Sheet Risk Our consolidated financial statements do not reflect various commitments and contingent liabilities that arise in the normal course of our business and involve elements of credit, liquidity, and interest rate risk. (Amounts in thousands) 2016 2015 Commitments to extend credit Standby letters of credit Affordable housing grants Total commitments In the normal course of business we are party to financial instruments with off-balance sheet credit risk to meet the financing needs of our customers. These financial instruments include commitments to extend credit, standby letters of credit and financial guarantees. These instruments involve elements of credit and interest rate risk similar to the amounts recognized in theConsolidated Balance Sheets. The contract or notional amounts of these instruments reflect the extent of our involvement in particular classes of financial instruments. The following table presents a summary of (Amounts in thousands) 2017 2016 Commitments to extend credit Standby letters of credit Affordable housing grants Total commitments and contingent liabilities We were not required to perform on any financial guarantees for the years ended December 31, Affordable Housing Grants In fulfilling our CRA responsibilities, we are a sponsor for various nonprofit organizations BANK OF COMMERCE HOLDINGS & SUBSIDIARIESNotes to Consolidated Financial Statementspresentssets forth, as of December 31, 2017, the future minimum lease payments under non-cancelable operating leases as of December 31, 2016leases. $ 645 530 502 515 525 962 $ 3,679 $ 845 866 884 899 807 1,367 $ 5,668 The following table presents a summary of our commitments and contingent liabilities at December 31. $ 224,082 $ 224,757 1,967 2,477 3,338 3,356 $ 229,387 $ 230,590 Our exposure to credit loss in the eventnonperformance by the other party to the financial instrument for commitments to extend credit, standby letters of credit, and financial guarantees, is represented by the contractual notional amount of those instruments. We use the same credit policies in makingour commitments and conditional obligations as we use for on-balance sheet instruments.Commitments to Extend Credit -Commitments to extend credit are agreements to lend to a customer as long as there is no violation of any covenant or condition established in the contract. Commitments generally have fixed expiration dates or other termination clauses and may require payment of a fee. Since many of the commitments are expected to expire without being drawn upon, the total commitment amounts do not necessarily represent future cash requirements.While most standby letters of credit are not utilized, a significant portion of such utilization is on an immediate payment basis. We evaluate each customer’s creditworthiness on a case-by-case basis. The amount of collateral obtained, if it is deemed necessary by the Bank upon extension of credit, is based on our credit evaluation of the counterparty. Collateral varies but may include cash, marketable securities, accounts receivable, inventory, premises and equipment and real estate.Standby letters of credit and financial guarantees are conditional commitments issued by the Bank to guarantee the performance of a customer to a third party. These guarantees are primarily issued to support public and private borrowing arrangements, including international trade finance, commercial paper, bond financing and similar transactions. The credit risk involved in issuing letters of credit is essentially the same as that involved in extending loan facilities to customers. contingent liabilities at December 31. $ 217,714 $ 224,082 6,692 1,967 3,338 3,338 $ 227,744 $ 229,387 107Table of ContentsBANK OF COMMERCE HOLDINGS & SUBSIDIARIESNotes to Consolidated Financial Statements2016 2017 and 2015,2016, respectively. At December 31, 2016, 2017, approximately $1.9$1.3 million of standby letters of credit expire within one year, and $91 thousand$5.4 million expire thereafter. -As part of satisfyingwhichthat receive cash grants from the Federal Home Loan Bank of San Francisco. Those grants require the nonprofit organization to comply with stipulated conditions of the grant over specified periods of time which typically vary from 10 to 15 years. If the nonprofit organization fails to comply, Federal Home Loan Bank of San Francisco can require us to refund the amount of the grant to Federal Home Loan Bank of San Francisco. To mitigate this contingent credit risk, Credit Administration underwrites the financial strength of the nonprofit organization and reviews their systems of internal control to determine, as best as is possible, that they will not fail to comply with the conditions of the grant.
Reserve Forfor Unfunded Commitments
The reserve for unfunded commitments, which is included inOther Liabilities on theConsolidated Balance Sheets, was $695$695 thousand at December 31, 2016 2017 and 2015.2016. The adequacy of the reserve for unfunded commitments is reviewed on a quarterly basis, based upon changes in the amount of commitments, loss experience, and economic conditions. When necessary, the provision expense is recorded in other noninterest expense in theConsolidatedStatements of Income.
Death Benefit Agreement
The Company has entered into contractsagreements with certain employees to pay a cash benefit to designated beneficiaries following the death of the employee. The payment will be made only if, at the time of death, the deceased employee was employed by the Bank and the Bank owned a life insurance policy on the employee’s life. Depending on specific facts and circumstances, the payment amount can vary from $0up to $225,000a maximum of $225,000 per employee.employee and may be taxable to the recipient. Neither the employeesemployee nor the designated beneficiaries haverecipient has a claim against the Bank’s life insurance policy on the employee’s life.
BANK OF COMMERCE HOLDINGS & SUBSIDIARIES
Notes to Consolidated Financial Statements
Legal Proceedings
We are involved in various pending and threatened legal actions arising in the ordinary course of business. We maintain reserves for losses from legal actions, which are both probable and estimable. In our opinion, the disposition of claims currently pending will not have a material adverse effect on our financial position or results of operations.
Concentrations of Credit Risk
We grant real estate construction, commercial, and installment loans to customers throughout northern California. In our judgment, a concentration exists in real estate related loans, which represented approximately75%approximately 77% and 74%75% of our gross loan portfolio at December 31, 2017 and December 31, 2016, and December 31, 2015, respectively.
Commercial real estate concentrations are managed to assure wide geographic and business diversity. Although management believes such concentrations have no more than the normal risk of collectability, a substantial decline in the economy in general, material increases in interest rates, changes in tax policies, tightening credit or refinancing markets, or a decline in real estate values in our principal market areas in particular, could have an adverse impact on the repayment of these loans. Personal and business incomes, proceeds from the sale of real property, or proceeds from refinancing, represent the primary sources of repayment for a majority of these loans.
We recognize the credit risks inherent in dealing with other depository institutions. Accordingly, to prevent excessive exposure to other depository institutions in aggregate or to any single correspondent, we have established general standards for selecting correspondent banks as well as internal limits for allowable exposure to other depository institutions in aggregate or to any single correspondent. In addition, we have an investment policy that sets forth limitations that apply to all investments with respect to credit rating and concentrations with an issuer.
BANK OF COMMERCE HOLDINGS & SUBSIDIARIES
Notes to Consolidated Financial Statements
NOTE17.16. EMPLOYEE BENEFITS AND RETIREMENTRETIREMENT PLANS
Profit sharing plan –In 1985, we adopted a profit sharing 401(k)401(k) plan for eligible employees to be funded out of the earnings of the Company. The employees’ contributions are limited to the maximum amount allowable under IRS Section 402(G)402(G). The Company’s contributions include a matching contribution of 100% of the first3% of salary deferred and 50% of the next 2% of salary deferred. Discretionary contributions are also permitted. We made matching contributions aggregating $457$494 thousand, $396$457 thousand, and $368$396 thousand for the years ended December 31, 2017, 2016 2015 and 2014,2015, respectively. No discretionary contributions were made over the three year reporting period.
Salary continuation plan – In April 2001, the Board of Directors approved the implementation of the Supplemental Executive Retirement Plan (SERP), which is a non-qualified executive benefit plan in which we agree to pay certain executives covered by the SERP plan additional benefits in the future in return for continued satisfactory performance by the executives.performance.
Benefits under the salary continuation plan differ by participating executive and include a benefit generally payable commencing upon a designated retirement date for a fixed period of ten to twenty years, disability or termination of employment, and a death benefit for the participants designated beneficiaries. Whole life insurance policies were purchased as an investment to provide for our contractual obligation to pay pre-retirement death benefits and to recover our cost of providing benefits. The executive is the insured under the policy, while we are the owner and beneficiary.
The assets of the SERP, under Internal Revenue Service Regulations, are the Company’s property and are available to our general creditors. Except for employees covered by the death benefit agreement described above, the insured executive has no claim on the insurance policy, its cash value or the proceeds thereof.
The Company accrues for these future benefits from the effective date of the agreements until the executives’executives’ expected final payment date. The amount of accrued benefits approximates the present value of the benefits expected to be provided at retirement. Compensation expense under the salary continuation plan totaled $551$577 thousand, $726$551 thousand, and $741$726 thousand for the years ended December 31, 2017, 2016 2015 and 2014,2015, respectively. As of December 31, 2017, 2016 2015 and 2014,2015, the vested benefit payable was $3.4$3.4 million, $3.5$3.4 million, and $3.3$3.5 million, respectively.
Directors deferred fee compensation –On December 19, 2013, the Board of Directors adopted a Directors Deferred Compensation Plan (the “2013“2013 Plan”) to replace the Directors Deferred Compensation Plan dated January 1, 1993 as amended April 1, 2009 (the “1993 (the “1993 Plan”). Both plans allow the eligible Director to voluntarily elect to defer some or all of his or her current fees in exchange for the Company’s promise to pay a deferred benefit. The deferred fees are credited with interest and the accrued liability is paid to the Director at retirement. Directors must stop the deferral of compensation once their total deferred benefit reaches $500$500 thousand.
The interest rate in the 2013 Plan is equal to the Bloomberg 20-year20-year Investment Grade Financial Institutions Index (IGFII) rate (or a similar reference rate we select if that rate is not published) in effect on the interest accrual date, plus two percent. The 2013 Plan is only available to independent directors and, as a nonqualified deferred compensation plan, is not subject to nondiscrimination requirements applicable to qualified plans. No deferred compensation is payable to a director until the death, disability, unforeseeable emergency or separation from service, whereupon all such compensation, together with interest thereon shall be provided to such Director, or his beneficiary within thirty (30) (30) days. The Director may designate payments to be made in a lump sum or in monthly installments over a period not to exceed 120 months.
Although deferrals under the 1993 Plan have ceased;ceased, the 1993 Plan remains in effect for all amounts previously deferred in the plan. Under the 1993 Plan, at retirement, Directors are granted the option of continuing to accrue interest on deferred payments at a variable rate of Wall Street Journal prime plus 3.25%3.00% or at a fixed rate of 10%. The Director may designate payments to be made in a lump sum or in monthly installments over a period not to exceed 180 months.
Deferred compensation expense recorded in other noninterest expense totaled $281$292 thousand, $274$281 thousand, and $254$274 thousand for the years ended December 31, 2017, 2016, 2015, and 2014,2015, respectively. As of December 31, 2017, 2016 2015 and 2014,2015, the vested benefit payable recorded inOther Liabilitiesin theConsolidated Balance Sheets was $3.8$3.8 million, $3.7$3.8 million, and $3.6$3.7 million, respectively.
NOTE 18. FEDERAL FUNDS PURCHASED AND LINES OF CREDIT
At December 31, 2016 and 2015, we had no outstanding federal funds purchased balances.
The Bank had nonbinding federal funds line of credit agreements with three financial institutions totaling $40.0 million at December 31, 2016. The lines of credit had interest rates ranging from 0.09% to 1.54% at December 31, 2016. Availability of the lines is subject to federal funds balances available for loan, continued borrower eligibility and are reviewed and renewed periodically throughout the year. These lines are intended to support short-term liquidity needs, and the agreements may restrict consecutive day usage.
BANK OF COMMERCE HOLDINGS & SUBSIDIARIES
Notes to Consolidated Financial Statements
NOTE 17. FEDERAL FUNDS PURCHASED AND LINES OF CREDIT
At December 31, 2017 and 2016, we had no outstanding federal funds purchased balances and no outstanding advances on any of the Bank’s lines of credit.
The Bank had the following lines of credit:
Federal Funds
We have entered into nonbinding federal funds line of credit agreements with three financial institutions to support short-term liquidity needs. The lines totaled $35.0 million at December 31, 2017 and had interest rates ranging from 1.64% to 2.29%. Advances under the lines are subject to funds availability, continued borrower eligibility, and may have consecutive day usage restrictions. The credit arrangements are reviewed and renewed annually.
Federal Reserve Bank
We have an available line of credit with the Federal Reserve Bank totaling $28.5 million subject to collateral requirements, namely the amount of certain pledged loans.
Federal Home Loan Bank of San Francisco
We have an available line of credit with the Federal Home Loan Bank of San Francisco of $334.9 million subject to certain collateral requirements, namely the amount of pledged loans and investment securities. The line of credit is secured by an investment in Federal Home Loan Bank of San Francisco stock, certain real estate mortgage loans that have been specifically pledged to the Federal Home Loan Bank of San Francisco pursuant to collateral requirements, and pledged securities held in the Bank’s investment securities portfolio.
As of December 31, 2017, the Bank was required to hold an investment in Federal Home Loan Bank of San Francisco stock of $4.5 million recorded in Other Assets in the Consolidated Balance Sheets. Our investments in Federal Home Loan Bank of San Francisco stock are restricted investment securities, carried at cost, evaluated for impairment, and excluded from securities accounted for under ASC Topic 320 and ASC Topic 321.
We have pledged $378.3 million of our commercial and real estate mortgage loans as collateral for the line of credit with the Federal Home Loan Bank of San Francisco. As of December 31, 2017, we also pledged $28.3 million in securities to the Federal Home Loan Bank of San Francisco.
NOTE18. SHAREHOLDERS’ EQUITY19. SHAREHOLDERS’ EQUITY
On May 10, 2017, the Company completed the sale of 2,738,096 shares of its common stock at a public offering price of $10.50 and received net proceeds of $26.8 million. These proceeds will support lending and investment activities, support or fund acquisitions of other institutions or branches as and if opportunities for such transactions become available, or repay certain borrowings.
On December 11, 2015, the Holding Company completed the redemption of all of the outstanding shares of the Holding Company’sCompany’s preferred stock designated as Senior Non-Cumulative Perpetual Preferred Stock, Series B (the “Series B Preferred Stock”), held by the US Treasury Department under the Small Business Lending Fund Program. The Holding Company paid $20.0$20.0 million to redeem the Series B Preferred Stock plus $39$39 thousand in accrued but unpaid dividends. The Holding Company exercised its optional redemption rights pursuant to the terms of the Securities Agreement. As a result of the SBLF Redemption, the Holding Company’s obligations under the Securities Agreement are terminated. The Holding Company funded the SBLF Redemption using the net proceeds from (i) its issuance and sale of $10.0$10.0 million in aggregate principal amount of its 6.88% Fixed to Floating rate Subordinated Notes due 2025 and (ii) the $10.0$10.0 million dollar loan provided to the Holding Company by another institution maturing in 2020 at a variable rate, resetting monthly that is equal to the sum of the current three month LIBOR plus 400 basis points.
Stock Plans –The 2008 Stock Option Plan was approved by the Holding Company’s shareholders on May 15, 2007 (“(“the Plan”). The Plan was amended and restated by the 2010 Equity Incentive Plan which was approved by the Holding Company’s shareholders on May 18, 2010. The latest amendment and restatement of the Plan was approved by the Holding Company’s shareholders on May 15, 2012. The Plan provides for equity awards including stock options, restricted stock and restricted stock units which may constitute incentive stock options (“ISO”) under Section 422(a)422(a) of the Internal Revenue Code of 1986, as amended, or non-statutory stock options (“NSO”) to key personnel of the Company, including Directors. The Plan provides that ISO and NSO under the Plan may not be granted at less than 100% of fair market value of the Holding Company’s common stock on the date of the grant. Vesting may be accelerated in case of an option holder’sholder���s death, disability, and retirement or in case of a change of control. At December 31, 2016, 2017, approximately 248198 thousand common shares were available for future grants under the Plan.
BANK OF COMMERCE HOLDINGS & SUBSIDIARIES
Notes to Consolidated Financial Statements
We recognized $53 thousand in tax benefits from vesting of restricted stock and $245 thousand in proceeds from stock options exercised during the year ended December 31, 2017. Proceeds from stock options exercised were $10 thousand and $156 thousand for the years ended December 31, 2016 and 2015, respectively.
Stock Option Activity
The following tables summarize information about stock option activity for the years ended December 31, 2017, 2016 2015 and 2014.2015.
| Weighted | ||||||||||||||||
Weighted | Average | |||||||||||||||
Average | Aggregate | Remaining | ||||||||||||||
Number | Exercise | Intrinsic | Contractual | |||||||||||||
of Shares | Price | Value | Term | |||||||||||||
Options outstanding December 31, 2014 | 256,100 | $ | 5.59 | $ | 274,297 | 6.58 | ||||||||||
Granted | 20,000 | $ | 5.83 | $ | — | 9.05 | ||||||||||
Exercised | (38,500 | ) | $ | 4.05 | $ | 59,494 | 6.17 | |||||||||
Forfeited | (3,500 | ) | $ | 11.59 | $ | — | — | |||||||||
Options outstanding December 31, 2015 | 234,100 | $ | 5.77 | $ | 319,483 | 5.87 | ||||||||||
Exercised | (1,900 | ) | $ | 5.29 | $ | 4,789 | 3.33 | |||||||||
Forfeited | (43,300 | ) | $ | 8.81 | $ | — | — | |||||||||
Options outstanding December 31, 2016 | 188,900 | $ | 5.08 | $ | 834,625 | 5.66 | ||||||||||
Exercisable at December 31, 2016 | 157,340 | 4.88 | 726,809 | 5.28 | ||||||||||||
| Weighted | ||||||||||||||||
Weighted | Average | |||||||||||||||
Average | Aggregate | Remaining | ||||||||||||||
Number | Exercise | Intrinsic | Contractual | |||||||||||||
of Shares | Price | Value | Term | |||||||||||||
Options outstanding December 31, 2015 | 234,100 | $ | 5.77 | $ | 319,483 | 5.87 | ||||||||||
Exercised | (1,900 | ) | $ | 5.29 | $ | 4,789 | 3.33 | |||||||||
Forfeited | (43,300 | ) | $ | 8.81 | $ | n/a | n/a | |||||||||
Options outstanding December 31, 2016 | 188,900 | $ | 5.08 | $ | 834,625 | 5.66 | ||||||||||
Exercised | (51,900 | ) | $ | 4.73 | $ | 245,450 | 4.42 | |||||||||
Forfeited | (2,500 | ) | $ | 4.05 | $ | n/a | n/a | |||||||||
Options outstanding December 31, 2017 | 134,500 | $ | 5.24 | $ | 704,350 | 4.76 | ||||||||||
Exercisable at December 31, 2017 | 118,920 | $ | 5.13 | $ | 609,596 | 4.51 | ||||||||||
BANK OF COMMERCE HOLDINGS & SUBSIDIARIES
Notes to Consolidated Financial Statements
For the Years Ended December 31, | For the Years Ended December 31, | |||||||||||||||||||||||
(Amounts in thousands, except per share information) | 2016 | 2015 | 2014 | 2017 | 2016 | 2015 | ||||||||||||||||||
Stock option expense | $ | 24 | $ | 42 | $ | 54 | $ | 23 | $ | 24 | $ | 42 | ||||||||||||
Stock option awards weighted average grant date fair value per share | $ | — | $ | 1.33 | $ | 1.45 | $ | — | $ | — | $ | 1.33 | ||||||||||||
At December 31, | At December 31, | |||||||||||||||||||||||
2016 | 2015 | 2014 | 2017 | 2016 | 2015 | |||||||||||||||||||
Unrecognized compensation costs related to non-vested stock option payments | $ | 29 | $ | 55 | $ | 72 | $ | 17 | $ | 29 | $ | 55 | ||||||||||||
Number of exercisable shares | 157 | 163 | 168 | 119 | 157 | 163 | ||||||||||||||||||
Generally, stock options vest at 20% per year from the date of the grant. The unrecognized compensation costs are expected to be recognized over a weighted average period of two years.
Restricted Stock Activity
The following tables summarize information about unvested restricted shares and restricted shares granted for the years ended December 31, 2017, 2016 2015 and 2014.
Weighted | Weighted | |||||||||||||||
Average | Aggregate | Average | ||||||||||||||
Number | Grant | Intrinsic | Remaining | |||||||||||||
of Shares | Price | Value | Contractual Term | |||||||||||||
Unvested restricted shares December 31, 2014 | 3,000 | $ | 5.81 | $ | 17,880 | 2.93 | ||||||||||
Granted | 53,831 | $ | 5.90 | $ | 242,125 | 2.25 | ||||||||||
Vested | (14,155 | ) | $ | 5.84 | $ | 81,182 | 1.45 | |||||||||
Unvested restricted shares December 31, 2015 | 42,676 | $ | 5.95 | $ | 285,076 | 2.49 | ||||||||||
Granted | 65,736 | $ | 5.74 | $ | 254,816 | 1.07 | ||||||||||
Vested | (38,148 | ) | $ | 5.79 | $ | 229,198 | 1.00 | |||||||||
Forfeited | (3,084 | ) | $ | 5.75 | $ | — | — | |||||||||
Unvested restricted shares December 31, 2016 | 67,180 | $ | 5.84 | $ | 638,210 | 1.38 | ||||||||||
For the Years Ended December 31, | ||||||||||||
(Amounts in thousands, except per share information) | 2016 | 2015 | 2014 | |||||||||
Restriction stock compensation expense | $ | 215 | $ | 89 | $ | 6 | ||||||
Restricted stock awards weighted average grant date fair value per share | $ | 5.74 | $ | 5.90 | $ | — | ||||||
At December 31, | ||||||||||||
2016 | 2015 | 2014 | ||||||||||
Unrecognized compensation costs related to non-vested restricted stock payments | $ | 205 | $ | 181 | $ | 17 | ||||||
Restricted shares vest over a three to five year service period. Unvested restricted shares have no dividend or voting rights. The unrecognized compensation costs are expected to be recognized over a weighted average period of three years.2015.
| Weighted | ||||||||||||||||
Weighted | Average | |||||||||||||||
Average | Aggregate | Remaining | ||||||||||||||
Number | Grant | Intrinsic | Contractual | |||||||||||||
of Shares | Price | Value | Term | |||||||||||||
Unvested restricted shares December 31, 2015 | 42,676 | $ | 5.95 | $ | 285,076 | 2.49 | ||||||||||
Granted | 65,736 | $ | 5.74 | $ | 254,816 | 1.07 | ||||||||||
Vested | (38,148 | ) | $ | 5.79 | $ | 229,198 | n/a | |||||||||
Forfeited | (3,084 | ) | 5.75 | n/a | n/a | |||||||||||
Unvested restricted shares December 31, 2016 | 67,180 | $ | 5.84 | $ | 638,210 | 1.38 | ||||||||||
Granted | 45,070 | $ | 10.35 | $ | 466,328 | 1.32 | ||||||||||
Vested | (37,761 | ) | $ | 5.79 | $ | 218,600 | n/a | |||||||||
Unvested restricted shares December 31, 2017 | 74,489 | $ | 8.60 | $ | 640,255 | 1.03 | ||||||||||
BANK OF COMMERCE HOLDINGS & SUBSIDIARIES
Notes to Consolidated Financial Statements
For the Years Ended December 31, | ||||||||||||
(Amounts in thousands, except per share information) | 2017 | 2016 | 2015 | |||||||||
Restricted stock compensation expense | $ | 196 | $ | 215 | $ | 89 | ||||||
Restricted stock awards weighted average grant date fair value per share | $ | 10.35 | $ | 5.74 | $ | 5.90 | ||||||
At December 31, | ||||||||||||
2017 | 2016 | 2015 | ||||||||||
Unrecognized compensation costs related to non-vested restricted stock payments | $ | 811 | $ | 205 | $ | 181 | ||||||
Restricted shares vest over a three to five year service period. Unvested restricted shares have no dividend or voting rights. The unrecognized compensation costs are expected to be recognized over a weighted average period of two years.
Stock Grant Activity
The following tables summarize information about shares granted as employee compensation for the year ended December 31, 2017.
Weighted | Stock | |||||||||||
Average | Grant | |||||||||||
Number | Grant | Compensation | ||||||||||
of Shares | Price | Expense | ||||||||||
Shares Granted during the year ended December 31, 2017 | 4,868 | $ | 10.05 | $ | 48,923 | |||||||
NOTE 20.19. ACCUMULATED OTHER COMPREHENSIVE LOSS
The following table presents the components of accumulated other comprehensive loss and the ending balances at December 31, 2017, 2016, 2015, and 2014,2015, respectively.
Unrealized | Unrealized | Accumulated Other | Unrealized | Unrealized | Accumulated Other | |||||||||||||||||||
Gains (Losses) | (Losses) | Comprehensive | Gains (Losses) | (Losses) | Comprehensive | |||||||||||||||||||
(Amounts in thousands) | On Securities | On Derivatives | Loss | On Securities | On Derivatives | Loss | ||||||||||||||||||
Accumulated other comprehensive loss as of December 31, 2014 | $ | 1,810 | $ | (1,897 | ) | $ | (87 | ) | ||||||||||||||||
Accumulated other comprehensive loss as of December 31, 2015 | $ | 1,142 | $ | (1,396 | ) | $ | (254 | ) | $ | 1,142 | $ | (1,396 | ) | $ | (254 | ) | ||||||||
Accumulated other comprehensive loss as of December 31, 2016 | $ | (659 | ) | $ | — | $ | (659 | ) | $ | (659 | ) | $ | — | $ | (659 | ) | ||||||||
Accumulated other comprehensive loss as of December 31, 2017 | $ | (266 | ) | $ | — | $ | (266 | ) | ||||||||||||||||
Accumulated other comprehensive loss in the table above is reported net of related tax. Detailed tax information on the individual components of comprehensive income are presented in theConsolidated Statements of Comprehensive Income.
NOTE 21.20. REGULATORY CAPITAL
The Holding Company and the Bank are subject to various regulatory capital requirements administered by federal and state banking agencies. Failure to meet minimum capital requirements can initiate certain mandatory and possibly additional discretionary actions by regulators that if undertaken, could have a direct material effect on our Consolidated Financial Statements.
Under capital adequacy guidelines and the regulatory framework for prompt corrective action, the Company and the Bank must meet specific capital guidelines that involve quantitative measures of their assets, liabilities and certain off-balance sheet items as calculated under regulatory accounting practices.
On July 2, 2013, the federal banking agencies substantially amended the regulatory risk-based capital rules applicable to the Holding Company and the Bank. Effective January 1, 2015 the new rules created “Common equity tier 1,” a new measure of regulatory capital closer to pure tangible common equity than the present Tier 1 definition; The required minimum risk-based capital ratio for Common equity tier 1 is 4.5 percent and with a 2.5 percent capital conservation buffer. The capital conservation buffer of 2.5 percent is being phased in between 2016 and 2019.
The new capital rules require the Bank to meet the capital conservation buffer requirement by 2019 in order to avoid constraints on capital distributions, such as dividends and equity repurchases, and certain bonus compensation for executive officers. These new capital rules also change the risk-weights of certain assets for purposes of the risk-based capital ratios and phase out certain instruments as qualifying capital.
BANK OF COMMERCE HOLDINGS & SUBSIDIARIES
Notes to Consolidated Financial Statements
When the new capital rule is fully phased in, the minimum capital requirements plus the conservation buffer will exceed the well-capitalized thresholds. This 0.5-percentage-point0.5 percentage-point cushion allows institutions to dip into a portion of their capital conservation buffer before reaching a status that is considered less than well capitalized for prompt corrective action purposes.
The capital amounts and the Bank’sBank’s prompt corrective action classifications are also subject to qualitative judgments by the regulators about components, risk weightings and other factors. Prompt corrective action provisions are not applicable to bank holding companies. Quantitative measures established by regulation to ensure capital adequacy, require the Company and the Bank to maintain minimum amounts and ratios set forth in the following table as defined in the regulations. Management believes as of December 31, 2016 2017 that the Company and the Bank met all capital adequacy requirements to which they are subject.
BANK OF COMMERCE HOLDINGS & SUBSIDIARIES
Notes to Consolidated Financial Statements
As of December 31, 2016, 2017, the most recent notification from the FDIC categorized the Bank as “well capitalized” under the regulatory framework for prompt corrective action. To be categorized as “well capitalized”, an institution must maintain minimum ratios as set forth in the following table. There are no conditions or events since that notification that management believes have changed the Bank’sBank’s capital rating category. The Holding Company’s and the Bank’s actual capital amounts and ratios as of December 31, 2016 2017 and 20152016 are presented in the following table.
Well | Minimum | Applicable | Minimum Capital | |||||||||||||||||||||||||||||||||||||||||||||||||||||||||||||||||
For Capital | Capital Adequacy Plus | To Be Well | Capitalized | Capital | 2017 Capital | Ratio plus Capital | ||||||||||||||||||||||||||||||||||||||||||||||||||||||||||||||
Actual | Adequacy Purposes | Capital Conversion Buffer | Capitalized | Capital | Actual | Requirement | Requirement | Conservation | Conservation Buffer | |||||||||||||||||||||||||||||||||||||||||||||||||||||||||||
(Amounts in thousands) | Amount | Ratio | Amount | Ratio | Amount | Ratio | Amount | Ratio | Amount | Ratio | Amount | Ratio | Amount | Ratio | Buffer | Amount | Ratio | |||||||||||||||||||||||||||||||||||||||||||||||||||
At December 31, 2017: | ||||||||||||||||||||||||||||||||||||||||||||||||||||||||||||||||||||
Company | ||||||||||||||||||||||||||||||||||||||||||||||||||||||||||||||||||||
Common equity tier 1 capital ratio | $ | 125,745 | 12.26 | % | n/a | n/a | $ | 46,169 | 4.50 | % | 1.25 | % | $ | 58,994 | 5.750 | % | ||||||||||||||||||||||||||||||||||||||||||||||||||||
Tier 1 capital ratio | $ | 135,745 | 13.23 | % | n/a | n/a | $ | 61,559 | 6.00 | % | 1.25 | % | $ | 74,384 | 7.250 | % | ||||||||||||||||||||||||||||||||||||||||||||||||||||
Total capital ratio | $ | 158,365 | 15.44 | % | n/a | n/a | $ | 82,079 | 8.00 | % | 1.25 | % | $ | 94,903 | 9.250 | % | ||||||||||||||||||||||||||||||||||||||||||||||||||||
Tier 1 leverage ratio | $ | 135,745 | 10.86 | % | n/a | n/a | $ | 50,008 | 4.00 | % | n/a | n/a | n/a | |||||||||||||||||||||||||||||||||||||||||||||||||||||||
Bank | ||||||||||||||||||||||||||||||||||||||||||||||||||||||||||||||||||||
Common equity tier 1 capital ratio | $ | 129,139 | 12.58 | % | $ | 66,703 | 6.50 | % | $ | 46,179 | 4.50 | % | 1.25 | % | $ | 59,006 | 5.750 | % | ||||||||||||||||||||||||||||||||||||||||||||||||||
Tier 1 capital ratio | $ | 129,139 | 12.58 | % | $ | 82,096 | 8.00 | % | $ | 61,572 | 6.00 | % | 1.25 | % | $ | 74,399 | 7.250 | % | ||||||||||||||||||||||||||||||||||||||||||||||||||
Total capital ratio | $ | 141,760 | 13.81 | % | $ | 102,620 | 10.00 | % | $ | 82,096 | 8.00 | % | 1.25 | % | $ | 94,923 | 9.250 | % | ||||||||||||||||||||||||||||||||||||||||||||||||||
Tier 1 leverage ratio | $ | 129,139 | 10.33 | % | $ | 62,486 | 5.00 | % | $ | 49,989 | 4.00 | % | n/a | n/a | n/a | |||||||||||||||||||||||||||||||||||||||||||||||||||||
At December 31, 2016: | ||||||||||||||||||||||||||||||||||||||||||||||||||||||||||||||||||||
Company | ||||||||||||||||||||||||||||||||||||||||||||||||||||||||||||||||||||
Common equity tier 1 capital ratio | $ | 92,757 | 9.43 | % | $ | 44,266 | 4.50 | % | n/a | n/a | n/a | n/a | $ | 92,757 | 9.43 | % | n/a | n/a | $ | 44,266 | 4.50 | % | 0.625 | % | $ | 50,414 | 5.125 | % | ||||||||||||||||||||||||||||||||||||||||
Tier 1 capital ratio | $ | 102,496 | 10.42 | % | $ | 59,021 | 6.00 | % | n/a | n/a | n/a | n/a | $ | 102,496 | 10.42 | % | n/a | n/a | $ | 59,021 | 6.00 | % | 0.625 | % | $ | 65,169 | 6.625 | % | ||||||||||||||||||||||||||||||||||||||||
Total capital ratio | $ | 124,735 | 12.68 | % | $ | 78,695 | 8.00 | % | n/a | n/a | n/a | n/a | $ | 124,735 | 12.68 | % | n/a | n/a | $ | 78,695 | 8.00 | % | 0.625 | % | $ | 84,843 | 8.625 | % | ||||||||||||||||||||||||||||||||||||||||
Tier 1 leverage ratio | $ | 102,496 | 9.13 | % | $ | 44,905 | 4.00 | % | n/a | n/a | n/a | n/a | $ | 102,496 | 9.13 | % | n/a | n/a | $ | 44,905 | 4.00 | % | n/a | n/a | n/a | |||||||||||||||||||||||||||||||||||||||||||
Bank | ||||||||||||||||||||||||||||||||||||||||||||||||||||||||||||||||||||
Common equity tier 1 capital ratio | $ | 121,098 | 12.31 | % | $ | 44,281 | 4.50 | % | $ | 50,432 | 5.125 | % | $ | 63,962 | 6.50 | % | $ | 121,098 | 12.31 | % | $ | 63,962 | 6.50 | % | $ | 44,281 | 4.50 | % | 0.625 | % | $ | 50,432 | 5.125 | % | ||||||||||||||||||||||||||||||||||
Tier 1 capital ratio | $ | 121,098 | 12.31 | % | $ | 59,042 | 6.00 | % | $ | 65,192 | 6.625 | % | $ | 78,722 | 8.00 | % | $ | 121,098 | 12.31 | % | $ | 78,722 | 8.00 | % | $ | 59,042 | 6.00 | % | 0.625 | % | $ | 65,192 | 6.625 | % | ||||||||||||||||||||||||||||||||||
Total capital ratio | $ | 133,337 | 13.55 | % | $ | 78,722 | 8.00 | % | $ | 84,873 | 8.625 | % | $ | 98,403 | 10.00 | % | $ | 133,337 | 13.55 | % | $ | 98,403 | 10.00 | % | $ | 78,722 | 8.00 | % | 0.625 | % | $ | 84,873 | 8.625 | % | ||||||||||||||||||||||||||||||||||
Tier 1 leverage ratio | $ | 121,098 | 10.80 | % | $ | 44,835 | 4.00 | % | n/a | n/a | $ | 56,043 | 5.00 | % | $ | 121,098 | 10.80 | % | $ | 56,043 | 5.00 | % | $ | 44,835 | 4.00 | % | n/a | n/a | n/a | |||||||||||||||||||||||||||||||||||||||
At December 31, 2015: | ||||||||||||||||||||||||||||||||||||||||||||||||||||||||||||||||||||
Company | ||||||||||||||||||||||||||||||||||||||||||||||||||||||||||||||||||||
Common equity tier 1 capital ratio | $ | 90,743 | 10.06 | % | $ | 40,587 | 4.50 | % | n/a | n/a | n/a | n/a | ||||||||||||||||||||||||||||||||||||||||||||||||||||||||
Tier 1 capital ratio | $ | 100,694 | 11.16 | % | $ | 54,117 | 6.00 | % | n/a | n/a | n/a | n/a | ||||||||||||||||||||||||||||||||||||||||||||||||||||||||
Total capital ratio | $ | 121,976 | 13.52 | % | $ | 72,155 | 8.00 | % | n/a | n/a | n/a | n/a | ||||||||||||||||||||||||||||||||||||||||||||||||||||||||
Tier 1 leverage ratio | $ | 100,694 | 10.03 | % | $ | 40,159 | 4.00 | % | n/a | n/a | n/a | n/a | ||||||||||||||||||||||||||||||||||||||||||||||||||||||||
Bank | ||||||||||||||||||||||||||||||||||||||||||||||||||||||||||||||||||||
Common equity tier 1 capital ratio | $ | 119,980 | 13.31 | % | $ | 40,570 | 4.50 | % | n/a | n/a | $ | 58,601 | 6.50 | % | ||||||||||||||||||||||||||||||||||||||||||||||||||||||
Tier 1 capital ratio | $ | 119,980 | 13.31 | % | $ | 54,094 | 6.00 | % | n/a | n/a | $ | 72,125 | 8.00 | % | ||||||||||||||||||||||||||||||||||||||||||||||||||||||
Total capital ratio | $ | 131,257 | 14.56 | % | $ | 72,125 | 8.00 | % | n/a | n/a | $ | 90,156 | 10.00 | % | ||||||||||||||||||||||||||||||||||||||||||||||||||||||
Tier 1 leverage ratio | $ | 119,980 | 11.98 | % | $ | 40,067 | 4.00 | % | n/a | n/a | $ | 50,084 | 5.00 | % | ||||||||||||||||||||||||||||||||||||||||||||||||||||||
TheWe currently hold $24.0 million from our May 2017 public offering. Historically, our principal source of cash for the Holding Company ishas been dividends from the Bank. Dividendsreceived from the Bank, which are subject to the Holding Company are restricted under California law to the lesser ofgovernment regulation and limitations on the Bank’s retained earnings or the Bank’s net income for the latest three fiscal years, lessability to pay dividends. We also have trust preferred securities, senior debt and subordinated debt agreements have provisions that may impact our ability to pay dividends previously declared during that period. With the approval of the CDBO, the dividend restriction can be expandedon our common stock to the greatest of the retained earnings of the Bank, the net income of the Bank for its last fiscal year, or the net income of the Bank for its current fiscal year. Also with the prior approval of the CDBO and the shareholders of the Bank, the Bank may make a distribution to its shareholders, as a reduction in capital of the Bank.
In the event that the Commissioner of the CDBO determines that the shareholders' equity of a bank is inadequate or that the making of a distribution by a bank would be unsafe or unsound, the Commissioner may order a bank to refrain from making such a proposed distribution.our common shareholders.
The Bank is subject to certain restrictions under the Federal Reserve Act, including restrictions on the extension of credit to affiliates. In particular, it is prohibited from lending to an affiliated company unless the loans are secured by specific types of collateral. Such secured loans and other advances from the subsidiaries are limited to 10% of the Bank’s Tier 1 and Tier 2 capital.
BANK OF COMMERCE HOLDINGS & SUBSIDIARIES
Notes There were no loans to Consolidated Financial Statementsaffiliates during the three years ended December 31, 2017.
NOTE 22.21. DERIVATIVES
During 2015 and the first quarter March of 2016, we utilized interest rate swaps (the “hedging instrument”) with another major financial institutions (counterparty) to hedge interest expenses associated with certain Federal Home Loan Bank of San Francisco borrowings (the “hedged instrument”). We do not use derivative instruments for trading or speculative purposes.
During March of 2016, we paid off the $75.0$75.0 million Federal Home Loan Bank of San Francisco borrowing (the “hedged instrument”) and terminated all of our interest rate swaps (active and forward starting). Prior to the time of termination, a $2.3$2.3 million unrealized pretax loss on swaps was carried inOtherLiabilitiesin ourConsolidated Balance Sheets.At termination, we immediately reclassified the loss to noninterest expense.
BANK OF COMMERCE HOLDINGS & SUBSIDIARIES
Notes to Consolidated Financial Statements
For derivative financial instruments accounted for as hedging instruments, we formally designate and document, at inception,inception, the financial instrument as a hedge of a specific underlying exposure, the risk management objective, and the manner in which the effectiveness of the hedge will be assessed. We formally assess both at inception and at each reporting period thereafter, whether the derivative financial instruments used in hedging transactions are effective in offsetting changes in cash flows of the related underlying exposures. Any ineffective portion of the changes in cash flow of the instruments is recognized immediately into earnings.
ASC 815-10,815-10,Derivatives and Hedging (“ASC 815”) requires companies to recognize all derivative instruments as assets or liabilities at fair value in theConsolidated Balance Sheets.Sheets. In accordance with ASC 815, we designated our interest rate swaps as cash flow hedges of certain active and forecasted variable rate Federal Home Loan Bank of San Francisco advances. Changes in the fair value of the hedging instrument, except any ineffective portion, arewere recorded in accumulated other comprehensive income (loss) until earnings arewere impacted by the hedged instrument. No components of our hedging instruments arewere excluded from the assessment of hedge effectiveness in hedging exposure to variability in cash flows.
Classification of the gain or loss in theConsolidatedStatements of Income upon release from accumulated other comprehensive income (loss) is the same as that of the underlying exposure. We discontinue the use of hedge accounting prospectively when (1)(1) the derivative instrument is no longer effective in offsetting changes in fair value or cash flows of the underlying hedged item; (2)(2) the derivative instrument expires, is sold, terminated, or exercised; or (3)(3) designating the derivative instrument as a hedge is no longer appropriate. When we discontinue hedge accounting because it is no longer probable that an anticipated transaction will occur in the originally expected period, or within an additional two-monthtwo-month period thereafter, changes to fair value that were recorded in accumulated other comprehensive income (loss) are recognized immediately in earnings.earnings.
The following table summarizes our interest rate swap contracts with counterparties outstanding at the losses recorded during the years ended December 31, 2015. The interest rate swap contracts were made with a single issuer 2016 and included2015 and their locations within the rightConsolidated Statements of offset.Income.
(Amounts in thousands) | |||||||||||||||||||||||||
Description | We Pay Fixed | We Receive Variable (1) | Notional Amount | Effective Date | Maturity Date | Consolidated Statement of Operations | 2016 | 2015 | |||||||||||||||||
Interest rate swap | 2.64 | % | 0.33 | % | $ | 75,000 | August 3, 2015 | August 1, 2016 | Interest on term debt | $ | 396 | $ | 1,435 | ||||||||||||
Forward starting interest rate swap | 3.22 | % | Variable | $ | 75,000 | August 1, 2016 | August 1, 2017 | ||||||||||||||||||
Forward starting interest rate swap - terminated (2) | Other noninterest expense | 2,325 | — | ||||||||||||||||||||||
Total | Total | $ | 2,721 | $ | 1,435 | ||||||||||||||||||||
(1) |
The following table individually lists the active and forward starting interest rate swap derivatives that were in a liability (loss) position and the fair value of such derivatives at December 31, 2016, and December 31, 2015. There were no interest rate swap derivatives that were in an asset (gain) position at December 31, 2016, or at December 31, 2015.
(Amounts in thousands) | Liability Derivatives | |||||||||
December 31, | ||||||||||
Description | Balance Sheet Location | 2016 | 2015 | |||||||
Interest rate swap | Cash flow hedge | — | 869 | |||||||
Forward starting interest rate swap | Cash flow hedge | — | 1,500 | |||||||
Total | $ | — | $ | 2,369 | ||||||
BANK OF COMMERCE HOLDINGS & SUBSIDIARIES
Notes to Consolidated Financial Statements
The following table summarizes the (gains) losses recorded during the years ended December 31, 2016, 2015 and 2014 and their locations within theConsolidatedStatements of Income.
(Amounts in thousands) | December 31, | |||||||||||||
Description | Consolidated Statement of Operations | 2016 | 2015 | 2014 | ||||||||||
Interest rate swap(1) | Interest on term debt | $ | 396 | $ | 1,435 | $ | — | |||||||
Forward starting interest rate swap - terminated (2) | Other noninterest expense (Interest on term debt) | 2,325 | — | (283 | ) | |||||||||
Forward starting interest rate swaps (3) | Other noninterest (income) | — | — | (1,617 | ) | |||||||||
Total | $ | 2,721 | $ | 1,435 | $ | (1,900 | ) | |||||||
(1)Losses represent tax effected amounts reclassified from accumulated other comprehensive income pertaining to net settlement recorded during the period on active interest rate swaps.(2)Gains represent tax effected amounts reclassified from accumulated other comprehensive income pertaining to the terminated forward starting interest rate swap.(3)Gains represent tax effected amounts reclassified from accumulated other comprehensive income immediately upon cancellation of forecasted Federal Home Loan Bank of San Francisco borrowings.
The following table summarizes the gains and (losses) on all derivative instruments (active and forward starting) designated as cash flow hedges recorded in accumulated other comprehensive income (loss) and reclassified into earnings during the years ended December 31, 2016 2015 and 2014.2015.
(Amounts in thousands) | December 31, | December 31, | ||||||||||||||||||
Description | 2016 | 2015 | 2014 | 2016 | 2015 | |||||||||||||||
Interest rate swaps | $ | (1,601 | ) | $ | (843 | ) | $ | 1,118 | $ | (1,601 | ) | $ | (843 | ) | ||||||
The following table summarizes the derivatives that had a right of offset at December 31, 2015.
Gross Amounts Not Offset In The Consolidated Balance Sheets | ||||||||||||||||||||
(Amounts in thousands) | Gross Amounts of Recognized Assets / (Liabilities) | Gross Amounts Offset In The Consolidated Balance Sheets | Net Amounts of Assets / (Liabilities) Presented In The Consolidated Balance Sheets | Collateral Posted | Net Amount | |||||||||||||||
December 31, 2015 | ||||||||||||||||||||
Derivative Liabilities | ||||||||||||||||||||
Interest rate swaps | $ | (2,369 | ) | $ | — | $ | (2,369 | ) | $ | 4,008 | $ | 1,639 | ||||||||
Derivative financial instruments contain an element of credit risk if counterparties are unable to meet the terms of the contract. Credit risk associated with derivative financial instruments is measured as the net replacement cost should the counterparties fail to perform under the terms of those contracts. Assuming no recoveries of underlying collateral, credit risk is measured by the market value of the derivative financial instrument.
The contracts with the derivative counterparties contain a provision where if we fail to maintain our status as a well/adequately capitalized institution, then the counterparty could terminate the derivative positions and we would be required to settle our obligations under the agreements. Similarly, we could be required to settle our obligations under certain of our agreements if specific regulatory events occur, such as if we were issued a prompt corrective action directive or a cease and desist order, or if certain regulatory ratios fall below specified levels.
We were required to post collateral against the obligations of $2.4 million at December 31, 2015. Accordingly, we pledged three mortgage backed securities with an aggregate par value of $3.8 million and an aggregate fair value of $4.0 million. In March of 2016, upon termination of all of our interest rate swaps the securities were returned to us.
BANK OF COMMERCE HOLDINGS & SUBSIDIARIES
Notes to Consolidated Financial Statements
NOTE 22. FAIR VALUES
NOTE 23. FAIR VALUES
Estimated fair values are disclosed for financial instruments for which it is practicable to estimate fair value. These estimates are made at a specific point in time based on relevant market data and information about the financial instruments. These estimates do not reflect any premium or discount that could result from offering our entire holdings of a particular financial instrument for sale at one time, nor do they attempt to estimate the value of anticipated future business related to the instruments. In addition, the tax ramifications related to the realization of unrealized gains and losses can have a significant effect on fair value estimates and have not been considered in any of these estimates.
The following table presents estimated fair values of our financial instruments as of December 31, 2016 2017 and 2015,2016, whether or not recognized or recorded at fair value in theConsolidated Balance Sheets.Sheets. The table indicates the fair value hierarchy of the valuation techniques we utilized to determine such fair value.
Non-financial assets and non-financial liabilities defined by the FASB ASC 820,Fair Value Measurement,, such as Bank premises and equipment, deferred taxes and other liabilities are excluded from the table. In addition, we have not disclosed the fair value of financial instruments specifically excluded from disclosure requirements of FASB ASC 825,Financial Instruments,, such as bank-owned life insurance policies.
(Amounts in thousands) | Carrying | Fair Value Measurements Using | Carrying | Fair Value Measurements Using | ||||||||||||||||||||||||||||||||
December 31, 2016 | Amounts | Level 1 | Level 2 | Level 3 | Total | |||||||||||||||||||||||||||||||
December 31, 2017 | Amounts | Level 1 | Level 2 | Level 3 | ||||||||||||||||||||||||||||||||
Financial assets | ||||||||||||||||||||||||||||||||||||
Cash and cash equivalents | $ | 68,407 | $ | 68,407 | $ | — | $ | — | $ | 68,407 | $ | 66,970 | $ | 66,970 | $ | — | $ | — | ||||||||||||||||||
Securities available-for-sale | $ | 175,174 | $ | — | $ | 175,174 | $ | — | $ | 175,174 | $ | 267,954 | $ | — | $ | 267,954 | $ | — | ||||||||||||||||||
Securities held-to-maturity | $ | 31,187 | $ | — | $ | 31,374 | $ | — | $ | 31,374 | ||||||||||||||||||||||||||
Net loans | $ | 793,991 | $ | — | $ | — | $ | 797,114 | $ | 797,114 | $ | 869,620 | $ | — | $ | — | $ | 873,660 | ||||||||||||||||||
Federal Home Loan Bank of San Francisco stock | $ | 4,465 | $ | 4,465 | $ | — | $ | — | $ | 4,465 | $ | 4,536 | $ | 4,536 | $ | — | $ | — | ||||||||||||||||||
Financial liabilities | ||||||||||||||||||||||||||||||||||||
Deposits | $ | 1,004,666 | $ | — | $ | 1,004,729 | $ | — | $ | 1,004,729 | $ | 1,102,732 | $ | — | $ | 1,101,523 | $ | — | ||||||||||||||||||
Term Debt | $ | 18,733 | $ | — | $ | 18,726 | $ | — | $ | 18,726 | $ | 16,958 | $ | — | $ | 16,918 | $ | — | ||||||||||||||||||
Junior subordinated debenture | $ | 10,310 | $ | — | $ | 9,077 | $ | — | $ | 9,077 | $ | 10,310 | $ | — | $ | 10,206 | $ | — | ||||||||||||||||||
(Amounts in thousands) | Carrying | Fair Value Measurements Using | ||||||||||||||
December 31, 2016 | Amounts | Level 1 | Level 2 | Level 3 | ||||||||||||
Financial assets | ||||||||||||||||
Cash and cash equivalents | $ | 68,407 | $ | 68,407 | $ | — | $ | — | ||||||||
Securities available-for-sale | $ | 175,174 | $ | — | $ | 175,174 | $ | — | ||||||||
Securities held-to-maturity | $ | 31,187 | $ | — | $ | 31,374 | $ | — | ||||||||
Net loans | $ | 793,991 | $ | — | $ | — | $ | 797,144 | ||||||||
Federal Home Loan Bank of San Francisco stock | $ | 4,465 | $ | 4,465 | $ | — | $ | — | ||||||||
Financial liabilities | ||||||||||||||||
Deposits | $ | 1,004,666 | $ | — | $ | 1,004,429 | $ | — | ||||||||
Term Debt | $ | 18,733 | $ | — | $ | 18,726 | $ | — | ||||||||
Junior subordinated debenture | $ | 10,310 | $ | — | $ | 9,077 | $ | — | ||||||||
(Amounts in thousands) | Carrying | Fair Value Measurements Using | ||||||||||||||||||
December 31, 2015 | Amounts | Level 1 | Level 2 | Level 3 | Total | |||||||||||||||
Financial assets | ||||||||||||||||||||
Cash and cash equivalents | $ | 51,192 | $ | 51,192 | $ | — | $ | — | $ | 51,192 | ||||||||||
Securities available-for-sale | $ | 159,030 | $ | — | $ | 159,030 | $ | — | $ | 159,030 | ||||||||||
Securities held-to-maturity | $ | 35,899 | $ | — | $ | 36,645 | $ | — | $ | 36,645 | ||||||||||
Net loans | $ | 706,329 | $ | — | $ | — | $ | 711,528 | $ | 711,528 | ||||||||||
Federal Home Loan Bank of San Francisco stock | $ | 4,465 | $ | 4,465 | $ | — | $ | — | $ | 4,465 | ||||||||||
Financial liabilities | ||||||||||||||||||||
Deposits | $ | 803,735 | $ | — | $ | 804,490 | $ | — | $ | 804,490 | ||||||||||
Term Debt | $ | 94,694 | $ | — | $ | 94,694 | $ | — | $ | 94,694 | ||||||||||
Junior subordinated debenture | $ | 10,310 | $ | — | $ | 5,402 | $ | — | $ | 5,402 | ||||||||||
Derivatives | $ | 2,369 | $ | — | $ | 2,369 | $ | — | $ | 2,369 | ||||||||||
BANK OF COMMERCE HOLDINGS & SUBSIDIARIESFair Value Hierarchy
Notes to Consolidated Financial Statements
Fair Value Hierarchy
Level 1 valuations utilize quoted prices (unadjusted) in active markets for identical assets or liabilities that we have the ability to access.
Level 2 valuations utilize inputs other than quoted prices included in Level 1 that are observable for the asset or liability, either directly or indirectly. Level 2 valuations include quoted prices for similar assets and liabilities in active markets, and inputs other than quoted prices that are observable for the asset or liability, such as interest rates and yield curves that are observable at commonly quoted intervals.
Level 3 valuations are unobservable inputs for the asset or liability, and include situations where there is little, if any, market activity for the asset or liability. Valuation is generated from model-based techniques that use significant assumptions not observable in the market. These unobservable assumptions reflect estimates of assumptions that market participants would use in pricing the asset or liability. Valuation techniques include the use of option pricing models, discounted cash flow models and similar techniques.
In certain cases, the inputs used to measure fair value may fall into different levels of the fair value hierarchy. In such cases, the level in the fair value hierarchy within which the fair value measurement in its entirety falls has been determined based on the lowest level input that is significant to the fair value measurement in its entirety.
We maximize the use of observable inputs and minimize the use of unobservable inputs when developing fair value measurements. Our assessment of the significance of a particular input to the fair value measurement in its entirety requires judgment, and considers factors specific to the asset or liability.
The following methods and assumptions were used to estimate the fair value of each class of financial instrument for which it is practical to estimate that value:
Cash and Cash Equivalents – The carrying amounts reported in theConsolidated Balance Sheets for cash and cash equivalents are a reasonable estimate of fair value. The carrying amount is a reasonable estimate of fair value because of the relatively short termshort-term between the origination of the instrument and its expected realization. Therefore, we believe the measurement of fair value of cash and cash equivalents is derived from Level 1 inputs.
BANK OF COMMERCE HOLDINGS & SUBSIDIARIES
Notes to Consolidated Financial Statements
Securities – Investment securities fair values are based on quoted market prices, where available, and are classified as Level 1. If quoted market prices are not available, fair values are estimated using quoted market prices or matrix pricing, which is a mathematical technique, used widely by the industry that relies on the securities relationship to other benchmark securities, and are classified as Level 2.
Net Loans– For variable rate loans that re-price frequently and with no significant change in credit risk, fair values are based on carrying values. For fixed rate loans, projected cash flows are discounted back to their present value based on specific risk adjusted spreads to the U.S. Treasury Yield Curve, with the rate determined based on the timing of the cash flows. The ALLL is considered to be a reasonable estimate of loan discount for credit quality concerns. Given that there are commercial loans with specific terms that are not readily available; we believe the fair value of loans is derived from Level 3 inputs.
Federal Home Loan Bank of San Francisco stock –The carrying value of Federal Home Loan Bank of San Francisco stock approximates fair value as the shares can only be redeemed by the issuing institution at par. We measure the fair value of Federal Home Loan Bank of San Francisco stock using Level 1 inputs.
Deposits– We measure fair value of maturing deposits using Level 2 inputs. The fair values of deposits were derived by discounting their expected future cash flows based on the Federal Home Loan Bank of San Francisco yield curves, and maturities. We obtained Federal Home Loan Bank of San Francisco yield curve rates as of the measurement date, and believe these inputs fall under Level 2 of the fair value hierarchy. Deposits with no defined maturities, the fair values are the amounts payable on demand at the respective reporting date.
Term Debt –For variable rate term debt, the carrying value approximates fair value. The fair value of fixed rate term debt is estimated by discounting the future cash flows using market rates at the reporting date, of which similar debt would be issued with similar credit ratings as ours and similar remaining maturities. At December 31, 2017, future cash flows were discounted at 7.29%.We measure the fair value of term debt using Level 2 inputs.
Junior subordinated debenture– The fair value of the junior subordinated debenture is estimated by discounting the future cash flows using market rates at the reporting date, of which similar debentures would be issued with similar credit ratings as ours and similar remaining maturities. At December 31, 2016, 2017, future cash flows were discounted at 2.37%3.34%. We measure the fair value of subordinated debentures using Level 2 inputs.
BANK OF COMMERCE HOLDINGS & SUBSIDIARIES
Notes to Consolidated Financial Statements
Commitments – Loan commitments and standby letters of credit generate ongoing fees, which are recognized over the term of the commitment period. In situations where the borrower’s credit quality has declined, we record a reserve for these unfunded commitments. Given the uncertainty in the likelihood and timing of a commitment being drawn upon, a reasonable estimate of the fair value of these commitments is the carrying value of the related unamortized loan fees plus the reserve, which is not material. As such, no disclosures are made on the fair value of commitments.
We use fair value measurements to record fair value adjustments to certain assets and liabilities and to determine fair value disclosures. Available-for-sale securities and derivatives are recorded at fair value on a recurring basis. From time to time, we may be required to record at fair value other assets on a nonrecurring basis, such as collateral dependent impaired loans and certain other assets including OREO, core deposit intangibles or goodwill. These nonrecurring fair value adjustments involve the application of lower of cost or fair value accounting or write-downs of individual assets.
The following table presents information about our assets and liabilities measured at fair value on a recurring basis, and indicate the fair value hierarchy of the valuation techniques we utilized to determine such fair value, as of December 31, 2017 and December 31, 2016 and December 31, 2015.2016.
(Amounts in thousands) | Fair Value at December 31, 2016 | Fair Value at December 31, 2017 | ||||||||||||||||||||||||||||||
Recurring Basis | Total | Level 1 | Level 2 | Level 3 | Total | Level 1 | Level 2 | Level 3 | ||||||||||||||||||||||||
Available-for-sale securities | ||||||||||||||||||||||||||||||||
U.S. government and agencies | $ | 40,369 | $ | — | $ | 40,369 | $ | — | ||||||||||||||||||||||||
Obligations of states and political subdivisions | $ | 59,428 | — | $ | 59,428 | $ | — | 78,844 | — | 78,844 | — | |||||||||||||||||||||
Residential mortgage backed securities and collateralized mortgage obligations | 69,604 | — | 69,604 | — | ||||||||||||||||||||||||||||
Residential mortgage-backed securities and collateralized mortgage obligations | 114,592 | — | 114,592 | — | ||||||||||||||||||||||||||||
Corporate securities | 16,116 | — | 16,116 | — | 4,992 | — | 4,992 | — | ||||||||||||||||||||||||
Commercial mortgage backed securities | 15,514 | — | 15,514 | — | ||||||||||||||||||||||||||||
Commercial mortgage-backed securities | 26,641 | — | 26,641 | — | ||||||||||||||||||||||||||||
Other investment securities(1) | 14,512 | — | 14,512 | — | 2,516 | — | 2,516 | — | ||||||||||||||||||||||||
Total assets measured at fair value | $ | 175,174 | $ | — | $ | 175,174 | $ | — | $ | 267,954 | $ | — | $ | 267,954 | $ | — | ||||||||||||||||
(1) Principally consists of asset backed securities and CRA qualified mutual fund investments. |
BANK OF COMMERCE HOLDINGS & SUBSIDIARIES
Notes to Consolidated Financial Statements
(Amounts in thousands) | Fair Value at December 31, 2016 | |||||||||||||||
Recurring Basis | Total | Level 1 | Level 2 | Level 3 | ||||||||||||
Available-for-sale securities | ||||||||||||||||
U.S. government and agencies | $ | 10,354 | $ | — | $ | 10,354 | $ | — | ||||||||
Obligations of states and political subdivisions | 59,428 | — | 59,428 | — | ||||||||||||
Residential mortgage-backed securities and collateralized mortgage obligations | 69,604 | — | 69,604 | — | ||||||||||||
Corporate securities | 16,116 | — | 16,116 | — | ||||||||||||
Commercial mortgage-backed securities | 15,514 | — | 15,514 | — | ||||||||||||
Other investment securities (1) | 4,158 | — | 4,158 | — | ||||||||||||
Total assets measured at fair value | $ | 175,174 | $ | — | $ | 175,174 | $ | — | ||||||||
(1) Principally consists of asset backed securities and CRA qualified mutual fund investments. |
(Amounts in thousands) | Fair Value at December 31, 2015 | |||||||||||||||
Recurring Basis | Total | Level 1 | Level 2 | Level 3 | ||||||||||||
Available-for-sale securities | ||||||||||||||||
U.S. government and agencies | $ | 3,943 | $ | — | $ | 3,943 | $ | — | ||||||||
Obligations of states and political subdivisions | 61,104 | — | 61,104 | — | ||||||||||||
Residential mortgage backed securities and collateralized mortgage obligations | 32,137 | — | 32,137 | — | ||||||||||||
Corporate securities | 33,778 | — | 33,778 | — | ||||||||||||
Commercial mortgage backed securities | 12,769 | — | 12,769 | — | ||||||||||||
Other investment securities (1) | 15,299 | — | 15,299 | — | ||||||||||||
Total assets measured at fair value | $ | 159,030 | $ | — | $ | 159,030 | $ | — | ||||||||
Derivatives – interest rate swaps | $ | 2,369 | $ | — | $ | 2,369 | $ | — | ||||||||
Total liabilities measured at fair value | $ | 2,369 | $ | — | $ | 2,369 | $ | — | ||||||||
(1) Principally consists of residential mortgage backed securities issued by both by governmental and nongovernmental agencies, and SBA pool securities.Recurring Items
Recurring Items
InvestmentDebt Securities –The available-for-sale securities amount in the recurring fair value table above represents securities that have been adjusted to their fair values. For these securities, we obtain fair value measurements from an independent pricing service. The fair value measurements consider observable data that may include dealer quotes, market spreads, cash flows, the U.S. Treasury yield curve, live trading levels, trade execution data, market consensus prepayment speeds, credit information and the bond’s terms and conditions among other things. We have determined that the source of these fair values falls within Level 2 of the fair value hierarchy.
BANK OF COMMERCE HOLDINGS & SUBSIDIARIES
Notes to Consolidated Financial Statements
Forward starting interest rate swaps –The valuation of our interest rate swaps was obtained from third party pricing services. The fair values of the interest rate swaps were determined by using a discounted cash flow analysis on the expected cash flows of each derivative. The pricing analysis was based on observable inputs for the contractual terms of the derivatives, including the period to maturity and interest rate curves. We have determined that the source of these derivatives’ fair values falls within Level 2 of the fair value hierarchy.
Transfers Between Fair Value Hierarchy Levels
Transfers between levels of the fair value hierarchy are recognized on the actual date of the event or circumstance that caused the transfer. There were no transfers between levels of the fair value hierarchy during the years ended December 31, 2016 2017 or 2015.2016.
Assets and Liabilities Recorded at Fair Value on a Nonrecurring Basis
We may be required, from time to time, to measure certain assets at fair value on a nonrecurring basis. These adjustments to fair value generally result from the application of lower of cost or fair value accounting or write-downs of individual assets due to impairment. The following three tables present information about our assets and liabilities at December 31, 2017 and December 31, 2016 and December 31, 2015 measured at fair value on a nonrecurring basis for which a nonrecurring change in fair value has been recorded during the reporting period.
The amounts disclosed below present the fair values at the time the nonrecurring fair value measurements were made, and not necessarily the fair values as of the date reported upon.
(Amounts in thousands) | Fair Value at December 31, 2016 | Fair Value at December 31, 2017 | ||||||||||||||||||||||||||||||
Nonrecurring basis | Total | Level 1 | Level 2 | Level 3 | Total | Level 1 | Level 2 | Level 3 | ||||||||||||||||||||||||
Collateral dependent impaired loans | $ | 1,587 | $ | — | $ | — | $ | 1,587 | $ | 60 | $ | — | $ | — | $ | 60 | ||||||||||||||||
Other real estate owned | 219 | — | — | 219 | 35 | — | — | 35 | ||||||||||||||||||||||||
Total assets measured at fair value | $ | 1,806 | $ | — | $ | — | $ | 1,806 | $ | 95 | $ | — | $ | — | $ | 95 | ||||||||||||||||
(Amounts in thousands) | Fair Value at December 31, 2015 | |||||||||||||||
Nonrecurring basis | Total | Level 1 | Level 2 | Level 3 | ||||||||||||
Collateral dependent impaired loans | $ | 707 | $ | — | $ | — | $ | 707 | ||||||||
Other real estate owned | 743 | — | — | 743 | ||||||||||||
Total assets measured at fair value | $ | 1,450 | $ | — | $ | — | $ | 1,450 | ||||||||
The following table presents the losses resulting from nonrecurring fair value adjustments for the years ended December 31, 2016, 2015 and 2014.
(Amounts in thousands) | December 31, | |||||||||||
Fair value adjustments | 2016 | 2015 | 2014 | |||||||||
Collateral dependent impaired loans | $ | 1,183 | $ | 476 | $ | 2,216 | ||||||
Other real estate owned | 77 | 197 | 42 | |||||||||
Total | $ | 1,260 | $ | 673 | $ | 2,258 | ||||||
For the year ended December 31, 2016 collateral dependent impaired loans with a carrying amount of $2.8 million were written down to their fair value of $1.6 million resulting in a $1.2 million adjustment to the ALLL.
For the year ended December 31, 2016, five properties are included in the OREO balance with an aggregate carrying value of $296 thousand that were written down to fair value of $219 thousand, resulting in a $77 thousand adjustment to ALLL.
(Amounts in thousands) | Fair Value at December 31, 2016 | |||||||||||||||
Nonrecurring basis | Total | Level 1 | Level 2 | Level 3 | ||||||||||||
Collateral dependent impaired loans | $ | 1,587 | $ | — | $ | — | $ | 1,587 | ||||||||
Other real estate owned | 219 | — | — | 219 | ||||||||||||
Total assets measured at fair value | $ | 1,806 | $ | — | $ | — | $ | 1,806 | ||||||||
BANK OF COMMERCE HOLDINGS & SUBSIDIARIES
Notes to Consolidated Financial Statements
The following table presents the losses resulting from nonrecurring fair value adjustments for the years ended December 31, 2017, 2016 and 2015 related to assets outstanding at December 31, 2017, 2016, and 2015.
(Amounts in thousands) | December 31, | |||||||||||
Fair value adjustments | 2017 | 2016 | 2015 | |||||||||
Collateral dependent impaired loans | $ | 20 | $ | 1,183 | $ | 476 | ||||||
Other real estate owned | 38 | 77 | 197 | |||||||||
Total | $ | 58 | $ | 1,260 | $ | 673 | ||||||
For the year ended December 31, 2017 collateral dependent impaired loans with a carrying amount of $80 thousand were written down to their fair value of $60 thousand resulting in a $20 thousand adjustment to the ALLL.
For the year ended December 31, 2017, one property is included in the OREO balance with an aggregate carrying value of $73 thousand that was written down to fair value of $35 thousand, resulting in a $38 thousand adjustment to ALLL.
The loan amounts above represent impaired, collateral dependent loans that have been adjusted to fair value during the respective reporting period. When we identify a collateral dependent loan as impaired, we measure the impairment using the current fair value of the collateral, less selling costs. Depending on the characteristics of a loan, the fair value of collateral is generally estimated by obtaining external appraisals. If we determine that the value of the impaired loan is less than the recorded investment in the loan, we recognize this impairment and adjust the carrying value of the loan to fair value through the ALLL.
The loss represents charge-offs or impairments on collateral dependent loans for fair value adjustments based on the fair value of collateral less estimated selling costs. The carrying value of loans fully charged off is zero. When the fair value of the collateral is based on a current appraised value, or management determines the fair value of the collateral is further impaired below the appraised value and there is no observable market price, we record the impaired loan as nonrecurring Level 3.
The OREO amount above represents impaired real estate that has been adjusted to fair value during the respective reporting period. The loss represents impairments on OREO for fair value adjustments based on the fair value of the real estate. The determination of fair value is based on recent appraisals of the foreclosed properties, which take into account recent sales prices adjusted for unobservable inputs, such as opinions provided by local real estate brokers and other real estate experts. OREO fair values are adjusted for estimated selling costs between 8% and 15%34%. We record OREO as a nonrecurring Level 3.
Limitations – Fair value estimates are made at a specific point in time, based on relevant market information and other information about the financial instrument. These estimates do not reflect any premium or discount that could result from offering for sale at one time, our entire holdings of a particular financial instrument. Because no market exists for a significant portion of our financial instruments, fair value estimates are based on judgments regarding future expected loss experience, current economic conditions, risk characteristics of various financial instruments, and other factors. These estimates are subjective in nature, involve uncertainties and matters of significant judgment, and therefore cannot be determined with precision. Changes in assumptions could significantly affect the estimates.
Fair value estimates are based on current on and off-balance sheet financial instruments without attempting to estimate the value of anticipated future business and the value of assets and liabilities that are not considered financial instruments. Other significant assets and liabilities that are not considered financial assets or liabilities include deferred tax assets and liabilities, and property, plant and equipment. In addition, the tax ramifications related to the realization of the unrealized gains and losses can have a significant effect on fair value estimates and have not been considered in any of the estimates.
BANK OF COMMERCE HOLDINGS & SUBSIDIARIES
Notes to Consolidated Financial Statements
NOTE24.23. INCOME TAXES
The following table presents components of income tax expense included in theConsolidated Statements of Income for each of the past three years.
(Amounts in thousands) | Current | Deferred | Total | Current | Deferred | Total | ||||||||||||||||||
Year ended December 31, 2017: | ||||||||||||||||||||||||
Federal | $ | 2,005 | $ | 2,837 | $ | 4,842 | ||||||||||||||||||
State | 1,474 | (76 | ) | 1,398 | ||||||||||||||||||||
Affordable housing partnership amortization | 688 | — | 688 | |||||||||||||||||||||
| $ | 4,167 | $ | 2,761 | $ | 6,928 | |||||||||||||||||||
Year ended December 31, 2016: | ||||||||||||||||||||||||
Federal | $ | 283 | $ | 409 | $ | 692 | $ | 283 | $ | 409 | $ | 692 | ||||||||||||
State | 582 | 86 | 668 | 582 | 86 | 668 | ||||||||||||||||||
Affordable housing partnership amortization | 598 | — | 598 | 598 | — | 598 | ||||||||||||||||||
| $ | 1,463 | $ | 495 | $ | 1,958 | $ | 1,463 | $ | 495 | $ | 1,958 | |||||||||||||
Year ended December 31, 2015: | ||||||||||||||||||||||||
Federal | $ | 1,183 | $ | 509 | $ | 1,692 | $ | 1,183 | $ | 509 | $ | 1,692 | ||||||||||||
State | 981 | 75 | 1,056 | 981 | 75 | 1,056 | ||||||||||||||||||
Affordable housing partnership amortization | 714 | — | 714 | 714 | — | 714 | ||||||||||||||||||
| $ | 2,878 | $ | 584 | $ | 3,462 | |||||||||||||||||||
Year ended December 31, 2014: | ||||||||||||||||||||||||
Federal | $ | 617 | $ | (414 | ) | $ | 203 | |||||||||||||||||
State | 391 | 83 | 474 | |||||||||||||||||||||
Affordable housing partnership amortization | 903 | — | 903 | |||||||||||||||||||||
Total | $ | 1,911 | $ | (331 | ) | $ | 1,580 | $ | 2,878 | $ | 584 | $ | 3,462 | |||||||||||
Our effective tax rate is derived from provision for income taxes divided by income before provision for income taxes. Income tax expense attributable to income before income taxes differed from the amounts computed by applying the U.S. federal income tax rate of 34% to income before income taxes.
The following table presents a reconciliation of income taxes computed at the federal statutory rate to the actual effective rate for the years ended December 31, 2017, 2016, 2015, and 2014.2015.
2016 | 2015 | 2014 | 2017 | 2016 | 2015 | |||||||||||||||||||
Income tax at the federal statutory rate | 34.00 | % | 34.00 | % | 34.00 | % | 34.00 | % | 34.00 | % | 34.00 | % | ||||||||||||
Deferred tax asset write-off | 5.02 | % | — | % | — | % | ||||||||||||||||||
Deferred tax asset write-down | 17.45 | % | 5.02 | % | — | % | ||||||||||||||||||
State franchise tax, net of federal tax benefit | 6.11 | % | 5.79 | % | 4.89 | % | 6.46 | % | 6.11 | % | 5.79 | % | ||||||||||||
Amortization of affordable housing credit partnerships | 8.11 | % | 5.91 | % | 11.04 | % | 4.82 | % | 8.11 | % | 5.91 | % | ||||||||||||
Officer life insurance | (2.89 | )% | (1.81 | )% | (3.34 | )% | (2.50 | %) | (2.89 | %) | (1.81 | %) | ||||||||||||
Tax-exempt interest | (5.23 | %) | (10.85 | %) | (8.02 | %) | ||||||||||||||||||
Affordable housing credits and benefits | (11.69 | )% | (6.42 | )% | (11.67 | )% | (5.68 | %) | (11.69 | %) | (6.42 | %) | ||||||||||||
Tax-exempt interest | (10.85 | )% | (8.02 | )% | (13.46 | )% | ||||||||||||||||||
Other | (0.68 | )% | (0.71 | )% | 0.16 | % | (0.78 | %) | (0.68 | %) | (0.71 | %) | ||||||||||||
Effective Tax Rate | 27.13 | % | 28.74 | % | 21.62 | % | 48.54 | % | 27.13 | % | 28.74 | % | ||||||||||||
For the year ended December 31, 2017, our income tax provision of $6.9 million on pre-tax income of $14.3 million was an effective tax rate of 48.5%. The income tax provision was composed of a $2.5 million write-down of our deferred tax assets and a $4.4 million tax provision on pre-tax net operating income of $14.3 million (30.8%). The $2.5 million write-down occurred when we revalued our deferred tax assets and liabilities to account for the future impact of lower corporate tax rates from a graduated rate of 35% to a flat rate of 21% resulting from the Tax Cuts and Jobs Act enacted on December 22, 2017.
BANK OF COMMERCE HOLDINGS & SUBSIDIARIES
Notes to Consolidated Financial Statements
The following table reflects the effects of temporary differences that give rise to the components of the net deferred tax asset as of December 31, 2016 2017 and 2015.2016.
(Amounts in thousands) | 2016 | 2015 | 2017 | 2016 | ||||||||||||
Deferred tax assets: | ||||||||||||||||
Loan and lease loss reserves | $ | 4,751 | $ | 4,601 | $ | 3,526 | $ | 4,751 | ||||||||
Deferred compensation | 3,285 | 3,293 | 2,365 | 3,285 | ||||||||||||
State franchise taxes | 291 | 260 | ||||||||||||||
Branch acquisition costs | 274 | 366 | ||||||||||||||
Unrealized losses other comprehensive income | 553 | 973 | 134 | 553 | ||||||||||||
Branch acquisition costs | 366 | — | ||||||||||||||
Non accrued interest | 341 | 349 | 105 | 341 | ||||||||||||
State franchise taxes | 260 | 428 | ||||||||||||||
Federal tax credits | 525 | 684 | — | 525 | ||||||||||||
Other | 1,093 | 1,639 | 484 | 1,093 | ||||||||||||
Total deferred tax assets | 11,174 | 11,967 | 7,179 | 11,174 | ||||||||||||
Deferred tax liabilities: | ||||||||||||||||
Deferred loan origination costs | (904 | ) | (675 | ) | (619 | ) | (904 | ) | ||||||||
Unrealized gains other comprehensive income | (92 | ) | (789 | ) | — | (92 | ) | |||||||||
Basis difference in fixed assets | (164 | ) | (371 | ) | — | (164 | ) | |||||||||
Other | (472 | ) | (372 | ) | (55 | ) | (472 | ) | ||||||||
Total deferred tax liabilities | (1,632 | ) | (2,207 | ) | (674 | ) | (1,632 | ) | ||||||||
Net deferred tax asset | $ | 9,542 | $ | 9,760 | $ | 6,505 | $ | 9,542 | ||||||||
We have determined that we are not required to establish a valuation allowance for the deferred tax assets as management believes it is more likely than not that the deferred tax assets of $11.2$7.2 million and $12.0$11.2 million at December 31, 2016 2017 and 2015,2016, will be realized principally through future reversals of existing taxable temporary differences. We further believe that future taxable income will be sufficient to realize the benefits of temporary deductible differences that cannot be realized through the reversal of future temporary taxable differences.
We have investments in Qualified Zone Academy Bonds (“QZAB”QZAB”) of $4.7$4.7 million at December 31, 2016 2017 and $2.72016 recorded in Other Assets in the Consolidated Balance Sheets. We also have investments in QZAB of $1.0 million at December 31, 2015.2017 recorded in Securities available-for-sale in the Consolidated Balance Sheets. The investments provide funds for capital improvements at local schools and are repaid at maturity in 2031,2033 and 2033.2046. In exchange for the investment we receive a federal tax credit at a rate determined at the settlement of the investment by the US Treasury. We account for the benefit for these tax credit investments using the deferred cost reduction method.
For the years ended December 31, 2017 and 2016, we expect to carryforward a California capital loss in the following tax credits:amount of $53 thousand which will expire in 2020.
|
|
|
|
See Note 2524Qualified Affordable Housing Partnership Investments in theseNotes to Consolidated Financial Statements, for further details on our affordable housing project investments.
In September of 2016, we filed amended federal and state tax returns for tax years 2011,2012,2013, and 2014. We recognized $41 thousand in other noninterest expense during the year ended December 31, 2017 as interest applied to our amended state tax returns.
Additionally, we have no unrecognized tax benefits at December 31, 2016 2017 and 2015.2016. We recognize interest accrued and penalties related to unrecognized tax benefits in taxother noninterest expense.
We file income tax returns in the U.S. federal jurisdiction, and the State of California. Income tax returns filed are subject to examination by the U.S. federal, state, and local income tax authorities. While no income tax returns are currently being examined, we are no longer subject to tax examination by tax authorities for years prior to fiscal year 20132014 for federal tax returns and fiscal year 20122013 for state and local tax returns.
In September of 2016, we filed amended federal and state tax returns for tax years 2011, 2012, 2013, and 2014. The amendments were filed to properly recognize tax events in years 2011 and 2013, that were improperly recognized in years 2011 through 2014. The IRS rejected the 2011 amended tax return citing the statute for assessment had expired. Accordingly, $988 thousand of taxes due to the taxing authorities pursuant to the 2011 amended federal tax return was returned to us. As of December 31, 2017 we continue to recognize 100% of the tax liability relating to our 2011 amended federal tax return because we believe it is more likely than not, our tax position would be sustained upon reexamination by the IRS or through the litigation process. We do not expect to reconsider or reverse our tax position until the statute of limitations expires on the 2014 amended federal tax return in September of 2018, and until we believe it is more likely than not that the taxes due cannot be recouped. If we reverse our tax position, we will recognize the $988 thousand in our provision for income taxes and our effective tax rate will be reduced.
The following table presents our uncertain tax position at December 31, 2017 and 2016.
(Amounts in thousands) | 2017 | 2016 | ||||||
Balance, beginning of period | $ | 988 | $ | — | ||||
Additions for tax positions related to prior years | — | 988 | ||||||
balance, end of period | $ | 988 | $ | 988 | ||||
BANK OF COMMERCE HOLDINGS & SUBSIDIARIES
Notes to Consolidated Financial StatementsNOTE 2
NOTE254. QUALIFIED AFFORDABLE HOUSINGPARTNERSHIP INVESTMENTS
Our investments in Qualified Affordable Housing Partnerships that generate Low Income Housing Tax Credits (“LIHTC”) and deductible operating losses totaled $4.2$3.5 million at December 31, 2016.2017. These investments are recorded in other assetsOther Assets with a corresponding funding obligation of $485$361 thousand recorded inOther Liabilitiesin ourConsolidated Balance Sheets. We have invested in four separate LIHTC partnerships, which provide the Company with CRA credit. Additionally, the investments in LIHTC partnerships provide us with tax credits and with operating loss tax benefits over an approximately 18 year-year period. None of the original investments will be repaid. The tax credits and the operating loss tax benefits that are generated by each of the properties are expected to exceed the total value of the investments we made and provide returns on the investments of between 5%3% and 8%6%. over the life of the investment. The investments in LIHTC partnerships are being accounted for using the proportional amortization method, under which we amortize the initial cost of an investment in proportion to the amount of the tax credits and other tax benefits received, and recognize the net investment performance in theConsolidated Statements of Income as a component of income tax expense.
BANK OF COMMERCE HOLDINGS & SUBSIDIARIES
Notes to Consolidated Financial Statements
The following table presents our original investment in LIHTC partnerships, the current recorded investment balance, and the unfunded liability balance of each investment at December 31, 2016 2017 and December 31, 2015. 2016. In addition, the table reflects the tax credits and tax benefits, amortization of the investment and the net impact to our income tax provision for the years ended December 31, 2016 2017 and 2015.2016.
At December 31, 2016 | For the year ended December 31, 2016 | At December 31, 2017 | For the year ended December 31, 2017 | |||||||||||||||||||||||||||||||||||||||||||||
Original | Current | Unfunded | Tax Credits | Amortization | Net | Original | Current | Unfunded | Tax Credits | Amortization | Net | |||||||||||||||||||||||||||||||||||||
(Amounts in thousands) | Investment | Recorded | Liability | and | of | Income Tax | Investment | Recorded | Liability | and | of | Income Tax | ||||||||||||||||||||||||||||||||||||
Qualified Affordable Housing Partnerships | Value | Investment | Obligation | Benefits(1) | Investments(2) | Benefit | Value | Investment | Obligation | Benefits | Investments | Benefit | ||||||||||||||||||||||||||||||||||||
Raymond James California Housing Opportunities Fund II | $ | 2,000 | $ | 1,361 | $ | 45 | $ | 227 | $ | 192 | $ | 35 | $ | 2,000 | $ | 1,182 | $ | 20 | $ | 224 | $ | 179 | $ | 45 | ||||||||||||||||||||||||
WNC Institutional Tax Credit Fund 38, L.P. | 1,000 | 698 | 73 | 140 | 100 | 40 | 1,000 | 589 | — | 139 | 108 | 31 | ||||||||||||||||||||||||||||||||||||
Merritt Community Capital Corporation Fund XV, L.P. | 2,500 | 1,713 | 367 | 274 | 106 | 168 | 2,500 | 1,476 | 341 | 271 | 237 | 34 | ||||||||||||||||||||||||||||||||||||
California Affordable Housing Fund | 2,454 | 445 | — | 202 | 200 | 2 | 2,454 | 282 | — | 176 | 164 | 12 | ||||||||||||||||||||||||||||||||||||
Total | $ | 7,954 | $ | 4,217 | $ | 485 | $ | 843 | $ | 598 | $ | 245 | $ | 7,954 | $ | 3,529 | $ | 361 | $ | 810 | $ | 688 | $ | 122 | ||||||||||||||||||||||||
At December 31, 2015 | For the year ended December 31, 2015 | |||||||||||||||||||||||
Original | Current | Unfunded | Tax Credits | Amortization | Net | |||||||||||||||||||
(Amounts in thousands) | Investment | Recorded | Liability | and | of | Income Tax | ||||||||||||||||||
Qualified Affordable Housing Partnerships | Value | Investment | Obligation | Benefits(1) | Investments(2) | Benefit | ||||||||||||||||||
Raymond James California Housing Opportunities Fund II | $ | 2,000 | $ | 1,553 | $ | 406 | $ | 226 | $ | 184 | $ | 42 | ||||||||||||
WNC Institutional Tax Credit Fund 38, L.P. | 1,000 | 797 | 166 | 126 | 93 | 33 | ||||||||||||||||||
Merritt Community Capital Corporation Fund XV, L.P. | 2,500 | 1,820 | 610 | 278 | 230 | 48 | ||||||||||||||||||
California Affordable Housing Fund | 2,454 | 645 | — | 207 | 207 | — | ||||||||||||||||||
Total | $ | 7,954 | $ | 4,815 | $ | 1,182 | $ | 837 | $ | 714 | $ | 123 | ||||||||||||
At December 31, 2016 | For the year ended December 31, 2016 | |||||||||||||||||||||||
Original | Current | Unfunded | Tax Credits | Amortization | Net | |||||||||||||||||||
(Amounts in thousands) | Investment | Recorded | Liability | and | of | Income Tax | ||||||||||||||||||
Qualified Affordable Housing Partnerships | Value | Investment | Obligation | Benefits | Investments | Benefit | ||||||||||||||||||
Raymond James California Housing Opportunities Fund II | $ | 2,000 | $ | 1,361 | $ | 45 | $ | 237 | $ | 192 | $ | 45 | ||||||||||||
WNC Institutional Tax Credit Fund 38, L.P. | 1,000 | 698 | 73 | 143 | 100 | 43 | ||||||||||||||||||
Merritt Community Capital Corporation Fund XV, L.P. | 2,500 | 1,713 | 367 | 266 | 106 | 160 | ||||||||||||||||||
California Affordable Housing Fund | 2,454 | 445 | — | 205 | 200 | 5 | ||||||||||||||||||
Total | $ | 7,954 | $ | 4,217 | $ | 485 | $ | 851 | $ | 598 | $ | 253 | ||||||||||||
BANK OF COMMERCE HOLDINGS & SUBSIDIARIES
Notes to Consolidated Financial Statements
The following table presents our generated tax credits and tax benefits from investments in qualified affordable housing partnerships for the years ended December 31, 2017, 2016 and 2015 and 2014.2015.
For the Years Ended December 31, | For the Years Ended December 31, | |||||||||||||||||||||||||||||||||||||||||||||||
2016 | 2015 | 2014 | 2017 | 2016 | 2015 | |||||||||||||||||||||||||||||||||||||||||||
(Amounts in thousands) | Generated | Tax Benefits from | Generated | Tax Benefits from | Generated | Tax Benefits from | Generated | Tax Benefits from | Generated | Tax Benefits from | Generated | Tax Benefits from | ||||||||||||||||||||||||||||||||||||
Qualified Affordable Housing Partnerships | Tax Credits | Taxable Losses | Tax Credits | Taxable Losses | Tax Credits | Taxable Losses | Tax Credits | Taxable Losses | Tax Credits | Taxable Losses | Tax Credits | Taxable Losses | ||||||||||||||||||||||||||||||||||||
Raymond James California Housing Opportunities Fund II | $ | 178 | $ | 49 | $ | 173 | $ | 53 | $ | 115 | $ | 45 | $ | 176 | $ | 48 | $ | 184 | $ | 53 | $ | 168 | $ | 62 | ||||||||||||||||||||||||
WNC Institutional Tax Credit Fund 38, L.P. | 112 | 28 | 99 | 27 | 84 | 21 | 113 | 26 | 107 | 36 | 93 | 27 | ||||||||||||||||||||||||||||||||||||
Merritt Community Capital Corporation Fund XV, L.P. | 217 | 57 | 218 | 60 | 265 | 75 | 215 | 56 | 206 | 60 | 214 | 58 | ||||||||||||||||||||||||||||||||||||
California Affordable Housing Fund | 158 | 44 | 158 | 49 | 158 | 51 | 126 | 50 | 158 | 47 | 158 | 43 | ||||||||||||||||||||||||||||||||||||
Total | $ | 665 | $ | 178 | $ | 648 | $ | 189 | 622 | $ | 192 | $ | 630 | $ | 180 | $ | 655 | $ | 196 | 633 | $ | 190 | ||||||||||||||||||||||||||
The tax credits and benefits were partially offset by the amortization of the principal investment balances of $598$688 thousand, $714$598 thousand and $903$712 thousand for the years ended December 31, 2017, 2016 2015 and 2014,2015, respectively.
BANK OF COMMERCE HOLDINGS & SUBSIDIARIES
Notes to Consolidated Financial Statements
The following table reflects the anticipated net income tax benefit at December 31, 2016, 2017, that is expected to be recognized over the remaining life of the investments.investments and has been updated to reflect the change in tax rate in the Tax Cuts and Jobs Act enacted on December 22, 2017.
(Amounts in thousands) | Raymond JamesCalifornia Housing Opportunities | WNC Institutional Tax Credit | MerrittCommunity Capital Corporation | California Affordable Housing | Total Net Income Tax | Raymond James | Merritt Community | California | ||||||||||||||||||||||||||||||||
Qualified Affordable Housing Partnerships | Fund II | Fund 38, L.P. | Fund XV, L.P | Fund | Benefit | |||||||||||||||||||||||||||||||||||
Anticipated net income tax benefit less amortization of investments: | ||||||||||||||||||||||||||||||||||||||||
2017 | $ | 46 | $ | 35 | $ | 48 | $ | (2 | ) | $ | 127 | |||||||||||||||||||||||||||||
Qualified Affordable Housing Partnerships: | California Housing | WNC Institutional | Capital | Affordable | Total | |||||||||||||||||||||||||||||||||||
Anticipated income tax benefit, net less | Opportunities | Tax Credit | Corporation | Housing | Income Tax | |||||||||||||||||||||||||||||||||||
amortization of investments | Fund II | Fund 38, L.P. | Fund XV, L.P | Fund | Benefit, Net | |||||||||||||||||||||||||||||||||||
2018 | 45 | 35 | 46 | (1 | ) | 125 | $ | 23 | $ | 21 | $ | 3 | $ | (17 | ) | $ | 30 | |||||||||||||||||||||||
2019 | 45 | 30 | 45 | — | 120 | 23 | 17 | 4 | (14 | ) | 30 | |||||||||||||||||||||||||||||
2020 | 45 | 29 | 45 | — | 119 | 22 | 17 | 4 | (14 | ) | 29 | |||||||||||||||||||||||||||||
2021 and thereafter | 170 | 102 | 183 | (2 | ) | 453 | ||||||||||||||||||||||||||||||||||
2021 | 23 | 16 | 3 | (14 | ) | 28 | ||||||||||||||||||||||||||||||||||
2022 and thereafter | 61 | 42 | 9 | (43 | ) | 69 | ||||||||||||||||||||||||||||||||||
Total | $ | 351 | $ | 231 | $ | 367 | $ | (5 | ) | $ | 944 | $ | 152 | $ | 113 | $ | 23 | $ | (102 | ) | $ | 186 | ||||||||||||||||||
NOTE NOTE2265.BRANCH ACQUISITION
On March 11, 2016, we completed the purchase of five Bank of America branches in northern California. The acquired branches are located in Colusa, Willows, Orland, Corning, and Yreka. The Bank also acquired three offsite ATM locations in Williams, Orland and Corning. The Bank paid cash consideration of $6.7$6.7 million and acquired $155.2$155.2 million in assets, primarily cash and premises. The Bank assumed $149.2$149.2 million in liabilities, primarily deposits.
The transaction provided a new source of low cost core deposits and allowed us to execute our plan to reconfigure our balance sheet. On March 14, 2016, we utilized a portion of that new liquidity to reduce our reliance on wholesale funding sources repaying $75.0$75.0 million of Federal Home Loan Bank of San Francisco hedged term debt and redeeming $17.5$17.5 million of brokered time deposits.
The transaction was accounted for using the acquisition method of accounting and, accordingly, assets acquired, liabilities assumed, and consideration exchanged were recorded at estimated fair values on the acquisition date. The Bank engaged third party specialists to assist in valuing certain assets, including the real estate and the core deposit intangible that resulted from the acquisition.
The contribution of the acquired operations of the five former Bank of America offices was immaterial. Therefore, disclosure of supplemental pro forma financial information, especially prior period comparisons is deemed neither practical nor meaningful. Additionally, the acquired operation was not considered a “significant business combination�� as defined by the Securities and Exchange Commission.
BANK OF COMMERCE HOLDINGS & SUBSIDIARIES
Notes to Consolidated Financial Statements
The contribution of the acquired operations of the five former Bank of America offices was immaterial. Therefore, disclosure of supplemental pro forma financial information, especially prior period comparisons is deemed neither practical nor meaningful. Additionally, the acquired operation was not considered a “significant business combination” as defined by the Securities and Exchange Commission.
Branch acquisition costs recorded during the year ended December 31, 2016 and 2015 were $580$580 thousand and $347$347 thousand, respectively. The following table provides an assessment of the consideration transferred, assets purchased, and the liabilities assumed.
Fair Value and | ||||||||||||
As Recorded by | Other Merger | |||||||||||
Bank of | Related | As Recorded by | ||||||||||
(Amounts in thousands) | America | Adjustments | the Company | |||||||||
Consideration paid: | ||||||||||||
Cash paid | $ | 6,656 | ||||||||||
Total consideration | $ | 6,656 | ||||||||||
Assets acquired: | ||||||||||||
Cash and cash equivalents | $ | 149,067 | $ | — | $ | 149,067 | ||||||
Premises and equipment, net | 1,835 | 2,355 | 4,190 | |||||||||
Other assets | 201 | — | 201 | |||||||||
Core deposit intangible | — | 1,772 | 1,772 | |||||||||
Total assets acquired | $ | 151,103 | $ | 4,127 | $ | 155,230 | ||||||
Liabilities assumed: | ||||||||||||
Deposits | $ | 149,047 | $ | — | $ | 149,047 | ||||||
Other liabilities | 20 | 172 | 192 | |||||||||
Total liabilities assumed | $ | 149,067 | $ | 172 | $ | 149,239 | ||||||
Net identifiable assets acquired over liabilities assumed | $ | 2,036 | $ | 3,955 | $ | 5,991 | ||||||
Goodwill | $ | 665 | ||||||||||
BANK OF COMMERCE HOLDINGS & SUBSIDIARIES
Fair Value and | ||||||||||||
As Recorded by | Other Merger | |||||||||||
Bank of | Related | As Recorded by | ||||||||||
(Amounts in thousands) | America | Adjustments | the Company | |||||||||
Consideration paid: | ||||||||||||
Cash paid | $ | 6,656 | ||||||||||
Total consideration | $ | 6,656 | ||||||||||
Assets acquired: | ||||||||||||
Cash and cash equivalents | $ | 149,067 | $ | — | $ | 149,067 | ||||||
Premises and equipment, net | 1,835 | 2,355 | 4,190 | |||||||||
Other assets | 201 | — | 201 | |||||||||
Core deposit intangible | — | 1,772 | 1,772 | |||||||||
Total assets acquired | $ | 151,103 | $ | 4,127 | $ | 155,230 | ||||||
Liabilities assumed: | ||||||||||||
Deposits | $ | 149,047 | $ | — | $ | 149,047 | ||||||
Other liabilities | 20 | 172 | 192 | |||||||||
Total liabilities assumed | $ | 149,067 | $ | 172 | $ | 149,239 | ||||||
Net identifiable assets acquired over liabilities assumed | $ | 2,036 | $ | 3,955 | $ | 5,991 | ||||||
Goodwill | $ | 665 | ||||||||||
Notes to Consolidated Financial Statements
NOTE 2NOTE276. EARNINGS PER COMMON SHARE
The following table presents a computation of basic and diluted earnings per share for the years ended December 31, 2017, 2016 2015 and 2014.2015.
(Amounts in thousands, except per share information) | ||||||||||||||||||||||||
Earnings Per Share | 2016 | 2015 | 2014 | 2017 | 2016 | 2015 | ||||||||||||||||||
Numerators: | ||||||||||||||||||||||||
Net income | $ | 5,259 | $ | 8,586 | $ | 5,727 | $ | 7,344 | $ | 5,259 | $ | 8,586 | ||||||||||||
Less: | ||||||||||||||||||||||||
Preferred stock extinguishment costs | — | 102 | — | — | — | 102 | ||||||||||||||||||
Preferred stock dividends | — | 189 | 200 | — | — | 189 | ||||||||||||||||||
Net income available to common shareholders | $ | 5,259 | $ | 8,295 | $ | 5,527 | $ | 7,344 | $ | 5,259 | $ | 8,295 | ||||||||||||
Denominators: | ||||||||||||||||||||||||
Weighted average number of common shares outstanding - basic | 13,367 | 13,331 | 13,475 | 15,207 | 13,367 | 13,331 | ||||||||||||||||||
Effect of potentially dilutive common shares | 58 | 34 | 45 | 103 | 58 | 34 | ||||||||||||||||||
Weighted average number of common shares outstanding - diluted | 13,425 | 13,365 | 13,520 | 15,310 | 13,425 | 13,365 | ||||||||||||||||||
Earnings per common share: | ||||||||||||||||||||||||
Basic | $ | 0.39 | $ | 0.62 | $ | 0.41 | $ | 0.48 | $ | 0.39 | $ | 0.62 | ||||||||||||
Diluted | $ | 0.39 | $ | 0.62 | $ | 0.41 | $ | 0.48 | $ | 0.39 | $ | 0.62 | ||||||||||||
Anti-dilutive options not included in earnings per share calculation | 45 | 121 | 104 | — | 45 | 121 | ||||||||||||||||||
Anti-dilutive restricted shares not included in earnings per share calculation | — | 41 | — | |||||||||||||||||||||
Anti-dilutive restricted shares not included in diluted earnings per share calculation | 7 | — | 41 | |||||||||||||||||||||
(1) Excludes unvested restricted shares because they do not have dividend or voting rights. | |||||||||
|
On May 10, 2017, the Company announced the closing of its underwritten public offering, at the public offering price of $10.50 per share. The Holding Company authorized, repurchased and subsequently retired 700,000 common shares under a plan announced in 2014. As such, the weighted averagetotal number of dilutiveshares of common shares outstanding decreasedstock sold by 154,986 during the year ended December 31, 2015.Company was 2,738,096 shares. Net proceeds raised in the offering, after underwriting discounts and expenses of the offering, were $26.8 million.
BANK OF COMMERCE HOLDINGS & SUBSIDIARIES
Notes to Consolidated Financial Statements
NOTE 28.27. RELATED PARTY TRANSACTIONS
Some of the directors and executive officers (and their associated or affiliated companies) were customers of and had banking transactions with us in the ordinary course of our business and we expect to have such transactions in the future. All deposits, loans and commitments to fund loans included in such transactions were made in compliance with the applicable laws on substantially the same terms, including interest rates and collateral, as those prevailing at the time for comparable transactions with other persons of similar creditworthiness.
The following table presents a summary of aggregate activity involving related party borrowers for the years ended December 31, 20162017 and 2015.2016.
(Amounts in thousands) | 2016 | 2015 | ||||||
Balance at beginning of year | $ | 13,707 | $ | 13,654 | ||||
New loan additions | — | 916 | ||||||
Advances on existing lines of credit | 24,447 | 19,643 | ||||||
Principal repayments | (24,730 | ) | (20,487 | ) | ||||
Reclassifications (1) | — | (19 | ) | |||||
Balance at end of year | $ | 13,424 | $ | 13,707 | ||||
|
(Amounts in thousands) | 2017 | 2016 | ||||||
Balance at beginning of year | $ | 13,424 | $ | 13,707 | ||||
Advances on existing lines of credit | 29,166 | 24,447 | ||||||
Principal repayments | (29,360 | ) | (24,730 | ) | ||||
Balance at end of year | $ | 13,230 | $ | 13,424 | ||||
At December 31, 2017 and 2016, deposits of related parties amounted to $6.7 million and $6.0 million, respectively. As of December 31, 2017 and 2016, there were no related party loans which were past due or adversely classified. At December 31, 2017 and 2016 there was $12.4 million, and $8.8 million, respectively, in outstanding loan commitments to related parties. In our opinion, these transactions did not involve more than a normal risk of collectability or present other unfavorable terms.
NOTE 28. PARENT COMPANY FINANCIAL STATEMENTS
Condensed Balance Sheets
Year ended December 31,
(Amounts in thousands) | 2017 | 2016 | ||||||
Assets: | ||||||||
Cash | $ | 23,984 | $ | 493 | ||||
Investment in: | ||||||||
Redding Bank of Commerce | 130,658 | 122,707 | ||||||
Bank of Commerce Mortgage | (64 | ) | (64 | ) | ||||
Bank of Commerce Holdings Trust II | 310 | 310 | ||||||
Other assets | 169 | 124 | ||||||
Total Assets | $ | 155,057 | $ | 123,570 | ||||
Liabilities and shareholders' equity: | ||||||||
Term debt: | ||||||||
Senior debt, net | $ | 7,090 | $ | 8,904 | ||||
Subordinated debt, net | 9,868 | 9,829 | ||||||
Junior subordinated debentures | 10,310 | 10,310 | ||||||
Other liabilities | 525 | 421 | ||||||
Total liabilities | 27,793 | 29,464 | ||||||
Shareholders’ equity | 127,264 | 94,106 | ||||||
Total liabilities and shareholders’ equity | $ | 155,057 | $ | 123,570 | ||||
BANK OF COMMERCE HOLDINGS & SUBSIDIARIES
Notes to Consolidated Financial Statements
Condensed Statements of Income
At Year Ended December 31, 2016 and 2015, deposits of related parties amounted to $6.0 million and $4.1 million, respectively. As of December 31, 2016 and 2015, there were no related party loans which were past due or adversely classified. At December 31, 2016 and 2015 there was $8.8 million, and $8.4 million, respectively, in outstanding loan commitments to related parties. In our opinion, these transactions did not involve more than a normal risk of collectability or present other unfavorable terms.
NOTE29. PARENT COMPANY FINANCIAL STATEMENTS
Condensed Balance Sheets
Year endedDecember 31,
(Amounts in thousands) | 2016 | 2015 | ||||||
Assets: | ||||||||
Cash | $ | 493 | $ | 985 | ||||
Investment in: | ||||||||
Bank subsidiary | 122,707 | 119,807 | ||||||
Nonbank subsidiary | 310 | 310 | ||||||
Other assets | 60 | 66 | ||||||
Total Assets | $ | 123,570 | $ | 121,168 | ||||
Liabilities and shareholders' equity: | ||||||||
Term debt: | ||||||||
Senior debt, net | $ | 8,904 | $ | 9,902 | ||||
Subordinated debt, net | 9,829 | 9,792 | ||||||
Junior subordinated debentures | 10,310 | 10,310 | ||||||
Other liabilities | 421 | 642 | ||||||
Total liabilities | 29,464 | 30,646 | ||||||
Shareholders’ equity | 94,106 | 90,522 | ||||||
Total liabilities and shareholders’ equity | $ | 123,570 | $ | 121,168 | ||||
(Amounts in thousands) | 2017 | 2016 | 2015 | |||||||||
Income: | ||||||||||||
Other income | $ | 9 | $ | 7 | $ | 6 | ||||||
Dividends from subsidiaries | 2,200 | 4,200 | 2,850 | |||||||||
Total income | 2,209 | 4,207 | 2,856 | |||||||||
Expenses: | ||||||||||||
Management fees paid to subsidiaries | 278 | 259 | 229 | |||||||||
Interest expense | 1,452 | 1,409 | 267 | |||||||||
Noninterest expense | 474 | 345 | 337 | |||||||||
Total expenses | 2,204 | 2,013 | 833 | |||||||||
Income before income taxes and equity in undistributed net income of subsidiaries | 5 | 2,194 | 2,023 | |||||||||
Income tax expense | 1 | 1 | 1 | |||||||||
Income before equity in undistributed net income of subsidiaries | 4 | 2,193 | 2,022 | |||||||||
Equity in undistributed net income of subsidiaries | 7,340 | 3,066 | 6,564 | |||||||||
Net income | $ | 7,344 | $ | 5,259 | $ | 8,586 | ||||||
Less: Preferred stock extinguishment costs | — | — | 102 | |||||||||
Less: Preferred dividends | — | — | 189 | |||||||||
Income available to common shareholders | $ | 7,344 | $ | 5,259 | $ | 8,295 | ||||||
BANK OF COMMERCE HOLDINGS & SUBSIDIARIES
Notes to Consolidated Financial Statements
Condensed Statements of Income
Year EndedDecember 31,
(Amounts in thousands) | 2016 | 2015 | 2014 | |||||||||
Income: | ||||||||||||
Other income | $ | 7 | $ | 6 | $ | 482 | ||||||
Dividends from subsidiaries | 4,200 | 2,850 | 10,100 | |||||||||
Total income | 4,207 | 2,856 | 10,582 | |||||||||
Expenses: | ||||||||||||
Management fees paid to subsidiaries | 259 | 229 | 208 | |||||||||
Interest expense | 1,409 | 267 | 363 | |||||||||
Noninterest expense | 345 | 337 | 1,719 | |||||||||
Total expenses | 2,013 | 833 | 2,290 | |||||||||
Income before income taxes and equity in undistributed net income of subsidiaries | 2,194 | 2,023 | 8,292 | |||||||||
Income tax expense | 1 | 1 | 1 | |||||||||
Income before equity in undistributed net income of subsidiaries | 2,193 | 2,022 | 8,291 | |||||||||
Equity (deficit) in undistributed net income of subsidiaries | 3,066 | 6,564 | (2,564 | ) | ||||||||
Net income | $ | 5,259 | $ | 8,586 | $ | 5,727 | ||||||
Less: Preferred stock extinguishment costs | — | 102 | — | |||||||||
Less: Preferred dividends | — | 189 | 200 | |||||||||
Income available to common shareholders | $ | 5,259 | $ | 8,295 | $ | 5,527 | ||||||
BANK OF COMMERCE HOLDINGS & SUBSIDIARIES
Notes to Consolidated Financial Statements
Condensed Statements of Cash Flows
Year EndedDecember 31,,
(Amounts in thousands) | 2016 | 2015 | 2014 | |||||||||
Operating activities: | ||||||||||||
Net income | $ | 5,259 | $ | 8,586 | $ | 5,727 | ||||||
Adjustments to reconcile net income to net cash provided by operating activities: | ||||||||||||
Compensation associated with stock options | — | 1 | 1 | |||||||||
Gain on termination of debt | — | — | (406 | ) | ||||||||
(Deficit) equity in undistributed net income of subsidiaries | (3,066 | ) | (6,564 | ) | 2,564 | |||||||
Amortization of debt issuance costs | 40 | — | — | |||||||||
Decrease other assets | 6 | 371 | 1,209 | |||||||||
Increase (decrease) other liabilities | (137 | ) | 229 | 55 | ||||||||
Net cash provided by operating activities | 2,102 | 2,623 | 9,150 | |||||||||
Investing activities: | ||||||||||||
Promissory note repayments | — | — | 292 | |||||||||
Proceeds from settlement of note to former mortgage subsidiary | — | — | 686 | |||||||||
Net cash provided by investing activities | — | — | 978 | |||||||||
Financial activities: | ||||||||||||
Advances of term debt | — | 20,000 | — | |||||||||
Repayment of term debt | (1,001 | ) | (83 | ) | — | |||||||
Debt issuance costs paid net of amortization | — | (223 | ) | — | ||||||||
Redemption of preferred stock | — | (20,000 | ) | — | ||||||||
Preferred stock extinguishment costs | — | (33 | ) | — | ||||||||
Cash dividends paid on preferred stock | — | (189 | ) | (200 | ) | |||||||
Cash dividends paid on common stock | (1,603 | ) | (1,601 | ) | (1,626 | ) | ||||||
Proceeds from stock options exercised | 10 | 156 | 23 | |||||||||
Repayment of junior subordinated debentures | — | — | (4,629 | ) | ||||||||
Repurchase of common stock | — | — | (4,562 | ) | ||||||||
Net cash used in financing activities | (2,594 | ) | (1,973 | ) | (10,994 | ) | ||||||
Changes in cash and cash equivalents | (492 | ) | 650 | (866 | ) | |||||||
Cash and cash equivalents, beginning of year | 985 | 335 | 1,201 | |||||||||
Cash and cash equivalents, end of year | $ | 493 | $ | 985 | $ | 335 | ||||||
Supplemental disclosures of non cash financing activities: | ||||||||||||
Vested restricted stock issued under employee plans | $ | 84 | $ | 36 | $ | 66 | ||||||
(Amounts in thousands) | 2017 | 2016 | 2015 | |||||||||
Cash flows from operating activities: | ||||||||||||
Net income | $ | 7,344 | $ | 5,259 | $ | 8,586 | ||||||
Adjustments to reconcile net income to net cash provided by operating activities: | ||||||||||||
Compensation associated with stock options | — | — | 1 | |||||||||
Equity in undistributed net income of subsidiaries | (7,340 | ) | (3,066 | ) | (6,564 | ) | ||||||
Amortization of debt issuance costs | 44 | 40 | — | |||||||||
Provision for depreciation and amortization | 6 | — | — | |||||||||
Decrease in other assets | 32 | 6 | 371 | |||||||||
Increase (decrease) in other liabilities | 59 | (137 | ) | 229 | ||||||||
Net cash provided by operating activities | 145 | 2,102 | 2,623 | |||||||||
Cash flows from investing activities: | ||||||||||||
Purchases of premises and equipment | (82 | ) | — | — | ||||||||
Net cash (used) by investing activities | (82 | ) | — | — | ||||||||
Cash flows from financing activities: | ||||||||||||
Advances on term debt | — | — | 20,000 | |||||||||
Repayment of term debt | (1,819 | ) | (1,001 | ) | (83 | ) | ||||||
Debt issuance costs paid | — | — | (223 | ) | ||||||||
Redemption of preferred stock | — | — | (20,000 | ) | ||||||||
Preferred stock extinguishment costs | — | — | (33 | ) | ||||||||
Cash dividends paid on preferred stock | — | — | (189 | ) | ||||||||
Cash dividends paid on common stock | (1,776 | ) | (1,603 | ) | (1,601 | ) | ||||||
Proceeds from stock options exercised | 245 | 10 | 156 | |||||||||
Net proceeds from issuance of common stock | 26,778 | — | — | |||||||||
Net cash provided by (used in) financing activities | 23,428 | (2,594 | ) | (1,973 | ) | |||||||
Net increase (decrease) in cash and cash equivalents | 23,491 | (492 | ) | 650 | ||||||||
Cash and cash equivalents at the beginning of year | 493 | 985 | 335 | |||||||||
Cash and cash equivalents at the end of year | $ | 23,984 | $ | 493 | $ | 985 | ||||||
Supplemental disclosures of non cash financing activities: | ||||||||||||
Stock compensation grants | $ | 41 | $ | — | $ | — | ||||||
Common stock issued under employee plans | $ | — | $ | 84 | $ | 36 | ||||||
BANK OF COMMERCE HOLDINGS & SUBSIDIARIES
Notes to Consolidated Financial Statements
NOTE NOTE3029. QUARTERLY FINANCIAL INFORMATION (UNAUDITED)
The following tables present the summary of results for the eight quarters ended December 31, 2016.2017.
20162017
March 31, | June 30, | September 30, | December 31, | Four | ||||||||||||||||
(Amounts in thousands, except for share information) | 2016 | 2016 | 2016 | 2016 | Quarters | |||||||||||||||
Net interest income | $ | 8,304 | $ | 9,217 | $ | 9,276 | $ | 9,434 | $ | 36,231 | ||||||||||
Provision for loan and lease losses | — | — | — | — | — | |||||||||||||||
Noninterest income | 949 | 437 | 959 | 1,250 | 3,595 | |||||||||||||||
Noninterest expense | 10,001 | 7,668 | 7,125 | 7,815 | 32,609 | |||||||||||||||
(Loss) income before provision for income tax | (748 | ) | 1,986 | 3,110 | 2,869 | 7,217 | ||||||||||||||
Provision for income tax | 212 | 430 | 744 | 572 | 1,958 | |||||||||||||||
(Loss) income available to common shareholders | $ | (960 | ) | $ | 1,556 | $ | 2,366 | $ | 2,297 | $ | 5,259 | |||||||||
(Loss) earnings per share - basic | $ | (0.07 | ) | $ | 0.11 | $ | 0.18 | $ | 0.17 | $ | 0.39 | |||||||||
Weighted average shares - basic | 13,360 | 13,367 | 13,369 | 13,370 | 13,367 | |||||||||||||||
(Loss) earnings per share - diluted | $ | (0.07 | ) | $ | 0.11 | $ | 0.18 | $ | 0.17 | $ | 0.39 | |||||||||
Weighted average shares - diluted | 13,403 | 13,425 | 13,439 | 13,476 | 13,425 | |||||||||||||||
March 31, | June 30, | September 30, | December 31, | Four | ||||||||||||||||
(Amounts in thousands, except for share information) | 2017 | 2017 | 2017 | 2017 | Quarters | |||||||||||||||
Net interest income | $ | 9,734 | $ | 10,175 | $ | 10,584 | $ | 10,869 | $ | 41,362 | ||||||||||
Provision for loan and lease losses | 200 | 300 | — | 450 | 950 | |||||||||||||||
Noninterest income | 1,471 | 995 | 1,076 | 1,282 | 4,824 | |||||||||||||||
Noninterest expense | 7,990 | 7,726 | 7,357 | 7,891 | 30,964 | |||||||||||||||
Income before provision for income tax | 3,015 | 3,144 | 4,303 | 3,810 | 14,272 | |||||||||||||||
Provision for income tax | 763 | 935 | 1,427 | 3,803 | 6,928 | |||||||||||||||
Income available to common shareholders | $ | 2,252 | $ | 2,209 | $ | 2,876 | $ | 7 | $ | 7,344 | ||||||||||
Earnings per share - basic | $ | 0.17 | $ | 0.15 | $ | 0.18 | $ | — | $ | 0.48 | ||||||||||
Weighted average shares - basic | 13,416 | 15,014 | 16,191 | 16,195 | 15,207 | |||||||||||||||
Earnings per share - diluted | $ | 0.17 | $ | 0.15 | $ | 0.18 | $ | — | $ | 0.48 | ||||||||||
Weighted average shares - diluted | 13,521 | 15,113 | 16,288 | 16,306 | 15,310 | |||||||||||||||
2016
2015
March 31, | June 30, | September 30, | December 31, | Four | March 31, | June 30, | September 30, | December 31, | Four | |||||||||||||||||||||||||||||||
(Amounts in thousands, except for share information) | 2015 | 2015 | 2015 | 2015 | Quarters | 2016 | 2016 | 2016 | 2016 | Quarters | ||||||||||||||||||||||||||||||
Net interest income | $ | 8,369 | $ | 8,595 | $ | 8,455 | $ | 8,351 | $ | 33,770 | $ | 8,304 | $ | 9,217 | $ | 9,276 | $ | 9,434 | $ | 36,231 | ||||||||||||||||||||
Provision for loan and lease losses | — | — | — | — | — | — | — | — | — | — | ||||||||||||||||||||||||||||||
Noninterest income | 854 | 881 | 808 | 640 | 3,183 | 824 | 412 | 990 | 1,260 | 3,486 | ||||||||||||||||||||||||||||||
Noninterest expense | 6,593 | 6,122 | 5,574 | 6,616 | 24,905 | 9,876 | 7,643 | 7,156 | 7,825 | 32,500 | ||||||||||||||||||||||||||||||
Income before provision for income tax | 2,630 | 3,354 | 3,689 | 2,375 | 12,048 | |||||||||||||||||||||||||||||||||||
(Loss) income before provision for income tax | (748 | ) | 1,986 | 3,110 | 2,869 | 7,217 | ||||||||||||||||||||||||||||||||||
Provision for income tax | 829 | 964 | 1,164 | 505 | 3,462 | 212 | 430 | 744 | 572 | 1,958 | ||||||||||||||||||||||||||||||
Net income | $ | 1,801 | $ | 2,390 | $ | 2,525 | $ | 1,870 | $ | 8,586 | ||||||||||||||||||||||||||||||
Less: preferred stock accretion and extinguishment costs | — | — | — | 102 | 102 | |||||||||||||||||||||||||||||||||||
Less: preferred dividend on preferred stock | 50 | 50 | 50 | 39 | 189 | |||||||||||||||||||||||||||||||||||
Income available to common shareholders | $ | 1,751 | $ | 2,340 | $ | 2,475 | $ | 1,729 | $ | 8,295 | ||||||||||||||||||||||||||||||
Earnings per share - basic | $ | 0.13 | $ | 0.18 | $ | 0.18 | $ | 0.13 | $ | 0.62 | ||||||||||||||||||||||||||||||
(Loss) income available to common shareholders | $ | (960 | ) | $ | 1,556 | $ | 2,366 | $ | 2,297 | $ | 5,259 | |||||||||||||||||||||||||||||
(Loss) earnings per share - basic | $ | (0.07 | ) | $ | 0.11 | $ | 0.18 | $ | 0.17 | $ | 0.39 | |||||||||||||||||||||||||||||
Weighted average shares - basic | 13,303 | 13,338 | 13,340 | 13,341 | 13,331 | 13,360 | 13,367 | 13,369 | 13,370 | 13,367 | ||||||||||||||||||||||||||||||
Earnings per share - diluted | $ | 0.13 | $ | 0.18 | $ | 0.18 | $ | 0.13 | $ | 0.62 | ||||||||||||||||||||||||||||||
(Loss) earnings per share - diluted | $ | (0.07 | ) | $ | 0.11 | $ | 0.18 | $ | 0.17 | $ | 0.39 | |||||||||||||||||||||||||||||
Weighted average shares - diluted | 13,340 | 13,370 | 13,377 | 13,395 | 13,365 | 13,403 | 13,425 | 13,439 | 13,476 | 13,425 | ||||||||||||||||||||||||||||||
IItemtem 9 - Changes In and Disagreements with Accountants on Accounting and Financial Disclosure
There have been no changes in or disagreements with accountants or auditors on accounting and financial disclosure.
IItemtem 9a - Controls and Procedures
Disclosure ControlsControls and Procedures
As of the end of the period covered by this report, an evaluation was carried out under the supervision and with the participation of the Company’sCompany’s management, including its President and Chief Executive Officer and its Chief Financial Officer, of the effectiveness of its disclosure controls and procedures (as defined in Rule 13a-15(e) under the Securities Exchange Act of 1934). Based on that evaluation, the President and Chief Executive Officer and the Chief Financial Officer concluded that these disclosure controls and procedures were effective.
Disclosure controls and procedures, no matter how well designed and implemented, can provide only reasonable assurance of achieving an entity’sentity’s disclosure objectives. The likelihood of achieving such objectives is affected by limitations inherent in disclosure controls and procedures. These include the fact that human judgment in decision-making can be faulty and that breakdowns in internal controls can occur because of human failures such as simple errors, mistakes or intentional circumvention of the established processes.
Report on Internal Control over Financial Reporting
Management is responsible for establishing and maintaining adequate internal control over financial reporting. Internal control over financial reporting is a process designed by, or under the supervision of, the Company’sCompany’s Chief Executive Officer and the Chief Financial Officer and implemented by the Company’s Board of Directors, management and other personnel, to provide reasonable assurance regarding the reliability of financial reporting and the preparation of financial statements for external purposes in accordance with generally accepted accounting principles in the United States of America.
The Company’sCompany’s internal control over financial reporting includes those policies and procedures that: (1) pertain to the maintenance of records that, in reasonable detail, accurately and fairly reflect the transactions and dispositions of the assets of the Company; (2) provide reasonable assurance that transactions are recorded as necessary to permit preparation of financial statements in accordance with generally accepted accounting principles in the United States of America, and that receipts and expenditures of the Company are being made only in accordance with authorizations of management and directors of the Company; and (3) provide reasonable assurance regarding prevention or timely detection of unauthorized acquisition, use or disposition of the Company’s assets that could have a material effect on the financial statements.
Because of its inherent limitations, internal control over financial reporting may not prevent or detect misstatements. Also, projections of any evaluation of effectiveness to future periods are subject to the risk that controls may become inadequate because of changes in conditions, or that the degree of compliance with the policies or procedures may deteriorate.
On a quarterly basis, we carry out an evaluation, under the supervision and with the participation of our management, including our Chief Executive Officer and Principal Financial Officer (whom is also our Principal Accounting Officer) of the effectiveness of the design and operation of our disclosure controls and procedures pursuant to Rule 13a-15(b) under the Securities Exchange Act of 1934. As of December 31, 2016,2017, our management, including our Chief Executive Officer, and Principal Financial Officer, concluded that our disclosure controls and procedures are effective in timely alerting them to material information relating to us that is required to be included in our periodic SEC filings.
Although we change and improve our internal controls over financial reporting on an ongoing basis, we do not believe that any such changes occurred in the fourth quarter 20162017 that materially affected or are reasonably likely to materially affect our internal control over financial reporting.
This annual report includes an attestation report of the Company’sCompany’s registered public accounting firm regarding internal control over financial reporting.
IItemtem 9b - Other Information
None to report.
Itemtem 10 - Directors, Executive Officers And Corporate Governance
The response to this item is incorporated by reference to Bank of Commerce Holdings Proxy Statement for the 20172018 Annual Meeting of shareholders (the “Proxy Statement”) under the captions “Section 16(a) Beneficial Ownership Reporting Compliance”, “Voting Securities and Ownership of Certain Beneficial Holders”, “Certain Relationships and Related Transactions and Director Independence”, and “Committees of the Board of Directors”.
IItemtem 11 - Executive Compensation
The response to this item is incorporated by reference to the Proxy Statement, under the captions “Information on Director and Executive Compensation” and “Compensation Discussion and Analysis”.
IItemtem 12 - Security Ownership Of Certain Beneficial Owners And Management And Related Shareholder Matters
The response to this item is incorporated by reference to the Proxy Statement, under the caption “Voting Securities and Ownership of Certain Beneficial Holders”.
IItemtem 13 - Certain Relationships and Related Transactions and Director Independence
The response to this item is incorporated by reference to the Proxy Statement.
IItemtem 14 - Principal Accounting Fees and Services
The response to this item is incorporated by reference to the Proxy Statement, under the caption “Report of the Audit and Qualified Legal Compliance Committee.”
IItemtem 15 - Exhibits and Financial Statement Schedules
(a) | The following documents are filed as a part of this Form 10-K: |
(1) | Financial Statements: | |
Reference is made to the Index to Consolidated Financial Statements under Item 8 in Part II of this Form 10-K.
(2) | Financial Statement Schedules: |
All schedules are omitted because they are not applicable or the required information is shown in the financial statements or notes thereto.
(3) | Exhibits: |
Exhibit | Exhibit Description | Form | SEC | Original | Filing | Filed |
3.1 | Restated Articles of Incorporation | 10-Q | 000-25135 | 3.1 | 8/5/2016 | |
3.2 | Amended and Restated Bylaws | 8-K | 000-25135 | 3.1 | 5/21/2015 | |
4.1 | Specimen Common Stock Certificate | 10-12G | 000-25135 | 4.1 | 12/4/1998 | |
4.2 | Promissory Note between Bank of Commerce Holdings and NexBank SSB, dated December 10, 2015 | 8-K | 000-25135 | 4.1 | 12/14/2015 | |
4.3 | Form of 6.875% Fixed to Floating Rate Subordinated Note due December 10, 2025 | 8-K | 000-25135 | 4.2 | 12/14/2015 | |
10.1* | 1993 Directors Deferred Compensation Plan | 10-12G | 000-25135 | 10.7 | 12/4/1998 | |
10.2* | Form of Deferred Compensation Agreement used in connection with 1993 Directors Deferred Compensation Plan | 10-12G | 000-25135 | 10.8 | 12/4/1998 | |
10.3* | Amendments to the 1993 Deferred Compensation Plan | 10-K | 000-25135 | 10.8 | 3/11/2014 | |
10.4* | 1998 Stock Option Plan | 10-12G | 000-25135 | 10.3 | 12/4/1998 | |
10.5* | Form of Incentive Stock Option Agreement used in connection with 1998 Stock Option Plan | 10-12G | 000-25135 | 10.4 | 12/4/1998 | |
10.6* | 2010 Equity Incentive Plan | DEF 14A | 000-25135 | Appendix D | 4/12/2010 | |
10.7* | Form of Stock Option Agreement used in connection with 2010 Equity Incentive Plan | 10-K | 000-25135 | 10.7 | 3/8/2016 | |
10.8* | Form of Notice of Exercise of Stock Option used in connection with 2010 Equity Incentive Plan | 10-K | 000-25135 | 10.8 | 3/8/2016 | |
10.9* | Form of Restricted Stock Agreement used in connection with 2010 Equity Incentive Plan | 10-K | 000-25135 | 10.9 | 3/8/2016 | |
10.10* | Form of Stock Grant Agreement used in connection with 2010 Equity Incentive Plan | 10-K | 000-25135 | 10.10 | 3/8/2016 | |
10.11* | Amended and Restated Salary Continuation Agreement with Randall S. Eslick, dated November 19, 2013 | 10-K | 000-25135 | 10.10 | 3/11/2014 | |
10.12* | Amended and Restated Salary Continuation Agreement with Samuel D. Jimenez, dated December 17, 2013 | 10-K | 000-25135 | 10.12 | 3/11/2014 |
10.13* | Amended and Restated Salary Continuation Agreement with Robert J. O’Neil, dated December 17, 2013 | 10-K | 000-25135 | 10.16 | 3/11/2014 | |
10.14* | Salary Continuation Agreement with Robert H. Muttera, dated January 17, 2014 | 10-K | 000-25135 | 10.18 | 3/11/2014 | |
10.15* | 2013 Directors Deferred Compensation Plan and Participant Election Form | 10-K | 000-25135 | 10.19 | 3/11/2014 | |
10. 16 | Purchase and Assumption Agreement between Bank of America, National Association and Redding Bank of Commerce, dated October 28, 2015 | 8-K | 000-25135 | 10.1 | 10/29/2015 | |
10.17 | Loan Agreement by and between Bank of Commerce Holdings and NexBank SSB, dated December 10, 2015 | 8-K | 000-25135 | 10.1 | 12/14/2015 | |
10.18 | Pledge and Security Agreement between Bank of Commerce Holdings and NexBank SSB, dated December 10, 2015 | 8-K | 000-25135 | 10.2 | 12/14/2015 | |
10.19 | Subordinated Note Purchase Agreement between Bank of Commerce Holdings and The Purchasers named Herein, dated December 10, 2015 | 8-K | 000-25135 | 10.3 | 12/14/2015 | |
10.20* | Amended and Restated Employment Agreement with Randall S. Eslick dated February 21, 2017. | X | ||||
10.21* | Amended and Restated Employment Agreement with James A. Sundquist dated February 21, 2017. | X | ||||
10.22* | Amended and Restated Employment Agreement with Samuel D. Jimenez dated February 21, 2017. | X | ||||
10.23* | Amended and Restated Employment Agreement with Robert H. Muttera dated February 21, 2017. | X | ||||
10.24* | Amended and Restated Employment Agreement with Robert J. O’Neil dated February 21, 2017. | X | ||||
14 | Code of Ethics for Senior Financial Officers | 8-K | 000-25135 | 14.1 | 5/21/2015 | |
21.1 | Subsidiaries of the Company | X | ||||
23.1 | Consent of Moss Adams LLP | X | ||||
24 | Power of Attorney (included on signature page to this report) | X | ||||
31.1 | Certification of Randall S. Eslick pursuant to Exchange Act Rule 13a-14(a) or 15d — 14(a) as Adopted Pursuant to Section 302 of the Sarbanes-Oxley Act of 2002 | X | ||||
31.2 | Certification of James A. Sundquist pursuant to Exchange Act Rule 13a-14(a) or 15d — 14(a) as Adopted Pursuant to Section 302 of the Sarbanes-Oxley Act of 2002 | X |
10.15 | 8-K | 000-25135 | 10.3 | 12/14/2015 | ||
10.16* | Amended and Restated Employment Agreement with Randall S. Eslick dated February 21, 2017. | 10-K | 000-25135 | 10.20 | 3/15/2017 | |
10.17* | Amended and Restated Employment Agreement with James A. Sundquist dated February 21, 2017. | 10-K | 000-25135 | 10.21 | 3/15/2017 | |
10.18* | Amended and Restated Employment Agreement with Samuel D. Jimenez dated February 21, 2017. | 10-K | 000-25135 | 10.22 | 3/15/2017 | |
10.19* | Amended and Restated Employment Agreement with Robert H. Muttera dated February 21, 2017. | 10-K | 000-25135 | 10.23 | 3/15/2017 | |
14 | 8-K | 000-25135 | 14.1 | 5/21/2015 | ||
21.1 | X | |||||
23.1 | X | |||||
24 | Power of Attorney (included on signature page to this report) | X | ||||
31.1 | X | |||||
31.2 | X | |||||
32.1 | X | |||||
101.INS | XBRL Instance Document | X | ||||
101.SCH | XBRL Taxonomy Extension Schema Document | X | ||||
101.CAL | XBRL Taxonomy Calculation Linkbase Document | X | ||||
101.DEF | XBRL Taxonomy Extension Definition Linkbase Document | X | ||||
101.LAB | XBRL Taxonomy Label Linkbase Document | X | ||||
101.PRE | XBRL Taxonomy Extension Presentation Linkbase Document | X | ||||
* Executive Contract, Compensatory Plan or Arrangement | ||||||
|
|
| ||||
|
|
| ||||
|
|
| ||||
|
|
| ||||
|
|
| ||||
|
|
| ||||
|
|
|
|
Pursuant to the requirements of Section 13 or 15(d) of the Securities Exchange Act of 1934, the Company has duly caused this report to be signed on its behalf by the undersigned, thereunto duly authorized, on March 15, 2017.9, 2018.
BANK OF COMMERCE HOLDINGS | ||
By | /s/RandallS. Eslick | |
| Randall S. Eslick | |
| President, Chief Executive Officer and Director of Redding Bank of Commerce and Bank of Commerce Holdings | |
KNOW ALL PERSONS BY THESE PRESENTS, that each person whose signature appears below constitutes and appoints Randall S. Eslick and James A. Sundquist, and each of them, his true and lawful attorneys-in-fact, each with full power of substitution, for him in any and all capacities, to sign any amendments to this report on Form 10-K and to file the same, with exhibits thereto and other documents in connection therewith, with the Securities and Exchange Commission, hereby ratifying and confirming all that each of said attorneys-in-fact or their substitute or substitutes may do or cause to be done by virtue hereof.
Pursuant to the requirements of the Securities Exchange Act of 1934, this report has been signed below by the following persons on behalf of the Company and in the capacities and on the dates indicated.
Name | Title | Date | ||
/s/ Randall S. Eslick | President and Chief Executive Officer | March | ||
/s/ James A. Sundquist | Executive Vice President and Chief Financial Officer | March | ||
/s/ Lyle L. Tullis | Chairman of the Board | March | ||
/s/ David H. Scott | Director | March | ||
/s/ Jon W. Halfhide | Director | March | ||
/s/ Orin N. Bennett | Director | March | ||
/s/ Gary R. Burks | Director | March | ||
/s/ Joseph Q. Gibson | Director | March | ||
/s/ Terence J. Street | Director | March | ||
/s/ Linda J. Miles | Director | March | ||
/s/ Karl L. Silberstein | Director | March |
(Material Contracts Listed as 10.1 - 10.24)10.19)
Exhibit | Exhibit Description | Form | SEC | Original | Filing | Filed |
3.1 | Restated Articles of Incorporation | 10-Q | 000-25135 | 3.1 | 8/5/2016 | |
3.2 | Amended and Restated Bylaws | 8-K | 000-25135 | 3.1 | 5/21/2015 | |
4.1 | Specimen Common Stock Certificate | 10-12G | 000-25135 | 4.1 | 12/4/1998 | |
4.2 | Promissory Note between Bank of Commerce Holdings and NexBank SSB, dated December 10, 2015 | 8-K | 000-25135 | 4.1 | 12/14/2015 | |
4.3 | Form of 6.875% Fixed to Floating Rate Subordinated Note due December 10, 2025 | 8-K | 000-25135 | 4.2 | 12/14/2015 | |
10.1* | 1993 Directors Deferred Compensation Plan | 10-12G | 000-25135 | 10.7 | 12/4/1998 | |
10.2* | Form of Deferred Compensation Agreement used in connection with 1993 Directors Deferred Compensation Plan | 10-12G | 000-25135 | 10.8 | 12/4/1998 | |
10.3* | Amendments to the 1993 Deferred Compensation Plan | 10-K | 000-25135 | 10.8 | 3/11/2014 | |
10.4* | 1998 Stock Option Plan | 10-12G | 000-25135 | 10.3 | 12/4/1998 | |
10.5* | Form of Incentive Stock Option Agreement used in connection with 1998 Stock Option Plan | 10-12G | 000-25135 | 10.4 | 12/4/1998 | |
10.6* | 2010 Equity Incentive Plan | DEF 14A | 000-25135 | Appendix D | 4/12/2010 | |
10.7* | Form of Stock Option Agreement used in connection with 2010 Equity Incentive Plan | 10-K | 000-25135 | 10.7 | 3/8/2016 | |
10.8* | Form of Notice of Exercise of Stock Option used in connection with 2010 Equity Incentive Plan | 10-K | 000-25135 | 10.8 | 3/8/2016 | |
10.9* | Form of Restricted Stock Agreement used in connection with 2010 Equity Incentive Plan | 10-K | 000-25135 | 10.9 | 3/8/2016 | |
10.10* | Form of Stock Grant Agreement used in connection with 2010 Equity Incentive Plan | 10-K | 000-25135 | 10.10 | 3/8/2016 | |
10.11* | Amended and Restated Salary Continuation Agreement with Randall S. Eslick, dated November 19, 2013 | 10-K | 000-25135 | 10.10 | 3/11/2014 | |
10.12* | Amended and Restated Salary Continuation Agreement with Samuel D. Jimenez, dated December 17, 2013 | 10-K | 000-25135 | 10.12 | 3/11/2014 | |
10.13* | Amended and Restated Salary Continuation Agreement with Robert J. O’Neil, dated December 17, 2013 | 10-K | 000-25135 | 10.16 | 3/11/2014 | |
10.14* | Salary Continuation Agreement with Robert H. Muttera, dated January 17, 2014 | 10-K | 000-25135 | 10.18 | 3/11/2014 | |
10.15* | 2013 Directors Deferred Compensation Plan and Participant Election Form | 10-K | 000-25135 | 10.19 | 3/11/2014 |
Exhibit | Exhibit Description | Form | SEC | Original | Filing | Filed |
3.1 | Restated Articles of Incorporation | 10-Q | 000-25135 | 3.1 | 8/5/2016 | |
3.2 | Amended and Restated Bylaws | 8-K | 000-25135 | 3.1 | 5/21/2015 | |
4.1 | Promissory Note between Bank of Commerce Holdings and NexBank SSB, dated December 10, 2015 | 8-K | 000-25135 | 4.1 | 12/14/2015 | |
4.2 | Form of 6.875% Fixed to Floating Rate Subordinated Note due December 10, 2025 | 8-K | 000-25135 | 4.2 | 12/14/2015 | |
10.1* | 1993 Directors Deferred Compensation Plan | 10-12G | 000-25135 | 10.7 | 12/4/1998 | |
10.2* | Form of Deferred Compensation Agreement used in connection with 1993 Directors Deferred Compensation Plan | 10-12G | 000-25135 | 10.8 | 12/4/1998 | |
10.3* | Amendments to the 1993 Deferred Compensation Plan | 10-K | 000-25135 | 10.8 | 3/11/2014 | |
10.4* | Amended and Restated 2010 Equity Incentive Plan (“2010 Equity Incentive Plan”) | DEF 14A | 000-25135 | Appendix A | 3/9/2012 | |
10.5* | Form of Stock Option Agreement used in connection with 2010 Equity Incentive Plan | 10-K | 000-25135 | 10.7 | 3/8/2016 | |
10.6* | Form of Notice of Exercise of Stock Option used in connection with 2010 Equity Incentive Plan | 10-K | 000-25135 | 10.8 | 3/8/2016 | |
10.7* | Form of Restricted Stock Agreement used in connection with 2010 Equity Incentive Plan | 10-K | 000-25135 | 10.9 | 3/8/2016 | |
10.8* | Form of Stock Grant Agreement used in connection with 2010 Equity Incentive Plan | 10-K | 000-25135 | 10.10 | 3/8/2016 | |
10.9* | Amended and Restated Salary Continuation Agreement with Randall S. Eslick, dated November 19, 2013 | 10-K | 000-25135 | 10.10 | 3/11/2014 | |
10.10* | Amended and Restated Salary Continuation Agreement with Samuel D. Jimenez, dated December 17, 2013 | 10-K | 000-25135 | 10.12 | 3/11/2014 | |
10.11* | Salary Continuation Agreement with Robert H. Muttera, dated January 17, 2014 | 10-K | 000-25135 | 10.18 | 3/11/2014 | |
10.12* | Amended and Restated 2013 Directors Deferred Compensation Plan and Participant Election Form | X | ||||
10.13 | Loan Agreement by and between Bank of Commerce Holdings and NexBank SSB, dated December 10, 2015 | 8-K | 000-25135 | 10.1 | 12/14/2015 | |
10.14 | Pledge and Security Agreement between Bank of Commerce Holdings and NexBank SSB, dated December 10, 2015 | 8-K | 000-25135 | 10.2 | 12/14/2015 | |
10.15 | Subordinated Note Purchase Agreement between Bank of Commerce Holdings and The Purchasers named Herein, dated December 10, 2015 | 8-K | 000-25135 | 10.3 | 12/14/2015 | |
10.16* | Amended and Restated Employment Agreement with Randall S. Eslick dated February 21, 2017. | 10-K | 000-25135 | 10.20 | 3/15/2017 |
10. 16 | Purchase and Assumption Agreement between Bank of America, National Association and Redding Bank of Commerce, dated October 28, 2015 | 8-K | 000-25135 | 10.1 | 10/29/2015 | |
10.17 | Loan Agreement by and between Bank of Commerce Holdings and NexBank SSB, dated December 10, 2015 | 8-K | 000-25135 | 10.1 | 12/14/2015 | |
10.18 | Pledge and Security Agreement between Bank of Commerce Holdings and NexBank SSB, dated December 10, 2015 | 8-K | 000-25135 | 10.2 | 12/14/2015 | |
10.19 | Subordinated Note Purchase Agreement between Bank of Commerce Holdings and The Purchasers named Herein, dated December 10, 2015 | 8-K | 000-25135 | 10.3 | 12/14/2015 | |
10.20* | Amended and Restated Employment Agreement with Randall S. Eslick dated February 21, 2017. | X | ||||
10.21* | Amended and Restated Employment Agreement with James A. Sundquist dated February 21, 2017. | X | ||||
10.22* | Amended and Restated Employment Agreement with Samuel D. Jimenez dated February 21, 2017. | X | ||||
10.23* | Amended and Restated Employment Agreement with Robert H. Muttera dated February 21, 2017. | X | ||||
10.24* | Amended and Restated Employment Agreement with Robert J. O’Neil dated February 21, 2017. | X | ||||
14 | Code of Ethics for Senior Financial Officers | 8-K | 000-25135 | 14.1 | 5/21/2015 | |
21.1 | Subsidiaries of the Company | X | ||||
23.1 | Consent of Moss Adams LLP | X | ||||
24 | Power of Attorney (included on signature page to this report) | X | ||||
31.1 | Certification of Randall S. Eslick pursuant to Exchange Act Rule 13a-14(a) or 15d — 14(a) as Adopted Pursuant to Section 302 of the Sarbanes-Oxley Act of 2002 | X | ||||
31.2 | Certification of James A. Sundquist pursuant to Exchange Act Rule 13a-14(a) or 15d — 14(a) as Adopted Pursuant to Section 302 of the Sarbanes-Oxley Act of 2002 | X | ||||
32.1 | Certification pursuant to Section 1350 | X | ||||
101.INS | XBRL Instance Document | X | ||||
101.SCH | XBRL Taxonomy Extension Schema Document | X |
|
|
| ||||
|
|
| ||||
|
|
| ||||
|
|
| ||||
| ||||||
10.17* | Amended and Restated Employment Agreement with James A. Sundquist dated February 21, 2017. | 10-K | 000-25135 | 10.21 | 3/15/2017 | |
10.18* | Amended and Restated Employment Agreement with Samuel D. Jimenez dated February 21, 2017. | 10-K | 000-25135 | 10.22 | 3/15/2017 | |
10.19* | Amended and Restated Employment Agreement with Robert H. Muttera dated February 21, 2017. | 10-K | 000-25135 | 10.23 | 3/15/2017 | |
14 | Code of Ethics for Senior Financial Officers | 8-K | 000-25135 | 14.1 | 5/21/2015 | |
21.1 | Subsidiaries of the Company | X | ||||
23.1 | Consent of Moss Adams LLP | X | ||||
24 | Power of Attorney (included on signature page to this report) | X | ||||
31.1 | Certification of Randall S. Eslick pursuant to Exchange Act Rule 13a-14(a) or 15d — 14(a) as Adopted Pursuant to Section 302 of the Sarbanes-Oxley Act of 2002 | X | ||||
31.2 | Certification of James A. Sundquist pursuant to Exchange Act Rule 13a-14(a) or 15d — 14(a) as Adopted Pursuant to Section 302 of the Sarbanes-Oxley Act of 2002 | X | ||||
32.1 | Certification pursuant to Section 1350 | X | ||||
101.INS | XBRL Instance Document | X | ||||
101.SCH | XBRL Taxonomy Extension Schema Document | X | ||||
101.CAL | XBRL Taxonomy Calculation Linkbase Document | X | ||||
101.DEF | XBRL Taxonomy Extension Definition Linkbase Document | X | ||||
101.LAB | XBRL Taxonomy Label Linkbase Document | X | ||||
101.PRE | XBRL Taxonomy Extension Presentation Linkbase Document | X | ||||
* Executive Contract, Compensatory Plan or Arrangement | ||||||
119
139