UNITED STATES

SECURITIES AND EXCHANGE COMMISSION

WASHINGTON, DC 20549

FORM 10-K

(Mark One)

(Mark One)
 

ANNUAL REPORT UNDER SECTION 13 OR 15(d) OF THE SECURITIES EXCHANGE ACT OF 1934

For the fiscal year ended December 31, 2016

2017
 

TRANSITION REPORT UNDER SECTION 13 OR 15(d) OF THE SECURITIES EXCHANGE ACT OF 1934

For the transition period from ________ to _______

Commission file number:  000-51889

TWO RIVERBANCORP
(Exact Name of Registrant as Specified in Its Charter)

TWO RIVER BANCORP

(Exact Name of Registrant as Specified in Its Charter)

New Jersey

20-3700861

New Jersey

20-3700861
(State or Other Jurisdiction of

Incorporation or Organization)

(I.R.S. Employer Identification Number)

766 Shrewsbury Avenue, Tinton Falls, New Jersey 07724

(Address of Principal Executive Offices, including Zip Code)

(732) 389-8722

(732) 389-8722
(Registrant’s telephone number, including area code)

Securities registered pursuant to Section 12(b) of the Act:

Common Stock, no par value 

The NASDAQ Stock Market LLC

Title of each class

Name of each exchange on which registered 

Securities registered pursuant to Section 12(g) of the Act:

Preferred Stock Purchase Rights

(Title of Class)

Indicate by check mark if the registrant is a well-known seasoned issuer, as defined in Rule 405 of the Securities Act. Yes ☐  No ☒

Indicate by check mark if the registrant is not required to file reports pursuant to Section 13 or 15(d) of the Act. Yes ☐  No ☒

Indicate by check mark whether the registrant (1) has filed all reports required to be filed by Section 13 or 15(d) of the Securities Exchange Act of 1934 during the preceding 12 months (or for such shorter period that the registrant was required to file such reports), and (2) has been subject to such filing requirements for the past 90 days.     Yes☒       No☐

Yes ☒       No ☐

Indicate by check mark whether the registrant has submitted electronically and posted on its corporate Website, if any, every Interactive Data File required to be submitted and posted pursuant to Rule 405 of Regulation S-T during the preceding 12 months (or for such shorter period that the registrant was required to submit and post such files).    Yes☒     No☐

Yes ☒     No ☐

i


Indicate by check mark if disclosure of delinquent filers pursuant to Item 405 of Regulation S-K is not contained herein, and will not be contained, to the best of registrant’s knowledge, in definitive proxy or information statements incorporated by reference in Part III of this Form 10-K or any amendment to this Form 10-K. 

x

Indicate by check mark whether the registrant is a large accelerated filer, an accelerated filer, a non-accelerated filer, or a smaller reporting company, or an emerging growth company. See definitions of “large accelerated filer,” “accelerated filer,” and “smaller reporting company”company,” and "emerging growth company" in Rule 12b-2 of the Exchange Act.

Large accelerated filer

 ☐

Accelerated filer

 ☐

x

Non-accelerated filer (Do not check if a smaller reporting company)

 ☐

Smaller reporting company

 ☒

 ☐
Emerging growth company ☐

If an emerging growth company, indicate by check mark if the registrant has elected not to use the extended transition period for complying with any new or revised financial accounting standards provided pursuant to Section 13(a) of the Exchange Act. ☐
Indicate by check mark whether the registrant is a shell company (as defined in Rule 12b-2 of the Act).   Yes☐    No☒

Yes ☐    No ☒

The aggregate market value of the registrant’s voting and non-voting common equity held by non-affiliates of the registrant, computed by reference to the price at which the common stock was last sold, or the average bid and asked price of such common equity, as of the last business day of the registrant’s most recently completed second fiscal quarter, is $73,871,447.

$132,975,441.

As of March 14, 2017, 8,389,3671, 2018, 8,501,628 shares of the registrant’s common stock were outstanding.

Documents incorporated by reference

Portions of the registrant’s definitive Proxy Statement for its 20172018 Annual Meeting of Shareholders are incorporated by reference into Part III of this report and will be filed within 120 days of December 31, 2016.

2017.

i


FORM 10-K

TABLE OF CONTENTS

PART I

Item 1.

Business 

1

21

22

23

23

23

23

24

50

50

50

50

51

51

51

52

52

52

53

53

54


ii
ii 


PART I

Forward-Looking Statements


From time to time, Two River Bancorp (the “Company”) may include forward-looking statements relating to such matters as anticipated financial performance, business prospects, technological developments, new products, research and development activities and similar matters in this and other filings with the Securities and Exchange Commission (the “SEC”). The Private Securities Litigation Reform Act of 1995 provides a safe harbor for forward-looking statements. When used in this and in future filings by us with the SEC, in our press releases and in oral statements made with the approval of one of our authorized executive officers, the words or phrases “will,” “will likely result,” “could,” “anticipates,” “believes,” “continues,” “expects,” “plans,” “will continue,” “is anticipated,” “estimated,” “project” or “outlook” or similar expressions (including confirmations by one of our authorized executive officers of any such expressions made by a third party with respect to us) are intended to identify forward-looking statements. We wish to caution readers not to place undue reliance on any such forward-looking statements, each of which speaks only as of the date made, even if subsequently made available on our website or otherwise. Such statements are subject to certain risks and uncertainties, many of which are beyond our control, that could cause actual results to differ materially from historical earnings and those presently anticipated or projected. The forward-looking statements are and will be based on management’s then-current views and assumptions regarding future events and operating performance, and are applicable only as of the dates of such statements.

Factors that may cause actual results to differ from those results expressed or implied, include, but are not limited to, those listed in this report under the heading “Risk Factors”; the ability of customers to repay their obligations; the adequacy of the allowance for loan losses; developments in the financial services industry and U.S. and global credit markets; downward changes in the direction of the economy nationally or in New Jersey; changes in interest rates; competition; loss of management and key personnel; government regulation; environmental liability; failure to implement new technologies in our operations; changes in our liquidity; changes in our funding sources; failure of our controls and procedures; disruptions of our operational systems and relationships with vendors; and our success in managing risks involved in the foregoing. Although management has taken certain steps to mitigate any negative effect of the aforementioned items, significant unfavorable changes could severely impact the assumptions used and have an adverse effect on profitability. Such risks and other aspects of our business and operations are described in Item 1. “Business,” Item 1A. “Risk Factors” and Item 7. “Management’s Discussion and Analysis of Financial Condition and Results of Operations” of this report. We have no obligation to publicly release the result of any revisions which may be made to any forward-looking statements to reflect anticipated or unanticipated events or circumstances occurring after the date of such statements.

Item 1. Business.

The disclosures set forth in this item are qualified by Item 1A. “Risk Factors,” Item 7. “Management’s Discussion and Analysis of Financial Condition and Results of Operations” and other statements set forth in this report.

Two River Bancorp – General Overview

Two River Bancorp, which we refer to herein as the “Company,” “we,” “us” and “our,” is a business corporation incorporated under the laws of the State of New Jersey in August 2005.

The principal place of business of Two River Bancorp is located at 766 Shrewsbury Avenue, Tinton Falls, New Jersey 07724 and its telephone number is (732) 389-8722. Effective June 28, 2013, the Company changed its name from Community Partners Bancorp to Two River Bancorp.

Two River Bancorp serves as a holding company for Two River Community Bank (“Two River” or the “Bank”), a New Jersey state-chartered commercial bank, having a branch network consisting of 1514 branches and two loan production offices (“LPOs”) throughout Monmouth, Middlesex, Union and Ocean Counties, New Jersey. The Company’s website iswww.tworiverbank.com.


As of December 31, 2016,2017 the Company had consolidated assets of $940.2 million,$1.04 billion, total loans of $753.1$850.9 million, total deposits of $776.6$861.6 million and shareholders’ equity of $100.7$106.6 million.


1


Other than its investment in the Bank, Two River Bancorp currently conducts no other significant business activities. Two River Bancorp may determine to operate its own business or acquire other commercial banks, thrift institutions or bank holding companies, or engage in or acquire such other activities or businesses as may be permitted by applicable law, although it has no present plans or intentions to do so. When we refer to the business conducted by Two River Bancorp in this document, including any lending or other banking activities, we are referring to the business that Two River Bancorp conducts through the Bank.


Employees

Employees


As of December 31, 2016,2017, the Company and its subsidiaries had 147157 full-time equivalent employees, of whom 142153 were full-time and 98 were part-time. None of the Company's employees are represented by a union or covered by a collective bargaining agreement. Management of the Company and the Bank believe that, in general, their employee relations are good.

Two River Community Bank

Two River Community Bank was organized in January 2000 as a New Jersey state-chartered commercial bank to engage in the business of commercial and retail banking.

As a community bank, the Bank offers a wide range of banking services including demand, savings and time deposits and commercial, residential and consumer/installment loans to small and medium-sized businesses, not-for-profit organizations, professionals and individuals primarily in Monmouth, Middlesex, Union and Ocean Counties, New Jersey.

The Bank also offers its customers numerous banking products such as safe deposit boxes, night depository, wire transfers, money orders, automated teller machines, direct deposit, telephone and internet banking and corporate business services. The Company markets to consumers in geographic areas around its branch network not only through existing bricks and mortar, but also with alternative delivery mechanisms and new product development such as online banking, remote deposit capture, mobile banking and telephonic banking. In addition, the Company attracts new customers by making its service through these distribution points convenient. All of the Company’s existing markets are prime targets for expanding the consumer side of its business with full loan and deposit relationships, and the Company has restructured its retail group to accommodate growth.

The Bank currently operates 1514 banking offices in Monmouth, Middlesex and Union Counties, New Jersey and a corporate headquarters building.

The Bank’s corporate headquarters is located at 766 Shrewsbury Avenue, Tinton Falls, New Jersey, while its principal banking office is located at 1250 Highway 35 South, Middletown, New Jersey. Other banking offices are located in Allaire, Atlantic Highlands, Manasquan, Navesink, Port Monmouth, Freehold, Red Bank, Sea Girt, Tinton Falls (2), West Long Branch, New Brunswick, Westfield, Cranford and Fanwood, New Jersey.

The Bank also operates two regional LPOs, one each in Union and Ocean Counties, New Jersey, for the purpose of expanding our presence in these communities.

We believe that the Bank’s customers still want to do business and have a relationship with their banker. To accomplish this objective, we emphasize to our employees the importance of delivering exemplary customer service and seeking out opportunities to build further relationships with the Bank’s customers. The Bank’s deposits are insured by the Federal Deposit Insurance Corporation (“FDIC”) up to the statutory limits.

Growth Strategy

Profitable and sustainable growth is the Company’s primary goal. In order to achieve our goal, our strategic plan centers on the following:

Aligning resources to support strategy and productivity;

Increase fee and other non-interest income, primarily through mortgage banking and SBA lending;

Continued improvement in net interest income through controlled balance sheet growth; and

Growth in earnings per share.


Aligning resources to support strategy and productivity;
Increase fee and other non-interest income, primarily through mortgage banking and SBA lending;
Continued improvement in net interest income through controlled balance sheet growth; and
Growth in earnings per share.

We will also consider the acquisition of a smaller financial institution, in whole or branch acquisition, should the opportunity arise and economics support, as an avenue to achieve our desired growth.


2


Securing deposits to support expansion across our key lines of business remains a priority for us. Technology initiatives will assist us as well.

During 2016,2017, we focused on growth in core markets by increasing loan production, increasing fee-based income and improving profitability. The Company grew loans by $59.9$97.8 million and achieved record annual net income to common shareholders of $8.6$6.5 million.

We are focusing on establishing a market presence in the communities between Union and Ocean Counties by adding strategically located new branches and loan production offices. We will accomplish this goal while operating in a safe and sound manner to provide a desirable return to our shareholders.

In January 2015,the third quarter of 2017, the Company opened a newly constructed full-service branch at 245-249 North Avenue in Cranford, New Jersey and closed and consolidated our store front office located at 104 Walnut Avenueits Allaire and Manasquan branches into thisa new branch location. In June 2015, the Company closed its Elm Street branchand more visible location in Westfield and consolidated its operations into our South Avenue branch.Sea Girt, New Jersey. The closure of boththese offices was in line with our strategic plans of optimizing the profitability of our branch network.


We have taken the approach of opening low-cost LPOs in contiguous markets, and once a certain level of business is achieved, we will consider replacing these LPOs with a full-service branch at an appropriate location within that market.Currently,market. Currently, we have two active LPOs.

We believe that this strategy continues to build shareholder value and increase revenues and earnings per share by creating a larger base of lending and deposit relationships while achieving economics of scale and other efficiencies.

Our efforts include looking for potential new retail banking offices in markets where we have established lending relationships, as well as exploring opportunities to grow and add other profitable banking-related businesses. We believe that by establishing banking offices and making selective acquisitions in attractive growth markets while providing high level customer service, our core deposits will naturally increase.

Our priorities also include the following:

Organically growing the size of the loan portfolio

Utilizing technology to attract new customers and lower costs

Enhancing our electronic delivery channels

Reducing costs associated with non-performing assets and other real estate owned


Organically growing the size of the loan portfolio;
Utilizing technology to attract new customers and lower costs; and
Enhancing our electronic delivery channels.

Competitive Advantages

Attractive franchise in demographically desirable markets in New Jersey

We believe that the Bank has a strong regional presence in Monmouth, Middlesex, Union and Ocean Counties, which consist of densely populated areas with average household incomes above the US national average. The Company currently has 1110 branches in Monmouth County, which currently ranks as the fourth highest median household income county in New Jersey.

Commercial lending expertise

We believe we have a strong track record of quality commercial loans, highlighted by a niche expertise in our Private Banking Division (medical practitioners and business owners) and SBA lending without any reliance on wholesale loan purchases.

Local brand recognition

We believe we have competed effectively by leveraging a steadily growing branch network and a full assortment of banking products to facilitate loan growth in our core locations.


3


Conservative underwriting parameters utilizing local expertise

The majority of our portfolio is secured by New Jersey properties, with average loan-to-value (LTV)("LTV") at origination of 75% or less, predominantly owner-occupied along with strong cash flow. We believe this local presence allows our loan underwriters to be able to assess loan candidates better than our peers.


High touch regional banking service

The Bank strives to compete against local and national competition through personalized customer service, operating upon the principle that a locally owned and operated bank dedicated to the needs of the local community can meaningfully outperform large regional banks managed from outside of this region, in terms of outstanding customer care, responsiveness, and commitment to the community.

Products andServices

The Bank offers a full range of banking services to our customers. These services include a wide variety of business and consumer lending products as well as corporate services for businesses and professionals. We offer a range of deposit products including checking, savings, money market accounts and certificates of deposit (“CD”). The Bank also participates in the Certificate of Deposit Account Registry Service (“CDARS”), a service that enables us to provide our customers with additional FDIC insurance on CD products. Other products and services include remote deposit capture, safe deposit boxes, ACH services, debit and ATM cards, money orders, direct deposit and coin counting. We also offer customers the convenience of a full complementofcomplement of electronic banking services accessible either through the web, mobile device or telephone. These services allow customers to perform various transactions, such as making mobile check deposits (consumer), monitoring account balances, receiving email alerts, transferring funds (internal and external), sending and receiving person-to-person payments, initiating stop payment requests, reordering checks and paying bills. The Bank continues to invest in technology solutions for its customers and plans to expand and enhance its electronic services.


Lending Activities
 

Lending Activities

The Bank engages in a variety of lending activities, which are primarily categorized as either:

(i)

commercial;

(ii)commercial real estate; and

(ii)

(iii)

commercial real estate; and

(iii)

residential or consumer lending.


The strategy is to focus our lending activities on small and medium-sized business customers and retain customers by offering them a wide range of products and personalized service. Commercial and real estate mortgage lending (consisting of commercial real estate, commercial business, construction, residential and other commercial lending, including medical lending and private banking) are currently our main lending focus. Loans are funded primarily from deposits, although we do borrow to fund loan growth or meet deposit outflows.

The Bank presently generates virtually all of our loans from borrowers located in the State of New Jersey, with a significant portion in Monmouth, Middlesex, Union and Ocean Counties. Loans are generated through marketing efforts, the Bank’s present base of customers, walk-in customers, referrals, our directors and members of the Bank’s advisory boards. The Bank strives to maintain a high overall credit quality through the establishment of and adherence to prudent lending policies and practices. The Bank has an established written loan policy that has been adopted by the Board of Directors, which is reviewed at least annually. Any loans to members of the Board of Directors or their affiliates must be reviewed and approved by the Bank’s Board of Directors in accordance with the loan policy as well as applicable state and federal banking laws. In accordance with our loan policy, approvals of affiliated transactions are made only by independent board members.

In managing the growth and quality of the Bank’s loan portfolio, we have focused on:

(i)

the application of prudent underwriting criteria;

(ii)

the active involvement by senior management and the Bank’s Board of Directors in the loan approval process;

(iii)

the active monitoring of loans to ensure timely repayment and early detection of potential problems; and

(iv)

a loan review process by an independent loan review firm, which conducts in-depth reviews of portions of the loan portfolio on a quarterly basis and an annual stress test of the commercial real estate portfolio.


Our principal earning assets are loans originated or participated in by the Bank. The risk that certain borrowers will not be able to repay their loans under the existing terms of the loan agreement is inherent in the lending function. Risk elements in a

4


loan portfolio include non-accrual loans (as defined below), past due and restructured loans, potential problem loans, loan concentrations (by industry or geographically) and other real estate owned acquired through foreclosure or a deed in lieu of foreclosure. Because the Bank makes loans to borrowers located in Monmouth, Middlesex, Union and Ocean Counties, New Jersey and elsewhere, each loan or group of loans presents a geographical and credit risk based upon the condition of the local economy. The local economy is influenced by conditions such as housing prices, employment conditions and changes in interest rates.

Construction Loans

We originate fixed-rate and adjustable-rate loans to individuals and builders to finance the construction of residential dwellings. We also originate construction loans for commercial development projects, including shopping centers, medical office space and owner-occupied properties used for businesses. Within these project types, the Bank also offers land development loans. Our construction loans generally provide for the payment of interest only during the construction phase which is usually twelve months for residential owner occupied properties and twelve to eighteen months for commercial properties and upwards to 36 months for land development projects, depending on the size and scope of the project. At the end of the commercial or residential construction phase, the loan can either be converted to a permanent loan or paid in full.

Before making a commitment to fund a construction loan, we require an appraisal of the property by a bank approved independent licensed appraiser, appropriate environmental due diligence, a construction cost review, an inspection of the property before disbursement of funds during the stages of the construction process, and pre-qualification from an identified source for the permanent takeout.

Construction financing is generally considered to involve a higher degree of risk of loss than long-term financing on improved, occupied real estate. Risk of loss on a construction loan depends largely upon the accuracy of the initial estimate of the property’s value at completion of construction and the estimated cost (including interest) of construction. During the construction phase, a number of factors could result in delays and cost overruns. If the estimate of construction costs proves to be inaccurate, we may be required to advance funds beyond the amount originally committed to permit completion of the building. If the estimate of value proves to be inaccurate, we may be confronted, at or before the maturity of the loan, with a building having a value which is insufficient to assure full repayment. If we are forced to foreclose on a building before or at completion due to a default, there can be no assurance that we will be able to recover all of the unpaid balance of, and accrued interest on, the loan as well as related foreclosure and holding costs.


Commercial and Industrial and Commercial Real Estate Loans

The Bank originates commercial and industrial loans for business purposes to sole proprietorships, partnerships, corporations, limited liability companies, and small businesses in our lending market areas. We extend commercial business loans on a secured and unsecured basis. Secured commercial loans are generally collateralized by residential and nonresidential real estate, marketable securities, accounts receivable, inventory, industrial/commercial machinery and equipment, and furniture and fixtures. To further enhance our security position, we typically require personal guarantees of the principal owners of the entities to which we extend credit. These loans are made on both lines of credit and fixed-term basis ranging from one to five years in duration.

When making commercial business loans, we consider the financial statements and/or tax returns of the borrower, the borrower’s payment history along with the principal owners’ payment history, the debt service capabilities of the borrower, the projected cash flows of the business, the value of the collateral and the financial strength of the guarantor.

Commercial real estate loans are made to local commercial, retail and professional firms and individuals for the acquisition of property or the refinancing of existing property. These loans are typically related to commercial businesses and secured by the underlying real estate used in these businesses or real property of the principals. These loans are generally offered on a fixed or variable rate basis, subject to rate re-adjustments every five years and amortization schedules ranging from 5 to 25 years.


Our established written underwriting guidelines for commercial loans are periodically reviewed and enhanced as needed. Pursuant to these guidelines, in granting commercial loans, we look primarily to the borrower’s cash flow as the principal source of loan repayment. To monitor cash flows on income properties, we require borrowers and loan guarantors of loan relationships to provide annual financial statements, rent rolls and/or tax returns. Collateral and personal guarantees of the principals of the entities to which we lend are consistent with the requirements of our loan policy.


5


Commercial loans are often larger and may involve greater risks than other types of lending. Because payments of such loans are often dependent on the successful operation of the business involved, repayment of such loans may be more sensitive than other types of loans and are subject to adverse conditions in the real estate market, or the general economy. We are also involved with off-balance sheet financial instruments, which include collateralized commercial and standby letters of credit. We seek to minimize these risks through our underwriting guidelines and prudent risk management techniques. Any collateral securing such loans may depreciate over time, may be difficult to appraise and may fluctuate in value. Environmental surveys and inspections are obtained when circumstances suggest the possible presence of hazardous materials. There can be no assurances, however, of success in the efforts to minimize these risks.

Unlike residential mortgage loans, which generally are made on the basis of the borrower’s ability to make repayment from his or her employment or other income and which are secured by real property the value of which tends to be more easily ascertainable, commercial loans are of higher risk and typically are made on the basis of the borrower’s ability to make repayment from the cash flow of the borrower’s business operation. As a result, the availability of funds for the repayment of commercial loans may depend substantially on the success of the business itself as the primary source of repayment. Further, any collateral securing such loans may depreciate over time and may be difficult to appraise as values fluctuate.

Residential Real Estate Loans / Mortgage Banking


The Company’s mortgage banking activity is primarily related to the origination of one-to-four family residential real estate located within our primary market areas in Monmouth, Middlesex, Union and Ocean Counties of New Jersey. We offer a full range of residential real estate loans. We do not originate subprime or negative amortization loans. Residential real estate loans consist of single-family detached units, individual condominium units, two-to-four family dwelling units and townhouses.

We typically retain adjustable-rate mortgage (“ARM”) loans in our portfolio. In recent periods, borrowers have largely trended towards fixed-rate loans as a result of the continuation of the historically low interest rate market. The Company’s fixed-rate mortgage banking activities typically have contractual maturities exceeding fifteen years and beyond. These loans are sold, on a case-by-case basis, in the secondary market as part of the Company’s efforts to manage interest rate risk.


Consumer Loans
 

Consumer Loans

The Bank offers consumer loans that are extended to individuals for personal or household purposes. These loans consist of home equity lines of credit, home equity loans, personal loans, automobile loans and overdraft protection.

Our home equity revolving lines of credit come with a floating interest rate tied to the prime rate. Lines of credit are available to qualified applicants in amounts up to $350,000 for up to 15 years. We also offer fixed rate home equity loans in amounts up to $350,000 for a term of up to 15 years. Credit is based on the income and cash flow of the individual borrowers, properly margined real estate collateral supporting the mortgage debt and past credit history.

Consumer loans may entail greater risk than do residential mortgage loans, particularly in the case of consumer loans that are unsecured or secured by assets that are in junior mortgage position. In such cases, repossessed collateral for a defaulted consumer loan may not provide an adequate source of repayment for the outstanding loan and the remaining deficiency often does not warrant further substantial collection efforts against the borrower. In addition, consumer loan collections depend on the borrower’s continuing financial stability, and therefore are more likely to be adversely affected by job loss, divorce, illness or personal bankruptcy. Furthermore, the application of various federal and state laws, including bankruptcy and insolvency laws, may limit the amount that can be recovered on such loans.

Participation Loans

The Bank underwrites all loan participations in accordance with our underwriting standards. We will not participate in a loan transaction unless each participant has a substantial interest in the loan relationship. In addition, we also consider the financial strength and reputation of the lead lender. To monitor cash flows on loan participations, we look for the lead lender to provide at a minimum, tax returns and annual financial statements for the borrower. Generally, we also conduct an annual internal loan review for participations.


6


Small Business Administration (“SBA”)Loans

The Bank offers SBA loans and achieved Preferred Lending status in 2011, which allows us to have delegated authority to approve and close SBA loans up to $5.0 million. Our risk philosophy in SBA lending is an extension of our existing credit culture and focused on the cash flow of the businesses while maintaining our commitment to providing small and mid-sized companies access to the credit they need to expand and hire. The Bank participates in SBA’s 7(a), including 7(a) sub-program such as SBA Express, and 504 loan programs. The 7(a) program typically provides guarantees ranging from 50% to 85%. The 504 program provides fixed rate financing with a first lien position for a conventional loan followed by a SBA debenture loan in a subordinated position. The 504 program is administered through SBA’s Certified Development Companies (“CDCs”). A typical 504 structure transaction is broken down by a 10% equity injection by the borrower, a 40% SBA debenture and a 50% conventional mortgage.

Market Area

Our primary market area consists of Monmouth, Middlesex, Union and Ocean Counties, New Jersey. Our customer base is primarily made up of business and personal banking relationships within these market areas.

We attract deposit relationships from individuals, merchants, small to medium-sized businesses, municipalities, not-for-profit organizations and professionals who live and/or work in the communities comprising our market areas. As of December 31, 2016,2017, approximately 51%55% of our deposits are from businesses and 49%45% from consumers.

Competition

The Bank faces substantial competition for deposits and creditworthy borrowers. It competes with New Jersey and regionally based commercial banks, savings banks and savings and loan associations, as well as national financial institutions, many of which have assets, capital and lending limits greater than that of the Bank. Other competitors include money market mutual funds, mortgage bankers, insurance companies, stock brokerage firms, regulated small loan companies, credit unions and issuers of commercial paper and other securities.

In all four counties in which we do business, we have

We face significant competition from banks with much larger branch networks nationwide, as well as credit unions and other community banks.

Asset Quality

We believe that strong asset quality is a key to long-term financial success. We have sought to grow and diversify the loan portfolio, while maintaining a high level of asset quality and moderate credit risk, using underwriting standards that we believe are conservative along with diligent monitoring. As we continue to grow and leverage our capital, we envision that loans will continue to be our principal earning assets. An inherent risk in lending is the borrower’s ability to repay the loan under its existing terms. Risk elements in a loan portfolio include non-accrual loans (as defined below), past due and restructured loans, potential problem loans, loan concentrations (by industry or geographically) and other real estate owned acquired through foreclosure or a deed in lieu of foreclosure.


Non-performing assets include loans that are not accruing interest (non-accrual loans) as a result of principal or interest being in default for a period of 90 days or more, loans past due 90 days or more and still accruing and other real estate owned, which consists of real estate acquired as the result of a defaulted loan. When a loan is classified as non-accrual, interest accruals cease and all past due interest is reversed and charged against current income. Until the loan becomes current as to principal or interest, as applicable, any payments received from the borrower are applied to outstanding principal and fees and costs to the Bank, unless we determine that the financial condition of the borrower and other factors merit recognition of such payments as interest.

A troubled debt restructuring (“TDR”) is a loan in which the contractual terms have been modified resulting in the Bank granting a concession to a borrower who is experiencing financial difficulties in order for the Bank to have a greater opportunity of collecting the indebtedness from the borrower. Non-accruing TDRs are included in non-performing loans.


7


We utilize a risk system, as described below under the section titled “Allowance for Loan Losses,” as an analytical tool to assess risk and set appropriate reserves. In addition, the FDIC has a classification system for problem loans and other lower quality assets, classifying them as “substandard,” “doubtful” or “loss.” A loan is classified as “substandard” when it is inadequately protected by the current value and paying capacity of the obligor or the collateral pledged, if any. Loans with this classification have a well-defined weakness or a weakness that jeopardizes the liquidation of the debt. They are characterized by the distinct possibility that some loss may occur if the deficiencies are not corrected. A loan is classified “doubtful” when it has all the weaknesses inherent in a loan classified as substandard with the added characteristics that the weaknesses make collection or liquidation in full, on the basis of currently existing factors, conditions, and values, highly questionable and improbable. A loan is classified as “loss” when it is considered uncollectible and such little value that the loan’s continuance as an asset on the balance sheet is not warranted.

In addition to categories for non-accrual loans and loans past due 90 days or more that are still accruing interest, we maintain a “watch list” of performing loans where management has identified conditions which potentially could cause such loans to be downgraded into higher risk categories in future periods. Loans on this list are subject to heightened scrutiny and more frequent review by management.SeeNote 1-Iin theNotes to Consolidated Financial Statements for more information.Non-performing assets are further discussed within the “Asset Quality” section under Item 7 of this report.


Allowance for Loan Losses

We maintain an allowance for loan losses at a level that we believe is adequate to provide for probable losses inherent in the loan portfolio. Loan losses are charged directly to the allowance when they occur and any recovery is credited to the allowance when realized. Risks from the loan portfolio are analyzed on a continuous basis by the Bank’s senior management, outside independent loan reviewers, the directors’ asset quality loan committee, the Board of Directors and our regulators.

The level of the allowance is determined by assigning specific reserves to impaired loans and general reserves on all other loans. The portion of the allowance that is allocated to impaired loans is determined by estimating the inherent loss on each credit after giving consideration to the value of the underlying collateral. A risk system, consisting of multiple grading categories, is utilized as an analytical tool to assess risk and set appropriate general reserves. Along with the risk system, senior management evaluates risk characteristics of the loan portfolio under current and anticipated economic conditions and considers such factors as the financial condition of the borrower, past and expected loss experience, and other factors management feels deserve recognition in establishing an appropriate reserve. These estimates are reviewed at least quarterly, and as adjustments become necessary, they are realized in the periods in which they become known. Additions to the allowance are made by provisions charged to expense and the allowance is reduced by net charge-offs (i.e., loans judged to be uncollectible and charged against the reserve, less any recoveries on such loans).

Although management attempts to maintain the allowance at a level deemed adequate to cover any losses, future additions to the allowance may be necessary based upon any changes in market conditions, either generally or specific to our area, or changes in the circumstances of particular borrowers. In addition, various regulatory agencies periodically review our allowance for loan losses, and may require us to take additional provisions based on their judgments about information available to them at the time of their examination.SeeNote 1-Jin theNotes to Consolidated Financial Statements for more information.

Risk Management

Managing risk is an essential part of a successful financial institution. Our most prominent risk exposures are credit risk, interest rate risk and market risk. Credit risk is the risk of not collecting the interest and/or the principal balance of a loan or investment when it is due. Interest rate risk is the potential reduction of net interest income as a result of changes in interest rates. Market risk arises from fluctuations in interest rates that may result in changes in the values of financial instruments, such as available for sale securities that are accounted for on a fair value basis. Other risks that we face are operational risks, liquidity risks and reputation risk. Operational risks include risks related to fraud, regulatory compliance, processing errors, and technology and disaster recovery. Liquidity risk is the possible inability to fund obligations to depositors or borrowers. Reputation risk is the risk that negative publicity or press, whether true or not, could cause a decline in our customer base or revenue. 


8


The management of and authority to assume interest rate risk is the responsibility of the Asset/Liability Committee (“ALCO”), which is comprised of senior management and board members. The primary objective of Asset/Liability management is to establish prudent risk management guidelines and to coordinate balance sheet composition with interest rate risk management to sustain a reasonable and stable net interest income throughout various interest rate cycles. We have policies and practices for measuring and reporting interest rate risk exposure, through analysis of the net interest margin, gap position, simulation testing, liquidity ratios and the Economic Value of Portfolio Equity. In addition, we annually review our interest rate risk policy, which includes limits on the impact to earnings from shifts in interest rates.

Credit Risk Management

Our strategy for credit risk management focuses on having well-defined credit policies and uniform underwriting criteria and providing prompt attention to potential problem loans. The Bank conducts annual commercial real estate stress testing. To further enhance our credit risk management strategy, we engage a third party loan review firm to provide additional portfolio surveillance. When a borrower fails to make a required loan payment, we take a number of steps to attempt to have the borrower cure the delinquency and restore the loan to current status. When the loan becomes 15 days past due, a late charge notice is generated and sent to the borrower and a representative of the Bank attempts to communicate by phone with the borrower to discuss the late payment. If payment is not then received by the 30th day of delinquency, a further notification is sent to the borrower. If no resolution can be achieved, after a loan becomes 90 days delinquent, we may commence foreclosure or other legal proceedings. If a foreclosure action is instituted and the loan is not brought current, paid in full, or refinanced before the foreclosure sale, the real property securing the loan generally is sold at foreclosure. We may consider loan workout arrangements with certain borrowers under certain circumstances.

Management reports to the Board of Directors monthly regarding the amount of loans delinquent more than 30 days, and all loans in foreclosure and all foreclosed and repossessed property that we own.

Investment Portfolio

Our investment portfolio consists primarily of obligations of U.S. Government sponsored agencies as well as municipal and government authority bonds, with corporate bonds accounting for less than 10% of the portfolio. Government regulations limit the type and quality of instruments in which the Company may invest its funds.

We conduct our asset/liability management through consultation with members of our Board of Directors, senior management and an outside financial advisor. The ALCO, which is comprised of the president, senior officers and certain members of our Board of Directors, is responsible for the review of interest rate risk and evaluates future liquidity needs over various time periods.

We have established a written investment policy which is reviewed annually by the ALCO and our Board of Directors that applies to Two River Bancorp and the Bank. The investment policy identifies investment criteria and states specific objectives in terms of risk, interest rate sensitivity and liquidity and emphasizes the quality, term and marketability of the securities acquired for our investment portfolio.

The ALCO is responsible for monitoring the investment portfolio and ensuring that investments comply with the investment policy. The ALCO may from time to time consult with investment advisors. The Bank’s president and its chief financial officer may purchase or sell securities on behalf of the Bank in accordance with the guidelines of the ALCO committee. The Board of Directors reviews the composition and performance of the investment portfolio, including all transactions, on a monthly basis.

DepositProducts

We strive to develop relationships and serve as the primary financial institution for commercial and individual customers. A key priority in this mission is obtaining transaction accounts, which are frequently non-interest bearing deposits or lower cost interest bearing checking, savings and money market deposit accounts.

Deposits are the primary source of funds used in lending and other general business purposes. In addition to deposits, we may derive additional funds from principal repayments on loans, the sale of investment securities and borrowings from other financial institutions. Loan amortization payments have historically been a relatively predictable source of funds. The level of deposit liabilities can vary significantly and is influenced by prevailing interest rates, money market conditions, general economic conditions and competition.


9


The Bank’s deposits consist of checking accounts, savings accounts, money market accounts and CDs. All deposits are obtained from individuals, partnerships, corporations and unincorporated businesses. The Bank participates in CDARS, a service that enables us to provide our customers with additional FDIC insurance on CD products. We attempt to control the flow of deposits primarily by pricing our accounts to remain competitive with other financial institutions in our market area.


Supervision and Regulation

Overview

Two River Bancorp operates within a system of banking laws and regulations intended to protect bank customers and depositors, and these laws and regulations govern the permissible operations and management, activities, reserves, loans and investments of the Company.

Two River Bancorp is a bank holding company under the Federal Bank Holding Company Act of 1956 (“BHCA”), as amended, by the Financial Modernization Act of 1999, known as the Gramm-Leach-Bliley Act, and is subject to the supervision of the Board of Governors of the Federal Reserve System (the “Federal Reserve”). In general, the BHCA limits the business of bank holding companies to banking, managing or controlling banks, and performing certain servicing activities for subsidiaries and, as a result of the Gramm-Leach-Bliley Act amendments, permits bank holding companies that are also financial holding companies to engage in any activity, or acquire and retain the shares of any company engaged in any activity, that is either (1) financial in nature or incidental to such financial activity or (2) complementary to a financial activity and does not pose a substantial risk to the safety and soundness of depository institutions or the financial system generally. In order for a bank holding company to engage in the broader range of activities that are permitted by the BHCA for bank holding companies that are also financial holding companies, upon satisfaction of certain regulatory criteria, the bank holding company must file a declaration with the Federal Reserve Board that it elects to be a “financial holding company.” Two River Bancorp does not presently intend to seek a “financial holding company” designation at this time, and does not believe that the current decision not to seek a financial holding company designation will adversely affect its ability to compete in its chosen markets. We believe that seeking such a designation for Two River Bancorp would not position it to compete more effectively in the offering of products and services currently offered by the Bank. Two River Bancorp is also subject to other federal laws and regulations as well as the corporate laws and regulations of New Jersey, the state of its incorporation.

The BHCA prohibits the Company, with certain exceptions, from acquiring direct or indirect ownership or control of more than five percent of the voting shares of any company which is not a bank and from engaging in any business other than that of banking, managing and controlling banks or furnishing services to subsidiary banks. The BHCA requires prior approval by the Federal Reserve Board of the acquisition by the Company of more than five percent of the voting stock of any other bank. Satisfactory capital ratios, Federal Community Reinvestment Act ratings and anti-money laundering policies are generally prerequisites to obtaining federal regulatory approval to make acquisitions.

The Bank is a commercial bank chartered under the laws of the State of New Jersey and is subject to the New Jersey Banking Act of 1948 (the “Banking Act”). As such, it is subject to regulation, supervision and examination by the New Jersey Department of Banking and Insurance and by the FDIC. Each of these agencies regulates aspects of activities conducted by the Bank and Two River Bancorp, as discussed below. The Bank is not a member of the Federal Reserve Bank of New York.

The following descriptions summarizesome of the more recent changes to the key laws and regulations to which the Bank is subject, and to which Two River Bancorp is subject as a registered bank holding company. These descriptions are not intended to be complete and are qualified in their entirety by reference to the full text of the statutes and regulations. Future changes in these laws and regulations, or in the interpretation and application thereof by their administering agencies, cannot be predicted, but could have a material effect on the business and results of Two River Bancorp and the Bank.

Small Business Lending Fund

On August 11, 2011, the Company received $12 million under the Small Business Lending Fund (“SBLF”), created as part of the Small Business Jobs Act. In exchange for the $12 million, the Company issued to the U.S. Department of the Treasury (“Treasury”) 12,000 shares of its Non-Cumulative Perpetual Preferred Stock, Series C, having a $1,000 liquidation preference per share (the “SBLF Preferred Shares”). The SBLF Preferred Shares qualified as Tier 1 Capital. On December 15, 2014, the Company redeemed $6.0 million (6,000 shares) of the outstanding SBLF Preferred Shares and on December 15, 2015, the remaining $6.0 million (6,000 shares) was redeemed. From July 1, 2013 to their redemption on December 15, 2015, the dividend rate on the SBLF Preferred Shares was 1.00%.


Dividend Restrictions

The primary source of cash to pay dividends to the Company’s shareholders and to meet the Company’s obligations is dividends paid to the Company by the Bank. Dividend payments by the Bank to the Company are subject to the laws of the State of New Jersey, the Banking Act, the Federal Deposit Insurance Act (“FDIA”) and the regulation of the New Jersey Department of Banking and Insurance and of the Federal Reserve. Under the Banking Act and the FDIA, a bank may not pay any dividends if, after paying such dividends, it would be undercapitalized under applicable capital requirements. In addition to these explicit limitations, the federal regulatory agencies are authorized to prohibit a banking subsidiary or bank holding company from engaging in unsafe or unsound banking practices. Depending upon the circumstances, the agencies could take the position that paying a dividend would constitute an unsafe or unsound banking practice.


It is the policy of the Federal Reserve Board that bank holding companies should pay cash dividends on common stock only out of income available from the immediately preceding year and only if prospective earnings retention is consistent with the organization’s expected future needs and financial condition. The policy provides that bank holding companies should not

10


maintain a level of cash dividend that undermines the bank holding company’s ability to serve as a source of strength to its banking subsidiary. A bank holding company may not pay dividends when it is insolvent.

In 2016,2017, Two River Bancorp paid $1.2$1.4 million in cash dividends to common shareholders.

Transactions with Affiliates

Banking laws and regulations impose certain restrictions on the ability of bank holding companies to borrow from and engage in other transactions with their subsidiary banks. Generally, these restrictions require that any extensions of credit must be secured (at levels of 100% and more) by designated amounts of specified collateral and be limited to (i) 10% of the bank’s capital stock and surplus per non-bank affiliated borrower, and (ii) 20% of the bank’s capital stock and surplus aggregated as to all non-bank affiliated borrowers. In addition, certain transactions with affiliates must be on terms and conditions, including credit standards, at least as favorable to the institution as those prevailing for arms-length transactions.

Deposit Insurance

All U.S. banks are required to have their deposits insured by the FDIC. The maximum amount of deposit insurance per depositor is $250,000. The FDIC charges premiums or “assessments” to pay for the deposit insurance provided. These assessments are based on the average total assets of a bank minus the bank’s average tangible equity.

Deposit insurance assessments have been “risk based,” in that the riskier a bank’s perceived business activities, the higher deposit insurance rate it has to pay. All banks are assigned to one of four “risk categories” by the FDIC, pursuant to their capital levels and examination results. The assignment to a particular risk category is made by the FDIC each quarter based on the most recent information available. Then, the FDIC applies certain adjustments to each bank based on its specific asset attributes to determine a final assessment ratio. As discussed above, these assessments are based on assets, not deposits, and the assessment rates will range from 2.5 basis points to 45 basis points.

The Dodd-Frank Act requires the deposit insurance fund to reach a reserve level of 1.35% of all insured deposits by September 2020, and authorizes the FDIC to implement changes in assessment rates in order to achieve such level. The Dodd-Frank Act authorizes the FDIC to establish a “designated reserve ratio” (which the FDIC has now set at 2.0%), and to reduce or eliminate assessments if the designated reserve ratio is met. If the deposit fund reserve ratio is 2.5% or more, the FDIC is authorized, but not required, to return assessments to banks. Given that most experts believe that the deposit fund will continue to incur losses over the short term for bank failures that have occurred and will occur from the financial crisis, it is expected that all banks will have to pay significant amounts of deposit insurance assessments for the foreseeable future, with little likelihood of reductions in deposit insurance assessments (or return of assessments paid) unless there is a material improvement in the economy and the health of the financial industry.

Capital Adequacy

The Federal banking regulators have adopted risk-based capital guidelines for banks and bank holding companies. The minimum guideline for the ratio of total capital to risk-weighted assets is 8%. At least half of the total capital is to be comprised of common stock, retained earnings, minority interests in the equity accounts of consolidated subsidiaries, noncumulative perpetual preferred stock and a limited amount of qualifying cumulative perpetual preferred stock, less goodwill and certain other intangibles (“Tier 1 Capital”). The remainder may consist of other preferred stock, certain other instruments and a portion of the loan loss allowance (“Tier 2 Capital”). “Total Capital” is the sum of Tier 1 Capital and Tier 2 Capital.

In addition, the Federal banking regulators have established minimum leverage ratio guidelines for banks and bank holding companies. These guidelines provide for a minimum ratio of Tier 1 Capital to average total assets of 3% for banks that meet certain specified criteria, including having the highest regulatory rating. All other banks and bank holding companies generally are required to maintain a leverage ratio of at least 3% plus an additional cushion of 100 to 200 basis points. At December 31, 2016,2017, Two River Bancorp’s leverage ratio was 8.94%8.85%.

The Company’s and the Bank’s capital ratios at December 31, 2016 and 2015 are set forth in “Management’s Discussion and Analysis of Financial Condition and Results of Operations – Capital Resource.” Both the Company and the Bank were “well-capitalized” at December 31, 2016.

Basel III Capital Rules. Effective on January 1, 2015, the federal bank regulatory agencies revised their capital adequacy guidelines and prompt corrective action rules to enhance such requirements and implement the revised standards of the Basel Committee on Banking Supervision, commonly referred to as Basel III.


The rules generally implement higher minimum capital requirements, add a new common equity Tier 1 Capital requirement, and establish criteria that instruments must meet to be considered common equity Tier 1 Capital, additional Tier 1 Capital or Tier 2 Capital. The newOur minimum capital to risk-adjusted assets requirements are a common equity Tier 1 Capital ratio of 4.5% (6.5% to be considered “well capitalized”) and, a Tier 1 Capital ratio of 6.0%, increased from 4.0% (and increased from 6.0% to 8.0%(8.0% to be considered “well capitalized”); theand a total capital ratio remains atof 8.0% under the new rules (10.0% to be considered “well capitalized”).

Under


The Company’s and the new rules,Bank’s capital ratios at December 31, 2017 and 2016 are set forth in “Management’s Discussion and Analysis of Financial Condition and Results of Operations – Capital Resource.”


11


In order to avoid limitations on capital distributions (including dividend payments and certain discretionary bonus payments to executive officers), a banking organization must hold a capital conservation buffer comprised of common equity Tier 1 Capital above its minimum risk-based capital requirements in an amount greater than 2.5% of total risk-weighted assets. The capital conservation buffer requirements phaseare being phased in over a three-year period beginning January 1, 2016.

Under these new requirements, as

As of December 31, 2016,2017, the Company and the Bank are well-capitalized"well-capitalized" and each of them has a capital conservation buffer greater than 2.5%.

Prompt Corrective Action

The Federal Deposit Insurance Act (FDIA)("FDIA") requires federal banking regulators to take prompt corrective action with respect to depository institutions that do not meet minimum capital requirements. Failure to meet minimum requirements can initiate certain mandatory and possibly additional discretionary actions by regulators that, if undertaken, could have an adverse material effect on Two River Bancorp’s financial condition. Under the FDIA’s Prompt Corrective Action Regulations, the Bank must meet specific capital guidelines that involve quantitative measures of its assets, liabilities and certain off-balance sheet items as calculated under regulatory accounting practices.

The Prompt Corrective Action Regulations define specific capital categories based on an institution’s capital ratios. The capital categories, in declining order, are “well capitalized,” “adequately capitalized,” “undercapitalized,” “significantly undercapitalized,” and “critically undercapitalized.” The FDIA imposes progressively more restrictive constraints on operations, management and capital distributions, depending on the capital category by which the institution is classified. Institutions categorized as “undercapitalized” or worse may be subject to requirements to file a capital plan with their primary federal regulator, prohibitions on the payment of dividends and management fees, restrictions on asset growth and executive compensation, and increased supervisory monitoring, among other things. Other restrictions may be imposed on the institution by the regulatory agencies, including requirements to raise additional capital, sell assets or sell the entire institution. Once an institution becomes “critically undercapitalized,” it generally must be placed in receivership or conservatorship within 90 days.

The appropriate federal banking agency may, under certain circumstances, reclassify a well-capitalized insured depository institution as adequately capitalized. The appropriate agency is also permitted to require an adequately capitalized or undercapitalized institution to comply with the supervisory provisions as if the institution were in the next lower category (but not to treat a significantly undercapitalized institution as critically undercapitalized) based on supervisory information other than an institution’s capital levels.

Unsafe and Unsound Practices

Notwithstanding its Prompt Corrective Action Regulations category dictated by risk-based capital ratios, the FDIA permits the appropriate bank regulatory agency to reclassify an institution if it determines, after notice and a hearing, that the condition of the institution is unsafe or unsound, or if it deems the institution to be engaging in an unsafe or unsound practice. Also, if a federal regulatory agency with jurisdiction over a depository institution believes that the depository institution will engage, is engaging, or has engaged in an unsafe or unsound practice, the regulator may require that the bank cease and desist from such practice, following notice and a hearing on the matter.

The USA PATRIOT Act

The USA PATRIOT Act of 2001 is a comprehensive anti-terrorism law. Title III of the USA PATRIOT Act imposes significant anti-money-laundering compliance and due diligence obligations on financial institutions, imposes crimes and penalties and expands the extra-territorial jurisdiction of the United States. The Treasury has issued a number of implementing regulations which apply various requirements of the USA PATRIOT Act to financial institutions such as the Bank. Those regulations impose new obligations on financial institutions to maintain appropriate policies, procedures and controls to detect, prevent and report money laundering and terrorist financing.

Failure of a financial institution to comply with the USA PATRIOT Act’s requirements could have serious legal consequences for the institution and adversely affect its reputation. Two River Bancorp and the Bank adopted policies, procedures and controlsdesigned to address compliance with the requirements of the USA PATRIOT Act under the existing regulations and will continue to revise and update its policies, procedures and controls to reflect changes required by the USA PATRIOT Act and by Treasury regulations.


12


Community Reinvestment Act

The Federal Community Reinvestment Act (“CRA”) requires banks to respond to the full range of credit and banking needs within their communities, including the needs of low and moderate-income individuals and areas. A bank’s failure to address the credit and banking needs of all socio-economic levels within its markets may result in restrictions on growth and expansion opportunities for the bank, including restrictions on new branch openings, relocation, formation of subsidiaries, mergers and acquisitions. Upon completion of a CRA examination, an overall CRA rating is assigned using a four-tiered rating system. These ratings are: Outstanding, Satisfactory, Needs to Improve, and Substantial Noncompliance.

In the latest CRA performance evaluation examination report with respect to the Bank, dated October 26, 2015, the Bank received a rating of Outstanding.

Consumer Privacy

The Gramm-Leach-Bliley Act’s financial privacy provisions generally prohibit financial institutions, including Two River Bancorp and the Bank, from disclosing or sharing nonpublic personal financial information to third parties for marketing or other purposes not related to transactions, unless customers have an opportunity to “opt out” of authorizing such disclosure, and have not elected to do so. It has never been the policy of Two River Bancorp or the Bank, to release such information except as may be required by law.

Loans to One Borrower

Federal banking laws limit the amount a bank may lend to a single borrower to 15% of the bank’s capital base, unless the entire amount of the loan is secured by adequate amounts of readily marketable collateral. However, no loan to one borrower may exceed 25% of a bank’s statutory capital, notwithstanding collateral pledged to secure it.

New Jersey banking law limits the total loans and extensions of credit by a bank to one borrower at one time to 15% of the capital funds of the bank when the loan is fully secured by collateral having a market value at least equal to the amount of the loans and extensions of credit. Such loans and extensions of credit are limited to 10% of the capital funds of the bank when the total loans and extensions of credit by a bank to one borrower at one time are fully secured by readily available marketable collateral having a market value (as determined by reliable and continuously available price quotations) at least equal to the amount of funds outstanding. This 10% limitation is separate from and in addition to the 15% limitation noted in the first paragraph. If a bank’s lending limit is less than $500,000, the bank may nevertheless have total loans and extensions of credit outstanding to one borrower at one time not to exceed $500,000. At December 31, 2016,2017, the Bank’s lending limit to one borrower was $15.3$16.3 million.

Dodd-Frank Act

The Dodd-Frank Act, which was enacted in July 2010, significantly restructured financial regulation in the United States.

However the implications of the Dodd-Frank Act for the Company’s businesses will depend to a large extent on the manner in which rules adopted pursuant to the Dodd-Frank Act are implemented by the primary U.S. financial regulatory agencies, as well as potential changes in market practices and structures in response to the requirements of the Dodd-Frank Act and financial reforms in other jurisdictions. Among other things:

The Dodd-Frank Act repealed the federal prohibitions on the payment of interest on demand deposits, thereby permitting depository institutions to pay interest on business transaction and other accounts. Depending on competitive responses, this significant change to existing law could have an adverse impact on the Company’s interest expense but, to date, it has not.

The Dodd-Frank Act also broadened the base for FDIC insurance assessments. Assessments are now based on the average consolidated total assets less tangible equity capital of a financial institution.

The Dodd-Frank Act also permanently increased the maximum amount of deposit insurance for banks, savings institutions and credit unions to $250,000 per depositor.

The Dodd-Frank Act centralized responsibility for consumer financial protection by creating a new agency, the Consumer Financial Protection Bureau (“CFPB”), and giving it responsibility for implementing, examining and enforcing compliance with federal consumer protection laws.

The “Durbin Amendment” provisions of the Dodd-Frank Act provided that debit card interchange fees must be reasonable and proportional to the cost incurred by the issuer with respect to the transaction. In June 2011, the Federal Reserve adopted regulations setting the maximum permissible interchange fee as the sum of 21 cents per transaction and 5 basis points multiplied by the value of the transaction, with an additional adjustment of up to one cent per transaction if the issuer implements certain fraud-prevention standards.


The Dodd-Frank Act created a new systemic risk oversight body, the Financial Stability Oversight Council (“FSOC”), to oversee and coordinate the efforts of the primary U.S. financial regulatory agencies in establishing regulations to address financial stability concerns.

The Dodd-Frank Act includes provisions permitting national and insured state banks to engage inde novo interstate branching if, under the laws of the state where the new branch is to be established, as state bank chartered in that state would be permitted to establish a branch.

The Dodd-Frank Act requires various U.S. financial regulatory agencies to implement comprehensive rules governing the supervision, structure, trading and regulation of swap and over-the-counter derivative markets and participants.

The Dodd-Frank Act requires the federal financial regulatory agencies to adopt rules that prohibit banks and their affiliates from engaging in proprietary trading and investing in and sponsoring certain unregistered investment companies (defined as hedge funds and private equity funds), with implementation starting as early as July 2012. The statutory provision is commonly referred to as the “Volcker Rule.” We do not currently anticipate that the Volcker Rule will have a material effect on our operations,although adjustments to the rule will undoubtedly be made.

Executive Compensation

The Dodd-Frank Act provides

SEC regulations provide for a say on pay for shareholders of all public companies. Under the Dodd-Frank Act,these regulations, each company must give its shareholders the opportunity to vote on the compensation of its executives at least once every three years. The Dodd-Frank ActSEC regulations also addshave disclosure and voting requirements for golden parachute compensation that is payable to named executive officers in connection with sale transactions.

On August 5, 2015, the SEC adopted final rules to implement Section 953(b) of the Dodd-Frank Act, requiring disclosure of the ratio of the CEO’s compensation to that of their median employee (“pay ratio”). An issuer’s first reporting period isTwo River Bancorp will become subject to these rules with respect to its first full year commencing on or after January 1, 2017 (e.g., companies whose fiscal year ends on December 31 will report in proxy statements and 10-Ks filed starting in 2018). 2019.
Concentration and Risk Guidance

The rule is not applicable to “smaller reporting companies,”federal banking regulatory agencies promulgated joint interagency guidance regarding material direct and indirect asset and funding concentrations. The guidance defines a concentration as defined under SEC rules. Two River Bancorp presently is a “smaller reporting company.”

On April 29, 2015, the SEC proposed rules to implement Section 953(a)any of the Dodd-Frank Act obligating companies to disclose in proxy materials for annual meetingsfollowing: (i) asset concentrations of shareholders information25% or more of Total Capital (loan related) or Tier 1 Capital (non-loan related) by individual borrower, small interrelated group of individuals, single repayment source or individual project; (ii) asset concentrations of 100% or more of Total Capital (loan related) or Tier 1 Capital (non-loan related) by industry, product line, type of collateral, or short-term obligations of one financial institution or affiliated group; (iii) funding concentrations from a single source representing 10% or more of Total Assets; or (iv) potentially volatile funding sources that shows the relationship between executive compensation actually paid to their named executive officerswhen combined represent 25% or more of Total Assets (these sources may include brokered, large, high-rate, uninsured, internet listing service deposits, Federal funds purchased or other potentially volatile deposits or borrowings). If a concentration is present, management must employ heightened risk management practices including board and their financial performance, taking into account any change in the valuemanagement oversight and strategic planning, development of the shares of a company’s stockunderwriting standards, risk assessment and dividends or distributions.monitoring through market analysis


13


and stress testing, third party review and increasing capital requirements. The timing of the final rule making and implementation has not yet been announced.

On July 1, 2015, the SEC adopted proposed rules to implement Section 954 of the Dodd-Frank Act, directing national securities exchanges (like NYSE and Nasdaq) to establish listing standards requiring companies to adopt policies that require executive officers to pay back incentive-based compensation that they were erroneously awarded. The failure by any company to adopt, disclose and implement such a policy would result in a delisting of its securities by such exchanges. The required policy would provide that, in the event the company is required to prepare an accounting restatement dueBank adheres to the material noncompliance of the company with any financial reporting requirement under the securities laws, the company will recover from any current or former executive officer of the company who received incentive-based compensation during the three-year period preceding the date on which the company is required to prepare the restatement based on the erroneous data, any exceptional compensation above what would have been paid under the restatement. The comment period for the proposed rule ended September 14, 2015, and the SEC has not taken any further action to finalize rules for the exchanges. However, companies must comply with the rule within 60 days of the final rule making.

Corporate Governance

On February 9, 2015, the SEC adopted proposed rules to implement Section 955 of the Dodd-Frank Act requiring that each company disclosepractices recommended in the proxy materials for its annual meetings whether an employee or board member is permitted to purchase financial instruments designed to hedge or offset decreases in the market value of equity securities granted as compensation or otherwise held by the employee or board member. The timing of the final rule making and implementation has not yet been announced.

The Dodd-Frank Act clarifies that the SEC may, but is not required to, promulgate rules that would require that a company’s proxy materials include a nominee for the board of directors submitted by a shareholder. Although the SEC promulgated rules to accomplish this these rules were invalidated by a federal appeals court decision. The SEC has said that they will not challenge the ruling, but has not ruled out the possibility that new rules could be proposed.

guidance.

The Dodd-Frank Act requires stock exchanges to have rules prohibiting their members from voting securities that they do not beneficially own (unless they have received voting instructions from the beneficial owner) with respect to the election of a member of the board of directors (other than an uncontested election of directors of an investment company registered under the Investment Company Act of 1940), executive compensation or any other significant matter, as determined by the SEC by rule.

FDIC Matters and Resolution Planning

The Dodd-Frank Act created an orderly liquidation process that the FDIC can employ for failing financial companies that are not insured depository institutions. The Dodd-Frank Act gives the FDIC new authority to create a widely available emergency financial stabilization program to guarantee the obligations of solvent depository institutions and their holding companies and affiliates during times of severe economic stress. Additionally, Dodd-Frank also codifies many of the temporary changes that had already been implemented, such as permanently increasing the amount of deposit insurance to $250,000.

New laws or regulations or changes to existing laws and regulations (including changes in interpretation or enforcement) could materially adversely affect our financial condition or results of operations. Many aspects of the Dodd-Frank Act are subject to further rulemaking and interpretation, and will take effect over several years. The overall financial impact on the Company and its subsidiaries or the financial services industry generally cannot be anticipated at this time.

Overall Impact of New Legislation and Regulations

Various legislative initiatives are from time to time introduced in Congress and in the New Jersey State Legislature. It cannot be predicted whether or to what extent the business and condition of Two River Bancorp or the Bank will be affected by new legislation or regulations, and legislation or regulations as yet to be proposed or enacted. Given that the financial industry remains under stress and severe scrutiny, and given that the U.S. economy has not yet fully recovered to pre-crisis levels of activity, we fully suspect that there will be significant legislation and regulatory actions that will materially affect the banking industry generally and our bank specifically for the foreseeable future.

Available Information

The Company maintains a website at www.tworiverbank.com. The Company makes available on its website free of charge its annual reports on Form 10-K, quarterly reports on Form 10-Q, Extensible Business Reporting Language (“XBRL”), a standards-based way to communicate and exchange business information between business systems, and current reports on Form 8-K, and amendments to those reports which are filed with or furnished to the SEC pursuant to Section 13(a) of the Securities Exchange Act of 1934. These documents are made available on the Company’s website as soon as reasonably practicable after they are electronically filed with or furnished to the SEC. Also available on the website are our Code of Conduct, our Shareholder Communications Policy and the charters of our Nominating and Corporate Governance Committee, Audit Committee, and Compensation Committee.


Item 1A. Risk Factors.

The following are some important factors that could cause the Company’s actual results to differ materially from those referred to or implied in any forward-looking statement. These are in addition to the risks and uncertainties discussed elsewhere in this Annual Report on Form 10-K and the Company’s other filings with the SEC.

Our dependence on loans secured by real estate subjects us to risks relating to fluctuations in the real estate market and related interest rates, and to legislation that could result in significant additional costs and capital requirements, which could adversely affect our financial condition and results of operations.

Approximately 92.2%92.6% of our loan portfolio as of December 31, 20162017 was comprised of loans collateralized by real estate, with 98.7%98.4% of the real estate located in New Jersey. The real estate collateral in each case provides an alternate source of repayment in the event of default by the borrower and may deteriorate in value during the time the credit is extended. A weakening of the real estate market in our primary market areas could have an adverse effect on the demand for new loans, the ability of borrowers to repay outstanding loans, the value of real estate and other collateral securing the loans and the value of real estate owned by us. As real estate values decline, it is also more likely that we would be required to make provisions for additional loan losses, which could adversely affect our financial condition and results of operations.


As of December 31, 2016,2017, we had $111.9$118.1 million, or 14.9%13.9%, of our total loans in real estate construction loans. Of this amount, $3.9$7.2 million were land loans and $94.6$82.3 million were made to finance residential construction. Substantially all of these loans are located in Monmouth, Middlesex, Union and Ocean Counties, New Jersey. Further, $13.4$28.6 million of real estate construction loans were made to finance commercial construction. Construction loans are subject to risks during the construction phase that are not present in standard residential real estate and commercial real estate loans. These risks include:

the viability of the contractor;

the value of the project being subject to successful completion;

the contractor’s ability to complete the project, to meet deadlines and time schedules and to stay within cost estimates; and

concentrations of such loans with a single contractor and its affiliates.

the viability of the contractor;
the value of the project being subject to successful completion;
the contractor’s ability to complete the project, to meet deadlines and time schedules and to stay within cost estimates; and
concentrations of such loans with a single contractor and its affiliates.

Real estate construction loans also present risks of default in the event of declines in property values or volatility in the real estate market during the construction phase. If we are forced to foreclose on a project prior to completion, we may not be able to recover the entire unpaid portion of the loan, may be required to fund additional amounts to complete a project and may have to hold the property for an indeterminate amount of time. If any of these risks were to occur, it could adversely affect our financial condition, results of operations and cash flows.


14


The federal banking agencies have issued guidance regarding high concentrations of commercial real estate loans within bank loan portfolios. The guidance requires financial institutions that exceed certain levels of commercial real estate lending compared with their total capital to maintain heightened risk management practices that address the following key elements: including board and management oversight and strategic planning, portfolio management, development of underwriting standards, risk assessment and monitoring through market analysis and stress testing, and maintenance of increased capital levels as needed to support the level of commercial real estate lending. If there is any deterioration in our commercial real estate or real estate construction portfolios or if our regulators conclude that we have not implemented appropriate risk management practices, it could adversely affect our business and result in a requirement of increased capital levels, and such capital may not be available at that time.

Our commercial real estate and commercial loans expose us to increased credit risks, and these risks will increase if we succeed in increasing these types of loans.

We focus our lending efforts on commercial-related loans and intend to grow commercial real estate and commercial loans further as a percentage of our portfolio. As of December 31, 2016,2017, commercial real estate loans and commercial and industrial loans totaled $554.4$639.1 million. In general, commercial real estate loans and commercial and industrial loans yield higher returns and often generate a deposit relationship, but also pose greater credit risks than do owner-occupied residential real estate loans. As our various commercial-related loan portfolios increase, the corresponding risks and potential for losses from these loans will also increase.

We make both secured and some unsecured commercial and industrial loans. Unsecured loans generally involve a higher degree of risk of loss than do secured loans because, without collateral, repayment is wholly dependent upon the success of the borrowers’ businesses or the guarantor(s). Secured commercial and industrial loans are generally collateralized by accounts receivable, inventory, equipment or other assets owned by the borrower and include a personal guaranty of the business owner. Compared to real estate, that type of collateral is more difficult to monitor, its value is harder to ascertain, it may depreciate more rapidly and it may not be as readily saleable if repossessed. Further, commercial and industrial loans generally will be serviced primarily from the operation of the business, which may not be successful, and commercial real estate loans generally will be serviced from income on the properties securing the loans.

Our financial condition and results of operations could be adversely affected if our allowance for loan losses is not sufficient to absorb actual losses or if we are required to increase our allowance.

Despite our underwriting criteria, we may experience loan delinquencies and losses. In order to absorb losses associated with non-performing loans, we maintain an allowance for loan losses based on, among other things, historical experience, an evaluation of economic conditions, and regular reviews of delinquencies and loan portfolio quality. Determination of the allowance inherently involves a high degree of subjectivity and requires us to make significant estimates of current credit risks and future trends, all of which may undergo material changes. At any time there are likely to be loans in our portfolio that will result in losses but that have not been identified as non-performing or potential problem credits. We cannot be sure that we will be able to identify deteriorating credits before they become non-performing assets or that we will be able to limit losses on those loans that are identified.


At December 31, 2017, the Bank’s allowance for loan losses was $10.7 million, which equaled 1.25% of the Bank’s total loans.

We may be required to increase our allowance for loan losses for any of several reasons. State and federal regulators, in reviewing our loan portfolio as part of a regulatory examination, may request that we increase our allowance for loan losses. Changes in economic conditions affecting borrowers, new information regarding existing loans, identification of additional problem loans and other factors, both within and outside of our control, may require an increase in our allowance. In addition, if charge-offs in future periods exceed our allowance for loan losses, we will need additional increases in our allowance for loan losses. Any increases in our allowance for loan losses will result in a decrease in our net income and, possibly, our capital, and may materially affect our results of operations in the period in which the allowance is increased.


Changes in tax laws could have an adverse effect on the Company, the banking industry, the Bank’s customers, the value of collateral securing loans and demand for loans.

Changes in tax laws contained in the recently enacted Tax Cuts and Jobs Act (the “Tax Act”) contain a number of provisions which could have an impact on the banking industry, borrowers and the market for single family residential and commercial real estate. Among the changes are: lower limits on the deductibility of mortgage interest on single family residential mortgages; a broad limitation on deductibility of business interest expense which will affect commercial borrowers; and limitations

15


on the deductibility of property taxes and state and local income taxes. We cannot predict the ultimate impact of these changes. However, such changes may have an adverse effect on the market for and valuation of single family residential properties and commercial real estate, the economics of borrowing by businesses, and on the demand for residential and commercial mortgage and business loans in the future. If home ownership or business borrowing become less attractive, demand for our loans would decrease. The value of the properties securing loans in our portfolio may be adversely impacted as a result of the changing economics of home ownership and borrowing, which could require an increase in our provision for loan losses, which would reduce our profitability and could materially adversely affect our business, financial condition and results of operations. Additionally, certain borrowers could become less able to service their debts if these changes become effective. These changes could adversely affect our business, financial condition and results of operations.

We may not be able to successfully integrate any banks or other businesses that we may acquire.

Our strategy has been to carefully evaluate each acquisition opportunity presented to us to determine whether it fits into our strategic growth plan and ensure that it does not involve excessive risk to the Company. Should we decide to pursue any acquisition opportunity, we may not be able to successfully integrate the assets, liabilities, customers, systems and management personnel we acquire into our operations, and we may not be able to realize related revenue synergies and cost savings within our expected time frames. In addition, we will incur substantial legal, investment banking, accounting and other expenses in pursuing any acquisitions. In respect to any completed acquisition, there will be potential goodwill impairment charges and fluctuations in the fair values of assets in the event projected financial results are not achieved within expected time frames.

Negative developments in the financial services industry and the U.S. and global credit markets may adversely impact our operations and results.

Financial institution regulatory agencies have been very aggressive in responding to concerns and trends identified in examinations, including the expected issuance of many formal enforcement actions. Negative developments in the financial services industry and the impact of new legislation in response to those developments could negatively impact our operations by restricting our business operations, including our ability to originate or sell loans, and adversely impact our financial performance.

The effects of another Superstorm Sandy or similar natural disaster may negatively impact collateral values or loan originations in the areas in which we do business.

On October 29, 2012, Superstorm Sandy made landfall in New Jersey, causing widespread property damage throughout the northeastern United States, including our primary market area in New Jersey. A similar or worse natural disaster than Superstorm Sandy could have a material adverse effect. Natural disasters can disrupt our operations, result in damage to our properties, reduce or destroy the value of the collateral for our loans and negatively affect the local economies in which we operate, which could have a material adverse effect on our results of operations and financial condition. The occurrence of a natural disaster could result in one or more of the following: (i) an increase in loan delinquencies; (ii) an increase in problem assets and foreclosures; (iii) a decrease in the demand for our products and services; or (iv) a decrease in the value of the collateral for loans, especially real estate, in turn reducing customers’ borrowing power, the value of assets associated with problem loans and collateral coverage.

The Company’s profitability depends significantly on local economic conditions.

The Company’s success depends primarily on the general economic conditions of the primary markets in New Jersey in which it operates and where its loans are concentrated. Unlike nationwide banks that are more geographically diversified, the Company provides banking and financial services to customers primarily in Monmouth, Middlesex, Union and Ocean Counties, New Jersey. The local economic conditions in these areas have a significant impact on the Company’s commercial and industrial, real estate and construction loans, the ability of its borrowers to repay their loans and the value of the collateral securing these loans. In addition, if the population or income growth in the Company’s market areas is slower than projected, income levels, deposits and housing starts could be adversely affected and could result in a reduction of the Company’s expansion, growth and profitability. If the Company’s market areas experience a downturn or a recession for a prolonged period of time, the Company could experience significant increases in nonperforming loans, which could lead to operating losses, impaired liquidity and eroding capital. A significant decline in general economic conditions, caused by inflation, recession, acts of terrorism, outbreaks of hostilities or other international or domestic calamities, unemployment, monetary and fiscal policies of the federal government or other factors could impact these local economic conditions and could negatively affect the Company’s financial condition, results of operations and cash flows.


16


The small to medium-sized businesses that the Company lends to may have fewer resources to weather a downturn in the economy, which may impair a borrower’s ability to repay a loan to the Company that could materially harm the Company’s operating results.

The Company targets its business development and marketing strategy primarily to serve the banking and financial services needs of small to medium-sized businesses. These small to medium-sized businesses frequently have smaller market share than their competition, may be more vulnerable to economic downturns, often need substantial additional capital to expand or compete and may experience significant volatility in operating results. Any one or more of these factors may impair the borrower’s ability to repay a loan. In addition, the success of a small to medium-sized business often depends on the management talents and efforts of one or two persons or a small group of persons, and the death, disability or resignation of one or more of these persons could have a material adverse impact on the business and its ability to repay a loan. Economic downturns and other events that negatively impact the Company’s market areas could cause the Company to incur substantial credit losses that could negatively affect the Company’s results of operations and financial condition.

Changes in interest rates could reduce our income, cash flows and asset values.

Our income and cash flows and the value of our assets depend to a great extent on the difference between the interest rates we earn on interest-earning assets, such as loans and investment securities, and the interest rates we pay on interest-bearing liabilities such as deposits and borrowings. These rates are highly sensitive to many factors which are beyond our control, including general economic conditions and policies of various governmental and regulatory agencies and, in particular, the Federal Reserve. Changes in monetary policy, including changes in interest rates, will influence not only the interest we receive on our loans and investment securities and the amount of interest we pay on deposits and borrowings but will also affect our ability to originate loans and obtain deposits and the value of our investment portfolio. If the rate of interest we pay on our deposits and other borrowings increases more than the rate of interest we earn on our loans and other investments, our net interest income, and therefore our earnings, could be adversely affected. Our earnings also could be adversely affected if the rates on our loans and other investments fall more quickly than those on our deposits and other borrowings.


Competition may decrease our growth or profits.

We face substantial competition in all phases of our operations from a variety of different competitors, including commercial banks, savings and loan associations, mutual savings banks, credit unions, consumer finance companies, factoring companies, leasing companies, insurance companies and money market mutual funds. There is very strong competition among financial services providers in our principal service area. Our competitors may have greater resources, higher lending limits or larger branch systems than we do. Accordingly, they may be able to offer a broader range of products and services as well as better pricing for those products and services than we can.

In addition, some of the financial services organizations with which we compete are not subject to the same degree of regulation as is imposed on federally insured financial institutions such as the Bank. As a result, those non-bank competitors may be able to access funding and provide various services more easily or at less cost than we can, adversely affecting our ability to compete effectively.

We rely on our management and other key personnel, and the loss of any of them may adversely affect our operations.

We are and will continue to be dependent upon the services of our executive management team. The Company’s performance is largely dependent on the talents and efforts of highly skilled individuals. There is intense competition in the financial services industry for qualified employees. In addition, the Company faces increasing competition with businesses outside the financial services industry for the most highly skilled individuals. The unexpected loss of services of any key management personnel or commercial loan officers could have an adverse effect on our business and financial condition because of their skills, knowledge of our market, years of industry experience and the difficulty of promptly finding qualified replacement personnel. The Company’s business operations could be adversely affected if it were unable to attract new employees and retain and motivate its existing employees.

We may be adversely affected by government regulation.

The banking industry is heavily regulated. Banking regulations are primarily intended to protect the federal deposit insurance funds and depositors, not shareholders. Changes in the laws, regulations, and regulatory practices affecting the banking industry may increase our costs of doing business or otherwise adversely affect us and create competitive advantages for others. Regulations affecting banks and financial services companies undergo continuous change, and we cannot predict the ultimate effect of these changes, which could have a material adverse effect on our profitability or financial condition.


17


The anti-money laundering or AML, and bank secrecy, or BSA, laws have imposed far-reaching and substantial requirements on financial institutions. The enforcement policy with respect to AML/BSA compliance has been vigorously applied throughout the industry, with regulatory action taking various forms. We believe that our policies and procedures with respect to combating money laundering are effective and that our AML/BSA policies and procedures are reasonably designed to comply with current applicable standards. We cannot provide assurance that in the future we will not face a regulatory action, adversely affecting our ability to acquire banks or open new branches.

Additionally, the federal government has passed a variety of other reforms related to banking and the financial industry including, without limitation, the Dodd-Frank Act.industry. See “Item 1. Business – Supervision and Regulation.”

Some provisions of the Dodd-Frank Act became effective immediately upon its enactment. Many provisions, however, required the adoption of rules by various agencies, many of which are very complex,

Future banking laws and many of which will be further amended as experience dictates. The provisions of the Dodd-Frank Act may have unintended effects, which will not be clear until actual experience by the industry with the rules is accomplished. The changes resulting from the Dodd-Frank Actregulations could limit our business activities, require changes to certain of our business practices, impose upon us more stringent capital, liquidity and leverage requirements or otherwise materially and adversely affect us. These changes may also require us to invest significant management attention and resources to evaluate and make any changes necessary to comply with new statutory and regulatory requirements. Failure to comply with theany new requirements could also materially and adversely affect us.


The short-term and long-term impact of the changingour regulatory capital requirements and new capital rules is uncertain and could adversely affect us.

The Company and the Bank are subject to capital requirements under regulations adopted by the federal banking regulators. The application of these capital requirements could, among other things, result in lower returns on invested capital, over time require the raising of additional capital, and result in regulatory actions if we were to be unable to comply with such requirements. Implementation of changes to assetAsset risk weightings for risk based capital calculations, items included or deducted in calculating regulatory capital and/or additional capital conservation buffers could result in management modifying its business strategy. Furthermore, the imposition of liquidity requirements in connection with these capital requirements could result in our having to lengthen the term of our funding, restructure our business models, and/or increase our holdings of liquid assets. Any additional changes in our regulation and oversight, in the form of new laws, rules and regulations could make compliance more difficult or expensive or otherwise materially adversely affect our business, financial condition or prospects.

We depend upon the accuracy and completeness of information about customers.

In deciding whether to extend credit to customers, we may rely on information provided to us by our customers, including financial statements and other financial information. We may also rely on representations of customers as to the accuracy and completeness of that information and, with respect to financial statements, on reports of independent auditors. Our financial condition and results of operations could be negatively impacted to the extent that we extend credit in reliance on financial statements or other information provided by customers that is false or misleading.

Our information systems may experience an interruption or breach in security.

We rely heavily on communications and information systems to conduct our business. Any failure, interruption or breach in security of these systems could result in failures or disruptions in our customer-relationship management, general ledger, deposit, loan and other systems. While we have policies and procedures designed to prevent or limit the effect of the failure, interruption or security breach of our information systems, there can be no assurance that any such failures, interruptions or security breaches will not occur; or, if they do occur, that they will be adequately addressed. The occurrence of any failures, interruptions or security breaches of our information systems could damage our reputation, result in a loss of customer business, subject us to additional regulatory scrutiny or expose us to civil litigation and possible financial liability; any of which could have a material adverse effect on our financial condition and results of operations.

We face the risk of cyber-attack to our computer systems.

Our computer systems, software and networks have been and will continue to be vulnerable to unauthorized access, loss or destruction of data (including confidential client information), account takeovers, unavailability of service, computer viruses or other malicious code, cyber-attacks and other events. These threats may derive from human error, fraud or malice on the part of employees or third parties, or may result from accidental technological failure. If one or more of these events occurs, it could result in the disclosure of confidential client information, damage to our reputation with our clients and the market, additional costs to us (such as repairing systems or adding new personnel or protection technologies), regulatory penalties and financial losses, to both us and our clients and customers. Such events could also cause interruptions or malfunctions in our operations (such as the lack of availability of our online banking system), as well as the operations of our clients, customers or other third parties.

18


Although we maintain safeguards to protect against these risks, there can be no assurance that we will not suffer losses in the future that may be material in amount.

We rely on third parties to provide key components of our business infrastructure, and a failure of these parties to perform for any reason could disrupt our operations.

Third parties provide key components of our business infrastructure such as data processing, internet connections, network access, core application processing, statement production and account analysis. Our business depends on the successful and uninterrupted functioning of our information technology and telecommunications systems and third-party servicers. The failure of these systems, or the termination of a third-party software license or service agreement on which any of these systems is based, could interrupt our operations. Because our information technology and telecommunications systems interface with and depend on third-party systems, we could experience service denials if demand for such services exceeds capacity or such third-party systems fail or experience interruptions. Replacing vendors or addressing other issues with our third-party service providers could entail significant delay and expense. If we are unable to efficiently replace ineffective service providers, or if we experience a significant, sustained or repeated, system failure or service denial, it could compromise our ability to operate effectively, damage our reputation, result in a loss of customer business, and subject us to additional regulatory scrutiny and possible financial liability, any of which could have a material adverse effect on our business, financial condition, results of operations and future prospects.

Environmental liability associated with lending activities could result in losses.

In the course of our business, we may foreclose on and take title to properties securing our loans. If hazardous substances were discovered on any of these properties, we could be liable to governmental entities or third parties for the costs of remediation of the hazard, as well as for personal injury and property damage. Many environmental laws can impose liability regardless of whether we knew of, or were responsible for, the contamination. In addition, if we arrange for the disposal of hazardous or toxic substances at another site, we may be liable for the costs of cleaning up and removing those substances from the site even if we neither own nor operate the disposal site. Environmental laws may require us to incur substantial expenses and may materially limit use of properties we acquire through foreclosure, reduce their value or limit our ability to sell them in the event of a default on the loans they secure. In addition, future laws or more stringent interpretations or enforcement policies with respect to existing laws may increase our exposure to environmental liability.


Failure to implement new technologies in our operations may adversely affect our growth or profits.

The market for financial services, including banking services and consumer finance services is increasingly affected by advances in technology, including developments in telecommunications, data processing, computers, automation, Internet-based banking and telebanking. Our ability to compete successfully in our markets may depend on the extent to which we are able to exploit such technological changes. However, we can provide no assurance that we will be able to properly or timely anticipate or implement such technologies or properly train our staff to use such technologies. Any failure to adapt to new technologies could adversely affect our business, financial condition or operating results.

A limited market exists for our common stock.

Our common stock commenced trading on the Nasdaq Capital Market on April 4, 2006 and Nasdaq upgraded the listing of the common stock to the Nasdaq Global Market on August 12, 2015. However, trading volumes for our common stock have always been modest. The limited trading market for our common stock may cause fluctuations in the market value of our common stock to be exaggerated, leading to price volatility in excess of that which would occur in a more active trading market. Accordingly, you may have difficulty selling our common stock at prices which you find acceptable or which accurately reflect the value of the Company.

We are subject to liquidity risk.

Liquidity risk is the potential that we will be unable to meet our obligations as they become due, capitalize on growth opportunities as they arise, or pay regular cash dividends because of an inability to liquidate assets or obtain adequate funding in a timely basis, at a reasonable cost and within acceptable risk tolerances.

Liquidity is required to fund various obligations, including credit commitments to borrowers, mortgage and other loan originations, withdrawals by depositors, repayment of borrowings, dividends to shareholders, operating expenses and capital expenditures. Liquidity is derived primarily from retail deposit growth and retention; principal and interest payments on loans; principal and interest payments on and the sale, maturity and prepayment of investment securities; net cash provided from operations and access to other funding sources.

Our access to funding sources in amounts adequate to finance our activities could be impaired by factors that affect us specifically or the financial services industry in general. Factors that could detrimentally impact our access to liquidity sources include a decrease in the level of our business activity due to a market downturn or adverse regulatory action against us. Our ability to borrow could also be impaired by factors that are not specific to us, such as a severe disruption of the financial markets or negative views and expectations about the prospects for the financial services industry as a whole.


19


Future offerings of debt or other securities may adversely affect the market price of our stock.

On December 16, 2015, we completed a private placement of $10 million in aggregate principal amount fixed to floating rate subordinated debentures to certain institutional accredited investors. A portion of the proceeds from that private placement was used to repay the remaining $6.0 million of Series C preferred stock that was issued to the United States Treasury in connection with its participation in the Small Business Lending Fund Program. The remaining proceeds from the placement of the debenture will be used for general corporate purposes and to support future growth.

In the future, we may attempt to increase our capital resources or, if our or the Bank’s capital ratios fall below the required minimums, the Company could be forced to raise additional capital by making additional offerings of debt or equity securities, including common or preferred stock and senior or subordinated debentures. The Company currently has a shelf registration statement on file with the Securities and Exchange Commission to allow us to access the capital markets more quickly should the need or desire arise. Upon liquidation, holders of any debt securities and shares of preferred stock and lenders with respect to other borrowings will receive distributions of our available assets prior to the holders of our common stock. Additional equity offerings may dilute the holdings of our existing shareholders or reduce the market price of our common stock, or both. Holders of our common stock are not entitled to preemptive rights or other protections against dilution.

The Company may lose lower-cost funding sources.

Checking, savings, and money market deposit account balances and other forms of customer deposits can decrease when customers perceive alternative investments, such as the stock market, as providing a better risk/return tradeoff. If customers move money out of bank deposits and into other investments, the Company could lose a relatively low-cost source of funds, increasing its funding costs and reducing the Company’s net interest income and net income.


Changes in consumers’ use of banks and changes in consumers’ spending and saving habits could adversely affect the Company’s financial results.

��

Technology and other changes now allow many consumers to complete financial transactions without using banks. For example, consumers can pay bills and transfer funds directly without going through a bank. This disintermediation could result in the loss of fee income, as well as the loss of customer deposits and income generated from those deposits. In addition, changes in consumer spending and saving habits could adversely affect our operations, and we may be unable to timely develop competitive new products and services in response to these changes that are accepted by new and existing customers.

The Company is subject to operational risk.

The Company faces the risk that the design of its controls and procedures, including those to mitigate the risk of fraud by employees or outsiders, may prove to be inadequate or are circumvented, thereby causing delays in detection of errors or inaccuracies in data and information. Management regularly reviews and updates the Company’s internal controls, disclosure controls and procedures, and corporate governance policies and procedures. Any system of controls, however well designed and operated, is based in part on certain assumptions and can provide only reasonable, not absolute, assurances that the objectives of the system are met. Any failure or circumvention of the Company’s controls and procedures or failure to comply with regulations related to controls and procedures could have a material adverse effect on the Company’s business, results of operations and financial condition.

The Company may also be subject to disruptions of its systems arising from events that are wholly or partially beyond its control (including, for example, computer viruses or electrical or telecommunications outages), which may give rise to losses in service to customers and to financial loss or liability. The Company is further exposed to the risk that its external vendors may be unable to fulfill their contractual obligations (or will be subject to the same risk of fraud or operational errors by their respective employees as is the Company) and to the risk that the Company’s (or its vendors’) business continuity and data security systems prove to be inadequate.

Negative publicity could damage our reputation and adversely impact our business and financial results.

Reputation risk, or the risk to our earnings and capital from negative publicity, is inherent in our business. Negative publicity can result from our actual or alleged conduct in any number of activities, including lending practices, corporate governance, acquisitions, and actions taken by government regulators and community organizations in response to those activities. Negative publicity can adversely affect our ability to keep and attract customers and can expose us to litigation and regulatory action. Although we take steps to minimize reputation risk in dealing with customers and other constituencies, as a financial services company with a high profile in our market area, we are inherently exposed to this risk.


Our SBA lending program is dependent upon the federal government and we face specific risks associated with originating SBA loans.

Our SBA lending program is dependent upon the federal government. As an SBA Preferred Lender, we enable our clients to obtain SBA loans without being subject to the potentially lengthy SBA approval process necessary for lenders that are

20


not SBA Preferred Lenders. The SBA periodically reviews the lending operations of participating lenders to assess, among other things, whether the lender exhibits prudent risk management. When weaknesses are identified, the SBA may request corrective actions or impose enforcement actions, including revocation of the lender’s Preferred Lender status. If we lose our status as a Preferred Lender, we may lose some or all of our customers to lenders who are SBA Preferred Lenders. Also, any changes to the SBA program, including changes to the level of guarantee provided by the federal government on SBA loans, could adversely affect our business and earnings.

We generally sell the guaranteed portion of our SBA 7(a) program loans in the secondary market. These sales have resulted in premium income for us at the time of sale and created a stream of future servicing income. We may not be able to continue originating these loans or selling them in the secondary market. Furthermore, even if we are able to continue originating and selling SBA 7(a) program loans in the secondary market, we might not continue to realize premiums upon the sale of the guaranteed portion of these loans. When we sell the guaranteed portion of our SBA 7(a) program loans, we incur credit risk on the non-guaranteed portion of the loans, and if a customer defaults on the non-guaranteed portion of a loan, we share any loss and recovery related to the loan pro-rata with the SBA. If the SBA establishes that a loss on an SBA guaranteed loan is attributable to significant technical deficiencies in the manner in which the loan was originated, funded or serviced by us, the SBA may seek recovery of the principal loss related to the deficiency from us, which could adversely affect our business and earnings.

The laws, regulations and standard operating procedures that are applicable to SBA loan products may change in the future. We cannot predict the effects of these changes on our business and profitability. Because government regulation greatly affects the business and financial results of all commercial banks and bank holding companies, changes in the laws, regulations and procedures applicable to SBA loans could adversely affect our business and earnings.


New lines of business or new products and services may subject the Bank to additional risks.
From time to time, the Bank may implement new lines of business or offer new products and services within existing lines of business. There are substantial risks and uncertainties associated with these efforts, particularly in instances where the markets are not fully developed. In developing and marketing new lines of business and/or new products and services, the Bank may invest significant time and resources. Initial timetables for the introduction and development of new lines of business and/or new products or services may not be achieved and price and profitability targets may not prove feasible. External factors, such as compliance with regulations, competitive alternatives, and shifting market preferences, may also impact the successful implementation of a new line of business and/or a new product or service. Furthermore, any new line of business and/or new product or service could have a significant impact on the effectiveness of the Bank’s system of internal controls. Failure to successfully manage these risks in the development and implementation of new lines of business and new products or services could have a material adverse effect on the Company’s business, financial condition, and results of operations.

The FASB has recently issued an accounting standard update that will result in a significant change in how we recognize credit losses and may have a material impact on our financial condition or results of operations.

In June 2016, the Financial Accounting Standards Board (“FASB”) issued an accounting standard update, “Financial Instruments-Credit Losses (Topic 326), Measurement of Credit Losses on Financial Instruments,” which replaces the current “incurred loss” model for recognizing credit losses with an “expected loss” model referred to as the Current Expected Credit Loss (“CECL”) model. Under the CECL model, banks will be required to present certain financial assets carried at amortized cost, such as loans held for investment and held-to-maturity debt securities, at the net amount expected to be collected. The measurement of expected credit losses is to be based on information about past events, including historical experience, current conditions, and reasonable and supportable forecasts that affect the collectability of the reported amount. This measurement will take place at the time the financial asset is first added to the balance sheet and periodically thereafter. This differs significantly from the “incurred loss” model required under current generally accepted accounting principles (“GAAP”), which delays recognition until it is probable a loss has been incurred. Accordingly, we expect that the adoption of the CECL model will materially affect how we determine our allowance for loan losses, and could require us to significantly increase our allowance. Moreover, the CECL model may create more volatility in the level of the allowance for loan losses. If we are required to materially increase the level of its allowance for loan losses for any reason, such increase could adversely affect our business, financial condition and results of operations.

The new CECL standard will become effective for the Company for fiscal years beginning after December 15, 2019 and for interim periods within those fiscal years. We are evaluating the impact the CECL model will have on our accounting, but we expect to recognize a one-time cumulative-effect adjustment to the allowance for loan losses as of the beginning of the first reporting period in which the new standard is effective, consistent with regulatory expectations set forth in interagency guidance issued at the end of 2016. We cannot yet determine the magnitude of any such one-time cumulative adjustment or of the overall impact of the new standard on its financial condition or results of operations.

21


The increasing use of social media platforms presents new risks and challenges and the inability or failure to recognize, respond to, and effectively manage the accelerated impact of social media could materially adversely impact the Bank’s business.

There has been a marked increase in the use of social media platforms, including weblogs (blogs), social media websites, and other forms of Internet-based communications which allow individuals access to a broad audience of consumers and other interested persons. Social media practices in the banking industry are evolving, which creates uncertainty and risk of noncompliance with regulations applicable to the Bank’s business. Consumers value readily available information concerning businesses and their goods and services and often act on such information without further investigation and without regard to its accuracy. Many social media platforms immediately publish the content their subscribers and participants post, often without filters or checks on accuracy of the content posted. Information posted on such platforms at any time may be adverse to the Bank’s interests and/or may be inaccurate. The dissemination of information online could harm the Bank’s business, prospects, financial condition, and results of operations, regardless of the information’s accuracy. The harm may be immediate without affording the Bank an opportunity for redress or correction.

Other risks associated with the use of social media include improper disclosure of proprietary information, negative comments about the Bank’s business, exposure of personally identifiable information, fraud, out-of-date information, and improper use by employees, directors and customers. The inappropriate use of social media by the Bank’s customers, directors or employees could result in negative consequences such as remediation costs including training for employees, additional regulatory scrutiny and possible regulatory penalties, litigation, or negative publicity that could damage the Bank’s reputation adversely affecting customer or investor confidence.

Item 1B. Unresolved Staff Comments.

Not applicable.


22


Item 2. Properties.

The following table provides certain information with respect to properties used by the Company or the Bank in their operations:  

Office Location


Address


Description


Opened


Corporate Headquarters:

Headquarters:

766 Shrewsbury Avenue

Tinton Falls, NJ

17,626 sq. ft. building (leased)

10/12

The Bank’s Main Office:

1250 Highway 35 South

Middletown, NJ

5,300 sq. ft. first-floor stand-alone building (leased)

02/00

Allaire:

Monmouth Executive Airport

229 Airport Road, Bldg. 13

Farmingdale, NJ

3,800 sq. ft. building (leased)

02/04

Atlantic Highlands:

84 First Avenue

Atlantic Highlands, NJ

817 sq. ft. store front (leased)

03/02

Cranford Office:

245-249 North Avenue

Cranford, NJ

2,438 sq. ft. stand-alone building (owned)

01/15

Fanwood:

328 South Avenue

Fanwood, NJ

2,966 sq. ft. stand-alone building (leased)

03/08

Freehold:


31 East Main Street

Freehold, NJ

2,060 sq. ft. in strip shopping center (leased)

05/15

10/12


Manasquan:The Bank’s Main Office

:

240 Route 71

Manasquan,

1250 Highway 35 South
Middletown, NJ

3,7615,300 sq. ft. first-floor stand-alone building (leased)

06/08

Navesink:

Eastpointe Shopping Center

2345 Route 36

Atlantic Highlands, NJ

2,080 sq. ft. in strip shopping center (leased)

09/05

New Brunswick:


Kilmer Square

94 Albany Street

New Brunswick, NJ

1,162 sq. ft. in strip shopping center (leased)

04/14

02/00


Atlantic Highlands:
84 First Avenue
Atlantic Highlands, NJ
817 sq. ft. store front (leased)03/02
Cranford Office:
245-249 North Avenue
Cranford, NJ
2,438 sq. ft. stand-alone building (owned)01/15
Fanwood:
328 South Avenue
Fanwood, NJ
2,966 sq. ft. stand-alone building (leased)03/08
Freehold:
31 East Main Street
Freehold, NJ
2,060 sq. ft. in strip shopping center (leased)05/15
Navesink:
Eastpointe Shopping Center
2345 Route 36
Atlantic Highlands, NJ
2,080 sq. ft. in strip shopping center (leased)09/05
New Brunswick:
Kilmer Square
94 Albany Street
New Brunswick, NJ
1,162 sq. ft. in strip shopping center (leased)04/14
Port Monmouth:

357 Highway 36

Port Monmouth, NJ

2,180 sq. ft. stand-alone building (leased)

06/01

Red Bank:

140 Broad Street

Red Bank, NJ

2,459 sq. ft. store front (leased)

11/12

Sea Girt:

1314 Sea Girt Avenue
Sea Girt, NJ
1,537 sq. ft. stand-alone building (owned)09/17
Tinton Falls:

4050 Asbury Avenue

Tinton Falls, NJ

2,500 sq. ft. stand-alone building (leased)

10/06

Tinton Falls:

656 Shrewsbury Avenue

Tinton Falls, NJ

3,650 sq. ft. stand-alone building (leased)

08/00

West Long Branch:

359 Monmouth Road

West Long Branch, NJ

3,100 sq. ft. in strip shopping center (leased)

01/04

Westfield:

520 South Avenue

Westfield, NJ

3,630 sq. ft. stand-alone building (leased)

10/98

The Company leases one property in Toms River, New Jersey utilized as an LPO, which has a lease expiration date of January 31, 2022 with two (2) five (5) year options. The Company also leases one property in Summit, New Jersey utilized as a LPO, which has a lease expiration date of February 28, 2018.

2019.


23


Item 3. Legal Proceedings.

The Company may, in the ordinary course of business, become a party to litigation involving collection matters, contract claims and other legal proceedings relating to the conduct of its business. The Company may also have various commitments and contingent liabilities which are not reflected in the accompanying consolidated balance sheet. At December 31, 2016,2017, we were not involved in any material legal proceedings.

Item 4. Mine Safety Disclosures.

Not applicable.


24


PART II


Item 5. Market for Registrant’s Common Equity, Related Stockholder Matters and Issuer Purchases of Equity Securities.

The common stock of the Company trades on the Nasdaq Global Market under the trading symbol “TRCB.” The following are the high and low sales prices per share, which have been adjusted for the 5% stock dividend declared January 19, 2017:


2016


2015


High


Low


High


Low


First Quarter


$

9.36


$

8.56


$

8.45


$

7.80


Second Quarter


10.65


8.92


9.05


8.17


Third Quarter


11.23


10.28


8.80


8.38


Fourth Quarter


14.57


10.84


9.50


8.44


  2017 2016
  High
 Low
 High
 Low
First Quarter$18.13
 $13.70
 $9.36
 $8.56
Second Quarter18.70
 15.90
 10.65
 8.92
Third Quarter19.85
 17.33
 11.23
 10.28
Fourth Quarter20.58
 17.81
 14.57
 10.84

As of March 14, 2017,1, 2018, there were approximately 520516 record holders of the Company’s common stock.

On January 19, 2017, the Company announced that it declared a 5% stock dividend, which was paid on February 28, 2017 to shareholders of record as of February 9, 2017.

For the year ended December 31, 2017, the Company paid total cash dividends of $0.17 per share. Such dividends were paid quarterly.

For the year ended December 31, 2016, the Company paid atotal cash dividenddividends of $0.14 per share.

Such dividends were also paid quarterly. For a description of regulatory restrictions on the ability of the Company and the Bank to pay dividends, see Note 17 “Regulatory Matters” included in the Notes to the Consolidated Financial Statements included herein under Item 8.


During the quarter ended December 31, 2016,2017, no shares were repurchased under the Company’s share repurchase program.


All shares repurchased to date have been transacted under the Company’s then-applicable share repurchase program (the “Repurchase Program”).program. Future purchases will be made subject to a new share repurchase program, approved and adopted on December 15, 2016,14, 2017, whereby the Company may repurchase up to $2.0 million of its common stock from January 1, 20172018 to December 31, 2017.
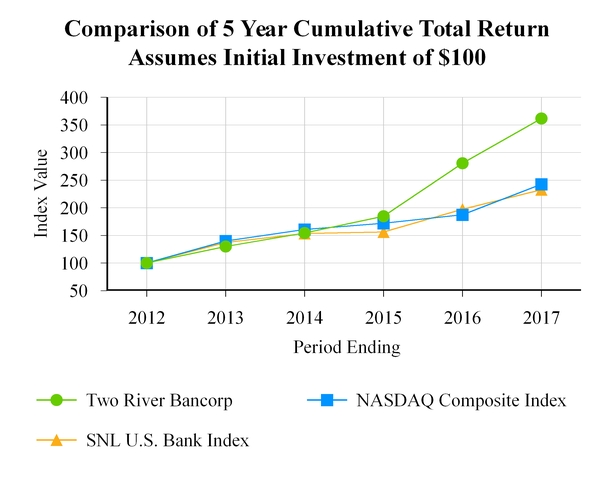
2018.


The Company maintains a Shareholder Rights Plan pursuant to which each outstanding share of the Company’s common stock also carries with it one right (a “Right”) entitling the holder to purchase from the Company one one-thousandth of a share of Series B Junior Participating Preferred Stock, at a purchase price of $25.00, subject to adjustment (as so adjusted, the “Exercise Price”). Upon the acquisition or attempted acquisition of 10% or more of the Company’s outstanding common stock, and in certain other instances, the Rights have certain benefits designed to protect shareholders from abusive takeover tactics and attempts to acquire control of the Company at an inadequate price. The Rights are not exercisable or transferable unless certain specified events occur and will expire on July 20, 2021.


25


The following chart compares the Company's cumulative total shareholder return over the past five years with the NASDAQ Market Index and the Peer Group Index. The Peer Group Index is the SNL U.S. Bank Index, which was prepared by S&P Global Market Intelligence, and contains 320 Banks.


  Period Ending 
Index12/31/1212/31/1312/31/1412/31/1512/31/1612/31/17
Two River Bancorp, Inc.100.00130.08154.19184.61280.76361.72
NASDAQ Composite Index100.00140.12160.78171.97187.22242.71
SNL U.S. Bank Index100.00137.30153.48156.10197.23232.91


26


Item 6. Selected Financial Data.

The following selected consolidated financial data as of December 31 for each of the five years presented should be read in conjunction with our audited consolidated financial statements and the accompanying notes.

Not required.

   
  As of and for the Years Ended December 31,
  2017 2016 2015 2014 2013
  (in thousands, except per share data)
Income Statement          
           
Interest income $38,240
 $34,624
 $32,103
 $30,386
 $30,316
Interest expense 5,707
 5,164
 3,863
 3,452
 3,799
   Net interest income 32,533
 29,460
 28,240
 26,934
 26,517
Provision for loan losses 1,530
 515
 490
 621
 910
   Net interest income after provision for loan losses 31,003
 28,945
 27,750
 26,313
 25,607
Non-interest income 5,459
 5,489
 3,537
 2,932
 2,705
Non-interest expenses 23,942
 21,475
 21,355
 19,667
 20,180
   Income before income taxes 12,520
 12,959
 9,932
 9,578
 8,132
Income tax expense 6,018
 4,328
 3,585
 3,561
 2,973
   Net income 6,502
 8,631
 6,347
 6,017
 5,159
Preferred stock dividend 
 
 (57) (117) (261)
   Net income available to common shareholders $6,502
 $8,631
 $6,290
 $5,900
 $4,898
           
Per Share Data (1)          
Weighted average shares outstanding:          
   Basic 8,388
 8,321
 8,304
 8,329
 8,443
   Diluted 8,658
 8,530
 8,507
 8,519
 8,600
Earnings per common share:          
   Basic $0.78
 $1.04
 $0.76
 $0.71
 $0.58
   Diluted 0.75
 1.01
 0.74
 0.69
 0.57
Cash dividends per common share 0.17
 0.14
 0.12
 0.10
 0.06
           
Balance Sheet          
Loans, net of unearned discounts and fees $850,874
 $753,092
 $693,150
 $627,614
 $602,816
Goodwill and other intangibles 18,109
 18,109
 18,118
 18,166
 18,252
Total assets 1,039,798
 940,211
 863,696
 781,196
 769,707
Total deposits 861,557
 776,567
 708,436
 642,390
 633,449
Total shareholders' equity 106,571
 100,716
 93,002
 93,932
 95,427
           
Performance Ratios          
Return on average assets 0.66% 0.96 % 0.76 % 0.78% 0.69%
Return on average equity 6.22% 8.94 % 6.59 % 6.21% 5.49%
Net interest margin 3.53% 3.53 % 3.68 % 3.79% 3.84%
Efficiency ratio (2) 63.02% 61.45 % 67.20 % 65.85% 69.06%


27


  As of and for the Years Ended December 31,
  2017 2016 2015 2014 2013
  (in thousands, except per share data)
Capital Ratios          
Tier 1 capital to average assets 8.85% 8.94 % 8.97 % 9.95% 10.40%
Tier 1 capital to risk weighted assets 9.68% 10.33 % 10.13 % 11.36% 11.99%
Total capital to risk weighted assets 11.93% 12.76 % 12.65 % 12.57% 13.21%
Common equity Tier 1 capital to risk weighted assets 9.68% 10.33 % 10.13 % N/A N/A
           
Asset Quality Ratios          
Non-performing loans to total loans (3) 0.24% 0.21 % 0.46 % 0.99% 1.00%
Non-performing assets to total assets (4) 0.20% 0.19 % 0.42 % 1.00% 1.14%
Net loan charge-offs (recoveries) to average loans 0.05% (0.05)% (0.02)% 0.07% 0.18%
Allowance for loan losses to total loans at period-end 1.25% 1.27 % 1.26 % 1.29% 1.31%
Allowance for loan losses to non-performing loans at period-end515.36% 617.89 % 274.17 % 129.37% 131.00%
           
(1) Restated for 5% stock dividend in 2017        
(2) Efficiency ratio is total non-interest expense divided by net interest income and non-interest income
(3) Non-performing loans include non-accrual loans and loans past due 90 days and still accruing
(4) Non-performing assets include non-accrual loans, loans past due 90 days and still accruing and other real estate owned


28


Item 7. Management’s Discussion and Analysis of Financial Condition and Results of Operations.


The following management’s discussion and analysis of financial condition and results of operations is intended to provide a better understanding of the significant changes and trends relating to the financial condition, results of operations, capital resources, liquidity and interest rate sensitivity of Two River Bancorp as of December 31, 2016 and 2015 and for the years then ended. The following information should be read in conjunction with the audited consolidated financial statements, as of and for the years ended December 31, 2016 and 2015, including the related notes thereto.

Critical Accounting Policies As used in the following discussion, the term "Company" refers to Two River Bancorp and Estimates

"the Bank" or "Two River" refers to the Company's wholly owned banking subsidiary, Two River Community Bank.


The following discussion is based upon our financial statements, which have been prepared in accordance with accounting principles generally accepted in the United States of America (“GAAP”). The preparation of these financial statements requires the Company to make estimates and judgments that affect the reported amounts of assets, liabilities, revenues and expenses.

Note 1 to our audited consolidated financial statements contains a summary of the Company’s significant accounting policies. Management believes the following critical accounting policies encompass the more significant judgments and estimates used in the preparation of our consolidated financial statements.

Allowance for Loan Losses. Management believes our policy with respect to the methodology for the determination of the allowance for loan losses (“ALLL”) involves a high degree of complexity and requires management to make difficult and subjective judgments which often require assumptions or estimates about highly uncertain matters. Changes in these judgments, assumptions or estimates could materially impact the results of operations. This critical policy and its application are reviewed quarterly with our audit committee, Board of Directors and management.

Management is responsible for preparing and evaluating the ALLL on a quarterly basis in accordance with Bank policy, and theInteragency Policy Statement on the ALLL released by the Board of Governors of the Federal Reserve System on December 13, 2006 as well as GAAP. We believe that our allowance for loan losses is adequate to cover specifically identifiable loan losses, as well as estimated losses inherent in our portfolio for which certain losses are probable but not specifically identifiable. The allowance for loan losses is based upon management’s evaluation of the adequacy of the allowance account, including an assessment of known and inherent risks in the loan portfolio, giving consideration to the size and composition of the loan portfolio, actual loan loss experience, level of delinquencies, detailed analysis of individual loans for which full collectability may not be assured, the existence and estimated net realizable value of any underlying collateral and guarantees securing the loans, and current economic and market conditions. Although management utilizes the best information available, the level of the allowance for loan losses remains an estimate that is subject to significant judgment and short term change. Various regulatory agencies may require us and our banking subsidiaries to make additional provisions for loan losses based upon information available to them at the time of their examination. Furthermore, the majority of our loans are secured by real estate in New Jersey, primarily in Monmouth, Middlesex and Union Counties. Accordingly, the collectability of a substantial portion of the carrying value of our loan portfolio is susceptible to changes in local market conditions and may be adversely affected should real estate values decline or the New Jersey and/or our local market areas experience economic shock.

Stock BasedStock-Based Compensation. Stock based Stock-based compensation cost has been measured using the fair value of an award on the grant date and is recognized over the service period, which is usually the vesting period. The fair value of each option is amortized into compensation expense on a straight-line basis between the grant date for the option and each vesting date. The Company estimates the fair value of stock options on the date of grant using the Black-Scholes option pricing model. The model requires the use of numerous assumptions, many of which are highly subjective in nature.

Goodwill Impairment.Although goodwill is not subject to amortization, the Company must test the carrying value for impairment at least annually or more frequently if events or changes in circumstances indicate that the asset might be impaired. Impairment testing requires that the fair value of our reporting unit be compared to the carrying amount of its net assets, including goodwill. Our reporting unit was identified as our community bank operations. If the fair value of the reporting unit exceeds the book value, no write-down of recorded goodwill is necessary. If the fair value of a reporting unit is less than book value, an expense may be required on the Company’s books to write-down the related goodwill to the proper carrying value. Impairment testing during 20162017 and 20152016 for goodwill and intangibles was completed, and the Company did not require any impairment charge during the years ended December 31, 20162017 and 2015.2016.

See Note 5 in the Notes to Consolidated Financial Statements for more information.

Investment Securities Impairment Valuation. Securities are evaluated on at least a quarterly basis, and more frequently when market conditions warrant such an evaluation, to determine whether a decline in their value is other-than-temporary. The analysis of other-than-temporary impairment requires the use of various assumptions including, but not limited to, the length of time the investment’s book value has been greater than fair value, the severity of the investment’s decline and the credit deterioration of the issuer. For debt securities, management assesses whether (a) it has the intent to sell the security and (b) it is more likely

29


than not that it will be required to sell the security prior to its anticipated recovery. These steps are done before assessing whether the entity will recover the cost basis of the investment.


In instances when a determination is made that an other-than-temporary impairment exists but the investor does not intend to sell the debt security, and it is more likely than not that it will not be required to sell the debt security prior to its anticipated recovery, the other-than-temporary impairment is separated into (a) the amount of the total other-than-temporary impairment related to a decrease in cash flows expected to be collected from the debt security (the credit loss) and (b) the amount of the total other-than-temporary impairment related to all other factors. The amount of the total other-than-temporary impairment related to the credit loss is recognized in earnings. The amount of the total other-than-temporary impairment related to all other factors is recognized in other comprehensive income.

Other Real Estate Owned. Other Real Estate Owned (“OREO”) includes real estate acquired through foreclosure or by deed in lieu of foreclosure. OREO is carried at the lower of cost or fair value of the property, adjusted by management for factors such as economic conditions and other market factors, less estimated costs to sell. When a property is acquired, the excess of the loan balance over fair value, less selling costs, is charged to the allowance for loan losses. Operating results from real estate owned, including rental income, operating expenses, and gains and losses realized from the sales of real estate owned are recorded as incurred. OREO is periodically reviewed to ensure that the fair value of the property supports the carrying value.

Deferred Tax Assets and Liabilities. We recognize deferred tax assets and liabilities for future tax effects of temporary differences, net operating loss carry forwards and tax credits. Deferred tax assets are subject to management’s judgment based upon available evidence, primarily management’s forecast of its ability to generate future earnings, that future realization is more likely than not. If management determines that we may be unable to realize all or part of net deferred tax assets in the future, a direct charge to income tax expense may be required to reduce the recorded value of the net deferred tax asset to the expected realizable amount.

Summary


The Tax Cuts and Jobs Act (the "Tax Act") was signed into law on December 22, 2017. Pursuant to the SEC Staff Accounting Bulletin No. 118, Income Tax Accounting Implications of Financial Resultsthe Tax Cuts and Jobs Act ("SAB 118"), given the amount and complexity of the changes in tax law resulting from the Tax Act, the Company has not finalized the accounting for the Years Ended December 31, 2016income tax effects of the Tax Act. This includes the measurement of deferred taxes. The impact of the Tax Act may differ from this estimate, during the one-year measurement period due to, among other things, further refinement of the Company's calculations, changes in interpretations and 2015

assumptions the Company has made, guidance that may be issued and actions the Company may take as a result of the Tax Act. As a result of the Tax Act, the Company recorded a non-cash charge to income tax expense of approximately $1.8 million in the fourth quarter of 2017 primarily due to the re-measurement of deferred tax assets and liabilities.


Financial Overview

Net Income

The Company reported record net income available to common shareholders of $8.6$6.5 million for the year ended December 31, 2016,2017, compared to $6.3$8.6 million in 2015,2016, an increasedecrease of $2.3$2.1 million, or 37.2%24.7%. Basic and diluted earnings per common share were $1.04$0.78 and $1.01,$0.75, respectively, for the year ended December 31, 20162017 compared to basic and diluted earnings after preferred stock dividendsper common share of $0.76$1.04 and $0.74,$1.01, respectively, for the same period in 2015.2016. Our results for 2016 were positively affected by an increase2017 include a non-cash charge of $1.78 million, or $0.21 per diluted share, in income tax expense, associated with the enactment of the Tax Act passed in December, which relates to the revaluation of the Company's net interest income primarilydeferred tax asset, due to strong loan and core deposit growth, and higher non-interestthe reduction in the Federal corporate income partially offset by an increase in non-interest expenses primarily resultingtax rate from higher salaries and benefits, and a higher provision for loan losses.34% to 21%, effective January 1, 2018. During 2016, the Company received a tax-free Bank Owned Life Insurance (“BOLI”) death benefit of $862,000, or $0.10 per diluted share, which was included in non-interest income. Excluding the charge to income tax expense and the BOLI event in the prior year, 2017 net income increased 6.6%. All share and per share data for all referenced reporting periods have been retroactively adjusted for a 5% stock dividend declared on January 19, 2017, payable on February 28, 2017 to shareholders of record as of February 9, 2017.

Total Assets


Total assets increased by $76.5$99.6 million, or 8.9%10.6%, to $1.04 billion at December 31, 2017 from $940.2 million at December 31, 2016 from $863.7 million at December 31, 2015.2016. The increase in total assets was primarily the result of the$97.8 million in loan growth funded mainly by core deposit growth during the year.

Total Loans and Deposits


Total loans amounted to $753.1$850.9 million at December 31, 2016,2017, which was an increase of $59.9$97.8 million, or 8.6%13.0%, compared to the December 31, 20152016 amount of $693.2$753.1 million. The Company continues to provide commercial, residential and

30


consumer lending to our market customers, while maintaining our high credit standards in a challenging market. The allowance for loan losses totaled $10.7 million, or 1.25% of total loans, at December 31, 2017, compared to $9.6 million, or 1.27% of total loans, at December 31, 2016, compared2016.
Deposits increased to $8.7$861.6 million or 1.26% of total loans, at December 31, 2015.

Deposits increased to2017 from $776.6 million at December 31, 2016, from $708.4 million at December 31, 2015, an increase of $68.2$85.0 million, or 9.6%10.9%. The increase in deposits is primarily attributable to the growth in our core checking deposits resulting from increased business and consumer activity, along with certificates of deposit.

Shareholders’ Equity and Tangible Book Value per Common Share

Shareholders’ equity amounted to $106.6 million at December 31, 2017 from $100.7 million at December 31, 2016, from $93.0 million at December 31, 2015, an increase of $7.7$5.9 million, or 8.3%5.8%. At year-end 2016,2017, book value per common share increased to $12.04$12.58 compared to $11.17$12.04 at December 31, 2015.2016. At year-end 2016,2017, tangible book value per common share (a Non-GAAP Financial Measure) increased to $9.88$10.44 compared to $9.00$9.88 at December 31, 2015.

2016.

Results of Operations

Our principal source of revenue is net interest income, the difference between interest income on interest earning assets and interest expense on deposits and borrowings. Interest earning assets consist primarily of loans, investment securities and federal funds sold. Sources to fund interest earning assets consist primarily of deposits and borrowed funds. Our net income is also affected by our provision for loan losses, non-interest income and non-interest expenses. Non-interest income consists primarily of gains on the sale of loans, service charges, commissions and fees, while non-interest expenses are comprised of salaries and employee benefits, occupancy costs and other operating expenses.


31


The following table provides certain performance ratios for the dates and periods indicated.


2016


2015


2014


Return on average assets

  0.96

%

  0.76

%

  0.78

%

Return on average tangible assets (1)

  0.98

%

  0.78

%

  0.80

%

Return on average shareholders’ equity

  8.94

%

  6.59

%

  6.21

%

Return on average tangible shareholders’ equity (1)

  11.00

%

  8.12

%

  7.64

%

Net interest margin

  3.53

%

  3.68

%

  3.79

%

Average equity to average assets

  10.70

%

  11.57

%

  12.60

%

Average tangible equity to average tangible assets (1)

  8.87

%

  9.60

%

  10.48

%

 2017 2016 2015
      
Return on average assets0.66% 0.96% 0.76%
Return on average tangible assets (1)0.67% 0.98% 0.78%
Return on average shareholders’ equity6.22% 8.94% 6.59%
Return on average tangible shareholders’ equity (1)7.52% 11.00% 8.12%
Net interest margin3.53% 3.53% 3.68%
Average equity to average assets10.55% 10.70% 11.57%
Average tangible equity to average tangible assets (1)8.89% 8.87% 9.60%

(1)     The following table providedprovides the reconciliation of non-GAAP Financial Measures for the dates indicated:

(in thousands except per share data and percentages)


2016


2015


2014


Total shareholders’ equity

 $100,667  $93,002  $93,932 

Less: preferred stock

  -   -   (6,000

)


Common shareholders’ equity

 $100,667  $93,002  $87,932 

Less: goodwill and other intangible assets

  (18,109

)

  (18,118

)

  (18,166

)

Tangible common shareholders’ equity

 $82,558  $74,884  $69,766 
             

Common shares outstanding

  8,365   8,325   8,337 

Book value per common share

 $12.04  $11.17  $10.55 
             

Book value per common share

 $12.04  $11.17  $10.55 

Effect of intangible assets

  (2.16

)

  (2.17

)

  (2.18

)

Tangible book value per common share

 $9.88  $9.00  $8.37 
             

Return on average assets

  0.96

%

  0.76

%

  0.78

%

Effect of intangible assets

  0.02

%

  0.02

%

  0.02

%

Return on average tangible assets

  0.98

%

  0.78

%

  0.80

%


Return on average equity

  8.94

%

  6.59

%

  6.21

%

Effect of average intangible assets

  2.06

%

  1.53

%

  1.43

%

Return on average tangible equity

  11.00

%

  8.12

%

  7.64

%


Average equity to average assets

  10.70

%

  11.57

%

  12.60

%

Effect of average intangible assets

  (1.83

%)

  (1.97

%)

  (2.12

%)

Average tangible equity to average tangible assets

  8.87

%

  9.60

%

  10.48

%

(in thousands except per share data and percentages)2017 2016 2015
      
Total shareholders’ equity$106,571
 $100,667
 $93,002
Less: goodwill and other intangible assets(18,109) (18,109) (18,118)
Tangible common shareholders’ equity$88,462
 $82,558
 $74,884
      
Common shares outstanding8,470
 8,365
 8,325
Book value per common share$12.58
 $12.04
 $11.17
      
Book value per common share$12.58
 $12.04
 $11.17
Effect of intangible assets(2.14) (2.16) (2.17)
Tangible book value per common share$10.44
 $9.88
 $9.00
      
Return on average assets0.66 % 0.96 % 0.76 %
Effect of intangible assets0.01 % 0.02 % 0.02 %
Return on average tangible assets0.67 % 0.98 % 0.78 %
      
Return on average equity6.22 % 8.94 % 6.59 %
Effect of average intangible assets1.30 % 2.06 % 1.53 %
Return on average tangible equity7.52 % 11.00 % 8.12 %
      
Average equity to average assets10.55 % 10.70 % 11.57 %
Effect of average intangible assets(1.66%) (1.83%) (1.97%)
Average tangible equity to average tangible assets8.89 % 8.87 % 9.60 %
This Report contains certain financial information determined by methods other than in accordance with GAAP. These non-GAAP financial measures are “tangible book value per common share,” “return on average tangible assets,” “return on average tangible equity,” and “average tangible equity to average tangible assets.” This non-GAAP disclosure has limitations as an analytical tool and should not be considered in isolation or as a substitute for analysis of the Company’s results as reported under GAAP, nor is it necessarily comparable to non-GAAP performance measures that may be presented by other companies. Our management uses these non-GAAP measures in its analysis of our performance because it believes these measures are material and will be used as a measure of our performance by investors.


32


Financial Results for the YearThree Years Ended December 31, 2016 Compared to Year Ended2017

Net Interest Income

For the year ended December 31, 2015

Net Interest Income

2017, net interest income amounted to $32.5 million, as compared to $29.5 million for the year ended December 31, 2016. This increase of $3.0 million, or 10.4%, was primarily the result of a higher volume of average interest-earning assets and a higher level of average core checking deposits. The Federal Reserve raised short-term interest rates three times during 2017 for a total of 0.75%, as compared to 0.25% increases in both 2016 and 2015. Our average earning assets increased by $86.0 million, or 10.3%, to $921.0 million for the year ended December 31, 2017 from $835.0 million for the year ended December 31, 2016, while our net interest spread remained unchanged at 3.35% for both years ended December 31, 2017 and 2016. Our net interest margin also remained unchanged at 3.53% for both years ended December 31, 2017 and 2016.

For the year ended December 31, 2016, net interest income amounted to $29.5 million, as compared to $28.2 million for the year ended December 31, 2015. This increase of $1.3 million, or 4.3%, was primarily the result of a higher volume of average interest earning assets and higher level of average core checking deposits. These positives were partially offset by the continued compression on our asset yields resulting from the maturity, prepayment or contractual repricing of loans and investment securities in this extended period of low interest rates. The Federal Reserve chose to raise short-term interest rates by 0.25% in both December of 2016 and 2015. Our average earning assets increased by $67.0 million, or 8.7%, to $835.0 million for the year ended December 31, 2016 from $768.0 million for the year ended December 31, 2015, while our net interest spread decreased by 17 basis points to 3.35% for the year ended December 31, 2016 as compared to 3.52% for the same period in 2015. Our net interest margin decreased by 15 basis points to 3.53% for year ended December 31, 2016 as compared to 3.68% for the same period in 2015. These decreases were primarily the result of the maturity, prepayment or contractual repricing of loans and investment securities in this prolonged low interest rate environment as well as the interest expense associated with the Company’s issuance of subordinated debentures in aggregate principal amount of $10 million in December 2015. This subordinated debt impacted our margin by approximately 8 basis points.


For the year ended December 31, 2017, total interest income increased to $38.2 million from $34.6 million for the year ended December 31, 2016. This increase of $3.6 million, or 10.4%, was primarily due to volume-related increases in interest income of $3.4 million, and by interest rate-related increases in interest income of $252,000, for the year ended December 31, 2017 as compared to the prior year. The average yield on our interest earning assets remained unchanged at 4.15% for the years ended December 31, 2017 and 2016.
For the year ended December 31, 2016, total interest income increased to $34.6 million from $32.1 million for the year ended December 31, 2015. This increase of $2.5 million, or 7.9%, was primarily due to volume-related increases in interest income of $3.0 million, partially offset by interest rate-related decreases in interest income of $495,000, for the year ended December 31, 2016 as compared to the prior year. The average yield on our interest earning assets decreased by 3 basis points to 4.15% for the year ended December 31, 2016 from 4.18% for the prior year.


Interest and fees on loans increased by $3.0 million, or 9.2%, to $35.8 million for the year ended December 31, 2017 compared to $32.8 million for the same period in 2016. Of the $3.0 million increase in interest and fees on loans, $3.1 million was attributable to volume-related increases, which were partially offset by $128,000 of rate-related decreases. The average balance of the loan portfolio for the year ended December 31, 2017 increased by $69.2 million, or 9.5%, to $793.7 million from $724.5 million for the same period in 2016. The average annualized yield on the loan portfolio decreased to 4.51% for the year ended December 31, 2017, from 4.53% for the same period in 2016. The average balance of non-accrual loans was $2.1 million and $1.9 million for the years ended December 31, 2017 and 2016, respectively, which impacted the Company’s loan yield for both periods presented.
Interest and fees on loans increased by $2.2 million, or 7.1%, to $32.8 million for the year ended December 31, 2016 compared to $30.6 million for the same period in 2015. Of the $2.2 million increase in interest and fees on loans, $2.9 million was attributable to volume-related increases, which were partially offset by $727,000 of rate-related decreases. The average balance of the loan portfolio for the year ended December 31, 2016 increased by $62.7 million, or 9.5%, to $724.5 million from $661.8 million for the same period in 2015. The average annualized yield on the loan portfolio decreased to 4.53% for the year ended December 31, 2016, from 4.63% for the same period in 2015. The average balance of non-accrual loans was $1.9 million and $4.1 million for the yearyears ended December 31, 2016 from $4.1 million for the year ended December 31,and 2015, respectively, which impacted the Company’s loan yield for both periods presented.


Interest income on interest-bearing deposits was $350,000 for the year ended December 31, 2017, representing an increase of $217,000, or 163.2%, from $133,000 for the same period in 2016. For the year ended December 31, 2017, interest-bearing deposits had an average balance of $33.3 million and an average annualized yield of 1.05% as compared to $26.2 million and an average annualized yield of 0.51% for the 2016 period.

33


Interest income on interest bearing deposits was $133,000 for the year ended December 31, 2016, representing an increase of $59,000, or 79.7%, from $74,000 for the same period in 2015. For the year ended December 31, 2016, interest bearing deposits had an average balance of $26.2 million and an average annualized yield of 0.51% as compared to $28.6 million and an average annualized yield of 0.26% for the 2015 period.


Interest income on investment securities totaled $2.1 million for the year ended December 31, 2017, representing an increase of $396,000, or 23.4%, over the year ended December 31, 2016. For the year ended December 31, 2017, investment securities had an average balance of $94.1 million with an average annualized yield of 2.22%, compared to an average balance of $84.2 million with an average annualized yield of 2.01% for the year ended December 31, 2016.
Interest income on investment securities totaled $1.7 million for the year ended December 31, 2016, representing an increase of $288,000, or 20.5%, over the year ended December 31, 2015. For the year ended December 31, 2016, investment securities had an average balance of $84.2 million with an average annualized yield of 2.01%, compared to an average balance of $77.5 million with an average annualized yield of 1.81% for the year ended December 31, 2015.


Total interest expense amounted to $5.7 million for the year ended December 31, 2017, compared to $5.2 million for the corresponding period in 2016, an increase of $543,000, or 10.5%. Of this increase in interest expense, $307,000 was due to volume-related increases resulting from deposit growth and by $236,000 in rate-related increases.
Total interest expense amounted to $5.2 million for the year ended December 31, 2016, compared to $3.9 million for the corresponding period in 2015, an increase of $1.3 million, or 33.7%. Of this increase in interest expense, $1.1 million was due to volume-related increases resulting from deposit growth and by $165,000 in rate-related increases.


The average balance of interest-bearing liabilities increased to $714.6 million for the year ended December 31, 2017, from $647.9 million for the same period last year, an increase of $66.7 million, or 10.3%. The average balance in NOW deposits during 2017 increased $50.1 million from $151.4 million with an average annualized yield of0.43% for the year ended December 31, 2016, to $201.5 million with an average annualized yield of 0.48% for the same period in 2017. Additionally, during 2017, average demand deposits reached $163.7 million, an increase of $13.2 million, or 8.8%, over the same period last year. Average time deposits increased by $1.5 million, or 1.1%, to $135.3 million with an average annualized yield of 1.45% for the year ended December 31, 2017, from $133.8 million with an average annualized yield of 1.42% for the year ended December 31, 2016. Average savings deposits increased by $22.7 million, or 9.7%, to $256.2 million with an average annualized yield of 0.52% for the year ended December 31, 2017, from $233.5 million with an average annualized yield of 0.50% for the year ended December 31, 2016. Average money market deposits decreased by $9.6 million, or 13.2%, to $63.1 million with an average annualized yield of 0.17% for the year ended December 31, 2017, from $72.7 million with an average annualized yield of 0.16% for the 2016 period. For both the years ended December 31, 2017 and 2016, the average yield on our interest-bearing liabilities was 0.80%.

The average balance of interest-bearing liabilities increased to $647.9 million for the year ended December 31, 2016, from $584.6 million for the same period last year ended December 31, 2015, an increase of $63.3 million, or 10.8%. The average balance in NOW deposits during 2016 increased $20.7 million from $130.7 million with an average annualized yield of 0.42% for the year ended December 31, 2015, to $151.4 million with an average annualized yield of 0.43% for the same period in 2016. Additionally, during 2016, average demand deposits reached $150.5 million, an increase of $5.5 million, or 3.8%, over the same period last year.2015. Average time deposits increased by $30.5 million, or 29.5%, to $133.8 million with an average annualized yield of 1.42% for the year ended December 31, 2016, from $103.3 million with an average annualized yield of 1.32% for the year ended December 31, 2015. Average savings deposits increased by $4.8 million, or 2.1%, to $233.5 million with an average annualized yield of 0.50% for the year ended December 31, 2016, from $228.7 million with an average annualized yield of 0.48% for the year ended December 31, 2015. Average money market deposits increased by $392,000, or 0.5%, to $72.7 million with an average annualized yield of 0.16% for the year ended December 31, 2016, from $72.3 million with the same average annualized yield for the 2015 period. For the year ended December 31, 2016, the average yield on our interest-bearing liabilities was 0.80%, compared to 0.66% for the year ended December 31, 2015, primarily due to the interest expense associated with the Company’s issuance of subordinated debentures discussed above,below, which effected our cost of interest-bearing liabilities by approximately 9 basis points.


Our strategies for increasing and retaining core relationship deposits, managing loan originations within our acceptable credit criteria and loan category concentrations, and our branch network growth strategy have combined to meet our liquidity needs. The Company also offers agreements to repurchase securities, commonly known as repurchase agreements, to its customers as an alternative to other insured deposits. Average balances of repurchase agreements for the year ended December 31, 20162017 amounted to $22.1 million, with an average interest rate of 0.30%, compared to $19.3 million, with an average interest rate of 0.32%, compared tofor the 2016, and $22.1 million, with an average interest rate of 0.31%, for the same prior year period.

2015.


34


The Company also utilizes FHLBFederal Home Loan Bank of New York ("FHLB") term borrowings as an additional funding source. Average FHLB term borrowings amounted to $26.5 million, $27.3 million, and $27.1 million for the years ended December 31, 2017, 2016 and 2015, respectively, with an average yield of 2.34%, 2.26% and 2.30%, for the years ended December 31, 2017, 2016 and 2015, respectively.

In December 2015, the Company completed a private placement of $10 million in aggregate principal amount of fixed to floating rate subordinated debentures to certain institutional accredited investors. The subordinated debentures have a maturity date of December 31, 2025 and bear interest, payable quarterly, at the rate of 6.25% per annum until January 1, 2021 when the rate adjusts. The subordinated debentures have been structured to qualify as Tier 2 capital for regulatory purposes. Subordinated debentures totaled $9.9 million at both December 31, 2017 and 2016, and $9.8 million at December 31, 2016,2015, which included $112,000, $145,000, and $176,000, respectively, of remaining unamortized debt issuance costs. The debt issuance costs are being amortized over the expected life of the issue. The effective interest rate of the subordinated debt is 6.67%.

The net cash proceeds of the subordinated debenture offering were used to redeem the Company’s Senior Non-Cumulative Perpetual Preferred Stock issued to the United States Treasury in connection with the Company’s participation in the Small Business Lending Fund program. The balance of such net proceeds are being used for general corporate purposes and to support future growth.


35


The following table reflects, for the periods presented, the components of our net interest income, setting forth: (1) average assets, liabilities, and shareholders’ equity, (2) interest income earned on interest-earning assets and interest expense paid on interest-bearing liabilities, (3) average yields earned on interest-earning assets and average rates paid on interest-bearing liabilities, (4) our net interest spread (i.e., the average yield on interest-earning assets less the average rate on interest-bearing liabilities), and (5) our yield on interest-earning assets. There have been no tax equivalent adjustments made to yields.


Years ended December 31,


2016


2015


2014


Average

Balance


Interest

Income/

Expense


Average

Yield/

Rate


Average

Balance


Interest

Income/

Expense


Average

Yield/

Rate


Average

Balance


Interest

Income/

Expense


Average

Yield/

Rate


(in thousands, except for percentages)


ASSETS


Interest-Earning Assets:


Interest-bearing deposits in banks

 $26,241  $133   0.51% $28,633  $74   0.26% $27,028  $70   0.26%

Investment securities

  84,227   1,693   2.01%  77,525   1,405   1.81%  74,244   1,403   1.89%

Loans, net of unearned fees (1) (2)

  724,511   32,798   4.53%  661,817   30,624   4.63%  609,627   28,913   4.74%
                                     

Total Interest-Earning Assets

  834,979   34,624   4.15%  767,975   32,103   4.18%  710,899   30,386   4.27%
                                     

Non-Interest-Earning Assets:


Allowance for loan loss

  (9,275

)

          (8,311

)

          (8,077

)


Other assets

  77,181           72,744           66,505         
                                     

Total Assets

 $902,885          $832,408          $769,327         
                                     

LIABILITIES & SHAREHOLDERS’ EQUITY


Interest-Bearing Liabilities:


NOW deposits

 $151,360   649   0.43% $130,658   551   0.42% $111,009   507   0.46%

Savings deposits

  233,514   1,165   0.50%  228,707   1,106   0.48%  233,162   1,091   0.47%

Money market deposits

  72,721   119   0.16%  72,329   116   0.16%  71,977   117   0.16%

Time deposits

  133,842   1,896   1.42%  103,324   1,368   1.32%  83,304   1,189   1.43%

Securities sold under agreements to repurchase

  19,309   61   0.32%  22,071   68   0.31%  20,096   65   0.32%

FHLB and other borrowings

  27,304   618   2.26%  27,051   621   2.30%  16,945   483   2.85%

Subordinated debt

  9,840   656   6.67%  494   33   6.68%  -   -   - 
                                     

Total Interest-Bearing Liabilities

  647,890   5,164   0.80%  584,634   3,863   0.66%  536,493   3,452   0.64%
                                     

Non-Interest-Bearing Liabilities:


Demand deposits

  150,495           144,980           130,465         

Other liabilities

  7,919           6,509           5,435         
                                     

Total Non-Interest-Bearing Liabilities

  158,414           151,489           135,900         
                                     

Shareholders’ Equity

  96,581           96,285           96,934         
                                     

Total Liabilities and Shareholders’ Equity

 $902,885          $832,408          $769,327         
                                     

NET INTEREST INCOME

     $29,460          $28,240          $26,934     
                                     

NET INTEREST SPREAD (3)

          3.35%          3.52%          3.63%
                                     

NET INTEREST MARGIN (4)

          3.53%          3.68%          3.79%

 Years ended December 31,
 2017 2016 2015
 
Average
Balance
 
Interest
Income/
Expense
 
Average
Yield/
Rate
 
Average
Balance
 
Interest
Income/
Expense
 
Average
Yield/
Rate
 
Average
Balance
 
Interest
Income/
Expense
 
Average
Yield/
Rate
                  
 (in thousands, except for percentages)
ASSETS                 
Interest-Earning Assets:                 
Interest-bearing deposits in banks$33,255
 $350
 1.05% $26,241
 $133
 0.51% $28,633
 $74
 0.26%
Investment securities94,052
 2,089
 2.22% 84,227
 1,693
 2.01% 77,525
 1,405
 1.81%
Loans, net of unearned fees (1) (2)793,671
 35,801
 4.51% 724,511
 32,798
 4.53% 661,817
 30,624
 4.63%
                  
Total Interest-Earning Assets920,978
 38,240
 4.15% 834,979
 34,624
 4.15% 767,975
 32,103
 4.18%
                  
Non-Interest-Earning Assets:                 
Allowance for loan loss(9,933)  
  
 (9,275)  
  
 (8,311)  
  
Other assets79,850
  
  
 77,181
  
  
 72,744


Total Assets$990,895
     $902,885
     $832,408
    
                  
LIABILITIES & SHAREHOLDERS’ EQUITY                 
Interest-Bearing Liabilities:                 
NOW deposits$201,490
 958
 0.48% $151,360
 649
 0.43% $130,658
 551
 0.42%
Savings deposits256,222
 1,330
 0.52% 233,514
 1,165
 0.50% 228,707
 1,106
 0.48%
Money market deposits63,093
 107
 0.17% 72,721
 119
 0.16% 72,329
 116
 0.16%
Time deposits135,326
 1,968
 1.45% 133,842
 1,896
 1.42% 103,324
 1,368
 1.32%
Securities sold under agreements to repurchase22,066
 66
 0.30% 19,309
 61
 0.32% 22,071
 68
 0.31%
FHLB and other borrowings26,544
 620
 2.34% 27,304
 618
 2.26% 27,051
 621
 2.30%
Subordinated debt9,872
 658
 6.67% 9,840
 656
 6.67% 494
 33
 6.68%
                  
Total Interest-Bearing Liabilities714,613
 5,707
 0.80% 647,890
 5,164
 0.80% 584,634
 3,863
 0.66%
                  
Non-Interest-Bearing Liabilities:                 
Demand deposits163,707
  
  
 150,495
  
  
 144,980
  
  
Other liabilities8,003
  
  
 7,919
  
  
 6,509


Total Non-Interest-Bearing Liabilities171,710
  
  
 158,414
  
  
 151,489


Shareholders’ Equity104,572
  
  
 96,581
  
  
 96,285


Total Liabilities and Shareholders’ Equity$990,895
  
  
 $902,885
  
  
 $832,408


NET INTEREST INCOME 
 $32,533
  
  
 $29,460
  
  
 $28,240
  
                  
NET INTEREST SPREAD (3) 
  
 3.35%  
  
 3.35%  
  
 3.52%
                  
NET INTEREST MARGIN (4) 
  
 3.53%  
  
 3.53%  
  
 3.68%
                  

(1)

(1)Included in interest income on loans are loan fees.

(2)

Includes non-performing loans.

(3)

The interest rate spread is the difference between the weighted average yield on average interest-earning assets and the weighted average cost of average interest-bearing liabilities.

(4)

The interest rate margin is calculated by dividing net interest income by average interest-earning assets.


36


Analysis of Changes in Net Interest Income

The following table sets forth for the periods indicated the amounts of the total change in net interest income that can be attributed to changes in the volume of interest-earning assets and interest-bearing liabilities and the amount of the change that can be attributed to changes in interest rates.


Years ended December 31,


2016 vs. 2015


2015 vs. 2014


Increase (decrease) due to change in


Average

volume


Average

rate


Net


Average

volume


Average

rate


Net


(in thousands)


Interest Earned On:


Interest-bearing deposits in banks

 $(6

)

 $65  $59  $4  $-  $4 

Investment securities

  121   167   288   62   (60

)

  2 

Loans, net of unearned fees

  2,901   (727

)

  2,174   2,475   (764

)

  1,711 
                         

Total Interest Income

  3,016   (495

)

  2,521   2,541   (824

)

  1,717 
                         

Interest Paid On:


NOW deposits

  87   11   98   90   (46

)

  44 

Savings deposits

  23   36   59   (22

)

  37   15 

Money market deposits

  1   2   3   1   (2

)

  (1

)

Time deposits

  404   124   528   285   (106

)

  179 

Securities sold under agreements to repurchase

  (9

)

  2   (7

)

  6   (3

)

  3 

FHLB and other borrowings

  6   (9

)

  (3

)

  288   (150

)

  138 

Subordinated debt

  624   (1

)

  623   33   -   33 
                         

Total Interest Expense

  1,136   165   1,301   681   (270

)

  411 
                         

Net Interest Income

 $1,880  $(660

)

 $1,220  $1,860  $(554

)

 $1,306 

 Years ended December 31,
 2017 vs. 2016 2016 vs. 2015
 Increase (decrease) due to change in
 
Average
volume
 
Average
rate
 Net 
Average
volume
 
Average
rate
 Net
            
 (in thousands)
Interest Earned On:           
Interest-bearing deposits in banks$36
 $181
 $217
 $(6) $65
 $59
Investment securities197
 199
 396
 121
 167
 288
Loans, net of unearned fees3,131
 (128) 3,003
 2,901
 (727) 2,174
            
Total Interest Income3,364
 252
 3,616
 3,016
 (495) 2,521
            
Interest Paid On:           
NOW deposits215
 94
 309
 87
 11
 98
Savings deposits113
 52
 165
 23
 36
 59
Money market deposits(16) 4
 (12) 1
 2
 3
Time deposits1
 71
 72
 404
 124
 528
Securities sold under agreements to repurchase8
 (3) 5
 (9) 2
 (7)
FHLB and other borrowings(16) 18
 2
 6
 (9) (3)
Subordinated debt2
 
 2
 624
 (1) 623
            
Total Interest Expense307
 236
 543
 1,136
 165
 1,301
            
Net Interest Income$3,057
 $16
 $3,073
 $1,880
 $(660) $1,220
The change in interest due to both volume and rate has been allocated proportionally to both, based on their relative absolute values.

Provision for Loan Losses

Our provision for loan losses for the year ended December 31, 2017 was $1.5 million, as compared to $515,000 for the year ended December 31, 2016. The increase in our provision was primarily due to an increase in loan activity. The $1.5 million provision for 2017 was driven by a number of factors, including the level of charge-offs and recoveries, our assessment of the current state of the economy, allowances related to impaired loans and loan activity. The provision for the comparable 2016 period considered the same factors. The provision for loan losses is determined by an allocation process whereby an estimated allowance is allocated to the specific allowance for impaired loans and the general allowance for pools of loans. The allocation reflects management’s assessment of economic conditions, credit quality and other risk factors inherent in the loan portfolio. The allowance for loan losses totaled $10.7 million, or 1.25% of total loans at December 31, 2017, compared to $9.6 million, or 1.27% of total loans at December 31, 2016.

Our provision for loan losses for the year ended December 31, 2016 was $515,000, as compared to $490,000 for the year ended December 31, 2015. The increase in our provision was primarily due to an increase in loan activity. The $515,000 provision for 2016 was driven by a number of factors, including the level of charge-offs and recoveries, our assessment of the current state of the economy, allowances related to impaired loans and loan activity. The provision for the comparable 2015 period considered the same factors. The provision for loan losses is determined by an allocation process whereby an estimated allowance

37


is allocated to the specific allowance for impaired loans and the general allowance for pools of loans. The allocation reflects management’s assessment of economic conditions, credit quality and other risk factors inherent in the loan portfolio. The allowance for loan losses totaled $9.6 million, or 1.27% of total loans at December 31, 2016, compared to $8.7 million, or 1.26% of total loans at December 31, 2015.


Non-Interest Income
 

Non-Interest Income

The following table provides a summary of non-interestNon-interest income by categoryamounted to $5.5 million for both the years ended December 31, 2017 and 2016. Excluding the tax-free BOLI death benefit of $862,000 in 2016, and 2015.


Years ended


%


December 31,


Increase


Increase


(dollars in thousands)


2016


2015


(Decrease)


(Decrease)


Service fees on deposit accounts

 $587  $578  $9   1.6%

Mortgage banking

  1,162   783   379   48.4%

Other loan fees

  610   214   396   185.0%

Earnings from investment in bank owned life insurance

  477   445   32   7.2%

Death benefit on bank owned life insurance

  862   -   862   N/A 

Gain on sale of SBA loans

  868   561   307   54.7%

Net gain on sale of securities

  72   37   35   94.6%

Gain on sale of premises and equipment

  -   208   (208

)

  (100.0

%)

Other income

  851   711   140   19.7%
                 

Total Non-Interest Income

 $5,489  $3,537  $1,952    55.2

non-interest income increased $832,000, or 18.0%. Mortgage banking revenue increased by $421,000, or 36.2%, while gains on the sale of SBA loans increased $184,000, or 21.2%. Both of these increases were the result of a higher volume of originated salable loans. Additionally, service fees on deposit accounts increased by $185,000, or 31.5%, mainly due to the realignment of fees on various products.


Non-interest income amounted to $5.5 million for the year ended December 31, 2016, compared to $3.5 million for the year ended December 31, 2015. This increase of $2.0 million, or 55.2%, included the receipt of a tax-free BOLI death benefit of $862,000. Additionally, the Company reported higher gains on the sale of SBA loans of $307,000 and an increase in other loan fees of $396,000 due to higher loan prepayment fees. Residential mortgage banking revenue increased by $379,000, or 48.4%, to $1,162,000 from $783,000 in 2015 while other income increased by $140,000, or 19.7%, due primarily to higher fees related to our title agency joint venture as well as other fees. These increases were partially offset by a decrease of $208,000 resulting from the gain on sale of a branch property in 2015.

Non-Interest Expenses

The following table provides a summary of non-interest

Non-interest expenses by category for the yearsyear ended December 31, 2017 increased $2.5 million, or 11.5%, compared to the year ended December 31, 2016. This increase was primarily the result of an increase of $1.2 million, or 9.4%, in salaries and employee benefits, which was due primarily to both annual merit increases and commissions from higher residential mortgage banking business. Occupancy and equipment expenses increased $124,000, or 3.0%, due primarily to increased expenses associated with computer and technology upgrades. Professional fees increased $299,000, or 25.0%, primarily due to higher consulting and audit fees. Advertising expenses increased $35,000, or 8.4%, due to increased advertising related to the Company’s branding, awareness and products and services. Loan workout expenses increased $160,000 or 219.2% primarily due to the recapture of $144,000 of expenses in 2016 related to previously charged off credit. OREO expenses, impairments and 2015.


Years ended


%


December 31,


Increase


Increase


(dollars in thousands)


2016


2015


(Decrease)


(Decrease)


Salaries and employee benefits

 $12,844  $12,486  $358   2.9%

Occupancy and equipment

  4,117   3,942   175   4.4%

Professional fees

  1,198   982   216   22.0%

Insurance

  216   268   (52

)

  (19.4

%)

FDIC insurance and assessments

  412   433   (21

)

  (4.8

%)

Advertising and marketing

  415   403   12   3.0%

Data processing

  554   475   79   16.6%

Outside service fees

  500   499   1   0.2%

Amortization of identifiable intangibles

  9   48   (39

)

  (81.3

%)

OREO expenses, impairments and sales, net

  (274

)

  (70

)

  (204

)

  291.4%

Loan workout expenses

  73   431   (358

)

  (83.1

%)

Other operating

  1,411   1,458   (47

)

  (3.2

%)


Total Non-Interest Expenses

 $21,475  $21,355  $120   0.6%

sales, net, increased by $322,000, or 117.5%, from 2016 primarily due to a $250,000 recovery of settlement expenses from an OREO property in 2016.


Non-interest expenses for year ended December 31, 2016 increased $120,000, or 0.6%, compared to the year ended December 31, 2015. This increase was primarily the result of an increase of $358,000, or 2.9%, in salaries and employee benefits, which was due primarily to both annual merit increases and commissions from higher residential mortgage banking volume. Occupancy and equipment expenses increased $175,000, or 4.4%, due primarily to increased expenses associated with computer and technology upgrades. Professional fees increased $216,000, or 22.0%, primarily due to higher consulting and legal fees. Data processing fees increased $79,000, or 16.6%, due primarily to computer and technology upgrades. Advertising expenses increased $12,000, or 3.0%, due to increased advertising related to the Company’s branding, awareness and products and services. These increases were partially offset by a decrease of $358,000, or 83.1%, in loan workout expenses primarily due to the decrease in impaired loans to which such expenses relate, in addition to the recapture of $144,000 of expenses related to a previously charged off credit. OREO expenses, impairments and sales, net, declined by $204,000, or 291.4%, from 2015 primarily due to a lower level of OREO assets and, as such, lower associated costs. Additionally, FDIC insurance and assessments declined by $21,000, or 4.8%, while insurance expenses decreased by $52,000, or 19.4%. Amortization of intangible assets, which was the result of The Town Bank acquisition in 2006, amounted to $9,000 during 2016 as compared to $48,000 during 2015.


Income Tax Expense


The Company recorded $6.0 million and $4.3 million in income tax expense for the years ended December 31, 2017 and 2016, respectively. The effective tax rate for 2017 increased to 48.1% from 33.4% in 2016 primarily due to the previously mentioned $1.8 million charge related to the re-valuation of our net deferred tax asset as a result of the Tax Act. Additionally the tax-free BOLI death benefit had the effect of lowering our effective tax rate in 2016.

The Company recorded $4.3 million and $3.6 million in income tax expense for the years ended December 31, 2016 and 2015, respectively. The effective tax rate for the year ended December 31, 2016 anddecreased to 33.4% from 36.1% in 2015 was 33.4% and 36.1%, respectively, due to a lower level of taxable income during the current period due primarily to the tax-free BOLI death benefit and a higher level of tax-exempt municipal securities.


38


Financial Condition

December 31, 20162017 Compared to December 31, 20152016

Assets

At December 31, 2016,2017, total assets were $1.04 billion, an increase of $99.6 million, or 10.6%, compared to $940.2 million at December 31, 2016. At December 31, 2017, total loans were $850.9 million, an increase of $76.5$97.8 million, or 8.9%, compared to total assets of $863.7 million at December 31, 2015. At December 31, 2016, total loans were $753.1 million, an increase of $59.9 million, or 8.6%13.0%, from the $693.2$753.1 million reported at December 31, 2015.2016. Investment securities, including restricted stock, were $94.6 million at December 31, 2017 as compared to $97.1 million at December 31, 2016, as compared to $80.3 million at December 31, 2015, an increasea decrease of $16.8$2.5 million, or 20.9%2.6%. At December 31, 2016,2017, cash and cash equivalents totaled $42.1$48.2 million compared to $46.7$42.1 million at December 31, 2015,2016, a decreaseincrease of $4.6$6.1 million, or 10.0%14.6%. Our liquidity position is described below under “Liquidity.” Goodwill totaled $18.1 million at both December 31, 20162017 and 2015.

2016.


Liabilities

Total liabilities increased $68.8$93.7 million, or 8.9%11.2%, to $933.2 million at December 31, 2017, from $839.5 million at December 31, 2016, from $770.72016. Total deposits increased $85.0 million, or 10.9%, to $861.6 million at December 31, 2015. Total deposits increased $68.2 million, or 9.6%, to2017, from $776.6 million at December 31, 2016, from $708.42016. FHLB and other borrowings increased $500,000 to $25.8 million at December 31, 2015. Deposits are the Company’s primary source of funds. The deposit increase during 2016 was primarily attributable to the Company’s strategic initiative to continue to remain focused on growing market share through core deposit relationships. The Company anticipates loan demand to increase during 2017, and beyond, and will depend on the expansion and maturation of the branch network as its primary funding source. As a secondary funding source, the Company intends to utilize borrowed funds, including FHLB advances, brokered CDs and deposits obtained through the use of deposit listing services (“Listed Service CDs”), at opportune times during changing rate cycles to help support its growth. The Company continues to experience change in the mix of the deposit products through its branch sales efforts, which are targeted to gain market penetration. In order to fund future loan growth, the Company intends to use the most cost-effective funding mix available within the market area.

FHLB and other borrowings decreased $1.2 million tofrom $25.3 million at December 31, 2016, from $26.5 million at December 31, 2015, and the Company issued $9.8 million of subordinated debentures in December 2015. See “Borrowings” and “Subordinated Debentures” below.

Securities Portfolio

Investment securities, including restricted investments, totaled $94.6 million at December 31, 2017 compared to $97.1 million at December 31, 2016, compared to $80.3 million at December 31, 2015, an increasea decrease of $16.8$2.5 million, or 20.9%2.6%. For 20162017 and 2015,2016, investment securities purchases amounted to $33.2$18.0 million and $46.0$33.2 million, respectively, while repayments, calls and maturities amounted to $15.9$20.4 million and $15.1$15.9 million, respectively. In 2016,2017, there were no investment securities sales as compared to sales totaling $1.0 million resulting in a net gain on sale of $72,000 as compared to sales totaling $24.3 million resulting in a net gain on sale of $37,000 during 2015.

2016.

The Company maintains an investment portfolio to fund increased loans and liquidity needs (resulting from decreased deposits or otherwise) and to provide an additional source of interest income. The portfolio is composed of obligations of the U.S. Government agencies and U.S. Government-sponsored entities, municipal securities, a limited amount of corporate debt securities and an investment in a Community Reinvestment Act (“CRA”) mutual fund. U.S. Government agencies are considered to have the lowest risk due to the “full faith and credit” guarantee by the U.S. Government. All of our mortgage-backed investment securities are collateralized by pools of mortgage obligations that are guaranteed by privately managed, U.S. Government-sponsored enterprises (“GSE”), such as Fannie Mae, Freddie Mac and the Government National Mortgage Association. Due to these GSE guarantees, these investment securities are susceptible to less risk of non-performance and default than other corporate securities which are collateralized by private pools of mortgages. At December 31, 2016,2017, the Company maintained $16.7$15.6 million of GSE residential mortgage-backed securities in the investment portfolio and $12.3$9.7 million of collateralized residential mortgage obligations, all of which are current as to payment of principal and interest and are performing to the terms set forth in their respective prospectuses. Municipal securities are evaluated by a review of the credit ratings of the underlying issuer, any changes in such ratings that have occurred, and adverse conditions relating to the security or its issuer, as well as other factors.

Included within the Company’s investment portfolio are trust preferred securities, which consists of four single issue securities issued by large financial institutions with Moody’s ratings from Baa1 to Ba1.Baa3. These securities have an amortized cost value of $2.8 million and a fair value of $2.5$2.6 million at December 31, 2016.2017. The unrealized loss on these securities is related to general market conditions and the widening of interest rate spreads and downgrades in credit ratings.

spreads.

Management evaluates all securities for other-than-temporary impairment at least on a quarterly basis, and more frequently when economic and market concerns warrant such evaluations. As of December 31, 2016,2017, all of these securities are current with their scheduled interest payments. Future deterioration in the cash flow of these investments or the credit quality of the financial institution issuers could result in impairment charges in the future.

The Company accounts for its investment securities as available for sale or held to maturity. Management determines the appropriate classification at the time of purchase. Based on an evaluation of the probability of the occurrence of future events, we determine if we have the ability and intent to hold the investment securities to maturity, in which case we classify them as held to maturity. All other investments are classified as available for sale.


Securities classified as available for sale must be reported at fair value, with unrealized gains and losses excluded from earnings and reported as a separate component of shareholders’ equity, net of taxes. Gains or losses on the sales of securities available for sale are recognized upon realization utilizing the specific identification method. The net effect of unrealized gains or losses, caused by marking our available for sale portfolio to fair value, could cause fluctuations in the level of shareholders’ equity and equity-related financial ratios as changes in market interest rates cause the fair value of fixed-rate securities to fluctuate.

Securities classified as held to maturity are carried at cost, adjusted for amortization of premium and accretion of discount over the terms of the maturity in a manner that approximates the interest method.


39


The following table sets forth the carrying value of the securities portfolio as of December 31, 2017, 2016 2015 and 20142015 (in thousands).


December 31,


2016


2015


2014


Securities available for sale at fair value:


U.S. Government agency securities

 $8,413  $1,238  $2,709 

Municipal securities

  503   517   522 

U.S. Government-sponsored enterprises (“GSE”) -residential mortgage-backed securities

  11,255   14,449   21,321 

U.S. Government collateralized residential mortgage obligations

  9,537   12,627   16,123 

Corporate debt securities, primarily financial institutions

  2,359   2,317   2,311 

Community Reinvestment Act (“CRA”) mutual fund

  2,397   2,382   2,445 
             
Total securities available for sale $34,464  $33,530  $45,431 
             

Securities held to maturity at amortized cost:


Municipal securities

 $47,806  $33,956  $18,138 

GSE - residential mortgage-backed securities

  5,414   3,789   2,100 

U.S. Government collateralized residential mortgage obligations

  2,801   3,602   3,225 

Corporate debt securities, primarily financial institutions

  1,822   1,820   1,817 
             
Total securities held to maturity $57,843  $43,167  $25,280 

 December 31,
 2017 2016 2015
Securities available for sale at fair value:     
U.S. Government agency securities$10,057
 $8,413
 $1,238
Municipal securities495
 503
 517
U.S. Government-sponsored enterprises (“GSE”) - residential mortgage-backed securities8,219
 11,255
 14,449
U.S. Government collateralized residential mortgage obligations7,482
 9,537
 12,627
Corporate debt securities, primarily financial institutions2,431
 2,359
 2,317
Community Reinvestment Act (“CRA”) mutual fund2,448
 2,397
 2,382
      
Total securities available for sale$31,132
 $34,464
 $33,530
      
Securities held to maturity at amortized cost:     
Municipal securities$46,614
 $47,806
 $33,956
GSE - residential mortgage-backed securities7,339
 5,414
 3,789
U.S. Government collateralized residential mortgage obligations2,224
 2,801
 3,602
Corporate debt securities, primarily financial institutions1,825
 1,822
 1,820
      
Total securities held to maturity$58,002
 $57,843
 $43,167


40


The contractual maturity distribution and weighted average yields, calculated on the basis of the stated yields to maturity, taking into account applicable premiums or discounts, of the securities portfolio at December 31, 20162017 is set forth in the following table (excluding restricted stock and mutual fund). Securities available for sale are carried at amortized cost in the table for purposes of calculating the weighted average yield. Expected maturities will differ from contractual maturities because borrowers may have the right to call or prepay obligations with or without call or prepayment penalties. There have been no tax equivalent adjustments made to the yields on tax-exempt securities.

December 31, 2016


Due within 1

year


Due 1 – 5 years


Due 5 – 10 years


Due after 10

years


Total


(dollars in thousands)


Amortized

Cost


Wtd

Avg

Yield


Amortized

Cost


Wtd

Avg

Yield


Amortized

Cost


Wtd

Avg

Yield


Amortized

Cost


Wtd

Avg

Yield


Amortized

Cost


Wtd

Avg

Yield


Securities available for sale:


U.S. Government agency securities

 $-   -  $1,245   0.88

%

 $-   -  $7,229   4.51

%

 $8,474   3.98

%

Municipal securities

  -   -   501   4.38

%

  -   -   -   -   501   4.38

%

GSE – residential mortgage-backedsecurities

  -   -   2   5.50

%

  2,027   3.72

%

  9,426   2.60

%

  11,455   2.80

%

U.S. Government collateralizedresidential mortgage obligations

  -   -   1,852   2.30

%

  231   2.22

%

  7,648   2.63

%

  9,731   2.55

%

Corporate debt securities,primarily financial institutions

  -   -   1,498   1.98

%

  -   -   995   1.91

%

  2,493   1.95

%

                                         
Total securities available for sale $-   -  $5,098   2.06

%

 $2,258   3.57

%

 $25,298   3.13

%

 $32,654   2.99

%


Securities held to maturity:


Municipal securities

 $12,158   1.03

%

 $3,308   3.33

%

 $6,094   4.27

%

 $26,246   4.68

%

 $47,806   3.61

%

GSE – residential mortgage-backedsecurities

  -   -   -   -   1,832   2.50

%

  3,582   2.66

%

  5,414   2.60

%

U.S. Government collateralizedresidential mortgage obligations

  -   -   -   -   -   -   2,801   2.40

%

  2,801   2.40

%

Corporate debt securitiesprimarily financial institutions

  -   -   -   -   -   -   1,822   1.43

%

  1,822   1.43

%

                                         
Total securities held to maturity $12,158   1.03

%

 $3,308   3.33

%

 $7,926   3.86

%

 $34,451   4.11

%

 $57,843   3.39

%

December 31, 2017 
Due within 1
year
 Due 1 – 5 years Due 5 – 10 years 
Due after 10
years
 Total
(dollars in thousands) 
Amortized
Cost
Wtd
Avg
Yield
 
Amortized
Cost
Wtd
Avg
Yield
 
Amortized
Cost
Wtd
Avg
Yield
 
Amortized
Cost
Wtd
Avg
Yield
 
Amortized
Cost
Wtd
Avg
Yield
Securities available for sale:  


U.S. Government agency securities $3,755
1.50% $
% $889
5.19% $5,461
5.26% $10,105
3.86%
Municipal securities 

 
% 175
4.63% 319
4.25% 494
4.38%
GSE – residential mortgage-backed securities 

 7,182
3.05% 568
2.37% 612
2.37% 8,362
2.95%
U.S. Government collateralized residential mortgage obligations 1,253
1.58% 3,457
3.18% 
% 2,962
1.98% 7,672
2.45%
Corporate debt securities, primarily financial institutions 

 1,994
2.41% 

 500
2.33% 2,494
2.40%
                
Total securities available for sale $5,008
1.52% $12,633
2.98% $1,632
4.14% $9,854
3.92% $29,127
3.11%
                
Securities held to maturity:               
Municipal securities $
% $
% $16,495
1.72% $30,119
4.64% $46,614
3.61%
GSE – residential mortgage-backed securities 

 5,937
2.58% 
% 1,402
2.50% 7,339
2.56%
U.S. Government collateralized residential mortgage obligations 2,224
2.43% 


% 2,224
2.43%
Corporate debt securities primarily financial institutions 

 1,825
1.95% 

 
% 1,825
1.95%
                
Total securities held to maturity $2,224
2.43% $7,762
2.43% $16,495
1.72% $31,521
4.54% $58,002
3.38%

41


Loan Portfolio

The following table summarizes total loans outstanding by loan category and amount on the dates indicated.

During the second quarter of 2014, certain types of loans were reclassified due to their purpose and overall risk characteristics. Therefore, balances on certain loan and allowance for loan losses as of December 31, 2013, and 2012 were reclassified to conform to the December 31, 2014 presentation.


December 31,


2016


2015


2014


Amount


Percent


Amount


Percent


Amount


Percent


(in thousands, except for percentages)


Commercial and industrial

 $93,697   12.4% $100,154   14.5% $96,514   15.4%

Real estate - construction

  111,914   14.9%  104,231   15.0%  89,145   14.2%

Real estate - commercial

  460,685   61.2%  422,665   61.0%  383,777   61.1%

Real estate - residential

  59,065   7.8%  39,524   5.7%  30,808   4.9%

Consumer

  28,279   3.8%  27,136   3.9%  28,095   4.5%

Unearned fees

  (548

)

  (0.1

%)

  (560

)

  (0.1

%)

  (725

)

  (0.1

%)


Total loans

 $753,092   100.0% $693,150   100.0% $627,614   100.0%


December 31,


2013


2012


Amount


Percent


Amount


Percent


(in thousands, except for percentages)


Commercial and industrial

 $91,887   15.2% $95,023   16.6%

Real estate - construction

  98,284   16.3%  104,506   18.3%

Real estate - commercial

  355,530   59.0%  314,321   55.0%

Real estate - residential

  25,588   4.2%  20,475   3.6%

Consumer

  32,413   5.4%  37,378   6.6%

Unearned fees

  (886

)

  (0.1

%)

  (656

)

  (0.1

%)


Total loans

 $602,816   100.0% $571,047   100.0%

 December 31,
 2017 2016 2015
 Amount Percent Amount Percent Amount Percent
            
 (in thousands, except for percentages)
Commercial and industrial$101,371
 11.9 % $93,697
 12.4 % $100,154
 14.5 %
Real estate - construction118,094
 13.9 % 111,914
 14.9 % 104,231
 15.0 %
Real estate - commercial537,733
 63.2 % 460,685
 61.2 % 422,665
 61.0 %
Real estate - residential64,238
 7.6 % 59,065
 7.8 % 39,524
 5.7 %
Consumer30,203
 3.5 % 28,279
 3.8 % 27,136
 3.9 %
Unearned fees(765) (0.1)% (548) (0.1)% (560) (0.1)%
            
Total loans$850,874
 100.0 % $753,092
 100.0 % $693,150
 100.0 %
 December 31,
 2014 2013
 Amount Percent Amount Percent
        
 (in thousands, except for percentages)
Commercial and industrial$96,514
 15.4 % $91,887
 15.2 %
Real estate - construction89,145
 14.2 % 98,284
 16.3 %
Real estate - commercial383,777
 61.1 % 355,530
 59.0 %
Real estate - residential30,808
 4.9 % 25,588
 4.2 %
Consumer28,095
 4.5 % 32,413
 5.4 %
Unearned fees(725) (0.1)% (886) (0.1)%
        
Total loans$627,614
 100.0 % $602,816
 100.0 %
Total loans, net of unearned fees, increased by $59.9$97.8 million, or 8.6%13.0%, to a new high of $850.9 million at December 31, 2017 compared to $753.1 million at December 31, 2016 compared to $693.2 million at December 31, 2015.2016. The increase was due to growth in commercial real estate, residential and construction lending.all sectors of the portfolio. Our local economy seems to reflectreflects some strengthening in certain sectors. As such, we remain optimistic in our growth prospects for lending in 2017,2018, recognizing that we will continue to be challenged due in part to both the competitive landscape and pricing pressures in this low rate environment.pressures. Our loan pipeline remains strong as we continue to stay focused on growing our portfolio. One of our strategies is to open low cost loan production offices (“LPOs”) in contiguous markets and once a certain level of business is achieved, the intention is to replace some of these LPOs with a full service branch at an appropriate location within that market. During the second quarter of 2015, we replaced our Freehold, New Jersey LPO with a full service branch to support that market. During the first quarter of 2016, the Bank re-opened an LPO in the Summit, New Jersey market, which now complements our other LPO in Toms River, New Jersey. In February 2017, the Bank relocated our Toms River LPO into a new, more highly visible location.location that now compliments our other LPO in Summit, New Jersey. Our LPOs are staffed by experienced seasoned loan officers who are knowledgeable within these markets and have begun to produce positive results.

The mix of our loan composition at December 31, 2016 when compared to December 31, 20152017 reflects our desire to continue emphasizing commercial and industrial, commercial real estate, construction and residential lending. Within the loan portfolio, commercial real estate loans remained the largest component, constituting 61.2%63.2% of our total loans outstanding at December 31, 2016,2017, up slightly from 61.0% from the prior year.61.2% at December 31, 2016. These loans increased by $38.0$77.0 million, or 9.0%16.7%, to $537.7 million at December 31, 2017, compared to $460.7 million at December 31, 2016, compared to $422.7 million at December 31, 2015 due to both increased production as well as completed construction projects which, at the time of renewal, were converted to commercial real estate loans.projects. Commercial and industrial loans decreased $6.5increased $7.7 million, or 6.4%8.2%, to $101.4 million at year-end 2017 compared to $93.7 million at year-end 2016, compared to $100.2 million at year-end 2015, and comprised 12.4%11.9% of our portfolio, down from 14.5%12.4% for the prior year. This decline was due mainly to the payoff of one large adversely classified credit. Real estate construction loans increased by $7.7$6.2 million, or 7.4%5.5%, to $111.9$118.1 million at December 31, 2016,2017, and comprised 14.9%13.9% of our total loans outstanding, down slightly from 15.0%14.9% for the prior year. Residential real estate loans increased $19.5$5.2 million, or 49.4%8.8%, and comprised 7.8%7.6% of our total loan portfolio at December 31, 2016, up2017, down slightly from 5.7%7.8% for the prior year. The increase in real estate residential loans is inclusive of the sale

42


of $8.2 million in portfolio adjustable rate mortgages during the year, which generated a gain of $177,000. Consumer loans increased by $1.2$1.9 million, or 4.2%6.7%, to $30.2 million at December 31, 2017 compared to $28.3 million at December 31, 2016, compared to $27.1 million at December 31, 2015, and comprised 3.8%3.5% of our 20162017 loan portfolio compared to 3.9%3.8% for 2015.

2016.

The following table sets forth the aggregate maturities of commercial and construction related loans, net of unearned discounts and deferred loan fees, in specified categories and the amount of such loans, which have fixed and variable rates as of December 31, 2016.

As of December 31, 2016


Due within 1

year


Due 1–5 years


Due after 5

years


Total


(in thousands)


Commercial and industrial

 $42,205  $36,754  $14,738  $93,697 

Real estate - construction

  76,185   24,965   10,764   111,914 

Real estate - commercial

  12,090   94,695   353,900   460,685 
                 

Total

 $130,480  $156,414  $379,402  $666,296 
                 

Fixed rate loans

 $49,303  $81,028  $75,109  $205,440 

Variable rate loans

  81,177   75,386   304,293   460,856 
                 

Total

 $130,480  $156,414  $379,402  $666,296 

2017.

As of December 31, 2017 
Due within 1
year
 Due 1–5 years 
Due after 5
years
 Total
    (in thousands)  
Commercial and industrial $41,449
 $37,459
 $22,463
 $101,371
Real estate - construction 67,640
 33,848
 16,606
 118,094
Real estate - commercial 7,759
 77,485
 452,489
 537,733
         
Total $116,848
 $148,792
 $491,558
 $757,198
         
Fixed rate loans $42,094
 $87,516
 $104,653
 $234,263
Variable rate loans 74,754
 61,276
 386,905
 522,935
         
Total $116,848
 $148,792
 $491,558
 $757,198
Asset Quality

One of our key operating objectives has been, and continues to be, to maintain a high level of asset quality. We continually analyze our credit quality through a variety of strategies. We have been proactive in addressing problem and non-performing assets, and management believes our allowance for loan losses is adequate to cover inherent and probable losses. These strategies, as well as our underwriting standards for new loan originations, have resulted in relatively low levels of non-performing loans and charge-offs. Our loan portfolio composition generally consists of loans secured by commercial real estate, land development and construction of real estate projects mainly in the Monmouth, Middlesex, Union and Ocean Counties, New Jersey market area. We continue to have lending success and growth in the medical markets through our Private Banking Department. We have experienced signs of improvement in our markets as our loan pipeline remains strong. Efficient and effective asset management strategies reflect the type and quality of assets being underwritten and originated.

The Company continues to be proactive in identifying troubled credits early, to record charge-offs promptly based on current collateral values, and to maintain an adequate allowance for loan losses at all times. We closely monitor local and regional real estate markets and other risk factors related to our loan portfolio.

The Bank does not originate or purchase loans with payment options, negative amortization loans or sub-prime loans. We evaluate the classification of all our loans, and the financial results of some of those loans may be adversely impacted by changes in the prevailing economic conditions, either nationally or in our local market areas, including decreases in real estate values, adverse employment conditions, the monetary and fiscal policies of the federal and state government and other significant external events. For loans involved in a workout situation, a new or updated appraisal or evaluation, as appropriate, is ordered to address current project plans and market conditions that were considered in the development of the workout plan. The consideration includes whether there has been material deterioration in the following factors: the performance of the project; conditions for the geographic market and property type; variances between actual conditions and original appraisal assumptions; changes in project specifications (e.g., changing a planned condominium project to an apartment building); loss of a significant lease or a take-out commitment. A new appraisal may not be necessary in all instances where an internal evaluation is used to appropriately update the original appraisal assumptions reflecting current market conditions along with providing an estimate of the collateral’s fair market value for impairment analysis testing.

Non-Performing Assets

Non-performing assets include loans that are not accruing interest (non-accrual loans), loans past due 90 days or more and still accruing and other real estate owned, which consists of real estate acquired as the result of a defaulted loan. A loan is placed on non-accrual status when collection of all principal or interest is considered unlikely or when principal or interest is past due for 90 days or more, unless the loan is well-secured and in the process of collection, in which case, the loan will continue to accrue interest. Any unpaid interest previously accrued on those loans is reversed from income. Interest income on other non-accrual loans is recognized only to the extent of interest payments received. A troubled debt restructuring loan (“TDR”) is a loan in which the contractual terms have been

43


modified resulting in the Bank granting a concession to a borrower who is experiencing financial difficulties in order for the Bank to have a greater opportunity of collecting the indebtedness from the borrower. Non-accruing TDRs are included in non-performing loans.


At December 31, 20162017 and 2015,2016, the Company had $1.5$2.1 million and $3.2$1.5 million in non-accrual loans, respectively. Our non-performing loans are primarily secured by real estate. There were no loans past due 90 days or more and still accruing interest at December 31, 20162017 and 2015.

2016.

The following table summarizes our non-performing assets for each of the five years in the period ended December 31, 2016.2017. Total TDRs are broken out at the bottom portion of the table.


Years ended December 31,


2016


2015


2014


2013


2012


(dollars in thousands)


Non-Performing Assets:


Non-Performing Loans:


Commercial and industrial

 $119  $138  $119  $17  $94 

Real estate – construction

  -   -   407   225   2,246 

Real estate – commercial

  666   2,244   4,722   5,483   2,883 

Real estate – residential

  763   796   694   -   263 

Consumer

  -   -   295   284   1,986 
                     

Total Non-Performing Loans

  1,548   3,178   6,237   6,009   7,472 
                     

Loans Past Due 90 days or More and Still Accruing

  -   -   -   -   2 
                     

Other Real Estate Owned and repossessed assets

  259   411   1,603   2,771   1,752 
                     

Total Non-Performing Assets

 $1,807  $3,589  $7,840  $8,780  $9,226 
                     

Ratios:


Non-Performing loans to total loans

  0.21

%

  0.46

%

  0.99

%

  1.00

%

  1.31

%


Non-Performing assets to total assets

  0.19

%

  0.42

%

  1.00

%

  1.14

%

  1.26

%


Troubled Debt Restructured Loans:


Performing

 $8,075  $9,289  $16,284  $23,021  $9,551 

Non-performing (included in non-performingassets above)

  157   1,552   4,269   2,355   - 

 Years ended December 31,
 2017 2016 2015 2014 2013
(dollars in thousands)         
          
Non-Performing Assets:         
Non-Performing Loans:         
Commercial and industrial$790
 $119
 $138
 $119
 $17
Real estate – construction150
 
 
 407
 225
Real estate – commercial219
 666
 2,244
 4,722
 5,483
Real estate – residential717
 763
 796
 694
 
Consumer194
 
 
 295
 284
          
Total Non-Performing Loans2,070
 1,548
 3,178
 6,237
 6,009
          
OREO and repossessed assets
 259
 411
 1,603
 2,771
          
Total Non-Performing Assets$2,070
 $1,807
 $3,589
 $7,840
 $8,780
          
Ratios:         
Non-Performing loans to total loans0.24% 0.21% 0.46% 0.99% 1.00%
          
Non-Performing assets to total assets0.20% 0.19% 0.42% 1.00% 1.14%
          
Troubled Debt Restructured Loans:         
Performing$6,053
 $8,075
 $9,289
 $16,284
 $23,021
Non-performing (included in non-performing assets above)994
 157
 1,552
 4,269
 2,355
Total non-performing loans decreasedincreased by $1.6 million$500,000 from December 31, 2015 to December 31, 2016. NineTwelve loans comprised the $1.6$2.1 million of non-performing loans at December 31, 2016,2017, compared to nine loans for the $3.2$1.5 million at December 31, 2015.2016. At December 31, 2016,2017, the Company believes it has a manageable level of non-performing loans, many of which are in the final stages of loss mitigation or legal resolution.

At December 31, 2016,2017, non-performing commercial and industrial loans decreasedincreased by $19,000$671,000 from December 31, 20152016, primarily due to the payoffaddition of one loan along with paydowns.four credits totaling $687,000. The $119,000$790,000 is comprised of threefive commercial term loans.

At December 31, 2016,2017, non-performing real estate commercial loans decreased by $1.6 million$447,000 from December 31, 2015,2016, due primarily to the payoff of two loans.

one loan.

At December 31, 2016,2017, non-performing real estate residential loans decreased $33,000,$46,000 from December 31, 2015 due to paydowns.

2016.


At December 31, 2017, non-performing real estate construction loans increased $150,000 from December 31, 2016. The $150,000 is comprised of one single advance construction loan.

44


At December 31, 2017, non-performing consumer loans increased $194,000 from December 31, 2016. The $194,000 is comprised of one home equity line of credit.
OREO represents real estate acquired as a result of foreclosure or by deed in lieu of foreclosure. These assets are carried at the lower of cost or fair value less estimated selling costs. When a property is acquired, the excess of the loan balance over fair value, less selling costs, is charged to the allowance for loan losses. Operating results from real estate owned, including rental income, operating expenses, and gains and losses realized from the sales of real estate owned are recorded as incurred. At December 31, 2016,2017, the Bank had $259,000 ofno OREO consisting of oneproperty,properties compared to $411,000$259,000 at December 31, 2015,2016, which consisted of two properties.one property. During 2016, one2017, the Bank sold its only OREO property totaling $152,000 was sold for a loss of $45,000.

$17,000.

All of our OREO are aggressively marketed and are monitored on a regular basis to ensure valuations are in line with current fair market values.

Loans whose terms are modified are classified as TDRs if the Company grants such borrowers concessions and it is deemed that those borrowers are experiencing financial difficulty. Concessions granted under a TDR generally involve a temporary reduction in interest rate or a modification of a loan’s amortization schedule. Non-accrual TDRs are restored to accrual status if principal and interest payments, under the modified terms, are current for six consecutive months after the modification is in place. Loans classified as TDRs are designated as impaired from a cash flow perspective. Modifications involving troubled borrowers may include a modification of a loan’s amortization schedule, reduction in the stated interest rate and rescheduling of future cash flows.

The Company’s TDR modifications are made on terms typically up to 12 months in order to aggressively monitor and track performance of the credit. The short-term modifications are monitored for continued performance for an additional period of time after the expiration of the concession. Balance reductions and annualized loss rates are also important metrics that are monitored. The main objective of the modification program is to reduce the payment burden for the borrower and to deleverage the Company’s exposure.

As of December 31, 2016,2017, TDRs totaled $8.2$7.0 million as compared to $10.8$8.2 million at December 31, 2015,2016, a decrease of $2.6$1.2 million. The decrease was largely the result of pay downs and payoffs. Concessions made on TDRs generally involved a temporary reduction in interest rate or a modification of a loan’s amortization schedule. The main objective of the modification is to reduce the payment burden for the borrower and improve the net present value of the Company’s expected cash flows. The $8.2$7.0 million is comprised of $935,000$228,000 in real estate commercial loans, $3.0$3.1 million in real estate construction loans, $3.9$3.3 million in commercial and industrial loans, $375,000and $369,000 in real estate-residential.estate residential loans. All but two identified TDRsTDR's, except for one loan relationship, as of December 31, 2016,2017, are collateral dependentcollateral-dependent loans, while one loan relationship is unsecured and on non-accrual, for which the two others, representing one relationship, are cash flow dependent.Company has charged off 77%, or $381,000, during 2017. Of the $8.2$7.0 million, $498,000no relationships have a specific reservesreserve in our ALLL computation totaling $2,000. the allowance for loan loss computation.
The remaining $7.7 million of TDRs are adequately collateralized requiring no specific reserves.

The $935,000$228,000 in real estate commercial loans identified as TDRs are all accruing, with the exception of one non-accrual loans totaling $54,000. The non-accrual loan totaling $54,000,$103,000, which is secured by real estate.

The remaining $881,000 million of performing TDRs are amortizing on various terms. The TDR designation was given primarily due to concessions granted for interest rate, amortization or maturity. These factors were all a result of the weak economy, which resulted in the borrowers having financial and cash flow difficulties.

The $3.0$3.1 million in real estate construction loans are primarily comprised of twothree relationships whichand are currently being developed, under contract and/or amortizing.

all performing, with the exception of one non-accrual loan totaling $150,000.

The $3.9$3.3 million in commercial and industrial loans are all performing, with the exception of onefive non-accrual loanloans totaling $103,000.

$741,000.

The $375,000$369,000 in real estate residential loans is one loan which isare all performing.


Potential Problem Loans

Potential problem loans consist of special mention, substandard and substandarddoubtful loans. At December 31, 2016,2017, the Company had $17.2$22.9 million in loans that were risk rated as special mention, substandard or substandard,doubtful, which includes $1.5$2.1 million in non-accrual loans that are included in the substandard category.and doubtful categories. This $17.2$22.9 million of special mention, substandard and substandarddoubtful loans represent an increase of $336,000$5.7 million from $16.9the $17.2 million at December 31, 2015. The change in risk rated loans was attributable to certain loans which were either upgraded2016, primarily due to a varietyone credit downgraded to special mention during the third quarter of changing conditions, including general economic conditions and/or conditions applicable to the specific borrower, or due to payoffs and paydowns.

2017.


45


At December 31, 2016,2017, other than the loans set forth above, the Company is not aware of any loans which present serious doubts as to the ability of its borrowers to comply with present loan repayment terms and which are expected to fall into one of the risk categories set forth in the description herein.

comprising potential problem loans.

Allowance for Loan Losses

Analysis and Determination of the Allowance for Loan Losses

The allowance for loan losses is a valuation allowance for probable credit losses in the loan portfolio. We evaluate the need to establish allowances against losses on loans on a monthly basis, and such allowances are reported to the Board of Directors on a quarterly basis. Through our prudent risk management practices, we continuously monitor the credit quality of our loan portfolio and maintain an allowance sufficient to absorb current probable and estimable losses inherent in our loan portfolio. We are committed to the timely recognition of problem loans and maintaining an appropriate and adequate allowance.

Our methodology for assessing the appropriateness of the allowance for loan losses consists of: (1) a specific allowance on impaired loans, (2) a general valuation allowance on the remainder of the loan portfolio, and (3) unallocated.an unallocated allowance to reflect the imprecision of loan loss methodologies. Although we determine the amount of each element of the allowance separately, the entire allowance for loan losses is available for the entire portfolio.

Specific Allowance Required for Impaired Loans

The first element of the allowance for loan loss analysis involves the estimation of allowance specific to individually evaluated impaired loans, including restructured commercial and industrial, commercial and residential real estate, and consumer loans. In this process, a specific allowance may be established for impaired loans based on an analysis of the most probable sources of repayment, including discounted cash flows, liquidation of collateral, or the market value of the loan itself. Restructured consumer loans are also evaluated in this element of the estimate.

General Valuation Allowance on the Remainder of the Loan Portfolio

We establish a general allowance for non-impaired loans to recognize the inherent losses associated with lending activities. This general valuation allowance is determined by segregating the loans by loan category and assigning percentages to each category. The percentages are adjusted for significant factors that, in management’s judgment, affect the collectability of the portfolio as of the evaluation date. These significant factors include changes in existing general economic and business conditions affecting our primary lending areas and the national economy, staff lending experience, recent historical loss experience in particular segments of the portfolio, specific reserve and classified asset trends, delinquency trends and risk rating trends. These loss factors are subject to ongoing evaluation to ensure their relevance in the current economic environment.

Future adjustments to the allowance for loan losses account may be necessary due to economic, operating, regulatory and other conditions beyond our control. Our primary lending emphasis is the origination of loans secured by commercial and residential real estate in the greater central New Jersey area. We are diligently working to address any asset quality concerns, including working with borrowers and increasing our allowance for loan losses when appropriate to ensure that we are well positioned for any losses that we may incur.

Unallocated

An unallocated component is maintained to cover certain uncertainties that could affect management’s estimate of probable losses. The unallocated component of the allowance reflects the margin of imprecision inherent in the underlying assumptions used in the methodologies for estimating specific and general losses in the portfolio.


46


The following table summarizes our allowance for loan losses for each of the five years in the period ended December 31, 2016.


Years ended December 31,


2016


2015


2014


2013


2012


(in thousands, except for percentages)


Balance at beginning of year

 $8,713  $8,069  $7,872  $7,984  $7,310 
                     

Provision charged to expense

  515   490   621   910   1,380 
                     

Recoveries of loans charged off:


Commercial and industrial

  12   12   454   54   18 

Real estate - construction

  12   217   -   397   169 

Real estate - commercial

  696   2   177   -   - 

Real estate - residential

  -   -   30   -   - 

Consumer

  66   5   46   2   3 

Loans charged-off:


Commercial and industrial

  -   -   -   (942

)

  (552

)

Real estate - construction

  -   -   -   -   (59

)

Real estate - commercial

  (444

)

  -   (990

)

  (186

)

  - 

Real estate - residential

  -   -   (4

)

  (60

)

  - 

Consumer

  (5

)

  (82

)

  (137

)

  (287

)

  (285

)


Recoveries (Charge-offs), net

  337   154   (424

)

  (1,022

)

  (706

)


Balance of allowance at end of year

 $9,565  $8,713  $8,069  $7,872  $7,984 
                     

Ratio of net charge-offs (recoveries) to averageloans outstanding

  (0.05

%)

  (0.02

%)

  0.07

%

  0.18

%

  0.13

%


Balance of allowance as a percentof loans at year-end

  1.27

%

  1.26

%

  1.29

%

  1.31

%

  1.40

%


Ratio of allowance to non-performingloans at year-end

  617.89

%

  274.17

%

  129.37

%

  131.00

%

  106.85

%

2017.
 Years ended December 31,
 2017 2016 2015 2014 2013
          
 (in thousands, except for percentages)
Balance at beginning of year$9,565
 $8,713
 $8,069
 $7,872
 $7,984
          
Provision charged to expense1,530
 515
 490
 621
 910
          
Recoveries of loans charged off:         
Commercial and industrial18
 12
 12
 454
 54
Real estate - construction12
 12
 217
 
 397
Real estate - commercial24
 696
 2
 177
 
Real estate - residential
 
 
 30
 
Consumer6
 66
 5
 46
 2
Loans charged-off:         
Commercial and industrial(381) 
 
 
 (942)
Real estate - construction


Real estate - commercial
 (444) 
 (990) (186)
Real estate - residential
 
 
 (4) (60)
Consumer(106) (5) (82) (137) (287)
          
Recoveries (charge-offs), net(427) 337
 154
 (424) (1,022)
          
Balance of allowance at end of year$10,668
 $9,565
 $8,713
 $8,069
 $7,872
          
Ratio of net charge-offs (recoveries) to average loans outstanding0.05% (0.05%) (0.02%) 0.07% 0.18%
          
Balance of allowance as a percent of loans at year-end1.25% 1.27 % 1.26 % 1.29% 1.31%
          
Ratio of allowance to non-performing loans at year-end515.36% 617.89 % 274.17 % 129.37% 131.00%

47


Allocation of the Allowance for Loan Losses

The following table sets forth the allocation of the allowance for loan losses by category of loans and the percentage of loans in each category to total loans for each of the five years in the period ended December 31, 2016.


December 31,


2016


2015


2014


Percent of


Percent of


Percent of


(dollars in thousands)


Amount


Allowance

to total

allowance


Loans

to total

loans


Amount


Allowance

to total

allowance


Loans

to total

loans


Amount


Allowance

to total

allowance


Loans

to total

loans


Balance applicable to:


Commercial and industrial

 $844   8.8%  12.4% $990   11.4%  14.5% $1,044   12.9%  15.4%

Real estate - construction

  1,276   13.3%  14.9%  1,283   14.7%  15.0%  1,454   18.0%  14.2%

Real estate - commercial

  6,315   66.1%  61.1%  5,599   64.2%  60.9%  4,624   57.3%  61.0%

Real estate - residential

  463   4.8%  7.8%  304   3.5%  5.7%  223   2.8%  4.9%

Consumer

  244   2.6%  3.8%  242   2.8%  3.9%  565   7.0%  4.5%

Unallocated

  423   4.4%  0.0%  295   3.4%  0.0%  159   2.0%  0.0%
                                     

Total

 $9,565   100.0%  100.0% $8,713   100.0%  100.0% $8,069   100.0%  100.0%


December 31,


2013


2012


Percent of


Percent of


(dollars in thousands)


Amount


Allowance

to total

allowance


Loans

to total

loans


Amount


Allowance

to total

allowance


Loans

to total

loans


Balance applicable to:


Commercial and industrial

 $990   12.6%  15.2% $1,256   15.7%  16.6%

Real estate - construction

  1,634   20.8%  16.3%  1,894   23.7%  18.3%

Real estate - commercial

  4,325   54.9%  58.9%  3,708   46.5%  54.9%

Real estate - residential

  190   2.4%  4.2%  217   2.7%  3.6%

Consumer

  594   7.5%  5.4%  740   9.3%  6.6%

Unallocated

  139   1.8%  0.0%  169   2.1%  0.0%
                         

Total

 $7,872   100.0%  100.0% $7,984   100.0%  100.0%

2017. 

 December 31,
 2017 2016 2015
   Percent of   Percent of   Percent of
(dollars in thousands)Amount 
Allowance
to total
allowance
 
Loans
to total
loans
 Amount 
Allowance
to total
allowance
 
Loans
to total
loans
 Amount 
Allowance
to total
allowance
 
Loans
to total
loans
Balance applicable to:                 
Commercial and industrial$930
 8.7% 11.9% $844
 8.8% 12.4% $990
 11.4% 14.5%
Real estate - construction1,389
 13.0% 13.9% 1,276
 13.3% 14.9% 1,283
 14.7% 15.0%
Real estate - commercial7,325
 68.7% 63.1% 6,315
 66.1% 61.1% 5,599
 64.2% 60.9%
Real estate - residential502
 4.7% 7.6% 463
 4.8% 7.8% 304
 3.5% 5.7%
Consumer174
 1.6% 3.5% 244
 2.6% 3.8% 242
 2.8% 3.9%
Unallocated348
 3.3% % 423
 4.4% % 295
 3.4% %
                  
Total$10,668
 100.0% 100.0% $9,565
 100.0% 100.0% $8,713
 100.0% 100.0%
 December 31,
 2014 2013
        
   Percent of   Percent of
(dollars in thousands)Amount 
Allowance
to total
allowance
 
Loans
to total
loans
 Amount 
Allowance
to total
allowance
 
Loans
to total
loans
Balance applicable to:           
Commercial and industrial$1,044
 12.9% 15.4% $990
 12.6% 15.2%
Real estate - construction1,454
 18.0% 14.2% 1,634
 20.8% 16.3%
Real estate - commercial4,624
 57.3% 61.0% 4,325
 54.9% 58.9%
Real estate - residential223
 2.8% 4.9% 190
 2.4% 4.2%
Consumer565
 7.0% 4.5% 594
 7.5% 5.4%
Unallocated159
 2.0% % 139
 1.8% %
            
Total$8,069
 100.0% 100.0% $7,872
 100.0% 100.0%
The Company’s allowance for loan losses was $10.7 million and $9.6 million at December 31, 2017 and 2016, and $8.7 million at December 31, 2015.respectively. The allowance for loan losses as a percentage of total loans at December 31, 20162017 was 1.27%1.25%, compared with 1.26%1.27% at December 31, 2015.2016. The Company had total provisions to the allowance for loan losses for the year ended December 31, 20162017 in the amount of $515,000$1.5 million as compared to $490,000$515,000 for the comparable period in 2015.2016. Net recoveriescharge-offs for the year ended December 31, 20162017 were $337,000,$427,000, compared to net recoveries of $154,000$337,000 for the year ended December 31, 2015.2016. Total recoveries were $786,000$60,000 for the year ended December 31, 2016, an increase of $550,000, from the $236,0002017 compared to $786,000 in 2015.2016. Total charge-offs were $449,000$487,000 for the year ended December 31, 2016, an increase of $367,000, from the $82,0002017 compared to $449,000 in 2015.2016. The $449,000$487,000 in charge-offs in 20162017 was primarily related to one credittwo credits that waswere charged off in the third quarterfirst and recovered in the fourth quarter.quarters. Non-performing loans at December 31, 20162017 are either well-collateralized or adequately reserved for in the allowance for loan losses.

In management’s opinion, the level of allowance for loan losses, totaling $9.6$10.7 million at December 31, 2016,2017, is appropriate to adequately provide for inherent and probable losses in the portfolio. In the current interest rate and credit quality environment, our risk management philosophy has been to stay within our established credit culture. Management will continue to review the need for additions to its allowance for loan losses based upon its ongoing review of the loan portfolio and credit quality trends, the level of delinquencies, as well as general market and economic conditions.


48


Bank Owned Life Insurance (“BOLI”)

In November of 2004, the Company invested in $3.5 million of BOLI as a source of funding for certain life insurance benefits for officers and for employee benefit expenses related to the Company’s non-qualified Supplemental Executive Retirement PlansPlan (“SERPs”SERP”) implemented for certain executive officers in 2004. The SERPs provideSERP provides for payments to such executives upon retirement, death or disability. Since its initial investment in 2004, the Company has purchased an additional $17.0 million of BOLI, of which $3.9 million was purchased in the third quarter of 2016, in order to provide life insurance benefits for additional officers upon death or disability and to provide a source of funding for future enhancements of the benefits under the SERPs.SERP. Expenses related to the SERPsSERP were approximately $204,000$309,000 and $261,000$204,000 for the years ended December 31, 20162017 and 2015,2016, respectively. BOLI involves our purchase of life insurance on a selected group of officers. The Company is the owner and beneficiary of the policies. Increases in the cash surrender values of this investment are recorded in other income in the statement of operations. Earnings on BOLI amounted to $477,000$544,000 and $445,000$477,000 for the years ended December 31, 20162017 and 2015,2016, respectively. During the third quarter of 2016, the Company received an $862,000 tax-free BOLI death benefit.

Premises and Equipment

Premises and equipment totaled $4.7$6.2 million and $5.1$4.7 million at December 31, 20162017 and 2015,2016, respectively. Depreciation expense for 20162017 was $780,000$765,000 compared to $798,000$780,000 in 2015.

2016.

Goodwill and Intangible Assets

Intangible assets totaled $18.1 million at both December 31, 2017 and 2016, and 2015. The Company’s intangible assets at December 31, 2016 werewhich is comprised of $18.1 million of goodwill. During 2016, the $2.1 million of core deposit intangible was fully amortized and therefore, no balance remains at December 31, 2016. The Company performed its annual qualitative factor goodwill impairment analysistest as of August 31, 2016.2017. Based on the results of the step one goodwill impairmentthis analysis, the Company concluded that there was no impairment on the current goodwill balance of $18.1 million. The Company’s intangible assets at December 31, 2015 were comprised of $18.1 million of goodwill and $9,000 of core deposit intangibles, net of accumulated amortization of $2.1 million. Accordingly, there was no impairment recorded during 20162017 and 2015.

2016.

There can be no assurance that future testing will not result in additional material impairment charges due to further developments in the banking industry or our markets or otherwise. Additional goodwill discussion can be referenced in Note 5, “Goodwill and Other Intangible Assets” in the Company’s financial statements.

Deposits

Deposits are the Company's primary source of funds used byfunds. The deposit increase during 2017 was primarily attributable to the Company’s strategic initiative to continue to remain focused on growing market share through core deposit relationships. The Company anticipates loan demand to increase during 2018 and beyond, and will depend on the expansion and maturation of the branch network as its primary funding source. As a secondary funding source, the Company intends to utilize borrowed funds, including FHLB advances, brokered CDs and deposits obtained through the use of deposit listing services (“Listed Service CDs”), at opportune times during changing rate cycles to help support its growth. The Company continues to experience change in lending and for general corporate purposes.the mix of the deposit products through its branch sales efforts, which are targeted to gain market penetration. In additionorder to deposits,fund future loan growth, the Company may derive funds from principal repayments on loans,intends to use the salemost cost-effective funding mix available within the market area.
In keeping with the Company's Strategic Plan, which includes optimizing the profitability of loansour branch network, the Company closed two branches and securities designated as available for sale, maturing investment securitiesconsolidated them into a new location during the fourth quarter of 2017, which will provide cost efficiencies and borrowings from financial intermediaries. The level of deposit liabilities may vary significantly and is dependent upon prevailing interest rates, moneygreater market conditions, general economic conditions and competition. The Company’s deposits consist of checking, savings and money market accounts along with certificates of deposit (“CDs”) and individual retirement accounts. Deposits are obtained from individuals, partnerships, corporations, unincorporated businesses and non-profit organizations throughout our market area.share potential. We attempt to control the flow of deposits primarily by pricing deposit offerings to be competitive with other financial institutionsopened a new branch in Sea Girt in the market area but not by necessarily offeringthird quarter, along the highest rate.

Route 35 corridor in Monmouth County, N.J., and consolidated the operations of our Allaire office in Wall Township, N.J. and our office in Manasquan, N.J., into this new branch. The Company anticipates annual pre-tax expense savings of approximately $300,000.


Total deposits at December 31, 20162017 were $776.6$861.6 million, an increase of $68.2$85.0 million, or 9.6%10.9%, from the $708.4$776.6 million at December 31, 2015.2016. Core checking deposits at December 31, 2016,2017, increased $19.9$87.1 million, or 6.8%27.8%, to $312.9$400.0 million when compared to year-end 2015,2016, primarilydue to new municipal deposit relationships coupled with seasonality, while savings, money market and time deposits, including wholesale and brokered CDs, increased $48.3$19.6 million, or 11.6%14.0%, to $463.7$159.3 million as compared to December 31, 2015. CDs increased $21.82016. These increases were partially offset by decreases of $21.7 million, or 18.4%6.7%, to $139.8 million at December 31, 2016. In light of the low interest rate environmentin savings and strong loan pipeline, the Company took advantage of extending the maturity of its CD portfolio by utilizing a laddered strategy of both brokered and Listed Service CDs during 2016.money market accounts. The Bank has continued to focus on building non-interest-bearing deposits, as this lowers our costs of funds. Additionally, our savings accounts and other interest-bearing deposit products excluding high-cost certificates of deposit, provide an efficient and cost-effective source to fund our loan originations.

One of the primary strategies is the accumulation and retention of core deposits. Core deposits consist of all deposits, except CDs $100,000$250,000 and over, brokered CDs and Listed Service CDs. Core deposits at December 31, 20162017 amounted to $656.7$761.6 million and accounted for 84.6%88.4% of total deposits as compared to $614.9$684.4 million and 86.8%88.1% of total deposits at December 31, 2015.

49


2016. During 2016,2017, we continued to price our CDs $100,000$250,000 and over at rates that did not exceed our market competition. The balance ofin our CDs $100,000$250,000 and over amounted to $78.1$14.9 million at December 31, 2017 compared to $8.9 million at December 31, 2016, an increase of $6.0 million. At December 31, 2017, brokered CDs totaled $40.7 million as compared to $56.9$35.6 million at December 31, 2015, an increase of $21.2 million, or 37.3%. At December 31, 2016, brokered CDs totaled $35.6 million as compared to $37.9 million at December 31, 2015 with rates ranging from 1.03%1.09% to 2.12% and original terms ranging from 24 to 84 months, while Listed Service CDs totaled $47.6$44.4 million compared to $33.3$47.6 million at December 31, 20152016, with rates between 0.96%1.20% to 2.10%2.50% and original terms ranging from 12 to 60 months.


The Company found this strategy of placing both brokered and Listed Service CDs provides a more cost-effective source of longer-term funding, as the rates paid for these type CDs were very competitive with current fixed rate term advances at the FHLB of New York without any collateral requirements.

The following table reflects the average balances and average rates paid on deposits for the years ended December 31, 2017, 2016 2015 and 2014.


Years ended December 31,


2016


2015


2014


(dollars in thousands)


Average

Balance


Average

Rate


Average

Balance


Average

Rate


Average

Balance


Average

Rate


Non-interest bearing demand

 $150,495    -  $144,980   -  $130,465   - 

Interest-bearing demand (NOW)

  151,360   0.43%  130,658   0.42%  111,009   0.46%

Savings deposits

  233,514   0.50%  228,707   0.48%  233,162   0.47%

Money market deposits

  72,721   0.16%  72,329   0.16%  71,977   0.16%

Time deposits

  133,842   1.42%  103,324   1.32%  83,304   1.43%
                         

Total

 $741,932   0.52% $679,998   0.46% $629,917   0.46%

2015.

 Years ended December 31,
 2017 2016 2015
(dollars in thousands)
Average
Balance
 
Average
Rate
 
Average
Balance
 
Average
Rate
 
Average
Balance
 
Average
Rate
Non-interest-bearing demand$163,707
 
 $150,495
 
 $144,980
 
Interest-bearing demand (NOW)201,490
 0.48% 151,360
 0.43% 130,658
 0.42%
Savings deposits256,222
 0.52% 233,514
 0.50% 228,707
 0.48%
Money market deposits63,093
 0.17% 72,721
 0.16% 72,329
 0.16%
Time deposits135,326
 1.45% 133,842
 1.42% 103,324
 1.32%
            
Total$819,838
 0.53% $741,932
 0.52% $679,998
 0.46%
The following table sets forth a summary of the maturities of certificates of deposit $100,000$250,000 and over at December 31, 20162017 (in thousands).


December 31,

2016


Due in three months or less

 $4,653 

Due over three months through twelve months

  16,272 

Due over one year through three years

  39,831 

Due over three years

  17,324 
     

Total certificates of deposit $100,000 and over

 $78,080 

 
December 31,
2017
Due in three months or less$262
Due over three months through twelve months4,790
Due over one year through three years9,198
Due over three years603
  
Total certificates of deposit $250,000 and over$14,853
Borrowings

The Bank has unsecured lines of credit totaling $46.0$39.0 million with fourthree correspondent financial institutions. These borrowings are priced on a daily basis. The Bank had no borrowings outstanding on these lines. The Bank also has a remaining borrowing capacity with the Federal Home Loan Bank of New York (“FHLB”)FHLB of approximately $48.6$41.4 million based on the current loan collateral pledged of $110.1$144.4 million at December 31, 2016.

2017.

Short-term borrowings consist of Federal funds purchased and short-term borrowings from the FHLB. At December 31, 2017, 2016 2015 and 2014,2015, the Company had no short-term borrowings outstanding.


50


At December 31, 2017, 2016 2015 and 2014,2015, FHLB and other borrowings consisted of advances from the FHLB, which amounted to $25.8 million, $25.3 million $26.5 million and $16.0$26.5 million, respectively. Total FHLB advances had a weighted average interest rate of 2.35%1.87%, 2.28%2.35% and 2.89%2.28% at December 31, 2017, 2016 2015 and 2014,2015, respectively. These advances are contractually scheduled for repayment as follows (in thousands):


Years ended December 31,


2016


2015


2014


2015

 $-  $-  $1,500 

2016

  -   4,200   1,500 

2017

  12,000   12,000   11,000 

2018

  3,300   3,300   2,000 

2019

  2,800   1,800   - 

2020

  2,700   2,700   - 

2021

  3,500   2,500   - 

2023

  1,000   -   - 
             
Total FHLB borrowings $25,300  $26,500  $16,000 

 Years ended December 31,
 2017 2016 2015
2016$
 $
 $4,200
2017
 12,000
 12,000
20183,300
 3,300
 3,300
20192,800
 2,800
 1,800
20202,700
 2,700
 2,700
20218,500
 3,500
 2,500
20227,500
 
 
20231,000
 1,000
 
      
Total FHLB borrowings$25,800
 $25,300
 $26,500
The maximum amount outstanding of FHLB advances at any month-end during 20162017 and 20152016 was $35.3 million for both periods and during 2015 was $28.0 million, respectively.million. The average interest rates paid on FHLB advances for 2017, 2016 and 2015 were 2.34%, 2.26% and 2014 were 2.26%, 2.30% and 2.85%, respectively.


Subordinated Debentures
 

Subordinated Debentures

In December 2015, the Company completed a private placement of $10 million in aggregate principal amount of fixed to floating rate subordinated debentures to certain institutional accredited investors. The subordinated debentures have a maturity date of December 31, 2025 and bear interest, payable quarterly, at the rate of 6.25% per annum until January 1, 2021. On that date, the interest rate will be adjusted to float at an annual rate equal to the three-month LIBOR rate plus 464 basis points (4.64%) until maturity. The debentures include a right of prepayment, without penalty, on or after December 14, 2020 and, in certain limited circumstances, before that date. The indebtedness evidenced by the subordinated debentures, including principal and interest, is unsecured and subordinate and junior in right to payment to general and secured creditors of the Company and depositors and other creditors of the Bank. The subordinated debentures have been structured to qualify as Tier 2 capital for regulatory purposes. Subordinated debentures totaled $9.9 million at both December 31, 2017 and 2016, and $9.8 million at December 31, 2016,2015, which includesincluded $112,000, $145,000, and $176,000, respectively, of remaining unamortized debt issuance costs at December 31, 2016 and 2015, respectively.costs. The debt issuance costs are being amortized over the expected life of the issue. The effective interest rate of the subordinated debentures is 6.67% as of December 31, 2016.

.

Repurchase Agreements

Securities sold under agreements to repurchase, which are classified as secured borrowings, generally mature within one to four days from the transaction date. Securities sold under agreements to repurchase are reflected as the amount of cash received in connection with the transaction. The Company may be required to provide additional collateral based on the fair value of the underlying securities. Securities sold under agreements to repurchase amounted to $27.1 million at December 31, 2017, an increase of $7.2 million, or 36.2%, from $19.9 million at December 31, 2016, an increase of $370,000, or 1.9%, from $19.5 million at December 31, 2015.

2016.


51


Repurchase agreements are summarized as follows:


Years ended December 31,


2016


2015


2014


(dollars in thousands)


Balance at year-end

 $19,915  $19,545  $23,290 

Average during the year

  19,309   22,071   20,096 

Maximum month-end balance

  22,105   27,916   27,562 

Weighted average rate during the year

  0.32

%

  0.31

%

  0.32

%

Weighted average rate at year-end

  0.24

%

  0.24

%

  0.29

%

 Years ended December 31,
 2017 2016 2015
      
 (dollars in thousands)
Balance at year-end$27,120
 $19,915
 $19,545
Average during the year22,066
 19,309
 22,071
Maximum month-end balance27,120
 22,105
 27,916
Weighted average rate during the year0.30% 0.32% 0.31%
Weighted average rate at year-end0.25% 0.24% 0.24%
Liquidity

Liquidity defines the Company’s ability to generate funds to support asset growth, meet deposit withdrawals, maintain reserve requirements and otherwise operate on an ongoing basis. An important component of the Company’s asset and liability management structure is the level of liquidity available to meet the needs of our customers and requirements of our creditors. The liquidity needs of the Bank are primarily met by cash on hand, Federal funds sold position, maturing investment securities and short-term borrowings on a temporary basis. The Bank invests the funds not needed to meet its cash requirements in overnight Federal funds sold and an interest bearing account with the Federal Reserve Bank of New York. With adequate deposit inflows coupled with the above-mentioned cash resources, the Bank is maintaining short-term assets which we believe are sufficient to meet its liquidity needs. The Bank’s liquidity can be affected by a variety of factors, including general economic conditions, market disruption, operational problems affecting third parties or us, unfavorable pricing, competition, our credit rating and regulatory restrictions.

At December 31, 2016,2017, the Company had $42.1$48.2 million in cash and cash equivalents as compared to $46.7$42.1 million at December 31, 2015.2016. Cash and cash equivalent balances included $22.2$18.6 million and $25.2$22.2 million held at the Federal Reserve Bank of New York at December 31, 20162017 and 2015,2016, respectively. At December 31, 20162017 and 2015,2016, there were no Federal funds sold. Further information regarding our borrowing capacity with FHLB and unsecured lines is discussed previously under the caption “Borrowings.”

On July 21, 2015, the Company filed a registration statement with the SEC permitting it to issue a combination of securities, in one or more offerings, from time to time, up to $30.0 million. This registration statement was declared effective by the SEC on September 4, 2015. See “Capital” below.


Off-Balance Sheet Arrangements

and Contractual Obligations

The Company’s financial statements do not reflect off-balance sheet arrangements that are made in the normal course of business. These off-balance sheet arrangements consist of unfunded loans and letters of credit made under the same standards as on-balance sheet instruments. These instruments have fixed maturity dates, and because many of them will expire without being drawn upon, they do not generally present any significant liquidity risk to the Company.

Management believes that any amounts actually drawn upon these commitments can be funded in the normal course of operations. The Company enters into contractual obligations in the normal course of business as a source of funds for its asset growth and its asset/liability management, to assist it in retaining key employees, and to meet required capital needs. These obligations require the Company to make cash payments over time as detailed in the table that follows. Contractual obligations consist primarily of time deposits, FHLB and other borrowings, subordinated debentures, operating lease obligations and projected retirement obligations.


52


The following table sets forth ourthe amounts and expected maturities of off-balance sheet arrangements and contractual obligations as of December 31, 2016 and 2015.


December 31,


2016


2015


(dollars in thousands)


Home equity lines of credit

 $24,255  $21,072 

Commitments to fund commercial real estate and construction loans

  125,494   92,363 

Commitments to fund commercial and industrial loans and other loans

  53,979   52,826 

Commercial and financial letters of credit

  3,973   4,315 
         
Total off-balance sheet commitments $207,701  $170,576 

2017.

          
 Within one year After one but within three years After three but within five years After five years Total
(in thousands)         
Off Balance Sheet Arrangements:        
Lines of credit secured by 1-4 family residential properties$2,377
 $1,236
 $1,712
 $20,799
 $26,124
Commitments to fund commercial real estate and construction loans42,210
 63,422
 1,314
 47,691
 154,637
Commitments to fund commercial and industrial and other loans38,984
 11,750
 144
 14,120
 64,998
Commercial and financial letters of credit4,592
 568
 
 
 5,160
Contractual Obligations:         
Time deposits52,073
 98,566
 8,682
 
 159,321
FHLB and other borrowings3,300
 5,500
 16,000
 1,000
 25,800
Subordinated debentures
 
 
 9,888
 9,888
Operating lease obligations1,478
 2,621
 1,526
 1,846
 7,471
Retirement obligations projected27
 55
 127
 1,837
 2,046
Total off-balance sheet arrangements and contractual obligations$145,041
 $183,718
 $29,505
 $97,181
 $455,445
Capital

Shareholders’ equity increased by $7.7$5.9 million, or 8.3%5.8%, to $106.6 million at December 31, 2017 compared to $100.7 million at December 31, 2016 compared to $93.0 million at December 31, 2015.2016. Net income for 20162017 added $8.6$6.5 million to shareholders’ equity. Additionally, stock-based compensation expense of $231,000,$279,000, options exercised of $104,000$276,000 and employee stock purchases of $56,000$67,000 were other major contributors ofto the increase. These increases were partially offset by $1.2$1.4 million in cash dividends on common stock and $148,000 in common stock repurchases. During the year ended December 31, 2106, the Company repurchased 13,232 shares of common stock for a toatal of $148,000 under its share repurchase program.

stock.

The Company and the Bank are subject to various regulatory and capital requirements administered by the Federal banking agencies. Our federal banking regulators, the Board of Governors of the Federal Reserve System (the “Federal Reserve) (which regulates bank holding companies) and the Federal Deposit Insurance Corporation (the “FDIC”) (which regulates the Bank), have issued guidelines classifying and defining capital. Failure to meet minimum capital requirements can initiate certain mandatory and possibly additional discretionary actions that, if undertaken, could have a direct material effect on the Company’s financial statements. Under capital adequacy guidelines and the regulatory framework for prompt corrective action, the Company and the Bank must meet specific capital guidelines that involve quantitative measures of their assets, liabilities and certain off-balance sheet items as calculated under regulatory accounting practices. The capital amounts and classification of the Company and the Bank isare also subject to qualitative judgments by the regulators about components, risk weightings and other factors. See “Item 1. Business - Supervision and Regulation.”

Quantitative measures established by regulation to ensure capital adequacy require the Company and the Bank to maintain minimum amounts and ratios, set forth in the following tables of Tier 1 Capital to Average Assets (Leverage Ratio), Common Equity Tier 1 Capital to Risk Weighted Assets, Tier 1 Capital to Risk Weighted Assets and Total Capital to Risk Weighted Assets.

As of December 31, 2016,2017, the Company and the Bank met all regulatory requirements for classification as well-capitalized under the applicable regulatory framework. Management believes that there are no conditions or events that have changed the classification.


53


The capital amounts and ratios of the Company and the Bank at December 31, 20162017 and 20152016 and the minimum amounts and ratios required for capital adequacy purposes and to be well capitalized under the prompt corrective action provisions are as follows:

  Actual  

For Capital

Adequacy Purposes


To be Well 

Capitalized under

Prompt Corrective

 Action Regulations*

 
  Amount Ratio  Amount Ratio  Amount Ratio 
        (Dollars in Thousands)       

As of December 31, 2016


Common Equity Tier 1 Capital (to risk weighted assets)


Two River Bancorp


$

82,994


10.33

%


$

≥36,154


≥4.50

%


$

N/A


N/A


Two River Community Bank


92,270


11.49

%


≥36,137


≥4.50

%


≥52,198


≥6.50

%


Total Capital (to risk weighted assets)


Two River Bancorp


102,509


12.76

%


≥64,269


≥8.00

%


N/A


N/A

%

Two River Community Bank


101,835


12.68

%


≥64,249


≥8.00

%


≥80,312


≥10.00

%


Tier 1 Capital (to risk weighted assets)


Two River Bancorp


82,994


10.33

%


≥48,206


≥6.00

%


≥48,206


≥6.00

%

Two River Community Bank


92,270


11.49

%


≥48,183


≥6.00

%


≥64,244


≥8.00

%


Tier 1 Capital (to average assets)


Two River Bancorp


82,994


8.94

%


≥37,134


≥4.00

%


N/A


N/A


Two River Community Bank


92,270


9.95

%


≥37,093


≥4.00

%


≥46,367


≥5.00

%


As of December 31, 2015


Common Equity Tier 1 Capital (to risk weighted assets)


Two River Bancorp


75,273


10.13

%


≥33,438


≥4.50

%


N/A


N/A


Two River Community Bank


84,659


11.39

%


≥33,447


≥4.50

%


≥48,313


≥6.50

%


Total Capital (to risk weighted assets)


Two River Bancorp


93,986


12.65

%


≥59,438


≥8.00

%


N/A


N/A


Two River Community Bank


93,372


12.56

%


≥59,473


≥8.00

%


≥74,341


≥10.00

%


Tier 1 Capital (to risk weighted assets)


Two River Bancorp


75,273


10.13

%


≥44,584


≥6.00

%


≥44,584


≥6.00

%

Two River Community Bank


84,659


11.39

%


≥44,596


≥6.00

%


≥59,462


≥8.00

%


Tier 1 Capital (to average assets)


Two River Bancorp


75,273


8.97

%


≥33,567


≥4.00

%


N/A


N/A


Two River Community Bank


84,659


10.09

%


≥33,562


≥4.00

%


$

≥41,952


≥5.00

%

  Actual 
For Capital
Adequacy Purposes 
 
To be Well 
Capitalized under
Prompt Corrective
 Action Regulations*
  Amount Ratio Amount Ratio Amount Ratio
             
      (Dollars in Thousands)    
As of December 31, 2017   ��        
Common Equity Tier 1 Capital (to risk weighted assets)            
Two River Bancorp $88,733
 9.68% 
$ >41,250
 
>4.50
 N/A N/A
Two River Community Bank 97,723
 10.66% 
>41,253
 
>4.50
 
$ >59,587
 
>6.50
             
Total Capital (to risk weighted assets)            
Two River Bancorp 109,401
 11.93% 
>73,362
 
>8.00
 N/A N/A
Two River Community Bank 108,391
 11.82% 
>73,361
 
>8.00
 
>91,701
 
>10.00
             
Tier 1 Capital (to risk weighted assets)            
Two River Bancorp 88,733
 9.68% 
>55,000
 
>6.00
 
>55,000
 
>6.00
Two River Community Bank 97,723
 10.66% 
>55,004
 
>6.00
 
>73,338
 
>8.00
             
Tier 1 Capital (to average assets)            
Two River Bancorp 88,733
 8.85% 
>40,105
 
>4.00
 N/A N/A
Two River Community Bank 97,723
 9.76% 
>40,050
 
>4.00
 
>50,063
 
>5.00
             
As of December 31, 2016            
Common Equity Tier 1 Capital (to risk weighted assets)            
Two River Bancorp $82,994
 10.33% $ ≥36,154 ≥4.50 N/A N/A
Two River Community Bank 92,270
 11.49% ≥36,137 ≥4.50 $ ≥52,198 ≥6.50
             
Total Capital (to risk weighted assets)            
Two River Bancorp 102,509
 12.76% ≥64,269 ≥8.00 N/A N/A
Two River Community Bank 101,835
 12.68% ≥64,249 ≥8.00 ≥80,312 ≥10.00
             
Tier 1 Capital (to risk weighted assets)            
Two River Bancorp 82,994
 10.33% ≥48,206 ≥6.00 ≥48,206 ≥6.00
Two River Community Bank 92,270
 11.49% ≥48,183 ≥6.00 ≥64,244 ≥8.00
             
Tier 1 Capital (to average assets)            
Two River Bancorp 82,994
 8.94% ≥37,134 ≥4.00 N/A N/A
Two River Community Bank 92,270
 9.95% ≥37,093 ≥4.00 ≥46,367 ≥5.00
*Applies to the Bank only. For the Company to be “well-capitalized”, the Tier 1 Capital to Risk Weighted Assets has to be at least 6.00%.

The Bank is subject to certain legal and regulatory limitations on the amount of dividends that it may declare without prior regulatory approval. Under Federal Reserve regulations, the Bank is limited as to the amount it may lend affiliates, including the Company, unless such loans are collateralized by specific obligations.


54


Basel III Capital Rules. In July 2013, the federal bank regulatory agencies adopted revisions to the agencies’ capital adequacy guidelines and prompt corrective action rules, which were designed to enhance such requirements and implement the revised standards of the Basel Committee on Banking Supervision, commonly referred to as Basel III.

These revisions generally implemented higher minimum capital requirements, added a new common equity Tier 1 Capital requirement, and established criteria that instruments must meet to be considered common equity Tier 1 Capital, additional Tier 1 Capital or Tier 2 Capital. Effective January 1, 2015, the new minimum capital to risk-adjusted assets requirements are a common equity Tier 1 Capital ratio of 4.5% (6.5% for the Bank to be considered “well capitalized”) and a Tier 1 Capital ratio of 6.0%, increased from 4.0% (and increased from 6.0% to 8.0% for the Bank to be considered “well capitalized”); the total capital ratio remains at 8.0% under the new rules (10.0% to be considered “well capitalized”).


The risk-based capital rules adopted effective January 1, 2015 require that banks and holding companies maintain a “capital conservation buffer” of 250 basis points in excess of the “minimum capital ratio.” The minimum capital ratio is equal to the prompt corrective action adequately capitalized threshold ratio. The capital conservation buffer is being phased in over a four year period that began on January 1, 2016, with a required buffer of 0.625% of risk weighted assets for 2016, 1.25% for 2017, 1.875% for 2018 and 2.5% for 2019 and thereafter. Failure to maintain the required capital conservation buffer will result in limitations on capital distributions and on discretionary bonuses to executive officers.

Effective January 1, 2017,2018, the capital levels required to avoid limitation on elective distributions applicable to the Company and the Bank were as follows:

i.

a common equity Tier 1 capital ratio of 5.75%6.375%;

ii.

a Tier 1 Risk based capital ratio of 7.25%7.875%; and

iii.

a Total Risk based capital ratio of 9.25%9.875%.

On July 21, 2015, the Company filed a registration statement with the SEC permitting it to issue a combination of securities, in one or more offerings, from time to time, up to $30.0 million. This registration statement was declared effective by the SEC on September 4, 2015.

We intend to use any net proceeds from the sale of the securities registered by this Registration Statement for general corporate purposes. General corporate purposes may include, among other purposes, contribution to the capital of the Bank to support its lending and investing activities; the repayment of our debt; the support or funding of acquisitions of other institutions or branches, if opportunities for such transactions become available; and investments in activities that are permitted for bank holding companies. The applicable prospectus supplement will provide details on the use of proceeds of any specific offering.

Interest Rate Risk

Interest rate risk management involves managing the extent to which interest-sensitive assets and interest-sensitive liabilities are matched. Interest rate sensitivity is the relationship between market interest rates and earnings volatility due to the re-pricing characteristics of assets and liabilities. Our net income is affected by changes in the level of market interest rates. In order to maintain consistent earnings performance, we seek to manage, to the extent possible, the re-pricing characteristics of our assets and liabilities.

The management of and authority to assume interest rate risk is the responsibility of the ALCO, which is comprised of senior management and board members. The primary objective of Asset/Liability management is to establish prudent risk management guidelines and to coordinate balance sheet composition with interest rate risk management to sustain a reasonable and stable net interest income throughout various interest rate cycles. We have policies and practices for measuring and reporting interest rate risk exposure, through analysis of the net interest margin, gap position, simulation testing, liquidity ratios and the Economic Value of Portfolio Equity. In addition, we annually review our interest rate risk policy, which includes limits on the impact to earnings from shifts in interest rates.

Gap Analysis

To manage our interest sensitivity position, an asset/liability model called “gap analysis” is used to monitor the difference in the volume of our interest-sensitive assets and liabilities that mature or re-price within given periods. The ratio between assets and liabilities re-pricing in specific time intervals is referred to as an interest rate sensitivity gap. A positive gap (asset-sensitive) indicates that more assets re-price during a given period compared to liabilities, while a negative gap (liability-sensitive) has the opposite effect. During a period of falling interest rates, a positive gap would tend to adversely affect net interest income, while a negative gap would tend to result in an increase in net interest income. During a period of rising interest rates, a positive gap would tend to result in an increase in net interest income, while a negative gap would tend to affect net interest income adversely. We employ net interest income simulation modeling to assist in quantifying interest rate risk exposure. This process measures and quantifies the impact on net interest income through varying interest rate changes and balance sheet compositions. The use of this model assists the ALCO to gauge the effects of the interest rate changes on interest-sensitive assets and liabilities in order to determine what impact these rate changes will have upon the net interest spread.


55


The following table set forth the gap analysis at December 31, 2017. Assumptions regarding the repricing characteristics of certain assets and liabilities are critical in determining the projected level of rate sensitivity. Certain savings and interest checking accounts are less sensitive to market interest rate changes than other interest-bearing sources of funds. Core deposits such as interest-bearing demand, savings and money market deposits are allocated based on their expected repricing in relation to changes in market interest rates.
        
 Under six monthsSix months through one yearMore than one year through three yearsMore than three years through five yearsMore than five years through ten yearsMore than ten years and not repricingTotal
(in thousands, except percentages)
Assets:       
Cash and due from banks$
$
$
$
$
$29,575
$29,575
Interest-bearing deposits in bank18,644


18,644
Securities16,274
17,953
13,683
5,819
32,547
2,858
89,134
Restricted stock


5,430
5,430
Loans, including held for sale205,627
74,947
225,288
222,796
100,663
24,134
853,455
Other assets


43,560
43,560
   Total assets$240,545
$92,900
$238,971
$228,615
$133,210
$105,557
$1,039,798
        
Liabilities and shareholders' equity:     
Non-interest bearing deposits$
$
$
$
$
$167,297
$167,297
Interest-bearing demand, savings and money market deposits274,971

57,956
106,988
95,024

534,939
Time deposits19,446
32,607
96,112
11,156


159,321
Borrowed funds and subordinated debt28,420
2,000
15,388
16,000
1,000

62,808
Other liabilites


8,862
8,862
Shareholders' equity


106,571
106,571
   Total liabilities and shareholders' equity$322,837
$34,607
$169,456
$134,144
$96,024
$282,730
$1,039,798
        
Gap$(82,292)$58,293
$69,515
$94,471
$37,186
$(177,173) 
Cumulative gap$(82,292)$(23,999)$45,516
$139,987
$177,173
$
 
Cumulative gap to total assets(7.9%)(2.3%)4.4%13.5%17.0%
 

As of December 31, 2016,2017, the Company’s six month cumulative gap was -9.1%-7.9% of total assets, or a negative $85.7$82.3 million, while its one-year cumulative gap was -1.8%-2.3% of total assets, or $16.5a negative $24.0 million, which is within the ALCO policy guideline of + or - 25%.

Simulation Modeling

We use a simulation model to analyze net interest income sensitivity to movements in interest rates. The simulation model projects net interest income based on various interest rate scenarios over a twelve and twenty-four month period. The model is based on the actual maturity and re-pricing characteristics of rate sensitive assets and liabilities. The model incorporates certain assumptions which management believes to be reasonable regarding the impact of changing interest rates and the prepayment assumptions of certain assets and liabilities as of December 31, 2016.2017. The model assumes changes in interest rates without any proactive change in the composition or size of the balance sheet by management. In the model, the forecasted shape of the yield curve remains static as of December 31, 2016.

2017.

Our simulation model is based on market interest rates and prepayment speeds prevalent in the market as of December 31, 2015.2017. The model utilizes an immediate parallel shift in the market interest rates at December 31, 2016.2017. As of December 31,

56


2017 and 2016, and 2015, the results of the simulation model were within guidelines prescribed by the ALCO policy. If model results were to fall outside prescribed ranges, action would be required by ALCO.

 Immediate Shock in Interest Rates  
December 31, 2017200 basis point increase 200 basis point decrease  
(dollars in thousands)Dollar change 
Percent of
change
 Dollar change 
Percent of
change
 
ALCO
Policy Guideline
Twelve month horizon:         
Net interest income change$(1,530) -4.4% $(1,525) -4.4% -10.0%
 Immediate Shock in Interest Rates  
December 31, 2016200 basis point increase 200 basis point decrease  
(dollars in thousands)Dollar change 
Percent of
change
 Dollar change 
Percent of
change
 
ALCO
Policy Guideline
Twelve month horizon:         
Net interest income change$(1,220) -4.0% $(1,173) -3.8% -10.0%


Immediate Shock in Interest Rates


December 31, 2015


200 basis point increase


200 basis point decrease


(dollars in thousands)


Dollar change


Percent of

change


Dollar change


Percent of

change


ALCO

Policy Guideline


Twelve month horizon:


Net interest income change

 $(1,041)  -3.4%  $(1,069)  -3.8%   -10.0% 

The assumptions used in the net interest income simulation are inherently uncertain. Actual results may differ significantly from those presented in the table above, due to the frequency and timing of changes in interest rates, and changes in spreads between maturity and re-pricing categories. Overall, our net interest income is affected by changes in interest rates and cash flows from our loan and investment portfolios. We actively manage these cash flows in conjunction with our liability mix, duration and interest rates to optimize the net interest income, while structuring the balance sheet in response to actual or potential changes in interest rates.

Additionally, our net interest income is impacted by the level of competition within our market place. Competition can negatively impact the level of interest rates attainable on loans and increase the cost of deposits, which may result in downward pressure on our net interest margin in future periods. Other factors, including, but not limited to, the slope of the yield curve and projected cash flows will impact our net interest income results and may increase or decrease the level of asset sensitivity of our balance sheet.

Economic Value of Equity

To measure the impact of longer-term asset and liability mismatches beyond two years, the Company utilizes Economic Value of Portfolio Equity (“EVPE”) models. EVPE considers the entire maturity spectrum of the Bank’s balance sheet, thereby providing a longer term measure of interest rate risk. The underlying economic value of the Bank’s assets, liabilities and off balance sheet instruments are affected by changes in interest rates. These changes occur because the present value of future cash flows and in some cases, the cash flows themselves, are affected by interest rate changes. The combined effects of the changes in these present values reflect the change in the Bank’s underlying economic value.

In addition to providing a longer-term measurement of interest rate risk, the economic value of equity measurement may highlight the impact of current interest rate changes that may not be accounted for in simulation analysis. In addition, a decline in the economic value of equity may indicate below market returns in the future. Because of balance sheet optionality, an EVPE analysis is used to dynamically model the present value of asset and liability cash flows, with rates ranging up or down 200 basis points. Our analysis of EVPE excludes goodwill and includes only tangible equity. The economic value of equity is likely to be different as interest rates change. Results falling outside prescribed ranges require action by the ALCO.


At December 31, 20162017 and 2015,2016, the Company’s variance in the EVPE as a percentage of change from book value of tangible equity compared to no change in interest rates, and to an instantaneous and sustained parallel shift of + or - 200 basis points, is within the Company’s policy guidelines as presented below.


Economic Value of Portfolio Equity


December 31, 2016


Change in Interest Rates

(dollars in thousands)


Base Case

(0 bp)


-200bp


+200bp


ALCO

Policy Guideline

Economic Value of Equity

 $111,406  $111,167  $103,501     

$ Change

      (239

)

  (7,905

)


% Change to Present Value of Equity

      -0.2

%

  -7.1

%

  -25.0% 


December 31, 2015


Change in Interest Rates

(dollars in thousands)


Base Case

(0 bp)


-200bp


+200bp


ALCO

Policy Guideline

Economic Value of Equity

 $98,218  $91,536  $95,218     

$ Change

      (6,682

)

  (3,000

)


% Change to Present Value of Equity

      -6.8

%

  -3.1

%

  -25.0% 


57


    Economic Value of Portfolio Equity
    December 31, 2017
Change in Interest Rates
(dollars in thousands)
 
Base Case
(0 bp)
 -200bp +200bp 
ALCO
Policy Guideline
Economic Value of Equity $132,313
 $132,537
 $123,290
  
$ Change   224
 (9,023)  
% Change to Present Value of Equity   0.2% -6.8 % -25.0%

    December 31, 2016
Change in Interest Rates
(dollars in thousands)
 
Base Case
(0 bp)
 -200bp +200bp 
ALCO
Policy Guideline
Economic Value of Equity $111,406
 $111,167
 $103,501
  
$ Change   (239) (7,905)  
% Change to Present Value of Equity   -0.2 % -7.1 % -25.0%

Item 7A. Quantitative and Qualitative Disclosures About Market Risk.

Not required.

Item 8. Financial Statements and Supplementary Data.

Reference is made to Item 15(a)(1) and (2) to page F-1 for a list of financial statements and supplementary data required to be filed pursuant to this Item 8. The information required by this Item 8 is provided beginning on page F-1 hereof.

Item 9. Changes In and Disagreements with Accountants on Accounting and Financial Disclosure.

None.


58


Item 9A. Controls and Procedures.

The Company has established disclosure controls and procedures designed to ensure that information required to be disclosed in the reports that the Company files or submits under the Securities Exchange Act of 1934, as amended (the “Exchange Act”) is recorded, processed, summarized, and reported within the time periods specified in SEC rules and forms and is accumulated and communicated to management, including the principal executive officer and principal financial officer, to allow timely decisions regarding required disclosure.

The Company’s principal executive officer and its principal financial and accounting officer, with the assistance of other members of the Company’s management, have evaluated the effectiveness of the design and operation of the Company’s disclosure controls and procedures (as such term is defined in Rules 13a-15(e) and 15d-15(e) under the Exchange Act) as of the end of the period covered by this annual report. Based upon such evaluation, the Company’s principal executive officer and principal financial and accounting officer have concluded that the Company’s disclosure controls and procedures are effective as of the end of the period covered by this annual report.

The Company’s principal executive officer and principal financial officer have also concluded that there was no change in the Company’s internal control over financial reporting (as such term is defined in Rule 13a-15(f) under the Exchange Act) that occurred during the quarter ended December 31, 20162017 that has materially affected, or is reasonably likely to materially affect, the Company’s internal control over financial reporting.


Management’s Report on Internal Control over Financial Reporting

Management of the Company is responsible for establishing and maintaining adequate internal control over financial reporting, as defined in Rules 13a-15(f) and 15d-15(f) under the Exchange Act and for complying with laws and regulations relating to safety and soundness that are designated by the FDIC and the Federal Reserve. The Company’s internal control over financial reporting is designed to provide reasonable assurance regarding the reliability of financial reporting and preparation of financial statements for external purposes in accordance with accounting principles generally accepted in the United States of America.

There are inherent limitations in the effectiveness of any internal control, including the possibility of human error and circumvention or overriding of controls. Accordingly, even effective internal control or compliance with banking laws can provide only reasonable assurance with respect to financial statement preparation. Further, because of changes in conditions, the effectiveness of internal control and compliance with banking laws may vary over time.

The Company’s management assessed the effectiveness of the Company’s internal control over financial reporting and its compliance with laws and regulations relating to safety and soundness that are designated by the FDIC and the Federal Reserve as of December 31, 2016.2017. In making this assessment, management used the criteria set forth in Internal Control-Integrated Framework (2013) (the “2013 Framework”) issued by the Committee of Sponsoring Organizations of the Treadway Commission (“COSO”). Based on their assessment using those criteria, management concluded that, as of December 31, 2016,2017, the Company’s internal control over financial reporting and its compliance with laws and regulations relating to safety and soundness that are designated by the FDIC and the Federal Reserve was effective.

This annual report does not include

BDO USA, LLP, an audit reportindependent registered public accounting firm, has audited the Company's consolidated financial statements as of and for the Company’s Independent Registered Public Accounting Firm regarding internal control over financial reporting. The Company’s Independent Registered Public Accounting Firm currently is not required to attest to management’s assessment ofyear ended December 31, 2017, and the effectiveness of the Company’sCompany's internal control over financial reporting under FDIC regulations.

as of December 31, 2017, as stated in their reports, which are included herein.


/s/ WILLIAM D. MOSS

/s/ A. RICHARD ABRAHAMIAN

Name:

William D. Moss

Name: 

A. Richard Abrahamian

Title:

President and Chief Executive Officer

Title: 

Executive Vice President and Chief Financial Officer

Date:

March 24, 2017

15, 2018

Date: 

March 24, 2017

15, 2018


Item 9B. Other Information.

None.


59


PART III


Item 10. Directors, Executive Officers and Corporate Governance.

The information required by this item is incorporated by reference from the Company’s Proxy Statement for its 20172018 Annual Meeting of Shareholders under the captions “Item 1 – ELECTION OF CLASS IIIII DIRECTORS – Information Concerning Nominees and Continuing Directors,” “Executive Officers,” “STOCK OWNERSHIP OF MANAGEMENT AND PRINCIPAL SHAREHOLDERS – Section 16(a) Beneficial Ownership Reporting Compliance,” “CORPORATE GOVERNANCE – Code of Conduct and Corporate Governance Guidelines” and “– Audit Committee.”

Item 11. Executive Compensation.

The information required by this item is incorporated by reference from the Company’s Proxy Statement for its 20172018 Annual Meeting of Shareholders under the captions “EXECUTIVE“DIRECTOR COMPENSATION,” “DIRECTOR"SUMMARY COMPENSATION TABLE," "2017 OUTSTANDING EQUITY AWARDS AT FISCAL YEAR-END," "EXECUTIVE INCENTIVE, EMPLOYMENT and CHANGE IN CONTROL AGREEMENTS," and “CORPORATE GOVERNANCE – Compensation Committee Interlocks and Insider Participation.”


60


Item 12. Security Ownership of Certain Beneficial Owners and Management and Related Shareholder Matters.

Equity Compensation Plan Information

The following table provides information about the Company’s common stock that may be issued upon the exercise of options, warrants and rights under all of the Company’s equity compensation plans as of December 31, 2016.2017. The information in the table has been adjusted for all subsequent stock dividends.

Plan category

Number of securities

to be issued upon

exercise of outstanding

options, warrants and

rights

(a)

Weighted-average exercise

price of outstanding

options, warrants and

rights

(b)

Number of securities

remaining available for

future issuance under

equity compensation plans

(excluding securities

reflected in column (a))

(c)

Equity compensation plansapproved by security holders

432,451

$5.05

   173,011 (1)


Equity compensation plans notapproved by security holders

-0-

N/A

-0-

Total

432,451

$5.05

173,011

Plan category 
Number of securities
to be issued upon
exercise of outstanding
options, warrants and
rights
(a)
 
Weighted-average exercise
price of outstanding
options, warrants and
rights
(b)
 
Number of securities
remaining available for
future issuance under
equity compensation plans
(excluding securities
reflected in column (a))
(c)
Equity compensation plans approved by security holders 361,507 $5.20 142,219
       
Equity compensation plans not approved by security holders 0 N/A 
Total 361,507 $5.20 142,219

(1)

The Company may issue these shares pursuant to options and restricted stock awards.


Security Ownership of Certain Beneficial Owners and Management.

The additional information required by this item is incorporated by reference from the Company’s Proxy Statement for its 20172018 Annual Meeting of Shareholders under the caption “STOCK OWNERSHIP OF MANAGEMENT AND PRINCIPAL SHAREHOLDERS.”

Item 13. Certain Relationships and Related Transactions, and Director Independence.

The information required by this item is incorporated by reference from the Company’s Proxy Statement for its 20172018 Annual Meeting of Shareholders under the captions “CERTAIN TRANSACTIONS WITH MANAGEMENT” and “CORPORATE GOVERNANCE – Director Independence.”

Item 14. Principal Accountant Fees and Services.

The information regarding principal accounting fees and services and the Company’s pre-approval policies and procedures for audit and non-audit services provided by the Company’s independent registered public accounting firm is incorporated by reference from the Company’s Proxy Statement for its 20172018 Annual Meeting of Shareholders under the caption “ITEM 3 – RATIFICATION OF INDEPENDENT REGISTERED PUBLIC ACCOUNTING FIRM – Independent Auditor Fees” and “– Audit Committee Pre-ApprovedPre-Approval Procedures.”


61


PART IV

Item 15. Exhibits and Financial Statement Schedules.

(a)

Financial Statements and Financial Statement Schedules


The following documents are filed as part of this report:

1.Financial Statements of Two River Bancorp


1.

Financial Statements of Two River Bancorp

Report of Independent Registered Public Accounting Firm


Consolidated Balance Sheets – December 31, 20162017 and 2015

2016


Consolidated Statements of Operations – Years Ended December 31, 2017, 2016 and 2015


Consolidated Statements of Comprehensive Income – Years Ended December 31, 2017, 2016 and 2015


Consolidated Statements of Shareholders’ Equity – Years Ended December 31, 2017, 2016 and 2015


Consolidated Statements of Cash Flows – Years Ended December 31, 2017, 2016 and 2015


Notes to Consolidated Financial Statements

  
2.

2.

All schedules are omitted because either they are inapplicable or not required, or because the information required therein is included in the Consolidated Financial Statements and Notes thereto.

  
3.

3.

See accompanying Index to Exhibits.

  
(b)

(b)

Exhibits


Exhibits required by Section 601 of Regulation S-K (see accompanying Index to Exhibits).

  
(c)

(c)

Financial Statement Schedules


These schedules are not required or are not applicable under Securities Exchange Commission accounting regulations and therefore have been omitted.


Item16.16.Form 10-K Summary.Summary.


None.


62


TWO RIVER BANCORP


INDEX TO CONSOLIDATED FINANCIAL STATEMENTS


Page


Report


F-3


F-4


F-5


F-6


F-7


F-8


Report of Independent Registered Public Accounting Firm

Shareholders and Board of Directors and Shareholders

Two River Bancorp

Tinton Falls, New Jersey

Opinion on the Consolidated Financial Statements
We have audited the accompanying consolidated balance sheets of Two River Bancorp and subsidiaries (the “Company”) as of December 31, 20162017 and 2015 and2016, the related consolidated statements of operations, comprehensive income, shareholders’ equity, and cash flows for each of the three years then ended. in the period ended December 31, 2017, and the related notes (collectively referred to as the “consolidated financial statements”). In our opinion, the consolidated financial statements present fairly, in all material respects, the financial position of the Company at December 31, 2017 and 2016, and the results of their operations and their cash flows for each of the three years in the period ended December 31, 2017, in conformity with accounting principles generally accepted in the United States of America.
We also have audited, in accordance with the standards of the Public Company Accounting Oversight Board (United States) (“PCAOB”), the Company's internal control over financial reporting as of December 31, 2017, based on criteria established in Internal Control - Integrated Framework (2013) issued by the Committee of Sponsoring Organizations of the Treadway Commission (“COSO”) and our report dated March 15, 2018 expressed an unqualified opinion thereon.
Basis for Opinion
These consolidated financial statements are the responsibility of the Company’s management. Our responsibility is to express an opinion on thesethe Company’s consolidated financial statements based on our audits.

We are a public accounting firm registered with the PCAOB and are required to be independent with respect to the Company in accordance with the U.S. federal securities laws and the applicable rules and regulations of the Securities and Exchange Commission and the PCAOB.

We conducted our audits in accordance with the standards of the Public Company Accounting Oversight Board (United States).PCAOB. Those standards require that we plan and perform the audit to obtain reasonable assurance about whether the consolidated financial statements are free of material misstatement.The Company is not requiredmisstatement, whether due to have, nor were we engagederror or fraud.
Our audits included performing procedures to perform, an auditassess the risks of its internal control overmaterial misstatement of the consolidated financial reporting. Our audit included consideration of internal control over financial reporting as a basis for designing auditstatements, whether due to error or fraud, and performing procedures that are appropriate in the circumstances, but not for the purpose of expressing an opinion on the effectiveness of the Company’s internal control over financial reporting. Accordingly, we express no such opinion. An audit also includesrespond to those risks. Such procedures included examining, on a test basis, evidence supportingregarding the amounts and disclosures in the consolidated financial statements, assessingstatements. Our audits also included evaluating the accounting principles used and significant estimates made by management, as well as evaluating the overall presentation of the consolidated financial statement presentation.statements. We believe that our audits provide a reasonable basis for our opinion.

We have served as the Company's auditor since 2013.


/s/ BDO USA, LLP

Philadelphia, Pennsylvania
March 15, 2018


Report of Independent Registered Public Accounting Firm
Shareholders and Board of Directors
Two River Bancorp
Tinton Falls, New Jersey
Opinion on Internal Control over Financial Reporting
We have audited Two River Bancorp and subsidiaries (the “Company’s”) internal control over financial reporting as of December 31, 2017, based on criteria established in Internal Control - Integrated Framework (2013) issued by the Committee of Sponsoring Organizations of the Treadway Commission (the “COSO criteria”). In our opinion, the consolidated financial statements referred to above present fairly,Company maintained, in all material respects, theeffective internal control over financial positionreporting as of Two River Bancorp at December 31, 2017, based on the COSO criteria.
We also have audited, in accordance with the standards of the Public Company Accounting Oversight Board (United States) (“PCAOB”), the consolidated balance sheets of the Company as of December 31, 2017 and 2016, and 2015, and the resultsrelated consolidated statements of its operations, comprehensive income, shareholders’ equity, and its cash flows for each of the three years thenin the period ended, December 31, 2017, and the related notes and our report dated March 15, 2018 expressed an unqualified opinion thereon.
Basis for Opinion
The Company’s management is responsible for maintaining effective internal control over financial reporting and for its assessment of the effectiveness of internal control over financial reporting, included in conformitythe accompanying “Item 9A, Management’s Report on Internal Control over Financial Reporting”. Our responsibility is to express an opinion on the Company’s internal control over financial reporting based on our audit. We are a public accounting firm registered with the PCAOB and are required to be independent with respect to the Company in accordance with U.S. federal securities laws and the applicable rules and regulations of the Securities and Exchange Commission and the PCAOB.
We conducted our audit of internal control over financial reporting in accordance with the standards of the PCAOB. Those standards require that we plan and perform the audit to obtain reasonable assurance about whether effective internal control over financial reporting was maintained in all material respects. Our audit included obtaining an understanding of internal control over financial reporting, assessing the risk that a material weakness exists, and testing and evaluating the design and operating effectiveness of internal control based on the assessed risk. Our audit also included performing such other procedures as we considered necessary in the circumstances. We believe that our audit provides a reasonable basis for our opinion.
Definition and Limitations of Internal Control over Financial Reporting
A company’s internal control over financial reporting is a process designed to provide reasonable assurance regarding the reliability of financial reporting and the preparation of financial statements for external purposes in accordance with generally accepted accounting principles. A company’s internal control over financial reporting includes those policies and procedures that (1) pertain to the maintenance of records that, in reasonable detail, accurately and fairly reflect the transactions and dispositions of the assets of the company; (2) provide reasonable assurance that transactions are recorded as necessary to permit preparation of financial statements in accordance with generally accepted accounting principles, generally acceptedand that receipts and expenditures of the company are being made only in accordance with authorizations of management and directors of the United Statescompany; and (3) provide reasonable assurance regarding prevention or timely detection of America.

unauthorized acquisition, use, or disposition of the company’s assets that could have a material effect on the financial statements.

Because of its inherent limitations, internal control over financial reporting may not prevent or detect misstatements. Also, projections of any evaluation of effectiveness to future periods are subject to the risk that controls may become inadequate because of changes in conditions, or that the degree of compliance with the policies or procedures may deteriorate.
/s/ BDO USA, LLP

BDO USA, LLP

Philadelphia, Pennsylvania

March 24, 2017

15, 2018


Two River Bancorp


Two River Bancorp


Consolidated Balance Sheets

 December 31,
 2017 2016
 (In Thousands, Except Share Data)
ASSETS   
Cash and due from banks$29,575
 $19,844
Interest-bearing deposits in bank18,644
 22,233
Cash and cash equivalents48,219
 42,077
    
Securities available for sale31,132
 34,464
Securities held to maturity (fair value of $58,549 and $57,284 at December 31, 2017 and 2016, respectively)58,002
 57,843
Restricted investments, at cost5,430
 4,805
Loans held for sale2,581
 4,537
Loans850,874
 753,092
Allowance for loan losses(10,668) (9,565)
Net Loans840,206
 743,527
    
Other real estate owned (“OREO”)
 259
Bank owned life insurance21,573
 21,029
Premises and equipment, net6,239
 4,662
Accrued interest receivable2,554
 2,234
Goodwill18,109
 18,109
Other assets5,753
 6,665
    
Total Assets$1,039,798
 $940,211
    
LIABILITIES AND SHAREHOLDERS’ EQUITY   
Liabilities:   
Deposits:   
Non-interest bearing$167,297
 $160,104
Interest-bearing694,260
 616,463
Total Deposits861,557
 776,567
    
Securities sold under agreements to repurchase27,120
 19,915
FHLB and other borrowings25,800
 25,300
Subordinated debt9,888
 9,855
Accrued interest payable70
 100
Other liabilities8,792
 7,758
    
Total Liabilities933,227
 839,495
    
Shareholders’ Equity   
Preferred stock, no par value; 6,500,000 shares authorized; no shares issued and outstanding
 
Common stock, no par value; 25,000,000 shares authorized;
   Issued – 8,782,124 and 8,677,536 at December 31, 2017 and 2016, respectively
   Outstanding – 8,470,030 and 8,365,442 at December 31, 2017 and 2016, respectively
79,678
 79,056
Retained earnings29,593
 24,447
Treasury stock, at cost; 312,094 shares at December 31, 2017 and 2016, respectively(2,396) (2,396)
Accumulated other comprehensive loss(304) (391)
Total Shareholders’ Equity106,571
 100,716
    
Total Liabilities and Shareholders’ Equity$1,039,798
 $940,211

Consolidated Balance Sheets


December 31,


2016


2015


(In Thousands, Except Share Data)


ASSETS


Cash and due from banks

 $19,844  $21,566 

Interest-bearing deposits in bank

  22,233   25,161 

Cash and cash equivalents

  42,077   46,727 
         

Securities available for sale

  34,464   33,530 

Securities held to maturity (fair value of $57,284 and $43,668 at December 31, 2016and 2015, respectively)

  57,843   43,167 

Restricted investments, at cost

  4,805   3,596 

Loans held for sale

  4,537   3,050 

Loans

  753,092   693,150 

Allowance for loan losses

  (9,565

)

  (8,713

)

Net Loans

  743,527   684,437 
         

Other real estate owned (“OREO”)

  259   411 

Bank owned life insurance

  21,029   17,294 

Premises and equipment, net

  4,662   5,083 

Accrued interest receivable

  2,234   1,912 

Goodwill

  18,109   18,109 

Other intangible assets, net of accumulated amortization of $2,106 and $2,097at December 31, 2016 and 2015, respectively

  -   9 

Other assets

  6,665   6,371 
         

Total Assets

 $940,211  $863,696 
         

LIABILITIES AND SHAREHOLDERS’ EQUITY


Liabilities:


Deposits:


Non-interest bearing

 $160,104  $144,627 

Interest bearing

  616,463   563,809 

Total Deposits

  776,567   708,436 
         

Securities sold under agreements to repurchase

  19,915   19,545 

FHLB and other borrowings

  25,300   26,500 

Subordinated debt

  9,855   9,824 

Accrued interest payable

  100   118 

Other liabilities

  7,758   6,271 
         

Total Liabilities

  839,495   770,694 
         

Shareholders’ Equity


Preferred stock, no par value; 6,500,000 shares authorized; no shares issued and outstanding

   -    - 

Common stock, no par value; 25,000,000 shares authorized;

   Issued – 8,677,536 and 8,213,196 at December 31, 2016 and 2015, respectively

   Outstanding – 8,365,442 and 7,929,196 at December 31, 2016 and 2015, respectively

  79,056   72,890 

Retained earnings

  24,447   22,759 

Treasury stock, at cost; 312,094 and 284,000 shares at December 31, 2016 and 2015, respectively

  (2,396

)

  (2,248

)

Accumulated other comprehensive loss

  (391

)

  (399

)

Total Shareholders’ Equity

  100,716   93,002 
         

Total Liabilities and Shareholders’ Equity

 $940,211  $863,696 

See notes to consolidated financial statements.


Two River Bancorp


Two River Bancorp


Consolidated Statements of Operations
 Years Ended December 31,
 2017 2016 2015
      
 (In Thousands, Except Per Share Data)
Interest Income     
Loans, including fees$35,801
 $32,798
 $30,624
Securities:     
Taxable988
 776
 782
Tax-exempt1,101
 917
 623
Interest-bearing deposits350
 133
 74
Total Interest Income38,240
 34,624
 32,103
Interest Expense     
Deposits4,363
 3,829
 3,141
Securities sold under agreements to repurchase66
 61
 68
FHLB and other borrowings620
 618
 621
Subordinated debt658
 656
 33
Total Interest Expense5,707
 5,164
 3,863
Net Interest Income32,533
 29,460
 28,240
Provision for Loan Losses1,530
 515
 490
Net Interest Income after Provision for Loan Losses31,003
 28,945
 27,750
      
Non-Interest Income     
Service fees on deposit accounts772
 587
 578
Mortgage banking1,583
 1,162
 783
Other loan fees588
 610
 214
Earnings from investment in bank owned life insurance544
 477
 445
Death benefit on bank owned life insurance
 862
 
Gain on sale of SBA loans1,052
 868
 561
Net gain on sale of securities
 72
 37
Gain on sale of premises and equipment
 
 208
Other income920
 851
 711
Total Non-Interest Income5,459
 5,489
 3,537
      
Non-Interest Expenses     
Salaries and employee benefits14,046
 12,844
 12,486
Occupancy and equipment4,241
 4,117
 3,942
Professional1,497
 1,198
 982
Insurance216
 216
 268
FDIC insurance and assessments467
 412
 433
Advertising450
 415
 403
Data processing553
 554
 475
Outside service fees473
 500
 499
Amortization of identifiable intangibles
 9
 48
OREO expenses, impairments and sales, net48
 (274) (70)
Loan workout expenses233
 73
 431
Other operating1,718
 1,411
 1,458
Total Non-Interest Expenses23,942
 21,475
 21,355
      
Income before Income Taxes12,520
 12,959
 9,932
Income tax expense6,018
 4,328
 3,585
Net Income6,502
 8,631
 6,347
Preferred stock dividend
 
 (57)
Net Income available to common shareholders$6,502
 $8,631
 $6,290
Earnings Per Common Share:     
Basic$0.78
 $1.04
 $0.76
Diluted$0.75
 $1.01
 $0.74

Consolidated Statements of Operations


Years Ended December 31,


2016


2015


(In Thousands, Except Per Share Data)


Interest Income


Loans, including fees

 $32,798  $30,624 

Securities:


Taxable

  776   782 

Tax-exempt

  917   623 

Interest-bearing deposits

  133   74 

Total Interest Income

  34,624   32,103 

Interest Expense


Deposits

  3,829   3,141 

Securities sold under agreements to repurchase

  61   68 

FHLB and other borrowings

  618   621 

Subordinated debt

  656   33 

Total Interest Expense

  5,164   3,863 

Net Interest Income

  29,460   28,240 

Provision for Loan Losses

  515   490 

Net Interest Income after Provision for Loan Losses

  28,945   27,750 
         

Non-Interest Income


Service fees on deposit accounts

  587   578 

Mortgage banking

  1,162   783 

Other loan fees

  610   214 

Earnings from investment in bank owned life insurance

  477   445 

Death benefit on bank owned life insurance

  862   - 

Gain on sale of SBA loans

  868   561 

Net gain on sale of securities

  72   37 

Gain on sale of premises and equipment

  -   208 

Other income

  851   711 

Total Non-Interest Income

  5,489   3,537 
         

Non-Interest Expenses


Salaries and employee benefits

  12,844   12,486 

Occupancy and equipment

  4,117   3,942 

Professional

  1,198   982 

Insurance

  216   268 

FDIC insurance and assessments

  412   433 

Advertising

  415   403 

Data processing

  554   475 

Outside service fees

  500   499 

Amortization of identifiable intangibles

  9   48 

OREO expenses, impairments and sales, net

  (274

)

  (70

)

Loan workout expenses

  73   431 

Other operating

  1,411   1,458 

Total Non-Interest Expenses

  21,475   21,355 
         

Income before Income Taxes

  12,959   9,932 

Income tax expense

  4,328   3,585 

Net Income

  8,631   6,347 

Preferred stock dividend

  -   (57

)

Net Income available to common shareholders

 $8,631  $6,290 

Earnings Per Common Share:


Basic

 $1.04  $0.76 

Diluted

 $1.01  $0.74 

See notes to consolidated financial statements.

Two River Bancorp


Two River Bancorp

Consolidated Statements of Comprehensive Income


Years Ended December 31,


2016


2015


(In Thousands)


Net income

 $8,631  $6,347 

Other comprehensive income (loss):


Reclassification adjustment for gains on sales of securities available for sale recognized inincome, net of income tax expense 2015: $14(a)(b)

  -   (23

)

Unrealized holdings gain (loss) on securities available for sale, net of income taxexpense (benefit) 2016: $5; 2015: $(24)

  8   (31

)


Other comprehensive income (loss)

  8   (54

)


Total comprehensive income

 $8,639  $6,293 

Consolidated Statements of Comprehensive Income

     
 Years Ended December 31,
 2017 2016 2015
 (In Thousands)
      
Net income$6,502
 $8,631
 $6,347
Other comprehensive income (loss):     
Reclassification adjustment for gains on sales of securities available for sale recognized in income, net of income tax expense 2015: $14 (a)(b)

 
 (23)
Unrealized holdings gains (losses) on securities available for sale, net of income tax expense (benefit) 2017: $56; 2016: $5; 2015: $(24)87
 8
 (31)
      
Other comprehensive income (loss)87
 8
 (54)
      
Total comprehensive income$6,589
 $8,639
 $6,293
(a) Gross amounts are included in net gain on sale of securities on the Consolidated Statements of Operations in non-interest income.

(b) Income tax amounts are included in income tax expense on the Consolidated Statements of Operation.

Operations.

See notes to consolidated financial statements.


Two River Bancorp


Consolidated Statements of Shareholders' Equity
(Dollars in thousands, except per share data)          
  Common Stock     
Accumulated
Other
Comprehensive
Income (Loss)
 
Total
Shareholders’
Equity
 
Preferred
Stock
 
Outstanding
Shares
 Amount 
Retained
Earnings
 Treasury Stock  
Balance, January 1, 2015$6,000
 7,939,684
 $72,527
 $17,501
 $(1,751) $(345) $93,932
              
Net income
 
 
 6,347
 
 
 6,347
              
Other comprehensive loss


 (54) (54)
              
Redemption of preferred stock, Series C(6,000) 


 (6,000)
              
Dividends on preferred stock, Series C
 
 
 (57) 
 
 (57)
              
Stock-based compensation expense
 
 186


 186
              
Cash dividends on common stock ($0.12 per share)
 
 
 (1,032) 
 
 (1,032)
              
Options exercised
 28,450
 114


 114
              
Tax benefit related to stock compensation
 
 7


 7
              
Common stock repurchased
 (56,388) 
 
 (497) 
 (497)
              
Restricted stock awards
 11,100


Employee stock purchase program
 6,350
 56


 56
              
Balance, December 31, 2015$
 7,929,196
 $72,890
 $22,759
 $(2,248) $(399) $93,002
              
Net income
 
 
 8,631
 
 
 8,631
              
Other comprehensive income


 8
 8
              
Stock-based compensation expense
 
 231


 231
              
Cash dividends on common stock ($0.14 per share)
 
 
 (1,193) 
 
 (1,193)
              
Common stock dividend - 5%
 399,554
 5,750
 (5,750) 


Options exercised
 27,527
 104


 104
              
Tax benefit related to stock compensation
 
 25


 25
              
Common stock repurchased
 (13,232) 
 
 (148) 
 (148)
              
Restricted stock and other awards
 17,000


Employee stock purchase program
 5,397
 56


 56
              
Balance, December 31, 2016$
 8,365,442
 $79,056
 $24,447
 $(2,396) $(391) $100,716
Two River Bancorp


Consolidated Statements of Shareholders' Equity (continued)
(Dollars in thousands, except per share data)          
  Common Stock     
Accumulated
Other
Comprehensive
Income (Loss)
 
Total
Shareholders’
Equity
 
Preferred
Stock
 
Outstanding
Shares
 Amount 
Retained
Earnings
 Treasury Stock  
Balance, December 31, 2016$
 8,365,442
 $79,056
 $24,447
 $(2,396) $(391) $100,716
              
Net income
 
 
 6,502
 
 
 6,502
              
Other comprehensive income


 87
 87
              
Stock-based compensation expense
 
 279


 279
              
Cash dividends on common stock ($0.17 per share)
 
 
 (1,415) 
 
 (1,415)
              
Common stock dividend - adjustment
 (1,069) 


Options exercised
 68,403
 276


 276
              
Tax benefit related to stock compensation
 
 
 59
 
 
 59
              
Restricted stock and other awards
 33,333


Employee stock purchase program
 3,921
 67


 67
              
Balance, December 31, 2017$
 8,470,030
 $79,678
 $29,593
 $(2,396) $(304) $106,571


Consolidated Statements of Shareholders’ Equity

(Dollars in thousands, except per share data)


Common Stock


Accumulated

Other


Total


Preferred

Stock


Outstanding

shares


Amount


Retained

Earnings

  Treasury Stock  

Comprehensive

Income (Loss)


Shareholders’

Equity


Balance, January 1, 2015

 $6,000   7,939,684  $72,527  $17,501  $(1,751

)

 $(345

)

 $93,932 
                             

Net income

  -   -   -   6,347   -   -   6,347 
                             

Other comprehensive loss

  -   -   -   -   -   (54

)

  (54

)


Redemption of preferred stock, Series C

  (6,000

)

  -   -   -   -   -   (6,000

)


Dividends on preferred stock, Series C

  -   -   -   (57

)

  -   -   (57

)


Stock-based compensation expense

  -   -   186   -   -   -   186 
                             

Cash dividends on common stock($0.12 per share)

  -   -   -   (1,032

)

  -   -   (1,032

)


Options exercised

  -   28,450   114   -   -   -   114 
                             

Tax benefit of exercised stock options

  -   -   7   -   -   -   7 
                             

Common stock repurchased

  -   (56,388

)

  -   -   (497

)

  -   (497

)


Restricted stock awards

  -   11,100   -   -   -   -   - 
                             

Employee stock purchase program

  -   6,350   56   -   -   -   56 
                             

Balance, December 31, 2015

 $-   7,929,196  $72,890  $22,759  $(2,248

)

 $(399

)

 $93,002 
                             

Net income

  -   -   -   8,631   -   -   8,631 
                             

Other comprehensive income

  -   -   -   -   -   8   8 
                             

Stock-based compensation expense

  -   -   231   -   -   -   231 
                             

Cash dividends on common stock($0.14 per share)

  -   -   -   (1,193

)

  -   -   (1,193

)


Common stock dividend - 5%

  -   399,554   5,750   (5,750

)

  -   -   - 
                             

Options exercised

  -   27,527   104   -   -   -   104 
                             

Tax benefit of exercised stock options

  -   -   25   -   -   -   25 
                             

Common stock repurchased

  -   (13,232

)

  -   -   (148

)

  -   (148

)


Restricted stock and other awards

  -   17,000   -   -   -   -   - 
                             

Employee stock purchase program

  -   5,397   56   -   -   -   56 
                             

Balance, December 31, 2016

 $-   8,365,442  $79,056  $24,447  $(2,396

)

 $(391

)

 $100,716 

See notes to consolidated financial statements.


Two River Bancorp


Consolidated Statements of Cash Flows

     
 Years Ended December 31,
 2017 2016 2015
 (In Thousands)
Cash Flows from Operating Activities     
Net income$6,502
 $8,631
 $6,347
Adjustments to reconcile net income to net cash provided by operating activities:     
Depreciation and amortization765
 780
 798
Provision for loan losses1,530
 515
 490
Intangible amortization
 9
 48
Amortization of subordinated debt issuance costs33
 31
 
Net amortization of securities premiums and discounts828
 714
 557
Deferred income taxes1,061
 (463) (484)
Earnings from investment in bank owned life insurance(544) (477) (445)
Proceeds from sale of mortgage loans held for sale72,190
 62,059
 41,393
Origination of mortgage loans held for sale(69,480) (60,882) (42,091)
Gain on sale of mortgage loans held for sale(1,278) (1,059) (650)
Gain on sale of loans transferred from held for investment to held for sale(177) 
 (113)
Net realized loss (gain) on sale of OREO17
 45
 (107)
Impairment on OREO26
 
 84
Stock-based compensation expense279
 231
 186
Net realized gain on sale of securities available for sale
 
 (37)
Net realized gain on sale of securities held to maturity
 (72) 
Death benefit on bank owned life insurance
 (862) 
Proceeds from sale of SBA loans held for sale9,744
 7,860
 6,980
Origination of SBA loans held for sale(8,168) (8,597) (6,419)
Gain on sale of SBA loans held for sale(1,052) (868) (561)
Gain on sale of premises and equipment
 
 (208)
Decrease (increase) in assets:     
Accrued interest receivable(320) (322) (276)
Other assets(205) 164
 413
Increase (decrease) in liabilities:     
Accrued interest payable(30) (18) 72
Other liabilities1,034
 1,487
 733
Net Cash Provided by Operating Activities12,755
 8,906
 6,710
Cash Flows from Investing Activities     
Purchase of securities available for sale(2,500) (8,038) (20,707)
Purchase of securities held to maturity(15,458) (25,213) (25,297)
Proceeds from repayments, calls and maturities of securities available for sale5,599
 6,781
 7,916
Proceeds from repayments, calls and maturities of securities held to maturity14,847
 9,155
 7,184
Proceeds from sales of securities available for sale
 
 24,306
Proceeds from sales of securities held to maturity
 1,076
 
Proceeds from sale of loans transferred from held for investment to held for sale8,357
 
 5,727
Net increase in loans(106,389) (59,605) (71,261)
Purchase of premises and equipment(2,342) (359) (902)
Proceeds from sale of premises and equipment
 
 925
Purchase of restricted investments, net(625) (1,209) (567)
Proceeds from the sale of OREO216
 107
 1,367
Purchase of bank owned life insurance
 (3,918) 
Proceeds from death benefit on bank owned life insurance
 1,522
 
 Net Cash Used in Investing Activities(98,295) (79,701) (71,309)
Two River Bancorp


Consolidated Statements of Cash Flows (continued)

  
 Years Ended December 31,
 2017 2016 2015
 (In Thousands)
Cash Flows from Financing Activities     
Net increase in deposits84,990
 68,131
 66,046
Net increase (decrease) in securities sold under agreements to repurchase7,205
 370
 (3,745)
Redemption of preferred stock, Series C
 
 (6,000)
Proceeds from FHLB and other borrowings12,500
 13,000
 12,000
Repayment of FHLB and other borrowings(12,000) (14,200) (1,500)
Cash dividends paid - preferred stock
 
 (57)
Cash dividends paid - common stock(1,415) (1,193) (1,032)
Proceeds from employee stock purchase plan67
 56
 56
Proceeds from subordinated debt placement, net of issuance costs of $176,000
 
 9,824
Proceeds from exercise of stock options276
 104
 114
Common stock repurchased
 (148) (497)
Tax benefit related to stock compensation59
 25
 7
Net Cash Provided by Financing Activities91,682
 66,145
 75,216
Net Increase (Decrease) in Cash and Cash Equivalents6,142
 (4,650) 10,617
Cash and Cash Equivalents – Beginning42,077
 46,727
 36,110
Cash and Cash Equivalents – Ending$48,219
 $42,077
 $46,727
Supplementary cash flow information:     
Interest paid$5,737
 $5,182
 $3,791
Income taxes paid$5,217
 $4,338
 $3,289
Supplementary schedule of non-cash activities:     
Transfer of loans held for investment to loans held for sale$8,180
 $
 $5,614
OREO acquired in settlement of loans$
 $
 $152

Consolidated Statements of Cash Flows


Years Ended December 31,


2016


2015


(In Thousands)


Cash Flows from Operating Activities


Net income

 $8,631  $6,347 

Adjustments to reconcile net income to net cash provided by operating activities:


Depreciation and amortization

  780   798 

Provision for loan losses

  515   490 

Intangible amortization

  9   48 

Amortization of subordinated debt issuance costs

  31   - 

Net amortization of securities premiums and discounts

  714   557 

Deferred income taxes

  (463

)

  (484

)

Earnings from investment in bank owned life insurance

  (477

)

  (445

)

Proceeds from sale of mortgage loans held for sale

  62,059   41,393 

Origination of mortgage loans held for sale

  (60,882

)

  (42,091

)

Gain on sale of mortgage loans held for sale

  (1,059

)

  (650

)

Gain on sale of loans transferred from held for investment to held for sale

  -   (113

)

Net realized loss (gain) on sale of OREO

  45   (107

)

Impairment on OREO

  -   84 

Stock-based compensation expense

  231   186 

Net realized gain on sale of securities available for sale

  -   (37

)

Net realized gain on sale of securities held to maturity

  (72

)

  - 

Death benefit on bank owned life insurance

  (862

)

  - 

Proceeds from sale of SBA loans held for sale

  7,860   6,980 

Origination of SBA loans held for sale

  (8,597

)

  (6,419

)

Gain on sale of SBA loans held for sale

  (868

)

  (561

)

Gain on sale of premises and equipment

  -   (208

)

Decrease (increase) in assets:


Accrued interest receivable

  (322

)

  (276

)

Other assets

  164


  413 

Increase (decrease) in liabilities:


Accrued interest payable

  (18

)

  72 

Other liabilities

  1,487   733 

Net Cash Provided by Operating Activities

  8,906   6,710 

Cash Flows from Investing Activities


Purchase of securities available for sale

  (8,038

)

  (20,707

)

Purchase of securities held to maturity

  (25,213

)

  (25,297

)

Proceeds from repayments, calls and maturities of securities available for sale

  6,781   7,916 

Proceeds from repayments, calls and maturities of securities held to maturity

  9,155   7,184 

Proceeds from sales of securities available for sale

  -   24,306 

Proceeds from sales of securities held to maturity

  1,076   - 

Proceeds from sale of loans transferred from held for investment to held for sale

  -   5,727 

Net increase in loans

  (59,605

)

  (71,261

)

Purchase of premises and equipment

  (359

)

  (902

)

Proceeds from sale of premises and equipment

  -   925 

Purchase of restricted investments, net

  (1,209

)

  (567

)

Proceeds from the sale of OREO

  107   1,367 

Purchase of bank owned life insurance

  (3,918

)

  - 

Proceeds from death benefit on bank owned life insurance

  1,522   - 

Net Cash Used in Investing Activities

  (79,701

)

  (71,309

)

Cash Flows from Financing Activities


Net increase in deposits

  68,131   66,046 

Net increase (decrease) in securities sold under agreements to repurchase

  370   (3,745

)

Redemption of preferred stock, Series C

  -   (6,000

)

Proceeds from FHLB and other borrowings

  13,000   12,000 

Repayment of FHLB and other borrowings

  (14,200

)

  (1,500

)

Cash dividends paid - preferred stock

  -   (57

)

Cash dividends paid - common stock

  (1,193

)

  (1,032

)

Proceeds from employee stock purchase plan

  56   56 

Proceeds from subordinated debt placement, net of issuance costs of$176,000

  -   9,824 

Proceeds from exercise of stock options

  104   114 

Common stock repurchased

  (148

)

  (497

)

Tax benefit of stock options exercised

  25   7 

Net Cash Provided by Financing Activities

  66,145   75,216 

Net (Decrease) Increase in Cash and Cash Equivalents

  (4,650

)

  10,617 

Cash and Cash Equivalents – Beginning

  46,727   36,110 

Cash and Cash Equivalents – Ending

 $42,077  $46,727 

Supplementary cash flow information:


Interest paid

 $5,182  $3,791 

Income taxes paid

 $4,338  $3,289 

Supplementary schedule of non-cash activities:


Transfer of loans held for investment to loans held for sale

 $-  $5,614 

OREO acquired in settlement of loans

 $-  $152 

See notes to consolidated financial statements.


Two River Bancorp


Note 1 – Summary of Significant Accounting Policies


A.

A.Organization and Basis of Presentation


The accompanying consolidated financial statements include the accounts of Two River Bancorp (the “Company”), a bank holding company, and its wholly-owned subsidiary, Two River Community Bank (“the Bank” or “Two River”) and the Bank’s wholly-owned subsidiaries, TRCB Investment Corporation TRCB Holdings Two LLC, TRCB Holdings Three LLC, TRCB Holdings Seven LLC and TRCB Holdings Eight LLC. All inter-company balances and transactions have been eliminated in the consolidated financial statements.

B.

B.Nature of Operations

Two River Bancorp is a bank holding company whose principal activity is the ownership of Two River Community Bank. Through its banking subsidiary, the Company provides banking services to small and medium-sized businesses, professionals and individual consumers primarily in the Monmouth, Middlesex, Union and UnionOcean Counties, located in Central and Northern New Jersey. The Company competes with other banking and financial institutions in its market communities.

The Company and its bank subsidiary are subject to regulations of certain state and federal agencies and, accordingly, they are periodically examined by those regulatory authorities. As a consequence of the extensive regulation of commercial banking activities, the Company’s and the Bank’s businesses are susceptible to being affected by state and federal legislation and regulations.

C.

C.Use ofEstimates

The preparation of financial statements in conformity with accounting principles generally accepted in the United States of America requires management to make estimates and assumptions that affect the reported amounts of assets and liabilities and disclosure of contingent assets and liabilities at the date of the financial statements and the reported amounts of revenues and expenses during the reporting period. Actual results could differ from those estimates.

The principal material estimates that are particularly susceptible to significant change in the near term related to: the allowance for loan losses, the potential impairment of goodwill, the potential impairment of restricted investments, the valuation of deferred tax assets, valuation of other real estate owned and the determination of other-than-temporary impairment on securities.

D.

D.Significant Concentrations of Credit Risk

Most of the Company’s activities are with customers located within Monmouth, Middlesex, Union and UnionOcean Counties of New Jersey. Note 2 discusses the types of securities that the Company invests in. Note 3 discusses the types of lending that the Company engages in. Although the Company actively manages the diversification of its loan portfolio, a substantial portion of its debtors’ ability to honor their contracts is dependent upon the strength of the local economy. The loan portfolio includes commercial real estate, which is comprised of owner occupied and investment real estate, including general office, medical, manufacturing and retail space. Construction loans, short-term in nature, comprise another portion of the portfolio, along with commercial and industrial loans. The latter includes lines of credit and equipment loans. From time to time, the Company may purchase or sell an interest in a loan from or to another lender (participation loan) in order to manage its portfolio risk. Loans purchased by the Company are typically located in central New Jersey and meet the Company’s own independent underwriting guidelines. The Company does not have any significant concentrations in any one industry or customer.

E.

E.Comprehensive Income

Comprehensive income consists of net income and other comprehensive income (loss). Other comprehensive income (loss) includes unrealized gains and losses on securities available for sale and unrealized losses related to factors other than credit on debt securities which have been determined to be other-than-temporarily impaired.


Note 1 - Summary of Significant Accounting Policies (Continued)


F.

F.Statement of Cash Flows


For purposes of reporting cash flows, cash and cash equivalents include cash on hand, amounts due from banks, interest-bearing deposits in banks, and Federal funds sold. Interest-bearing deposits are due from the Federal Reserve Bank of New York. Generally, Federal funds are purchased and sold for one-day periods.


G.Securities
 

Note 1 – Summary of Significant Accounting Policies (Continued)

G.

Securities

Securities classified as available for sale are those securities that the Company intends to hold for an indefinite period of time but not necessarily to maturity. Securities available for sale are carried at fair value. Any decision to sell a security classified as available for sale would be based on various factors, including significant movement in interest rates, changes in maturity mix of the Company’s assets and liabilities, liquidity needs, regulatory capital considerations and other similar factors. Unrealized gains or losses are reported as increases or decreases in other comprehensive income (loss), net of the related deferred tax effect. Realized gains or losses, determined on the basis of the cost of the specific securities sold, are included in earnings. Premiums and discounts are recognized in interest income using the interest method over the terms of the securities. Gains and losses on the sale of securities available for sale are recorded on the trade date and are determined using the specific identification method.

Securities classified as held to maturity are those securities the Company has both the intent and ability to hold to maturity regardless of changes in market conditions, liquidity needs or changes in general economic conditions. These securities are carried at cost adjusted for the amortization of premium and accretion of discount, computed by the interest method over the terms of the securities.

Management determines the appropriate classification of debt securities at the time of purchase and re-evaluates such designation as of each balance sheet date.

Other-than-temporary accounting guidance specifies that (a) if a company does not have the intent to sell a debt security prior to recovery and (b) it is more likely than not that it will not have to sell the debt security prior to recovery, the security would not be considered other-than-temporary impaired unless there is a credit loss. When an entity does not intend to sell the security, and it is more likely than not, the entity will not have to sell the security before recovery of its cost basis, it will recognize the credit component of an other-than-temporary impairment of a debt security in earnings and the remaining portion in other comprehensive income (loss). For held to maturity debt securities, the amount of an other-than-temporary impairment recorded in other comprehensive income (loss) for the noncredit portion of a previous other-than-temporary impairment should be amortized prospectively over the remaining life of the security on the basis of the timing of future cash flows of the security.

H.

H.Restricted Investments

Restricted investments, which represents the required investment in the common stock of correspondent banks, is carried at cost and as of December 31, 20162017 and 2015,2016, consists of the common stock of the Federal Home Loan Bank of New York (“FHLB”) and Atlantic Community Bancshares, Inc. (“ACBI”), the parent company of Atlantic Community Bankers Bank. Federal law requires a member institution of the FHLB to hold stock of its district FHLB according to a predetermined formula. The recorded investment in FHLB common stock was$3,230,000was $3,855,800 and $2,021,000$3,230,000 at December 31, 20162017 and 2015,2016, respectively. The recorded investment in ACBI common stock was$75,000was $75,000 at December 31, 20162017 and 2015.

2016.

Restricted investments also include the Solomon Hess SBA Loan Fund, utilized for the purpose of the Bank satisfying its CRA lending requirements. As this fund operates as a private fund, shares in the Fund are not publicly traded and therefore have no readily determinable market value. An investor can have their interest in the Fund redeemed for the balance of their capital account at any quarter end assuming they give the Fund 60 days’ notice. The investment in this Fund is recorded at cost, which was$1,500,000was $1,500,000 at December 31, 20162017 and 2015.2016. The Company does not record the investment at fair value on a recurring basis.

Management evaluates the restricted investments for impairment in accordance with U.S. generally accepted accounting principles. Management’s determination of whether these investments are impaired is based on their assessment of the ultimate recoverability of their cost rather than by recognizing temporary declines in value.Managementvalue. Management believes no impairment charge is necessary related to restricted investments as of December 31, 2016.

2017.
Note 1 - Summary of Significant Accounting Policies (Continued)


I.

I.Loans Receivable and Loans Held for Sale

Loans receivable, which management has the intent and ability to hold for the foreseeable future or until maturity or payoff are stated at their outstanding unpaid principal balances, net of an allowance for loan losses and any deferred fees or costs. Interest income is accrued on the unpaid principal balance. Loan origination fees, net of certain direct origination costs, are deferred and recognized as an adjustment of the yield (interest income) of the related loans. The Company is generally amortizing these amounts over the contractual life of the loan.


Note 1 – Summary of Significant Accounting Policies (Continued)

Generally, loans

Loans held for sale are designated at time of origination,origination. They generally consist of newly originated fixed rate residential loans and salable SBA loans and are recorded at the lower of aggregate cost or estimated fair value in the aggregate. The Company did not transfer any impairedtypically retains adjustable-rate mortgage (“ARM”) loans in its portfolio, however occasionally, the Company may elect to sell a small pool of these loans as part of its strategy to manage interest rate risk or as a secondary source of liquidity. The Company transferred $8.2 million from held for investment to held for sale in 2017, while no such loans were transferred in 2016. In 2015, theThe Company transferred $5.6 million from held for investment to held for sale.sale in 2015. Gains from such sales were $177,000, $0, and $113,000 for the years ended December 31, 2017, 2016 and 2015, respectively. Transfers from held for investment are infrequent and occur at lower of cost or fair value, less costs to sell, with any charge-off to allowance for loan losses.sell. Gains are recognized on a settlement-date basis and are determined by the difference between the net sales proceeds and the carrying value of the loans, including any net deferred fees or costs.

The loans receivable portfolio is segmented into commercial and consumer loans.five categories, those being a) Commercial loans consist of the following classes: commercial and industrial, realb) Real estate-construction (consisting of both residential and real estate-commercial. Consumer loans consist of the following classes: realcommercial construction), c) Real estate-commercial, d) Real estate-residential, and consumer.

e) Consumer.

For all classes of loans receivable, the accrual of interest is discontinued when the contractual payment of principal or interest has become 90 days past due or management has serious doubts about further collectability of principal or interest, even though the loan is currently performing. A loan may remain on accrual status if it is in the process of collection and is either guaranteed or well secured. When a loan is placed on nonaccrual status, unpaid interest previously accrued on these loans is reversed from income. Interest received on nonaccrual loans, including impaired loans, generally is either applied against principal or reported as interest income, according to management’s judgment as to the collectability of principal. Generally, loans are restored to accrual status when the obligation is brought current, has performed in accordance with the contractual terms for a reasonable period of time (generally six months) and the ultimate collectability of the total contractual principal and interest is no longer in doubt. The past due status of all classes of loans receivable is determined based on contractual due dates for loan payments.


J.

J.Allowance for Loan Losses

The allowance for credit losses consists of the allowance for loan losses and the reserve for unfunded lending commitments. The allowance for loan losses represents management’s estimate of losses inherent in the loan portfolio as of the balance sheet date and is recorded as a reduction to loans. The reserve for unfunded lending commitments represents management’s estimate of losses inherent in its unfunded loan commitments and is recorded in other liabilities on the consolidated balance sheet, which at December 31, 20162017 and 2015,2016, the Company had no such reserves. The allowance for loan losses is increased by the provision for loan losses, and decreased by charge-offs, net of recoveries. Loans deemed to be uncollectable are charged against the allowance for loan losses, and subsequent recoveries, if any, are credited to the allowance. All, or part, of the principal balance of loans receivable are charged off to the allowance as soon as it is determined that the repayment of all, or part, of the principal balance is highly unlikely.

The allowance for loan losses is maintained at a level considered adequate to provide for losses that can be reasonably anticipated. Management performs a monthly evaluation of the adequacy of the allowance. The allowance is based on the Company’s past loan loss experience, known and inherent risks in the portfolio, adverse situations that may affect the borrower’s ability to repay, the estimated value of any underlying collateral, composition of the loan portfolio, current economic conditions and other relevant factors. This evaluation is inherently subjective as it requires material estimates that may be susceptible to significant revision as more information becomes available.

The allowance consists of specific, general and unallocated components. For loans that are classified as impaired, an allowance is established when the discounted cash flows (or collateral value or observable market price) of the impaired loan is lower than the carrying value of the loan. The specific component relates to loans that are classified
Note 1 - Summary of Significant Accounting Policies (Continued)


as impaired. When a loan is impaired, there are three acceptable methods under ASC 310-10-35 for measuring the impairment:

1.

The loan’s observable market price;

2.

The fair value of the underlying collateral; or

3.

The present value (PV) of expected future cash flows.


1.The loan's observable market price;
2.The fair value of the underlying collateral; or
3.The present value (PV) of expected future cash flows.
Loans that are considered “collateral-dependent” should be evaluated under the “Fair market value of collateral.” Loans that are still expected to be supported by repayment from the borrower should be evaluated under the “Present value of future cash flows.”

For the most part, the Company measures impairment under the “Fair market value of collateral” for any loan that would rely on the value of collateral for recovery in the event of default. The individual impairment analysis for each loan is clearly documented as to the chosen valuation method.


Note 1 – Summary of Significant Accounting Policies (Continued)

The general component covers pools of loans by loan class including commercial and industrial, real estate-construction and real estate-commercial not considered impaired as well as smaller balance homogeneous loans such as real estate-residential and consumer.

These pools of loans are evaluated for loss exposure based upon historical loss rates for each of these categories of loans, adjusted for qualitative factors. These qualitative risk factors include:

1.

Changes in lending policy and procedures, including changes in underwriting standards and collection practices not previously considered in estimating credit losses.

2.

Changes in relevant economic and business conditions.

3.

Changes in nature and volume of the loan portfolio and in the terms of loans.

4.

Changes in experience, ability and depth of lending management and staff.

5.

Changes in the volume and severity of past due loans, the volume of non-accrual loans and the volume and severity of adversely classified loans.

6.

Changes in the quality of the loan review system.

7.

Changes in the value of underlying collateral for collateral-dependent loans.

8.

The existence and effect of any concentration of credit and changes in the level of such concentrations.

9.

The effect of other external forces such as competition, legal and regulatory requirements on the level of estimated credit losses in the existing portfolio.


1. Changes in lending policy and procedures, including changes in underwriting standards and collection practices not previously considered in estimating credit losses.
2. Changes in relevant economic and business conditions.
3. Changes in nature and volume of the loan portfolio and in the terms of loans.
4. Changes in experience, ability and depth of lending management and staff.
5. Changes in the volume and severity of past due loans, the volume of non-accrual loans and the volume and severity of adversely classified loans.
6. Changes in the quality of the loan review system.
7. Changes in the value of underlying collateral for collateral-dependent loans.
8. The existence and effect of any concentration of credit and changes in the level of such concentrations.
9. The effect of other external forces such as competition, legal and regulatory requirements on the level of estimated credit losses in the existing portfolio.
Each factor is assigned a risk value to reflect low, moderate or high risk assessments based on management’s best judgment using current market, macro and other relevant information available at the time of the evaluation. Adjustments to the factors are supported through documentation in each factor and accompany the allowance for loan loss calculation.

An unallocated component is maintained to cover uncertainties that could affect management’s estimate of probable losses. The unallocated component of the allowance reflects the margin of imprecision inherent in the underlying assumptions used in the methodologies for estimating specific and general losses in the portfolio.

The Company engages in a variety of lending activities, including commercial and industrial, real estate-commercial, real estate-construction, real estate-residential and consumer loans. The Company focuses its lending activities on individuals, professionals along with small to medium sized businesses.

The Company originates commercial business loans to professionals, sole proprietorships and small businesses in our market areas. We extend commercial business loans on a secured and unsecured basis. Secured commercial loans are generally collateralized by residential and nonresidential real estate, marketable securities, accounts receivable, inventory, industrial/commercial machinery and equipment and furniture and fixtures. To further enhance our security position, we generally require personal guarantees of the principal owners of the entities to which we extend credit. These loans are made on both lines of credit and fixed-term basis typically ranging from one to five years in duration. When making commercial business loans, we consider the financial statements and/or tax returns of the borrower, the borrower’s payment history along with the principal owners’ payment history,
Note 1 - Summary of Significant Accounting Policies (Continued)


the debt service capabilities of the borrower, the projected cash flows of the business, and the value of the collateral and the financial strength of the guarantor.

Commercial real estate loans are made to local commercial, retail and professional firms and individuals for the acquisition of new property or the refinancing of existing property. These loans are typically related to commercial businesses and secured by the underlying real estate used in these businesses or real property of the principals. Commercial real estate loans typically require a loan to value ratio of not greater than 75%. These loans are generally offered on a fixed or variable rate basis, subject to rate re-adjustments every five years and amortization schedules ranging from 5 to 25 years.


Note 1 – Summary of Significant Accounting Policies (Continued)

Commercial loans are often larger and may involve greater risks than other types of lending. Because payments of such loans are often dependent on the successful operation of the business involved, repayment of such loans may be more sensitive than other types of loans and are subject to adverse conditions in the real estate market or the general economy. We are also involved with off-balance sheet financial instruments, which include collateralized commercial and standby letters of credit. We seek to minimize these risks through our underwriting guidelines and prudent risk management techniques. Any collateral securing such loans may depreciate over time, may be difficult to appraise and may fluctuate in value. Environmental surveys and inspections are obtained when circumstances suggest that the possibility of the presence of hazardous materials. There can be no assurances, however, of success in the efforts to minimize these risks.

The Company is an approved Preferred Lender by the Small Business Administration (“SBA”), which allows the Company delegated authority to approve and close SBA loans up to $5.0 million. The Company maintains prudent credit risk management to monitor and evaluate the value of real estate and other collateral used to secure SBA loans. All SBA loans are originated in compliance with all applicable federal lending regulations, including but not limited to the Equal Credit Opportunity Act. The Bank currently participates in SBA’s 7a and 504 loan programs, which typically provide guarantees up to 75% per loan. The Bank generallytypically sells the guaranteed portion of selectedSBA loans to a third party and retains the servicing rights, holdingunguaranteed portion ("retained interest"). A portion of the nonguaranteed portion in its portfolio. When the guaranteed portion is sold, the premium received on the sale of SBA loans is recognized as gain on sale of loans at the time of the sale by allocating the carrying amount between the asset sold and the presentretained interest, including servicing assets, based on their relative fair values. The remaining portion of the premium is recorded as a discount on the remaining life of the loan as an adjustment to yield. The retained interest, net of any discount, is included in loans in the accompanying consolidated balance sheets. Servicing assets are amortized in proportion to, and over the period of, the estimated net servicing income or net servicing loss and measured for impairment based on fair value of future cash flowsat each reporting date. The amortization of the servicing assetsrights is analyzed periodically and is adjusted to reflect changes in prepayment rates and other estimates. Serviced loans sold to others is not included in the balance sheets. The unpaid principal balances of loans serviced for others were $32.9 million and $21.0 million at December 31, 2017 and 2016, respectively. Income (losses) and fees collected for servicing are recognized in income.included within Other Loan Fees on the statements of operations, and totaled $172,000, $100,000, and $57,000 for the years ended December 31, 2017, 2016 and 2015, respectively. The servicing asset rightsassets recorded as of December 31, 20162017 and 20152016 are not material. Our philosophy remains to be prudent and focused on the cash flow of the businesses and financial strength of the guarantors.

The Company originates fixed-rate and adjustable-rate loans to individuals and builders to finance the construction of residential dwellings. We also originate construction loans for commercial development projects, including apartment buildings, restaurants, shopping centers and owner-occupied properties used for businesses. Our construction loans generally provide for the payment of interest only during the construction phase which is typically twelve months for residential properties and twelve to eighteen months for commercial properties. At the end of the construction phase, the loan is either converted to a permanent mortgage loan or paid off. Before making a commitment to fund a construction loan, we require an appraisal and an environmental analysis of the property performed by a bank approved independent licensed appraiser and environmental consultant, an inspection of the property before disbursement of funds during the stages of the construction process, and approval from an identified source for the permanent takeout.

The Company offers a full range of residential real estate and consumer loans. These loans consist of residential mortgages, home equity lines of credit, equity loans, personal loans, automobile loans and overdraft protection. We do not originate subprime or negative amortization loans. Each residential mortgage loan is evidenced by a promissory note secured by a mortgage or deed of trust creating a first lien on one-to-four family residential property. Residential real estate properties underlying residential mortgage loans consist of single-family detached units, individual condominium units, two-to-four family dwellings units and townhouses. Our home equity revolving lines of credit come with a floating interest rate tied to the prime rate. Lines of credit are available to
Note 1 - Summary of Significant Accounting Policies (Continued)


qualified applicants in amounts up to $350,000 for up to 15 years. We also offer fixed rate home equity loans in amounts up to $350,000 for a term of up to 15 years. Credit is based on the income and cash flow of the individual borrowers, real estate collateral supporting the mortgage debt and past credit history.

Consumer loans may entail greater risk than residential mortgage loans, particularly in the case of consumer loans that are unsecured or secured by assets that depreciate in value rapidly. In such cases, repossessed collateral for a defaulted consumer loan may not provide an adequate source of repayment for the outstanding loan and the remaining deficiency often does not warrant further substantial collection efforts against the borrower. In addition, consumer loan collections depend on the borrower’s continuing financial stability, and therefore are more likely to be adversely affected by job loss, divorce, illness or personal bankruptcy. Furthermore, the application of various federal and state laws, including bankruptcy and insolvency laws, may limit the amount that can be recovered on such loans.

A loan is considered impaired when it is probable that the Company will be unable to collect the scheduled payments of principal or interest when due according to the contractual terms of the loan agreement. Factors considered by management in determining impairment include payment status, collateral value and the probability of collecting scheduled principal and interest payments when due. Loans that experience insignificant delays and payment shortfalls generally are not classified as impaired. Management determines the significance of payment delays and payment shortfalls on a case-by-case basis, taking into consideration all of the circumstances surrounding the loan and the borrower, including the length of the delay, the reasons for the delay, the borrower’s prior payment record and the amount of the shortfall in relation to the principal and interest owed. Impairment is measured on a loan by loan basis for commercial and industrial, real estate-commercial, real estate-construction, real estate-residential and consumer loans by either the present value of expected future cash flows discounted at the loan’s effective interest rate or the fair value of the collateral if the loan is collateral dependent.


Note 1 – Summary of Significant Accounting Policies (Continued)

An allowance for loan losses is established for an impaired loan if its carrying value exceeds its estimated fair value. The estimated fair values of substantially all of the Company’s impaired loans are measured based on the estimated fair value of the loan’s collateral.

For commercial loans secured by real estate, estimated fair values are determined primarily through third-party appraisals. When a real estate secured loan becomes impaired, a decision is made regarding whether an updated certified appraisal of the real estate is necessary. This decision is based on various considerations, including the age of the most recent appraisal, the loan-to-value ratio based on the original appraisal and the condition of the property. Appraised values are discounted to arrive at the estimated selling price of the collateral, which is considered to be the estimated fair value. The discounts also include estimated costs to sell the property.

For commercial loans secured by non-real estate collateral, such as accounts receivable, inventory and equipment, estimated fair values are determined based on the borrower’s financial statements, inventory reports, accounts receivable aging or equipment appraisals or invoices. Indications of value from these sources are generally discounted based on the age of the financial information or the quality of the assets.

Loans whose terms are modified are classified as troubled debt restructurings (“TDRs”) if the Company grants such borrowers concessions and it is deemed that those borrowers are experiencing financial difficulty. Concessions granted under a TDR generally involve a temporary reduction in interest rate or a modification of a loan’s amortization schedule. Non-accrual TDRs are restored to accrual status if principal and interest payments, under the modified terms, are current for six consecutive months after the modification is in place. Loans classified as TDRs, including those restored to accrual status, are designated as impaired.

The Company’s TDR modifications are made on terms typically up to 12 months in order to aggressively monitor and track performance. The short-term modifications performances are monitored for continued payment performance for an additional period of time after the expiration of the concession. Balance reductions and annualized loss rates are also important metrics that are monitored. The main objective of the modification programs is to reduce the payment burden for the borrower and to deleverage the Company’s exposure.

The allowance calculation methodology includes further segregation of loan classes into risk rating categories. The borrower’s overall financial condition, repayment sources, guarantors and value of collateral, if appropriate, are evaluated annually for commercial loans or when credit deficiencies arise, such as delinquent loan payments, for commercial and consumer loans. Credit quality risk ratings include regulatory classifications of special mention, substandard, doubtful and loss. Loans classified special mention have potential weaknesses that deserve
Note 1 - Summary of Significant Accounting Policies (Continued)


management’s close attention. If uncorrected, the potential weaknesses may result in deterioration of the repayment prospects. Loans classified substandard have a well-defined weakness or weaknesses that jeopardize the liquidation of the debt. They include loans that are inadequately protected by the current sound net worth and paying capacity of the obligor or of the collateral pledged, if any. Loans classified doubtful have all the weaknesses inherent in loans classified substandard with the added characteristics that collection or liquidation in full, on the basis of current conditions and facts, is highly improbable. Loans classified as a loss are considered uncollectable and are charged to the allowance for loan losses. Loans not classified are rated pass.


In addition, federal and state regulatory agencies, as an integral part of their examination process, periodically review the Company’s allowance for loan losses and may require the Company to recognize additions to the allowance based on their judgments about information available to them at the time of their examination, which may not be currently available to management. Based on management’s comprehensive analysis of the loan portfolio, management believes the current level of the allowance for loan losses is adequate.


K.

K.Transfers of Financial Assets

Transfers of financial assets, including sale of loans and loan participation sales, are accounted for as sales, when control over the assets has been surrendered. Control over transferred assets is deemed to be surrendered when (1) the assets have been isolated from the Company, (2) the transferee obtains the right (free of conditions that constrain it from taking advantage of that right) to pledge or exchange the transferred assets and (3) the Company does not maintain effective control over the transferred assets through an agreement to repurchase them before their maturity.


Note 1 – Summary of Significant Accounting Policies (Continued)

L.

L.Other Real Estate Owned

Other Real Estate Owned (“OREO”) includes real estate acquired through foreclosure or by deed in lieu of foreclosure. OREO is initially recorded at fair value less cost to sell at the date of foreclosure, establishing a new cost basis. Any write-downs based on fair value less costs to sell at the date of foreclosure are charged to the allowance for loan losses. If at the time of foreclosure, the fair value less costs to sell is greater than the loan balance, the resulting gain is recognized at the time of foreclosure unless there has been a prior charge-off, in which case a recovery to the allowance for loan losses is recorded. Subsequent to foreclosure, valuations are periodically performed by management and the assets are carried at the lower of carrying amount or fair value less cost to sell. Operating results from real estate owned, including rental income, operating expenses, and gains and losses realized from the sales of real estate owned, are recorded as incurred.


M.

M.Bank Owned Life Insurance

The Company invests in bank owned life insurance (“BOLI”) as a source of funding for employee benefit expenses. BOLI involves the purchasing of life insurance by the Company’s wholly-owned trust on a chosen group of officers and directors. The Company is the owner and beneficiary of the policies. This life insurance investment is carried at the cash surrender value of the underlying policies. Income generated from the increase in cash surrender value of the policies is included in non-interest income on the statements of operations.

N.

N.Bank Premises and Equipment


Premises and equipment are stated at cost less accumulated depreciation. Depreciation is charged to operations on a straight-line basis over the estimated useful lives of the respective assets. Leasehold improvements are amortized over the shorter of their estimated life or the lease term.

O.

O.Advertising

The Company expenses advertising costs as incurred.

P.

P.Income Taxes

The Tax Cuts and Jobs Act (the "Tax Act") was signed into law on December 22, 2017. As a result of the Tax Act, the Company recorded a non-cash charge to income tax expense of approximately $1.8 million in the fourth quarter of 2017 due to the re-measurement of deferred tax assets and liabilities resulting from the reduction in the Federal corporate income tax rate from 34% to 21%, effective January 1, 2018.

Note 1 - Summary of Significant Accounting Policies (Continued)


Deferred income taxes are provided on the liability method whereby deferred tax assets are recognized for deductible temporary differences and deferred tax liabilities are recognized for taxable temporary differences. Temporary differences are the differences between the reported amounts of assets and liabilities and their tax basis. Deferred tax assets are reduced by a valuation allowance when, in the opinion of management, it is more likely than not that some portion of the deferred tax assets will not be realized. Deferred tax assets and liabilities are adjusted for the effects of changes in tax laws and rates on the date of enactment. The Company and its subsidiary file a consolidated Federal income tax return.

The Company analyzes each tax position taken in its tax returns and those positions not taken and determines the likelihood that the position will be realized. Only tax positions that are “more likely than not” to be realized can be recognized in the Company’s financial statements. For tax positions that do not meet this recognition threshold, the Company will record an unrecognized tax benefit for the difference between the position taken on the tax return and the amount recognized in the financial statements.

The Company does not have any material unrecognized tax benefits or accrued interest or penalties at December 31, 20162017 or 20152016 or during the years then ended. No unrecognized tax benefits are expected to arise within the next twelve months. The Company’s policy is to account for interest as a component of interest expense and penalties as a component of other expenses. The Company and its subsidiaries are subject to U.S. Federal income tax as well as income tax of the State of New Jersey. The Company is no longer subject to examination by taxing authorities for the years before January 1, 2013.

Q.

Q.Off-Balance Sheet Financial Instruments

In the ordinary course of business, the Company has entered into off-balance sheet financial instruments consisting of commitments to extend credit and letters of credit. Such financial instruments are recorded in the balance sheet when they are funded.

R.

R.Earnings per Common Share

On January 19, 2017, the Company declared a 5% stock dividend on common stock outstanding payable February 28, 2017 to shareholders of record as of February 9, 2017. All share and per share information in the financial statements have been adjusted retroactively for the effect of the stock dividend.


Note 1 – Summary of Significant Accounting Policies (Continued)

Earnings per common share are calculated on the basis of the weighted average number of common shares outstanding during the year. Basic earnings per common share excludes dilution and is calculated by dividing net income available to common shareholders by the weighted average common shares outstanding excluding potential common shares. Diluted earnings per common share takes into account the potential dilution thatcouldthat could occur if potential common shares had been issued relating to outstanding stock options and restricted stock awards. Potential common shares relate to outstanding stock options, warrants and restricted stock awards, and are determined using the treasury stock method.

S.

S.Stock-Based Compensation

Stock compensation accounting guidance requires that the compensation cost relating to share-based payment transactions be recognized in financial statements. That cost will be measured based on the grant date fair value of the equity or liability instruments issued. The stock compensation accounting guidance covers a wide range of share-based compensation arrangements including stock options, restricted share plans, performance-based awards, share appreciation rights, and employee share purchase plans.

The stock compensation accounting guidance requires that compensation cost for all stock awards be calculated and recognized over the employees’ service periods, generally defined as the vesting period. For awards with graded-vesting, compensation cost is recognized on a straight-line basis over the requisite service period for the entire award. A Black-Scholes model is used to estimate the fair value of stock options, while the market price of the Company’s common stock at the date of grant is used for restricted stock awards.

Note 1 - Summary of Significant Accounting Policies (Continued)


T.

T.Correction of an Immaterial Error on the Consolidated Statement of Cash Flows

The

For the year ended December 31, 2015, the Company identified an immaterial error related to its consolidated statement of cash flows for the origination of SBA loans sold. The Company determined that in the prior period reported, these amounts were improperly reflected in cash flow from investing activities instead of in cash flow from operating activities. The Company reviewed the impact of this error on the prior period and determined that the error was not material to the prior period consolidated financial statements. The Company has corrected the consolidated statement of cash flows for the year ended December 31, 2015 by presenting these amounts within operating activities as opposed to within the investing activities. The impact of the error decreased net cash provided by operating activities by $6.4 million and increased the Company’s cash flows from investing activities by an equivalent amount for the year ended December 31, 2015.


U.

U.Goodwill and Other Intangible Assets

The Company’s goodwill was recognized in connection with the acquisition of the Town Bank in April 2006. Accounting principles generally accepted in the United States of America require that goodwill be tested for impairment annually or more frequently if impairment indicators arise utilizing a two-step methodology. Step one requiresHowever, a qualitative factor test can be performed to determine whether it is necessary to perform the Company to determinetwo-step quantitative impairment test. If this qualitative test determines it is not likely (less than 50% probability) the fair value of the reporting unit is less than book value, then the Company does not have to perform a step one quantitative test and compare itgoodwill can be considered not impaired. The Company reviewed the requirements of ASU 350-20 and examples of qualitative assessments to determine whether the weight of evidence indicates greater than 50% likelihood exists that the carrying value, including goodwill, of such reporting unit. The reporting unit was determined to be our community banking operations, which is our only operating segment. If the fair value of the reporting unit exceeds the carrying value, goodwill is not impaired. If the carrying value exceedsits fair value, there is an indicationvalue. The nine qualitative assessments used are macroeconomic factors, banking industry conditions, banking industry merger and acquisition trends, bank historical performance, parent stock price, expected bank performance, change of impairmentcontrol premium (parent), change of control premium (peer), and the second step is performed to determine the amount of impairment, if any. The second step compares the fair value of the reporting unit to the aggregate fair values of its individual assets, liabilities and identified intangibles.

other factors.

During the third quarter of 2016, the Company prospectively changed its annual goodwill impairment testing date from September 30, 2016 to August 31, 2016. The voluntary change provides additional time for the completion of the annual goodwill impairment testing prior to the end of the quarter. This change in accounting principle does not delay, accelerate, or avoid an impairment loss, nor does the change have a cumulative effective on pre-tax income, net income or loss, retained earnings, or net assets. This change was applied prospectively beginning on August 31, 2016. Retrospective application to prior periods did not occur, as it is impracticable to objectively determine the assumptions that would have been used in those earlier periods to estimate fair value.

The Company performed its annual qualitative factor goodwill impairment analysis asoftest as of August 31, 2016.2017. Based on the results of the step one goodwill impairment analysis, the Company determined that there was no impairment on the current goodwill balance. See Note 5 for additional details.


V.Segment Reporting
 

Note 1 – Summary of Significant Accounting Policies (Continued)

V.

Segment Reporting

The Company acts as an independent community financial services provider, and offers traditional banking and related financial services to individual, business and government customers. Through its branch, automated teller machine networks, and internet banking services, the Company offers a full array of commercial and retail financial services, including time, savings and demand deposits; the making of commercial, consumer and mortgage loans; and the providing of other financial services. Management does not separately allocate expenses, including the cost of funding loan demand, between the commercial, retail, mortgage banking and consumer banking operations of the Company. Accordingly, all significant operating decisions are based upon analysis of the Bank as one segment or unit.

W.

W.Subsequent Events

The Company has evaluated events and transactions occurring subsequent to the balance sheet date of December 31, 20162017 for items that should potentially be recognized or disclosed in these financial statements.

Note 1 - Summary of Significant Accounting Policies (Continued)


X.

X.Recent Accounting Pronouncements


ASU 2014-09: In May 2014, the Financial Accounting Standards Board (“FASB”("FASB") issued ASU 2014-09,Revenue from Contracts with Customers. (Topic 606), superseding the revenue recognition requirements in ASC 605. This ASU establishes a comprehensiverequires an entity to recognize revenue recognition standard for virtually all industries under U.S. GAAP, including those that previously followed industry-specific guidance such as real estate, construction and software industries. The revenue standard’s core principle is built on the contract between a vendor and a customer for the provisiontransfer of promised goods and services. It attemptsor services to depict the exchange of rights and obligations between the partiescustomers in the pattern of revenue recognition based onan amount that reflects the consideration to which the vendor is entitled.entity expects to be entitled in exchange for those goods or services. The amendment includes a five-step process to assist an entity in achieving the main principle(s) of revenue recognition under ASC 605. In March 2016, the FASB also issued ASU 2016-08, an amendment to the guidance in this ASU for public companies2014-09, which reframed the structure of the indicators of when an entity is acting as an agent and focused on evidence that an entity is acting as the principal or agent in a revenue transaction. ASU 2016-08 also eliminated two of the indicators (the entity’s consideration is in the form of a commission, and the entity is not exposed to credit risk) in making that determination. This amendment also clarifies that each indicator may be more or less relevant to the assessment depending on the terms and conditions of the contract. In May 2016, the FASB issued ASU 2016-12, an amendment to ASU 2014-09, which provided practical expedients related to disclosures of remaining performance obligations, as well as other amendments to guidance on transition, collectability, non-cash consideration and presentation of sales and other similar taxes. The amendments, collectively, should be applied retrospectively to each prior reporting period presented or as a cumulative effect adjustment as of the date of adoption (modified retrospective approach).

Because the ASU does not apply to revenue associated with financial instruments (including loans and securities), the Company concluded that the new guidance did not have a material impact on the elements of its consolidated statements of operations most closely associated with financial instruments (such as interest income, interest expense and securities gains). This ASU was effective for the annual periods beginning after December 15, 2016, including interim periods therein. In August 2015,Company on January 1, 2018. The Company completed its identification of all revenue streams included in its financial statements and has identified its deposit- related fees, service charges, debit and interchange income to be within the FASB approved a one-year delayscope of the effective datestandard. The Company has also completed its review of the related contracts and its evaluation of certain costs related to these revenue streams to determine whether such costs should be presented as expenses or contra-revenue (i.e., gross vs. net). The Company's overall assessment indicates that adoption of this standard. The deferral would require public entities to applyASU will not materially change its current method and timing of recognizing revenue for the standard for annual reporting periods beginning after December 15, 2017. Public companies would be permitted to elect to early adopt for annual reporting periods beginning after December 15, 2016.identified revenue streams. The Company, however, is still in the process of reviewing itsdeveloping additional quantitative and qualitative disclosures that are required upon the adoption of the new revenue streamsrecognition standard. The Company adopted this ASU on January 1, 2018, on a modified retrospective approach. The adoption of this ASU, as discussed above, did not have a significant impact to evaluate the impact that this guidance will have on itsCompany's financial condition, results of operations and consolidated financial statements.

ASU 2016-01: In January 2016, the FASB issued ASU 2016-01,Recognition and Measurement of Financial Assets and Financial Liabilities. In February 2018, the FASB issued ASU 2018-03, Technical Corrections and Improvements to Financial Instruments -- Overall (Subtopic 825-10): Recognition and Measurement of Financial Assets and Liabilities, that clarifies the guidance in ASU 2016-01. ASU 2016-01 requires equity investments to be measured at fair value with changes in fair value recognized in net income; provides for a practicability exception election for equity investments without readily determinable fair values; simplifies the impairment assessment of equity investments without readily determinable fair values by requiring a qualitative assessment to identify impairment; eliminates the requirement for nonpublic business entities to disclose the method(s) and significant assumptions used to estimate the fair value that is required to be disclosed for financial instruments measured at amortized cost on the balance sheet; requires public business entities to use the exit price notion when measuring the fair value of financial instruments for disclosure purposes; requires an entity to present separately in other comprehensive income the portion of the total change in the fair value of a liability resulting from a change in the instrument-specific credit risk when the entity has elected to measure the liability at fair value in accordance with the fair value option for financial instruments; requires separate presentation of financial assets and financial liabilities by measurement category and form of financial assets on the balance sheet or the accompanying notes to the financial statements and clarifies that an entity should evaluate the need for a valuation allowance on a deferred tax asset related to available-for-sale securities in combination with the entity’s other deferred tax assets. ASU 2016-01 is effective for financial statements issued for fiscal years beginning after December 15, 2017, and interim periods within those fiscal years. The Company is currently evaluatingadopted this ASU effective January 1, 2018 and the impact that ASU 2016-01 will haveis not material on its statement ofthe financial position or financial statement disclosures.statements.

ASU 2016-02: In February 2016, the FASB issued ASU No. 2016-02,Leases. From the lessee’s perspective, the new standard establishes a right-of-use (ROU) model that requires a lessee to record a ROU asset and a lease liability on the balance sheet for all leases with terms longer than 12 months. Leases will be classified as either finance or operating, with classification affecting the pattern of expense recognition in the income statement for
Note 1 - Summary of Significant Accounting Policies (Continued)


a lessee. From the lessor’s perspective, the new standard requires a lessor to classify leases as either sales-type, finance or operating. A lease will be treated as a sale if it transfers all of the risks and rewards, as well as control of the underlying asset, to the lessee. If risks and rewards are conveyed without the transfer of control, the lease is treated as a financing. If the lessor doesn’t convey risks and rewards or control, an operating lease results. The new standard is effective for fiscal years beginning after December 15, 2018, including interim periods within those fiscal years. A modified retrospective transition approach is required for lessees for capital and operating leases existing at or entered into after, the beginning of the earliest comparative period presented in the financial statements, with certain practical expedients available.


Note 1 – Summary of Significant Accounting Policies (Continued)

A modified retrospective transition approach is required for lessors for sales-type, direct financing, and operating leases existing at, or entered into after, the beginning of the earliest comparative period presented in the financial statements, with certain practical expedients available. The Company has determined that the provisions of ASU 2016-02 will result in an increase in assets to recognize the present value of the lease obligations with a corresponding increase in liabilities, however, the Company does not expect this to have a material impact on its financial position, results of operations or cash flows.


ASU 2016-09:2016-09: In March 2016, the FASB issued ASU No. 2016-09,Compensation - Stock Compensation (Topic 718): Improvements to Employee Share-Based Payment Accounting.This ASUintroduces targeted amendments intended. The objective of the Update is to simplify the accounting for stock compensation. Specifically,share-based payment transactions, including the ASU requiresincome tax consequences, classification of awards as either equity or liabilities, and classification on the statement of cash flows. Under the Update, all excess tax benefits and tax deficiencies (including tax benefits of dividends on share-based payment awards) toshould be recognized as income tax expense or benefit in the income statement. The tax effects of exercised or vested awards should be treated as discrete items in the reporting period in which they occur. An entity also should recognize excess tax benefits and assess the need for a valuation allowance, regardless of whether the benefit reduces taxes payable in the current period. That is, off balance sheetAn entity can make an entity-wide accounting policy election to either estimate the number of awards that are expected to vest (current accounting), which the Company has elected, or account for net operating losses stemming fromforfeitures when they occur. Within the Cash Flow Statement, excess tax benefits would no longer be required and instead such net operating losses would be recognized when they arise. Existing net operating losses that are currently tracked off balance sheet would be recognized, net of a valuation allowance if required, through an adjustment to opening retained earnings in the period of adoption. Entities will no longer need to maintain and track an “APIC pool.” The ASU also requires excess tax benefits toshould be classified along with other income tax cash flows as an operating activity, in the statement of cash flows. In addition, the ASU elevates the statutory tax withholding threshold to qualify for equity classification up to the maximum statutory tax rates in the applicable jurisdiction(s). The ASU also clarifies thatand cash paid by an employer when directly withholding shares for tax withholdingtax-withholding purposes should be classified as a financing activity. The ASU provides an optional accounting policy election (with limited exceptions), to be applied on an entity-wide basis, to either estimate the number of awards that are expected to vest (consistent with existing U.S. GAAP) or account for forfeitures when they occur. Further, the ASU provides two accounting alternatives to nonpublic entities: A nonpublic entity can make an accounting policy election to apply a practical expedient to estimate the expected term for all awards with performance or service conditions that meet certain conditions. Also a nonpublic entity can make a one-time accounting policy election to switch from measuring all liability-classified awards at fair value to intrinsic value.The amendments arein this Update were effective for public business entities for annual periods beginning after December 15, 2016, and interim periods within those annual periods. The Company has evaluated the provisions ofadopted this ASU 2016-09 to determine the potential impact of the new standard and has determined that it is not expected to have a material impact on its financial position, results of operations or cash flows.January 1, 2017, resulting in an $192,000 decrease in income tax expense in 2017.

ASU 2016-13: In SeptemberJune 2016, the FASB issued ASU 2016-13,Financial Instruments—Credit Losses (Topic 326). This ASU requires entities to measure all expected credit losses for financial assets held at the reporting date based on historical experience, current conditions, and reasonable and supportable forecasts. Entities will now use forward-looking information to better form their credit loss estimates. The ASU also requires enhanced disclosures to help financial statement users better understand significant estimates and judgments used in estimating credit losses, as well as the credit quality and underwriting standards of an entity’s portfolio. For public entities that are SEC filers, this ASU is effective for fiscal years, and interim periods within those fiscal years, beginning after December 15, 2019. For public entities that are not SEC filers, this ASU is effective for fiscal years, and interim periods within those fiscal years, beginning after December 15, 2020. For non-public entities, this ASU is effective for fiscal years beginning after December 15, 2020, and for interim periods within fiscal years beginning after December 15, 2021. Early application will be permitted for all entities for fiscal years, and interim periods within those fiscal years, beginning after December 15, 2018. While the Company is currently evaluating the provisions of ASU 2016-13 to determine the potential impact the new standard will have on its consolidated financial statements, it has taken steps to prepare for the implementation when it becomes effective, such as forming an internal task force, selecting an outside vendor, gathering pertinent data, consulting with outside professionals and evaluating its current IT systems.running quarterly update reports to evaluate output.


ASU 2016-15: In August 2016, the FASB issued ASU 2016-15,Statement of Cash Flows (Topic 230): Classification of Certain Cash Receipts and Cash Payments. ASU 2016-15 addresses changes to reduce the presentation diversity of certain cash receipts and cash payments in the statement of cash flows, including debt prepayment or extinguishment costs, settlement of certain debt instruments, contingent consideration payments made after a business combination, proceeds from the settlement of insurance claims, and distributions received from equity method investees. The guidance becomes effective for fiscal years beginning after December 15, 2017, including interim periods within those fiscal years, with early adoption permitted. An entity that elects early adoption must adopt all of the amendments in the same period. The new standard will be applied retrospectively, but may be applied prospectively if retrospective application would be impracticable. The Company is currently evaluating the new guidanceadopted this ASU and has not determined the impact this standard may haveis not material on its consolidated statementthe financial statements.
Note 1 - Summary of cash flows.

Significant Accounting Policies (Continued)


ASU 2016-18: In November 2016, the FASB issued ASU 2016-18,Statement of Cash Flows (Topic 230): Restricted Cash. ASU 2016-18 was issued to address divergence in the way restricted cash is classified and presented. The amendments in the update require that a statement of cash flows explain the change during a reporting period in the total of cash, cash equivalents, and amounts generally described as restricted cash and restricted cash equivalents. The amendments in this update apply to entitiesthat have restricted cash or restricted cash equivalents and are required to present a statement of cash flows under Topic 230. The amendment says that transfers between cash, cash equivalents, and amounts generally described as restricted cash or restricted cash equivalents are not part of the entity's operating, investing, and financing activities. For public business entities, ASU 2016-18 is effective for fiscal years beginning after December 15, 2017, and interim periods within those fiscal years. The Company is currently evaluatingadopted this ASU and the impact ofis not material on the adoptions of ASU 2016-18 on its consolidated financial statements.


Note 1 – Summary of Significant Accounting Policies (Continued)

ASU 2017-04: In January 2017, the FASB issued ASU 2017-04,Intangibles—Goodwill and Other (Topic 350). ASU 2017-04 removes Step 2 from the goodwill impairment test. Under the amendments in this update, an entity should perform its annual, or interim, goodwill impairment test by comparing the fair value of a reporting unit with its carrying amount. An entity should recognize an impairment charge for the amount by which the carrying amount exceeds the reporting unit’s fair value; however, the loss recognized should not exceed the total amount of goodwill allocated to that reporting unit. Additionally, an entity should consider income tax effects from any tax deductible goodwill on the carrying amount of the reporting unit when measuring the goodwill impairment loss, if applicable. The Board also eliminated the requirements for any reporting unit with a zero or negative carrying amount to perform a qualitative assessment and, if it fails that qualitative test, to perform Step 2 of the goodwill impairment test. Therefore, the same impairment assessment applies to all reporting units. An entity is required to disclose the amount of goodwill allocated to each reporting unit with a zero or negative carrying amount of net assets. An entity still has the option to perform the qualitative assessment for a reporting unit to determine if the quantitative impairment test is necessary. For public entities that are SEC filers, this ASU is effective for its annual, or any goodwill impairment tests in fiscal years, beginning after December 15, 2019. For public entities that are not SEC filers, this ASU is effective for its annual, or any goodwill impairment tests in fiscal years, beginning after December 15, 2020. For non-public entities, this ASU is effective for its annual, or any goodwill impairment tests in fiscal years, beginning after December 15, 2021. Early adoption is permitted for interim or annual goodwill impairment tests performed on testing dates after January 1, 2017. The Company is currently evaluating the new guidance but has determined that this standard should not have a material impact on its consolidated financial statements.


ASU 2017-09: In May 2017, the FASB issued ASU No. 2017-09, “Stock Compensation, Scope of Modification Accounting.” This ASU clarifies when changes to the terms of conditions of a share-based payment award must be accounted for as modifications. Companies will apply the modification accounting guidance if the value, vesting conditions or classification of the award changes. The new guidance should reduce diversity in practice and result in fewer changes to the terms of an award being accounted for as modifications, as the guidance will allow companies to make certain non-substantive changes to awards without accounting for them as modifications. It does not change the accounting for modifications. ASU No. 2017-09 is effective for interim and annual reporting periods beginning after December 15, 2017; early adoption is permitted. ASU No. 2017-09 is not expected to have a material impact on the Company’s consolidated financial statements.

ASU 2018-02: In February 2018, the FASB issued ASU 2018-02, “Income Statement - Reporting Comprehensive Income (Topic 220) - Reclassification of Certain Tax Effects from Accumulated Other Comprehensive Income.” This ASU was issued to address a narrow-scope financial reporting issue that arose as a result of the enactment of the Tax Cuts and Jobs Act (“Tax Reform”) on December 22, 2017. The objective of ASU 2018-02 is to address the tax effects of items within accumulated other comprehensive income (referred to as “stranded tax effects”) that do not reflect the appropriate tax rate enacted in the Tax Reform. As a result, the ASU 2018-02 allows a reclassification from accumulated other comprehensive income to retained earnings for stranded tax effects resulting from the newly enacted federal corporate income tax rate. The amount of the reclassification would be the difference between the historical corporate income tax rate of 35 percent and the newly enacted corporate income tax rate of 21 percent. ASU 2018-02 is effective for fiscal years beginning after December 15, 2018, with early adoption permitted, including adoption in an interim period. The amendments in this ASU may be applied retrospectively to each period in which the effect of the change in the U.S. Federal corporate income tax rate in the Tax Reform is recognized. The Company has adopted ASU 2018-02 effective January 1, 2018, and the impact will amount to approximately $60,000 as a reclassification from accumulated other comprehensive loss to retained earnings.

Note 2 - Securities


Note 2 – Securities

The amortized cost, gross unrealized gains and losses, and fair values of the Company’s securities are summarized as follows:

December 31, 2016:


Gross


Gross


Amortized

Cost


Unrealized

Gains


Unrealized

Losses


Fair

Value


(In Thousands)


Securities available for sale:


U.S. Government agency securities

 $8,474  $1  $(62

)

 $8,413 

Municipal securities

  501   2   -   503 

U.S. Government-sponsored enterprises (“GSE”) – residentialmortgage-backed securities

  11,455   2   (202

)

  11,255 

U.S. Government collateralized residential mortgage obligations

  9,731   6   (200

)

  9,537 

Corporate debt securities, primarily financial institutions

  2,493   7   (141

)

  2,359 
                 
Sub-total  32,654   18   (605

)

  32,067 
                 

Community Reinvestment Act (“CRA”) mutual fund

  2,451   -   (54

)

  2,397 
                 
Total securities available for sale $35,105  $18  $(659

)

 $34,464 
                 

Securities held to maturity:


Municipal securities

 $47,806  $224  $(528

)

 $47,502 

GSE – residential mortgage-backed securities

  5,414   6   (65

)

  5,355 

U.S. Government collateralized residential mortgage obligations

  2,801   1   (29

)

  2,773 

Corporate debt securities, primarily financial institutions

  1,822   -   (168

)

  1,654 
                 
Total securities held to maturity $57,843  $231  $(790

)

 $57,284 

December 31, 2015:


Gross


Gross


Amortized

Cost


Unrealized

Gains


Unrealized

Losses


Fair

Value


(In Thousands)


Securities available for sale:


U.S. Government agency securities

 $1,241  $-  $(3

)

 $1,238 

Municipal securities

  508   9   -   517 

GSE – residential mortgage-backed securities

  14,646   5   (202

)

  14,449 

U.S. Government collateralized residential mortgage obligations

  12,900   13   (286

)

  12,627 

Corporate debt securities, primarily financial institutions

  2,492   -   (175

)

  2,317 
                 
Sub-total  31,787   27   (666

)

  31,148 
                 

CRA mutual fund

  2,397   -   (15

)

  2,382 
                 

Total securities available for sale

 $34,184  $27  $(681

)

 $33,530 
                 

Securities held to maturity:


Municipal securities

 $33,956  $824  $(9

)

 $34,771 

GSE – residential mortgage-backed securities

  3,789   9   (44

)

  3,754 

U.S. Government collateralized residential mortgage obligations

  3,602   -   (46

)

  3,556 

Corporate debt securities, primarily financial institutions

  1,820   -   (233

)

  1,587 
                 

Total securities held to maturity

 $43,167  $833  $(332

)

 $43,668 


December 31, 2017       
 
Amortized
Cost
 
Gross Unrealized
Gains
 
Gross Unrealized
Losses
 
Fair
Value
   (In Thousands)  
Securities available for sale:       
U.S. Government agency securities$10,105
 $
 $(48) $10,057
Municipal securities494
 1
 
 495
U.S. Government-sponsored enterprises (“GSE”) – residential mortgage-backed securities8,362
 
 (143) 8,219
U.S. Government collateralized residential mortgage obligations7,672
 1
 (191) 7,482
Corporate debt securities, primarily financial institutions2,494
 9
 (72) 2,431
        
Sub-total29,127
 11
 (454) 28,684
        
Community Reinvestment Act (“CRA”) mutual fund2,503
 
 (55) 2,448
        
Total securities available for sale$31,630
 $11
 $(509) $31,132
        
Securities held to maturity:       
Municipal securities$46,614
 $812
 $(20) $47,406
GSE – residential mortgage-backed securities7,339
 
 (98) 7,241
U.S. Government collateralized residential mortgage obligations2,224
 
 (46) 2,178
Corporate debt securities, primarily financial institutions1,825
 
 (101) 1,724
        
Total securities held to maturity$58,002
 $812
 $(265) $58,549
Note 2 – Securities (Continued)


December 31, 2016       
 
Amortized
Cost
 
Gross Unrealized
Gains
 
Gross Unrealized
Losses
 
Fair
Value
   (In Thousands)  
Securities available for sale:       
U.S. Government agency securities$8,474
 $1
 $(62) $8,413
Municipal securities501
 2
 
 503
GSE – residential mortgage-backed securities11,455
 2
 (202) 11,255
U.S. Government collateralized residential mortgage obligations9,731
 6
 (200) 9,537
Corporate debt securities, primarily financial institutions2,493
 7
 (141) 2,359
        
Sub-total32,654
 18
 (605) 32,067
        
CRA mutual fund2,451
 
 (54) 2,397
        
Total securities available for sale$35,105
 $18
 $(659) $34,464
        
Securities held to maturity:       
Municipal securities$47,806
 $224
 $(528) $47,502
GSE – residential mortgage-backed securities5,414
 6
 (65) 5,355
U.S. Government collateralized residential mortgage obligations2,801
 1
 (29) 2,773
Corporate debt securities, primarily financial institutions1,822
 
 (168) 1,654
        
Total securities held to maturity$57,843
 $231
 $(790) $57,284

The amortized cost and fair value of the Company’s debt securities at December 31, 2016,2017, by contractual maturity, are shown below. Expected maturities will differ from contractual maturities because borrowers may have the right to call or prepay obligations with or without call or prepayment penalties.


Available for Sale


Held to Maturity


Amortized

Cost


Fair

Value


Amortized

Cost


Fair

Value


(In Thousands)


Due in one year or less

 $-  $-  $12,784  $12,797 

Due in one year through five years

  3,286   3,288   3,681   3,754 

Due in five years through ten years

  -   -   5,343   5,383 

Due after ten years

  8,182   7,987   27,820   27,222 
                 
Sub-total  11,468   11,275   49,628   49,156 
                 

GSE – residential mortgage-backed securities

  11,455   11,255   5,414   5,355 

U.S. Government collateralized residential mortgageobligations

  9,731   9,537   2,801   2,773 
                 
Total $32,654  $32,067  $57,843  $57,284 

 Available for Sale Held to Maturity
 
Amortized
Cost
 
Fair
Value
 
Amortized
Cost
 
Fair
Value
 (In Thousands)
Due in one year or less$1,249
 $1,247
 $13,309
 $13,316
Due in one year through five years4,561
 4,553
 2,803
 2,822
Due in five years through ten years
 
 8,273
 8,387
Due after ten years7,283
 7,183
 24,054
 24,605
Sub-total13,093
 12,983
 48,439
 49,130
        
GSE – residential mortgage-backed securities8,362
 8,219
 7,339
 7,241
U.S. Government collateralized residential mortgage obligations7,672
 7,482
 2,224
 2,178
        
Total$29,127
 $28,684
 $58,002
 $58,549
The CompanyhadCompany had no security sales in 2017 as compared to one security sale in 2016 totaling $1.0$1.1 million and recorded a gross realized gain of$72,000 from this sale as compared tonineteensecurities sales in 2015 totaling $24,306,000 and recorded gross realizedgains and lossesgains of $70,000 and $33,000 respectively.$72,000. The sale in 2016 was a municipal bond, which was carried in our held to maturity portfolio. The Company sold this bond out of its held to maturity portfolio due to significant deterioration in the issuer’s creditworthiness.

In 2015, the Company had security sales of $24.3 million and recorded gross realized gains and losses of $70,000 and $33,000, respectively.


Investment securities with a carrying value of $33,088,000and $32,596,000$34,634,000 and $33,088,000 at December 31, 20162017 and 2015,2016, respectively, were pledged as collateral to secure securities sold under agreements to repurchase and public funds as required or permitted by law.

Note 2 – Securities (Continued)


The tables below indicate the length of time individual securities have been in a continuous unrealized loss position at December 31, 20162017 and 2015:


Less than 12 Months


12 Months or More


Total


Fair

Value


Unrealized

Losses


Fair

Value


Unrealized

Losses


Fair

Value


Unrealized

Losses


December 31, 2016:


(In Thousands)


U.S. Government agency securities

 $7,125  $(62

)

 $-  $-  $7,125  $(62

)

Municipal securities

  22,036   (528

)

  -   -   22,036   (528

)

GSE – residential mortgage-backed securities

  9,632   (163

)

  5,949   (104

)

  15,581   (267

)

U.S. Government collateralized residential mortgageobligations

  5,630   (50

)

  4,990   (179

)

  10,620   (229

)

Corporate debt securities, primarily financial institutions

  -   -   3,009   (309

)

  3,009   (309

)

CRA mutual fund

  2,397   (54

)

  -   -   2,397   (54

)


Total temporarily impaired securities

 $46,820  $(857

)

 $13,948  $(592

)

 $60,768  $(1,449

)

2016:


Less than 12 Months


12 Months or More


Total


Fair

Value


Unrealized

Losses


Fair

Value


Unrealized

Losses


Fair

Value


Unrealized

Losses


December 31, 2015:


(In Thousands)


U.S. Government agency securities

 $1,238  $(3

)

 $-  $-  $1,238  $(3

)

Municipal securities

  5,858   (5

)

  498   (4

)

  6,356   (9

)

GSE – residential mortgage-backed securities

  11,946   (151

)

  5,006   (95

)

  16,952   (246

)

U.S. Government collateralized residential mortgageobligations

  8,284   (72

)

  6,861   (260

)

  15,145   (332

)

Corporate debt securities, primarily financialinstitutions

  496   (1

)

  2,907   (407

)

  3,403   (408

)

CRA mutual fund

  2,382   (15

)

  -   -   2,382   (15

)


Total temporarily impaired securities

 $30,204  $(247

)

 $15,272  $(766

)

 $45,476  $(1,013

)

 
 Less than 12 Months 12 Months or More Total
 
Fair
Value
 
Unrealized
Losses
 
Fair
Value
 
Unrealized
Losses
 
Fair
Value
 
Unrealized
Losses
December 31, 2017(In Thousands)
U.S. Government agency securities$8,229
 $(46) $1,766
 $(2) $9,995
 $(48)
Municipal securities14,170
 (20) 
 
 14,170
 (20)
GSE – residential mortgage-backed securities6,302
 (66) 9,123
 (175) 15,425
 (241)
U.S. Government collateralized residential mortgage obligations1,806
 (20) 7,500
 (217) 9,306
 (237)
Corporate debt securities, primarily financial institutions
 
 2,648
 (173) 2,648
 (173)
CRA mutual fund
 
 2,449
 (55) 2,449
 (55)
            
Total temporarily impaired securities$30,507
 $(152) $23,486
 $(622) $53,993
 $(774)
 Less than 12 Months 12 Months or More Total
 
Fair
Value
 
Unrealized
Losses
 
Fair
Value
 
Unrealized
Losses
 
Fair
Value
 
Unrealized
Losses
December 31, 2016(In Thousands)
U.S. Government agency securities$7,125
 $(62) $
 $
 $7,125
 $(62)
Municipal securities22,036
 (528) 
 
 22,036
 (528)
GSE – residential mortgage-backed securities9,632
 (163) 5,949
 (104) 15,581
 (267)
U.S. Government collateralized residential mortgage obligations5,630
 (50) 4,990
 (179) 10,620
 (229)
Corporate debt securities, primarily financial institutions
 
 3,009
 (309) 3,009
 (309)
CRA mutual fund2,397
 (54) 
 
 2,397
 (54)
            
Total temporarily impaired securities$46,820
 $(857) $13,948
 $(592) $60,768
 $(1,449)

Note 2 – Securities (Continued)

The Company had 69securities61 securities in an unrealized loss position at December 31, 2016.2017. In management’s opinion, the unrealized losses in corporate debit,debt, U.S. Government agencies, U.S. Government collateralized residential mortgage obligations, municipals, GSE residential mortgage-backed securities and the CRA mutual fund reflect changes in interest rates subsequent to the acquisition of specific securities. The unrealized loss for corporate debt securities also reflects a widening of spreads due to the liquidity and credit concerns in the financial markets. The Company may, if conditions warrant it, elect to sell debt securities at a loss and redeploy the proceeds into other investments in an effort to improve returns, risk profile and overall portfolio diversification. The Company will recognize any losses when the decision is made. At December 31, 2016,2017, the Company does not intend to sell these debt securities prior to recovery.

Included in corporate debt securities are four individual trust preferred securities issued by large financial institutions with Moody’s ratings from Baa1 to Ba1.Baa1to Baa3. As of December 31, 2016,2017, all of these securities are current with their scheduled interest payments. These single issue securities are from large money center banks. Management concluded that these securities were not other-than-temporarily impaired as of December 31, 2016.2017. These foursecuritiesfour securities have an amortized cost value of $2.8 million and a fair value of $2.52.6 million at December 31, 2016.

2017.

There was no other-than-temporary impairments recognized during 20162017 and 2015. 

2016. 


Note 3 – Loans Receivable and Allowance for Loan Losses

The components of the loan portfolio at December 31, 20162017 and 20152016 are as follows:


2016


2015


(In Thousands)


Commercial and industrial

 $93,697  $100,154 

Real estate – construction

  111,914   104,231 

Real estate – commercial

  460,685   422,665 

Real estate – residential

  59,065   39,524 

Consumer

  28,279   27,136 
         
   753,640   693,710 

Allowance for loan losses

  (9,565

)

  (8,713

)

Net unearned fees

  (548

)

  (560

)


Net Loans

 $743,527  $684,437 

 2017 2016
 (In Thousands)
Commercial and industrial$101,371
 $93,697
Real estate – construction118,094
 111,914
Real estate – commercial537,733
 460,685
Real estate – residential64,238
 59,065
Consumer30,203
 28,279
    
 851,639
 753,640
Allowance for loan losses(10,668) (9,565)
Net unearned fees(765) (548)
    
Net Loans$840,206
 $743,527
The performance and credit quality of the loan portfolio is monitored by analyzing the age of the loans receivable as determined by the length of time a recorded payment is past due. The following table presents the classes of the loan portfolio summarized by the past due status as of December 31, 20162017 and 2015:

December 31, 2016:


Loans


Receivable


(In Thousands)


30-59 Days

Past Due


60-89 Days

Past Due


Greater than

90 Days


Total Past

Due


Current


Total Loans

Receivable


>90 Days and

Accruing


Commercial and industrial

 $-  $-  $119  $119  $93,578  $93,697  $- 

Real estate – construction

  -   -   -   -   111,914   111,914   - 

Real estate – commercial

  154   -   666   820   459,865   460,685   - 

Real estate – residential

  -   -   533   533   58,532   59,065   - 

Consumer

  -   -   -   -   28,279   28,279   - 
                             

Total

 $154  $-  $1,318  $1,472  $752,168  $753,640  $- 
2016:

December 31, 2015:


Loans


Receivable


(In Thousands)


30-59 Days

Past Due


60-89 Days

Past Due


Greater than

90 Days


Total Past

Due


Current


Total Loans

Receivable


>90 Days and

Accruing


Commercial and industrial

 $107  $-  $31  $138  $100,016  $100,154  $- 

Real estate – construction

  -   150   -   150   104,081   104,231   - 

Real estate – commercial

  112   -   2,075   2,187   420,478   422,665   - 

Real estate – residential

  -   -   796   796   38,728   39,524   - 

Consumer

  -   -   -   -   27,136   27,136   - 
                             

Total

 $219  $150  $2,902  $3,271  $690,439  $693,710  $- 

 
December 31, 2017             
(In Thousands)
30-59 Days
Past Due
 
60-89 Days
Past Due
 
Greater than
90 Days
 
Total Past
Due
 Current 
Total Loans
Receivable
 
Loans Receivable>90 Days and
Accruing
Commercial and industrial$224
 $
 $790
 $1,014
 $100,357
 $101,371
 $
Real estate – construction
 
 150
 150
 117,944
 118,094
 
Real estate – commercial146
 150
 219
 515
 537,218
 537,733
 
Real estate – residential290
 
 717
 1,007
 63,231
 64,238
 
Consumer92
 
 194
 286
 29,917
 30,203
 
              
Total$752
 $150
 $2,070
 $2,972
 $848,667
 $851,639

$
December 31, 2016             
(In Thousands)
30-59 Days
Past Due
 
60-89 Days
Past Due
 
Greater than
90 Days
 
Total Past
Due
 Current 
Total Loans
Receivable
 
Loans Receivable>90 Days and
Accruing
Commercial and industrial$
 $
 $119
 $119
 $93,578
 $93,697
 $
Real estate – construction


 111,914
 111,914
 
Real estate – commercial154
 
 666
 820
 459,865
 460,685
 
Real estate – residential
 
 533
 533
 58,532
 59,065
 
Consumer


 28,279
 28,279
 
              
Total$154
 $
 $1,318
 $1,472
 $752,168
 $753,640
 $


Note 3 – Loans Receivable and Allowance for Loan Losses (Continued)


The following table presents non-accrual loans by classes of the loan portfolio at December 31, 20162017 and 2015:

2016:
  

2016


2015


(In Thousands)


Commercial and industrial

 $119  $138 

Real estate – construction

  -   - 

Real estate – commercial

  666   2,244 

Real estate – residential

  763   796 

Consumer

  -   - 
         

Total

 $1,548  $3,178 

 2017 2016
 (In Thousands)
Commercial and industrial$790
 $119
Real estate – construction150
 
Real estate – commercial219
 666
Real estate – residential717
 763
Consumer194
 
    
Total$2,070
 $1,548
The following table summarizes information in regards to impaired loans by loan portfolio class as of and for the years ended December 31, 2017, 2016 and 2015:

December 31, 2016:


Recorded

Investment,

Net of

Charge-offs


Unpaid

Principal

Balance


Related

Allowance


Average

Recorded

Investment


Interest

Income

Recognized


(In Thousands)


With no related allowance recorded:


Commercial and industrial

 $3,402  $3,415  $-  $3,575  $174 

Real estate – construction

  3,036   3,036   -   3,073   129 

Real estate – commercial

  1,548   1,577   -   1,618   47 

Real estate – residential

  1,139   1,189   -   1,164   18 

Consumer

  -   -   -   -   - 
                     

With an allowance recorded:


Commercial and industrial

 $498  $498  $2  $507  $15 

Real estate – construction

  -   -   -   -   - 

Real estate – commercial

  -   -   -   -   - 

Real estate – residential

  -   -   -   -   - 

Consumer

  -   -   -   -   - 
                     

Total:


Commercial and industrial

 $3,900  $3,913  $2  $4,082  $189 

Real estate – construction

  3,036   3,036   -   3,073   129 

Real estate – commercial

  1,548   1,577   -   1,618   47 

Real estate – residential

  1,139   1,189   -   1,164   18 

Consumer

  -   -   -   -   - 
                     
Total $9,623  $9,715  $2  $9,937  $383 

 
December 31, 2017 
Recorded
Investment,
Net of
Charge-offs
 
Unpaid
Principal
Balance
 
Related
Allowance
 
Average
Recorded
Investment
 
Interest
Income
Recognized
(In Thousands)          
With no related allowance recorded:          
Commercial and industrial $3,350
 $3,697
 $
 $3,758
 $152
Real estate – construction 3,148
 3,148
 
 3,163
 133
Real estate – commercial 344
 344
 
 411
 6
Real estate – residential 1,086
 1,086
 
 1,105
 18
Consumer 194
 194
 
 194
 1
           
With an allowance recorded:          
Commercial and industrial $
 $
 $
 $
 $
Real estate – construction 


Real estate – commercial 


Real estate – residential 


Consumer 


Total:          
Commercial and industrial $3,350
 $3,697
 $
 $3,758
 $152
Real estate – construction 3,148
 3,148
 
 3,163
 133
Real estate – commercial 344
 344
 
 411
 6
Real estate – residential 1,086
 1,086
 
 1,105
 18
Consumer 194
 194
 
 194
 1
           
Total $8,122
 $8,469
 $
 $8,631
 $310

Note 3 – Loans Receivable and Allowance for Loan Losses (Continued)

December 31, 2015:


Recorded

Investment,

Net of

Charge-offs


Unpaid

Principal

Balance


Related

Allowance


Average

Recorded

Investment


Interest

Income

Recognized


(In Thousands)


With no related allowance recorded:


Commercial and industrial

 $652  $652  $-  $645  $18 

Real estate – construction

  3,855   3,855   -   4,381   186 

Real estate – commercial

  3,267   3,542   -   3,338   48 

Real estate – residential

  1,178   1,178   -   1,183   29 

Consumer

  209   209   -   215   9 
                     

With an allowance recorded:


Commercial and industrial

 $3,305  $3,305  $49  $3,278  $152 

Real estate – construction

  -   -   -   -   - 

Real estate – commercial

  -   -   -   -   - 

Real estate – residential

  -   -   -   -   - 

Consumer

  -   -   -   -   - 
                     

Total:


Commercial and industrial

 $3,957  $3,957  $49  $3,923  $170 

Real estate – construction

  3,855   3,855   -   4,381   186 

Real estate – commercial

  3,267   3,542   -   3,338   48 

Real estate – residential

  1,178   1,178   -   1,183   29 

Consumer

  209   209   -   215   9 
                     
Total $12,466  $12,741  $49  $13,040  $442 


December 31, 2016 
Recorded
Investment,
Net of
Charge-offs
 
Unpaid
Principal
Balance
 
Related
Allowance
 
Average
Recorded
Investment
 
Interest
Income
Recognized
(In Thousands)          
With no related allowance recorded:          
Commercial and industrial $3,402
 $3,415
 $
 $3,575
 $174
Real estate – construction 3,036
 3,036
 
 3,073
 129
Real estate – commercial 1,548
 1,577
 
 1,618
 47
Real estate – residential 1,139
 1,189
 
 1,164
 18
Consumer 


With an allowance recorded:          
Commercial and industrial $498
 $498
 $2
 $507
 $15
Real estate – construction 


Real estate – commercial 


Real estate – residential 


Consumer 


Total:          
Commercial and industrial $3,900
 $3,913
 $2
 $4,082
 $189
Real estate – construction 3,036
 3,036
 
 3,073
 129
Real estate – commercial 1,548
 1,577
 
 1,618
 47
Real estate – residential 1,139
 1,189
 
 1,164
 18
Consumer 


Total $9,623
 $9,715
 $2
 $9,937
 $383

Note 3 – Loans Receivable and Allowance for Loan Losses (Continued)


December 31, 2015Recorded
Investment,
Net of
Charge-offs
 Unpaid
Principal
Balance
 Related
Allowance
 Average
Recorded
Investment
 Interest
Income
Recognized
(In Thousands)         
With no related allowance recorded:         
Commercial and industrial$652
 $652
 $
 $645
 $18
Real estate – construction3,855
 3,855
 
 4,381
 186
Real estate – commercial3,267
 3,542
 
 3,338
 48
Real estate – residential1,178
 1,178
 
 1,183
 29
Consumer209
 209
 
 215
 9
          
With an allowance recorded:         
Commercial and industrial$3,305
 $3,305
 $49
 $3,278
 $152
Real estate – construction


Real estate – commercial


Real estate – residential


Consumer


Total:         
Commercial and industrial$3,957
 $3,957
 $49
 $3,923
 $170
Real estate – construction3,855
 3,855
   4,381
 186
Real estate – commercial3,267
 3,542
   3,338
 48
Real estate – residential1,178
 1,178
   1,183
 29
Consumer209
 209
   215
 9
          
Total$12,466
 $12,741
 $49
 $13,040
 $442

The following table presents the classes of the loan portfolio summarized by the aggregate pass rating and the classified ratings of special mention, substandard and doubtful within the Company’s internal risk rating system as of December 31, 20162017 and 2015:


Pass


Special

Mention


Substandard


Doubtful


Total


(In Thousands)


December 31, 2016:


Commercial and industrial

 $88,776  $1,277  $3,644  $-  $93,697 

Real estate – construction

  108,728   1,894   1,292   -   111,914 

Real estate – commercial

  452,740   6,716   1,229   -   460,685 

Real estate – residential

  58,302   -   763   -   59,065 

Consumer

  27,856   230   193   -   28,279 
                     

Total

 $736,402  $10,117  $7,121  $-  $753,640 
2016:


Pass


Special

Mention


Substandard


Doubtful


Total


(In Thousands)


December 31, 2015:


Commercial and industrial

 $96,038  $159  $3,957  $-  $100,154 

Real estate – construction

  100,376   1,830   2,025   -   104,231 

Real estate – commercial

  414,872   4,667   3,126   -   422,665 

Real estate – residential

  38,631   -   893   -   39,524 

Consumer

  26,891   38   207   -   27,136 
                     

Total

 $676,808  $6,694  $10,208  $-  $693,710 

 
  Pass 
Special
Mention
 Substandard Doubtful Total
  (In Thousands)
December 31, 2017          
           
Commercial and industrial $97,160
 $796
 $3,299
 $116
 $101,371
Real estate – construction 112,353
 4,252
 1,489
 
 118,094
Real estate – commercial 525,951
 5,681
 6,101
 
 537,733
Real estate – residential 63,521
 
 717
 
 64,238
Consumer 29,795
 34
 374
 
 30,203
           
Total $828,780
 $10,763
 $11,980
 $116
 $851,639

Note 3 – Loans Receivable and Allowance for Loan Losses (Continued)


  Pass 
Special
Mention
 Substandard Doubtful Total
  (In Thousands)
December 31, 2016          
           
Commercial and industrial $88,776
 $1,277
 $3,644
 $
 $93,697
Real estate – construction 108,728
 1,894
 1,292
 
 111,914
Real estate – commercial 452,740
 6,716
 1,229
 
 460,685
Real estate – residential 58,302
 
 763
 
 59,065
Consumer 27,856
 230
 193
 
 28,279
           
Total $736,402
 $10,117
 $7,121
 $
 $753,640

The following table presents the change in the allowance for loan losses by classes of loans as of December 31, 2017, 2016 and 2015:

Allowance for Loan Losses


Commercial

and

Industrial


Real Estate -

Construction


Real Estate -

Commercial


Real Estate –

Residential


Consumer


Unallocated


Total


(In Thousands)


Beginning balance,January 1, 2016

 $990  $1,283  $5,599  $304  $242  $295  $8,713 

Charge-offs

  -   -   (444

)

  -   (5

)

  -   (449

)

Recoveries

  12   12   696   -   66   -   786 

Provision

  (158

)

  (19

)

  464   159   (59

)

  128   515 
                             

Ending balance,December 31, 2016

 $844  $1,276  $6,315  $463  $244  $423  $9,565 

Allowance for Loan Losses


Commercial

and

Industrial


Real Estate -

Construction


Real Estate -

Commercial


Real Estate -

Residential


Consumer


Unallocated


Total


(In Thousands)


Beginning balance,January 1, 2015

 $1,044  $1,454  $4,624  $223  $565  $159  $8,069 

Charge-offs

  -   -   -   -   (82

)

  -   (82

)

Recoveries

  12   217   2   -   5   -   236 

Provision

  (66

)

  (388

)

  973   81   (246

)

  136   490 
                             

Ending balance,December 31, 2015

 $990  $1,283  $5,599  $304  $242  $295  $8,713 

 
Allowance for Loan Losses 
Commercial
and
Industrial
 
Real Estate -
Construction
 
Real Estate -
Commercial
 
Real Estate –
Residential
 Consumer Unallocated Total
      (In Thousands)      
Beginning balance, January 1, 2017 $844
 $1,276
 $6,315
 $463
 $244
 $423
 $9,565
Charge-offs (381) 
 
 
 (106) 
 (487)
Recoveries 18
 12
 24
 
 6
 
 60
Provision 449
 101
 986
 39
 30
 (75) 1,530
               
Ending balance, December 31, 2017 $930
 $1,389
 $7,325
 $502
 $174
 $348
 $10,668
Allowance for Loan Losses 
Commercial
and
Industrial
 
Real Estate -
Construction
 
Real Estate -
Commercial
 
Real Estate -
Residential
 Consumer Unallocated Total
      (In Thousands)      
Beginning balance, January 1, 2016 $990
 $1,283
 $5,599
 $304
 $242
 $295
 $8,713
Charge-offs 
 
 (444) 
 (5) 
 (449)
Recoveries 12
 12
 696
 
 66
 
 786
Provision (158) (19) 464
 159
 (59) 128
 515
               
Ending balance, December 31, 2016 $844
 $1,276
 $6,315
 $463
 $244
 $423
 $9,565

Allowance for Loan LossesCommercial
and
Industrial
 Real Estate -
Construction
 Real Estate -
Commercial
 Real Estate -
Residential
 Consumer Unallocated Total
     (In Thousands)      
Beginning balance, January 1, 2015$1,044
 $1,454
 $4,624
 $223
 $565
 $159
 $8,069
Charge-offs


 (82) 
 (82)
Recoveries12
 217
 2
 
 5
 
 236
Provision(66) (388) 973
 81
 (246) 136
 490
              
Ending balance, December 31, 2015$990
 $1,283
 $5,599
 $304
 $242
 $295
 $8,713


Note 3 – Loans Receivable and Allowance for Loan Losses (Continued)


The following table presents the balance in the allowance for loan losses at December 31, 20162017 and 20152016 disaggregated on the basis of the Company’s impairment method by class of loans receivable along with the balance of loans receivable by class disaggregated on the basis of the Company’s impairment methodology:


Allowance for Loan Losses


Loans Receivable


December 31, 2016:


Balance


Balance

Related to

Loans

Individually

Evaluated

for

Impairment


Balance

Related to

Loans

Collectively

Evaluated

for

Impairment


Balance


Balance

Individually

Evaluated for

Impairment


Balance

Collectively

Evaluated for

Impairment


(In Thousands)


Commercial and industrial

 $844  $2  $842  $93,697  $3,900  $89,797 

Real estate – construction

  1,276   -   1,276   111,914   3,036   108,878 

Real estate – commercial

  6,315   -   6,315   460,685   1,548   459,137 

Real estate – residential

  463   -   463   59,065   1,139   57,926 

Consumer

  244   -   244   28,279   -   28,279 

Unallocated

  423   -   423   -   -   - 
                         

Total

 $9,565  $2  $9,563  $753,640  $9,623  $744,017 


Allowance for Loan Losses


Loans Receivable


December 31, 2015:


Balance


Balance

Related to

Loans

Individually

Evaluated

for

Impairment


Balance

Related to

Loans

Collectively

Evaluated

for

Impairment


Balance


Balance

Individually

Evaluated for

Impairment


Balance

Collectively

Evaluated for

Impairment


(In Thousands)


Commercial and industrial

 $990  $49  $941  $100,154  $3,957  $96,197 

Real estate – construction

  1,283   -   1,283   104,231   3,855   100,376 

Real estate – commercial

  5,599   -   5,599   422,665   3,267   419,398 

Real estate – residential

  304   -   304   39,524   1,178   38,346 

Consumer

  242   -   242   27,136   209   26,927 

Unallocated

  295   -   295   -   -   - 
                         

Total

 $8,713  $49  $8,664  $693,710  $12,466  $681,244 

 
 Allowance for Loan Losses Loans Receivable
December 31, 2017Balance 
Balance
Related to
Loans
Individually
Evaluated
for
Impairment
 
Balance
Related to
Loans
Collectively
Evaluated
for
Impairment
 Balance 
Balance
Individually
Evaluated for
Impairment
 
Balance
Collectively
Evaluated for
Impairment
     (In Thousands)    
Commercial and industrial$930
 $
 $930
 $101,371
 $3,350
 $98,021
Real estate – construction1,389
 
 1,389
 118,094
 3,148
 114,946
Real estate – commercial7,325
 
 7,325
 537,733
 344
 537,389
Real estate – residential502
 
 502
 64,238
 1,086
 63,152
Consumer174
 
 174
 30,203
 194
 30,009
Unallocated348
 
 348


Total$10,668
 $
 $10,668
 $851,639
 $8,122
 $843,517
 Allowance for Loan Losses Loans Receivable
December 31, 2016Balance 
Balance
Related to
Loans
Individually
Evaluated
for
Impairment
 
Balance
Related to
Loans
Collectively
Evaluated
for
Impairment
 Balance 
Balance
Individually
Evaluated for
Impairment
 
Balance
Collectively
Evaluated for
Impairment
     (In Thousands)    
Commercial and industrial$844
 $2
 $842
 $93,697
 $3,900
 $89,797
Real estate – construction1,276
 
 1,276
 111,914
 3,036
 108,878
Real estate – commercial6,315
 
 6,315
 460,685
 1,548
 459,137
Real estate – residential463
 
 463
 59,065
 1,139
 57,926
Consumer244
 
 244
 28,279
 
 28,279
Unallocated423
 
 423


Total$9,565
 $2
 $9,563
 $753,640
 $9,623
 $744,017


Note 3 – Loans Receivable and Allowance for Loan Losses (Continued)


The following tables present newly troubled debt restructured loans that occurred during the years ended December 31, 20162017 and 2015:

2016:

 Year Ended December 31, 2017
 Number of
Contracts
 Pre-Modification
Outstanding
Recorded
Investment
 Post-Modification
Outstanding
Recorded
Investment
 (Dollars in Thousands)
Troubled Debt Restructuring:     
Commercial and Industrial3
 $320
 $320
Real Estate - Construction1
 150
 150
 4
 $470
 $470


 Year Ended December 31, 2016
 
Number of
Contracts
 
Pre-Modification
Outstanding
Recorded
Investment
 
Post-Modification
Outstanding
Recorded
Investment
 (Dollars in Thousands)
Troubled Debt Restructuring:     
Commercial and industrial1 $257
 $257


Year Ended December 31, 2015


Number of

Contracts


Pre-Modification

Outstanding

Recorded

Investment


Post-Modification

Outstanding

Recorded

Investment


(Dollars in Thousands)


Troubled Debt Restructuring:


Commercial and industrial

  6  $3,227  $3,227 

As of December 31, 2017, TDRs totaled $7.1 million, including $6.1 million that were current and seven non-accrual loans totaling $1.0 million. As of December 31, 2016, TDRs totaled $8.2million,$8.2 million, including $8.1 million that were current and twonon-accrual loanstwo non-accrual TDRs totaling $157,000. As of December 31, 2015, TDRs totaled $10.8 million, including $9.3 million that were current and three non-accrual loans totaling $1.5 million. During the twelve months ended December 31, 2017, two TDRs in the amount of $726,000 were paid in full compared to the twelve months ended December 31, 2016 during which eight TDRs totaling $2.2 million were paid in full. At December 31, 2017, there were no loans with a specific reserve, while at December 31, 2016, and 2015, a specific reserve of $2,000, and $49,000, respectively, was recorded against one loan relationship classified as TDR.

Our troubled debt restructured loans are generally structured with short-term payment plans. The extent of these plans is generally made on terms up to twelve-month payments and all the loans identified as troubled debt restructured as of December 31, 2016,2017, generally involve a temporary reduction in interest rate or a modification of a loan’s amortization schedule.

There were no financing receivablesloans receivable modified as TDRs and with a payment default occurring within 12 months of the restructure date, and the payment default occurring during the three years ended December 31, 2016 and 2015.

2017.

It is the Company’s policy to classify a TDR that is either 90 days or greater delinquent or that has been placed in a non-accrual status as a subsequently defaulted TDR.


Note 4 –Premises and Equipment

Premises and equipment at December 31, 20162017 and 20152016 are as follows:


Estimated

Useful Lives (years)


2016


2015


(In Thousands)


Land

  Indefinite   $1,250  $1,250 

Buildings

  30    1,413   1,419 

Leasehold improvements

  5-15   4,089   4,005 

Furniture and equipment

  2-7   9,229   8,954 
              
Total premises and equipment       15,981   15,628 
              

Less accumulated depreciation and amortization

       (11,319

)

  (10,545

)

              
Total premises and equipment, net      $4,662  $5,083 

 
Estimated
Useful Lives (years)
 2017 2016
       (In Thousands)
LandIndefinite $1,487
 $1,250
Buildings  30   2,120
 1,413
Leasehold improvements5  15 3,432
 4,089
Furniture and equipment2  7 8,915
 9,229
Construction in progress      1,136
 
          
Total premises and equipment      17,090
 15,981
          
Less accumulated depreciation and amortization      (10,851) (11,319)
          
Total premises and equipment, net      $6,239
 $4,662


During the fourth quarter of 2017, the Company acquired a former bank building in Middletown, NJ., and will be constructing a new branch. This branch is expected to open in the fourth quarter of 2018. As of December 31, 2017, construction in progress represents expenditures the Company has incurred related to the new Middletown Branch in the amount of $1.1 million. The majority of these expenditures relate to the acquisition of the location. The Company anticipates additional costs of approximately $350,000 to complete the branch.


Note 5 – Goodwill and Other Intangible Assets

The Company’s goodwill was recognized in connection with the acquisition of The Town Bank (“Town Bank”) in April 2006. GAAP requires that goodwill be tested for impairment annually or more frequently if impairment indicators arise utilizing a two-step methodology. Step one requiresHowever, a qualitative factor test can be performed to determine whether it is necessary to perform the Company to determinetwo-step quantitative impairment test. If this qualitative test determines it is not likely (less than 50% probability) the fair value of the reporting unit is less than book value, then the Company does not have to perform a step one quantitative test and compare itgoodwill can be considered not impaired. The Company reviewed the requirements of ASU 350-20 and examples of qualitative assessments to determine whether the weight of evidence indicates greater than 50% likelihood exists that the carrying value, including goodwill, of such reporting unit. The reporting unit was determined to be our community banking operations, which is our only operating segment. If the fair value of the reporting unit exceeds the carrying value, goodwill is not impaired. If the carrying value exceedsits fair value, there is an indicationvalue. The nine qualitative assessments used are macroeconomic factors, banking industry conditions, banking industry merger and acquisition trends, bank historical performance, parent stock price, expected bank performance, change of impairmentcontrol premium (parent), change of control premium (peer), and the second step is performed to determine the amount of impairment, if any. The second step compares the fair value of the reporting unit to the aggregate fair values of its individual assets, liabilities and identified intangibles.

other factors.


The Company performed its annual step onequalitative factor goodwill impairment analysistest as of August 31, 2016, and uses the fair value of the reporting unit based on the income approach and market approach. The income approach uses a dividend discount analysis. This approach calculates cash flows based on anticipated financial results assuming a change of control transaction. This change of control assumes that an acquirer will achieve an expected base level of earnings, achieve integration cost savings and incur certain transaction costs (including such items as legal and financial advisors fees, contract cancellations, severance and employment obligations, and other transaction costs). The present value of all excess cash flows generated by the Company (above the minimum tangible capital ratio) plus the present value of a terminal sale value is calculated to arrive at the fair value for the income approach.

The market approach is used to calculate the fair value of a company by calculating median earnings and book value pricing multiples for recent actual acquisitions of companies of similar size and performance and then applying these multiples to our community banking reporting unit. No company or transaction in the analysis is identical to our community banking reporting unit and, accordingly, the results of the analysis are only indicative of comparable value. This technique uses historical data to create a current pricing level and is thus a trailing indicator. Results of the market approach need to be understood in this context, especially in periods of rapid price change and market uncertainty. The Company applied the market valuation approach to our then current stock price adjusted by an appropriate control premium and also to a peer group adjusted by an appropriate control premium.

2017. Based on the results of this analysis, the Company determined that there was, no impairment on the current goodwill balance of $18,109,000 for the year ended December 31, 2017. For the year ended December 31, 2016, the Company performed a step one goodwill impairment analysis. Based on the results of that analysis, the Company determined that goodwill impairment did not exist and therefore a step two test was not required. Accordingly, no goodwill impairment was recorded on the goodwill balance of $18,109,000 for the years ended December 31, 2016 and 2015, respectively.

recorded.

Note 5 – Goodwill and Other Intangible Assets (Continued)

The Company acquired core deposit intangible assets in conjunction with the acquisition of Town Bank. This intangible asset had no carrying value net of accumulated amortization of $2,106,000 as of December 31, 20162017 and had a carrying value of $9,000, net of accumulated amortization of $2,097,000, as of December 31, 2015. Amortization2016. There was no amortization expense related to intangible assets wasfor the year ended December 31, 2017 and $9,000 and $48,000 for the years ended December 31, 2016 and 2015, respectively.

Note 6 – Deposits

The components of deposits at December 31, 20162017 and 20152016 are as follows:


2016


2015


(In Thousands)


Demand, non-interest bearing

 $160,104  $144,627 

Demand, interest bearing, money market and savings

  476,704   445,788 

Time, $250,000 and over

  8,893   7,693 

Time, other

  130,866   110,328 
         
Total deposits $776,567  $708,436 

 2017 2016
 (In Thousands)
Demand, non-interest bearing$167,297
 $160,104
Demand, interest-bearing, money market and savings534,939
 476,704
Time, $250,000 and over14,853
 8,893
Time, other144,468
 130,866
Total deposits$861,557
 $776,567
At December 31, 2016,2017, the scheduled maturities of time deposits are as follows (in thousands):

2017

 $38,415 

2018

  37,902 

2019

  33,694 

2020

  25,402 

2021

  4,346 
     
Total time deposits $139,759 

2018$52,073
201962,297
202036,269
20214,697
20223,985
  
Total time deposits$159,321
Brokered CDs as of December 31, 2017 and 2016 were $40,702,000 and 2015 were $35,622,000, and $37,859,000, respectively. Deposits obtained through the use of deposit listing services that are not brokered deposits as of December 31, 2017 and 2016 were $44,436,000 and 2015 were $47,648,000, and $33,261,000, respectively. The aggregate amounts of demand deposit overdrafts that have been reclassified as loan balances are $993,000$944,000 and $143,000$993,000 as of December 31, 2017 and 2016, and 2015, respectively.


Note 7 – Securities Sold Under Agreements to Repurchase

Securities sold under agreements to repurchase, which are classified as secured borrowings, generally mature within one to four days from the transaction date. Securities sold under agreements to repurchase are reflected as the amount of cash received in connection with the transaction. Securities sold under these agreements are retained under the Company’s control at its safekeeping agent. The Company may be required to provide additional collateral based on the fair value of the underlying securities. Information concerning repurchase agreements for the three years ended December 31, 2016 and 20152017 is as follows:


2016


2015


(Dollars In Thousands)


Repurchase agreements:


Balance at year-end

 $19,915  $19,545 

Average during the year

 $19,309  $22,071 

Maximum month-end balance

 $22,105  $27,916 

Weighted average rate during the year

  0.32

%

  0.31

%

Weighted average rate at December 31

  0.24

%

  0.24

%

 
 2017 2016 2015
 (Dollars In Thousands)
Repurchase agreements:     
Balance at year-end$27,120
 $19,915
 $19,545
Average during the year$22,066
 $19,309
 $22,071
Maximum month-end balance$27,120
 $22,105
 $27,916
Weighted average rate during the year0.30% 0.32% 0.31%
Weighted average rate at December 310.25% 0.24% 0.24%

Note 7 – Securities Sold Under Agreements to Repurchase (Continued)

The Bank enters into Sweep Account Agreements with certain of its deposit account holders for repo sweep arrangements under which funds in excess of a predetermined amount are removed from each such depositor’s account at the end of each banking day, and the Bank’s obligation to restore those funds to the account at the beginning of the following banking day is evidenced by an integrated retail repurchase agreement (a “Repurchase Agreement”) secured by a collateral interest in favor of the depositor in certain government securities held by a third party custodian. The Bank’s obligation to restore the funds under the Repurchase Agreements is accounted for as a collateralized financing arrangement (i.e., secured borrowings), and not as a sale and subsequent repurchase of securities. The obligation to restore the funds to each account is reflected as a liability in the Company's consolidated balance sheets, while the securities underlying the repurchase agreements remain in the respective securities accounts. There is no offsetting or netting of the securities against the Repurchase Agreement obligation.

The following table presents the contractual maturities of the Repurchase Agreements as of December 31, 2017 and 2016, disaggregated by the class of collateral pledged:


Maturity of Repurchase Agreements


(dollars in thousands)


Overnight

and

Continuous


Up to

30 days


30 to 90

days


Over 90

days


Total


December 31, 2016:


Class of Collateral Pledged:


U.S. Government agency securities

 $8,371  $-  $-  $-  $8,371 

GSE – Residential mortgage-backed securities

  9,074   -   -   -   9,074 

U.S. Government collateralized residentialmortgage obligations

  13,895   -   -   -   13,895 

Total

 $31,340  $-  $-  $-  $31,340 

Gross amount of recognized liabilities for repurchaseagreements and securities lending

                 $19,915 

Excess of collateral pledged over recognizedliability

                 $11,425 

 Maturity of Repurchase Agreements
(dollars in thousands)
Overnight
and
Continuous
 
Up to
30 days
 
30 to 90
days
 
Over 90
days
 Total
December 31, 2017         
Class of Collateral Pledged:         
U.S. Government agency securities$9,995
 $
 $
 $
 $9,995
GSE – Residential mortgage-backed securities5,558


 5,558
U.S. Government collateralized residential mortgage obligations13,440


 13,440
Total$28,993
 $
 $
 $
 $28,993
Gross amount of recognized liabilities for repurchase agreements and securities lending 


 $27,120
Excess of collateral pledged over recognized liability 


 $1,873
Note 7 - Securities Sold Under Agreements to Repurchase (Continued)


 Maturity of Repurchase Agreements
(dollars in thousands)Overnight
and
Continuous
 Up to
30 days
 30 to 90
days
 Over 90
days
 Total
December 31, 2016         
Class of Collateral Pledged:         
U.S. Government agency securities$8,371
 $
 $
 $
 $8,371
GSE – Residential mortgage-backed securities9,074


 9,074
U.S. Government collateralized residential mortgage obligations13,895


 13,895
Total$31,340
 $
 $
 $
 $31,340
Gross amount of recognized liabilities for repurchase agreements and securities lending


 $19,915
Excess of collateral pledged over recognized liability


 $11,425

The potential risks associated with the Repurchase Agreements and related pledged collateral, including obligations arising from a decline in the fair value of the pledged collateral, are minimal due to the fact that the Repurchase Agreements pertain to overnight borrowings and therefore, are not subject to fluctuations in fair market value.


Note 8 – FHLB and Other Borrowings

The Bank utilizes an account relationship with Atlantic Community Bankers Bank to borrow funds through its Federal funds borrowing line in an aggregate amount up to $10.0 million. The Bank also has $36.0$29.0 million in unsecured credit facilities with threetwo correspondent banks. These borrowings are priced on a daily basis. The Bank had no borrowings outstanding on these lines.lines at December 31, 2017 or 2016. The Bank also has a remaining borrowing capacity with the FHLB of approximately $48.6$41.4 million based on the current loan collateral pledged of$110.1of $144.4 million at December 31, 2016.

2017.

At December 31, 20162017 and 2015,2016, FHLB and other borrowings consisted of advances from the FHLB, which amounted to $25.3$25.8 million and $26.5$25.3 million, respectively. These advances had a weighted average interest rate of 2.35%1.87% and 2.28%2.35% at December 31, 20162017 and 2015,2016, respectively. These advances are contractually scheduled for repayment as follows (dollars in thousands):


2016


2015


Rate


Original Term

(years)


Maturity

Fixed Rate Note

 $7,500  $7,500   3.97%  10 

November 2017

Fixed Rate Note

  -   1,500   2.41%  6 

August 2016

Fixed Rate Note

  1,500   1,500   2.71%  7 

August 2017

Fixed Rate Note

  2,000   2,000   1.28%  4 

October 2017

Fixed Rate Note

  2,000   2,000   1.65%  5 

October 2018

Fixed Rate Note

  -   2,700   0.60%  1 

January 2016

Fixed Rate Note

  1,000   1,000   0.97%  2 

January 2017

Fixed Rate Note

  1,300   1,300   1.31%  3 

January 2018

Fixed Rate Note

  1,800   1,800   1.59%  4 

January 2019

Fixed Rate Note

  2,700   2,700   1.81%  5 

January 2020

Fixed Rate Note

  2,500   2,500   2.03%  6 

January 2021

Fixed Rate Note

  1,000   -   1.09%  3 

July 2019

Fixed Rate Note

  1,000   -   1.42%  5 

July 2021

Fixed Rate Note

  1,000   -   1.70%  7 

July 2023

                  
Total FHLB borrowings $25,300  $26,500          

 2017 2016 Rate 
Original Term
(years)
 Maturity
Fixed Rate Note$
 $7,500
 3.97% 10 November 2017
Fixed Rate Note
 1,500
 2.71% 7 August 2017
Fixed Rate Note
 2,000
 1.28% 4 October 2017
Fixed Rate Note2,000
 2,000
 1.65% 5 October 2018
Fixed Rate Note
 1,000
 0.97% 2 January 2017
Fixed Rate Note1,300
 1,300
 1.31% 3 January 2018
Fixed Rate Note1,800
 1,800
 1.59% 4 January 2019
Fixed Rate Note2,700
 2,700
 1.81% 5 January 2020
Fixed Rate Note2,500
 2,500
 2.03% 6 January 2021
Fixed Rate Note1,000
 1,000
 1.09% 3 July 2019
Fixed Rate Note1,000
 1,000
 1.42% 5 July 2021
Fixed Rate Note1,000
 1,000
 1.70% 7 July 2023
Fixed Rate Note7,500
 
 2.07% 5 August 2022
Fixed Rate Note5,000
 
 2.16% 4 October 2021
Total FHLB borrowings$25,800
 $25,300


As of December 31, 2017 the FHLB has issued $75.1 million in municipal deposit letters of credit in the name of the Bank naming the NJ Department of Banking and Insurance as beneficiary. This letter of credit will take the place of securities previously pledged to the State of New Jersey for the Bank’s various municipal deposits.


Note 9 – Subordinated Debentures

In December 2015, the Company completed a private placement of $10 million in aggregate principal amount of fixed to floating rate subordinated debentures to certain institutional accredited investors. The subordinated debentures have a maturity date of December 31, 2025 and bear interest, payable quarterly, at the rate of 6.25% per annum until January 1, 2021. On that date, the interest rate will be adjusted to float at an annual rate equal to the three-month LIBOR rate plus 464 basis points (4.64%) until maturity. The debentures include a right of prepayment, without penalty, on or after December 14, 2020 and, in certain limited circumstances, before that date. The indebtedness evidenced by the subordinated debentures, including principal and interest, is unsecured and subordinate and junior in right to payment to general and secured creditors of the Company and depositors and all other creditors of the Bank. The subordinated debentures have been structured to qualify as Tier 2 capital for regulatory purposes. Subordinated debentures totaled $9.9 million at December 31, 2017 and 2016, respectively, which includes $112,000 and $145,000 of remaining unamortized debt issuance costs.costs at December 31, 2017 and 2016, respectively. The debt issuance costs are being amortized over the expected life of the issue. The effective interest rate of the subordinated debentures is 6.67%.

Note 10 – Employee Benefit Plans

Under the 401(k) plan, all employees are eligible to contribute up to 100% of their pay and bonus up to the IRS yearly limit. Annually, the Company matches a percentage of employee contributions. The Company contributed $304,000, $288,000, and $264,000 for the years ended December 31, 2017, 2016 and 2015, respectively. Each year, the Company may, at its discretion, elect to contribute profit sharing amounts into the 401(k) plan. For the three years ended December 31, 2016 and 2015,2017, the Company has not contributed any profit sharing amounts.


Note 10 – Employee Benefit Plans (Continued)

The Company has a non-qualified Supplemental Executive Retirement Plan for certain executive officers that provides for payments upon retirement, death or disability. At December 31, 20162017 and 2015,2016, other liabilities included approximately $1.6$1.9 million and $1.4$1.6 million, respectively, accrued under this plan. For the year ended December 31, 2016, expensesExpenses related to this plan, which are included in the consolidated statements of operations and are recorded in salaries and employee benefits, amounted to $309,000, $204,000 as compared toand $261,000 for the yearyears ended December 31, 2015.

2017, 2016 and 2015, respectively.

On September 7, 2016, the Bank entered into a deferred compensation agreement with the President and CEO, effective September 1, 2016, to provide nonqualified pension benefits. Under the deferred compensation agreement, the President and CEO may elect to defer receipt of up to $100,000 of his base salary to be credited to the deferral account under the agreement. In addition, the Bank may make elective contributions to the deferral account. On September 1, 2016, theThe Bank made an elective contributioncontributions to the deferraldeferred account in the amount of $70,000.$70,000 for the years ended December 31, 2017 and 2016, respectively. The Bank may, at any time, make additional employer contributions to the deferral account. Amounts credited to the President and CEO’s deferral account are adjusted monthly for interest, as described in the agreement. The unfunded liability related to the deferred compensation agreement was $183,000 and $83,000 as of $83,000December 31, 2017 and 2016, respectively, and is recorded in other liabilities in the consolidated balance sheets. For the yearyears ended December 31, 2017 and 2016, expenses related to this plan, which are included in the consolidated statements of operations and are recorded in salaries and employee benefits, amounted to $83,000.

$100,000 and $83,000, respectively.


Note 11 – Income Taxes

As a result of the enactment of the Tax Act on December 22, 2017, which reduced the Federal corporate income tax rate from 34% to 21% beginning in 2018, the Company revalued its net deferred tax asset at December 31, 2017 to reflect the lower corporate income tax rate that would be in effect in future years. As such, the Company reduced its net deferred tax asset by $1.78 million, which was recorded as a non-cash charge to income tax expense in the fourth quarter of 2017.

The components of income tax expense for the years ended December 31, 2017, 2016 and 2015 are as follows:


2016


2015


(In Thousands)


Current

 $4,791  $4,069 

Deferred

  (463

)

  (484

)

         
Income tax expense $4,328  $3,585 

 2017 2016 2015
 (In Thousands)
Current$4,957
 $4,791
 $4,069
Deferred1,061
 (463) (484)
      
Income tax expense$6,018
 $4,328
 $3,585
A reconciliation of the statutory Federal income tax at a rate of 34% to the income tax expense included in the statements of operations is as follows for the years ended December 31, 2017, 2016 and 2015:


2016


2015


Amount


%


Amount


%


(Dollars In Thousands)


Federal income tax expense at statutory rate

 $4,406   34.0

%

 $3,376   34.0

%

Increases (decreases) resulting from:                

Tax exempt interest

  (334

)

  (2.6

)

  (239

)

  (2.4

)

Bank owned life insurance income

  (455

)

  (3.5

)

  (151

)

  (1.5

)

State income taxes, net of federal income tax benefit

  712   5.5   557   5.6 

Other, net

  (1

)

  -   42   0.4 
                 
Income tax expense $4,328   33.4

%

 $3,585   36.1

%

 2017 2016 2015
 Amount % Amount % Amount %
 (Dollars In Thousands)
Federal income tax expense at statutory rate$4,257
 34.0 % $4,406
 34.0 % $3,376
 34.0 %
Increases (decreases) resulting from:


Tax exempt interest(358) (2.9) (334) (2.6) (239) (2.4)
Bank owned life insurance income(185) (1.5) (455) (3.5) (151) (1.5)
State income taxes, net of federal income tax benefit734
 5.9
 712
 5.5
 557
 5.6
Reduction in Federal tax rate1,778
 14.3


Other, net(208) (1.7) (1) 
 42
 0.4
            
Income tax expense$6,018
 48.1 % $4,328
 33.4 % $3,585
 36.1 %
Note 11 - Income Taxes (Continued)


The components of the net deferred tax asset, included in other assets on the Consolidated Balance Sheets, as of December 31, 20162017 and 2015,2016, were as follows:


2016


2015


(In Thousands)


Deferred tax assets:


Allowance for loan losses

 $3,841  $3,501 

Depreciation and amortization

  507   535 

Deferred compensation

  1,291   1,130 

OREO write-downs

  33   7 

Unrealized loss on securities available for sale

  250   256 

Other

  31   10 
         
Total deferred tax assets  5,953   5,439 

Deferred tax liabilities:


Purchase accounting adjustments

  -   (4

)

Other

  (483

)

  (422

)

         
Total deferred tax liabilities  (483

)

  (426

)


Net Deferred Tax Asset

 $5,470  $5,013 

 2017 2016
 (In Thousands)
Deferred tax assets:   
Allowance for loan losses$3,012
 $3,841
Depreciation and amortization415
 507
Deferred compensation1,063
 1,291
OREO write-downs
 33
Unrealized loss on securities available for sale194
 250
Other35
 31
    
Total deferred tax assets4,719
 5,953
Deferred tax liabilities:   
Purchase accounting adjustments
 
Other(366) (483)
    
Total deferred tax liabilities(366) (483)
    
Net Deferred Tax Asset$4,353
 $5,470

Based upon taxes paid and projected future taxable income, Management believes that it is more likely than not that the gross deferred tax asset will be realized.


During 2017, the Company realized $192,000 of tax windfalls due to the adoption of ASU 2016-09. The windfalls were recorded as a reduction to our income tax expense.

The Company is subject to U.S. Federal income tax as well as income tax in various state jurisdictions. The Company is no longer subject to Federal examination for years prior to 2014 and state examination for tax years prior to 2013.


Note 12 – Earnings Per Common Share

The following sets forth the computation of basic and diluted earnings per common share for the three years ended December 31, 2016 and 2015:

2017:
  

Years Ended December 31,

��
  

2016


2015


(In Thousands, Except Per Share Data)


Net income

 $8,631  $6,347 

Preferred stock dividend

  -   (57

)


Income applicable to common shareholders

 $8,631  $6,290 
         

Weighted average common shares outstanding

  8,321   8,304 

Effect of dilutive securities, stock options and restricted stock

  209   203 
         

Weighted average common shares outstanding used to calculatediluted earnings per share

  8,530   8,507 
         

Basic earnings per common share

 $1.04  $0.76 
         

Diluted earnings per common share

 $1.01  $0.74 

 Years Ended December 31,
 2017 2016 2015
 (In Thousands, Except Per Share Data)
      
Net income$6,502
 $8,631
 $6,347
Preferred stock dividend
 
 (57)
      
Income applicable to common shareholders$6,502
 $8,631
 $6,290
      
Weighted average common shares outstanding8,388
 8,321
 8,304
Effect of dilutive securities, stock options and restricted stock270
 209
 203
      
Weighted average common shares outstanding used to calculate diluted earnings per share8,658
 8,530
 8,507
      
Basic earnings per common share$0.78
 $1.04
 $0.76
      
Diluted earnings per common share$0.75
 $1.01
 $0.74
Dilutive securities in the table above exclude common stock options with exercise prices that exceed the average market price of the Company’s common stock during the periods presented. Inclusion of these common stock options would be anti-dilutive to the dilutedearningsdiluted earnings per common share calculation. For 2017, 2016 and 2015, there were no stock options that were anti-dilutive.

Note 13 – Lease Commitments and Total Rental Expense

The Company leases banking facilities under non-cancelable operating lease agreements expiring through 2025. Aggregate rent expense was $1,982,000$2.1 million, $2.0 million, and $1,965,000$2.0 million for the years ended December 31, 2017, 2016 and 2015, respectively.

The approximate future minimum rental commitments under operating leases at December 31, 20162017 are as follows (in thousands):

2017

 $1,564 

2018

  1,474 

2019

  1,395 

2020

  1,169 

2021

  931 

Thereafter

  2,105 
     
Total $8,638 

 
2018$1,478
20191,405
20201,216
2021979
2022547
Thereafter1,846
  
Total$7,471

Note 14 - Stock-Based Compensation


General

On March 20, 2007, the Board of Directors adopted the

The Two River Bancorp 2007 Equity Incentive Plan (the “Plan”), which was approved by the Company’s shareholders at the 2007 annual meeting. This plan provides that the Compensation Committee of the Board of Directors (the “Committee”) may grant to those individuals who are eligible under the terms of the Plan stock options, shares of restricted stock, or such other equity incentive awards as the Committee may determine. As of December 31, 2016,2017, the number of shares of Company common stock remaining and available for future issuance under the Plan is173,011.is 142,219. Shares reserved under the Plan will be issued out of authorized and unissued shares, or treasury shares, or partly out of each, as determined by the Board.
Note 14 – Stock-Based Compensation (Continued)

All share and per share data have been retroactively adjusted to reflect the 5% stock dividend paid on February 28, 2017 to shareholders of record as of February 9, 2017.

Options

From the adoption of the Plan until March 20, 2017, options awarded under the Plan maywere permitted to be either options that qualify as incentive stock options (“ISOs”) under Section 422 of the Internal Revenue Code of 1986, as amended (the “Code”), or options that do not, or cease to, qualify as incentive stock options under the Code (“nonqualified stock options” or “NQSOs”). However after March 20, 2017, only NQSO's may be awarded under the Plan. Awards may be granted under the Plan to directors and employees of the Company, and to consultants and other persons who provide substantial services to the Company.

The exercise price per share purchasable under either an ISO or a NQSO may not be less than the fair market value of a share of stock on the date of grant of the option. The Committee will determine the vesting period and term of each option, provided that no ISO or NQSO may have a term in excess of ten years after the date of grant.

Restricted stock is stock which is subject to certain transfer restrictions and to a risk of forfeiture. The Committee will determine the period over which any restricted stock which is issued under the Plan will vest, and will impose such restrictions on transferability, risk of forfeiture and other restrictions as the Committee may in its discretion determine. Unless restricted by the Committee, a participant granted restricted stock will have all of the rights of a shareholder (except for the aforesaid transfer restrictions and risk of forfeitures), including the right to vote the restricted stock and the right to receive dividends with respect to that stock.

Unless otherwise provided by the Committee in the award document or subject to other applicable restrictions, in the event of a Change in Control (as defined in the Plan) all non-forfeited options and awards carrying a right to exercise that was not previously exercisable and vested will become fully exercisable and vested as of the time of the Change in Control, and all restricted stock and awards subject to risk of forfeiture will become fully vested.

Stock Options

On October 11, 2016,

For the Committee awarded an officer an ISO to purchase an aggregate of 5,250 shares of Company’s common stock. Thesetwelve months ended December 31, 2017, there were no options are scheduled to vest 20% per year over five years beginning October 11, 2017. These options were granted with an exercise price of $11.21 per share as determined in accordance with the Plan.

granted.

Stock-based compensation expense related to the stock option grants was approximately $80,000, $113,000, and $98,000 for the three years ended December 31, 2017, 2016 and 2015, respectively, and is included in salaries and employee benefits on the statement of operations.

Total unrecognized compensation cost related to non-vested options under the Plan was $195,000$110,000 as of December 31, 20162017 and will be recognized over the subsequent weighted average life of 1.62.0 years.


Note 14 – Stock-Based Compensation (Continued)

The following table presents information regarding the Company’s outstanding options:


Number of

Shares


Weighted

Average

Price


Weighted

Average

Remaining

Contractual

Life (years)


Aggregate

Intrinsic

Value


Options outstanding, December 31, 2015

  459,959   $4.91         

Options granted

  5,250    11.21         

Options exercised

  (28,903


  3.60         

Options forfeited

  (3,855)


  7.99         
                  

Options outstanding, December 31, 2016

  432,451   $5.05   3.85  $3,969,726 

Options exercisable, December 31, 2016

  357,476   $4.37   3.88  $3,520,288 
                  

Options price range at December 31, 2016

 $2.87to$11.21             

  
Number of
Shares
 
Weighted
Average
Price
 
Weighted
Average
Remaining
Contractual
Life (years)
 
Aggregate
Intrinsic
Value
         
Options outstanding, December 31, 2016  432,451
  $5.05
    
Options exercised  (68,403)  4.03
    
Options forfeited  (2,541)  7.81
    
           
Options outstanding, December 31, 2017  361,507
  $5.20
 3.82 $4,674,948
Options exercisable, December 31, 2017  317,037
  $4.71
 3.32 $4,254,922
           
Options price range at December 31, 2017 $2.87
to$11.21
  
    
The total intrinsic value of stock options exercised was $911,700, $190,800 and $137,000 during the three years ended December 31, 2017, 2016 and 2015, respectively. Cash received from such exercises was $275,900, $104,100, and $113,000,$113,500 during the three years ended December 31, 2017, 2016 and 2015, respectively. AAn income tax benefit of $153,000 was recognized during the year ended December 31, 2017 relating to the adoption of ASU 2016-09, Compensation - Stock Compensation, Improvements to
Note 14 – Stock-Based Compensation (Continued)

Employee Share-Based Payment Accounting attributable to stock options. There was a $25,000 and $7,000 wastax benefit recognized during the years ended December 31, 2016 and 2015.

2015, respectively.

The following summarizes information about stock options outstanding at December 31, 2016:

2017:
      

Options Outstanding


Range of Exercise Prices


Number

Outstanding at

December 31,

2016


Weighted-

Average

Remaining

Contractual

Life (years)


Weighted-

Average

Exercise

Price


$2.87- $3.65   193,774   2.3  $3.23 
$4.94- $5.23   128,689   5.2   5.02 
$7.06- $8.00   69,458   7.4   7.53 
$8.59- $9.20   35,280   8.1   9.15 
 $11.21     5,250   9.8   11.21 
                 
Total options outstanding   432,451         

  Options Outstanding
Range of Exercise Prices 
Number
Outstanding at
December 31, 2017
 
Weighted-Average Remaining
Contractual Life (years)
 
Weighted- Average
Exercise Price
           
$2.87
  $3.65
 149,383
 1.3 $3.23
$4.94
  $5.23
 109,011
 4.3 5.03
$7.06
  $8.00
 63,885
 6.4 7.53
$8.59
  $11.21
 39,228
 8.2 9.42
           
Total options outstanding 361,507
    
The fair value of each option grant is estimated on the date of grant using the Black-Scholes option-pricing model.

The following assumptions were used to estimate the fair value of the stock options granted on October 11, 2016:


Dividend yield 1.33%
Expected volatility 27.67%
Risk-free interest rate 1.54%
Expected life (in years) 7.5
Weighted average fair value of options granted $3.05

The following assumptions were used to estimate the fair value of the stock options granted on December 15, 2015:

Dividend yield 1.45%
Expected volatility 27.22%
Risk-free interest rate 2.06%
Forfeiture rate 5.00%
Expected life (in years) 7.5
Weighted average fair value of options granted $2.66


Note 14 – Stock-Based Compensation (Continued)

The following assumptions were used to estimate the fair value of the stock options granted on May 11, 2015:

Dividend yield 1.33%
Expected volatility 27.67%
Risk-free interest rate 2.00%
Expected life (in years) 7.5
Weighted average fair value of options granted $2.55


The dividend yield assumption is based on the Company’s history and expectations of cash dividends. The expected volatility is based on historical volatility. The risk-free interest rate is based on the U.S. Treasury yield curve for the expected life of the grants which is based on historical exercise experience.


Restricted Stock

Restricted stock is valued at the market value on the date of grant and expense is evenly attributed to the period in which the restrictions lapse.

Note 14 – Stock-Based Compensation (Continued)

On January 17, 2017, the Company awarded an aggregate 6,553 shares of the Company’s common stock that vest ratably in annual one-fifth increments per year over five years beginning January 17, 2018. On January 23, 2017, the Company awarded an officer 3,465 shares of the Company’s common stock that vest ratably in annual one-fifth increments per year over five years beginning January 23, 2018. On May 25, 2017, the Company awarded an aggregate 11,000 shares of the Company’s common stock that vest ratably in annual one-third increments per year over three years beginning May 25, 2018. On November 16, 2017, the Company awarded an aggregate 1,100 shares of the Company’s common stock that vested immediately. On December 14, 2017, the Company awarded an aggregate 11,215 shares of the Company’s common stock that vest 50% on December 14, 2020, with the remaining 50% vesting in equal increments over the two year period beginning December 14, 2021.

Compensation expense related to the restricted stock was to$199,000, $118,000 and $88,000 for the years ended December 31, 2017, 2016 and 2015, respectively, and is included in salaries and employee benefits on the statement of operations. There was a $39,000 income tax benefit for the year ended December 31, 2017 related to the adoption of ASU 2016-09 attributable to the restricted stock awards. There was no deferred tax benefit recognized during years ended December 31, 2016 and 2015 related to the restricted stock compensation.

or 2015.

Total unrecognized compensation cost related to restricted stock under the Plan was $237,000$601,000 as of December 31, 20162017 and will be recognized over the subsequent weighted average life of 1.43.3 years.

The following table summarizes information about restricted stock for the year ended December 31, 2016:

2017:
  

Number of Shares


Weighted

Average Price


Unvested at December 31, 2015

  24,079  $7.96 

Restricted stock earned

  (6,797

)

  (8.22

)

Granted

  16,800   9.90 
         

Unvested at December 31, 2016

  34,082  $8.90 

 Number of Shares 
Weighted
Average Price
    
Unvested at December 31, 201634,082
 $8.90
Restricted stock earned(18,394) 9.78
Granted33,333
 16.89
    
Unvested at December 31, 201749,021
 $14.01

Other Awards

During the yearyears ended December 31, 2017, 2016, and 2015, the Company granted 1,100, 1,050, and no shares of stock, respectively, to certain other persons who will provide substantial services to the Company. The Company placed no restrictions on these shares. These shares were valued at the market value on the date of grant at $19,950 and $10,390 and were expensed during the second quarter of 2016.

years ended December 31, 2017 and 2016, respectively. There were no such grants awarded in 2015.

Note 15 – Transactions with Executive Officers, Directors and Principal Shareholders

Certain directors and executive officers of Two River Bancorp and its affiliates, including their immediate families and companies in which they are principal owners (more than 10%), are indebted to the Bank. Two River Bancorp relies on such directors and executive officers for the identification of their associates. These loans at December 31, 20162017 were current as to principal and interest payments, and did not involve more than normal risk of collectability. Total extensions of credit to related parties at December 31, 2017 and 2016 and 2015 were $14.4$13.0 million and $15.8$14.4 million, respectively. Of these amounts, loans outstanding to related parties at December 31, 2017 and 2016 and 2015 were $8.8$7.7 million and $10.2$8.8 million, respectively, with the balance representing unused extensions of credit. During 2016,2017, new loans and advances to such related parties totaled $721,000$1.6 million and repayments and other reductions aggregated $2.1$2.7 million. Deposits from certain directors, executive officers and their affiliates at December 31, 2017 and 2016 and 2015 totaled $14.0$12.9 million and $14.8$14.0 million, respectively, plus an additional $3.1$6.1 million and $1.7$3.1 million, respectively, in securities sold under agreements to repurchase.

In 2017 and 2016, the Company did not pay any amounts to any director or his or her affiliates for products or services, except for compensation for board or board committee services. In 2015, the Company paid $1,820 to one director for certain services unrelated to board or board services.

Note 16 – Financial Instruments with Off-Balance Sheet Risk

The Company is a party to financial instruments with off-balance sheet risk in the normal course of business to meet the financing needs of its customers. These financial instruments include commitments to extend credit and letters of credit. Those instruments involve, to varying degrees, elements of credit risk in excess of the amount recognized in the financial statements.

Note 16 - Financial Instruments with Off Balance Sheet Risk (Continued)

The Company’s exposure to credit loss in the event of non-performance by the other party to the financial instrument for commitments to extend credit and letters of credit is represented by the contractual amount of those instruments. The Company uses the same credit policies in making commitments and conditional obligations as it does for on-balance sheet instruments.

Commitments to extend credit are agreements to lend to a customer as long as there is no violation of any condition established in the contract. Since many of the commitments are expected to expire without being drawn upon, the total commitment amounts do not necessarily represent future cash requirements. Commitments generally have fixed expiration dates or other termination clauses and may require payment of a fee. The Company evaluates each customer's credit worthiness on a case-by-case basis. The amount of collateral obtained, if deemed necessary by the Company upon extension of credit, is based on management's credit evaluation. Collateral held varies but may include personal or commercial real estate, accounts receivable, inventory and equipment. The Company had commitments to extend credit, including unused lines of credit, of approximately $203,728,000and $166,262,000$245,759,000 and $203,728,000 at December 31, 2017 and 2016, and 2015, respectively.

Standby letters of credit are conditional commitments issued by the Company to guarantee the financial performance of a customer to a third party. Those guarantees are primarily issued to support contracts entered into by customers. Most guarantees extend for one year. The credit risk involved in issuing letters of credit is essentially the same as that involved in extending loan facilities to customers. The Company defines the fair value of these letters of credit as the fees paid by the customer or similar fees collected on similar instruments. The Company amortizes the fees collected over the life of the instrument. The Company generally obtains collateral, such as real estate or liens on customer assets for these types of commitments. The Company’s potential liability would be reduced by any proceeds obtained in liquidation of the collateral held. The Company had commercial and similar letters of credit for customers aggregating $3,973,000$5,160,000 and $4,315,000$3,973,000 at December 31, 20162017 and 2015,2016, respectively. The current amounts of the liability related to guarantees under standby letters of credit issued are not material as of December 31, 20162017 and 2015.

2016.

Note 17 – Regulatory Matters


The Company and the Bank are subject to various regulatory and capital requirements administered by the Federal banking agencies. Our federal banking regulators, the Board of Governors of the Federal Reserve System (the “Federal Reserve”) (which regulates bank holding companies) and the Federal Deposit Insurance Corporation (the “FDIC”) (which regulated the Bank), have issued guidelines classifying and defining capital. Failure to meet minimum capital requirements can initiate certain mandatory and possibly additional discretionary actions that, if undertaken, could have a direct material effect on the Company’s financial statements. Under capital adequacy guidelines and the regulatory framework for prompt corrective action, the Company and the Bank must meet specific capital guidelines that involve quantitative measures of their assets, liabilities and certain off-balance sheet items as calculated under regulatory accounting practices. The capital amounts and classification of the Company and the Bank is also subject to qualitative judgements by the regulators about components, risk weightings and other factors.


Under the New Jersey Banking Act (the “Banking Act”), no dividend may be paid by the Bank on its capital stock unless, following the payment of each such dividend, the capital stock of the Bank will be unimpaired, and the Bank will have a surplus of not less than 50% of its capital stock. Therefore the highest amount of dividends that the Bank could pay to the Company at December 31, 20162017 under the Banking Act is $84.5$89.9 million, subject to amounts it needs to retain in order to remain “well capitalized” as set forth below. Under Federal Reserve regulations, the Bank is limited as to the amount it may lend affiliates, including the Company, unless such loans are collateralized by specific obligations.


Quantitative measures established by regulation to ensure capital adequacy require the Company and the Bank to maintain minimum amounts and ratios, set forth in the following tables of Tier 1 Capital to Average Assets (Leverage Ratio), Common Equity Tier 1 Capital to Risk Weighted Assets, Tier 1 Capital to Risk Weighted Assets and Total Capital to Risk Weighted Assets. Management believes that, at December 31, 2016,2017, the Company and the Bank met all capital adequacy requirements to which they are subject.


As of December 31, 2016,2017, the Company and the Bank met all regulatory requirements for classification as well-capitalized under the applicable regulatory framework. Management believes that there are no conditions or events that have changed the classification.

Note 17 - Regulatory Matters (Continued)


The capital ratios of the Company and the Bank, at December 31, 20162017 and 2015,2016, are presented below.


Actual


For Capital

AdequacyPurposes


To be Well Capitalized

under Prompt Corrective

Action Regulations*


Amount


Ratio


Amount


Ratio


Amount


Ratio


(Dollars in Thousands)


As of December 31, 2016


Common Equity Tier 1 Capital (to risk weighted assets)


Two River Bancorp

 $82,994   10.33

%

 $>36,154   >4.50

%

 $N/A   N/A 

Two River Community Bank

  92,270   11.49

%

  >36,137   >4.50

%

  >52,198   >6.50

%


Total Capital (to risk weighted assets)


Two River Bancorp

  102,509   12.76

%

  >64,269   >8.00

%

  N/A   N/A 

Two River Community Bank

  101,835   12.68

%

  >64,249   >8.00

%

  >80,312   >10.00

%


Tier 1 Capital (to risk weighted assets)


Two River Bancorp

  82,994   10.33

%

  >48,206   >6.00

%

  >48,206   >6.00

%

Two River Community Bank

  92,270   11.49

%

  >48,183   >6.00

%

  >64,244   >8.00

%


Tier 1 Capital (to average assets)


Two River Bancorp

  82,994   8.94

%

  >37,134   >4.00

%

  N/A   N/A 

Two River Community Bank

 $92,270   9.95

%

 $>37,093   >4.00

%

 $>46,367   >5.00

%


As of December 31, 2015


Common Equity Tier 1 Capital (to risk weighted assets)


Two River Bancorp

 $75,273   10.13

%

  >33,438   >4.50

%

 $N/A   N/A 

Two River Community Bank

  84,659   11.39

%

  >33,447   >4.50

%

  >48,313   >6.50

%


Total Capital (to risk weighted assets)


Two River Bancorp

  93,986   12.65

%

 $>59,438   >8.00

%

 $N/A   N/A 

Two River Community Bank

  93,372   12.56

%

  >59,473   >8.00

%

  >74,341   >10.00

%


Tier 1 Capital (to risk weighted assets)


Two River Bancorp

  75,273   10.13

%

  >44,584   >6.00

%

  >44,584   >6.00

%

Two River Community Bank

  84,659   11.39

%

  >44,596   >6.00

%

  >59,462   >8.00

%


Tier 1 Capital (to average assets)


Two River Bancorp

  75,273   8.97

%

  >33,567   >4.00

%

  N/A   N/A 

Two River Community Bank

 $84,659   10.09

%

 $>33,562   >4.00

%

 $>41,952   >5.00

%

  Actual 
For Capital
Adequacy Purposes
 
To be Well Capitalized
under Prompt Corrective
Action Regulations*
  Amount Ratio Amount Ratio Amount Ratio
             
  (Dollars in Thousands)
As of December 31, 2017            
Common Equity Tier 1 Capital (to risk weighted assets)            
Two River Bancorp $88,733
 9.68% 
$ >41,250
 
>4.50
 N/A N/A
Two River Community Bank 97,723
 10.66% 
>41,253
 
>4.50
 
$ >59,587
 
>6.50
             
Total Capital (to risk weighted assets)            
Two River Bancorp 109,401
 11.93% 
>73,362
 
>8.00
 N/A N/A
Two River Community Bank 108,391
 11.82% 
>73,361
 
>8.00
 
>91,701
 
>10.00
             
Tier 1 Capital (to risk weighted assets)            
Two River Bancorp 88,733
 9.68% 
>55,000
 
>6.00
 
>55,000
 
>6.00
Two River Community Bank 97,723
 10.66% 
>55,004
 
>6.00
 
>73,338
 
>8.00
             
Tier 1 Capital (to average assets)            
Two River Bancorp 88,733
 8.85% 
>40,105
 
>4.00
 N/A N/A
Two River Community Bank 97,723
 9.76% 
>40,050
 
>4.00
 
>50,063
 
>5.00
             
As of December 31, 2016            
Common Equity Tier 1 Capital (to risk weighted assets)            
Two River Bancorp $82,994
 10.33% 
$ >36,154
 
>4.50
 N/A N/A
Two River Community Bank 92,270
 11.49% 
>36,137
 
>4.50
 
$ >52,198
 
>6.50
             
Total Capital (to risk weighted assets)            
Two River Bancorp 102,509
 12.76% 
>64,269
 
>8.00
 N/A N/A
Two River Community Bank 101,835
 12.68% 
>64,249
 
>8.00
 
>80,312
 
>10.00
             
Tier 1 Capital (to risk weighted assets)            
Two River Bancorp 82,994
 10.33% 
>48,206
 
>6.00
 
>48,206
 
>6.00
Two River Community Bank 92,270
 11.49% 
>48,183
 
>6.00
 
>64,244
 
>8.00
             
Tier 1 Capital (to average assets)            
Two River Bancorp 82,994
 8.94% 
>37,134
 
>4.00
 N/A N/A
Two River Community Bank 92,270
 9.95% 
>37,093
 
>4.00
 
 >46,367
 
>5.00
*Applies to the Bank only. For the Company to be “well-capitalized”, the Tier 1 Capital to Risk Weighted Assets has to be at least 6.00%.


Note 17 – Regulatory Matters (Continued)

Basel III Capital Rules. In July 2013, the federal bank regulatory agencies adopted revisions to the agencies’ capital adequacy guidelines and prompt corrective action rules, which were designed to enhance such requirements and implement the revised standards of the Basel Committee on Banking Supervision, commonly referred to as Basel III.

These revisions generally implemented higher minimum capital requirements, added a new common equity Tier 1 Capital requirement, and established criteria that instruments must meet to be considered common equity Tier 1 Capital, additional Tier 1 Capital or Tier 2 Capital. Effective January 1, 2015, the new minimum capital to risk-adjusted assets requirements are a common
Note 17 - Regulatory Matters (Continued)


equity Tier 1 Capital ratio of 4.5% (6.5% for the Bank to be considered “well capitalized”) and a Tier 1 Capital ratio of 6.0%, increased from 4.0% (and increased from 6.0% to 8.0% for the Bank to be considered “well capitalized”); the total capital ratio remains at 8.0% under the new rules (10.0%(10.00% to be considered “well capitalized”).

The risk-based capital rules adopted effective January 1, 2015 require that banks and holding companies maintain a “capital conservation buffer” of 250 basis points in excess of the “minimum capital ratio.” The minimum capital ratio is equal to the prompt corrective action adequately capitalized threshold ratio. The capital conservation buffer is being phased in over a four year period that began January 1, 2016, with a required buffer of 0.625% of risk weighted assets for 2016, 1.25% for 2017, 1.875% for 2018 and 2.5% for 2019 and thereafter. Failure to maintain the required capital conservation buffer will result in limitations on capital distributions and on discretionary bonuses to executive officers.

Effective January 1, 2016,2017, the capital levels required for the Company and the Bank to avoid these limitations were as follows:

(i)

a common equity Tier 1 capital ratio of 5.125%5.75%;

(ii)

a Tier 1 Risk based capital ratio of 6.625%7.25%; and

(iii)

a Total Risk based capital ratio of 8.625%9.25%.


As of December 31, 2016,2017, the Bank had a conservation buffer greater than 2.5%.


Note 18 – Fair Value of Financial Instruments


Accounting guidance establishes a fair value hierarchy that prioritizes the inputs to valuation methods used to measure fair value. The hierarchy gives the highest priority to unadjusted quoted prices in active markets for identical assets or liabilities (Level 1 measurements) and the lowest priority to unobservable inputs (Level 3 measurements). The three levels of the fair value hierarchy are as follows:

Level 1:

1:

Unadjusted quoted prices in active markets that are accessible at the measurement date for identical, unrestricted assets or liabilities.


Level 2:

2:

Quoted prices in markets that are not active, or inputs that are observable either directly or indirectly, for substantially the full term of the asset or liability.


Level 3:

3:

Prices or valuation techniques that require inputs that are both significant to the fair value measurement and unobservable (i.e. supported with little or no market activity).


Note 18 – Fair Value of Financial Instruments (Continued)


An asset’s or liability’s level within the fair value hierarchy is based on the lowest level of input that is significant to the fair value measurement. For financial assets measured at fair value on a recurring basis, the fair value measurements by level within the fair value hierarchy used at December 31, 20162017 and 20152016 are as follows:

Description


(Level 1)

Quoted Prices

in Active

Markets for

Identical

Assets


(Level 2)

Significant

Other

Observable

Inputs


(Level 3)

Significant

Unobservable

Inputs


Total


(In Thousands)


At December 31, 2016


Securities available for sale:


U.S. Government agency securities

 $-  $8,413  $-  $8,413 

Municipal securities

  -   503   -   503 

GSE – Residential mortgage-backed securities

  -   11,255   -   11,255 

U.S. Government collateralized residential mortgage obligations

  -   9,537   -   9,537 

Corporate debt securities, primarily financial institutions

  -   2,359   -   2,359 

CRA mutual fund

  2,397   -   -   2,397 
                 

Total securities available for sale

 $2,397  $32,067  $-  $34,464 
                 

At December 31, 2015


Securities available for sale:


U.S. Government agency securities

 $-  $1,238  $-  $1,238 

Municipal securities

  -   517   -   517 

GSE – Residential mortgage-backed securities

  -   14,449   -   14,449 

U.S. Government collateralized residential mortgage obligations

  -   12,627   -   12,627 

Corporate debt securities, primarily financial institutions

  -   2,317   -   2,317 

CRA mutual fund

  2,382   -   -   2,382 
                 

Total securities available for sale

 $2,382  $31,148  $-  $33,530 

Description 
(Level 1)
Quoted Prices
in Active
Markets for
Identical
Assets
 
(Level 2)
Significant
Other
Observable
Inputs
 
(Level 3)
Significant
Unobservable
Inputs
 Total
  (In Thousands)
At December 31, 2017        
         
Securities available for sale:        
         
U.S. Government agency securities $
 $10,057
 $
 $10,057
Municipal securities 
 495
 
 495
GSE – Residential mortgage-backed securities 
 8,219
 
 8,219
U.S. Government collateralized residential mortgage obligations 
 7,482
 
 7,482
Corporate debt securities, primarily financial institutions 
 2,431
 
 2,431
CRA mutual fund 2,448
 
 
 2,448
         
Total securities available for sale $2,448
 $28,684
 $
 $31,132
         
At December 31, 2016   
    
         
Securities available for sale:        
         
U.S. Government agency securities $
 $8,413
 $
 $8,413
Municipal securities 
 503
 
 503
GSE – Residential mortgage-backed securities 
 11,255
 
 11,255
U.S. Government collateralized residential mortgage obligations 
 9,537
 
 9,537
Corporate debt securities, primarily financial institutions 
 2,359
 
 2,359
CRA mutual fund 2,397
 
 
 2,397
         
Total securities available for sale $2,397
 $32,067
 $
 $34,464

As of December 31, 20162017 and 2015,2016, there were no securities available for sale measured at fair value on a recurring basis using significant unobservable inputs (Level 3).


Note 18 – Fair Value of Financial Instruments (Continued)


For assets measured at fair value on a nonrecurring basis, the fair value measurements by level within the fair value hierarchy used at December 31, 20162017 and 20152016 are as follows:

Description


(Level 1)

Quoted Prices

in Active

Markets for

Identical

Assets


(Level 2)

Significant

Other

Observable

Inputs


(Level 3)

Significant

Unobservable

Inputs


Total


(In Thousands)


At December 31, 2016


Impaired loans, net of allowance recorded

 $-  $-  $496  $496 

OREO

  -   -   259   259 
                 

At December 31, 2015


Impaired loans, net of allowance recorded

 $-  $-  $3,256  $3,256 

Impaired loans, net of partial charge-offs

  -   -   1,389   1,389 

OREO

  -   -   411   411 

Description 
(Level 1)
Quoted Prices
in Active
Markets for
Identical
Assets
 
(Level 2)
Significant
Other
Observable
Inputs
 
(Level 3)
Significant
Unobservable
Inputs
 Total
  (In Thousands)
         
At December 31, 2017        
Impaired loans, net of partial charge-offs $
 $
 $116
 $116
         
At December 31, 2016        
Impaired loans, net of allowance recorded $
 $
 $496
 $496
OREO 
 
 259
 259
The Company’s policy is to recognize transfers between levels as of the beginning of the period. There were no transfers between Levels 1, 2 and 3 for the years ended December 31, 20162017 and 2015.

2016.

The following valuation techniques were used to measure fair value of assets in the tables above:

Impaired loans – Impaired loans measured at fair value are those loans in which the Company has measured impairment generally based on the fair value of the loan’s collateral. This method of fair value measurement is used on all of the Company’s impaired loans, except for two loans in one relationship which are evaluated on a cash flow basis. Fair value is generally determined based upon either independent third party appraisals of the properties or discounted cash flows based upon the expected proceeds. The appraisals may be adjusted by management for qualitative factors such as economic conditions and estimated liquidation expenses. At December 31, 2016, two loans received a 5.0% discount to their appraised values while at December 31, 2015, there were no discounts applied to appraisal values as impaired appraisals were current. At December 31, 2016 and 2015, liquidation expenses were 5.0% (weighted average of 5.0%). These assets are included as Level 3 fair values, based upon the lowest level of input that is significant to the fair value measurements.

OREO– Real estate properties acquired through, or in lieu of, loan foreclosure are carried at fair value less cost to sell. Fair value is based upon the appraised value of the collateral, adjusted by management for factors such as economic conditions and other market factors. At December 31, 2016, the discount and liquidation expenses for collateral adjustments to our one OREO property was 5.95%, while at December 31, 2015, the discount range and liquidation expenses for collateral adjustments to OREO ranged from 0.4% to 6.0% (weighted average of 3.9%). These assets are included in Level 3 fair value based upon the lowest level of input that is significant to the fair value measurement. At December 31, 2016 and 2015, OREO totaling $259,000 and $411,000, respectively, were acquired by deed in lieu of foreclosure and are carried at fair value less estimated selling costs based on current appraisals. At December 31, 2016, the Company had no residential real estate properties held in OREO while at December 31, 2015, there was one residential loan for $153,000 held in OREO, which was subsequently sold during the first quarter of 2016. As of December 31, 2016 and 2015, the Company initiated foreclosure proceedings on one residential mortgage loan collateralized by a real estate property in the amount of$532,000 and $542,000, respectively.

Impaired loans – Impaired loans measured at fair value are those loans in which the Company has measured impairment generally based on the fair value of the loan’s collateral. This method of fair value measurement is used on all of the Company’s impaired loans, except for two loans in one relationship which are evaluated on a cash flow basis. Fair value is generally determined based upon either independent third party appraisals of the properties or discounted cash flows based upon the expected proceeds. The appraisals may be adjusted by management for qualitative factors such as economic conditions and estimated liquidation expenses. At December 31, 2017, there were no loans that received a discount, while at December 31, 2016, two loans received a 5.0% discount to their appraised values. At December 31, 2017, there were no liquidation expenses while at December 31, 2016, liquidation expenses were 5.0% (weighted average of 5.0%). These assets are included as Level 3 fair values, based upon the lowest level of input that is significant to the fair value measurements.

OREO – Real estate properties acquired through, or in lieu of, loan foreclosure are carried at fair value less cost to sell. Fair value is based upon the appraised value of the collateral, adjusted by management for factors such as economic conditions and other market factors. During the third quarter of 2017, the Company sold its only OREO property for a loss of $17,000. At December 31, 2016, the discount and liquidation expenses for collateral adjustments to our one OREO property was 5.95%. These assets are included in Level 3 fair value based upon the lowest level of input that is significant to the fair value measurement. At December 31, 2016, OREO totaling $259,000 was acquired by deed in lieu of foreclosure and was carried at fair value less estimated selling costs based on current appraisal. At December 31, 2017 and 2016, the Company had no residential real estate properties held in OREO. As of December 31, 2017 and 2016, the Company initiated foreclosure proceedings on one residential mortgage loan collateralized by a real estate property in the amount of $490,000 and $532,000, respectively.

The following information should not be interpreted as an estimate of the fair value of the entire Company since a fair value calculation is only provided for a limited portion of the Company’s assets and liabilities. Due to a wide range of valuation techniques and the degree of subjectivity used in making the estimates, comparisons between the Company’s disclosures and those of other companies may not be meaningful. The following methods and assumptions were used to estimate the fair values of the Company’s financial instruments at December 31, 20162017 and 2015:

2016:


Cash and Cash Equivalents (carried at cost):

The carrying amounts reported in the balance sheet for cash and short-term instruments approximate those assets’ fair values.


Note 18 – Fair Value of Financial Instruments (Continued)


Securities

Securities:

The fair value of securities available-for-sale (carried at fair value) and held to maturity (carried at amortized cost) are determined by obtaining quoted market prices on nationally recognized securities exchanges (Level 1), or matrix pricing (Level 2), which is a mathematical technique used widely in the industry to value debt securities without relying exclusively on quoted market prices for the specific securities but rather by relying on the securities’ relationship to other benchmark quoted prices. For certain securities which are not traded in active markets or are subject to transfer restrictions, valuations are adjusted to reflect illiquidity and/or non-transferability, and such adjustments are generally based on available market evidence (Level 3). At December 31, 20162017 and 2015,2016, there were no Level 3 securities.

Restricted Investments (carried at cost):

The carrying amount of restricted investment in Federal Home Loan Bank stock, Atlantic Community Bancshares, Inc. stock and Solomon Hess SBA Loan Fund approximates fair value, and considers the limited marketability of such securities.

Loans Held for Sale:

Loans held for sale are carried at the lower of aggregate cost or estimated fair value, less costs to sell. The fair value of these loans are equal to the contractual sales price.

Loans Receivable (carried at cost):

The fair values of loans, excluding collateral dependent impaired loans, are estimated using discounted cash flow analyses, using market rates at the balance sheet date that reflect the credit and interest rate-risk inherent in the loans, including liquidity. Projected future cash flows are calculated based upon contractual maturity or call dates, projected repayments and prepayments of principal. The valuation of the loan portfolio reflects discounts that the Company believes are consistent with transactions occurring in the marketplace for both performing and distressed loan types. The carrying value that fair value is compared to is net of the allowance for loan losses and other associated premiums and discounts. Generally, for variable rate loans that reprice frequently and with no significant change in credit risk, fair values are based on carrying values. Due to the significant judgment involved in evaluating credit quality risk, loans are classified within Level 3 of the fair value hierarchy.

Accrued Interest Receivable and Payable (carried at cost):

The carrying amount of accrued interest receivable and accrued interest payable approximates its fair value.

Deposit Liabilities (carried at cost):

The fair values disclosed for demand deposits (e.g., interest and non-interest checking, passbook savings and money market accounts) are, by definition, equal to the amount payable on demand at the reporting date, (i.e., their carrying amounts). Fair values for fixed-rate certificates of deposit are estimated using a discounted cash flow calculation that applies interest rates currently being offered in the market on certificates to a schedule of aggregated expected monthly maturities on time deposits.

Securities Sold Under Agreements to Repurchase (carried at cost):

The carrying amounts of these short-term borrowings approximate their fair values.

Long-term DebtFHLB and Other Borrowings (carried at cost):

Fair values of FHLB advances are estimated by using a discounted cash flow analysis, based on quoted prices for new FHLB advances with similar credit risk characteristics, terms and remaining maturity. These prices obtained from this active market represent a market value that is deemed to represent the transfer price if the liability were assumed by a third party.

Subordinated Debentures (carried at cost):

The fair value of subordinated debentures is estimated by using a discounted cash flow analysis that, at December 31, 2017 and 2016, applies a 4.56% and 2015, applies a4.64% and 4.49%4.64% credit spread, respectively, plus the U.S. Treasury rate (all-in issue spread) to the time remaining until the issue’s call option date.

Note 18 – Fair Value of Financial Instruments (Continued)


Off-Balance Sheet Financial Instruments (disclosed at cost):

Fair values for the Company’s off-balance sheet financial instruments (lending commitments and letters of credit) are based on fees currently charged in the market to enter into similar agreements, taking into account, the remaining terms of the agreements and the counterparties’ credit standing. The fair values of such fees are not material at December 31, 20162017 and 2015.

2016.

Note 18 – Fair Value of Financial Instruments (Continued)

The estimated fair values of the Company’s financial instruments at December 31, 20162017 and 20152016 were as follows: 


Fair Value Measurements at December 31, 2016


(in thousands)


Carrying

Amount


Estimated

Fair

Value


(Level 1)

Quoted Prices

in Active

Markets for

Identical

Assets


(Level 2)

Significant

Other

Observable

Inputs


(Level 3)

Significant

Unobservable

Inputs


Financial assets:


Cash and cash equivalents

 $42,077  $42,077  $42,077  $-  $- 

Securities available for sale

  34,464   34,464   2,397   32,067   - 

Securities held to maturity

  57,843   57,284   -   57,284   - 

Restricted investments

  4,805   4,805   -   -   4,805 

Loans held for sale

  4,537   4,698   -   -   4,698 

Loans receivable, net

  743,527   740,910   -   -   740,910 

Accrued interest receivable

  2,234   2,234   -   621   1,613 
                     

Financial liabilities:


Deposits

  776,567   776,404   -   776,404   - 

Securities sold under agreements to repurchase

  19,915   19,915   -   19,915   - 

Long-term debt

  25,300   25,363   -   25,363   - 

Subordinated debt

  9,855   9,827   -   9,827   - 

Accrued interest payable

  100   100   -   100   - 


Fair Value Measurements at December 31, 2015


(in thousands)


Carrying

Amount


Estimated

Fair

Value


(Level 1)

Quoted Prices

in Active

Markets for

Identical

Assets


(Level 2)

Significant

Other

Observable

Inputs


(Level 3)

Significant

Unobservable

Inputs


Financial assets:


Cash and cash equivalents

 $46,727  $46,727  $46,727  $-  $- 

Securities available for sale

  33,530   33,530   2,382   31,148   - 

Securities held to maturity

  43,167   43,668   -   43,668   - 

Restricted investments

  3,596   3,596   -   -   3,596 

Loans held for sale

  3,050   3,105   -   -   3,105 

Loans receivable, net

  684,437   676,703   -   -   676,703 

Accrued interest receivable

  1,912   1,912   -   422   1,490 
                     

Financial liabilities:


Deposits

  708,436   707,908   -   707,908   - 

Securities sold under agreements to repurchase

  19,545   19,545   -   19,545   - 

Long-term debt

  26,500   26,882   -   26,882   - 

Subordinated debt

  9,824   9,823   -   9,823   - 

Accrued interest payable

  118   118   -   118   - 

 
  Fair Value Measurements at December 31, 2017
(in thousands) 
Carrying
Amount
 
Estimated
Fair
Value
 
(Level 1)
Quoted Prices
in Active
Markets for
Identical
Assets
 
(Level 2)
Significant
Other
Observable
Inputs
 
(Level 3)
Significant
Unobservable
Inputs
           
Financial assets:          
Cash and cash equivalents $48,219
 $48,219
 $48,219
 $
 $
Securities available for sale 31,132
 31,132
 2,448
 28,684
 
Securities held to maturity 58,002
 58,549
 
 58,549
 
Restricted investments 5,430
 5,430
 
 
 5,430
Loans held for sale 2,581
 2,738
 
 
 2,738
Loans receivable, net 840,206
 841,477
 
 
 841,477
Accrued interest receivable 2,554
 2,554
 
 638
 1,916
           
Financial liabilities:          
Deposits 861,557
 860,129
 
 860,129
 
Securities sold under agreements to repurchase 27,120
 27,120
 
 27,120
 
FHLB and other borrowings 25,800
 25,382
 
 25,382
 
Subordinated debt 9,888
 9,812
 
 9,812
 
Accrued interest payable 70
 70
 
 70
 
Note 18 – Fair Value of Financial Instruments (Continued)


  Fair Value Measurements at December 31, 2016
(in thousands) 
Carrying
Amount
 
Estimated
Fair
Value
 
(Level 1)
Quoted Prices
in Active
Markets for
Identical
Assets
 
(Level 2)
Significant
Other
Observable
Inputs
 
(Level 3)
Significant
Unobservable
Inputs
           
Financial assets:          
Cash and cash equivalents $42,077
 $42,077
 $42,077
 $
 $
Securities available for sale 34,464
 34,464
 2,397
 32,067
 
Securities held to maturity 57,843
 57,284
 
 57,284
 
Restricted investments 4,805
 4,805
 
 
 4,805
Loans held for sale 4,537
 4,698
 
 
 4,698
Loans receivable, net 743,527
 740,910
 
 
 740,910
Accrued interest receivable 2,234
 2,234
 
 621
 1,613
           
Financial liabilities:          
Deposits 776,567
 776,404
 
 776,404
 
Securities sold under agreements to repurchase 19,915
 19,915
 
 19,915
 
FHLB and other borrowings 25,300
 25,363
 
 25,363
 
Subordinated debt 9,855
 9,827
 
 9,827
 
Accrued interest payable 100
 100
 
 100
 

Note 19 – Shareholders’ Equity

On August 11, 2011, the Company received $12 million under the Small Business Lending Fund (“SBLF”), created as part of the Small Business Jobs Act. The SBLF provided Tier 1 Capital to community banks, and the terms of this capital contained incentives for making small business loans, defined as certain loans of up to $10 million to businesses with up to $50 million in annual revenues. In exchange for the $12 million, the Company issued to the U.S. Department of the Treasury (“Treasury”) 12,000 shares of its Non-Cumulative Perpetual Preferred Stock, Series C, having a $1,000 liquidation preference per share (the “SBLF Preferred Shares”). The SBLF Preferred Shares qualified as Tier 1 Capital. On December 15, 2014, the Company redeemed $6.0 million (6,000 shares) of the outstanding SBLF Preferred Shares, and on December 15, 2015, the remaining $6.0 million (6,000 shares) was redeemed. From July 1, 2013 to their redemption on December 15, 2015, the dividend rate on the SBLF Preferred Shares was 1.00%.

From January 1, 20162017 until December 31, 2016,2017, the Company maintained a Share Repurchase Program under which the Company repurchased a total of 13,894 shares for a total price of approximately $148,000.did not repurchase any shares. This program expired on December 31, 2016.

2017.

On December 15, 2016,14, 2017, the Company announced that its Board of Directors approved a new Share Repurchase Program. This new program allows for the Company to repurchase up to $2.0$2 million of its common stock from January 1, 20172018 to December 31, 2017.

2018.


Note 20 – Condensed Financial Statements of Parent Company

Condensed financial information pertaining to the parent company, Two River Bancorp, is as follows:

Condensed Balance Sheets


December 31,


2016


2015


(In Thousands)


Assets


Cash and cash equivalents

 $161  $333 

Investments in subsidiaries

  110,042   102,388 

Other assets

  470   345 
         

Total assets

 $110,673  $103,066 
         

Liabilities and Shareholders’ Equity


Subordinated debt

 $9,855  $9,824 

Other liabilities

  102   240 

Shareholders’ equity

  100,716   93,002 
         

Total liabilities and shareholders’ equity

 $110,673  $103,066 

 December 31,
 2017 2016
 (In Thousands)
Assets   
Cash and cash equivalents$41
 $161
Investments in subsidiaries115,507
 110,042
Other assets1,067
 470
    
Total assets$116,615
 $110,673
    
Liabilities and Shareholders’ Equity   
Subordinated debt$9,888
 $9,855
Other liabilities156
 102
Shareholders’ equity106,571
 100,716
    
Total liabilities and shareholders’ equity$116,615
 $110,673
Condensed Statements of Operations and Comprehensive Income


December 31,


2016


2015


(In Thousands)


Dividends from Bank

 $1,636  $1,456 

Interest expense - subordinated debt

  656   33 

Other operating expenses

  233   186 
         

Income before income taxes

  747   1,237 
         

Income tax benefit

  (239

)

  (10

)


Income before undistributed income of subsidiaries

  986   1,247 
         

Equity in undistributed income of subsidiaries

  7,645   5,100 
         

Net income

 $8,631  $6,347 
         

Equity in other comprehensive income (loss) of subsidiaries, net of tax

  8   (54

)


Total comprehensive income, net of tax

 $8,639  $6,293 

 
 December 31,
 2017 2016 2015
 (In Thousands)
      
Dividends from Bank$1,578
 $1,636
 $1,456
Interest expense - subordinated debt658
 656
 33
Other operating expenses279
 233
 186
      
Income before income taxes641
 747
 1,237
      
Income tax benefit(483) (239) (10)
      
Income before undistributed income of subsidiaries1,124
 986
 1,247
      
Equity in undistributed income of subsidiaries5,378
 7,645
 5,100
      
Net income$6,502
 $8,631
 $6,347
      
Equity in other comprehensive income (loss) of subsidiaries, net of tax87
 8
 (54)
      
Total comprehensive income, net of tax$6,589
 $8,639
 $6,293

Note 20 – Condensed Financial Statements of Parent Company (Continued)


Condensed Statements of Cash Flows


December 31,


2016


2015


(In Thousands)


Cash flows from operating activities:


Net income

 $8,631  $6,347 

Adjustments to reconcile net income to net cash provided by operating activities:


Equity in undistributed income of subsidiaries, net of dividends received from Bank

  (7,645

)

  (5,100

)

Amortization of subordinated debt issuance costs

  31   - 

Stock-based compensation expense

  231   186 

Other, net

  (264

)

  248 
         

Net cash provided by operating activities

  984   1,681 
         

Cash flows from investing activities:


Contributions to subsidiary, net

  -   (3,809

)

Net cash used in investing activities

  -   (3,809

)


Cash flows from financing activities:


Proceeds from exercise of stock options

  104   114 

Tax benefit of stock options exercised

  25   7 

Proceeds from employee stock purchase program

  56   56 

Redemption of preferred stock, Series C

  -   (6,000

)

Proceeds from subordinated debt placement, net of issuance costs

  -   9,824 

Common stock repurchased

  (148

)

  (497

)

Cash dividends paid on common stock

  (1,193

)

  (1,032

)

Dividends paid on preferred stock, Series C

  -   (57

)


Net cash provided by (used in) financing activities

  (1,156

)

  2,415 
         

Net increase (decrease) in cash and cash equivalents

  (172

)

  287 
         

Cash and Cash Equivalents - Beginning

  333   46 
         

Cash and Cash Equivalents – Ending

 $161  $333 

 
 December 31,
 2017 2016 2015
 (In Thousands)
      
Cash flows from operating activities:     
Net income$6,502
 $8,631
 $6,347
Adjustments to reconcile net income to net cash provided by operating activities:     
Equity in undistributed income of subsidiaries, net of dividends received from Bank(5,378) (7,645) (5,100)
Amortization of subordinated debt issuance costs33
 31
 
Stock-based compensation expense279
 231
 186
Other, net(543) (264) 248
      
Net cash provided by operating activities893
 984
 1,681
      
Cash flows from investing activities:     
Contributions to subsidiary, net
 
 (3,809)
Net cash used in investing activities
 
 (3,809)
      
Cash flows from financing activities:     
Proceeds from exercise of stock options276
 104
 114
Tax benefit relating to stock compensation59
 25
 7
Proceeds from employee stock purchase program67
 56
 56
Redemption of preferred stock, Series C
 
 (6,000)
Proceeds from subordinated debt placement, net of issuance costs
 
 9,824
Common stock repurchased
 (148) (497)
Cash dividends paid on common stock(1,415) (1,193) (1,032)
Dividends paid on preferred stock, Series C
 
 (57)
      
Net cash provided by (used in) financing activities(1,013) (1,156) 2,415
      
Net increase (decrease) in cash and cash equivalents(120) (172) 287
      
Cash and Cash Equivalents - Beginning161
 333
 46
      
Cash and Cash Equivalents – Ending$41
 $161
 $333


Note 21 – Summary of Quarterly Results (Unaudited)

The following summarizes the consolidated results of operations during 20162017 and 2015,2016, on a quarterly basis, for Two River Bancorp. Note that certain balances may not cross-foot due to rounding.

(in thousands, except per share data):


2016


Fourth Quarter


Third Quarter


Second Quarter


First Quarter


Interest income

 $8,970  $8,777  $8,539  $8,338 

Interest expense

  1,376   1,308   1,270   1,210 
                 

Net interest income

  7,594   7,469   7,269   7,128 

Provision for loan losses

  (345

)

  470   390   - 
                 

Net interest income after provision for loan losses

  7,939   6,999   6,879   7,128 

Non-interest income

  1,447   1,983   1,166   893 

Non-interest expense

  5,360   5,339   5,379   5,397 
                 

Income before income taxes

  4,026   3,643   2,666   2,624 

Income taxes

  1,459   999   939   931 
                 

Net income

 $2,567  $2,644  $1,727  $1,693 
Per common share data:                

Basic earnings

 $0.31  $0.32  $0.21  $0.20 

Diluted earnings

 $0.30  $0.31  $0.20  $0.20 


2015


Fourth Quarter


Third Quarter


Second Quarter


First Quarter


Interest income

 $8,306  $8,218  $7,903  $7,676 

Interest expense

  1,019   973   967   904 
                 

Net interest income

  7,287   7,245   6,936   6,772 

Provision for loan losses

  90   120   190   90 
                 

Net interest income after provision for loan losses

  7,197   7,125   6,746   6,682 

Non-interest income

  984   836   941   776 

Non-interest expense

  5,509   5,308   5,377   5,161 
                 

Income before income taxes

  2,672   2,653   2,310   2,297 

Income taxes

  921   961   849   854 
                 

Net income

  1,751   1,692   1,461   1,443 
                 

Preferred stock dividends

  (12

)

  (15

)

  (15

)

  (15

)


Net income available to common shareholders

 $1,739  $1,677  $1,446  $1,428 

Per common share data:


Basic earnings

 $0.21  $0.20  $0.17  $0.17 

Diluted earnings

 $0.20  $0.20  $0.17  $0.17 

  2017
  Fourth Quarter Third Quarter Second Quarter First Quarter
         
Interest income $10,074
 $9,824
 $9,349
 $8,993
Interest expense 1,545
 1,408
 1,391
 1,363
         
Net interest income 8,529
 8,416
 7,958
 7,630
Provision for loan losses 675
 255
 375
 225
         
Net interest income after provision for loan losses 7,854
 8,161
 7,583
 7,405
Non-interest income 1,343
 1,453
 1,538
 1,125
Non-interest expense 5,919
 6,175
 6,071
 5,777
         
Income before income taxes 3,278
 3,439
 3,050
 2,753
Income taxes 2,943
 1,202
 922
 951
         
Net income $335
 $2,237
 $2,128
 $1,802
Per common share data:        
Basic earnings $0.04
 $0.27
 $0.25
 $0.22
Diluted earnings $0.04
 $0.26
 $0.25
 $0.21
  2016
  Fourth Quarter Third Quarter Second Quarter First Quarter
         
Interest income $8,970
 $8,777
 $8,539
 $8,338
Interest expense 1,376
 1,308
 1,270
 1,210
         
Net interest income 7,594
 7,469
 7,269
 7,128
Provision for loan losses (345) 470
 390
 
         
Net interest income after provision for loan losses 7,939
 6,999
 6,879
 7,128
Non-interest income 1,447
 1,983
 1,166
 893
Non-interest expense 5,360
 5,339
 5,379
 5,397
         
Income before income taxes 4,026
 3,643
 2,666
 2,624
Income taxes 1,459
 999
 939
 931
         
Net income $2,567
 $2,644
 $1,727
 $1,693
Per common share data:        
Basic earnings $0.31
 $0.32
 $0.21
 $0.20
Diluted earnings $0.30
 $0.31
 $0.20
 $0.20


SIGNATURES

Pursuant to the requirements of the Securities Exchange Act of 1934, the registrant has duly caused this report to be signed on its behalf by the undersigned, thereunto duly authorized.


TWO RIVER BANCORP


Date:  

March 24, 2017

15, 2018

By:

/s/ WILLIAM D. MOSS

William D. Moss

President and Chief Executive Officer

 
   William D. Moss 
President and Chief Executive Officer


Pursuant to the requirements of the Securities Exchange Act of 1934, this report has been signed below by the following persons on behalf of the registrant and in the capacities and on the dates indicated.


63


Signature


Capacity


Date


/s/ FRANK J. PATOCK, JR.


Chairman of the Board


March 24, 2017

15, 2018

Frank J. Patock, Jr.


/s/ JAMES M. BOLLERMAN


Vice Chairman of the Board


March 24, 2017

15, 2018

James M. Bollerman


/s/ JOHN J. PERRI, JR., CPA


Vice Chairman of the Board


March 24, 2017

15, 2018

John J. Perri, Jr., CPA


/s/ CHARLES F. BUTRICO, JR.


Director


March 24, 2017

15, 2018

Charles F. Butrico, Jr.


/s/ ROBERT E. GREGORY


Director


March 24, 2017

15, 2018

Robert E. Gregory


/s/ ROBERT B. GROSSMAN, MD


Director


March 24, 2017

15, 2018

Robert B. Grossman, MD


/s/ WILLIAM F. LaMORTE


Director


March 24, 2017

15, 2018

William F. LaMorte


/s/ JOSEPH F.X. O’SULLIVAN


Director


March 24, 2017

15, 2018

Joseph F.X. O’Sullivan


/s/ WILLIAM STATTER


Director


March 24, 2017

15, 2018

William Statter


/s/ ANDREW A. VITALE, CPA


Director


March 24, 2017

15, 2018

Andrew A. Vitale, CPA


/s/ ROBIN ZAGER 


Director, Corporate Secretary of the Board


March 24, 2017

15, 2018

Robin Zager

/s/ WILLIAM D. MOSS

President, Chief Executive Officer, Director

March 24, 2017

William D. Moss


/s/ WILLIAM D. MOSS

President, Chief Executive Officer, DirectorMarch 15, 2018
William D. Moss
/s/ A. RICHARD ABRAHAMIAN


Executive Vice President, Chief Financial Officer


March 24, 2017

15, 2018

A. Richard Abrahamian


(Principal Financial and Accounting Officer)


64


INDEX TO EXHIBITS

Exhibit No.


Description


Amended and Restated Certificate of Incorporation of the Registrant (incorporated by reference to Exhibit 3.1 to the Registration Statement No. 333-205780 on Form S-3 filed with the SEC on July 21, 2015)


Amended and Restated By-laws of the Registrant (incorporated by reference to Exhibit 3.2 to the Registrant’s Quarterly Report on Form 10-Q (File No. 000-51889) for the quarter ended June 30, 2014 filed with the SEC on August 14, 2014)


Specimen certificate representing the Registrant’s common stock, no par value per share (incorporated by reference to Exhibit 4.1 to the Registrant’s Annual Report on Form 10-K filed with the SEC on March 31, 2014)


Form of the Registrant’s Subordinated Note (incorporated by reference to Exhibit 4.1 to the Registrant’s Current Report on Form 8-K filed with the SEC on December 16, 2015)


Shareholder Rights Agreement, dated as of July 20, 2011, between the Registrant and Registrar and Transfer Company (incorporated by reference to Exhibit 4.1 to the Registrant’s Current Report on Form 8-K filed with the SEC on July 26, 2011)


Form of Rights Certificate of the Registrant (incorporated by reference to Exhibit B to Exhibit 4.1 to the Registrant’s Current Report on Form 8-K filed with the SEC on July 26, 2011)


#

Two River Bancorp Employee Stock Purchase Plan (incorporated by referenced to Exhibit 4.3 to Registration Statement No. 333-172335 on Form S-8 filed with the SEC on February 18, 2011)


#

Amended and Restated Supplemental Executive Retirement Agreement between Two River Community Bank and William D. Moss dated July 1, 2013 (incorporated by reference to Exhibit 10.4 to the Current Report on Form 8-K filed with the SEC on August 23, 2013)


#

Supplemental Executive Retirement Agreement between Two River Community Bank and Alan B. Turner (incorporated by reference to Exhibit 10.8 to Registration Statement No. 333-129638 on Form S-4 filed with the SEC on November 10, 2005 (the “S-4”))


#

Two River Bancorp 2007 Equity Incentive Plan (incorporated by reference to Exhibit A to the Registrant’s Definitive Proxy Statement on Schedule 14A filed with the SEC on April 17, 2007)

10.4

#

Form of Incentive Stock Option Agreement under 2007 Equity Incentive Plan (incorporated by reference to Exhibit 10.8 to the Registrant’s Annual Report on Form 10-K filed with the SEC on March 29, 2013)

10.5

#

Form of Non-Qualified Stock Option Agreement under 2007 Equity Incentive Plan (incorporated by reference to Exhibit 10.7 to the Registrant’s Annual Report on Form 10-K filed with the SEC on March 31, 2014)

10.6

#

Form of the Subordinated Note Purchase Agreement dated as of December 14, 2015 between the Registrant and certain purchasers (incorporated by reference to Exhibit 10.1 to the Registrant’s Current Report on Form 8-K filed with the SEC on December 16, 2015)

10.7

#

First Amendment to the Two River Community Bank Supplemental Executive Retirement Agreement dated January 1, 2005, between Two River Community Bank and Alan B. Turner, effective as of January 1, 2005 (incorporated by reference to Exhibit 10.20 to the Registrant’s Quarterly Report on Form 10-Q for the quarterly period ended March 31, 2009 filed with the SEC on May 15, 2009)


10.8

#

Employment Agreement dated as of June 1, 2016, among the Registrant, Two River Community Bank and William D. Moss (incorporated by reference to Exhibit 10.1 to the Registrant’s Current Report on Form 8-K filed with the SEC on June 3, 2016)

10.9

#

Change in Control Agreement dated as of June 1, 2013, among the Registrant, Two River Community Bank and Alan B. Turner (incorporated by reference to Exhibit 10.1 to the Registrant’s Current Report on Form 8-K filed with the SEC on August 23, 2013)


10.10

#

Second Amendment to the Two River Community Bank Supplemental Executive Retirement Agreement dated March 1, 2010 by and between Two River Community Bank and Alan B. Turner (incorporated by reference to Exhibit 10.17 to the Registrant’s Annual Report on Form 10-K filed with the SEC on March 29, 2013)


10.11

#

Third Amendment to the Two River Community Bank Supplemental Executive Retirement Agreement dated June 11, 2010 between Two River Community Bank and Alan B. Turner, effective as of June 1, 2010 (incorporated by reference to Exhibit 10.6 to the Registrant’s Quarterly Report on Form 10-Q for the quarterly period ended June 30, 2010 filed with SEC on August 16, 2010)


10.12

#

Change in Control Agreement, dated as of June 1, 2013, among the Registrant, Two River Community Bank and A. Richard Abrahamian (incorporated by reference to Exhibit 10.2 to the Registrant’s Current Report on Form 8-K filed with SEC on August 23, 2013)

10.13

#

Form of Restricted Stock Agreement (incorporated by reference to Exhibit 10.15 to the Registrant’s Annual Report on Form 10-K filed with the SEC on March 31, 2014)

10.14

#

Two River Community Bank 2014 Incentive Bonus Program (incorporated by reference to Exhibit 10.1 to the Registrant’s Quarterly Report as Form 10-Q for the quarter ended June 30, 2014 filed with the SEC on August 14, 2014)

10.15

#

Fourth Amendment to the Two River Community Bank Supplemental Executive Retirement Agreement dated as of June 1, 2013 between Two River Community Bank and Alan B. Turner (incorporated by reference to Exhibit 10.5 to the Registrant’s Current Report on Form 8-K filed with SEC on August 23, 2013)


10.16

#

Fifth Amendment to Supplemental Executive Retirement Agreement dated as of September 30, 2016, between Two River Community Bank and Alan Turner (incorporated by reference to Exhibit 10.3 to the Registrant’s Current Report on the Form 8-K filed with the SEC on October 3, 2016)


#Two River Bancorp 2007 Equity Incentive Plan (incorporated by reference to Exhibit A to the Registrant’s Definitive Proxy Statement on Schedule 14A filed with the SEC on April 17, 2007)
#Form of Incentive Stock Option Agreement under 2007 Equity Incentive Plan (incorporated by reference to Exhibit 10.8 to the Registrant’s Annual Report on Form 10-K filed with the SEC on March 29, 2013)
#Form of Non-Qualified Stock Option Agreement under 2007 Equity Incentive Plan (incorporated by reference to Exhibit 10.7 to the Registrant’s Annual Report on Form 10-K filed with the SEC on March 31, 2014)
#Form of Restricted Stock Agreement under 2007 Equity Incentive Plan (incorporated by reference to Exhibit 10.15 to the Registrant’s Annual Report on Form 10-K filed with the SEC on March 31, 2014)
#Form of the Subordinated Note Purchase Agreement dated as of December 14, 2015 between the Registrant and certain purchasers (incorporated by reference to Exhibit 10.1 to the Registrant’s Current Report on Form 8-K filed with the SEC on December 16, 2015)
#Change in Control Agreement dated as of June 1, 2013, among the Registrant, Two River Community Bank and Alan B. Turner (incorporated by reference to Exhibit 10.2 to the Registrant’s Current Report on Form 8-K filed with the SEC on August 23, 2013)
#First Amendment to Change in Control Agreement dated as of May 29, 2015 by and among the Registrant, Two River Community Bank and Alan B. Turner (incorporated by reference to Exhibit 10.1 to the Registrant’s Current Report on the Form 8-K filed with the SEC on May 29, 2015)
#Second Amendment to Change in Control Agreement dated as of May 31, 2017 by and among Registrant, Two River Community Bank and Alan B. Turner (incorporated by reference to Exhibit 10.1 to the Registrant's Current Report on Form 8-K filed with the SEC on June 6, 2017)
#Change in Control Agreement, dated as of June 1, 2013, among the Registrant, Two River Community Bank and A. Richard Abrahamian (incorporated by reference to Exhibit 10.2 to the Registrant’s Current Report on Form 8-K filed with SEC on August 23, 2013)
#First Amendment to Change in Control Agreement dated as of May 29, 2015 by and among the Registrant, Two River Community Bank and A. Richard Abrahamian (incorporated by reference to Exhibit 10.2 to the Registrant’s Current Report on the Form 8-K filed with the SEC on May 29, 2015)
#Second Amendment to Change in Control Agreement dated as of May 31, 2017 by and among Registrant, Two River Community Bank and A. Richard Abrahamian (incorporated by reference to Exhibit 10.2 to the Registrant's Current Report on Form 8-K filed with the SEC on June 6, 2017)
#Two River Community Bank 2014 Incentive Bonus Program (incorporated by reference to Exhibit 10.1 to the Registrant’s Quarterly Report as Form 10-Q for the quarter ended June 30, 2014 filed with the SEC on August 14, 2014)
#Two River Community Bank Supplemental Executive Retirement Agreement dated as of January 1, 2012 between Two River Community Bank and A. Richard Abrahamian (incorporated by reference to Exhibit 10.1 to the Registrant’s Quarterly Report on Form 10-Q for the quarter ended March 31, 2012 filed with the SEC on May 15, 2012)


10.17

#

First Amendment to the Two River Community Bank Supplemental Executive Retirement Agreement dated as of June 1, 2013 between Two River Community Bank and A. Richard Abrahamian (incorporated by reference to Exhibit 10.6 to the Registrant’s Current Report on Form 8-K filed with SEC on August 23, 2013)


10.18

#

First Amendment to Change in Control Agreement dated as of May 29, 2015 by and among the Registrant, Two River Community Bank and Alan B. Turner (incorporated by reference to Exhibit 10.1 to the Registrant’s Current Report on the Form 8-K filed with the SEC on May 29, 2015)

10.19

#

First Amendment to Change in Control Agreement dated as of May 29, 2015 by and among the Registrant, Two River Community Bank and A. Richard Abrahamian (incorporated by reference to Exhibit 10.2 to the Registrant’s Current Report on the Form 8-K filed with the SEC on May 29, 2015)

10.20

#

Deferred Compensation Agreement dated as of September 7, 2016, between Two River Community Bank and William D. Moss (incorporated by reference to Exhibit 10.1 to the Registrant’s Current Report on the Form 8-K filed with the SEC on September 9, 2016)

10.21

#

Supplemental Executive Retirement Agreement dated as of September 30, 2016, between Two River Community Bank and Anthony Mero (incorporated by reference to Exhibit 10.1 to the Registrant’s Current Report on the Form 8-K filed with the SEC on October 3, 2016)

10.22

#

Second Amendment to Supplemental Executive Retirement Agreement dated as of September 30, 2016, between Two River Community Bank and A. Richard Abrahamian (incorporated by reference to Exhibit 10.2 to the Registrant’s Current Report on the Form 8-K filed with the SEC on October 3, 2016)


#

Fifth AmendmentDeferred Compensation Agreement dated as of September 7, 2016, between Two River Community Bank and William D. Moss (incorporated by reference to Exhibit 10.1 to the Registrant’s Current Report on the Form 8-K filed with the SEC on September 9, 2016)

#Supplemental Executive Retirement Agreement dated as of September 30, 2016, between Two River Community Bank and Alan TurnerAnthony Mero (incorporated by reference to Exhibit 10.210.1 to the Registrant’s Current Report on the Form 8-K filed with the SEC on October 3, 2016)

#Employment Agreement dated as of June 1, 2016, among the Registrant, Two River Community Bank and William D. Moss (incorporated by reference to Exhibit 10.1 to the Registrant’s Current Report on Form 8-K filed with the SEC on June 3, 2016)
#First Amendment to Employment Agreement dated as of May 31, 2017, by and among Registrant, Two River Community Bank and William D. Moss (incorporated by reference to Exhibit 10.3 to the Registrant's Current Report on Form 8-K filed with the SEC on June 6, 2017)

21

*

*Subsidiaries of the Registrant

*

Consent of BDO USA, LLP Independent Registered Public Accounting Firm


*

Certification of William D. Moss, President and Chief Executive Officer of the Registrant, pursuant to Securities Exchange Act Rule 13a-14(a)

*

Certification of A. Richard Abrahamian, Chief Financial Officer of the Registrant, pursuant to Securities Exchange Act Rule 13a-14(a)

*

Certifications pursuant to 18 U.S.C. Section 1350, as adopted pursuant to Section 906 of The Sarbanes-Oxley Act of 2002, signed by William D. Moss, President and Chief Executive Officer of the Registrant, and A. Richard Abrahamian, Chief Financial Officer of the Registrant


101.INS

101.INSXBRL Instance Document


101.SCH

XBRL Taxonomy Extension Schema


101.CAL

XBRL Taxonomy Extension Calculation Linkbase


101.DEF

XBRL Taxonomy Extension Definition Linkbase


101.LAB

XBRL Taxonomy Extension Label Linkbase


101.PRE

XBRL Taxonomy Extension Presentation Linkbase


* Filed herewith.

# Management contract or compensatory plan or arrangement.

57


68