


UNITED STATES
SECURITIES AND EXCHANGE COMMISSION
Washington, D.C. 20549
FORM 10-K
(X)☒ ANNUAL REPORT PURSUANT TO SECTION 13 OR 15(d) OF THE SECURITIES EXCHANGE ACT OF 1934 FOR THE FISCAL YEAR ENDED SEPTEMBER 30, 201725, 2021
( )☐ TRANSITION REPORT PURSUANT TO SECTION 13 OR 15 (d) OF THE SECURITIES EXCHANGE ACT OF 1934 FOR THE TRANSITION PERIOD FROM TO
Commission File No. 0-14616000-14616
Registrant's telephone number, including area code: (856) 665-9533
J & J&J SNACK FOODS CORP.
(Exact name of registrant as specified in its charter)
New Jersey | 22-1935537 |
| (I.R.S. Employer Identification No.) |
incorporation or organization)
6000 Central Highway | 08109 | |
Pennsauken, New Jersey | (Zip Code) | |
|
Registrant's telephone number, including area code: (856) 665-9533
Securities Registered Pursuant to Section 12(b) of the Act:
Title of Each Class | Trading Symbols(s) | Name of Each Exchange on Which Registered |
Common Stock, no par value | JJSF | The NASDAQ Global Select Market |
Securities Registered Pursuant to Section 12(g) of the Act: None
Indicate by check mark if the registrant is a well-known seasoned issuer, as defined in Rule 405 of the Securities Act. Yes _X_☒ No __☐
Indicate by check mark if the registrant is not required to file reports pursuant to Section 13 or 15(d) of the Act. Yes ___☐ No X ☒
Indicate by check mark whether the registrant (1) has filed all reports required to be filed by Section 13 or 15(d) of the Securities Exchange Act of 1934 during the preceding 12 months (or such shorter period that the registrant was required to file such reports), and (2) has been subject to such filing requirements for the past 90 days. Yes X ☒ No ___☐
Indicate by check mark whether the registrant has submitted electronically and posted on its corporate Website, if any, every Interactive Data File required to be submitted and posted pursuant to Rule 405 of Regulation S-T (§(§232.405 of this chapter) during the preceding 12 months (or for such shorter period that the registrant was required to submit and post such files).
Yes X No ___
Indicate by check mark if disclosure of delinquent filers pursuant to Item 405 of Regulation S-K (229.405 of this chapter) is not contained herein, and will not be contained, to the best of registrant's knowledge, in definitive proxy or information statements incorporated by reference in Part III of this Form 10-K or any amendment to this Form 10-K. ___Yes ☒ No ☐
Indicate by check mark whether the registrant is a large accelerated filer, an accelerated filer, a non-accelerated filer, smaller reporting company, or an emerging growth company. See the definition of “large accelerated filer,” “accelerated filer,” “smaller reporting company,” and “emerging growth company” in Rule 12b-2 of the Exchange Act.
Large accelerated filer | Accelerated filer | ☐ | |
Non-accelerated filer | Smaller reporting company | ||
| |||
| Emerging growth company | ☐ |
If an emerging growth company, indicate by check mark if the registrant has elected not to use the extended transition period for complying with any new or revised financial accounting standards provided pursuant to Section 13(a) of the Exchange Act.
Indicate by check mark whether the registrant has filed a report on and attestation to its management’s assessment of the effectiveness of its internal control over financial reporting under Section 404(b) of the Sarbanes-Oxley Act (15 U.S.C. 7262(b)) by the registered public accounting firm that prepared or issued its audit report. Yes ☒ No ☐
Indicate by check mark whether the registrant is a shell company (as defined in Rule 12b-2 of the Exchange Act). Yes___Yes ☐ No X_ ☒
March 24, 201726, 2021 was the last business day of the registrant’sregistrant’s most recently completed second fiscal quarter. The aggregate market value of the registrant’s common stock held by non-affiliates was $2,024,207,044,$2,398,906,547 based on the last sale price on March 24, 201726, 2021 of $136.31$157.64 per share. As of November 15, 2017, the latest practicable date, 18,664,02419, 2021, 19,084,586 shares of the registrant’s common stock were issued and outstanding.
DOCUMENTS INCORPORATED BY REFERENCE
Portions of the registrant’s definitive proxy statement for its Annual Meeting of Shareholders scheduled for February 9, 201816, 2022 are incorporated by reference into Part III of this report.
J & J SNACK FOODS CORP.
20172021 FORM 10-K ANNUAL REPORT
TABLE OF CONTENTS
Page
| ||
PART I | ||
Note About Forward-Looking Statements | 1 | |
Item 1 | Business | 1 |
Item 1A | Risk Factors | |
Item 1B | Unresolved Staff Comments | |
Item 2 | Properties | 11 |
Item 3 | Legal Proceedings | 12 |
Item 4 | Mine Safety Disclosures | 12 |
PART II | ||
Item 5 | Market For | |
Item 6 |
| 15 |
Item 7 |
| |
Item 7A | Quantitative And Qualitative Disclosures About Market Risk | |
Item 8 | Financial Statements And Supplementary Data | 27 |
Item 9 | Changes In And Disagreements With Accountants On Accounting And Financial Disclosure | |
Item 9A | Controls and Procedures | 27 |
Item 9B | Other Information |
|
PART III | ||
Item 10 | Directors, Executive Officers and Corporate Governance | |
Item 11 | Executive Compensation | 30 |
Item 12 | Security Ownership Of Certain Beneficial Owners And Management And Related Stockholder Matters | |
Item 13 | Certain Relationships And Related Transactions, and Director Independence | |
Item 14 | Principal Accountant Fees and Service | 31 |
PART IV | ||
Item 15 | Exhibits, Financial Statement Schedules | 31 |
Note About Forward-Looking Statements
In additionStatements made in this Form 10-K that are not historical or current facts are “forward-looking statements” made pursuant to historical information, this report containsthe safe harbor provisions of Section 27A of the Securities Act of 1933 (the “Act”) and Section 21E of the Securities Act of 1934, that involve substantial risks or uncertainties. These statements often can be identified by the use of terms such as “may,” “will,” “expect,” “believe,” “anticipate,” “estimate,” “projects,” “seek,” “predict,” “approximate,” or “continue,” or other similar references to future periods or the negative thereof. Statements addressing our future operating performance and statements addressing events and developments that we expect or anticipate will occur are also considered as forward-looking statements. TheWe intend that such forward-looking statements contained hereinbe subject to the safe harbors for such statements. We wish to caution readers not to place undue reliance on any such forward-looking statements, which speak on as of the date made. Any forward-looking statements represent management’s best judgment as to what may occur in the future. However, forward-looking statements are subject to certain risks, uncertainties, and uncertaintiesimportant factors beyond our control that could cause actual results and events to differ materially from historical results of operations and events and those projectedpresently anticipated or projected. We disclaim any obligation subsequently to revise, update, add or to otherwise correct, any forward-looking statements to reflect events or circumstances after the date of such statement or to reflect the occurrence of anticipated or unanticipated events. Furthermore, all subsequent written and oral forward-looking statements attributable to us or persons acting on our behalf are expressly qualified in their entirety by the forward-looking statements. Important factors that might cause such a difference include, but are not limited to, those discussedcautionary statements contained in the “Management’sthis report. The discussion and analysis of our financial condition and results of operations included in Item 7- Management’s Discussion and Analysis of Financial Condition and Results of Operations.” Readers are cautioned not to place undue reliance on these forward-lookingOperations should be read in conjunction with our consolidated financial statements which reflect management’s analysis only asand related notes included in Item 8 of the date hereof. We undertake no obligation to publicly revise or update these forward-looking statements to reflect events or circumstances that arise after the date hereof.this Form 10-K.
Part I
Item 1. Business
General
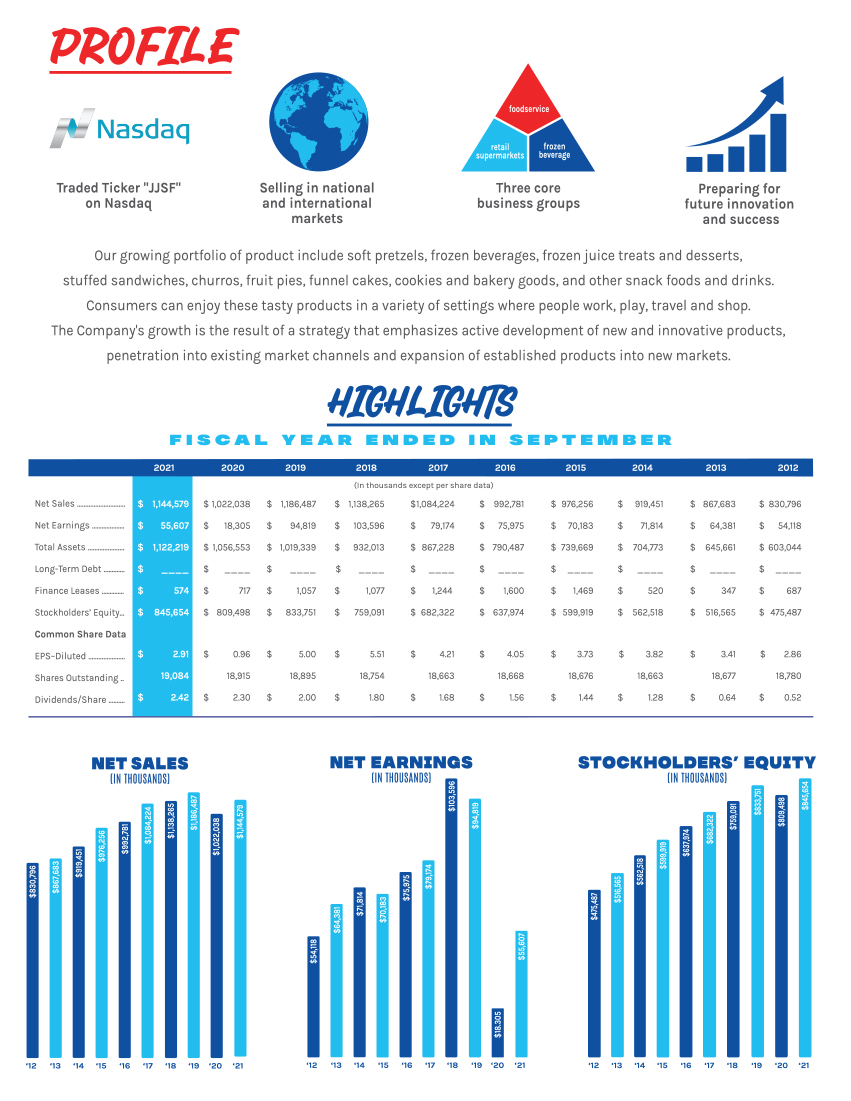
J & J Snack Foods Corp. (the “Company” or “J & J”) manufactures snack foods and distributes frozen beverages which it markets nationally to the food service and retail supermarket industries. The Company’s principal snack food products are soft pretzels marketed primarily under the brand names SUPERPRETZEL, BRAUHAUS, AUNTIE ANNE’S* and BAVARIAN BAKERY, frozen juice treats and dessertsnovelties marketed primarily under the LUIGI’S, WHOLE FRUIT, ICEE, DOGSTERS, PHILLY SWIRL, SOUR PATCH** and MINUTE MAID*** brand names, churros marketed primarily under the TIO PEPE’S and CALIFORNIA CHURROS and OREO** brand names and bakery products sold primarily under the READI-BAKE, COUNTRY HOME, MARY B’S, DADDY RAY’S and HILL & VALLEY brand names as well as for private label and contract packing. J & J believes it is the largest manufacturer of soft pretzels in the United States. Other snack food products include funnel cake sold under THE FUNNEL CAKE FACTORY brand and dough enrobed handheld products sold under the PATIO brand and other smaller brands as well.brands. The Company’s principal frozen beverage products are the ICEE brand frozen carbonated beverage and the SLUSH PUPPIE brand frozen non-carbonated beverage.
The Company’s Food Service and Frozen Beverages sales are made primarily to food service customers including snack bar and food stand locations in leading chain, department, discount, warehouse club and convenience stores; malls and shopping centers; fast food and casual dining restaurants; stadiums and sports arenas; leisure and theme parks; movie theatres; independent retailers; and schools, colleges and other institutions. The Company’s retail supermarket customers are primarily supermarket chains.
* AUNTIE ANNE’S is a registered trademark of Auntie Anne’s LLC
** SOUR PATCH is a registered trademark of Mondelēz International Group
*** Minute Maid is a registered trademark of the Coca-Cola Company
The Company was incorporated in 1971 under the laws of the State of New Jersey.
The Company has made acquisitions as described in “Management’s Discussion and Analysis of Financial Condition and Results of Operations” and our consolidated financial statements and related notes thereto.
The Company operates in three business segments: Food Service, Retail Supermarkets and Frozen Beverages. These segments are described below.
The Chief Operating Decision Maker for Food Service, and Retail Supermarkets and the Chief Operating Decision Maker for Frozen Beverages monthly reviewreviews detailed operating income statements and sales reports in order to assess performance and allocate resourcesresources to each individual segment. Sales and operating income are key variables monitored by the Chief Operating Decision MakersMaker and management when determining each segment’s and the company’s financial condition and operating performance. In addition, the Chief Operating Decision Makers reviewMaker reviews and evaluateevaluates depreciation, capital spending and assets of each segment on a quarterly basis to monitor cash flow and asset needs of each segment (see Item 7 – Management’s Discussion and Analysis of Financial Condition and Results of Operations and Item 8 – Financial Statements and Supplementary Data for financial information about segments).segments.
Food Service
The primary products sold by the food service segment are soft pretzels, frozen juice treats and desserts,novelties, churros, dough enrobed handheld products and baked goods. Our customers in the food service segment include snack bars and food stands in chain, department and discount stores; malls and shopping centers; casual dining restaurants; fast food and casual dining restaurants; stadiums and sports arenas; leisure and theme parks; convenience stores; movie theatres; warehouse club stores; schools, colleges and other institutions. Within the food service industry, our products are purchased by the consumer primarily for consumption at the point-of-sale.
Retail Supermarkets
The primary products sold to the retail supermarket channel are soft pretzel products – including SUPERPRETZEL and AUNTIE ANNE’S, frozen juice treats and dessertsnovelties including LUIGI’S Real Italian Ice, MINUTE MAID Juice Bars and Soft Frozen Lemonade, WHOLE FRUIT frozen fruit bars and sorbet, PHILLY SWIRL cups and sticks, SOUR PATCH sticks, ICEE Squeeze-Up Tubes and dough enrobed handheld products including PATIO burritos.products. Within the retail supermarket channel, our frozen and prepackaged products are purchased by the consumer for consumption at home.
Frozen Beverages
We sell frozen beverages to the food service industry primarily under the names ICEE, SLUSH PUPPIE and PARROT ICE in the United States, Mexico and Canada. We also provide repair and maintenance serviceservices to customers for customers’ owned equipment.
Products
Soft Pretzels
The Company’s soft pretzels are sold under many brand names; some of which are: SUPERPRETZEL, PRETZEL FILLERS, PRETZELFILS, GOURMET TWISTS, MR. TWISTER, SOFT PRETZEL BITES, SOFTSTIX, SOFT PRETZEL BUNS, TEXAS TWIST,BAVARIAN BAKERY,SUPERPRETZEL BAVARIAN, NEW YORK PRETZEL, KIM & SCOTT’S GOURMET PRETZELS, SERIOUSLY TWISTED!, BRAUHAUS, AUNTIE ANNE’S***ANNE’S AND LABRIOLA; and, to a lesser extent, under private labels.
Soft pretzels are sold in the Food Service and Retail Supermarket segments. Soft pretzel sales amounted to 20% of the Company’s revenue in both fiscal year 2017, 20% in 2016years 2021 and 2020, and 21% in 2015.2019.
Certain of the Company’s soft pretzels qualify under USDA regulations as the nutritional equivalent of bread for purposes of the USDA school lunch program, thereby enabling a participating school to obtain partial reimbursement of the cost of the Company’s soft pretzels from the USDA.
The Company’s soft pretzels are manufactured according to a proprietary formula. Soft pretzels, ranging in size from one to twenty-four ounces in weight, are shaped and formed by the Company’s twister machines. These soft pretzel tying machines are automated, high-speed machines for twisting dough into the traditional pretzel shape. Additionally, we make soft pretzels which are extruded or shaped by hand. Soft pretzels, after processing, are primarily quick-frozen in either raw or baked form and packaged for delivery.
The Company’s principal marketing program in the Food Service segment includes supplying ovens, mobile merchandisers, display cases, warmers and similar merchandising equipment to the retailer to prepare and promote the sale of soft pretzels. Some of this equipment is proprietary, including combination warmer and display cases that reconstitute frozen soft pretzels while displaying them, thus eliminating the need for an oven. The Company retains ownership of the equipment placed in customer locations, and as a result, customers are not required to make an investment in equipment.
Frozen Juice Treats and DessertsNovelties
The Company’s frozen juice treats and dessertsnovelties are marketed primarily under the LUIGI’S, WHOLE FRUIT, PHILLY SWIRL, SOUR PATCH, ICEE and MINUTE MAID brand names. Frozen juice treats and dessertsnovelties are sold in the Food Service and Retail Supermarkets segments. Frozen juice treats and dessertnovelties sales were 11%13% of the Company’s revenue in fiscal year 2017,2021, 12% in 20162020 and 13%10% in 2015.2019.
The Company’s school food service LUIGI’S and WHOLE FRUIT frozen juice bars and cups contain three to four ounces of 100% apple or pineapple juice with no added sugar and 100% of the daily US FDA value of vitamin C. The juice bars are produced in various flavors and are packaged in a sealed push-up paper container referred to as the Milliken M-pak, which the Company believes has certain sanitary and safety advantages.
The balance of the Company’s frozen juice treats and dessertsnovelties products are manufactured from water, sweeteners and fruit juice concentrates in various flavors and packaging including cups, tubes, sticks, M-paks and pints. Several of the products contain ice cream and WHOLE FRUIT contains pieces of fruit.
Churros
The Company’s churros are sold primarily under the TIO PEPE’S and CALIFORNIA CHURROS and OREO brand names. Churros are sold to the Food Service and Retail Supermarkets segments. Churro sales were 6% of the Company’s sales in fiscal year 2017, 6%2021, 5% in fiscal year 20162020 and 6% in 2015.2019. Churros are Hispanic pastries in stick form which the Company produces in several sizes according to a proprietary formula. The churros are deep fried, frozen and packaged. At food service point-of-sale they are reheated and topped with a cinnamon sugar mixture. The Company also sells fruit and crème-filled churros. The Company supplies churro merchandising equipment similar to that used for its soft pretzels.
Handheld Products
The Company's dough enrobed handheld products are marketed under the PATIO, SUPREME STUFFERS and SWEET STUFFERS brand names and under private labels. Handheld products are sold to the Food Service and Retail Supermarket segments. Handheld product sales amounted to 5%7% of the Company’s sales in fiscal year 2017, 4%2021, 5% in 20162020 and 4% in 2015.2019.
Bakery Products
The Company’s bakery products are marketed under the MRS. GOODCOOKIE, READI-BAKE, COUNTRY HOME, MARY B’S, DADDY RAY’S and HILL & VALLEY brand names, and under private labels. Bakery products include primarily biscuits, fig and fruit bars, cookies, breads, rolls, crumb, muffins and donuts. Bakery products are sold to the Food Service segment. Bakery products sales amounted to 32% of the Company’s sales in fiscal year 2017, 30%2021, 35% in 20162020 and 31%32% in 2015.2019.
Frozen Beverages
The Company markets frozen beverages primarily under the names ICEE, SLUSH PUPPIE and PARROT ICE which are sold primarily in the United States, Mexico and Canada. Frozen beverages are sold in the Frozen Beverages segment.
Frozen beverage sales amounted to 15%11% of the Company’s revenue in fiscal year 2017, 15%2021, 10% in 20162020 and 15% in 2015.2019.
Under the Company’s principal marketing program for frozen carbonated beverages, it installs frozen beverage dispensers for its ICEE brand at customer locations and thereafter services the machines, arranges to supply customers with ingredients required for production of the frozen beverages, and supports customer retail sales efforts with in-store promotions and point-of-sale materials. In most cases, the Company retains ownership of its dispensers, and as a result, customers are not required to make an investment in equipment or arrange for the ingredients and supplies necessary to produce and market the frozen beverages. The Company sells frozen non-carbonated beverages under the SLUSH PUPPIE and PARROT ICE brands through a distributor network and through its own distribution network. The Company also provides repair and maintenance service to customers for customers’ ownedcustomer-owned equipment and sells equipment in its Frozen Beverages segment. Revenue from equipment sales and repair and maintenance services totaled 9% of the Company’s sales in fiscal 2017, 10%year 2021, 11% in 20162020 and 9%11% in 2015.2019.
Each new frozen carbonated customer location requires a frozen beverage dispenser supplied by the Company or by the customer. Company-supplied frozen carbonated dispensers are purchased from outside vendors or rebuilt by the Company.
The Company provides managed service and/or products to approximately 125,000119,000 Company-owned and customer-owned dispensers.
The Company has the rights to market and distribute frozen beverages under the name ICEE to the entire continental United States (except for portions of four states) as well as internationally.
Other Products
Other products sold by the Company include funnel cakes sold under the FUNNEL CAKE FACTORY brand name and smaller amounts of various other food products. These products are sold in the Food Service and Frozen Beverages segments.
Customers
The Company sells its products to two principal channels: food service and retail supermarkets. The primary products sold to the food service channel are soft pretzels, frozen beverages, frozen juice treats and desserts,novelties, churros, dough enrobed handheld products and baked goods. The primary products sold to the retail supermarket channel are soft pretzels, frozen juice treatsnovelties and desserts and dough enrobed handheld products.
We have several large customers that account for a significant portion of our sales. Our top ten customers accounted for 42%43%, 42%43% and 43% of our sales during fiscal years 2017, 20162021, 2020 and 2015,2019, respectively, with our largest customer accounting for 9%11% of our sales in 2017, 8%2021, 13% of our sales in 20162020 and 8%11% of our sales in 2015. Three2019. Five of the ten customers in 2021 are food distributors who sell our product to many end users. The loss of one or more of our large customers could adversely affect our results of operations. These customers typically do not enter into long-term contracts and make purchase decisions based on a combination of price, product quality, consumer demand and customer service performance. If our sales to one or more of these customers are reduced, this reduction may adversely affect our business. If receivables from one or more of these customers become uncollectible, our operating income would be adversely impacted.
The Food Service and the Frozen Beverages segments sell primarily to food service channels. The Retail Supermarkets segment sells primarily to the retail supermarket channel.
The Company’s customers in the food service segment include snack bars and food stands in chain, department and mass merchandising stores, malls and shopping centers, fast food and casual dining restaurants, stadiums and sports arenas, leisure and theme parks, convenience stores, movie theatres, warehouse club stores, schools, colleges and other institutions, and independent retailers. Machines and machine parts are sold to other food and beverage companies. Within the food service industry, the Company’s products are purchased by the consumer primarily for consumption at the point-of-sale.
The Company sells its products to an estimated 85-90% of supermarkets in the United States. Products sold to retail supermarket customers are primarily soft pretzel products, including SUPERPRETZEL and AUNTIE ANNE’S, frozen juice treats and dessertsnovelties including LUIGI’S Real Italian Ice, MINUTE MAID Juice Bars and Soft Frozen Lemonade, WHOLE FRUIT frozen fruit bars, WHOLE FRUIT Sorbet, PHILLY SWIRL cups and sticks, MARY B’S biscuits and dumplings, DADDY RAY’S fig and fruit bars, HILL & VALLEY baked goods, and ICEE Squeeze-Up Tubes, PATIO burritos and OREO Churros.Tubes. Within the retail supermarket industry, the Company’s frozen and prepackaged products are purchased by the consumer for consumption at home.
Marketing and Distribution
The Company has developed a national marketing program for its products. For the Food Service and Frozen Beverages segments’ customers, this marketing program includes providing ovens, mobile merchandisers, display cases, warmers, frozen beverage dispensers and other merchandising equipment for the individual customer’s requirements and point-of-sale materials as well as participating in trade shows and in-store demonstrations. The Company’s ongoing advertising and promotional campaigns for its Retail Supermarket segment’s products include trade shows, newspaper advertisements with coupons and consumer advertising campaigns.campaigns across traditional and digital channels.
The Company develops and introduces new products on a routine basis. The Company evaluates the success of new product introductions on the basis of sales and profit levels, which are reviewed no less frequently than monthly by the Company’s Chief Operating Decision Makers.Maker.
The Company’s products are sold through a network of about 100 food brokers, independent sales distributors and the Company’s own direct sales force. For its snack food products, the Company maintains warehouse and distribution facilities in Pennsauken, Bellmawr and Bridgeport, New Jersey; Vernon (Los Angeles) and Colton, California; Brooklyn, New York; Scranton, Pittsburgh, Hatfield and Lancaster, Pennsylvania; Carrollton (Dallas), Texas; Atlanta, Georgia; Moscow Mills (St. Louis), Missouri; Pensacola and Tampa, Florida; Solon, Ohio; Weston, Oregon; Holly Ridge, North Carolina; Alsip (Chicago)Carolina and Rock Island, Illinois. Frozen beverages and machine parts are distributed from 164177 Company managed warehouse and distribution facilities located in 44 states, Mexico and Canada, which allow the Company to directly service its customers in the surrounding areas. The Company’s products are shipped in refrigeratedfrozen and other vehicles from the Company’s manufacturing and warehouse facilities on a fleet of Company operated tractor-trailers, trucks and vans, as well as by independent carriers.
Seasonality
The Company’s sales are seasonal because frozen beverage sales and frozen juice treats and dessertsnovelties sales are generally higher during the warmer months.
Trademarks and Patents
The Company has numerous trademarks, the most important of which are SUPERPRETZEL, TEXAS TWIST, NEW YORK PRETZEL, BAVARIAN BAKERY, MR. TWISTER, SOFT PRETZEL BITES, SOFTSTIX, PRETZEL FILLERS, PRETZELFILS, BRAUHAUS and LABRIOLA for its pretzel products; SHAPE-UPS, WHOLE FRUIT, PHILLY SWIRL and LUIGI’S for its frozen juice treats and desserts;novelties; TIO PEPE’S and CALIFORNIA CHURROS for its churros; ARCTIC BLAST, SLUSH PUPPIE and PARROT ICE for its frozen beverages; FUNNEL CAKE FACTORY for its funnel cake products, PATIO for its handheld burritos and MRS. GOODCOOKIE, READI-BAKE, COUNTRY HOME, CAMDEN CREEK, MARY B’S, DADDY RAY’S and HILL & VALLEY for its bakery products.
The Company markets frozen beverages under a license to use the trademark ICEE in all of the continental United States except for portions of four states, and in Mexico and Canada. Additionally, the Company has the international rights to the trademark ICEE.
The trademarks, when renewed and continuously used, have an indefinite term and are considered important to the Company as a means of identifying its products. The Company considers its trademarks important to the success of its business.
The Company has numerous patents related to the manufacturing and marketing of its product.
Supplies
The Company’s manufactured products are produced from raw materials which are readily available from numerous sources. With the exception of the Company’s churro production equipment, funnel cake production equipment and soft pretzel twisting equipment, all of which are made for J & J by independent third parties, and certain specialized packaging equipment, the Company’s manufacturing equipment is readily available from various sources. Syrup for frozen beverages is purchased primarily from The Coca-Cola Company, Dr Pepper Snapple Group, Inc., the Pepsi Cola Company, and Jogue, Inc. Cups, straws and lids are readily available from various suppliers. Parts for frozen beverage dispensing machines are purchased from several sources. Frozen beverage dispensers are purchased primarily from IMI Cornelius, Inc. and FBD Partnership.
Competition
Snack food and bakery products markets are highly competitive. The Company’s principal products compete against similar and different food products manufactured and sold by numerous other companies, some of which are substantially larger and have greater resources than the Company. As the soft pretzel, frozen juice treat and dessert,novelties, bakery products and related markets evolve, additional competitors and new competing products may enter the markets. Competitive factors in these markets include product quality, customer service, taste, price, identity and brand name awareness, method of distribution and sales promotions.
The Company believes it is the only national distributor of soft pretzels. However, there are numerous regional and local manufacturers of food service and retail supermarket soft pretzels as well as several chains of retail pretzel stores.
In Frozen Beverages the Company competes directly with other frozen beverage companies. These include several companies which have the right to use the ICEE name in portions of four states. There are many other regional frozen beverage competitors throughout the country and one large retail chain which uses its own frozen beverage brand.
The Company competes with large soft drink manufacturers for counter and floor space for its frozen beverage dispensing machines at retail locations and with products which are more widely known than the ICEE, SLUSH PUPPIE and PARROT ICE frozen beverages.
The Company competes with a number ofseveral other companies in the frozen juice treat and dessertnovelties and bakery products markets.
Risks Associated with Foreign Operations
Foreign operations generally involve greater risk than doing business in the United States. Foreign economies differ favorably or unfavorably from the United States’ economy in such respects as the level of inflation and debt, which may result in fluctuations in the value of the country’s currency and real property. Sales of our foreign operations were $31,001,000, $27,075,000$20,754,000, $15,421,000 and $25,313,000$33,906,000 in fiscal years 2017, 20162021, 2020 and 2015,2019, respectively. At September 30, 2017,25, 2021, the total assets of our foreign operations were approximately $39$25 million or 4.5%2.2% of total assets. At September 24, 2016,26, 2020, the total assets of our foreign operations were approximately $29$20 million or 3.7%1.9% of total assets.
Employees
The Company has about 4,2004,300 full and part time employees and approximately 1,500800 workers employed by staffing agencies as of September 30, 2017.25, 2021. About 1,200 production and distribution employees throughout the Company are covered by collective bargaining agreements.
The Company considers its employee relations to be good.
Available Information
The Company’s internet address is www.jjsnack.com.www.jjsnack.com. On the investor relations section of its website, the Company provides free access to its annual report on Form 10-K, quarterly reports on Form 10-Q, current reports on Form 8-K and any amendments to these reports, as soon as reasonably practicable after such materials are electronically filed with, or furnished to, the Securities and Exchange Commission (“SEC”). The information on the website listed above is not and should not be considered part of this annual report on Form 10-K and is not incorporated by reference in this document.
Item1A. Risk Factors
You should carefully consider the risks described below, together with all of the other information included in this report, in considering our business and prospects. The risks and uncertainties described below are not the only ones facing us. Additional risks and uncertainties not presently known to us or that we currently deem insignificant may also impair our business operations. FollowingThe following is a discussion of known potentially significant risks which could result in harm to our business, financial condition or results of operations.
Risks Related to COVID-19
The global COVID-19 pandemic of 2020 and 2021 continues to affect our operations. Approximately 2/3 of the Company’s sales are to venues and locations that previously shut down or sharply curtailed their food service operations as a result of COVID-19. While the majority of these venues have re-opened, the extent of the future impact of COVID-19 on our operations depends on future developments of the virus and its effects which is uncertain at this point in time. Furthermore any economic downturn caused by any pandemic, epidemic or other disease outbreak, comparable or similar to COVID-19, may also cause substantial changes in consumer behavior, adversely affecting results of operations and our financial position, some of which we may not be able to predict with certainty.
Risks of Shortages or Increased Cost of Raw Materials
We are exposed to the market risks arising from adverse changes in commodity prices, affecting the cost of our raw materials and energy. The raw materials and energy which we use for the production and distribution of our products are largely commodities that are subject to price volatility and fluctuations in availability caused by changes in global supply and demand, weather conditions, agricultural uncertainty or governmental controls. We purchase these materials and energy mainly in the open market. Our procurement practices are intended to reduce the risk of future price increases, but also may potentially limit the ability to benefit from possible price decreases. If commodity price changes result in increases in raw materials and energy costs, we may not be able to increase our prices to offset these increased costs without suffering reduced volume, revenue and operating income.
General Risks of the Food Industry
Food processors are subject to the risks of adverse changes in general economic conditions; evolving consumer preferences and nutritional and health-related concerns; changes in food distribution channels; federal, state and local food processing controls or other mandates; changes in federal, state, local and international laws and regulations, or in the application of such laws and regulations; consumer product liability claims; risks of product tampering;tampering and contamination; and negative publicity surrounding actual or perceived product safety deficiencies. The increased buying power of large supermarket chains, other retail outlets and wholesale food vendors could result in greater resistance to price increases and could alter the pattern of customer inventory levels and access to shelf space.
Risks of Shortages or Increased Costs of Labor
Our businesses operate in highly competitive markets. The labor market in the United States is very competitive. We depend on the skills, working relationships, and continued services of employees, including our experienced management team. We must hire, train and develop effective employees. We compete with other companies both within and outside of our industry for talented employees, and we may lose key personnel or fail to attract, train, and retain other talented personnel. In addition, our ability to achieve our operating goals depends on our ability to identify, hire, train, and retain qualified individuals. Any such loss or failure could adversely affect our product sales, financial condition, and operating results. Additionally, a shortage in the labor pool and other general inflationary pressures or changes, and applicable laws and regulations could increase labor costs, which could have a material adverse effect on our consolidated operating results or financial condition.
Environmental Risks
The disposal of solid and liquid waste material and the discharge of airborne pollutants resulting from the preparation and processing of foods is subject to various federal, state and local laws and regulations relating to the protection of the environment. Such laws and regulations have an important effect on the food processing industry as a whole, requiring substantially all firms in the industry to incur material expenditures for modification of existing processing facilities and for construction of upgraded or new waste treatment facilities.
We cannot predict what environmental legislation or regulations will be enacted in the future, how existing or future laws or regulations will be administered or interpreted or what environmental conditions may be found to exist. Enactment of more stringent laws or regulations or more strict interpretation of existing laws and regulations may require additional expendituresexpenditure by us, some of which could be material. Additionally, the failure by any one or more of our suppliers to comply with applicable federal, state and local laws and regulations relating to the protection of the environment, or allegations of non-compliance, may disrupt their operations and could result in accompanying disruptions to our operations.
Risks Resulting from Customer Concentration
We have several large customers that account for a significant portion of our sales. Our top ten customers accounted for 42%43%, 42%43% and 43% of our sales during fiscal years 2017, 20162021, 2020 and 2015,2019, respectively, with our largest customer accounting for 9%11% of our sales in 2017, 8%2021, 13% of our sales in 20162020 and 8%11% of our sales in 2015. Three2019.
Five of the ten customers are food distributors who sell our product to many end users. The loss of one or more of our large customers could adversely affect our results of operations. These customers typically do not enter into long-term contracts and make purchase decisions based on a combination of price, product quality, consumer demand and customer service performance. If our sales to one or more of these customers are reduced, this reduction may adversely affect our business. If receivables from one or more of these customers become uncollectible, our operating income would be adversely impacted.
Competition
Our businesses operate in highly competitive markets. We compete against national and regional manufacturers and distributors on the basis of price, quality, product variety, brand recognition and loyalty, and effective distribution. Many of our major competitors in the market are larger and have greater financial and marketing resources than we do. Increased competition and anticipated actions by our competitors could lead to downward pressure on prices and/or a decline in our market share, either of which could adversely affect our results. See “Competition” in Item 1 for more information about our competitors.
Risks Relating to Manufacturing and Distribution
Our ability to purchase, manufacture and distribute products is critical to our success. DamageBecause we source certain products from single manufacturing sites, it is possible that we could experience a production disruption that results in a reduction or disruptionelimination of the availability of some of our products. If we are not able to obtain alternate production capability in a timely manner, or on favorable terms, it could have a negative impact on our business, results of operations, financial condition and cash flows, including the potential for long-term loss of product placement with various customers. We are also subject to risks of other business disruptions associated with our dependence on production facilities and distribution systems. Natural disasters, terrorist activity, cyberattacks or other unforeseen events could interrupt production or distribution and have a material adverse effect on our business, results of operations, financial condition and cash flows, including the potential for long-term loss of product placement with our customers.
Risks Relating to the Availability and Costs of Transportation
Our ability to obtain adequate and reasonably priced methods of transportation to distribute our products, including refrigerated trailers for many of our products, is a key factor to our manufacturing or distribution capabilitiessuccess. Delays in transportation, including weather-related delays, and carrier capacity limitations, could have a material adverse effect on our business and results of operations. Further, higher fuel costs and increased line haul costs due to weather, natural disaster, fireindustry capacity constraints, customer delivery requirements and a more restrictive regulatory environment could also negatively impact our financial results. We pay fuel surcharges that fluctuate with the price of diesel fuel to third-party transporters of our products, and such surcharges can be substantial. Any sudden or explosion, terrorism, pandemic, political upheaval, labor strikes, work stoppages or other reasonsdramatic increases in the price of diesel fuel would serve to increase our fuel surcharges and our cost of goods sold. These higher costs could impairhave a material adverse effect on our business, results of operations, financial condition and cash flows.
Risks Relating to Manufacturing Capacity Constraints
Our current manufacturing resources may be inadequate to meet significantly increased demand for some of our food products. Our ability to manufactureincrease our manufacturing capacity depends on many factors, including the equipment delivery, construction lead-times, installation, qualification, regulatory permitting and regulatory requirements. A lack of sufficient manufacturing capacity to meet demand could cause our customer service levels to decrease, which may negatively affect customer demand for our products and customer relations generally, which in turn could have a material adverse effect on our business, results of operations, financial condition and cash flows. In addition, operating facilities at or distributenear capacity may also increase production and distribution costs and negatively affect relations with our products.employees or contractors, which could result in disruptions in our operations.
New Jersey Law and Provisions of Our Amended and Restated Certificate of Incorporation and Bylaws May Inhibit a Change In Control
The New Jersey Shareholders' Protection Act, N.J.S.A. 14A:10A-1, et.et seq., may delay, deter or prevent a change in control by prohibiting the Company from engaging in a business combination transaction with an interested shareholder for a period of five years after the person becomes an interested stockholder, even if a majority of our shareholders believe a change in control would be in the best interests of the Company and its shareholders. In addition, our Amended and Restated Certificate of Incorporation and Bylaws contain provisions that may delay, deter or prevent a future acquisition of J & J Snack Foods Corp. not approved by our Board of Directors. This could occur even if our shareholders are offered an attractive value for their shares or if a substantial number or even a majority of our shareholders believe the takeover is in their best interest. These provisions are intended to encourage any person interested in acquiring us to negotiate with and obtain the approval of our Board of Directors in connection with the transaction. Provisions of our Amended and Restated Certificate of Incorporation and Bylaws that could delay, deter or prevent a future acquisition include the following:
-- | a classified Board of Directors; |
-- |
|
-- |
|
-- |
|
-- |
|
| the ability of the Board of Directors to consider the interests of various constituencies, including our employees, customers, suppliers, creditors and the local communities in which we operate; |
-- | shareholders do not generally have the |
-- |
|
-- | our Bylaws contain |
|
|
Risks Relating to Gerald B. Shreiber
GeraldGerald B. Shreiber is the founder President, Chief Executive Officer and Chairman of the Board of Directors of the Company and the currentCompany. He is currently beneficial owner of 20%18% of its outstanding common stock.stock, held in a trust for his benefit. Our Amended and Restated Certificate of Incorporation provides that Mr. Shreiber has three votes on any matter to be acted upon by the Board of Directors (subject to certain adjustments). Therefore, he and one other director would have the ability to approve any matter before the Board. The performance of this Company is greatly impacted by his leadership and decisions. His retirement, disability or death may have a significant impact on our future operations.
Risk Related to Increases in our Health Insurance Costs and Costs of Compliance with the Patient Protection and Affordable Care Act and the Health Care and Education Reconciliation Act of 2010
The costs of employee health care insurance have been increasing in recent years due to rising health care costs, legislative changes, and general economic conditions. Additionally, we may incur additional costs because of the Patient Protection and Affordable Care Act and the Health Care and Education Reconciliation Act of 2010 (collectively, the “Health Care Reform Laws”). Provisions of these laws have become and will become effective over the past several years and at various dates over the next several years. Because of the breadth and complexity of these laws and the phased-in nature of the newhealth care regulations as well as other health care reform legislation considered by Congress and state legislatures, we cannot predict with certainty the future effect of these laws on us. A continued increase in health care costs or additional costs incurred as a result of the Health Care Reform Lawsnew or the enforcement of the Health Care Reform Laws or other futureexisting health care reform laws imposed by Congress or state legislationschanges in enforcement policies could have a negative impact on our financial position and results of operations.
Risk Related to Product Changes
There are risks in the marketplace related to trade and consumer acceptance of product improvements, packing initiatives and new product introductions.
Risks Related to ChangeChanges in the Business
Our ability to successfully manage changes to our business processes, including selling, distribution, product capacity, information management systems and the integration of acquisitions, will directly affect our results of operations.
Risks Associated with Foreign Operations
Foreign operations generally involve greater risk than doing business in the United States. Foreign economies may differ favorably or unfavorably from the United States’ economy in such respects as the level of inflation and debt, which may result in fluctuations in the value of the country’s currency and real property. Further, there may be less government regulation in various countries, and we may face difficulty in enforcing our legal rights outside the United States. Additionally, in some foreign countries, there is the possibility of expropriation or confiscatory taxation limitations on the removal of property or other assets, political or social instability or diplomatic developments which could affect the operations and assets of U.S. companies doing business in that country. Any such difficulties noted above could effect our business. Sales of our foreign operations were $31,001,000, $27,075,000$20,754,000, $15,421,000 and $25,313,000$33,906,000 in fiscal years 2017, 20162021, 2020 and 2015,2019, respectively. At September 30, 2017,25, 2021, the total assets of our foreign operations were approximately $39$25 million or 4.5%2.2% of total assets. At September 24, 2016,26, 2020, the total assets of our foreign operations were approximately $29$20 million or 3.7%1.9% of total assets.
Risks associatedAssociated with our information technology systemsInformation Technology Systems
The efficient operation of our business depends on our information technology systems. We rely on our information technology systems to effectively manage our business data, communications, supply chain, manufacturing, order entry and fulfillment, and other business processes. The failure of our information technology systems (including those provided to us by third parties) to perform as we anticipate could disrupt our business and could result in billing, collecting, and ordering errors, processing inefficiencies, and the loss of sales and customers, causing our business and results of operations to suffer.
In addition, ourOur information technology systems may be vulnerable to damage or interruption from circumstances beyond our control, including fire, natural disasters, systems failures, security breaches or intrusions (including those against our third-party providers and theft of customer, consumer or other confidential data), and viruses. IfAlthough we continue to monitor our information technology networks, if we are unable to prevent physical and electronic break-ins, cyber-attacks and other information security breaches, we may suffer financial and reputational damage, be subject to litigation or incur remediation costs or penalties because of the unauthorized disclosure of confidential information belonging to us or to our partners, customers, suppliers or employees.
We may experience difficulties in implementing the final phases of our new enterprise resource planning system. We are in the late stages of a multi-year implementation of a new enterprise resource planning system (“ERP”), which is replacing our existing financial and operating systems. The design and implementation of this new ERP has required an investment of significant personnel and financial resources, including substantial expenditures for outside consultants and software. We may not be able to implement the ERP successfully without experiencing delays, increased costs and other difficulties, including potential design defects, miscalculations, testing requirements, and the diversion of management’s attention from day-to-day business operations. If we are unable to implement the new ERP as planned, the effectiveness of our internal control over financial reporting could be adversely affected, our ability to assess those controls adequately could be delayed, and our business, results of operations, financial condition and cash flows could be negatively impacted.
Risks Associated with Real or Perceived Safety Issues Regarding our Food Products
We sell food products for human consumption, which involves risks such as product contamination or spoilage, product tampering, other adulteration of food products, mislabeling, and misbranding. We can be impacted by both real and unfounded claims regarding the safety of our operations, or concerns regarding mislabeled, adulterated, contaminated or spoiled food products. Any of these circumstances could necessitate a voluntary or mandatory recall due to a substantial product hazard, a need to change a product’s labeling or other consumer safety concerns. A pervasive product recall may result in significant loss due to the costs of a recall, related legal claims, including claims arising from bodily injury or illness caused by our products, the destruction of product inventory, or lost sales due to product unavailability. A highly publicized product recall, whether involving us or any related products made by third parties, also could result in a loss of customers or an unfavorable change in consumer sentiment regarding our products or any category in which we operate. In addition, an allegation of noncompliance with federal or state food laws and regulations could force us to cease production, stop selling our products or create significant adverse publicity that could harm our credibility and decrease market acceptance of our products. Any of these events could have a material adverse effect on our business, results of operations, financial condition and cash flows.
Seasonality and Quarterly Fluctuations
Our sales are affected by the seasonal demand for our products. Demand is greater during the summer months primarily as a result of the warm weather demand for our ICEE and frozen juice treats and dessertsnovelties products. Because of seasonal fluctuations, there can be no assurance that the results of any particular quarter will be indicative of results for the full year or for future years.
Item 1B. Unresolved Staff Comments
We have no unresolved SEC staff comments to report.
Item 2. Properties
The Company’s primary east coast manufacturing facility is located in Pennsauken, New Jersey in a 70,000 square foot building on a two-acre lot. Soft pretzels, churros, and funnel cake are manufactured at this Company-owned facility which also serves as the Company’s corporate headquarters. This facility operates at approximately 65% of capacity. The Company owns a 128,000 square foot building adjacent to this manufacturing facility which contains a large freezer for warehousing and distribution purposes. The warehouse has a utilization rate of 80-90% depending on product demand. The Company leases, through January 2022, 16,000 square feet of office and warehouse space located next to the Pennsauken, New Jersey plant and owns a 43,000 square foot office and warehouse building in the same complex.
The Company owns a 150,000 square foot building on eight acres in Bellmawr, New Jersey. The facility is used by the Company to manufacture some of its products including funnel cake,soft pretzels and churros. The facility operates at about 75%various lines of capacity.baked goods.
The Company’s primary west coast manufacturing facility is located in Vernon (Los Angeles), California. It consists of a 137,000 square foot facility in which soft pretzels, churros and various lines of baked goods are produced and warehoused. Included in the 137,000 square foot facility is a 30,000 square foot freezer used for warehousing and distribution purposes. The facility is leased through November 2030. The Company leases an additional 80,000 square feet of office and warehouse space, adjacent to its manufacturing facility, through November 2030. The manufacturing facility operates at approximately 50% of capacity.
The Company leases a 22,000 square foot soft pretzel manufacturing facility located in Brooklyn, New York. The lease runs through August 2023. The facility operates at about 60% of capacity.
The Company leases through June 2030 a 45,000 square foot churros and funnel cake manufacturing facility located in Colton, California which operates at approximately 50% of capacity.California.
The Company leases an 85,000 square foot bakery manufacturing facility located in Atlanta, Georgia. The lease runs through December 2020. The facility operates at about 55% of capacity.2022.
The Company leases a 129,000 square foot bakery manufacturing facility located in Rock Island, Illinois. The lease runs through December 2034. The facility operates at about 80% of capacity.
The Company owns a 46,000 square foot frozen juice treat and dessertnovelties manufacturing facility and a 42,000 square foot dry storage warehouse located on six acres in Scranton, Pennsylvania. The manufacturing facility operates at approximately 70% of capacity.
The Company leases a 29,600 square foot soft pretzel manufacturing facility located in Hatfield, Pennsylvania. The lease runs through June 2032. The facility operates at approximately 50% of capacity.
The Company leases a 48,000 square foot soft pretzel manufacturing facility located in Carrollton, Texas. The lease runs through April 2019. The facility operates at approximately 85% capacity.2026. The Company leases an additional property containing a 6,500 square foot storage freezer across the street from the manufacturing facility, which lease expires May 2021.
The Company leases a 177,500 square foot soft pretzel manufacturing facility located in Alsip, Illinois. The lease runs through March 2030. The facility operates at approximately 30% of capacity.
The Company’s fresh bakery products manufacturing facility and offices are located in Bridgeport, New Jersey in three buildings totaling 133,000 square feet. The buildings are leased through December 2025. The manufacturing facility operates at approximately 65% of capacity.
The Company owns a 165,000 square foot fig and fruit bar manufacturing facility located on 9-1/2 acres in Moscow Mills (St. Louis), Missouri. The facility operates at about 65% of capacity.
The Company leases a building in Pensacola, Florida for the manufacturing, packing and warehousing of dumplings. The building is approximately 14,000 square feet and the lease runs through December 2018. The manufacturing facility operates at approximately 70% of capacity.
The Company owns an 84,000 square foot handheld products manufacturing facility in Holly Ridge, North Carolina which operates at about 60% of capacity.Carolina.
The Company leases a 70,000 square foot handheld products manufacturing facility in Weston, Oregon which operates at about 40% of capacity. The facility is leased through June 30, 2031. The Company leases an additional 11,300 square foot freezer storage facility in Weston, Oregon which expires May 13, 2021.2023.
The Company leases 84,000 square feet of office space in LaVergne (Nashville), Tennessee through February 2035 for its ICEE headquarters.
The Company leases a 39,000 square foot frozen juice treat and dessertnovelties manufacturing facility in Tampa, Florida which operates at about 40% of capacity. The facility is leased through September 2023.
The Company also leases approximately 160 warehouse and distribution facilities in 44 states, Mexico and Canada.
Item 3.Legal Proceedings
The Company has no material pending legal proceedings, other than ordinary routine litigation incidental to the business, to which the Company or any of its subsidiaries is a party or of which any of their property is subject.
Item 4. Mine Safety Disclosures
Not Applicable
PART II
| Item 5.Market For Registrant’s Common Equity, Related Stockholder Matters And Issuer Purchases Of Equity Securities |
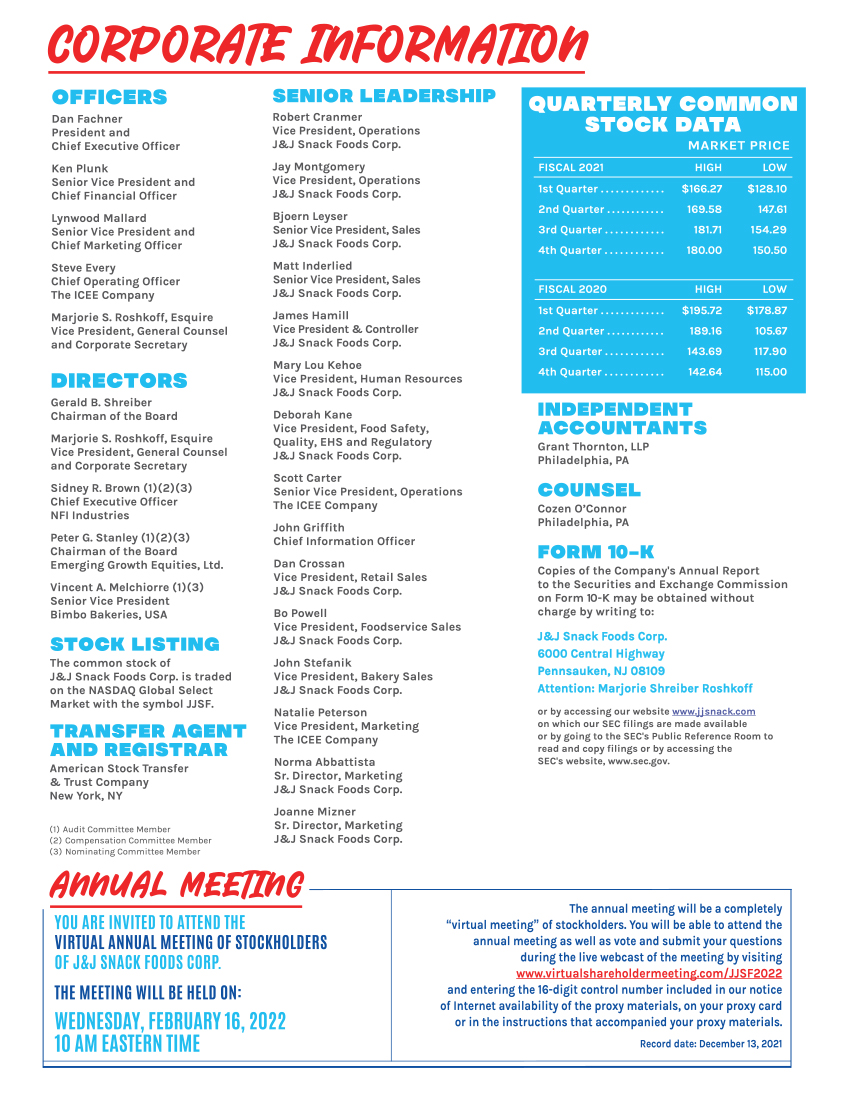
The Company’s common stock is traded on the NASDAQ Global Select Market under the symbol “JJSF.” The following table sets forth the high and low sale price quotations as reported by NASDAQ and dividend information for the common stock for each quarter of the years ended September 24, 201626, 2020 and September 30, 2017.25, 2021.
| Common Stock Market Price | Common Stock Market Price | |||||||||||||||||||||||
Dividend | Dividend | |||||||||||||||||||||||
High | Low | Declared | High | Low | Declared | |||||||||||||||||||
Fiscal 2016 | ||||||||||||||||||||||||
Fiscal 2021 | ||||||||||||||||||||||||
First quarter | $ | 125.62 | $ | 110.76 | $ | 0.3900 | $ | 166.27 | $ | 128.10 | $ | 0.575 | ||||||||||||
Second quarter | 119.99 | 102.90 | 0.3900 | 169.58 | 147.61 | 0.575 | ||||||||||||||||||
Third quarter | 113.93 | 97.73 | 0.3900 | 181.71 | 154.29 | 0.633 | ||||||||||||||||||
Fourth quarter | 125.18 | 111.04 | 0.3900 | 180.00 | 150.50 | 0.633 | ||||||||||||||||||
Fiscal 2017 | ||||||||||||||||||||||||
Fiscal 2020 | ||||||||||||||||||||||||
First quarter | $ | 135.04 | $ | 102.81 | $ | 0.4200 | $ | 195.72 | $ | 178.87 | $ | 0.575 | ||||||||||||
Second quarter | 143.21 | 124.57 | 0.4200 | 189.16 | 105.67 | 0.575 | ||||||||||||||||||
Third quarter | 142.28 | 121.20 | 0.4200 | 143.69 | 117.90 | 0.575 | ||||||||||||||||||
Fourth quarter | 138.38 | 124.10 | 0.4200 | 142.64 | 115.00 | 0.575 | ||||||||||||||||||
As of September 30, 2017,25, 2021, we had approximately 15,00026,000 beneficial shareholders.
We did not purchase any shares of our common stock in our fiscal year ended September 28, 2019.
In our fiscal year ended September 26, 2015,2020, we purchased and retired 72,69865,648 shares of our common stock at a cost of $8,011,118.$8,972,292, all of which was purchased in our second quarter.
In our fiscal year ended September 24, 2016, we purchased and retired 141,700
We did not purchase any shares of our common stock at a cost of $15,265,019.
Inin our fiscal year ended September 30, 2017, we purchased and retired 142,665 shares of our common stock at a cost of $18,228,763. In our second quarter, we purchased and retired 12,926 shares at a cost of $1,682,342. In our third quarter, we purchased and retired 13,004 shares at a cost of $1,691,357. In our fourth quarter, we purchased and retired 116,735 shares at a cost of $14,855,064. The following sets forth the amount of our common stock purchased by the Company during the fourth quarter of fiscal 2017:25, 2021.
Total Number of Shares | Maximum Number of | |||||||||||||||||
Purchased as part of | Shares that may yet be | |||||||||||||||||
Total Number of | Average Price | Publicly announced | Purchased under the | |||||||||||||||
Period: | Shares Purchased | Paid per Share | Plans or Programs | Plan or Programs | ||||||||||||||
June 25, 2017-July 22, 2017 | - | - | - | - | ||||||||||||||
July 23, 2017-August 19, 2017 | 48,490 | $ | 128.31 | 48,490 | 473,355 | |||||||||||||
August 20, 2017-September 30, 2017 | 68,245 | $ | 126.51 | 68,245 | 405,110 | |||||||||||||
Total | 116,735 | $ | 127.26 | 116,735 | 405,110 | |||||||||||||
A plan to purchase 500,000 shares was announced on November 8, 2012 .2012. 500,000 shares were purchased under this plan with the last purchase in August 2017.
A plan to purchase 500,000 shares was announced on August 4, 2017 with no expiration date. 318,858 shares remain to be purchased under this plan.
For information on the Company’sCompany’s Equity Compensation Plans, please see Item 12 herein.
Stock Performance Graph
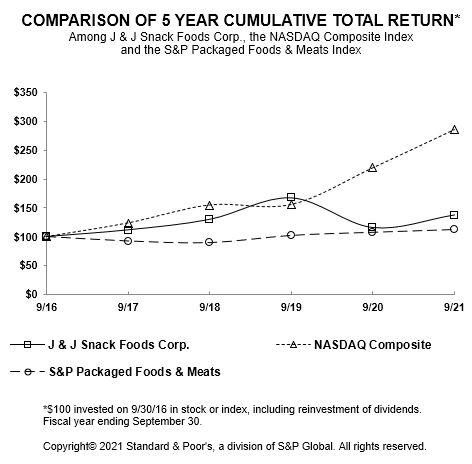
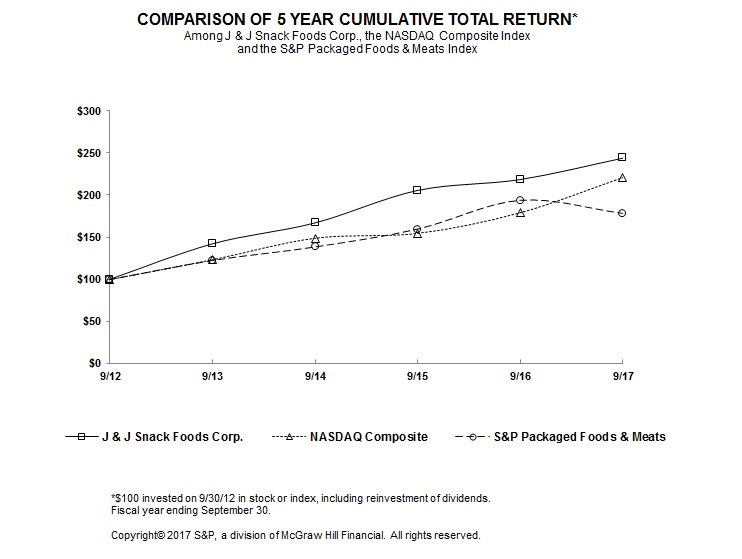 |
Item 6. Selected Financial Data[ RESERVED ]
The selected financial data for the last five years was derived from our audited consolidated financial statements. The following selected financial data should be read in conjunction with “Management’s
Item 7.Management’s Discussion And Analysis Of Financial Condition And Results Of Operations
This Management’s Discussion and Analysis of Financial Condition and Results of Operations”Operations (“MD&A”) is intended to provide a reader of our financial statements with a narrative from the perspective of our management regarding our financial condition and results of operations, liquidity and certain other factors that may affect our future results. The following discussion should be read in conjunction with the consolidated financial statements and relatedaccompanying notes thereto, especially as the information pertains to fiscal 2015, 2016 and 2017.included in Item 8 of this Form 10-K.
| Fiscal year ended in September | ||||||||||||||||||||
| (In thousands except per share data) | ||||||||||||||||||||
2017 | 2016 | 2015 | 2014 | 2013 | ||||||||||||||||
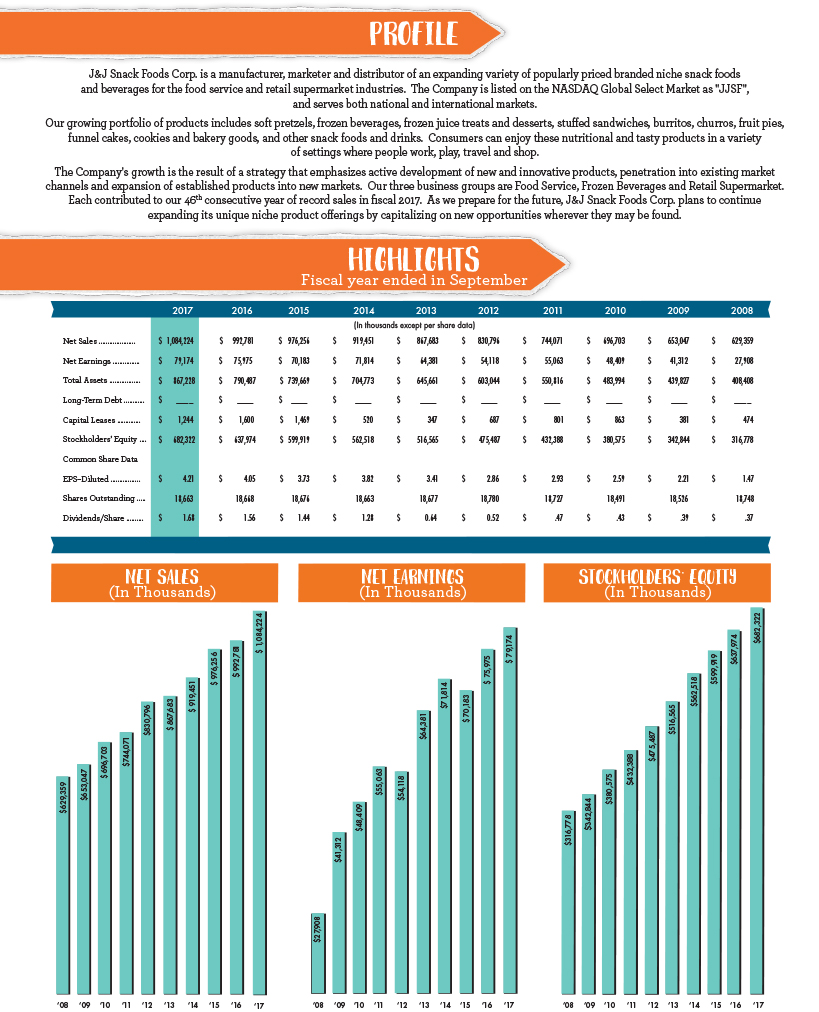
Net Sales | $ | 1,084,224 | $ | 992,781 | $ | 976,256 | $ | 919,451 | $ | 867,683 | ||||||||||
Net Earnings | $ | 79,174 | $ | 75,975 | $ | 70,183 | $ | 71,814 | $ | 64,381 | ||||||||||
Total Assets | $ | 867,228 | $ | 790,487 | $ | 739,669 | $ | 704,773 | $ | 645,661 | ||||||||||
Long-Term Debt | $ | - | $ | - | $ | - | $ | - | $ | - | ||||||||||
Capital Lease Obligations | $ | 1,244 | $ | 1,600 | $ | 1,469 | $ | 520 | $ | 347 | ||||||||||
Stockholders' Equity | $ | 682,322 | $ | 637,974 | $ | 599,919 | $ | 562,518 | $ | 516,565 | ||||||||||
Common Share Data | ||||||||||||||||||||
Earnings Per Diluted Share | $ | 4.21 | $ | 4.05 | $ | 3.73 | $ | 3.82 | $ | 3.41 | ||||||||||
Earnings Per Basic Share | $ | 4.23 | $ | 4.07 | $ | 3.76 | $ | 3.85 | $ | 3.43 | ||||||||||
Common Shares Outstanding At Year End | 18,663 | 18,668 | 18,676 | 18,663 | 18,677 | |||||||||||||||
Cash Dividends Declared Per Common Share | $ | 1.68 | $ | 1.56 | $ | 1.44 | $ | 1.28 | $ | 0.64 | ||||||||||
Item 7. Management’s Discussion And Analysis Of Financial Condition And Results Of Operations
In addition to historical information, this document and analysis contains forward-looking statements. The forward-looking statements contained herein are subject to certain risks and uncertainties that could cause actual results to differ materially from those projected in the forward-looking statements. Important factors that might cause such a difference include, but are not limited to, those discussed in the “Management’s Discussion and Analysis of Financial Condition and Results of Operations.” Readers are cautioned not to place undue reliance on these forward-looking statements, which reflect management’s analysis only as of the date hereof. We undertake no obligation to publicly revise or update these forward-looking statements to reflect events or circumstances that arise after the date hereof.
Critical Accounting Policies, Judgments and Estimates
We prepare our financial statements in conformity with accounting principles generally accepted in the United States of America. The preparation of such financial statements requires management to make estimates and assumptions that affect the reported amounts of assets and liabilities and disclosures of contingent assets and liabilities at the date of those financial statements and the reported amounts of revenues and expenses during the reporting period. Actual results could differ from those estimates.
The Company discloses its significant accounting policies in the accompanying notes to its audited consolidated financial statements.
Judgments and estimates of uncertainties are required in applying the Company’s accounting policies in certain areas. Following are some of the areas requiring significant judgments and estimates: revenue recognition, accounts receivable, cash flow and valuation assumptions in performing asset impairment tests of long-lived and intangible assets, estimates of the value and useful lives of intangible assets, insurance reserves, inventories, and income taxes.
There are numerous critical assumptions that may influence accounting estimates in these and other areas. We base our critical assumptions on historical experience, third-party data, and various other estimates we believe to be reasonable. A description of the aforementioned policies follows:
Revenue Recognition - We adopted the new revenue recognition guidance on the first day of our fiscal 2019 year using a modified retrospective approach; however, we did not record a cumulative-effect adjustment from initially applying the standard as the adoption did not have a material impact on our financial position or results of operations. We completed a review of customer contracts and evaluated the impact of the new standard on certain common practices currently employed by us. We also finalized our assessment of the impact on our accounting policies, processes, system requirements, internal controls and disclosures.
When Performance Obligations Are Satisfied
A performance obligation is a promise in a contract to transfer a distinct good or service to the customer and is the unit of account for revenue recognition. A contract’s transaction price is allocated to each distinct performance obligation and recognized as revenue when, or as, the performance obligation is satisfied.
The singular performance obligation of our customer contracts for product and machine sales is determined by each individual purchase order and the respective products ordered, with revenue being recognized at a point-in-time when the obligation under the terms of the agreement is satisfied and product control is transferred to our customer. Specifically, control transfers to our customers when the product is delivered to, installed, or picked up by our customers based upon applicable shipping terms, as our customers can direct the use and obtain substantially all of the remaining benefits from the product at this point in time. The performance obligations in our customer contracts for product are generally satisfied within 30 days.
The singular performance obligation of our customer contracts for time and material repair and maintenance equipment service is the performance of the repair and maintenance with revenue being recognized at a point-in-time when the repair and maintenance is completed.
The singular performance obligation of our customer repair and maintenance equipment service contracts is the performance of the repair and maintenance with revenue being recognized over the time the service is expected to be performed. Our customers are billed for service contracts in advance of performance and therefore we have contract liability on our balance sheet.
Significant Payment Terms
In general, within our customer contracts, the purchase order identifies the product, quantity, price, pick-up allowances, payment terms and final delivery terms. Although some payment terms may be more extended, presently the majority of our payment terms are 30 days. As a result, we have used the available practical expedient and, consequently, do not adjust our revenues for the effects of a significant financing component.
Shipping
All amounts billed to customers related to shipping and handling are classified as revenues; therefore, we recognize revenue from ourfor shipping and handling fees at the time the products are shipped or when services are performed. The cost of shipping products to the customer is recognized at the time the products are shipped to the customer and our policy is to classify them as Distribution expenses.
Variable Consideration
In addition to fixed contract consideration, our contracts include some form of variable consideration, including sales discounts, trade promotions and certain other sales and consumer incentives, including rebates and coupon redemptions. In general, variable consideration is treated as a reduction in revenue when the related revenue is recognized. Depending on the specific type of variable consideration, we use the most likely amount method to determine the variable consideration. We believe there will be no significant changes to our estimates of variable consideration when any related uncertainties are resolved with our customers. RepairWe review and maintenance equipment service revenue is recorded when it is performed ifupdate our estimates and related accruals of variable consideration each period based on historical experience.
Warranties & Returns
We provide all customers with a standard or assurance type warranty. Either stated or implied, we provide assurance the customer termsrelated products will comply with all agreed-upon specifications and other warranties provided under the law. No services beyond an assurance warranty are that the customer isprovided to be charged onour customers.
We do not grant a time and material basisgeneral right of return. However, customers may return defective or recorded onnon-conforming products. Customer remedies may include either a straight-line basis over the termcash refund or an exchange of the contract when the customer has signed a service contract. Revenue is recognized only where persuasive evidence of an arrangement exists, our price is fixed or estimable and collectability is reasonably assured.product. We record offsets to revenue for allowances, end-user pricing adjustments, trade spending, coupon redemption costs and returned product. Customers generally do not have theestimate a right toof return product unless it is damaged or defective. Off-invoice allowances are deducted directly from the amount invoiced to our customer whenand related refund liability as returns of our products are shipped to the customer. Offsets to revenuerare.
Contract Balances
Our customers are billed for allowances, end-user pricing adjustmentsservice contracts in advance of performance and trade spending are recorded primarily as a reduction of accounts receivable basedtherefore we have contract liability on our estimatesbalance sheet as follows:
Fiscal Year Ended | ||||||||
September 25, | September 26, | |||||||
2021 | 2020 | |||||||
(in thousands) | ||||||||
Beginning Balance | $ | 1,327 | $ | 1,334 | ||||
Additions to contract liability | 5,544 | 5,526 | ||||||
Amounts recognized as revenue | (5,774 | ) | (5,533 | ) | ||||
Ending Balance | $ | 1,097 | $ | 1,327 | ||||
Disaggregation of liability Revenue
See Note N of the Notes to our Consolidated Financial Statements for disaggregation of our net sales by class of similar product and type of customer.
Allowance for Doubtful Receivables
We provide an allowance for doubtful receivables after taking into consideration historical experience and other factors. On September 27, 2020, the Company adopted guidance issued by the FASB in ASU 2016-13 Measurement of Credit Losses on Financial Instruments, which are based on customer programs and historical experience. These offsetsrequires companies to revenue are estimated primarilyrecognize an allowance that reflects a current estimate of credit losses expected to be incurred over the life of the asset. Adoption of this new guidance did not have a material impact on the quantityconsolidated financial statements. The Company continuously monitors collections and payments from its customers and maintains a provision for estimated credit losses. The allowance for doubtful accounts considers a number of product purchased over specific time periods. For our Retail Supermarket and Frozen Beverages segments, we accrue forfactors including the liability based on products sold multiplied by per product offsets. Offsets to revenue for our Food Service segment are calculated in a similar manner for offsets owed to our direct customers; however, because shipments to end-users are unknown to us until reported by our direct customers or byage of receivable balances, the end-users, there is a greater degreehistory of uncertainty as to the accuracylosses, expectations of the amounts accrued for end-user offsets. Additional uncertainty may occur as customers take deductions when they make payments to us. This creates complexities because our customers do not always provide reasons for the deductions taken. Additionally, customers may take deductions to which they are not entitledfuture credit losses and the length of time customers take deductionscustomers’ ability to which they are entitled can vary from two weeks to well over a year. Because of the aforementioned uncertainties, the process to determine these estimates requires judgment. We feel that due to constant monitoring of the process, including but not limited to comparing actual results to estimates madepay off obligations. The allowance for doubtful receivables was $1,405,000 and $1,388,000 on a monthly basis, these estimates are reasonable in all material respects. Our recorded liability for allowances, end-user pricing adjustmentsSeptember 25, 2021 and trade spending was approximately $13.0 million at September 30, 2017 and $14.3 million at September 24, 2016.26, 2020, respectively.
Accounts Receivable - We record accounts receivable at the time revenue is recognized. Bad debt expense is recorded in marketing and administrative expenses. The amount of the allowance for doubtful accounts is based on our estimate of the accounts receivable amount that is uncollectable. It is comprised of a general reserve based on historical experience and amounts for specific customers’ accounts receivable balances that we believe are at risk due to our knowledge of facts regarding the customer(s). We continually monitor our estimate of the allowance for doubtful accounts and adjust it monthly. We usually have approximately 1528 customers with accounts receivable balances of between $1 million to $10 million with one customer having a balance of approximately $14 million. Failure of these customers, and others with lesser balances, to pay us the amounts owed, could have a material impact on our consolidated financial statements.
Accounts receivable due from any of our customers is subject to risk. Our total bad debt expense was $122,000, $525,000$338,000, $1,105,000 and $310,000$389,000 for the fiscal years 2017, 20162021, 2020 and 2015,2019, respectively. At September 30, 201725, 2021 and September 24, 2016,26, 2020, our accounts receivables were $124,553,000$162,939,000 and $98,325,000$126,587,000 net of an allowance for doubtful accounts of $359,000$1,405,000 and $571,000.$1,388,000.
Asset Impairment – We have three reporting units with goodwill totaling $102,511,000$121,833,000 as of September 30, 2017.25, 2021. Goodwill is evaluated annually by the Company for impairment. We perform impairment tests at year end for our reporting units, which is also the operating segment level, with recorded goodwill utilizing primarily the discounted cash flow method. This methodology used to estimate the fair value of the total Company and its reporting units requires inputs and assumptions (i.e. revenue growth, operating profit margins, capital spending requirements and discount rates) that reflect current market conditions. The estimated fair value of each reporting unit is compared to the carrying value of the reporting unit. If the carrying value of the reporting unit exceeds its fair value, the goodwill of the reporting unit is potentially impaired, and the Company then determines the implied fair value of goodwill, which is compared to the carrying value of goodwill to determine if impairment exists. Our tests at September 30, 201725, 2021 show that the fair value of each of our reporting units with goodwill exceeded its carrying value. Therefore, no further analysis was required. The inputs and assumptions used involve considerable management judgment and are based upon assumptions about expected future operating performance. Assumptions used in these forecasts are consistent with internal planning. The actual performance of the reporting units could differ from management’s estimates due to changes in business conditions, operating performance, economic conditions, competition, and consumer preferences.
Licenses and rights, customer relationships and non-compete agreements are being amortized by the straight-line method over periods ranging from 32 to 20 years and amortization expense is reflected throughout operating expenses. Long-lived assets, including fixed assets and amortizing intangibles, are reviewed for impairment as events or changes in circumstances occur indicating that the carrying amount of the asset may not be recoverable. Indefinite lived intangibles are reviewed annually for impairment. Cash flow and sales analyses are used to assess impairment. The estimates of future cash flows and sales involve considerable management judgment and are based upon assumptions about expected future operating performance. Assumptions used in these forecasts are consistent with internal planning. The actual cash flows and sales could differ from management’s estimates due to changes in business conditions, operating performance, economic conditions, competition, and consumer preferences.
Useful Lives of Intangible Assets - Most of our trade names and distribution rights which have carrying value have been assigned an indefinite life and are not amortized because we plan to receive the benefit from them indefinitely. If we decide to curtail or eliminate the use of any of the trade names or if sales that are generated from any particular trade name or distribution right do not support the carrying value of the trade name or distribution right, then we would record impairment or assign an estimated useful life and amortize over the remaining useful life. Rights such as prepaid licenses and non-compete agreements are amortized over contractual periods. The useful lives of customer relationships are based on the discounted cash flows expected to be received from sales to the customers adjusted for an attrition rate. The loss of a major customer or declining sales in general could create an impairment charge.
Insurance Reserves - We have a self-insured medical plan which covers approximately 1,600 of our employees. We record a liability for incurred but not yet reported or paid claims based on our historical experience of claims payments and a calculated lag time period. We maintain a spreadsheet that includes claims payments made each month according to the date the claim was incurred. This enables us to have an historical record of claims incurred but not yet paid at any point in the past. We then compare our accrued liability to the more recent claims incurred but not yet paid amounts and adjust our recorded liability up or down accordingly. Our recorded liability at September 30, 201725, 2021 and September 24, 201626, 2020 was $2,382,000$1,791,000 and $1,719,000,$1,737,000 respectively. Considering that we have stop loss coverage of $200,000 for each individual plan subscriber, the general consistency of claims payments and the short time lag, we believe that there is not a material exposure for this liability. Because of the foregoing, we do not engage a third party actuary to assist in this analysis.
We self-insure, up to loss limits, worker’sworkers’ compensation, automobile and automobilegeneral liability claims. Accruals for claims under our self-insurance program are recorded on a claims-incurred basis. Under this program, the estimated liability for claims incurred but unpaid in fiscal years 20172021 and 20162020 was $2,900,000$5,300,000 and $1,900,000$3,700,000, respectively. Our total recorded liability for all years’ claims incurred but not yet paid was $8,100,000$14,500,000 and $8,200,000$12,800,000 at September 30, 201725, 2021 and September 24, 2016,26, 2020, respectively. We estimate the liability based on total incurred claims and paid claims adjusting for loss development factors which account for the development of open claims over time. We estimate the amounts we expect to pay for some insurance years by multiplying incurred losses by a loss development factor which is based on insurance industry averages and the age of the incurred claims; our estimated liability is then the difference between the amounts we expect to pay and the amounts we have already paid for those years. Loss development factors that we use range from 1.0 to 2.0. However, for some years, the estimated liability is the difference between the amounts we have already paid for that year and the maximum we could pay under the program in effect for that particular year because the calculated amount we expect to pay is higher than the maximum. For other years, where there are few claims open, the estimated liability we record is the amount the insurance company has reserved for those claims. We evaluate our estimated liability on a continuing basis and adjust it accordingly. Due to the multi-year length of these insurance programs, there is exposure to claims coming in lower or higher than anticipated; however, due to constant monitoring and stop loss coverage of $350,000 on individual claims, we believe our exposure is not material. Because of the foregoing, we do not engage a third party actuary to assist in this analysis. In connection with these self-insurance agreements, we customarily enter into letters of credit arrangements with our insurers. At both September 30, 201725, 2021 and September 24, 2016,26, 2020, we had outstanding letters of credit totaling $8,675,000 and $8,675,000, respectively.$9,275,000.
Inventories - Inventories are valued at the lower of cost (determined by the first-in, first-out method) or market. We recognize abnormal amounts of idle facilities, freight, handling costs, and spoilage as charges of the current period. Additionally, we allocate fixed production overhead to inventories based on the normal capacity of our production facilities. We calculate normal capacity as the production expected to be achieved over a number of periods or seasons under normal circumstances, taking into account the loss of capacity resulting from planned maintenance. This requires us to use judgment to determine when production is outside the range of expected variation in production (either abnormally low or abnormally high). In periods of abnormally low production (for example, periods in which there is significantly lower demand, labor and material shortages exist, or there is unplanned equipment downtime) the amount of fixed overhead allocated to each unit of production is not increased. However, in periods of abnormally high production the amount of fixed overhead allocated to each unit of production is decreased to assure inventories are not measured above cost.
Income Taxes - We account for our income taxes under the liability method. Under the liability method, deferred tax assets and liabilities are determined based on the difference between the financial statement and tax bases of assets and liabilities as measured by the enacted tax rates that will be in effect when these differences reverse. Deferred tax expense is the result of changes in deferred tax assets and liabilities.
Refer to Note A to the accompanying consolidated financial statements for additional information on our accounting policies.
RESULTS OF OPERATIONS:OPERATIONS:
Fiscal 2017 (53Year 2021 (52 weeks) Compared to Fiscal Year 20162020 (52 weeks)
Net sales increased $91,443,000,$122,541,000, or 9%12%, to $1,084,224,000$1,144,579,000 in fiscal 20172021 from $992,781,000$1,022,038,000 in fiscal 2016. Excluding2020. As parts of the economy that impact our operations continue to open, sales from the extra week in 2017, sales increased approximately 7% from 2016 to 2017.
Excluding sales from Hill & Valley, Inc., acquired in January 2017, an ICEE distributor located in the Southeast acquired in June 2017 and Labriola Bakery which was acquired in August 2017 and the extra week in 2017, sales increased approximately 3% for the year.year improved from a year ago. Approximately 2/3 of the Company’s sales are to venues and locations that previously shut down or sharply curtailed their foodservice operations as a result of COVID-19. While the majority of these venues have re-opened, the extent of the future impact of COVID-19 on our operations depends on future developments of the virus and its effects which are uncertain at this point in time. As we have $305 million of cash and marketable securities on our balance sheet, we do not expect to have any liquidity issues, nor do we anticipate a material amount of our assets would be impaired.
We have three reportable segments, as disclosed in the accompanying notes to the consolidated financial statements: Food Service, Retail Supermarkets and Frozen Beverages.
The Chief Operating Decision Maker for Food Service, and Retail Supermarkets and the Chief Operating Decision Maker for Frozen Beverages reviews monthly review detailed operating income statements and sales reports in order to assess performance and allocate resourcesresources to each individual segment. Sales and operating income are the key variables monitored by the Chief Operating Decision MakersMaker and management when determining each segment’s and the company’sCompany’s financial condition and operating performance. In addition, the Chief Operating Decision Makers reviewMaker reviews and evaluateevaluates depreciation, capital spending and assets of each segment on a quarterly basis to monitor cash flow and asset needs of each segment.
FOOD SERVICE
Sales to food service customers increased $80,265,000$106,090,000, or 13%17%, to $701,794,000$724,983,000 in fiscal 2017. Excluding sales from the extra week in 2017, sales increased approximately 10% from 2016 to 2017. Excluding Hill & Valley and Labriola sales and the extra week in 2017, sales increased approximately 5% for the year.2021. Soft pretzel sales to the food service market increased 6%16% to $180,138,000$174,977,000 for the year with strong sales to restaurant chains and with sales increases and decreases throughout our customer base. Our new line of BRAUHAUS pretzels contributed to the increased sales. Excluding Labriola sales, soft pretzelyear. Frozen novelties sales increased 5%. Frozen juice bar and ices sales decreased $2,329,000,$9,429,000, or 4%27%, to $49,469,000$44,605,000 for the year due primarily to lower sales to warehouse club stores.year. Churro sales to food service customers were up 10%38% to $62,809,000$64,916,000 for the year with increased sales to restaurant chains and warehouse club stores.year. Sales of bakery products increased $56,839,000,$10,095,000, or 19%3%, to $342,609,000 for the year. Excluding Hill & Valley sales, bakery sales increased 7% for the year. Although sales increases and decreases were spread across our customer base, increased sales to two customers accounted for the entire sales increase, exclusive of Hill & Valley. Handheld sales to food service customers were up 35%110% to $36,913,000$75,627,000 in 2017 with sales increases to four customers accounting for about 75% of the increase.2021. Sales of funnel cake increased $780,000,$4,868,000, or 4%29% to $19,959,000 due primarily to increased sales to school food service and despite a sharp decline in sales to one restaurant chain. Overall food service sales to restaurant chains and school food service$21,491,000. Sales were strong for the year. Sales of new products in the first twelve months since their introduction were approximately $43 million for the year. Volume increases, including newup across all product sales and sales from acquired companies, accounted for virtually alllines as many of the food service sales increases. Price increases had a marginal impact on sales for the year. Operating income invenues and locations where our Food Service segment increased from $76,539,000 in 2016 to $81,208,000 in 2017 with primarily all of the increase coming in our fourth quarter because of strong sales of all product categories compared to last year’s fourth quarter and about $551,000 of operating income from Hill & Valley. Additionally, last year’s fourth quarter was impacted by roughly $1.5 million of costs related to certain bakery products are sold that were withdrawn from the market due to quality issues. Operating income for the 2017 year benefitted from a $1.8 million gain on insurance recovery recordedpreviously shut down or operating at reduced capacity in our third quarter related to last year’s product quality issues.
RETAIL SUPERMARKETS
Sales of products to retail supermarkets increased $1,658,0002020 have partially or 1% to $119,247,000fully re-opened in fiscal year 2017. Excluding sales from the extra week in 2017, sales decreased approximately 1/2 of 1 % from 2016 to 2017. Soft pretzel sales to retail supermarkets were $35,081,000 compared to $33,279,000 in 2016, an increase of 5%. About 3/4 of the pretzel sales increase was from sales of AUNTIE ANNE’S products, under a license agreement entered into this year. Sales of frozen juices and ices increased $2,401,000 or 3% to $71,325,000 primarily because of a reduction in trade spending which was higher than usual last year to introduce WHOLE FRUIT Organic juice tubes and new PHILLY SWIRL products and increased sales of the WHOLE FRUIT product line in general. Coupon redemption costs, a reduction of sales, increased 11% to $4,898,000 for the year. Handheld sales to retail supermarket customers decreased 3% to $14,892,000 for the year as sales of this product line in retail supermarkets continues its long-term decline. Sales of OREO churros, introduced last year, were approximately $2.5 million for the year compared to $4.0 million last year, with all of the decline in the fourth quarter. 2021.
Sales of new products in the first twelve months since their introduction were approximately $2.8$39 million for the year. Operating income in our Food Service segment increased from $6,458,000 in 2020 to $39,172,000 in 2021. The increase in operating income was primarily due to the increase in sales which improved margin efficiencies and expense leverage.
RETAIL SUPERMARKETS
Sales of products to retail supermarkets increased $7,732,000 or 4% to $184,897,000 in fiscal year 2021. Soft pretzel sales to retail supermarkets were $54,990,000, an increase of $5,833,000, or 12%, from sales in 2020. Sales of frozen novelties increased $11,316,000 or 13% to $100,059,000. Sales of biscuits and dumplings decreased 15% to $24,197,000 for the year. Handheld sales to retail supermarket customers decreased 38% to $7,547,000 for the year.
Sales of new products in the first twelve months since their introduction were approximately $1 million in fiscal year 2017. Price increases were negligible in 2017.2021. Operating income in our Retail Supermarkets segment increased from $9,618,000$23,202,000 to $10,627,000$25,914,000 for the year primarily because of approximately $2.5 million ofdue to higher trade spending in 2016 for the introduction of WHOLE FRUIT Organic juice tubes, OREO churros, PILLSBURY mini dessert pies and several PHILLY SWIRL products.volume.
FROZEN BEVERAGES
FrozenTotal frozen beverage and related productsegment sales increased 4% to $263,183,000$234,699,000 in fiscal 2017. Excluding sales from the extra week in 2017,2021 and beverage sales increased approximately 2% from 2016 to 2017. Excluding the acquired ICEE distributor and the extra week in 2017, sales increased approximately 1%16% or $17,494,000 for the year. BeverageGallon sales alone increased 7% or $10,125,00016% from last year. Service revenue decreased 3% to $81,305,000 for the year primarily due to the loss of a major customer in October 2020. Machines revenue, primarily sales of machines, decreased from $33,986,000 in 2020 to $26,953,000 in 2021 due to lower sales volumes with increasesa major customer. Overall, sales in the frozen beverage segment grew as key amusement, convenience, restaurants, and decreases throughout our customer base. Gallon sales were up 6%retail venues returned to pre-COVID capacity in our base ICEE business, with sales increases spread throughout our customer base. Service revenue increased 5% to $74,594,000 forthe second half of the year, with sales increases and decreases spread throughout our customer base. Sales of beverage machines, which tend to fluctuate from year to year while following no specific trend, decreased from $31,155,000offset a slower recovery in 2016 to $27,073,000 in 2017. the theater channel.
The estimated number of Company ownedCompany-owned frozen beverage dispensers was 25,00019,000 and 23,00027,000 at September 30, 201725, 2021 and September 24, 2016,26, 2020, respectively. Operating income in ourOur Frozen Beverage segment decreased from $26,653,000had operating income of $6,132,000 in 20162021 compared to $26,272,000an operating loss of $12,466,000 in 20172020 primarily as a result of higher beverage sales volume due primarily to lower machine sales and higher payroll and payroll related costs.COVID-19 recovery during 2021.
CONSOLIDATED
Other than as commented upon above by segment, there are no material specific reasons for the reported sales increases or decreases. Sales levels can be impacted by the appeal of our products to our customers and consumers and their changing tastes, competitive and pricing pressures, sales execution, marketing programs, seasonal weather, customer stability and general economic conditions.
Gross profit as a percentage of sales decreasedincreased to 30.53%26.1% in 20172021 from 30.67%23.3% in 2016. Without the lower gross profit percentage of the Hill & Valley business, gross profit percentage would have been 30.82% in 2017. Gross profit percentage compared2020. The increase is largely attributable to the previous year benefitted from higher volumes throughout our businessbenefit of increased sales, favorable product mix and lower trade spending in our retail supermarket business but was negatively impacted by higher payroll and payroll related costs throughout our business. Additionally this year’s grosscorresponding margin percentage benefitted from the $1.8 million gain on insurance recovery in contrast to the additional $1.5 million of related costs in last year in our food service segment.efficiencies.
Total operating expenses increased $21,259,000$6,477,000 to $212,916,000$227,710,000 in fiscal 2017 and2021 but as a percentage of sales increaseddecreased to 19.64%19.9% of sales from 19.31%21.6% in 2016.2020. Operating expenses this year included $1,273,000 of intangible asset impairment charges and operating expenses in 2020 included $6,387,000 of plant shutdown impairment costs for the shutdown of one of our manufacturing plants. Marketing and selling expenses were 8.71% and 8.66decreased to 6.8% this year from 8.3% of sales in 2017 and 2016, respectively.2020 driven by effective investment of marketing dollars aligned with sales recovery. Distribution expenses as a percent of sales increased to 7.55%9.5% from 7.36%9.1% in 20172020 due in part to higher shippingrising freight and fuel costs. Administrative expenses were 3.40%3.5% and 3.25%3.6% of sales in 20172021 and 2016, respectively as we incur costs to upgrade our information systems.2020, respectively.
Operating income increased $5,297,000$54,024,000 or 5%314% to $118,107,000$71,218,000 in fiscal year 20172021 as a result of the aforementioned items.
Our investments generated before tax income of $5.3$2,815,000 million this year, updown from $4.1 million$4,356,000 last year. Last year’s income was reduced by realized lossesyear due to decreases in the amount of $661,000 on sales of investments.investments and lower interest rates.
Other expenses thisOur effective tax rate in our fiscal 2021 year include $1,070,000 of expenses incurred to acquire Hill & Valley,was 24.9%. Net earnings for the ICEE distributor and Labriola Bakery.
The effective2020 year benefited from a reduction in income tax rate increasedexpense related to 35.2% from 35.0% last year. We expect thestate deferred taxes of approximately $2.2 million. Excluding this adjustment, our effective income tax rate for 2018 to be approximately 36%in our fiscal 2020 year was 25.0%.
Net earnings increased $3,199,000$37,302,000 or 4%204%, in the 53 weeks fiscal 20172021 to $79,174,000,$55,607,000, or $4.21$2.91 per diluted share, from $75,975,000,$18,305,000 or $4.05$0.96 per diluted share, in the 52 weeks fiscal 20162020 as a result of the aforementioned items.
There are many factors which can impact our net earnings from year to year and in the long run, among which are the supply and cost of raw materials and labor, insurance costs, factors impacting sales as noted above, the continuing consolidation of our customers, our ability to manage our manufacturing, marketing and distribution activities, our ability to make and integrate acquisitions and changes in tax laws and interest rates.
Fiscal 2016 (52 weeks) Compared to Fiscal Year 2015 (52 weeks)
Net sales increased $16,525,000, or 2%, to $992,781,000 in fiscal 2016 from $976,256,000 in fiscal 2015.
We have three reportable segments, as disclosed in the accompanying notes to the consolidated financial statements: Food Service, Retail Supermarkets and Frozen Beverages.
The Chief Operating Decision Maker for Food Service and Retail Supermarkets and the Chief Operating Decision Maker for Frozen Beverages monthly review detailed operating income statements and sales reports in order to assess performance and allocate resources to each individual segment. Sales and operating income are key variables monitored by the Chief Operating Decision Makers and management when determining each segment’s and the company’s financial condition and operating performance. In addition, the Chief Operating Decision Makers review and evaluate depreciation, capital spending and assets of each segment on a quarterly basis to monitor cash flow and asset needs of each segment.
FOOD SERVICE
Sales to food service customers increased $4,894,000 or less than 1%, to $621,529,000 in fiscal 2016. Soft pretzel sales to the food service market increased 1% to $170,155,000 for the year with sales increases and decreases throughout our customer base. Soft pretzel sales to restaurant chains were about the same this year and last year. Frozen juice bar and ices sales decreased $2,656,000, or 5%, to $51,798,000 for the year due primarily to lower sales to two customers. Churro sales to food service customers were up 1% to $57,318,000 for the year with sales increases and decreases throughout our customer base. Sales of bakery products decreased $6,617,000, or 2%, for the year with sales to one customer down $7.0 million as the customer added a secondary supplier. Handheld sales to food service customers were up 26% to $27,427,000 in 2016 with sales increases to one customer accounting for about 80% of the increase. Sales of funnel cake increased $7,000,000, or 57% to $19,179,000 due primarily to increased sales to school food service and $4.0 million of sales to a new restaurant chain customer. Sales of new products in the first twelve months since their introduction were approximately $32 million for the year. Price increases accounted for approximately $5 million of sales for the year and net volume, including new product sales as defined above, was essentially unchanged from last year. Operating income in our Food Service segment increased from $75,286,000 in 2015 to $76,539,000 in 2016. Operating income for the year benefitted from lower marketing expenses, lower ingredient costs, significantly increased volume of our handhelds and funnel cake products, pricing and more favorable product mix and was hurt by higher group health insurance costs and lower volume of our frozen juices and ices and bakery products. However, operating income in the fourth quarter decreased from $23,665,000 in 2015 to $17,498,000 in 2016 primarily because of a 2% decline in sales and higher manufacturing expenses. We anticipate that these issues will continue to affect us into the first quarter of fiscal year 2017. Additionally, approximately 1/4 of the decrease of $6,167,000 in operating income resulted from costs related to certain bakery products that were withdrawn from the market due to quality issues.
RETAIL SUPERMARKETS
Sales of products to retail supermarkets decreased $5,788,000 or 5% to $117,589,000 in fiscal year 2016. Soft pretzel sales to retail supermarkets were $33,279,000 compared to $35,727,000 in 2015, a decrease of 7%. About 1/2 of the pretzel sales decline was due to the discontinuance of SUPERPRETZEL BAVARIAN Soft Pretzel bread which was introduced in 2015. Sales of frozen juices and ices decreased $3,250,000 or 5% to $68,924,000. Increased trade spending to introduce WHOLE FRUIT Organic juice tubes and new PHILLY SWIRL products and general declines in sales of our existing PHILLY SWIRL products accounted for all of the sales decline in frozen juices and ices. PHILLY SWIRL sales were down primarily because of lower sales to a customer in Canada due to the stronger US dollar, lower sales to one warehouse club store which carried fewer SKUS this year and decreased sales to one retail supermarket customer of a product that is being discontinued. Although sales were down for the year, PHILLY SWIRL sales were marginally higher in the fourth quarter. Coupon redemption costs, a reduction of sales, which were higher in the first six months a year ago supporting the introduction of the SUPERPRETZEL BAVARIAN Soft Pretzel Bread, decreased 6% to $4,430,000 for the year. Handheld sales to retail supermarket customers decreased 19% to $15,347,000 for the year. Roughly 37% of the handhelds sales decline in the year resulted from increased trade spending to introduce PILLSBURY mini dessert pies. The balance of the sales decline was spread over our customer base. Sales of OREO churros, introduced this year, were approximately $4.0 million for the year, with about ½ of the sales coming in the fourth quarter.
Sales of new products in the first twelve months since their introduction were approximately $8 million in fiscal year 2016. Price increases accounted for approximately $2 million of sales for the year but higher trade spending of $6 million and volume decreases of $2 million resulted in an overall sales decline of $5.7 million. Operating income in our Retail Supermarkets segment decreased from $11,020,000 to $9,618,000 for the year primarily because of approximately $2 million of increased trade spending related to the introduction of WHOLE FRUIT Organic juice tubes, OREO churros, PILLSBURY mini dessert pies and other new products and lower soft pretzels and frozen juices and ices sales volume. However, operating income in the fourth quarter increased from $1,413,000 in 2015 to $1,793,000 in 2016 primarily because of a 4% increase in overall sales.
FROZEN BEVERAGES
Frozen beverage and related product sales increased 7% to $253,663,000 in fiscal 2016. Beverage sales alone increased 5% to $150,118,000 for the year with increases and decreases throughout our customer base. Gallon sales were up 6% in our base ICEE business, with sales to movie theaters accounting for about 3/4 of the increase. Service revenue increased 8% to $71,123,000 for the year with sales increases and decreases spread throughout our customer base. Sales of beverage machines, which tend to fluctuate from year to year while following no specific trend, increased from $26,413,000 in 2015 to $31,155,000 in 2016. The estimated number of Company owned frozen beverage dispensers was 23,000 and 22,000 at September 24, 2016 and September 26, 2015, respectively. Operating income in our Frozen Beverage segment increased from $24,582,000 in 2015 to $26,653,000 in 2016 due primarily to higher sales in all areas of the business.
CONSOLIDATED
Other than as commented upon above by segment, there are no material specific reasons for the reported sales increases or decreases. Sales levels can be impacted by the appeal of our products to our customers and consumers and their changing tastes, competitive and pricing pressures, sales execution, marketing programs, seasonal weather, customer stability and general economic conditions.
Gross profit as a percentage of sales decreased to 30.67% in 2016 from 30.82% in 2015. Gross profit percentage benefitted from lower ingredient costs, pricing and increased food service handhelds and funnel cake business which was more than offset by higher costs in our frozen beverages business and increased trade spending related to the introduction of WHOLE FRUIT Organic juice tubes, OREO churros, PILLSBURY mini dessert pies and new PHILLY SWIRL products in our retail supermarket business, as well as by lower volume in most of our food service segment and in our retail supermarket business and the product withdrawal in our food service segment mentioned previously.
Total operating expenses increased $1,655,000 to $191,657,000 in fiscal 2016 and as a percentage of sales decreased to 19.31% of sales from 19.46% in 2015. Marketing expenses were 8.66% and 8.72% of sales in 2016 and 2015, respectively. Distribution expenses as a percent of sales decreased to 7.36% from 7.60% in 2015 due in part to lower fuel costs and shipping efficiencies. Administrative expenses were 3.25% and 3.16% of sales in 2016 and 2015, respectively. Other general expense of $281,000 this year compared to other general income of $207,000 in 2015.
Operating income increased $1,922,000 or 2% to $112,810,000 in fiscal year 2016 as a result of the aforementioned items.
Our investments generated before tax income of $4.1 million this year, up from $1.2 million last year as sales of our mutual fund investments, net of capital gain distributions, generated a realized loss of $598,000 this year compared to a realized loss of $3.9 million last year. Although we recognized losses as we decreased our investments in mutual funds, our overall return on the mutual funds has been positive since we first made the investments in October 2012. We have reduced our investments in mutual funds over the past year to $13 million at September 2016 from $19 million at September 2015 and $128 million at September 2014. The remaining unrealized losses of $520,000 are spread over 4 funds with total fair market value of $12.5 million. The remaining mutual funds presently generate income of 4.9 % per year. We have invested $17 million in Fixed-to-Floating Perpetual Preferred Stock which generates fixed income to call dates in 2018, 2019 and 2025 and then income is based on a spread above LIBOR if the securities are not called. The annual yield from these investments is presently 5.5%, of which 70% is not subject to income tax. The mutual funds and the Fixed-to-Floating Perpetual Preferred Stock investment securities do not have contractual maturities; however, we classify them as long term assets as it is our intent to hold them for a period of over one year, although we may sell some or all of them depending on presently unanticipated needs for liquidity or market conditions. We have invested $103 million in corporate bonds which generate fixed income to maturity dates in 2017 through 2021, with $67 million maturing prior to the end of our fiscal year 2018. The bonds presently generate income of about 2.2% per year. Our expectation is that we will hold the corporate bonds to their maturity dates and redeem them at our amortized cost.
The effective income tax rate decreased to 35.0% from 37.3% last year because the realized losses on sales of our mutual fund investments in 2015 and 2016 are not deductible as we do not have capital gains to offset the losses and our income tax expense for 2016 benefitted by $885,000 related to share base compensation (see Note A13).
Net investment after tax income for the year of $2.7 million, or $.14 per share, compared to last year’s net investment after tax loss of $516,000, or $.03 per share.
Net earnings increased $5,792,000 or 8%, in fiscal 2016 to $75,975,000, or $.32 per diluted share as a result of the aforementioned items.
There are many factors which can impact our net earnings from year to year and in the long run, among which are the supply and cost of raw materials and labor, insurance costs, factors impacting sales as noted above, the continuing consolidation of our customers, our ability to manage our manufacturing, marketing and distribution activities, our ability to make and integrate acquisitions and changes in tax laws and interest rates.
RESULTS OF OPERATIONS:
Fiscal Year 2020 (52 weeks) Compared to Fiscal Year 2019 (52 weeks)
Net sales decreased $164,449,000, or 14%, to $1,022,038,000 in fiscal 2020 from $1,186,487,000 in fiscal 2019. Excluding sales from the acquisition of ICEE Distributors in October 2019 and BAMA ICEE in February 2020, sales decreased 15% for the year. Sales for our fourth quarter improved to being down approximately 19% from a year ago compared to being down 34% from a year ago in our third quarter as parts of the economy that impact our operations continue to open up. Approximately 2/3 of the Company’s sales are to venues and locations that have shut down or sharply curtailed their foodservice operations, and therefore we anticipate COVID-19 will continue to have a negative impact on our business. As we have $278 million of cash and marketable securities on our balance sheet, up from $267 million at March 28, 2020, we do not expect to have any liquidity issues, nor do we anticipate a material amount of our assets would be impaired.
FOOD SERVICE
Sales to food service customers decreased $117,094,000, or 16%, to $618,893,000 in fiscal 2020. Soft pretzel sales to the food service market decreased 28% to $150,786,000 for the year. Frozen novelties sales decreased $8,496,000, or 19%, to $35,176,000 for the year. Churro sales to food service customers were down 29% to $46,881,000 for the year. Sales of bakery products decreased $26,506,000, or 7%, to $332,514,000 for the year. Handheld sales to food service customers were up 14% to $36,088,000 in 2020 with sales of a new product to a warehouse club store customer accounting for all of the increase. Sales of funnel cake decreased $8,170,000, or 33% to $16,623,000. Sales were down across all product lines except handhelds as many of the venues and locations where our products are sold had been shut down or operated at reduced capacity for some or all of the third and fourth quarters due to COVID-19.
Sales of new products in the first twelve months since their introduction were approximately $5 million for the year. Operating income in our Food Service segment decreased from $76,546,000 in 2019 to $6,458,000 in 2020 primarily because of lower production and sales volume due to COVID-19. This year’s operating income was impacted by plant shutdown impairment costs of $6,387,000 for the shutdown of one of our manufacturing plants. We expect to reduce manufacturing overhead and distribution costs by about $7-8 million annually as a result of this plant closure. This year also included approximately $6 million of costs for employee safety and increased COVID-19 compensation as well as increased expense of about $3.5 million for accounts receivable allowances and inventory losses due to the impact of COVID-19 on some of our customers and on sales of some of our products.
RETAIL SUPERMARKETS
Sales of products to retail supermarkets increased $32,573,000 or 23% to $177,165,000 in fiscal year 2020. Soft pretzel sales to retail supermarkets were $49,157,000, an increase of $12,893,000, or 36%, from sales in 2019. Sales of frozen novelties increased $14,992,000 or 20% to $88,743,000. Sales of biscuits and dumplings increased 12% to $28,317,000 for the year. Coupon redemption costs, a reduction of sales, of $3,569,000 were down less than 1% from 2019. Handheld sales to retail supermarket customers increased 13% to $12,303,000 for the year. Sales were generally higher for all product lines as sales in the year ago periods were impacted by lost volume and placements due to the price increases implemented in last year’s first quarter and because of increased sales to supermarkets generally since mid-March 2020 due to COVID-19.
Sales of new products in the first twelve months since their introduction were approximately $1 million in fiscal year 2020. Operating income in our Retail Supermarkets segment increased from $10,460,000 to $23,202,000 for the year primarily due to higher volume.
FROZEN BEVERAGES
Total frozen beverage segment sales decreased 26% to $225,980,000 in fiscal 2020 and beverage sales decreased 38% or $64,816,000 for the year. Excluding sales from the acquisition of ICEE Distributors in October 2019 and BAMA ICEE in February 2020, total frozen beverage segment sales decreased 30% for the year and beverage sales decreased 45% for the year. Gallon sales were down 41% from last year exclusive of ICEE Distributors’ gallons. Service revenue decreased 3% to $83,420,000 for the year with sales increases and decreases spread throughout our customer base with additional sales to existing customers and to new customers to largely offset declines in sales business to customers due to COVID-19. Machines revenue, primarily sales of machines, decreased from $45,811,000 in 2019 to $33,986,000 in 2020 with the decrease due to two significant install projects during the prior fiscal year, as well as the slowdown due to COVID-19. Sales are down across all product lines as many of the venues and locations where our products are sold have been shut down or operating at reduced capacity for some or all of the third and fourth quarters due to COVID-19.
The estimated number of Company-owned frozen beverage dispensers was 27,000 and 26,000 at September 26, 2020 and September 28, 2019, respectively. Our Frozen Beverage segment had an operating loss of $12,466,000 in 2020 compared to operating income of $29,950,000 in 2019 primarily as a result of lower sales volume due to COVID-19. This year’s operating income was also impacted by relocation costs of our ICEE’s headquarters of $2.5 million.
CONSOLIDATED
Other than as commented upon above by segment, there are no material specific reasons for the reported sales increases or decreases. Sales levels can be impacted by the appeal of our products to our customers and consumers and their changing tastes, competitive and pricing pressures, sales execution, marketing programs, seasonal weather, customer stability and general economic conditions.
Gross profit as a percentage of sales decreased to 23.3% in 2020 from 29.5% in 2019. Gross profit percentage decreased because of lower volume in our food service and frozen beverages segments, higher costs related to production disruptions due to volume mix changes, expenses related to employee safety and increased COVID-19 compensation and increased cost compared to last year of about $4.5 million for the write-down and disposal of inventory.
Total operating expenses decreased $12,212,000 to $221,233,000 in fiscal 2020 but as a percentage of sales increased to 21.6% of sales from 19.7% in 2019. Operating expenses this year included $6,387,000 of plant shutdown impairment costs for the shutdown of one of our manufacturing plants. Marketing and selling expenses increased to 8.3% this year from 8.1% of sales in 2019. Distribution expenses as a percent of sales increased to 9.1% from 8.0% in 2019. Administrative expenses were 3.6% and 3.4% of sales in 2020 and 2019, respectively. The percentage increases mentioned above were because of the drop in sales (lower denominators) and our inability to reduce expenses in line with the decrease in sales because of fixed costs that do not fluctuate with sales.
Operating income decreased $99,762,000 or 85% to $17,194,000 in fiscal year 2020 as a result of the aforementioned items.
Our investments generated before tax income of $4,356,000 million this year, down from $7,741,000 last year due to decreases in the amount of investments and lower interest rates.
Other income in 2019 includes a $2.0 million payment received from a customer due to cancellation of production under a co-manufacturing agreement.
Net earnings in 2019 benefited from a reduction of approximately $900,000 in tax as the provision for the one-time repatriation tax under the Tax Cuts and Jobs Act recorded in 2018 was reduced as the amount recorded in 2018 was an estimate. Excluding the reduction in the provision for the one-time repatriation tax, our effective tax rate was 25.8% for 2019. Net earnings for the 2020 year benefited from a reduction in income tax expense related to state taxes of approximately $2.2 million. Excluding this benefit, our effective tax rate in our fiscal 2020 year was 25.0%.
Net earnings decreased $76,514,000 or 81%, in fiscal 2020 to $18,305,000, or $.96 per diluted share, from $94,819,000 or $5.00 per diluted share, in fiscal 2019 as a result of the aforementioned items.
There are many factors which can impact our net earnings from year to year and in the long run, among which are the supply and cost of raw materials and labor, insurance costs, factors impacting sales as noted above, the continuing consolidation of our customers, our ability to manage our manufacturing, marketing and distribution activities, our ability to make and integrate acquisitions and changes in tax laws and interest rates.
RESULTS OF OPERATIONS
ACQUISITIONS
InOn October 2013,1, 2019, we acquired the assets of New York Pretzel, a manufacturer and distributor of soft pretzels selling primarilyICEE Distributors LLC, based in the northeast to foodservice and retail locations. This business had sales of about $4.3 million in our 2014 fiscal year included in the food service segment.
In May 2014, we acquired the stock of Philly’s Famous Water Ice, Inc. (PHILLY SWIRL). PHILLY SWIRL, located in Tampa, FL, produces frozen novelty products sold primarily to retail supermarket locations throughout the United States and to Canada with annual sales approximating $25 million. Sales of PHILLY SWIRL from the acquisition date to September 26, 2015 were $12.6 million and are included in the retail supermarket segment.
On December 30, 2016, we acquired Hill & Valley Inc., a premium bakery located in Rock Island, Illinois,Bossier City, Louisiana for approximately $31$45 million. Hill & Valley, with sales of over $45 million annually, is a manufacturer of a variety of pre-baked cakes, cookies, pies, muffinsICEE Distributors does business in Arkansas, Louisiana and other desserts selling to retail in-store bakeries. Hill & Valley is a leading brand of Sugar Free and No Sugar Added pre-baked in-store bakery items. Additionally, Hill & Valley sustains strategic private labeling partnerships with retailers nationwide.Texas. Sales and operating income of Hill & Valley included in our 2017 fiscalICEE Distributors were $9.7 million and $2.4 million for the year operating results were $35,770,000 and $653,000, respectively.
On May 22, 2017, we acquired an ICEE distributor doing business in Georgia and Tennessee for approximately $11 million.ended September 25, 2021. Sales and operating income of ICEE Distributors were $11.4 million and $3.6 million for the acquired business included in our 2017 fiscal year operating results were $1,689,000 and $395,000, respectively. ended September 26, 2020.
On August 16, 2017,February 4, 2020, we acquired Labriola Baking Company, a premium bakerythe assets of breads and artisan soft pretzels locatedBAMA ICEE, based in Alsip, IllinoisBirmingham, Alabama for approximately $6$12 million. Labriola Bakery, with salesBAMA ICEE does business in Alabama and Georgia. Sales and operating income of approximately $17BAMA ICEE were $1.8 million annually, is a manufacturerand $0.5 million for the year ended September 25, 2021. Sales and operating income of pre-baked breads, rollsBAMA ICEE were $1.7 million and soft pretzels$0.6 million for retail in-store bakery and foodservice outlets nationwide. Sales of Labriola included in our 2017 fiscalthe year operating results were $2,061,000 with marginal operating income.ended September 26, 2020.
These acquisitions were accounted for under the purchase method of accounting, and their operations are included in the accompanying consolidated financial statements from their respective acquisition dates.
LIQUIDITY AND CAPITAL RESOURCES
Although there are many factors that could impact our operating cash flow, most notably net earnings, we believe that our future operating cash flow, along with our borrowing capacity, our current cash and cash equivalent balances and our investment securities is sufficient to satisfy our cash requirements over the next twelve months and beyond, as well as fund future growth and expansion. See Note C
As of September 25, 2021, we have 283,192,000 of Cash and Cash Equivalents, and $22,111,000 of Marketable Securities.
The Company’s material cash requirements include the following contractual and other obligations:
Purchase Commitments
Our most significant raw material requirements include flour, packaging, shortening, corn syrup, sugar, juice, cheese, chocolate, and a variety of nuts. We attempt to minimize the effect of future price fluctuations related to the purchase of raw materials primarily through forward purchasing to cover future manufacturing requirements, generally for periods from 1 to 12 months. As of September 25, 2021, we have approximately $78 million of such commitments. The purchase commitments do not exceed our financial statementsprojected requirements over the related terms and are in the normal course of business.
Leases
We have operating leases with initial noncancelable lease terms in excess of one year covering the rental of various facilities and equipment. Our operating leases include leases for a discussionreal estate from some of our investment securities.office and manufacturing facilities as well as manufacturing and non-manufacturing equipment used in our business. As of September 25, 2021, we have operating lease payment obligations of $66,324,000, with $14,994,000 payable within 12 months.
Fluctuations in the value of the Mexican and Canadian currencies and the resulting translation of the net assets of our Mexican and Canadian subsidiaries caused a decrease of $3,745,000$2,204,000 in accumulated other comprehensive loss in 2017,2021, an increase of $3,065,000$2,599,000 in accumulated other comprehensive loss in 20162020 and an increase of $5,389,000$909,000 in accumulated other comprehensive loss in 2015.2019. In 2017,2021, sales of the two subsidiaries were $31,001,000$20,754,000 as compared to $27,075,000$15,421,000 in 20162020 and $25,313,000$33,906,000 in 2015.2019. The fluctuation of sales over the periods presented is the result of COVID-19.
In our fiscal year ended September 30, 2017,28, 2019, we did not purchase any shares of our common stock.
In our fiscal year ended September 26, 2020, we purchased and retired 142,66565,648 shares of our common stock at a cost of $18,228,763. In our second quarter, we purchased and retired 12,926 shares at a cost of $1,682,342. In our third quarter, we purchased and retired 13,004 shares at a cost of $1,691,357. In our fourth quarter, we purchased and retired 116,735 shares at a cost of $14,855,064. $8,972,292.
In our fiscal year ended September 24, 2016,25, 2021, we purchased and retired 141,700did not purchase any shares of our common stock at a cost of $15,265,019.stock.
In our fiscal year ended September 26, 2015, we purchased and retired 72,698 shares of our common stock at a cost of $8,011,118.
In November 2016, we entered into an amendment and modification to an amended and restated loan agreement with our existing banks which provides for up to a $50,000,000 revolving credit facility repayable in November 2021. The agreement contains restrictive covenants and requires commitment fees in accordance with standard banking practice. There were no outstanding balances under the facility at September 30, 201725, 2021 or at September 24, 2016.26, 2020. The significant financial covenants are:
. Tangible net worth must initially be more than $465 million. |
|
| .Total funded indebtedness divided by earnings before |
We were in compliance with the financial covenants described above at September 30, 2017.25, 2021.
On November 16, 2021, we entered into an amendment and modification to the amended and restated loan agreement which extended the maturity of the revolving credit facility to December 16, 2021.
We self-insure, up to loss limits, certain insurable risks such as worker'sworkers’ compensation, automobile, and automobilegeneral liability claims. Accruals for claims under our self-insurance program are recorded on a claims-incurred basis. Under this program, the estimated liability for claims incurred but unpaid in fiscal years 20172021 and 20162020 was $2,900,000$5,300,000 and $1,900,000,$3,700,000, respectively. In connection with certain self-insurance agreements, we customarily enter into letters of credit arrangements with our insurers. At both September 30, 201725, 2021 and September 24, 2016,26, 2020, we had outstanding letters of credit totaling $8,575,000 and $8,575,000, respectively.$9,275,000.
The following table presents our contractual cash flow commitments on long-term debt, operating leases and purchase commitments for raw materials and packaging. See Notes to the consolidated financial statements for additional information on our long-term debt and operating leases.
| Payments Due by Period | ||||||||||||||||||||
| (in thousands) | ||||||||||||||||||||
Less | ||||||||||||||||||||
Than | 1-3 | 4-5 | After | |||||||||||||||||
Total | 1 Year | Years | Years | 5 Years | ||||||||||||||||
Long-term debt, including current maturities | $ | - | $ | - | $ | - | $ | - | $ | - | ||||||||||
Capital lease obligations | 1,244 | 340 | 568 | 336 | ||||||||||||||||
Purchase commitments | 75,000 | 73,500 | 1,500 | - | - | |||||||||||||||
Operating leases | 82,514 | 15,441 | 24,263 | 14,772 | 28,038 | |||||||||||||||
Total | $ | 158,758 | $ | 89,281 | $ | 26,331 | $ | 15,108 | $ | 28,038 | ||||||||||
The purchase commitments do not exceed our projected requirements over the related terms and are in the normal course of business.
Fiscal 20172021 Compared to Fiscal 20162020
Cash and cash equivalents and marketable securities held to maturity and available for sale decreased $33,145,000increased $27,440,000 or 12%10%, to $241,243,000$305,303,000 from a year ago for reasons described below.
Accounts receivables, net increased $26,228,000,$36,352,000, or 27%29%, to $124,553,000$162,939,000 in 20172021 because of significantly higher sales in this year’s September month and timing of collections. Inventories
Inventory increased $14,584,000$14,237,000 or 16%13% to $103,268,000 in 2017$123,160,000 largely due to higherthe increase in sales this year and the need for additional inventory build for specific first quarter 2018in connection with the increased sales.
Prepaid expenses and other decreasedwas $7,498,000 compared to $3,936,000 from $13,904,000$17,087,000 last year, primarily because last year included $10,574,000 ofas prepaid income tax decreased by $13,697,000. Prepaid taxes in 2020 were higher, as a resultpayments in the first six months of adopting bonus tax depreciation.the year were based on pre-COVID expectations.
Net property, plant and equipment increased $43,368,000$5,571,000 to $227,581,000$267,187,000 because purchases of property, plant and equipment for the improvement and expansion of our manufacturing capabilities and frozen carbonated beverage business exceeded depreciation on existing assets and we acquired $10,273,000 of property plant and equipment in acquisitions.assets. Purchases of property, plant and equipment increaseddecreased slightly to $72,180,000$53,578,000 in 20172021 from $48,709,000$57,817,000 in 2016 due to several large projects across our manufacturing base to modernize our facilities to have state-of-the-art systems to produce high quality products, increase capacity and respond to customer requests.2020. We are continually looking for opportunities to invest in projects at our manufacturing facilities that have a financial payback on capital invested with the goal of improving efficiency and reducing operating costs.
Goodwill increased to $102,511,000 because of $16,069,000 acquired in acquisitions.
Other intangible assets, less accumulated amortization increased $19,453,000 to $61,272,000 as $23,293,000 was acquired in acquisitions during the year and $3,840,000 was amortized.
Marketable securities available for sale and held to maturity increaseddecreased by $16,545,000$59,943,000 to $150,281,000$22,111,000 as we continuedecreased our holdings of corporate bonds and available for sale securities primarily due to increase our income generating investments.the decline in interest rates.
Accounts Payables increased 17%32% to $72,729,000$96,789,000 from $62,026,000$73,135,000 in 2016. About 40% of the increase was at our acquired Hill & Valley business and the balance was due to general increase in business.
Accrued insurance liability increased 4% to $10,558,000 as our estimates for incurred but not yet paid claims under our group insurance and insurance liability programs increased from a year ago.
Accrued compensation expense increased 21% to $19,826,000 due to an increase in our employee base, a general increase in the level of pay rates and additional accrual because of the change in timing due to this year having 53 weeks.2020.
Dividends payable increased to $7,838,000$12,080,000 as our quarterly dividend payment increased to $.42/$0.633/share from $.39/$0.575/share.
Deferred income tax liabilities increased $14,519,000 to $62,705,000 from $48,186,000 because of increased liabilities related to depreciation of property and equipment, amortization of goodwill and other intangible assets and the addition of $6,632,000 of deferred tax liabilities as a result of purchase accounting for the Hill & Valley acquisition.
Common stock decreased $7,950,000 to $17,382,000 in 2017 because repurchases of our common stock of $18,229,000 exceeded increases totaling $10,279,000 from the exercise of incentive and nonqualified stock options, stock issued under our stock purchase plan for employees, stock issued under our deferred stock plan and share-based compensation expense.
Net cash provided by operating activities increased $4,124,000$9,356,000 to $125,349,000$101,499,000 in 20172021 primarily because of an increase in net earnings of $3,199,000, an increase of accounts payable and accrued liabilities of $9,521,000 compared to $3,888,000 in 2016, a decrease of $10,265,000 in prepaid expenses and other compared to an increase of prepaid expenses and other in 2016 of $7,386,000, as well as by higher depreciation of fixed assets of $3,675,000 in 2017 , all of which were partially offset by an increase ofin the investment in net working capital balances, predominantly related to accounts receivable of $20,370,000 in 2017 compared to a decrease of $3,571,000 in 2016 and an increase in inventories of $7,410,000 compared to an increase of $6,295,000 in 2016.receivable.
Net cash provided by investing activities increased $54,402,000 to $9,939,000 in 2021 from net cash used in investing activities increased $60,717,000of $44,463,000 in 2020 primarily due to $135,319,000 in 2017 from $74,602,000 in 2016 because$57,212,000 of paymentscash paid for purchases of companies netin 2020. In 2021, proceeds from the redemption and sales of marketable securities outpaced the cash acquired of $47,698,000 in 2017 compared to none in 2016 and increasedused on purchases of property, plant and equipment of $23,471,000 from 2016 to 2017. equipment.
Net cash used in financing activities decreased by $18,791,000 to a use of $37,573,000cash of $24,673,000 in 2016 increased2021 due to $42,213,000an increase in 2017 primarily becauseproceeds from the issuance of increased dividend payments of $2,336,000 and increasedcommon stock combined with having no repurchases of common stock in 2021. The net use of $2,964,000.cash in 2021 was due the payment of cash dividends outpacing the inflow of cash proceeds from the issuance of common stock.
In 2017,2021, the major variables in determining our net increase in cash and cash equivalents and marketable securities were our increase in net earnings, depreciation and amortization of fixed assets, changes in accounts receivable, and accounts payable purchases of companies,and accrued liabilities and changes in deferred tax liabilities, purchases of property, plant and equipment, and payments of cash dividend and the repurchase of common stock.dividends. Other variables which in the past have had a significant impact on our change in cash and cash equivalents and marketable securities are proceeds from borrowings and payments of long-term debt. As discussed in results of operations, our net earnings may be influenced by many factors. Depreciation and amortization of fixed assets is primarily determined by past purchases of property, plant and equipment although it could be impacted by a significant acquisition. Purchases of property, plant and equipment are primarily determined by our ongoing normal manufacturing and marketing requirements but could be increased significantly for manufacturing expansion requirements or large frozen beverage customer needs. From time to time, we have repurchased common stock and we anticipate that we will do so again in the future. We are actively seeking acquisitions that could be a significant use of cash. Although we have no long-term debt at September 30, 2017,25, 2021, we may borrow in the future depending on our needs.
Fiscal 2016 Compared to Fiscal 2015
Cash and cash equivalents and marketable securities held to maturity and available for sale increased $34,401,000, or 14%, to $274,388,000 from a year ago for reasons described below.
Accounts receivables, net decreased $4,324,000, or 4%, to $98,325,000 in 2016 because of lower sales in this year’s September month and timing of collections. Inventories increased $6,027,000 or 7% to $88,684,000 in 2016 due to sluggish September sales this year and changes in product mix.
Prepaid expenses and other increased to $13,904,000 from $6,557,000 last year due primarily to an increase in prepaid income taxes as a result of adopting bonus depreciation.
Net property, plant and equipment increased $12,159,000 to $184,213,000 because purchases of property, plant and equipment for the improvement and expansion of our manufacturing capabilities and frozen carbonated beverage business exceeded depreciation on existing assets. Purchases of property, plant and equipment were $48,709,000 in 2016 and $48,641,000 in 2015.
Goodwill remained at $86,442,000 because there was no goodwill acquired in acquisitions and no impairment charges.
Other intangible assets, less accumulated amortization decreased $4,000,000 to $41,819,000 due to amortization of $5,078,000 during the year, offset by $1,078,000 paid for the acquisition of the HEARTBAR brand in the food service segment.
Marketable securities available for sale and held to maturity increased by $27,438,000 to $133,736,000 as we reinvested proceeds from the 2015 sales of our mutual funds investments.
Accounts Payables increased 5% to $62,026,000 from $59,206,000.
Accrued insurance liability was essentially unchanged at $10,119,000 as our estimates for incurred but not yet paid claims under our group insurance and insurance liability programs remained about the same as at September 2015.
Accrued compensation expense increased 7% to $16,340,000 due to an increase in our employee base and a general increase in the level of pay rates.
Dividends payable increased to $7,280,000 as our quarterly dividend payment increased to $.39/share from $.36/share.
Deferred income tax liabilities increased $7,663,000 to $48,186,000 from $40,523,000 because of increased liabilities related to depreciation of property and equipment.
Other long-term liabilities include $354,000 of gross unrecognized tax benefits at September 24, 2016 and $334,000 at September 26, 2015.
Common stock decreased $6,321,000 to $25,332,000 in 2016 because repurchases of our common stock of $15,265,000 exceeded increases totaling $8,945,000 from the exercise of incentive and nonqualified stock options, stock issued under our stock purchase plan for employees, stock issued under our deferred stock plan and share-based compensation expense.
Net cash provided by operating activities increased $17,304,000 to $121,225,000 in 2016 primarily because of an increase in net earnings of $5,792,000, a reduction of accounts receivable of $3,571,000 in 2016 compared to an increase of $3,123,000 in 2015, an increase of accounts payable and accrued liabilities of $3,888,000 compared to $287,000 in 2015 and an increase in deferred income taxes of $7,700,000, as well as by higher depreciation of fixed assets of $2,180,000 in 2016.
Net cash used in investing activities increased $46,111,000 to $74,602,000 in 2016 from $28,491,000 in 2015 primarily because purchases of marketable securities, net of proceeds, was $28,562,000 in 2016 compared to proceeds from marketable securities, net of purchases, of $19,877,000, in 2015. We reduced our holdings of mutual funds in 2015 by $109 million.
Net cash used in financing activities of $29,745,000 in 2015 increased to $37,573,000 in 2016 primarily because of increased dividend payments of $2,369,000 and increased repurchases of common stock of $7,254,000.
In 2016, the major variables in determining our net increase in cash and cash equivalents and marketable securities were our net earnings, depreciation and amortization of fixed assets, changes in accounts receivable and accounts payable, purchases of property, plant and equipment, payments of cash dividend and the repurchase of common stock. Other variables which in the past have had a significant impact on our change in cash and cash equivalents and marketable securities are purchases of companies and proceeds from borrowings and payments of long-term debt. As discussed in results of operations, our net earnings may be influenced by many factors. Depreciation and amortization of fixed assets is primarily determined by past purchases of property, plant and equipment although it could be impacted by a significant acquisition. Purchases of property, plant and equipment are primarily determined by our ongoing normal manufacturing and marketing requirements but could be increased significantly for manufacturing expansion requirements or large frozen beverage customer needs.
Off –Balance Sheet Arrangements
The Company does not have anyhas off-balance sheet arrangements for operating leases and purchase commitments as of September 30, 2017.25, 2021.
|
|
Item 7A.Quantitative And Qualitative Disclosures About Market Risk
The following is the Company’sCompany’s quantitative and qualitative analysis of its financial market risk:
Interest Rate Sensitivity
The Company has in the past entered into interest rate swaps to limit its exposure to interest rate risk and may do so in the future if the Board of Directors feels that such non-trading purpose is in the best interest of the Company and its shareholders. As of September 30, 2017,25, 2021, the Company had no interest rate swap contracts.
Interest Rate Risk
At September 30, 2017,25, 2021, the Company had no long-term debt obligations.
Purchasing Risk
The Company’s most significant raw material requirements include flour, shortening, corn syrup, sugar, juice, cheese, chocolate, and a variety of nuts. The Company attempts to minimize the effect of future price fluctuations related to the purchase of raw materials primarily through forward purchasing to cover future manufacturing requirements, generally for periods from 1 to 12 months. Future contracts are not used in combination with forward purchasing of these raw materials. The Company’s procurement practices are intended to reduce the risk of future price increases, but also may potentially limit the ability to benefit from possible price decreases.
Foreign Exchange Rate Risk
The Company has not entered into any forward exchange contracts to hedge its foreign currency rate risk as of September 30, 2017,25, 2021, because it does not believe its foreign exchange exposure is significant.
Item 8.Financial Statements And Supplementary Data
The financial statements of the Company are filed under this Item 8, beginning on page F-1 of this report.
Item 9.Changes In And Disagreements With Accountants OnAccounting And Financial Disclosure
None.
Item 9A. Controls And Procedures
Disclosure Controls and Procedures
We carried out an evaluation under the supervision and with the participation of our management, including our chief executive officer and chief financial officer, of the effectiveness of the design and operation of our disclosure controls and procedures, as such term is defined under Rule 13a-15(e) promulgated under the Securities Exchange Act of 1934 (the "Exchange Act"), as amended for financial reporting, as of September 30, 2017.25, 2021. Based on that evaluation, our chief executive officer and chief financial officer concluded that these controls and procedures are effective at a reasonable assurance level.
Our disclosure controls and procedures are designed to provide reasonable assurance that information required to be disclosed by us in the reports that we file or submit under the Exchange Act is recorded, processed, summarized, and reported, within the time periods specified in the rules and forms of the SEC. These disclosure controls and procedures include, among other things, controls and procedures designed to provide reasonable assurance that information required to be disclosed by us in the reports that we file under the Exchange Act is accumulated and communicated to our management, including our chief executive officer and chief financial officer, as appropriate to allow timely decisions regarding required disclosure.
Management’s’s Report on Internal Control over Financial Reporting
Our management is responsible for establishing and maintaining adequate internal control over financial reporting. Internal control over financial reporting is defined in Rule 13a-15(f) and 15d-15(f) under the Exchange Act as a process designed by, or under the supervision of, the chief executive officer and chief financial officer and effected by the board of directors and management to provide reasonable assurance regarding the reliability of financial reporting and the preparation of financial statements for external purposes in accordance with generally accepted accounting principles and includes those policies and procedures that:
● | Pertain to the maintenance of records that in reasonable detail accurately and fairly reflect the transactions and dispositions of our assets; |
● |
|
| Provide reasonable assurance that transactions are recorded as necessary to permit preparation of financial statements in accordance with generally accepted accounting principles, and that receipts and expenditures of the company are being made only in accordance with |
● | Provide reasonable assurance regarding prevention or timely detection of unauthorized acquisition, use or disposition of our assets that could have a material effect on the financial statements. |
Because of its inherent limitations, internal control over financial reporting may not prevent or detect misstatements. Projections of any evaluation of effectiveness to future periods are subject to the risks that controls may become inadequate because of changes in conditions, or that the degree of compliance with the policies or procedures may deteriorate.
Our management assessed the effectiveness of our internal control over financial reporting as of September 30, 2017.25, 2021. In making this assessment, our management used the criteria set forth by the Committee of Sponsoring Organizations of the Treadway Commission (COSO) in the 2013 Internal Control-Integrated Framework.
Based on our assessment, our management believes that, as of September 30, 2017,25, 2021, our internal control over financial reporting is effective. There have been no changes that occurred during our fourth quarter that have materially affected, or are reasonably likely to materially affect, our internal control over financial reporting.
Our independent registered public accounting firm, Grant Thornton LLP, audited our internal control over financial reporting as of September 30, 2017.25, 2021. Their report, dated November 28, 2017,23, 2021, expressed an unqualified opinion on our internal control over financial reporting. That report appears in Item 15 of Part IV of this Annual Report on Form 10-K and is incorporated by reference to this Item 9A.
Item 9B.Other Information
There was no information required on Form 8-K during the quarter that was not reported.
PART III
Item 10.Directors, Executive Officers and Corporate Governance
The following is a list of the executive officers of the Company and their principal past occupations or employment. All such persons serve at the pleasure of the Board of Directors and have been elected to serve until the Annual Meeting of Shareholders on February 9, 201816, 2022 or until their successors are duly elected.
Name | Age | Position |
Gerald B. Shreiber |
| Chairman of the Board |
|
|
|
| 64 | Director |
| 61 | Director |
| 53 | Director, General Counsel and |
Dan Fachner |
| Chief Executive Officer and President |
|
| Senior Vice President and |
Robert J. Pape |
| Senior Vice President Sales |
Lynwood Mallard | 53 | Chief Marketing Officer |
Steve Every | 59 | Senior Vice President, Chief Operating Officer – The ICEE Company |
Gerald B. Shreiber is the founder of the Company and has served as its Chairman of the Board President, and Chief Executive Officer since its inception in 1971.1971 and as Chief Executive Officer and President until Dan Fachner was named Chief Executive Officer and President of the Company in May 2021, and May 2020, respectively. His term as a director expires in 2020.2025.
DennisPeter G. Moore joinedStanley became a director in 1983. Since November 1999 he has been the Chairman of the Board of Emerging Growth Equities, Ltd., an investment banking firm.
Sidney R. Brown became a director of the Company in 1984.2003. He served in various controllership functions prior to becomingis the Chief FinancialExecutive Officer of NFI Industries, Inc., a premier integrated supply chain solutions provider. Mr. Brown is also on the Board of FS Energy and Power Fund, a specialty finance company that invests primarily in June 1992. His term asincome-oriented securities of private energy-related companies. In addition, he is a member of the Board of Trustees of Cooper Health Systems.
Vincent A. Melchiorre became a director expires in 2022.
Robert M. Radano joined the Company in 19722013. He is Senior Vice President of Bimbo Bakeries USA since September 2010. From June 2007 to August 2010, Mr. Melchiorre was employed by J&J Snack Foods Corp. as Senior Vice President-Food Group. From May 2006 to June 2007 he was Senior Vice President, Bread and in May 1996 was named Chief Operating Officer of the Company. PriorRoll Business, George Weston Foods; from January 2003 to becoming Chief Operating Officer,April 2006 he was Senior Vice President, Sales responsible for national food service salesand Marketing at Tasty Baking Company and from June 1982 to December 2002 he was employed by Campbell Soup Company in various capacities, most recently Vice President of J & J.Marketing of Pepperidge Farm.
Marjorie S. Roshkoff joined the Company in February 2016 with more than 15 years of legal experience. In February 2017 she was appointed Vice President, In-House Counsel and Corporate Secretary. In this role, she oversees outside counsel and is responsible for the Company’s legal issues. Ms. Roshkoff became a director of the Company in 2020. In 2021, she was named General Counsel of the Company. Ms. Roshkoff is a daughter of Gerald B. Schreiber.
Dan Fachner has been an employee of ICEE-USA Corp.,The ICEE Company, which was acquired by the Company in May 1987, since 1979. He was named Senior Vice President of The ICEE Company in April 1994 and became President of ICEE in May 1997. On May 4, 2020, he was appointed President of J & J Snack Foods Corp. and on May 11, 2021, he was appointed Chief Executive Officer of J & J Snack Foods.
Gerard G. LawKen A. Plunk joined the Company in 1992. He served in various manufacturing and sales management capacities prior to becomingSeptember 2020 as Senior Vice President Western Operations in 2009. He was namedand Chief Financial Officer. Prior to his present position in 2011 in which he has responsibility for marketing, researchjoining the Company, Mr. Plunk held various senior positions with Walmart, Inc., The Home Depot and development and overseeing a number of the manufacturing facilities of J & J. The Coca-Cola Company.
Robert J. Pape joined the Company in 1998. He served in various sales and sales management capacities prior to becoming Senior Vice President Sales in 2010. Mr. Pape will be retiring effective January 3, 2022.
Lynwood Mallard joined the Company in March 2021 as Senior Vice President, Chief Marketing Officer. Prior to joining the Company, Mr. Mallard worked for Coca-Cola for almost 23 years and held various positions across Coca-Cola’s business segments. Mr. Mallard was most recently Vice President of Innovation for Coca-Cola’s Foodservice division.
Steve Every joined the Company in 2009 and in July 2021, was promoted to Chief Operating Officer, The ICEE Company. Since joining the Company, Mr. Every has served in a number of roles including sales, operations, service and international, most recently as SVP-Sales.
Portions of the information concerning directors and executive officers, appearing under the captions “Information Concerning Nominees For Election To Board” and “Information Concerning Continuing Directors And Executive Officers” and information concerning Section 16(a) Compliance appearing under the caption “Compliance with Section 16(a) of the Securities Exchange Act of 1934” in the Company’sCompany’s Proxy Statement filed with the SEC in connection with the Annual Meeting of Shareholders to be held on February 9, 201816, 2022 (“20172021 Proxy Statement”) is incorporated herein by reference.
Portions of the information concerning the Audit Committee, the requirement for an Audit Committee Financial Expert and the Nominating Committee in the Company’s 20172021 Proxy Statement filed with the SEC in connection with the Annual Meeting of Shareholders to be held on February 9, 201816, 2022 is incorporated herein by reference.
The Company has adopted a Code of Ethics pursuant to Section 406 of the Sarbanes-Oxley Act of 2002, which applies to the Company’s principal executive officer and senior financial officers. The Company has also adopted a Code of Business Conduct and Ethics which applies to all employees. The Company will furnish any person, without charge, a copy of the Code of Ethics upon written request to J & J Snack Foods Corp., 6000 Central Highway, Pennsauken, New Jersey 08109, Attn: Marjorie S. Roshkoff, Esq. A copy of the Code of Ethics can also be found on our website at www.jjsnack.com.www.jjsnack.com. Any waiver of any provision of the Code of Ethics granted to the principal executive officer or senior financial officer may only be granted by a majority of the Company’s disinterested directors. If a waiver is granted, information concerning the waiver will be posted on our website www.jjsnack.com for a period of 12 months.
Item 11.Executive Compensation
Information concerning executive compensation appearing in the Company’s 20172021 Proxy Statement under the caption “Management Remuneration” is incorporated herein by reference.
Item 12.Security Ownership Of Certain Beneficial Owners And Management And Related Stockholder Matters
Information concerning the security ownership of certain beneficial owners and management appearing in the Company’s 20172021 Proxy Statement under the caption “Security Ownership of Certain Beneficial Owners and Management” is incorporated herein by reference.
The following table details information regarding the Company’s existing equity compensation plans as of September 30, 2017.25, 2021.
( a ) | ( b ) | ( c ) | ( a ) | ( b ) | ( c ) | |||||||||||||||||||
Number of | Number of | |||||||||||||||||||||||
Securities | Securities | |||||||||||||||||||||||
Remaining | Remaining | |||||||||||||||||||||||
available for | available for | |||||||||||||||||||||||
future | future | |||||||||||||||||||||||
Number of | Weighted- | issuance under | Number of | Weighted- | issuance under | |||||||||||||||||||
securities to | average | equity | securities to | average | equity | |||||||||||||||||||
be issued upon | exercise | compensation | be issued upon | exercise | compensation | |||||||||||||||||||
exercise of | price of | plans | exercise of | price of | plans | |||||||||||||||||||
outstanding | outstandng | (excluding | outstanding | outstandng | (excluding | |||||||||||||||||||
options, | options, | securities | options, | options, | securities | |||||||||||||||||||
warrants and | warrants and | reflected in | warrants and | warrants and | reflected in | |||||||||||||||||||
Plan Category | rights | rights | column (a) ) | rights | rights | column (a)) | ||||||||||||||||||
Equity compensation plans approved by security holders | 711,000 | $ | 102.07 | 486,000 | 748,096 | $ | 141.16 | 598,000 | ||||||||||||||||
Equity compensation plans not approved by security holders | - | - | - | - | - | - | ||||||||||||||||||
Total | 711,000 | $ | 102.07 | 486,000 | 748,096 | $ | 141.16 | 598,000 | ||||||||||||||||
Column A includes 704,000173,000 from stock option plans that have beenwere replaced subsequent to September 30, 2017. Those plans have been replaced by a plan, subject to shareholder approvalapproved by shareholders in February 2018, that has 800,000174,000 shares available for future issuance as of the date of this Form 10-K.
Item 13.Certain Relationships And Related Transactions, and Director Independence
Information concerning the Certain Relationships and Related Transactions, and Director Independence in the Company’s 20172021 Proxy Statement is incorporated herein by reference.
Item 14. Principal AccountingAccountant Fees And Services
Information concerning the Principal Accountant Fees and Services in the Company’s 20172021 Proxy Statement is incorporated herein by reference.
PART IV
Item 15.Exhibits, Financial Statement Schedules
(a) | The following documents are filed as part of this Report: |
(1) Financial Statements
The financial statements filed as part of this report are listed on the Index to Consolidated Financial Statements and Financial Statements Schedule on page F-1.
(2) Financial Statement Schedule – Page S-1
Schedule II – Valuation and Qualifying Accounts
All other schedules are omitted either because they are not applicable or because the information required is contained in the financial statements or notes thereto.
(b)
(b) | Exhibits |
3.1
Amended and Restated Certificate of Incorporation filed February 28, 1990 (Incorporated by reference from the Company’sCompany’s Form 10-Q dated May 4, 1990).
3.2
4.3
4.6**
Fifth Amendment and Modification to Amended and Restated Loan Agreement
21.1**
Subsidiaries of J & J Snack Foods Corp.
23.1**
Consent of Independent Registered Public Accounting Firm.
31.1***
Certification Pursuant to Section 302 of the Sarbanes-Oxley Act of 2002.
31.2**
Certification Pursuant to Section 302 of the Sarbanes-Oxley Act of 2002.
32.1**
32.2**
101101****
The following financial information from J&J Snack Foods Corp.'s's Form 10-K for the year ended September 30, 2017,25, 2021, formatted in XBRL (eXtensibleiXBRL (Inline extensible Business Reporting Language):
(i) | Consolidated Balance Sheets, |
(ii) | Consolidated Statements of Earnings, |
(iii) | Consolidated Statements of Comprehensive Income, |
(iv) | Consolidated Statements of Cash Flows, |
(v) | Consolidated Statement of Changes in Stockholders' Equity and |
(vi) | The Notes to the Consolidated Financial Statements |
104
Cover Page Interactive Data File (formatted as Inline XBRL and contained in Exhibit 101).
_____________
*Compensatory Plan
**Filed Herewith
SIGNATURES
Pursuant to the requirements of Section 13(a) or 15(d) of the Securities Exchange Act of 1934, the Registrant has duly caused report to be signed on its behalf by the undersigned, thereunto duly authorized.
J & J SNACK FOODS CORP. | |||
November | By: |
| |
Chief Executive Officer and President (Principal Executive Officer) | |||
|
| ||
Pursuant to the requirements of the Securities Exchange Act of 1934, this report has been signed below by the following persons on behalf of the Registrant and in the capacities and on the dates indicated.
|
| |||
| ||||
November 23, 2021 |
| |||
Dan Fachner, Chief Executive Officer and President (Principal Executive Officer) | ||||
November | /s/ | |||
Ken A. Plunk, Senior Vice President and Chief Financial Officer | ||||
(Principal Financial Officer) | ||||
(Principal Accounting Officer) | ||||
| November | /s/ Sidney R. Brown | |||
| Sidney R. Brown, Director | ||||
November | /s/ Peter G. Stanley | |||
| Peter G. Stanley, Director | ||||
November | /s/ Vincent A. Melchiorre | |||
Vincent A. Melchiorre, Director | ||||
J & J SNACK FOODS CORP.
INDEX TO CONSOLIDATED FINANCIAL STATEMENTS
AND FINANCIAL STATEMENT SCHEDULE
Financial Statements: | |
Report of Independent Registered Public Accounting Firm | F-2 |
Opinion of Independent Registered Public Accounting Firm on Internal Control over Financial Reporting | F-4 |
Consolidated Balance Sheets as of September |
|
Consolidated Statements of Earnings for the fiscal years ended September |
|
Consolidated Statements of Comprehensive Income for the fiscal years ended September |
|
Consolidated Statement of Changes in |
|
Consolidated Statements of Cash Flows for the fiscal years ended September |
|
Notes to Consolidated Financial Statements |
|
Financial Statement Schedule: | |
Schedule II – Valuation and Qualifying Accounts | S-1 |
REPORT OF INDEPENDENT REGISTERED PUBLIC ACCOUNTING FIRM Board of Directors and Shareholders J&J Snack Foods Corp. and Subsidiaries Opinion on the financial statements We have audited the accompanying consolidated balance sheets of J&J Snack Foods Corp. (a New Jersey corporation) and subsidiaries (the “Company”) as of September 25, 2021 and September 26, 2020, the related consolidated statements of earnings, comprehensive income, changes in shareholders’ equity, and cash flows for each of the three years in the period ended September 25, 2021, and the related notes and financial statement schedule included under Item 15(a) (collectively referred to as the “financial statements”). In our opinion, the financial statements present fairly, in all material respects, the financial position of the Company as of September 25, 2021 and September 26, 2020, and the results of its operations and its cash flows for each of the three years in the period ended September 25, 2021, in conformity with accounting principles generally accepted in the United States of America. We also have audited, in accordance with the standards of the Public Company Accounting Oversight Board (United States) (“PCAOB”), the Company’s internal control over financial reporting as of September 25, 2021, based on criteria established in the 2013 Internal Control—Integrated Framework issued by the Committee of Sponsoring Organizations of the Treadway Commission (“COSO”), and our report dated November 23, 2021 expressed an unqualified opinion. Basis for opinion These financial statements are the responsibility of the Company’s management. Our responsibility is to express an opinion on the Company’s financial statements based on our audits. We are a public accounting firm registered with the PCAOB and are required to be independent with respect to the Company in accordance with the U.S. federal securities laws and the applicable rules and regulations of the Securities and Exchange Commission and the PCAOB. We conducted our audits in accordance with the standards of the PCAOB. Those standards require that we plan and perform the audit to obtain reasonable assurance about whether the financial statements are free of material misstatement, whether due to error or fraud. Our audits included performing procedures to assess the risks of material misstatement of the financial statements, whether due to error or fraud, and performing procedures that respond to those risks. Such procedures included examining, on a test basis, evidence supporting the amounts and disclosures in the financial statements. Our audits also included evaluating the accounting principles used and significant estimates made by management, as well as evaluating the overall presentation of the financial statements. We believe that our audits provide a reasonable basis for our opinion. |
Critical audit matters The critical audit matter communicated below is a matter arising from the current period audit of the financial statements that was communicated or required to be communicated to the audit committee and that: (1) relate to accounts or disclosures that are material to the financial statements and (2) involved our especially challenging, subjective, or complex judgments. The communication of critical audit matters does not alter in any way our opinion on the financial statements, taken as a whole, and we are not, by communicating the critical audit matter below, providing separate opinions on the critical audit matter or on the accounts or disclosures to which it relates. Net Revenue Adjustments As described in Note A to the consolidated financial statements, contracts with customers include some form of variable consideration, including sales discounts, trade promotions and certain other sales and consumer incentives, including rebates. Variable consideration is treated as a reduction in revenue when the related revenue is recognized, and is recorded using the most likely amount method, with updates to estimates and related accruals of variable consideration occurring each period based on historical experience and changes in circumstances. We identified the estimation of certain subsidiaries’ reserves for these net revenue adjustments by management as a critical audit matter because the inputs and assumptions utilized by management in estimating these reserves, including consistency of historical data and contract pricing, require significant judgment and create a high degree of estimation uncertainty. Consequently, auditing these assumptions requires subjective auditor judgment. Our audit procedures related to the estimation of the reserves included the following, among others. | |
| ● | We obtained an understanding of management’s processes and controls over calculating the reserves for net revenue adjustments, including understanding relevant inputs and assumptions. |
| ● | We evaluated the design and tested the operating effectiveness of key controls relating to the calculation of the reserves for net revenue adjustments, including key management review controls over the period-end accrual of allowances and end-user pricing adjustments. |
| ● | We re-performed management’s process for calculating the reserves for net revenue adjustments. |
| ● | We evaluated key inputs and assumptions relevant to the net revenue adjustments, including contractual pricing and rebate arrangements with customers and historical allowance data, which were compared to source documents. |
| ● | We considered transactions subsequent to year end occurring up to the date of our auditor’s opinion, which involved inspecting customer contracts and relevant source documents submitted by customers in conjunction with the allowance, including end-user pricing adjustments. |
/s/ GRANT THORNTON LLP We have served as the Company’s auditor since 1984. Philadelphia, Pennsylvania November 23, 2021 | |
REPORT OF INDEPENDENT REGISTERED PUBLIC ACCOUNTING FIRM
Board of Directors and Shareholders
J&J Snack Foods Corp. and Subsidiaries
Opinion on internal control over financial reporting
We have audited the accompanying consolidated balance sheetsinternal control over financial reporting of J&J Snack Foods Corp. (a New Jersey corporation) and subsidiaries (the “Company”) as of September 30, 2017 and September 24, 2016, and the related consolidated statements of earnings, comprehensive income, changes in shareholders’ equity, and cash flows for each of the three fiscal years in the period ended September 30, 2017 (53 weeks, 52 weeks and 52 weeks, respectively). Our audits of the basic consolidated financial statements included the financial statement schedule listed in the index appearing under Item 15(a) (2). These financial statements and financial statement schedule are the responsibility of the Company’s management. Our responsibility is to express an opinion on these financial statements and financial statement schedule based on our audits. We have also audited the internal control over financial reporting of the Company as of September 30, 2017,25, 2021 based on criteria established in the 2013 Internal Control—Control—Integrated Framework issued by the Committee of Sponsoring Organizations of the Treadway Commission (COSO)(“COSO”). In our opinion, the Company maintained, in all material respects, effective internal control over financial reporting as of September 25, 2021, based on criteria established in the 2013 Internal Control—Integrated Framework issued by COSO.
We also have audited, in accordance with the standards of the Public Company Accounting Oversight Board (United States) (“PCAOB”), the consolidated financial statements of the Company as of and for the year ended September 25, 2021, and our report dated November 23, 2021 expressed an unqualified opinion on those financial statements.
Basis for opinion
The Company’s management is responsible for maintaining effective internal control over financial reporting and for its assessment of the effectiveness of internal control over financial reporting, included in the accompanying Management’s Report on Internal Control over Financial Reporting. Our responsibility is to express an opinion on the Company’s internal control over financial reporting based on our audit. We are a public accounting firm registered with the PCAOB and are required to be independent with respect to the Company in accordance with the U.S. federal securities laws and the applicable rules and regulations of the Securities and Exchange Commission and the PCAOB.
We conducted our auditsaudit in accordance with the standards of the Public Company Accounting Oversight Board (United States).PCAOB. Those standards require that we plan and perform the audit to obtain reasonable assurance about whether the financial statements are free of material misstatement and whether effective internal control over financial reporting was maintained in all material respects. AnOur audit includes examining, on a test basis, evidence supporting the amounts and disclosures in the financial statements. An audit also includes assessing the accounting principles used and significant estimates made by management, as well as evaluating the overall financial statement presentation. An audit of internal control over financial reporting includesincluded obtaining an understanding of internal control over financial reporting, assessing the risk that a material weakness exists, testing and evaluating the design and operating effectiveness of internal control based on the assessed risk, and performing such other procedures as we considerconsidered necessary in the circumstances. We believe that our audits provideaudit provides a reasonable basis for our opinion.
Definition and limitations of internal control over financial reporting
A company’scompany’s internal control over financial reporting is a process designed to provide reasonable assurance regarding the reliability of financial reporting and the preparation of financial statements for external purposes in accordance with generally accepted accounting principles. A company’s internal control over financial reporting includes those policies and procedures that (1) pertain to the maintenance of records that, in reasonable detail, accurately and fairly reflect the transactions and dispositions of the assets of the company; (2) provide reasonable assurance that transactions are recorded as necessary to permit preparation of financial statements in accordance with generally accepted accounting principles, and that receipts and expenditures of the company are being made only in accordance with authorizations of management and directors of the company; and (3) provide reasonable assurance regarding prevention or timely detection of unauthorized acquisition, use, or disposition of the company’s assets that could have a material effect on the financial statements.
Because of its inherent limitations, internal control over financial reporting may not prevent or detect misstatements. Also, projections of any evaluation of effectiveness to future periods are subject to the risk that controls may become inadequate because of changes in conditions, or that the degree of compliance with the policies or procedures may deteriorate.
In our opinion, the consolidated financial statements referred to above present fairly, in all material respects, the financial position of the Company as of September 30, 2017 and September 24, 2016, and the results of its operations and its cash flows for each of the three fiscal years in the period ended September 30, 2017 (53 weeks, 52 weeks and 52 weeks, respectively) in conformity with accounting principles generally accepted in the United States of America. Also, in our opinion, the related financial statement schedule, when considered in relation to the basic consolidated financial statements taken as a whole, presents fairly, in all material respects, the information set forth therein. Also, in our opinion the Company maintained, in all material respects, effective internal control over financial reporting as of September 30, 2017, based on criteria established in the 2013 Internal Control—Integrated Framework issued by COSO.
/s/GRANT THORNTON LLP
Philadelphia, Pennsylvania
November 28, 201723, 2021
J & J SNACK FOODS CORP. AND SUBSIDIARIES CONSOLIDATED BALANCE SHEETS (in thousands, except share amounts) September 30, September 24, September 25, September 26, 2017 2016 2021 2020 Assets Current assets Cash and cash equivalents Marketable securities held to maturity Accounts receivable, net Inventories Prepaid expenses and other Total current assets Property, plant and equipment, at cost Less accumulated depreciation and amortization Property, plant and equipment, net Other assets Goodwill Other intangible assets, net Marketable securities held to maturity Marketable securities available for sale Operating lease right-of-use assets Other Total other assets Total Assets Liabilities and Stockholders' Equity Current Liabilities Current obligations under capital leases Current finance lease liabilities Accounts payable Accrued insurance liability Accrued liabilities Current operating lease liabilities Accrued compensation expense Dividends payable Total current liabilities Long-term obligations under capital leases Noncurrent finance lease liabilities Noncurrent operating lease liabilities Deferred income taxes Other long-term liabilities Stockholders' Equity Preferred stock, $1 par value; authorized 10,000,000 shares; none issued Common stock, no par value; authorized, 50,000,000 shares; issued and outstanding 18,663,000 and 18,668,000 respectively Common stock, no par value; authorized, 50,000,000 shares; issued and outstanding 19,084,000 and 18,915,000 respectively Accumulated other comprehensive loss Retained Earnings Total stockholders' equity Total Liabilities and Stockholders' Equity The accompanying notes are an integral part of these statements. September 30, September 24, September 26, 2017 2016 2015 (53 weeks) (52 weeks) (52 weeks) Net Sales Cost of goods sold (1) Gross Profit Operating expenses Marketing (2) Distribution (3) Administrative (4) Other (income) expense Total operating expenses Operating Income Other income (expenses) Investment income Interest expense & other Earnings before income taxes Income taxes NET EARNINGS Earnings per diluted share Weighted average number of diluted shares Earnings per basic share Weighted average number of basic shares (in thousands, except per share information) Fiscal Year Ended September 25, September 26, September 28, 2021 2020 2019 (52 weeks) (52 weeks) (52 weeks) Net Sales Cost of goods sold Gross Profit Operating expenses Marketing and selling Distribution Administrative Intangible asset impairment charges Plant shutdown impairment costs Other general expense (income) Total operating expenses Operating Income Other income (expenses) Investment income Interest expense & other Earnings before income taxes Income taxes NET EARNINGS Earnings per diluted share Weighted average number of diluted shares Earnings per basic share Weighted average number of basic shares The accompanying notes are an integral part of these statements. (in thousands) September 25, September 26, September 28, 2021 2020 2019 (52 weeks) (52 weeks) (52 weeks) Net Earnings Foreign currency translation adjustments Total Other Comprehensive Income (loss), net of tax Comprehensive Income 2017 2016 2015 (53 weeks) (52 weeks) (52 weeks) Net Earnings Foreign currency translation adjustments Unrealized holding gain (loss) on marketable securities Amount reclassified from accumulated other comprehensive income Total Other Comprehensive Income (loss), net of tax Comprehensive Income J & J SNACK FOODS CORP. AND SUBSIDIARIES CONSOLIDATED STATEMENT OF CHANGES IN STOCKHOLDERS' EQUITY (in thousands) Accumulated Accumulated Other Other Common Stock Comprehensive Retained Common Stock Comprehensive Retained Shares Amount Loss Earnings Total Shares Amount Loss Earnings Total Balance at September 28, 2014 Balance at September 29, 2018 Issuance of common stock upon exercise of stock options Issuance of common stock for employee stock purchase plan Foreign currency translation adjustment Unrealized holding gain on marketable securities Reclass from accumulated other comprehensive income Issuance of common stock under deferred stock plan Dividends declared Share-based compensation Net earnings Balance at September 28, 2019 Issuance of common stock upon exercise of stock options Issuance of common stock for employee stock purchase plan Foreign currency translation adjustment Issuance of common stock under deferred stock plan Dividends declared Share-based compensation Repurchase of common stock Net earnings Balance at September 26, 2015 Balance as September 26, 2020 Issuance of common stock upon exercise of stock options Issuance of common stock for employee stock purchase plan Foreign currency translation adjustment Unrealized holding gain on marketable securities Issuance of common stock under deferred stock plan Dividends declared Share-based compensation Repurchase of common stock Net earnings Balance at September 24, 2016 Issuance of common stock upon exercise of stock options Issuance of common stock for employee stock purchase plan Foreign currency translation adjustment Unrealized holding gain on marketable securities Issuance of common stock under deferred stock plan Dividends declared Share-based compensation Repurchase of common stock Net earnings Balance at September 30, 2017 Balance as September 25, 2021 The accompanying notes are an integral part of these statements. J & J SNACK FOODS CORP. AND SUBSIDIARIES CONSOLIDATED STATEMENTS OF CASH FLOWS (in thousands) Fiscal Year Ended September 25, September 26, September 28, 2021 2020 2019 (52 weeks) (52 weeks) (52 weeks) Operating activities: Net earnings Adjustments to reconcile net earnings to net cash provided by operating activities: Depreciation of fixed assets Amortization of intangibles and deferred costs Intangible asset impairment charges Gains from disposals of property & equipment Plant shutdown impairment costs Amortization of bond premiums Share-based compensation Deferred income taxes (Gain) Loss on sale of marketable securities Changes in assets and liabilities, net of effects from purchase of companies: Decrease (increase) in accounts receivable, net Decrease (increase) in inventories Decrease (increase) in prepaid expenses and other Increase (decrease) in accounts payable and accrued liabilities Net cash provided by operating activities Investing activities: Payments for purchases of companies, net of cash acquired Purchases of property, plant and equipment Purchases of marketable securities Proceeds from redemption and sales of marketable securities Proceeds from disposal of property, plant and equipment Other Net cash provided by (used in) investing activities Financing activities: Payments to repurchase common stock Proceeds from issuance of common stock Payments on capitalized lease obligations Payment of cash dividend Net cash used in financing activities Effect of exchange rates on cash and cash equivalents Net increase in cash and cash equivalents Cash and cash equivalents at beginning of year Cash and cash equivalents at end of year The accompanying notes are an integral part of these statements. September 30, September 24, September 26, 2017 2016 2015 (53 weeks) (52 weeks) (52 weeks) Operating activities: Net earnings Adjustments to reconcile net earnings to net cash provided by operating activities: Depreciation of fixed assets Amortization of intangibles and deferred costs Gains from disposals of property & equipment Amortization of bond premiums Share-based compensation Deferred income taxes (Gain) loss on sale of marketable securities Changes in assets and liabilities, net of effects from purchase of companies: (Increase) decrease in accounts receivable, net Increase in inventories Decrease (increase) in prepaid expenses and other Increase in accounts payable and accrued liabilities Net cash provided by operating activities Investing activities: Payments for purchases of companies, net of cash acquired Purchases of property, plant and equipment Purchases of marketable securities Proceeds from redemption and sales of marketable securities Proceeds from disposal of property, plant and equipment Other Net cash used in investing activities Financing activities: Payments to repurchase common stock Proceeds from issuance of common stock Payments on capitalized lease obligations Payment of cash dividend Net cash used in financing activities Effect of exchange rates on cash and cash equivalents Net (decrease) increase in cash and cash equivalents Cash and cash equivalents at beginning of year Cash and cash equivalents at end of year NOTES TO CONSOLIDATED FINANCIAL STATEMENTSCONSOLIDATED BALANCE SHEETS(in thousands, except share amounts) $ 90,962 $ 140,652 $ 283,192 $ 195,809 59,113 13,539 7,980 51,151 124,553 98,325 162,939 126,587 103,268 88,684 123,160 108,923 3,936 13,904 7,498 17,087 381,832 355,104 584,769 499,557 653,889 605,045 757,242 717,261 426,308 420,832 490,055 455,645 227,581 184,213 267,187 261,616 102,511 86,442 121,833 121,833 61,272 41,819 77,776 81,622 60,908 90,732 4,047 16,927 30,260 29,465 10,084 13,976 54,555 58,110 2,864 2,712 1,968 2,912 257,815 251,170 270,263 295,380 $ 867,228 $ 790,487 $ 1,122,219 $ 1,056,553 $ 340 $ 365 $ 182 $ 349 72,729 62,026 96,789 73,135 10,558 10,119 16,260 13,039 7,753 6,161 10,955 7,420 13,395 13,173 19,826 16,340 17,968 16,134 7,838 7,280 12,080 10,876 119,044 102,291 167,629 134,126 904 1,235 392 368 46,557 47,688 62,705 48,186 61,578 64,413 2,253 801 409 460 - - 0 0 17,382 25,332 73,597 49,268 (8,875 ) (13,415 ) (13,383 ) (15,587 ) 673,815 626,057 785,440 775,817 682,322 637,974 845,654 809,498 $ 867,228 $ 790,487 $ 1,122,219 $ 1,056,553 F-5J & J SNACK FOODS CORP. AND SUBSIDIARIES CONSOLIDATED STATEMENTS OF EARNINGS (in thousands, except per share information) Fiscal Year Ended $ 1,084,224 $ 992,781 $ 976,256 753,201 688,314 675,366 331,023 304,467 300,890 94,394 85,963 85,160 81,824 73,114 74,158 36,843 32,299 30,891 (145 ) 281 (207 ) 212,916 191,657 190,002 118,107 112,810 110,888 5,289 4,132 1,157 (1,196 ) (123 ) (126 ) 122,200 116,819 111,919 43,026 40,844 41,736 $ 79,174 $ 75,975 $ 70,183 $ 4.21 $ 4.05 $ 3.73 18,816 18,769 18,819 $ 4.23 $ 4.07 $ 3.76 18,707 18,649 18,685 (1)Includes share-based compensation expense of $720 for the year ended September 30, 2017, $609 for the year ended September 24, 2016 and $471 for the year ended September 26, 2015. J & J SNACK FOODS CORP. AND SUBSIDIARIES(2)Includes share-based compensation expense of $1,038 for the year ended September 30, 2017, $924 for the year ended September 24, 2016 and $709 for the year ended September 26, 2015. CONSOLIDATED STATEMENTS OF EARNINGS(3) $ 1,144,579 $ 1,022,038 $ 1,186,487 845,651 783,611 836,086 298,928 238,427 350,401 77,922 84,977 96,428 108,297 92,759 94,888 40,538 36,747 40,721 1,273 0 0 0 6,387 0 (320 ) 363 1,408 227,710 221,233 233,445 71,218 17,194 116,956 2,815 4,356 7,741 (7 ) (84 ) 1,880 74,026 21,466 126,577 18,419 3,161 31,758 $ 55,607 $ 18,305 $ 94,819 $ 2.91 $ 0.96 $ 5.00 19,133 19,032 18,959 $ 2.92 $ 0.97 $ 5.04 19,013 18,901 18,812 F-6Includes share-based compensation expense of $72 for the year ended September 30, 2017, $48 for the year ended September 24, 2016 and $44 for the year ended September 26, 2015. J&J SNACK FOODS CORP. AND SUBSIDIARIES(4)Includes share-based compensation expense of $1,218 for the year ended September 30, 2017, $794 for the year ended September 24, 2016 and $942 for the year ended September 26, 2015. CONSOLIDATED STATEMENTS OF COMPREHENSIVE INCOMEThe accompanying notes are an integral part of these statements. Fiscal Year Ended $ 55,607 $ 18,305 $ 94,819 2,204 (2,599 ) (909 ) 2,204 (2,599 ) (909 ) $ 57,811 $ 15,706 $ 93,910 F-7J&J SNACK FOODS CORP. AND SUBSIDIARIES CONSOLIDATED STATEMENTS OF COMPREHENSIVE INCOME(in thousands) Fiscal Year Ended September 30, September 24, September 26, $ 79,174 $ 75,975 $ 70,183 3,745 (3,065 ) (5,389 ) 795 (8 ) (2,607 ) - 555 3,087 4,540 (2,518 ) (4,909 ) $ 83,714 $ 73,457 $ 65,274 The accompanying notes are an integral part of these statements.(in thousands) 18,663 $ 32,621 $ (5,988 ) $ 535,885 $ 562,518 18,754 $ 27,340 $ (11,994 ) $ 743,745 $ 759,091 72 3,489 - - 3,489 128 12,658 0 0 12,658 14 1,174 - - 1,174 12 1,516 0 0 1,516 - - (5,389 ) - (5,389 ) - 0 (909 ) 0 (909 ) - - 480 - 480 - 0 (85 ) 85 0 1 91 0 0 91 - 0 0 (37,654 ) (37,654 ) - 4,139 0 0 4,139 - 0 0 94,819 94,819 18,895 $ 45,744 $ (12,988 ) $ 800,995 $ 833,751 73 6,406 0 0 6,406 12 1,495 0 0 1,495 - 0 (2,599 ) 0 (2,599 ) - 21 - - 21 1 91 0 0 91 - - - (26,905 ) (26,905 ) - 0 0 (43,483 ) (43,483 ) - 2,359 - - 2,359 - 4,504 0 0 4,504 (73 ) (8,011 ) - - (8,011 ) (66 ) (8,972 ) 0 0 (8,972 ) - - - 70,183 70,183 - 0 0 18,305 18,305 18,676 $ 31,653 $ (10,897 ) $ 579,163 $ 599,919 18,915 $ 49,268 $ (15,587 ) $ 775,817 809,498 120 5,249 - - 5,249 158 18,739 0 0 18,739 14 1,320 - - 1,320 11 1,391 0 0 1,391 - - (3,065 ) - (3,065 ) - 0 2,204 0 2,204 - - 547 - 547 - 7 - - 7 - - - (29,081 ) (29,081 ) - 0 0 (45,984 ) (45,984 ) - 2,368 - - 2,368 - 4,199 0 0 4,199 (142 ) (15,265 ) - - (15,265 ) - - - 75,975 75,975 - 0 0 55,607 55,607 18,668 $ 25,332 $ (13,415 ) $ 626,057 $ 637,974 124 5,826 - - 5,826 13 1,405 - - 1,405 - - 3,745 - 3,745 - - 795 - 795 1 94 - - 94 - - - (31,416 ) (31,416 ) - 2,954 - - 2,954 (143 ) (18,229 ) - - (18,229 ) - - - 79,174 79,174 18,663 $ 17,382 $ (8,875 ) $ 673,815 $ 682,322 19,084 $ 73,597 $ (13,383 ) $ 785,440 $ 845,654 F-8 $ 55,607 $ 18,305 $ 94,819 46,781 49,830 45,225 2,610 3,218 3,385 1,273 0 0 (231 ) (303 ) (347 ) 0 6,387 0 77 296 730 4,199 4,595 4,230 (2,896 ) 2,622 9,637 (1,026 ) 882 404 (35,755 ) 14,580 (8,759 ) (14,155 ) 7,877 (3,231 ) 9,629 (11,366 ) (744 ) 35,386 (4,780 ) 2,150 101,499 92,143 147,499 0 (57,212 ) (1,156 ) (53,578 ) (57,817 ) (57,128 ) 0 (6,103 ) (26,091 ) 60,891 73,226 39,158 2,435 3,593 2,050 191 (150 ) (196 ) 9,939 (44,463 ) (43,363 ) 0 (8,972 ) 0 20,256 7,901 14,174 (144 ) (340 ) (356 ) (44,785 ) (42,053 ) (36,644 ) (24,673 ) (43,464 ) (22,826 ) 618 (802 ) (394 ) 87,383 3,414 80,916 195,809 192,395 111,479 $ 283,192 $ 195,809 $ 192,395 F-9J & J SNACK FOODS CORP. AND SUBSIDIARIESCONSOLIDATED STATEMENTS OF CASH FLOWS (in thousands) Fiscal Year Ended $ 79,174 $ 75,975 $ 70,183 38,211 34,536 32,356 4,234 5,587 5,915 (346 ) (398 ) (334 ) 1,189 1,011 103 3,048 2,375 2,166 7,847 7,700 (121 ) (14 ) 661 4,319 (20,370 ) 3,571 (3,123 ) (7,410 ) (6,295 ) (4,959 ) 10,265 (7,386 ) (2,871 ) 9,521 3,888 287 125,349 121,225 103,921 (47,698 ) - (615 ) (72,180 ) (48,709 ) (48,641 ) (39,923 ) (41,786 ) (90,240 ) 22,997 13,224 110,117 1,935 2,294 1,786 (450 ) 375 (898 ) (135,319 ) (74,602 ) (28,491 ) (18,229 ) (15,265 ) (8,011 ) 7,231 6,570 4,663 (356 ) (355 ) (243 ) (30,859 ) (28,523 ) (26,154 ) (42,213 ) (37,573 ) (29,745 ) 2,493 (2,087 ) (3,756 ) (49,690 ) 6,963 41,929 140,652 133,689 91,760 $ 90,962 $ 140,652 $ 133,689 The accompanying notes are an integral part of these statements.J & J SNACK FOODS CORP. AND SUBSIDIARIES
NOTE A – SUMMARY OF SIGNIFICANT ACCOUNTING POLICIES
J & J Snack Foods Corp. and Subsidiaries (the Company) manufactures, markets and distributes a variety of nutritional snack foods and beverages to the food service and retail supermarket industries. A summary of the significant accounting policies consistently applied in the preparation of the accompanying consolidated financial statements follows. Our 2017 fiscal year comprises 53 weeks. All references to 2017 fiscal year refer to that 53 week period. Fiscal years 20162021,2020 and 2015 comprised 2019 comprise 52 weeks.
1. Principles of Consolidation
The consolidated financial statements were prepared in accordance with U.S. GAAP. These financial statements include the accounts of J & J Snack Foods Corp. and its wholly-owned subsidiaries. Intercompany balances and transactions have been eliminated in the consolidated financial statements.
2. Revenue Recognition
We recognize revenue in accordance with ASC 606, “Revenue from Contracts with Customers.”
When Performance Obligations Are Satisfied
A performance obligation is a promise in a contract to transfer a distinct good or service to the customer and is the unit of account for revenue recognition. A contract’s transaction price is allocated to each distinct performance obligation and recognized as revenue when, or as, the performance obligation is satisfied.
The singular performance obligation of our customer contracts for product and machine sales is determined by each individual purchase order and the respective products ordered, with revenue being recognized at a point-in-time when the products are shippedobligation under the terms of the agreement is satisfied and product control is transferred to our customers. Repaircustomer. Specifically, control transfers to our customers when the product is delivered to, installed or picked up by our customers based upon applicable shipping terms, as our customers can direct the use and obtain substantially all of the remaining benefits from the product at this point in time. The performance obligations in our customer contracts for product are generally satisfied within 30 days.
The singular performance obligation of our customer contracts for time and material repair and maintenance equipment service is the performance of the repair and maintenance with revenue being recognized at a point-in-time when the repair and maintenance is recorded when itcompleted.
The singular performance obligation of our customer repair and maintenance equipment service contracts is performed provided the performance of the repair and maintenance with revenue being recognized over the time the service is expected to be performed. Our customers are billed for service contracts in advance of performance and therefore we have contract liability on our balance sheet.
Significant Payment Terms
In general, within our customer contracts, the purchase order identifies the product, quantity, price, pick-up allowances, payment terms and final delivery terms. Although some payment terms may be more extended, presently the majority of our payment terms are that30 days. As a result, we have used the customer is to be charged onavailable practical expedient and, consequently, do not adjust our revenues for the effects of a time and material basis or on a straight-line basis over the term of the contract when the customer has signed a service contract. Revenue is recognized only where persuasive evidence of an arrangement exists, our price is fixed or estimable and collectability is reasonably assured. We record offsets to revenue for allowances, end-user pricing adjustments, trade spending, coupon redemption costs and returned product. Customers generally do not have the right to return product unless it is damaged or defective. Our recorded liability for allowances, end-user pricing adjustments and trade spending was approximately $13.0 million at September 30, 2017 and $14.3 million at September 24, 2016.significant financing component.
Shipping
All amounts billed to customers related to shipping and handling are classified as revenues. Our product costs include amounts for shipping and handling,revenues; therefore, we charge our customersrecognize revenue for shipping and handling fees at the time the products are shipped or when services are performed. The cost of shipping products to the customer is recognized at the time the products are shipped to the customer and our policy is to classify them as Distribution expenses.
Variable Consideration
In addition to fixed contract consideration, our contracts include some form of variable consideration, including sales discounts, trade promotions and certain other sales and consumer incentives, including rebates and coupon redemptions. In general, variable consideration is treated as a reduction in revenue when the related revenue is recognized. Depending on the specific type of variable consideration, we use the most likely amount method to determine the variable consideration. We believe there will be no significant changes to our estimates of variable consideration when any related uncertainties are resolved with our customers. We review and update our estimates and related accruals of variable consideration each period based on historical experience. Our recorded liability for allowances, end-user pricing adjustments and trade spending was approximately $14.6 million at September 25, 2021 and $14.3 million at September 26, 2020.
Warranties & Returns
We provide all customers with a standard or assurance type warranty. Either stated or implied, we provide assurance the related products will comply with all agreed-upon specifications and other warranties provided under the law. No services beyond an assurance warranty are provided to our customers.
We do not grant a general right of return. However, customers may return defective or non-conforming products. Customer remedies may include either a cash refund or an exchange of the product. We do not estimate a right of return and related refund liability as returns of our products are rare.
Contract Balances
Our customers are billed for service contracts in advance of performance and therefore we have contract liability on our balance sheet as follows:
Fiscal Year Ended | ||||||||
September 25, | September 26, | |||||||
2021 | 2020 | |||||||
(in thousands) | ||||||||
Beginning Balance | $ | 1,327 | $ | 1,334 | ||||
Additions to contract liability | 5,544 | 5,526 | ||||||
Amounts recognized as revenue | (5,774 | ) | (5,533 | ) | ||||
Ending Balance | $ | 1,097 | $ | 1,327 | ||||
Disaggregation of Revenue
See Note N for disaggregation of our net sales by class of similar product and type of customer.
Allowance for Doubtful Receivables
The costCompany continuously monitors collections and payments from its customers and maintains a provision for estimated credit losses. The allowance for doubtful accounts considers a number of shipping productsfactors including the age of receivable balances, the history of losses, expectations of future credit losses and the customers’ ability to the customer classified as Distribution expensespay off obligations. The allowance for doubtful receivables was $81,824,000, $73,114,000$1,405,000 and $74,158,000 for the fiscal years ended 2017, 2016 $1,388,000 at September 25, 2021 and 2015, September 26, 2020, respectively.
During the years ended September 30, 2017, September 24, 2016 and September 26, 2015, we sold $23,489,000, $24,664,000 and $25,536,000, respectively, of repair and maintenance service contracts in our frozen beverage business. At September 30, 2017 and September 24, 2016, deferred income on repair and maintenance service contracts was $1,956,000 and $1,671,000, respectively, of which $210,000 and $145,000 is included in other long-term liabilities as of September 30, 2017 and September 24, 2016, respectively and the balance is reflected as short-term and included in accrued liabilities on the consolidated balance sheet. Repair and maintenance service contract income of $23,204,000, $24,571,000 and $25,534,000 was recognized for the fiscal years ended 2017, 2016 and 2015, respectively.
3. Foreign Currency
Assets and liabilities in foreign currencies are translated into U.S. dollars at the rate of exchange prevailing at the balance sheet date. Revenues and expenses are translated at the average rate of exchange for the period. The cumulative translation adjustment is recorded as a separate component of stockholders’ equity and changes to such are included in comprehensive income.
4. Use of Estimates
In preparing financial statements in conformity with accounting principles generally accepted in the United States of America, management is required to make estimates and assumptions that affect the reported amounts of assets and liabilities, the disclosure of contingent assets and liabilities at the date of the financial statements, and the reported amounts of revenues and expenses during the reporting period. Actual results could differ from those estimates.
J & J SNACK FOODS CORP. AND SUBSIDIARIES
NOTES TO CONSOLIDATED FINANCIAL STATEMENTS (continued)5. Cash Equivalents
NOTE A - SUMMARY OF SIGNIFICANT ACCOUNTING POLICIES (continued)
5. Cash Equivalents
Cash equivalents are short-term, highly liquid investments with original maturities of three months or less.
6.Concentrations Concentrations and related risks
We maintain cash balances at financial institutions located in various states. We have cash balances at twofour banks totaling approximately $45$123 million that is in excess of FDIC insurance of $250,000 per bank.federally insured limits.
Financial instruments that could potentially subject us to concentrations of credit risk are trade accounts receivable; however, such risks are limited due to the large number of customers comprising our customer base and their dispersion across geographic regions. We usually have approximately 1528 customers with accounts receivable balances of between $1 million and $10 million and one customer with a balance of approximately $14 million.
We have several large customers that account for a significant portion of our sales. Our top ten customers accounted for 42%43%, 42%43% and 43% of our sales during fiscal years 2017, 20162021,2020 and 2015,2019, respectively, with our largest customer accounting for 9%11% of our sales in 2017, 8%2021, 13% of our sales in 20162020 and 8%11% of our sales in 2015. Three2019. Five of the ten customers are food distributors who sell our product to many end users.
About 28%27% of our employees are covered by collective bargaining agreements.
None of our vendors supplied more than 10% of our ingredients and packaging in 2017, 20162021,2020 or 2015. 2019.
Virtually all of our accounts receivable are due from trade customers. Credit is extended based on evaluation of our customers’ financial condition and collateral is not required. Accounts receivable payment terms vary and are stated in the financial statements at amounts due from customers net of an allowance for doubtful accounts. At September 30, 2017 25, 2021 and September 24, 2016, 26, 2020, our accounts receivables were $124,553,000$162,939,000 and $98,325,000$126,587,000, net of an allowance for doubtful accounts of $359,000$1,405,000 and $571,000.$1,388,000. Accounts receivable outstanding longer than the payment terms are considered past due. We determine our allowance by considering a number of factors, including the length of time trade accounts receivable are past due, our previous loss history, customers’ current ability to pay their obligations to us, and the condition of the general economy and the industry as a whole. We write off accounts receivable when they become uncollectible, and payments subsequently received on such receivables are credited to the allowance for doubtful accounts.
7. Inventories
Inventories are valued at the lower of cost (determined by the first-in, first-outfirst-in, first-out method) or market.net realizable value. We recognize abnormal amounts of idle facilities, freight, handling costs, and spoilage as charges of the current period. Additionally, we allocate fixed production overhead to inventories based on the normal capacity of our production facilities. We calculate normal capacity as the production expected to be achieved over a number of periods or seasons under normal circumstances, taking into account the loss of capacity resulting from planned maintenance. This requires us to use judgment to determine when production is outside the range of expected variation in production (either abnormally low or abnormally high). In periods of abnormally low production (for example, periods in which there is significantly lower demand, labor and material shortages exist, or there is unplanned equipment downtime) the amount of fixed overhead allocated to each unit of production is not increased. However, in periods of abnormally high production the amount of fixed overhead allocated to each unit of production is decreased to assure inventories are not measured above cost.
J & J SNACK FOODS CORP. AND SUBSIDIARIES
NOTES TO CONSOLIDATED FINANCIAL STATEMENTS (continued)8. Investment Securities
NOTE A - SUMMARY OF SIGNIFICANT ACCOUNTING POLICIES (continued)
8. Investment Securities
We classify our investment securities in one of three categories: held to maturity, trading, or available for sale. Our investment portfolio at September 30, 2017, 25, 2021 consists of investments classified as held to maturity and available for sale. The securities that we have the positive intent and ability to hold to maturity are classified as held to maturity and are stated at amortized cost. Investments classified as available for sale are reported at fair market value with unrealized gains and losses related to the changes in fair value of the securities recognized in accumulated other comprehensive income (loss). investment income. The mutual funds and preferred stock in our available for sale portfolio do not have contractual maturities; however, we classify them as long termlong-term assets as it is our intent to hold them for a period of over one year, although we may sell some or all of them depending on presently unanticipated needs for liquidity or market conditions. See Note C for further information on our holdings of investment securities.
9. Depreciation and Amortization
Depreciation of equipment and buildings is provided for by the straight-line method over the assets’ estimated useful lives. We review our equipment and buildings to ensure that they provide economic benefit and are not impaired.
Amortization of leasehold improvements is provided for by the straight-line method over the term of the lease or the assets’ estimated useful lives, whichever is shorter. Licenses and rights, customer relationships, and non-compete agreements and certain tradenames are being amortized by the straight-line method over periods ranging from 32 to 20 years and amortization expense is reflected throughout operating expenses.
Long-lived assets, including fixed assets and amortizing intangibles, are reviewed for impairment as events or changes in circumstances occur indicating that the carrying amount of the asset may not be recoverable. Indefinite lived intangibles are reviewed annually for impairment. Cash flow and sales analyses are used to assess impairment. The estimates of future cash flows and sales involve considerable management judgment and are based upon assumptions about expected future operating performance. Assumptions used in these forecasts are consistent with internal planning. The actual cash flows and sales could differ from management’s estimates due to changes in business conditions, operating performance, economic conditions, competition, and consumer preferences.
10. Fair Value of Financial Instruments
The carrying value of our short-term financial instruments, such as accounts receivables and accounts payable, approximate their fair values, based on the short-term maturities of these instruments.
11. Income Taxes
We account for our income taxes under the liability method. Under the liability method, deferred tax assets and liabilities are determined based on the difference between the financial statement and tax bases of assets and liabilities as measured by the enacted tax rates that will be in effect when these differences reverse. Deferred tax expense is the result of changes in deferred tax assets and liabilities.
Additionally, we recognize a liability for income taxes and associated penalties and interest for tax positions taken or expected to be taken in a tax return which are more likely than not to be overturned by taxing authorities (“uncertain tax positions”). We have not recognized a tax benefit in our financial statements for these uncertain tax positions.
J & J SNACK FOODS CORP. AND SUBSIDIARIES
NOTES TO CONSOLIDATED FINANCIAL STATEMENTS (continued)
NOTE A - SUMMARY OF SIGNIFICANT ACCOUNTING POLICIES (continued)
As of September 30, 2017 25, 2021 and September 24, 2016, 26, 2020, the total amount of gross unrecognized tax benefits is $374,000$343,000 and $354,000;$360,000, respectively, all of which would impact our effective tax rate over time, if recognized. We recognize interest and penalties related to income tax matters as a part of the provision for income taxes. WeAs of September 25, 2021 and September 26, 2020, we had $239,000$267,000 of accrued interest and penalties as of September 30, 2017 and $219,000 as of September 24, 2016. We did not recognize any penalties and interest resulting from tax settlements in the years ended September 30, 2017 and September 24, 2016.penalties. A reconciliation of the beginning and ending amount of unrecognized tax benefits is as follows:
(in thousands) | (in thousands) | |||||||
Balance at September 24, 2016 | $ | 354 | ||||||
Balance at September 26, 2020 | $ | 360 | ||||||
Additions based on tax positions related to the current year | 20 | - | ||||||
Reductions for tax positions of prior years | - | 0 | ||||||
Settlements | - | (17 | ) | |||||
Balance at September 30, 2017 | $ | 374 | ||||||
Balance at September 25, 2021 | $ | 343 | ||||||
In addition to our federal tax return and tax returns for Mexico and Canada, we file tax returns in all states that have a corporate income tax. Virtually all the returns noted above are open for examination for three to four years.
Net earnings in the year ended September 28, 2019 benefited from a reduction of $885,000 in tax as the provision for the one-time repatriation tax was reduced as the amount recorded in 2018 was an estimate. Excluding the reduction in the provision for the one-time repatriation tax, our effective tax rate was 25.8% in 2019. Net earnings for the 2020 year benefited from a reduction in income tax expense related to state deferred taxes and provision to return adjustments of approximately $2.2 million. Excluding these benefits, our effective tax rate in our fiscal 2020 year was 25.0%. Our effective tax rate in our fiscal 2021 year was 24.9%.
12. Earnings Per Common Share
Basic earnings per common share (EPS) excludes dilution and is computed by dividing income available to common shareholders by the weighted average common shares outstanding during the period. Diluted EPS takes into consideration the potential dilution that could occur if securities (stock options) or other contracts to issue common stock were exercised and converted into common stock.
Our calculation of EPS is as follows:
Fiscal Year Ended September 30, 2017 | Fiscal Year Ended September 25, 2021 | |||||||||||||||||||||||
Income | Shares | Per Share | Income | Shares | Per Share | |||||||||||||||||||
(Numerator) | (Denominator) | Amount | (Numerator) | (Denominator) | Amount | |||||||||||||||||||
(in thousands, except per share amounts) | (in thousands, except per share amounts) | |||||||||||||||||||||||
Earnings Per Basic Share | ||||||||||||||||||||||||
Net Income available to common stockholders | $ | 79,174 | 18,707 | $ | 4.23 | $ | 55,607 | 19,013 | $ | 2.92 | ||||||||||||||
Effect of Dilutive Securities | ||||||||||||||||||||||||
Options | - | 109 | (0.02 | ) | 0 | 120 | (0.01 | ) | ||||||||||||||||
Earnings Per Diluted Share | ||||||||||||||||||||||||
Net Income available to common stockholders plus assumed conversions | $ | 79,174 | 18,816 | $ | 4.21 | $ | 55,607 | 19,133 | $ | 2.91 | ||||||||||||||
157,994 anti-dilutive shares have been excluded in the computation of 2017
284,480 anti-dilutive shares have been excluded in the computation of 2021 diluted EPS. |
| Fiscal Year Ended September 26, 2020 | ||||||||||||
Income | Shares | Per Share | ||||||||||
(Numerator) | (Denominator) | Amount | ||||||||||
(in thousands, except per share amounts) | ||||||||||||
Earnings Per Basic Share | ||||||||||||
Net Income available to common stockholders | $ | 18,305 | 18,901 | $ | 0.97 | |||||||
Effect of Dilutive Securities | ||||||||||||
Options | 0 | 131 | (0.01 | ) | ||||||||
Earnings Per Diluted Share | ||||||||||||
Net Income available to common stockholders plus assumed conversions | $ | 18,305 | 19,032 | $ | 0.96 | |||||||
341,849 anti-dilutive shares have been excluded in the computation of 2020 diluted EPS. |
| Fiscal Year Ended September 28, 2019 | ||||||||||||
Income | Shares | Per Share | ||||||||||
(Numerator) | (Denominator) | Amount | ||||||||||
(in thousands, except per share amounts) | ||||||||||||
Earnings Per Basic Share | ||||||||||||
Net Income available to common stockholders | $ | 94,819 | 18,812 | $ | 5.04 | |||||||
Effect of Dilutive Securities | ||||||||||||
Options | 0 | 147 | (0.04 | ) | ||||||||
Earnings Per Diluted Share | ||||||||||||
Net Income available to common stockholders plus assumed conversions | $ | 94,819 | 18,959 | $ | 5.00 | |||||||
162,070 anti-dilutive shares have been excluded in the computation of 2019 diluted EPS. |
NOTE A - SUMMARY OF SIGNIFICANT ACCOUNTING POLICIES (continued)
Fiscal Year Ended September 24, 2016 | ||||||||||||
Income | Shares | Per Share | ||||||||||
(Numerator) | (Denominator) | Amount | ||||||||||
(in thousands, except per share amounts) | ||||||||||||
Earnings Per Basic Share | ||||||||||||
Net Income available to common stockholders | $ | 75,975 | 18,649 | $ | 4.07 | |||||||
Effect of Dilutive Securities | ||||||||||||
Options | - | 120 | (0.02 | ) | ||||||||
Earnings Per Diluted Share | ||||||||||||
Net Income available to common stockholders plus assumed conversions | $ | 75,975 | 18,769 | $ | 4.05 | |||||||
180,170 anti-dilutive shares have been excluded in the computation of 2016 diluted EPS.
Fiscal Year Ended September 26, 2015 | ||||||||||||
Income | Shares | Per Share | ||||||||||
(Numerator) | (Denominator) | Amount | ||||||||||
(in thousands, except per share amounts) | ||||||||||||
Earnings Per Basic Share | ||||||||||||
Net Income available to common stockholders | $ | 70,183 | 18,685 | $ | 3.76 | |||||||
Effect of Dilutive Securities | ||||||||||||
Options | - | 134 | (0.03 | ) | ||||||||
Earnings Per Diluted Share | ||||||||||||
Net Income available to common stockholders plus assumed conversions | $ | 70,183 | 18,819 | $ | 3.73 | |||||||
1,500 anti-dilutive shares have been excluded in the computation of 2015 diluted EPS.
13.Accounting for Stock-Based Compensation
At September 30, 2017, 25, 2021, the Company has three stock-based employee compensation plans. Share-based compensation was recognized as follows:
Fiscal year ended | ||||||||||||
September 30, | September 24, | September 26, | ||||||||||
2017 | 2016 | 2015 | ||||||||||
| (in thousands) | ||||||||||||
Stock options | $ | (436 | ) | $ | 86 | $ | 1,098 | |||||
Stock purchase plan | 363 | 305 | 328 | |||||||||
Stock issued to an outside director | 56 | - | - | |||||||||
Restricted stock issued to employees | 4 | 4 | 6 | |||||||||
Total share-based compensation | $ | (13 | ) | $ | 395 | $ | 1,432 | |||||
The above compensation is net of tax benefits | $ | 3,061 | $ | 1,980 | $ | 734 | ||||||
J & J SNACK FOODS CORP. AND SUBSIDIARIES
NOTES TO CONSOLIDATED FINANCIAL STATEMENTS (continued)
NOTE A - SUMMARY OF SIGNIFICANT ACCOUNTING POLICIES (continued)
Income tax benefit related to share-based compensation for the years ended September 30, 2017 and September 24, 2016 includes $1,497,000 and $885,000, respectively, as a result of our early adoption as of our fiscal March 2016 quarter of Accounting Standards Update No 2016-09, Improvements to Employee Share-Based Payment Accounting. Under this new standard, income tax benefit is recognized rather than additional paid in capital upon the exercise of stock options.
Fiscal year ended | ||||||||||||
September 25, | September 26, | September 28, | ||||||||||
2021 | 2020 | 2019 | ||||||||||
| (in thousands) | |||||||||||
Stock options | $ | 2,265 | $ | 2,874 | $ | 1,743 | ||||||
Stock purchase plan | 573 | 390 | 390 | |||||||||
Stock issued to an outside director | 44 | 66 | 66 | |||||||||
Restricted stock issued to employees | 93 | 0 | 0 | |||||||||
Total share-based compensation | $ | 2,975 | $ | 3,330 | $ | 2,199 | ||||||
The above compensation is net of tax benefits | $ | 1,224 | $ | 1,265 | $ | 2,030 | ||||||
At September 30, 2017, 25, 2021, the Company has unrecognized compensation expense of approximately $4.0$6.6 million to be recognized over the next three fiscal years.
The fair value of each option grant is estimated on the date of grant using the Black-Scholes options-pricing model with the following weighted average assumptions used for grants in fiscal 2017, 20162021,2020 and 2015:2019: expected volatility of 16.6%25.8% for fiscal year 2017, expected volatility of 16.7%2021, 17.4% for fiscal year 20162020 and 18.4%17.2% for fiscal year 2015:2019: weighted average risk-free interest rates of 2.0%0.8%, 1.3%0.3% and 1.7%2.1%; dividend rate of 1.3%1.4%, 1.4%1.8% and 1.4%1.2% and expected lives ranging between 54 and 10 years for all years. An expected forfeiture rate of 13% was used for 2017, 19% was used for 2016 and 19% was used for 2015.
Expected volatility is based on the historical volatility of the price of our common shares over the past 49 to 51 months for 5 year-year options and 10 years for 10 year-year options. We use historical information to estimate expected life and forfeitures within the valuation model. The expected term of awards represents the period of time that options granted are expected to be outstanding. The risk-free rate for periods within the expected life of the option is based on the U.S. Treasury yield curve in effect at the time of grant. Compensation cost is recognized using a straight-line method over the vesting or service period and is net of estimated forfeitures.
14.Advertising Costs
Advertising costs are expensed as incurred. Total advertising expense was $5,677,000, $4,870,000$4,885,000, $6,461,000, and $4,290,000$5,938,000 for the fiscal years 2017, 20162021,2020 and 2015,2019, respectively.
15. 15. Commodity Price Risk Management
Our most significant raw material requirements include flour, packaging, shortening, corn syrup, sugar, juice, cheese, chocolate, and a variety of nuts. We attempt to minimize the effect of future price fluctuations related to the purchase of raw materials primarily through forward purchasing to cover future manufacturing requirements, generally for periods from 1 to 12 months. As of September 30, 2017, 25, 2021, we have approximately $75$78 million of such commitments. Futures contracts are not used in combination with forward purchasing of these raw materials. Our procurement practices are intended to reduce the risk of future price increases, but also may potentially limit the ability to benefit from possible price decreases. Our policy is to recognize estimated losses on purchase commitments when they occur. At each of the last three fiscal year ends, we did not have any material losses on our purchase commitments.
16. Research and Development Costs
Research and development costs are expensed as incurred. Total research and development expense was $674,000, $525,000$619,000, $680,000 and $506,000$645,000 for the fiscal years 2017, 20162021,2020 and 2015,2019, respectively.
J & J SNACK FOODS CORP. AND SUBSIDIARIES
NOTES TO CONSOLIDATED FINANCIAL STATEMENTS (continued)
NOTE A - SUMMARY OF SIGNIFICANT ACCOUNTING POLICIES (continued)
17.Recent Accounting Pronouncements
In May 2014 and in subsequent updates, the FASB issued guidance on revenue recognition which requires that we recognize revenue to depict the transfer of promised goods or services to customers in an amount that reflects the consideration which we expect to be entitled in exchange for those goods or services. We have performed a review of the requirements of the new revenue standard and are in the process of reviewing customer contracts and applying the five-step model of this new guidance to each contract category we have identified and will compare the results to our current accounting practices. We plan to adopt this guidance on the first day of our fiscal 2019 year. We will likely apply the modified retrospective transition method, which would result in an adjustment to retained earnings for the cumulative effect, if any, of applying the standard to contracts in process as of the adoption date. Under this method, we would not restate the prior financial statements presented. Therefore, this guidance would require additional disclosures of the amount by which each financial statement line item is affected in the fiscal year 2019 reporting period.
In January 2016, the FASB issued guidance which requires an entity to measure equity investments at fair value with changes in fair value recognized in net income , to use the price that would be received by a seller when measuring the fair value of financial instruments for disclosure purposes, and which eliminates the requirement to disclose the method(s) and significant assumptions used to estimate the fair value that is required to be disclosed for financial instruments measured at amortized cost on the balance sheet. Under present guidance, changes in fair value of equity investments available for sale are recognized in Stockholders’ Equity. This guidance is effective for our fiscal year ended September 2019. Early adoption is not permitted. We anticipate that the adoption of this guidance on our consolidated financial statements will not be material.
In February 2016, the FASB issued guidance on lease accounting which requires that an entity recognize most leases on its balance sheet. The guidance retains a dual lease accounting model for purposes of income statement recognition, continuing the distinction between what are currently known as “capital” and “operating” leases for lessees. This guidance is effective for our fiscal year ended September 2020. While we continue to evaluateWe adopted the effect of adopting this guidance on September 29, 2019 using this alternate transition method, but we did not record a cumulative-effect adjustment from initially applying the standard. We elected the package of practical expedients that permits us not to reassess our consolidatedprior conclusions about lease identification, lease classification and initial direct costs and made an accounting policy election to exclude short-term leases with an initial term of 12 months or less from our Consolidated Balance Sheets. We have completed the implementation of a lease accounting system to enable the preparation of financial statementsinformation and relatedhave implemented relevant accounting policies and internal controls surrounding the lease accounting process. As a result of adoption, on September 29, 2019, we recognized a right-of-use asset and lease liability of $71 million and $72 million, respectively. The right-of-use asset balance reflects the reclassification of deferred rent and prepaid rent against the initial asset. The adoption did not impact our results of operations or cash flows. See additional lease disclosures we expect our operating leases, as disclosed in Note J — Commitments and Contingencies, will be subject to the new standard. We will recognize right-of-use assets and operating lease liabilities on our consolidated balance sheets upon adoption, which will increase our total assets and liabilities.P.
In MarchJune 2016, the FASB issued guidanceASU 2016-13,Measurement of Credit Losses on share based compensation Financial Instruments, which requireschanges the impairment model used to measure credit losses for most financial assets. We are required to recognize an allowance that an entity recognize all excess tax benefits and tax deficiencies as income tax expense or benefit inreflects the income statement as discrete items inCompany’s current estimate of credit losses expected to be incurred over the reporting period in which they occur. Under current guidance, excess tax benefits are recognized in additional paid-in capital and tax deficiencies are recognized either as an offset to accumulated excess tax benefits, or in the income statement. This guidance is effective for our fiscal year ended September 2018. Early adoption is permitted. See Note A.13 to these financial statements for a discussionlife of the impact the adoption offinancial asset, including trade receivables and held to maturity debt securities.
The Company adopted this guidance in our March 2016the first quarter had on our consolidated financial statements.
In January 2017,of Fiscal 2021 using the FASB issued guidance to clarify the definition of a business. The updated standard provides guidance to assist entities with evaluating when a set of transferred assets and activities is a business. Under the new guidance, an entity first determines whether substantially all of the fair value of the gross assets acquired is concentrated in a single identifiable asset or a group of similar identifiable assets. If this threshold is met, the set is not a business. If it is not met, the entity then evaluates whether the set meets the requirements that a business include, at a minimum, an input and a substantive process that together significantly contribute to the ability to create outputs. The updated guidance is effective for our fiscal year ending September 2019 and interim periods within that year. Early adoption is permitted, including the interim and annual periods in which the financial statements have not been issued or made available for issuances. We have adopted this new guidance in the March 2017 quarter and the adoption had no impact on our consolidated financial statements.
J & J SNACK FOODS CORP. AND SUBSIDIARIES
NOTES TO CONSOLIDATED FINANCIAL STATEMENTS (continued)
NOTE A - SUMMARY OF SIGNIFICANT ACCOUNTING POLICIES (continued)
In January 2017, the FASB issued guidance to simplify the test for goodwill impairment. This updated standard simplifies the subsequent measurement of goodwill and eliminates the two-step goodwill impairment test. Under the new guidance, an annual or interim goodwill impairment test is performed by comparing the fair value of a reporting unit with its carrying amount, and an impairment charge is recognized for the amount by which the carrying amount exceeds the reporting unit’s fair value. The guidance also eliminates the requirements for any reporting unit with a zero or negative carrying amount to perform a qualitative assessment and two-step goodwill impairment test. The updated guidance is effective for our fiscal year ending September 2021 and interim periods within that year. Early adoption is permitted for interim or annual goodwill impairment tests performed on testing dates after January 1, 2017.modified retrospective transition method. The adoption of this new guidance in our September 2017 quarterASU 2016-13 did not have a material impact on ourthe Company’s consolidated financial statements.
18.Reclassifications
Certain prior year financial statement amounts have been reclassified to be consistent with the presentation for the current year.
NOTE B – ACQUISITIONS
On December 30, 2016, we acquired Hill & Valley Inc., a premium bakery located in Rock Island, IL for approximately $31 million. Hill & Valley, with sales of over $45 million annually, is a manufacturer of a variety of pre-baked cakes, cookies, pies, muffins and other desserts selling to retail in-store bakeries. Hill & Valley is a brand of Sugar Free and No Sugar Added pre-baked in-store bakery items. Additionally, Hill & Valley sustains strategic private labeling partnerships with retailers nationwide. Sales and operating income of Hill & Valley included in our 2017 fiscal year operating results were $35.8 million and $653,000, respectively.
On May 22, 2017, we acquired an ICEE distributor doing business in Georgia and Tennessee for approximately $11 million. Sales and operating income of the acquired business included in our 2017 fiscal year operating results were $1,689,000 and $395,000, respectively.
On August 16, 2017, we acquired Labriola Baking Company, a bakery of breads and artisan soft pretzels located in Alsip, IL for approximately $6 million. Labriola Bakery, with sales of approximately $17 million annually, is a manufacturer of pre-baked breads, rolls and soft pretzels for retail in-store bakery and foodservice outlets nationwide. Sales of Labriola included in our 2017 fiscal year operating results were $2,061,000 with marginal operating income.
Acquisition costs of $1,070,000 for the acquisitions are included in other general expense in the consolidated statements of earnings for the year ended September 30, 2017.
NOTE B – ACQUISITIONS (continued)
On October 1, 2019, we acquired the assets of ICEE Distributors LLC, based in Bossier City, Louisiana for approximately $45 million. ICEE Distributors does business in Arkansas, Louisiana and Texas. Sales and operating income of ICEE Distributors were $9.7 million and $2.4 million for the year ended September 25, 2021. Sales and operating income of ICEE Distributors were $11.4 million and $3.6 million for the year ended September 26, 2020.
On February 4, 2020, we acquired the assets of BAMA ICEE, based in Birmingham, Alabama for approximately $12 million. BAMA ICEE does business in Alabama and Georgia. Sales and operating income of BAMA ICEE were $1.8 million and $0.5 million for the year ended September 25, 2021. Sales and operating income of BAMA ICEE were $1.7 million and $0.6 million for the year ended September 26, 2020.
The preliminary purchase price allocations subject to final valuation, for the threethese two acquisitions are as follows:
ICEE | Labriola | |||||||||||
Hill & Valley | Distributor | Baking Co | ||||||||||
(in thousands) | ||||||||||||
Accounts Receivable, net | $ | 4,054 | $ | 340 | $ | 1,165 | ||||||
Inventories | 6,088 | 217 | 779 | |||||||||
Prepaid expenses and other | 122 | 25 | 102 | |||||||||
Property, plant & equipment, net | 4,398 | 2,277 | 3,598 | |||||||||
Trade Names | 2,090 | - | 388 | |||||||||
Customer Relationships | 13,000 | 57 | - | |||||||||
Distibution rights | - | 6,900 | - | |||||||||
Goodwill | 14,175 | 1,236 | 658 | |||||||||
Covenant not to compete | 670 | - | 188 | |||||||||
Accounts Payable | (2,260 | ) | (79 | ) | (1,110 | ) | ||||||
Accrued Liabilities | (2,162 | ) | (26 | ) | (128 | ) | ||||||
Accrued compensation expense | (650 | ) | - | - | ||||||||
Other long-term liabilities | (1,782 | ) | - | - | ||||||||
Deferred income taxes | (6,632 | ) | - | - | ||||||||
Purchase Price | $ | 31,111 | $ | 10,947 | $ | 5,640 | ||||||
(in thousands) | ||||||||||||
ICEE | BAMA | Total | ||||||||||
Distributors | ICEE | |||||||||||
Accounts Receivable, net | $ | 721 | $ | 71 | $ | 792 | ||||||
Inventories | 866 | 77 | 943 | |||||||||
Property, plant & equipment, net | 4,851 | 1,722 | 6,573 | |||||||||
Customer Relationships | 569 | 133 | 702 | |||||||||
Distribution rights | 22,400 | 6,800 | 29,200 | |||||||||
Goodwill | 15,773 | 3,549 | 19,322 | |||||||||
Accounts Payable | (210 | ) | (110 | ) | (320 | ) | ||||||
Purchase Price | $ | 44,970 | $ | 12,242 | $ | 57,212 | ||||||
The goodwill and intangible assets acquired in the business combinations are recorded at estimated fair value. To measure fair value for such assets, we use techniques including discounted expected future cash flows (Level 3 input). The goodwill recognized is attributable to the assembled workforce of each acquired business and certain other strategic intangible assets that do not meet the requirements for recognition separate and apart from goodwill. Acquisition costs of $76,000 are included in other general expense for the year ended September 26, 2020.
Our unaudited proforma results, giving effect to these three acquisitions and assuming an acquisition date of September 28, 2014, 30, 2018, would have been:
Fiscal Year Ended | ||||||||||||||||||||
(in thousands) | ||||||||||||||||||||
September 30, | September 24, | September 26, | ||||||||||||||||||
2017 | 2016 | 2015 | ||||||||||||||||||
(53 weeks) | (52 weeks) | (52 weeks) | Fiscal Year Ended | |||||||||||||||||
Unaudited | Unaudited | Unaudited | September 26, | September 28, | ||||||||||||||||
2020 | 2019 | |||||||||||||||||||
Net Sales | $ | 1,116,599 | $ | 1,062,500 | $ | 1,043,862 | $ | 1,022,838 | $ | 1,201,804 | ||||||||||
Net Earnings | $ | 79,082 | $ | 76,180 | $ | 68,938 | $ | 18,303 | $ | 96,945 | ||||||||||
NOTE C – INVESTMENT SECURITIES
We have classified our investment securities as marketable securities held to maturity and available for sale. The FASB defines fair value as the price that would be received from selling an asset or paid to transfer a liability in an orderly transaction between market participants. As such, fair value is a market-based measurement that should be determined based on assumptions that market participants would use in pricing an asset or liability. As a basis for considering such assumptions, the FASB has established three levels of inputs that may be used to measure fair value:
| Level 1Observable inputs such as quoted prices in active markets for identical assets or liabilities; |
| Level 2Observable inputs, other than Level 1 inputs in active markets, that are observable either directly or indirectly; and |
| Level 3Unobservable inputs for which there is little or no market data, which require the reporting entity to develop its own assumptions. |
Our marketable securities held to maturity and available for sale consist primarily of investments in mutual funds, preferred stock and corporate bonds. The fair values of mutual funds are based on quoted market prices in active markets and are classified within Level 1 of the fair value hierarchy. The fair values of preferred stock and corporate bonds and certificates of deposits are based on quoted prices for identical or similar instruments in markets that are not active. As a result, preferred stock and corporate bonds and certificates of deposits are classified within Level 2 of the fair value hierarchy.
The amortized cost, unrealized gains and losses, and fair market values of our marketable securities held to maturity at September 30, 2017 25, 2021 are summarized as follows:
Gross | Gross | Fair | Gross | Gross | Fair | |||||||||||||||||||||||||||
Amortized | Unrealized | Unrealized | Market | Amortized | Unrealized | Unrealized | Market | |||||||||||||||||||||||||
Cost | Gains | Losses | Value | Cost | Gains | Losses | Value | |||||||||||||||||||||||||
| (in thousands) | (in thousands) | |||||||||||||||||||||||||||||||
Corporate Bonds | $ | 114,101 | $ | 424 | $ | 155 | $ | 114,370 | $ | 12,027 | $ | 123 | $ | 18 | $ | 12,132 | ||||||||||||||||
Certificates of Deposit | 5,920 | 18 | 1 | 5,937 | ||||||||||||||||||||||||||||
Total marketable securities held to maturity | $ | 120,021 | $ | 442 | $ | 156 | $ | 120,307 | $ | 12,027 | $ | 123 | $ | 18 | $ | 12,132 | ||||||||||||||||
The amortized cost, unrealized gains and losses, and fair market values of our marketable securities available for sale at September 30, 2017 25, 2021 are summarized as follows:
Gross | Gross | Fair | Gross | Gross | Fair | |||||||||||||||||||||||||||
Amortized | Unrealized | Unrealized | Market | Amortized | Unrealized | Unrealized | Market | |||||||||||||||||||||||||
Cost | Gains | Losses | Value | Cost | Gains | Losses | Value | |||||||||||||||||||||||||
(in thousands) | (in thousands) | |||||||||||||||||||||||||||||||
Mutual Funds | $ | 13,003 | $ | 77 | $ | 240 | $ | 12,840 | $ | 3,588 | $ | 0 | $ | 536 | $ | 3,052 | ||||||||||||||||
Preferred Stock | 16,791 | 711 | 82 | 17,420 | 6,892 | 175 | 35 | 7,032 | ||||||||||||||||||||||||
Total marketable securities available for sale | $ | 29,794 | $ | 788 | $ | 322 | $ | 30,260 | $ | 10,480 | $ | 175 | $ | 571 | $ | 10,084 | ||||||||||||||||
The mutual funds seek current income with an emphasis on maintaining low volatility and overall moderate duration.duration. The mutual funds presently generate income of 4.5 %about 3.5% per year. We have invested $17$7 million in Fixed-to-Floating Perpetual Preferred Stock which generates fixed income to call dates in 2018, 2019 and 2025 and then income is based on a spread above LIBOR if the securities are not called. The annual yield from these investments is presently 5.5%5.9%, of which 70%50% is not subject to income tax. The mutual funds and the Fixed-to-Floating Perpetual Preferred Stock investment securities do not have contractual maturities; however, we classify them as long termlong-term assets as it is our intent to hold them for a period of over one year, although we may sell some or all of them depending on presently unanticipated needs for liquidity or market conditions. We have invested $114$12 million in corporate bonds which generate fixed income to maturity dates in 20172021 through 2021,2023, with $78$8 million maturing prior to the end of our fiscal year 2019.2022. The bonds presently generate income of about 2.1%3.1% per year.year based on purchase price. Our expectation is that we will hold the corporate bonds to their maturity dates and redeem them at our amortized cost.
J & J SNACK FOODS CORP. AND SUBSIDIARIES
NOTES TO CONSOLIDATED FINANCIAL STATEMENTS (continued)
NOTE C – INVESTMENT SECURITIES (continued)
The amortized cost, unrealized gains and losses, and fair market values of our marketable securities held to maturity at September 24, 2016 26, 2020 are summarized as follows:
Gross | Gross | Fair | Gross | Gross | Fair | |||||||||||||||||||||||||||
Amortized | Unrealized | Unrealized | Market | Amortized | Unrealized | Unrealized | Market | |||||||||||||||||||||||||
Cost | Gains | Losses | Value | Cost | Gains | Losses | Value | |||||||||||||||||||||||||
| (in thousands) |
| (in thousands) | ||||||||||||||||||||||||||||||
Corporate Bonds | $ | 103,311 | $ | 734 | $ | 138 | $ | 103,907 | $ | 68,078 | $ | 1,015 | $ | 32 | $ | 69,061 | ||||||||||||||||
Certificates of Deposit | 960 | 11 | - | 971 | ||||||||||||||||||||||||||||
Total marketable securities held to maturity | $ | 104,271 | $ | 745 | $ | 138 | $ | 104,878 | $ | 68,078 | $ | 1,015 | $ | 32 | $ | 69,061 | ||||||||||||||||
The amortized cost, unrealized gains and losses, and fair market values of our marketable securities available for sale at September 24, 2016 26, 2020 are summarized as follows:
Gross | Gross | Fair | Gross | Gross | Fair | |||||||||||||||||||||||||||
Amortized | Unrealized | Unrealized | Market | Amortized | Unrealized | Unrealized | Market | |||||||||||||||||||||||||
Cost | Gains | Losses | Value | Cost | Gains | Losses | Value | |||||||||||||||||||||||||
(in thousands) | (in thousands) | |||||||||||||||||||||||||||||||
Mutual Funds | $ | 13,003 | $ | - | $ | 520 | $ | 12,483 | $ | 3,588 | $ | 0 | $ | 738 | $ | 2,850 | ||||||||||||||||
Preferred Stock | 16,791 | 273 | 82 | 16,982 | 11,596 | 116 | 586 | 11,126 | ||||||||||||||||||||||||
Total marketable securities available for sale | $ | 29,794 | $ | 273 | $ | 602 | $ | 29,465 | $ | 15,184 | $ | 116 | $ | 1,324 | $ | 13,976 | ||||||||||||||||
The amortized cost and fair value of the Company’sCompany’s held to maturity securities by contractual maturity at September 30, 2017 25, 2021 and September 24, 2016 26, 2020 are summarized as follows:
September 30, 2017 | September 24, 2016 | September 25, 2021 | September 26, 2020 | |||||||||||||||||||||||||||||
Fair | Fair | Fair | Fair | |||||||||||||||||||||||||||||
Amortized | Market | Amortized | Market | Amortized | Market | Amortized | Market | |||||||||||||||||||||||||
Cost | Value | Cost | Value | Cost | Value | Cost | Value | |||||||||||||||||||||||||
(in thousands) | (in thousands) | |||||||||||||||||||||||||||||||
Due in one year or less | $ | 59,113 | $ | 59,194 | $ | 13,539 | $ | 13,552 | $ | 7,980 | $ | 8,080 | $ | 51,151 | $ | 51,815 | ||||||||||||||||
Due after one year through five years | 60,908 | 61,113 | 90,732 | 91,326 | 4,047 | 4,052 | 16,927 | 17,246 | ||||||||||||||||||||||||
Due after five years through ten years | - | - | - | - | 0 | 0 | 0 | 0 | ||||||||||||||||||||||||
Total held to maturity securities | $ | 120,021 | $ | 120,307 | $ | 104,271 | $ | 104,878 | $ | 12,027 | $ | 12,132 | $ | 68,078 | $ | 69,061 | ||||||||||||||||
Less current portion | 59,113 | 59,194 | 13,539 | 13,552 | 7,980 | 8,080 | 51,151 | 51,815 | ||||||||||||||||||||||||
Long term held to maturity securities | $ | 60,908 | $ | 61,113 | $ | 90,732 | $ | 91,326 | $ | 4,047 | $ | 4,052 | $ | 16,927 | $ | 17,246 | ||||||||||||||||
Proceeds from the sale and redemption of marketable securities were $22,997,000, $13,224,000$60,891,000, $73,226,000, and $110,117,000$39,158,000 in the years ended September 30, 2017, September 24, 2016 and 25, 2021, September 26, 2015, 2020, and September 28, 2019, respectively; with a gain of $14,000$213,000 in 20172021, a gain of $83,000 in 2020 and lossesa gain of $661,000 and $4,319,000 recorded$27,000 in 2016 and 2015, respectively.2019. We use the specific identification method to determine the cost of securities sold. Unrealized losses of $813,000 and 965,000 were recorded in 2021 and 2020, respectively.
Total marketable securities held to maturity as of September 25, 2021 with credit ratings of AAA/AA/A had an amortized cost basis totaling $1,469,000 and those with credit ratings of BBB/BB/B had an amortized cost basis totaling $10,558,000. This rating information was obtained September 30, 2021.
NOTE D – INVENTORIES
Inventories consist of the following:
September 30, | September 24, | September 25, | September 26, | |||||||||||||
2017 | 2016 | 2021 | 2020 | |||||||||||||
(in thousands) | (in thousands) | |||||||||||||||
Finished goods | $ | 45,394 | $ | 38,285 | $ | 49,756 | $ | 40,184 | ||||||||
Raw materials | 22,682 | 18,223 | 29,529 | 24,550 | ||||||||||||
Packaging materials | 8,833 | 6,799 | 11,168 | 10,545 | ||||||||||||
Equipment parts and other | 26,359 | 25,377 | ||||||||||||||
Equipment, parts and other | 32,707 | 33,644 | ||||||||||||||
Total Inventories | $ | 103,268 | $ | 88,684 | $ | 123,160 | $ | 108,923 | ||||||||
NOTE E – PROPERTY, PLANT AND EQUIPMENT
Property, plant and equipment consist of the following:following:
September 30, | September 24, | Estimated Useful Lives | Estimated | ||||||||||||||||||||||||
2017 | 2016 | (in years) | September 25, 2021 | September 26, 2020 | Useful Lives (in years) | ||||||||||||||||||||||
(in thousands) | (in thousands) | ||||||||||||||||||||||||||
Land | $ | 2,482 | $ | 2,512 | - | $ | 2,494 | $ | 2,494 | - | |||||||||||||||||
Buildings | 26,741 | 26,741 | 15 | - | 39.5 | 26,582 | 26,582 | 15 | - | 39.5 | |||||||||||||||||
Plant machinery and equipment | 257,172 | 227,614 | 5 | - | 20 | 343,716 | 330,168 | 5 | - | 20 | |||||||||||||||||
Marketing equipment | 278,860 | 278,299 | - | 7 | 258,624 | 250,914 | 5 | - | 7 | ||||||||||||||||||
Transportation equipment | 8,449 | 7,637 | 5 | 10,315 | 9,966 | 5 | |||||||||||||||||||||
Office equipment | 25,302 | 22,136 | 3 | - | 5 | 34,648 | 33,878 | 3 | - | 5 | |||||||||||||||||
Improvements | 38,003 | 34,750 | 5 | - | 20 | 45,578 | 43,264 | 5 | - | 20 | |||||||||||||||||
Construction in Progress | 16,880 | 5,356 | - | 35,285 | 19,995 | - | |||||||||||||||||||||
| 653,889 | 605,045 | 757,242 | 717,261 | ||||||||||||||||||||||||
Less accumulated depreciation and amortization | 426,308 | 420,832 | 490,055 | 455,645 | |||||||||||||||||||||||
Property, plant and equipment, net | $ | 227,581 | $ | 184,213 | $ | 267,187 | $ | 261,616 | |||||||||||||||||||
Depreciation expense was $38,211,000, $34,536,000$46,781,000, $49,830,000, and $32,356,000$45,225,000 for fiscal years 2017, 20162021,2020 and 2015,2019, respectively.
NOTE C F – INVESTMENT SECURITIES (continued) GOODWILL AND INTANGIBLE ASSETS
Our three reporting units, which are also reportable segments, are Food Service, Retail Supermarket and Frozen Beverages.
The carrying amount of acquired intangible assets for the reportable segments are as follows:
September 30, 2017 | September 24, 2016 | September 25, 2021 | September 26, 2020 | |||||||||||||||||||||||||||||
Gross | Gross | Gross | Gross | |||||||||||||||||||||||||||||
Carrying | Accumulated | Carrying | Accumulated | Carrying | Accumulated | Carrying | Accumulated | |||||||||||||||||||||||||
Amount | Amortization | Amount | Amortization | Amount | Amortization | Amount | Amortization | |||||||||||||||||||||||||
(in thousands) | (in thousands) | |||||||||||||||||||||||||||||||
FOOD SERVICE | ||||||||||||||||||||||||||||||||
Indefinite lived intangible assets | ||||||||||||||||||||||||||||||||
Trade Names | $ | 16,628 | $ | - | $ | 14,150 | $ | - | $ | 10,408 | $ | 812 | $ | 10,408 | $ | - | ||||||||||||||||
Amortized intangible assets | ||||||||||||||||||||||||||||||||
Non compete agreements | 980 | 263 | 122 | 93 | 670 | 670 | 670 | 645 | ||||||||||||||||||||||||
Customer relationships | 20,510 | 6,476 | 35,491 | 31,895 | 13,000 | 6,188 | 19,737 | 11,595 | ||||||||||||||||||||||||
License and rights | 1,690 | 1,058 | 1,690 | 974 | 1,690 | 1,396 | 1,690 | 1,312 | ||||||||||||||||||||||||
TOTAL FOOD SERVICE | $ | 39,808 | $ | 7,797 | $ | 51,453 | $ | 32,962 | $ | 25,768 | $ | 9,066 | $ | 32,505 | $ | 13,552 | ||||||||||||||||
RETAIL SUPERMARKETS | ||||||||||||||||||||||||||||||||
Indefinite lived intangible assets | ||||||||||||||||||||||||||||||||
Trade Names | $ | 6,557 | $ | - | $ | 7,206 | $ | - | $ | 12,777 | $ | 461 | $ | 12,750 | $ | - | ||||||||||||||||
Amortized Intangible Assets | ||||||||||||||||||||||||||||||||
Trade names | 649 | 130 | - | - | 649 | 649 | 676 | 519 | ||||||||||||||||||||||||
Customer relationships | 7,979 | 2,822 | 7,979 | 2,021 | 7,907 | 5,931 | 7,907 | 5,140 | ||||||||||||||||||||||||
TOTAL RETAIL SUPERMARKETS | $ | 15,185 | $ | 2,952 | $ | 15,185 | $ | 2,021 | $ | 21,333 | $ | 7,041 | $ | 21,333 | $ | 5,659 | ||||||||||||||||
FROZEN BEVERAGES | ||||||||||||||||||||||||||||||||
Indefinite lived intangible assets | ||||||||||||||||||||||||||||||||
Trade Names | $ | 9,315 | $ | - | $ | 9,315 | $ | - | $ | 9,315 | $ | - | $ | 9,315 | $ | - | ||||||||||||||||
Distribution rights | 6,900 | - | 36,100 | - | 36,100 | - | ||||||||||||||||||||||||||
Amortized intangible assets | ||||||||||||||||||||||||||||||||
Customer relationships | 257 | 50 | 200 | 28 | 1,439 | 400 | 1,439 | 257 | ||||||||||||||||||||||||
Licenses and rights | 1,400 | 794 | 1,400 | 723 | 1,400 | 1,072 | 1,400 | 1,002 | ||||||||||||||||||||||||
TOTAL FROZEN BEVERAGES | $ | 17,872 | $ | 844 | $ | 10,915 | $ | 751 | $ | 48,254 | $ | 1,472 | $ | 48,254 | $ | 1,259 | ||||||||||||||||
CONSOLIDATED | $ | 72,865 | $ | 11,593 | $ | 77,553 | $ | 35,734 | $ | 95,355 | $ | 17,579 | $ | 102,092 | $ | 20,470 | ||||||||||||||||
The gross carrying amount of intangible assets is determined by applying a discounted cash flow model to the future sales and earnings associated with each intangible asset or is set by contract cost. The amortization period used for definite lived intangible assets is set by contract period or by the period over which the bulk of the discounted cash flow is expected to be generated. We currently believe that we will receive the benefit from the use of the trade names and distribution rights classified as indefinite lived intangible assets indefinitely and they are therefore not amortized.
J & J SNACK FOODS CORP. AND SUBSIDIARIES
NOTES TO CONSOLIDATED FINANCIAL STATEMENTS (continued)
NOTE F – GOODWILL AND INTANGIBLE ASSETS (continued)
Licenses and rights, customer relationships and non-compete agreements are being amortized by the straight-line method over periods ranging from 32 to 20 years and amortization expense is reflected throughout operating expenses.
Amortizing intangibles are reviewed for impairment as events or changes in circumstances occur indicating that the carrying amount of the asset may not be recoverable. Indefinite lived intangibles are reviewed annually at year end for impairment. Cash flow and sales analyses are used to assess impairment. The estimates of future cash flows and sales involve considerable management judgment and are based upon assumptions about expected future operating performance which include Level 3 inputs such as annual growth rates and discount rates. Assumptions used in these forecasts are consistent with internal planning. The actual cash flows and sales could differ from management’s estimates due to changes in business conditions, operating performance, economic conditions, competition, and consumer preferences. There were no impairments of intangible assets in 2017, 2016 or 2015.
In connection with our annual impairment assessment conducted during the fourth quarter of 2021, we determined that the carrying amounts of two trade names exceeded their fair value as of September 25, 2021. As a result, the Company recorded an indefinite lived intangible asset impairment charge of $1,273,000 in the fourth quarter of 2021. The intangible asset impairment charge is reflected in Intangible asset impairment charges in the Consolidated Statements of Earnings. Of the total impairment charge, $812,000 related to trade names in the Food Service segment and $461,000 related to trade names in the Retail Supermarket segment.
There were 0 intangible assets acquired in fiscal year 2021. In fiscal year 2020, intangible assets of $200,000$22,969,000 were acquiredadded in the frozen beverages segment from the acquisition of ICEE Distributors in fiscal year 2015. the quarter ended December 28, 2019 and $6,933,000 from the acquisition of BAMA ICEE in the quarter ended March 28, 2020. Intangible assets of $1,078,000 were acquired in fiscal year 2016 in the food service segment due to the purchase of the HEARTBAR brand. In fiscal year 2017, intangible assets of $6,957,000 were acquired in our ICEE distributor acquisition in our frozen beverage segment and intangible assets of $15,760,000$480,000 were acquired in the Hill & Valley acquisitionFrozen Beverage segment in our food service segment and intangible assets of $576,000 were acquired in the Labriola Baking acquisition, also in our food service segment.fiscal year 2019.
Aggregate amortization expense of intangible assets for the fiscal years 2017, 20162021,2020 and 20152019 was $3,840,000, $5,078,000$2,610,000, $3,202,000, and $5,370,000,$3,320,000, respectively.
Estimated amortization expense for the next five fiscal years is approximately $3,500,000 in 2018, $3,400,000 in 2019, $3,000,000 in 2020, $2,400,000 in 2021 and $2,300,000 in 2022.2022 and 2023, $2,000,000 in 2024 and $1,400,000 in 2025 and 2026. The weighted average amortization period of the intangible assets is 10.810.9 years.
Goodwill
The carrying amounts of goodwill for the reportable segments are as follows:
Food | Retail | Frozen | ||||||||||||||
Service | Supermarkets | Beverages | Total | |||||||||||||
(in thousands) | ||||||||||||||||
Balance at September 30, 2017 | $ | 61,665 | $ | 3,670 | $ | 37,176 | $ | 102,511 | ||||||||
Balance at September 24, 2016 | $ | 46,832 | $ | 3,670 | $ | 35,940 | $ | 86,442 | ||||||||
Food | Retail | Frozen | ||||||||||||||
Service | Supermarkets | Beverages | Total | |||||||||||||
(in thousands) | ||||||||||||||||
Balance at | ||||||||||||||||
September 25, 2021 | $ | 61,189 | $ | 4,146 | $ | 56,498 | $ | 121,833 | ||||||||
September 26, 2020 | $ | 61,189 | $ | 4,146 | $ | 56,498 | $ | 121,833 | ||||||||
The carrying value of goodwill is determined based on the excess of the purchase price of acquisitions over the estimated fair value of tangible and intangible net assets. Goodwill is not amortized but is evaluated annually at year end by management for impairment. Our impairment analysis for 2017, 20162021,2020 and 20152019 was based on a combination of the income approach, which estimates the fair value of reporting units based on discounted cash flows, and the market approach, which estimates the fair value of reporting units based on comparable market prices and multiples. Under the income approach the Company used a discounted cash flow which requires Level 3 inputs such as: annual growth rates, discount rates based upon the weighted average cost of capital and terminal values based upon current stock market multiples. There were no0 impairment charges in 2017, 20162021,2020 and 2015.2019.
In 2017, goodwill of $1,236,000 was acquired in the ICEE distributor acquisition in our frozen beverage segment, goodwill of $14,175,000 was acquired in the Hill & Valley acquisition in our food service segment and goodwill of $658,000 was acquired in the Labriola Baking acquisition, also in our food service segment.
NoNaN goodwill was acquired in fiscal years 2021. In fiscal years 2015 2020, goodwill of $15,773,000 was added in the frozen beverages segment from the acquisition of ICEE Distributors in the quarter ended December 28, 2019 and 2016.$3,549,000 from the acquisition of BAMA ICEE in the quarter ended March 28, 2020.
J & J SNACK FOODS CORP. AND SUBSIDIARIES
NOTES TO CONSOLIDATED FINANCIAL STATEMENTS (continued)
NOTE G – LONG-TERM DEBT
In November 2016, we entered into an amended and restated loan agreement with our existing banks which provides for up to a $50,000,000 revolving credit facility repayable in November 2021, with the availability of repayments without penalty. Interest is calculated based on LIBOR plus an applicable margin. The agreement contains financial covenants and requires commitment fees in accordance with standard banking practice. As of September 30, 2017 25, 2021 and September 24, 2016, 26, 2020, there were no0 outstanding balances under the facility. We were in compliance with the financial covenants at September 30, 2017.25, 2021.
On November 16, 2021, we entered into an amendment and modification to the amended and restated loan agreement which extended the maturity of the revolving credit facility to December 16, 2021.
NOTE H – OBLIGATIONS UNDER CAPITAL LEASES
The following is a schedule by years of future minimum lease payments under capital leases:
(in thousands) | ||||
2018 | $ | 340 | ||
2019 | 307 | |||
2020 | 261 | |||
2021 | 266 | |||
2022 | 70 | |||
2023 and thereafter | - | |||
Total minimum capital lease payments | $ | 1,244 | ||
NOTE I – INCOME TAXES
Income tax expense (benefit) is as follows:
| Fiscal year ended | ||||||||||||
September 30, | September 24, | September 26, | ||||||||||
2017 | 2016 | 2015 | ||||||||||
| (in thousands) | ||||||||||||
Current | ||||||||||||
U.S. Federal | $ | 27,142 | $ | 25,126 | $ | 33,348 | ||||||
Foreign | 2,770 | 2,433 | 2,260 | |||||||||
State | 5,227 | 5,622 | 6,294 | |||||||||
Total current expense | 35,139 | 33,181 | 41,902 | |||||||||
Deferred | ||||||||||||
U.S. Federal | $ | 6,857 | $ | 6,444 | $ | (109 | ) | |||||
Foreign | (422 | ) | (145 | ) | (34 | ) | ||||||
State | 1,452 | 1,364 | (23 | ) | ||||||||
Total deferred expense(benefit) | 7,887 | 7,663 | (166 | ) | ||||||||
Total expense | $ | 43,026 | $ | 40,844 | $ | 41,736 | ||||||
The change in deferred taxes for the year ended September 30, 2017 does not equal deferred tax expense in the amount of $6,632,000 as a result of purchase accounting related to the Hill & Valley acquisition.
J & J SNACK FOODS CORP. AND SUBSIDIARIES
NOTES TO CONSOLIDATED FINANCIAL STATEMENTS (continued)
NOTE I – INCOME TAXES (continued)
| Fiscal year ended | ||||||||||||
September 25, | September 26, | September 28, | ||||||||||
2021 | 2020 | 2019 | ||||||||||
| (in thousands) | ||||||||||||
Current | ||||||||||||
U.S. Federal | $ | 13,964 | $ | 1,992 | $ | 14,078 | ||||||
Foreign | 860 | 193 | 2,111 | |||||||||
State | 6,431 | (1,517 | ) | 5,971 | ||||||||
Total current expense | 21,255 | 668 | 22,160 | |||||||||
Deferred | ||||||||||||
U.S. Federal | $ | (145 | ) | $ | 3,139 | $ | 6,285 | |||||
Foreign | (353 | ) | (536 | ) | 849 | |||||||
State | (2,338 | ) | (110 | ) | 2,464 | |||||||
Total deferred benefit | (2,836 | ) | 2,493 | 9,598 | ||||||||
Total expense | $ | 18,419 | $ | 3,161 | $ | 31,758 | ||||||
The provisions for income taxes differ from the amounts computed by applying the statutory federal income tax rate of approximately 35%21% for the fiscal years ended 2021,2020 and 2019 to earnings before income taxes for the following reasons:
Fiscal year ended | Fiscal year ended | |||||||||||||||||||||||
September 30, | September 24, | September 26, | September 25, | September 26, | September 28, | |||||||||||||||||||
2017 | 2016 | 2015 | 2021 | 2020 | 2019 | |||||||||||||||||||
(in thousands) | (in thousands) | |||||||||||||||||||||||
Income taxes at federal statutory rates | $ | 42,770 | $ | 40,887 | $ | 39,172 | $ | 15,545 | $ | 4,508 | $ | 26,581 | ||||||||||||
Increase (decrease)in taxes resulting from: | ||||||||||||||||||||||||
Increase (decrease) in taxes resulting from: | ||||||||||||||||||||||||
State income taxes, net of federal income tax benefit | 4,341 | 4,541 | 4,196 | 3,233 | (1,285 | ) | 6,664 | |||||||||||||||||
Domestic production activities deduction | (1,820 | ) | (2,100 | ) | (2,100 | ) | ||||||||||||||||||
One-time repatriation tax | 0 | 0 | (885 | ) | ||||||||||||||||||||
Increase in gross unrecognized tax benefits | 20 | 20 | 39 | 0 | 0 | 20 | ||||||||||||||||||
(Decrease) increase in federal valuation allowance | (6 | ) | 240 | 1,366 | ||||||||||||||||||||
Share based compensation | (1,923 | ) | (1,109 | ) | 308 | (124 | ) | (183 | ) | (777 | ) | |||||||||||||
Non deductible employee compensation | 0 | 0 | 490 | |||||||||||||||||||||
Other, net | (356 | ) | (1,635 | ) | (1,245 | ) | (235 | ) | 121 | (335 | ) | |||||||||||||
Income tax expense | $ | 43,026 | $ | 40,844 | $ | 41,736 | $ | 18,419 | $ | 3,161 | $ | 31,758 | ||||||||||||
Net earnings in the year ended September 28, 2019 benefited from a reduction of $885,000 in tax as the provision for the one-time repatriation tax was reduced as the amount recorded in 2018 was an estimate. Excluding the reduction in the provision for the one-time repatriation tax, our effective tax rate was 25.8% in 2019. Net earnings for the 2020 year benefited from a reduction in income tax expense related to state deferred taxes and provision to return adjustments of approximately $2.2 million. Excluding these benefits, our effective tax rate in our fiscal 2020 year was 25.0%. Our effective tax rate in our fiscal 2021 year was 24.9%.
Deferred tax assets and liabilities consist of the following:
September 30, | September 24, | September 25, | September 26, | |||||||||||||
2017 | 2016 | 2021 | 2020 | |||||||||||||
(in thousands) | (in thousands) | |||||||||||||||
Deferred tax assets | ||||||||||||||||
Deferred tax assets: | ||||||||||||||||
Vacation accrual | $ | 1,740 | $ | 1,646 | $ | 1,359 | $ | 1,460 | ||||||||
Capital loss carry forwards | 1,668 | 1,674 | 14 | 161 | ||||||||||||
Unrealized gains/losses | 598 | 345 | ||||||||||||||
Insurance accrual | 3,225 | 3,317 | 3,918 | 3,060 | ||||||||||||
Operating lease liabilities | 16,235 | 16,368 | ||||||||||||||
Deferred income | 927 | 112 | 30 | 105 | ||||||||||||
Allowances | 1,991 | 1,514 | 2,155 | 2,863 | ||||||||||||
Inventory capitalization | 1,235 | 954 | 1,108 | 1,058 | ||||||||||||
Share-based compensation | 1,607 | 1,253 | 1,754 | 1,637 | ||||||||||||
Net Operating Loss | 1,559 | 1,691 | 617 | 697 | ||||||||||||
Payroll Tax Accrual | 2,307 | 0 | ||||||||||||||
Plant shutdown impairment costs | 0 | 1,721 | ||||||||||||||
Foreign tax credit | 404 | 404 | ||||||||||||||
Total deferred tax assets | 13,952 | 12,161 | 30,499 | 29,879 | ||||||||||||
Valuation allowance | (1,668 | ) | (1,674 | ) | (612 | ) | (506 | ) | ||||||||
Total deferred tax assets, net | 12,284 | 10,487 | 29,887 | 29,373 | ||||||||||||
Deferred tax liabilities | ||||||||||||||||
Deferred tax liabilities: | ||||||||||||||||
Amortization of goodwill and other intangible assets | 35,043 | 27,358 | 31,540 | 29,587 | ||||||||||||
Depreciation of property and equipment | 39,946 | 31,315 | 44,924 | 48,303 | ||||||||||||
Right-of-use assets | 14,773 | 15,605 | ||||||||||||||
Accounting method change 481 (a) | 228 | 291 | ||||||||||||||
Total deferred tax liabilities | 74,989 | 58,673 | 91,465 | 93,786 | ||||||||||||
Total deferred tax liabilities, net | $ | 62,705 | $ | 48,186 | $ | 61,578 | $ | 64,413 | ||||||||
As of September 30, 2017, 25, 2021, we have federal and state capital loss carry forwards of approximately $4.6 million$2,209,000 primarily from the sale of marketable securities in fiscal year 2016 and unrealized losses incurred in fiscal years 20152019 and 2016.2020. These carry forwards willbegan to expire in 2020, 2021 and 2022. As2021. Except for current year usage, we have no foreseeable capital gains that would allow us to use this asset,asset. Accordingly, we have recorded a valuation allowance for the full amount of this deferred tax asset.
As of September 30, 2017, 25, 2021, we have a federal net operating loss carry forward of approximately $5$2.9 million from the PHILLY SWIRL acquisition. These carry forwards are subject to an annual limitation under Code Section 382 of approximately $378,000 and will expire in 2033. We have determined there are no limitations to the total use of this tax asset and accordingly, have not recorded a valuation allowance for this deferred tax asset.
NOTE I – INCOME TAXES (continued)
We have undistributed earnings of our Mexican and Canadian subsidiaries. As a result of the Tax Act, we changed our assertion with respect to foreign earnings. We are no longer permanently reinvested in earnings of our foreign subsidiaries thatfor any year. However, due to the impact of the Tax Act and the deemed repatriation of positive accumulated earnings and profits from our foreign subsidiaries in 2017, which resulted in a Sec. 965 liability of $315,000 for our fiscal year ended September 2018, no additional U.S. federal income taxes are consideredanticipated if our undistributed earnings in our Mexican and Canadian subsidiaries were repatriated to the U.S. However, if such funds were repatriated, a portion of the funds remitted may be indefinitely reinvested and accordingly no provision for US federal andsubject to applicable state income taxes has been provided thereon.
NOTE J - COMMITMENTS
1. Lease Commitmentsand non-U.S. income and withholding taxes. The amount of unrecognized deferred income tax liabilities related to potential state income tax and foreign withholding taxes is immaterial.
The followingTax Act was enacted on December 22, 2017 and introduced significant changes to U.S. income tax law. Effective in 2018, the Tax Act reduced the U.S. statutory tax rate from 35% to 21%. We have updated any provisional amounts related to the Tax Act and accounting for this is now final.
The Coronavirus, Aid, Relief and Economic Security (“CARES”) Act was signed into law on March 27, 2020, which introduced and revised numerous provisions including a summarytechnical correction to qualified improvement property for assets placed in service after 2017 through 2022 to allow for immediate depreciation to be claimed on these assets and the deferral of approximate future minimum rental commitments for non-cancelable operating leases with termsemployer’s share of more than one yearcertain payroll taxes. As a result of the CARES Act, we deferred $9.0 million of payroll taxes as of September 30, 2017:
Plants and | ||||||||||||
Offices | Equipment | Total | ||||||||||
| (in thousands) | ||||||||||||
2018 | $ | 8,613 | $ | 6,828 | $ | 15,441 | ||||||
2019 | 7,919 | 5,599 | 13,518 | |||||||||
2020 | 7,040 | 3,705 | 10,745 | |||||||||
2021 | 6,197 | 2,275 | 8,472 | |||||||||
2022 | 5,788 | 512 | 6,300 | |||||||||
2023 and thereafter | 27,976 | 62 | 28,038 | |||||||||
Total minimal rental commitments | $ | 63,533 | $ | 18,981 | $ | 82,514 | ||||||
Total rent expense was $20,354,000, $17,481,000 and $16,448,000 for fiscal years 2017, 2016 and 2015, respectively.25, 2021.
2. Other Commitments
NOTE I ‑ COMMITMENTS
We are a party to litigation which has arisen in the normal course of business which management currently believes will not have a material adverse effect on our financial condition or results of operations.
We self-insure, up to loss limits, certain insurable risks such as worker’sworkers’ compensation, automobile, and automobilegeneral liability claims. Accruals for claims under our self-insurance program are recorded on a claims incurred basis. Our total recorded liability for all years’ claims incurred but not yet paid was $8,100,000$14,500,000 and $8,200,000$12,800,000 at September 30, 2017 25, 2021 and September 24, 2016, 26, 2020, respectively. In connection with certain self-insurance agreements, we customarily enter into letters of credit arrangements with our insurers. At both September 30, 2017 25, 2021 and September 24, 2016, 26, 2020, we had outstanding letters of credit totaling $8,675,000 and $8,675,000, respectively.$9,275,000.
We have a self-insured medical plan which covers approximately 1,600 of our employees. We record a liability for incurred but not yet reported or paid claims based on our historical experience of claims payments and a calculated lag time period. Our recorded liability at September 30, 2017 25, 2021 and September 24, 2016 26, 2020 was $2,382,000$1,791,000 and $1,719,000,$1,737,000, respectively.
NOTE K -J ‑ CAPITAL STOCK
We did not purchase any shares of our common stock in our fiscal year ended September 28, 2019.
In our fiscal year ended September 30, 2017, 26, 2020, we purchased and retired 142,66565,648 shares of our common stock at a cost of $18,228,763. In our second quarter, we purchased and retired 12,926 shares at a cost of $1,682,342. In our third quarter, we purchased and retired 13,004 shares at a cost of $1,691,357. In our fourth quarter, we purchased and retired 116,735 shares at a cost of $14,855,064. $8,972,292.
In our fiscal year ended September 24, 2016, we purchased and retired 141,700We did not purchase any shares of our common stock at a cost of $15,265,019.
Inin our fiscal year ended September 26, 2015, we purchased and retired 72,698 shares of our common stock at a cost of $8,011,118.25, 2021.
J & J SNACK FOODS CORP. AND SUBSIDIARIES
NOTES TO CONSOLIDATED FINANCIAL STATEMENTS (continued)
NOTE L K – STOCK OPTIONS
We have subject to shareholder approval in February 2018, a Stock Option Plan (the “Plan”). Pursuant to the Plan, stock options may be granted to officers and our key employees which qualify as incentive stock options as well as stock options which are nonqualified. The exercise price of incentive stock options is at least the fair market value of the common stock on the date of grant. The exercise price for nonqualified options is determined by a committee of the Board of Directors. The options are generally exercisable after three years and expire no later than ten years from date of grant. There were 800,000are 174,000 shares reserved under the Plan underfor which no options havenot yet been issued. There are options that were issued under prior option plans that have since expiredbeen replaced that are still outstanding.
We have an Employee Stock Purchase Plan (“ESPP”) whereby employees purchase stock by making contributions through payroll deductions for six month-month periods. The purchase price of the stock is 85% of the lower of the market price of the stock at the beginning of the six-monthsix-month period or the end of the six-monthsix-month period. In fiscal years 2017, 20162021,2020 and 20152019 employees purchased 13,271, 13,74711,988, 12,292 and 13,64812,492 shares at average purchase prices of $105.85, $96.00$116.03, $121.62, and $86.01,$121.37, respectively. ESPP expense of $363,000, $305,000$573,000, $390,000, and $328,000$390,000 was recognized for fiscal years 2017, 20162021,2020 and 2015,2019, respectively.
A summary of the status of our stock option plans as of fiscal years 2017, 20162021,2020 and 20152019 and the changes during the years ended on those dates is represented below:
Incentive Stock Options | Nonqualified Stock Options | Incentive Stock Options | Nonqualified Stock Options | |||||||||||||||||||||||||||||
Weighted- | Weighted- | Weighted- | Weighted- | |||||||||||||||||||||||||||||
Stock | Average | Stock | Average | Stock | Average | Stock | Average | |||||||||||||||||||||||||
Options | Exercise | Options | Exercise | Options | Exercise | Options | Exercise | |||||||||||||||||||||||||
Outstanding | Price | Outstanding | Price | Outstanding | Price | Outstanding | Price | |||||||||||||||||||||||||
Balance, September 28, 2014 | 295,645 | $ | 60.83 | 249,379 | $ | 53.38 | ||||||||||||||||||||||||||
Balance, September 29, 2018 | 433,556 | $ | 120.90 | 332,269 | $ | 105.66 | ||||||||||||||||||||||||||
Granted | 114,488 | 100.94 | 55,152 | 106.96 | 118,934 | 163.14 | 66,236 | 171.78 | ||||||||||||||||||||||||
Exercised | (70,792 | ) | 47.30 | (6,590 | ) | 51.14 | (100,018 | ) | 102.01 | (35,763 | ) | 101.03 | ||||||||||||||||||||
Canceled | (6,989 | ) | 84.13 | - | - | (18,320 | ) | 127.88 | 0 | 0 | ||||||||||||||||||||||
Balance, September 26, 2015 | 332,352 | 77.04 | 297,941 | 63.34 | ||||||||||||||||||||||||||||
Balance, September 28, 2019 | 434,152 | 136.53 | 362,742 | 118.19 | ||||||||||||||||||||||||||||
Granted | 120,450 | 108.69 | 58,720 | 112.35 | 124,414 | 126.33 | 37,074 | 125.83 | ||||||||||||||||||||||||
Exercised | (86,223 | ) | 53.67 | (44,777 | ) | 42.53 | (51,350 | ) | 109.73 | (24,182 | ) | 53.43 | ||||||||||||||||||||
Canceled | (10,792 | ) | 97.07 | - | - | (36,796 | ) | 138.34 | (29,192 | ) | 135.79 | |||||||||||||||||||||
Balance, September 24, 2016 | 355,787 | 92.81 | 311,884 | 75.56 | ||||||||||||||||||||||||||||
Balance, September 26, 2020 | 470,420 | 136.62 | 346,442 | 122.04 | ||||||||||||||||||||||||||||
Granted | 121,508 | 129.35 | 59,786 | 129.94 | 111,862 | 165.53 | 43,970 | 160.14 | ||||||||||||||||||||||||
Exercised | (78,114 | ) | 65.49 | (60,156 | ) | 41.46 | (102,976 | ) | 120.83 | (55,453 | ) | 120.92 | ||||||||||||||||||||
Canceled | (6,200 | ) | 100.93 | - | - | (31,684 | ) | 143.74 | (41,222 | ) | 95.95 | |||||||||||||||||||||
Balance, September 30, 2017 | 392,981 | $ | 109.41 | 311,514 | $ | 92.58 | ||||||||||||||||||||||||||
Exercisable Options September 30, 2017 | 51,719 | $ | 81.54 | 137,856 | $ | 62.21 | ||||||||||||||||||||||||||
Balance, September 25, 2021 | 447,622 | $ | 146.98 | 293,737 | $ | 132.29 | ||||||||||||||||||||||||||
Exercisable Options September 25, 2021 | 123,552 | $ | 136.24 | 144,327 | $ | 108.19 | ||||||||||||||||||||||||||
The weighted-average fair value of incentive stock options granted during fiscal years ended September 30, 2017, September 24, 2016 and 25, 2021, September 26, 2015 2020 and September 28, 2019 was $18.84, $13.94$31.20, $14.43 and $15.27,$26.29, respectively. The weighted-average fair value of non-qualified stock options granted during the fiscal years ended September 30, 2017, September 24, 2016 and 25, 2021, September 26, 2015 2020 and September 28, 2019 was $24.82, $19.95$29.76, $14.32 and $21.90,$33.11, respectively. The total intrinsic value of stock options exercised was $10.1$6.0 million, $8.4$5.7 million and $4.8$9.4 million in fiscal years 2017, 20162021,2020 and 2015,2019, respectively.
J & J SNACK FOODS CORP. AND SUBSIDIARIES
NOTES TO CONSOLIDATED FINANCIAL STATEMENTS (continued)
NOTE L – STOCK OPTIONS (continued)
The total cash received from these option exercises was $5.8$18.7 million, $5.3$6.4 million and $3.1$12.7 million in fiscal years 2017, 20162021,2020 and 2015,2019, respectively; and the actual tax benefit realized from the tax deductions from these option exercises was $3.0$1.2 million, $1.6$1.1 million and $874,000$1.8 million in fiscal years 2017, 20162021,2020 and 2015,2019, respectively.
The following table summarizes information about incentive stock options outstanding as of September 25, 2021: |
The following table summarizes information about incentive stock options outstanding as of September 30, 2017:
Options Outstanding | Options Exercisable | |||||||||||||||||||||
Number | Weighted- | Number | ||||||||||||||||||||
Outstanding | Average | Weighted- | Exercisable | Weighted- | ||||||||||||||||||
at | Remaining | Average | at | Average | ||||||||||||||||||
Range of | September 25, | Contractual | Exercise | September 25, | Exercise | |||||||||||||||||
Exercise Prices | 2021 | Life | Price | 2021 | Price | |||||||||||||||||
$125.83 | - | $158.97 | 237,596 | 2.3 | $ | 131.41 | 123,052 | $ | 136.13 | |||||||||||||
$163.29 | - | $192.13 | 210,026 | 3.7 | $ | 164.59 | 500 | 163.29 | ||||||||||||||
Total options | 447,622 | 123,552 | 136.24 | |||||||||||||||||||
The following table summarizes information about nonqualified stock options outstanding as of September 25, 2021: |
Options Outstanding | Options Exercisable | |||||||||||||||||||||
Number | Weighted- | Number | ||||||||||||||||||||
Outstanding | Average | Weighted- | Exercisable | Weighted- | ||||||||||||||||||
at | Remaining | Average | at | Average | ||||||||||||||||||
Range of | September 25, | Contractual | Exercise | September 25, | Exercise | |||||||||||||||||
Exercise Prices | 2021 | Life | Price | 2021 | Price | |||||||||||||||||
$57.33 | - | $94.24 | 60,000 | 2.0 | $ | 77.45 | 60,000 | $ | 77.45 | |||||||||||||
$117.85 | - | $131.30 | 98,137 | 2.4 | $ | 126.11 | 62,681 | 126.27 | ||||||||||||||
$141.01 | - | $191.40 | 135,600 | 3.1 | $ | 161.03 | 21,646 | 141.01 | ||||||||||||||
Total options | 293,737 | 144,327 | 108.19 | |||||||||||||||||||
Options Outstanding | Options Exercisable | |||||||||||||||||||||
Number | Weighted- | Number | ||||||||||||||||||||
Outstanding | Average | Weighted- | Exercisable | Weighted- | ||||||||||||||||||
at | Remaining | Average | at | Average | ||||||||||||||||||
Range of | September 30, | Contractual | Exercise | September 30, | Exercise | |||||||||||||||||
Exercise Prices | 2017 | Life | Price | 2017 | Price | |||||||||||||||||
$57.15 | - | $81.67 | 51,219 | 1.1 | $ | 81.43 | 51,219 | $ | 81.43 | |||||||||||||
$93.17 | - | $137.16 | 341,762 | 3.4 | 113.60 | 500 | 93.17 | |||||||||||||||
Total options | 392,981 | 3.1 | 109.41 | 51,719 | 81.54 | |||||||||||||||||
The following table summarizes information about nonqualified stock options outstanding as of September 30, 2017:
Options Outstanding | Options Exercisable | |||||||||||||||||||||
Number | Weighted- | Number | ||||||||||||||||||||
Outstanding | Average | Weighted- | Exercisable | Weighted- | ||||||||||||||||||
at | Remaining | Average | at | Average | ||||||||||||||||||
Range of | September 30, | Contractual | Exercise | September 30, | Exercise | |||||||||||||||||
Exercise Prices | 2017 | Life | Price | 2017 | Price | |||||||||||||||||
$34.17 | - | $47.59 | 60,000 | 2.7 | $ | 41.17 | 60,000 | $ | 41.17 | |||||||||||||
$57.33 | - | $81.67 | 57,856 | 4.1 | 72.95 | 57,856 | 72.95 | |||||||||||||||
$94.24 | - | $131.30 | 193,658 | 5.5 | 114.38 | 20,000 | 94.24 | |||||||||||||||
Total options | 311,514 | 4.7 | 92.58 | 137,856 | 62.21 | |||||||||||||||||
NOTE M L – 401(k) PROFIT-SHARING401(k) PROFIT‑SHARING PLAN
We maintain a 401(k)401(k) profit-sharing plan for our employees. Under this plan, we may make discretionary profit-sharingprofit‑sharing and matching 401(k)401(k) contributions. Contributions of $2,084,000, $1,936,000$2,270,000, $2,390,000, and $1,836,000$2,433,000 were made in fiscal years 2017, 20162021,2020 and 2015,2019, respectively.
NOTE N M – CASH FLOW INFORMATION
The following is supplemental cash flow information:
| Fiscal Year Ended | ||||||||||||||||||||||||
Fiscal Year Ended | Fiscal Year Ended | |||||||||||||||||||||||
September 30, | September 24, | September 26, | September 25, | September 26, | September 28, | |||||||||||||||||||
2017 | 2016 | 2015 | 2021 | 2020 | 2019 | |||||||||||||||||||
(in thousands) | (in thousands) | |||||||||||||||||||||||
Cash paid for: | ||||||||||||||||||||||||
Interest | $ | 52 | $ | 57 | $ | 53 | $ | 23 | $ | 29 | $ | 36 | ||||||||||||
Income taxes | 25,024 | 41,064 | 43,867 | 4,275 | 11,556 | 23,002 | ||||||||||||||||||
Non cash items: | ||||||||||||||||||||||||
Capital leases | $ | - | $ | 486 | $ | 1,191 | ||||||||||||||||||
Obtaining a right-of-use asset in exchange for a lease liability | $ | 6,513 | $ | 685 | $ | 336 | ||||||||||||||||||
J & J SNACK FOODS CORP. AND SUBSIDIARIES
NOTES TO CONSOLIDATED FINANCIAL STATEMENTS (continued)
NOTE O N – SEGMENT REPORTING
We principally sell our products to the food service and retail supermarket industries. Sales and results of our frozen beverages business are monitored separately from the balance of our food service business because of different distribution and capital requirements. We maintain separate and discrete financial information for the three operating segments mentioned above which is available to our Chief Operating Decision Makers.Maker. We have applied no aggregation criteria to any of these operating segments in order to determine reportable segments. Our three3 reportable segments are Food Service, Retail Supermarkets and Frozen Beverages. All inter-segment net sales and expenses have been eliminated in computing net sales and operating income. These segments are described below.
Food Service
The primary products sold by the food service segment are soft pretzels, frozen juice treats and desserts,novelties, churros, dough enrobed handheld products and baked goods. Our customers in the food service segment include snack bars and food stands in chain, department, and discount stores; malls and shopping centers; casual dining restaurants; fast food outlets; stadiums and sports arenas; leisure and theme parks; convenience stores; movie theatres; warehouse club stores; schools, colleges, and other institutions. Within the food service industry, our products are purchased by the consumer primarily for consumption at the point-of-sale.
Retail Supermarkets
The primary products sold to the retail supermarket channel are soft pretzel products – including SUPERPRETZEL, frozen juice treats and dessertsnovelties including LUIGI’S Real Italian Ice, MINUTE MAID Juice Bars and Soft Frozen Lemonade, WHOLE FRUIT frozen fruit bars and sorbet, PHILLY SWIRL cups and sticks, ICEE Squeeze-Up Tubes and dough enrobed handheld products including PATIO burritos.products. Within the retail supermarket channel, our frozen and prepackaged products are purchased by the consumer for consumption at home.
Frozen Beverages
We sellThe Company markets frozen beverages to the food service industry primarily under the names ICEE, SLUSH PUPPIE and PARROT ICE which are sold primarily in the United States, Mexico, and Canada. We also provide repair and maintenance service to customers for customers’ owned equipment.
The Chief Operating Decision Maker for Food Service, and Retail Supermarkets and the Chief Operating Decision Maker for Frozen Beverages reviews monthly review detailed operating income statements and sales reports in order to assess performance and allocate resources to each individual segment. Sales and operating income are key variables monitored by the Chief Operating Decision MakersMaker and management when determining each segment’s and the company’s financial condition and operating performance. In addition, the Chief Operating Decision Makers reviewMaker reviews and evaluateevaluates depreciation, capital spending and assets of each segment on a quarterly basis to monitor cash flow and asset needs of each segment. Information regarding the operations in these three reportable segments is as follows:
NOTE O – SEGMENT REPORTING (continued)
Fiscal year ended | ||||||||||||
September 30, | September 24, | September 26, | ||||||||||
2017 | 2016 | 2015 | ||||||||||
(53 weeks) | (52 weeks) | (52 weeks) | ||||||||||
| (in thousands) | ||||||||||||
Sales to External Customers: | ||||||||||||
Food Service | ||||||||||||
Soft pretzels | $ | 180,138 | $ | 170,155 | $ | 168,970 | ||||||
Frozen juices and ices | 49,469 | 51,798 | 54,454 | |||||||||
Churros | 62,809 | 57,318 | 56,602 | |||||||||
Handhelds | 36,913 | 27,427 | 21,817 | |||||||||
Bakery | 351,357 | 294,518 | 301,135 | |||||||||
Other | 21,108 | 20,313 | 13,657 | |||||||||
Total Food Service | $ | 701,794 | $ | 621,529 | $ | 616,635 | ||||||
Retail Supermarket | ||||||||||||
Soft pretzels | $ | 35,081 | $ | 33,279 | $ | 35,727 | ||||||
Frozen juices and ices | 71,325 | 68,924 | 72,174 | |||||||||
Handhelds | 14,892 | 15,347 | 18,957 | |||||||||
Coupon redemption | (4,898 | ) | (4,430 | ) | (4,725 | ) | ||||||
Other | 2,847 | 4,469 | 1,244 | |||||||||
Total Retail Supermarket | $ | 119,247 | $ | 117,589 | $ | 123,377 | ||||||
Frozen Beverages | ||||||||||||
Beverages | $ | 160,243 | $ | 150,118 | $ | 142,705 | ||||||
Repair and maintenance service | 74,594 | 71,123 | 65,765 | |||||||||
Machines sales | 27,073 | 31,155 | 26,413 | |||||||||
Other | 1,273 | 1,267 | 1,361 | |||||||||
Total Frozen Beverages | $ | 263,183 | $ | 253,663 | $ | 236,244 | ||||||
Consolidated Sales | $ | 1,084,224 | $ | 992,781 | $ | 976,256 | ||||||
Depreciation and Amortization: | ||||||||||||
Food Service | $ | 24,629 | $ | 22,912 | $ | 21,289 | ||||||
Retail Supermarket | 949 | 1,031 | 1,132 | |||||||||
Frozen Beverages | 16,867 | 16,180 | 15,850 | |||||||||
Total Depreciation and Amortization | $ | 42,445 | $ | 40,123 | $ | 38,271 | ||||||
Operating Income: | ||||||||||||
Food Service | $ | 81,208 | $ | 76,539 | $ | 75,286 | ||||||
Retail Supermarket | 10,627 | 9,618 | 11,020 | |||||||||
Frozen Beverages | 26,272 | 26,653 | 24,582 | |||||||||
Total Operating Income | $ | 118,107 | $ | 112,810 | $ | 110,888 | ||||||
Capital Expenditures: | ||||||||||||
Food Service | $ | 44,067 | $ | 24,759 | $ | 28,228 | ||||||
Retail Supermarket | 239 | 369 | 112 | |||||||||
Frozen Beverages | 27,874 | 23,581 | 20,301 | |||||||||
Total Capital Expenditures | $ | 72,180 | $ | 48,709 | $ | 48,641 | ||||||
Assets: | ||||||||||||
Food Service | $ | 635,709 | $ | 589,854 | $ | 543,851 | ||||||
Retail Supermarket | 21,129 | 22,090 | 24,209 | |||||||||
Frozen Beverages | 210,390 | 178,543 | 171,609 | |||||||||
Total Assets | $ | 867,228 | $ | 790,487 | $ | 739,669 | ||||||
September 25, |
September 26, |
September 28, | ||||||||||
2021 | 2020 | 2019 | ||||||||||
(52 weeks) | (52 weeks) | (52 weeks) | ||||||||||
| (in thousands) | ||||||||||||
Sales to External Customers: | ||||||||||||
Food Service | ||||||||||||
Soft pretzels | $ | 174,977 | $ | 150,786 | $ | 209,227 | ||||||
Frozen novelties | 44,605 | 35,176 | 43,672 | |||||||||
Churros | 64,916 | 46,881 | 65,976 | |||||||||
Handhelds | 75,627 | 36,088 | 31,685 | |||||||||
Bakery | 342,609 | 332,514 | 359,020 | |||||||||
Other | 22,249 | 17,448 | 26,707 | |||||||||
Total Food Service | $ | 724,983 | $ | 618,893 | $ | 736,287 | ||||||
Retail Supermarket | ||||||||||||
Soft pretzels | $ | 54,990 | $ | 49,157 | $ | 36,264 | ||||||
Frozen novelties | 100,059 | 88,743 | 73,751 | |||||||||
Biscuits | 24,197 | 28,317 | 25,316 | |||||||||
Handhelds | 7,574 | 12,303 | 10,902 | |||||||||
Coupon redemption | (3,689 | ) | (3,569 | ) | (3,596 | ) | ||||||
Other | 1,766 | 2,214 | 1,955 | |||||||||
Total Retail Supermarket | $ | 184,897 | $ | 177,165 | $ | 144,592 | ||||||
Frozen Beverages | ||||||||||||
Beverages | $ | 124,498 | $ | 107,004 | $ | 171,820 | ||||||
Repair and maintenance service | 81,305 | 83,420 | 85,834 | |||||||||
Machines revenue | 26,953 | 33,986 | 45,811 | |||||||||
Other | 1,943 | 1,570 | 2,143 | |||||||||
Total Frozen Beverages | $ | 234,699 | $ | 225,980 | $ | 305,608 | ||||||
Consolidated Sales | $ | 1,144,579 | $ | 1,022,038 | $ | 1,186,487 | ||||||
Depreciation and Amortization: | ||||||||||||
Food Service | $ | 26,738 | $ | 28,111 | $ | 26,978 | ||||||
Retail Supermarket | 1,671 | 1,577 | 1,418 | |||||||||
Frozen Beverages | 20,982 | 23,360 | 20,214 | |||||||||
Total Depreciation and Amortization | $ | 49,391 | $ | 53,048 | $ | 48,610 | ||||||
Operating Income: | ||||||||||||
Food Service | $ | 39,172 | $ | 6,458 | $ | 76,546 | ||||||
Retail Supermarket | 25,914 | 23,202 | 10,460 | |||||||||
Frozen Beverages | 6,132 | (12,466 | ) | 29,950 | ||||||||
Total Operating Income | $ | 71,218 | $ | 17,194 | $ | 116,956 | ||||||
Capital Expenditures: | ||||||||||||
Food Service | $ | 38,558 | $ | 34,798 | $ | 29,197 | ||||||
Retail Supermarket | 288 | 1,763 | 1,979 | |||||||||
Frozen Beverages | 14,732 | 21,256 | 25,952 | |||||||||
Total Capital Expenditures | $ | 53,578 | $ | 57,817 | $ | 57,128 | ||||||
Assets: | ||||||||||||
Food Service | $ | 799,149 | $ | 738,033 | $ | 766,081 | ||||||
Retail Supermarket | 31,486 | 31,704 | 29,369 | |||||||||
Frozen Beverages | 291,584 | 286,816 | 223,889 | |||||||||
Total Assets | $ | 1,122,219 | $ | 1,056,553 | $ | 1,019,339 | ||||||
NOTE PO - ACCUMULATED OTHER COMPREHENSIVE LOSS:
Changes to the components of accumulated other comprehensive loss are as follows:
Fiscal Year Ended September 30, 2017 | Fiscal Year Ended September 25, 2021 | |||||||||||||||
| (in thousands) | (in thousands) | |||||||||||||||
Unrealized | ||||||||||||||||
Foreign Currency | Holding (Loss) Gain | Foreign Currency | ||||||||||||||
Translation | on Marketable | Translation | ||||||||||||||
Adjustments | Securities | Total | Adjustments | |||||||||||||
Beginning Balance | $ | (13,086 | ) | $ | (329 | ) | $ | (13,415 | ) | $ | (15,587 | ) | ||||
Other comprehensive loss before reclassifications | 3,745 | 795 | 4,540 | |||||||||||||
Amounts reclassified from accumulated other comprehensive income | - | - | - | |||||||||||||
Other comprehensive income | 2,204 | |||||||||||||||
Ending Balance | $ | (9,341 | ) | $ | 466 | $ | (8,875 | ) | $ | (13,383 | ) | |||||
Fiscal Year Ended September 24, 2016 | Fiscal Year Ended September 26, 2020 | |||||||||||||||
| (in thousands) | (in thousands) | |||||||||||||||
Unrealized | ||||||||||||||||
Foreign Currency | Holding Loss on | Foreign Currency | ||||||||||||||
Translation | Marketable | Translation | ||||||||||||||
Adjustments | Securities | Total | Adjustments | |||||||||||||
Beginning Balance | $ | (10,021 | ) | $ | (876 | ) | $ | (10,897 | ) | $ | (12,988 | ) | ||||
Other comprehensive loss before reclassifications | (3,065 | ) | (8 | ) | (3,073 | ) | ||||||||||
Amounts reclassified from accumulated other comprehensive income | - | 555 | 555 | |||||||||||||
Other comprehensive loss | (2,599 | ) | ||||||||||||||
Ending Balance | $ | (13,086 | ) | $ | (329 | ) | $ | (13,415 | ) | $ | (15,587 | ) | ||||
NOTE P – LEASES
General Lease Description
We have operating leases with initial noncancelable lease terms in excess of one year covering the rental of various facilities and equipment. Certain of these leases contain renewal options and some provide options to purchase during the lease term. Our operating leases include leases for real estate from some of our office and manufacturing facilities as well as manufacturing and non-manufacturing equipment used in our business. The remaining lease terms for these operating leases range from 1 month to 13 years.
We have finance leases with initial noncancelable lease terms in excess of one year covering the rental of various equipment. These leases are generally for manufacturing and non-manufacturing equipment used in our business. The remaining lease terms for these finance leases range from 1 year to 6 years.
Significant Assumptions and Judgments
Contract Contains a Lease
In evaluating our contracts to determine whether a contract is or contains a lease, we considered the following:
• Whether explicitly or implicitly identified assets have been deployed in the contract; and
• Whether we obtain substantially all of the economic benefits from the use of that underlying asset, and we can direct how and for what purpose the asset is used during the term of the contract.
Allocation of Consideration
In determining how to allocate consideration between lease and non-lease components in a contract that was deemed to contain a lease, we used judgment and consistent application of assumptions to reasonably allocate the consideration.
Options to Extend or Terminate Leases
We have leases which contain options to extend or terminate the leases. On a lease-by-lease basis, we have determined if the extension should be considered reasonably certain to be exercised and thus a right-of-use asset and a lease liability should be recorded.
Discount Rate
The discount rate for leases, if not explicitly stated in the lease, is the incremental borrowing rate, which is the rate of interest that a lessee would have to pay to borrow on a collateralized basis over a similar term an amount equal to the lease payments in a similar economic environment.
We used a discount rate to calculate the present value of the lease liability at the date of adoption. In the development of the discount rate, we considered our internal borrowing rate, treasury security rates, collateral, and credit risk specific to us, and our lease portfolio characteristics.
As of September 25, 2021, the weighted-average discount rate of our operating and finance leases was 3.3% and 3.2%, respectively. As of September 26, 2020, the weighted-average discount rate of our operating and finance leases was 3.3% and 3.1%, respectively
Amounts Recognized in the Financial Statements | |
| The components of lease expense were as follows: | |
Twelve Months Ended | Twelve Months Ended | |||||||
September 25, 2021 | September 26, 2020 | |||||||
Operating lease cost in Cost of goods sold and Operating Expenses | $ | 15,471 | $ | 17,250 | ||||
Finance lease cost: | ||||||||
Amortization of assets in Cost of goods sold and Operating Expenses | $ | 346 | $ | 337 | ||||
Interest on lease liabilities in Interest expense & other | 25 | 29 | ||||||
Total finance lease cost | $ | 371 | $ | 366 | ||||
Short-term lease cost in Cost of goods sold and Operating Expenses | 0 | 0 | ||||||
Total net lease cost | $ | 15,842 | $ | 17,616 | ||||
Supplemental balance sheet information related to leases is as follows: |
September 25, 2021 | September 26, 2020 | |||||||
Operating Leases | ||||||||
Operating lease right-of-use assets | $ | 54,555 | $ | 58,110 | ||||
Current operating lease liabilities | $ | 13,395 | $ | 13,173 | ||||
Noncurrent operating lease liabilities | 46,557 | 47,688 | ||||||
Total operating lease liabilities | $ | 59,952 | $ | 60,861 | ||||
Finance Leases | ||||||||
Finance lease right-of-use assets in Property, plant and equipment, net | $ | 561 | $ | 684 | ||||
Current finance lease liabilities | $ | 182 | $ | 349 | ||||
Noncurrent finance lease liabilities | 392 | 368 | ||||||
Total finance lease liabilities | $ | 574 | $ | 717 | ||||
| Supplemental cash flow information related to leases is as follows: |
Twelve Months Ended | Twelve Months Ended | |||||||
September 25, 2021 | September 26, 2020 | |||||||
Cash paid for amounts included in the measurement of lease liabilities: | ||||||||
Operating cash flows from operating leases | $ | 15,651 | $ | 17,324 | ||||
Operating cash flows from finance leases | $ | 144 | $ | 340 | ||||
Financing cash flows from finance leases | $ | 25 | $ | 29 | ||||
Supplemental noncash information on lease liabilities arising from obtaining right-of-use assets | $ | 6,513 | $ | 685 | ||||
Supplemental noncash information on lease liabilities removed due to purchase of leased asset | $ | - | $ | - | ||||
As of September 25, 2021, the maturities of lease liabilities were as follows: |
Operating Leases | Finance Leases | |||||||
2022 | $ | 14,994 | $ | 207 | ||||
2023 | 12,821 | 137 | ||||||
2024 | 10,071 | 137 | ||||||
2025 | 6,769 | 65 | ||||||
2026 | 4,411 | 39 | ||||||
Thereafter | 17,258 | 32 | ||||||
Total minimum payments | $ | 66,324 | $ | 617 | ||||
Less amount representing interest | (6,372 | ) | (43 | ) | ||||
Present value of lease obligations | $ | 59,952 | $ | 574 | ||||
As of September 25, 2021, the weighted-average remaining term of our operating and finance leases was 6.3 years and 4.2 years, respectively. As of September 26, 2021, the weighted average remaining term of our operating and finance leases was 7.1 years and 3.5 years, respectively. |
J & J SNACK FOODS CORP. AND SUBSIDIARIES
NOTES TO CONSOLIDATED FINANCIAL STATEMENTS (continued)
NOTE Q - QUARTERLY FINANCIAL DATA (UNAUDITED)
Fiscal Year Ended September 30, 2017 | ||||||||||||||||
Net Earnings | ||||||||||||||||
Per | ||||||||||||||||
Gross | Net | Diluted | ||||||||||||||
Net Sales | Profit | Earnings | Share(1) | |||||||||||||
(in thousands, except per share information) | ||||||||||||||||
1st Quarter | $ | 225,570 | $ | 65,895 | $ | 13,540 | $ | 0.72 | ||||||||
2nd Quarter | 246,513 | 72,817 | 15,987 | 0.85 | ||||||||||||
3rd Quarter | 295,415 | 94,764 | 25,304 | 1.34 | ||||||||||||
4th Quarter | 316,726 | 97,547 | 24,343 | 1.29 | ||||||||||||
Total | $ | 1,084,224 | $ | 331,023 | $ | 79,174 | $ | 4.20 | ||||||||
Fiscal Year Ended September 24, 2016 | ||||||||||||||||
Net Earnings | ||||||||||||||||
Per | ||||||||||||||||
Gross | Net | Diluted | ||||||||||||||
Net Sales | Profit | Earnings | Share(1) | |||||||||||||
(in thousands, except per share information) | ||||||||||||||||
1st Quarter | $ | 222,850 | $ | 63,835 | $ | 12,978 | $ | 0.69 | ||||||||
2nd Quarter | 229,710 | 68,749 | 15,588 | 0.83 | ||||||||||||
3rd Quarter | 277,981 | 92,086 | 26,791 | 1.43 | ||||||||||||
4th Quarter | 262,240 | 79,797 | 20,618 | 1.10 | ||||||||||||
Total | $ | 992,781 | $ | 304,467 | $ | 75,975 | $ | 4.05 | ||||||||
Opening | Charged to | Closing | |||||||||||||||
Year | Description | Balance | Expense | Deductions | Balance | ||||||||||||
2021 | Allowance for doubtful accounts | $ | 1,388,000 | $ | 338,000 | $ | 321,000 | (1) | $ | 1,405,000 | |||||||
2020 | Allowance for doubtful accounts | $ | 572,000 | $ | 1,105,000 | $ | 289,000 | (1) | $ | 1,388,000 | |||||||
2019 | Allowance for doubtful accounts | $ | 400,000 | $ | 389,000 | $ | 217,000 | (1) | $ | 572,000 | |||||||
|
|
SCHEDULE II - VALUATION AND QUALIFYING ACCOUNTS
Opening | Charged to | Closing | |||||||||||||||
Year | Description | Balance | Expense | Deductions | Balance | ||||||||||||
2017 | Allowance for doubtful accounts | $ | 571,000 | $ | 122,000 | $ | 334,000 | (1) | $ | 359,000 | |||||||
2016 | Allowance for doubtful accounts | $ | 304,000 | $ | 525,000 | $ | 258,000 | (1) | $ | 571,000 | |||||||
2015 | Allowance for doubtful accounts | $ | 450,000 | $ | 310,000 | $ | 456,000 | (1) | $ | 304,000 | |||||||
|