SECURITIES AND EXCHANGE COMMISSION
(Mark One)
| | | | | |
| ☒ | [X]
| ANNUAL REPORT PURSUANT TO SECTION 13 OR 15(d) OF THE SECURITIES EXCHANGE ACT OF 1934 |
For the
fiscal year ended December 31, 20172023
OR
| | | | | |
| ☐ | [ ]
| TRANSITION REPORT PURSUANT TO SECTION 13 OR 15(d) OF THE SECURITIES EXCHANGE ACT OF 1934 |
For the transition period from _________________________ to
Commission file number: 001-36246number:
001-36246 Civeo Corporation_______________
(Exact
____________
(Exact name of registrant as specified in its charter)
| | | | | | | | | | | |
| British Columbia, Canada | 98-1253716 | |
| (State or other jurisdiction of | (I.R.S. Employer | |
| incorporation or organization) | Identification No.) | |
| | | |
| Three Allen Center, 333 Clay Street, Suite 4980, | | |
|
Houston, Texas | 77002 | |
| (Address of principal executive offices) | (Zip Code) | |
| (713) | |
| 713 510-2400 |
(Registrant’sRegistrant’s telephone number, including area code) |
Securities registered pursuant to Section 12(b) of the Act:
| | | | | | | | |
| Title of Each Class | Trading Symbol(s) | Name of Exchange on Which Registered |
Common Shares,Shares, no par value | CVEO | New York Stock Exchange |
Securities registered pursuant to Section 12(g) of the Act:
Indicate by check mark if the registrant is a well-known seasoned issuer, as defined in Rule 405 of the Securities Act.
Indicate by check mark if the registrant is not required to file reports pursuant to Section 13 or Section 15(d) of the Act.
Indicate by check mark whether the registrant (1) has filed all reports required to be filed by Section 13 or 15(d) of the Securities Exchange Act of 1934 during the preceding 12 months (or for such shorter period that the registrant was required to file such reports), and (2) has been subject to such filing requirements for the past 90 days.
Indicate by check mark whether the registrant has submitted electronically and posted on its corporate Web site, if any, every Interactive Data File required to be submitted and posted pursuant to Rule 405 of Regulation S-T (§232.405 of this chapter) during the preceding 12 months (or for such shorter period that the registrant was required to submit and post such files).
Indicate by check mark if disclosure of delinquent filers pursuant to Item 405 of Regulation S-K (§229.405 of this chapter) is not contained herein, and will not be contained, to the best of registrant's knowledge, in definitive proxy or information statements incorporated by reference in Part III of this Form 10-K or any amendment to this form 10-K. [X]
Indicate by check mark whether the registrant is a large accelerated filer, an accelerated filer, a non-accelerated filer, a smaller reporting company or an emerging growth company. See the definitions of "accelerated filer," "large accelerated filer," "smaller reporting company” and “emerging growth company” in Rule 12b-2 of the Exchange Act.
(Check one):
| | | | | | | | | | | | | | | | | |
Large Accelerated Filer [ ] | ☐ | Accelerated Filer [X] | ☒ | Emerging Growth Company [ ] | ☐ |
| | | | | |
Non-Accelerated Filer [ ] (Do not check if a smaller reporting company) | ☐ | Smaller Reporting Company [ ] | ☐ | | |
If an emerging growth company, indicate by check mark if the registrant has elected not to use the extended transition period for complying with any new or revised financial accounting standards provided pursuant to Section 13(a) of the Exchange Act.
[ ]☐
Indicate by check mark whether the registrant has filed a report on and attestation to its management’s assessment of the effectiveness of its internal control over financial reporting under Section 404(b) of the Sarbanes-Oxley Act (15 U.S.C. 7262(b)) by the registered public accounting firm that prepared or issued its audit report. ☒
If securities are registered pursuant to Section 12(b) of the Act, indicate by check mark whether the financial statements of the registrant included in the filing reflect the correction of an error to previously issued financial statements. ☐
Indicate by check mark whether any of those error corrections are restatements that required a recovery analysis of incentive-based compensation received by any of the registrant’s executive officers during the relevant recovery period pursuant to §240.10D-1(b). ☐
Indicate by check mark whether the registrant is a shell company (as defined in Rule 12b-2 of the Exchange Act).
The aggregate market value of common
sharesshares held by non-affiliates computed by reference to the price at which the common equity was last sold, or the average bid and asked price of such common equity, as of the last business day of the registrant’s most recently completed second fiscal quarter, June 30, 2017,2023, was $273,686,965.$254,992,411.
The Registrant had
132,313,751 14,669,767 common shares outstanding as of February 19, 2018.23, 2024.
DOCUMENTS INCORPORATED BY REFERENCE
Portions of the registrant's Definitive Proxy Statement for the
20182024 Annual General Meeting of Shareholders, which the registrant intends to file with the Securities and Exchange Commission not later than 120 days after the end of the fiscal year covered by this Annual Report on Form 10-K, are incorporated by reference into Part III of this Annual Report on Form 10-K.
CIVEO CORPORATION
| | | | | | | | |
| | Page No. |
PART | | |
| |
| | |
| | 2
|
| | 25
|
| | 49
|
| Properties
Cybersecurity | 50
|
| Legal Proceedings
| 51
|
| | |
| | 51
|
| | |
| | |
| | 52
|
Item 6.6. | Selected Financial Data
Reserved | 53
|
| | 56
|
| | 82
|
| | 82
|
| | 82
|
| | 82
|
| | 83
|
| Disclosure Regarding Foreign Jurisdictions that Prevent Inspections | |
PART III | | |
| | |
| | 84
|
| | 84
|
| | 84
|
| | 84
|
| | 84
|
| | |
| | |
| | 85
|
| | 89
|
| | |
| 90
|
| 91
|
PART I
PART I
Thisannual report on Form 10-K (annual report) containscertain“forward-looking statements" within the meaning of Section 27A of the Securities Act of 1933(the Securities Act)and Section 21E of the Securities Exchange Act of 1934 (the Exchange Act).ActualActual results could differ materially from those projected in the forward-looking statements as a result of a number of important factors. For a discussion of known material factors that could affect our results, please refer to "Cautionary Statement Regarding Forward-Looking Statements" below and“Part I, Item 1. Business,” “Part I, Item 1A. Risk Factors,” “Part II, Item 7. Management's Discussion and Analysis of Financial Condition and Results of Operations” and “Part II, Item 7A. Quantitative and Qualitative Disclosures about Market Risk” below.
of this annual report.
In addition, in certain places in thisannualreport,on Form 10-K, we refer to reports published by third parties that purport to describe trends or developments in the energy industry.We doso for the convenience of our shareholdersshareholders and in an effort to provide information available in the market that will assistourinvestors in a better understanding of the market environment in whichweoperate. However,wespecifically disclaim any responsibility for the accuracy and completeness ofof such information and undertakeno obligation to update such information.
Cautionary Statement Regarding Forward-Looking Statements
We include the following cautionary statement to take advantage of the "safe harbor" provisions of the Private Securities Litigation Reform Act of 1995 for any "forward-looking statement" made by us or on our behalf.
All statements other than statements of historical facts included in this Annual Report on Form 10-Kannual report are forward-looking statements. The forward-looking statements can be identified by the use of forward-looking terminology including “may,” “expect,” “anticipate,” “estimate,” “continue,” “believe” or other similar words. Such statements may include statements regarding our future financial position, budgets, capital expenditures, projected costs, plans and objectives of management for future operations and possible future strategic transactions. Where any such forward-looking statement includes a statement of the assumptions or bases underlying such forward-looking statement, we caution that, while we believe such assumptions or bases to be reasonable and make them in good faith, assumed facts or bases almost always vary from actual results. The differences between assumed facts or bases and actual results can be material, depending upon the circumstances. The factors identified in this cautionary statement are important factors (but not necessarily all of the important factors) that could cause actual results to differ materially from those expressed in any forward-looking statement made by us, or on our behalf.In any forward-looking statement where we, or our management, express an expectation or belief as to future results, such expectation or belief is expressed in good faith and believed to have a reasonable basis. However, there can be no assurance that the statement of expectation or belief will result or be achieved or accomplished. Taking this into account, the following are identified as important factors that could cause actual results to differ materially from those expressed in any forward-looking statement made by, or on behalf of, us:
•the Company: | ●
| our ability to complete the Noralta Acquisition (as defined herein) in a timely manner or at all, and to successfully integrate the operations of Noralta Lodge Ltd. (Noralta);
|
| ●
| our ability to implement our plans, forecasts and other expectations with respect to Noralta’s business after the completion of the Noralta Acquisition and to realize the anticipated synergies and cost savings in the time frame anticipated or at all;
|
| ●
| risks associated with the effect of the announcement or pendency of the Noralta Acquisition on our or Noralta’s business relationships, operating results and business generally;
|
| ●
| risks that the Noralta Acquisition disrupts current plans and operations of us or Noralta and potential difficulties in employee retention as a result of the Noralta Acquisition;
|
| ●
| risks related to diverting management’s attention from our and Noralta’s ongoing business operations;
|
| ●
| risks associated with any legal proceedings instituted related to the Noralta Acquisition;
|
level of supply and demand for oil, metallurgical coal, natural gas, iron ore and other minerals;
•the level of activity, spending and natural resource development in Canada and Australia;
•the level of demand, particularly from China, for coal and other natural resources from Australia;
•the availability of attractive natural resource projects and assets, which may be affected by governmental actions, including changes in royalty or tax regimes, or environmental activists which may restrict drilling or development;
•fluctuations in the current and future prices of oil, coal, natural gas, iron ore and other minerals;
•failure by our customers to reach positive final investment decisions on, or otherwise not complete, projects with respect to which we have been awarded contracts to provide related hospitality services, which may cause those customers to terminate or postpone the contracts;
•fluctuations in currency exchange rates;
•general global economic conditions, such as the pace of global economic growth, a general slowdown in the global economy, supply chain disruptions, inflationary pressures and geopolitical events such as the ongoing Russia/Ukraine and Israel/Hamas conflicts;
| ●
| the level of supply and demand for oil, coal, natural gas, iron ore and other minerals;
|
| ●
| the level of activity and developments in the Canadian oil sands;
|
| ●
| failure by our customers to reach positive final investment decisions on, or otherwise not complete, projects with respect to which we have been awarded contracts to provide related accommodation, which may cause those customers to terminate or postpone the contracts;
|
| ●
| the level of demand for coal and other natural resources from Australia;
|
| ●
| the availability of attractive oil and natural gas field assets, which may be affected by governmental actions or environmental activists which may restrict drilling;
|
| ●
| fluctuations in the current and future prices of oil, coal, iron ore and other minerals;
|
| ●
| fluctuations in currency exchange rates;
|
| ●
| general global economic conditions and the pace of global economic growth;
|
| ●
| changes in tax laws, tax treaties or tax regulations or the interpretation or enforcement thereof, including taxing authorities not agreeing with our assessment of the effects of such laws, treaties and regulations;
|
| ●
| global weather conditions and natural disasters;
|
| ●
| our ability to hire and retain skilled personnel;
|
| ●
| the availability and cost of capital;
|
| ●
| the development of new projects, including whether such projects will continue in the future;
|
| ●
| the inability to realize expected benefits from our redomicile to Canada; and
|
| ●
| other factors identified in Item 1A, "Risk Factors."
|
•changes in tax laws, tax treaties or tax regulations or the interpretation or enforcement thereof, including taxing authorities not agreeing with our assessment of the effects of such laws, treaties and regulations;
•changes to government and environmental regulations, including climate change legislation and clean energy policies;
•global weather conditions, natural disasters, global health concerns, and security threats, including cybersecurity incidents;
•our ability to hire and retain skilled personnel;
•the availability and cost of capital, including the ability to access the debt and equity markets;
•our capital structure and our ability to return cash to shareholders through dividends or common share repurchases;
•our ability to integrate acquisitions;
•the development of new projects, including whether such projects will continue in the future; and
•other factors identified in Item 1A. - "Risk Factors" of this annual report.
Such risks and uncertainties are beyond our ability to control, and in many cases, we cannot predict the risks and uncertainties that could cause our actual results to differ materially from those indicated by the forward-looking statements.
All subsequent written and oral forward-looking statements attributable to us or to persons acting on our behalf are expressly qualified in their entirety by reference to these risks and uncertainties. You should not place undue reliance on forward-looking statements. Each forward-looking statement speaks only as of the date of the particular statement, and we do not undertake any obligation to publicly update or revise any forward-looking statements except as required by law.
We
maintain a website with the address of www.civeo.com. We are not including the information contained on our website as a part of, or incorporating it by reference into, this Annual Report on Form 10-K.annual report. We file or furnish annual, quarterly and current reports, proxy statements and other documents with the Securities and Exchange Commission (the SEC). We make available free of charge through our website our Annual Report on Form 10-K, quarterly reports on Form 10-Q and current reports on Form 8-K, and amendments to these reports, as soon as reasonably practicable after we electronically file such material with, or furnish such material to, the SecuritiesSEC. Also, the SEC maintains a website that contains reports, proxy and Exchange Commission (the Commission). The filings are also available throughinformation statements, and other information regarding issuers that file electronically with the Commission at the Commission's Public Reference Room at 100 F Street, N.E., Washington, D.C. 20549 or by calling 1-800-SEC-0330. Also, theseSEC, including us, and our filings are available on the Internet at www.sec.gov and free of charge upon written request to our corporate secretary at the address shown on the cover page of this Annual Report on Form 10-K.annual report.
Our Company
Redomiciliationto Canada
On July 17, 2015,
We provide a suite of hospitality services for our guests in the natural resources industry, including lodging, catering and food service, housekeeping and maintenance at accommodation facilities that we
changedor our
placecustomers own. In many cases, we provide services that support the day-to-day operations of
incorporation from Delaware to British Columbia, Canada, and Civeo Corporation, a British Columbia, Canada limited company formerly named Civeo Canadian Holdings ULC (Civeo Canada), became the publicly traded parent company of the Civeo group of companies (the Redomicile Transaction).Our Company
We are one of the largest integrated providers of workforce accommodations, logistics andthese facilities, such as laundry, facility management and maintenance, water and wastewater treatment, power generation, communication systems, security and logistics. We also manage development activities for workforce accommodation facilities, including site selection, permitting, engineering and design, manufacturing management and site construction, along with providing hospitality services toonce the natural resource industry. facility is constructed.
We primarily operate in some of the world’s most active oil, metallurgical (met) coal, liquefied natural gas (LNG) and iron ore producing regions, including Canada, Australiawhere, in many cases, traditional accommodations and the U.S. We have established a leadership position in providing a fully integrated service offering to ourrelated infrastructure often are not accessible, sufficient or cost effective. Our customers which include major and independent oil companies, mining companies, engineering companies and oilfield and mining service companies. Our extensive suite of services enables us to meet the unique needs of each of our customers, while providing comfortable accommodations for their employees. Our customers are able to outsource their accommodations needs to a single supplier, maintaining employee welfare and satisfaction while focusing their investment on their core resource production efforts.
Our Company is built on the foundation of the following core values: Safety,
Respect, Care, Excellence, Integrity and Collaboration. We put the safety of our employees and guests above all other concerns. We care about our people, guests, customers, communities and the environment, and we deliver excellent service with passion and pride. We act with integrity and collaborate with our people, communities, customers and partners.
Our Develop, Own and Operate model allows our customers to focus their efforts and resources on their core development and production operations.

Using our Develop, Own and Operate business model, we provide accommodations solutions that span the lifecycle of customer projects from the initial exploration and resource delineation to long-term production. Initially, as customers assess the resource potential and determine how they will develop it, they typically need accommodations for a limited number of employees for an uncertain duration of time. Our fleet of temporary accommodation assets is well-suited to support this initial exploratory stage as customers evaluate their development and construction plans. As development of the resource begins, we are able to serve their needs through either our fleet of temporary accommodation assets, particularly for shorter term projects such as pipeline construction and seasonal drilling programs, or our open camp model or our scalable lodge or village model. As projects grow and headcount needs increase, we are able to scale our facility size to meet our customers’ growing needs. By providing infrastructure early in the project lifecycle, we are well positioned to continue to service our customers throughout the production phase, which typically lasts decades.
The initial component of our Develop, Own and Operate business model is site selection and permitting. We believe there are benefits created by investing early in land in order to gain the strategic, early-mover advantage in an emerging region or resource play. Our business development team actively assesses regions of potential future customer demand and pursues land acquisition and permitting, a process we describe as “land banking.” We believe that having the first available accommodations solution in a new market allows us to win contracts from customers and gives us an early-mover advantage, as competitors may be less willing to invest in undeveloped land in the expectation of future demand without firm customer commitments. The strength of our land banked locations allowed us to secure contract growth in our most recent Canadian lodge locations, McClelland Lake in the Canadian oil sands region and our Sitka Lodge in the British Columbia liquefied natural gas (LNG) market.
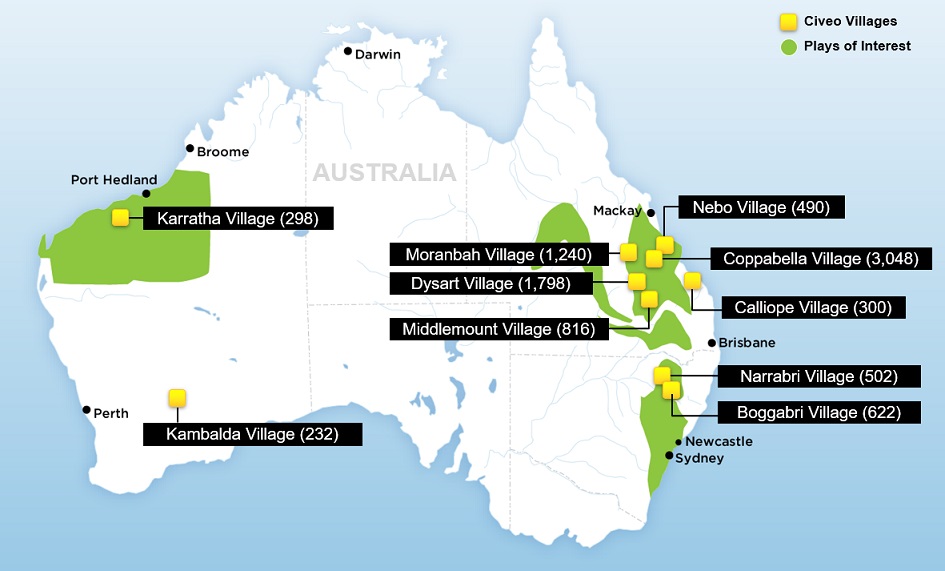
Our scalable modular facilities provide workforce accommodations where, in many cases, traditional accommodations and related infrastructure is not accessible, sufficient or cost effective. Our services help facilitate efficient development and production of natural resources found in areas without sufficient housing, infrastructure or local labor. We believe that many of the more recently discovered mineral deposits and hydrocarbon reservoirs are in remote locations. We support the development of these natural resources by providing lodging, catering and food services, housekeeping, recreation facilities, laundry services and facilities management, as well as water and wastewater treatment, power generation, communications and personnel logistics where required. Our accommodations services allow our customers to outsource their accommodations needs to a single supplier, maintaining employee welfare and satisfaction while focusing their investment on their core resource production efforts. Our primary focus is on providing accommodations to leading natural resource companies at our major properties, which we refer to as lodges in Canada and villages in Australia. We have nineteen lodges and villages with an aggregate of more than 24,000 rooms. Additionally, in the U.S. and Canada we have seven smaller open camp properties, as well as a fleet of mobile accommodation assets. We have long-standing relationships with many of our customers, many of whom are, or are affiliates of, large, investment-grade energy and mining companies.
On November 26, 2017, we entered into a Share Purchase Agreement (the Purchase Agreement) to acquire Noralta. This acquisition (the Noralta Acquisition), which we expect to close in the second quarter 2018, will increase our capacity in Canada by 11 lodges, with over 5,700 owned rooms and 7,900 total rooms. Please see Item 7, “Management’s Discussion and Analysis of Financial Condition and Results of Operations” of this annual report for additional information regarding the Noralta Acquisition.
Demand for our accommodations and related services is influenced by four primary factors: commodity prices, available infrastructure, workforce requirements and competition. Current commodity prices, and our customers’ expectations for future commodity prices, influence customers’ spending on current productive assets, maintenance on current assets, expansion of existing assets and development of greenfield, brownfield or new assets. In addition to commodity prices, different types of customer activity require varying workforce sizes, influencing the demand for accommodations. Also, competing locations and services will influence demand for our assets and services.
In the Canadian oil sands region, demand for our accommodations is influenced by oil prices. Spending on construction and the development of new projects has historically decreased as the outlook for oil prices decreases. However, spending on current operations and maintenance has historically reacted less quickly to changes in oil prices, as customers consider their cash operating costs, rather than overall full-cycle returns. Likewise, construction and expansion projects underway have also been less sensitive to commodity price decreases, as generally customers focus on completion and incremental costs. Natural gas prices also influence oil sands activity as an input cost; so as natural gas prices fall, a significant component of our customers’ operating costs fall as well.
Another factor that influences demand for our rooms and services is the type of customer project we are supporting. Generally, Canadian customers require larger workforces during construction and expansionary periods, and therefore have higher demand for accommodations. Operational and maintenance headcounts are typically a fraction, 20-25%, of the headcounts experienced during construction.
In addition, proximity to customer activity and availability of customer-owned rooms influences occupancy. Typically, customers prefer to first utilize their own rooms on location, and if such customer-owned rooms are insufficient, customers prefer to avoid busing their workforces to housing more than 45 kilometers away.
A number of multinational energy companies believe there is a potential to export LNG from Canada to meet the increasing global demand, particularly in Asia, for LNG. Currently, Western Canada does not have any operational LNG export facilities. However, as of December 2017, there were 16 proposed LNG export facilities in British Columbia in various stages of feasibility assessment and project planning, although none have reached a positive final investment decision. We expect that LNG activity in Western Canada will be influenced by the global prices for LNG, which are largely tied to global oil prices, global supply/demand dynamics for LNG and Western Canadian wellhead prices for natural gas. Should our customers or potential customers decide to invest in these LNG projects, demand for accommodations over the next three years will be driven by (i) the construction of the LNG facilities on the coast of British Columbia and (ii) the construction of the related natural gas pipeline infrastructure across British Columbia. Facility construction will create demand for permanent lodge accommodations, while pipeline construction activity will drive demand for mobile fleet accommodations.
Our Australian villages support similar activities for the natural resources industry. Our customers are typically developing and producing metallurgical (met) coal and other mines which have resource lives that are measured in decades. As such, their spending levels tend to react similarly to commodity prices as those of our Canadian customers. Spending on producing assets is less sensitive to commodity price decreases in the short and medium term, assuming the projects remain cash flow positive. However, new construction projects and expansionary projects are typically cancelled or deferred during periods of lower met coal prices. During 2011 through 2013, roughly half of our occupancy was driven by construction or expansion activity, while the other half supported operation activities of resource production. Currently, our occupancy is primarily driven by production, maintenance and operating activities. With the reduction in met coal prices from mid-year 2012 to mid-year 2016, much of the demand for rooms from new construction activity has ceased, and our current and expected occupancy is primarily driven by production, maintenance and operational activity. Workforce requirements and competition in the Australian market are comparable to those in the Canadian market. New project construction activity typically requires larger workforces than day-to-day operations, where proximity and availability of customer-owned rooms influences the demand for workforce accommodations. The rise in met coal prices in the fourth quarter of 2016 and during 2017 has improved market sentiment; however, this price improvement has yet to materially improve customer capital spending. We expect that customers will look for a period of sustained higher prices before we see any significant impact on customer activity levels and the demand for our accommodations.
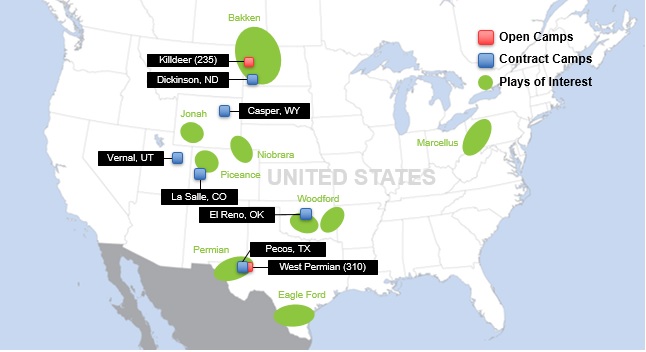
Our U.S. operations are primarily tied to activity in the U.S. shale formations in the Bakken, the Rockies and West Texas. Given the shorter investment horizon and decision cycle of our U.S. customers, typically on a well-by-well basis, U.S. customers’ spending activities typically react more quickly to changes in oil and natural gas prices. These spending dynamics were clearly demonstrated over the past four years. With oil prices near $100 per barrel from 2012 to late 2014, drilling and completion activity levels grew. However, as oil prices fell beginning in August 2014 and remained at relatively low levels throughout 2015 and most of 2016, activity in the U.S. reacted swiftly, with the U.S. rig count falling over 50% in six months from its peak in the third quarter of 2014. The U.S. rig count grew in 2017 and stabilized by the end of the 2017, finishing the year at 929 rigs. The Permian Basin was the biggest driver, representing 43% of the rigs in the U.S. market. Completion activity also grew, with the Permian Basin again seeing the majority of growth in the U.S. market. Unlike the Canadian and Australian markets, headcount requirements for drilling and completion activity are fairly uniform in the U.S. market. Given the U.S. market for accommodations is primarily supported by mobile camp assets, competition is primarily driven by the availability of assets and price.
For the years ended December 31, 2017, 2016 and 2015, we generated $382.3 million, $397.2 million and $518.0 million in revenues and $98.0 million, $95.8 million and $145.0 million in operating loss, respectively. The majority of our operations, assets and income are derived from lodge and village facilities that have historically been contracted by our customers on a take-or-pay basis for periods ranging from several months to several years. These facilities generate more than 75% of our revenue. Important performance metrics include average available rooms, average rentable rooms, revenue related to our major properties, occupancy and average daily rate (in local currency). “Mobile and Open Camp Revenue,” shown below, consists of our revenue related to our open camp facilities and mobile camps, as well as third party sales related to our manufacturing division. The table below summarizes these key statistics for the periods presented in this Annual Report on Form 10-K.
| | | Year Ended December 31, | |
| | | 2017 | | | 2016 | | | 2015 | |
| | | (In millions, except for room counts and average daily rate) | |
Lodge/Village Revenue (1) | | | | | | | | | | | | |
Canada | | $ | 226.8 | | | $ | 238.2 | | | $ | 267.5 | |
Australia | | | 111.2 | | | | 106.8 | | | | 136.0 | |
Total Lodge/Village Revenue | | $ | 338.0 | | | $ | 345.0 | | | $ | 403.5 | |
| | | | | | | | | | | | | |
Mobile and Open Camp Revenue | | | | | | | | | | | | |
Canada | | $ | 18.8 | | | $ | 40.2 | | | $ | 76.8 | |
Australia | | | — | | | | — | | | | — | |
United States | | | 25.5 | | | | 12.0 | | | | 37.7 | |
Total Mobile and Open Camp Revenue | | $ | 44.3 | | | $ | 52.2 | | | $ | 114.5 | |
Total Revenue | | $ | 382.3 | | | $ | 397.2 | | | $ | 518.0 | |
| | | | | | | | | | | | | |
Average Available Lodge/Village Rooms (2) | | | | | | | | | | | | |
Canada | | | 14,720 | | | | 14,653 | | | | 13,435 | |
Australia | | | 9,369 | | | | 9,335 | | | | 9,180 | |
Total Lodge/Village Rooms | | | 24,089 | | | | 23,988 | | | | 22,615 | |
| | | | | | | | | | | | | |
Rentable Rooms for Lodges and Villages (3) | | | | | | | | | | | | |
Canada | | | 8,642 | | | | 9,979 | | | | 10,054 | |
Australia | | | 8,739 | | | | 8,679 | | | | 8,862 | |
Total Rentable Rooms for Lodges and Villages | | | 17,381 | | | | 18,658 | | | | 18,916 | |
| | | | | | | | | | | | | |
Average Daily Rates for Lodges and Villages (4) | | | | | | | | | | | | |
Canada | | $ | 92 | | | $ | 104 | | | $ | 121 | |
Australia | | | 80 | | | | 76 | | | | 74 | |
Total Average Daily Rates for Lodges and Villages | | $ | 88 | | | $ | 94 | | | $ | 100 | |
| | | | | | | | | | | | | |
Occupancy in Lodges and Villages (5) | | | | | | | | | | | | |
Canada | | | 78 | % | | | 63 | % | | | 60 | % |
Australia | | | 43 | % | | | 44 | % | | | 56 | % |
Total Occupancy in Lodges and Villages | | | 61 | % | | | 54 | % | | | 58 | % |
| | | | | | | | | | | | | |
Average Exchange Rate | | | | | | | | | | | | |
Canadian dollar to U.S. dollar | | $ | 0.7712 | | | $ | 0.7551 | | | $ | 0.7832 | |
Australian dollar to U.S. dollar | | | 0.7669 | | | | 0.7439 | | | | 0.7523 | |
__________
(1)
| Includes revenue related to rooms, as well as the fees associated with catering, laundry and other services, including facilities management.
|
(2)
| Average available rooms includes rooms that are utilized for our personnel.
|
(3)
| Rentable rooms excludes rooms that are utilized for our personnel and out of service rooms.
|
(4)
| Average daily rate is based on rentable rooms and lodge/village revenue.
|
(5)
| Occupancy represents total billed days divided by rentable days. Rentable days excludes staff rooms and out of service rooms.
|
Our History
Our Canadian operations, founded in 1977, began by providing modular rental housing to energy customers, primarily supporting drilling rig crews. Over the next decade, the business acquired a catering operation and a manufacturing facility, enabling it to provide a more integrated service offering. Through our experience with Syncrude’s Mildred Lake Village, a 2,100 bed facility that we built and sold to Syncrude in 1990 and operated and managed for them for nearly 20 years, we recognized a need for a premium, and more permanent, solution for workforce accommodations in the Canadian oil sands region. Pursuing this strategy, we opened PTI Lodge in 1998, one of the first independent lodging facilities in the region.
With an integrated business model, we are able to identify, solve and implement solutions and services that enhance the guests’ accommodations experience and reduce the customer’s total cost of housing a workforce in a remote operating location. Through our experiences and integrated model, our accommodation services have evolved to include fitness centers, water and wastewater treatment, laundry service and many other advancements. As our experience in the region grew, we were the first to introduce to the Canadian oil sands market suite-style accommodations for middle and upper level management working in the oil sands region, with our Beaver River Executive Lodge in 2005. Since then, we have continued to innovate our service offering to meet our customers’ growing and evolving needs. From that entrepreneurial beginning, we have developed into Canada’s largest third-party provider of accommodations in the oil sands region.
Today, in addition to providing accommodations services, we endeavor to support customers’ logistical efforts in managing the movement of large numbers of personnel efficiently. At our Wapasu Creek location, we have introduced services that improve efficiencies for customers in transporting personnel to mine sites on a daily basis, as well as in rotating personnel when crews change.
During 2015, we entered the Canadian LNG market with our latest lodge location, Sitka Lodge. Most of the Sitka Lodge’s 436 rooms were under contract through October 2017 to LNG Canada (LNGC), a large LNG export project proposed by a joint venture between Shell Canada Energy, an affiliate of Royal Dutch Shell plc (50 percent), and affiliates of PetroChina (20 percent), Korea Gas Corporation (15 percent) and Mitsubishi Corporation (15 percent). In addition, in May 2016, we were awarded a contract with LNGC to construct a 4,500 person workforce accommodation center (Cedar Valley Lodge) for a proposed liquefaction and export facility in Kitimat, British Columbia. Construction of Cedar Valley Lodge will not commence until LNGC’s joint venture participants have made a positive final investment decision (FID). The FID was originally planned for the end of 2016. However, FID has been delayed. Recent public statements by LNGC and news reports indicate that FID for LNGC is expected in the second half of 2018. Should the project ultimately move forward, LNGC activity could become a material driver of future activity for our Sitka Lodge, as well as for our mobile fleet assets, which are well suited for the related pipeline construction activity. However, there can be no assurance that LNGC’s joint venture participants will reach a positive FID or that our contracts with LNGC will be extended. Further, on July 25, 2017, Petronas and its partners announced the cancellation of their Pacific NorthWest (“PNW”) liquefied natural gas project they had planned to build in Port Edward, British Columbia. If the LNGC project, and other potential projects in the area, do not move forward, our future results of operations and our existing long-lived assets in Canada, including our Sitka Lodge, may be negatively affected, and we may be required to record material impairment charges equal to the excess of the carrying values of these assets over their fair values. As of December 31, 2017, the net book value of long-lived assets that are currently supporting, or could be used to support, potential LNG projects in British Columbia was approximately $80 million.
With the acquisition of our Australian business in December 2010, we began to support the Australian natural resources industry through villages located in Queensland, New South Wales and Western Australia. Like Canada, our Australian business has a long-history of accommodating customers in remote regions, beginning with its initial Moranbah Village in 1996, and has grown to become Australia’s largest integrated provider of accommodations services for people working in remote locations. Our Australian business was the first to introduce resort-style accommodations to the mining sector, adding landscaping, outdoor kitchens, pools, fitness centers and, in some cases, taverns. In all our operating regions, our business is built on a culture of continual service improvement to enhance the guest experience and reduce customer remote housing costs.
We take an active role in minimizing working to minimize the environmental impact of our operations through a number of sustainable initiatives. We also have a focus on water conservation and utilize alternative water supply options such as recycling and rainwater collection and use. By building infrastructure such as waste-waterwastewater treatment and water treatment facilities to recycle greygray and black water on some of our sites, we are able to gain cost efficiencies as well as reduce the use of trucks related to water and wastewater hauling, which in turn, reduces our carbon footprint. In our Australian villages, we utilize passive-solar-design principles and smart-switching systems to reduce the need for electricity related to heating and cooling.
Our
Industryhospitality services span the lifecycle of customer projects, from the initial exploration and resource delineation to long-term production. Initially, as customers assess the resource potential and determine how they will develop it, they typically need our hospitality services for a limited number of employees for an uncertain duration of time. Our fleet of mobile assets is well-suited to support this initial exploratory stage as customers evaluate their development and construction plans. As development of the resource begins, we are able to serve their needs through either: (i) our fleet of mobile assets, particularly for shorter term projects such as pipeline construction and seasonal drilling programs, (ii) our scalable lodge or village model, or (iii) our integrated services model in customer-owned facilities. As projects grow and headcount needs increase, we are able to meet our customers growing needs at our accommodation facilities or with our hospitality services. By providing infrastructure support and hospitality services early in the project lifecycle, we are well positioned to continue to service our customers throughout the production phase, which typically lasts decades.
We own and operate 24 lodges and villages with approximately 26,000 rooms. We operate approximately 14,200 rooms owned by our customers. Additionally, in Canada, we also offer a fleet of mobile assets which serve shorter term projects, such as pipeline construction. We have long-standing relationships with many of our customers, many of whom are, or are affiliates of, large, investment-grade energy and mining companies.
For the years ended December 31, 2023, 2022 and 2021, we generated $700.8 million, $697.1 million and $594.5 million in revenues and $39.5 million, $17.0 million and $6.1 million in operating income, respectively. The majority of our operations, assets and income are derived from the hospitality services provided at lodges and villages we own that have historically been contracted by our customers under multi-year, take-or-pay or exclusivity contracts. The hospitality services we provide at these facilities generated 63% of our revenue for the year ended December 31, 2023. Important performance metrics include revenue related to our major properties, average daily rates and aggregate billed rooms. The table below summarizes these key statistics for the periods presented in this annual report.
| | | | | | | | | | | | | | | | | |
| | Year Ended December 31, |
| | 2023 | | 2022 | | 2021 |
| | (In thousands, except for room counts and average daily rate) |
Accommodation Revenue (1) | | | | | |
| Canada | $ | 266,926 | | | $ | 279,455 | | | $ | 239,526 | |
| Australia | 177,834 | | | 152,714 | | | 145,335 | |
| Other | 11,205 | | | 3,058 | | | 5,437 | |
| Total Accommodation Revenue | $ | 455,965 | | | $ | 435,227 | | | $ | 390,298 | |
| | | | | |
Mobile Facility Rental Revenue (2) | | | | | |
| Canada | $ | 61,899 | | | $ | 96,400 | | | $ | 62,856 | |
| Other | — | | | 18,367 | | | 14,486 | |
| Total Mobile Facility Rental Revenue | $ | 61,899 | | | $ | 114,767 | | | $ | 77,342 | |
| | | | | |
Food Service and Other Services Revenue (3) | | | | | |
| Canada | $ | 23,970 | | | $ | 20,142 | | | $ | 18,996 | |
| Australia | 158,929 | | | 125,538 | | | 105,739 | |
| Other | 42 | | | 90 | | | 50 | |
| Total Food Service and Other Services Revenue | $ | 182,941 | | | $ | 145,770 | | | $ | 124,785 | |
| | | | | |
Manufacturing Revenue (4) | | | | | |
| Other | $ | — | | | $ | 1,288 | | | $ | 2,038 | |
| Total Manufacturing Revenue | $ | — | | | $ | 1,288 | | | $ | 2,038 | |
| | | | | |
| Total Revenue | $ | 700,805 | | | $ | 697,052 | | | $ | 594,463 | |
| | | | | |
Average Daily Rates for Lodges and Villages (5) | | | | | |
| Canada | $ | 97 | | | $ | 100 | | | $ | 99 | |
| Australia | $ | 75 | | | $ | 75 | | | $ | 79 | |
| | | | | |
Total Billed Rooms for Lodges and Villages (6) | | | | | |
| Canada | 2,710,784 | | | 2,759,521 | | | 2,404,880 | |
| Australia | 2,371,763 | | | 2,024,068 | | | 1,846,882 | |
| | | | | |
| Average Exchange Rate | | | | | |
| Canadian dollar to U.S. dollar | $ | 0.74 | | | $ | 0.77 | | | $ | 0.80 | |
| Australian dollar to U.S. dollar | $ | 0.66 | | | $ | 0.69 | | | $ | 0.75 | |
(1)Includes revenues related to lodge and village rooms and hospitality services for Civeo owned rooms for the periods presented.
(2)Includes revenues related to mobile assets for the periods presented.
(3)Includes revenues related to food service, laundry and water and wastewater treatment services, and facilities management for the periods presented.
(4)Includes revenues related to modular construction and manufacturing services for the periods presented. Civeo's remaining manufacturing operations in Louisiana were sold in the fourth quarter of 2022.
(5)Average daily rate is based on billed rooms and accommodation revenue for Civeo owned rooms during the periods presented.
(6)Billed rooms represents total billed days for Civeo owned rooms for the periods presented.
Our History
Our history is one of identifying customer and market needs and developing economic solutions. Our historical experience in Canada began in small, mobile camps and evolved into owning and managing large scale remote accommodations. In Australia, our operations originated with a similar build-own-operate model as we operate in our Canadian lodges, growing up to our current eight owned villages. Since then and with the addition of an acquisition, we have evolved our service delivery to include operating customer-owned locations with the same hospitality services that we provide at our owned villages.
Our Canadian operations, founded in 1977, began by providing modular rental housing to energy customers, primarily supporting drilling rig crews in the Western Canadian Sedimentary Basin. Over the next decade, we acquired a food service operation, enabling us to provide a more comprehensive accommodation solution. Through our experience with Syncrude’s Mildred Lake Village, a 2,100 bed facility that we operated and managed for them for nearly 20 years, we recognized the need for a premium, and more permanent, solution for workforce accommodations and hospitality services in the Canadian oil sands region. Pursuing this strategy, we opened PTI Lodge in 1998, one of the first independent lodging facilities in the region.
In 2018, we acquired Noralta Lodge Ltd. (Noralta), which provided remote hospitality services in Alberta, Canada (the Noralta Acquisition) through eleven lodges comprising over 5,700 owned rooms and gas7,900 total rooms. Over time, we have developed into Canada’s largest third-party provider of accommodations and hospitality services in the Canadian oil sands region.
During 2015, we entered the Canadian LNG market with the construction of our Sitka Lodge. LNG Canada (LNGC), a joint venture among Shell Canada Energy, an affiliate of Shell plc (40 percent), and affiliates of PETRONAS, through its wholly-owned entity, North Montney LNG Limited Partnership (25 percent), PetroChina (15 percent), Mitsubishi Corporation (15 percent) and Korea Gas Corporation (5 percent), is currently constructing a liquefaction and export facility in Kitimat, British Columbia (Kitimat LNG Facility). The Kitimat LNG Facility is nearing completion and expected to be operational in 2024. Our Sitka Lodge is well positioned to serve construction activity at the Kitimat LNG facility, as well as portions of the related pipeline construction activity.
With the acquisition of our Australian business in December 2010, we began providing hospitality services to support the Australian natural resources industry through our villages located in Queensland, New South Wales and Western Australia. Like Canada, our Australian business has a long-history of taking care of customers in remote regions, beginning with our initial Moranbah Village in 1996, and has grown to become Australia’s largest independent provider of hospitality services for people working in remote locations. Our Australian business was the first to introduce resort-style accommodations to the mining industries.sector, adding landscaping, outdoor kitchens, pools, fitness centers and, in some cases, taverns.
In 2019, we acquired Action Industrial Catering (Action), a provider of catering and managed services (which we refer to as our integrated services business) to the mining industry in Western Australia. The Action acquisition enhanced our service offering, expanded our geographic footprint, added exposure to new commodities in Australia and underlines our focus on pursuing growth opportunities that fit within our core competencies and strategic direction.
Our Customers
We provide our hospitality services to customers in the natural resources industry. Our scalable modular facilities provide long-term and temporary work forceworkforce accommodations where, in many cases, traditional accommodations and related infrastructure often are not accessible, sufficient or cost effective. Once facilities
Through our wide range of hospitality services offerings, we are deployedable to identify, solve and implement solutions and services that enhance the guest experience and reduce the customer’s total cost of housing a workforce in the field, we also providea remote operating location. In addition to lodging, catering and food service, housekeeping and maintenance at accommodation facilities that we or our customers own, our hospitality services housekeeping, laundry, facility management,have evolved to include fitness centers, water and wastewater treatment, power generation, communicationslaundry service and personnel logistics. Demand for our servicesmany other enhancements.
Our customers either own their accommodations assets or outsource them. Customers may choose to own their accommodations assets because (i) their natural resource project is
cyclical and substantially dependent upon activity levels, particularly our customers’ willingness to spend capital on the
exploration for, development and productiononly source of
oil, coal, natural gas and other resource reserves. Our customers’ spending plans generally are based on their view of commodity supply and demand dynamics, as well as the outlook for near-term and long-term commodity prices. As a result, the demand for
our services is sensitiverooms in the region; (ii) they believe in the long-term nature of their resource project; and/or (iii) they desire to
current and expected commodity prices.We serve multiple projects and multiplemaintain control over the supply of rooms for their project. Where customers at most of our sites, which allows thosehave chosen to own their accommodations assets, customers to share someusually subcontract the
management of the
costs associated with their peak construction accommodations needs. Our facilities provide customers with cost efficiencies as they are able to share the costs of accommodations related infrastructure (power, water, sewer and IT) and central dining and recreation facilities with other customers operating projects in the same vicinity.Our business is significantly influenced by the level of production of oil sands deposits in Alberta, Canada, activity levels in support of natural resources production in Australia and oil and gas production in Canadafacility and the U.S. Our two primary activity drivers are development and production activityprovision of the hospitality services to a third-party provider, such as Civeo through our integrated services model in thecustomer-owned facilities.
Historically, Canadian
oil sands region in Western Canada and the met coal region of Australia’s Bowen Basin.Historically, oil sands developers and Australian mining companies built owned and in some cases operatedowned the accommodations necessary to house their personnel in these remote regions because local labor and third-party owned rooms were not available. Over the past 20 years, and increasingly over the past 10 years, some customers have moved away from the insourcing business model for somea portion of their accommodationsaccommodation needs as they recognize that owning accommodations and providing the related hospitality services are non-core investments for their business.
Civeo
The accommodations outsourcing model is oneeffective in regions in which multiple customers have on-going or prospective projects where third-party owned and operated accommodations assets can service multiple customers. This allows those customers to share some of the fewcosts associated with their peak accommodations providersneeds, including infrastructure (power, water, sewer and information technology) and central dining and recreation facilities. The Canadian oil sands region and the Queensland Bowen Basin region are two geographic areas that servicefit this market dynamic.
Initial demand for our hospitality services has historically been driven by our customers’ capital spending programs related to the entire valueconstruction and development of natural resource projects and associated infrastructure, as well as the exploration for oil and natural gas. Long-term demand for our services has been driven by natural resource production, maintenance and operation of those facilities as well as expansion of those sites. In general, industry capital spending programs are based on the outlook for commodity prices, production costs, economic growth, global commodity supply/demand, estimates of resource production and the expectations of our customers' shareholders. As a result, demand for our hospitality services is largely sensitive to expected commodity prices, principally related to oil, met coal, LNG and iron ore, and the resultant impact of these commodity price expectations on our customers’ spending. Other factors that can affect our business and financial results include the general global economic environment, including inflationary pressures, supply chain from site identificationdisruptions and labor shortages, volatility affecting the banking system and financial markets, availability of capital to long-term facility management. the natural resource industry and regulatory changes in Canada, Australia and other markets, including governmental measures introduced to fight climate change.
We believe that our existing industry divides accommodations into threetwo primary types: (i) lodges and villages open camps and (ii) mobile assets. Civeo is principally focused on hospitality services at lodges and villages. Lodges and villages typically contain a larger number of rooms and require more time and capital to develop. These facilities typically have dining areas, meeting rooms, recreational facilities, pubs and taverns and landscaped grounds where weather permits. Lodges and villages are generally built supported by multi-year, take-or-pay or exclusivity contracts. These facilities are designed to serve the long-term needs of customers in constructingdeveloping and operatingproducing their natural resource developments. Open camps are usually smaller in number of rooms and typically serve customers on a spot or short-term basis. They are “open” for any customer who needs lodging services. Finally, mobile campsMobile assets are designed to follow customers’customers’ activities and can be deployed rapidly to scale. They are often used to support conventional and in-situ drilling crews, as well as pipeline and seismic crews, and are contracted on a project-by-project, well-by-well or short-term basis. Oftentimes, customers will initially require mobile accommodationsassets as they evaluate or initially develop a field or mine. Open camps may bestMobile asset projects can be dedicated and committed to a single customer or project or can serve smaller operations ormultiple customers.
Our Competitors
The accommodation facilities market supporting the
needs of customers as they expand in a region. These open camps can also serve as an initial, small foothold in a region until the demand for a full-scale lodge or village is required.The accommodations marketnatural resource industry is segmented into competitors that serve components of the overall value chain, but has very few integrated providers.offer the entire suite of hospitality services to customers. We estimate that customer-owned rooms represent over 50% of the market. Engineering firms such as Bechtel Fluor and ColtAmecFluor often design accommodations facilities. Many public and private firms, such as ATCO Structures & Logistics Ltd. (ATCO), Horizon North LogisticsDexterra Group Inc. (Horizon North)(Dexterra), Alta-Fab Structures Ltd. (Alta-Fab) and Northgate Industries Ltd. (Northgate) will, build the modular accommodations for sale. Horizon North,Dexterra, Black Diamond Group Limited (Black Diamond), ATCO, Royal Camp Services Ltd. and Algeco Scotsman willTarget Hospitality primarily own and lease the units to customers and, in some cases, provide facility management services, usually on a shorter-term basis with a more limited number of rooms, similar to our open camp and mobile fleetassets business. Facility service companies, such as Aramark Corporation (Aramark), Sodexo Inc. (Sodexo) or, Compass Group PLC (Compass Group), and Cater Care, typically do not invest in and own the accommodations assets, but will manageprovide hospitality services at third-party or customer-owned facilities. We believe the integrated model provides value to our customers by reducing project timing and counterparty risks. In addition, with our holistic approach to accommodations, we are able to identify efficiency opportunities for the customers and execute them. With our focus on large-scale lodges and villages, our business model is most similar to a developer of multi-family properties, such as Camden Property Trust, AvalonBay Communities, Mid-America Apartment Communities, or a developer of lodging properties who is also an owner operator, such as Hyatt Hotels Corporation or Marriott International, Inc.
During the year ended December 31, 2017,2023, we generated approximately 64%50% of our revenue from our Canadian operations. We are western Canada’s largest integrated provider of accommodationshospitality services for people working in remote locations. We provide our accommodation services through our lodges open camps and mobile assets.assets and at customer-owned locations. Our accommodationshospitality services support
workforces in the Canadian
LNG and oil sands
markets and in a variety of oil and natural gas drilling, mining,
pipeline and related natural resource
applications, as well as disaster relief efforts.
applications.
Demand for our hospitality services in the Canadian market is largely driven by customer capital spending, which is greatly influenced by current and future commodity prices.
In the Canadian oil sands accommodationsregion, demand is primarily influenced by the longer-term outlook for crude oil prices rather than current energy prices, given the multi-year production phaselife ofCanadian oil sands projects and the costscapital investment associated with development of such large scalelarge-scale projects. UtilizationDemand for our Canadian lodges is secondarily impacted by oil takeaway capacity which influences the net price our customers receive for their oil production.
Spending on the construction and development of new projects generally decreases as the outlook for oil prices decreases. However, spending on current operations and maintenance has historically reacted less quickly and less severely to changes in oil prices, as customers consider their cash operating costs, rather than overall full-cycle returns. Likewise, construction and expansion projects already underway have also been less sensitive to commodity price decreases, as customers generally focus on completion and incremental costs. Natural gas prices also influence oil sands activity as an input cost: as natural gas prices fluctuate, a significant component of our existingcustomers’ operating costs fluctuate as well.
Another factor that influences demand for our hospitality services in the Canadian capacity and our future expansions will largely depend on continued oil sands spending relatedregion is the type of customer project we are supporting. Generally, Canadian customers require larger workforces during construction and expansionary periods, and therefore have higher demand for our rooms and services. Operational and maintenance headcounts are typically a fraction, 20% to existing production efforts, maintenance thereon25%, of the headcounts experienced during construction.
In addition, proximity to customer activity and
potential future expansionavailability of
existing projects.customer-owned and competitor-owned rooms influences the rental demand of our rooms in the Canadian oil sands region. Typically, customers prefer to first utilize their own rooms on location, and if such customer-owned rooms are insufficient, customers prefer to avoid busing their workforces to housing more than 45 kilometers away.
The Athabasca oil sands are located in northern Alberta, an area that is very remote,
, with a limited local labor supply. Of Canada’s approximately 3640 million residents, nearlyapproximately half of the population lives in ten cities, while only approximately 10%12% of the population lives in Alberta and less than 1% of the population lives within 100 kilometers of the oil sands.sands activity. The local municipalities, of which Fort McMurray is the largest, have grown rapidly over the last decade, stressing their infrastructures and challenging themlimited infrastructure to respond to large-scale changes in demand.workforce accommodation demands and are a significant driving distance from many of the oil sands projects. As such, the workforce accommodations market provides a cost effectivecost-effective solution to the problemchallenge of staffing large oil sands projects by sourcing labor largely throughout Canada to work on a rotational basis.
With respect to LNG and related pipeline activity in Canada, a number of multinational energy companies believe there is a potential to export LNG from Canada to meet the increasing global LNG demand, particularly in Asia. Currently, Western Canada does not have any operational LNG export facilities. The Kitimat LNG Facility is nearing completion and expected to be operational in 2024. The population of Kitimat and the surrounding area is approximately 9,000 people, whereas the LNGC project had almost 7,500 workers at its peak to construct the Kitimat LNG Facility. Accordingly, British Columbia LNG activity and related pipeline projects are a material driver of activity for our Sitka Lodge, as well as for our mobile assets, which are contracted to serve designated portions of the related pipeline construction activity. The majority of our contracted commitments associated with the Coastal GasLink Pipeline (CGL), the pipeline constructed to transport natural gas feedstock to LNGC, were completed in the fourth quarter of 2023. See "Canada-Canadian British Columbia Lodge" for more information.
LNG investment and activity in Western Canada, and related demand for hospitality services, is influenced by the global prices for LNG, which are largely tied to global oil prices, global supply/demand dynamics for LNG and Western Canadian wellhead prices for natural gas. Utilization of our existing Canadian capacity and any future expansions will largely depend on continued LNG and oil sands spending related to existing production, maintenance activities and potential future expansion of existing projects.
Canadian Oil Sands Lodges
During the year ended December 31,
2017,2023, activity in the Athabasca oil sands region generated over 85%approximately 67% of our Canadian revenue, or 34% of our consolidated revenue. The oil sands region of northern Alberta, Canada continues to represent one of the world’s largest reserves for heavy oil. Our McClelland Lake, Wapasu Creek, Athabasca, Henday and Beaver River, LodgesFort McMurray Village, Grey Wolf, Hudson, and Borealis lodges are focused on the northern region of the Athabasca oil sands, where customers primarily utilize surface mining to extract the bitumen, or oil sands.bitumen. Oil sands mining operations are characterized by large capital requirements, large reserves, largelarger personnel requirements, long-term reserve lives, very low exploration or reserve risk and relatively lower cash operating costs per barrel of bitumen produced. Our Conklin, Mariana LakeAnzac, Red Earth and AnzacWabasca lodges as well as a portion of our mobile fleet of assets, are focused in the southern portion of the region where we primarily serve in-situ operations and pipeline expansion and maintenance activity. In-situ methods are used on reserves that are too deep for traditional mining methods. In-situ technology typically injects steam toor solvents into the deep oil sands in place to separate the bitumen from the sand and pumps it to the surface where it undergoes the same upgrading treatment as the mined bitumen. Reserves requiring in situin-situ techniques of extraction represent 80% of the established recoverable reserves in Alberta. In-situIn comparison to surface mining operations, in-situ operations generally require lesslower initial capital andinvestment, fewer personnel andbut produce lower volumes of bitumen per development, with higher ongoing operating expense per barrel of bitumen produced.
Our oil sands lodges primarily support construction and operating personnel for maintenance and expansionary projects, as well as ongoing operations associated with surface mining and in-situ oil sands projects, as well as maintenance, turnaround and expansionary personnel, generally under shortshort- and medium-term contracts. AllMost of our oil sands lodge propertieslodges are located on land with leases obtained from the province of Alberta, with initial terms of ten years.years, or subleased from the resource developer. Our leases have expiration dates that range from 20232024 to 2027. Currently, none of our Canadian lodge rooms are on land with leases expiring prior to December 31, 2018.2030. In recent years, we have successfully renewed or extended all expiring land leases which we have requested to renew or extend. We did not renew an expiring land lease associated with our McClelland Lake Lodge in Alberta, Canada, which expired in June 2023, in order to support our customer’s intent to mine the exceptionland where the lodge was located. Two of oneour oil sands properties are located on land which we own.
In order to operate a lodge in Canada, we are required to obtain a development permit from the regional municipality in which the lodge is located. The development permits are granted for a term of five years. Our development permits have expiration dates that range from 2024 to 2028. In recent years, we have successfully renewed or extended all expiring development permits. See “Item 1A. Risk Factors - Risks Related to Our Operations - The majority of our major Canadian lodges are located on land subject to leases. If we are unable to renew a lease
or obtain permits necessary to operate on
privatesuch leased land,
in 2014,we could be materially and
expect we will be able to in the future.adversely affected.” of this annual report for further information.
We provide a
full servicerange of hospitality
functionservices at our lodges,
, including reservation management, check in and check out, catering,food service, housekeeping and facilities management. Our lodge guests receive the amenity level ofamenities similar to a full-service, urban hotel pluswith our service offering a room and three meals a day. During 2017, no further rooms were added (net of retirements) to our major oil sands lodges. Our Wapasu Creek Lodge, with more than 5,000 rooms, is equivalent in size to the largest hotels in North America.During the year ended December 31, 2017, over 85% of our Canadian revenue was generated by our eight major lodges.
We provide our
lodgehospitality services
at the lodges we own on a day rate or monthly rental basis, and our customers typically commit for short to
medium-termlong-term contracts (from several months up to several years).
CustomersMost customers make a minimum nightly or monthly room
commitment or an aggregate total room night commitment for the term of the contract, and the multi-year contracts typically provide for inflationary escalations in rates for increased food, labor and utilities costs.
Canadian British Columbia Lodge
As previously discussed, LNGC is currently constructing the Kitimat LNG
Facility. British Columbia LNG activity and related pipeline projects are a material driver of activity for our Sitka Lodge,
During as well as for our mobile assets, which are contracted to serve designated portions of the related CGL pipeline construction activity. The majority of our contracted commitments associated with the CGL pipeline project were completed in the fourth quarter of 2015, in Kitimat, British Columbia, we built 436 rooms during the initial development of our Sitka Lodge. Most of these rooms were under contract through October 2017 to LNG Canada, a large LNG export project proposed by a joint venture between Shell Canada Energy, an affiliate of Royal Dutch Shell plc (50 percent), and affiliates of PetroChina (20 percent), Korea Gas Corporation (15 percent) and Mitsubishi Corporation (15 percent). The initial phase of this location features catering services and recreational facilities and the ability to expand should demand for rooms in the region warrant.
In addition, we were awarded a contract with LNGC to construct a 4,500 person workforce accommodation center (Cedar Valley Lodge) for a proposed liquefaction and export facility in Kitimat, British Columbia. Construction of Cedar Valley Lodge will not commence until LNGC’s joint venture participants have made a positive FID. The FID was originally planned for the end of 2016. However, FID has been delayed. Recent public statements by LNGC and news reports indicate that FID for LNGC is expected in the second half of 2018. There can be no assurance that LNGC’s joint venture participants will reach a positive FID or that our contracts with LNGC will be extended.
2023.


Rooms in our Canadian Lodges
| | | | | | | As of December 31, |
Lodges | | Region | | Extraction Technique | | 2017 | | 2016 | | 2015 |
| | | | | | | | | | | |
Wapasu | | N. Athabasca | | mining | | 5,246 | | 5,246 | | 5,174 |
Athabasca | | N. Athabasca | | mining | | 2,005 | | 2,005 | | 2,005 |
McClelland Lake | | N. Athabasca | | mining | | 1,997 | | 1,997 | | 1,997 |
Henday (1) | | N. Athabasca | | mining/in situ | | 1,698 | | 1,698 | | 1,698 |
Beaver River | | N. Athabasca | | mining | | 1,094 | | 1,094 | | 1,094 |
Conklin | | S. Athabasca | | mining/in situ | | 1,032 | | 1,032 | | 700 |
Anzac (1) | | S. Athabasca | | in situ | | 526 | | 526 | | 526 |
Mariana Lake | | S. Athabasca | | mining | | 686 | | 686 | | 526 |
Subtotal – Oil Sands | | | | | | 14,284 | | 14,284 | | 13,720 |
Sitka Lodge (1) | | Kitimat, BC | | LNG | | 436 | | 436 | | 436 |
Total Rooms | | | | | | 14,720 | | 14,720 | | 14,156 |
(1)
| | | | | | | | | | | | | | | | | | | | | | | | | | | | | | | | | | | | | | | | | As of December 31, |
Lodges | | Region | | Extraction
Technique | | 2023 | | 2022 | | 2021 | | Wapasu Creek | | N. Athabasca | | mining/in-situ | | 5,174 | | | 5,174 | | | 5,174 | | | Athabasca | | N. Athabasca | | mining | | 2,005 | | | 2,005 | | | 2,005 | | McClelland Lake (2) | | N. Athabasca | | mining | | — | | | 1,997 | | | 1,997 | | | Beaver River | | N. Athabasca | | mining | | 1,094 | | | 1,094 | | | 1,094 | | | Fort McMurray Village: | | | | | | | | | | | Black Bear | | N. Athabasca | | mining | | 531 | | | 531 | | | 531 | | | Bighorn | | N. Athabasca | | mining | | 763 | | | 763 | | | 763 | | | Lynx | | N. Athabasca | | mining | | 855 | | | 855 | | | 855 | | | Wolverine | | N. Athabasca | | mining | | 855 | | | 855 | | | 855 | | Borealis (1) | | N. Athabasca | | mining | | 1,504 | | | 1,504 | | | 1,504 | | | Grey Wolf | | N. Athabasca | | mining | | 946 | | | 946 | | | 946 | | Hudson (1) | | N. Athabasca | | mining | | 624 | | | 624 | | | 624 | | Wabasca (1) | | S. Athabasca | | mining | | 288 | | | 288 | | | 288 | | Red Earth (1) | | S. Athabasca | | mining | | 216 | | | 216 | | | 216 | | Conklin (1) | | S. Athabasca | | mining/in-situ | | 610 | | | 610 | | | 610 | | Anzac (1) | | S. Athabasca | | in-situ | | 526 | | | 526 | | | 526 | | | Subtotal – Oil Sands | | | | | | 15,991 | | | 17,988 | | | 17,988 | | | Sitka Lodge | | Kitimat, BC | | LNG | | 961 | | | 961 | | | 959 | | | Total Rooms | | | | | | 16,952 | | | 18,949 | | | 18,947 | |
(1)Currently closed as of December 31, 2023, due to lodge loading strategy, seasonal activity fluctuations or low activity level in the region. All three closed lodges were assessed for impairment upon their closure, in accordance with U.S. Generally Accepted Accounting Principles (U.S. GAAP). Please see Note 3 - Impairment Charges to the notes to the consolidated financial statements in Item 8 of this annual report for further discussion. |
Open Camps
In addition to our lodges, we have five open camps in Alberta, British Columbia, Saskatchewan and Manitoba. The major differentiator between lodges and open camps is the size of the facility. Open camps are generally smaller facilities that provide a level of amenity similar to that of one of our larger lodges, including quality accommodation and food services, satellite television, fitness facilities and on-site laundry. We own the land where all of our open camp assets are located, with the exception of Geetla Lodge, which is on leased land. In the fourth quarter of 2017, we demobilized our Pebble Beach open camp for a mobile camp opportunity servicing a pipeline construction project. These assets will be included in our mobile camp assets going forward. Open camps are typically utilized for exploratory, seasonal or short-term projects. Therefore, customer commitments for open camps tend to be shorter in initial duration (six to 18 months). Open camps may be operational for 12 months or several years or transition into lodges depending on customer demand. Over time, room counts may fluctuate up or down depending on demand in the region. IfAll closed lodges are periodically assessed for impairment at an asset group level, in accordance with United States (U.S.) generally accepted accounting principles. See Note 4 - Impairment Charges to the demandnotes to the consolidated financial statements in a region decreases, open camp assets can be relocated to areasItem 8 of greater activity. this annual report for further discussion.
(2)The land lease associated with the asset expired in June 2023 and was not renewed. See "Item 7. Management’s Discussion and Analysis of Financial Condition and Results of Operations - Overview and Macroeconomic Environment -McClelland Lake Lodge” of this annual report for additional information.
Hospitality Services at Third-Party Owned Facilities
We
also provide
accommodationhospitality services at
our open camps on a day rate basis. Open camp revenue comprises a portion of “Other Revenue” in our Canadian segment.Our Alberta open camps service the Athabasca and Peace River oil sands, as well as conventional and shale play oil and gas developments and infrastructure expansions. Geetla Lodge services the Horn River Basin in British Columbia.
Rooms in our Canadian Open Camps
| | | | | As of December 31, |
Open Camps | | Province | | 2017 | | 2016 | | 2015 |
| | | | | | | | | |
Boundary (1) | | Saskatchewan | | 346 | | 346 | | 346 |
Antler River (1) | | Manitoba | | 254 | | 254 | | 254 |
Red Earth | | Alberta | | 114 | | 114 | | 114 |
Geetla (1) | | British Columbia | | 81 | | 81 | | 81 |
Pebble Beach (1) (2) | | Alberta | | --- | | 436 | | 436 |
Christina Lake | | Alberta | | 35 | | 35 | | 35 |
Total Rooms | | | | 830 | | 1,266 | | 1,266 |
| (1)
| Currently closed due to low activity level in the region. All three closed camps were assessed for impairment upon their closure, and written down to their fair market value. Please see Note 3 - Impairment Charges to the notes to the consolidated financial statements in Item 8 of this annual report for further discussion.
|
| (2)
| During the fourth quarter 2017, the Pebble Beach open camp location was demobilized and the assets will be included in our mobile camp assets going forward.
|
Catering and Facilities Management
We have experience in the management of third-partycustomer-owned facilities. Historically, this has been primarily focused around natural resource production relatedproduction-related housing facilities that are owned by producers. Currently, we operate camp facilities for third-party customers.oil production companies. The facilities we manage typically range anywhere from 200500 to 3,0001,500 rooms. We are able to customize our service offeringofferings depending on our client’scustomer’s needs. Facilities managementHospitality services can be performed on an end-to-end basis with catering,food service, housekeeping, maintenance and utility services included or in segments such as cateringfood service only.
Recently, we have engaged in developing a non-energy related catering brand. This diversification initiative targets catering and facility management opportunities outside of the energy sector, including educational, entertainment, healthcare and traditional catering events. Currently, we operate three non-energy Our focus on hospitality service contracts has allowed us to successfully pursue food service only opportunities. Due to our experience servicing customer-owned facilities, and we are constructing a food production facility, which will begin operations in early 2018.
this business easily fits into our overall strategy.
Canadian
Mobile CampsAssets
Our mobile
camps consistsassets consist of modular, skid-mounted accommodations and central facilities that can be quickly configured to serve a multitude of shortshort- to medium-term accommodation needs. The dormitory,Dormitory, kitchen and ancillary assets can be rapidly mobilized and demobilized and are scalable to support 200 to 800 people in a single location. In addition to asset rental, we provide cateringhospitality services such as food service and housekeeping, as well as other camp management services, including fresh water and sewage hauling services. Our mobile campsassets service the traditional oil and gas sector in Alberta and British Columbia and in-situ oil sands drilling and development operations in Alberta, as well as pipeline construction crews throughout Western Canada. TheThese assets have also been used in the past in disaster relief efforts, the 2010 Vancouver Winter Olympic Games and a variety of other non-energy related projects.
Our mobile
camp assets are rented on a per unit basis based on the number of days that a customer utilizes the asset.asset, and, in some cases, involve standby rental arrangements. In cases where we provide cateringfood service or ancillary services, the contract can provide for per unit pricing or cost-plus pricing. Customers are also typically responsible for mobilization and demobilization costs. Our focus on ancillaryhospitality service contracts has allowed us to successfully pursue cateringfood service only opportunities. Due to the business nature ofour experience servicing client-ownedcustomer-owned facilities, this business easily fits into our overall business. Aside from the traditional workforce accommodations, we are expanding our target markets to areas such as institutional, educational and entertainment facilities. Mobile camp revenue comprises a portion of “Other Revenue” in our Canadian segment.strategy.
Australia
Australia
During the year ended December
31, 2017,2023, we generated 29%48% of our revenue from our Australian operations. As of December 31, 2017,2023, we had 9,346owned 8,910 rooms across teneight villages, of which 7,3927,488 rooms service the Bowen Basin region of central Queensland, one of the premier metallurgical (met)met coal basins in the world. We provide accommodationhospitality services on a day rate basis to mining and related service companies (including construction contractors), typically under short- and medium-term contracts (three(one to five years) with minimum nightly room commitments. During 2017, no further rooms were addedIn addition, we provide integrated services to our Australian villages.
the mining industry in Western Australia and South Australia.
As the
largest contributor to exports and a major contributor to the country’s gross domestic product and government revenue, the Australian natural resources sectorindustry plays a vital role in the Australian economy. Australia has broad natural resources, including met and thermal coal, conventional and coal seam gas, base metals, iron ore, copper, lithium and precious metals such as gold. Australia is the largest exporter of met coal and iron ore in the world, in addition to being in close proximity to the largest steel producing countries in the world, primarily in Southeast Asia. The growth of Australian natural resource commodity exports over the last decade has been largely driven by strong Asian demand for met coal, iron ore and LNG. Australia’s resources are primarily located in remote regions of the country that lack infrastructure and resident labor forces to developproduce these resources. Approximately 60%resources, as the majority of the AustralianAustralia’s population is located in five cities, which are all located on the east coast of Australia, and over 90% of the population lives in the southern half of the country. Sufficient local labor is lacking near the major natural resources developments, which are primarily inland and in the central and northern parts of the country. As a result, much of the natural resources labor force works on a rotational basis, which often requires a commute from a major city or the coast andto a living arrangement near the resource projects. Consequently, there is substantial need for workforce accommodations and hospitality services to support resource production in the country. Workforce accommodations have historically been built and owned by the resource developer/owner, with third parties providing the hospitality and facility management services, typical of an insourcing business model.
Since 1996, our Australian business has sought to change the insourcing business model through its integrated servicehospitality services offering, allowing customers to outsource their accommodations needs and focus their investmentsinvestments on resource production operations. Our Australian accommodations villages are strategically located in proximity to long-lived, low-cost mines operated by multiple investment-grade, international mining companies. The current
Our Australian villages support similar activities as our Canadian lodges for the natural resources industry in Australia. Our customers are typically developing and producing met coal, iron ore and other minerals which have resource lives that are measured in decades. As such, their spending levels tend to react similarly to commodity prices as the spending levels of our Australian segmentCanadian customers. Spending on producing assets is less sensitive to commodity price decreases in the short and medium term, assuming the projects remain cash flow positive. However, new construction projects and expansionary projects are primarily related to supplying accommodations in supporttypically canceled or deferred during periods of lower met coal mining inand iron ore prices. New project construction activity typically requires larger workforces than day-to-day operations, where proximity and availability of customer-owned rooms influences the demand for our rooms and services. Demand for rooms at our Australian villages is primarily driven by production, maintenance and operational activities.
Our Australian operations primarily serve the Bowen Basin
of Queensland and the Pilbara region
of Queensland.in Western Australia. During the year ended December 31, 2017,2023, our five villages in the Bowen Basin of central Queensland generated 80%47% of our Australian revenue, or 23% of our consolidated revenue. The Bowen Basin contains one of the largest coal deposits in Australia and is renowned for its premium met coal. Met coal is usedIn addition, we provide village operation and mine site cleaning services at eight customer locations in the steel making processPilbara region, which is renowned for high grade iron ore production. Our villages and demand has largely been driven by global demand for steel finished goods and steel construction materials. In recent years, growth in construction demand for steel products in emerging economies, particularly China, has slowed significantly, negatively impacting demand for the commodity. However, during 2017 demand from China for steel increased leading to improved pricing for met coal. Australia is the largest exporter of met coal in the world, in addition to being in close proximity to the largest steel producing countries in the world. Our villagescustomer-owned locations are focused on the mines in the central portion of the basinPilbara and Bowen Basins and are well positioned for the active mines in the region.
Beyond
met coal and iron ore markets served in the
Pilbara and Bowen
Basin,Basins, we serve several
emergingother markets with
fourthree additional villages and ten customer-owned villages. At the end of 2017,2023, we had two villages with over 1,000 combined rooms in the Gunnedah Basin, an emerginga thermal and met coal as well as coal seam gas region ofin New South Wales. In Western Australia, we serve workforces related to LNG facilities operations on the Northwest Shelf through our Karratha village. In addition, we provide hospitality services in Western Australia and South Australia at ten customer-owned villages which support workforces related to nickel, copper, zinc, silver and gold production in the Goldfields-Esperance region, lithium production in the Pilbara region and copper, silver and gold in Western Australia and South Australia.
AustralianVillage Locations
Owned Rooms in our Australian Villages
| | | | | | | As of December 31, |
Villages | | Resource Basin | | Commodity | | 2017 | | 2016 | | 2015 |
| | | | | | | | | | | |
Coppabella | | Bowen | | met coal | | 3,048 | | 3,048 | | 3,048 |
Dysart | | Bowen | | met coal | | 1,798 | | 1,798 | | 1,798 |
Moranbah | | Bowen | | met coal | | 1,240 | | 1,240 | | 1,240 |
Middlemount | | Bowen | | met coal | | 816 | | 816 | | 816 |
Boggabri | | Gunnedah | | met/thermal coal | | 622 | | 662 | | 662 |
Narrabri | | Gunnedah | | met/thermal coal | | 502 | | 502 | | 502 |
Nebo | | Bowen | | met coal | | 490 | | 490 | | 490 |
Calliope (1) | | --- | | LNG | | 300 | | 300 | | 300 |
Kambalda | | Goldfields | | Gold, lithium | | 232 | | 232 | | 232 |
Karratha | | Pilbara | | LNG, iron ore | | 298 | | 298 | | 208 |
Total Rooms | | | | | | 9,346 | | 9,386 | | 9,296 |
| | | | | | | | | | | | | | | | | | | | | | | | | | | | | | | | |
| | | | | | | As of December 31, |
Villages | | Resource
Basin | | Commodity | | 2023 | | 2022 | | 2021 |
| Coppabella | | Bowen | | met coal | | 3,144 | | | 3,048 | | | 3,048 | |
| Dysart | | Bowen | | met coal | | 1,798 | | | 1,798 | | | 1,798 | |
| Moranbah | | Bowen | | met coal | | 1,240 | | | 1,240 | | | 1,240 | |
| Middlemount | | Bowen | | met coal | | 816 | | | 816 | | | 816 | |
| Boggabri | | Gunnedah | | met/thermal coal | | 622 | | | 622 | | | 622 | |
| Narrabri | | Gunnedah | | met/thermal coal | | 502 | | | 502 | | | 502 | |
| Nebo | | Bowen | | met coal | | 490 | | | 490 | | | 490 | |
| Karratha | | Pilbara | | LNG, iron ore | | 298 | | | 298 | | | 298 | |
Kambalda (1) | | - | | gold, lithium | | — | | | — | | | 232 | |
| Total Rooms | | | | | | 8,910 | | | 8,814 | | | 9,046 | |
(1) Currently closed due to low activity level Sold in the region. This village was assessed for impairment upon its closure, and written down to its fair market value. Please see Note 3 - Impairment Charges to the notes to the consolidated financial statements in Item 8third quarter of this annual report for further discussion.2022.
Our Australian segment
includes teneight company-owned villages with 9,3468,910 rooms as of December 31, 2017 and has a significant development portfolio in Australia.2023, which are strategically located near long-lived, low-cost mines operated by large mining companies. Our Australian business provides accommodationhospitality services to mining and related service companies under short- and medium-term contracts. Our Australian accommodations villages are strategically located near long-lived, low-cost mines operated by large mining companies. Our growth plan for this part of our business continues to include theenhanced occupancy and expansion of these properties where we believe there is durable long-term demand.demand, as well as to provide hospitality services at customer-owned assets.
Our Coppabella, Dysart, Moranbah, Middlemount and Nebo villages are located in the Bowen Basin. Coppabella, at over 3,0003,100 rooms, is our largest village and provides accommodationrooms and related hospitality services to a variety of customers. Each of these villages supports both operational workforce needs and contractor needs with resort style amenities, including swimming pools, gyms, a walking track and a tavern.
Our
Nebo, Dysart, Moranbah and Middlemount Villages have a long history of providing service in the region.Our Narrabri and Boggabri villages in New South Wales serviceprovide rooms and related hospitality services to met and thermal coal mines and coal seam gas in the Gunnedah Basin. Our Karratha village, in Western Australia, services workforces related to LNG facilities operations on the Northwest Shelf. Our Kambalda
Hospitality Services at Third-Party Owned Facilities
We also provide hospitality services at customer-owned villages to the mining industry in Western Australia. Historically, this has been focused around natural resource production-related village supports goldfacilities that are primarily owned by iron ore production companies. We provide village hospitality services at 18 customer-owned locations, which represent over 12,600rooms, primarily in the Pilbara region of Western Australia, one of the premier iron ore bodies in the world, and lithium mining in southernthe Goldfields-Esperance region of Western Australia.U.S.
Overview
During The facilities we manage range anywhere from 200 to over 1,900 rooms. We work together with our customers to customize our service offerings depending on our customer’s needs. Hospitality services can be performed on an end-to-end basis with catering and food service, housekeeping and site maintenance included or in segments such as food service only. Mine site cleaning services are also provided at some of our customer-owned locations.
Other
In the
year ended December 31, 2017,first quarter of 2023, we sold our accommodation assets in Louisiana. In addition, in the second half of 2022, we sold both our U.S. business generated 7% of our revenue.wellsite services and offshore businesses. Our remaining U.S. business has operational exposure to the Rocky Mountain corridor, the Bakken Shale region, the Permian Basin regionconsists of Texas and offshore locations235 rooms at our Killdeer Lodge, which supports completion activity in the Gulf of Mexico. The business provides open camp facilities and highly mobile smaller camps that follow drilling rigs andBakken. U.S. oil completion crews as well as accommodations, office and storage modules that are placed on offshore drilling rigs and production platforms.
U.S. Market
Onshore oil and natural gas development in the U.S. has historically been supported by local workforces traveling short to moderate distances to the worksites. With the development of substantial resources in regions such as the Bakken, Rockies and Permian Basin, labor demand has exceeded the local labor supply and accommodations infrastructure to support the demand. Consequently, demand for remote, scalable accommodations has developed in the U.S. over the past several years. Demand for accommodations in the U.S. has historically been tied to the level of oil and natural gas exploration and production activity which is primarily driven by oil and natural gas prices. Activity levels have been, and we expect will continue to be highly correlated with hydrocarbon commodity prices.
U.S.Locations
U.S. Mobile Camps
Our business in the U.S. consists primarilyimpacted by oil prices, pipeline capacity, federal energy policies and availability of mobile camp assets, both in the lower 48 states, including the Rocky Mountain corridor, the Bakken Shale region, the Permian Basin region of Texas,capital to support exploration and in the Gulf of Mexico. We provide a variety of sizes and configurations to meet the needs of drilling contractors,production completion companies, infrastructure construction projects and offshore drilling and completion activity. We provide quality catering and housekeeping services as well.
Our mobile fleet is rented on a per unit basis based on the number of days that a customer utilizes the asset. In cases where we provide catering or ancillary services, the contract can provide for per unit pricing or cost-plus pricing. Customers are also typically responsible for mobilization and demobilization costs.
Open Camps
| | | | As of December 31, | |
| | State | | 2017 | | | 2016 | | | 2015 | |
| | | | | | | | | | | | | | |
West Permian | TX | | | 326 | | | | 310 | | | | 310 | |
Three Rivers (1) | TX | | | --- | | | | --- | | | | 274 | |
Killdeer | ND | | | 235 | | | | 235 | | | | 235 | |
Stanley House (2) | ND | | | --- | | | | --- | | | | 157 | |
Total Rooms | | | 561 | | | | 545 | | | | 976 | |
| (2)
| Closed in March 2016. Any closed camp is assessed for impairment upon its closure, in accordance with US GAAP. Please see Note 3 - Impairment Charges to the notes to the consolidated financial statements in Item 8 of this annual report for further discussion.
|
We had two open camps in the U.S. comprised of 561 rooms as of December 31, 2017. We sold our Three Rivers location in January 2016 and closed the Stanley House location in March 2016. Our Killdeer Lodge, which we opened in October 2013, provides accommodations support to the Bakken Shale region in North Dakota. Our West Permian Lodge supports the Permian Basin in West Texas.
Modular Construction and Manufacturing
Our Canadian segment includes the design, engineering, production, transportation and installation of a variety of modular buildings, predominately for our own use. As of December 31, 2017, we owned one modular construction and manufacturing plant near Edmonton, Alberta, Canada. During the fourth quarter of 2017, we made the decision to sell this plant due to changing geographic and market needs. In line with our Australian and U.S. strategy, we are now subcontracting modular construction from third-party manufacturers for our Canadian business. In Canada, we continue to retain a staff of experts who have designed and delivered large and small modular construction projects. We are capable of taking highly replicable and well-designed manufactured buildings and our expertise in site layout, combined with site-built components including landscaping, recreational facilities and certain common facilities, to create a comfortable community within a community. We design accommodations facilities to suit the climate, terrain and population of a specific project site.
While we traditionally focused our manufacturing efforts on our internal needs, from time to time we have sold units to third parties. Revenues from the sale of accommodation units to third parties has been a small portion of our revenue and is included in “Other Revenue” in our Canadian and U.S. segments. We have not historically sold units to third parties in Australia.
plans.
Community Relations
Engagement
With a focus on long-term indigenousIndigenous community participation, our Canadian operations continue to work closely with local indigenous communitiesa number of First Nations to develop mutually beneficial and long-term partnerships focused on revenue sharing, capacity building, employment training, business development and community investments.investment and support. For over a decade, our Canadian operations have supported Buffalo Metis Catering, a partnership with three Metis communities in the Regional Municipality of Wood Buffalo, to provide cateringBuffalo. Through this partnership, food and housekeeping atservices were delivered to three of our lodges. Beyond these services, this partnership provided a business incubator environment for a number of Metis business ventures. Our Canadian operations continue to utilize local indigenous subcontractors to providealso procure services from a number
of other services such asFirst Nations-owned, Metis-owned and member-owned businesses including water hauling, snow removal and security. Our indigenous strategicsecurity services. In 2023, we purchased more than C$64.0 million in goods and services from the Indigenous business community, representing 27% of our total Canadian local spending, compared to C$66.2 million in goods and services from the Indigenous business community, representing 30% of our total Canadian local spending in 2022.
In 2021, the Fort McKay Metis community awarded Civeo with the inaugural 2020 Fort McKay Metis National President's Award. This award recognizes people or organizations who make a positive contribution to the well-being of the Metis community. In 2023 and in 2019, our Indigenous partnership initiatives were recognizedearned Civeo a Gold level Progressive Aboriginal Relations (PAR) certification, by a jury comprised of Indigenous business people, which was supported by an unbiased, independent, third-party verification of our performance. In 2016, Civeo was awarded a Silver level PAR certification by the Canadian Council for Aboriginal Business (CCAB), demonstrating our commitment to the principles and practices established by the CCAB. In addition, in 2011 and 2012, we were recognized with awards from the Alberta Chamber of Commerce industry awards in recognition for excellence in indigenous relations business practices. Commerce.
In addition, we were awarded a silver level PAR Certification by the Canada Council for Aboriginal Business in 2016. During 2017,2018, Civeo entered into three new indigenousIndigenous partnerships in the oil sands region as well asand two new partnerships in British Columbia and, in 2021, Civeo entered into a new partnership in British Columbia. Our partnerships in British Columbia are tied to accommodations contracts secured by Civeo for the Kitimat LNG Facility, the CGL pipeline expansion projects as it related to our priority growth strategy. Duringproject that originates in the same period, we continued to work with two other indigenous communities as it relates to LNGC on the west coastNorth Montney region of north-east British Columbia and the north Montney region in north eastTrans Mountain expansion project that twins an existing pipeline between Edmonton, Alberta and Burnaby, British Columbia. Beyond revenue sharing, these new arrangements provide procurement, employment, training, and ancillary business opportunities for indigenousIndigenous owned businesses. In addition, Civeo was recognized in 2017 by Indigenous Works (formerly known as the Aboriginal Human Resource Council), as an industry leader that is focused on strengthening the company's performance and results in indigenous employment, workplace engagement and inclusion.
In Australia, our community relations program also aims to build and maintain a
positive social license to operate inby consulting and engaging with local regional communities by delivering consultation and engagement from project inception, through development, construction and operations. This is a major advantage for our business model, as it facilitates consistent communication, engenders trust and builds relationships to last throughout the resource lifecycle. There is an emphasis on developing partnerships that create a long-term sustainable outcome to address specific community needs. To that end, we partner with local municipalities to improve and expand municipal infrastructure. These improvements provide necessary infrastructure, allowing the local communities an opportunity to expand and improve. We also provide support to local community groups through sponsorship and in-kind contributions to local events and initiatives. In addition, all of our food suppliers are Australian companies and, where possible, are based locally. Through our membership with Supply Nation, a non-profit organization committed to supplier diversity and Indigenous business development, we directed approximately A$12.3 million in 2023, compared to A$9.5 million in 2022, into Indigenous-owned and operated companies, and we are always looking for more opportunities to partner with these businesses.
In addition, we have four unincorporated joint venture partnerships with Indigenous landowners in Western Australia. Under these agreements, we strive to develop the business capacity, project management skills and expertise of the Indigenous joint venture members and also provide local employment opportunities and training. One of the four unincorporated joint venture partnerships entitles Indigenous landowners to a profit distribution calculated in accordance with the unincorporated joint venture deeds. Additionally, three of the four remaining agreements incentivize the joint venture members via milestone payments for business objectives achieved.
Customers and Competitors
Our customers primarily operate in oil sands mining and development, drilling, exploration and extraction of oil and natural gas and coal and other extractive industries. To a lesser extent, we also support other activities, including pipeline construction, forestry
and humanitarian
aid and disaster relief, and support for military operations.aid. Our largest customers in 20172023 were Imperial Oil Limited (a company controlled by ExxonMobil Corporation) and Fort Hills Energy LP (a partnership between Suncor Energy Inc., Total E&P Canada Ltd and Teck Resources Limited)Fortescue Metals Group Ltd., who each accounted for more than 10% of our 20172023 revenues.
Our primary competitors in Canada in
the openlodge and mobile
camp accommodationsasset hospitality services include
ATCO, Black Diamond, Horizon North, NoraltaDexterra and Clean Harbors, Inc. Some of these competitors have one or two locations similar to our oil sands lodges; however, based on our estimates, these competitors do not have the breadth or scale of our lodge operations. In Canada, we also compete against Aramark, andSodexo, Compass Group and Royal Camp Services for third-party facility management and hospitality services.
Our primary competitors in Australia
for our village accommodationshospitality services are customer-owned and operated villages as well as Ausco Modular (a subsidiary of Algeco Scotsman)Modulaire Group), Fleetwood Corporation and Fleetwood Corporation.smaller independent village operators. We also compete against ISS, Sodexo, and Compass Group, Northern Rise (as a division of Sirrom Corporation) and Cater Care for third-party facility management services.In the U.S., we primarily offer our open camp and mobile camps accommodations and compete against Stallion Oilfield Holdings, Inc., Target Logistics Management LLC (a subsidiary of Algeco Scotsman Global S.a.r.l.), HB Rentals (a subsidiary of Superior Energy Services) and Black Diamond.
Historically, many customers have invested in their own
accommodations. We estimate that our existing and potential customers own approximately 50% of the rooms available in both the Canadian oil sands and 50% of the rooms in the Australian coal mining regions.Our Lodge and Village Contracts
During the year ended December 31,
2017,2023, revenues from our lodges and villages represented over 85%63% of our consolidated revenues. Our customers typically contract for accommodations services under take-or-pay contracts with terms that most often range from several months to three years. Our contract terms generally provide for a rentaldaily rate for a reserved room and an occupied room rate that compensates us for hospitality services, including meals,food service, housekeeping, utilities and maintenance for workers staying in the lodges and villages. In most multi-year contracts, our rates typically have annual contractual escalation provisions to cover expected increases in labor and consumables costs over the contract term. Over the term of the contract, the customer commits to a minimum number of rooms over a determined period. In some contracts, customers have a contractual right to terminate, rooms, for reasons other than a breach, in exchange for a termination fee. As of December 31, 2017, we had commitmentsOur customers typically contract for 30% of our rentable rooms for 2018 and 15% of our rentable rooms for 2019.As of December 31, 2017, we had 7,034 roomshospitality services under contract, or 41% of our rentable rooms. The table below details the expiration of those contracts:
| | Contracted
Room Expiration
| |
2018
| | | 4,056 | |
2019
| | | 745 | |
2020
| | | 400 | |
2021
| | | 116 | |
2022
| | | 1,717 | |
Thereafter
| | | --- | |
Total
| | | 7,034 | |
contracts with terms that most often range from several months to twelve years. The contracts expire throughout the year,, and for many of the near-term expirations, we are in the process of negotiating extensions or new commitments. We cannot assure that we can renew existing contracts or obtain new business on the same or better terms, if at all.
Long-Term Take-or-Pay Contracts. Over the term of a take-or-pay contract, the customer commits to either a minimum number of rooms over a specified period or an aggregate number of room nights over the period, generally for terms greater than 12 months. During the year ended December 31, 2023, we billed approximately 2.6 million room nights under our long-term take-or-pay contracts, which included 0.6 million room nights in excess of the take-or-pay minimums. For the year ended December 31, 2024, we have commitments for 1.7 million room nights under our long-term take-or-pay contracts.
Short-Term Take-or-Pay Contracts. Customers may contract with us on a take-or-pay basis for less than 12 months, particularly for turnaround projects. Similar to long-term take-or-pay contracts, the customer commits to either a minimum number of rooms over a specified period or an aggregate number of room nights over the period. During the year ended December 31, 2023, we billed approximately 0.7 million room nights under our short-term take-or-pay contracts. For the year ended December 31, 2024, we have commitments for 0.1 million room nights under our short-term take-or-pay contracts.
Exclusivity Contracts. Over the term of an exclusivity contract, rather than receiving a minimum room commitment, we are the exclusive hospitality service provider for the customer's employees working on a specific project or projects. During the year ended December 31, 2023, we billed approximately 1.7 million room nights under our exclusivity contracts.
Casual / Walk-ins. Customers without long-term committed contracts may utilize lodge/village rooms via short-term bookings at lodge/village casual or agreed rates. During the year ended December 31, 2023, we billed approximately 0.1 million room nights to casual or walk-in customers.
Our Integrated Services Contracts
During the year ended December 31, 2023, revenues from our customer-owned locations represented 26% of our consolidated revenues. Our contract terms generally provide for a per guest per day rate for hospitality services, including food service and housekeeping. Similar to our owned lodge and villages contracts, in most multi-year contracts, our rates typically have annual escalation provisions to cover increases in labor and consumables costs over the contract term. Our customers typically contract for hospitality services under exclusivity contracts with terms that most often range from several months to five years. During the year ended December 31, 2023, we billed approximately 2.6 million room nights under our integrated services exclusivity contracts.
Seasonality of Operations
Our operations are directly affected by seasonal weather. A portion of our Canadian operations is conducted during the winter months when the winter freeze in remote regions is required for customers’ activity to occur. The spring thaw in these frontier regions restricts operations in the second quarter and adversely affects our customers' operations and our ability to provide services. Customers’ maintenance activities in the oil sands region, such as shutdown and turnaround activity, are typically performed in the second and third quarters annually. Our Canadian operations have also been impacted by forest fires and flooding in the past five years. During the Australian rainy season between November and April, our operations in Queensland and the northern parts of Western Australia can be affected by cyclones, monsoons and resultant flooding. In the U.S., winter weather in the first quarter and the resulting spring break up in the second quarter have historically negatively impacted
Human Capital Resources
We believe that our
Bakken and Rocky Mountain operations. Our U.S. offshore operations have historically been impacted by the Gulfemployees are one of
Mexico hurricane season from July through November. Employees
our greatest resources. As of December 31, 2017,2023, we had approximately 1,7001,600 full-time employees and approximately 1,000 hourly employees on a consolidated basis, 72%47% of whom are located in Canada, 20%
52% of whom are located in Australia and
8%1% of whom are located in the U.S. We were party to collective bargaining agreements covering
approximately 850798 employees located in Canada and
1301,020 employees located in Australia as of December 31,
2017.2023.
As a company, we acknowledge the significance of a diverse workforce composed of individuals from various backgrounds, experiences, and perspectives. As many of our projects in Canada and Australia operate in traditional territories, we work closely with Indigenous communities to actively explore mutually beneficial investment, employment, and business opportunities. Our ability to cultivate and strengthen relationships with Indigenous communities is vital to the success of our business. In Canada, we are committed to expanding our Indigenous workforce to 10%. In 2023, we reached 7% Indigenous employment in Canada, excluding corporate staff. Approximately 6% of our total new hires in Canada were of Indigenous background during 2023.
We strive to offer competitive compensation, benefits and services that meet the needs of our employees, including short- and long-term incentive packages, various defined contribution plans, healthcare benefits, and wellness and employee assistance programs. Management monitors market compensation and benefits in order to attract, retain, and promote employees and reduce turnover and its associated costs.
Safety is a foundational pillar of Civeo’s corporate culture. We are committed to operating in a safe, secure and responsible manner for the benefit of our employees, customers and the communities we serve. Our commitment to safeguarding employees, contractors, and guests is demonstrated through our employee-named Making Zero Count initiative, which emphasizes the importance of eliminating harm and focuses on the processes required to achieve exceptional performance.
At Civeo, we believe that investing in our employees is fundamental to our success. Our commitment to training and career development enables employees to grow and advance in their careers while supporting our industry-leadership position. Committed to the continuous improvement of our team, we prioritize the development of our workforce’s technical and managerial competencies, with an emphasis on safety, customer service, and leadership development. Our learning and development program encompasses a range of learning modalities, including e-learning modules, in-person training sessions, nationally certified programs and licensed training provided by external partners.
Our business is significantly affected by
foreignCanadian, Australian and U.S. laws and regulations at the federal, provincial, state and local levels relating to the oil,
, natural gas and mining industries, worker safety and environmental protection. Changes in these laws, including more stringent regulations and increased levels of enforcement of these laws and regulations, and the development of new laws and regulations could significantly affect our business and result in: | ●
| increased compliance costs or additional operating restrictions associated with our operations or our customers’ operations;
|
| ●
| other increased costs to our business or our customers’ business;
|
| ●
| reduced demand for oil, natural gas, and other natural resources that our customers produce; and
|
| ●
| reduced demand for our services.
|
•increased difficulty securing required permits, approvals, licenses or other authorizations issued by federal, provincial and local authorities needed to carry out our operations or our customers' operations;
•increased compliance costs or additional operating restrictions associated with our operations or our customers’ operations;
•other increased costs to our business or our customers’ business;
•reduced demand for oil, natural gas, and other natural resources that our customers produce; and
•reduced demand for our services.
To the extent that these laws and regulations impose more stringent requirements or increased costs or delays upon our customers in the performance of their operations, the resulting demand for our services by those customers may be adversely affected, which impact could be significant and long-lasting. Moreover, climate change laws or regulations could increase the cost of consuming, and thereby reduce demand for, oil and natural gas, which could reduce our customers’ demand for our services. We cannot predict changes in the level of enforcement of existing laws and regulations, how these laws and regulations may be interpreted or the effect changes in these laws and regulations may have on us or our customers or on our future operations or earnings. We also are not able to predict the extent to which new laws and regulations will be adopted or whether such new laws and regulations may impose more stringent or costly restrictions on our customers or our operations.
Our operations and the operations of our customers are subject to numerous stringent and comprehensive foreign, federal, provincial, state and local environmental laws and regulations governing the release or discharge of materials into the environment or otherwise relating to environmental protection. Numerous governmental agencies issue regulations to implement and enforce these laws, for which compliance is often costly yet critical. The violation of these laws and regulations may result in the denial or revocation of permits, issuance of corrective action orders, modification or cessation of operations,
assessment of
administrative and civil penalties, and even criminal prosecution. We believe that we are in substantial compliance with existing environmental laws and regulations andAlthough we do not anticipate that future compliance with existing environmental laws and regulations will have a material effect on our financial condition, results of operations or cash flows. However,flows over the short term, there can be no assurance that substantial costs for compliance or penalties for non-compliance with these existing requirements will not be incurred in the future by us or our customers. Moreover, it is possible that other developments, such as the adoption of stricter environmental laws, regulations and enforcement policies or more stringent enforcement of existing environmental laws and regulations, could result in additional costs or liabilities upon us or our customers that we cannot currently quantify.Canadian Environmental Regulations
In Canada, the federal
and provincial
and local governments
both have jurisdiction to regulate environmental matters.
WeThe provincial governments may also devolve jurisdiction over environmental matters to local governments. Our activities, or
those of our customers, may be subject to environmental regulations imposed by these three levels of government. The following addresses updates to Canadian
federal and provincial environmental regulations in
20172023 that may affect us or our customers.Federal Regulatory Reforms
In 2017
Air Quality Management
The Government of Canada (Canada), the Government of Alberta (Alberta), and the Government of British Columbia (British Columbia) each have frameworks for air quality management that may affect us and our customers.
At the federal level, the Reduction in the Release of Volatile Organic Compounds Regulations (Petroleum Sector) were published in 2020. Certain leak detection and repair provisions of the regulations took effect beginning in 2021 and the regulations set additional monitoring and requirements for operators in 2022 and 2023. These regulations require the implementation of comprehensive leak detection and repair (LDAR) programs as well as design and operating standards that prevent leaks at Canadian petroleum refineries, upgraders and certain petrochemical facilities and may affect our customers’ operations.
In addition to federal requirements, emissions from facilities in Alberta are subject to provincial regulation. The Alberta Energy Regulator (AER), which is responsible for regulating upstream oil and gas activity in Alberta, oversees compliance with Directive 60: Upstream Petroleum Industry Flaring, Incinerating, and Venting (Directive 60). This Directive applies to all upstream petroleum industry wells, facilities and pipelines as well as all oil sands schemes and operations with the exception of oil sands mining. Directive 60 requires operators to eliminate or reduce flaring associated with a wide variety of energy development activities and operations. In December 2018, the AER finalized amendments to its Directive 60 and Directive 017: Measurement Requirements for Oil and Gas Operations (Directive 17) as part of its role in implementing commitments from the Alberta government to reduce methane emissions from upstream oil and gas operations by 45% by 2025. These requirements, among other things, set limits on methane emissions from various facilities and require annual reporting of such emissions to the AER. The methane reduction requirements in Directive 60 took effect in 2020, additional vent gas limits took effect on January 1, 2022 and additional vent gas limits took effect on January 1, 2023. Meeting these regulatory requirements may result in additional costs or liabilities for our customers’ operations.
Similarly, emissions from facilities in British Columbia are also subject to provincial regulation. The British Columbia Energy Regulator (BCER) is responsible for regulating oil and gas activity in British Columbia. BCER oversees compliance with the Drilling and Production Regulation, which is one of British Columbia's primary regulatory instruments governing all aspects of oil and natural gas drilling and production. Effective January 1, 2020, that regulation was amended to require operators to eliminate or reduce natural gas leaking or venting associated with a wide variety of equipment and activities in energy development. Under this regulation, requirements are imposed for facilities detecting leaks and inspecting seals as well as restrictions or prohibitions on the types of equipment used for energy development. Some of these requirements took effect in 2022 and further requirements took effect on January 1, 2023. In addition, the BCER completed consultation in 2023 on proposed amendments to the Drilling and Production Regulation to maintain equivalency with federal requirements. Regulations designed to achieve a 45% reduction in methane emissions relative to 2014 levels are now in place. The BCER is currently conducting a regulatory review and engagement on the development of new regulations designed to achieve a 75% reduction in methane emissions from the oil and gas sector by 2030. Meeting these regulatory requirements may result in additional costs or liabilities for our customers’ operations.
Environmental Assessment of Major Projects
In August 2019, the Canadian Environmental Impact Assessment Act, 2012 (CEAA 2012) was repealed and replaced with the federal Impact Assessment Act. The Impact Assessment Act and regulations made under that Act provide that certain new projects and expansions to existing projects – including oil sands mining and in situ projects, metallurgical mining projects, pipelines and other developments – will likely require a federal planning and assessment process to understand the environmental and social impacts of the project, as well as decision on whether those impacts are in the public interest.
One of the stated objectives of the Impact Assessment Act was to shorten review times for projects that are subject to review under that Act. However, concerns about lengthy reviews that require substantial information from project proponents remain even after the implementation of the Impact Assessment Act. Our customers operate in the aforementioned industries and could be considering future projects that would be subject to the Impact Assessment Act. To the extent our customers are required to comply with this legislation, it is possible that the uncertainty regarding cost and timelines for navigating the planning, assessment, and decision-making processes may negatively impact our customers' decisions on whether to proceed with those projects.
The Government of Alberta, supported by the governments of Ontario and Saskatchewan, has challenged the constitutionality of the Impact Assessment Act. In October of 2023, a majority of the Supreme Court of Canada
initiated(Court) concluded that a
serieslarge portion of
reviewsthe regime created by the Impact Assessment Act was unconstitutional. The federal government subsequently issued interim guidance on the administration of the Impact Assessment Act and advised that it intended to
consideramend the Impact Assessment Act to align with the Court's ruling. The federal government is expected to introduce legislation amending the Impact Assessment Act in 2024. As a result, there is significant
changes touncertainty about the future application of Canada's federal environmental assessment
regime, the federal Fisheries Act, the protection of navigable waters, and the legislation governing the approval, construction and operation of interprovincial pipelines. The four parallel review processes culminated in reports from four separate review panels which resulted in the Government of Canada publishing a discussion paper summarizing proposed changes to the relevant legislative frameworks. The Government of Canada has been engaging with potentially affected stakeholders since July 2017 and new legislation implementing changes to the relevant legislation is expected in 2018. If implemented, the direct and indirect costs of these proposed regulatory changes may adversely affect our operations and financial results as well as those of our customers.Federal
Climate Change Regulation
Scientific studies have suggested that emissions of greenhouse gases (GHG), including carbon dioxide and methane, may be contributing to warming of the Earth’sEarth’s atmosphere and other climatic changes. In December 2015, 195 nations, including Canada, Australia, and the U.S., adopted the Paris Agreement at the 21st “Conference of the Parties” to the United Nations Convention on Climate Change (COP 21). The Paris Agreement does not set legally binding emission reduction targets but does set a goal of limiting global temperature increases to less than 2° Celsius. Canada announced that it is in favor of the decision of the COP 21 to endeavor to take action to further limit global temperature increases to less than 1.5° Celsius. The Paris Agreement also requires parties to submit Intended Nationally Determined Contributions (INDCs) which set out their emission reduction targets and to renew these INDCs, with the goal of increasing the reductions, every five years. Canada's INDC was to reduce economy-wide GHG emissions by 30% below 2005 levels by 2030. The Paris Agreement does not legally bind the parties to reach their INDCs, nor does it prescribe the measures itthat must take to achieve them. These measures are left to each participating nation. In September 2016, Canada's new federal government confirmed that it would not commit to a more ambitious INDC than the preceding Conservative federal government. The government maintained this approach in 2017 revisions to Canada’s INDC submission taking into account the federal Pan-Canadian Framework on Clean Growth and Climate Change (PCF)adopted in 2016.
In March 2016, Canada and the Government of the United StatesU.S. jointly announced their intention to take action to reduce methane emissions from the oil and gas sector in an effort to meet their respective INDCs pursuant to the Paris Agreement. For its part, Canada announced its intention to reduce methane emissions from the oil and gas sector by 40-45 percent below 2012 levels by 2025 and stated that draft regulations to implement that commitment would be published in early 2017.2025. In May 2017, Canada released2018, the proposed government introduced the Regulations Respecting Reduction in the Release of Methane and Certain Volatile Organic Compounds (Upstream Oil and Gas Sector) (Proposed(Federal Methane Regulations). The Proposed Regulations would apply to facilities that have the potential to emit hydrocarbons above a 60,000 m3 per year threshold and to certain other covered facilities. The Proposed Regulations would require those facilities to conserve or destroy (e.g. through flaring) methane and to implement leak detectionits methane commitment. The Federal Methane Regulations impose various quantity-based limits on the venting of natural gas (or in the case of well completions involving hydraulic fracturing, a ban on such venting) and repair programs by 2020. If implemented,include associated conservation, measurement, inspection and corrective action requirements. Certain requirements of the new regulatory requirements would be phased in betweenFederal Methane Regulations came into effect January 1, 2020, and other emissions limits are now in place for certain equipment installed on or after January 1, 2023.
In March 2022, the federal government began consultation on a proposed strategy to expand coverage and increase stringency of methane reduction obligations in the oil and gas sector specifically, and is expected to issue draft regulations in 2023. In December 2023,
the federal government published proposed amendments to the Federal Methane Regulations for public comment. The proposed amendments are intended to reduce methane emissions in Canada's upstream oil and
gas sector by at least 75% below 2012 levels by 2030. To achieve that objective, the proposed amendments would prohibit venting natural gas to the environment, subject to limited exceptions. They would also impose requirements on hydrocarbon combustion systems and measures to reduce fugitive methane emissions. Draft regulations are expected to be published in 2024. These requirements may result in additional costs or liabilities for our
customers'customers’ operations.
In March 2016,2018, the federal government enacted the Greenhouse Gas Pollution Pricing Act (GGPPA), which came into force on January 1, 2019. This regime has two parts: an output-based pricing system for large industry and a regulatory fuel charge. This system serves as a further effort to"backstop" and applies in provinces and territories that request it and in those that do not have their own emissions pricing systems in place that meet Canada’s INDCs, representatives of the federal and provincial governments committed to imposingstandards. This ensures that there is a uniform price on carbon pollution, beginning at $10 per tonne in 2018 and increasing at a rate of $10 annuallyemissions across the country. The backstop price under the GGPPA increased to $50 per tonne of CO2e in 2022. The federally established carbonAs of January 1, 2024, the backstop price is $65 per tonne of CO2e. That price will serve asincrease to $80 in April 2024 and the current government plan is to continue increasing that price by $15 each year until it reaches $170/tonne of CO2e in 2030.
On November 19, 2020, the federal government introduced the Canadian Net-Zero Emissions Accountability Act in Parliament. That Act was passed by Parliament and received Royal Assent on June 29, 2021 and binds the Government of Canada to a "backstop"process intended to help Canada achieve net-zero emissions by 2050. It also establishes rolling five-year emissions-reduction targets and requires the government to develop plans to reach each target. The federal government is required to support those efforts by creating a Net-Zero Advisory Body and by publishing annual reports that describe how departments and Crown corporations are considering the financial risks and opportunities of climate change in any provincetheir decision-making.
At the 26th Conference of the Parties to the UNFCCC (COP 26), held in Glasgow between October 31 and November 13, 2021, Canada presented a strengthened climate plan and committed to an enhanced emissions reduction target of between 40 and 45 percent below 2005 levels by 2030. Following a 2021 federal election, the Government of Canada delivered a new Throne Speech in November 2021 which reiterated its intent to take action that
does not establish an equivalentwould "go further, faster" to fight climate change. Among other things, the federal government pledged to cap and cut oil and gas sector emissions while accelerating on the path to 100 percent net zero electricity. In December 2023, the federal government announced that it intended to implement a national cap-and-trade system for oil and gas emissions in Canada and published a draft regulatory framework
by 2018. Federalfor public comment. Draft regulations
implementing the carbon price are expected to be
releasedpublished in
2018. If2024. As currently proposed, the
federal carbon pricing framework iscap-and-trade system would apply to liquified natural gas producers as well as producers in the conventional oil, offshore, oil sands and natural gas production and processing subsectors. The proposed cap-and-trade system would set oil and gas sector emissions limits, to be phased in between 2026 and 2030. Producers would be required to reduce their emissions or purchase "allowances" from other facilities that have reduced their emissions. These requirements, if implemented,
as planned, these regulatory changes may increase costs to us and our customers.To ensure that it meets its INDC commitments under the Paris Agreement, the Canadian federal government may elect to impose further regulation on GHG emissions and may wish to enter into equivalency agreements with provinces to establish a consistent regulatory regime for GHGs. This may result in increasedadditional costs or liabilities for our customers’ operations.
In addition, the federal government amended the Canadian Environmental Protection Act, 1999 (“CEPA”) in 2023. In particular, the preamble to
us and our customers.Provincial Climate Change Regulation
Climate changeCEPA now recognizes that every individual in Canada has a right to a healthy environment. The Government of Canada must now take into consideration this right, including the principles of environmental justice, when making decisions under CEPA, including its regulation can also take place atof greenhouse gas emissions in Canada. Within two years, the provincial level. For example, in 2015 Alberta announced a new Climate Leadership Plan (CLP). The policies set out in the CLP contemplateGovernment of Canada must develop an implementation framework on how this right will be upheld while administering CEPA. Until that framework is developed, there is significant uncertainty regarding how these changes to CEPA will be implemented, and their potential to affect our customers' operations.
In Alberta, GHGs are regulated pursuant to the
regulation of GHG emissions both from large industrial emittersEmissions Management and
consumer use of fossil fuels. To implementClimate Resilience Act and the
CLP, Alberta published the Carbon Competitiveness Incentive Regulation in 2017, which replaces the Specified Gas Emitters Regulation under the Climate ChangeTechnology Innovation and Emissions Management ActReduction Regulation (TIER Regulation).
In December 2019, the TIER Regulation was deemed equivalent to the backstop prescribed by the federal GGPPA, meaning that facilities within Alberta subject to the TIER Regulation are not subject to the full costs of complying with the GGPPA. The
Carbon Competitiveness IncentiveTIER Regulation provides a framework for managing GHG emissions from generally applies to Alberta-based facilities that emit over 100,000 tonnes of
carbon dioxide equivalent (CO2e)CO2e per
year as well as otheryear. Under the TIER Regulation, emissions from each facility are compared to either an industry-wide benchmark or a facility-specific benchmark which effectively permits facilities
which opt into emit GHGs up to a certain amount without being subject to the
regulation by establishing industry-specific output-basedprovincial carbon price. Those benchmarks “tighten” resulting in more onerous compliance costs, every year. Facilities with emissions
allocations and requiring that
those facilities ensure their net emissions do not exceed the
industry-wide benchmark or facility-specific benchmark, as applicable, must rely on one or more of the compliance options established
output based allocation. Companies can reduce their net emissions either through outperforming their output based allocation in a given reporting period, throughby the
TIER Regulation, such as purchase
of "fund credits" from the Climate Change and Emissions Management Fund,credits or
other approved credits. Each fund credit reduces a facility's net emissions by oneoffsets for each tonne of
CO2e.CO2e in excess of their limits. The
price of a "fund credit" effectively setsAlberta government issues an order every year setting the price
of GHG emissions for heavy industrial emitters in Alberta. Effectiveto acquire credits, which effectively dictates compliance costs. In January
1, 2018,2023, the
Alberta government published amendments to the TIER Regulation, including increases to the carbon price
of a fund credit is $30. and increases to annual benchmark tightening rates. These changes were implemented in order to ensure that the regulation of GHG emissions may significantly increaseTIER Regulation maintains equivalency with the cost of compliance for some of our customers.The CLP also proposed introducing a broad economy-wide levy on GHG emissions from the combustion of fossil fuels, subject to limited exceptions. In May 2016, Alberta passed the Climate Leadership Act, implementing the broad economy-wide levy on GHG emissions contemplated in the CLP. Under that Act, all fuel consumption – including gasoline, diesel, and natural gas consumption – is subject to a carbon levy. Alberta's carbon levy was set at $20 per tonne in 2017 and increased to $30 per tonne effective January 1, 2018. The increase in the carbon levy will addframework established by GGPPA. Increases to the cost of most fossil-based fuelsTIER Regulation credits and annual benchmark tightening rates may result in additional costs for us andor liabilities for our customers.
customers’ operations. In addition, similar increases in stringency of provincial GHG regulatory frameworks within British Columbia and Saskatchewan may result in additional costs or liabilities for our customers’ operations.
The CLP also targetsCanadian Species at Risk Act is intended to prevent wildlife species in Canada from disappearing and to provide for the recovery of wildlife species that no longer exist in the wild in Canada, or that are endangered or threatened as a 45 percent reductionresult of human activity, and to manage species of special concern to prevent them from becoming endangered or threatened. The designation of previously unprotected species as threatened or endangered in methane emissions fromareas of Canada where our customers’ oil and natural gas exploration and production operations by 2025. The Alberta Energy Regulator (AER) has been tasked with developing a multifaceted approachare conducted could cause them to reducing methane emissionsincur increased costs arising from the upstream oilspecies
protection measures or could result in limitations on their exploration and gas sector that is expected to include enhancements to its existing AER directives, new measurement and reporting requirements, and other regulations for both new and existing facilities. To that end, the AER has established a Methane Reduction Oversight Committee, consisting of representatives from government, environmental organizations, industry and technology groups. Draft Alberta methane reduction regulations are expected in 2018 and are intended to be equivalent to the federal Proposed Regulations described above. If equivalent, the Alberta methane reduction regulations would apply in lieu of the federal Proposed Regulations. Further, as contemplated in the CLP, Alberta passed the Oil Sands Emissions Limit Act in 2016 which capsoil sands GHG emissions at 100 million tonnes annually. The CLP also targets the phasing out of coal-generated electricity (or the emissions therefrom) by 2030. The combination of the announced carbon levy, and coal phase-out is expected to increase fuel and electricity prices,production activities, which could have an adverse impact on demand for our operating costs. The directservices.
Woodland caribou habitat covers large portions of several Canadian provinces including British Columbia, Alberta, and
indirect costsSaskatchewan. Many of
these regulatory changes may adverselyour customers have existing or proposed developments in or near woodland caribou habitat. Conservation measures imposed by the federal or provincial governments could affect
our operations and financial results as well as thosethe business of our customers with
whom we conduct business.operations near caribou habitat.
Abandonment and Remediation of Oil and Gas Infrastructure
As the lifecycle regulator for energy resource activities, the AER oversees closure requirements, including the abandonment and reclamation of wells, well sites, facilities, facility sites, and pipelines. Historically, the AER discharged this role through its Liability Management Rating Program (AB LMR Program). The
Government of British Columbia implemented a broad-based carbon taxAB LMR Program relied on the
purchaseratio of a company's assets and
useliabilities (Liability Management Ratio or LMR) to assess whether the company would be able to address closure obligations. Where a company's liabilities exceeded their assets (resulting in a LMR of
most fuelsless than 1.0), the AER could require the company to post security to bring the ratio to 1.0. The AB LMR Program was developed during a period of rapid growth in
2008. British Columbia's carbon tax is currently set at $30 per tonne of CO2e, but will increase by $5 per tonne of CO2e effective April 1, 2018, followed by annual increases of $5 per tonne of CO2e until reaching $50 per tonne of CO2e in 2021. The directthe province when companies were focused on well and indirect costs of these carbon price increases may adversely affect our operationsinfrastructure expansion. In recent years, it became clear that the LMR Program needed to be updated to reflect declining production and financial results as well as those of our customers.The Government of Manitoba recently announced its intention to implement a carbon tax asaging infrastructure.
As a result of the agreementSupreme Court of Canada's decision in Orphan Well Association v Grant Thornton (also known as the Redwater decision), receivers and trustees can no longer avoid the AER's legislated authority to impose abandonment orders against licensees or to require a licensee to pay a security deposit before approving a license transfer when any such licensee is subject to formal insolvency proceedings. This means that insolvent estates can no longer disclaim assets that have reached by federalthe end of their productive lives (and therefore represent a net liability) in order to deal primarily with the remaining productive and provincial governmentsvaluable assets without first satisfying any abandonment and reclamation obligations associated with the insolvent estate's assets. In April 2020, the Government of Alberta passed the Liabilities Management Statutes Amendment Act, which places the burden of a defunct licensee's abandonment and reclamation obligations first on the defunct licensee's working interest partners, and second, the AER may order the orphan fund (Orphan Fund) established under the Oil and Gas Conservation Act (OGCA) to assume care and custody and accelerate the clean-up of wells or sites which do not have a responsible owner. These changes will come into force on proclamation.
As a result of the changing landscape and new direction from the Redwater decision, in 2016. July 2020, the Government of Alberta began implementing changes to its liability management policy. In particular, in July 2020, the Province released a new Liability Management Framework (AB LMF) which includes a series of mechanisms and requirements to improve and expedite reclamation efforts and to require industry to better manage clean-up of oil and gas wells, pipelines and facilities. Notably, the AB LMF provided policy direction allowing the AER to take "Licensee Special Action" to assist operators in managing their assets and maintaining operations under certain circumstances.
The Government of ManitobaAlberta followed the announcement of the AB LMF with amendments to the Oil and Gas Conservation Rules and the Pipeline Rules in late 2020. The changes to these rules fall into three broad categories: (i) they introduce "closure" as a defined term, which captures both abandonment and reclamation; (ii) they expand the AER's authority to initiate and supervise closure; and (iii) they permit qualifying third parties on whose property wells or facilities are located to request that licensees prepare a closure plan.
The AB LMF provided Government of Alberta policy direction on managing energy sector closure requirements. The AER implements and administers that policy through directives. In April 2021, the AER made changes to Directive 67: Eligibility Requirements for Acquiring and Holding Energy Licenses and Approvals (Directive 67) in order to increase scrutiny the AER applies to ensure that authorization for oil and gas development is currently consulting ononly granted to responsible parties. Those changes include additional requirements for industry to provide updated financial information when making certain applications to the AER and throughout the energy development lifecycle. As a draft plan forresult of the changes to Directive 67, the AER may revoke or restrict a company's eligibility to hold AER licenses if the AER determines that the licensee poses an "unreasonable risk", taking into account a broad range of financial and operational considerations.
In December 2021, the AER published a new Directive 88: Licensee Life-Cycle Management (Directive 88) and supporting guidance information to further support implementing the AB LMF. Among other things, Directive 88 establishes the AER's authority to conduct a holistic licensee assessment to inform regulatory decisions about a given licensee, including by conducting a "Licensee Capability Assessment." Directive 88 also establishes the Licensee Management Program contemplated in the AB LMF which enables the AER to proactively monitor licensees to identify those at risk of not meeting
their regulatory obligations and to use appropriate regulatory tools to address that risk. Finally, Directive 88 establishes the Inventory Reduction Program and allows the AER to set licensee-specific and industry-wide closure targets.
Complementing the AB LMF Program and associated directives, Alberta's OGCA establishes an orphan fund (Orphan Fund) to help pay the costs to suspend, abandon, remediate and reclaim a well, facility or pipeline included in the AB LMR Program if a licensee or working interest participant becomes insolvent or is unable to meet its carbon tax, with draft legislation expectedobligations. The Orphan Fund was originally conceived to be bankrolled by licensees in 2018. To date,the AB LMR Program who contribute to a levy administered by the AER. However, given the increase in orphaned oil and natural gas assets, the Government of SaskatchewanAlberta has indicated that it will not develop a carbon tax, leaving openloaned the possibility that the federal "backstop" carbon pricing framework will applyOrphan Fund approximately $335 million to carry out abandonment and reclamation work, of which, $121 million had been paid as of May 2023. In response to the consumptionCOVID-19 pandemic, the Government of fossil fuelsAlberta also covered $113 million in levy payments that licensees would otherwise have owed to the Orphan Fund, corresponding to the levy payments due for the first six months of the AER's fiscal year. A separate orphan levy applies to persons holding licenses for large facilities. Collectively, these programs, the AB LMF, and associated directives are designed to minimize the risk to the Orphan Fund posed by the unfunded liabilities of licensees and to GHG emissionsprevent the taxpayers of Alberta from industrialincurring costs to suspend, abandon, remediate and reclaim wells, facilities or pipelines.
These and any other changes to the AER's approach to manages closure requirements for energy resource activities may result in
Saskatchewan.Finally, it should be notedadditional costs or liabilities for our customers’ operations.
In British Columbia the BCER’s Comprehensive Liability Management Plan addresses liability management, improving the rate of inactive site restoration, and addressing orphan sites. The BCER uses a Liability Management Rating (LMR) program to evaluate each company’s ability to pay for site restoration. The BCER addresses dormant sites through the Dormancy and Shutdown Regulation, which ensures oil and natural gas producers responsibly bring their energy resource activities to regulatory closure within a reasonable time frame. The Dormant Sites Program is used to identify permit holders that
some scientists have concluded that increasing concentrationsare subject to the dormant site provisions of
GHGs in the
Earth’s atmosphere may produce climate changes that have significant physical effects, such as higher sea levels, increased frequency and severity of storms, droughts, floods and other climatic events. If any such effects were to occur, they could have an adverse effect on our operations and financial results as well as those of our customers.Alberta’s Electricity Market
On November 3, 2016, Alberta released the details of its Renewable Electricity Program (REP) which includes a procurement process for renewable generation as part of Alberta’s CLP, which in addition to phasing out coal, includes a commitment to achieve 30 percent renewable generation by 2030. A total of approximately 5,000 megawatts (MW) of renewable generation is expected to be procured. The first procurement process concluded in December 2017. Alberta procured almost 600 MW of wind generation capacity, achieving the lowest price in Canada. Details regarding the next procurement process have not yet been released.
Alberta also announced on November 23, 2016 that it would restructure its electricity market to include a parallel capacity market by 2021. The capacity market is still in the design phase, with the first procurement process set to begin in 2019Energy Resource Activities Act and the first contractsDormancy and Shutdown Regulation. The regulation sets timelines for restoration and imposes requirements for decommissioning, site assessment, remediation and restoration. Like in Alberta, British Columbia’s Orphan Site Reclamation Fund is a levy on oil and natural gas producers that is used to be awardedpay the cost of restoring orphan sites in 2020/2021.
There is still uncertainty regarding implementingBC. If or when applicable to operations, any changes to the REP, notwithstanding the low prices achievedBCER’s approach to managing dormancy and closure requirements for energy resource activities may result in the first auction, and Alberta’s new capacity market, which may increaseadditional costs to us andor liabilities for our customers.
customers’ operations.
Australian Environmental Regulations
Our Australian segment is regulated by general statutory environmental and land use controls at both the federal, state and federal levelterritory and local government levels which may result in land use approval, regulation of operations and compliance risk. These controls include: land use and urban design controls; controls to protect Australia’s natural environment, iconic places and Aboriginal and Torres Strait islander native title and heritage; the regulation of hard and liquid waste, including the requirement for tradewastetrade waste and/or wastewater permits or licenses; the regulation of water, noise, heat, and atmospheric gases emissions; the regulation of the production, transport and storage of dangerous and hazardous materials (including asbestos); and the regulation of pollution and site contamination and requirements to notify of and clean-up environmental contamination. Some specified activities,
Federal Controls
At a federal level, the Environment Protection and Biodiversity Conservation Act 1999 (EPBC Act) is Australia’s key piece of environmental legislation. The EPBC Act protects of matters of national environmental significance, for example, sewage treatment works,threatened species and communities (e.g. Koalas), migratory species, Ramsar wetlands and world heritage properties. Activities that have the potential to impact matters protected by the EPBC Act trigger referral to the federal government for assessment and approval.
In October 2020, the findings of an independent review of the EPBC Act (Independent Review) recommended significant reforms including (but not limited to) introduction of legally binding ‘National Environmental Standards’, a ‘climate change’ referral trigger, measures to harness and recognize the importance of indigenous knowledge, stronger compliance and enforcement powers, proposals for revised bilateral agreements with the States and Territories to streamline the assessment and approval process of some activities regulated by the EPBC Act and criminal penalties for offenses relating to emissions-intensive actions.
In December 2022 the federal government announced its response to the Independent Review. This response proposes various changes to the EPBC Act in line with the Independent Review, for example, the introduction of ‘National Environmental Standards’, creation of a federal Environmental Protection Agency and the introduction of a requirement to
achieve ‘net positive’ outcomes. Several bills to effect some of the recommended reforms are currently before Parliament and a comprehensive draft bill is expected to be introduced in 2024 together with a draft of the proposed National Environmental Standards. Notably, the federal government is not presently proposing to introduce the climate change referral trigger recommended by the Independent Review.
If any of the recommended reforms take effect, our obligations under, and compliance with, the EPBC Act ought to be reviewed. However, its implications for our Australian operations are not anticipated to be significant.
Ongoing awareness of these reforms is important as the legislative and policy changes may require regulation at a state level by way of environmental protection licenses which also impose monitoringaffect our customers’ operations and reporting obligationshave impacts on the holder. non-renewable resources sector generally.
There is an increasing emphasis from
state and federal regulators on sustainability and energy efficiency in business operations. Federal requirements are now in place for the mandatory disclosure of energy performance under building rating schemes. These schemes require the tracking of specific environmental performance factors. Carbon reporting requirements currently exist for corporations which meet a reporting threshold for greenhouse gases or energy use or production for a reporting (financial) year under
nationalfederal legislation.
From July 1, 2023, new obligations and reporting requirements took effect with respect to the ‘Safeguard Mechanism’ – Australia’s policy for reducing emissions from facilities that emit more than 100,000t CO2-e per financial year that has been in place since 2016. These reforms are intended to assist Australia meet its emissions reduction targets of 43% below 2005 levels by 2030 and may affect large scale industry customers.
The federal government has also proposed further climate-related disclosure requirements that are anticipated to take effect (for some companies) from mid-2024. These proposed disclosure requirements will oblige companies to disclose various climate-related information, including information about their greenhouse gas emissions, climate-related targets, offset contributions, transition plans, and information about strategies, plans and governance procedures/controls in place to monitor and manage climate-related risks and opportunities. If these reforms become law, we will have corporate reporting requirements in relation to these climate related matters, likely to commence in 2026.
State and Territory Controls
At a State and Territory level, our operations are authorized and regulated by layers of planning and environmental approvals. Queensland, New South Wales and Western Australia all have multiple acts regulating matters of the environment, conservation, vegetation management and protection of aboriginal and Torres Strait Islander use rights which are administered by each States’ independent environment protection regulator (e.g. Queensland’s Department of Environment, Science and Innovation). If amendments are made to the EPBC Act to effect new bilateral agreements, the States and Territories will likely be given further power to assess and approve certain actions regulated the EPBC Act.
Under state law, some specified activities, for example, sewage treatment works at our sites, may require regulation by way of environmental approvals. Such approvals may also impose monitoring and reporting obligations on the holder as well as obligations to rehabilitate the subject site once the regulated activity has ceased.
We must ensure that all necessary approvals, permits and licenses are in place to authorize our operations and that the conditions of those approvals, permits and licenses are complied with until the relevant operations cease (and are cleaned-up if necessary). Where approvals are not held and/or complied with, the operation may be unlawful and subject to penalties, including stop-work orders, remediation orders and financial penalties. Our Australian operations continue to comply with our existing approvals, permits and licenses.
We have a positive obligation under state legislation to notify of an incident causing (or threatening) serious or material environmental harm. Examples of notifiable environment harm include effluent overflow, chemical leaks and chemical fires. Failure to discharge this obligation can attract significant sanctions and financial penalties.
Local Government
At a local government level, our operations are subject to, and regulated by, local laws administered by local government authorities. Local laws may cover matters such as operation of certain activities, management of vegetation and natural and anthropogenic hazards, actionable nuisance and fencing. Local laws differ between each local government area and we must understand and operate within these laws as they apply to our operations Australia wide.
U.S. Environmental Regulations
The Clean Water Act, as amended, and analogous state laws impose restrictions and strict controls regarding the discharge of pollutants into state waters or waters of the U.S. The discharge of pollutants into jurisdictional waters is prohibited unless the
discharge is permitted by the U.S. Environmental Protection Agency (EPA) or authorized state agencies. The EPA published a final rule outlining its position onIn addition, the federal jurisdictional reach over waters of the U.S. in June 2015, but this rule has been stayed nationwide by the U.S. Sixth Circuit Court of Appeals pending a substantive decision on the merits. In January 2017, the United States Supreme Court accepted review of the rule to determine whether jurisdiction to hear challenges to the rule rests with the federal district or appellate courts. In January 2018, the Supreme Court ruled that distinct courts have jurisdiction over challenges to the rule. Litigation surrounding this rule is ongoing, and the EPA has instituted rulemakings to both delay the effective date of the rule and repeal the rule. Many of our U.S. properties and operations require permits for discharges of wastewater and/or storm water, and we have developed a system for securing and maintaining these permits. The Clean Water Act and analogous state laws provide for administrative, civil and criminal penalties for unauthorized discharges and, together with the Oil Pollution Act of 1999, as amended, require the development and implementation of spill prevention and response plans and impose liability for the remedial costs and associated damages arising out of any unauthorized discharges.
GHG Emissions
The EPA has adopted rules requiring the monitoring and reporting of GHG emissions from specified large GHG emission sources in the U.S., including, offshore and onshore oil and natural gas production facilities, on an annual basis.
In October 2015,December 2023, the EPA finalized rules that added new sourcesissued a final rule updating New Source Performance Standards (NSPS) and providing emission guidelines to the scope of the GHG monitoring and reporting requirements. These new sources include gathering and boosting facilities as well as completions and workovers from hydraulically fractured oil wells. In addition, the EPA has finalized new regulations that would further restrict GHG emissions, such as new standards forreduce methane and volatile organic compound (VOC) emissionsother pollutants from new and modifiedthe oil and gas sources, which the EPA published in June 2016. The EPA has also announced that it intends to impose methane emission standards for existing sources and has issued information collection requests for oil and natural gas facilities. The EPA is currently engaged in rulemaking to stay the effective date of these rules. In November 2016, the Bureau of Land Management (BLM) issued new regulations to reduce “waste” of natural gas—of which methane is a primary constituent—from venting, flaring and leaks during oil and natural gas production activities on onshore federal and Indian lands. In December 2017, implementation of this rule was delayed until January 2019. In October 2015, the EPA finalized the Clean Power Plan, which imposes additional obligations on the power generation sector to reduce GHG emissions. However, on February 9, 2016, the U.S. Supreme Court stayed implementation of the Clean Power Plan pending resolution of legal challenges to the rule. While our operations are not directly affected by these actions, their impact on our oil and natural gas exploration and production customers could result in a decreased demand for the services that we provide.industry.
While the U.S. Congress has, from time to time, considered legislation to reduce emissions of GHGs, in recent years, there has not been significant activity in the form of adopted legislation to reduce GHG emissions at the federal level in recent years.level. In the absence of federal climate legislation in the U.S., a number of state and regional efforts have emerged that are aimed at tracking and/or reducing GHG emissions, by means ofincluding cap and trade programs that typically require major sources of GHG emissions, such as electric power plants, to acquire and surrender emission allowances in return for emitting those GHGs. The U.S. also participated in the creation of the Paris Agreement at COP 21 in December 2015 but has subsequently announced its intention to withdraw2015. Although the U.S. had withdrawn from the agreement. Paris Agreement, in November 2020, the Biden administration officially reentered the U.S. into the agreement in February 2021. Under the Paris Agreement, the Biden Administration has committed the U.S. to reducing its greenhouse gas emissions by 50% to 52% from 2005 levels by 2030. In November 2021, the U.S. and other countries entered into the Glasgow Climate Pact, which includes a range of measures designed to address climate change, including but not limited to the phase-out of fossil fuel subsidies, reducing methane emissions 30% by 2030, and cooperating toward the advancement of the development of clean energy.
Although it is not possible at this time to predict how legislation or new regulations that may be adopted to address GHG emissions would impact our business, any such future laws and regulations could require us or our customers to incur increased operating costs, such as costs to purchase and operate emissions control systems, to acquire emission allowances or comply with new regulatory or reporting requirements. Any such legislation or regulatory programs could also increase the cost of consuming, and thereby reduce demand for oil and natural gas, which could reduce our customers’ demand for our services. Consequently, legislation and regulatory programs to reduce GHG emissions could have an adverse effect on our business, financial condition and results of operations.
Other Environmental Regulations
Our operations, as well as the operations of our customers, are also subject to various laws and regulations addressing the management, disposal and releases of regulated
substances. For example, in the U.S.,substances, including the federal Resource Conservation and Recovery Act, as amended (RCRA)
and comparable state statutes regulate the generation, storage, treatment, transportation, disposal and cleanup of hazardous and non-hazardous solid wastes. Under the auspices of the EPA, most states administer some or all of the provisions of RCRA, sometimes in conjunction with their own, more stringent requirements. Federal and state regulatory agencies can seek to impose administrative, civil and criminal penalties for alleged non-compliance with RCRA and analogous state requirements. In the course of our operations, we generate some amounts of ordinary industrial wastes, such as paint wastes, waste solvents and waste oils that may be regulated as hazardous wastes. Moreover,, the federal Comprehensive Environmental Response, Compensation and Liability Act, as amended (CERCLA), also known as the Superfund law, and comparable
state laws impose liability, without regard to fault or legality of conduct, on classes of persons considered to be responsible for the release of a “hazardous substance” into the environment. These persons include the current and past owner or operator of the site where the release occurred and anyone who transported, disposed or arranged for the transport or disposal of a hazardous substance released at the site. Under CERCLA, such persons may be subject to joint and several strict liability for the costs of cleaning up the hazardous substances that have been released into the environment, for damages to natural resources and for the costs of certain health studies. CERCLA also authorizes the EPA and, in some instances, third parties to act in response to threats to the public health or the environment and to seek to recover from the responsible classes of persons the costs they incur. In addition, neighboring landowners and other third parties may file claims for personal injury and property damage allegedly caused by the hazardous substances released into the environment. We generate materials in the course of our operations that may qualify as hazardous substances. In the event of mismanagement or release of regulated substances upon properties where we conduct operations, we could become subject to liability and/or obligations under CERCLA, RCRA and/or analogous state laws. Under such laws, we could be required to undertake response or corrective measures, which could include removal of previously disposed substances and wastes, cleanup of contaminated property or performance of remedial operations to prevent future contamination.
The federal Endangered Species Act, as amended (ESA), restricts activities in the U.S. that may affect endangered or threatened species or their habitats. If endangered species are located in areas of the U.S. where our oil and natural gas exploration and production customers operate, such operations could be prohibited or delayed or expensive mitigation may be required.
Moreover, as a result of a settlement approved by the U.S. District Court for the District of Columbia in 2011, the U.S. Fish and Wildlife Service is required to make a determination on listings of more than 250 species as endangered or threatened under the ESA before the end of the agency’s 2017 fiscal year.The designation of previously unprotected species as threatened or endangered or designation of previously unprotected habitat as critical habitat in areas of the U.S. where our customers’customers’ oil and natural gas exploration and production operations are conducted could cause them to incur increased costs arising from species protection measures or could result in limitations on their exploration and production activities, which could have an adverse impact on demand for our services.
Hydraulic fracturing is a process sometimes used to stimulate production of hydrocarbons from tight formations.an important and common practice in the oil and gas industry. The process involves the injection of water, sand and chemicals under pressure into formationsa formation to fracture the surrounding rock and stimulate production. Hydraulicproduction of hydrocarbons. Certain environmental advocacy groups and regulatory agencies have suggested that additional federal, state and local laws and regulations may be needed to more closely regulate the hydraulic fracturing is typically regulated by state oilprocess, and natural gas regulators, buthave made claims that
hydraulic fracturing techniques are harmful to surface water and drinking water resources and may cause earthquakes. Various governmental entities (within and outside the U.S.) are in the process of studying, restricting, regulating or preparing to regulate hydraulic fracturing, directly or indirectly.
In the U.S., the EPA has assertedalready regulates certain hydraulic fracturing operations involving diesel under the Underground Injection Control program of the federal regulatory authority pursuant to the Safe Drinking Water Act (SDWA) over,Act. In January 2021, President Biden announced a moratorium on new oil and issuedgas leasing on federal lands and offshore waters pending completion of a comprehensive review and reconsideration of federal oil and gas permitting guidanceand leasing practices. In August 2022, a federal district judge in February 2014 for, certainLouisiana permanently enjoined the moratorium in the 13 states that filed a lawsuit against the action.
States and local governments may also seek to limit hydraulic fracturing activities
involvingthrough time, place, and manner restrictions on operations or ban the
useprocess altogether. The adoption of
diesel fuels. In May 2014, EPA issued an advance noticelegislation or regulatory programs that restrict hydraulic fracturing could adversely affect, reduce or delay well drilling and completion activities, increase the cost of
proposed rulemaking seeking comment ondrilling and production, and thereby reduce demand for our services. There also exists the
development ofpotential for the Biden Administration to pursue new or amended laws, regulations,
under the Toxic Substances Control Act (TSCA) to require companies to disclose information regarding the chemicals used in hydraulic fracturing. In March 2015, BLM issued a final ruleexecutive actions and other regulatory initiatives that
imposes requirementscould impose more stringent restrictions on hydraulic fracturing,
activitiesincluding potential restrictions on
federal and Indian lands, including new requirements relating to public disclosure, wellbore integrity and handling of flowback water; similar final rules were published in November 2016 for hydraulic fracturing activities on National Park and National Wildlife Refuge System lands. However, in June 2016, the U.S. District Court for the District of Wyoming struck down the BLM final rule, finding that BLM lacked authority to promulgate the rule. While that decision was on appeal, BLM rescinded this rule in December 2017. In addition, Congress has from time to time considered legislation to provide for federal regulation of hydraulic fracturing under the SDWA and to require disclosure of chemicals used in the hydraulic fracturing process. Some states and local governments also have adopted or are considering adopting regulations to restrict or ban hydraulic fracturing in certain circumstances. Moreover, ongoing governmental reviews of the environmental impacts of hydraulic fracturing by EPAbanning new oil and other agencies could lead to further regulation of hydraulic fracturing. For example, in December 2016, the EPA released its final reportgas permitting on the potential impacts of hydraulic fracturing on drinking water resources. The final report concluded that hydraulic fracturing activities can impact drinking water under some circumstances, including large volume spills and inadequate mechanical integrity of wells.federal lands. While our operations are not directly affected by these actions, their impact on our oil and natural gas exploration and production customers could result in a decreased demand for the services that we provide.
ITEM 1A.Risk Factors
ITEM 1A. Risk Factors
We are subject tovariousrisks and hazards due to the nature of the business activities we conduct. The risks summarized and discussed below, any of which could materially and adversely affect our business, financial condition, cash flows and results of operations and the price of our shares, are not the only risks we face. We may experience additional risks and uncertainties not currently known to us or, as a result of developments occurring in the future, conditions that we currently deem to be immaterial may also materially and adversely affect our business, financial condition, cash flows and results of operations.
Risks in this section are grouped by category. Many risks affect more than one category and the risks are not in order of significance or probability of occurrence because they have been grouped by categories.
Summary of Risk Factors:
Set forth below is a summary of the risks more fully described in this Part I, Item 1A. “Risk Factors” of this Annual Report on Form 10-K. This summary should be read in connection with the Risk Factors more fully described below and should not be relied upon as an exhaustive summary of the material risks facing our business.
•Risks Related to Our BusinessDecreased customer expenditure levels have adversely affected and may continue to adversely affect our resultsMacroeconomic-Business Environment
◦Certain of operations.Demand for our services is sensitive to the level of exploration, development and production activity of, and the corresponding capital spending by, oil and gas and mining companies. Although we have seen an increase in oil prices in late 2016 and through 2017, we are not expecting significant improvement in customer activity in the near-term, as we anticipate that our customers’ expenditures will generally lag increased oil prices by nine to 12 months. If our customers’ expenditures fail to increase in regions where our facilities are located,spending may be directly, and our business willmay be adversely impacted. Theindirectly, affected by (i) volatile or low oil, and gas and mining industries’ willingness to explore, develop and produce depends largely upon the availability of attractive resource prospects and the prevailing view of future commodity prices, which over the past year, has not been positive. Prices for oil,metallurgical (met) coal, natural gas or iron ore prices; (ii) increasing production costs; or (iii) unsuccessful exploration results.
◦The effects of public health crises, pandemics and other mineralsepidemics may materially affect how we and our customers are subjectoperating our and their businesses.
•Risks Related to large fluctuations in response to changes in the supply ofOur Customers
◦Our customers and demand for these commodities, market uncertainty, and a variety of other factors thattheir operations are beyond our control. Accordingly, a sudden or long-term decline in commodity pricing, or a continuation of the current depressed commodity price environment, would have material adverse effects on our results of operations.During the first quarter of 2016, global oil prices dropped to their lowest levels in over ten years due to concerns over global oil demand, global crude inventory levels, worldwide economic growth and price cutting by major oil producing countries, such as Saudi Arabia. Increasing global supply, including increased U.S. shale oil production, also negatively impacted pricing. With falling West Texas Intermediate (WTI) oil prices, Western Canadian Select (WCS) also fell. Oil prices and WCS have rebounded in recent periods. WCS prices in the fourth quarter of 2017 averaged $38.65 per barrel comparedexposed to a lownumber of $20.26 in the first quarter of 2016unique operating risks and a high of $83.78 in the second quarter of 2014. As of February 16, 2018, the WTI price was $61.68, and the WCS price was $35.05.
In addition, met coal prices have fluctuated from approximately $119/metric tonne as of December 31, 2014 to approximately $92.50/metric tonne as of September 30, 2016, due to a declining demand for steel and the impact of a stronger U.S. dollar. Steel demand rebounding in 2017 and the weakening of the U.S. dollar has led to higher met coal pricing. As of February 19, 2018, spot prices for met coal were $229.25/metric tonne and benchmark contract prices for the first quarter of 2018 paid to Australian metallurgical coal producers by Japanese steel producers had not settled. The increase in met coal pricing in 2017 and early 2018 have not led our customers to approve anychallenges.
◦We depend on several significant new projects. The low commodity price environment has significantly depressed exploration, development, and production activity. A deterioration of this price environment is likely to continue to depress activity levels, often reflected as reductions in employees or resource production, and have a material adverse effect on our financial position, results of operations or cash flows. Additionally, significant new regulatory requirements, including climate change legislation, could have an impact on the demand for and the cost of producing oil, coal and natural gas in the regions where we operate. Many factors affect the supply of and demand for oil, coal, natural gas and other minerals and, therefore, influence product prices, including:
| ● | the level of activity and developments in the Canadian oil sands; |
| | |
| ● | the global level of demand, particularly from China, for coal and other natural resources produced in Australia; |
customers.
| ● | the availability of economically attractive oil and natural gas field prospects, which may be affected by governmental actions or environmental activists which may restrict development; |
| | |
| ● | the availability of transportation infrastructure for oil, natural gas, LNG and coal, refining capacity and shifts in end-customer preferences toward fuel efficiency and the use of natural gas; |
| | |
| ● | global weather conditions and natural disasters; |
| | |
| ● | worldwide economic activity including growth in developing countries, such as China and India;
|
| | |
| ● | national government political requirements, including the ability of the Organization of Petroleum Exporting Companies (OPEC) to set and maintain production levels and prices for oil and government policies which could nationalize or expropriate oil and natural gas exploration, production, refining or transportation assets; |
| | |
| ● | the level of oil and gas production by non-OPEC countries; |
| | |
| ● | rapid technological change and the timing and extent of energy resource development, including LNG or other alternative fuels; |
| | |
| ●
| environmental regulation; and |
| | |
| ● | U.S. and foreign tax policies. |
◦Our failure to retain our current customers, renew our existing customer contracts and obtain new customer contracts, or the termination of existing contracts, could adversely affect our business.
◦Adverse events in areas where we operate could negatively impact our business, and our geographic concentration could limit the number of customers seeking our services.
◦We may be adversely affected if customers reduce their accommodations outsourcing.
•Risks Related to Our Operations
◦We operate in a highly competitive industry, and if we fail to compete effectively, our business will suffer.
◦Our operations may suffer due to over-capacity of certain types of accommodations assets in certain regions.
◦Increased operating costs and limited cost recovery through pricing or contract terms may constrain our ability to make a profit.
◦Employee and customer labor problems could adversely affect us.
◦A failure to maintain food safety or comply with government regulations related to food and beverages or serving alcoholic beverages may subject us to liability.
◦The majority of our major Canadian lodges are located on land subject to leases.
◦We are susceptible to seasonal earnings volatility due to adverse weather conditions in our regions of operations.
◦Failure to maintain positive relationships with the Indigenous people in the areas where we operate could adversely affect our business.
◦Development of permanent infrastructure in the areas where we locate our assets could negatively impact our business.
◦We may be subject to risks associated with the transportation, installation and demobilization of mobile accommodations.
◦Our business could be negatively impacted by security threats, including cybersecurity threats and other disruptions.
◦Our business could be disrupted by any failure of our information technology systems.
◦Loss of key members of our management could adversely affect our business.
•Financial/Accounting Risks
◦Currency exchange rate fluctuations could adversely affect our U.S. dollar reported results of operations and financial position.
◦We may not have adequate insurance for potential liabilities and insurance may not cover certain liabilities.
◦The cyclical nature of our business and a severe prolonged downturn has, and could in the future, negatively affect the value of our long-lived assets and our goodwill.
◦Our inability to control the inherent risks of identifying, acquiring and integrating businesses that we may acquire could adversely affect our operations.
◦Our indebtedness could restrict our operations and make us more vulnerable to adverse economic conditions.
•Legal and Regulatory Risks
◦We do business in Canada and Australia, whose political and regulatory environments and compliance regimes differ from those in the U.S.
◦We are subject to extensive and costly environmental laws and regulations.
◦We may be exposed to certain regulatory and financial risks related to climate change and other environmental, social and governance (ESG) related matters.
•Risks Related to Our Common Shares
◦The market price and trading volume of our common shares may be volatile.
◦The payment of dividends and repurchases of our common shares are each within the discretion of our Board of Directors, and there is no guarantee that we will pay any dividends or repurchase common shares in the future or at levels anticipated by our shareholders.
◦We are governed by the corporate laws in British Columbia, Canada.
◦Provisions contained in our articles and applicable Canadian and British Columbia laws could discourage a take-over attempt.
◦The enforcement of civil liabilities against Civeo may be more difficult.
•Risks Related to Our Structure
◦We are subject to various Canadian, Australian and other taxes.
◦We remain subject to changes in tax law (in various jurisdictions) and other factors that could impact our effective tax rate.
◦Future potential changes to U.S. tax laws could result in Civeo being treated as a U.S. corporation for U.S. federal income tax purposes.
Risk Factors:
Risks Related to Our Macroeconomic Business Environment
Certain of our customers’ spending may be directly, and our business may be indirectly, affected by (i) volatile or low oil, metallurgical (met) coal, natural gas or iron ore prices; (ii) increasing production costs; or (iii) unsuccessful exploration results.
Demand for our services is sensitive to the level of exploration, development and production activity of, and the corresponding capital spending by, natural resources companies. Our business typically supports customer projects that are capital intensive and require several years to generate first production, with production lasting for decades. The economic analyses conducted by our customers in Canadian oil sands, Australian mining and global liquefied natural gas (LNG) investment areas have historically assumed a relatively conservative longer-term price outlook for production from such projects to determine economic viability. The willingness of natural resources companies to explore, develop and produce depends largely upon the availability of attractive resource prospects and the prevailing view of future commodity prices, and expenditures by our natural resources customers generally lag changes in commodity prices by at least three to six months.
Prices for oil, met coal, LNG, iron ore and other natural resources are subject to large fluctuations in response to changes in global supply of and demand for these commodities. Other factors beyond our control that affect commodity prices include:
•worldwide economic activity including growth in and demand for oil, coal and other natural resources, particularly from developing countries, such as China and India;
•the level of activity, spending and natural resource developments in Australia and Canada;
•the level of global oil and gas exploration and production and the impact of government regulation or Organization of the Petroleum Exporting Countries Plus (OPEC+) policies that impact production levels and oil prices;
•the availability of transportation infrastructure and refining capacity for oil, natural gas, LNG and coal;
•global weather conditions, natural disasters and global health concerns;
•geopolitical events such as the ongoing Russia/Ukraine and Israel/Hamas conflicts;
•global reduction in demand for fossil fuels due to international efforts to address climate change;
•rapid technological change and the timing and extent of energy resource development, including hydraulic fracturing of horizontally drilled wells in shale discoveries and LNG;
•development, commercialization, availability and economics of alternative fuels; and
•government, tax and environmental regulation, including climate change legislation and clean energy policies.
As of February 23, 2024, the West Texas Intermediate (WTI) price was $77.54 and the Western Canadian Select (WCS) price was $58.60, resulting in a discount (WCS Differential) at which WCS trades relative to WTI of $18.94. Should the price of WTI decline or the WCS discount to WTI widen further, our oil sands customers may delay or eliminate additional investments, reduce their spending in the oil sands region or curtail or shut-down existing operations.
The effects of public health crises, pandemics and epidemics may materially affect how we and our customers are operating our and their businesses.
Public health crises, pandemics and epidemics, such as the COVID-19 pandemic, have adversely impacted and may in the future adversely impact, worldwide economic activity, including the operations of natural resources companies in Canada, Australia and the U.S. and the worldwide demand for oil and natural gas. Other effects of such public health crises, pandemics and epidemics include significant volatility and disruption of the global financial markets; continued volatility of commodity prices and related uncertainties around OPEC+ production; disruption of operations resulting from decreased customer demand and labor shortages; supply chain disruptions or equipment shortages; reduced capital spending by oil and gas companies; and employee impacts from illness, travel restrictions, including border closures, and other community response measures.
The extent to which our business operations and financial results may be affected by such public health crises, pandemics and epidemics depends on various factors beyond our control, such as the duration, severity and sustained geographic impact of the outbreak; the impact and effectiveness of governmental actions to contain and treat such outbreaks, including government policies and restrictions; vaccine hesitancy, vaccine mandates, and voluntary or mandatory quarantines; and the global response surrounding such uncertainties.
Risks Related to Our Customers
Our customers and their operations are exposed to a number of unique operating risks and challenges which could also adversely affect us.
We could be materially adversely affected by disruptions to our customers’ operations. The price of and demand for natural resources produced by our customers may impact their desire and/or ability to continue producing existing projects or start new projects. Customers may also experience unexpected problems, higher costs or delays in commencing, developing or producing a project. Additionally, the willingness of natural resources companies to explore, develop and produce may be impacted by pressures to limit increases in capital spending generally and on met coal and hydrocarbons in particular, as well as by cost overruns on past and current projects, which could adversely impact demand for our services. Operating risks and challenges our customers face, which may ultimately affect their need for the accommodations and services we provide, include:
•commodity price volatility;
•unforeseen and adverse geological, geotechnical, seismic and mining conditions;
•lack of availability or failure of the required infrastructure, including sourcing sufficient water or power, necessary to maintain or to expand their operations;
•the breakdown or shortage of equipment and labor necessary to maintain their operations;
•capital project cost overruns and cost inflation;
•risks associated with the natural resources industry being subject to laws and regulations, including those governing air and greenhouse gas emissions, as well as various regulatory approvals, including a government agency failing to grant an approval or failing to renew an existing approval, or the approval or renewal not being provided by the government agency in a timely manner or the government agency granting or renewing an approval subject to materially onerous conditions;
•risks to land titles, mining titles and use thereof as a result of native title claims;
•claims by persons living in close proximity to mining projects, which may have an impact on the consents granted; and
•interruptions to the operations of our customers caused by governmental action, industrial accidents, disputes or public health emergencies.
We depend on several significant customers.
We depend on several significant customers, including customers that operate in the natural resources industry. The loss of any one of our largest customers in any of our business segments or a sustained decrease in demand by any of such customers could result in a substantial loss of revenues and could have a material adverse effect on our results of operations. In addition, the concentration of customers in the natural resources industry may impact our overall exposure to credit risk, either positively or negatively, in that customers may be similarly affected by changes in economic and industry conditions. With low and/or volatile oil and gas prices, some of our customers may face liquidity issues, which could impair their ability to pay or otherwise perform on their obligations. Furthermore, some of our customers may be highly leveraged and subject to their own operating and regulatory risks, which increases the risk that they may default on their obligations to us. For a more detailed explanation of our customers, see “Business” in Item 1 of this annual report.
Our failure to retain our current customers, renew our existing customer contracts and obtain new customer contracts, or the termination of existing contracts, could adversely affect our business.
Our success depends on our ability to retain our current customers, renew or replace our existing customer contracts and obtain new business. Our ability to do so generally depends on a variety of factors, including overall customer expenditure levels and the quality, price and responsiveness of our services, as well as our ability to market these services effectively and differentiate ourselves from our competitors. We cannot assure you that we will be able to obtain new business, renew existing customer contracts at the same or higher levels of pricing, or at all, or that our current customers will not turn to competitors, cease operations, elect to self-operate(i) utilize their own, on-site accommodations or (ii) terminate contracts with us. Because
Our business is contract intensive and we are party to many contracts with customers. Due to the volatile nature of the current depressed commodity price environment,prices, our customers may not renew contracts on terms favorable to us or, in some cases, at all, and we may have difficulty obtaining new business. Additionally, severalSeveral contracts have clauses that allow termination upon the payment of a termination fee. As a result, our customers may choose to terminate their contracts. The likelihood that a customer may seek to terminate a contract is increased during periods of market weaknessvolatility like those we are currently experiencing. Further, certainAdditionally, our exclusivity contracts do not include minimum room commitments, so we receive payment only if the customer utilizes our services. Finally, while we periodically review our compliance with contract terms and provisions, if customers were to dispute our contract determinations, the resolution of such disputes in a manner adverse to our interests, including customers maywithholding payments or modification of payment terms, could negatively affect sales and operating results.
We did not reach positive final investment decisions on projectsrenew the land lease associated with respectour McClelland Lake Lodge in Alberta, Canada, which expired in June 2023, in order to whichsupport our customer’s intent to mine the land where the lodge was located. In addition, the accompanying hospitality services contract at McClelland Lake Lodge expired in July 2023; however, we have been awarded contractscontinued to provide related accommodation, which may cause those customershospitality services to terminate the contracts. customer at our other owned lodges through January 31, 2024 under a short-term take-or-pay commitment. We completed the sale of the McClelland Lake Lodge assets in January 2024. Revenues associated with the 2023 room commitments at the lodge through July 2023 were approximately C$39 million.
Customer contract cancellations,
reduced customer utilization, the failure to renew a significant number of our existing contracts or the failure to obtain new business would have a material adverse effect on our business and results of operations.
Due to the cyclical nature of the natural resources industry, our business may be adversely affected by extended periods of low oil, coal or natural gas prices or unsuccessful exploration results may decrease our customers’ spending and therefore our results.
Commodity prices have been and are expected to remain volatile. This volatility causes oil and gas and mining companies to change their strategies and expenditure levels. Prices of oil, coal and natural gas can be influenced by many factors, including reduced demand due to lower global economic growth, surplus inventory, improved technology such as the hydraulic fracturing of horizontally drilled wells in shale discoveries, access to potential productive regions and availability of required infrastructure to deliver production to the marketplace. In particular, global demand for both oil and metallurgical coal is, at least partially, dependent on the growth of the Chinese economy. Should gross domestic product growth in China slow further or contract, demand for oil and metallurgical coal and, correspondingly, our accommodations would fall, which would negatively impact our financial results.
Our business typically supports projects that are capital intensive and require several years to generate first production. The economic analyses conducted by our customers in oil sands, Australian mining and LNG investment areas have historically assumed a relatively conservative longer-term price outlook for production from such projects to determine economic viability. Because of the recent depressed commodity price environment, our customers have reduced or deferred, and may continue to reduce or defer, major expenditures, particularly in Canada and Australia, given the long-term nature of many large scale development projects, adversely affecting our revenues and profitability.
In Canada, WCS crude is the benchmark price for our oil sands accommodations customers. Pricing for WCS is driven by several factors, including the underlying price for WTI and the availability of transportation infrastructure. Historically, WCS has traded at a discount to WTI. Should the price of WTI decline or the WCS discount to WTI widen further, our oil sands customers may delay or eliminate additional investments, further reduce their spending in the oil sands region or curtail or shut-down additional existing operations. Similarly, the volumes and prices of the mineral products of our customers, including coal and gold, have historically varied significantly and are difficult to predict. The demand for, and price of, these minerals and commodities is highly dependent on a variety of factors, including international supply and demand, the price and availability of alternative fuels, actions taken by governments and global economic and political developments. Mineral and commodity prices have fluctuated in recent years and may continue to fluctuate significantly in the future. No assurance can be given regarding future volumes or prices relating to the activities of our customers. We have experienced in the past, and expect to experience in the future, significant fluctuations in operating results based on these changes.
In addition, the carrying value of our lodges or villages could be reduced by extended periods of limited or no activity by our customers, which has required us to record impairment charges equal to the excess of the carrying value of the lodges or villages over fair value. We recorded impairments of our long-lived assets of $31.6 million and $46.1 million in 2017 and 2016, respectively. We also recorded goodwill impairments of $43.2 million in 2015. We may incur additional asset impairment charges in the future, which charges will affect negatively our results of operations and financial condition.
Exchange rate fluctuations could adversely affect our U.S. dollar reported results of operations and financial position.
Currency exchange rate fluctuations can create volatility in our consolidated financial position, results of operations and/or cash flows. Because our consolidated financial results are reported in U.S. dollars, if we generate net revenues or earnings in countries whose currency is not the U.S. dollar, the translation of such amounts into U.S. dollars can result in an increase or decrease in our reported revenues, net income, financial condition and cash flows depending upon exchange rate movements. For the year ended December 31, 2017, 93% of our revenues originated from subsidiaries outside of the U.S. and were denominated in either the Canadian dollar or the Australian dollar. As a result, a material decrease in the value of these currencies relative to the U.S. dollar has had, and may have in the future, a negative impact on our reported revenues, net income, financial condition and cash flows. Any currency controls implemented by local monetary authorities in countries where we currently operate could also adversely affect our business, financial condition and results of operations.
Our reporting currency is the U.S. dollar, and we are exposed to currency exchange risk primarily between the U.S. dollar and the Canadian and Australian dollars. We may attempt to limit the risks of currency fluctuation where possible by entering into financial instruments to protect against foreign currency exposure. Our efforts to limit exchange risks may be unsuccessful, thereby exposing us to foreign currency fluctuations that could cause our results of operations, financial condition and cash flows to deteriorate.
We do business in Canada and Australia, whose political and regulatory environments and compliance regimes differ from those in the United States.
A significant portion of our revenue is attributable to operations in Canada and Australia. These activities accounted for 93% of our consolidated revenue in the year ended December 31, 2017. Risks associated with our operations in Canada and Australia include, but are not limited to:
| ● | international currency fluctuations; |
| ● | different taxing regimes; |
| | |
| ● | changing political conditions; |
| | |
| ● | changing international and U.S. monetary policies; |
| | |
| ● | regional economic downturns; |
| | |
| ● | expropriation, confiscation or nationalization of assets; and |
| | |
| ● | foreign exchange limitations. |
The regulatory regimes in these countries are substantially different than those in the United States, and may be unfamiliar to U.S. investors. Violations of non-U.S. laws could result in monetary and criminal penalties against us or our subsidiaries and could damage our reputation and, therefore, our ability to do business.
All but one of our major Canadian lodges are located on land subject to leases. If we are unable to renew a lease, we could be materially and adversely affected.
All but one of our major Canadian lodges are located on land subject to leases. Accordingly, while we own the accommodations assets, we only own a leasehold in those properties. If we are found to be in breach of a lease, we could lose the right to use the property. In addition, unless we can extend the terms of these leases before their expiration, as to which no assurance can be given, we will lose our right to operate our facilities located on these properties upon expiration of the leases. In that event, we would be required to remove our accommodations assets and remediate the site. Generally, our leases have an initial term of ten years and will expire between 2023 and 2027 unless extended. We can provide no assurances that we will be able to renew our leases upon expiration on similar terms, or at all. If we are unable to renew leases on similar terms, it may have an adverse effect on our business.
Due to the significant geographic concentration of our business, in the oil sands region of Alberta, Canada and in the Bowen Basin coal region of Queensland, Australia, adverse events in these areas where we operate could negatively impact our business, and our geographic concentration could limit the number of customers seeking our services.
Because of the concentration of our business in
three relatively small geographic areas: the oil sands region of Alberta, Canada,
and in the coal producing,
Bowen Basin region of Queensland, Australia
two relatively small geographic areas,and the iron ore producing, Pilbarra region of Western Australia, we have increased exposure
in these areas to political, regulatory, environmental, labor, climate or natural
disasterdisasters such as forest fires or flooding, events or developments that could disproportionately impact our operations and financial results. For example, in
2017, a cyclone impacted areas near2011 and 2017, cyclones and resulting flooding threatened our villages in Australia. AlsoSimilarly, in 2011 and 2016, forest fires in northern Alberta impacted areas near our Canadian oil sands lodges. DueMoreover, global climate change may result in significant natural disasters occurring more frequently or with greater intensity, such as drought, wildfires, storms, sea-level rise, and flooding. Many of the areas in which we operate are very remote with limited local supplies, including availability of water, electricity or natural gas necessary to operate our geographic concentration,business, and any significant adverse events such as those discussed above could impact our ability to obtain good or developments in our operating areas may disproportionately affect our financial results.services and personnel.
In addition, a limited number of companiespotential customers operate in the areas in which our business is concentrated,located, and occupancy at each of our lodges may be constrained by the radius which potential customers are willing to transport their workers. Our geographic concentration could limit the number of customers seeking our services, and as to any single lodge or village, we
may have few potential customers. Therefore, we are subject to volatility in occupancy in any location based on the capital spending plans of a limited number of customers, based on their changing decisions as to whether to outsource or use their own company-owned accommodations and whether other potential customers move into that
lodge’slodge’s radius.
Development of permanent infrastructure in the Canadian oil sands region, the west coast of British Columbia, regions of Australia or various U.S. locations where we locate our assets could negatively impact our business.
We specialize in providing housing and personnel logistics for work forces in remote areas which often lack the infrastructure typically available in nearby towns and cities. If permanent towns, cities and municipal infrastructure develop, grow or otherwise become available in the oil sands region of northern Alberta, Canada, the west coast of British Columbia or regions of Australia where we locate villages, then demand for our accommodations could decrease as customer employees move to the region and choose to utilize permanent housing and food services.
We depend on several significant customers. The loss of one or more such customers or the inability of one or more such customers to meet their obligations to us could adversely affect our results of operations.
We depend on several significant customers. The majority of our customers operate in the energy or mining industry. For a more detailed explanation of our customers, see “Business” in Item 1 of this annual report. The loss of any one of our largest customers in any of our business segments or a sustained decrease in demand by any of such customers could result in a substantial loss of revenues and could have a material adverse effect on our results of operations. In addition, the concentration of customers in two industries may impact our overall exposure to credit risk, either positively or negatively, in that customers may be similarly affected by changes in economic and industry conditions. While we perform ongoing credit evaluations of our customers, we do not require collateral in support of our trade receivables.
As a result of our customer concentration, risks of nonpayment and nonperformance by our counterparties are a concern in our business. We are subject to risks of loss resulting from nonpayment or nonperformance by our customers. Many of our customers finance their activities through cash flow from operations, the incurrence of debt or the issuance of equity. Although we have seen an increase in oil prices in late 2016 and through 2017, commodity prices have remained depressed since 2015, and the capital markets and availability of credit have been constrained relative to historical levels. Additionally, many of our customers’ equity values have declined and could decline further. The combination of lower cash flow due to commodity prices, a reduction in borrowing bases under reserve-based credit facilities and the lack of available debt or equity financing may continue to result in a significant reduction in our customers’ liquidity and could impair their ability to pay or otherwise perform on their obligations to us. Furthermore, some of our customers may be highly leveraged and subject to their own operating and regulatory risks, which increases the risk that they may default on their obligations to us. The inability or failure of our significant customers to meet their obligations to us or their insolvency or liquidation may adversely affect our financial results.
We are susceptible to seasonal earnings volatility due to adverse weather conditions in our regions of operations.
Our operations are directly affected by seasonal differences in weather in the areas in which we operate, most notably in Canada and Australia, and, to a lesser extent, the Rocky Mountain region and the Permian Basin. A portion of our Canadian operations is conducted during the winter months when the winter freeze in remote regions is required for exploration and production activity to occur. The spring thaw in these frontier regions restricts operations in the spring months and, as a result, adversely affects our operations and our ability to provide services in the second and, to a lesser extent, third quarters. During the Australian rainy season, generally between the months of November and April, our operations in Queensland and the northern parts of Western Australia can be affected by cyclones, monsoons and resultant flooding. Severe winter weather conditions in the Rocky Mountain region and the Permian Basin of the United States can restrict access to work areas for our customers. Furthermore, the areas in which we operate are susceptible to forest fires, which could interrupt our operations and adversely impact our earnings.
Our customers are exposed to a number of unique operating risks and challenges which could also adversely affect us.
We could be materially adversely affected by disruptions to our clients’ operations caused by any one of or all of the following singularly or in combination:
| ● | U.S. and international pricing and demand for the natural resource being produced at a given project (or proposed project); |
| | |
| ● | unexpected problems, higher costs and delays during the development, construction and project start-up which may delay the commencement of production; |
| ● | unforeseen and adverse geological, geotechnical, seismic and mining conditions; |
| | |
| ● | lack of availability of sufficient water or power to maintain their operations;
|
| | |
| ● | lack of availability or failure of the required infrastructure necessary to maintain or to expand their operations; |
| | |
| ● | the breakdown or shortage of equipment and labor necessary to maintain their operations; |
| | |
| ● | risks associated with the natural resources industry being subject to various regulatory approvals. Such risks may include a government agency failing to grant an approval or failing to renew an existing approval, or the approval or renewal not being provided by the government agency in a timely manner or the government agency granting or renewing an approval subject to materially onerous conditions; |
| | |
| ●
| risks to land titles, mining titles and use thereof as a result of native title claims; |
| | |
| ● | claims by persons living in close proximity to mining projects, which may have an impact on the consents granted; |
| | |
| ● | interruptions to the operations of our customers caused by industrial accidents or disputes; and |
| | |
| ● | delays in or failure to commission new infrastructure in timeframes so as not to disrupt customer operations. |
We may be adversely affected if customers reduce their accommodations outsourcing.
Our business and growth strategies depend in large part on customers outsourcing some or all of the services that we provide. Many
oil and gas and miningnatural resources companies in our core markets own their own accommodations facilities, while others outsource all or part of their accommodations requirements. Customers have largely built their
own accommodations in the past but will outsource
for additional capacity or if they perceive that outsourcing may provide quality services at a lower overall cost or allow them to accelerate the timing of their projects. We cannot be certain that these customer preferences will continue or that customers that have
previously outsourced accommodations will not decide to perform these functions themselves or only outsource accommodations during the development or construction phases of their projects. In addition, labor unions representing customer employees and contractors have, in the past, opposed outsourcing accommodations to the extent that the unions believe that third-party accommodations negatively impact union membership and recruiting. The reversal or reduction in customer outsourcing of accommodations could negatively impact our financial results and growth prospects.
Risks Related to Our Operations
We operate in a highly competitive industry, and if we fail to compete effectively, our business will suffer.
The workforce accommodations and hospitality industry in which we operate is highly competitive. To be successful, we must provide hospitality services that meet the specific needs of our customers at competitive prices. The principal competitive factors in the markets in which we operate are service quality, availability, price, location, technical knowledge and experience and safety performance. We compete with international and regional competitors, several of which are significantly larger than us. These competitors offer similar services in the geographic regions in which we operate. Many natural resources companies in our core markets own their own accommodations facilities and outsource their service requirements, while others outsource all or part of their accommodations requirements. As a result of competition, we may be unable to continue to provide our present services, to provide such services at historical operating margins or to acquire additional business opportunities, which could have a material adverse effect on our business, financial condition, results of operations and cash flows. Reduced levels of activity in the workforce accommodation industry can intensify competition and result in lower revenue to us.
Our operations may suffer due to over-capacity of certain types of accommodations assets in certain regions.
The demand for and/or pricing of rooms and accommodation services is subject to the overall availability of rooms in a region. If demand for our assets were to decrease, or to the extent that we and our competitors have capacity in excess of current demand, we may encounter decreased pricing for, or utilization of, our assets and services, which could adversely impact our operations and profits. For example, we experienced a decrease in customer demand in 2020 for accommodations in the Canadian oil sands and our U.S. business as a result of the economic disruption caused by COVID-19, and experienced a corresponding decrease in our occupancy and profitability. Continued volatility in commodity price levels, any future global health crises, inflationary pressures, actions taken by OPEC+ to adjust production levels, geopolitical events such as the ongoing Russia/Ukraine and Israel/Hamas conflicts, and regulatory implications on such prices, among other factors, could cause our Canadian oil sands and pipeline customers to reduce production, delay expansionary and maintenance spending and defer additional investments in their oil sands assets, which would cause a decrease in customer demand for our accommodations.
Increased operating costs and
obstacles tolimited cost recovery
due to thethrough pricing
and cancellationor contract terms
of our accommodation services contracts may constrain our ability to make a profit.
Our profitability can be adversely affected to the extent we are faced with cost increases for food, wages and other labor related expenses, insurance, fuel and utilities, especially to the extent we are unable to recover such increased costs through increases in the prices for our services, due to one or more of general economic conditions, competitive conditions or contractual provisions in our customer contracts. SubstantialFor example, substantial increases in the cost of fuel and utilities have historically resulted in cost increases in our lodges and villages. From time to time
In the last eighteen months, we have experienced a significant increase in our food costs due to global inflationary pressures. While inflation has stabilized, and while we have been able to pass some of the increased costs onto our customers, we expect to continue to experience increases in our food costs. While we believe a portion of these increases were attributablecosts from time to time due to increasing fuel prices, we believe the increases also resulted from rising global food demand.demand, other general inflationary pressures and rising supply chain issues affecting supply of goods. In addition, food
prices can fluctuate as a result of foreign exchange rates and temporary changes in supply, including as a result of incidences of wildfires or severe weather such as droughts, heavy rains and late freezes. freezes, or other climate effects. Climate and natural disaster events, such as forest fires or flooding, have the ability to impact local crop production, limiting supply and therefore having an upward pressure on food prices. For example, large swathes of farmland across the Australian states of New South Wales, Queensland and Victoria in 2022 were inundated with flood waters, damaging wheat and other crops including fruit and vegetables.
A shortage of skilled labor could also result in higher wages due to more expensive temporary hire labor resources that would increase our labor costs, which could negatively affect our profitability. For example, we have recently been impacted by increased staff costs as a result of hospitality labor shortages in Australia due to low levels of immigration into Australia and, specifically, an acute shortage of skilled labor. The reduced levels of immigration and shortage of skilled labor subsequently led to an increased reliance on more expensive temporary labor hire resources and negatively affected our profitability. Additionally, an increased proportion of temporary labor hire resources has the effect of driving up costs due to a lack of efficiency. The nature of temporary labor hire resource positions are short term, with key skills unable to be retained in our lodges and villages due to higher staff turnover.
While our
long termmulti-year contracts often provide for annual escalation in our room rates for food, labor and utility inflation, we may be unable to fully recover costs,
or the recovery may be delayed, and such increases would negatively impact our profitability on contracts that do not contain such inflation protections.
Employee and customer labor problems could adversely affect us.
Our business is labor intensive requiring a significant number of employees to perform housekeeping, janitorial and food service functions at our locations or locations that we manage. As our operations grow or our occupancy increases, we require additional staff to take care of our guests at a standard we deem appropriate and to operate safely. If we are unable to hire a sufficient labor force, we could be required to increase wages or use temporary labor at a higher cost and reduced efficiency. In recent years, we experienced, and expect to continue to experience, a shortage of labor for certain functions, inflationary pressures on wages, and an increasingly competitive labor market. The extent and duration of the effect of these labor market challenges are subject to numerous factors, including geopolitical events such as the ongoing Russia/Ukraine and Israel/Hamas conflicts, availability of qualified persons in the markets where we and our contracted service providers operate, inflation and unemployment levels within these markets and our reputation within the labor market. Inefficient operations or further increased labor costs resulting from these labor market challenges could negatively impact our profitability and could damage our reputation with our customers.
Additionally, as of December 31, 2023, we were party to collective bargaining agreements covering 798 employees in Canada and 1,020 employees in Australia. Efforts have been made from time to time to unionize other portions of our workforce. In addition, our facilities serving oil sands development work in Northern Alberta, Canada and mining operations in Australia house both union and non-union customer employees. We have not experienced strikes, work stoppages or other slowdowns in the past, but we cannot guarantee that we will not experience such events in the future. A prolonged strike, work stoppage or other slowdown by our employees or by the employees of our customers could cause us to experience a disruption of our operations or adversely impact our reputation, which could adversely affect our business and results of operations. Additional unionization efforts and new collective bargaining agreements also could materially increase our costs or limit our flexibility. Collective bargaining agreements in our Canadian operations have individual expiration dates, but in no case extend beyond 2026. Enterprise bargaining agreements in our Australian operations cover certain employees working at our villages in Queensland, New South Wales and Western Australia, as well as certain employees working at our integrated services customer-owned sites in Western Australia and South Australia. These agreements either have individual expiration dates or continue until either party seeks to have such agreement cancelled, but in no case extend beyond 2024.
A failure to maintain food safety or comply with government regulations related to food and beverages or serving alcoholic beverages may subject us to liability.
Claims of illness or injury relating to food quality or food handling are common in the food service industry, and a number of these claims may exist at any given time. Because food safety issues could be experienced at the source or by food suppliers or distributors, food safety could, in part, be out of our control. Regardless of the source or cause, any report of food-borne illness or other food safety issues such as food tampering or contamination at one of our locations could adversely impact our reputation, hindering our ability to renew contracts on favorable terms or to obtain new business, and have a negative impact on our
sales.revenue. Future food product recalls and health concerns associated with food contamination may also increase our raw materials costs and, from time to time, disrupt our business.
A variety of regulations at various governmental levels relating to the handling, preparation and serving of food (including, in some cases, requirements relating to the temperature of food),
and the cleanliness of food production facilities and
the hygiene of food-handling personnel are enforced primarily at the local public health department level. We
cannot assure youcan give no assurances that we are in full compliance with all applicable laws and regulations at all times or that we will be able to comply with any future laws and regulations. Furthermore, legislation and regulatory attention to food safety is very high. Additional or amended regulations in this area may significantly increase the cost of compliance or expose us to liabilities.
We serve alcoholic beverages at some of our facilities, and must comply with applicable licensing laws, as well as local service laws. These laws generally prohibit serving alcoholic beverages to certain persons such as a
patron who is intoxicated or a minor. If we violate these laws, we may be liable to the patron and/or to third parties for the acts of the patron. We cannot guarantee that intoxicated or minorcertain patrons will not be served or that liability for their acts will not be imposed on us. There can be no assurance that additional regulation in this area would not limit our activities in the future or significantly increase the cost of regulatory compliance. We must also obtain and comply with the terms of licenses in order to sell alcoholic beverages in the jurisdictions in which we serve alcoholic beverages. If we are unable to maintain food safety or comply with government regulations related to food, beverages or alcoholic beverages, the effect could be materially adverse to our business orand results of operations.
Our
The majority of our major Canadian lodges are located on land banking strategy maysubject to leases. If we are unable to renew a lease or obtain permits necessary to operate on such leased land, we could be materially and adversely affected.
The majority of our major Canadian lodges are located on land subject to provincial leases. Accordingly, while we own the accommodations assets, we only own a leasehold in those properties. If we are found to be in breach of a lease, we could lose the right to use the property. In addition, our leases generally have an initial term of ten years and will expire between 2024 and 2030 unless extended. Unless we can extend the terms of these leases before their expiration, as to which no assurance can be given, we will lose our right to operate our facilities located on these properties upon expiration of the leases. In that event, we would be required to remove our accommodations assets and remediate the site at our own cost, which could be material.
We did not
be successful.Ourrenew an expiring land banking strategy is focused on investing earlylease associated with our McClelland Lake Lodge in landAlberta, Canada, which expired in June 2023, in order to gainsupport our customer’s intent to mine the land where the lodge was located. As of December 31, 2023, we had an asset retirement obligation (ARO) liability related to the McClelland Lake Lodge on our balance sheet of $0.3 million. Consistent with U.S. generally accepted accounting principles, this liability is the estimated present value of the amount of required asset removal and site remediation costs related to the retirement of assets at this location in 2023.
As of December 31, 2023, we had other ARO liabilities on our balance sheet of $16.2 million. Should the remediation requirement be accelerated, our near term cash obligation could be significantly larger than the liability currently on our balance sheet and could negatively impact our cash flows and liquidity.
Also, in certain areas in which we operate, we are required to seek permits from local government agencies in order to build a strategic, early mover advantage innew lodge or operate an emerging region or resource play. However, we cannot assure you that all landexisting lodge on leased land. We can provide no assurances that we purchase or lease will be able to renew our leases or permits upon expiration on similar terms, or at all. If we are unable to renew our leases or permits on similar terms, it may have an adverse effect on our business and results of operations.
We are susceptible to seasonal earnings volatility due to adverse weather conditions in a regionour regions of operations.
Our operations are directly affected by seasonal differences in weather in the areas in which we operate. A portion of our customers requireCanadian operations is conducted during the winter months when the winter freeze in remote regions is required for exploration and production activity to occur. The spring thaw in these frontier regions restricts operations in the spring months and, as a result, adversely affects our operations and our ability to provide services in the future. We also cannot assure you thatsecond quarter. During the property acquiredAustralian rainy season, generally between the months of November and April, our operations in Queensland and the northern parts of Western Australia can be affected by us willcyclones, monsoons and resultant flooding. Additionally, the areas in which we operate are susceptible to wildfires. Finally, global climate change may result in certain of these adverse weather conditions occurring more frequently or with greater intensity.If any of these conditions occur, our operations could be profitably developed. Our land banking strategy involves significant risks thatinterrupted and our earnings may be adversely impacted.
Failure to maintain positive relationships with the Indigenous people in the areas where we operate could adversely affect our financial condition, results of operations, cash flow and the market pricebusiness.
A component of our
securities, which includebusiness strategy is based on developing and maintaining positive relationships with the
following risks: | ● | the regionsIndigenous people and communities in the areas where we operate. These relationships are important to our operations and customers who desire to work on traditional Indigenous lands. The inability to develop and maintain relationships and to be in which we invest may not develop or sustain adequate customer demand; |
| | |
| ● | we may incur costs to acquire land and/or construct assets without securing a customer contract or prior to finalization of an accommodations contract with a customer and, if the contract is not obtained or delayed, the resulting impact could result in an impairment of the related investment; |
| | |
| ● | during the time between acquisition and use, and depending on adjacent uses of the land, the property may become unusable or require costly remediation efforts due to environmental damage; |
| | |
| ● | we may not be able to obtain financing for development projects on favorable terms or at all;
|
| | |
| ● | we may not be able to obtain, or may experience delays in obtaining, all necessary zoning, land-use, building, occupancy and other governmental permits and authorizations, and the issuance of permits is dependent upon a number of factors, including water and waste treatment alternatives available, road traffic volumes and fire conditions in forested areas; |
| | |
| ● | development opportunities that we explore may be abandoned and the related investment impaired; |
| | |
| ● | the properties may perform below anticipated levels, producing cash flow below budgeted amounts; |
| ●
| construction costs, total investment amounts and our share of remaining funding may exceed our estimates and projects may not be completed, delivered or stabilized as planned; |
| | |
| ● | we may experience delays (temporary or permanent) if there is public, government or aboriginal opposition to our activities; and |
| | |
| ● | substantial renovation, new development and redevelopment activities, regardless of their ultimate success, typically require a significant amount of management’s time and attention, diverting their attention from our day-to-day operations. |
Our business is contract intensive and may lead to customer disputes or delays in receipt of payments.
Our business is contract intensive and we are party to many contracts with customers. We periodically review our compliance with contract terms and provisions. If customers were to dispute our contract determinations, the resolution of such disputes in a manner adverse to our interests could negatively affect sales and operating results. In the past, our customers have withheld payment due to contract or other disputes, which has delayed our receipt of payments. While we do not believe any reviews, audits, delayed payments or other such matters should result in material adjustments, if a large number of our customer arrangements were modified or payments withheld in response to any such matter, the effect could be materially adverse to our business or results of operations.
We are subject to extensive and costly environmental laws and regulations that may require us to take actions that will adversely affect our results of operations.
All of our operations are significantly affected by stringent and complex foreign, federal, provincial, state and local laws and regulations governing the discharge of substances into the environment or otherwise relating to environmental protection. We could be exposed to liabilities for cleanup costs, natural resource damages and other damages as a result of our conduct that was lawful at the time it occurred or the conduct of, or conditions caused by, prior operators or other third-parties. Environmental laws and regulations are subject to change in the future, possibly resulting in more stringent requirements. The implementation of new laws and regulations could result in materially increased costs, stricter standards and enforcement, larger fines and liability and increased capital expenditures and operating costs, particularly for our customers, andrequirements could have an adverse effect on our business and results of operations.
Development of permanent infrastructure in the areas where we locate our assets could negatively impact our business.
We specialize in providing hospitality services for workforces in remote areas which often lack the infrastructure typically available in nearby towns and cities. If permanent towns, cities and municipal infrastructure develop, grow or otherwise become available in the oil sands region of northern Alberta, Canada, the west coast of British Columbia or regions of Australia where we operate, then demand for our services. See “Business - Government Regulation” in Item 1 of this annual report for a more detailed description of ourhospitality services could decrease as customer employees move to the region and choose to utilize permanent housing and food service.
We may be subject to risks associated with
environmental lawsthe transportation, installation and
regulations.Any failure by usdemobilization of mobile accommodations.
We currently have several contracts to
complytransport and install modular, skid-mounted accommodations and central facilities that can be quickly configured to serve a multitude of short- to medium-term accommodation needs. In connection with
applicable environmental laws and regulations may result in governmental authorities taking actions against our business that could adversely impact our operations and financial condition, including the: | ● | issuance of administrative, civil and criminal penalties; |
| | |
| ● | denial or revocation of permits or other authorizations; |
| | |
| ● | reduction or cessation of operations; and |
| | |
| ● | performance of site investigatory, remedial or other corrective actions.
|
Construction risks exist which may adversely affect our results of operations.
There are a number of general risks that might impinge on companies involved in the development, construction, manufacturetransportation and installation of these facilities, as a prerequisite to the management of those assets in an operational sense. We might be exposed to these risks from time to time by relying on these corporations and/or other third parties which could include any and/or all of the following:
| ● | the construction activities of our accommodations are partially dependent on the supply of appropriate construction and development opportunities; |
| ● | development approvals, slow decision making by counterparties, complex construction specifications, changes to design briefs, legal issues and other documentation changes may give rise to delays in completion, loss of revenue and cost over-runs which may, in turn, result in termination of accommodation supply contracts; |
| | |
| ● | other time delays that may arise in relation to construction and development include supply of labor, scarcity of construction materials, lower than expected productivity levels, inclement weather conditions, land contamination, cultural heritage claims, difficult site access or industrial relations issues; |
| | |
| ● | objections to our activities or those of our customers aired by aboriginal or community interests, environment and/or neighborhood groups which may cause delays in the granting or approvals and/or the overall progress of a project;
|
| | |
| ● | where we assume design responsibility, there is a risk that design problems or defects may result in rectification and/or costs or liabilities which we cannot readily recover; and |
| | |
| ● | there is a risk that we may fail to fulfill our statutory and contractual obligations in relation to the quality of our materials and workmanship, including warranties and defect liability obligations. |
The cyclical nature of our business and a severe prolonged downturn has and could in the future negatively affect the value of our long-lived assets.
We recorded impairments of our long-lived assets, including intangibles, of $31.6 million, $46.1 million and $79.7 million in 2017, 2016 and 2015, respectively. We also recorded goodwill impairments of $43.2 million in 2015.
Extended periods of limited or no activity by our customers at our lodges or villages could require us to record further impairment charges equal to the excess of the carrying value of the lodges or villages over fair value. We may recognize additional impairment losses on our long-lived assets in the future if, among other factors:
| ● | global economic conditions remain depressed or further deteriorate, including a further decrease in the price of or demand for oil, natural gas and minerals; |
| | |
| ● | the outlook for future profits and cash flow for our Canadian and Australian reporting units deteriorates as the result of many possible factors, including, but not limited to, increased or unanticipated competition, technology becoming obsolete, need to satisfy changes in customers’ accommodations requirements, further reductions in customer capital spending plans, loss of key personnel, adverse legal or regulatory judgment(s), future operating losses at a reporting unit, downward forecast revisions or restructuring plans or if certain of our customers do not reach positive final investment decisions on projects with respect to which we have been awarded contracts to provide related accommodation, which may cause those customers to terminate the contracts; |
| | |
| ● | costs of equity or debt capital increase; or |
| | |
| ● | valuations for comparable public companies or comparable acquisition valuations deteriorate.
|
An accidental release of pollutants into the environment may cause us to incur significant costs and liabilities.
There is inherent risk of environmental costs and liabilities in our business as a result of our handling of petroleum hydrocarbons, because of air emissions and waste water discharges related to our operations, and due to historical industry operations and waste disposal practices. Certain environmental statutes impose joint and several strict liability for these costs. For example, an accidental release by us in the performance of services at one of our or our customers’ sites could subject us to substantial liabilities arising from environmental cleanup, restoration costs and natural resource damages, claims made by neighboring landowners and other third parties for personal injury and property damage and fines or penalties for related violations of environmental laws or regulations. We may not be able to recover some or any of these costs from insurance.
We may be exposed to certain regulatoryvarious risks, including:
•delays in necessary approvals to install the facilities or objections to our activities or those of our customers aired by aboriginal or community interests, environment and/or neighborhood groups which may cause delays in the granting of such approvals and/or the overall progress of a project;
•challenges during installation, including problems, defects, inclement weather conditions, land contamination, cultural heritage claims, difficult site access or industrial relations issues; and financial
•risks related to climate change.Climate change is receiving increasing attention from scientiststhe quality of our materials and legislators alike. The debate is ongoing asworkmanship, including warranties and defect liability obligations.
Our business could be negatively impacted by security threats, including cybersecurity threats and other disruptions.
We face various security threats, including cybersecurity threats to gain unauthorized access to sensitive information or to render data or systems unusable or hold them for ransom; threats to the
extentsafety of our employees; threats to
whichthe security of our
climate is changing, the potential causes offacilities and infrastructure or third-party facilities and infrastructure; and threats from terrorist acts. Although we utilize various procedures and controls to monitor these threats and mitigate our exposure to such threats, including cybersecurity insurance, there can be no assurance that these procedures and controls will be sufficient in preventing security threats from materializing. If any
change and its potential impacts. Some attribute global warming to increased levels of greenhouse gases, including carbon dioxide, which has led to significant legislative and regulatory efforts to limit greenhouse gas emissions. Significant focus is being made on companies that are active producers of depleting natural resources.There are a number of legislative and regulatory proposals to address greenhouse gas emissions, which are in various phases of discussion or implementation. The outcome of Canadian, Australian, U.S. federal, regional, provincial and state actions to address global climate change could result in a variety of regulatory programs including potential new regulations, additional charges to fund energy efficiency activities, or other regulatory actions. These actions could:
| ● | result in increased costs associated with our operations and our customers’ operations; |
| | |
| ● | increase other costs to our business; |
| | |
| ● | reduce the demand for carbon-based fuels; and |
| | |
| ● | reduce the demand for our services.
|
Any adoption of these events were to materialize, they could lead to losses of sensitive information, critical infrastructure, personnel or similar proposals by Canadian, Australian, U.S. federal, regional, provincial or state governments mandating a substantial reduction in greenhouse gas emissions could have far-reaching and significant impacts on the energy industry. Although it is not possible at this timecapabilities essential to predict how legislation or new regulations that may be adopted to address greenhouse gas emissions would impact our business, any such future laws and regulations could result in increased compliance costs or additional operating restrictions,operations and could have a material adverse effect on our reputation, competitive position, financial position, results of operations or cash flows. In addition, such events could result in litigation, regulatory action and potential liability, including liability under laws that protect the privacy of personal information, as well as the costs and operational consequences of implementing further data protection measures.
Cybersecurity attacks in particular develop and evolve rapidly, including from emerging technologies, such as advanced forms of artificial intelligence. Such attacks include, but are not limited to, malicious software, attempts to gain unauthorized access to data, ransomware attacks and other electronic security breaches that could lead to disruptions in critical systems, unauthorized release of or denial of access to confidential or otherwise protected information and corruption of data. We have experienced, and expect to continue to confront, efforts by hackers and other third parties to gain unauthorized access or deny access to, or otherwise disrupt, our information systems and networks. While we have not experienced a material cybersecurity incident in the last three years, a material cybersecurity incident could have a material adverse effect on our business, financial condition, results of operations or liquidity.
Our business could be disrupted by any failure of our information systems.
We depend on our information systems to actively manage our accommodation services, including with respect to administrative functions, financial and operational data, ordering and point of sale processing, to enhance our ability to optimize facility utilization, occupancy, costs of goods sold and average daily rate. The failure of our information systems to perform as anticipated could damage our reputation with our customers, disrupt our business or
demand forresult in, among other things, decreased revenue and increased costs. Any such failure could harm our
services. See “Business—Government Regulation” in Item 1 of this annual report for a more detailed description of our climate-change related risks.
Our inability to control the inherent risks of identifying, acquiring and integrating businesses that we may acquire, including any related increases in debt or issuances of equity securities, could adversely affect our operations.
Acquisitions have been, and our management believes acquisitions will continue to be, a key element of our growth strategy. We may not be able to identify and acquire acceptable acquisition candidates on favorable terms in the future. We may be required to incur substantial indebtedness to finance future acquisitions and also may issue equity securities in connection with such acquisitions. Such additional debt service requirements could impose a significant burden on ourbusiness, results of operations and financial condition. The issuanceIn addition, the delay or failure to implement information system upgrades and new systems effectively could disrupt our business, distract management’s focus and attention from business operations and growth initiatives, and increase our implementation
and operating costs, any of additional equity securitieswhich could materially adversely affect our operations and operating results. Furthermore, these technologies may require refinements and upgrades, which may require significant investment by us. As various systems and technologies become outdated or new technology is required, we may not be able to replace or introduce them as quickly as needed or in a cost- effective and timely manner. As a result, we may not achieve the benefits we may have been anticipating from any new technology or system.
Loss of key members of our management could adversely affect our business.
We depend on the continued employment and performance of key members of our management. If any of our key managers resign or become unable to continue in significant dilutiontheir present roles and are not adequately replaced, our business operations could be materially adversely affected. We do not maintain “key man” life insurance for any of our officers.
Financial/Accounting Risks
Currency exchange rate fluctuations could adversely affect our U.S. dollar reported results of operations and financial position.
Our reporting currency is the U.S. dollar, and we are exposed to
shareholders.We expectcurrency exchange risk primarily between the U.S. dollar and the Canadian and Australian dollars. For the year ended December 31, 2023, 98% of our revenues originated from subsidiaries outside of the U.S. and were denominated in either the Canadian dollar or the Australian dollar. As a result, a material decrease in the value of these currencies relative to gain certainthe U.S. dollar has had, and may have in the future, a negative impact on our reported revenues, net income, financial condition and cash flows. Any currency controls implemented by local monetary authorities in countries where we currently operate could also adversely affect our business, financial condition and strategic advantages as a resultresults of business combinations we undertake, including synergies and operating efficiencies. Our forward-looking statements assume that we will successfully integrate our business acquisitions and realize these intended benefits. An inabilityoperations. We may attempt to realize expected strategic advantages as a resultlimit the risks of the acquisition would negatively affect the anticipated benefits of the acquisition. Additional risks we could face in connection with acquisitions include:
| ● | retaining key employees of acquired businesses; |
| | |
| ● | retaining and attracting new customers of acquired businesses; |
| | |
| ● | retaining supply and distribution relationships key to the supply chain; |
| ● | increased administrative burden;
|
| | |
| ● | developing our sales and marketing capabilities; |
| | |
| ● | managing our growth effectively; |
| | |
| ● | potential impairment resulting from the overpayment for an acquisition; |
| | |
| ●
| integrating operations; |
| | |
| ● | managing tax and foreign exchange exposure; |
| | |
| ● | potentially operating a new line of business; |
| | |
| ● | increased logistical problems common to large, expansive operations; and |
| | |
| ● | inability to pursue and protect patents covering acquired technology. |
Additionally, an acquisition may bring uscurrency fluctuation where possible by entering into businessesfinancial instruments to protect against foreign currency exposure, but, to date, we have not previously conducted and exposeentered into any foreign currency financial instruments. Our efforts to limit exchange risks may be unsuccessful, thereby exposing us to additional business risksforeign currency fluctuations that are different from those we have previously experienced. If we fail to manage any of these risks successfully,could cause our business could be harmed. Our capitalization and results of operations, may change significantly following an acquisition,financial condition and our shareholders may not have the opportunitycash flows to evaluate the economic, financial and other relevant information that we will consider in evaluating future acquisitions.
deteriorate.
We may not have adequate insurance for potential liabilities and insurance may not cover certain
liabilities, including litigation.liabilities.
Our operations are subject to many hazards. In the ordinary course of business, we become the subject of various claims, lawsuits and administrative proceedings seeking damages or other remedies concerning our commercial operations, products, employees and other matters, including occasional claims by individuals alleging exposure to hazardous materials as a result of our products or operations. Some of these claims relate to the activities of businesses that we have acquired, even though these activities may have occurred prior to our acquisition of such businesses. We maintain insurance to cover many of our potential losses,
including cyber risk insurance, and we are subject to various self-retentions and deductibles under our insurance policies. It is possible, however, that a judgment could be rendered against us in cases in which we could be uninsured and beyond the amounts that we currently have reserved or anticipate incurring for such matters. Even a partially uninsured or underinsured claim, if successful and of significant size, could have a material adverse effect on our results of operations or consolidated financial position. In addition, we are insured under
the insurance policies of Oil States
’ insurance policies International, Inc. (Oil States) for occurrences prior to the completion of the Spin-off.our spin-off from Oil States in May 2014 (the Spin-Off). The specifications and insured limits under those policies, however, may be insufficient for such claims. We also face the following other risks related to our insurance coverage: | ● | coverage, including (i) we may not be able to continue to obtain insurance on commercially reasonable terms; |
| | |
| ● | the counterparties to our insurance contracts may pose credit risks; and |
| | |
| ● | we may incur losses from interruption of our business that exceed our insurance coverage. |
Our operations may suffernot be able to continue to obtain insurance on commercially reasonable terms; (ii) the counterparties to our insurance contracts may pose credit risks; (iii) we may incur losses from interruption of our business that exceed our insurance coverage; and (iv) we may not be able to procure insurance for certain risks due to increased industry-wide capacityvarious factors including insurance market constraints.
The cyclical nature of
certain types of assets.The demand for and/or pricing of roomsour business and accommodation service is subject to the overall availability of roomsa severe prolonged downturn has, and could in the marketplace. If demand forfuture, negatively affect the value of our long-lived assets were to decrease, or to the extent that we and our competitors increase our capacity in excess of current demand, we may encounter decreased pricing for or utilizationgoodwill.
We recorded impairments of our
long-lived assets
of $1.4 million, $5.7 million and
services, which could adversely impact$7.9 million in 2023, 2022 and 2021, respectively. As of December 31, 2023, goodwill at our
operations and profits.Australian reporting unit represented 1% of total assets, or $7.7 million.
In addition, we significantly increased our capacity in the Canadian oil sands region and in Australia over the past several years basedFactors that may cause us to recognize further impairment losses on our previous expectations for customer demand for accommodations in these areas. However, due tolong-lived assets or on the sustained decline in commodity prices throughout 2015 and 2016 and into 2017, customer demand for accommodations in those areas has decreased significantly, and we have experienced a corresponding significant decrease ingoodwill at our occupancy and profitability. ShouldAustralian reporting unit include, among other things, extended periods of limited or no activity by our customers build their own facilities to meet their accommodations needsat our lodges or our competitors likewise increase their available accommodations,villages, increased or activity in the oil sandsunanticipated competition, and downward forecast revisions or natural resources regions declines further, demand and/restructuring plans or pricing for our accommodations could further decrease, negatively impacting our profitability.
We operate in a highly competitive industry, and if we fail to compete effectively, our business will suffer.
The workforce accommodation, logistics and facility management industry in which we operate is highly competitive. To be successful, we must provide services that meet the specific needscertain of our customers at competitive prices. The principal competitive factorsdo not reach positive final investment decisions on projects with respect to which we have been awarded contracts to provide related accommodation, which may cause those customers to terminate the contracts.
Our inability to control the inherent risks of identifying, acquiring and integrating businesses that we may acquire, including any related increases in debt or issuances of equity securities, could adversely affect our operations.
Acquisitions have been, and our management believes acquisitions will continue to be, a key element of our growth strategy. We may not be able to identify and acquire acceptable acquisition candidates on favorable terms in the
markets in which we operate are service quality and availability, price, technical knowledge and experience and reputation for safety.future. We compete with international and regional competitors, several of which are significantly larger than us. These competitors offer similar services in the geographic regions in which we operate. Many oil and gas and mining companies in our core markets own their own accommodations facilities, while others outsource all or part of their accommodations requirements. As a result of competition, we may be unablerequired to continueincur substantial indebtedness to provide our present services, to providefinance future acquisitions and also may issue equity securities in connection with such services at historical operating margins or to acquireacquisitions. Such additional business opportunities, whichdebt service requirements could haveimpose a material adverse effectsignificant burden on our business, financial condition, results of operations and cash flows. Reduced levelsfinancial condition. The issuance of activity in the workforce accommodation industry can intensify competition andadditional equity securities could result in lower revenuesignificant dilution to us.
Lossshareholders. In addition, overpayment of an acquisition could cause potential impairments which could affect our results of operations.
We expect to gain certain business, financial and strategic advantages as a result of business combinations we undertake, including synergies and operating efficiencies. Our forward-looking statements assume that we will successfully integrate our business acquisitions and realize these intended benefits. The success of any acquisitions we make depends, in large part, on our ability to realize the anticipated benefits, including operating synergies from combining our businesses, which were previously operated independently, and retaining and integrating key membersemployees, vendors and customers from the acquired businesses. An inability to realize expected strategic advantages as a result of the acquisition would negatively affect the anticipated benefits of the acquisition.
Additionally, an acquisition may bring us into businesses we have not previously conducted or geographies in which we have not previously operated and expose us to additional business risks that are different from those we have previously experienced. Our future success depends, in part, upon our ability to manage this expanded business, which will pose substantial challenges for our management,
could adversely affect our business.We depend onincluding challenges related to the continued employmentmanagement and performancemonitoring of key members of our management.new operations and associated increased costs and complexity. If we fail to manage any of our key managers resign or become unable to continue in their present roles and are not adequately replaced,these risks successfully, our business operations could be materially adversely affected. We doharmed. Our capitalization and results of operations may change significantly following an acquisition, and our shareholders may not maintain “key man” life insurance for any ofhave the opportunity to evaluate the economic, financial and other relevant information that we will consider in evaluating future acquisitions.
Our indebtedness could restrict our
officers.
Employeeoperations and customer labor problems could adversely affect us.
make us more vulnerable to adverse economic conditions.
As of December 31,
2017,2023, we
were party to collective bargaining agreements coveringhad approximately
850 employees in Canada and 130 employees in Australia. Efforts have been made from time to time to unionize other portions$65.6 million outstanding under the revolving portion of our workforce. In addition, our facilities serving oil sands development workSyndicated Facility Agreement (Credit Agreement), $1.4 million of outstanding letters of credit and an additional $133.1 million in Northern Alberta, Canada and mining operations in Australia house both union and non-union customer employees. We have not experienced strikes, work stoppagesremaining capacity to borrow under the revolving portion of the Credit Agreement. If market or other slowdowns in the past, but we cannot guarantee that we will not experience such events in the future. A prolonged strike, work stoppageeconomic conditions remain depressed or other slowdown byfurther deteriorate, our employees or by the employees of our customers could cause us to experience a disruption of our operations, which could adversely affect our business, financial condition and results of operations. Additional unionization efforts and new collective bargaining agreements also could materially increase our costs, reduce our revenues or limit our flexibility. Collective bargaining agreements in our Canadian operations have individual expiration dates, extending in some cases to 2020. One enterprise bargaining agreement exists in our Australian operation covering certain employees working at our villages in Queensland and New South Wales. This agreement was renewed in 2017.
Failure to maintain positive relationships with the indigenous people in the areas where we operate could adversely affect our business.
A component of our business strategy is based on developing and maintaining positive relationships with the indigenous people and communities in the areas where we operate. These relationships are important to our operations and customers who desire to work on traditional aboriginal lands. The inability to develop and maintain relationships and to be in compliance with local requirements could have an adverse effect on our business, results of operations or financial condition.
The enforcement of civil liabilities against Civeoborrowing capacity may be more difficult.
Civeo is a British Columbia company and a substantial portion of its assets are located outside the U.S. As a result, investors could experience more difficulty enforcing judgments obtained against us in U.S. courts than would be the case for U.S. judgments obtained against a U.S. company. In addition, some claims may be more difficult to bring against Civeo in Canadian courts than it would be to bring similar claims against a U.S. company in a U.S. court.
reduced.
We may increase our debt or issue equity in the future, which could affect our financial condition, may decrease our profitability or could dilute our shareholders.
We may increase our debt or issue equity in the future, subject to restrictions in our debt agreements. If our cash flow from operations is less than we anticipate, or if our cash requirements are more than we expect, we may require more financing. However, debt or equity financing may not be available to us on terms acceptable to us, if at all. If we incur additional debt or raise equity through the issuance of our preferred shares, including the issuance of preferred shares in connection with the Noralta Acquisition, the terms of the debt or our preferred shares issued may give the holders rights, preferences and privileges senior to those of holders of our common shares, particularly in the event of liquidation. The terms of the debt may also impose additional and more stringent restrictions on our operations than we currently have. If we raise funds through the issuance of additional equity, your ownership in us would be diluted. If we are unable to raise additional capital when needed, it could affect our financial health, which could negatively affect your investment in us.
Our Amended Credit Agreement contains operating and financial restrictions that may restrict our business and financing activities
Our Amended Credit Agreement contains, and any future indebtedness we incur may contain, a number of restrictive covenants that will impose significant operating and financial restrictions on us. The Amended Credit Agreement contains customary affirmativeus and negative covenants that,may limit our ability to, among other things, limit or restrict (i) subsidiary indebtedness, liens and fundamental changes, (ii) asset sales, (iii) margin stock, (iv) specified acquisitions, (v) certain restrictive agreements, (vi) transactions with affiliates and (vii) investments and other restricted payments, includingborrow funds, dispose of assets, pay dividends and other distributions. Specifically, we must maintain an interest coverage ratio, defined as the ratio of consolidated EBITDA (as defined in the Amended Credit Agreement) to consolidated interest expense, of at least 3.0 to 1.0 and our maximum leverage ratio, defined as the ratio of total debt to consolidated EBITDA, of no greater than 5.85 to 1.0 (as of December 31, 2017).
The permitted level of the maximum leverage ratio changes over time, as illustrated in the table below.
Period Ended
| Maximum Leverage
Ratio
|
| |
December 31, 2017
| 5.85 : 1.00
|
March 31, 2018
| 5.85 : 1.00
|
June 30, 2018
| 5.85 : 1.00
|
September 30, 2018
| 5.85 : 1.00
|
December 31, 2018
| 5.50 : 1.00
|
March 31, 2019 & thereafter
| 5.25 : 1.00
|
Each of the factors considered in the calculations ofmake certain investments. In addition, these ratios are defined in the Amended Credit Agreement. EBITDA and consolidated interest, as defined, exclude goodwill and asset impairments, debt discount amortization and other non-cash charges.
Wecovenants also may be prevented from taking advantage of business opportunities that arise because of the limitations imposed on us by the restrictive covenants under the Amended Credit Agreement. The restrictions contained in the Amended Credit Agreement could:
| ●
| limit our ability to plan for, or react to, market conditions, to meet capital needs or otherwise to restrict our activities or business plan; and
|
| ●
| adversely affect our ability to finance our operations, enter into acquisitions or to engage in other business activities that would be in our interest.
|
Additionally, our ability to comply with some of the covenants, ratios or tests contained in the Amended Credit Agreement may be affected by events beyond our control and, as a result, we may be unable to meet these ratios and financial condition tests. These financial ratio restrictions and financial condition tests could limit our ability to obtain future financings, make needed capital expenditures, withstand a continued downturn in our business or a downturn in the economy in general or otherwise conduct necessary corporate activities. Our ability to comply with these covenants may be affected by events beyond our control. Declines in commodity prices, or a prolonged period of commodity prices at depressed levels, could eventually result in our failing to meet one or more of the financial covenants under the Amended Credit Agreement, which could require us to refinance or amend such obligations resulting in the payment of consent fees or higher interest rates, or require us to raise additional capital at an inopportune time or on terms not favorable to us.
We may not be able to reduce our indebtedness to comply with these covenants.
A failure to comply with these covenants, ratios or tests could
also result in an event of default. A default under the
Amended Credit
Agreement, if not cured or waived, could result in acceleration of all indebtedness outstanding thereunder. The accelerated debt would become immediately due and payable. If that should occur, we may be unable to pay all such debt or to borrow sufficient funds to refinance it. Even if new financing were then available, it may not be on terms that are acceptable to us. In addition, in the event of an event of default under the Amended Credit Agreement, the lenders could foreclose on the collateral securing the credit facility and require repayment of all borrowings outstanding. If the amounts outstanding under the credit facility or any of our other indebtedness were to be accelerated, our assets may not be sufficient to repay in full the money owed to the lenders or to our other debt holders. Moreover, any new indebtedness we incur may impose financial restrictions and other covenants on us that may be more restrictive than our existing debt agreements.
Our indebtedness could restrict our operations and make us more vulnerable to adverse economic conditions.
We currently have a substantial amount of indebtedness. As of December 31, 2017, we had approximately $297.6 million outstanding under the term loan portion of the Amended Credit Agreement, no borrowings outstanding under the revolving portion of the Amended Credit Agreement, $1.8 million of outstanding letters of credit and capacity to borrow an additional $107.4 million under the revolving portion of the Amended Credit Agreement. Borrowings outstanding under the Amended Credit Agreement mature in May 2019. As of December 31, 2017, our borrowing capacity under the revolving portion of the Amended Credit Agreement was reduced by approximately $165.8 million due to the negative covenants. If market or other economic conditions remain depressed or further deteriorate, our borrowing capacity may be further reduced.
Our level of indebtedness may adversely affect our operations and limit our growth, and we may have difficulty making debt service payments on our indebtedness as such payments become due. Our level of indebtedness may affect our operations in several ways, including the following:
| ●
| our indebtedness may increase our vulnerability to general adverse economic and industry conditions;
|
| ●
| the covenants contained in the Amended Credit Agreement limit our ability to borrow funds, dispose of assets, pay dividends and make certain investments;
|
| ●
| our debt covenants also affect our flexibility in planning for, and reacting to, changes in the economy and in its industry; and
|
| ●
| our indebtedness could impair our ability to obtain additional financing in the future for working capital, capital expenditures, acquisitions or other general corporate purposes.
|
Our ability to service our debt,, including repaying outstanding borrowings under our Amended Credit Agreement at maturity, will depend upon, among other things, our future financial and operating performance, which will be affected by prevailing economic conditions and financial, business, regulatory and other factors, some of which are beyond our control. If our business does not generate sufficient cash flows from operations to enable us to meet our obligations under our indebtedness, we will be forced to take actions such as reducing or delaying business activities, including dividend payments and share repurchases,
acquisitions, investments and/or capital expenditures, selling assets, restructuring or refinancing our indebtedness or seeking additional equity capital. We may not be able to effect any of these remedies on satisfactory terms or at all, which could have a material adverse effect on our business, financial condition, results of operations and cash flows.
Legal and Regulatory Risks
Our
We do business in Canada and Australia, whose political and regulatory environments and compliance regimes differ from those in the U.S.
A significant portion of our revenue is attributable to operations in Canada and Australia. These activities accounted for 98% of our consolidated revenue in the year ended December 31, 2023. Risks associated with our operations in Canada and Australia include, but are not limited to, (i) different taxing regimes; (ii) changing political conditions at the federal, provincial or state level; (iii) changing international and U.S. monetary policies; and (iv) regional economic downturns.
The regulatory regimes in these countries are substantially different than those in the U.S. and may be unfamiliar to U.S. investors. Violations of non-U.S. laws could result in monetary and criminal penalties against us or our subsidiaries and could damage our reputation and, therefore, our ability to do business.
We are subject to extensive and costly environmental laws and regulations that may require us to take actions that will adversely affect our results of operations.
All of our operations are significantly affected by stringent and complex foreign, federal, provincial, state and local laws and regulations governing the discharge of substances into the environment or otherwise relating to environmental protection. We could be
negatively impacted by security threats, including cybersecurity threatsexposed to liabilities for cleanup costs, natural resource damages and other
disruptions.We face various security threats, including cybersecurity threats to gain unauthorized access to sensitive information or to render data or systems unusable; threats to the safetydamages as a result of our employees; threatsconduct that was lawful at the time it occurred or the conduct of, or conditions caused by, prior operators or other third-parties. There is inherent risk of environmental costs and liabilities in our business as a result of historical industry operations and waste disposal practices, which include air emissions and waste water discharges as well as our handling of petroleum hydrocarbons related to our operations. Certain environmental statutes impose joint and several strict liability for these costs. For example, an accidental release by us in the securityperformance of services at one of our facilitiesor our customers’ sites could subject us to substantial liabilities arising from environmental cleanup, restoration costs and infrastructurenatural resource damages, claims made by neighboring landowners and other third parties for personal injury and property damage and fines or third-party facilities and infrastructure; and threats from terrorist acts. Although we utilize various procedures and controlspenalties for related violations of environmental laws or regulations. We may not be able to monitor these threats and mitigate our exposure to such threats, there can be no assurance that these procedures and controls will be sufficient in preventing security threats from materializing. Ifrecover some or any of these events werecosts from insurance.
Environmental laws and regulations are subject to materialize, theychange in the future, possibly resulting in more stringent requirements. The implementation of new laws and regulations could leadresult in materially increased costs, stricter standards and enforcement, increased reporting obligations, larger fines and liability and increased capital expenditures and operating costs, particularly for our customers, and could have an adverse effect on our business or demand for our services. See Item 1. “Business - Government Regulation” of this annual report for a more detailed description of our risks associated with environmental laws and regulations. It should also be noted that scientists have concluded that increasing concentrations of greenhouse gases (GHG) in the earth’s atmosphere may produce climate changes that have significant physical effects, such as increased frequency and severity of storms, droughts, and floods and other climatic events.
Any failure by us to lossescomply with applicable environmental laws and regulations may result in governmental authorities taking actions against our business that could adversely impact our business and results of sensitive information, critical infrastructure, personneloperations, including the issuance of administrative, civil and criminal penalties; denial or capabilities essentialrevocation of permits or other authorizations; reduction or cessation of operations; and performance of site investigatory, remedial or other corrective actions.
We may be exposed to certain regulatory and financial risks related to climate change and other ESG-related matters.
Climate change and other ESG-related matters are receiving increasing attention from the media, scientists and legislators alike, which has resulted in legislative, regulatory and other initiatives, including international agreements, to reduce greenhouse gas emissions, such as carbon dioxide and methane, and proposed regulations to increase climate change reporting obligations. Significant focus is being made on companies that are active producers of fossil fuels, or companies which serve such producers.
Efforts have been made and continue to be made in the international community toward the adoption of international treaties or protocols that would address global climate change issues and impose reductions of hydrocarbon-based fuels. There are a number of legislative and regulatory proposals to address greenhouse gas emissions, including increased fuel efficiency standards, carbon taxes or cap and trade systems, restrictive permitting, and incentives for renewable energy, which are in various phases of discussion or implementation. Moreover, such legislation, regulations and proposals are subject to frequent
change by regulatory authorities. The outcome of Canadian, Australian and U.S. federal, regional, provincial and state actions to address global climate change could result in a variety of regulatory programs including potential new regulations, additional charges to fund energy efficiency activities, or other regulatory actions. These actions could both (i) directly impact us due to increased costs associated with our operations, and (ii) indirectly impact us due to increased costs of and/or reduced demand for our customers' operations, and resulting reduced demand for our services.
Any adoption of these or similar proposals by Canadian, Australian or U.S. federal, regional, provincial, state or local governments mandating a substantial reduction in greenhouse gas emissions could have far-reaching and significant impacts on the energy industry, including negatively impacting the price of oil relative to other energy sources, reducing demand for hydrocarbons and other minerals or limiting drilling or mining in the areas in which we operate. Although it is not possible at this time to predict how legislation or new regulations that may be adopted to address greenhouse gas emissions would impact our business, any such future laws and regulations could result in increased compliance costs or additional operating restrictions, and could have a material adverse effect on our reputation, financial position, resultsbusiness or demand for our services.
In addition, there have also been efforts in recent years to influence the investment community, including investment advisors and certain sovereign wealth, pension and endowment funds promoting divestment of
fossil fuel equities and pressuring lenders to limit funding to companies engaged in the extraction of fossil fuel reserves. Such environmental activism and initiatives aimed at limiting climate change and reducing air pollution could interfere with our business activities, operations
or cash flows. Cybersecurity attacks in particular are evolving and
include, but are not limitedability to
malicious software, attempts to gain unauthorized access
to datacapital and
other electronic security breaches that could lead to disruptions in critical systems, unauthorized release of confidential or otherwise protected information and corruption of data.Risks Related to the Noralta Acquisition
There can be no assurance when or even if the Noralta Acquisition will be completed. Failure to obtain required approvals necessary to satisfy closing conditions may delay or prevent completionassess acquisitions. Furthermore, members of the Noralta Acquisition.
The completioninvestment community, as well as political advocacy groups, are increasing their focus on ESG practices and disclosures by public companies, and concerns over climate change have resulted in, and are expected to continue to result in, the adoption of regulatory requirements for climate-related disclosures. As a result, we may continue to face increasing pressure regarding our ESG disclosures and practices, and mandatory reporting obligations could increase our compliance burden and costs. We publish an annual ESG Report, which outlines our progress and ongoing efforts to advance our ESG initiatives. Our disclosures on these matters rely on management’s expectations as of the Noralta Acquisition is subject to a number of closing conditions, some of whichdate the statements are out of our control, including the following:
| ● | the share issuance proposal being approved by our shareholders; |
| | |
| ●
| the accuracy of the representations and warranties of the parties at and as of the closing of the Noralta Acquisition (subject to certain materiality qualifiers);
|
| ●
| the performance in all material respects of each party’s obligations under the Purchase Agreement required to be performed by it onfirst made, as well as standards for measuring progress that are still in development, and may change or prior to the closing date of the Noralta Acquisition;
|
| ●
| the absence of a Material Adverse Effect (as defined in the Purchase Agreement) on either party; and
|
| ●
| the receipt of Canadian regulatory approvals and clearances, including under the Competition Act (Canada) and the Investment Canada Act, and other regulatory and third party consents.
|
We cannot be certain that our shareholders will approve the share issuance proposal. We have received notice from the Competition Bureau that it does not intend to challenge the acquisition under the Competition Act (Canada), and we have been granted approval under the Investment Canada Act for the acquisition. However, we cannot be certain when we and Noralta will be able to satisfy the other closing conditions or whether those closing conditions will be satisfied. If any of these conditions are not satisfied or waived prior to May 31, 2018, it is possible that the Purchase Agreement may be terminated. Although we and Noralta have agreed in the Purchase Agreement to use commercially reasonable efforts, subject to certain limitations, to complete the Noralta Acquisition as promptly as possible, these and other conditions to the completion of the Noralta Acquisition may fail to be satisfied.
The pendency of the Noralta Acquisition could have an adverse effect on the trading price of realized. These expectations and standards may continue to evolve. If our common sharesESG disclosures and our business, financial condition, results of operations or business prospects.
The pendency of the Noralta Acquisition could disrupt our business in the following ways, including:
| ● | third parties may seek to terminate or renegotiate their relationships with us, or may delay or defer certain business decisions, as a result of the Noralta Acquisition, whether pursuant to the terms of their existing agreements with us or otherwise; |
| | |
| ●
| the attention of our management may be directed toward completion of the Noralta Acquisition and related matters and may be diverted from the day-to-day business operations of their respective companies, including from other opportunities that otherwise might be beneficial to us;
|
| ●
| employee retention and recruitment may be challenging before the completion of the Noralta Acquisition, as employees and prospective employees may experience uncertainty about their future roles; and
|
| ●
| the Purchase Agreement restricts us from taking certain specified actions while the Noralta Acquisition is pending without first obtaining written consent of Noralta, which may restrict us from pursuing otherwise attractive business opportunities and making other changes to our business before completion of the Noralta Acquisition or termination of the Purchase Agreement.
|
Should they occur, any of these matters could adversely affect the trading price of our common shares or harm our financial condition, results of operations or business prospects.
The rights of holders of our common shares will be subordinate to the rights of the holders of our preferred shares.
The holders of the preferred shares issued in the Noralta Acquisition will have rights and preferences superior to those of the holders of our common shares. These rights include, among others:
| ● | the right to receive a liquidation preference prior to any distribution of our assets to the holders of our common shares; |
| | |
| ●
| the right to receive a 2% annual dividend, paid quarterly in cash or, at our option, by increasing the shares’ liquidation preference, or any combination thereof; and
|
| ●
| the right to convert the preferred shares into common shares after two years from the closing of the Noralta Acquisition at an initial conversion price of US$3.30 per common share, which may not be the fair market value of such shares at the time of conversion.
|
The Noralta Acquisition may be completed even though material adverse changes subsequent to the announcement of the Noralta Acquisition, such as industry-wide changespractices do not meet regulatory, investor or other events, may occur.
In general, either party can refuse to complete the Noralta Acquisition if there is a material adverse change affecting the other party. However, some types of changes do not permit either party to refuse to complete the Noralta Acquisition, even if such changes would have a material adverse effect on either of the parties. For example, a worsening of Noralta’s or our financial condition or results of operations due to a decrease in commodity prices or general economic conditions would not give the other party the right to refuse to complete the Noralta Acquisition. If adverse changes occur that affect either party but the parties are still required to complete the Noralta Acquisition, our share price, businessstakeholder expectations and financial results after the Noralta Acquisition may suffer.
Failure to complete the Noralta Acquisition could negatively impact our share price and future business and financial results.
If the Noralta Acquisition is not completed, our ongoing business may be adversely affected, and we may be subject to several risks, including the following:
| ● | having to pay certain costs relating to the Noralta Acquisition, such as legal, accounting, financial advisor and other fees and expenses;
|
| | |
| ●
| a potential decline in the price of our common shares to the extent that the current market price reflects a market assumption that the Noralta Acquisition will be completed;
|
| ●
| reputational harm due to the adverse perception of any failure to successfully complete the Noralta Acquisition; and
|
| ●
| having had the focus of our management on the Noralta Acquisition instead of on pursuing other opportunities that could have been beneficial to the company.
|
We have incurred and willstandards, which continue to incur significant transaction costs in connection with the Noralta Acquisition.
We expect to incur a number of non-recurring transaction-related costs associated with completing the Noralta Acquisition, combining the operations of the two organizations and achieving desired synergies. These fees and costs will be substantial. Non-recurring transaction costs include, but are not limited to, fees paid to financial, legal and accounting advisors, filing fees and printing costs. Additional unanticipated costs may be incurred in the integration of our businesses. There can be no assurance that the elimination of certain duplicative costs, as well as the realization of other efficiencies related to the integration of the two businesses, will offset the incremental transaction-related costs over time.
The failure to integrate our business successfully with Noralta in the expected timeframe would adversely affect our future results following the completion of the Noralta Acquisition.
The success of the Noralta Acquisition will depend, in large part, on our ability following the completion of the Noralta Acquisition to realize the anticipated benefits, including operating synergies, from combining our businesses, which have previously been operated independently. To realize these anticipated benefits, we must successfully integrate Noralta into our business. This integration will be complex and time-consuming, and we and Noralta will only be able to conduct limited planning regarding the integration of the two companies prior to completion of the Noralta Acquisition. Significant management attention and resources will be required to integrate the two companies. Delays in this process could adversely affect our business, financial results, financial condition and share price following the Noralta Acquisition.
Potential difficulties that may be encountered in the integration process include the following:
| ● | complexities associated with managing the larger, combined business; |
| | |
| ●
| integrating personnel from the two companies;
|
| ●
| potential unknown liabilities and unforeseen expenses, delays or regulatory conditions associated with the Noralta Acquisition; and
|
| ●
| performance shortfalls at one or both of the companies as a result of the diversion of management’s attention caused by completing the Noralta Acquisition and integrating the companies’ operations.
|
Even if we were able to integrate the business operations successfully, there can be no assurance that this integration will result in the realization of the full benefits of synergies and operational efficiencies that may be possible from this integration and that these benefits will be achieved within a reasonable period of time.
The trading price of our common shares after the Noralta Acquisition may be affected by factors different from those affecting the price of our common shares before the Noralta Acquisition.
Our results of operations, as well as the trading price of our common shares, after the Noralta Acquisition may be affected by factors different from those currently affecting our results of operations and the trading price of our common shares. These factors include:
| ● | a greater number of common shares outstanding as compared to the number of currently outstanding common shares; |
| | |
| ●
| different shareholders; and
|
| ●
| different assets and capital structure.
|
Accordingly, the historical trading prices and our financial results may not be indicative of future trading prices of the common shares after the Noralta Acquisition.
Our future results will suffer if we do not effectively manage our expanded operations following the Noralta Acquisition.
Following the Noralta Acquisition, the size of our business will be larger than its current business. Our future success depends, in part, upon our ability to manage this expanded business, which will pose substantial challenges for our management, including challenges related to the management and monitoring of new operations and associated increased costs and complexity. We can offer no assurance that we will be successful or will realize the benefits currently anticipated to result from the Noralta Acquisition.
The loss of key personnel could have a material adverse effect on our business, financial condition or results of operations.
The success of the Noralta Acquisition will depend in part on our ability to retain key Civeo and Noralta employees who continue employment with us after the Noralta Acquisition is completed. It is possible that these employees might decide not to remain with us after the Noralta Acquisition.
If these key employees terminate their employment, our activities might be adversely affected, management’s attention might be diverted from successfully integrating Noralta’s operations to recruiting suitable replacements and our business, financial condition or results of operations could be adversely affected. In addition, we might not be able to locate suitable replacements for any such key employees who leave the company or offer employment to potential replacements on reasonable terms.
Our success will also depend on pre-existing relationships with third parties, which relationships may be affected by the Noralta Acquisition. Any adverse changes in these relationships could adversely affect our business, financial condition or results of operations.
Our success will be dependent on the ability to maintain and renew relationships with pre-existing third parties, including local Aboriginal groups. For example, Noralta currently has two significant contracts for the provision of accommodation services. One of such contracts extends through April 2022, and the second contract has a primary term through 2027, with early termination by the customer permitted starting in 2021. Following the Noralta Acquisition, we will be subject to the risks, among others, of early termination of the contracts, failure to extend the contracts beyond their primary term and a decrease in demand under the contracts below our expectations. In addition, the revenue we will derive under the contracts following the Noralta Acquisition will be variable and depend on the utilization by the customers of our services under the contracts and other factors that are beyond our control. There can be no assurance that our business will be able to maintain these contracts or other pre-existing business and other relationships, including with local Aboriginal groups, or enter into or maintain other new business relationships, on acceptable terms, if at all. The failure to maintain these contracts and other important pre-existing third party relationshipsevolve, it could have a material adverse effect on our business or demand for our services. At the same time, some stakeholders and regulators have increasingly expressed or pursued opposing views, legislation, and investment expectations with respect to ESG, including the enactment or proposal of “anti-ESG” legislation or policies. By publishing our annual ESG Report, our business may also face increased scrutiny related to ESG activities and be unable to satisfy all stakeholders. Additionally, members of the investment community may screen our ESG disclosures and performance before investing in our common shares.
See Item 1. “Business - Government Regulation” of this annual report for a more detailed description of our climate-change related risks.
Risks Related to Our Common Shares
The market price and trading volume of our common shares may be volatile.
The market price of our common shares has historically experienced and may continue to experience volatility. For example, during 2023, the market price of our common shares ranged from a low of $17.87 per share to a high of $36.88 per share. The market price of our common shares may be influenced by many factors, some of which are beyond our control, including those described above and the following:
•changes in financial conditionestimates by analysts and our inability to meet those financial estimates;
•strategic actions by us or our competitors;
•announcements by us or our competitors of significant contracts, acquisitions, joint marketing relationships, joint ventures or capital commitments;
•variations in our quarterly operating results and those of our competitors;
•general economic and stock market conditions;
•risks related to our business and our industry, including those discussed above;
•changes in conditions or trends in our industry, markets or customers;
•geopolitical events or terrorist acts, including cybersecurity threats;
•trading volume of our common shares;
•the majority of our common shares being held by a few shareholders;
•our policy on share repurchases and dividend payments;
•future sales of our common shares or other securities by us, members of our management team or our existing shareholders; and
•investor perceptions of the investment opportunity associated with our industry or common shares relative to other investment alternatives.
These factors may materially reduce the market price of our common shares, regardless of our operating performance. In addition, our average daily trading volume on the New York Stock Exchange has historically been low, which may result in greater price volatility.
In addition, in recent years the stock market has experienced substantial price and volume fluctuations. This volatility has had a significant effect on the market prices of securities issued by many companies for reasons potentially unrelated to their operating performance. For example, our share price may experience substantial volatility due to uncertainty regarding commodity prices. These market fluctuations, regardless of the cause, may materially and adversely affect our share price, regardless of our operating results. Price volatility may cause the average price at which we repurchase our common shares (see Note 17 – Share Repurchase Programs and Dividends for a discussion of repurchases of our common shares) in a given period to exceed the share price at a given point in time. In addition, stock market volatility may impact our ability to access the capital markets in the future on acceptable terms or at all. Furthermore, the trading market for our common shares is influenced by the research and reports that industry or securities analysts publish about us or our business. If one or more of these analysts cease coverage of our company or fail to publish reports on us regularly, we could lose visibility in the financial markets, which in turn could cause our share price or trading volume to decline.
The payment of dividends and repurchases of our common shares are each within the discretion of our Board of Directors, and there is no guarantee that we will pay any dividends or repurchase common shares in the future or at levels anticipated by our shareholders.
The amount and timing of all future payments of dividends or repurchases of common shares pursuant to our share repurchase program, if any, are each subject to the discretion of the Board of Directors (Board) and will depend upon business conditions, results of operations,
afterfinancial condition and other factors. Our Board may, without advance notice, discontinue the
Noralta Acquisition.payment of dividends or suspend or terminate our share repurchase program. There can be no assurance that we will make dividend payments or repurchase our common shares in the future. The payment of dividends on our common shares or repurchase of shares under our share repurchase program could diminish our cash reserves, which may impact our ability to finance future growth and to pursue possible future strategic growth projects. In addition, any elimination of, or downward revision in, our dividend policy or our share repurchase program could have an adverse effect on the market price of our common shares. While the U.S. has imposed an excise tax on U.S. domestic corporations repurchasing stock, our share repurchase program is not currently subject to this tax. A similar 2% tax has been imposed in Canada, effective January 1, 2024, which applies to us and may impact the tax efficiency of our share repurchase program.
We are governed by the corporate laws in British Columbia, Canada which in some cases have a different effect on shareholders than the corporate laws in Delaware, U.S.
There are material differences between the Business Corporations Act (British Columbia) (BCBCA) as compared to the Delaware General Corporation Law (DGCL). Some of these material differences include the following: (i) for material corporate transactions (such as amalgamations, arrangements, the sale of all or substantially all of our undertaking, and other extraordinary corporate transactions), the BCBCA, subject to the provisions of our articles, generally requires two-thirds majority vote by shareholders, whereas DGCL generally only requires a majority vote of shareholders for similar material corporate transactions; and (ii) under the BCBCA, a holder of 5% or more of our common shares can requisition a general meeting of shareholders for the purpose of transacting any business that may be transacted at a general meeting, whereas the DGCL does not give this right. We cannot predict if investors will find our common shares less attractive because of these material differences. If some investors find our common shares less attractive as a result, there may be a less active trading market for our common shares and our share price may be more volatile.
Provisions contained in our articles and applicable Canadian and British Columbia laws could discourage a take-over attempt, which may reduce or eliminate the likelihood of a change of control transaction and, therefore, the ability of our shareholders to sell their shares for a premium.
Provisions contained in our articles provide for a classified Board, limitations on the removal of directors, limitations on shareholder proposals at meetings of shareholders and limitations on shareholder action by written consent, which could make it more difficult for a third-party to acquire control of us. Our articles, subject to the corporate law of British Columbia, also authorize our Board to issue series of preferred shares without shareholder approval. If our Board elects to issue preferred
shares, it could increase the difficulty for a third-party to acquire us, which may reduce or eliminate our shareholders’ ability to sell their common shares at a premium. In addition, in Canada, we may become subject to applicable securities laws, including National Instrument 62-104 Take-Over Bids and Issuer Bids of the Canadian Securities Administrators, which provide a heightened threshold for shareholder acceptance of third-party acquisition offers and could discourage take-over attempts that could result in a premium over the market price for our common shares.
As a British Columbia company, we may be subject to additional Canadian laws and regulations. The application of additional Canadian laws and regulations could make it more difficult for third parties to acquire control of us. For example, such laws and regulations may, depending on the circumstances, result in regulatory reviews of and may require regulatory approval for any proposed take-over attempts.
Any of the foregoing could prevent or delay a change of control and may deprive or limit strategic opportunities for our shareholders to sell their common shares and/or affect the market price of our common shares.
The enforcement of civil liabilities against Civeo may be more difficult.
Civeo is a British Columbia company and a substantial portion of our assets are located outside the U.S. As a result, investors could experience more difficulty enforcing judgments obtained against us in U.S. courts than would be the case for U.S. judgments obtained against a U.S. company. In addition, some claims may be more difficult to bring against Civeo in Canadian courts than it would be to bring similar claims against a U.S. company in a U.S. court.
Risks Related to
the Redomicile TransactionOur Structure
We are subject to various Canadian,
Australian and other
taxes as a result of the Redomicile Transaction.While we expect the Redomicile Transaction will enable us to take advantage of lower Canadian tax rates in the years after the year of implementation to a greater extent than would likely have been available if the Redomicile Transaction was not completed, these benefits may not be achieved. In particular, tax authorities may challenge our application and/or interpretation of relevant tax laws, regulations or treaties, valuations and methodologies or other supporting documentation, and, if they are successful in doing so, we may not experience the level of benefits we anticipate or we may be subject to adverse tax consequences. Even if we are successful in maintaining our tax positions, we may incur significant expense in contesting these positions or other claims made by tax authorities. In addition, changes in tax laws or increased rates of tax could have the effect of negatively impacting our anticipated effective tax rates. taxes.
Our effective tax rates
(including our Canadian and
the benefits described hereinAustralian tax rate) are
also subject todependent on a variety of
other factors, many of which are beyond our ability to control, such as changes in the rate of economic growth in
Canada, the financial performance of our businessjurisdictions in
various jurisdictions,which we operate, currency exchange rate fluctuations (especially
as between Canadian
and U.S. dollars and Australian and U.S. dollars), and significant changes in trade, monetary or fiscal policies of Canada
and Australia, including changes in interest rates, withholding taxes, tax treaties and federal and provincial tax rates generally. The impact of these factors, individually and in the aggregate, is difficult to predict, in part because the occurrence
of any number of the events or circumstances described in such factors may be (and, in fact, often seem to be) interrelated, and the impact to us of the occurrence of any one of these events or circumstances could be compounded or, alternatively, reduced, offset, or more than offset, by the occurrence of one or more of the other events or circumstances described in such factors.
More specifically, Canada’sCanada’s tax rules under the Income Tax Act (Canada) (the Canadian Tax Act) allow for favorable tax treatment insofar asrelated to the repatriation of certain dividends from foreign affiliates. If it becomes necessary or desirable to repatriate earnings from subsidiaries, repatriating earnings could, in certain circumstances, give rise to the imposition of potentially significant withholding taxes by the jurisdictions in which such amounts were earned, without our receiving the benefit of any offsetting tax credits, which could adversely impact our effective tax rate and cash flows. These tax rules are complicated and could change over time. Any such changes could have a material impact on our overall tax rate.
Canada has also introduced tax rules governing “foreign affiliate dumping” in the Canadian Tax Act that can have adverse tax consequences
in respect of non-Canadian business activities and investments for Canadian corporations that are controlled by non-Canadian
corporations in respect of non-Canadian business activities and investments.corporations. These rules would have a negative impact on us to the extent that we became controlled by a non-Canadian resident corporation.
The Canada Revenue Agency (CRA) may disagree with our conclusions on tax treatment and the CRA has not provided (and we have not requested) a ruling on the Canadian tax aspects of the Redomicile Transaction.
Based on the current provisions of the Canadian Tax Act, we expect that the Redomicile Transaction will not result in any material Canadian federal income tax liability to us. However, if the CRA disagrees with this view, it may take the position that material Canadian federal income tax liabilities or amounts on account thereof are payable by us as a result of the Redomicile Transaction, in which case, we expect that we would contest such assessment. To contest such assessment, we would be required to remit cash equal to half of the amount in dispute, or provide security acceptable to the CRA, to prevent the CRA from seeking enforcement actions pending the dispute of such assessment. If we were unsuccessful in disputing the assessment, the implications could be materially adverse to us. The CRA has not provided (and we have not requested) a ruling on the Canadian tax aspects of the Redomicile Transaction. There can be no assurance that the CRA will agree with our interpretation of the tax aspects of the Redomicile Transaction or any related matters associated therewith.
The Internal Revenue Service (IRS) may not agree with the conclusion that we should be treated as a foreign corporation for U.S. federal tax purposes, and no ruling has been sought from the IRS.
For U.S. federal income tax purposes, a corporation generally is considered a tax resident in the jurisdiction of its organization or incorporation. Because we are a British Columbia incorporated entity, we generally will be classified as a foreign corporation (and, therefore, a non-U.S. tax resident) under U.S. federal income tax law. Even so, the IRS may assert that we should be treated as a U.S. corporation (and, therefore, a U.S. tax resident) for U.S. federal income tax purposes pursuant to Section 7874 of the Internal Revenue Code.
Under Section 7874 of the Internal Revenue Code, if the former stockholders of Civeo US hold 80% or more of the vote or value of our common shares by reason of holding stock in Civeo US (the ownership test), and our expanded affiliated group after the Redomicile Transaction does not have substantial business activities in Canada relative to its worldwide activities (the substantial business activities test), we would be treated as a U.S. corporation. For this purpose, “substantial business activities” generally requires at least 25% of the employees (by number and compensation), assets and gross income of our expanded affiliated group to be based, located and derived, respectively, in Canada (25% test).
We believe that we have satisfied this 25% test because Civeo US had significant operations in Canada prior to the Redomicile Transaction (with its remaining operations occurring in Australia and the United States), and we have continued these operations following the Redomicile Transaction. Therefore, under current U.S. federal income tax law, we believe that we will not be treated as a U.S. corporation for U.S. federal income tax purposes. If it were determined, however, that we should be taxed as a U.S. corporation for U.S. federal income tax purposes, we could be liable for substantial additional U.S. federal income taxes.
Future potential changes to U.S. tax laws could result in Civeo being treated as a U.S. corporation for U.S. federal income tax purposes.
Under current U.S. federal income tax law, Civeo is generally treated as a foreign corporation for U.S. federal income tax purposes. Changes to Section 7874 of the Internal Revenue Code or the U.S. Treasury regulations promulgated thereunder or official interpretations thereof, could adversely affect Civeo’s status as a foreign corporation for U.S. federal income tax purposes. For example, members of Congress from time to time have proposed changes to the Internal Revenue Code, and the U.S. Treasury has taken and may continue to take regulatory action, in connection with so-called inversion transactions. The timing and substance of any such change in law or regulatory action is uncertain. Any such change of law or regulatory action could adversely impact the treatment of Civeo as a foreign corporation for U.S. federal income tax purposes and could adversely impact its tax position and financial position and results in a material manner. The precise scope and application of any legislative or regulatory proposals will not be clear until they are actually issued, and, accordingly, until such legislation or regulations are issued and fully understood, we cannot be certain as to their potential impact. Any such changes could apply retroactively to a date prior to the date of the Redomicile Transaction. If Civeo were to be treated as a U.S. corporation for U.S. federal income tax purposes, it could be subject to substantially greater U.S. federal income tax liability.
We remain subject to changes in tax law (in various jurisdictions) and other factors that may not allow us to achieve a lower effective corporate tax rate.
While we believe that the Redomicile Transaction should allow for a lower effective corporate tax rate, we cannot give any assurance as to whatcould impact our effective tax rate will be after the Redomicile Transaction because of, among other things, the tax policies of the jurisdictions where we operate, primarily Canada and Australia. Also, therate.
The tax laws of Canada, Australia and other jurisdictionsthe U.S. could change in the future, and such changes could cause a material change in our effective corporate tax rate. As a result, our actualrealized effective tax rate may be materially different from our current expectation. Our provision for income taxes will be based on certain estimates and assumptions made by management in consultation with our tax and other advisors. Our consolidated income tax rate will be affected by the amount of net income earned in Canada and our other operating jurisdictions, the availability of benefits under tax treaties, and the rates of taxes payable in respect of that income. We will enter into many transactions and arrangements in the ordinary course of business in respect of which the tax treatment is not entirely certain. We will therefore make estimates and judgments based on our knowledge and understanding of applicable tax laws and tax treaties, and the application of those tax laws and tax treaties to our business, in determining our consolidated tax provision. The final outcome of any audits by taxation authorities may differ from
the estimates and assumptions we may use in determining our consolidated tax provisions and accruals. This could result in a material adverse effect on our consolidated income tax provision, financial condition and the net income for the period in which such determinations are made.
Our tax position may be adversely affected by changes in tax law relating to multinational corporations, or increased scrutiny by tax authorities.
Recent legislative proposals have aimed to expand the scope of U.S. corporate tax residence, to limit the ability of foreign-owned corporations to deduct interest expense, and to make other changes in the taxation of multinational corporations.
Additionally, the
The U.S. Congress, government agencies in non-U.S. jurisdictions where we and our affiliates do business, and the Organization for Economic Co-operation and Development
(the “OECD”) have recently focused on issues related to the taxation of multinational corporations.
OneFor example,
is found in the
areaOECD has proposed a two-pillar plan to reform international taxation, with proposals to ensure a fairer distribution of
“base erosionprofits among countries and
profit shifting”, where profits are claimed to
be earned forimpose a floor on tax
purposes in low-tax jurisdictions, or payments are made between affiliates fromcompetition through the introduction of a
jurisdiction with high tax rates to a jurisdiction with lower tax rates.global minimum tax. As a result, the tax laws in the U.S. and other countries in which we and our affiliates do business could change on a prospective or retroactive basis
(or both), and any such changes could materially adversely affect us.
Moreover,Future potential changes to U.S. and international tax authorities may carefully scrutinize companies thatlaws could result in Civeo being treated as a U.S. corporation for U.S. federal income tax purposes.
Although we have
redomiciled, suchhistorically been regarded as
our company, which may lead such authoritiesa foreign corporation for U.S. federal income tax purposes, changes to
assert that we owe additional taxes.On December 22, 2017,Section 7874 of the Tax Cuts and Jobs ActInternal Revenue Code or the U.S. Treasury regulations promulgated thereunder, or official interpretations thereof, could adversely affect Civeo’s status as a foreign corporation for U.S. federal income tax purposes. For example, members of 2017 (U.S. Tax Reform) was signed into law, making significantCongress from time to time have proposed changes to the U.S. Internal Revenue Code. ChangesCode, and the U.S. Treasury has taken and may continue to take regulatory action, in connection with inversion transactions. The timing and substance of any such change in law or regulatory action is uncertain. Any such change of law or regulatory action could adversely impact the treatment of Civeo as a foreign corporation for U.S. federal income tax purposes and could adversely impact its tax position and financial position and results in a material manner. The precise scope and application of any legislative or regulatory proposals will not be clear until they are actually issued, and, accordingly, until such legislation or regulations are issued and fully understood, we cannot be certain as to their potential impact. If Civeo were to be treated as a U.S. corporation for U.S. federal income tax purposes, it could be subject to substantially greater U.S. federal income tax liability.
ITEM 1B. Unresolved Staff Comments
None.
ITEM 1C. Cybersecurity
Risk Management and Strategy
We recognize the importance of developing, implementing and maintaining robust cybersecurity measures to safeguard our information systems and protect the confidentiality, integrity and availability of our data. Our processes for assessing, identifying, and managing material risks from cybersecurity threats have been integrated into our overall risk management system and processes. Cybersecurity events are collected, evaluated and, when appropriate, escalated to the Chief Information Security Officer (CISO) for impact analysis utilizing the cybersecurity risk management policy.
Cybersecurity risks are monitored and evaluated by management through an internal compliance program with oversight by internal audit. We engage a variety of cybersecurity partners to perform penetration testing and quarterly audits on our cybersecurity profile. These partnerships enable us to leverage specialized knowledge and insights, and are meant to help our cybersecurity strategies and processes in remaining risk appropriate. In order to promote a company-wide culture of cybersecurity risk management, management has also implemented a variety of required programs to both test and train our employees on cybersecurity fundamentals, including both annual and ongoing information security awareness training.
Our cybersecurity policies and procedures encompass data privacy, incident response, information security and risks from our use of third-party vendors. In order to help develop these policies and procedures, we monitor the privacy and cybersecurity laws, regulations and guidance applicable to us in the regions where we do business, as well as proposed privacy and cybersecurity laws, regulations, guidance and emerging risks.
We also have conducted a cyber breach simulation exercise with the assistance of a third party cybersecurity consultant. The exercise focused on incident management and communication processes. Company business functions, executive management and members of the Board participated. The goal was to identify opportunities for greater efficiency, coordination, and alignment.
We face risks from various security threats, including cybersecurity threats to gain unauthorized access to sensitive information or to render data or systems unusable or hold them for ransom. Cybersecurity attacks in particular develop and evolve rapidly, including from emerging technologies, such as advanced forms of artificial intelligence. Such attacks include, but are not limited to,
a corporate tax rate decrease from 35%malicious software, attempts to
21% effective for tax years beginning after December 31, 2017, the transition of U.S. international taxation from a worldwide tax systemgain unauthorized access to
a territorial system, and a one-time transition tax on the mandatory deemed repatriation of cumulative foreign earnings as of December 31, 2017. Many aspects of the new legislation are unclear and may not be clarified for some time. As a result, we have made an estimate of the impact of the new laws on our business, operating results and financial condition. It is possible that the U.S. Tax Reform, or interpretations under it, could have an adverse effect on us, and such effect could be material.
We may be subject to additional Canadian and British Columbia laws and regulations as a result of the Redomicile Transaction.
Now that we are a British Columbia company, we may be subject to additional Canadian and British Columbia laws and regulations, which can increase compliance costs for us and result in delays in future transactions we propose to complete.
Risks Related to the Spin-Off from Oil States
Our tax sharing agreement with Oil States may require us to indemnify Oil States for significant tax liabilities.
In connection with our spin-off from Oil States International, Inc. (Oil States) in May 2014 (the Spin-Off), we entered into a tax sharing agreement. Under the tax sharing agreement, we are required to indemnify Oil States against certain tax-related liabilities incurred by Oil States (including any of its subsidiaries) relating to the Spin-off, to the extent caused by our breach of any representations or covenants made in the tax sharing agreement or the separation and distribution agreement, or made in connection with the private letter ruling or the tax opinion obtained with respect to the Spin-off. These liabilities include the substantial tax-related liability (calculated without regard to any net operating loss or other tax attribute of Oil States) that would result if the Spin-off of our stock to Oil States stockholders failed to qualify as a tax-free transaction. In addition, we have agreed to pay 50% of any taxes arising from the Spin-off to the extent that the tax is not attributable to the fault of either party.
We could have significant tax liabilities for periods during which our subsidiaries and operations were those of Oil States.
For any tax periods (or portion thereof) in which Oil States owned at least 80% of the total voting power and value of Civeo US’s common stock, our U.S. subsidiaries will be included in Oil States’ consolidated group for U.S. federal income tax purposes. In addition, one or more of our U.S. subsidiaries may be included in the combined, consolidated or unitary tax returns of Oil States or one or more of its subsidiaries for U.S. state or local income tax purposes. Under the tax sharing agreement, for each period in which we or any of our subsidiaries are consolidated or combined with Oil States for purposes of any tax return, and with respect to which such tax return has not yet been filed, Oil States will prepare a pro forma tax return for us as if we filed our own consolidated, combined or unitary return, except that such pro forma tax return will generally include current income, deductions, credits and losses from us (with certain exceptions), will not include any carryovers or carrybacks of losses or credits and will be calculated without regard to the federal Alternative Minimum Tax. We will reimburse Oil States for any taxes shown on the pro forma tax returns, and Oil States will reimburse us for any current losses or credits we recognize based on the pro forma tax returns. In addition, by virtue of Oil States’ controlling ownership and the tax sharing agreement, Oil States will effectively control all of our U.S. tax decisions in connection with any consolidated, combined or unitary income tax returns in which any of our subsidiaries are included. The tax sharing agreement provides that Oil States will have sole authority to respond to and conduct all tax proceedings (including tax audits) relating to us, to prepare and file all consolidated, combined or unitary income tax returns in which we are included on our behalf (including the making of any tax elections), and to determine the reimbursement amounts in connection with any pro forma tax returns. This arrangement may result in conflicts of interest between Oil States and us. For example, under the tax sharing agreement, Oil States will be able to choose to contest, compromise or settle any adjustment or deficiency proposed by the relevant taxing authority in a manner that may be beneficial to Oil States and detrimental to us; provided, however, that Oil States may not make any settlement that would materially increase our tax liability without our consent.
Moreover, notwithstanding the tax sharing agreement, U.S. federal law provides that each member of a consolidated group is liable for the group’s entire tax obligation. Thus, to the extent Oil States or other members of Oil States’ consolidated group fail to make any U.S. federal income tax payments required by law, one or more of our U.S. subsidiaries could be liable for the shortfall with respect to periods in which such subsidiary was a member of Oil States’ consolidated group. Similar principles may apply for foreign, state or local income tax purposes where we file combined, consolidated or unitary returns with Oil States or its subsidiaries for federal, foreign, state or local income tax purposes.
If there is a determination that the Spin-off is taxable for U.S. federal income tax purposes because the facts, assumptions, representations, or undertakings underlying the tax opinion are incorrect or for any other reason, then Oil States and its stockholders could incur significant income tax liabilities, and we could incur significant liabilities.
Oil States received a private letter ruling from the IRS and an opinion of its outside counsel regarding certain aspects of the Spin-off transaction. The private letter ruling and the opinion rely on certain facts, assumptions, representations and undertakings from Oil States and us regarding the past and future conduct of the companies’ respective businessesdata, ransomware attacks and other matters. If anyelectronic security breaches that could lead to disruptions in critical systems, unauthorized release of these facts, assumptions, representations, or undertakings are,denial of access to confidential or become, incorrectotherwise protected information and corruption of data. We have experienced, and expect to continue to confront, efforts by hackers and other third parties to gain unauthorized access or notdeny access to, or otherwise satisfied, Oil Statesdisrupt, our information systems and its stockholders may not be able to rely on the private letter ruling or the opinion of its tax advisor and could be subject to significant tax liabilities. In addition, an opinion of counsel is not binding upon the IRS, so, notwithstanding the opinion of Oil States’ tax advisor, the IRS could conclude upon audit that the Spin-off is taxable in full or in part if it disagrees with the conclusions in the opinion, or for other reasons,networks. Risks from cybersecurity threats, including as a result of any previous cybersecurity incidents, have not materially affected us, including our business strategy, results of operations, or financial condition, but we face certain significant changes inongoing risks from cybersecurity threats that, if realized, are reasonably likely to have such an affect. See Part I, Item 1A, “Risk Factors,” under the stock ownership of Oil States or us. If the Spin-off is determined to be taxable for U.S. federal income tax purposes for any reason, Oil States and/or its stockholders could incur significant income tax liabilities, and we could incur significant liabilities.
Third parties may seek to hold us responsible for liabilities of Oil States that we did not assume in our agreements.
Third parties may seek to hold us responsible for retained liabilities of Oil States. Under our agreements with Oil States, Oil States agreed to indemnify us for claims and losses relating to these retained liabilities. However, if those liabilities are significant and we are ultimately held liable for them, we cannot assure you that we will be able to recover the full amount of our losses from Oil States.
The Spin-Off may have exposed us to potential liabilities arising out of state and federal fraudulent conveyance laws and legal dividend requirements.
The Spin-off is subject to review under various state and federal fraudulent conveyance laws. Under these laws, if a court in a lawsuit by an unpaid creditor or an entity vested with the power of such creditor (including without limitation a trustee or debtor-in-possession in a bankruptcy by us or Oil States or any of our respective subsidiaries) were to determine that Oil States or any of its subsidiaries did not receive fair consideration or reasonably equivalent value for distributing shares of our common stock or taking other action as part of the Spin-Off, or that we or any of our subsidiaries did not receive fair consideration or reasonably equivalent value for incurring indebtedness, including the debt incurred by us in connection with the Spin-off, transferring assets or taking other action as part of the Spin-off and, at the time of such action, we, Oil States or any of our respective subsidiaries (i) was insolvent or would be rendered insolvent, (ii) had reasonably small capital with which to carry on its business and all business in which it intended to engage or (iii) intended to incur, or believed it would incur, debts beyond its ability to repay such debts as they would mature, then such court could void the Spin-off as a constructive fraudulent transfer. If such court made this determination, the court could impose a number of different remedies, including without limitation, voiding our liens and claims against Oil States, or providing Oil States with a claim for money damages against us in an amount equal to the difference between the consideration received by Oil States and the fair market value of our company at the time of the Spin-Off.
The measure of insolvency for purposes of the fraudulent conveyance laws will vary depending on which jurisdiction’s law is applied. Generally, however, an entity would be considered insolvent if the present fair saleable value of its assets is less than (i) the amount of its liabilities (including contingent liabilities) or (ii) the amount that will be required to pay its probable liabilities on its existing debts as they become absolute and mature. No assurance can be given as to what standard a court would apply to determine insolvency or that a court would determine that we, Oil States or any of our respective subsidiaries were solvent at the time of or after giving effect to the Spin-Off, including the distribution of shares of our common stock.
Under the separation and distribution agreement, Oil States is and we are responsible for the debts, liabilities and other obligations related to the business or businesses which Oil States and we, respectively, own and operate following the Spin-Off. Although we do not expect to be liable for any such obligations not expressly assumed by us pursuant to the separation and distribution agreement, it is possible that a court would disregard the allocation agreed to between the parties, and require that we assume responsibility for obligations allocated to Oil States, particularly if Oil States were to refuse or were unable to pay or perform the subject allocated obligations.
Risksheading “Risks Related to Our Common Shares
If we cannot meet the NYSE continued listing requirements, the NYSE may delist our common shares.
Our common shares are currently listed on the NYSE, and the continued listing of our common shares is subject to our compliance with a number of listing standards. If we fail to maintain compliance with these continued listing standards, our common shares may be delisted. A delisting of our common shares could negatively impact us by, among other things:
| ●
| reducing the liquidity and market price of our common shares;
|
| ●
| reducing the number of investors, including institutional investors, willing to hold or acquire our common shares, which could negatively impact our ability to raise equity;
|
| ●
| decreasing the amount of news and analyst coverage of us;
|
| ●
| limiting our ability to issue additional securities, obtain additional financing or pursue strategic restructuring, refinancing or other transactions; and
|
| ●
| impacting our reputation and, as a consequence, our ability to attract new business.
|
The market price and trading volume of our common shares may be volatile.
The market price of our common shares has historically experienced and may continue to experience volatility. For example, during 2016, the market price of our common shares ranged from a low of $0.75 per share to a high of $2.81 per share, and during 2017, the market price of our common shares ranged from a low of $1.57 per share to a high of $3.73 per share. From January 1, 2018 to February 19, 2018, the market price of our common shares has ranged between a low of $2.74 per share to a high of $3.81 per share. The market price of our common shares may be influenced by many factors, some of which are beyond our control, including those described above and the following:
| ● | changes in financial estimates by analysts and our inability to meet those financial estimates; |
| | |
| ● | strategic actions by us or our competitors; |
| | |
| ● | announcements by us or our competitors of significant contracts, acquisitions, joint marketing relationships, joint ventures or capital commitments; |
| | |
| ● | variations in our quarterly operating results and those of our competitors;
|
| | |
| ● | general economic and stock market conditions; |
| | |
| ● | risks related to our business and our industry, including those discussed above; |
| ● | changes in conditions or trends in our industry, markets or customers; |
| | |
| ●
| terrorist acts; |
| | |
| ● | future sales of our common shares or other securities by us, members of our management team or our existing shareholders; and |
| | |
| ● | investor perceptions of the investment opportunity associated with our common shares relative to other investment alternatives. |
These broad market and industry factors may materially reduce the market price of our common shares, regardless of our operating performance. In addition, price volatility may be greater if the public float and trading volume of our common shares is low.
Our financial position, cash flows, results of operations and share price could be materially adversely affected if commodity prices do not improve or decline further. In addition, in recent years the stock market has experienced substantial price and volume fluctuations. This volatility has had a significant effect on the market prices of securities issued by many companies for reasons potentially unrelated to their operating performance. Our share price may experience substantial volatility due to uncertainty regarding commodity prices. These market fluctuations, regardless of the cause, may materially and adversely affect our share price, regardless of our operating results.
If securities or industry analysts do not publish research or reports about our business, if they adversely change their recommendations regarding our common shares or if our operating results do not meet their expectations, our share price could decline.
The trading market for our common shares is influenced by the research and reports that industry or securities analysts publish about us or our business. If one or more of these analysts cease coverage of our company or fail to publish reports on us regularly, we could lose visibility in the financial markets, which in turn could cause our share price or trading volume to decline.
We cannot assure you that we will pay dividends in the future, and our indebtedness could limit our ability to pay dividends on our common shares.
We currently do not pay dividends. The declaration and amount of all dividends will be at the discretion of our board of directors and will depend upon many factors, including our financial condition, results of operations, cash flows, prospects, industry conditions, capital requirements of our business, covenants associated with certain debt obligations, legal requirements, regulatory constraints, industry practice and other factors the board of directors deems relevant. In addition, our ability to pay dividends on our common shares is limited by covenants in the Amended Credit Agreement. Future agreements may also limit our ability to pay dividends. If we elect to pay dividends in the future, the amount per share of our dividend payments may be changed, or dividends may again be suspended, without advance notice. The likelihood that dividends will be reduced or suspended is increased during periods of market weakness. See “Management’s Discussion and Analysis of Financial Condition and Results of Operations” in Item 7 of this annual report. There can be no assurance that we will pay a dividend in the future.
Provisions contained in our articles and applicable Canadian and British Columbia laws could discourage a take-over attempt, which may reduce or eliminate the likelihood of a change of control transaction and, therefore, the ability of our shareholders to sell their shares for a premium.
Provisions contained in our articles provide for a classified board of directors, limitations on the removal of directors, limitations on shareholder proposals at meetings of shareholders and limitations on shareholder action by written consent, which could make it more difficult for a third party to acquire control of us. Our articles, subject to the corporate law of British Columbia, also authorize our board of directors to issue series of preferred shares without shareholder approval. If our board of directors elects to issue preferred shares, it could increase the difficulty for a third party to acquire us, which may reduce or eliminate our shareholders’ ability to sell their common shares at a premium. In addition, in Canada, we may become subject to applicable securities laws, including National Instrument 62-104 Take-Over Bids and Issuer Bids of the Canadian Securities Administrators, which provide a heightened threshold for shareholder acceptance of third-party acquisition offers and could discourage take-over attempts that could result in a premium over the market price for our common shares.
As a British Columbia company, we may be subject to additional Canadian laws and regulations. The application of additional Canadian laws and regulations could make it more difficult for third parties to acquire control of us. For example, such laws and regulations may, depending on the circumstances, result in regulatory reviews of and may require regulatory approval for any proposed take-over attempts.
Any of the foregoing could prevent or delay a change of control and may deprive or limit strategic opportunities for our shareholders to sell their common shares and/or affect the market price of our common shares.
Operations - Our business could be negatively affected asimpacted by security threats, including cybersecurity threats and other disruptions” for more information regarding the risks we face.
As discussed in Part I, Item 1A, “Risk Factors,” under the heading “Financial/Accounting Risks – We may not have adequate insurance for potential liabilities and insurance may not cover certain liabilities,” we maintain cyber risk insurance to mitigate our exposure to these threats.
Governance
Risk oversight is a resultresponsibility of the actionsBoard. The Board has delegated responsibility for monitoring technology and cybersecurity risks to the Audit Committee. The Board reviews the Company's cybersecurity risk posture, strategy and execution on at least an annual basis while the Audit Committee receives cybersecurity updates quarterly.
The CISO and executive management play a pivotal role in informing the Audit Committee on cybersecurity risks. Executive management, including the CISO, regularly meets with the Audit Committee to discuss cybersecurity risks, review quarterly cyber metrics and oversee progress against our annual action plans. These briefings may encompass a broad range of
activist shareholders.Publicly traded companies have increasingly become subjecttopics, including:
•Current cybersecurity landscape and emerging threats;
•Status of ongoing cybersecurity initiatives and strategies;
•Incident reports and learnings from any cybersecurity events; and
•Compliance with regulatory requirements and industry standards.
In addition to campaigns by investors seeking to increase shareholder value by advocating corporate actions such as financial restructuring, increased borrowing, special dividends, share repurchasesour scheduled meetings, the Audit Committee and executive management maintain an ongoing dialogue regarding emerging or even salespotential cybersecurity risks.
Primary responsibility for assessing, monitoring and managing our cybersecurity risks rests with the CISO. Our CISO has cybersecurity expertise from over 18 years of assets or the entire company. It is possible activist shareholders may attempt to effect such changes or acquire control over us. Responding to proxy contests and other actions by such activist shareholders or othersexperience in the future would be costlyfield of cybersecurity. His background includes extensive experience as CISO at Civeo and time-consuming, disruptpreviously for a Fortune 500 company. He also oversees our operationscybersecurity governance programs, assists with testing our compliance with applicable standards, leads our efforts to remediate known risks and divertleads our employee training program.
The CISO is informed about the attentionlatest developments in cybersecurity, including potential threats and innovative risk management techniques. The CISO implements and oversees processes for the monitoring of our boardinformation systems. This includes the deployment of directorsadvanced security measures and seniorregular system audits to identify potential vulnerabilities. The Company deploys a Security Operations Center team who monitor and escalate cybersecurity events. In the event of a cybersecurity incident, the CISO is equipped with an incident response plan, which is intended to mitigate the impact of the incident and includes long-term strategies for remediation and prevention of future incidents.
The CISO regularly updates executive management
from the pursuit of business strategies, which could adversely affect our results of operationson cybersecurity risks and
financial condition. Additionally, perceived uncertainties as to our future direction as a result of shareholder activism or changesincidents. Significant cybersecurity matters and certain strategic risk management decisions are escalated to the
composition ofAudit Committee and the
board of directors may lead to the perception of a change in the direction of the business, instability or lack of continuity which may be exploited by our competitors, cause concern to our current or potential customers, and make it more difficult to attract and retain qualified personnel. If customers choose to delay, defer or reduce transactions with us or transact with our competitors instead of us because of any such issues, then our revenue, earnings and operating cash flows could be adversely affected.
We are governed by the corporate laws in British Columbia, Canada which in some cases have a different effect on shareholders than the corporate laws in Delaware, United States.
There are material differences between the Business Corporations Act (British Columbia) (BCBCA) as compared to the Delaware General Corporation Law (DGCL). For example, some of these material differences include the following: (a) for material corporate transactions (such as amalgamations, arrangements, the sale of all or substantially all of our undertaking, and other extraordinary corporate transactions) the BCBCA, subject to the provisions of our Articles, generally requires two-thirds majority vote by shareholders, whereas DGCL generally only requires a majority vote of shareholders for similar material corporate transactions; and (b) under the BCBCA a holder of 5% or more of our common shares can requisition a general meeting of shareholders for the purpose of transacting any business that may be transacted at a general meeting, whereas the DGCL does not give this right. We cannot predict if investors will find our common shares less attractive because of these material differences. If some investors find our common shares less attractive as a result, there may be a less active trading market for our common shares and our share price may be more volatile.
ITEM 1B. Unresolved Staff Comments
None.
Board.
ITEM2.Properties
ITEM 2. Properties
The following table presents information about our principal properties and facilities as of December 31, 2017.2023. Except as indicated, below, we own all of the properties or facilities listed below. Each of the properties is encumbered by our secured credit facilities. See Item 7, “Management’s“Management’s Discussion and Analysis of Financial Condition and Results of Operations”Operations” in Item 7 and Note 1011 – Debt to the notes to consolidated financial statements included in Item 8 of this annual report for additional information
concerning our credit facilities. For a discussion about how each of our business segments utilizes its respective properties,
please see Item 1, “Business” of this annual report.
| | | | | | | | | | | |
| Location | Approximate
Square
Footage/Acreage | | Approximate
Square
Footage/Acreage
| Description |
Canada: | | | | | |
Fort McMurray, Alberta (leased land) | | 240 acres | | Wapasu Creek and Henday Lodges Lodge |
Fort McMurray, Alberta (leased land) | 138 acres | | 135 acres
| Conklin Lodge
Fort McMurray Village |
Fort McMurray, Alberta (leased land) | 135 acres | | Conklin Lodge |
| Fort McMurray, Alberta (leased land) | 128 acres | | Beaver River and Athabasca Lodges |
| | | |
| Kitimat, British Columbia | 59 acres | | Sitka Lodge |
| Fort McMurray, Alberta (leased land and lodges) | 58 acres | | Hudson and Borealis Lodges |
| Acheson, Alberta (lease) | 40 acres | | Office and warehouse |
| Vanderhoof, British Columbia | 33 acres | | Storage yard |
| Fort McMurray, Alberta (leased land) | 30 acres | | 78 acres
| McClelland LakeGreywolf Lodge
|
Fort McMurray, Alberta (leased land) | 18 acres | | 43 acres
| Mariana LakeAnzac Lodge
|
Kitimat, British Columbia
| | 60 acres
| | Sitka Lodge
|
Acheson, Alberta (lease)
| | 40 acres
| | Office and warehouse
|
Edmonton, Alberta
| | 33 acres
| | Manufacturing facility
|
Grimshaw, Alberta (lease)
| | 20 acres
| | Equipment yard
|
Fort McMurray, Alberta (leased land)
| | 18 acres
| | Anzac Lodge
|
Edmonton, Alberta (lease) | 86,376 sq. feet | | 86,376
| Office and warehouse commercial production kitchen |
| Calgary, Alberta (lease) | 7,000 sq. feet | | | | Office |
Australia: | | | | | |
Coppabella, Queensland, Australia | 192 acres | | 192 acres
| Coppabella Village |
Calliope, Queensland, Australia
| | 124 acres
| | Calliope Village
|
Narrabri, New South Wales, Australia | | 82 acres | | Narrabri Village |
Boggabri, New South Wales, Australia | | 52 acres | | Boggabri Village |
Dysart, Queensland, Australia | | 50 acres | | Dysart Village |
Middlemount, Queensland, Australia | | 37 acres | | Middlemount Village |
Karratha, Western Australia, Australia (own(owned and lease) leased land) | | 34 acres | | Karratha Village |
Kambalda, Western Australia, Australia
| | 27 acres
| | Kambalda Village
|
Nebo, Queensland, Australia | | 26 acres | | Nebo Village |
Moranbah, Queensland, Australia | | 17 acres | | Moranbah Village |
Sydney, New South Wales, Australia (lease) | 11,518 sq. feet | | 17,276
| Office |
Perth, Western Australia, Australia (lease) | 6,921 sq. feet | | Office |
| Brisbane, Queensland, Australia (lease) | 5,543 sq. feet | | 4,478
| Office |
| U.S.: | | | | |
United States:
| | | | | |
Houston, Texas (lease) | 8,900 sq. feet | | 8,900
| Principal executive offices |
Sulphur, Louisiana | 44 acres | | Acadian Acres land only |
| Killdeer, North Dakota | 39 acres | | 39 acres
| Open camp
|
Pecos, Texas (lease)
| | 35 acres
| | Open camp
|
Dickinson, North Dakota (lease)
| | 26 acres
| | Mobile asset facility and yard
|
Vernal, Utah (lease)
| | 21 acres
| | Mobile asset facility and yard
|
Casper, Wyoming (lease)
| | 14 acres
| | Accommodations facility and yard
|
Belle Chasse, Louisiana
| | 10 acres
| | Manufacturing facility and yard
|
Big Piney, Wyoming (lease)
| | 7 acres
| | Mobile asset facility and yard
|
LaSalle, Colorado (lease)
| | 6 acres
| | Mobile asset facility and yard
|
Elreno, Oklahoma (lease)
| | 12 acres
| | Mobile asset facility and yard
|
Wright, Wyoming (lease)
| | 5 acres
| | Mobile asset facility and yard
Killdeer Lodge |
Longmont, Colorado (lease)
| | 4,377
| | Office
|
We also own various undeveloped properties in British Columbia.We also have various offices supporting our business segments which are both owned and leased.
We believe that our leases are at competitive or market rates and do not anticipate any difficulty in leasing additional suitable space upon expiration of our current lease terms.
Leased land for our lodge properties in Canada refers to land leased from the Alberta government. We also lease land for our Karratha
Village from the provincialstate government in Australia. Generally, ourthese leases have an initial term of ten years and are scheduled to expire between 20232024 and 2027.ITEM3. 2030.
We are a party to various pending or threatened claims, lawsuits and administrative proceedings seeking damages or other remedies concerning our commercial operations, products, employees and other matters, including occasional claims by individuals alleging exposure to hazardous materials as a result of our products or operations. Some of these claims relate to matters occurring prior to our acquisition of businesses, and some relate to businesses we have sold. In certain cases, we are entitled to indemnification from the sellers of businesses, and in other cases, we have indemnified the buyers of businesses from us. Although we can give no assurance about the outcome of pending legal and administrative proceedings and the effect such outcomes may have on us, we believe that any ultimate liability resulting from the outcome of such proceedings, to the extent not otherwise provided for or covered by indemnity or insurance, will not have a material adverse effect on our consolidated financial position, results of operations or liquidity.
On January 26, 2018, a putative class action captioned Philip Suhr v. Civeo Corporation et al. was filed in the U.S. District Court for the Southern District of Texas against us and members of our board of directors regarding our proposed acquisition of Noralta. The complaint alleges that we filed a materially incomplete and misleading proxy statement in connection with the Noralta Acquisition, in violation of Sections 14(a) and 20(a) of the Exchange Act and Rule 14a-9 of the Commission. The complaint seeks injunctive relief, including to enjoin the shareholder vote on the Noralta Acquisition as well as the transaction itself, damages and an award of attorneys' fees, in addition to other relief. Additional lawsuits arising out of the Noralta Acquisition may be filed in the future. There can be no assurance that we will be successful in the outcome of the pending or any potential future lawsuits. A preliminary injunction could delay or jeopardize the completion of the Noralta Acquisition, and an adverse judgment granting permanent injunctive relief could indefinitely enjoin the completion of the Noralta Acquisition. We believe that the pending lawsuit is without merit and intend to defend vigorously against the lawsuit and any other future lawsuits challenging the Noralta Acquisition.
ITEM4.Mine Safety Disclosures
PART II
ITEM 5.
| Market for Registrant's Common Equity, Related Shareholder Matters and Issuer Purchases of Equity Securities
|
ITEM5. Market for Registrant's Common Equity, Related Shareholder Matters and Issuer Purchases of Equity Securities
Market for Our Common Shares
Our
Our common shares trade on the
NYSENew York Stock Exchange under the trading symbol
“CVEO.” Set forth in the table below for the periods presented are the high and low sale prices for our common shares. | | | 2017 | | | 2016 | |
| | | High | | | Low | | | High | | | Low | |
First Quarter | | $3.73 | | | $2.21 | | | $1.64 | | | $0.75 | |
Second Quarter | | $3.34 | | | $1.75 | | | $2.40 | | | $1.01 | |
Third Quarter | | $2.95 | | | $1.57 | | | $1.96 | | | $1.00 | |
Fourth Quarter | | $2.92 | | | $1.83 | | | $2.81 | | | $1.06 | |
“CVEO”.
As of
February 19, 2018,23, 2024, there were 1721 holders of record of Civeo common shares.
We
do not currentlyintend to pay any cashregular quarterly dividends on our common shares.shares, with all future dividend payments subject to quarterly review and approval by our Board. The declaration and amount of all potential future dividends will be at the discretion of our board of directorsBoard and will depend upon many factors, including our financial condition, results of operations, cash flows, prospects, industry conditions, capital requirements of our business, covenants associated with certain debt obligations, legal requirements, regulatory constraints, industry practice and other factors the board of directorsBoard deems relevant. WeIn addition, our ability to pay cash dividends on common shares is limited by covenants in the Credit Agreement. Future agreements may also limit our ability to pay dividends, and we may incur incremental taxes if we are required to repatriate foreign earnings to pay such dividends. The amount per share of our dividend payments may be changed, or dividends may be suspended, without advance notice. The likelihood that dividends will be reduced or suspended is increased during periods of market weakness. There can givebe no assurancesassurance that we will continue to pay a dividend in the future.
Performance Graph
The share price performance shown on the graph is not necessarily indicative of future price performance. Information used in the graph was obtained from Research Data Group, Inc., a source believed to be reliable, but we are not responsible for any errors or omissions in such information.
| | | 6/2/14 | | | 12/31/14 | | | 12/31/15 | | | 12/31/16 | | | 12/31/17 | |
| | | | | | | | | | | | | | | | | | | | | |
Civeo Corporation | | $ | 100.00 | | | $ | 17.99 | | | $ | 6.21 | | | $ | 9.63 | | | $ | 11.95 | |
S&P 500 | | $ | 100.00 | | | $ | 108.31 | | | $ | 109.81 | | | $ | 122.94 | | | $ | 149.78 | |
PHLX Oil Service Sector | | $ | 100.00 | | | $ | 74.32 | | | $ | 57.56 | | | $ | 72.45 | | | $ | 61.86 | |
Peer Group | | $ | 100.00 | | | $ | 73.68 | | | $ | 52.06 | | | $ | 69.20 | | | $ | 69.93 | |
The following performance graph and chart compare the cumulative total return to holders of our common shares with the cumulative total returns of the Standard & Poor's 500 Stock Index, Philadelphia OSX and with that of our peer group, for the period from December 31, 2018 to December 31, 2023. The graph and chart show the value, at the dates indicated, of $100 invested at December 31, 2018 and assume the reinvestment of all dividends, as applicable.
Our peer group consists of the following:
| | | | | |
| Badger Daylighting Ltd. | Nine Energy Service, Inc. |
| Black Diamond Group Limited | North American Construction Group |
| Dexterra Group | Oil States International, Inc. |
| Enerflex Ltd. | Precision Drilling Corporation |
| Forum Energy Technologies, Inc. | Select Energy Services Inc. |
| Matrix Service Company | Target Hospitality Corp. |
McGrath RentCorp | Tetra Technologies, Inc. |
| Newpark Resources, Inc. | Total Energy Services Inc. |
| |
| Note: The current peer group remain unchanged for 2023 with the exception of the removal of Exterran Corporation, as they were acquired by Enerflex Ltd. |
| | | | | | | | | | | | | | | | | | | | | | | | | | | | | | | | | | | | | | |
| | | 12/31/18 | | 12/31/19 | | 12/31/20 | | 12/31/21 | | 12/31/22 | | 12/31/23 |
| Civeo Corporation | | $ | 100.00 | | | $ | 90.21 | | | $ | 81.00 | | | $ | 111.71 | | | $ | 181.24 | | | $ | 136.22 | |
| S&P 500 | | $ | 100.00 | | | $ | 131.49 | | | $ | 155.68 | | | $ | 200.37 | | | $ | 164.08 | | | $ | 207.21 | |
| PHLX Oil Service Sector | | $ | 100.00 | | | $ | 99.45 | | | $ | 57.60 | | | $ | 69.55 | | | $ | 112.31 | | | $ | 114.47 | |
| Peer Group | | $ | 100.00 | | | $ | 117.51 | | | $ | 104.04 | | | $ | 140.90 | | | $ | 156.26 | | | $ | 168.01 | |
The performance graph above is furnished and not filed for purposes of the
Securities Act and the Exchange Act. The performance graph is not soliciting material subject to Regulation 14A.Unregistered Sales of Equity Securities and Use of Proceeds
None.
None.
Repurchases of
Registered Equity Securities by Registrant or its Affiliates in the Fourth Quarter
None.
ITEM 6. Selected Financial Data
The following
tables presenttable provides information about purchases of our common shares during the
selected historical consolidated financial information of Civeo and combined financial information of the accommodations business. The term “accommodations business” refers to Oil States International Inc.’s (Oil States) historical accommodations segment reflected in its historical combined financial statements discussed herein. The accommodations business was spun off from Oil States on May 30, 2014. All financial information presented after our spin-off from Oil States represents the consolidated results of operation and financial position of Civeo. Accordingly, | ●
| Our consolidated statement of operations data for the years ended December 31, 2017, 2016 and 2015 consists entirely of the consolidated results of Civeo. Our consolidated statement of operations data for the year ended December 31, 2014 consists of (i) the combined results of the Oil States accommodations business for the fivethree months ended May 30, 2014 and (ii) the consolidated results of Civeo for the seven months ended December 31, 2014. Our consolidated statements of operations data for the year ended December 31, 2013 consists entirely of the combined results of the Oil States accommodations business.
|
| ●
| Our consolidated balance sheet data at December 31, 2017, 2016, 2015 and 2014 consists entirely of the consolidated balances of Civeo, while at December 31, 2013 it consists entirely of the combined balances of the Oil States accommodations business.
|
The balance sheet data as of December 31, 2017 and 2016 and the statement of operations data for each of the years ended December 31, 2017, 20162023.
| | | | | | | | | | | | | | | | | | | | | |
| Total Number of Shares Purchased (1) | | Average Price Paid per Share | | Total number of shares purchased as part of publicly announced plans or programs | Maximum number of shares that may be purchased under the plans or programs | |
| October 1, 2023 - October 31, 2023 | 99,521 | | | $ | 19.84 | | | 99,521 | | 600,769 | | |
| November 1, 2023 - November 30, 2023 | 12,900 | | | $ | 19.71 | | | 12,900 | | 587,869 | | |
| December 1, 2023 - December 31, 2023 | 8,332 | | | $ | 21.50 | | | 8,332 | | 579,537 | | |
| Total | 120,753 | | | $ | 19.94 | | | 120,753 | | 579,537 | | |
(1) In August 2023, our Board authorized a common share repurchase program to repurchase up to 5.0% of our total common shares which were issued and 2015 are derived fromoutstanding at the time of approval, or 742,134 common shares, over a twelve month period. We repurchased an aggregate of 120,753 of our audited financial statements included in Item 8 of this annual report. The balance sheet data as of December 31, 2015, 2014 and 2013 and statement of operations datacommon shares outstanding for approximately $2.4 million during the yearsthree months ended December 31, 2014 and 2013 are derived from our audited financial statements not included in this annual report.The historical financial information presented below should be read in conjunction with our consolidated financial statements and accompanying notes in Item 8 and “Management’s Discussion and Analysis of Financial Condition and Results of Operations” in Item 7 of this annual report. The financial information may not be indicative of our future performance and, for periods prior to December 31, 2014, does not necessarily reflect what the financial position and results of operations would have been had we operated as a separate, stand-alone entity during those periods, including changes that occurred in our operations as a result of our spin-off from Oil States.
| | | For the year ended December 31, | |
| | | 2017 | | | 2016 | | | 2015 | | | 2014 | | | 2013 | |
| | | (In thousands, except per share data) | |
Statement of Operations Data: | | | | | | | | | | | | | | | | | | | | |
Revenues | | $ | 382,276 | | | $ | 397,230 | | | $ | 517,963 | | | $ | 942,891 | | | $ | 1,041,104 | |
Operating income (loss) | | | (97,971 | ) | | | (95,760 | ) | | | (145,003 | ) | | | (142,891 | ) | | | 259,456 | |
Net income (loss) attributable to Civeo or the Accommodations Business of Oil States International, Inc., as applicable | | | (105,713 | ) | | | (96,388 | ) | | | (131,759 | ) | | | (189,043 | ) | | | 181,876 | |
Diluted net income (loss) per share attributable to Civeo or the Accommodations Business of Oil States International, Inc., as applicable (1) | | | (0.82 | ) | | | (0.90 | ) | | | (1.24 | ) | | | (1.77 | ) | | | 1.70 | |
ITEM6.Reserved
| | | As of December 31, | |
| | | 2017 | | | 2016 | | | 2015 | | | 2014 | | | 2013 | |
| | | (In thousands, except per share data) | |
Balance Sheet Data: | | | | | | | | | | | | | | | | | | | | |
Total assets | | $ | 853,912 | | | $ | 910,446 | | | $ | 1,066,529 | | | $ | 1,829,161 | | | $ | 2,123,237 | |
Long-term debt to affiliates | | | — | | | | — | | | | — | | | | — | | | | 335,171 | |
Long-term debt to third-parties | | | 277,990 | | | | 337,800 | | | | 379,416 | | | | 755,625 | | | | — | |
Total Civeo shareholders’ equity or Oil States net investment, as applicable | | | 476,250 | | | | 475,467 | | | | 563,245 | | | | 858,001 | | | | 1,591,034 | |
Cash dividends per share | | | — | | | | — | | | | — | | | | 0.26 | | | | — | |
(1)
| On May 30, 2014, 106,538,044 shares of our common stock were distributed to Oil States stockholders in connection with the spin-off. For comparative purposes, and to provide a more meaningful calculation of weighted-average shares outstanding in our diluted net income (loss) per share calculation, we have assumed these shares were outstanding as of the beginning of each period prior to the separation presented in the calculation of weighted-average shares. In addition, we have assumed the dilutive securities outstanding at May 30, 2014 were also outstanding for each of the periods presented prior to the spin-off.
|
ITEM 7.
ITEM7.Management’s Discussion and Analysis of Financial Condition and Results of Operations “
Management’s Discussion and Analysis of Financial Condition and Results of Operations” contains “forward-looking statements” within the meaning of Section 27A of the Securities Act and Section 21E of the Exchange Act that are based on management’s current expectations, estimates and projections about our business operations. Please readRead “Cautionary Statement Regarding Forward Looking Statements.” Our actual results may differ materially from those currently anticipated and expressed in such forward-looking statements as a result of numerous factors, including the known material factors set forth in Item 1A,1A. “Risk Factors” of this annual report. You should read the following discussion and analysis together with our consolidated financial statements and the notes to those statements in Item 8 of this annual report.
This section of this annual report generally discusses key operating and financial data as of and for the years ended 2023 and 2022 and provides year-over-year comparisons for such periods. For a similar discussion and year-over-year comparisons to our 2021 results, refer to "Management’s Discussion and Analysis of Financial Condition and Results of Operations" in Part II, Item 7 of our Annual Report on Form 10-K for the year ended December 31, 2022, filed with the Securities and Exchange Commission on March 1, 2023.
Description of the Business
We are oneprovide a suite of the largest integrated providers of workforce accommodations, logistics and facility managementhospitality services tofor our guests in the natural resource industry. Our scalable modular facilities provide long-term and temporary accommodations where traditional accommodations and related infrastructure are insufficient, inaccessible or not cost effective. Once facilities are deployed in the field, we also provideresources industry, including lodging, catering and food service, housekeeping and maintenance at accommodation facilities that we or our customers own. In many cases, we provide services housekeeping,that support the day-to-day operations of these facilities, such as laundry, facility management and maintenance, water and wastewater treatment, power generation, communicationscommunication systems, security and redeployment logistics. Our accommodations support our customers’ employeesWe also offer development activities for workforce accommodation facilities, including site selection, permitting, engineering and contractorsdesign, manufacturing management and site construction, along with providing hospitality services once the facility is constructed.
We primarily operate in
some of the
Canadianworld’s most active oil,
sands and in a variety of oil andmetallurgical (met) coal, liquefied natural gas
drilling, mining(LNG) and iron ore producing regions, where, in many cases, traditional accommodations and related
natural resource applications as well as disaster relief efforts, primarily in Canada, Australiainfrastructure often are not accessible, sufficient or cost effective. Our customers include major and
the United States.independent oil companies, mining companies, engineering companies and oilfield and mining service companies. We operate in
threetwo principal reportable business segments – Canada
Australia and
U.S.On February 7, 2017, we closed a public offering of 23,000,000 common shares at $3.00 per share. We used a portion of the net proceeds of $64.7 million from the offering to repay amounts outstanding under several revolving credit facilities provided by our primary credit agreement (the Credit Agreement) and are using the remaining proceeds for general corporate purposes.
On February 17, 2017, the third amendment to the Credit Agreement (as so amended, the Amended Credit Agreement) became effective, which (i) reduced the aggregate revolving loan commitments; (ii) added one additional level to the total leverage-based grid for determining interest rates; and (iii) increased the maximum leverage ratio allowed under the Amended Credit Agreement. For further information, please see Note 10 – Debt.
Noralta Acquisition
On November 26, 2017, we entered into a Share Purchase Agreement (the Purchase Agreement) with Noralta, Torgerson Family Trust (Torgerson Trust), 2073357 Alberta Ltd., 2073358 Alberta Ltd., 1818939 Alberta Ltd., 2040618 Alberta Ltd., 2040624 Alberta Ltd., 989677 Alberta Ltd. (989677) and Lance Torgerson. Under the terms and subject to the conditions set forth in the Purchase Agreement, at closing, we will acquire, directly or indirectly, all of the issued and outstanding shares of Noralta. The consideration for the acquisition payable at closing will be in an amount equal to (i) C$209,500,000 (or US$167 million, based on an exchange rate of $0.797 Canadian dollars to U.S. dollars as of February 16, 2018) in cash, subject to customary adjustments for working capital, debt, cash and transaction expenses, of which C$28,500,000 will be held in escrow by Alliance Trust Company (the Escrow Agent) to support the sellers’ indemnification obligations under the Purchase Agreement, (ii) 32,790,868 common shares of Civeo, no par value, of which 13,491,100 shares will be held in escrow by the Escrow Agent and released in three equal installments from escrow upon the satisfaction of certain conditions related to customer contracts remaining in place in June 2021, June 2022 and June 2023, and (iii) 9,679 shares of Class A Series 1 Preferred Shares of Civeo with an initial liquidation preference of US$96,790,000. We intend to fund the cash consideration with cash on hand and borrowings under the Amended Credit Agreement.
Consummation of the transactions contemplated by the Purchase Agreement is subject to various closing conditions, including but not limited to: (i) receipt of Canadian regulatory approvals and other regulatory and third party consents and approvals; (ii) the absence of any injunction or order prohibiting or restricting the consummation of the transactions contemplated by the Purchase Agreement; and (iii) the receipt of approval by our shareholders of our issuance of the common shares and preferred shares. We have received notice from the Competition Bureau that it does not intend to challenge the acquisition under the Competition Act (Canada), and we have been granted approval under the Investment Canada Act for the acquisition. The Purchase Agreement may be terminated by either party if such conditions are not satisfied by May 31, 2018.
In addition, at the closing of the Purchase Agreement, we will enter into a Registration Rights, Lock-Up and Standstill Agreement (the Registration Rights Agreement) with Torgerson Trust and 989677. Pursuant to the terms and conditions of the Registration Rights Agreement, for a period of 18 months following the closing, Torgerson Trust and 989677 will agree not to transfer any of their common shares without our prior written consent, with certain limited exceptions for permitted transfers. Following such 18-month period, Torgerson Trust and 989677 will be permitted to transfer common shares under Rule 144 or an effective registration statement under the U.S. Securities Act of 1933, subject to a limitation restricting transfers of more than 10% of the common shares (including common shares received upon conversion of the preferred shares) received by Torgerson Trust and 989677 during any 90-day period. The Registration Rights Agreement also provides that, as soon as practicable following the date that is 18 months after the date of the Registration Rights Agreement, but in no event more than 30 days thereafter, we will use our commercially reasonable efforts to prepare and file a shelf registration statement under the Securities Act covering the public offering of the registrable securities held by Torgerson Trust and 989677 and cause such shelf registration statement to become effective within 150 days after filing. In addition, Torgerson Trust and 989677 will have customary “piggy-back” rights with respect to public offerings of common shares by us. In the event the shelf registration statement does not become effective within the time period specified in the Registration Rights Agreement, the dividend rate of the preferred shares will be increased by (i) 0.25% per annum commencing on the first succeeding dividend date after such registration default and (ii) 0.25% per annum on each subsequent dividend date until such time as a shelf registration statement becomes effective (up to a maximum increase of 1.00% per annum). Finally, Torgerson Trust and 989677 each agreed to be subject to customary standstill restrictions, including a restriction on additional purchases of common shares, and a restriction on voting common shares that limits the voting by such holders of common shares (including common shares held in escrow) in excess of 15% of the voting power of the outstanding common shares, which will be voted consistently with all other shareholders. The transfer, standstill and voting restrictions terminate at such time as the shares beneficially owned by Torgerson Trust and 989677 no longer constitute at least 5% of our common shares then outstanding (calculated assuming conversion of all of the outstanding preferred shares) or upon a bankruptcy or change of control of Civeo.
Holders of the preferred shares will be entitled to receive a 2% annual dividend, paid quarterly in cash or, at our option, by increasing the preferred shares’ liquidation preference. The preferred shares are convertible into common shares at a conversion price of US$3.30 per preferred share. We have the right to elect to convert the preferred shares into common shares if the 15-day volume weighted average price of the common shares is equal to or exceeds the conversion price. Holders of the preferred shares will have the right to convert the preferred shares into common shares at any time after two years from the date of issuance, and the preferred shares mandatorily convert after five years from the date of issuance. The preferred shares also convert automatically into common shares upon a change of control of Civeo. We may redeem any or all of the preferred shares for cash at the liquidation preference, plus accrued and unpaid dividends. The preferred shares do not have voting rights, except as statutorily required.
Australia.
Basis of Presentation
Unless otherwise stated or the context otherwise
indicates,indicates: (i) all references in these consolidated financial statements to “Civeo,” “the Company,” “us,” “our” or “we” refer to Civeo Corporation (Civeo) and its consolidated subsidiaries. Allsubsidiaries; and (ii) all references in this annual report to “dollars” or “$” are to U.S.United States (U.S.) dollars.Overview and Macroeconomic Environment
We provide workforce accommodations to the natural resource industry in Canada, Australia and the U.S. Demand for our services can be attributed to two phases of our customers’ projects: (1) the development or construction phase; and (2) the operations or production phase.
Historically, initial demand for our
hospitality services has been driven by our customers’ capital spending programs related to the construction and development of
oil sands and coal minesnatural resource projects and associated infrastructure, as well as the exploration for oil and natural gas. Long-term demand for our services has been driven by
continued development and expansion of natural resource production,
maintenance and operation of
oil sands and mining facilities.those facilities as well as expansion of those sites. In general, industry capital spending programs are based on the outlook for commodity prices,
production costs, economic growth,
andglobal commodity supply/demand, estimates of resource
production.production and the expectations of our customers' shareholders. As a result, demand for our
products andhospitality services is largely sensitive to expected commodity prices, principally related to
crude oil,
met coal, LNG and
metallurgical (met) coal.iron ore, and the resultant impact of these commodity price expectations on our customers’ spending. Other factors that can affect our business and financial results include the general global economic environment, including inflationary pressures, supply chain disruptions and labor shortages, volatility affecting the banking system and financial markets, availability of capital to the natural resource industry and regulatory changes in Canada, Australia and other markets, including governmental measures introduced to fight climate change.
Commodity Prices
There is continued uncertainty around commodity price levels, including the impact of inflationary pressures, actions taken by Organization of the Petroleum Exporting Countries Plus (OPEC+) to adjust production levels, geopolitical events such as the ongoing Russia/Ukraine and Israel/Hamas conflicts and rising geopolitical risks in the Middle East, U.S. oil production levels and regulatory implications on such prices. In Canada,particular, these items could cause our Canadian oil sands and pipeline
customers to reduce production, delay expansionary and maintenance spending and defer additional investments in their oil sands assets.
Recent Commodity Prices
Recent West Texas Intermediate (WTI) crude, Western Canadian Select (WCS) crude, met coal and iron ore pricing trends are as follows:
| | | | | | | | | | | | | | | | | | | | | | | | | | |
| | | Average Price (1) |
Quarter
ended | | WTI
Crude
(per bbl) | | WCS
Crude
(per bbl) | | Hard
Coking Coal
(Met Coal)
(per tonne) | | Iron
Ore
(per tonne) |
| First Quarter through February 23, 2024 | | $ | 74.99 | | | $ | 56.16 | | | $ | 323.93 | | | $ | 127.50 | |
| 12/31/2023 | | 78.55 | | | 55.31 | | | 332.24 | | | 122.24 | |
| 9/30/2023 | | 82.50 | | | 66.20 | | | 260.12 | | | 111.04 | |
| 6/30/2023 | | 73.54 | | | 60.25 | | | 243.54 | | | 106.98 | |
| 3/31/2023 | | 75.96 | | | 56.61 | | | 341.08 | | | 117.08 | |
| 12/31/2022 | | 82.82 | | | 54.72 | | | 276.19 | | | 94.93 | |
| 9/30/2022 | | 91.63 | | | 70.70 | | | 252.63 | | | 99.21 | |
| 6/30/2022 | | 108.77 | | | 92.89 | | | 464.61 | | | 128.80 | |
| 3/31/2022 | | 95.17 | | | 82.04 | | | 474.83 | | | 129.46 | |
| 12/31/2021 | | 77.31 | | | 60.84 | | | 371.95 | | | 104.88 | |
| 9/30/2021 | | 70.54 | | | 57.58 | | | 258.41 | | | 164.90 | |
| 6/30/2021 | | 66.19 | | | 53.27 | | | 136.44 | | | 195.97 | |
| 3/31/2021 | | 58.13 | | | 46.28 | | | 127.95 | | | 159.83 | |
| 12/31/2020 | | 42.63 | | | 31.34 | | | 109.37 | | | 128.24 | |
(1)Source: WTI crude prices are from U.S. Energy Information Administration, WCS crude prices and iron ore prices are from Bloomberg and hard coking coal prices are from IHS Markit.
WTI Crude.After reaching historic lows in early 2020 during the start of the COVID-19 pandemic, global oil prices increased to above $100 per barrel in the second quarter 2022. In the second half of 2022 and throughout 2023, oil prices declined due to (i) rising fears of a recession resulting from severe inflation and rising interest rates, (ii) resulting lower demand for oil and (iii) increasing U.S. oil production. In an effort to support the price of oil amidst demand concerns, OPEC+ countries announced additional oil production cuts through the end of 2023. These production cuts, coupled with the rising geopolitical risks in the Middle East, resulted in increased oil prices in the third quarter and early part of the fourth quarter of 2023, before reducing in the latter part of the fourth quarter back to levels consistent with the first six months of 2023.
WCS Crude. In Canada, WCS crude is the benchmark price for our oil sands accommodations customers. Pricing for WCS is driven by several factors,, including the underlying price for West Texas Intermediate (WTI)WTI crude, and the availability of transportation infrastructure.infrastructure (consisting of pipelines and crude by railcar), refinery blending requirements and governmental regulation. Historically, WCS has traded at a discount to WTI, creating a “WCS Differential,” due to transportation costs and limited capacity restrictions to move Canadian heavy oil production to refineries, primarily along the U.S. Gulf Coast. The WCS Differential has varied depending on the extent of transportation capacity availability.After beginning to drop in the second half of 2014, global
Certain expansionary oil
prices dropped during the first quarter of 2016 to their lowest levels in over ten years due to concerns over global oil demand, global crude inventory levels, worldwide economic growth and price cutting by major oil producing countries, such as Saudi Arabia. Increasing global supply, including increased U.S. shale oil production, also negatively impacted pricing. With falling WTI oil prices, WCS also fell. Prices began to increase in March 2016, and after falling slightly in the second quarter of 2017, prices continued to increase through the second half of 2017. WCS prices in the fourth quarter of 2017 averaged $38.65 per barrel compared to a low of $20.26 in the first quarter of 2016 and a high of $83.78 in the second quarter of 2014. The WCS Differential increased from $16.10 per barrel at the end of the fourth quarter of 2016 to $26.00 per barrel at the end of the fourth quarter of 2017. As of February 16, 2018, the WTI price was $61.68 and the WCS price was $35.05, resulting in a WCS Differential of $26.63. The increased WCS Differential is resulting from pipeline access limitations.There remains a risk that prices for Canadian oil sands crude oil related products could deteriorate for an extended period of time, and the discount between WCS crude prices and WTI crude prices could widen. The depressed price levels through the first quarter of 2016 negatively impacted exploration, development, maintenance and production spending and activity by Canadian operators and, therefore, demand for our services in late 2014 and throughout 2015 and 2016. Although we have seen an increase in oil prices in late 2016 and through 2017, we are not expecting significant improvement in customer activity in the near-term, as we anticipate that our customers’ capital spending will generally lag increased oil prices by nine to 12 months. The current outlook for expansionary projects in Canada is primarily related to proposed pipeline and insitu oil sands projects. However, continued uncertainty and commodity price volatility and regulatory complications could cause our Canadian oil sands and pipeline customers to delay expansionary and maintenance spending and defer additional investments in their oil sands assets.
Our U.S. business is also primarily tied to oil prices, specifically oil shale drilling and completion activity, and therefore WTI oil prices, in the Bakken, Rockies and Permian Basins. With the recovery in oil prices in late 2016 and through 2017, coupled with ample capital availability for U.S. E&P companies, oil drilling and completion activity in the U.S. has significantly increased over the past year. The U.S. oil rig count has increased from its low of 316 rigs in May of 2016 to over 700 rigs active in the fourth quarter of 2017. As of February 16, 2018, there were 798 active oil rigs in the U.S. (as measured by Bakerhughes.com). U.S. oil drilling and completion activity will continue to be dependent on sustained higher WTI oil prices and sufficient capital to support E&P drilling and completion plans.
In Australia, approximately 80% of our rooms are located in the Bowen Basin and primarily serve met coal mines in that region. Met coal pricing and production growth in the Bowen Basin region is predominantly influenced by the levels of global steel production, which increased by 5.5% during 2017 compared to 2016. On March 28, 2017, a Category 4 cyclone made landfall on the coast of Queensland, Australia, temporarily shutting down the majority of Bowen Basin coal export rail infrastructure, causing a spike in met coal spot prices from $152 per metric tonne on March 31, 2017 to over $250 per metric tonne. As of February 19, 2018, met coal spot prices were $229.25 per metric tonne and benchmark contract prices for the first quarter of 2018 paid to Australian metallurgical coal producers by Japanese steel producers had not settled. Following cyclone Debbie, the market began to shift away from quarterly benchmark pricing to an index linked approach as a pricing mechanism. The changes in met coal pricing this year have not led our customers to approve any significant new projects. We expect that customers will look for a period of sustained higher prices before new projects are approved. Long-term demand for steel is expected to be driven by increased steel consumption per capita in developing economies, such as China and India, whose current consumption per capita is a fraction of developed countries. Our customers continue to actively implement cost, productivity and efficiency measures to further drive down their cost base.
Recent WTI crude, WCS crude and met coal pricing trends are as follows:
| | | Average Price (1) | |
| | | WTI | | | WCS | | | Hard | |
Quarter | | Crude | | | Crude | | | Coking Coal (Met Coal) | |
ended | | (per bbl) | | | (per bbl) | | | (per tonne) | |
First Quarter through 2/16/2018 | | $ | 63.03 | | | $ | 36.81 | | | $ | N/A | |
12/31/2017 | | | 55.28 | | | | 38.65 | | | | 192.00 | |
9/30/2017 | | | 48.16 | | | | 37.72 | | | | 170.00 | |
6/30/2017 | | | 48.11 | | | | 38.20 | | | | 193.50 | |
3/31/2017 | | | 51.70 | | | | 38.09 | | | | 285.00 | |
12/31/2016 | | | 49.16 | | | | 34.34 | | | | 200.00 | |
9/30/2016 | | | 44.88 | | | | 30.67 | | | | 92.50 | |
6/30/2016 | | | 45.53 | | | | 32.84 | | | | 84.00 | |
3/31/2016 | | | 33.41 | | | | 20.26 | | | | 81.00 | |
12/31/2015 | | | 42.02 | | | | 27.82 | | | | 89.00 | |
9/30/2015 | | | 46.48 | | | | 31.54 | | | | 93.00 | |
6/30/2015 | | | 57.64 | | | | 48.09 | | | | 109.50 | |
3/31/2015 | | | 48.49 | | | | 35.03 | | | | 117.00 | |
12/31/2014 | | | 73.21 | | | | 57.75 | | | | 119.00 | |
__________
| (1)
| Source: WTI crude prices are from U.S. Energy Information Administration (EIA), and WCS crude prices and Seaborne hard coking coal contract prices are from Bloomberg.
|
Overview
As noted above, demand for our services is primarily tied to the outlook for crude oil and met coal prices. Other factors that can affect our business and financial results include the general global economic environment and regulatory changes in Canada, Australia, the U.S. and other markets.
Our business is predominantly located in northern Alberta, Canada and Queensland, Australia, and we derive most of our business from resource companies who are developing and producing oil sands and met coal resources and, to a lesser extent, other hydrocarbon and mineral resources. More than three-fourths of our revenue is generated by our large-scale lodge and village facilities. Where traditional accommodations and infrastructure are insufficient, inaccessible or cost ineffective, our lodge and village facilities provide comprehensive accommodations services similar to those found in an urban hotel. We typically contract our facilities to our customers on a fee-per-day basis that covers lodging and meals and is based on the duration of customer needs, which can range from several weeks to several years.
Generally, our customers are making multi-billion dollar investments to develop their prospects, which have estimated reserve lives ranging from ten years to in excess of 30 years. Consequently, these investments are dependent on those customers’ long-term views of commodity demand and prices.
In response to decreases in crude oil prices beginning in late 2014, many of our customers in Canada curtailed their operations and spending, and most major oil sands mining operators began reducing their costs and limiting capital spending, thereby limiting the demand for accommodations of the kind we provide. In Australia, approximately 80% of our rooms are located in the Bowen Basin and primarily serve met coal mines in that region, where our customers continue to implement operational efficiency measures, in order to drive down their cost base.
In recent months, however, several catalysts have emerged that we believe could have favorable intermediate to long-term implications for our core end markets. Since the announcement by OPEC in late November 2016 to cut production quotas and the subsequent rise in spot oil prices and future oil price expectations, certain operators with steam-assisted gravity drainage operations in the Canadian oil sands increased capital spending in 2017. Despite construction at the Fort Hill Energy LP project ending in early 2018, Canadian oil sands capital spending in 2018 is forecasted to be relatively flat, in the aggregate. In addition, recent regulatory approvals of several major pipeline projects have the potential to both drive incremental demand for mobile accommodations assets and to improve take-away capacity for Canadian oil sands producers over the longer term. Additionally, we believe thatThe Enbridge Line 3 replacement project was completed at the Keystone XL pipelineend of 2021 and the Trans Mountain Pipeline is approximately 98% complete, with mechanical completion expected to occur in the first quarter 2024, commercial service expected to begin in April 2024 and volumes expected to ramp up to full capacity by year end 2024.
WCS prices in the fourth quarter of 2023 averaged $55.31 per barrel compared to an average of $54.72 in the fourth quarter of 2022. The WCS Differential decreased from $27.39 per barrel at the end of the fourth quarter of 2022 to $19.35 at the end of the fourth quarter of 2023. As of February 23, 2024, the WTI price was $77.54 and the WCS price was $58.60, resulting in a WCS Differential of $18.94.
Met Coal. In Australia, 84% of our rooms are located in the Bowen Basin of Queensland, Australia and primarily serve met coal mines in that region. Met coal pricing and production growth in the Bowen Basin region is predominantly influenced
by the level of global steel production, which decreased by 0.1% during 2023 compared to 2022. The decrease year-over-year was the result of weaker production in December 2023 from China, offset by stronger production throughout 2023 from both Europe and Russia. As of February 23, 2024, met coal spot prices were $311.40 per tonne. Steel output is forecast to improve marginally through 2024, with large infrastructure rollouts in a number of major economies including the U.S., if constructed, would be and India.
Met coal prices remained over $200 per tonne during 2023, which supported existing producers, and also assisted new and expansion projects. In the last quarter of 2023, met coal prices averaged over $330 per tonne which continues to provide a positive catalystshort-term outlook for Canadian oil sands producers,producing projects, though future investment could be impacted by the increase in the Queensland royalty scheme introduced in 2022. Analysts forecast prices to remain elevated in the near term but to fall below $300 per tonne in 2024 as it would bolster confidencesupply side pressures are expected to ease and Chinese met coal imports fall following high restocking levels.
Iron Ore. Iron ore prices remained consistently above $100 per tonne throughout 2023 and averaged over $130 per tonne in future take-away capacitylate December 2023, following a sustained period of high prices. Analysts are forecasting 2024 prices to remain over $100 per tonne on average.
Other
Inflationary Pressures. During 2022 and 2023, inflationary pressures and supply chain disruptions have been, and continue to be, experienced worldwide. Price increases resulting from inflation and supply chain concerns have, and are expected to continue to have, a negative impact on our labor and food costs, as well as consumable costs such as fuel. We are managing inflation risk with negotiated service scope changes and contractual protections.
Labor Shortages. In addition to the regionmacro inflationary impacts on labor costs noted above, during the COVID-19 pandemic, we were, and continue to U.S. Gulf Coast refineries. Inbe, impacted by increased staff costs as a result of hospitality labor shortages in Australia we believe prices are currently atas government-imposed and voluntary social distancing and quarantining impacted travel. This labor shortage has been exacerbated by significantly reduced migration in and around Australia affecting labor availability, which has subsequently led to an increased reliance on more expensive temporary labor resources.
LNG.Our Sitka Lodge supports the LNG Canada project and related pipeline projects. From a level that may contributemacroeconomic standpoint, LNG demand has continued to increased activity overgrow, reinforcing the long term if our customers view these price levels as sustainable.While we believe that these macroeconomic developments are positive for our customers andneed for the underlying demandglobal LNG industry to expand access to natural gas. Evolving government energy policies around the world have amplified support for our accommodations services, we do not expect an immediate improvement in our business. Accordingly, we plan to focus on enhancing the quality of our operations, maintaining financial discipline and proactively managing our business as market conditions continue to evolve.
We began expansion of our room count in Kitimat, British Columbia during the second half of 2015 to support potential liquefiedcleaner energy supply, creating more opportunities for natural gas (LNG) projects onand LNG. The conflict between Russia/Ukraine and Israel/Hamas has further highlighted the west coast of British Columbia. We were awarded a contract withneed for secure natural gas supply globally, particularly in Europe. Accordingly, additional investment in LNG supply will be needed to meet the resulting expected long-term LNG demand growth.
Currently, Western Canada does not have any operational LNG export facilities. LNG Canada (LNGC)
for the provision, a joint venture among Shell Canada Energy, an affiliate of
open lodge roomsShell plc (40 percent), and
associated services that ranaffiliates of PETRONAS, through
October 2017. To support this contract, we developedits wholly-owned entity, North Montney LNG Limited Partnership (25 percent), PetroChina (15 percent), Mitsubishi Corporation (15 percent) and Korea Gas Corporation (5 percent), is currently constructing a
new accommodations facility, Sitka Lodge, which includes private washrooms, recreational facilities and other amenities. This lodge currently has 436 rooms, with the potential to expand to serve future accommodations demand in the region.In addition, we were awarded a contract with LNGC to construct a 4,500 person workforce accommodation center (Cedar Valley Lodge) for a proposed liquefaction and export facility in Kitimat, British Columbia. Construction of Cedar Valley Lodge will not commence until LNGC’s joint venture participants have made a positive final investment decision (FID)Columbia (Kitimat LNG Facility). The FID was originally planned for the end of 2016. However, FID has been delayed. Recent public statements by LNGCKitimat LNG Facility is nearing completion and news reports indicate that FID for LNGC is expected to be operational in the second half of 2018. Should the project ultimately move forward,2024. British Columbia LNG activity could becomeand related pipeline projects are a material driver of future activity for our Sitka Lodge, as well as for our mobile fleet assets, which are well suited forwere contracted to serve several designated portions of the related pipeline construction activity.
However, there can be no assurance that LNGC’s joint venture participants will reach a positive FID or that The majority of our contractscontracted commitments associated with LNGC will be extended. Further, on July 25, 2017, Petronas and its partners announced the cancellation of their Pacific NorthWest (PNW) liquefiedCoastal GasLink Pipeline, the pipeline constructed to transport natural gas project they had plannedfeedstock to build in Port Edward, British Columbia. If the LNGC, project, and other potential projects in the area, do not move forward, our future results of operations and our existing long-lived assets in Canada, including our Sitka Lodge, may be negatively affected, and we may be required to record material impairment charges equal to the excess of the carrying values of these assets over their fair values. As of December 31, 2017, the net book value of long-lived assets that are currently supporting, or could be used to support, potential LNG projects in British Columbia was approximately $80 million.
Due to the PNW cancellation, we identified an indicator that certain asset groups used, or expected to be used, in conjunction with potential LNG projects in British Columbia may be impaired. As a result, we assessed the carrying values of each of the asset groups to determine if they continued to be recoverable based on their estimated future cash flows. Based on the assessment, the carrying values of certain undeveloped land positions in British Columbia were determined to not be recoverable, and an impairment charge totaling $1.2 million was recorded in the third quarter of 2017.
We identified an indicator that certain asset groups used in the southern oil sands may be impaired due to market developments, including project delays, occurringcompleted in the fourth quarter of 2017.2023.
McClelland Lake Lodge. We assesseddid not renew an expiring land lease associated with our McClelland Lake Lodge in Alberta, Canada, which expired in June 2023, in order to support our customer’s intent to mine the carrying valueland where the lodge was located. In addition, the accompanying hospitality services contract at McClelland Lake Lodge expired in July 2023; however, we continued to provide hospitality services to the customer at our other owned lodges through January 31, 2024 under a short-term take-or-pay commitment. Subsequent to this date, we have continued to provide such services at our other lodges; however, not pursuant to a take-or-pay commitment. Our assets were demobilized and completely removed from the existing site in January 2024. During the third quarter of each2023, we entered into a definitive agreement to sell our McClelland Lake Lodge assets to a U.S.-based mining project for approximately C$49 million, or US$36 million. The transaction was completed in January 2024. During the third and fourth quarters of 2023, we recognized $14.2 million in demobilization costs and received $28.2 million in cash proceeds associated with the sale. We expect to recognize the remaining demobilization costs and the proceeds of the asset groups insale in the southern portionfirst quarter of 2024.
U.S. Business. In the region to determine if they continuedfirst quarter of 2023, we sold our accommodation assets in Louisiana. In addition, in the second half of 2022, we sold both our U.S. wellsite services and offshore businesses. Our remaining U.S. business supports completion
activity in the Bakken. U.S. oil completion activity will continue to be
recoverable based on their estimated future cash flows. Based on the assessment, the carrying values of two of our lodges were determined to not be fully recoverable,impacted by oil prices, pipeline capacity, federal energy policies and
we proceeded to compare the estimated fair value of those assets groups to their respective carrying values. Accordingly, the value of the two lodges were written down to their fair value of zero, and an impairment charge totaling $27.2 million was recorded in the fourth quarter of 2017.In estimating future cash flows, we made numerous assumptions with respect to future circumstances that might directly impact each of the asset groups’ operations in the future and are therefore uncertain. These assumptions with respect to future circumstances included future oil, coal and natural gas prices, anticipated customer spending, and industry and/or local market conditions. These assumptions represented our best judgment based on the current facts and circumstances. However, different assumptions could result in a determination that the carrying values of additional asset groups are no longer recoverable based on estimated future cash flows. Our estimate of fair value was primarily calculated using the income approach, which derives a present value of the asset group based on the asset groups estimated future cash flows. We discounted our estimated future cash flows using a long-term weighted average costavailability of capital based on our estimate of investment returns required by a market participant.
to support exploration and production completion plans.
Foreign Currency Exchange Rates.Exchange rates between the U.S. dollar and each of the Canadian dollar and the Australian dollar influence our U.S. dollar reported financial results. Our business has historically derived the vast majority of its revenues and operating income in Canada andand Australia. These revenues and profitsprofits/losses are translated into U.S. dollars for U.S. GAAPgenerally accepted accounting principles financial reporting purposes. The following tables summarize the fluctuations in the exchange rates between the U.S. dollar and each of the Canadian dollar was valued at an average exchange rate of U.S. $0.77 for 2017 compared to U.S. $0.76 for 2016, an increase of approximately 2%. The Canadian dollar was valued at an exchange rate of $0.80 on December 31, 2017 and $0.74 on December 31, 2016. Thethe Australian dollar was valued at an average exchange rate of U.S. $0.77 for 2017 compared to U.S. $0.74 for 2016, an increase of approximately 3%. The Australian dollar was valued at an exchange rate of $0.78 on December 31, 2017 and $0.72 on December 31, 2016. dollar:
| | | | | | | | | | | | | | | | | | | | | | | |
| Year Ended December 31, |
| 2023 | | 2022 | | Change | | Percentage |
| Average Canadian dollar to U.S. dollar | $0.741 | | $0.769 | | (0.028) | | (3.6)% |
| Average Australian dollar to U.S. dollar | $0.665 | | $0.695 | | (0.030) | | (4.3)% |
| | | | | | | | | | | | | | | | | | | | | | | |
| As of December 31, |
| 2023 | | 2022 | | Change | | Percentage |
| Canadian dollar to U.S. dollar | $0.756 | | $0.738 | | 0.018 | | 2.4% |
| Australian dollar to U.S. dollar | $0.681 | | $0.679 | | 0.002 | | 0.2% |
These fluctuations of the Canadian and Australian dollars have had and will continue to have an impact on the translation of earnings generated from our Canadian and Australian subsidiaries and, therefore, our financial results.
Capital Expenditures.We continue to monitor the global economy, thecommodity prices, demand for crude oil, met coal, LNG and met coaliron ore, inflation and the resultant impact on the capital spending plans of our customers in order to plan our business activities. We currently expect that our 20182024 capital expenditures exclusivewill be in the range of any business acquisitions, will total approximately $15$30 million to $20$35 million, compared to 20172023 capital expenditures of $11.2$31.6 million. Please seeOur 2023 capital expenditures included approximately $10 million related to village enhancements in Australia, for which our customer has reimbursed us, resulting in a net negligible cash flow impact in 2023 for these expenditures. We may adjust our capital expenditure plans in the future as we continue to monitor customer activity.
See “Liquidity and Capital Resources” below for further discussion of 20182024 and 20172023 capital expenditures.
Unless otherwise indicated, discussion of results for theyearsyearendedDecember 31,, 2017 and 2016 2023is based on a comparison with the corresponding period of 2016 and 2015, respectively.
2022.
Results of Operations– Year Ended December 31, 2017 2023Compared to Year Ended December 31, 2016
| | | Year Ended December 31, | |
| | | 2017 | | | 2016 | | | Change | |
| | | ($ in thousands) | |
Revenues | | | | | | | | | | | | |
Canada | | $ | 245,595 | | | $ | 278,464 | | | $ | (32,869 | ) |
Australia | | | 111,221 | | | | 106,815 | | | | 4,406 | |
United States and other | | | 25,460 | | | | 11,951 | | | | 13,509 | |
Total revenues | | | 382,276 | | | | 397,230 | | | | (14,954 | ) |
Costs and expenses | | | | | | | | | | | | |
Cost of sales and services | | | | | | | | | | | | |
Canada | | | 171,677 | | | | 190,878 | | | | (19,201 | ) |
Australia | | | 55,722 | | | | 51,688 | | | | 4,034 | |
United States and other | | | 29,859 | | | | 17,084 | | | | 12,775 | |
Total cost of sales and services | | | 257,258 | | | | 259,650 | | | | (2,392 | ) |
Selling, general and administrative expenses | | | 63,431 | | | | 55,297 | | | | 8,134 | |
Depreciation and amortization expense | | | 126,443 | | | | 131,302 | | | | (4,859 | ) |
Impairment expense | | | 31,604 | | | | 46,129 | | | | (14,525 | ) |
Other operating expense | | | 1,511 | | | | 612 | | | | 899 | |
Total costs and expenses | | | 480,247 | | | | 492,990 | | | | (12,743 | ) |
Operating loss | | | (97,971 | ) | | | (95,760 | ) | | | (2,211 | ) |
| | | | | | | | | | | | | |
Interest expense and income, net | | | (22,081 | ) | | | (22,817 | ) | | | 736 | |
Other income (expense) | | | 1,308 | | | | 2,645 | | | | (1,337 | ) |
Loss before income taxes | | | (118,744 | ) | | | (115,932 | ) | | | (2,812 | ) |
Income tax benefit | | | 13,490 | | | | 20,105 | | | | (6,615 | ) |
Net loss | | | (105,254 | ) | | | (95,827 | ) | | | (9,427 | ) |
Less: Net income attributable to noncontrolling interest | | | 459 | | | | 561 | | | | (102 | ) |
Net loss attributable to Civeo | | $ | (105,713 | ) | | $ | (96,388 | ) | | $ | (9,325 | ) |
2022
| | | | | | | | | | | | | | | | | | | |
| | Year Ended
December 31, | | |
| | 2023 | | 2022 | | Change | | |
| | | | | | | |
| | ($ in thousands) | | |
| Revenues | | | | | | | |
| Canada | $ | 352,795 | | | $ | 395,997 | | | $ | (43,202) | | | |
| Australia | 336,763 | | | 278,252 | | | 58,511 | | | |
| Other | 11,247 | | | 22,803 | | | (11,556) | | | |
| Total revenues | 700,805 | | | 697,052 | | | 3,753 | | | |
| Costs and expenses | | | | | | | |
| Cost of sales and services | | | | | | | |
| Canada | 277,067 | | | 293,576 | | | (16,509) | | | |
| Australia | 243,011 | | | 200,944 | | | 42,067 | | | |
| Other | 10,209 | | | 22,543 | | | (12,334) | | | |
| Total cost of sales and services | 530,287 | | | 517,063 | | | 13,224 | | | |
| Selling, general and administrative expenses | 72,605 | | | 69,962 | | | 2,643 | | | |
| Depreciation and amortization expense | 75,142 | | | 87,214 | | | (12,072) | | | |
| Impairment expense | 1,395 | | | 5,721 | | | (4,326) | | | |
| Gain on sale of McClelland Lake Lodge assets, net | (18,590) | | | — | | | (18,590) | | | |
| Other operating expense | 479 | | | 74 | | | 405 | | | |
| Total costs and expenses | 661,318 | | | 680,034 | | | (18,716) | | | |
| Operating income | 39,487 | | | 17,018 | | | 22,469 | | | |
| | | | | | | |
| Interest expense, net | (13,005) | | | (11,435) | | | (1,570) | | | |
| Other income | 13,881 | | | 5,149 | | | 8,732 | | | |
| Income before income taxes | 40,363 | | | 10,732 | | | 29,631 | | | |
| Income tax expense | (10,633) | | | (4,402) | | | (6,231) | | | |
| Net income | 29,730 | | | 6,330 | | | 23,400 | | | |
| Less: Net income (expense) attributable to noncontrolling interest | (427) | | | 2,333 | | | (2,760) | | | |
| Net income attributable to Civeo Corporation | 30,157 | | | 3,997 | | | 26,160 | | | |
| Less: Dividends attributable to Class A preferred shares | — | | | 1,771 | | | (1,771) | | | |
| Net income attributable to Civeo common shareholders | $ | 30,157 | | | $ | 2,226 | | | $ | 27,931 | | | |
We
reported net lossincome attributable to Civeo for the year ended December 31, 20172023 of $105.7$30.2 million, or $0.82$2.01 per diluted share. As further discussed below, net lossincome included (i) $28.3 million of net gains associated with the sale of the McClelland Lake Lodge in Canada and (ii) a $31.6$1.4 million pre-tax loss ($23.1 million after-tax, or $0.18 per diluted share) resulting from the impairment of fixed assets included in Impairment expense below; and (ii) a $2.3 million pre-tax loss ($2.2 million after-tax, or $0.02 per diluted share) from costs incurred in connection with the proposed Noralta Acquisition, included in Selling, general and administrative (SG&A) expense below.expense.
We reported net lossincome attributable to Civeo for the year ended December 31, 20162022 of $96.4$2.2 million, or $0.90$0.21 loss per diluted share. As further discussed below, net lossincome included (i) a $46.1$5.7 million pre-tax loss ($35.9 million after-tax, or $0.34 per diluted share) resulting from the impairment of fixed assets included in Impairment expense,expense.
Revenues. Consolidated revenues increased $3.8 million, or 1%, in 2023 compared to 2022. This increase was primarily due to (i) increased occupancy at our Civeo owned villages in the Australian Bowen Basin and Gunnedah Basin and (ii) a $1.3 million pre-tax loss ($1.2 million after-tax, or $0.01 per diluted share) from costs incurredincreased activity at our integrated services villages in connection with the Redomicile Transaction, included in SG&A expense below.Revenues. Consolidated revenues decreased $15.0 million, or 4%, in 2017 compared to 2016. This decline was largely driven by decreases in Canada due to lower rates and lower mobile, open camp and product activity,Western Australia. These items were partially offset by increased occupancies(i) decreased mobile asset activity from pipeline projects in Canada, (ii) lower billed rooms at some of our lodges. This decrease was offset by increasesCanadian lodges, (iii) reduced activity in the U.S. operations due to increased activity levelsthe sale of our wellsite and offshore businesses in Australia duethe second half of 2022 and (iv) a weaker Australian and Canadian dollar relative to increased occupancy, as well as stronger Canadian and Australian dollarsthe U.S. dollar in 20172023 compared to 2016. Please see2022. See the discussion of segment results of operations below for further information.
Cost of Sales and Services.Our consolidated cost of sales decreased $2.4and services increased $13.2 million, or 1%3%, in 20172023 compared to 2016,2022. This increase was primarily due to decreases(i) increased occupancy at our Civeo owned villages in Canadathe Australian
Bowen Basin and Gunnedah Basin, (ii) increased activity at our integrated services villages in Western Australia and (iii) increased operating costs due to
lower mobile, open camp and product activity, as well as a focus on cost containment and operational efficiencies. This wasinflationary pressures in Australia. These items were partially offset by
increases(i) reduced activity in the U.S.
operations due to
increasedthe sale of our wellsite and offshore businesses in the second half of 2022, (ii) lower costs related to reduced mobile asset activity
levelsin Canada, (iii) lower billed rooms at our Canadian lodges and
(iv) a weaker Australian and Canadian dollar relative to the U.S. dollar in
Australia due to increased occupancy, as well as stronger Canadian and Australian dollars in 20172023 compared to
2016. Please see2022. See the discussion of segment results of operations below for further information.
Selling, General and Administrative Expenses.SG&A expense increased $8.1$2.6 million, or 15%4%, in 20172023 compared to 2016.2022. This increase was primarily due to higher share based compensation expense associated with phantom share awards,of $2.4 million, higher information technology expense of $2.3 million and higher incentive compensation costs and higher professional fees when compared to 2016.of $2.0 million. The increase in share based compensation expense was primarily due to theincreased staff and recruitment costs. The increase in our share price during the period, which is used to remeasure the phantom share awards at each reporting date. The higher professional fees include $2.3 millioninformation technology expense was related to ongoing investment in our newly implemented human capital management (HCM) system and set-up costs incurred in a cloud computing arrangement for the proposed Noralta Acquisition.HCM system, which are being amortized through SG&A expense instead of depreciation and amortization expense. These items were partially offset by reducedlower share-based compensation asexpense of $3.9 million and a result of workforce reductionsweaker Australian and Canadian dollar relative to the U.S. dollar in 2016 and other administrative cost reductions.
2023 compared to 2022 resulted in a $2.1 million decrease in SG&A expense. The decrease in share-based compensation expense was due to a relative decrease in our share price during 2023 compared to 2022.
Depreciation and Amortization Expense.Depreciation and amortization expense decreased $4.9$12.1 million, or 4%14%, in 20172023 compared to 20162022. The decrease was primarily due to reduced(i) the sale of our wellsite and offshore businesses in the U.S. in the second half of 2022, (ii) certain assets becoming fully depreciated in Canada in the second quarter of 2023 and (iii) lower depreciation and amortization expense resulting from impairments recordeddue to a weaker Australian and Canadian dollar relative to the U.S. dollar in 2016,2023 compared to 2022. This was partially offset by increased depreciationthe shortening of the useful lives on certain assets in Canada, including the McClelland Lake Lodge.
Impairment Expense. We recorded pre-tax impairment expense of $1.4 million in 2023 associated with an enterprise information system placedlong-lived assets in service in 2017.Impairment Expense. Impairmentthe U.S. We recorded pre-tax impairment expense of $31.6$5.7 million in 2017 consisted of:
| ●
| Pre-tax impairment losses of $27.2 million related to certain lodge2022 associated with long-lived assets in the southern oil sands in our Canadian segment; and
|
| ●
| Pre-tax impairment losses of $4.4 million related to leasehold improvements and undeveloped land positions in our Canadian segment.
|
Impairment expense of $46.1 million in 2016 consisted of:
| ●
| Pre-tax impairment losses of $37.7 million related to mobile camp assets and certain undeveloped land positions in the British Columbia LNG market in our Canadian segment; and
|
| ●
| Pre-tax impairment losses of $8.4 million related to the impairment of fixed assets in our U.S. segment.
|
Please seethe U.S. and our Australian reporting unit.
See Note
34 - Impairment
Charges to the notes to the consolidated financial statements included in Item 8 of this annual report for further discussion.
Gain on Sale of McClelland Lake Lodge Assets, net. We recorded $18.6 million in 2023 related to net gains associated with the sale of the McClelland Lake Lodge. The remaining net gains related to the sale of the McClelland Lake Lodge will be recognized in the first quarter of 2024.
Operating Loss. Consolidated operating lossIncome. Operating income increased $2.2$22.5 million, or 2%132%, in 20172023 compared to 20162022 primarily due to lower contracted ratesa net gain on sale of McClelland Lake Lodge assets, higher activity levels in Canada and higher SG&A expenses, partially offset by lower impairment expenseAustralia and lower depreciation and amortization expenseand impairment expenses in 20172023 compared to 2016.2022. These items were partially offset by reduced mobile asset activity in Canada and increased operating costs due to inflationary pressures in 2023 compared to 2022.
Interest Expense and Interest(Expense) Income, net.Net interest expense decreased by $0.7increased $1.6 million, or 3%14%, in 20172023 compared to 20162022 primarily duerelated to lower amounts outstanding under our revolving credit facilities in 2017 as compared to 2016, offset by increases from the 2017 write-off of $0.8 million of debt issuance costs associated with an amendment to the Credit Agreement (as compared to a $0.3 million write-off of debt issuance costs in the first quarter 2016) and higher interest rates on term loan and revolving credit facility borrowings.Income Tax Benefit. Ourborrowings during 2023 compared to 2022, partially offset by lower average debt levels.
Other Income. Consolidated other income tax benefit for the year ended December 31, 2017 totaled $13.5increased $8.7 million, or 11.4% of pretax loss,170%, in 2023 compared to a benefit2022. Other income in 2023 included $9.7 million in reimbursements associated with the dismantlement of $20.1 million, or 17.3%the McClelland Lake Lodge. In addition, 2023 included gains related to the sale of pretax loss, for the year ended December 31, 2016. Our effective tax rate in 2017 was lower than the Canadian statutory rate of 27%, primarily due to losses in Australia and the U.S. for which no tax benefit was recorded. As a result, a valuation allowance of $13.2 million was established against net deferred taxour Acadian Acres accommodation assets in the U.S. and Australia. In addition, a valuation allowancegain on the settlement of $5.9 million was established against net deferred tax assetsan ARO in Canada. Other income in 2022 included $4.7 million in gains on the sale of assets primarily related to our Kambalda village and undeveloped land holdings in Australia, our wellsite and offshore businesses in the U.S. and various mobile assets across Canada, Australia and the U.S.
Income Tax (Expense) Benefit. Our income tax expense for 2023 totaled $10.6 million, or 26.3% of pretax income, compared to an expense of $4.4 million, or 41.0% of pretax income for 2022. Our effective tax rate in 2016for 2023 and 2022 was lowerhigher than the Canadian federal statutory rate of 27%15%, primarily due to lossespre-tax income in Australia being taxed at the higher Australian income tax rate of 30%. Additionally, due to the full valuation allowances maintained in both Canada and the U.S., no tax expense or benefit was recorded related to pre-tax income in Canada and the U.S. for which noIn 2023, tax benefitexpense in Canada and the U.S. was recorded. As a result,offset by a valuation allowance release of $15.1$1.7 million and $0.8 million, respectively. In 2022, tax expense in Canada
was
established against net deferredoffset by a valuation allowance release of $0.6 million and the tax
assetsbenefit in the U.S.
and Australia.was offset by an increase to the valuation allowance of $1.0 million.
Other ComprehensiveIncome (Loss)(Loss).Other comprehensive income increased $31.6$28.0 million in 20172023 compared to 20162022 primarily as a result of foreign currency translation adjustments due to changes in the Canadian and Australian dollar exchange rates compared to the U.S. dollar. The Canadian dollar exchange rate compared to the U.S. dollar increased 7% from December 31, 2016 to December 31, 20172.4% in 2023 compared to a 3% increase from December 31, 2015 to December 31, 2016.6.4% decrease in 2022. The Australian dollar exchange rate compared to the U.S. dollar increased 8% from December 31, 2016 to December 31, 20170.2% in 2023 compared to a 1%6.5% decrease from December 31, 2015 to December 31, 2016.
in 2022.
Segment Results of Operations
– Canadian Segment
| | | Year Ended December 31, | |
| | | 2017 | | | 2016 | | | Change | |
Revenues ($ in thousands) | | | | | | | | | | | | |
Lodge revenue (1) | | $ | 226,789 | | | $ | 238,220 | | | $ | (11,431 | ) |
Mobile, open camp and product revenue | | | 18,806 | | | | 40,244 | | | | (21,438 | ) |
Total revenues | | $ | 245,595 | | | $ | 278,464 | | | $ | (32,869 | ) |
| | | | | | | | | | | | | |
Cost of sales and services ($ in thousands) | | $ | 171,677 | | | $ | 190,878 | | | $ | (19,201 | ) |
| | | | | | | | | | | | | |
Gross margin as a % of revenues | | | 30.1 | % | | | 31.5 | % | | | (1.4% | ) |
| | | | | | | | | | | | | |
Average available lodge rooms (2) | | | 14,720 | | | | 14,653 | | | | 67 | |
| | | | | | | | | | | | | |
Rentable rooms for lodges (3) | | | 8,642 | | | | 9,979 | | | | (1,337 | ) |
| | | | | | | | | | | | | |
Average daily rate for lodges (4) | | $ | 92 | | | $ | 104 | | | $ | (12 | ) |
| | | | | | | | | | | | | |
Occupancy in lodges (5) | | | 78 | % | | | 63 | % | | | 15 | % |
| | | | | | | | | | | | | |
Average Canadian dollar to U.S. dollar | | $ | 0.771 | | | $ | 0.755 | | | $ | 0.016 | |
| (1)
| Includes revenue related to rooms as well as the fees associated with catering, laundry and other services, including facilities management.
|
| (2)
| Average available rooms include rooms that are utilized for our personnel.
|
| (3)
| Rentable rooms exclude rooms that are utilized for our personnel and out-of-service rooms.
|
| (4)
| Average daily rate is based on rentable rooms and lodge/village revenue.
|
| (5)
| Occupancy represents total billed days divided by rentable days. Rentable days excludes staff rooms and out-of-service rooms
|
| | | | | | | | | | | | | | | | | |
| | Year Ended
December 31, |
| | 2023 | | 2022 | | Change |
| Revenues ($ in thousands) | | | | | |
Accommodation revenue (1) | $ | 266,926 | | | $ | 279,455 | | | $ | (12,529) | |
Mobile facility rental revenue (2) | 61,899 | | | 96,400 | | | (34,501) | |
Food service and other services revenue (3) | 23,970 | | | 20,142 | | | 3,828 | |
| | | | | |
| Total revenues | $ | 352,795 | | | $ | 395,997 | | | $ | (43,202) | |
| | | | | |
| Cost of sales and services ($ in thousands) | | | | | |
| Accommodation cost | $ | 195,843 | | | $ | 204,592 | | | $ | (8,749) | |
| Mobile facility rental cost | 49,073 | | | 60,055 | | | (10,982) | |
| Food service and other services cost | 21,821 | | | 18,372 | | | 3,449 | |
| | | | | |
| Indirect other cost | 10,330 | | | 10,557 | | | (227) | |
| Total cost of sales and services | $ | 277,067 | | | $ | 293,576 | | | $ | (16,509) | |
| | | | | |
| Gross margin as a % of revenues | 21.5 | % | | 25.9 | % | | (4.4) | % |
| | | | | |
Average daily rate for lodges (4) | $ | 97 | | | $ | 100 | | | $ | (3) | |
| | | | | |
Total billed rooms for lodges (5) | 2,710,784 | | | 2,759,521 | | | (48,737) | |
| | | | | |
| Average Canadian dollar to U.S. dollar | $ | 0.741 | | | $ | 0.769 | | | $ | (0.028) | |
(1)Includes revenues related to lodge rooms and hospitality services for owned rooms for the periods presented.
(2)Includes revenues related to mobile assets for the periods presented.
(3)Includes revenues related to food service, laundry and water and wastewater treatment services for the periods presented.
(4)Average daily rate is based on billed rooms and accommodation revenue.
(5)Billed rooms represents total billed days for owned assets for the periods presented.
Our Canadian segment
reported revenues in 20172023 that were $32.9$43.2 million, or 12%11%, lower than 2016.2022. The strengtheningweakening of the average exchange ratesrate for the Canadian dollar relative to the U.S. dollar by 2%3.6% in 20172023 compared to 20162022 resulted in a $5.3$13.9 million year-over-year increaseperiod-over-period decrease in revenues. In addition, excludingExcluding the impact of the strongerweaker Canadian exchange rates,rate, the segment experienced a 7% decline in lodge revenues, primarily due torevenue decrease was driven by (i) reduced mobile asset activity from pipeline projects and (ii) lower rates, partially offset by increased occupanciesbilled rooms at some of our lodges. Finally, mobile, open camp and product revenues declined due to overall lower activity levels.
Our Canadian segment cost of sales and
services decreased $19.2$16.5 million, or 10%6%, in 20172023 compared to 2016, primarily due2022. The weakening of the average exchange rate for the Canadian dollar relative to the declineU.S. dollar by 3.6% in 2023 compared to 2022 resulted in a $10.8 million period-over-period decrease in cost of sales and services. Excluding the impact of the weaker Canadian exchange rate, the decrease in cost of sales and services was driven by lower costs related to the reduced mobile open campasset activity and productreduced activity as well as a focus on cost containment and operational efficiencies.at certain lodges.
Our Canadian segment gross margin as a percentage of
revenues decreased from 31%25.9% in 20162022 to 30%21.5% in 20172023. This decrease was primarily due to lower rates, partially offsetdriven by lowerreduced margins from our mobile asset activity as certain higher margin components were recognized over the initial contract terms through late 2022, with 2023 representing mobile camp activity winding down. In addition, mobile camp demobilization costs due to a focus on cost containment and operational efficiencies.of approximately $6.5 million were incurred in the second half of 2023.
Segment Results of Operations
– Australian Segment
| | | Year Ended December 31, | |
| | | 2017 | | | 2016 | | | Change | |
Revenues ($ in thousands) | | | | | | | | | | | | |
Village revenue (1) | | $ | 111,221 | | | $ | 106,815 | | | $ | 4,406 | |
Total revenues | | | 111,221 | | | | 106,815 | | | | 4,406 | |
| | | | | | | | | | | | | |
Cost of sales ($ in thousands) | | $ | 55,722 | | | $ | 51,688 | | | $ | 4,034 | |
| | | | | | | | | | | | | |
Gross margin as a % of revenues | | | 49.9 | % | | | 51.6 | % | | | (1.7 | %) |
| | | | | | | | | | | | | |
Average available village rooms (2) | | | 9,369 | | | | 9,335 | | | | 34 | |
| | | | | | | | | | | | | |
Rentable rooms for villages (3) | | | 8,739 | | | | 8,679 | | | | 60 | |
| | | | | | | | | | | | | |
Average daily rate for villages (4) | | $ | 80 | | | $ | 76 | | | $ | 4 | |
| | | | | | | | | | | | | |
Occupancy in Villages (5) | | | 43 | % | | | 44 | % | | | (1 | %) |
| | | | | | | | | | | | | |
Average Australian dollar to U.S. dollar | | $ | 0.767 | | | $ | 0.744 | | | $ | 0.023 | |
| (1)
| Includes revenue related to rooms as well as the fees associated with catering, laundry and other services, including facilities management.
|
| (2)
| Average available rooms include rooms that are utilized for our personnel.
|
| (3)
| Rentable rooms exclude rooms that are utilized for our personnel and out-of-service rooms.
|
| (4)
| Average daily rate is based on rentable rooms and lodge/village revenue.
|
| (5)
| Occupancy represents total billed days divided by rentable days. Rentable days excludes staff rooms and out-of-service rooms.
|
| | | | | | | | | | | | | | | | | |
| | Year Ended
December 31, |
| | 2023 | | 2022 | | Change |
| Revenues ($ in thousands) | | | | | |
Accommodation revenue (1) | $ | 177,834 | | | $ | 152,714 | | | $ | 25,120 | |
Food service and other services revenue (2) | 158,929 | | | 125,538 | | | 33,391 | |
| Total revenues | $ | 336,763 | | | $ | 278,252 | | | $ | 58,511 | |
| | | | | |
| Cost of sales ($ in thousands) | | | | | |
| Accommodation cost | $ | 85,461 | | | $ | 73,325 | | | $ | 12,136 | |
| Food service and other services cost | 148,599 | | | 119,957 | | | 28,642 | |
| Indirect other cost | 8,951 | | | 7,662 | | | 1,289 | |
| Total cost of sales and services | $ | 243,011 | | | $ | 200,944 | | | $ | 42,067 | |
| | | | | |
| Gross margin as a % of revenues | 27.8 | % | | 27.8 | % | | — | % |
| | | | | |
Average daily rate for villages (3) | $ | 75 | | | $ | 75 | | | $ | — | |
| | | | | |
Total billed rooms for villages (4) | 2,371,763 | | | 2,024,068 | | | 347,695 | |
| | | | | |
| Australian dollar to U.S. dollar | $ | 0.665 | | | $ | 0.695 | | | $ | (0.030) | |
(1)Includes revenues related to village rooms and hospitality services for owned rooms for the periods presented.
(2)Includes revenues related to food service and other services, including facilities management, for the periods presented.
(3)Average daily rate is based on billed rooms and accommodation revenue.
(4)Billed rooms represents total billed days for owned assets for the periods presented.
Our Australian segment
reported revenues in
20172023 that were $4.4$58.5 million, or 4%21%, higher than 2016.2022. The strengtheningweakening of the average exchange ratesrate for Australian dollars relative to the U.S. dollar by 3%4.3% in 2017the 2023 compared to 20162022 resulted in a $3.2$14.9 million year-over-year increaseperiod-over-period decrease in revenues. Excluding the impact of the strongerweaker Australian exchange rates,rate, the increase in the Australian segment experienced a 1% increase in revenues due towas driven by increased occupancyactivity at our villages in Western Australian, offset by reduced occupancy at ourCiveo owned villages in the Bowen Basin. Occupancy increasedBasin and Gunnedah Basin and our integrated services villages in Western Australia during 2017, with increased activity from anchor tenants at both our Western Australian village locations. Reduced occupancy in the Bowen Basin is primarily a result of the slowdown in mining activity.Australia.
Our Australian segment cost of sales
and services increased
$4.0$42.1 million, or 8%21%, in 20172023 compared to 2016.2022. The weakening of the average exchange rate for Australian dollars relative to the U.S. dollar by 4.3% in 2023 compared to 2022 resulted in a $10.8 million period-over-period decrease in cost of sales and services. Excluding the impact of the weaker Australian exchange rate, the increase in cost of sales and services was largely driven by higherincreased occupancy levels at our Civeo owned villages in the Bowen Basin and Gunnedah Basin and our integrated services villages in Western Australian, as well as the strengthening of the Australian dollar.Australia and increased operating costs due to inflationary pressures.
Our Australian segment gross margin as a percentage of revenues
decreased to 50%remained constant at 27.8% in
2017both 2023 and 2022. The increased revenue contribution in 2023 from
52%our integrated services business, which has a service only-business model and therefore generates lower overall margins than our accommodation business, had a negative impact on margins in
2016.2023. This
negative impact was
primarily drivenoffset by
reduced take-or-pay revenues on expired contracts compared to 2016.Segment Results of Operations – United States Segment
| | | Year Ended December 31, | |
| | | 2017 | | | 2016 | | | Change | |
| | | | | | | | | | | | | |
Revenues ($ in thousands) | | $ | 25,460 | | | $ | 11,951 | | | $ | 13,509 | |
| | | | | | | | | | | | | |
Cost of sales ($ in thousands) | | $ | 29,859 | | | $ | 17,084 | | | $ | 12,775 | |
| | | | | | | | | | | | | |
Gross margin as a % of revenues | | | (17.3% | ) | | | (43.0% | ) | | | 25.7 | % |
Our U.S. segment revenues in 2017 were $13.5 million, or 113%, higher than 2016. The increase was primarily due to greater U.S. drilling activityimproved margins at Civeo owned villages in the Bakken, RockiesBowen Basin and Texas markets and higher revenues from our offshore business.
Our U.S. cost of sales increased $12.8 million, or 75%, in 2017 compared to 2016. The increase was driven by greater U.S. drilling activity in the Bakken, Rockies and Texas markets, greater activity in the offshore business and costs to move mobile camp assets into two new markets.
Our U.S. segment gross margin as a percentage of revenues increased from (43%) in 2016 to (17%) in 2017, primarily due to increased activity in the Bakken, Rockies and Texas markets.
Results of Operations – Year Ended December 31, 2016 Compared to Year Ended December 31, 2015
| | | Year Ended December 31, | |
| | | 2016 | | | 2015 | | | Change | |
| | | ($ in thousands) | |
Revenues | | | | | | | | | | | | |
Canada | | $ | 278,464 | | | $ | 344,249 | | | $ | (65,785 | ) |
Australia | | | 106,815 | | | | 135,964 | | | | (29,149 | ) |
United States and other | | | 11,951 | | | | 37,750 | | | | (25,799 | ) |
Total revenues | | | 397,230 | | | | 517,963 | | | | (120,733 | ) |
Costs and expenses | | | | | | | | | | | | |
Cost of sales and services | | | | | | | | | | | | |
Canada | | | 190,878 | | | | 230,713 | | | | (39,835 | ) |
Australia | | | 51,688 | | | | 60,585 | | | | (8,897 | ) |
United States and other | | | 17,084 | | | | 36,315 | | | | (19,231 | ) |
Total cost of sales and services | | | 259,650 | | | | 327,613 | | | | (67,963 | ) |
Selling, general and administrative expenses | | | 55,297 | | | | 68,441 | | | | (13,144 | ) |
Depreciation and amortization expense | | | 131,302 | | | | 152,990 | | | | (21,688 | ) |
Impairment expense | | | 46,129 | | | | 122,926 | | | | (76,797 | ) |
Other operating expense (income) | | | 612 | | | | (9,004 | ) | | | 9,616 | |
Total costs and expenses | | | 492,990 | | | | 662,966 | | | | (169,976 | ) |
Operating loss | | | (95,760 | ) | | | (145,003 | ) | | | 49,243 | |
| | | | | | | | | | | | | |
Interest expense and income, net | | | (22,817 | ) | | | (22,026 | ) | | | (791 | ) |
Other income (expense) | | | 2,645 | | | | 3,276 | | | | (631 | ) |
Loss before income taxes | | | (115,932 | ) | | | (163,753 | ) | | | 47,821 | |
Income tax benefit | | | 20,105 | | | | 33,089 | | | | (12,984 | ) |
Net loss | | | (95,827 | ) | | | (130,664 | ) | | | 34,837 | |
Less: Net income attributable to noncontrolling interest | | | 561 | | | | 1,095 | | | | (534 | ) |
Net loss attributable to Civeo | | $ | (96,388 | ) | | $ | (131,759 | ) | | $ | 35,371 | |
We reported net loss attributable to Civeo for the year ended December 31, 2016 of $96.4 million, or $0.90 per diluted share. As further discussed below, net loss included (i) a $46.1 million pre-tax loss ($35.9 million after-tax, or $0.34 per diluted share) resulting from the impairment of fixed assets, included in Impairment expense, and (ii) a $1.3 million pre-tax loss ($1.2 million after-tax, or $0.01 per diluted share) from costs incurred in connection with the Redomicile Transaction, included in SG&A expense below.
We reported net loss attributable to Civeo for the year ended December 31, 2015 of $131.8 million, or $1.24 per diluted share. As further discussed below, net loss included the following items:
| ●
| an $80.7 million pre-tax loss ($56.0 million after-tax, or $0.52 per diluted share) resulting from the impairment of fixed assets and intangible assets, included in Impairment expense below;
|
| ●
| a $43.2 million pre-tax loss ($43.2 million after-tax, or $0.40 per diluted share) resulting from the impairment of goodwill in our Canadian reporting unit, included in Impairment expense below;
|
| ●
| a $7.0 million pre-tax loss ($4.6 million after-tax, or $0.05 per diluted share) from costs incurred in connection with the Redomicile Transaction, included in Selling, general and administrative (SG&A) expense below; and
|
| ●
| a $1.5 million pre-tax loss ($1.5 million after-tax, or $0.01 per diluted share) from the write off of debt issuance costs, included in Interest expense and income, net below.
|
Revenues. Consolidated revenues decreased $120.7 million, or 23%, in 2016 compared to 2015. This decline was largely driven by decreases in Canada due to lower room rates, and in Australia and the U.S. due to lower occupancy, as well as weaker Canadian dollar in 2016 compared to 2015. Please see the discussion of segment results of operations below for further information.
Cost of Sales and Services. Our consolidated cost of sales decreased $68.0 million, or 21%, in 2016 compared to 2015, primarily due to decreases in occupancy in both Canada and Australia, as well as the weaker Canadian dollar in 2016 compared to 2015. Please see the discussion of segment results of operations below for further information.
Selling, General and Administrative Expenses. SG&A expense decreased $13.1 million, or 19%, in 2016 compared to 2015. This decrease was primarily due to reduced compensationGunnedah Basin as a result of workforce reductionsincreased activity and improved margins in 2016 and 2015, lower professional fees due to lower costs associated with the Redomicile Transaction, lower bad debt expense when compared to 2015, lower incentive compensation costs and the impact of the weaker Canadian dollar. These items were partially offset by higher share based compensation expense associated with phantom share awards. The increase in share based compensation was largely due to an increase in our share price during 2016. We use current market prices to remeasure these awards at each reporting date.
Depreciation and Amortization Expense. Depreciation and amortization expense decreased $21.7 million, or 14%, in 2016 compared to 2015, primarilyintegrated services business due to reduced depreciation expense resultingcosts realized from impairments recorded in 2015, as well as the impact of the weaker Canadian dollar.
Impairment Expense. Impairment expense of $46.1 million in 2016 consisted of:
| ●
| Pre-tax impairment losses of $37.7 million related to mobile camp assets and certain undeveloped land positions in the British Columbia LNG market in our Canadian segment; and
|
| ●
| Pre-tax impairment losses of $8.4 million related to the impairment of fixed assets in our U.S. segment.
|
Impairment expense of $122.9 million in 2015 consisted of:
| ●
| Pre-tax impairment losses of $33.5 million related to fixed assets in our Australian segment;
|
| ●
| Pre-tax impairment totaling $2.7 million in 2015 related to a decision to sell our U.S. manufacturing facility;
|
| ●
| Goodwill impairment losses of $43.2 million in our Canadian reporting unit;
|
| ●
| Pre-tax impairment losses totaling $20.5 million associated with long-lived assets in our U.S. segment; and
|
| ●
| Pre-tax impairment losses totaling $23.0 million associated with long-lived assets in our Canadian segment.
|
Please see Note 3 - Impairment Charges to the notes to the consolidated financial statements in Item 8 of this annual report for further discussion.
Other Operating Expense (Income). Other operating expense (income) decreased from income of $9.0 million in 2015 to an expense of $0.6 million in 2016. The 2015 income was primarily due to foreign currency gains on the remeasurement of U.S. dollar denominated cash in Canadian bank accounts, as a result of the strengthening of the U.S. dollar.
Operating Loss. Consolidated operating loss decreased $49.2 million, or 34%, in 2016 compared to 2015, primarily due to lower impairment expenseour inflation mitigation plan in the 2016 period, partially offset by lower occupancy levels in Canada and Australia and the weaker Canadian dollar.
Interest Expense and Interest Income, net. Net interest expense increased by $0.8 million, or 4%, in 2016 compared to 2015, primarily resulting from decreased interest income due to lower average cash balances in 2016 as compared to 2015 and lower capitalized interest in 2016. This was partially offset by decreased interest expense associated with lower amounts outstanding under the Amended Credit Agreement and the 2015 write-off of $1.5 million of debt issuance costs associated with the Amended Credit Agreement.
Income Tax Benefit. Our income tax benefit for the year ended December 31, 2016 totaled $20.1 million, or 17.3% of pre-tax income, compared to a benefit of $33.1 million, or 20.2% of pre-tax income, for the year ended December 31, 2015. Our effective tax rate in 2016 was lower than the Canadian statutory rate of 27%, primarily due to losses in Australia and the U.S. for which no tax benefit was recorded. As a result, a valuation allowance of $15.1 million was established against net deferred tax assets in the U.S. and Australia.
In 2015, our income tax benefit and effective tax rate were impacted by the effect of non-deductible goodwill charges, dividend income generated as part of a global restructuring, foreign tax credits, the reversal of deferred tax liabilities recorded on a portion of our unremitted earnings of approximately $25.3 million and a valuation allowance of $11.2 million was established against net deferred tax assets in the U.S. and Australia.
Other Comprehensive Income (Loss). Other comprehensive income increased $171.8 million in 2016 compared to 2015 primarily as a result of foreign currency translation adjustments, due to changes in the Canadian and Australian dollar exchange rates compared to the U.S. dollar. The Canadian dollar exchange rate compared to the U.S. dollar increased 3% from December 31, 2015 to December 31, 2016 compared to a 16% decrease from December 31, 2014 to December 31, 2015. The Australian dollar exchange rate compared to the U.S. dollar decreased 1% from December 31, 2015 to December 31, 2016 compared to a 11% decrease from December 31, 2014 to December 31, 2015.
year.
Segment Results of Operations – Canadian Segment
| | | Year Ended December 31, | |
| | | 2016 | | | 2015 | | | Change | |
Revenues ($ in thousands) | | | | | | | | | | | | |
Lodge revenue (1) | | $ | 238,220 | | | $ | 267,486 | | | $ | (29,266 | ) |
Mobile, open camp and product revenue | | | 40,244 | | | | 76,763 | | | | (36,519 | ) |
Total revenues | | $ | 278,464 | | | $ | 344,249 | | | $ | (65,785 | ) |
| | | | | | | | | | | | | |
Cost of sales and services ($ in thousands) | | $ | 190,878 | | | $ | 230,713 | | | $ | (39,835 | ) |
| | | | | | | | | | | | | |
Gross margin as a % of revenues | | | 31.5 | % | | | 33.0 | % | | | (1.5% | ) |
| | | | | | | | | | | | | |
Average available lodge rooms (2) | | | 14,653 | | | | 13,435 | | | | 1,218 | |
| | | | | | | | | | | | | |
Rentable rooms for lodges (3) | | | 9,979 | | | | 10,054 | | | | (75 | ) |
| | | | | | | | | | | | | |
Average daily rate for lodges (4) | | $ | 104 | | | $ | 121 | | | $ | (17 | ) |
| | | | | | | | | | | | | |
Occupancy in lodges (5) | | | 63 | % | | | 60 | % | | | 3 | % |
| | | | | | | | | | | | | |
Average Canadian dollar to U.S. dollar | | $ | 0.755 | | | $ | 0.783 | | | $ | (0.028 | ) |
| (1)
| Includes revenue related to rooms as well as the fees associated with catering, laundry and other services, including facilities management.
|
| (2)
| Average available rooms include rooms that are utilized for our personnel.
|
| (3)
| Rentable rooms exclude rooms that are utilized for our personnel and out-of-service rooms.
|
| (4)
| Average daily rate is based on rentable rooms and lodge/village revenue.
|
| (5)
| Occupancy represents total billed days divided by rentable days. Rentable days excludes staff rooms and out-of-service rooms
|
Our Canadian segment revenues in 2016 were $65.8 million, or 19%, lower than 2015. The weakening of the average exchange rates for the Canadian dollar relative to the U.S. dollar by 4%in 2016 compared to 2015 resulted in a $10.6 million year-over-year reduction in revenues. In addition, excluding the impact of the weaker Canadian exchange rates, the segment experienced an 8% decline in lodge revenues, primarily due to lower room rates. This decline was partially mitigated by room needs related to the Fort McMurray fires. Finally, mobile, open camp and product revenues all declined due to overall lower activity levels.
Our Canadian segment cost of sales and services decreased $39.8 million, or 17%, in 2016 compared to 2015, primarily due to the decline in mobile and open camp activity, as well as a focus on cost containment and operational efficiencies. Additionally, the weakening of the average exchange rates for the Canadian dollar resulted in reduced cost of sales.
Our Canadian segment gross margin as a percentage of revenues decreased from 33% in 2015 to 31% in 2016, primarily due to lower contracted room rates, partially offset by room needs related to the Fort McMurray fires and lower costs due to a focus on cost containment and operational efficiencies.
Segment Results of Operations – Australian Segment
| | | Year Ended December 31, | |
| | | 2016 | | | 2015 | | | Change | |
Revenues ($ in thousands) | | | | | | | | | | | | |
Village revenue (1) | | $ | 106,815 | | | $ | 135,964 | | | $ | (29,149 | ) |
Total revenues | | | 106,815 | | | | 135,964 | | | | (29,149 | ) |
| | | | | | | | | | | | | |
Cost of sales ($ in thousands) | | $ | 51,688 | | | $ | 60,585 | | | $ | (8,897 | ) |
| | | | | | | | | | | | | |
Gross margin as a % of revenues | | | 51.6 | % | | | 55.4 | % | | | (3.8% | ) |
| | | | | | | | | | | | | |
Average available village rooms (2) | | | 9,335 | | | | 9,180 | | | | 155 | |
| | | | | | | | | | | | | |
Rentable rooms for villages (3) | | | 8,679 | | | | 8,862 | | | | (183 | ) |
| | | | | | | | | | | | | |
Average daily rate for villages (4) | | $ | 76 | | | $ | 74 | | | $ | 2 | |
| | | | | | | | | | | | | |
Occupancy in Villages (5) | | | 44 | % | | | 56 | % | | | (12% | ) |
| | | | | | | | | | | | | |
Average Australian dollar to U.S. dollar | | $ | 0.744 | | | $ | 0.752 | | | $ | (0.008 | ) |
| (1)
| Includes revenue related to rooms as well as the fees associated with catering, laundry and other services, including facilities management.
|
| (2)
| Average available rooms include rooms that are utilized for our personnel.
|
| (3)
| Rentable rooms exclude rooms that are utilized for our personnel and out-of-service rooms.
|
| (4)
| Average daily rate is based on rentable rooms and lodge/village revenue.
|
| (5)
| Occupancy represents total billed days divided by rentable days. Rentable days excludes staff rooms and out-of-service rooms.
|
Our Australian segment revenues in 2016 were $29.1 million, or 21%, lower than 2015. The weakening of the average exchange rates for Australian dollars relative to the U.S. dollar by 1% in 2016 compared to 2015 resulted in a $1.2 million year-over-year reduction in revenues. Excluding the impact of the weaker Australian exchange rates, the segment experienced a 20% decline in revenues due to lower occupancy levels in 2016 compared to 2015, primarily as a result of the continued slowdown in mining activity.
Our Australian segment cost of sales decreased $8.9 million, or 15%, in 2016 compared to 2015. The decrease was driven by lower occupancy levels.
Our Australian segment gross margin as a percentage of revenues decreased to 52% in 2016 from 55% in 2015. This was primarily driven by reduced revenues from take or pay contracts and lower occupancy compared to 2015.
Segment Results of Operations – United States Segment
| | | Year Ended December 31, | |
| | | 2016 | | | 2015 | | | Change | |
| | | | | | | | | | | | | |
Revenues ($ in thousands) | | $ | 11,951 | | | $ | 37,750 | | | $ | (25,799 | ) |
| | | | | | | | | | | | | |
Cost of sales ($ in thousands) | | $ | 17,084 | | | $ | 36,315 | | | $ | (19,231 | ) |
| | | | | | | | | | | | | |
Gross margin as a % of revenues | | | (43.0% | ) | | | 3.8 | % | | | (46.8% | ) |
Our United States segment revenues in 2016 were $25.8 million, or 68%, lower than 2015. The reduction was primarily due to continued lower U.S. drilling activity in the Bakken, Rockies and Texas markets and decreased sales in our offshore business.
Our United States cost of sales decreased $19.2 million, or 53%, in 2016 compared to 2015. The decrease was driven by overall lower activity levels.
Our United States segment gross margin as a percentage of revenues decreased from 4% in 2015 to (43%) in 2016, primarily due to overall lower activity levels, which were insufficient to cover the fixed cost structure of our United States segment.
Liquidity and Capital Resources
Our primary liquidity needs are to fund capital expenditures, which in the past have included expanding and improving our
accommodations,hospitality services, developing new lodges and villages
and purchasing or leasing land,
under our land banking strategy,to pay dividends, to repurchase common shares and for general working capital needs. In addition, capital has been used to repay debt
and fund strategic business
acquisitions and pay dividends.acquisitions. In the future, capital may be required to move lodges from one site to another. Historically, our primary sources of funds have been available cash, cash flow from operations, borrowings under
the Amendedour Credit Agreement and proceeds from our equity issuance.issuances. In the future, we may seek to access the debt and equity capital markets from time to time to raise additional capital, increase liquidity, fund acquisitions andor refinance debt.
The following summarizes our material future cash requirements at December 31, 2023, and the effect such obligations are expected to have on our liquidity and cash flow over the next five years (in thousands):
| | | | | | | | | | | | | | | | | | | | | | | | | | | | | |
| | Total | | Less Than 1
Year | | 1 – 3 Years | | 3 – 5 Years | | More
Than 5
Years |
| Debt maturities | $ | 65,554 | | | $ | — | | | $ | 65,554 | | | $ | — | | | $ | — | |
Interest payments(1) | 10,236 | | | 6,031 | | | 4,205 | | | — | | | — | |
| Purchase obligations | 11,064 | | | 11,064 | | | — | | | — | | | — | |
| Non-cancelable lease obligations | 15,713 | | | 4,563 | | | 6,531 | | | 4,065 | | | 554 | |
| Asset retirement obligations – expected cash payments | 68,645 | | | 2,576 | | | 2,066 | | | 2,365 | | | 61,638 | |
| Total contractual cash obligations | $ | 171,212 | | | $ | 24,234 | | | $ | 78,356 | | | $ | 6,430 | | | $ | 62,192 | |
(1)Interest payments due under the Credit Agreement, which matures on September 8, 2025; based on an interest rate of 9.2% for Canadian revolver borrowings.
Our debt obligations at December 31, 2023 are reflected in our consolidated balance sheet, which is a part of our consolidated financial statements in Item 8 of this annual report. We have not entered into any material leases subsequent to December 31, 2023.
The following table summarizes our consolidated liquidity position as of December 31,
20172023 and
2016:| | | December 31, 2017 | | | December 31, 2016 | |
Lender commitments (1) | | $ | 275,000 | | | $ | 350,000 | |
Reductions in availability (2) | | | (165,845 | ) | | | (144,803 | ) |
Borrowings against revolving credit capacity | | | -- | | | | (39,129 | ) |
Outstanding letters of credit | | | (1,773 | ) | | | (1,571 | ) |
Unused availability | | | 107,382 | | | | 164,497 | |
Cash and cash equivalents | | | 32,647 | | | | 1,785 | |
Total available liquidity | | $ | 140,029 | | | $ | 166,282 | |
| (1)
| We also have a A$2.0 million bank guarantee facility. We had bank guarantees of A$0.8 million and A$0.8 million under this facility outstanding as of December 31, 2017 and 2016, respectively.
|
| (2)
| As of December 31, 2017 and 2016, $165.8 million and $144.8 million, respectively, of our borrowing capacity under the Amended Credit Agreement could not be utilized in order to maintain compliance with the maximum leverage ratio financial covenant in the Amended Credit Agreement.
|
2022 (in thousands):
| | | | | | | | | | | |
| December 31, |
| | 2023 | | 2022 |
| Lender commitments | $ | 200,000 | | | $ | 200,000 | |
| | | |
| Borrowings against revolving credit capacity | (65,554) | | | (102,505) | |
| Outstanding letters of credit | (1,353) | | | (1,365) | |
| Unused availability | 133,093 | | | 96,130 | |
| Cash and cash equivalents | 3,323 | | | 7,954 | |
| Total available liquidity | $ | 136,416 | | | $ | 104,084 | |
Cash
totaling $56.8$96.6 million was provided by operations during 20172023 compared to $62.1$91.8 million provided by operations during 20162022. During 2023 and $186.1 million during 2015. The decreases in operating cash flow in 2017 compared to 2016 and in 2016 compared to 2015, primarily were due to lower revenue resulting from reduced rates and occupancy levels in lodges and villages. Net cash provided by changes in operating assets and liabilities was $1.2 million during 2017 compared to2022, net cash used in changes in operating assetsfor working capital was $1.6 million and liabilities of $13.5$13.9 million, during 2016 and net cash provided by changes in operating assets and liabilities of $67.3 million during 2015. The increase in 2017 compared to 2016 was primarily the result of increased accounts payable, offset by increased accounts receivable.respectively. The decrease in 2016cash used for working capital in 2023 compared to 2015 was primarily the result2022 is largely due to payments received from a customer for village enhancements in Australia and other working capital changes driven by timing of a greater reduction in accounts receivable balancesreceipts and payments during 2015 than during 2016.2023 compared to 2022.
Cash was used in investing activities during 2017, 2016 and 20152023 totaled $14.5 million compared to cash used in the amountsinvesting activities during 2022 of $8.7 million, $12.7 million and $49.8 million, respectively.$8.9 million. The increase in cash used in investing activities was primarily due to higher capital expenditures. Capital expenditures totaled $11.2 million, $19.8$31.6 million and $62.5$25.4 million during 2023 and 2022, respectively. Capital expenditures in 2017 and 2016 consistedboth periods were primarily of routine maintenancerelated to maintenance. In addition, our 2023 capital expenditures as well as investmentsincluded approximately $10 million related to customer-funded infrastructure upgrades in an enterprise information system. Capital expendituresAustralia. We received net proceeds from the sale of property, plant and equipment of $16.7 million during 2023 primarily related to the sale of our McClelland Lake Lodge accommodation assets in 2015 consisted principallyCanada and Acadian Acres accommodation assets in the U.S., compared to $16.3 million during 2022 primarily related to the sale of costs for the constructionour Kambalda village and installation ofundeveloped land holdings in Australia, unused corporate office space and various mobile assets for our Sitka lodge in British ColumbiaCanada and our Mariana Lake lodgewellsite and offshore businesses in Alberta.
the U.S.
We expect our capital expenditures for
20182024 to be in the range of $15$30 million to $20$35 million, which excludes any expenditures for the proposed Noralta Acquisition and unannounced and uncommitted projects, the spending for which is contingent on obtaining customer contracts.contracts or commitments. Whether planned expenditures will actually be spent in 20182024 depends on industry conditions, project approvals and schedules, customer room commitments and project and construction timing. We expect to fund these capital expenditures with available cash, cash flow from operations and revolving credit borrowings under our Amended Credit Agreement. The foregoing capital expenditure forecast does not include any funds for strategic acquisitions, which we could pursue dependingshould the transaction economics be attractive enough to us compared to the current capital allocation priorities of debt reduction and return of capital to shareholders. We continue to monitor the global economy, commodity prices, demand for crude oil, met coal, LNG and iron ore, inflation and the resultant impact on the economic environmentcapital spending plans of our customers in order to plan our industrybusiness activities, and we may adjust our capital expenditure plans in the availability of transactions at prices deemed to be attractive to us.future.
The table below delineates historical capital expenditures split between
developmentexpansionary and maintenance spending on our lodges and villages,
land banking spending, mobile
and open campasset spending and other capital expenditures. We classify capital expenditures for
the development of rooms and central facilities at our lodges and villages as
developmentexpansion capital expenditures.
Land banking spending consists of land acquisition and initial permitting or zoning costs. Other capital expenditures in the table below relate to routine capital spending for support equipment, upgrades to infrastructure at our lodge and village properties and spending related to our manufacturing facilities, among other items.
We have also classified the expenditures between expansionary and maintenance spending.Based on
management’smanagement’s judgment of capital spending classifications, we believe the following table represents the components of capital expenditures for the years ended December 31, 2017, 20162023 and 20152022 (in millions):| | | Year Ended December 31, | |
| | | 2017 | | | 2016 | | | 2015 | |
| | | Expansion | | | Maint | | | Total | | | Expansion | | | Maint | | | Total | | | Expansion | | | Maint | | | Total | |
Development | | $ | 0.5 | | | $ | -- | | | $ | 0.5 | | | $ | 2.4 | | | $ | 0.7 | | | $ | 3.1 | | | $ | 28.7 | | | $ | 3.9 | | | $ | 32.6 | |
Lodge/village | | | -- | | | | 3.6 | | | | 3.6 | | | | 0.5 | | | | 3.6 | | | | 4.1 | | | | 3.5 | | | | 4.7 | | | | 8.2 | |
Land banking | | | -- | | | | -- | | | | -- | | | | 0.1 | | | | -- | | | | 0.1 | | | | 1.0 | | | | -- | | | | 1.0 | |
Mobile/open camp | | | 0.4 | | | | 1.4 | | | | 1.8 | | | | -- | | | | 0.1 | | | | 0.1 | | | | 1.1 | | | | 3.6 | | | | 4.7 | |
Other | | | 4.1 | | | | 1.2 | | | | 5.3 | | | | 11.8 | | | | 0.6 | | | | 12.4 | | | | 13.3 | | | | 2.7 | | | | 16.0 | |
Total | | $ | 5.0 | | | $ | 6.2 | | | $ | 11.2 | | | $ | 14.8 | | | $ | 5.0 | | | $ | 19.8 | | | $ | 47.6 | | | $ | 14.9 | | | $ | 62.5 | |
Development
| | | | | | | | | | | | | | | | | | | | | | | | | | | | | | | | | | | |
| | Year Ended December 31, |
| | 2023 | | 2022 |
| | Expansion | | Maint | | Total | | Expansion | | Maint | | Total |
| Lodge/village | $ | 12.8 | | | $ | 11.6 | | | $ | 24.4 | | | $ | 0.2 | | | $ | 19.7 | | | $ | 19.9 | |
| Mobile assets | 1.3 | | | — | | | 1.3 | | | — | | | 1.1 | | | 1.1 |
| Other | 2.4 | | | 3.5 | | | 5.9 | | | 2.0 | | | 2.4 | | 4.4 |
| Total | $ | 16.5 | | | $ | 15.1 | | | $ | 31.6 | | | $ | 2.2 | | | $ | 23.2 | | | $ | 25.4 | |
Expansion lodge and village spending in 20152023 was largely related to customer-funded infrastructure upgrades at three Australian villages.
Maintenance lodge and village spending in 2023 and 2022 was primarily associated with routine maintenance projects at our major properties.
Mobile asset spending in 2023 was primarily related to
the construction of our Sitka lodgean asset storage yard purchased in
British Columbia and our Mariana Lake lodge in Alberta.OtherCanada. Mobile asset spending in 2017 and 20162022 was primarily related to investmentsroutine maintenance of our mobile assets in an enterprise information system. the U.S. and Canadian markets.
Other
maintenance and expansion spending in
20152023 was primarily related to
investmentsmiscellaneous equipment and supplies to support the day-to-day operations at our accommodation and laundry facilities and information technology infrastructure to support our business. Other maintenance and expansion spending in
an enterprise2022 was primarily associated with mobilization of new sites at our integrated services business in Western Australia, purchases of miscellaneous equipment and supplies to support the day-to-day operations at our accommodation facilities and information
system and the completion of a water and wastewater treatment facility in Canada.Net cash of $18.1 million wastechnology infrastructure to support our business.
Cash used in financing activities during
2017,2023 of $86.8 million was primarily due to
net proceeds from our February 2017 equity offering of $64.7 million, offset by(i) net repayments under our revolving credit facilities of
$39.9$37.8 million,
(ii) repayments of term loan borrowings of
$40.8$29.9 million, (iii) repurchases of our common shares of $11.6 million and
debt issuance costs(iv) dividend payments of
$1.8$7.4 million.
Net cash of $58.3 million wasCash used in financing activities during
2016,2022 of $79.7 million was primarily due to
(i) repayments of term loan borrowings of
$41.0$30.4 million,
(ii) repurchases of our preferred shares and our common shares of $30.6 million and $14.2 million, respectively, (iii) net repayments
under our revolving credit facilities of
revolver borrowings$3.4 million, (iv) settlement of
$15.2tax obligations on vested shares under our share-based compensation plans of $1.0 million and
debt issuance costs(v) a cash dividend paid on our preferred shares in connection with the repurchase of
$2.1$0.1 million.
Net cash of $349.6 million was used in financing activities during 2015, primarily due to repayments of term loan borrowings of $729.4 million, offset by borrowings of term loans of $325 million and net revolver borrowings of $59.1 million.
The following table summarizes the changes in debt outstanding during 20172023 (in thousands):
| | | Canada | | | Australia | | | U.S. | | | Total | |
Balance at December 31, 2016 | | $ | 326,385 | | | $ | 6,507 | | | $ | 24,375 | | | $ | 357,267 | |
Borrowings under revolving credit facilities | | | 22,655 | | | | 4,970 | | | | 16,900 | | | | 44,525 | |
Repayments of borrowings under revolving credit facilities | | | (55,725 | ) | | | (11,837 | ) | | | (16,900 | ) | | | (84,462 | ) |
Repayments of term loans | | | (16,406 | ) | | | -- | | | | (24,375 | ) | | | (40,781 | ) |
Translation | | | 20,714 | | | | 360 | | | | -- | | | | 21,074 | |
Balance at December 31, 2017 | | $ | 297,623 | | | $ | -- | | | $ | -- | | | $ | 297,623 | |
We intend to fund the cash portion of the consideration for the Noralta Acquisition with cash on hand and borrowings under the Amended Credit Agreement. Our Amended Credit Agreement allows us to include in our leverage ratio calculation the trailing twelve months of an acquired company’s EBITDA on a pro forma combined basis. By including Noralta’s EBITDA in our leverage ratio calculation, our borrowing capacity under the Amended Credit Agreement increases, therefore allowing us to borrow the necessary funds to pay the cash consideration portion required by the Share Purchase Agreement. | | | | | | | | | | | | | | | | | | | |
| | Canada | | Australia | | | | Total |
| Balance as of December 31, 2022 | $ | 130,679 | | | $ | 1,358 | | | | | $ | 132,037 | |
| Borrowings under revolving credit facilities | 199,247 | | | 11,337 | | | | | 210,584 | |
| Repayments of borrowings under revolving credit facilities | (235,670) | | | (12,760) | | | | | (248,430) | |
| Repayments of term loans | (29,899) | | | — | | | | | (29,899) | |
| Translation | 1,197 | | | 65 | | | | | 1,262 | |
| Balance at December 31, 2023 | $ | 65,554 | | | $ | — | | | | | $ | 65,554 | |
We believe that cash on hand and cash flow from operations will be sufficient to meet our other anticipated liquidity needs infor the comingnext 12 months. If our plans or assumptions change, including as a result of changes in our customers' capital spending or changes in the price of and demand for natural resources, or are inaccurate, or if we make acquisitions, we may need to raise additional capital. Acquisitions have been, and our management believes acquisitions will continue to be, an element of our long-term business strategy. The timing, size or success of any acquisition effort and the associated potential capital commitments are unpredictable and uncertain. We may seek to fund all or part of any such efforts with proceeds from debt and/or equity issuances or may issue equity directly to the sellers. Our ability to obtain capital for additional projects to implement
our growth strategy over the longer term will depend on our future operating performance, financial condition and, more broadly, on the availability of equity and debt financing. Capital availability will be affected by prevailing conditions in our industry, the global economy, the global financial markets and other factors, many of which are beyond our control. In addition, any additional debt service requirements we take on could be based on higher interest rates and shorter maturities and could impose a significant burden on our results of operations and financial condition, and the issuance of additional equity securities could result in significant dilution to shareholders.
In August 2023, our Board authorized a common share repurchase program to repurchase up to 5.0% of our total common shares which are issued and outstanding, or 742,134 common shares, over a twelve month period. In addition,
our Board declared quarterly dividends of $0.25 per common share to shareholders of record as of close of business on September 15, 2023 and November 27, 2023. Dividend payments of $3.7 million were made on both September 29, 2023 and December 18, 2023. The dividends are eligible dividends pursuant to the Income Tax Act (Canada). See Note 17 – Share Repurchase Programs and Dividends to the notes to the consolidated financial statements included in
some cases, we may incur costs to acquire land and/or construct assets without securing a customer contract or prior to finalizationItem 8 of
an accommodations contract with a customer. If the contract is not obtained or the underlying investment decision is delayed, the resulting impact could result in an impairment of the related investment.Amended this annual report for further discussion.
Credit Agreement
On February 17, 2017,
As of December 31, 2023, our Credit Agreement (as then amended to date, the third amendmentCredit Agreement) provided for: (i) a $200.0 million revolving credit facility scheduled to mature on September 8, 2025, allocated as follows: (A) a $10.0 million senior secured revolving credit facility in favor of one of our U.S. subsidiaries, as borrower; (B) a $155.0 million senior secured revolving credit facility in favor of Civeo, as borrower; and (C) a $35.0 million senior secured revolving credit facility in favor of one of our Australian subsidiaries, as borrower, and (ii) a C$100.0 million term loan facility, which was fully repaid on December 31, 2023, in favor of Civeo.
As of December 31, 2023, we had outstanding letters of credit of $0.3 million under the U.S. facility, zero under the Australian facility and $1.1 million under the Canadian facility. We also had outstanding bank guarantees of A$0.8 million under the Australian facility.
See Note 11 - Debt to the notes to the consolidated financial statements in Item 8 of this annual report for the terms of the Credit Agreement
became effective, which: | ●
| provided for the reduction by $75 million of the aggregate revolving loan commitments under the Amended Credit Agreement, to a maximum principal amount of $275 million, allocated as follows: (1) a $40.0 million senior secured revolving credit facility in favor of certain of our U.S. subsidiaries, as borrowers; (2) a $90.0 million senior secured revolving credit facility in favor of Civeo and certain of our Canadian subsidiaries, as borrowers; (3) a $60.0 million senior secured revolving credit facility in favor of Civeo, as borrower; and (4) an $85.0 million senior secured revolving credit facility in favor of one of our Australian subsidiaries, as borrower;
|
| ●
| established one additional level to the total leverage-based grid such that the interest rates for the loans range from the London Interbank Offered Rate (LIBOR) plus 2.25% to LIBOR plus 5.50%, and increased the undrawn commitment fee from a range of 0.51% to 1.13% to a range of 0.51% to 1.24% based on total leverage;
|
| ●
| adjusted the maximum leverage ratio financial covenant for the relevant periods, as follows:
|
Period Ended
| Maximum Leverage Ratio
|
December 31, 2017
| 5.85 : 1.00
|
March 31, 2018
| 5.85 : 1.00
|
June 30, 2018
| 5.85 : 1.00
|
September 30, 2018
| 5.85 : 1.00
|
December 31, 2018
| 5.50 : 1.00
|
March 31, 2019 & thereafter
| 5.25 : 1.00
|
; and
further discussion regarding our debt.
Dividends
| ●
| provided for other technical changes and amendments to the Amended Credit Agreement.
|
The following table summarizes the revolving capacity available under the Amended Credit Agreement, as compared
We intend to
the second amendment to the Credit Agreement (in thousands): | | | Second Amendment to the Credit Agreement | | | Amended Credit Agreement | |
Total capacity under revolving credit facilities: | | | | | | | | |
U.S. revolving credit facility | | $ | 50,000 | | | $ | 40,000 | |
Canadian revolving credit facility | | | 100,000 | | | | 90,000 | |
New Canadian revolving credit facility | | | 100,000 | | | | 60,000 | |
Australian revolving credit facility | | | 100,000 | | | | 85,000 | |
Total capacity under revolving credit facilities | | $ | 350,000 | | | $ | 275,000 | |
U.S. dollar amounts outstanding under the facilities provided by the Amended Credit Agreement bear interest at a variable rate equal to LIBOR plus a margin of 2.25% to 5.50%, or a base rate plus 1.25% to 4.50%, in each case basedpay regular quarterly dividends on a ratio of our total leverage to EBITDA (as defined in the Amended Credit Agreement). Canadian dollar amounts outstanding bear interest at a variable rate equal to the Canadian Dollar Offered Rate plus a margin of 2.25% to 5.50%, or a base rate plus a margin of 1.25% to 4.50%, in each case based on a ratio of our consolidated total leverage to EBITDA. Australian dollar amounts outstanding under the Amended Credit Agreement bear interest at a variable rate equal to the Bank Bill Swap Bid Rate plus a margin of 2.25% to 5.50%, based on a ratio of our consolidated total leverage to EBITDA.
The Amended Credit Agreement contains customary affirmative and negative covenants that, among other things, limit or restrict: (i) subsidiary indebtedness, liens and fundamental changes; (ii) asset sales; (iii) acquisitions of margin stock; (iv) specified acquisitions; (v) certain restrictive agreements; (vi) transactions with affiliates; and (vii) investments and other restricted payments, including dividends and other distributions. In addition, we must maintain an interest coverage ratio, defined as the ratio of consolidated EBITDA to consolidated interest expense, of at least 3.0 to 1.0 and our maximum leverage ratio, defined as the ratio of total debt to consolidated EBITDA, of no greater than 5.85 to 1.0 (as of December 31, 2017). As noted above, the permitted maximum leverage ratio changes over time. Each of the factors considered in the calculations of these ratios are defined in the Amended Credit Agreement. EBITDA and consolidated interest, as defined, exclude goodwill and asset impairments, debt discount amortization and other non-cash charges. We were in compliancecommon shares, with all of these covenants as of December 31, 2017.
Borrowings under the Amended Credit Agreement are secured by a pledge of substantially all of our assetsfuture dividend payments subject to quarterly review and the assets of our subsidiaries. The obligations under the Amended Credit Agreement are guaranteedapproval by our significant subsidiaries. There are 15 lenders that are parties to the Amended Credit Agreement, with commitments ranging from $0.7 million to $121.7 million.
Dividends
We do not currently pay dividends.Board. The declaration and amount of all potential future dividends will be at the discretion of our Board of Directors and will depend upon many factors, including our financial condition, results of operations, cash flows, prospects, industry conditions, capital requirements of our business, covenants associated with certain debt obligations, legal requirements, regulatory constraints, industry practice and other factors the Board of Directors deems relevant. In addition, our ability to pay cash dividends on common shares is limited by covenants in the Amended Credit Agreement. Future agreements may also limit our ability to pay dividends, and we may incur incremental taxes if we are required to repatriate foreign earnings to pay such dividends. If we elect to pay dividends in the future, theThe amount per share of our dividend payments may be changed, or dividends may again be suspended, without advance notice. The likelihood that dividends will be reduced or suspended is increased during periods of market weakness. There can be no assurance that we will continue to pay a dividend in the future.
Effects of Inflation
Our revenues and results of operations have not been materially impacted by inflation in the past three fiscal years.
Off-Balance Sheet Arrangements
As of December 31, 2017, we had no off-balance sheet arrangements as defined in Item 303(a)(4)(ii) of Regulation S-K.
Contractual Obligations
The following summarizes our contractual obligations at December 31, 2017, and the effect such obligations are expected to have on our liquidity and cash flow over the next five years (in thousands):
| | | Total | | | Less Than 1 Year | | | 1 – 3 Years | | | 3 – 5 Years | | | More Than 5 Years | |
| | | | | | | | | | | | | | | | | | | | | |
Total debt | | $ | 297,623 | | | $ | 16,767 | | | $ | 280,856 | | | $ | -- | | | $ | -- | |
Interest payments(1) | | | 18,455 | | | | 13,290 | | | | 5,165 | | | | -- | | | | -- | |
Purchase obligations | | | 7,281 | | | | 7,281 | | | | -- | | | | -- | | | | -- | |
Non-cancelable operating lease obligations | | | 21,117 | | | | 3,850 | | | | 6,650 | | | | 3,507 | | | | 7,110 | |
Asset retirement obligations – expected cash payments | | | 48,176 | | | | 1,799 | | | | 1,271 | | | | 986 | | | | 44,120 | |
Total contractual cash obligations | | $ | 392,652 | | | $ | 42,987 | | | $ | 293,942 | | | $ | 4,493 | | | $ | 51,230 | |
| (1)
| Interest payments due under the Amended Credit Agreement, which matures on May 28, 2019; based on a weighted average interest rate of 4.5% for the twelve month period ended December 31, 2017.
|
Our debt obligations at December 31, 2017 are reflected in our consolidated balance sheet, which is a part of our consolidated financial statements in Item 8 of this annual report. We have not entered into any material leases subsequent to December 31, 2017.
Critical Accounting Policies
Our
consolidated financial statements in Item 8 of this annual report have been prepared in accordance with U.S. GAAP, which require that management make numerous estimates and assumptions. Actual results could differ from those estimates and assumptions, thus impacting our reported results of operations and financial position. The critical accounting policies and estimates described in this section are those that are most important to the depiction of our financial condition and results of operations and the application of which requires management’s most subjective judgments in making estimates about the effect of matters that are inherently uncertain. We describe our significant accounting policies more fully in Note 2 - Summary of Significant Accounting Policies to the notes to consolidated financial statements in Item 8 of this annual report.Accounting for Contingencies
We have contingent liabilities and future claims for which we have made estimates of the amount of the eventual cost to liquidate these liabilities or claims. These liabilities and claims sometimes involve threatened or actual litigation where damages have been quantified and we have made an assessment of our exposure and recorded a provision in our accounts to cover an expected loss. Other claims or liabilities have been estimated based on their fair value or our experience in these matters and, when appropriate, the advice of outside counsel or other outside experts. Upon the ultimate resolution of these uncertainties, our future reported financial results will be impacted by the difference between our estimates and the actual amounts paid to settle a liability. Examples of areas where we have made important estimates of future liabilities include litigation, taxes, interest, insurance claims, contract claims and obligations and asset retirement obligations.
Impairment of Tangible and Intangible Assets, including GoodwillGoodwill. Goodwill represents the excess of the purchase price paid for acquired businesses over the allocated fair value of the related net assets after impairments, if applicable. In connection with the preparation of our financial statements for the three months ended September 30, 2015, we performed a goodwill impairment test as of September 30, 2015, and we reduced the value of our goodwill to zero. Please see Note 3 – Impairment Charges to the notes to consolidated financial statements in Item 8 of this annual report for further discussion of goodwill impairments recorded in the year ended December 31, 2015.
We do not amortize goodwill. We evaluate goodwill for impairment, at the reporting unit level, annually and when an event occurs or circumstances change to suggest that the carrying amount may not be recoverable. A reporting unit is the operating segment, or a business one level below that operating segment (the “component” level) if discrete financial information is prepared and regularly reviewed by management at the component level. Each segment of our business represents a separate reporting unit, and all three of our reporting units previously had goodwill. We recognize an impairment loss for any amount by which the carrying amount of a reporting unit’s goodwill exceeds the reporting unit’s implied fair value (IFV) of goodwill. We conduct our annual impairment test as of November 30 of each year.
Our assessment consisted of a two-step impairment test. In the first step, we compared each reporting unit’s carrying amount, including goodwill, to the IFV of the reporting unit. If the carrying amount of the reporting unit exceeded its fair value, goodwill was considered impaired, and a second step was performed to determine the amount of impairment. Future impairment tests will be impacted by new accounting guidance which eliminates the second step of the goodwill impairment test.
We are given the option to test for impairment of our goodwill by first performing a qualitative assessment to determine whether it is more likely than not (that is, likelihood of more than 50 percent) that the fair value of a reporting unit is less than its carrying amount, including goodwill. If it is determined that it is more likely than not that the fair value of a reporting unit is greater than its carrying amount, then performing the currently prescribed two-step impairment test is unnecessary. In developing a qualitative assessment to meet the “more-likely-than-not” threshold, each reporting unit with goodwill is assessed separately and different relevant events and circumstances are evaluated for each unit. We have the option to bypass the qualitative assessment for any reporting unit in any period and proceed directly to performing the first step of the two-step goodwill impairment test.
In performing the two-step impairment test, we compare each reporting unit’s carrying amount, including goodwill, to the IFV of the reporting unit. Because none of our reporting units has a publically quoted market price, we must determine the value that willing buyers and sellers would place on the reporting unit through a routine sale process (a Level 3 fair value measurement). In our analysis, we target an IFV that represents the value that would be placed on the reporting unit by market participants, and value the reporting unit based on historical and projected results throughout a cycle, not the value of the reporting unit based on trough or peak earnings. The IFV of the reporting unit is estimated using a combination of (i) an analysis of trading multiples of comparable companies (Market Approach) and (ii) discounted projected cash flows (Income Approach). We also use acquisition multiples analyses in certain circumstances. The relative weighting of each approach varies by reporting unit, based on management’s judgment.
Market Approach - This valuation approach utilizes publicly traded comparable companies’ enterprise values, as compared to their recent and forecasted earnings before interest, taxes and depreciation (EBITDA) information. We have historically used an average EBITDA multiple ranging from approximately 6.5x to approximately 9.5x depending on the reporting unit. We use EBITDA because it is a widely used key indicator of the cash generating capacity of companies in our industry.
Income Approach - This valuation approach derives a present value of the reporting unit’s projected future annual cash flows over the next five years. We use a variety of underlying assumptions to estimate these future cash flows, including assumptions relating to future economic market conditions, rates, occupancy levels, costs and expenses and capital expenditures. These assumptions vary by each reporting unit depending on market conditions. In addition, a terminal value is estimated, using a Gordon Growth methodology with a long-term growth rate of 3%. We discount our projected cash flows using a long-term weighted average cost of capital based on our estimate of investment returns that would be required by a market participant.
The IFV of our reporting units is affected by future oil, coal and natural gas prices, anticipated spending by our customers and the cost of capital. Our estimate of IFV requires us to use significant unobservable inputs, representative of Level 3 fair value measurements, including numerous assumptions with respect to future circumstances, such as industry and/or local market conditions that might directly impact each reporting unit’s operations in the future, and are therefore uncertain. We selected these valuation approaches because we believe the combination of these approaches and our best judgment regarding underlying assumptions and estimates provides us with the best estimate of fair value for each of our reporting units. We believe these valuation approaches are proven valuation techniques and methodologies for our industry and widely accepted by investors. The IFV of each reporting unit would change if our assumptions under these valuation approaches, or relative weighting of the valuation approaches, were materially modified.
Definite-Lived Tangible and
Intangible Assets.Assets
The recoverability of the carrying values of tangible and intangible assets is assessed at an asset group level which represents the lowest level for which identifiable cash flows are largely independent of the cash flows of other assets and liabilities. Whenever, in management’s judgment,
we review our assets for impairment in step one when events or changes in circumstances indicate that the carrying value of such asset groups may not be recoverable based on estimated future cash flows, an asset impairment evaluation is performed. Indicators of impairment might include persistent
and sustained negative economic trends affecting the markets we serve, recurring
cash flow losses or
significantly lowered expectations of future cash flows expected to be generated by our assets.
As part of the initial step, we also reevaluate the remaining useful lives and salvage values of our assets when indicators of impairment exist.
Identification of Asset Groups–The following summarizes the asset groups that we have identified in each of our reportablereporting segments. Our Canada segment consists of numerous lodges,
and open camps, as well as our mobile
camp assets and our manufacturing facility.assets. These properties are grouped in the following asset groups:
| ●
| McClelland Lake Lodge – North Athabasca
|
| ●
| Mariana Lake Lodge – South Athabasca
|
| ●
| Conklin Lodge – South Athabasca
|
| ●
| Anzac Lodge – South Athabasca
|
| ●
| Sitka Lodge – Kitimat, British Columbia
|
| ●
| Wapasu and Henday Lodges – North Athabasca
|
| ●
| Beaver River and Athabasca Lodges – North Athabasca
|
| ●
| Boundary open camp – Saskatchewan
|
| ●
| Antler River open camp – Manitoba
|
| ●
| Red Earth open camp – Alberta
|
| ●
| Geetla open camp – British Columbia
|
| ●
| Christina Lake open camp – Alberta
|
| ●
| Noble manufacturing facility
|
| ●
| Various land holdings in British Columbia purchased in anticipation of potential LNG related projects
|
•Core Region
◦Fort McMurray Village – North Athabasca
◦Beaver River Lodge – North Athabasca
◦Athabasca Lodge – North Athabasca
◦Hudson and Borealis Lodges – North Athabasca
•Wapasu Creek Lodge – North Athabasca
•Grey Wolf Lodge - North Athabasca
•Conklin Lodge – South Athabasca
•Anzac Lodge – South Athabasca
•Red Earth Lodge - South Athabasca
•Wabasca Lodge - South Athabasca
•Sitka Lodge – Kitimat, British Columbia
•Geetla camp – British Columbia
•Antler River camp – Manitoba
•Red Earth camp – Alberta
•Christina Lake camp – Alberta
•Mobile assets
•Various land holdings in British Columbia purchased in anticipation of potential LNG related projects
In general, the lodges
and open camps are operated on a lodge by lodge basis.
For two setsHowever, for one set of lodges
(Wapasu/Henday(the Core Region, including Beaver River, Athabasca, Hudson and
Beaver River/Athabasca)Borealis Lodges and Fort McMurray Village), there are no identifiable cash flows largely independent of the cash flows of other assets and liabilities for such lodges, and therefore, such lodges are combined into a single asset groups.group. Factors such as proximity to each other, commonality of customers, and common monitoring by management and operating decisions being made to optimize these lodges as a group result in the Wapasu Lodge and the Henday Lodge to be treated as a single asset group and the Beaver River Lodge and the Athabasca Lodge to bethese lodges being treated as a single asset group for the purposes of our impairment assessments.
Our Australia segment consists of
teneight villages in several regions within the country.country, as well as our integrated services assets and land banked assets. These properties are grouped in the following asset groups: | ●
| Karratha – Pilbara Region, Western Australia
|
| ●
| Kambalda – Kambalda, Western Australia
|
| ●
| Calliope – Gladstone, Queensland
|
•Karratha – Pilbara Region, Western Australia
•Integrated services – Assets held on client owned sites in Western Australia and South Australia
•Gunnedah Basin
◦Narrabri – Gunnedah Basin, New South Wales
◦Boggabri – Gunnedah Basin, New South Wales
•Bowen Basin
◦Moranbah – Bowen Basin, Queensland
| o
| Narrabri – Gunnedah Basin, New South Wales
|
| o
| Boggabri – Gunnedah Basin, New South Wales
|
| o
| Moranbah – Bowen Basin, Queensland
|
| o
| Dysart – Bowen Basin, Queensland
|
| o
| Nebo – Bowen Basin, Queensland
|
| o
| Coppabella – Bowen Basin, Queensland
|
| o
| Middlemount – Bowen Basin, Queensland
|
◦Dysart – Bowen Basin, Queensland
◦Nebo – Bowen Basin, Queensland
◦Coppabella – Bowen Basin, Queensland
◦Middlemount – Bowen Basin, Queensland
•Various non-operational sites acquired as part of Civeo’s land-banking strategy
In general, the villages are operated on a village by village basis, except for the villages located in the Bowen Basin (Moranbah, Dysart, Nebo, Coppabella and Middlemount) and the Gunnedah Basin (Narrabri and Boggabri).
For theThe villages in the Bowen and Gunnedah Basins
, there are no identifiable cash flows largely independent contain significant levels of the cash flows of otherinterdependency that allow these assets and liabilities for each of the villages in such basins, and therefore, such villages areto be combined into asset groups.cash generating units (asset groups). Factors such as commonality of customers, location, resource basins served and common monitoring by management result in the villages in the Bowen Basinand Gunnedah Basins to be treated as a single asset group and the villages in the Gunnedah Basin to be treated as a single asset groupgroups for the purposes of our impairment assessments.Our Integrated services assets provide catering and managed services to the mining industry in Western Australia and South Australia.
U.S.
segment consists of
open camps in two geographical areas, mobile camp assets in various geographical areas,a lodge, land and a
waste-waterwastewater treatment plant (WWTP).
These properties are grouped in the following asset groups: | o
| Texas – we currently own and operate one open camp in Texas, our West Permian camp. Previously, we also owned the Three Rivers camp, which we sold in January 2016.
|
| o
| Bakken – we currently own two open camps in the Bakken shale region of North Dakota, the Killdeer and the Stanley House camps.
|
| ●
| Offshore – this asset group includes mobile camp assets which are utilized in the Gulf of Mexico.
|
| ●
| Wellsites – this asset group includes mobile camp assets, primarily in the Rocky mountain corridor, the Bakken shale region and the Permian Basin region of Texas.
|
| ●
| Killdeer WWTP – this asset group represents a WWTP in Killdeer, North Dakota, which was constructed in early 2014.
|
•Killdeer Lodge – North Dakota
•Acadian Acres land – Louisiana
•Killdeer WWTP – this asset group represents a WWTP in Killdeer, North Dakota, which was constructed in early 2014
Recoverability Assessment– In performing an impairment analysis, the firstsecond step is to compare each asset group’s carrying value to estimates of undiscounted future direct cash flows.flows associated with the asset group over the remaining useful life of the asset group's primary asset. We use a variety of underlying assumptions to estimate these future cash flows, including assumptions relating to future economic market conditions, rates, occupancy levels, costs and expenses and capital expenditures. The estimates are consistent with those used for purposes of our goodwill impairment test, as further discussed in Goodwill, above.test.
Fair Value Determination–If, based on the assessment, the carrying values of any of our asset groups are determined to not be recoverable as a result of the undiscounted future cash flows not exceeding the net book value of the asset group, we proceed to the secondthird step. In this step, we compare the fair value of the respective asset group to its carrying value. Our estimate of the fair value requires us to use significant unobservable inputs, representative of Level 3 fair value measurements, including numerous assumptions with respect to future circumstances, such as industry and/or local market conditions that might directly impact each of the asset groups’ operations in the future, and are therefore uncertain. In some cases our estimate of fair value is based on appraisals from third parties.
Our industry is cyclical and our estimates of the period over which future cash flows will be generated, as well as the predictability of these cash flows and our determination of whether a decline in value of our
investment has occurred, can have a significant impact on the carrying value of these assets and, in periods of prolonged down cycles, may result in impairment losses. If this assessment indicates that the carrying values will not be recoverable, an impairment loss is recognized equal to the excess of the carrying value over the fair value of the asset group. The fair value of the asset group is based on prices of similar assets, if available, or discounted cash flows.
In estimating future cash flows, we makemake numerous assumptions with respect to future circumstances that might directly impact each of the asset groups’ operations in the future and are therefore uncertain. These assumptions with respect to future circumstances include future oil and coal prices, anticipated customer spending, and industry and/or local market conditions. These assumptions represent our best judgment based on the current facts and circumstances. However, different assumptions could result in a determination that the carrying values of additional asset groups are no longer recoverable based on estimated future cash flows. Our estimate of fair value is primarily calculated using the Income Approach, which derives a present value of the asset group based on the asset groups’ estimated future cash flows. We discounted our estimated future cash flows using a long-term weighted average cost of capital based on our estimate of investment returns required by a market participant.
Please see
See Note
34 – Impairment Charges to the notes to consolidated financial statements in Item 8 of this annual report for further discussion of impairments of definite-lived tangible and intangible assets recorded in the years ended December 31, 2017, 20162023, 2022 and 2015.Indefinite-Lived Intangible Assets. We are required to evaluate our indefinite-lived intangible assets for impairment annually and when an event occurs or circumstances change to suggest the carrying amount may not be recoverable. In performing the impairment test, we compare the fair value of the indefinite-lived intangible asset with its carrying amount. The measurement of the impairment is calculated based on the excess of the carrying value over its fair value.
Please see Note 3 – Impairment Charges to the notes to consolidated financial statements in Item 8 of this report for further discussion of impairments of indefinite-lived intangible assets recorded in the year ended December 31, 2015.
2021.
Revenue and Cost Recognition
Revenues are recognized in the period in which
We generally recognize accommodation, mobile facility rental, food service and other services revenues over time as our obligations are satisfied pursuantcustomers simultaneously receive and consume benefits as we serve our customers because of continuous transfer of control to the terms of contractual relationships with our customers. This occurscustomer. Revenue is recognized when control of the promised goods or services is transferred to our customers, in an amount that reflects the consideration we expect to be entitled to in exchange for those goods or services. The amount of consideration we receiveWe transfer control and revenue we recognize is generallya sale based on a periodic (usually daily) room rate.rate each night a customer stays in our rooms or when the services are rendered. In some contracts, the rate or committed room numbersrates may vary over the contract term. In these cases, revenue may be deferred and recognized on a straight-line basis over the contract term. Revenue from the saleA limited portion of products not accounted for utilizing the cost based input method,our revenue is recognized at a point in time following the transfer ofwhen control of such products to the customer. This typically occurs upon delivery to and acceptance by the customer, when title and all significant risks of ownership have passedtransfers to the customer collectabilityrelated to small modular construction and manufacturing contracts, minor food service arrangements and optional purchases our customers make for incidental services offered at our accommodation and mobile facilities.
Because of control transferring over time, the majority of our revenue is
probable and pricing is fixed and determinable. Our product sales terms do not include significant post-delivery obligations.For significant projects, revenues are recognized applyingbased on the cost based input method, measured by the actual costs incurred relative to the total estimated costs to determine ourextent of progress towards completion of the performance obligation. At contract completioninception, we assess the goods and to calculate the corresponding amount of revenueservices promised in our contracts with customers and gross profit to recognize. Billings on such contracts in excess of costs incurred and estimated profits are classified as deferred revenue. Costs incurred and estimated profits in excess of billings on these contracts are recognized as unbilled receivables. Our management believes this input method is the most appropriate measure of progress to the satisfaction ofidentify a performance obligation for each promise to transfer our customers a good or service (or bundle of goods or services) that is distinct. Our customers typically contract for hospitality services under take-or-pay contracts with terms that range from several months to multiple years. Our contract terms generally provide for a rental rate for a reserved room and an occupied room rate that compensates us for services provided. We typically contract our facilities to our customers on large contracts. Provisions for estimated losses on uncompleted contracts are madea fee per day basis where the goods and services promised include lodging and meals. To identify the performance obligations, we consider all of the goods and services promised in the period in which such losses are determined. Changes in job performance, job conditions, estimated profitability and finalcontext of the contract settlements may result in revisions to projected costs and revenue and are recognized in the period in which the revisions to estimates are identified and the amounts can be reasonably estimated. Factors that may affect future project costs and margins include weather, production efficiencies, availability and costspattern of labor, materials and subcomponents. These factors can significantly impact the accuracy oftransfer to our estimates and materially impact our future reported earnings.
customers.
Revenues exclude taxes assessed based on revenues such as sales or value added taxes.
Cost of services includes labor, food,
utilities, cleaningutility costs, cleaning supplies, and other costs associated withof operating theour accommodations facilities. Cost of goods sold includes all direct material and labor costs and those costs related to contract performance, such as indirect labor, supplies, tools and repairs. Selling, general and administrative costs are charged to expense as incurred.
Estimation of Useful Lives
The selection of the useful lives of many of our assets requires the judgments of our operating personnel as to the length of these useful lives. Our judgment in this area is influenced by our historical experience in operating our assets, technological developments and expectations of future demand for the assets. Should our estimates be too long or short, we might eventually report a disproportionate number of losses or gains upon disposition or retirement of our long-lived assets. We reevaluate the remaining useful lives and salvage values of our assets when certain events occur that directly impact the useful lives and salvage values, including changes in operating condition, functional capability and market and economic factors. We believe our estimates of useful lives are appropriate.
Share-Based Compensation
Our historic share-based compensation is based on participating in Civeo’s 2014 Equity Participation Plan (the Plan). Our disclosures reflect only our employees’ participation in the Plans. We are required to estimate the fair value of share compensation made pursuant to awards under the Plans. An initial estimate of the fair value of each option award or restricted share award determines the amount of share compensation expense we will recognize in the future. For stock option awards, which were all granted prior to our May 30, 2014 spin-off from Oil States, to estimate the value of the awards under the Plan, Oil States selected a fair value calculation model. Oil States chose the Black-Scholes option pricing model to value stock options awarded under the Plan. Oil States chose this model because option awards were made under straightforward vesting terms, option prices and option lives. Utilizing the Black-Scholes option pricing model required Oil States to estimate the length of time options will remain outstanding, a risk free interest rate for the estimated period options are assumed to be outstanding, forfeiture rates, future dividends and the volatility of our common stock. All of these assumptions affect the amount and timing of future share-based compensation expense recognition. We have not made any option awards subsequent to May 30, 2014, but, in the event that we make future awards, we expect to utilize a similar valuation methodology. We will continually monitor our actual experience and change assumptions for future awards as we consider appropriate.
We also grant performance awards under the Plan. Awards granted in 2017 will be earned in amounts between 0% and 200% of the participant’s target performance share award, based on the payout percentage associated with Civeo’s relative total shareholder return rank among a peer group of 15 other companies. Awards granted in 2016 will be earned in amounts between 0% and 200% of the participant’s target performance share award, based on the payout percentage associated with Civeo’s relative total shareholder return rank among a peer group of 12 other companies. The fair value of both the 2017 and the 2016 awards was estimated using a Monte Carlo simulation pricing model. We chose this model because the performance awards contain complex vesting terms. Utilizing the Monte Carlo simulation pricing model required us to estimate the risk-free interest rate and the expected market price volatility of our common shares as well as a peer group of companies over a time period equal to the expected term of the award. The resulting cost is recognized over the period during which an employee is required to provide service in exchange for the awards, usually the vesting period. For additional details, see Note 16 – Share Based Compensation.
Income Taxes
We follow the liability method of accounting for income taxes in accordance with current accounting standards regarding the accounting for income taxes. Under this method, deferred income taxes are recorded based upon the differences between the financial reporting and tax bases of assets and liabilities and are measured using the enacted tax rates and laws in effect at the time the underlying assets or liabilities are recovered or settled.
When our earnings from foreign subsidiaries are considered to be indefinitely reinvested, no provision for Canadian income taxes is made for these earnings. If any of the subsidiaries have a distribution of earnings in the form of dividends or otherwise, we wouldcould be subject to both Canadian income taxes (subject to an adjustment for foreign tax credits) and withholding taxes payable to various foreign countries.
We
do not expect to provide Canadian income taxes on future foreign earnings.We record a valuation allowance in each reporting period when our management believes that it is more likely than not that any recorded deferred tax asset will not be realized. Our management will continue to evaluate the appropriateness of the valuation allowance in the future, based upon our current and historical operating results. Please seeresults and other potential sources of future taxable income. See Note 1314 – Income Taxes to the notes to consolidated financial statements in Item 8 of this annual report for further discussion.
In accounting for income taxes, we are required to estimate a liability for future income taxes for any uncertainty for potential income tax exposures. The calculation of our tax liabilities involves dealing with uncertainties in the application of complex tax regulations. We recognize liabilities for anticipated tax audit issues in the U.S.Canada and other tax jurisdictions based on our estimate of whether, and the extent to which, additional taxes will be due.due, including an accrual of interest and penalties, if applicable, related to the unrecognized tax benefits. If we ultimately determine that payment of these amounts is unnecessary, we reverse the liability and recognize a tax benefit during the period in which we determine that the liability is no longer necessary. We record an additional charge in our provision for taxes in the period in which we determine that the recorded tax liability is less than we expect the ultimate assessment to be.
On December 22, 2017, the Tax Cuts and Jobs Act of 2017 (U.S. Tax Reform) was signed into law, making significant changes to the U.S. Internal Revenue Code. Changes include, but are not limited to, a corporate tax rate decrease from 35% to 21% effective for tax years beginning after December 31, 2017, the transition of U.S. international taxation from a worldwide tax system to a territorial system, and a one-time transition tax on the mandatory deemed repatriation of cumulative foreign earnings as of December 31, 2017. Many aspects of the new legislation are unclear and may not be clarified for some time.
As of December 31, 2017, we had no unrepatriated U.S. foreign earnings subject to the transition tax. We have calculated an estimate of the impacts of the U.S. Tax Reform to our U.S. deferred taxes as of December 31, 2017, the result of which was a decrease of the U.S. net deferred tax asset of $9 million, which was fully offset by a decrease in the U.S. valuation allowance of $9 million. This results in zero impact to our income tax benefit for the year ended December 31, 2017.
Recent Accounting Pronouncements
From time to time, new accounting pronouncements are issued by the Financial Accounting Standards Board (the FASB), which are adopted by us as of the specified effective date. Unless otherwise discussed, management believes that the impact of recently issued standards, which are not yet effective, will not have a material impact on our consolidated financial statements upon adoption. Please see
See Note 2 – Summary of Significant Accounting Policies – Recent Accounting Pronouncements to the notes to consolidated financial statements in Item 8 of this annual report for further discussion.
ITEM7A. 7A.Quantitative and Qualitative Disclosures about Market Risk
Our principal market risks are our exposure to changes in interest rates and foreign currency exchange rates.
We have credit facilities that are subject to the risk of higher interest charges associated with increases in interest rates.
As of December 31, 2017,2023, we had $297.6$65.6 million of outstanding floating-rate obligations under our credit facilities. These floating-rate obligations expose us to the risk of increased interest expense in the event of increases in short-term interest rates. If floating interest rates increased by 100 basis points, our consolidated interest expense would increase by approximately $3.0$0.7 million annually, based on our floating-rate debt obligations and interest rates in effect as of December 31, 2017.2023.
Foreign Currency Exchange Rate Risk
Our operations are conducted in various countries around the world,
, and we receive revenue and pay expenses from these operations in a number of different currencies. As such, our earnings are subject to movements in foreign currency exchange rates when transactions are denominated in (i) currencies other than the U.S. dollar, which is our reporting currency, or (ii) the functional currency of our subsidiaries, which is not necessarily the U.S. dollar. Excluding intercompany balances, our Canadian dollar and Australian dollar functional currency net assets total approximately C$0.1 billion234 million and A$0.4 billion,205 million, respectively, at December 31, 2017.2023. We use a sensitivity analysis model to measure the impact of a 10% adverse movement of foreign currency exchange rates against the United StatesU.S. dollar. A hypothetical 10% adverse change in the value of the Canadian dollar and Australian dollar relative to the U.S. dollar as of December 31, 20172023 would result in translation adjustments of approximately $13$23 million and $43$21 million, respectively, recorded in other comprehensive loss. Although we do not currently have any foreign exchange agreements outstanding, in order to reduce our exposure to fluctuations in currency exchange rates, we may enter into foreign exchange agreements with financial institutions in the future.
ITEM8.Financial Statements and Supplementary Data
Our Consolidated Financial Statements and supplementary data
appear on pages 9168 through 126100 of this Annual Report on Form 10-K and are incorporated by reference into this Item 8. Selected quarterly financial data is set forth in Note 19 – Quarterly Financial Information (Unaudited) to our Consolidated Financial Statements, which is incorporated herein by reference.
ITEM9.Changes in and Disagreements With Accountants on Accounting and Financial Disclosure There were no changes in or disagreements on any matters of accounting principles or financial statement disclosure between us and our independent auditors during our two most recent
fiscal years or any subsequent interim period.
ITEM9A. 9A.Controls and Procedures
(i)
Evaluation of Disclosure Controls and ProceduresAs of the end of the period covered by this
annual report, we carried out an evaluation, under the supervision and with the participation of our management, including our Chief Executive Officer and Chief Financial Officer, of the effectiveness of the design and operation of our disclosure controls and procedures (as defined in Rules 13a-15(e) and 15d-15(e) under the Exchange Act). Our disclosure controls and procedures are designed to provide reasonable assurance that the information required to be disclosed by us in reports that we file under the Exchange Act is accumulated and communicated to our management, including our Chief Executive Officer and Chief Financial Officer, as appropriate, to allow timely decisions regarding required disclosure and is recorded, processed, summarized and reported within the time periods specified in the rules and forms of the Securities and Exchange Commission. Based upon that evaluation, our Chief Executive Officer and Chief Financial Officer concluded that our disclosure controls and procedures were effective as of December 31, 20172023 at the reasonable assurance level.
(ii)(ii) Internal Control Over Financial Reporting
(a)
Management's annual report on internal control over financial reporting.
Our management is responsible for establishing and maintaining adequate internal control over financial reporting as defined in Rules 13a-15(f) and 15d-15(f) under the Exchange Act. Our internal control over financial reporting is a process designed to provide reasonable assurance regarding the reliability of financial reporting and the preparation of consolidated financial statements for external purposes in accordance with GAAP. Our internal control over financial reporting includes those policies and procedures that (i) pertain to the maintenance of records that, in reasonable detail, accurately and fairly reflect the transactions and dispositions of our assets; (ii) provide reasonable assurance that transactions are recorded as necessary to permit preparation of financial statements in accordance with GAAP, and that our receipts and expenditures are being made only in accordance with authorizations of management and our directors, and (iii) provide reasonable assurance regarding prevention or timely detection of unauthorized acquisition, use or disposition of our assets that could have a material effect on the consolidated financial statements.
Because of its inherent limitations, internal control over financial reporting may not prevent or detect misstatements. Also, projections of any evaluation of effectiveness to future periods are subject to the risk that controls may become inadequate because of changes in conditions, or that the degree of compliance with the policies or procedures may deteriorate. Accordingly, even effective internal control over financial reporting can only provide reasonable assurance of achieving their control objectives.
Under the supervision and with the participation of our management, including our Chief Executive Officer and Chief Financial Officer, an assessment of the effectiveness of our internal control over financial reporting as of December 31,
20172023 was conducted. In making this assessment, management used the criteria set forth by the Committee of Sponsoring Organizations of the Treadway Commission (COSO) in Internal Control–Integrated Framework (2013 Framework). Based on our assessment we believe that, as of December 31, 2017, the Company's2023, our internal control over financial reporting is effective based on those criteria.(b) Attestation report of the registered public accounting firm.
The attestation report of Ernst & Young LLP,
the Company'sour independent registered public accounting firm, on
the Company'sour internal control over financial reporting is set forth in this
annual report on page 9371 and is incorporated herein by reference.
(c)Changes ininternal controlinternalcontrol overfinancial reporting.financialreporting. During the three months ended
December 31, 2017,2023, there were no changes in our internal control over financial reporting (as defined in Rules 13a-15(f) and 15d-15(f) of the Exchange Act) which have materially affected, or are reasonably likely to materially affect, our internal control over financial reporting.ITEM
None.
ITEM9C.Disclosure Regarding Foreign Jurisdictions that Prevent Inspections
ITEM10.Directors, Executive Officers and Corporate Governance
The information required by Item
1010 hereby is incorporated by reference to such information as set forth in the Company's Definitive Proxy Statement for the 20182024 Annual General Meeting of Shareholders.The Board of
Directors of the Company
(the Board) has documented its governance practices by adopting several corporate governance policies. These governance policies, including the Company's Corporate Governance Guidelines, Corporate Code of Business Conduct and Ethics and Financial Code of Ethics for Senior Officers, as well as the charters for the committees of the Board (Audit Committee, Compensation Committee, Finance and Investment Committee and NominatingEnvironmental, Social, Governance and Corporate GovernanceNominating Committee) may also be viewed at the Company's website. The Financial Code of Ethics for Senior Officers applies to our principal executive officer, principal financial officer, principal accounting officer and certain other senior officers. We intend to disclose any amendments to or waivers from our Financial Code of Ethics for Senior Officers by posting such information on our website at www.civeo.com.www.civeo.com within four business days following the date of the amendment or waiver. Copies of such documents will be sent to shareholders free of charge upon written request to the corporate secretary at the address shown on the cover page of this annual report.ITEM
ITEM11.Executive Compensation
The information required by Item 11 hereby is incorporated by reference to such information as set forth in the Company's Definitive Proxy Statement for the
20182024 Annual General Meeting of Shareholders.ITEM
ITEM12.Security Ownership of Certain Beneficial Owners and Management and Related ShareholderShareholder Matters
The information required by Item 12 hereby is incorporated by reference to such information as set forth in the Company's Definitive Proxy Statement for the
20182024 Annual General Meeting of Shareholders.ITEM
ITEM13.Certain Relationships and Related Transactions, and Director Independence
The information required by Item 13 hereby is incorporated by reference to such information as set forth in the Company's Definitive Proxy Statement for the
20182024 Annual General Meeting of Shareholders.ITEM
ITEM14.Principal Accounting Fees and Services The information required by Item
1414 hereby is incorporated by reference to such information as set forth in the Company's Definitive Proxy Statement for the 20182024 Annual General Meeting of Shareholders.
ITEM 15.Exhibits, Financial Statement Schedules
(a) Index to Financial Statements, Financial Statement Schedules and Exhibits
(1) Financial Statements: Reference is made to the index set forth on page 9168 of this Annual Report on Form 10-K. (2) Financial Statement Schedules: No schedules have been included herein because the information required to be submitted has been included in the Consolidated Financial Statements or the Notes thereto, or the required information is inapplicable. (3) Index of Exhibits: See Index of Exhibits, below, for a list of those exhibits filed herewith, which index also includes and identifies management contracts or compensatory plans or arrangements required to be filed as exhibits to this Annual Report on Form 10-K by Item 601 of Regulation S-K.
| | | | | | | | |
| Exhibit No. | | Description |
| | |
| 2.1
| | Agreement and Plan of Merger, dated as of April 6, 2015, among Civeo Corporation, Civeo Canadian Holdings ULC and Civeo US Merger Co (incorporated by reference to Annex A of Civeo Corporation’s definitive proxy statement/prospectus on Schedule 14A filed with the Commission on April 8, 2015).
| 2.1 | | |
2.2
| | Separation and Distribution Agreement by and between Oil States International, Inc. and Civeo Corporation, dated May 27, 2014 (incorporated herein by reference to Exhibit 2.1 to the Current Report on Form 8-K (File No. 001-36246) filed on June 2, 2014).
|
| | |
2.3
| | Share Purchase Agreement, dated November 26, 2017, by and among Civeo Corporation, Noralta Lodge Ltd., Torgerson Family Trust, 2073357 Alberta Ltd., 2073358 Alberta Ltd., 1818939 Alberta Ltd., 2040618 Alberta Ltd., 2040624 Alberta Ltd., 989677 AlbertaAlberta Ltd. and Lance Torgerson (incorporated herein by reference to Exhibit 10.1 to the Current Report on Form 8-K (File No. 001-36246) filed on November 27, 2017). |
| | |
| 2.2 | | Amending Agreement, dated March 15, 2018, among Civeo Corporation, the Torgerson Family Trust, 989677 Alberta Ltd., 1818939 Alberta Ltd., 2040618 Alberta Ltd., 2040624 Alberta Ltd., 2073357 Alberta Ltd., 2073358 Alberta Ltd., Lance Torgerson and Noralta Lodge Ltd. (incorporated herein by reference to Exhibit 10.1 to the Current Report on Form 8-K (File No. 001-36246) filed on March 16, 2018).
|
| | |
| 3.1 | |
|
| | |
3.2 | | |
| | |
| 3.3 | |
|
| | |
| 4.1 | |
|
| | |
10.1
4.2 | |
|
| | |
10.2
4.3 | | |
| | |
10.3
10.1† | | Employee Matters Agreement by and between Oil States International, Inc. and Civeo Corporation, dated May 27, 2014 (incorporated herein by reference to Exhibit 10.3 to the Current Report on Form 8-K (File No. 001-36246) filed on June 2, 2014).
|
| | |
10.4
| | Transition Services Agreement by and between Oil States International, Inc. and Civeo Corporation, dated May 27, 2014 (incorporated herein by reference to Exhibit 10.4 to the Current Report on Form 8-K (File No. 001-36246) filed on June 2, 2014).
|
10.5
| | Syndicated Facility Agreement, dated as of May 28, 2014, among Civeo Corporation, Civeo Canada Inc., Civeo Premium Camp Services Ltd. And Civeo Australia Pty Limited, as Borrowers, the Lenders named therein, Royal Bank of Canada, as Administrative Agent, U.S. Collateral Agent, Canadian Administrative Agent, Canadian Collateral Agent and an Issuing Bank, and RBC Europe Limited, as Australian Administrative Agent, Australian Collateral Agent and an Issuing Bank (incorporated herein by reference to Exhibit 10.5 to the Current Report on Form 8-K (File No. 001-36246) filed on June 2, 2014).
|
| | |
10.6†
| | |
| | |
10.7†
10.2† | | Settlement Agreement and Release, dated as of June 26, 2014, by and between Civeo Corporation and Ronald Green (incorporated herein by reference to Exhibit 10.7 to the Quarterly Report on Form 10-Q (File No. 001-36246) filed on August 13, 2014).
|
| | |
10.8†
| | |
| | |
| | | | | | | | |
10.9†
10.3† | |
|
| | |
10.10†
10.4† | | |
| | |
10.11†
10.5† | |
|
| | |
10.12†
10.6† | |
|
| | |
10.13†
10.7† | |
|
| | |
10.14†
10.8† | |
|
| | |
10.15†
10.9† | |
|
| | |
10.16†
10.10† | |
|
| | |
10.17†
10.11† | |
|
| | |
10.18†
10.12† | |
|
| | |
10.19†
10.13† | | |
10.20†
| | Executive Agreement between Civeo Corporation and Frank C. Steininger, dated May 4, 2015 (incorporated herein by reference to Exhibit 10.1 to the Current Report on Form 8-K (File No. 001-36246) filed on May 7, 2015).
|
| | |
10.21†
10.14† | | |
| | |
10.22†
10.15† | | Dual Employment Agreement of Bradley J. Dodson (incorporated herein by reference to Exhibit 10.4 to the Current Report on Form 8-K12B (File No. 001-36246) filed on July 17, 2015).
|
| | |
10.23†
| | Dual Employment Agreement of Frank C. Steininger (incorporated herein by reference to Exhibit 10.5 to the Current Report on Form 8-K12B (File No. 001-36246) filed on July 17, 2015).
|
| | |
10.24†
| |
|
| | |
| 10.16† | | |
| 10.25†
| |
| 10.17† | |
|
| | |
10.26†
10.18† | | Dual Employment Agreement (Canada) of Allan Schoening, dated July 16, 2015 (incorporated herein by reference to Exhibit 10.8 to the Quarterly Report on Form 10-Q (File No. 001-36246) filed on November 3, 2015).
|
| | |
10.27†
| | Dual Employment Agreement (United States) of Allan Schoening, dated July 16, 2015 (incorporated herein by reference to Exhibit 10.9 to the Quarterly Report on Form 10-Q (File No. 001-36246) filed on November 3, 2015).
|
| | |
10.28†
| | Executive Agreement between Civeo Corporation and Mike Ridley, effective May 4, 2015 (incorporated herein by reference to Exhibit 10.10 to the Quarterly Report on Form 10-Q (File No. 001-36246) filed on November 3, 2015).
|
| | |
10.29†
| | |
| | |
| | | | | | | | |
| 10.19† | | |
| 10.30†
| |
| 10.20† | |
|
| | |
| 10.21† | | |
| 10.31
| |
| 10.22 | | First Amendment to Syndicated Facility Agreement, dated as of May 13, 2015,September 8, 2021, by and among Civeo Corporation, Civeo Canadian Holdings ULC, Civeo Canada Inc., Civeo Premium Camp Services Ltd.,Pty Limited and Civeo PTY LimitedManagement LLC, as Borrowers, the Lenders named therein, Royal Bank of Canada, as Administrative Agent, U.S. Collateral Agent, Canadian Administrative Agent, Canadian Collateral Agent and an Issuing Bank and RBC Europe Limited, as Australian Administrative Agent, Australian Collateral Agent and an Issuing Bank (incorporated herein by reference to Exhibit 10.1 to the Current Report on Form 8-K (File No. 001-36246) filed on May 19, 2015)September 8, 2021). |
| | |
10.32
10.23† | | SecondFirst Amendment to Syndicated Facility Agreement, dated as of February 18, 2016, by andMarch 31, 2023, among Civeo Corporation, Civeo U.S. Holdings LLC, Civeo Management LLC Civeo Canada Inc., Civeo Premium Camp Services Ltd., and Civeo PTYPty Limited, as Borrowers, certain subsidiary guarantors of the Borrowers party thereto, the Lenders named therein,party thereto, the Issuing Banks, the Swing Line Lenders, Royal Bank of Canada, as Administrative Agent,administrative agent for the U.S. Collateral Agent,Lenders, U.S. collateral agent, administrative agent for the Canadian Administrative Agent,Lenders and Canadian Collateral Agent and an Issuing Bankcollateral agent and RBC Europe Limited, as administrative agent for the Australian Administrative Agent,Lenders and Australian Collateral Agentcollateral agent (incorporated herein by reference to Exhibit 10.1 to the Quarterly Report on Form 10-K (File No. 001-36246) filed on April 28, 2023). |
| | |
| 10.24† | | |
| | |
| 10.25† | | |
| | |
| 10.26† | | |
| | |
| 10.27† | |
|
| 10.33†
| |
| 10.28† | | |
| | |
10.34
| | Third Amendment to Syndicated FacilityRetention Commitment Agreement, dated as of February 17, 2017, by and amongOctober 5, 2023, between Civeo Corporation Civeo U.S. Holdings LLC, Civeo Management LLC, Civeo Canada Inc., Civeo Premium Camp Services Ltd., and Civeo PTY Limited, as Borrowers, the Guarantors and Lenders named therein, Royal Bank of Canada, as Administrative Agent, U.S. Collateral Agent, Canadian Administrative Agent, Canadian Collateral Agent and an Issuing Bank and RBC Europe Limited, as Australian Administrative Agent, Australian Collateral Agent and an Issuing BankAllan D. Schoening (incorporated herein by reference to Exhibit 10.1 to the Current Report on Form 8-K (File No. 001-36246) filed on February 21, 2017)October 11, 2023).
|
| | |
21.1* | | |
| | |
23.1* | | |
| | |
31.1* | | —
|
| | |
31.2* | | —
|
| | |
32.1** | | —
|
| | |
32.2** | | —
|
| | |
| 97.1* | | |
| | |
| 101.INS* | | —
Inline XBRL Instance Document |
| | |
101.SCH* | | —
Inline XBRL Taxonomy Extension Schema Document |
| | |
101.CAL* | | —
Inline XBRL Taxonomy Extension Calculation Linkbase Document |
| | |
101.DEF* | | —
Inline XBRL Taxonomy Extension Definition Linkbase Document |
| | |
| | | | | | | | |
101.LAB* | | —
Inline XBRL Taxonomy Extension Label Linkbase Document |
| | |
101.PRE* | | —
Inline XBRL Taxonomy Extension Presentation Linkbase Document |
* | Filed herewith. |
| | |
| 104 | | Cover Page Interactive Data File (formatted as Inline XBRL and contained in Exhibit 101) |
| | | | | |
| * | Filed herewith. |
| † | Management contracts and compensatory plans and arrangements. |
| ** | Furnished herewith. |
PLEASE NOTE: Pursuant to the rules and regulations of the Securities and Exchange Commission, we have filed or incorporated by reference the agreements referenced above as exhibits to this Annual Report on Form 10-K. The agreements have been filed to provide investors with information regarding their respective terms. The agreements are not intended to provide any other factual information about Civeo or its business or operations. In particular, the assertions embodied in any representations, warranties and covenants contained in the agreements may be subject to qualifications with respect to knowledge and materiality different from those applicable to investors and may be qualified by information in confidential disclosure schedules not included with the exhibits. These disclosure schedules may contain information that modifies, qualifies and creates exceptions to the representations, warranties and covenants set forth in the agreements. Moreover, certain representations, warranties and covenants in the agreements may have been used for the purpose of allocating risk between the parties, rather than establishing matters as facts. In addition, information concerning the subject matter of the representations, warranties and covenants may have changed after the date of the respective agreement, which subsequent information may or may not be fully reflected in our public disclosures. Accordingly, investors should not rely on the representations, warranties and covenants in the agreements as characterizations of the actual state of facts about Civeo or its business or operations on the date hereof.
ITEM 16. hereof.
ITEM16.Form 10-K SummaryNone.
None.
Pursuant to the requirements of
Section 13 or 15 (d) of the Securities Exchange Act of 1934, the registrant has duly caused this report to be signed on its behalf by the undersigned, thereunto duly authorized on February 23, 2018.29, 2024. | | | | | | | | | | | |
| CIVEO CORPORATION | |
| | | |
| | | |
| By | /s/ FRANK C. STEININGER CAROLYN J. STONE | |
| | Frank C. Steininger
Carolyn J. Stone | |
| |
Senior Vice President, Chief Financial Officer and Treasurer (Duly Authorized Officer and Principal Financial Officer)
|
| | | | | | | | |
| Signature | | Title |
| | |
/s/ RICHARD A. NAVARRE | | ChairmanChair of the Board
|
Richard A. Navarre | | |
| | |
/s/ BRADLEY J. DODSON | | Director, President &and Chief Executive Officer |
Bradley J. Dodson | | (Principal Executive Officer) |
| | |
/s/ FRANK C. STEININGER CAROLYN J. STONE | | Senior Vice President, Chief Financial Officer and Treasurer |
Frank C. Steininger
Carolyn J. Stone | | and Treasurer
|
| | (Principal Financial Officer and Accounting Officer) |
| | |
/s/ C. RONALD BLANKENSHIP | | Director |
C. Ronald Blankenship | | |
| | |
| /s/ JAY K. GREWAL | | Director |
Jay K. Grewal | | |
| | |
| /s/ MARTIN A. LAMBERT | | Director |
Martin A. Lambert | | |
| | |
| /s/ MICHAEL MONTELONGO | | Director |
Michael Montelongo | | |
| | |
| /s/ CONSTANCE B. MOORE | | Director |
Constance B. Moore | | |
| | |
/s/ CHARLES SZALKOWSKI | | Director |
| Charles Szalkowski | | |
| | |
| /s/ TIMOTHY O. WALL | | Director |
Timothy O. Wall | | |
| | |
/s/ CHARLES SZALKOWSKI
| | Director
|
Charles Szalkowski
| | |
INDEX TO CONSOLIDATED FINANCIAL STATEMENTS
| | | | | |
| Page No. |
| |
| 92
|
| 93
|
| 94
|
| 95
|
| 96
|
| 97
|
| 98
|
| 99 -126
|
Report of Independent Registered Public AccountingPublic Accounting Firm
To the Shareholders and the Board of Directors of Civeo Corporation
Opinion on the Financial Statements We have audited the accompanying consolidated balance sheets of Civeo Corporation (“the Company”) as of December 31, 20172023 and 2016,2022, and the related consolidated statements of operations, comprehensive loss,income (loss), changes in shareholders' equity and cash flows for each of the three years in the period ended December 31, 2017,2023, and the related notes (collectively referred to as the “consolidated financial statements”). In our opinion, the consolidated financial statements present fairly, in all material respects, the financial position of the Company at December 31, 20172023 and 2016,2022, and the results of its operations and its cash flows for each of the three years in the period ended December 31, 2017,2023, in conformity with U.S. generally accepted accounting principles.
We also have audited, in accordance with the standards of the Public Company Accounting Oversight Board (United States) (PCAOB), the Company's internal control over financial reporting as of December 31, 2017,2023, based on criteria established in Internal Control-Integrated Framework issued by the Committee of Sponsoring Organizations of the Treadway Commission (2013 framework),and our report dated February 23, 201829, 2024 expressed an unqualified opinion thereon.
These financial statements are the responsibility of the Company's management. Our responsibility is to express an opinion on the Company’sCompany’s financial statements based on our audits. We are a public accounting firm registered with the PCAOB and are required to be independent with respect to the Company in accordance with the U.S. federal securities laws and the applicable rules and regulations of the Securities and Exchange Commission and the PCAOB.
We conducted our audits in accordance with the standards of the PCAOB. Those standards require that we plan and perform the audit to obtain reasonable assurance about whether the financial statements are free of material misstatement, whether due to error or fraud. Our audits included performing procedures to assess the risks of material misstatement of the financial statements, whether due to error or fraud, and performing procedures that respond to those risks. Such procedures included examining, on a test basis, evidence regarding the amounts and disclosures in the financial statements. Our audits also included evaluating the accounting principles used and significant estimates made by management, as well as evaluating the overall presentation of the financial statements. We believe that our audits provide a reasonable basis for our opinion.
Critical Audit Matter
The critical audit matter communicated below is a matter arising from the current period audit of the financial statements that was communicated or required to be communicated to the audit committee and that: (1) relates to accounts or disclosures that are material to the financial statements and (2) involved our especially challenging, subjective or complex judgments. The communication of the critical audit matter does not alter in any way our opinion on the consolidated financial statements, taken as a whole, and we are not, by communicating the critical audit matter below, providing a separate opinion on the critical audit matter or on the accounts or disclosures to which it relates.
| | | | | |
| Realizability of Deferred Tax Assets |
| Description of the Matter | As more fully described in Note 2 and Note 14 to the consolidated financial statements, at December 31, 2023, the Company had deferred tax assets related to deductible temporary differences and net loss carryforwards of $46.2 million, net of a $78.8 million valuation allowance. Deferred tax assets are reduced by a valuation allowance if, based on the weight of all available evidence, in management’s judgment it is more likely than not that some portion, or all, of the deferred tax assets will not be realized.
Auditing management’s assessment of the realizability of its deferred tax assets was complex and involved subjectivity because the assessment process includes scheduling the use of the applicable deferred tax assets, which includes management’s judgments related to the forecasted turns of both deferred tax assets and deferred tax liabilities. |
| How We Addressed the Matter in Our Audit | We obtained an understanding, evaluated the design, and tested the operating effectiveness of controls over the Company's process to assess the realizability of its deferred tax assets. For example, we tested controls over management's scheduling of the future reversal of existing taxable temporary differences.
To test the Company’s assessment of the realizability of its deferred tax assets, our audit procedures included, among others, testing the completeness and accuracy of the Company’s scheduling of the reversal of existing temporary taxable differences. With the assistance of our tax specialists, we verified the appropriateness of the projected usage of tax attributes and assessed the reasonableness of the timing of the reversal of the deferred tax liabilities into taxable income. |
We have served as the
Company’sCompany’s auditor since 2013.February
23, 201829, 2024
Report of Independent Registered Public Accounting Firm
To
the Shareholders and the Board of Directors of Civeo Corporation
Opinion on Internal Control
overover Financial ReportingWe have audited Civeo Corporation’sCorporation’s internal control over financial reporting as of December 31, 2017,2023, based on criteria established in Internal Control— IntegratedControl-Integrated Framework issued by the Committee of Sponsoring Organizations of the Treadway Commission (2013 framework) (the COSO criteria). In our opinion, Civeo Corporation (“the Company”) maintained, in all material respects, effective internal control over financial reporting as of December 31, 2017,2023, based on the COSO criteria.
We also have audited, in accordance with the standards of the Public Company Accounting Oversight Board (United States) (PCAOB), the consolidated balance sheets of the Company as of December 31,
20172023 and
2016,2022, and the related consolidated statements of
operations, comprehensive loss,income (loss), changes in shareholders’shareholders' equity and cash flows for each of the three years in the period ended December 31, 2017,2023, and the related notes and our report dated February 23, 201829, 2024 expressed an unqualified opinion thereon.
The
Company’sCompany’s management is responsible for maintaining effective internal control over financial reporting and for its assessment of the effectiveness of internal control over financial reporting included in the accompanying Management’s annual report on internal control over financial reporting. Our responsibility is to express an opinion on the Company’s internal control over financial reporting based on our audit. We are a public accounting firm registered with the PCAOB and are required to be independent with respect to the Company in accordance with the U.S. federal securities laws and the applicable rules and regulations of the Securities and Exchange Commission and the PCAOB.
We
conducted our audit in accordance with the standards of the PCAOB. Those standards require that we plan and perform the audit to obtain reasonable assurance about whether effective internal control over financial reporting was maintained in all material respects.
Our audit included obtaining an understanding of
internal control over financial reporting, assessing the risk that a material weakness exists, testing and evaluating the design and operating effectiveness of internal control based on the assessed risk, and performing such other procedures as we considered necessary in the circumstances. We believe that our audit provides a reasonable basis for our opinion.
Definition and
LimitationsLimitations of Internal Control OverControl Over Financial ReportingReporting
A
company’scompany’s internal control over financial reporting is a process designed to provide reasonable assurance regarding the reliability of financial reporting and the preparation of financial statements for external purposes in accordance with generally accepted accounting principles. A company’s internal control over financial reporting includes those policies and procedures that (1) pertain to the maintenance of records that, in reasonable detail, accurately and fairly reflect the transactions and dispositions of the assets of the company; (2) provide reasonable assurance that transactions are recorded as necessary to permit preparation of financial statements in accordance with generally accepted accounting principles, and that receipts and expenditures of the company are being made only in accordance with authorizations of management and directors of the company; and (3) provide reasonable assurance regarding prevention or timely detection of unauthorized acquisition, use, or disposition of the company’s assets that could have a material effect on the financial statements.Because
Because of its inherent limitations, internal control over financial reporting may not prevent or detect misstatements. Also, projections of any evaluation of effectiveness to future periods are subject to the risk that controls may become inadequate because of changes in conditions, or that the degree of compliance with the policies or procedures may deteriorate.
February
23, 201829, 2024
CIVEO CORPORATION
CIVEO CORPORATION
CONSOLIDATED CONSOLIDATED STATEMENTS OF
OPERATIONS
(In Thousands,
, Except Per Share Amounts)Amounts)| | | YEAR ENDED DECEMBER 31, | |
| | | 2017 | | | 2016 | | | 2015 | |
Revenues: | | | | | | | | | | | | |
Service and other | | $ | 371,462 | | | $ | 378,585 | | | $ | 489,788 | |
Product | | | 10,814 | | | | 18,645 | | | | 28,175 | |
| | | | 382,276 | | | | 397,230 | | | | 517,963 | |
Costs and expenses: | | | | | | | | | | | | |
Service and other costs | | | 244,978 | | | | 238,037 | | | | 300,888 | |
Product costs | | | 12,280 | | | | 21,613 | | | | 26,725 | |
Selling, general and administrative expenses | | | 63,431 | | | | 55,297 | | | | 68,441 | |
Depreciation and amortization expense | | | 126,443 | | | | 131,302 | | | | 152,990 | |
Impairment expense | | | 31,604 | | | | 46,129 | | | | 122,926 | |
Other operating expense (income) | | | 1,511 | | | | 612 | | | | (9,004 | ) |
| | | | 480,247 | | | | 492,990 | | | | 662,966 | |
Operating loss | | | (97,971 | ) | | | (95,760 | ) | | | (145,003 | ) |
| | | | | | | | | | | | | |
Interest expense to third-parties, net of capitalized interest | | | (21,439 | ) | | | (22,667 | ) | | | (22,585 | ) |
Loss on extinguishment of debt | | | (842 | ) | | | (302 | ) | | | (1,474 | ) |
Interest income | | | 200 | | | | 152 | | | | 2,033 | |
Other income | | | 1,308 | | | | 2,645 | | | | 3,276 | |
Loss before income taxes | | | (118,744 | ) | | | (115,932 | ) | | | (163,753 | ) |
Income tax benefit | | | 13,490 | | | | 20,105 | | | | 33,089 | |
Net loss | | | (105,254 | ) | | | (95,827 | ) | | | (130,664 | ) |
Less: Net income attributable to noncontrolling interest | | | 459 | | | | 561 | | | | 1,095 | |
Net loss attributable to Civeo Corporation | | $ | (105,713 | ) | | $ | (96,388 | ) | | $ | (131,759 | ) |
| | | | | | | | | | | | | |
| | | | | | | | | | | | | |
Per Share Data (see Note 6) | | | | | | | | | | | | |
Basic net loss per share attributable to Civeo Corporation common shareholders | | $ | (0.82 | ) | | $ | (0.90 | ) | | $ | (1.24 | ) |
| | | | | | | | | | | | | |
Diluted net loss per share attributable to Civeo Corporation common shareholders | | $ | (0.82 | ) | | $ | (0.90 | ) | | $ | (1.24 | ) |
| | | | | | | | | | | | | |
Weighted average number of common shares outstanding: | | | | | | | | | | | | |
Basic | | | 128,365 | | | | 107,024 | | | | 106,604 | |
Diluted | | | 128,365 | | | | 107,024 | | | | 106,604 | |
| | | | | | | | | | | | | | | | | |
| | YEAR ENDED DECEMBER 31, |
| | 2023 | | 2022 | | 2021 |
| Revenues: | | | | | |
| Service and other | $ | 699,006 | | | $ | 676,001 | | | $ | 575,186 | |
| Rental | 737 | | | 18,316 | | | 16,033 | |
| Product | 1,062 | | | 2,735 | | | 3,244 | |
| | 700,805 | | | 697,052 | | | 594,463 | |
| Costs and expenses: | | | | | |
| Service and other costs | 529,741 | | | 500,513 | | | 420,579 | |
| Rental costs | 176 | | | 14,975 | | | 13,960 | |
| Product costs | 370 | | | 1,575 | | | 1,923 | |
| Selling, general and administrative expenses | 72,605 | | | 69,962 | | | 60,600 | |
| Depreciation and amortization expense | 75,142 | | | 87,214 | | | 83,101 | |
| Impairment expense | 1,395 | | | 5,721 | | | 7,935 | |
| Gain on sale of McClelland Lake Lodge assets, net | (18,590) | | | — | | | — | |
| Other operating expense | 479 | | | 74 | | | 313 | |
| | 661,318 | | | 680,034 | | | 588,411 | |
| Operating income | 39,487 | | | 17,018 | | | 6,052 | |
| | | | | |
| Interest expense | (13,177) | | | (11,474) | | | (12,964) | |
| Loss on extinguishment of debt | — | | | — | | | (416) | |
| Interest income | 172 | | | 39 | | | 2 | |
| Other income | 13,881 | | | 5,149 | | | 13,199 | |
| Income before income taxes | 40,363 | | | 10,732 | | | 5,873 | |
| Income tax expense | (10,633) | | | (4,402) | | | (3,376) | |
| Net income | 29,730 | | | 6,330 | | | 2,497 | |
| Less: Net income (loss) attributable to noncontrolling interest | (427) | | | 2,333 | | | 1,147 | |
| Net income attributable to Civeo Corporation | 30,157 | | | 3,997 | | | 1,350 | |
| Less: Dividends attributable to Class A preferred shares | — | | | 1,771 | | | 1,925 | |
| Net income (loss) attributable to Civeo common shareholders | $ | 30,157 | | | $ | 2,226 | | | $ | (575) | |
| | | | | |
| | | | | |
| Per Share Data (see Note 6) | | | | | |
| Basic net income (loss) per share attributable to Civeo Corporation common shareholders | $ | 2.02 | | | $ | (0.21) | | | $ | (0.04) | |
| | | | | |
| Diluted net income (loss) per share attributable to Civeo Corporation common shareholders | $ | 2.01 | | | $ | (0.21) | | | $ | (0.04) | |
| | | | | |
| Weighted average number of common shares outstanding: | | | | | |
| Basic | 14,906 | | | 14,002 | | | 14,232 | |
| Diluted | 15,013 | | | 14,002 | | | 14,232 | |
The accompanying notes are an integral part of these financial statements.
CIVEO CORPORATION
CIVEO CORPORATION
CONSOLIDATED CONSOLIDATED STATEMENTS OF COMPREHENSIVE
LOSSINCOME (LOSS)
(In Thousands)
| | | YEAR ENDED DECEMBER 31, | |
| | | 2017 | | | 2016 | | | 2015 | |
| | | | | | | | | | | | | |
Net loss | | $ | (105,254 | ) | | $ | (95,827 | ) | | $ | (130,664 | ) |
| | | | | | | | | | | | | |
Other comprehensive income (loss), net of tax: | | | | | | | | | | | | |
Foreign currency translation adjustment, net of tax of zero, zero and $1.9 million, respectively | | | 35,038 | | | | 3,389 | | | | (168,363 | ) |
Total other comprehensive income (loss), net of tax | | | 35,038 | | | | 3,389 | | | | (168,363 | ) |
| | | | | | | | | | | | | |
Comprehensive loss | | | (70,216 | ) | | | (92,438 | ) | | | (299,027 | ) |
Comprehensive income attributable to noncontrolling interest | | | (780 | ) | | | (571 | ) | | | (550 | ) |
Comprehensive loss attributable to Civeo Corporation | | $ | (70,996 | ) | | $ | (93,009 | ) | | $ | (299,577 | ) |
The accompanying notes are an integral part of these financial statements.
CIVEO CORPORATION
CONSOLIDATED BALANCE SHEETS
(In Thousands)
| | | | | | | | | |
| | | DECEMBER 31, 2017 | | | DECEMBER 31, 2016 | |
| ASSETS | | | | | | | | |
| | | | | | | | | |
Current assets: | | | | | | | | |
Cash and cash equivalents | | $ | 32,647 | | | $ | 1,785 | |
Accounts receivable, net | | | 66,823 | | | | 56,302 | |
Inventories | | | 7,246 | | | | 3,112 | |
Prepaid expenses | | | 14,481 | | | | 15,431 | |
Other current assets | | | 1,553 | | | | 1,519 | |
Assets held for sale | | | 9,462 | | | | 4,419 | |
Total current assets | | | 132,212 | | | | 82,568 | |
| | | | | | | | | |
Property, plant and equipment, net | | | 693,833 | | | | 789,710 | |
Other intangible assets, net | | | 22,753 | | | | 28,039 | |
Other noncurrent assets | | | 5,114 | | | | 10,129 | |
Total assets | | $ | 853,912 | | | $ | 910,446 | |
| | | | | | | | | |
LIABILITIES AND SHAREHOLDERS’ EQUITY | | | | | | | | |
| | | | | | | | | |
Current liabilities: | | | | | | | | |
Accounts payable | | $ | 27,812 | | | $ | 20,675 | |
Accrued liabilities | | | 22,208 | | | | 14,822 | |
Income taxes | | | 1,728 | | | | 111 | |
Current portion of long-term debt | | | 16,596 | | | | 15,471 | |
Deferred revenue | | | 5,442 | | | | 6,792 | |
Other current liabilities | | | 1,843 | | | | 2,572 | |
Total current liabilities | | | 75,629 | | | | 60,443 | |
| | | | | | | | | |
Long-term debt, less current maturities | | | 277,990 | | | | 337,800 | |
Deferred income taxes | | | -- | | | | 9,194 | |
Other noncurrent liabilities | | | 23,926 | | | | 27,019 | |
Total liabilities | | | 377,545 | | | | 434,456 | |
| | | | | | | | | |
Commitments and contingencies (Note 14) | | | | | | | | |
| | | | | | | | | |
Shareholders’ Equity: | | | | | | | | |
Common shares (no par value; 550,000,000 shares authorized, 132,427,885 shares and 108,171,329 shares issued, respectively, and 132,262,434 shares and 108,103,048 shares outstanding, respectively) | | | -- | | | | -- | |
Additional paid-in capital | | | 1,383,934 | | | | 1,311,226 | |
Accumulated deficit | | | (579,113 | ) | | | (472,764 | ) |
Common shares held in treasury at cost, 165,451 and 68,281 shares, respectively | | | (358 | ) | | | (65 | ) |
Accumulated other comprehensive loss | | | (328,213 | ) | | | (362,930 | ) |
Total Civeo Corporation shareholders’ equity | | | 476,250 | | | | 475,467 | |
Noncontrolling interest | | | 117 | | | | 523 | |
Total shareholders’ equity | | | 476,367 | | | | 475,990 | |
Total liabilities and shareholders’ equity | | $ | 853,912 | | | $ | 910,446 | |
The accompanying notes are an integral part of these financial statements.
| | | | | | | | | | | | | | | | | |
| | YEAR ENDED DECEMBER 31, |
| | 2023 | | 2022 | | 2021 |
| | | | | |
| Net income | $ | 29,730 | | | $ | 6,330 | | | $ | 2,497 | |
| | | | | |
| Other comprehensive income (loss), net of taxes: | | | | | |
| Foreign currency translation adjustment, net of zero taxes | 4,532 | | | (23,486) | | | (12,936) | |
| Total other comprehensive income (loss), net of taxes | 4,532 | | | (23,486) | | | (12,936) | |
| | | | | |
| Comprehensive income (loss) | 34,262 | | | (17,156) | | | (10,439) | |
| Less: Comprehensive income (loss) attributable to noncontrolling interest | (367) | | | 2,151 | | | 1,105 | |
| Comprehensive income (loss) attributable to Civeo Corporation | $ | 34,629 | | | $ | (19,307) | | | $ | (11,544) | |
CIVEO CORPORATION
CONSOLIDATED STATEMENTS OF CHANGES IN
SHAREHOLDERS’ EQUITY
(In Thousands)
| | | Attributable to Civeo | | | | | | | | | |
| | | Common Shares | | | | | | | | | | | | | | | | | | | | | |
| | | Par Value | | | Additional Paid-in Capital | | | Accumulated Deficit | | | Treasury Shares | | | Accumulated Other Comprehensive Income (Loss) | | | Noncontrolling Interest | | | Total Shareholders’ Equity | |
| | | | | | | | | | | | | | | | | | | | | | | | | | | | | |
Balance, December 31, 2014 | | $ | 1,067 | | | $ | 1,300,042 | | | $ | (244,617 | ) | | $ | -- | | | $ | (198,491 | ) | | $ | 2,108 | | | $ | 860,109 | |
Net income (loss) | | | -- | | | | -- | | | | (131,759 | ) | | | -- | | | | -- | | | | 1,095 | | | | (130,664 | ) |
Currency translation adjustment | | | -- | | | | -- | | | | -- | | | | -- | | | | (167,818 | ) | | | (545 | ) | | | (168,363 | ) |
Dividends paid | | | -- | | | | -- | | | | -- | | | | -- | | | | -- | | | | (2,133 | ) | | | (2,133 | ) |
Reclassification in connection with our redomicile transaction | | | (1,075 | ) | | | 929 | | | | -- | | | | 146 | | | | -- | | | | -- | | | | -- | |
Share-based compensation | | | 8 | | | | 5,102 | | | | -- | | | | (146 | ) | | | -- | | | | -- | | | | 4,964 | |
Other | | | -- | | | | (143 | ) | | | -- | | | | -- | | | | -- | | | | -- | | | | (143 | ) |
Balance, December 31, 2015 | | $ | -- | | | $ | 1,305,930 | | | $ | (376,376 | ) | | $ | -- | | | $ | (366,309 | ) | | $ | 525 | | | $ | 563,770 | |
Net income (loss) | | | -- | | | | -- | | | | (96,388 | ) | | | -- | | | | -- | | | | 561 | | | | (95,827 | ) |
Currency translation adjustment | | | -- | | | | -- | | | | -- | | | | -- | | | | 3,379 | | | | 10 | | | | 3,389 | |
Dividends paid | | | -- | | | | -- | | | | -- | | | | -- | | | | -- | | | | (573 | ) | | | (573 | ) |
Share-based compensation | | | -- | | | | 5,296 | | | | -- | | | | (65 | ) | | | -- | | | | -- | | | | 5,231 | |
Other | | | -- | | | | -- | | | | -- | | | | -- | | | | -- | | | | -- | | | | -- | |
Balance, December 31, 2016 | | $ | -- | | | $ | 1,311,226 | | | $ | (472,764 | ) | | $ | (65 | ) | | $ | (362,930 | ) | | $ | 523 | | | $ | 475,990 | |
Net income (loss) | | | -- | | | | -- | | | | (105,713 | ) | | | -- | | | | -- | | | | 459 | | | | (105,254 | ) |
Currency translation adjustment. | | | -- | | | | -- | | | | -- | | | | -- | | | | 34,717 | | | | 321 | | | | 35,038 | |
Dividends paid | | | -- | | | | -- | | | | -- | | | | -- | | | | -- | | | | (1,186 | ) | | | (1,186 | ) |
Cumulative effect of implementation of ASU 2016-09 | | | -- | | | | 636 | | | | (636 | ) | | | -- | | | | -- | | | | -- | | | | -- | |
Issuance of common shares | | | -- | | | | 64,734 | | | | -- | | | | -- | | | | -- | | | | -- | | | | 64,734 | |
Share-based compensation | | | -- | | | | 7,338 | | | | -- | | | | (293 | ) | | | -- | | | | -- | | | | 7,045 | |
Balance, December 31, 2017 | | $ | -- | | | $ | 1,383,934 | | | $ | (579,113 | ) | | $ | (358 | ) | | $ | (328,213 | ) | | $ | 117 | | | $ | 476,367 | |
| |
Common Stock (in thousands)
| | | | | | | | | | | | | | | | | | | | | | | | | |
Balance, December 31, 2014
| | | 106,721 | | | | | | | | | | | | | | | | | | | | | | | | | |
Share-based compensation
| | | 750 | | | | | | | | | | | | | | | | | | | | | | | | | |
Balance, December 31, 2015
| | | 107,471 | | | | | | | | | | | | | | | | | | | | | | | | | |
Share-based compensation
| | | 632 | | | | | | | | | | | | | | | | | | | | | | | | | |
Balance, December 31, 2016
| | | 108,103 | | | | | | | | | | | | | | | | | | | | | | | | | |
Issuance of common shares
| | | 23,000 | | | | | | | | | | | | | | | | | | | | | | | | | |
Share-based compensation
| | | 1,159 | | | | | | | | | | | | | | | | | | | | | | | | | |
Balance, December 31, 2017
| | | 132,262 | | | | | | | | | | | | | | | | | | | | | | | | | |
The accompanying notes are an integral part of these financial statements.
CIVEO CORPORATION
CIVEO CORPORATION
CONSOLIDATED STATEMENTS OF CASH FLOWS
CONSOLIDATEDBALANCE SHEETS
| | | YEAR ENDED DECEMBER 31, | |
| | | 2017 | | | 2016 | | | 2015 | |
| | | | | | | | | | | | | |
Cash flows from operating activities: | | | | | | | | | | | | |
Net loss | | $ | (105,254 | ) | | $ | (95,827 | ) | | $ | (130,664 | ) |
Adjustments to reconcile net loss to net cash provided by operating activities: | | | | | | | | | | | | |
Depreciation and amortization | | | 126,443 | | | | 131,302 | | | | 152,990 | |
Impairment charges | | | 31,604 | | | | 46,129 | | | | 122,926 | |
Inventory write-down | | | 525 | | | | 850 | | | | 1,015 | |
Loss on extinguishment of debt | | | 842 | | | | 302 | | | | 1,474 | |
Deferred income tax benefit | | | (8,976 | ) | | | (13,208 | ) | | | (34,175 | ) |
Non-cash compensation charge | | | 7,338 | | | | 5,296 | | | | 4,614 | |
(Gain) loss on disposals of assets | | | (825 | ) | | | 29 | | | | (1,826 | ) |
Provision (benefit) for loss on receivables, net of recoveries | | | 51 | | | | (54 | ) | | | 1,205 | |
Other, net | | | 3,871 | | | | 868 | | | | 1,424 | |
Changes in operating assets and liabilities: | | | | | | | | | | | | |
Accounts receivable | | | (6,896 | ) | | | 6,680 | | | | 80,347 | |
Inventories | | | (4,463 | ) | | | 1,773 | | | | 5,406 | |
Accounts payable and accrued liabilities | | | 12,674 | | | | (4,398 | ) | | | (12,739 | ) |
Taxes payable | | | 3,210 | | | | (10,239 | ) | | | 6,204 | |
Other current assets and liabilities, net | | | (3,318 | ) | | | (7,334 | ) | | | (11,924 | ) |
Net cash flows provided by operating activities | | | 56,826 | | | | 62,169 | | | | 186,277 | |
| | | | | | | | | | | | | |
Cash flows from investing activities: | | | | | | | | | | | | |
Capital expenditures, including capitalized interest | | | (11,194 | ) | | | (19,779 | ) | | | (62,451 | ) |
Proceeds from disposition of property, plant and equipment | | | 1,908 | | | | 5,775 | | | | 12,683 | |
Other, net | | | 548 | | | | 1,315 | | | | -- | |
Net cash flows used in investing activities | | | (8,738 | ) | | | (12,689 | ) | | | (49,768 | ) |
| | | | | | | | | | | | | |
Cash flows from financing activities: | | | | | | | | | | | | |
Proceeds from issuance of common shares, net | | | 64,734 | | | | -- | | | | 500 | |
Revolving credit borrowings | | | 44,525 | | | | 310,539 | | | | 299,427 | |
Revolving credit repayments | | | (84,462 | ) | | | (325,738 | ) | | | (240,284 | ) |
Term loan borrowings | | | -- | | | | -- | | | | 325,000 | |
Term loan repayments | | | (40,781 | ) | | | (41,023 | ) | | | (729,425 | ) |
Debt issuance costs | | | (1,795 | ) | | | (2,062 | ) | | | (4,833 | ) |
Other, net | | | (293 | ) | | | (65 | ) | | | (146 | ) |
Net cash flows used in financing activities | | | (18,072 | ) | | | (58,349 | ) | | | (349,761 | ) |
| | | | | | | | | | | | | |
Effect of exchange rate changes on cash | | | 846 | | | | 2,817 | | | | (42,225 | ) |
Net change in cash and cash equivalents | | | 30,862 | | | | (6,052 | ) | | | (255,477 | ) |
Cash and cash equivalents, beginning of period | | | 1,785 | | | | 7,837 | | | | 263,314 | |
| | | | | | | | | | | | | |
Cash and cash equivalents, end of period | | $ | 32,647 | | | $ | 1,785 | | | $ | 7,837 | |
| | | | | | | | | | | | | | |
| | DECEMBER 31, |
| | 2023 | | 2022 |
| ASSETS | | | | |
| | | | |
| Current assets: | | | | |
| Cash and cash equivalents | | $ | 3,323 | | | $ | 7,954 | |
| Accounts receivable, net | | 143,222 | | | 119,755 | |
| Inventories | | 6,982 | | | 6,907 | |
| Prepaid expenses | | 8,439 | | | 7,199 | |
| Other current assets | | 7,407 | | | 3,081 | |
| Assets held for sale | | 5,873 | | | 8,653 | |
| Total current assets | | 175,246 | | | 153,549 | |
| | | | |
| Property, plant and equipment, net | | 270,563 | | | 301,890 | |
| Goodwill | | 7,690 | | | 7,672 | |
| Other intangible assets, net | | 77,999 | | | 81,747 | |
| Operating lease right-of-use assets | | 12,286 | | | 15,722 | |
| Other noncurrent assets | | 4,278 | | | 5,604 | |
| Total assets | | $ | 548,062 | | | $ | 566,184 | |
| | | | |
| LIABILITIES AND SHAREHOLDERS’ EQUITY | | | | |
| | | | |
| Current liabilities: | | | | |
| Accounts payable | | $ | 58,699 | | | $ | 51,087 | |
| Accrued liabilities | | 40,523 | | | 39,211 | |
| Income taxes | | 3,831 | | | 178 | |
| Current portion of long-term debt | | — | | | 28,448 | |
| Deferred revenue | | 4,849 | | | 991 | |
| Other current liabilities | | 6,334 | | | 8,342 | |
| Total current liabilities | | 114,236 | | | 128,257 | |
| | | | |
| Long-term debt, less current maturities | | 65,554 | | | 102,505 | |
| Deferred income taxes | | 11,803 | | | 4,778 | |
| Operating lease liabilities | | 9,264 | | | 12,771 | |
| Other noncurrent liabilities | | 24,167 | | | 14,172 | |
| Total liabilities | | 225,024 | | | 262,483 | |
| | | | |
| Commitments and contingencies (Note 15) | | | | |
| | | | |
| Shareholders’ equity: | | | | |
| Preferred shares (Class A Series 1) | | — | | | — | |
| Common shares (no par value; 46,000,000 shares authorized, 15,046,756 shares and 15,584,176 shares issued, respectively, and 14,680,081 shares and 15,217,501 shares outstanding, respectively) | | — | | | — | |
| Additional paid-in capital | | 1,628,972 | | | 1,624,512 | |
| Accumulated deficit | | (919,023) | | | (930,123) | |
| Common shares held in treasury at cost, 366,675 and 366,675 shares, respectively | | (9,063) | | | (9,063) | |
| Accumulated other comprehensive loss | | (380,715) | | | (385,187) | |
| Total Civeo Corporation shareholders’ equity | | 320,171 | | | 300,139 | |
| Noncontrolling interest | | 2,867 | | | 3,562 | |
| Total shareholders’ equity | | 323,038 | | | 303,701 | |
| Total liabilities and shareholders’ equity | | $ | 548,062 | | | $ | 566,184 | |
The accompanying notes are an integral part of these financial statements.
CIVEO CORPORATION
1.
| DESCRIPTION OF BUSINESS AND BASIS OF PRESENTATION
|
CONSOLIDATED STATEMENTS OF CHANGES IN
SHAREHOLDERS’ EQUITY
(In Thousands)
| | | | | | | | | | | | | | | | | | | | | | | | | | | | | | | | | | | | | | | | | | | | | | | | |
| | Attributable to Civeo | | | | |
| | Preferred Shares | | Common Shares | | | | | | | | | | | |
| | | | Par Value | | Additional
Paid-in
Capital | | Accumulated
Deficit | | Treasury
Shares | | Accumulated
Other
Comprehensive
Income (Loss) | | Noncontrolling
Interest | | Total
Shareholders’
Equity | |
| Balance, December 31, 2020 | $ | 60,016 | | | $ | — | | | $ | 1,578,315 | | | $ | (907,727) | | | $ | (6,930) | | | $ | (348,989) | | | $ | 672 | | | $ | 375,357 | | |
| Net income | — | | | — | | | — | | | 1,350 | | | — | | | — | | | 1,147 | | | 2,497 | | |
| Currency translation adjustment | — | | | — | | | — | | | — | | | — | | | (12,894) | | | (42) | | | (12,936) | | |
| Dividends paid | — | | | — | | | — | | | — | | | — | | | — | | | (165) | | | (165) | | |
| Paid-in-kind dividends attributable to Class A preferred shares | 1,925 | | | — | | | — | | | (1,925) | | | — | | | — | | | — | | | — | | |
| Common shares repurchases | — | | | — | | | — | | | (4,649) | | | — | | | — | | | — | | | (4,649) | | |
| Share-based compensation | — | | | — | | | 4,127 | | | — | | | (1,120) | | | — | | | — | | | 3,007 | | |
| Balance, December 31, 2021 | $ | 61,941 | | | $ | — | | | $ | 1,582,442 | | | $ | (912,951) | | | $ | (8,050) | | | $ | (361,883) | | | $ | 1,612 | | | $ | 363,111 | | |
| Net income | — | | | — | | | — | | | 3,997 | | | — | | | — | | | 2,333 | | | 6,330 | | |
| Currency translation adjustment | — | | | — | | | — | | | — | | | — | | | (23,304) | | | (182) | | | (23,486) | | |
| Dividends paid | — | | | — | | | — | | | (65) | | | — | | | — | | | (201) | | | (266) | | |
| Paid-in-kind dividends attributable to Class A preferred shares | 1,706 | | | — | | | — | | | (1,706) | | | — | | | — | | | — | | | — | | |
| Preferred shares repurchased | (25,364) | | | — | | | — | | | (5,189) | | | — | | | — | | | — | | | (30,553) | | |
| Preferred shares converted to common shares | (38,283) | | | — | | | 38,283 | | | — | | | — | | | — | | | — | | | — | | |
| Common shares repurchases | — | | | — | | | — | | | (14,209) | | | — | | | — | | | — | | | (14,209) | | |
| Share-based compensation | — | | | — | | | 3,787 | | | — | | | (1,013) | | | — | | | — | | | 2,774 | | |
| Balance, December 31, 2022 | $ | — | | | $ | — | | | $ | 1,624,512 | | | $ | (930,123) | | | $ | (9,063) | | | $ | (385,187) | | | $ | 3,562 | | | $ | 303,701 | | |
| Net income (loss) | — | | | — | | | — | | | 30,157 | | | — | | | — | | | (427) | | | 29,730 | | |
| Currency translation adjustment | — | | | — | | | — | | | — | | | — | | | 4,472 | | | 60 | | | 4,532 | | |
| Dividends paid | — | | | — | | | — | | | (7,423) | | | — | | | — | | | (328) | | | (7,751) | | |
| Common shares repurchased | — | | | — | | | — | | | (11,634) | | | — | | | — | | | — | | | (11,634) | | |
| Share-based compensation | — | | | — | | | 4,460 | | | — | | | — | | | — | | | — | | | 4,460 | | |
| Balance, December 31, 2023 | $ | — | | | $ | — | | | $ | 1,628,972 | | | $ | (919,023) | | | $ | (9,063) | | | $ | (380,715) | | | $ | 2,867 | | | $ | 323,038 | | |
| | | | | | | | | | | |
| | Preferred
Shares | | Common Shares (in thousands) |
| Balance, December 31, 2020 | 9,042 | | | 14,215 | |
| Share-based compensation | — | | | 113 | |
| Shares repurchased | — | | | (217) | |
| Balance, December 31, 2021 | 9,042 | | | 14,111 | |
| Share-based compensation | — | | | 100 | |
| Shares repurchased | (3,617) | | | (498) | |
| Preferred shares converted to common shares | (5,425) | | | 1,505 | |
| Balance, December 31, 2022 | — | | | 15,218 | |
| Share-based compensation | — | | | 26 | |
| Shares repurchased | — | | | (564) | |
| Balance, December 31, 2023 | — | | | 14,680 | |
The accompanying notes are an integral part of these financial statements.
CIVEO CORPORATION
CONSOLIDATEDSTATEMENTS OF CASH FLOWS
(In Thousands)
| | | | | | | | | | | | | | | | | |
| | YEAR ENDED DECEMBER 31, |
| | 2023 | | 2022 | | 2021 |
| Cash flows from operating activities: | | | | | |
| Net income | $ | 29,730 | | | $ | 6,330 | | | $ | 2,497 | |
| Adjustments to reconcile net income to net cash provided by operating activities: | | | | | |
| Depreciation and amortization | 75,142 | | | 87,214 | | | 83,101 | |
| Impairment charges | 1,395 | | | 5,721 | | | 7,935 | |
| | | | | |
| Loss on extinguishment of debt | — | | | — | | | 416 | |
| Deferred income tax expense | 6,806 | | | 4,177 | | | 3,070 | |
| Non-cash compensation charge | 4,460 | | | 3,787 | | | 4,127 | |
| Gain on disposals of assets | (21,196) | | | (4,917) | | | (6,188) | |
| Provision for credit losses, net of recoveries | 135 | | | 162 | | | 141 | |
| Other, net | 1,660 | | | 3,223 | | | 2,200 | |
| Changes in operating assets and liabilities: | | | | | |
| Accounts receivable | (22,311) | | | (14,447) | | | (28,131) | |
| Inventories | 5 | | | (1,845) | | | (526) | |
| Accounts payable and accrued liabilities | 7,438 | | | 12,323 | | | 15,435 | |
| Taxes payable | 3,576 | | | 5 | | | (28) | |
| Other current assets and liabilities, net | 9,725 | | | (9,960) | | | 4,485 | |
| Net cash flows provided by operating activities | 96,565 | | | 91,773 | | | 88,534 | |
| | | | | |
| Cash flows from investing activities: | | | | | |
| Capital expenditures | (31,633) | | | (25,421) | | | (15,571) | |
| | | | | |
| Proceeds from disposition of property, plant and equipment | 16,740 | | | 16,286 | | | 14,306 | |
| Other, net | 372 | | | 190 | | | 559 | |
| Net cash flows used in investing activities | (14,521) | | | (8,945) | | | (706) | |
| | | | | |
| Cash flows from financing activities: | | | | | |
| Revolving credit borrowings | 210,584 | | | 289,705 | | | 397,952 | |
| Revolving credit repayments | (248,430) | | | (293,079) | | | (348,795) | |
| Term loan repayments | (29,899) | | | (30,442) | | | (125,483) | |
| Dividends paid | (7,423) | | | — | | | — | |
| Debt issuance costs | — | | | — | | | (4,412) | |
| Repurchases of common shares | (11,634) | | | (14,209) | | | (4,649) | |
| Repurchases of preferred shares | — | | | (30,553) | | | — | |
| Other, net | — | | | (1,078) | | | (1,120) | |
| Net cash flows used in financing activities | (86,802) | | | (79,656) | | | (86,507) | |
| | | | | |
| Effect of exchange rate changes on cash | 127 | | | (1,500) | | | (1,194) | |
| Net change in cash and cash equivalents | (4,631) | | | 1,672 | | | 127 | |
| Cash and cash equivalents, beginning of period | 7,954 | | | 6,282 | | | 6,155 | |
| | | | | |
| Cash and cash equivalents, end of period | $ | 3,323 | | | $ | 7,954 | | | $ | 6,282 | |
| | | | | |
| Non-cash investing activities: | | | | | |
| Capital expenditure additions accrued at end of period | 510 | | | 511 | | | 575 | |
| | | | | |
| Non-cash financing activities: | | | | | |
| Preferred dividends paid-in-kind | — | | | 1,706 | | | 1,925 | |
The accompanying notes are an integral part of these financial statements.
1.DESCRIPTION OF BUSINESSAND BASIS OF PRESENTATION
Description of the Business
We
are oneprovide a suite of
the largest integrated providers of workforce accommodations, logistics and facility managementhospitality services
tofor our guests in the natural
resource industry. Our scalable modular facilities provide long-term and temporary accommodations where traditional accommodations and related infrastructure is insufficient, inaccessible or not cost effective. Once facilities are deployed in the field, we also provideresources industry, including lodging, catering and food service, housekeeping and maintenance at accommodation facilities that we or our customers own. In many cases, we provide services housekeeping,that support the day-to-day operations of these facilities, such as laundry, facility management and maintenance, water and wastewater treatment, power generation, communicationscommunication systems, security and redeployment logistics. Our accommodations support our customers’ employeesWe also manage development activities for workforce accommodation facilities, including site selection, permitting, engineering and contractorsdesign, manufacturing management and site construction, along with providing hospitality services once the facility is constructed. We primarily operate in some of the Canadianworld’s most active oil, sands and in a variety of oil andmetallurgical (met) coal, liquefied natural gas drilling,(LNG) and iron ore producing regions, and our customers include major and independent oil companies, mining companies, engineering companies and related natural resource applications as well as disaster relief efforts, primarily in Canada, Australiaoilfield and the United States.mining service companies. We operate in threetwo principal reportable business segments – Canada Australia and U.S.Noralta Acquisition
On November 26, 2017, we entered into a definitive agreement to acquire Noralta Lodge Ltd. (Noralta). Under the terms of the agreement, we would acquire 100% of Noralta's equity, on a cash-free, debt-free basis, subject to adjustment in accordance with the terms of the definitive agreement, for consideration comprising approximately:
C$210 million (or US$167 million, based on an exchange rate of $0.797 Canadian dollars to U.S. dollars as of February 16, 2018) in cash, which we intend to fund with cash on hand and borrowings under the Amended Credit Agreement;
Australia.32.8 million Civeo common shares issued to Noralta's equity holders; and
Non-voting convertible preferred equity issued to Noralta's equity holders with a 2.0% dividend rate initially convertible into 29.3 million Civeo common shares.
This acquisition (the Noralta Acquisition), which we expect to close in the second quarter 2018, will increase our capacity in Canada by 11 lodges, with over 5,700 owned rooms and 7,900 total rooms.
Completion of the Noralta Acquisition is subject to various closing conditions, including among others (i) receipt of Canadian regulatory approvals and other regulatory and third party consents and approvals; (ii) the absence of any injunction or order prohibiting or restricting the consummation of the acquisition; and (iii) the receipt of approval by our shareholders of our issuance of the common shares and preferred shares. We have received notice from the Competition Bureau that it does not intend to challenge the acquisition under the Competition Act (Canada), and we have been granted approval under the Investment Canada Act for the acquisition. The definitive agreement may be terminated by either party if such conditions are not satisfied by May 31, 2018.
Basis of Presentation
Unless otherwise stated or the context otherwise
indicates,indicates: (i) all references in these consolidated financial statements to “Civeo,”
“the Company,” “us,” “our” or “we” refer to Civeo
Corporation and its consolidated subsidiaries.subsidiaries; and (ii) all references in this report to “dollars” or “$” are to U.S. dollars.
2.SUMMARY OF SIGNIFICANT ACCOUNTING POLICIES
Cash
2.
| SUMMARY OF SIGNIFICANT ACCOUNTING POLICIES
|
Cash
We consider all highly liquid investments purchased with an original maturity of three months or less to be cash equivalents.
Allowances
Allowance for
Doubtful AccountsCredit Losses
We are exposed to credit losses primarily through the sale of our products and services. We maintain allowances for
doubtful accountscredit losses for estimated losses resulting from the inability of our customers to make required payments. If a trade receivable is deemed to be uncollectible, such receivable is charged-off against the allowance for
doubtful accounts. We considercredit losses account. Our expected loss allowance methodology for accounts receivable is developed using historical collection experience, current and future economic and market conditions and a review of the
following factors when determining if collectioncurrent status of
revenuecustomers' trade receivables. Due to the short-term nature of such receivables, the estimate of the amount of accounts receivable that may not be collected is
reasonably assured: customer credit-worthiness, past transaction history withbased on an aging of the
customer, current economic industry trends, customer solvencyaccounts receivable balances and
changes in customer payment terms.the financial condition of customers. Additionally, specific allowance amounts are established to record the appropriate provision for customers that have a higher probability of default. If we have
no previous experience with the customer, we typically obtain reports from various credit organizations to ensure that the customer has a history of paying its creditors. We
may also request financial information, including combined financial statements or other documents, to ensure that the customer has the means of making payment. If these factors do
not indicate collection is reasonably assured, we
generally would require a prepayment or other arrangement to support revenue recognition and recording of a trade receivable. If the financial condition of our customers were to deteriorate, adversely affecting their ability to make payments, additional allowances would be required.
Inventories consist of
work in process, raw materials and supplies and materials for the
construction and operation of remote accommodation facilities. Inventories also include food, raw materials, labor, subcontractor charges
manufacturing overhead and catering and other supplies needed for operation of our facilities. Inventories are carried at the lower of cost or
market.net realizable value. The cost of inventories is determined on
anan average cost or specific-identification method.
Property, Plant and Equipment
Property, plant and equipment are stated at cost or at estimated fair market value at acquisition date if acquired in a business combination, and depreciation is computed, for assets owned or recorded under capital lease, using the straight-line method, after allowing for salvage value where applicable, over the estimated useful lives of the assets. Leasehold improvements are capitalized and amortized over the lesser of the life of the lease or the estimated useful life of the asset.
We record the fair value of a liability, which reflects the estimated present value of the amount of asset removal and site reclamation costs related to the retirement of our assets, for an asset retirement obligation (ARO) when it is incurred (typically when the asset is installed). When the liability is initially recorded, we capitalize the associated asset retirement cost by increasing the carrying amount
of the related property, plant and equipment. Please seeSee Asset Retirement Obligations below for further discussion.Expenditures for repairs and maintenance are charged to expense when incurred. Expenditures for major renewals and betterments, which extend the useful lives of existing equipment, are capitalized and depreciated. Upon retirement or disposition of property and equipment, the cost and related accumulated depreciation are removed from the accounts and any resulting gain or loss is recognized in the
consolidated statements of operations.Interest Capitalization
Interest costs
Business Combinations
We evaluate acquisitions of assets and other similar transactions to assess whether or not the transaction should be accounted for as a business combination by assessing whether or not we have acquired inputs and processes that have the constructionability to create outputs. If determined to be a business combination, we account for a business acquisition under the acquisition method of certain long-termaccounting. The accounting rules governing business combinations require the acquiring entity in a business combination to recognize the fair value of all assets are capitalizedacquired and amortizedliabilities assumed and establish the acquisition date as the fair value measurement point. Accordingly, we recognize assets acquired and liabilities assumed in a business combination based on the fair value estimates as of the date of acquisition. Goodwill is measured as the excess of the fair value of the consideration paid over the relatedfair value of the identified net assets,’ including intangible assets, acquired.
The fair value measurement of the identified net assets requires the significant use of estimates and is based on information that was available to management at the time the purchase price allocation was prepared. We utilize recognized valuation techniques, including the cost approach, the market approach and the income approach, to value the net assets acquired. The impact of changes to the estimated
useful lives. Forfair values of assets acquired and liabilities assumed is recorded in the
years ended December 31,2017,2016reporting period in which the adjustment is identified. Final valuations of assets and
2015, zero, zeroliabilities are obtained and
$1.6 million were capitalized, respectively.recorded within one year from the date of the acquisition.
Impairment of Long-Lived Assets
The recoverability of the carrying values of long-lived assets, including amortizable intangible assets,
is assessed whenever, in management’s judgment, events or changes in circumstances indicate that the carrying value of such asset groups may not be recoverable based on estimated future cash flows. If this assessment indicates that the carrying values will not be recoverable, as determined based on undiscounted cash flows over the remaining useful lives, an impairment loss is recognized. The impairment loss equals the excess of the carrying value over the fair value of the asset group. The fair value of the asset group is based on prices of similar assets, if available, or discounted cash flows.
In performing this analysis,
the first step is to review asset groups are reviewed at the lowest level for which identifiable cash flows are largely independent of the cash flows of other assets and liabilities. For each asset group, we compare its carrying value to estimates of undiscounted future cash flows. We use a variety of underlying assumptions to estimate these future cash flows, including assumptions relating to future economic market conditions, rates, occupancy levels, costs and expenses and capital expenditures. The estimates are consistent with those used for purposes of our goodwill impairment test, as further discussed in Goodwill and Other Intangible Assets, below. Based on the assessment, if the carrying values of certain of our asset groups are determined to not be recoverable, we proceed to the secondnext step. In this step, we compare the fair value of the respective asset group to its carrying value. The fair value of the asset groups are based on prices of similar assets, as applicable,if available, or discounted future cash flows. Our estimate of the fair value requires us to use significant unobservable inputs, representative of Level 3 fair value measurements, including numerous assumptions with respect to future circumstances, such as industry and/or local market conditions that might directly impact each of the asset groups’ operations in the future, and are therefore uncertain.Please seefuture.
See Note
34 – Impairment Charges for a discussion of impairment charges we recognized in 2017,20162023, 2022 and 20152021 related to our long-lived assets.
Goodwill andOtherIntangible Assets
Goodwill. Goodwill represents the excess of the purchase price paid for acquired businesses over the allocated fair value of the related net assets after impairments, if applicable. All of our goodwill as of December 31, 2023 was included in our Australia reporting unit.
We
do not amortize goodwill. We evaluate goodwill for impairment, at the reporting unit level, annually and when an event occurs or circumstances change to suggest that the carrying amount may not be recoverable. We conduct our annual impairment test as of November 30 of each year. Our goodwill balance was fully impaired at September 30, 2015.A reporting unit is the operating segment, or a business one level below that operating segment (the “component” level) if discrete financial information is prepared and regularly reviewed by management at the component level. Each segment of our business represents a separate reporting unit, and all threeunit.
We conduct our annual impairment test as of
our reporting units previously had goodwill.November 30 of each year. We
recognize an impairment loss for any amount by which the carrying amount of a reporting unit’s goodwill exceeds the reporting unit’s implied fair value (IFV) of goodwill.Our assessment consisted of a two-step impairment test. In the first step, we compare each reporting unit’s carrying amount, including goodwill, to the IFVfair value of the reporting unit. If the carrying amount of the reporting unit exceeds its fair value, goodwill is potentially impaired, and a second step is performed to determine the amount of impairment, if any. Future impairment tests will be impacted by new accounting guidance which eliminates the second step of the goodwill impairment test.
Weimpaired.
We are given the option to test for impairment of our goodwill by first performing a qualitative assessment to determine whether it is more likely than not (that is, likelihood of more than 50 percent) that the fair value of a reporting unit is less than its carrying amount, including goodwill. If it is determined that it is more likely than not that the fair value of a reporting unit is greater than its carrying amount, then performing the currently prescribed two-stepquantitative impairment test is unnecessary. In developing a qualitative assessment to meet the “more-likely-than-not”“more-likely-than-not” threshold, each reporting unit with goodwill is assessed separately and different relevant events and circumstances are evaluated for each unit. We have the option to bypass the qualitative assessment for any reporting unit in any period and proceed directly to performing the first stepquantitative goodwill impairment test.
When performing our annual assessment on November 30, 2023, 2022 and 2021, we performed a qualitative assessment related to goodwill at our Australia reporting unit. Qualitative factors that we considered as part of our assessment included industry and market conditions, macroeconomic conditions and the financial performance of our Australian business. We also noted that, based on the interim quantitative testing performed as of March 31, 2020, the estimated fair value of the
two-step goodwill impairment test.Australia reporting unit exceeded its carrying value by more than 125%. After assessing these events and circumstances, we determined that, as of November 30, 2023, it was more likely than not that the fair value of the Australia reporting unit was greater than its carrying value.
In performing the
two-stepquantitative goodwill impairment test, we compare
each reporting unit’s carrying amount, including goodwill, to the IFVfair value of the reporting unit. Because none of our reporting units has a publicallypublicly quoted market price, we must determine the value that willing buyers and sellers would place on the reporting unit through a routine sale process (a Level 3 fair value measurement). In our analysis, we target an IFVa fair value that represents the value that would be placed on the reporting unit by market participants, and value the reporting unit based on historical and projected results throughout a cycle, not the value of the reporting unit based on trough or peak earnings. The IFVfair value of the reporting unit is estimated using a combination of (i) an analysis of trading multiples of comparable companies (Market Approach) and (ii) discounted projected cash flows (Income Approach). We also use acquisition multiples analyses in certain circumstances. The relative weighting of each approach varies by reporting unit, based on management’s judgment.reflects current industry and market conditions.
Market Approach - This valuation approach utilizes publicly traded comparable companies’ enterprise values, as compared to their recent and forecasted earnings before interest, taxes and depreciation (EBITDA) information. We have historically used an average EBITDA multiple ranging from approximately 6.5x to approximately 9.5x depending on the reporting unit. We use EBITDA because it is a widely used key indicator of the cash generating capacity of companies in our industry.
Income Approach - This valuation approach derives a present value of the reporting unit’s projected future annual cash flows over the next five years. years with a terminal value assumption. We use a variety of underlying assumptions to estimate these future cash flows, including assumptions relating to future economic market conditions, rates, occupancy levels, costs and expenses and capital expenditures. These assumptions can vary by each reporting unit depending on market conditions. In addition, a terminal value is estimated, using a Gordon Growth methodology with a long-term growth rate of 3%.methodology. We discount our projected cash flows using a long-term weighted average cost of capital based on our estimate of investment returns that would be required by a market participant.
The
IFVfair value of our reporting units is affected by future oil, coal and natural gas prices, anticipated spending by our customers, and the cost of capital.
Our estimate of IFVfair value requires us to use significant unobservable inputs, representative of Level 3 fair value measurements, including numerous assumptions with respect to future circumstances, such as industry and/or local market conditions that might directly impact each of the reporting units’ operations in the future, and are therefore uncertain.future. We selected these valuation approaches because we believe the combination of these approaches and our best judgment regarding underlying assumptions and estimates provides us with the best estimate of fair value for each of our reporting units. We believe these valuation approaches are proven valuation techniques and methodologies for our industry and widely accepted by investors. The IFVfair value of each reporting unit would change if our assumptions under these valuation approaches, or relative weighting of the valuation approaches, were materially modified.
Please see Note 3– Impairment Charges for a discussion of impairment charges we recognized in 2015 related to our goodwill.
Other Intangible Assets.Assets. We amortize the cost of other intangible assets using the straight-line method over their estimated useful lives unless such lives are deemed indefinite. For intangible assets that we amortize, we review the useful life of the intangible asset and evaluate each reporting period whether events and circumstances warrant a revision to the remaining useful life. We evaluate the remaining useful life of an intangible asset that is not being amortized each reporting period to determine whether events
See Note 9 – Goodwill and
circumstances continue to support an indefinite useful life.We are required to evaluate our indefinite-lived intangible assetsOther Intangible Assets for impairment annually and when an event occurs or circumstances change to suggest the carrying amount may not be recoverable. In performing the impairment test, we compare the fair value of the indefinite-lived intangible asset with its carrying amount. The measurement of the impairment is calculated based on the excess of the carrying value over its fair value.
Please see Note 3– Impairment Charges for a discussion of impairment charges we recognized in 2015 related to our intangible assets.
further information.
Foreign Currency and Other Comprehensive Income
Gains and losses resulting from
consolidated balance sheet translation of foreign operations where a foreign currency is the functional currency are included as a separate component of accumulated other comprehensive income within shareholders’ equity representingand represent substantially all of the balances within accumulated other comprehensive income. Remeasurements of intercompany loans denominated in a different currency than the functional currency of the entity that are of a long-term investment nature are recognized as other comprehensive income within shareholders’ equity. Gains and losses resulting from consolidated balance sheet remeasurements of assets and liabilities denominated in a different currency than the functional currency, other than intercompany loans that are of a long-term investment nature, are included in the consolidated statements of operations as incurred. For the years ended December 31, 2017, 2016,2023, 2022, and 2015,2021, we recognized approximately $(1.5)$0.5 million, $(0.6)$0.1 million and $9.0$0.3 million in foreign currency gains (losses),losses, respectively.
Foreign
Currency Exchange
Rate Risk
A significant portion of revenues, earnings and net investments in foreign affiliates are exposed to changes in foreign currency exchange rates. We seek to manage our foreign exchange risk in part through operational means, including managing expected local currency revenues in relation to local currency costs and local currency assets in relation to local currency liabilities. We have
not entered into any foreign currency forward contracts.
Revenue and Cost Recognition
We derive
For the majority of our revenue from lodgingoperations and related ancillary services. In eachcontracts, we generally recognize accommodation, mobile facility rental, food service and other services revenues over time as our customers simultaneously receive and consume benefits as we serve our customers because of our operating segments, revenue is recognized in the period in which our obligations are satisfied pursuantcontinuous transfer of control to the terms of our contractual relationships with our customers. This occurscustomer. Revenue is recognized when control of the promised goods or services is transferred to our customers, in an amount that reflects the consideration we expect to be entitled to in exchange for those goods or services. We transfer control and recognize a sale based on a periodic (usually daily) room rate each night a customer stays in our rooms or when the services are rendered. In some contracts, rates may vary over the contract term. In these cases, revenue may be deferred and recognized on a straight-line basis over the contract term. Revenue from
Because of control transferring over time, the
salemajority of
products, not accounted for utilizing the cost based input method,our revenue is recognized
at a point in time followingbased on the
transferextent of
control of such products to the customer, which typically occurs upon delivery to and acceptance by the customer, when title and all significant risks of ownership have passed to the customer, collectability is reasonably assured and pricing is fixed and determinable. Our product sales terms do not include significant post-delivery obligations.For significant projects, revenues are recognized applying the cost based input methods, measured by the actual costs incurred relative to the total estimated costs to determine our progress towards completion of the performance obligation. At contract completioninception, we assess the goods and to calculate the corresponding amount of revenueservices promised in our contracts with customers and gross profit to recognize. Billings on such contracts in excess of costs incurred and estimated profits are classified as deferred revenue. Costs incurred and estimated profits in excess of billings on these contracts are recognized as unbilled receivables. Management believes this input method is the most appropriate measure of progress to the satisfaction ofidentify a performance obligation for each promise to transfer our customers a good or service (or bundle of goods or services) that is distinct. Our customers typically contract for hospitality services under take-or-pay contracts with terms that range from several months to multiple years. Our contract terms generally provide for a rental rate for a reserved room and an occupied room rate that compensates us for services provided. We typically contract our facilities to our customers on large contracts. Provisions for estimated losses on uncompleted contracts are madea fee per day basis where the goods and services promised include lodging and meals. To identify the performance obligations, we consider all of the goods and services promised in the period in which such losses are determined. Changes in job performance, job conditions, estimated profitability, and finalcontext of the contract settlements may result in revisions to projected costs and revenue and are recognized in the period in which the revisions to estimates are identified and the amounts can be reasonably estimated. Factors that may affect future project costs and margins include weather, production efficiencies, availability and costspattern of labor, materials and subcomponents. These factors can significantly impact the accuracy oftransfer to our estimates and materially impact our future reported earnings.
customers.
Revenues exclude taxes assessed based on revenues such as sales or value added taxes.
Cost of
services includes labor, food, utility costs, cleaning supplies and other costs of operating our accommodations facilities. Cost of goods sold includes all direct material and labor costs and those costs related to contract performance, such as indirect labor, supplies, tools and repairs. Selling, general and administrative costs are charged to expense as incurred.
Our
operations are subject to Canadian federal and provincial income taxes, as well as foreign income taxes. We determine the provision for income taxes using the asset and liability approach. Under this approach, deferred income taxes represent the expected future tax consequences of temporary differences between the carrying amounts and tax bases of assets and liabilities.
Valuation allowances are established when necessary to reduce deferred tax assets to the amounts expected to be realized. In assessing the need for a valuation allowance, we look to the future reversal of existing taxable temporary differences, taxable income in carryback years, the feasibility of tax planning strategies and estimated future taxable income. The valuation allowance can be affected by changes to tax laws, changes to statutory tax rates and changes to future taxable income
estimates.estimates and historical losses.
We recognize tax benefits from uncertain tax positions only if it is more likely than
not that the tax position will be sustained on examination by the taxing authorities, based on the technical merits of the position. The tax benefits recognized in the consolidated financial statements from such positions are measured based on the largest benefit that has a greater than
50% likelihood of being realized upon ultimate settlement.
On December 22, 2017, the Tax Cuts and Jobs Act of 2017(U.S. Tax Reform) was signed into law making significant changes to the U.S. Internal Revenue Code. Changes include, but are not limited to, a corporate tax rate decrease from 35% to 21% effective for tax years beginning after December 31, 2017, the transition of U.S. international taxation from a worldwide tax system to a territorial system and a one-time transition tax on the mandatory deemed repatriation of cumulative foreign earnings as of December 31, 2017. Please see See Note 1314 – Income Taxes for further information.
Receivables and Concentration of Credit Risk
Based on the nature of
our customer base, we do not believe that we have any significant concentrations of credit risk other than our concentration in the Canadian oil sands and Australian mining industries. We evaluate the credit-worthiness of our significant, new and existing customers’ financial condition and, generally, we do not require collateral from our customers. For the yearsyear ended December 31, 2017 and 2016,2023, each of Imperial OilSuncor Energy and Fort Hills Energy LPFortescue Metals Group Ltd. accounted for more than 10% of our revenues. For the year ended December 31, 2015, 2022, each of Suncor Energy, Imperial Oil Fort Hills Energy LP and BM Alliance Coal Operations Pty LtdFortescue Metals Group Ltd. accounted for more than 10% of our revenues. For the year ended December 31, 2021, each of Suncor Energy, Imperial Oil and Fortescue Metals Group Ltd. accounted for more than 10% of our revenues.
Asset Retirement Obligations
We
have AROs that we are required to perform under law or contract once an asset is permanently taken out of service. We initially record the
liability at fair value,
of a liability, which reflects the estimated present value of the amount of asset removal and site reclamation costs related to the retirement of our assets, for
an ARO when it is incurred (typically when the asset is installed). When the liability is initially recorded, we capitalize the associated asset retirement cost by increasing the carrying amount of the related property, plant and equipment. Over time, the liability increases for the change in its present value, while the capitalized cost depreciates over the useful life of the related asset. Accretion expense is recognized over the estimated productive life of the related assets. If the fair value of the estimated ARO changes, an adjustment is recorded to both the ARO and the capitalized asset retirement cost. Revisions in estimated liabilities can result from changes in estimated inflation rates, changes in service and equipment costs and changes in the estimated timing of settling the ARO. We utilize current retirement costs to estimate the expected cash outflows for retirement obligations. We estimate the ultimate productive life of the properties and a risk-adjusted discount rate in order to determine the current present value of the obligation.We relieve ARO liabilities when the related obligations are settled.
We have AROs that we are required to perform under law or contract once an asset is permanently taken out of service. Most of these obligations are
not expected to be paid until
severalmany years in the future and will be funded from general company resources at the time of removal.
Please see See Note 12 – Asset Retirement Obligations for further discussion.Share-Based
We
sponsor an equity participation plan in which certain of our key employees and non-employee directors participate. We measure the cost of employee services received in exchange for an award ofservice-based equity instrumentsawards (typically restricted share awards and deferred share awards) based on the grant-date fair value of the award. The grant-date fair value is calculated based on our share price on the grant-date. The resulting cost is recognized over the period during which an employee or non-employee director is required to provide service in exchange for the awards, usually the vesting period.We also grant performance share awards. For awards granted in 2023 and 2022, awards are earned in amounts between 0% and 200% of the participant’s target performance share award, based on (i) the payout percentage associated with Civeo’s relative total shareholder return (TSR) rank among a peer group of other companies and (ii) the payout percentage associated with Civeo's cumulative operating cash flow over the performance period relative to a preset target. Awards granted in 2021 are earned in amounts between 0% and 200% of the participant’s target performance share award, based on (i) the payout percentage associated with Civeo’s relative TSR rank among a peer group of other companies and (ii) the payout percentage associated with Civeo's cumulative free cash flow over the performance period relative to a preset target. The fair value of the TSR portion of each performance share is estimated using option-pricing models at the grant date. The fair value of the operating cash flow and free cash flow portion of each performance share is based on the closing market price of our common shares on the date of grant and adjusted throughout the performance period based on our estimate of the most probable outcome of such performance conditions. The resulting costs for each portion of the award are recognized over the period during which an employee is required to provide service in exchange for the awards, usually the vesting period.
Additionally, we grant phantom
shares.share units. All of the awards vest in equal annual installments and are accounted for as a liability based on the fair value of our share price. Participants granted
units of phantom
sharesshare units are entitled to a lump sum cash payment equal to the fair market value of a common share on the vesting date.
We also grant performance awards. These awards are earned in amounts between 0% and 200% of the participant’s target performance share award, based on the payout percentage associated with Civeo’s relative total shareholder return rank among a peer group of other companies. The fair value is estimated using option-pricing models. The resulting cost is recognized over the period during which an employee is required to provide service in exchange for the awards, usually the vesting period.
Substantially all of our Canadian and
U.S.United States (U.S.) subsidiaries are guarantors under our
Amended Credit Agreement. See Note
10 - Debt.11 – Debt for further discussion.
During the ordinary course of business,
we also provide standby letters of credit or other guarantee instruments to certain parties as required for certain transactions initiated by us or our subsidiaries. As of December 31,2017, 2023, the maximum potential amount of future payments that we could be required to make under these guarantee agreements (letters(including letters of credit) was approximately $2.4$1.9 million. We have not recorded any liability in connection with these guarantee arrangements. We do not believe, based on historical experience and information currently available, that it is likely that any amounts will be required to be paid under these guarantee arrangements.
The preparation of
consolidated financial statements in conformity with U.S. GAAPgenerally accepted accounting principles (U.S. GAAP) requires the use of estimates and assumptions by management in determining the reported amounts of assets and liabilities and disclosures of contingent assets and liabilities at the date of the consolidated financial statements and the reported amounts of revenues and expenses during the reporting period. Examples of a few such estimates include revenue and income recognized on the percentage-of-completion method, estimates of the amount and timing of costs to be incurred for asset retirement obligations,AROs, any valuation allowance recorded on net deferred tax assets, warranty claims, long-lived asset and goodwill impairments and allowance for doubtful accounts.credit losses. Actual results could materially differ from those estimates.
Accounting for Contingencies
We have contingent liabilities and future claims for which we have made estimates of the amount of the eventual cost to liquidate these liabilities or claims.
We make an assessment of our exposure and record a provision in our accounts to cover an expected loss when we believe a loss is probable and the amount of the loss can be reasonably estimated. These liabilities and claims sometimes involve threatened or actual litigation where damages have been
quantified and we have made an assessment of our exposure and recorded a provision in our accounts to cover an expected loss.quantified. Other claims or liabilities have been estimated based on their fair value or our experience in these matters and, when appropriate, the advice of outside counsel or other outside experts. Upon the ultimate resolution of these uncertainties, our future reported financial results will be impacted by the difference between our estimates and the actual amounts paid to settle a liability. Examples of areas where we have made important estimates of future liabilities include litigation,
taxes, interest, insurance claims,
warranty claims and contract claims and obligations.
Recent
Recent Accounting Pronouncements
From time to time, new accounting pronouncements are issued by the Financial Accounting Standards Board
(the FASB)(FASB), which are adopted by
us as of the specified effective date. Unless otherwise discussed, management believes that the impact of recently issued standards or other guidance updates, which are not yet effective, will not have a material impact on our consolidated financial statements upon adoption.
In
June 2016, November 2023, the FASB issued Accounting Standards Update (ASU) 2016-13, “Financial Instruments – Credit Losses” (ASU 2016-13). This new standard changes how companies will measure credit losses for most financial assets and certain other instruments that2023-07, “Segment Reporting (Topic 280): Improvements to Reportable Segment Disclosures”, which updates reportable segment disclosure requirements primarily through enhanced disclosures about significant segment expenses. The amendments arenot measured at fair value through net income. ASU 2016-13 is effective for financial statements issued for reporting periodsfiscal years beginning after December 15, 2019 2023, and for interim periods within fiscal years beginning after December 15, 2024. Early adoption is permitted. The amendments should be applied retrospectively to all prior periods presented in the reporting periods.financial statements. We are currently evaluating thethis ASU to determine its impact of this new standard on our consolidated financial statements.disclosures.
In March 2016, December 2023, the FASB issued ASU 2016-09, “Improvements2023-09, “Income Taxes (Topic 740): Improvements to Employee Share-Based Payment Accounting” (ASU 2016-09). This new standard requires companiesIncome Tax Disclosures”, which enhances effective tax rate reconciliation disclosure requirements and provides clarity to recognize the disclosures of income tax effects of awards in thetaxes paid, income statement when the awards vest orbefore taxes and provision for income taxes. The amendments are settled. ASU 2016-09 is effective for fiscal years beginning after December 15, 2024. Early adoption is permitted for annual financial statements that have not yet been issued or made available for reporting periods beginning after December 15, 2016 and interim periods within the reporting periods.issuance. The changes to the accounting for forfeitures and excess tax benefits or deficienciesamendments in this update should be applied usingon a modified retrospective transition method with a cumulative-effect adjustmentprospective basis. Retrospective application is permitted. We are currently evaluating this ASU to retained earnings. We adopted this standard effective January 1, 2017. Upon adoption of this standard, we no longer estimate forfeitures in advancedetermine its impact on our disclosures.
3.REVENUE
The following table disaggregates our revenue by our two reportable segments (Canada and
now recognize forfeitures as they occur and have reflected a cumulative effect adjustment of $0.6 million to accumulated deficit in the accompanying consolidated balance sheet as of December 31, 2017. In addition, this new standard requires that companies classify the cash paid to a tax authority when shares are withheld to satisfy the employer’s statutory income tax withholding obligation as a financing activity. As a result of our withholding of shares for tax-withholding purposes, during the year ended December 31, 2016, we withheld approximately 68,000 shares at a total value of $0.1 million. As a result of our adoption of ASU 2016-09, we reclassified $0.1 million of tax-withholdings from operating activities to financing activities on the accompanying consolidated statement of cash flowsAustralia) into major categories for the years ended
December 31, 2016 2023, 2022 and
2015.In February 2016, the FASB issued ASU 2016-02, “Leases” (Topic 842), which replaces the existing guidance for lease accounting, Leases (Topic 840). ASU 2016-02 requires lessees to recognize a lease liability and a right-of-use asset for all leases with terms longer than 12 months. The guidance is effective for financial statements issued for reporting periods beginning after December 15, 2018 and interim periods within the reporting periods. An entity will be required to recognize and measure leases at the beginning of the earliest period presented using a modified retrospective approach. We are currently evaluating the impact of this new standard on our consolidated financial statements.
2021 (in thousands): In May 2014, the FASB issued ASU 2014-09 establishing Accounting Standards Codification (ASC) Topic 606, “Revenue from Contracts with Customers” (ASC 606). ASC 606 establishes a comprehensive new revenue recognition model designed to depict the transfer of goods or services to a customer in an amount that reflects the consideration the entity expects to be entitled to receive in exchange for those goods or services and requires significantly enhanced revenue disclosures. The standard is effective for annual and interim reporting periods beginning after December 15, 2017. Accordingly, we plan to adopt this standard in the first quarter of 2018. ASC 606 allows either full retrospective or modified retrospective transition, and we currently plan to use the modified retrospective method of adoption. Our evaluation of the impact of this new standard on our consolidated financial statements included performing a detailed review of key contracts representative of our different businesses and comparing historical accounting policies and practices to the new standard. During 2017, we reviewed a material amount of our lodge and village contracts, as well as other revenue generating contracts, in our Canadian, U.S. and Australian segments. Based on our review of these contracts, we do not expect the new revenue recognition standard to have a material impact on our consolidated financial statements upon adoption.
| | | | | | | | | | | | | | | | | |
| | 2023 | | 2022 | | 2021 |
| Canada | | | | | |
| Accommodation revenues | $ | 266,926 | | | $ | 279,455 | | | $ | 239,526 | |
| Mobile facility rental revenues | 61,899 | | | 96,400 | | | 62,856 | |
| Food service and other services revenues | 23,970 | | | 20,142 | | | 18,996 | |
| | | | | |
| Total Canada revenues | 352,795 | | | 395,997 | | | 321,378 | |
| | | | | |
| Australia | | | | | |
| Accommodation revenues | $ | 177,834 | | | $ | 152,714 | | | $ | 145,335 | |
| Food service and other services revenues | 158,929 | | | 125,538 | | | 105,739 | |
| Total Australia revenues | 336,763 | | | 278,252 | | | 251,074 | |
| | | | | |
| Other | | | | | |
| Other revenues | $ | 11,247 | | | $ | 22,803 | | | $ | 22,011 | |
| | | | | |
| | | | | |
| | | | | |
| Total other revenues | 11,247 | | | 22,803 | | | 22,011 | |
| | | | | |
| Total revenues | $ | 700,805 | | | $ | 697,052 | | | $ | 594,463 | |
2017Our payment terms vary by the type and location of our customer and the products or services offered. The term between invoicing and when our performance obligations are satisfied is not significant. Payment terms are generally within 30 days and in most cases do not extend beyond 60 days. We do not have significant financing components or significant payment terms.
As of December 31, 2023, for contracts that are greater than one year, the table below discloses the estimated revenues related to performance obligations that are unsatisfied (or partially unsatisfied) and when we expect to recognize the revenue. The table only includes revenue expected to be recognized from contracts where the quantity of service is certain (in thousands):
| | | | | | | | | | | | | | | | | | | | | | | | | | | | | |
| | For the years ending December 31, |
| | 2024 | | 2025 | | 2026 | | Thereafter | | Total |
| Revenue expected to be recognized as of December 31, 2023 | $ | 166,047 | | | $ | 126,082 | | | $ | 95,196 | | | $ | 295,371 | | | $ | 682,696 | |
We applied the practical expedient and do not disclose consideration for remaining performance obligations with an original expected duration of one year or less. In addition, we do not estimate revenues expected to be recognized related to unsatisfied performance obligations for contracts without minimum room commitments. The table above represents only a portion of our expected future consolidated revenues and it is not necessarily indicative of the expected trend in total revenues.
4.IMPAIRMENT CHARGES
The following summarizes pre-tax impairment charges recorded during
2017,2023, which are included in Impairment expense in our consolidated statements of operations (in thousands):| | | Canada | | | Australia | | | U.S. | | | Total | |
Quarter ended September 30, 2017 | | | | | | | | | | | | | | | | |
| | | | | U.S. | |
| | | | | U.S. | |
| | | | | U.S. | | | Total |
| Quarter ended December 31, 2023 | |
Long-lived assets | | $ | 4,360 | | | $ | -- | | | $ | -- | | | $ | 4,360 | |
Quarter ended December 31, 2017 | | | | | | | | | | | | | | | | |
| Long-lived assets | |
Long-lived assets | | | 27,244 | | | | -- | | | | -- | | | | 27,244 | |
Total | | $ | 31,604 | | | $ | -- | | | $ | -- | | | $ | 31,604 | |
Quarter ended December 31, 2017.2023. During the fourth quarter of 2017,2023, we identified an indicator that certain asset groups usedrecorded impairment expense of $1.4 million, related to land located in the southern oil sands may be impaired due to market developments, including project delays, occurring in the fourth quarter of 2017. We assessed the carrying value of each of the asset groups in the southern portion of the region to determine if they continued to be recoverable based on their estimated future cash flows. Based on the assessment, the carrying values of two of our lodges were determined to not be fully recoverable, and we proceeded to compare the estimated fair value of those assets groups to their respective carrying values. Accordingly, the value of the two lodgesU.S. market. The land was written down to their estimated fair values of zero. As a result of the analysis described above, we recorded an impairment expense of $27.2 million.Quarter ended September 30, 2017. During the third quarter of 2017, we made the decision to vacate an open camp facility in Canada and relocated the assets to a newly awarded contract for a Canadian mobile camp. We assessed the carrying value of the remaining assets to determine if they continued to be recoverable based on their estimated future cash flows. Based on the assessment, the carrying values of certain leasehold improvements were determined to not be fully recoverable, and we proceeded to compare theits estimated fair value (less costs to sell) of those assets to their respective carrying values. Accordingly, the value of the remaining leasehold improvements were written down to their estimated fair value of zero. As a result of the analysis described above, we recorded an impairment expense of $3.2 million associated with our leased properties in Canada.
We also recorded an impairment expense of $1.2 million related to undeveloped land positions in Canada, the fair market value of which was negatively impacted by the recent cancellation of an LNG project in British Columbia.
$5.9 million.
The following summarizes pre-tax impairment charges recorded during
2016,2022, which are included in Impairment expense in our consolidated statements of operations (in thousands):
| | | Canada | | | Australia | | | U.S. | | | Total | |
Quarter ended March 31, 2016 | | | | | | | | | | | | | | | | |
| | | Australia | |
| | | Australia | |
| | | Australia | | | U.S. | | Total |
| Quarter ended December 31, 2022 | |
Long-lived assets | | $ | -- | | | $ | -- | | | $ | 8,400 | | | $ | 8,400 | |
Quarter ended September 30, 2016 | | | | | | | | | | | | | | | | |
| Long-lived assets | |
Long-lived assets | | | 37,729 | | | | -- | | | | -- | | | | 37,729 | |
Total | | $ | 37,729 | | | $ | -- | | | $ | 8,400 | | | $ | 46,129 | |
Quarter ended MarchDecember 31, 2016.2022. During the firstfourth quarter of 2016,2022, we recorded an impairment expense of $8.4$3.8 million, resulting from the impairment ofrelated to fixed assets in our U.S. segment,a village located in Western Australia. At December 31, 2022, we identified an impairment trigger due to a continued reduction of U.S. drilling activity inan expiring contract that was not renewed. Accordingly, the Bakken Shale region. These fixed assets were written down to their estimated fair value of $3.8$1.8 million. We assessed the carrying valuesIn addition, we recorded impairment expense of the asset groups$1.9 million, related to determine if they continuedfixed assets in a lodge located in our U.S. market. The lodge was written down to be recoverable based on estimated future cash flows. Based on the assessment, the carrying values were determined to not be recoverable, and we proceeded to compare theits estimated fair value (less costs to sell) of those assets groups to their respective carrying values.Quarter ended September 30, 2016. During the third quarter of 2016, we identified an indicator that certain asset groups used, or expected to be used, in conjunction with potential LNG projects in British Columbia may be impaired due to market developments occurring in the third quarter of 2016, including the delay in the final investment decision regarding an LNG project in British Columbia. We assessed the carrying value of each of the asset groups to determine if they continued to be recoverable based on their estimated future cash flows. Based on the assessment, the carrying values of the mobile camp assets and certain undeveloped land positions in British Columbia were determined to not be fully recoverable, and we proceeded to compare the estimated fair value of those assets groups to their respective carrying values. Accordingly, the mobile camp assets and undeveloped land positions were written down to their estimated fair values of $26.6 million and $5.6 million, respectively.
As a result of the analysis described above, we recorded an impairment expense of $37.7 million associated with our mobile camp assets in Canada and undeveloped land positions in the British Columbia LNG market.
2015$7.7 million.
The following summarizes pre-tax impairment charges recorded during
2015,2021, which are included in Impairment expense in our consolidated statements of operations (in thousands):| | | Canada | | | Australia | | | U.S. and Other | | | Total | |
Quarter ended March 31, 2015 | | | | | | | | | | | | | | | | |
Long-lived assets | | $ | -- | | | $ | -- | | | $ | 2,738 | | | $ | 2,738 | |
Quarter ended June 30, 2015 | | | | | | | | | | | | | | | | |
Long-lived assets | | | -- | | | | 9,473 | | | | -- | | | | 9,473 | |
Quarter ended September 30, 2015 | | | | | | | | | | | | | | | | |
Goodwill | | | 43,194 | | | | -- | | | | -- | | | | 43,194 | |
Long-lived assets | | | 23,041 | | | | 23,980 | | | | 18,040 | | | | 65,061 | |
Intangible assets | | | -- | | | | -- | | | | 2,460 | | | | 2,460 | |
Total | | $ | 66,235 | | | $ | 33,453 | | | $ | 23,238 | | | $ | 122,926 | |
| | | | | | | | | | | | | | | |
| | | Australia | | | | Total |
| Quarter ended June 30, 2021 | | | | | | | |
| Long-lived assets | | | $ | 7,935 | | | | | $ | 7,935 | |
| Total | | | $ | 7,935 | | | | | $ | 7,935 | |
Quarter ended March 31, 2015. June 30, 2021. During the firstsecond quarter of 2015,2021, we made the decision to dispose of our manufacturing facility in Johnstown, Colorado. Accordingly, the facility met the criteria of held for sale, and its carrying value was adjusted downward to $8.7 million, which represents its estimated fair value less the cost to sell. Accordingly, we recorded a pre-tax impairment expense of $2.7$7.9 million related to various undeveloped land positions and an additional $1.1 million write-down of our inventory. During the fourth quarter of 2015, we completed the sale of the facility.
Quarter ended related permitting costs in Australia. At June 30, 2015. During the second quarter of 2015,2021, we recordedidentified an impairment expensetrigger related to certain of $9.5 million, resulting from the impairment of fixed assets in a village located in Western Australia,these properties due to the continued downturncancellation of a significant thermal coal project in gold mining activityAustralia and lack of contract renewals. These fixedour negative expectations related to other possible Australian thermal coal projects becoming viable in the near term. Accordingly, the assets were written down to their estimated fair value of $0.1$2.4 million. We assessed the carrying value of the asset group to determine if it continued to be recoverable based on estimated future cash flows. Based on the assessment, the carrying value was determined to not be recoverable.
Quarter ended September 30, 2015.During the third quarter of 2015, we recorded impairment expense related to goodwill, long-lived assets and intangible assets.
Due to the sustained reduction of our share price throughout 2015, our market capitalization implied an enterprise value which was significantly less than the sum of the estimated fair values of our reporting units. As a result of our market capitalization at September 30, 2015, coupled with (1) the continued depression of worldwide oil prices, including the substantial declines experienced in the third quarter of 2015, and (2) continued weakness in the Canadian dollar in the third quarter of 2015, we determined that an indicator of a goodwill impairment was present as of September 30, 2015. Accordingly, as a result of then-current macroeconomic conditions, we performed an interim goodwill impairment test as of September 30, 2015, and we reduced the value of our goodwill in our Canadian reporting unit to zero. This resulted in a $43.2 million impairment charge in the third quarter of 2015.
Furthermore, due to the goodwill impairment in our Canadian segment, we determined all asset groups within this segment had experienced a triggering event indicating that the carrying values might not be recoverable. Accordingly, we compared the carrying value of each asset group to estimates of the undiscounted cash flows for such asset group. Based on the assessment, carrying values of certain asset groups were determined to be unrecoverable, and we proceeded to compare the estimated fair values of those asset groups to their respective carrying values. Accordingly, we recorded an impairment loss of $11.1 million related to long-lived assets in our Canadian segment. These fixed assets were written down to their fair value of $12.6 million.
Also due to the sustained reduction of our share price throughout 2015, we reviewed the long-lived assets in our U.S. and Australia reportable segments to determine if an indicator of impairment had occurred that would indicate that the carrying values of the asset groups in these segments might not be recoverable. We determined that certain asset groups within the U.S. and Australia segments had experienced an indicator of impairment, and thus compared the carrying value of the respective asset group to estimates of the undiscounted future cash flows for such asset group. Based on the assessment, the carrying values of three of our asset groups were determined to not be recoverable, and we proceeded to compare the estimated fair values of the asset groups to their carrying values. Accordingly, we recorded an impairment loss of $20.5 million related to our U.S. segment. Of the $20.5 million impairment, $18.0 million reduced the value of our fixed assets and $2.5 million reduced the value of our amortizable intangible assets. These fixed assets were written down to their estimated fair value of $9.5 million. In addition, we recorded an impairment loss of $24.0 million related to our Australian segment that reduced the value of our fixed assets. These fixed assets were written down to their estimated fair value of $10.3 million.
Finally, during the third quarter of 2015, we identified assets in our Canadian segment that should have been impaired in the fourth quarter of 2014. We determined that the error was not material to our financial statements for the year ended December 31, 2014 and therefore corrected the error in the third quarter of 2015. This resulted in an additional impairment expense of $11.9 million.
5.FAIR VALUE MEASUREMENTS
4.
| FAIR VALUE MEASUREMENTS
|
Our financial instruments consist of cash and cash equivalents, receivables, payables and debt instruments. We believe that the carrying values of these instruments on the accompanying consolidated balance sheets approximate their fair values.
As of
December 31, 2017 2023 and 2016,2022, we believe the carrying value of our floating-rate debt outstanding under our term loans and revolving credit facilities approximates fair value because the terms include short-term interest rates and exclude penalties for prepayment. We estimated the fair value of our floating-rate term loan and revolving credit facilities using significant other observable inputs, representative of a Level 2 fair value measurement, including terms and credit spreads for these loans. In addition, the estimated fair value of our assets held for sale is based upon Level 2 fair value measurements, which include appraisals, broker price opinions and previous negotiations with third parties.
During 2017,2016the fourth quarter of 2023 and 2015,2022 and the second quarter of 2021, we wrote down certain long-lived assets to their fair values. Our estimates of fair value required us to use significant unobservable inputs, representative of Level 3 fair value measurements, including numerous assumptions with respect to future circumstances that might directly impact each of the relevant asset groups’ operations in the future and are therefore uncertain. These assumptions with respect to future circumstances included future oil, coal and natural gas prices, anticipated spending by our customers, the cost of capital, and industry and/or local market conditions.value. During the thirdfourth quarter of 20172023 and 2016,2022, our estimatesestimate of fair value of certain undeveloped land positionsa property in British Columbiathe U.S. was based on broker price opinions or appraisals from third parties, which referenced available market information, such as listing agreements, offers, and pending and closed sales. During the second quarter of 2021 and the fourth quarter of 2022, our estimate of fair value in Australia for assets that were impaired was based on appraisals from third parties. Please see
See Note
2 – Summary of Significant Accounting Policies – Impairment of Long-Lived Assets
for further discussion of the significant judgments and
assumptions used in calculating their fair value.During 2015, we also wrote down our goodwill to its implied fair value (IFV). Our estimate of IFV required us to use significant unobservable inputs, representative of Level 3 fair value measurements, including numerous assumptions with respect to future circumstances, such as industry and/or local market conditions that might directly impact each of the reporting units’ operations in the future, and are therefore uncertain. Please see Note 2 – Summary of Significant Accounting Policies – Goodwill and Other Intangible Assets for further discussion of the significant judgments and assumptions used in calculating their fair value.
5.
| DETAILS OF SELECTED BALANCE SHEET ACCOUNTS
|
6.EARNINGS PER SHARE
For the year ended December 31, 2023, we calculated our basic earnings per share by dividing net income (loss) attributable to common shareholders, before allocation of earnings to participating earnings by the weighted average number of common shares outstanding. For diluted earnings per share, the basic shares outstanding are adjusted by adding all potentially dilutive securities.
For the years ended December 31 2022 and 2021, a period during which we had participating securities in the form of Class A preferred shares, we used the two-class method to calculate basic and diluted earnings per share. The two-class method requires a proportional share of net income to be allocated between common shares and participating securities. The proportional share to be allocated to participating securities is determined by dividing total weighted average participating securities by the sum of total weighted average common shares and participating securities.
Basic earnings per share is computed under the two-class method by dividing the net income (loss) attributable to common shareholders, after allocation of earnings to participating earnings by the weighted average number of common shares outstanding during the period. Net income attributable to common shareholders, after allocation of earnings to participating earnings represents our net income reduced by an allocation of current period earnings to participating securities as described above. No such adjustment is made during periods with a net loss, as the adjustment would be anti-dilutive.
Diluted earnings per share is computed under the two-class method by dividing diluted net income (loss) attributable to common shareholders, after reallocation adjustment for participating securities by the weighted average number of common shares outstanding, plus, for periods with net income attributable to common stockholders, the potential dilutive effects of share-based awards. In addition, we calculate the potential dilutive effect of any outstanding dilutive security under both the two-class method and the “if-converted” method, and we report the more dilutive of the methods as our diluted earnings per share. We also apply the treasury stock method with respect to certain share-based awards in the calculation of diluted earnings per share, if dilutive.
On October 30, 2022, we repurchased 3,617 Series A preferred shares from the holders for approximately $30.6 million. The repurchase premium of $5.2 million was treated as a reduction to the numerator of net income (loss) attributable to Civeo common shareholders utilized in the calculation of earnings per share for the year ended December 31, 2022.
The calculation of earnings per share attributable to Civeo common shareholders is presented below for the years ended December 31, 2023, 2022 and 2021 (in thousands, except per share amounts):
| | | | | | | | | | | | | | | | | |
| | 2023 | | 2022 | | 2021 |
| Numerator: | | | | | |
| Net income attributable to Civeo common shareholders, before allocation of earnings to participating securities | $ | 30,157 | | | $ | 2,226 | | | $ | (575) | |
| Less: premium paid for repurchase of preferred shares | — | | | (5,189) | | | — | |
| Less: income allocated to participating securities | — | | | — | | | — | |
| Net income (loss) attributable to Civeo Corporation common shareholders, after allocation of earnings to participating securities | $ | 30,157 | | | $ | (2,963) | | | $ | (575) | |
| Add: undistributed income attributable to participating securities | — | | | — | | | — | |
| Less: undistributed income reallocated to participating securities | — | | | — | | | — | |
| Diluted net income (loss) attributable to Civeo Corporation common shareholders, after reallocation adjustment for participating securities | $ | 30,157 | | | $ | (2,963) | | | $ | (575) | |
| | | | | |
| Denominator: | | | | | |
| Weighted average shares outstanding - basic | 14,906 | | | 14,002 | | | 14,232 | |
| Dilutive shares - share-based awards | 107 | | | — | | | — | |
| Weighted average shares outstanding - diluted | 15,013 | | | 14,002 | | | 14,232 | |
| | | | | |
Basic net income (loss) per share attributable to Civeo Corporation common shareholders (1) | $ | 2.02 | | | $ | (0.21) | | | $ | (0.04) | |
| | | | | |
Diluted net income (loss) per share attributable to Civeo Corporation common shareholders (1) | $ | 2.01 | | | $ | (0.21) | | | $ | (0.04) | |
(1)Computations may reflect rounding adjustments.
The following common share equivalents have been excluded from the calculation of weighted-average common shares outstanding because the effect is anti-dilutive for the years ended December 31, 2023, 2022 and 2021 (in millions of shares):
| | | | | | | | | | | | | | | | | | | |
| | 2023 | | 2022 | | 2021 | | |
Share-based awards (1) | — | | | 0.2 | | | 0.2 | | | |
| Preferred shares | — | | | 2,240 | | | 2,461 | | | |
(1)Share-based awards for the year ended December 31, 2023 totaled fewer than 0.1 million shares.
7.DETAILS OF SELECTED BALANCE SHEET ACCOUNTS
Additional information regarding selected balance sheet accounts at
December 31, 2017 2023 and 20162022 is presented below (in thousands): | | | | December 31, 2017 | | | December 31, 2016 | | | December 31, 2023 | | December 31, 2022 |
Accounts receivable, net: | | | | | | | | |
| Trade | |
| Trade | |
Trade | | $ | 46,692 | | | $ | 39,442 | |
Unbilled revenue | | | 20,555 | | | | 16,063 | |
Other | | | 914 | | | | 1,435 | |
Total accounts receivable | | | 68,161 | | | | 56,940 | |
Allowance for doubtful accounts | | | (1,338 | ) | | | (638 | ) |
| Allowance for credit losses | |
Total accounts receivable, net | | $ | 66,823 | | | $ | 56,302 | |
| | | December 31, 2017 | | | December 31, 2016 | |
Inventories: | | | | | | | | |
Finished goods and purchased products | | $ | 2,211 | | | $ | 1,700 | |
Work in process | | | 4,096 | | | | 3 | |
Raw materials | | | 939 | | | | 1,409 | |
Total inventories | | $ | 7,246 | | | $ | 3,112 | |
During the fourth quarter of 2017 | | | | | | | | | | | |
| | December 31, 2023 | | December 31, 2022 |
| Inventories: | | | |
| Finished goods and purchased products | $ | 5,648 | | | $ | 5,538 | |
| | | |
| Raw materials | 1,334 | | | 1,369 | |
| Total inventories | $ | 6,982 | | | $ | 6,907 | |
| | | | | | | | | | | | | | | | | |
| | Estimated
Useful Life
(in years) | | December 31, 2023 | | December 31, 2022 |
| Property, plant and equipment, net: | | | | | |
| Land | | | $ | 27,988 | | | $ | 25,528 | |
| Accommodations assets | 3-15 | | 1,378,408 | | | 1,464,476 | |
| Buildings and leasehold improvements | 7-20 | | 14,603 | | | 15,516 | |
| Machinery and equipment | 4-7 | | 13,255 | | | 11,775 | |
| Office furniture and equipment | 3-7 | | 67,248 | | | 62,725 | |
| Vehicles | 3-5 | | 10,025 | | | 8,411 | |
| Construction in progress | | | 12,087 | | | 1,771 | |
| Total property, plant and equipment | | | 1,523,614 | | | 1,590,202 | |
| Accumulated depreciation | | | (1,253,051) | | | (1,288,312) | |
| Total property, plant and equipment, net | | | $ | 270,563 | | | $ | 301,890 | |
| | | | | | | | | | | |
| | December 31, 2023 | | December 31, 2022 |
| Accrued liabilities: | | | |
| Accrued compensation | $ | 33,854 | | | $ | 34,358 | |
| Accrued taxes, other than income taxes | 3,997 | | | 2,873 | |
| | | |
| Other | 2,672 | | | 1,980 | |
| Total accrued liabilities | $ | 40,523 | | | $ | 39,211 | |
| | | | | | | | | | | |
| December 31, 2023 | | December 31, 2022 |
| Contract liabilities (Deferred revenue): | | | |
Current contract liabilities (1) | $ | 4,849 | | | $ | 991 | |
Noncurrent contract liabilities (1) | 8,068 | | | — | |
| Total contract liabilities (Deferred revenue) | $ | 12,917 | | | $ | 991 | |
(1)Current contract liabilities and the third quarter of 2016, we recorded a $0.5 million and $0.9 million, respectively, write-down of inventory at our modular construction and manufacturing plant in Canada, which isNoncurrent contract liabilities are included in Service"Deferred revenue" and other costs"Other noncurrent liabilities," respectively, in our accompanying consolidated statementsbalance sheets.
Deferred revenue typically consists of
operations.| | | Estimated Useful Life (in years) | | | December 31, 2017 | | | December 31, 2016 | |
Property, plant and equipment, net: | | | | | | | | | | | | | |
Land | | | | | | | $ | 40,567 | | | $ | 41,122 | |
Accommodations assets | | 3 | - | 15 | | | | 1,658,867 | | | | 1,554,986 | |
Buildings and leasehold improvements | | 5 | - | 20 | | | | 24,181 | | | | 28,104 | |
Machinery and equipment | | 4 | - | 15 | | | | 8,848 | | | | 9,667 | |
Office furniture and equipment | | 3 | - | 7 | | | | 53,688 | | | | 29,948 | |
Vehicles | | 3 | - | 5 | | | | 13,869 | | | | 14,725 | |
Construction in progress | | | | | | | | 2,770 | | | | 23,016 | |
Total property, plant and equipment | | | | | | | | 1,802,790 | | | | 1,701,568 | |
Accumulated depreciation | | | | | | | | (1,108,957 | ) | | | (911,858 | ) |
Total property, plant and equipment, net | | | | | | | $ | 693,833 | | | $ | 789,710 | |
| | | December 31, 2017 | | | December 31, 2016 | |
Accrued liabilities: | | | | | | | | |
Accrued compensation | | $ | 20,424 | | | $ | 13,189 | |
Accrued taxes, other than income taxes | | | 1,224 | | | | 917 | |
Accrued interest | | | 15 | | | | 194 | |
Other | | | 545 | | | | 522 | |
Total accrued liabilities | | $ | 22,208 | | | $ | 14,822 | |
upfront payments received before we satisfy the associated performance obligation. The calculation of earnings per share attributableincrease in deferred revenue from December 31, 2022 to the Company is presented below for the periods indicated (in thousands, except per share amounts):
| | | 2017 | | | 2016 | | | 2015 | |
Basic Loss per Share | | | | | | | | | | | | |
Net loss attributable to Civeo | | $ | (105,713 | ) | | $ | (96,388 | ) | | $ | (131,759 | ) |
Less: undistributed net income to participating securities | | | -- | | | | -- | | | | -- | |
Net loss attributable to Civeo’s common shareholders - basic | | $ | (105,713 | ) | | $ | (96,388 | ) | | $ | (131,759 | ) |
| | | | | | | | | | | | | |
Weighted average common shares outstanding - basic | | | 128,365 | | | | 107,024 | | | | 106,604 | |
| | | | | | | | | | | | | |
Basic loss per share | | $ | (0.82 | ) | | $ | (0.90 | ) | | $ | (1.24 | ) |
| | | | | | | | | | | | | |
Diluted Loss per Share | | | | | | | | | | | | |
Net loss attributable to Civeo’s common shareholders – basic | | $ | (105,713 | ) | | $ | (96,388 | ) | | $ | (131,759 | ) |
Less: undistributed net income to participating securities | | | -- | | | | -- | | | | -- | |
Net loss attributable to Civeo’s common shareholders - diluted | | $ | (105,713 | ) | | $ | (96,388 | ) | | $ | (131,759 | ) |
| | | | | | | | | | | | | |
| | | | | | | | | | | | | |
Weighted average common shares outstanding - basic | | | 128,365 | | | | 107,024 | | | | 106,604 | |
Effect of dilutive securities (1) | | | -- | | | | -- | | | | -- | |
Weighted average common shares outstanding - diluted | | | 128,365 | | | | 107,024 | | | | 106,604 | |
| | | | | | | | | | | | | |
Diluted loss per share | | $ | (0.82 | ) | | $ | (0.90 | ) | | $ | (1.24 | ) |
(1)
| When an entity has a net loss from continuing operations, it is prohibited from including potential common shares in the computation of diluted per share amounts. Accordingly, we have utilized the basic shares outstanding amount to calculate both basic and diluted loss per share for the years ended December 31, 2017, 2016 and 2015. In the years ended December 31, 2017, 2016 and 2015, we excluded from the calculation 2.1 million, 1.3 million and 1.3 million share based awards, respectively, since the effect would have been anti-dilutive.
|
During the fourth quarter of 2017, we made the decision to dispose of our modular construction and manufacturing plant near Edmonton, Alberta, CanadaDecember 31, 2023 was due to changing geographicpayments received from a customer for village enhancements in Australia and market needs. Accordingly,a payment received from a customer related to an asset transportation contract, which will all be recognized over the facility met the criteriacontracted terms.
8.ASSETS HELD FOR SALE
As of
December 31, 2023, assets held for
sale. Its estimated fair value less the cost to sell exceeded its carrying value. We recorded an expense of $0.5 million to write-down our inventory to its expected sales proceeds. Additionally, we have discontinued depreciation of the facility. Depreciation expense related to the facility totaled approximately $0.5 million, $0.7 million and $0.7 million during the years ended December 31, 2017, 2016 and 2015, respectively. The facility is part of our Canadian reportable business segment. In addition,sale included certain undeveloped land positionsassets in the British Columbia LNG market in our Canadian segment previously met the criteria of held for sale.U.S. These assets were recorded at the estimated fair value less costs to sell, which exceeded or equaled their carry values. During the first quarter of 2023, we sold the accommodation assets in Louisiana. The land at this location remains in assets held for sale as of December 31, 2023.
During the third quarter of 2023, we entered into a definitive agreement to sell our McClelland Lake Lodge assets for approximately
$4.4C$49 million, or US$36 million. The related assets had no remaining carrying value. During the year ended December 31, 2023, we recognized $14.2 million in demobilization costs and received $28.2 million in cash proceeds associated with the sale. We expect to recognize the remaining demobilization costs and the proceeds of the sale in the first quarter of 2024.
As of December 31, 2022, assets held for sale included certain assets in our Canadian business segment and the U.S. These assets were recorded at the estimated fair value less costs to sell, which exceeded their carrying values.
The following table summarizes the carrying amount as of
December 31, 2017 2023 and 2022 of the
major classes of assets
from the modular construction and manufacturing plant and undeveloped land positions we classified as held for sale (in thousands):| | | December 31, | | | December 31, | |
| | | 2017 | | | 2016 | |
Assets held for sale: | | | | | | | | |
Property, plant and equipment, net | | $ | 9,418 | | | $ | 4,419 | |
Inventories | | | 44 | | | | -- | |
Total assets held for sale | | $ | 9,462 | | | $ | 4,419 | |
8.
| SUPPLEMENTAL CASH FLOW INFORMATION
|
Cash paid during | | | | | | | | | | | |
| December 31, 2023 | | December 31, 2022 |
| Assets held for sale: | | | |
| Property, plant and equipment, net | $ | 5,873 | | | $ | 8,653 | |
| Total assets held for sale | $ | 5,873 | | | $ | 8,653 | |
9.GOODWILL AND OTHER INTANGIBLE ASSETS
Changes in the
years ended carrying amount of goodwill (all of which is in our Australia segment) from December31,2017,2016 and 2015 for interest and income taxes was 2021 to December 31, 2023 are as follows (in thousands):| | | 2017 | | | 2016 | | | 2015 | |
| | | | | | | | | | | | | |
Interest (net of amounts capitalized) | | $ | 17,362 | | | $ | 18,927 | | | $ | 21,385 | |
Income taxes paid, net of refunds | | | (7,755 | ) | | | 3,404 | | | | (5,169 | ) |
| 9.
| | | | | | | | | | |
| | | | | | | Total |
| Goodwill as of December 31, 2021 | | OTHER INTANGIBLE ASSETS
| | | | | $ | 8,204 | |
| Foreign currency translation | | | | | | | (532) | |
| Goodwill as of December 31, 2022 | | | | | | | $ | 7,672 | |
| Foreign currency translation | | | | | | | 18 | |
| Goodwill as of December 31, 2023 | | | | | | | $ | 7,690 | |
The following table presents the total amount of
other intangible assets and the related accumulated amortization for major intangible asset classes as of December 31,2017 2023 and 20162022 (in thousands):| | | AS OF DECEMBER 31, | |
| | | 2017 | | | 2016 | |
| | | Gross Carrying Amount | | | Accumulated Amortization | | | Gross Carrying Amount | | | Accumulated Amortization | |
Amortizable Intangible Assets | | | | | | | | | | | | | | | | |
Customer relationships | | $ | 45,209 | | | $ | (33,997 | ) | | $ | 42,614 | | | $ | (28,804 | ) |
Contracts / agreements | | | 38,362 | | | | (26,853 | ) | | | 35,499 | | | | (21,300 | ) |
Noncompete agreements | | | 675 | | | | (675 | ) | | | 749 | | | | (749 | ) |
Total amortizable intangible assets | | $ | 84,246 | | | $ | (61,525 | ) | | $ | 78,862 | | | $ | (50,853 | ) |
| | | | | | | | | | | | | | | | | |
Indefinite-Lived Intangible Assets Not Subject to Amortization | | | | | | | | | | | | | | | | |
Licenses | | | 32 | | | | -- | | | | 30 | | | | -- | |
Total indefinite-lived intangible assets | | | 32 | | | | -- | | | | 30 | | | | -- | |
Total intangible assets | | $ | 84,278 | | | $ | (61,525 | ) | | $ | 78,892 | | | $ | (50,853 | ) |
| | | | | | | | | | | | | | | | | | | | | | | |
| December 31, | | December 31, |
| | 2023 | | 2022 |
| | Gross
Carrying
Amount | | Accumulated
Amortization | | Gross
Carrying
Amount | | Accumulated
Amortization |
| Amortizable Intangible Assets | | | | | | | |
| Customer relationships | $ | 40,728 | | | $ | (40,728) | | | $ | 40,656 | | | $ | (40,656) | |
| Trade name | 3,363 | | | (3,363) | | | 3,324 | | | (3,324) | |
| Contracts / agreements | 143,725 | | | (65,754) | | | 149,356 | | | (67,637) | |
| Total amortizable intangible assets | $ | 187,816 | | | $ | (109,845) | | | $ | 193,336 | | | $ | (111,617) | |
| | | | | | | |
| Indefinite-Lived Intangible Assets Not Subject to Amortization | | | | | | | |
| Licenses | 28 | | | — | | | 28 | | | — | |
| Total indefinite-lived intangible assets | 28 | | | — | | | 28 | | | — | |
| Total intangible assets | $ | 187,844 | | | $ | (109,845) | | | $ | 193,364 | | | $ | (111,617) | |
Please see Note 3– Impairment Charges for a discussion of impairment charges we recognized in 2015 related to our intangible assets.
The weighted average remaining amortization period for all intangible assets, other than indefinite-lived intangibles, was
3.114.1 years as of December 31,2017 2023 and 4.115.0 years as of December 31,2016. Total amortization expense is expected to be $7.5 million in 2018 through 2020,$0.2 million in 2021 and $0.1 million in 2022. Amortization expense was $7.3$5.8 million, $7.2$5.9 million and $7.6$6.0 million in the years ended December 31,2017,2016 2023, 2022 and 2015,2021, respectively.
As of December 31, 2023, the estimated remaining amortization of our amortizable intangible assets was as follows (in thousands):
| | | | | |
| | Year Ending
December 31, |
| 2024 | $ | 5,616 | |
| 2025 | 5,616 | |
| 2026 | 5,616 | |
| 2027 | 5,616 | |
| 2028 | 5,616 | |
| Thereafter | 49,891 | |
| Total | $ | 77,971 | |
10.LEASES
We have operating and finance leases covering certain land locations and various office facilities and equipment in our two reportable business segments. Our leases have remaining lease terms of one year to seven years, some of which include options to extend the leases for up to 10 years, and some of which include options to terminate the leases within 90 days. In addition, we do not recognize right-of-use assets or lease liabilities for leases with terms shorter than twelve months.
The components of lease expense were $4.2 million, $5.0 million and $5.9 million under operating leases for the years ended December 31, 2023, 2022 and 2021, respectively. The components of lease expense were $0.2 million, $0.0 million and $0.0 million under finance leases for the years ended December 31, 2023, 2022 and 2021, respectively. Included in the measurement of lease liabilities, we paid $4.6 million and $0.1 million in cash related to operating leases and finance leases during the year ended December 31, 2023, respectively. Right-of-use assets obtained in exchange for new lease obligations during the year ended December 31, 2023 were $0.6 million.
Supplemental balance sheet information related to leases were as follows (in thousands):
| | | | | | | | | | | | | |
| | December 31, 2023 | | December 31, 2022 | | |
| Operating leases | | | | | |
| Operating lease right-of-use assets | $ | 12,286 | | | $ | 15,722 | | | |
| | | | | |
| Other current liabilities | $ | 3,594 | | | $ | 3,792 | | | |
| Operating lease liabilities | 9,264 | | | 12,771 | | | |
| Total operating lease liabilities | $ | 12,858 | | | $ | 16,563 | | | |
| | | | | |
| Finance leases | | | | | |
| Other noncurrent assets | $ | 760 | | | $ | — | | | |
| | | | | |
| Other current liabilities | $ | 164 | | | $ | — | | | |
| Other noncurrent liabilities | 613 | | | — | | | |
| Total finance lease liabilities | $ | 777 | | | $ | — | | | |
| | | | | |
| Weighted average remaining lease term | | | | | |
| Operating leases | 4.1 years | | 4.8 years | | |
| Finance leases | 4.3 years | | — | | | |
| Weighted average discount rate | | | | | |
| Operating leases | 5.5 | % | | 5.4 | % | | |
| Finance leases | 6.6 | % | | — | % | | |
Maturities of lease liabilities at December 31, 2023, were as follows (in thousands):
| | | | | | | | | | | | | | | | | |
| Year Ending December 31, | Operating Leases | | Finance Leases | | Total |
| 2024 | $ | 4,341 | | | $ | 222 | | | $ | 4,563 | |
| 2025 | 3,366 | | | 222 | | | 3,588 | |
| 2026 | 2,721 | | | 222 | | | 2,943 | |
| 2027 | 2,548 | | | 216 | | | 2,764 | |
| 2028 | 1,238 | | | 63 | | | 1,301 | |
| Thereafter | 554 | | | — | | | 554 | |
| Total lease payments | 14,768 | | | 945 | | | 15,713 | |
| Less imputed interest | 1,910 | | | 168 | | | 2,078 | |
| Total | $ | 12,858 | | | $ | 777 | | | $ | 13,635 | |
11.DEBT
As of
December 31, 20172023 and 2016,2022, long-term debt consisted of the following (in thousands):| | | December 31, 2017 | | | December 31, 2016 | |
U.S. term loan, which matures on May 28, 2019; weighted average interest rate of 4.5% for the twelve-month period ended December 31, 2017 | | $ | -- | | | $ | 24,375 | |
| | | | | | | | | |
Canadian term loan, which matures on May 28, 2019; 1.25% of aggregate principal repayable per quarter; weighted average interest rate of 4.5% for the twelve-month period ended December 31, 2017 | | | 297,623 | | | | 293,763 | |
| | | | | | | | | |
U.S. revolving credit facility, which matures on May 28, 2019, weighted average interest rate of 6.5% for the twelve-month period ended December 31, 2017 | | | -- | | | | -- | |
| | | | | | | | | |
Canadian revolving credit facility, which matures on May 28, 2019, weighted average interest rate of 5.3% for the twelve-month period ended December 31, 2017 | | | -- | | | | 23,089 | |
| | | | | | | | | |
Canadian revolving credit facility, which matures on May 28, 2019, weighted average interest rate of 5.3% for the twelve-month period ended December 31, 2017 | | | -- | | | | 9,533 | |
| | | | | | | | | |
Australian revolving credit facility, which matures on May 28, 2019, weighted average interest rate of 5.1% for the twelve-month period ended December 310, 2017 | | | -- | | | | 6,507 | |
| | | | 297,623 | | | | 357,267 | |
Less: Unamortized debt issuance costs | | | 3,037 | | | | 3,996 | |
Total debt | | | 294,586 | | | | 353,271 | |
Less: Current portion of long-term debt, including unamortized debt issuance costs, net | | | 16,596 | | | | 15,471 | |
Long-term debt, less current maturities | | $ | 277,990 | | | $ | 337,800 | |
| | | | | | | | | | | |
| | December 31, 2023 | | December 31, 2022 |
| Canadian term loan; weighted average interest rate of 8.2% for the twelve-month period ended December 31, 2023 | $ | — | | | $ | 29,532 | |
| U.S. revolving credit facility; weighted average interest rate of 10.2% for the twelve-month period ended December 31, 2023 | — | | | — | |
| Canadian revolving credit facility; weighted average interest rate of 8.3% for the twelve-month period ended December 31, 2023 | 65,554 | | | 101,147 | |
| Australian revolving credit facility; weighted average interest rate of 6.8% for the twelve-month period ended December 31, 2023 | — | | | 1,358 | |
| | 65,554 | | | 132,037 | |
| Less: Unamortized debt issuance costs | — | | | 1,084 | |
| Total debt | 65,554 | | | 130,953 | |
| Less: Current portion of long-term debt, including unamortized debt issuance costs, net | — | | | 28,448 | |
| Long-term debt, less current maturities | $ | 65,554 | | | $ | 102,505 | |
Scheduled maturities of long-term debt as of
December 31, 20172023 are as follows (in thousands):2018 | | | 16,767 | |
2019 | | | 280,856 | |
| | | $ | 297,623 | |
| | | | | |
| Year Ending
December 31, |
| 2024 | $ | — | |
| 2025 | 65,554 | |
| |
| | $ | 65,554 | |
Amended
As of
December 31, 2016, 2023, our Credit Agreement
as(as then amended to date,
the Credit Agreement) provided for:
(i) a $350.0$200.0 million revolving credit facility scheduled to mature on May 28, 2019, September 8, 2025, allocated as follows: (A) a $50.0$10.0 million senior secured revolving credit facility in favor of certainone of our U.S. subsidiaries, as borrowers;borrower; (B) a $100.0 million senior secured revolving credit facility in favor of Civeo and certain of our Canadian subsidiaries, as borrowers; (C) a $100.0$155.0 million senior secured revolving credit facility in favor of Civeo, as borrower; and (D)(C) a $100.0$35.0 million senior secured revolving credit facility in favor of one of our Australian subsidiaries, as borrower; and (ii) a $350.0C$100.0 million term loan facility, scheduled to maturewhich was fully repaid, on May 28, 2019 December 31, 2023 in favor of Civeo.On February 17, 2017, the third amendment to the
The Credit Agreement
(aswas amended
byeffective March 31, 2023 to, among other things, change the
third amendment,benchmark interest rate for certain U.S. dollar-denominated loans in each of the
Amended Credit Agreement) became effective, which: | ●
| provided for the reduction by $75 million of the aggregate revolving loan commitments under the Amended Credit Agreement, to a maximum principal amount of $275 million, allocated as follows: (1) a $40.0 million senior secured revolving credit facility in favor of certain of our U.S. subsidiaries, as borrowers; (2) a $90.0 million senior secured revolving credit facility in favor of Civeo and certain of our Canadian subsidiaries, as borrowers; (3) a $60.0 million senior secured revolving credit facility in favor of Civeo, as borrower; and (4) an $85.0 million senior secured revolving credit facility in favor of one of our Australian subsidiaries, as borrower;
|
Australian Revolving Facility, Canadian Revolving Facility, and U.S. Revolving Facility from London Inter-Bank Offered Rate to Term Secured Overnight Financing Rate (SOFR).
| ●
| established one additional level to the total leverage-based grid such that the interest rates for the loans range from the London Interbank Offered Rate (LIBOR) plus 2.25% to LIBOR plus 5.50%, and increased the undrawn commitment fee from a range of 0.51% to 1.13% to a range of 0.51% to 1.24% based on total leverage;
|
| ●
| adjusted the maximum leverage ratio financial covenant for the relevant periods, as follows:
|
Period Ended
| Maximum Leverage Ratio
|
December 31, 2017
| 5.85 : 1.00
|
March 31, 2018
| 5.85 : 1.00
|
June 30, 2018
| 5.85 : 1.00
|
September 30, 2018
| 5.85 : 1.00
|
December 31, 2018
| 5.50 : 1.00
|
March 31, 2019 & thereafter
| 5.25 : 1.00
|
; and
| ●
| provided for other technical changes and amendments to the Amended Credit Agreement.
|
U.S. dollar amounts outstanding under the facilities provided by the Amended Credit Agreement bear interest at a variable rate equal to LIBORthe Term SOFR plus a margin of 2.25%3.00% to 5.50%4.00%, or a base rate plus 1.25%2.00% to 4.50%3.00%, in each case based on a ratio of our total leveragenet debt to Consolidated EBITDA (as defined in the Amended Credit Agreement). Canadian dollar amounts outstanding bear interest at a variable rate equal to a Bankers’ Acceptance Discount Rate (as defined in the Credit Agreement) based on the Canadian Dollar Offered Rate (CDOR) plus a margin of 2.25%3.00% to 5.50%4.00%, or a baseCanadian Prime rate plus a margin of 1.25%2.00% to 4.50%3.00%, in each case based on a ratio of our consolidated total leveragenet debt to Consolidated EBITDA. Australian dollar amounts outstanding under the Amended Credit Agreement bear interest at a variable rate equal to the Bank Bill Swap Bid Rate plus a margin of 2.25%3.00% to 5.50%4.00%, based on a ratio of our consolidated total leveragenet debt to Consolidated EBITDA.
The Amendedfuture transition from CDOR as an interest rate benchmark is addressed in the Credit Agreement and at such time the transition from CDOR takes place, an alternate benchmark will be established based on the first alternative of the following, plus a benchmark replacement adjustment, Term Canadian Overnight Repo Rate Average (CORRA) and Compound CORRA.
The Credit Agreement contains customary affirmative and negative covenants that, among other things, limit or restrict: (i) subsidiary indebtedness, liens and fundamental changes; (ii) asset sales; (iii) acquisitions of margin stock; (iv) specified acquisitions; (v)(iv) certain restrictive agreements; (vi)(v) transactions with affiliates; and (vii)(vi) investments and other restricted payments, including dividends and other distributions. In addition, we must maintain ana minimum interest coverage ratio, defined as the ratio of consolidated EBITDA to consolidated interest expense, of at least 3.03.00 to 1.01.00 and oura maximum net leverage ratio, defined as the ratio of total net debt to consolidatedConsolidated EBITDA, of no greater than 5.853.00 to 1.0 (as1.00. Following a qualified offering of December 31, 2017). As noted above, the permittedindebtedness, we will be required to maintain a maximum leverage ratio changes over time.of no greater than 3.50 to 1.00 and a maximum senior secured ratio less than 2.00 to 1.00. Each of the
factors considered in the calculations of these ratios are defined in the
Amended Credit Agreement. EBITDA and consolidated interest, as defined, exclude goodwill and asset impairments, debt discount amortization,
amortization of intangibles and other non-cash charges. We were in compliance with
all of theseour covenants as of
December 31, 2017. As of December 31, 2017, we have 15 lenders in our Amended Credit Agreement with commitments ranging from $0.7 million to $121.7 million. As of December 31, 2017, we had outstanding letters of credit of $0.8 million under the U.S facility, $0.6 million under the Australian facility and $0.4 million under the Canadian facility.2023.
Borrowings under the
Amended Credit Agreement are secured by a pledge of substantially all of our assets and the assets of our subsidiaries. Obligationssubsidiaries subject to customary exceptions. The obligations under the Amended Credit Agreement are guaranteed by our significant subsidiaries.In addition As of December 31, 2023, we had seven lenders that were parties to the Amended Credit Agreement, with total revolving commitments ranging from $16.1 million to $37.1 million. As of December 31, 2023, we have an A$2.0had outstanding letters of credit of $0.3 million bank guaranteeunder the U.S. facility, which matures March 31, 2018. There werezero under the Australian facility and $1.1 million under the Canadian facility. We also had outstanding bank guarantees of A$0.8 million under this facility outstanding as of the Australian facility.
12.ASSET RETIREMENT OBLIGATIONS
AROs at December 31,
2017.2023 and 2022 were (in thousands): | | | | | | | | | | | |
| | 2023 | | 2022 |
| Asset retirement obligations | $ | 16,215 | | | $ | 18,113 | |
Less: Asset retirement obligations due within one year (1) | 2,576 | | | 4,550 | |
| Long-term asset retirement obligations | $ | 13,639 | | | $ | 13,563 | |
| | | | | |
| (1) | Classified as a current liability on the consolidated balance sheets, under the caption “Other current liabilities.” Balance at December 31, 2023 related to remediation work planned for 2024. |
Total accretion expense related to AROs was $1.1 million, $1.8 million and $1.4 million during the years ended December 31, 2023, 2022 and 2021, respectively.
During the years ended December 31, 2023, 2022 and 2021, our ARO changed as follows (in thousands):
| | | | | | | | | | | | | | | | | |
| | 2023 | | 2022 | | 2021 |
| Balance as of January 1 | $ | 18,113 | | | $ | 13,745 | | | $ | 14,993 | |
| Accretion of discount | 1,104 | | | 1,830 | | | 1,429 | |
| | | | | |
| Change in estimates of existing obligations | 1,366 | | | 4,138 | | | (763) | |
| Settlement of obligations | (4,756) | | | (455) | | | (1,943) | |
| Foreign currency translation | 388 | | | (1,145) | | | 29 | |
| Balance as of December 31 | $ | 16,215 | | | $ | 18,113 | | | $ | 13,745 | |
13.RETIREMENT PLANS
We sponsor
various defined contribution plans. Participation in these plans is available to substantially all employees. We recognized expense of $4.8 million, $6.4 million and $9.6 million, respectively, related to matching contributions under our various defined contribution plans during the years ended December 31,2017,2016 and 2015, respectively. A defined contribution plan is a post-employment benefit plan under which an entity pays fixed contributions into a separate entity and will generally have no legal or constructive obligation to pay further amounts. Obligations for contributions to defined contribution plans are recognized as an employee benefit expense in profit or loss in the periods during which services are rendered by employees. We recognized expense of $10.2 million, $8.2 million and $7.6 million related to matching contributions under our various defined contribution plans during the years ended December 31, 2023, 2022 and 2021, respectively.
Canadian Retirement Savings Plan
We offer a defined contribution retirement plan to our Canadian employees. In Canada, we contribute, on a matched basis, an amount up
to 5% of each Canadian based, salaried employee’s earnings (base salary plus annual incentive compensation) to the legislated maximum for a Deferred Profit Sharing Plan (DPSP – Maximum(DPSP). The maximum for 2017 - $13,115).2023 was C$15,780. DPSP is a form of defined contribution retirement savings plan governed by Canadian Federal Taxfederal tax legislation which provides for the deferral of tax on depositdeposits and investment returnreturns until removed from the plan to support retirement income. Employer contributions vest upon the completion of two years of service. Employee contributions are required in order to be eligible for the DPSP employer matching. Maximum employer matching (5%(5% noted above) is attained with (6%) employee contribution which would go into a Group Registered Retirement Savings Plan (GRRSP).Plan. The two plans work in tandem. Contributions to the “Retirement Savings Plan” for Canadian employees are subject to the annual maximum total registered savings limit of $26,010C$30,780 in 20172023 as set out in the Canadian Tax Act.
Australian Retirement Savings Plan
Our Australian
subsidiary contributes to various defined contribution plans for its employees in accordance with legislation governing the calculation of the Superannuation Guarantee Surcharge (SGC). SGC is contributed by the employer at a rate of 9.5%10.5% of the base salary of an employee, capped at the legislated maximum contribution base which is indexed annually.Our Australian
subsidiary makes no investment decisions on behalf of the employee and has no obligations other than to remit the defined contributions to the plan selected by each individual employee.
U.S. Retirement Savings Plan
We offer a defined contribution
401(k)401(k) retirement plan to substantially all of our U.S. employees. Participants
may contribute from
1% to
75% of their base and cash incentive compensation (subject to Internal Revenue Service limitations), and we make matching contributions under this plan on the
first6% of the
participant’sparticipant’s compensation (100%(100% match of the first4% employee contribution and 50% match on the next 2% contribution). Our matching contributions vest at a rate of 40% after two years of service and 20% per year for each of the employee’s firstfivenext three years of service and then are fully vested thereafter.
14.INCOME TAXES
12.
| ASSET RETIREMENT OBLIGATIONS
|
AROs at December 31,2017 and 2016 were (in thousands):
| | | 2017 | | | 2016 | |
| | | | | | | | | |
Asset retirement obligations | | $ | 17,185 | | | $ | 17,584 | |
Less: Asset retirement obligations due within one year* | | | 1,799 | | | | 2,374 | |
Long-term asset retirement obligations | | $ | 15,386 | | | $ | 15,210 | |
*
| Classified as a current liability on the consolidated balance sheets, under the caption “Other current liabilities.” Related to remediation work planned for 2018.
|
Total expense related to the ARO was $1.4 million, $1.4 million and $1.3 million in 2017,2016 and 2015, respectively.
During the years ended December 31, 2017, 2016 and 2015, our ARO changed as follows (in thousands):
| | | 2017 | | | 2016 | | | 2015 | |
Balance as of January 1 | | $ | 17,584 | | | $ | 17,299 | | | $ | 21,610 | |
Accretion of discount | | | 1,353 | | | | 1,351 | | | | 1,292 | |
New obligations | | | 86 | | | | -- | | | | 81 | |
Change in estimates of existing obligations | | | (1,901 | ) | | | (1,182 | ) | | | (2,366 | ) |
Settlement of obligations | | | (816 | ) | | | (376 | ) | | | (132 | ) |
Foreign currency translation | | | 879 | | | | 492 | | | | (3,186 | ) |
Balance as of December 31 | | $ | 17,185 | | | $ | 17,584 | | | $ | 17,299 | |
The Company’sCompany’s operations are conducted through various subsidiaries in a number of countries throughout the world. The Company has provided for income taxes based upon the tax laws and rates in the countries in which operations are conducted and income is earned.
Income taxbenefitexpense (benefit).Pre-tax lossincome (loss) for the years ended December 31,2017,2016 2023, 2022 and 20152021 consisted of the following (in thousands): | | | | 2017 | | | 2016 | | | 2015 | | | 2023 | | 2022 | | 2021 |
Canada operations | | $ | (87,143 | ) | | $ | (87,234 | ) | | $ | (73,691 | ) |
Foreign operations | | | (31,601 | ) | | | (28,698 | ) | | | (90,062 | ) |
Total | | $ | (118,744 | ) | | $ | (115,932 | ) | | $ | (163,753 | ) |
The components of the income tax
benefitexpense (benefit) for the years ended
December31,2017,2016 2023, 2022 and 20152021 consisted of the following (in thousands): | | | | 2017 | | | 2016 | | | 2015 | | | 2023 | | 2022 | | 2021 |
Current: | | | | | | | | | | | | |
| Canada | |
| Canada | |
Canada | | $ | (5,986 | ) | | $ | (8,646 | ) | | $ | (820 | ) |
Foreign | | | 1,472 | | | | 1,749 | | | | 1,906 | |
Total | | $ | (4,514 | ) | | $ | (6,897 | ) | | $ | 1,086 | |
| | | | | | | | | | | | | |
Deferred: | | | | | | | | | | | | |
| Deferred: | |
| Deferred: | |
| Canada | |
| Canada | |
Canada | | $ | (9,194 | ) | | $ | (12,169 | ) | | $ | (2,707 | ) |
Foreign | | | 218 | | | | (1,039 | ) | | | (31,468 | ) |
Total | | $ | (8,976 | ) | | $ | (13,208 | ) | | $ | (34,175 | ) |
| | | | | | | | | | | | | |
Total Benefit | | $ | (13,490 | ) | | $ | (20,105 | ) | | $ | (33,089 | ) |
| Net income tax expense (benefit) | |
| Net income tax expense (benefit) | |
| Net income tax expense (benefit) | |
The
net income tax
benefitexpense (benefit) differs from an amount computed at
Canadian statutory rates as follows for the years ended December 31, 2017, 20162023, 2022 and 20152021 (in thousands):| | | 2017 | | | 2016 | | | 2015 | |
Federal tax benefit at statutory rates | | $ | (32,061 | ) | | | 27.0 | % | | $ | (31,302 | ) | | | 27.0 | % | | $ | (44,213 | ) | | | 27.0 | % |
Effect of foreign income tax, net | | | (3,399 | ) | | | 2.9 | % | | | (6,593 | ) | | | 5.7 | % | | | (15,088 | ) | | | 9.2 | % |
Enacted tax rate change – U.S. Tax Reform | | | 9,047 | | | | (7.6 | %) | | | -- | | | | -- | | | | -- | | | | -- | |
Valuation allowance – U.S. Tax Reform | | | (9,047 | ) | | | 7.6 | % | | | -- | | | | -- | | | | -- | | | | -- | |
Valuation allowance – Other | | | 19,130 | | | | (16.1 | %) | | | 15,051 | | | | (13.0 | %) | | | 11,189 | | | | (6.8 | %) |
Tax effects of restructuring | | | -- | | | | -- | | | | 3,038 | | | | (2.6 | %) | | | 17,600 | | | | (10.8 | %) |
Deemed income from foreign subsidiaries | | | 334 | | | | (0.3 | %) | | | 1,108 | | | | (1.0 | %) | | | 4,190 | | | | (2.6 | %) |
Enacted tax rate change - Canada | | | 598 | | | | (0.5 | %) | | | 712 | | | | (0.6 | %) | | | 3,332 | | | | (2.0 | %) |
Goodwill impairment | | | -- | | | | -- | | | | -- | | | | -- | | | | 11,533 | | | | (7.0 | %) |
Tax on future unremitted earnings | | | -- | | | | -- | | | | -- | | | | -- | | | | (25,306 | ) | | | 15.4 | % |
Other, net | | | 1,908 | | | | (1.6 | %) | | | (2,119 | ) | | | 1.8 | % | | | 3,674 | | | | (2.2 | %) |
Net income tax benefit | | $ | (13,490 | ) | | | 11.4 | % | | $ | (20,105 | ) | | | 17.3 | % | | $ | (33,089 | ) | | | 20.2 | % |
| | | | | | | | | | | | | | | | | | | | | | | | | | | | | | | | | | | | |
| | 2023 | | 2022 | | 2021 | |
| Canadian federal tax benefit at statutory rates | $ | 6,054 | | | 15.0 | % | | $ | 1,610 | | | 15.0 | % | | $ | 779 | | | 13.3 | % | |
| Canadian provincial income tax | 497 | | | 1.2 | % | | 282 | | | 2.6 | % | | 215 | | | 3.7 | % | |
| Effect of foreign income tax, net | 5,481 | | | 13.6 | % | | 1,809 | | | 16.9 | % | | 1,189 | | | 20.2 | % | |
| Valuation allowance | (2,556) | | | (6.3) | % | | 153 | | | 1.4 | % | | 1,028 | | | 17.5 | % | |
| Noncontrolling interest | 125 | | | 0.3 | % | | (562) | | | (5.2) | % | | — | | | — | % | |
| | | | | | | | | | | | |
| Non-deductible compensation | 1,009 | | | 2.5 | % | | 808 | | | 7.5 | % | | 526 | | | 9.0 | % | |
| Unrealized intercompany foreign currency translation gain | (148) | | | (0.4) | % | | (250) | | | (2.3) | % | | (708) | | | (12.1) | % | |
| | | | | | | | | | | | |
| Deemed income from foreign subsidiaries | 322 | | | 0.8 | % | | 331 | | | 3.1 | % | | 297 | | | 5.1 | % | |
| Other, net | (151) | | | (0.4) | % | | 221 | | | 2.0 | % | | 50 | | | 0.8 | % | |
| Net income tax expense (benefit) | $ | 10,633 | | | 26.3 | % | | $ | 4,402 | | | 41.0 | % | | $ | 3,376 | | | 57.5 | % | |
U.S. Tax Reform. On December 22, 2017, U.S. Tax Reform was signed into law, making significant changes to the U.S. Internal Revenue Code. Changes include, but are not limited to, a corporate tax rate decrease from 35% to 21% effective for tax years beginning after December 31, 2017, the transition of U.S. international taxation from a worldwide tax system to a territorial system, and a one-time transition tax on the mandatory deemed repatriation of cumulative foreign earnings as of December 31, 2017.
In 2015, due to our redomiciling to Canada, we recognized and repatriated all U.S. cumulative foreign earnings in that year. As of December 31, 2017, we had no remaining unrepatriated earnings subject to the transition tax.
The tax legislation also includes two new U.S. base-erosion provisions beginning in 2018: (1) the global intangible low-taxes income (GILTI) provisions; and (2) base-erosion and anti-abuse tax (BEAT) provisions.
The GILTI provisions require us to include, in our U.S. income tax provision, foreign subsidiary earnings in excess of an allowable return on the foreign subsidiary’s tangible assets. We do not expect to be impacted by this tax as we had no U.S. foreign subsidiaries as of December 31, 2017.
The BEAT provisions eliminate the deduction of certain base-erosion payments made to related foreign companies, and impose a minimum tax if greater than the regular tax. As of December 31, 2017, we anticipate the impact to us to be immaterial as there are minimal payments made to our U.S. foreign affiliates.
Beginning in 2018, as a result of U.S. Tax Reform, under Section 162(m), our deduction for compensation, including performance-based compensation, may be limited in excess of $1 million paid to anyone who serves as the Chief Executive Officer or Chief Financial Officer, or who is among the three most highly compensated executive officers for any tax year. We are continuing to evaluate our executive compensation packages to determine any impact to 2018 and forward tax years.
On December 22, 2017, the Commission staff issued Staff Accounting Bulletin No. 118 (SAB 118) to address the application of U.S. GAAP in situations when a registrant does not have the necessary information available, prepared, or analyzed in reasonable detail to complete the accounting for certain income tax effects of the U.S. Tax Reform. We have calculated an estimate of the impacts of U.S. Tax Reform to our U.S. deferred taxes and recorded these amounts in our total deferred taxes as of December 31, 2017, the result of which was a decrease of the U.S. net deferred tax asset of $9 million which was fully offset by a decrease in the U.S. valuation allowance of $9 million. This results in zero impact to our income tax benefit for the year ended December 31, 2017. The ultimate impact may differ from these estimates due to additional analysis, changes in interpretations and assumptions we have made, additional regulatory guidance that may be issued, and actions we may take as a result of the U.S. Tax Reform. We expect to finalize our estimate upon filing of our 2017 U.S. corporate income tax return.
Deferred Tax Liabilities and Assets. The significant items giving rise to the deferred tax assets and liabilities as of December 31, 2017 2023 and 20162022 are as follows (in thousands):
| | | | 2017 | | | 2016 | | | 2023 | | 2022 |
Deferred tax assets: | | | | | | | | |
Net operating loss | | $ | 70,920 | | | $ | 49,810 | |
| Net operating loss | |
| Net operating loss | |
Employee benefits | | | 5,560 | | | | 6,952 | |
Deductible goodwill and other intangibles | | | 50,758 | | | | 45,262 | |
| Land | |
Other reserves | | | 6,854 | | | | 4,773 | |
Unearned revenue | | | 1,424 | | | | 1,776 | |
| Deferred revenue | |
| Operating lease liabilities | |
| Capital losses | |
Other | | | 188 | | | | 1,588 | |
Deferred tax assets | | | 135,704 | | | | 110,161 | |
Valuation allowance | | | (90,663 | ) | | | (76,157 | ) |
Deferred tax assets, net | | $ | 45,041 | | | $ | 34,004 | |
Deferred tax liabilities: | | | | | | | | |
| Intangibles | |
| Intangibles | |
| Intangibles | |
Depreciation | | $ | (44,141 | ) | | $ | (42,701 | ) |
Investment | | | (900 | ) | | | (497 | ) |
| Operating lease right-of-use assets | |
Deferred tax liabilities | | | (45,041 | ) | | | (43,198 | ) |
Net deferred tax liability | | $ | -- | | | $ | (9,194 | ) |
| Net deferred tax liabilities, net | |
At December 31, 2023 and 2022, we had no undistributed earnings of foreign subsidiaries that would be subject to income tax upon distribution to Canada from a foreign subsidiary. As such, as of December 31, 2023 and 2022, we did not provide for deferred taxes on any such earnings of our foreign subsidiaries.
NOL Carryforwards. The following table summarizes net operating loss (NOL) carryforwards at December 31,2017 2023 (in thousands): | | | Amount | | Expiration Period |
Net operating loss carryforwards: | | | | | |
Canada | | $ | 121,115 | | Begins to expire in 2035 |
Australia | | | 85,840 | | Does not expire |
U.S. – Federal | | | 32,671 | | Begins to expire in 2036 |
U.S. – State | | | 5,606 | | Begins to expire in 2020 |
| | | | | | | | | | | |
| Amount | | Expiration Period |
| Net operating loss carryforwards: | | | |
| Canada – Federal and provincial | $ | 144,242 | | | Begins to expire in 2035 |
| | | |
| U.S. – Federal | 34,028 | | | Begins to expire in 2036 |
| U.S. – Federal | 30,655 | | | Does not expire |
| U.S. – State, tax effected | 6,073 | | | Begins to expire in 2024 |
Change in Valuation Allowance. Realization of our deferred tax assets is dependent upon, among other things, our ability to generate taxable income of the appropriate character in the future. Changes in
our valuation allowance for the years ended December 31, 2017 2023 and 20162022 are as follows (in thousands):| | | Foreign Tax Credits | | | Federal / State NOLs | | | Net Deferred Tax Assets | | | Other | | | Total | |
Balance as of December 31, 2015 | | $ | (58,906 | ) | | $ | (1,526 | ) | | $ | (54,128 | ) | | $ | (527 | ) | | $ | (115,087 | ) |
Change in income tax provision | | | -- | | | | (13,580 | ) | | | (1,085 | ) | | | (386 | ) | | | (15,051 | ) |
Write-off of U.S. foreign tax credits | | | 58,906 | | | | -- | | | | -- | | | | -- | | | | 58,906 | |
Other change | | | -- | | | | (4,008 | ) | | | (1,174 | ) | | | (72 | ) | | | (5,254 | ) |
Foreign currency translation | | | -- | | | | 1 | | | | 344 | | | | (16 | ) | | | 329 | |
Balance as of December 31, 2016 | | | -- | | | | (19,113 | ) | | | (56,043 | ) | | | (1,001 | ) | | | (76,157 | ) |
Change in income tax provision – U.S. Tax Reform | | | -- | | | | 4,574 | | | | 4,473 | | | | -- | | | | 9,047 | |
Change in income tax provision - Other | | | -- | | | | (17,622 | ) | | | (1,508 | ) | | | -- | | | | (19,130 | ) |
Other change | | | -- | | | | 1,277 | | | | (1,290 | ) | | | 255 | | | | 242 | |
Foreign currency translation | | | -- | | | | (515 | ) | | | (4,150 | ) | | | -- | | | | (4,665 | ) |
Balance as of December 31, 2017 | | $ | -- | | | $ | (31,399 | ) | | $ | (58,518 | ) | | $ | (746 | ) | | $ | (90,663 | ) |
| | | | | |
| |
| Balance as of December 31, 2021 | $ | (85,351) | |
| Change in income tax provision | (153) | |
| Other change | (1,178) | |
| Foreign currency translation | 3,777 | |
| Balance as of December 31, 2022 | (82,905) | |
| Change in income tax provision | 2,556 | |
| Other change | 1,767 | |
| Foreign currency translation | (187) | |
| Balance as of December 31, 2023 | $ | (78,769) | |
Following
As of each reporting date, management considers new evidence, both positive and negative, that could affect our view of the
repatriationfuture realization of
all deferred tax assets. As of December 31, 2023, management determined that there is not sufficient evidence to conclude that it is more likely than not that the Canadian and U.S. cumulative foreign earnings in 2015, a full valuation allowance was placed against excess foreignnet deferred tax credits totaling $58.9 million. The excess foreign tax credits were written-off againstassets are realizable, therefore we have maintained the valuation allowance in 2016 becauseboth of the remote likelihoodthese jurisdictions. As of December 31, 2023, management determined that there is not sufficient evidence to conclude that it is more likely than not that the foreignAustralia deferred tax credits will be utilized.In 2017, theassets related to certain capital assets are realizable, therefore we have maintained a partial valuation allowance was decreased by $9 million due to the decrease of the U.S. statutory tax rate from 35% to 21% as a result of U.S. Tax Reform.
At the end of 2017, the valuation allowance increased by $5.9 million as a result of placing a valuation allowance against the Canadian net deferred tax asset.
Indefinite Reinvestment of Earnings. At December 31, 2016 and 2017, we had no undistributed earnings of foreign subsidiaries subject to income tax in Canada. Due to our redomiciling to Canada in 2015, we recognized and repatriated all U.S. cumulative foreign earnings in 2015.
Australia.
Unrecognized Tax Benefits.We file tax returns in the jurisdictions in which they are required. All of these returns are subject to examination or audit and possible adjustment as a result of assessments by taxing authorities. We believe that we have recorded sufficient tax liabilities and do not expect the resolution of any examination or audit of our tax returns to have a material adverse effect on our operating results, financial condition or liquidity. Our Canadian federal tax returns subsequent to
20102018 are subject to audit by the Canada Revenue Agency. Our Australian
subsidiary’ssubsidiary’s federal income tax returns subsequent to 20132018 are open for review by the Australian Taxation Office. Our U.S. subsidiary’s federal tax returns from 2014subsequent to 2019 are subject to audit by the USU.S. Internal Revenue Service.The total amount of unrecognized tax benefits as of
December 31,2017,2016 2023, 2022 and 20152021 was zero, zero and $0.7 million, respectively. The unrecognizedzero. Unrecognized tax benefits, if recognized, would affect the effective tax rate. We accrue interest and penalties, if applicable, related to unrecognized tax benefits as a component of our provision for income taxes. As of December 31, 2017, 20162023, 2022 and 2015,2021, we had accrued zero zero and $0.3 million, respectively, of interest expense and penalties.A reconciliation of the beginning and ending amount of unrecognized tax benefits is as follows (in thousands):
| | | 2017 | | | 2016 | | | 2015 | |
Balance as of January 1 | | $ | -- | | | $ | 679 | | | $ | 679 | |
Additions for tax positions of prior years | | | -- | | | | -- | | | | -- | |
Reductions for tax positions of prior years | | | -- | | | | -- | | | | -- | |
Reductions for settlements | | | -- | | | | -- | | | | -- | |
Lapse of the applicable statute of limitations | | | -- | | | | (679 | ) | | | -- | |
Balance as of December 31 | | $ | -- | | | $ | -- | | | $ | 679 | |
During 2016, management determined that, based upon the status of current examinations, an uncertain tax liability of $0.7 million was reversed.
14.
| COMMITMENTS AND CONTINGENCIES
|
We lease a portion of our equipment, office space, computer equipment, automobiles and trucks under leases which expire at various dates.
Minimum future operating lease obligations in effect at December31,2017, were as follows (in thousands):
2018 | | $ | 3,850 | |
2019 | | | 3,441 | |
2020 | | | 3,209 | |
2021 | | | 2,006 | |
2022 | | | 1,501 | |
Thereafter | | | 7,110 | |
Total | | $ | 21,117 | |
Rental expense under operating leases was $5.6 million, $6.0 million and $7.6 million for the years ended December 31,2017,2016 and 2015, respectively.
We are a party to various pending or threatened claims, lawsuits and administrative proceedings seeking damages or other remedies concerning our commercial operations, products, employees and other matters, including warranty and product liability claims as a result of our products or operations. Although we can give
no assurance about the outcome of pending legal and administrative proceedings and the effect such outcomes
may have on us, management believes that any ultimate liability resulting from the outcome of such proceedings, to the extent
not otherwise provided for or covered by insurance, will
not have a material adverse effect on our consolidated financial position, results of operations or
liquidity.liquidity.
16.PREFERRED SHARES
On January 26,April 2, 2018, a putative class action captioned Philip Suhr v. Civeo Corporation et al. was filed inwe issued 9,679 Series A preferred shares as part of the U.S. District Court for the Southern District of Texas against us and members of our board of directors regarding our proposed acquisition of Noralta.Noralta Lodge Ltd. (Noralta Acquisition). The complaint alleges that we filedSeries A preferred shares had an initial liquidation preference of $10,000 per share. Holders of the Series A preferred shares were entitled to receive a materially incomplete and misleading proxy statement2% annual dividend on the liquidation preference paid quarterly in connection withcash or, at our option, by increasing the Series A preferred shares’ liquidation preference or any combination thereof. During the fourth quarter of 2018, 637 Series A preferred shares initially held in escrow to support certain obligations of the Noralta Acquisition were released. On October 30, 2022, 3,617 Series A preferred shares were repurchased from the holders for approximately $30.6 million, which included accrued dividends of under $0.1 million. On December 13, 2022, the holders of the Series A preferred shares elected to convert the remaining 5,425 Series A preferred shares outstanding into 1,504,539 common shares. As of December 31, 2022, we had no Series A preferred shares outstanding.
During the years ended December 31, 2022 and 2021, we recognized preferred dividends on the Series A preferred shares as follows (in thousands):
| | | | | | | | | | | | | | | |
| | | 2022 | | 2021 |
| In-kind dividends | | | $ | 1,706 | | | $ | 1,925 | |
| Cash dividend on repurchased preferred shares | | | 65 | | | — | |
| Total preferred dividends | | | $ | 1,771 | | | $ | 1,925 | |
The Board of Directors (Board) elected to pay the dividends beginning June 30, 2018 through December 12, 2022 through an increase in violationthe liquidation preference rather than in cash. The paid-in-kind dividend of Sections 14(a)$1.7 million and 20(a)$1.9 million is included in Preferred dividends on the accompanying consolidated statements of operations for the years ended December 31, 2022 and 2021, respectively. On December 13, 2022, the holders of the Series A preferred shares converted all outstanding Series A preferred shares into common shares. Following such conversion, no further dividends were required to be paid.
17. SHARE REPURCHASE PROGRAMS AND DIVIDENDS
Share Repurchase Programs
In August 2023, 2022 and 2021, our Board authorized common share repurchase programs to repurchase up to 5.0% of our total common shares which were issued and outstanding, or approximately 742,000, 685,000 and 715,000 common shares, respectively, over a twelve month period.
The repurchase authorization allows repurchases from time to time in open market transactions, including pursuant to trading plans adopted in accordance with Rule 10b5-1 of the Securities Exchange Act of
1934 and Rule 14a-9 of the Securities and Exchange Commission. The complaint seeks injunctive relief, including to enjoin the shareholder vote on the Noralta Acquisition as well as the transaction itself, damages and an award of attorneys' fees, in addition to other relief. Additional lawsuits arising out of the Noralta Acquisition may be filed in the future. There can be no assurance that we will be successful in the outcome of the pending or any potential future lawsuits. A preliminary injunction could delay or jeopardize the completion of the Noralta Acquisition, and an adverse judgment granting permanent injunctive relief could indefinitely enjoin the completion of the Noralta Acquisition.1934. We
believe that the pending lawsuit is without merithave funded, and intend to
defend vigorously againstcontinue to fund, repurchases through cash on hand and cash generated from operations. The common shares repurchased under the
lawsuitshare repurchase programs are cancelled in the periods they are acquired and
any other future lawsuits challenging the
Noralta Acquisition.payment is accounted for as an increase to accumulated deficit in our Consolidated Statements of Changes in Shareholders’ Equity in the period the payment is made.
15.
| ACCUMULATED OTHER COMPREHENSIVE LOSS
|
The following table summarizes our common share repurchases pursuant to our share repurchase programs (in thousands, except per share data).
| | | | | | | | | | | | | | | | | |
| 2023 | | 2022 | | 2021 |
| Shares repurchased | 564 | | 124 | | 217 |
| Average price paid per share | $ | 20.60 | | | $ | 28.54 | | | $ | 21.38 | |
| Dollar-value of shares repurchased | $ | 11,634 | | | $ | 3,540 | | | $ | 4,649 | |
In addition to the shares repurchased pursuant to our share repurchase programs, we repurchased 374,753 common shares from a shareholder for approximately $10.7 million during the three months ended September 30, 2022.
Dividends
Our Board declared a quarterly dividend on October 27, 2023 of $0.25 per common share to shareholders of record as of close of business on November 27, 2023. The total cash payment of $3.7 million was paid on December 18, 2023. Our Board declared a quarterly dividend on September 5, 2023 of $0.25 per common share to shareholders of record as of close of business on September 15, 2023. The total cash payment of $3.7 million was paid on September 29, 2023. The dividends are eligible dividends pursuant to the Income Tax Act (Canada).
18.ACCUMULATED OTHER COMPREHENSIVE LOSS
Our accumulated other
comprehensive loss decreased $34.7$4.5 million from $362.9$385.2 million at December 31, 2016 2022 to $328.2$380.7 million at December 31, 2017, 2023, as a result of foreign currency exchange rate fluctuations. Changes in other comprehensive loss during 20172023 were primarily driven by the Australian dollar and Canadian dollar increasing in value compared to the U.S. dollar. Excluding intercompany balances, our Canadian dollar and Australian dollar functional currency net assets totaled approximately C$0.1 billion234 million and A$0.4 billion,205 million, respectively, at December 31, 2017.2023.
16.
| SHARE BASED COMPENSATION
|
Our
19.SHARE-BASED COMPENSATION
Certain key employees and non-employee directors participate in the Amended and Restated
2014 Equity Participation Plan of Civeo Corporation (the Civeo Plan). The Civeo Plan authorizes our Board
of Directors and the Compensation Committee of our Board
of Directors to approve
grantsand grant awards of options, awards of restricted shares, performance awards,
phantom share units and dividend equivalents, awards of deferred shares, and share payments to our employees and non-employee directors.
No more than
14.03.0 million Civeo common shares
may are authorized to be
awardedissued under the Civeo Plan.
Share-based
Share-based compensation expense recognized in the years ended
December 31,2017,2016 2023, 2022 and
20152021 totaled
$15.4$11.8 million,
$9.9$14.9 million and
$5.6$9.9 million, respectively. Share-based compensation expense is reflected in Selling, general and administrative
(SG&A) expense in our consolidated statements of operations. The total income tax benefit recognized in the consolidated statements of operations for
share basedshare-based compensation arrangements was approximately
zero, $0.6$0.6 million, $0.8 million and $0.3$0.5 million for the years ended December 31, 2017, 20162023, 2022 and 2015,2021, respectively.
Phantom Share Units
Options to Purchase Common Shares
No options were awarded in 2017,2016 or 2015. The following table presents the changes in stock options outstanding and related information for our employees during the years ended December 31, 2017, 2016 and 2015:
| | | Options | | | Weighted Average Exercise Price Per Share | | | Weighted Average Contractual Life (Years) | | | Intrinsic Value (Thousands) | |
Outstanding Options at December 31, 2014 | | | 532,926 | | | $ | 11.03 | | | | 3.4 | | | $ | 66,130 | |
Granted | | | -- | | | | -- | | | | | | | | | |
Exercised | | | (137,771 | ) | | | 3.63 | | | | | | | | | |
Forfeited / Expired | | | (4,821 | ) | | | 16.43 | | | | | | | | | |
Outstanding Options at December 31, 2015 | | | 390,334 | | | $ | 13.58 | | | | 3.5 | | | $ | -- | |
Granted | | | -- | | | | -- | | | | | | | | | |
Exercised | | | -- | | | | -- | | | | | | | | | |
Forfeited / Expired | | | (224,448 | ) | | | 10.33 | | | | | | | | | |
Outstanding Options at December 31, 2016 | | | 165,886 | | | $ | 17.98 | | | | 4.6 | | | $ | -- | |
Granted | | | -- | | | | -- | | | | | | | | | |
Exercised | | | -- | | | | -- | | | | | | | | | |
Forfeited / Expired | | | (20,085 | ) | | | 18.10 | | | | | | | | | |
Outstanding Options at December 31, 2017 | | | 145,801 | | | $ | 17.97 | | | | 4.5 | | | $ | -- | |
| | | | | | | | | | | | | | | | | |
Exercisable Options at December 31, 2016 | | | 145,804 | | | $ | 17.67 | | | | 4.4 | | | $ | -- | |
Exercisable Options at December 31, 2017 | | | 139,491 | | | $ | 17.79 | | | | 4.2 | | | $ | -- | |
| | | | | | | | | | | | | | | | | |
The total intrinsic value of options exercised by our employees during 2017,2016 and 2015 was zero, zero and less than $100,000, respectively. The tax benefits realized for the tax deduction from options exercised during 2017,2016 and 2015 totaled zero, zero and less than $100,000, respectively.
At December 31, 2017, unrecognized compensation cost related to options was less than $100,000,We grant phantom share unit awards, which is expected to be recognizedvest a third per year over a weighted average period of less than 1 year.
The following table summarizes information for outstanding options of our employees at December 31,2017:
| | | | | Options Outstanding | | | Options Exercisable | |
Range of Exercise Prices | | | Number Outstanding as of December 31, 2017 | | | Weighted Average Remaining Contractual Life | | | Weighted Average Exercise Price | | | Number Exercisable as of December 31, 2017 | | | Weighted Average Exercise Price | |
| | | | | | | | | | | | | | | | | | | | | | | | |
| $16.43 | | | | | | 63,142 | | | | 3.13 | | | $ | 16.43 | | | | 63,142 | | | $ | 16.43 | |
| $17.48 | | | | | | 29,849 | | | | 5.14 | | | $ | 17.48 | | | | 29,849 | | | $ | 17.48 | |
| $18.43 | | | | | | 27,553 | | | | 4.13 | | | $ | 18.43 | | | | 27,553 | | | $ | 18.43 | |
| $21.87 | | | | | | 25,257 | | | | 6.14 | | | $ | 21.87 | | | | 18,947 | | | $ | 21.87 | |
| $16.43 | - | $21.87 | | | | 145,801 | | | | 4.25 | | | $ | 17.97 | | | | 139,491 | | | $ | 17.79 | |
Restricted Share Awards / Deferred Share Awards
The following table presents the changes in restricted share and deferred share awards outstanding and related information for our employees during the years ended December 31, 2017, 2016 and 2015:
| | | Number of Awards | | | Weighted Average Grant Date Fair Value Per Share | |
Nonvested shares at December 31, 2014 | | | 576,882 | | | $ | 19.78 | |
Granted | | | 1,208,642 | | | | 3.61 | |
Vested | | | (248,215 | ) | | | 18.17 | |
Forfeited | | | (223,745 | ) | | | 7.54 | |
Nonvested shares at December 31, 2015 | | | 1,313,564 | | | $ | 7.29 | |
Granted | | | 584,283 | | | | 1.64 | |
Vested | | | (526,628 | ) | | | 8.15 | |
Forfeited | | | (72,847 | ) | | | 7.04 | |
Nonvested shares at December 31, 2016 | | | 1,298,372 | | | $ | 4.41 | |
Granted | | | 1,655,067 | | | | 3.14 | |
Vested | | | (733,147 | ) | | | 4.19 | |
Forfeited | | | (49,968 | ) | | | 3.43 | |
Nonvested shares at December 31, 2017 | | | 2,170,324 | | | $ | 3.54 | |
The weighted average grant date fair value per share for restricted share and deferred share awards granted during 2017,2016 and 2015 was $3.14,$1.64 and $3.61, respectively. The total fair value of restricted share and deferred share awards vested during 2017,2016 and 2015 was $2.0 million, $0.6 million and $0.9 million, respectively. At December 31, 2017, unrecognized compensation cost related to restricted share and deferred share awards was $4.5 million, which is expected to be recognized over a weighted average period of 1.7 years.
Phantom Share Awards
three year period. Each phantom shareshare unit award is equal in value to one common share. Upon vesting, each recipient will receive a lump sum cash payment equal to the fair market value of a common share on the respective vesting date.date in respect of each phantom share unit then vesting. These awards are accounted for as a liability that is remeasured at each reporting date until paid.
The following table presents the changes in phantom share
unit awards outstanding and related information for our employees during the years ended
December 31, 2017,20162023, 2022 and 2015:2021: | | | | | |
| | NumberNumber of Awards
| |
Nonvested shares at December 31, 2014
| | | 432,881 | |
Granted
| | | 1,920,451 | |
Vested
| | | (202,284 | ) |
Forfeited
| | | (352,848 | ) |
Nonvested shares at December 31, 2015 2020 | 458,175 | | 1,798,200 | |
Granted | 354,535 | | 6,831,957 | |
Vested | (163,499) | | (608,230 | ) |
Forfeited | (27,081) | | (1,751,963 | ) |
Nonvested shares at December 31, 2016 2021 | 622,130 | | 6,269,964 | |
Granted | 335,098 | | 750,525 | |
Vested | (270,382) | | (2,207,589 | ) |
Forfeited | (27,558) | | (263,161 | ) |
Nonvested shares at December 31, 2017 2022 | 659,288 | |
| Granted | 4,549,739229,845 | |
| Vested | (335,178) | |
| Forfeited | (33,394) | |
| Nonvested shares at December 31, 2023 | 520,561 | |
At December 31,
2017,2023, the balance of the liability for the phantom share awards was
$5.3$5.7 million.
For the years ended December 31, 2017, 20162023, 2022 and 2015,2021, we made phantom share cash payments of $7.1$10.4 million, $0.5$6.0 million and $0.8$3.1 million, respectively. At December 31, 2017,2023, unrecognized compensation cost related to phantom shares was $7.1$6.5 million, as remeasured at December 31, 2017,2023, which is expected to be recognized over a weighted average period of 1.31.6 years. The weighted average grant dategrant-date fair value per share of phantom shares granted during the years ended December 31, 2017, 20162023, 2022 and 20152021 was $3.27, $0.91$31.05, $21.97 and $3.68,$19.80, respectively.
Performance PerformanceShare Awards
On February 21, 2017, we granted 762,497We grant performance
share awards,
under the Civeo Plan, which cliff vest
after three years subject to attainment of applicable performance goals. Awards granted in
three years on February 21, 2020. These awards2023 and 2022 will be earned in amounts between
0% and
200% of the participant’s target performance share award, based
equally on
the payout percentage associated with Civeo’s relative total shareholder return (TSR) rank among a peer group of 15 other companies. The awards are being accounted for as equity awards, with a fair value of $5.20 calculated as of February 21, 2017.On February 23, 2016, we granted 2,400,606 performance awards under the Civeo Plan, which cliff vest in three years on February 23, 2019. These awards will be earned in amounts between 0% and 200% of the participant’s target performance share award, based on(i) the payout percentage associated with Civeo’s relative TSR rank among a peer group of 12other companies. Shareholder approvalcompanies and (ii) the payout percentage associated with Civeo's cumulative operating cash flow over the performance period relative to grant these awards as equity awardsa preset target. Awards granted in 2021 are earned in amounts between 0% and 200% of the participant’s target performance share award, based on (i) the payout percentage associated with Civeo’s relative TSR rank among a peer group of other companies and (ii) the payout percentage associated with Civeo's cumulative free cash flow over the performance period relative to be settled in shares was obtained on May 12, 2016. Accordingly, the awards are being accounted for as equity awards, with a preset target. The grant-date fair value of $3.18 calculated asthe portion of May 12, 2016.
the performance awards tied to
cumulative operating cash flow and free cash flow is based on target achievement and the closing market price of our common shares on the date of grant. We evaluate the probability of achieving the performance goals throughout the performance period and will adjust share-based compensation expense based on the number of shares expected to vest based on our estimate of the most probable performance outcome.
The fair value of
the TSR portion of each
performance share award was estimated using a Monte Carlo simulation pricing model that uses the assumptions noted in the following table. The risk-free interest rate is based on the U.S. Treasury yield curve in effect for the expected term of the performance share at the time of grant. The dividend yield on our common shares was assumed to be zero since we do did not currently pay dividends.dividends when the awards were granted. The expected market price volatility of our common shares was based on an estimate that considers the historical and implied volatility of our common shares as well as a peer group of companies over a time period equal to the expected term of the option.award. The initial TSR performance was based on historical performance of our common shares and the peer group’s common shares.| | | 2017 | | | 2016 | |
Risk-free weighted interest rate | | | 1.50 | % | | | 0.92 | % |
Expected volatility | | | 90.0 | % | | | 90.0 | % |
Initial TSR | | | 0.04 | % | | | 93.7 | % |
| | | | | | | | | | | | | | | | | |
| | 2023 | | 2022 | | 2021 |
| Risk-free weighted interest rate | 4.4 | % | | 1.7 | % | | 0.2 | % |
| Expected volatility | 73.0 | % | | 78.0 | % | | 83.0 | % |
| Initial TSR | 4.1 | % | | 14.1 | % | | 27.1 | % |
The
followingfollowing table presents the changes in performance share awards outstanding and related information for our employees during the year ended December 31, 2017 2023, 2022 and 2016:2021: | | | Number of Awards | | | Weighted Average Grant Date Fair Value Per Share | |
Nonvested shares at December 31, 2015 | | | -- | | | $ | -- | |
| | | | Number of
Awards | | Weighted
Average Grant
Date Fair Value
Per Share |
| Nonvested shares at December 31, 2020 | |
Granted | | | 2,400,606 | | | | 3.18 | |
Performance adjustment (1) | |
Vested | | | -- | | | | -- | |
Forfeited | | | (448,922 | ) | | | 3.18 | |
Nonvested shares at December 31, 2016 | | | 1,951,684 | | | $ | 3.18 | |
| Nonvested shares at December 31, 2021 | |
Granted | | | 762,497 | | | | 5.20 | |
Performance adjustment (2) | |
Vested | | | -- | | | | -- | |
Forfeited | | | (38,699 | ) | | | 3.64 | |
Nonvested shares at December 31, 2017 | | | 2,675,482 | | | $ | 3.75 | |
| Nonvested shares at December 31, 2022 | |
| Granted | |
Performance adjustment (3) | |
Vested (3) | |
| Forfeited | |
| Nonvested shares at December 31, 2023 | |
(1)Related to 2018 performance share awards that vested in 2021, which were paid out at 150% based on Civeo's TSR rank.
(2)Related to 2019 performance share awards that vested in 2022, which were paid out at 126% based on Civeo's TSR rank.
(3)No performance share awards vested in 2023.
During the
yearsyears ended December 31, 2017 2023, 2022 and 2016,2021, we recognized compensation expense associated with performance share awards totaling $3.0$3.4 million, $2.6 million and $1.9 million.$2.4 million, respectively. At December 31, 2017, 2023, unrecognized compensation cost related to performance share awards was $5.0$3.8 million, which is expected to be recognized over a weighted average period of 1.7 years.
Restricted ShareAwards/ Restricted Share Units/ Deferred ShareAwards
17.
| SEGMENT AND RELATED INFORMATION
|
The following table presents the changes in restricted share awards, restricted share units and deferred share awards outstanding and related information for our employees and non-employee directors during the years ended December 31, 2023, 2022 and 2021:
| | | | | | | | | | | | |
| | Number of
Awards/Units | | Weighted
Average Grant
Date Fair Value
Per Share | |
| Nonvested shares at December 31, 2020 | 105,091 | | | $ | 34.56 | | |
| Granted | 59,027 | | | 17.58 | | |
| Vested | (77,304) | | | 35.76 | | |
| Forfeited | (1,957) | | | 30.36 | | |
| Nonvested shares at December 31, 2021 | 84,857 | | | $ | 21.76 | | |
| Granted | 40,465 | | | 25.64 | | |
| Vested | (86,290) | | | 21.83 | | |
| | | | |
| Nonvested shares at December 31, 2022 | 39,032 | | | $ | 25.62 | | |
| Granted | 50,336 | | | 21.02 | | |
| Vested | (39,770) | | | 25.53 | | |
| | | | |
| Nonvested shares at December 31, 2023 | 49,598 | | | $ | 21.02 | | |
The weighted average grant-date fair value per share for restricted share awards, restricted share units and deferred share awards granted during 2023, 2022 and 2021 was $21.02, $25.64 and $17.58, respectively. The total fair value of restricted share awards, restricted share units and deferred share awards vested during 2023, 2022 and 2021 was $0.9 million, $2.1 million and $1.5 million, respectively. At December 31, 2023, unrecognized compensation cost related to restricted share awards, restricted share units and deferred share awards was $0.4 million, which is expected to be recognized over a weighted average period of 0.4 years. In addition, at December 31, 2023, all nonvested shares were related to non-employee directors.
Optionsto Purchase Common Shares
No options were awarded or exercised in 2023, 2022 or 2021. We had 287 outstanding options at December 31, 2023 that expire in February 2024 with a weighted average exercise price per share of $262.44.
As no options were exercised in the last three years, the total intrinsic value of options exercised by our employees during 2023, 2022 and 2021 was zero. Additionally, the tax benefits realized for the tax deduction from options exercised during 2023, 2022 and 2021 totaled zero.
At December 31, 2023, unrecognized compensation cost related to options was zero.
20.SUPPLEMENTAL CASH FLOW INFORMATION
Cash paid during the years ended December 31, 2023, 2022 and 2021 for interest and income taxes was as follows (in thousands):
| | | | | | | | | | | | | | | | | |
| | 2023 | | 2022 | | 2021 |
| Interest (net of amounts capitalized) | $ | 10,250 | | | $ | 9,226 | | | $ | 9,991 | |
| Net income taxes paid, net of refunds received | 251 | | | 220 | | | 334 | |
21.ACQUISITIONS
Noralta
On April 2, 2018, we acquired the equity of Noralta. As a result of the Noralta Acquisition, we expanded our existing accommodations business in the Canadian oil sands market. The total consideration, which was subject to adjustment in accordance with the terms of the definitive agreement, included (i) C$207.7 million (or approximately US$161.2 million) in cash, subject to customary post-closing adjustments for working capital, indebtedness and transactions expenses, (ii) 2.7 million of our common shares, of which 1.1 million shares were held in escrow and released based on certain conditions related to Noralta customer contracts remaining in place, and (iii) 9,679 Series A preferred shares with an initial liquidation preference of $96.8 million and initially convertible into 2.4 million of our common shares. We funded the cash consideration with cash on hand and borrowings under our revolving credit facility.
During the second quarters of each of 2023, 2022 and 2021, 0.4 million shares were released to the sellers from escrow.
22.SEGMENT AND RELATED INFORMATION
In accordance with current accounting standards regarding disclosures about segments of an enterprise and related information, we have identified
the followingtwo reportable
segments:segments, Canada
Australia and
U.S.,Australia, which represent our strategic focus on
hospitality services and workforce accommodations.
Prior to the first quarter of 2023, we presented the U.S. operating segment as a separate reportable segment. Our operating segment in the U.S. no longer meets the reportable segment quantitative thresholds required by U.S. GAAP and is included below within the Corporate, other and eliminations category. Prior periods have been updated to be consistent with the presentation for the year ended December 31, 2023.
Financial information by business segment for each of the three years ended December 31, 2017, 20162023, 2022 and 20152021 is summarized in the following table (in thousands):
| | | Total Revenues | | | Less: Intersegment Revenues | | | Revenues from unaffiliated customers | | | Depreciation and amortization | | | Operating loss | | | Capital expenditures | | | Total assets | |
2017 | | | | | | | | | | | | | | | | | | | | | | | | | | | | |
| | | | Total
Revenues | | Depreciation and amortization | | Operating (loss) income | | Capital expenditures | | Total assets |
| 2023 | |
| Canada | |
| Canada | |
Canada | | $ | 245,595 | | | $ | -- | | | $ | 245,595 | | | $ | 69,983 | | | $ | (63,211 | ) | | $ | 3,893 | | | $ | 550,378 | |
Australia | | | 111,221 | | | | -- | | | | 111,221 | | | | 45,699 | | | | (11,528 | ) | | | 2,772 | | | | 353,840 | |
United States | | | 25,460 | | | | -- | | | | 25,460 | | | | 4,653 | | | | (14,426 | ) | | | 1,912 | | | | 33,128 | |
Corporate, stand-alone adjustments and eliminations | | | -- | | | | -- | | | | -- | | | | 6,108 | | | | (8,806 | ) | | | 2,617 | | | | (83,434 | ) |
| Corporate, other and eliminations | |
Total | | $ | 382,276 | | | $ | -- | | | $ | 382,276 | | | $ | 126,443 | | | $ | (97,971 | ) | | $ | 11,194 | | | $ | 853,912 | |
| | | | | | | | | | | | | | | | | | | | | | | | | | | | | |
2016 | | | | | | | | | | | | | | | | | | | | | | | | | | | | |
| 2022 | |
| 2022 | |
| 2022 | |
| Canada | |
| Canada | |
Canada | | $ | 278,464 | | | $ | -- | | | $ | 278,464 | | | $ | 80,837 | | | $ | (59,351 | ) | | $ | 3,773 | | | $ | 548,786 | |
Australia | | | 106,815 | | | | -- | | | | 106,815 | | | | 45,883 | | | | (6,853 | ) | | | 5,682 | | | | 376,008 | |
United States | | | 11,951 | | | | -- | | | | 11,951 | | | | 5,433 | | | | (24,616 | ) | | | 6 | | | | 29,799 | |
Corporate, stand-alone adjustments and eliminations | | | -- | | | | -- | | | | -- | | | | (851 | ) | | | (4,940 | ) | | | 10,318 | | | | (44,147 | ) |
| Corporate, other and eliminations | |
Total | | $ | 397,230 | | | $ | -- | | | $ | 397,230 | | | $ | 131,302 | | | $ | (95,760 | ) | | $ | 19,779 | | | $ | 910,446 | |
| | | | | | | | | | | | | | | | | | | | | | | | | | | | | |
2015 | | | | | | | | | | | | | | | | | | | | | | | | | | | | |
| 2021 | |
| 2021 | |
| 2021 | |
| Canada | |
| Canada | |
Canada | | $ | 344,249 | | | $ | -- | | | $ | 344,249 | | | $ | 89,269 | | | $ | (73,215 | ) | | $ | 41,446 | | | $ | 579,816 | |
Australia | | | 135,964 | | | | -- | | | | 135,964 | | | | 51,392 | | | | (24,817 | ) | | | 12,160 | | | | 424,731 | |
United States | | | 40,146 | | | | (2,396 | ) | | | 37,750 | | | | 11,833 | | | | (40,083 | ) | | | 2,170 | | | | 71,710 | |
Corporate, stand-alone adjustments and eliminations | | | (2,396 | ) | | | 2,396 | | | | -- | | | | 496 | | | | (6,888 | ) | | | 6,675 | | | | (9,728 | ) |
| Corporate, other and eliminations | |
Total | | $ | 517,963 | | | $ | -- | | | $ | 517,963 | | | $ | 152,990 | | | $ | (145,003 | ) | | $ | 62,451 | | | $ | 1,066,529 | |
Financial information by geographic segment
as of and for each of the
three years ended
December31,2017,2016 2023, 2022 and 2015,2021, is summarized below (in thousands). Revenues in the U.S.Other revenues include export sales. Revenues are attributable to countries based on the location of the entity selling the products or performing the services. Long-lived assets are attributable to countries based on the physical location of the entity and its operating assets and do not include intercompany balances.| | | Canada | | | Australia | | | U.S. and Other | | | Total | |
2017 | | | | | | | | | | | | | | | | |
| | | | Canada | | Australia | | Other | | Total |
| 2023 | |
| Revenues from unaffiliated customers | |
| Revenues from unaffiliated customers | |
Revenues from unaffiliated customers | | $ | 245,595 | | | $ | 111,221 | | | $ | 25,460 | | | $ | 382,276 | |
Long-lived assets | | | 353,710 | | | | 331,511 | | | | 32,280 | | | | 717,501 | |
| | | | | | | | | | | | | | | | | |
2016 | | | | | | | | | | | | | | | | |
| 2022 | |
| 2022 | |
| 2022 | |
| Revenues from unaffiliated customers | |
| Revenues from unaffiliated customers | |
Revenues from unaffiliated customers | | $ | 278,464 | | | $ | 106,815 | | | $ | 11,951 | | | $ | 397,230 | |
Long-lived assets | | | 431,477 | | | | 348,293 | | | | 46,995 | | | | 826,765 | |
| | | | | | | | | | | | | | | | | |
2015 | | | | | | | | | | | | | | | | |
| 2021 | |
| 2021 | |
| 2021 | |
| Revenues from unaffiliated customers | |
| Revenues from unaffiliated customers | |
Revenues from unaffiliated customers | | $ | 344,249 | | | $ | 135,964 | | | $ | 37,750 | | | $ | 517,963 | |
Long-lived assets | | | 532,419 | | | | 390,623 | | | | 56,935 | | | | 979,977 | |
23.VALUATIONACCOUNTS
Activity in the valuation accounts was as follows (in thousands):
| | | Balance at Beginning of Period | | | Charged to Costs and Expenses | | | Deductions (Net of Recoveries) | | | Translation and Other, Net | | | Balance at End of Period | |
| | | | | | | | | | | | | | | | | | | | | |
Year Ended December 31, 2017: | | | | | | | | | | | | | | | | | | | | |
Allowance for doubtful accounts receivable | | $ | 638 | | | $ | 48 | | | $ | (23 | ) | | $ | 675 | | | $ | 1,338 | |
Valuation allowance for deferred tax assets | | | 76,157 | | | | 10,083 | | | | (242 | ) | | | 4,665 | | | | 90,663 | |
| | | | | | | | | | | | | | | | | | | | | |
Year Ended December 31, 2016: | | | | | | | | | | | | | | | | | | | | |
Allowance for doubtful accounts receivable | | $ | 1,121 | | | $ | (110 | ) | | $ | (377 | ) | | $ | 4 | | | $ | 638 | |
Valuation allowance for deferred tax assets | | | 115,087 | | | | 15,051 | | | | (53,652 | ) | | | (329 | ) | | | 76,157 | |
| | | | | | | | | | | | | | | | | | | | | |
Year Ended December 31, 2015: | | | | | | | | | | | | | | | | | | | | |
Allowance for doubtful accounts receivable | | $ | 4,043 | | | $ | 1,004 | | | $ | (3,844 | ) | | $ | (82 | ) | | $ | 1,121 | |
Valuation allowance for deferred tax assets | | | 49,523 | | | | 70,095 | | | | -- | | | | (4,531 | ) | | | 115,087 | |
| | | | | | | | | | | | | | | | | | | | | | | | | | | | | |
| | Balance at
Beginning
of Period | | Charged (Reduction) to
Costs and
Expenses | | Deductions
(Net of
Recoveries) | | Translation
and Other,
Net | | Balance
at End of
Period |
| Year Ended December 31, 2023: | | | | | | | | | |
| Allowance for credit losses on accounts receivable | $ | 299 | | | $ | 79 | | | $ | (181) | | | $ | 2 | | | $ | 199 | |
| Valuation allowance for deferred tax assets | 82,905 | | | (2,556) | | | (1,767) | | | 187 | | | 78,769 | |
| | | | | | | | | |
| Year Ended December 31, 2022: | | | | | | | | | |
| Allowance for credit losses on accounts receivable | $ | 361 | | | $ | 115 | | | $ | (162) | | | $ | (15) | | | $ | 299 | |
| Valuation allowance for deferred tax assets | 85,351 | | | 153 | | | 1,178 | | | (3,777) | | | 82,905 | |
| | | | | | | | | |
| Year Ended December 31, 2021: | | | | | | | | | |
| Allowance for credit losses on accounts receivable | $ | 275 | | | $ | 131 | | | $ | (30) | | | $ | (15) | | | $ | 361 | |
| Valuation allowance for deferred tax assets | 88,251 | | | 1,028 | | | (656) | | | (3,272) | | | 85,351 | |
19.
| QUARTERLY FINANCIAL INFORMATION(UNAUDITED)
|
The following table summarizes quarterly financial information for 2017 and 2016 (in thousands, except per share amounts):
| | | First Quarter(2) | | | Second Quarter(3) | | | Third Quarter(4) | | | Fourth Quarter(5) | |
2017 | | | | | | | | | | | | | | | | |
Revenues | | $ | 91,429 | | | $ | 92,010 | | | $ | 97,489 | | | $ | 101,348 | |
Gross profit(1) | | | 29,757 | | | | 32,526 | | | | 31,962 | | | | 30,773 | |
Net income (loss) attributable to Civeo | | | (20,987 | ) | | | (14,816 | ) | | | (22,331 | ) | | | (47,579 | ) |
Basic earnings (loss) per share | | | (0.17 | ) | | | (0.11 | ) | | | (0.17 | ) | | | (0.36 | ) |
Diluted earnings (loss) per share | | | (0.17 | ) | | | (0.11 | ) | | | (0.17 | ) | | | (0.36 | ) |
| | | | | | | | | | | | | | | | | |
2016 | | | | | | | | | | | | | | | | |
Revenues | | $ | 95,036 | | | $ | 107,035 | | | $ | 104,238 | | | $ | 90,921 | |
Gross profit(1) | | | 29,093 | | | | 42,449 | | | | 36,274 | | | | 29,764 | |
Net income attributable to Civeo | | | (26,822 | ) | | | (11,486 | ) | | | (42,131 | ) | | | (15,949 | ) |
Basic earnings per share | | | (0.25 | ) | | | (0.11 | ) | | | (0.39 | ) | | | (0.15 | ) |
Diluted earnings per share | | | (0.25 | ) | | | (0.11 | ) | | | (0.39 | ) | | | (0.15 | ) |
| (1)
| Represents "revenues" less "product costs" and "service and other costs" included in our consolidated statements of operations.
|
| (2)
| In the first quarter of 2017, there were no significant items recognized.
|
In the first quarter of 2016, we recognized the following items:
| ●
| Costs associated with our migration to Canada of $1.0 million ($0.7 million after-tax, or $0.01 per diluted share), included in Selling, general and administrative expenses on the accompanying consolidated statements of operations.
|
| ●
| A charge of $8.4 million ($8.4 million after-tax, or $0.05 per diluted share), related to the impairment of certain fixed assets which carrying value we determined not to be recoverable. The charge, which is related to our U.S. segment, is included in Impairment expense on the accompanying consolidated statements of operations.
|
| (3)
| In the second quarter of 2017, there were no significant items recognized.
|
In the second quarter of 2016, we recognized the following items:
| ●
| Costs associated with our migration to Canada of $0.2 million ($0.2 million after-tax, or $0.00 per diluted share), included in Selling, general and administrative expenses on the accompanying consolidated statements of operations.
|
| (4)
| In the third quarter of 2017, we recognized the following items:
|
| ●
| A charge of $4.4 million ($3.2 million after-tax, or $0.02 per diluted share), related to leasehold improvements and undeveloped land positions in the British Columbia LNG market which carrying value we determined not to be recoverable. The charge, which is related to our Canadian segment, is included in Impairment expense on the accompanying consolidated statements of operations.
|
In the third quarter of 2016, we recognized the following items:
| ●
| A charge of $37.7 million ($27.5 million after-tax, or $0.26 per diluted share), related to mobile camp assets and certain undeveloped land positions in the British Columbia LNG market which carrying value we determined not to be recoverable. The charge, which is related to our Canadian segment, is included in Impairment expense on the accompanying consolidated statements of operations.
|
| (5)
| In the fourth quarter of 2017, we recognized the following items:
|
| ●
| Costs associated with our pending acquisition of Noralta of $2.3 million ($2.2 million after-tax, or $0.02 per diluted share), included in Selling, general and administrative expenses on the accompanying consolidated statements of operations.
|
| ●
| A charge of $27.2 million ($19.9 million after-tax, or $0.15 per diluted share), related to certain lodge assets in the southern oil sands which carrying values we determined not to be recoverable. The charge, which is related to our Canadian segment, is included in Impairment expense on the accompanying consolidated statements of operations.
|
In the fourth quarter of 2016, there were no significant items recognized.
Amounts are calculated independently for each of the quarters presented. Therefore, the sum of the quarterly amounts may not equal the total calculated for the year.
126