strong chemical resistance. Rubber flooring is extremely durable compared to other flooring alternatives.
Marketing and Sales
We have traditionally focused our carpet marketing strategy on major accounts, seeking to build lasting relationships with national and multinational end-users, and on architects, engineers, interior designers, contracting firms, and other specifiers who often make or significantly influence purchasing decisions. While most of our sales are in the corporate office segment, both new construction and renovation, we also emphasize sales in other segments, including retail space, government institutions, schools, healthcare facilities, tenant improvement space, hospitality centers, residences and home office space. Our marketing efforts are enhanced by the established and well-known brand names of our carpet products, including Interface andFLOR.
An important part of our marketing and sales efforts involves the preparation of custom-made samples of requested carpet designs, in conjunction with the development of innovative product designs and styles to meet the customer’s particular needs. In most cases, we can produce samples to customer specifications in less than five days, which significantly enhances our marketing and sales efforts and has increased our volume of higher margin custom or made-to-order sales. In addition, through our websites, we have made it easy to view and request samples of our products. We also use technology which allows us to provide digital, simulated samples of our products, which helps reduce raw material and energy consumption associated with our samples.
We primarily use our internal marketing and sales force to market our carpet products. In order to implement our global marketing efforts, we have product showrooms or design studios in the United States, Canada, Mexico, Brazil, Denmark, England, France, Germany, Spain, the Netherlands, India, Australia, Norway, United Arab Emirates, Russia, Singapore, Hong Kong, Thailand, China and elsewhere. We expect to open offices in other locations around the world as necessary to capitalize on emerging marketing opportunities.
Raw Materials Germany. the COVID-19 pandemic over the course of the year. We believe the principal competitive factors in our primary floorcovering markets are brand recognition, quality, design, service, broad product lines, product performance, marketing strategy, pricing and development. Innovation and increased customization in product design and styling are the principal focus of our product development efforts, the lowest carbon footprint possible and products that help maintain a climate fit for life. Our carbon negative carpet tile features carbon negative materials in the With our new COVID-19 have resulted in delays of construction projects and flooring installations in many regions worldwide, which also have caused fluctuations in our backlog. January 2, 2022. Information About Our Executive Officers Principal Position(s) David B. Foshee Vice President, General Counsel and Secretary Bruce A. Hausmann Vice President and Chief Financial Officer Vice President (President - Americas) Nigel Stansfield Vice President (President - 2001. He was elected to the Board in October 1996 and has served on the Executive Committee of the Board since July 2001. In October 2011, Mr. Hendrix was elected as Chairman of the Board of Directors. Mr. Hendrix retired from the positions of President and Chief Executive Officer in March 2017 (while remaining Chairman of the Board), and subsequently was re-elected as President and Chief Executive Officer in January 2020. companies and is a certified public accountant (inactive status) in the State of California. Africa, and in January 2019 he assumed responsibility for the Asia-Pacific region as well. market. weakened by negative cycles or other factors, including as a result of the continuing COVID-19 pandemic. and manufacturing personnel. us. The market price of our common stock has been volatile and the value of your investment may decline. We are also making significant investments and modifications to our manufacturing facilities, results of operations. These types of events could also affect our suppliers, installers, and customers, which could have a material adverse impact on our business. West Point, Georgia Annual Report on Form 10-K is incorporated by reference herein. High Low Dividends Per Share 2018 First Quarter (through February 16, 2018) 2017 Fourth Quarter Third Quarter Second Quarter First Quarter 2016 Fourth Quarter Third Quarter Second Quarter First Quarter Stock Performance 12/30/12 12/29/13 12/28/14 1/3/16 1/1/17 12/31/17 Interface, Inc. $100 $137 $107 $124 $122 $167 NASDAQ Composite Index $100 $142 $166 $175 $191 $248 Self-Determined Peer Group (14 Stocks) $100 $150 $166 $178 $205 $229 Issuer Purchases of Equity Securities Period(1) Total Number of Shares Purchased Average Price Paid Per Share Total Number of Shares Purchased as Part of Publicly Announced Plans or Programs(2) Approximate Dollar Value of Shares that May Yet Be Purchased Under the Plans or Programs(2) October 2 - 31, 2017 November 1 – 30, 2017 (3) December 1 – 31, 2017 Total 2017 2016 2015 2014 2013 Net sales Cost of sales Operating income(1) Net income(2) Income from continuing operations per common share attributable to Interface, Inc. Basic Diluted Average Shares Outstanding Basic Diluted Cash dividends per common share Property additions Depreciation and amortization(3) Working capital Total assets Total long-term debt Shareholders’ equity Current ratio(4) market segments for the last three fiscal years by reportable segment. 2020. 2017 2016 2015 (in millions) Impact of changes in foreign currency on net sales Impact of changes in foreign currency on operating income Fiscal Year 2017 2016 2015 Net sales Cost of sales Gross profit on sales Selling, general and administrative expenses Restructuring and asset impairment charges Operating income Interest/Other expense Income before income tax expense Income tax expense Net income Fiscal Year Percentage Change 2017 2016 2015 2017 compared 2016 compared (in thousands) with 2016 with 2015 Net Sales 2020 Consolidated Cost and Expenses Cost and Expenses Fiscal Year Percentage Change 2017 2016 2015 2017 compared with 2016 2016 compared with 2015 (in thousands) Cost of Sales Selling, General and Administrative Expenses Total net sales was partially offset by productivity efficiencies during the year. Management believes it is reasonably likely the inflationary pressures experienced in 2021 will continue to some degree in 2022, particularly in the first half of 2022. COVID-19. AOI for 2020. We anticipate that our liquidity is sufficient to meet our obligations for the next 12 months and we expect to generate sufficient cash to meet our long-term obligations. 2022 to be approximately $30 million, although we are not committed to these amounts. of Senior Notes outstanding. and (2) a decrease in dividends paid of $9.8 million. cost of borrowing cash overnight collateralized by U.S. Treasury securities. We have exposure to LIBOR-based financial instruments under the Facility, which has variable (or floating) interest rates based on LIBOR. The Facility allows for the use of an alternative benchmark rate if LIBOR is no longer available. As of January 2, 2022, the weighted average interest rate on borrowings outstanding under the Facility was 1.91%. Payments Due by Period Total Payments Due Less than 1 year 1-3 years 3-5 years More than 5 years (in thousands) Long-Term Debt Obligations Operating Lease Obligations(1) Expected Interest Payments(2) Unconditional Purchase Obligations(3) Pension Cash Obligations(4) Total Contractual Cash Obligations(5) (6) and Estimates Impairment of Long-Lived Assets.Long-lived assets are reviewed for impairment at the asset group level whenever events or changes in circumstances indicate that the carrying value may not be recoverable. If the sum of the expected future undiscounted cash flow is less than the carrying amount of the asset, an impairment is indicated. A loss is then recognized for the difference, if any, between the fair value of the asset (as estimated by management using its best judgment) and the carrying value of the asset. Management’s judgement in estimating the undiscounted cash flows based on market conditions and trends, and other industry specific metrics used in determining the fair value is subject to uncertainty. If actual market value is less favorable than that estimated by management, additional write-downs may be required. impacted. used in the fair value determination are subject to judgement. During the fourth quarters of However, the full extent of the future impact of COVID-19 on the Company’s operations is uncertain, and a prolonged COVID-19 pandemic could result in additional impairment of goodwill. If the actual fair value of the goodwill is determined to be less than that estimated, an additional write-down may be required. Pension Benefits.Net pension expense recorded is based on, among other things, assumptions about the discount rate, estimated return on plan assets and salary increases. While management believes these assumptions are reasonable, changes in these and other factors and differences between actual and assumed changes in the present value of liabilities or assets of our plans above certain thresholds could cause net annual expense to increase or decrease materially from year to year. The actuarial assumptions used in our salary continuation plan and our foreign defined benefit plans reporting are reviewed periodically and compared with external benchmarks to ensure that they appropriately account for our future pension benefit obligation. The expected long-term rate of return on plan assets assumption is based on weighted average expected returns for each asset class. Expected returns reflect a combination of historical performance analysis and the forward-looking views of the financial markets, and include input from actuaries, investment service firms and investment managers. The table below represents the changes to the projected benefit obligation as a result of changes in discount rate assumptions: Foreign Defined Benefit Plans Increase (Decrease) in Projected Benefit Obligation (in millions) 1% increase in actuarial assumption for discount rate 1% decrease in actuarial assumption for discount rate Domestic Salary Continuation Plan Increase (Decrease) in Projected Benefit Obligation (in millions) 1% increase in actuarial assumption for discount rate 1% decrease in actuarial assumption for discount rate Contents Recent Accounting Pronouncements There were no active derivative instruments as of January 2, 2022. 2020. in 2021. 2018 2019 2020 2021 Thereafter Total Fair Value (in thousands) Rate-Sensitive Liabilities Long-term Debt: Variable Rate Variable Interest Rate January 2, 2022 and January 3, 2021 was 1.91% and 1.89%, respectively. The carrying value of the Company’s borrowings under our Syndicated Credit Facility approximates fair value as the Facility bears variable interest rates that are similar to existing market rates. Based on a hypothetical immediate 100 basis point increase in interest rates, with all other variables held constant, the fair value of our fixed rate long-term debt would be impacted by a net decrease of $10.8 million. Conversely, a 100 basis point decrease in interest rates would result in a net increase in the fair value of our fixed rate long-term debt of $6.0 million. ITEM 8. FINANCIAL STATEMENTS AND SUPPLEMENTARY DATA FISCAL YEAR 2017 2016 2015 (in thousands, except per share data) Net sales Cost of sales Gross profit on sales Selling, general and administrative expenses Restructuring and asset impairment charges Operating income Interest expense Other expense (income) Income before income tax expense Income tax expense Net income Net income per share – basic Net income per share – diluted Basic weighted average common shares outstanding Diluted weighted average common shares outstanding INTERFACE, INC. AND SUBSIDIARIES FISCAL YEAR 2017 2016 2015 (in thousands) Net income Other comprehensive income (loss), after tax Foreign currency translation adjustment Cash flow hedge change in net unrealized gains (losses) Pension liability adjustment Comprehensive income INTERFACE, INC. AND SUBSIDIARIES END OF FISCAL YEAR 2017 2016 (in thousands) ASSETS Current Cash and cash equivalents Accounts receivable, net Inventories, net Prepaid expenses and other current assets Total current assets Property and equipment, net Deferred tax asset Goodwill, net Other assets LIABILITIES AND SHAREHOLDERS’ EQUITY Current liabilities Accounts payable Accrued expenses Current portion of long-term debt Total current liabilities Long term debt Deferred income taxes Other Total liabilities Commitments and contingencies Shareholders’ equity Preferred stock Common stock Additional paid-in capital Retained earnings Accumulated other comprehensive loss – foreign currency translation Accumulated other comprehensive income – cash flow hedge Accumulated other comprehensive loss – pension liability Total shareholders’ equity Total liabilities and shareholders’ equity INTERFACE, INC. AND SUBSIDIARIES FISCAL YEAR 2017 2016 2015 (in thousands) Net income Adjustments to reconcile income to cash provided by operating activities Depreciation and amortization Stock compensation amortization expense Enactment of U.S. Tax Cuts and Jobs Act expenses Bad debt expense Deferred income taxes and other Working capital changes: Accounts receivable Inventories Prepaid expenses and other current assets Accounts payable and accrued expenses Cash provided by operating activities INVESTING ACTIVITIES: Capital expenditures Other Cash used in investing activities FINANCING ACTIVITIES: Credit facility borrowing Credit facility repayments Term loan repayments Repurchase of common stock Dividends paid Tax Withholding Payments for Share-Based Compensation Debt issuance costs Proceeds from issuance of common stock Cash provided by (used in) financing activities Net cash provided by (used in) operating, investing and financing activities Effect of exchange rate changes on cash CASH AND CASH EQUIVALENTS: Net increase (decrease) Balance, beginning of year Balance, end of year the nora acquisition, and integration of its European and Asia-Pacific commercial areas, and determined that it has 2 operating and reportable segments – namely Americas (“AMS”) and Europe, Africa, Asia and Australia (collectively “EAAA”). The AMS operating segment is unchanged from prior year and continues to include the United States, Canada and Latin America geographic areas. See Note 20 entitled “Segment Information” for additional information. Handling Cash, Cash Equivalents and Short-Term Investments 3, 2021. Property and Equipment and Long-Lived Assets amount. During the fourth quarters of BALANCE JANUARY 1, 2017 ACQUISITIONS IMPAIRMENT FOREIGN CURRENCY TRANSLATION BALANCE DECEMBER 31, 2017 (in thousands) rates and classified as level 2 within the fair value hierarchy. See Note 5 entitled “Fair Value of Financial Instruments” for further information. Stock-Based Compensation “Shareholders' Equity.” 2019. the same category as the cash flows from the items being hedged. follows: COVID-19 pandemic under the NOW program enacted in the Netherlands. Revenue from sales of carpet, modular resilient flooring, rubber flooring, and other flooring-related material was approximately 98% of total revenue for 2021, 2020 and 2019. The remaining 2% of revenue was generated from the installation of carpet and other flooring-related material in 2021, 2020 and 2019. Inventories are summarized as END OF FISCAL YEAR 2017 2016 (in thousands) Finished goods Work-in-process Raw materials Property, plant and equipment consisted of the following: END OF FISCAL YEAR 2017 2016 (in thousands) Land Buildings Equipment Accumulated depreciation END OF FISCAL YEAR 2017 2016 (in thousands) Compensation Interest Restructuring Taxes Accrued purchases Warranty and sales allowances Other Long-term debt consisted of the following: the Company is required to make quarterly amortization payments of the term loan borrowings. The amortization payments are due on the last day of the calendar quarter. principal amount plus accrued and unpaid interest, if any, to (but excluding) the redemption date, plus a make-whole premium. If the Company experiences a change of control, the Company will be required to offer to purchase the Senior Notes at 101% of their principal amount, plus accrued and unpaid interest to (but excluding) the date of repurchase. payable. $0.4 million, and $0.4 million, respectively. FISCAL YEAR AMOUNT (in thousands) 2018 2019 2020 2021 2022 Thereafter NOTE The program. The following tables depict the activity in the accounts which make up SHARES AMOUNT ADDITIONAL PAID-IN CAPITAL RETAINED EARNINGS (DEFICIT) PENSION LIABILITY FOREIGN CURRENCY TRANSLATION ADJUSTMENT (in thousands) Balance, at December 28, 2014 Net income Stock issuances under employee option plans Other issuances of common stock Unamortized stock compensation expense related to restricted stock awards Cash dividends paid Forfeitures and compensation expense related to stock awards Share repurchases Pension liability adjustment Foreign currency translation adjustment Other Balance, at January 3, 2016 SHARES AMOUNT ADDITIONAL PAID-IN CAPITAL RETAINED EARNINGS (DEFICIT) PENSION LIABILITY FOREIGN CURRENCY TRANSLATION ADJUSTMENT (in thousands) Balance, at January 3, 2016 Net income Stock issuances under employee plans Other issuances of common stock Unamortized stock compensation expense related to restricted stock awards Cash dividends paid Forfeitures and compensation expense related to stock awards Share Repurchases Pension liability adjustment Foreign currency translation adjustment Windfall tax benefit - share-based payment awards Other Balance, at January 1, 2017 SHARES AMOUNT ADDITIONAL PAID-IN CAPITAL RETAINED EARNINGS (DEFICIT) PENSION LIABILITY FOREIGN CURRENCY TRANSLATION ADJUSTMENT CASH FLOW HEDGE (in thousands) Balance, at January 1, 2017 Net income Stock issuances under employee plans Other issuances of common stock Unamortized stock compensation expense related to restricted stock awards Cash dividends paid Forfeitures and compensation expense related to stock awards Share Repurchases Pension liability adjustment Foreign currency translation adjustment Cash flow hedge unrealized gain (loss) Adoption of new accounting standard - share-based payment awards Balance, at December 31, 2017 Shares Weighted Average Exercise Price Outstanding at January 1, 2017 Granted Exercised Forfeited or cancelled Outstanding at December 31, 2017 (a) Exercisable at December 31, 2017 (b) forfeited during the period. The expense related to awards of restricted stock is captured in SG&A expenses on the consolidated statements of operations. Shares Weighted Average Grant Date Fair Value Outstanding at January 1, 2017 Granted Vested Forfeited or cancelled Outstanding at December 31, 2017 Performance Share Awards The Company evaluates the probability of achieving the performance-based goals as of the end of each reporting period and adjusts compensation expense based on this assessment. Performance Shares Weighted Average Grant Date Fair Value Outstanding at January 1, 2017 Granted Vested Forfeited or canceled Outstanding at December 31, 2017 will be recognized by the end of 2024. Fiscal Year 2017 2016 2015 Earnings per share: Basic earnings per share Distributed earnings Undistributed earnings Diluted earnings per share Distributed earnings Undistributed earnings The following table Fiscal Year 2017 2016 2015 (in millions) Net income attributable to participating securities Total Restructuring Charge Costs Incurred in 2016 Costs Incurred in 2017 Balance at Dec. 31, 2017 (in thousands) Workforce Reduction Asset Impairment Lease Exit Costs FISCAL YEAR 2017 2016 2015 (in thousands) Current expense/(benefit): Federal Foreign State Deferred expense/(benefit): Federal Foreign State FISCAL YEAR 2017 2016 2015 (in thousands) U.S. operations Foreign operations 2017 2016 ASSETS LIABILITIES ASSETS LIABILITIES (in thousands) Basis differences of property and equipment Basis difference of intangible assets Foreign currency Net operating loss carryforwards Valuation allowances on net operating loss carryforwards Federal tax credits Deferred compensation Basis difference of inventory Basis difference of prepaids, accruals and reserves Pensions Foreign withholding taxes on unremitted earnings Undistributed earnings from foreign subsidiaries not deemed to be indefinitely reinvested Basis difference of other assets and liabilities FISCAL YEAR 2017 2016 (in thousands) Deferred tax asset (non-current asset) Deferred income taxes (non-current liabilities) As of FISCAL YEAR 2017 2016 2015 (in thousands) Income taxes at U.S. federal statutory rate Increase (decrease) in taxes resulting from: State income taxes, net of federal tax effect Non-deductible business expenses Non-deductible employee compensation Tax effects of Company owned life insurance One-time transition tax on foreign earnings Remeasurement of net Deferred Tax Asset Tax effects of undistributed earnings from foreign subsidiaries not deemed to be indefinitely reinvested Foreign and U.S. tax effects attributable to foreign operations Valuation allowance effect – State NOL Federal tax credits Other Income tax expense FISCAL YEAR 2017 2016 2015 (in thousands) Balance at beginning of year Increases related to tax positions taken during the current year Decreases related to tax positions taken during the prior years Decreases related to settlements with taxing authorities Decreases related to lapse of applicable statute of limitations Changes due to foreign currency translation Balance at end of year FISCAL YEAR AMOUNT (in thousands) 2018 2019 2020 2021 2022 Thereafter Defined Contribution and Deferred Compensation Plans Under the 2019, a plan amendment was executed to eliminate future service accruals in our defined benefit pension plan in the Netherlands (the “Dutch Plan”), which resulted in a curtailment of the plan. The Dutch Plan remains in existence and continues to pay vested benefits. Active participants no longer accrue benefits after December 31, 2019, and instead participate in the Industry-Wide Pension Fund (the “IWPF”) multi-employer plan beginning in fiscal year 2020. During 2021 and 2020, the Company recorded multi-employer pension expense related to multi-employer contributions of $2.6 million and $2.5 million, respectively. The Company’s contributions into the IWPF are less than 5% of total plan contributions. The IWPF is more than 95% funded at the end of 2020, which is the latest date plan information is available. The IWPF multi-employer plan is not considered to be significant based on the funded status of the plan and our contributions. In the next fiscal year, approximately $1.4 million will be reclassified from accumulated other comprehensive loss into net periodic benefit cost. FISCAL YEAR 2017 2016 (in thousands) Change in benefit obligation Benefit obligation, beginning of year Service cost Interest cost Benefits and expenses paid Actuarial loss (gain) Member contributions Currency translation adjustment Benefit obligation, end of year FISCAL YEAR 2017 2016 (in thousands) Change in plan assets Plan assets, beginning of year Actual return on assets Company contributions Benefits paid Currency translation adjustment Plan assets, end of year Reconciliation to balance sheet Funded status benefit asset/(liability) Amounts recognized in accumulated other comprehensive income (after tax) Unrecognized actuarial loss Unamortized prior service costs Total amount recognized Accumulated Benefit Obligation The above disclosure represents the aggregation of information related to the END OF FISCAL YEAR 2017 2016 (in thousands) Projected Benefit Obligation Accumulated Benefit Obligation Plan Assets Dutch Plan Projected Benefit Obligation Accumulated Benefit Obligation Plan Assets FISCAL YEAR 2017 2016 2015 (in thousands) Components of net periodic benefit cost Service cost Interest cost Expected return on plan assets Amortization of prior service cost Recognized net actuarial (gains)/losses Net periodic benefit cost 3, 2021. Under the express terms of the Contract, contract value is the greater of (i) the value of the discounted vested benefits of the Dutch Plan 2021 and 2020 is not significant. FISCAL YEAR 2018 2017 2016 Target Allocation Percentage of Plan Assets at Year End Asset Category: Equity Securities Debt and Debt Securities Other Pension Plan Assets by Category as of December 31, 2017 Dutch Plan UK Plan Total (in thousands) Level 1 Level 2 Level 3 Total Pension Plan Assets by Category as of January 1, 2017 Dutch Plan UK Plan Total (in thousands) Level 1 Level 2 Level 3 Total 2017 Level 1 Level 2 Level 3 (in thousands) Asset Class Equity Securities Debt and Debt Securities Other (including cash) 2016 Level 1 Level 2 Level 3 (in thousands) Asset Class Equity Securities Debt and Debt Securities Other (including cash) 2021 and 2020: 2017 (in thousands) Balance of level 3 assets, beginning of year Interest cost Benefits paid Assets transferred in to (out of) Level 3 Actuarial gain (loss) Translation adjustment Ending Balance of level 3 assets FISCAL YEAR EXPECTED PAYMENTS (in thousands) 2018 2019 2020 2021 2022 FISCAL YEAR 2017 2016 (in thousands) Change in benefit obligation Benefit obligation, beginning of year Service cost Interest cost Benefits paid Actuarial loss (gain) Benefit obligation, end of year The amounts recognized in the consolidated balance sheets are as follows: 2017 2016 (in thousands) Current liabilities Non-current liabilities 2017 2016 (in thousands) Unrecognized actuarial loss 2017 2016 2015 (in thousands, except for assumptions) Assumptions used to determine net periodic benefit cost Discount rate Rate of compensation Assumptions used to determine benefit obligations Discount rate Rate of compensation Components of net periodic benefit cost Service cost Interest cost Amortizations Net periodic benefit cost FISCAL YEAR EXPECTED PAYMENTS (in thousands) 2018 2019 2020 2021 2022 AMERICAS EUROPE ASIA- PACIFIC TOTAL (in thousands) 2017 Net Sales Depreciation and amortization Total assets 2016 Net Sales Depreciation and amortization Total assets 2015 Net Sales Depreciation and amortization FISCAL YEAR ENDED 2017 2016 2015 (in thousands) DEPRECIATION AND AMORTIZATION Total segment depreciation and amortization Corporate depreciation and amortization Reported depreciation and amortization ASSETS Total segment assets Corporate assets and eliminations Reported total assets FISCAL YEAR 2017 2016 2015 (in thousands) SALES TO UNAFFILIATED CUSTOMERS(1) United States United Kingdom Australia Other foreign countries Net sales LONG-LIVED ASSETS(2) United States United Kingdom Netherlands Australia Thailand China Other foreign countries Total long-lived assets NOTE FISCAL YEAR 2017 FIRST QUARTER(1) SECOND QUARTER THIRD QUARTER FOURTH QUARTER(2) (in thousands, except per share data) Net sales Gross profit Net income Basic income per share Diluted income per share Share prices High Low FISCAL YEAR 2016 FIRST QUARTER SECOND QUARTER THIRD QUARTER FOURTH QUARTER(1) (in thousands, except per share data) Net sales Gross profit Net income Basic income per share Diluted income per share Share prices High Low Report of Independent Registered Public Accounting Firm 2021. Notes to Consolidated Financial Statements (BDO USA, LLP, Atlanta, Georgia, PCAOB ID: 243) 23 24 31.1 31.2 32.1 32.2 101.INS XBRL Instance Document 101.SCH XBRL Taxonomy Extension Schema 101.CAL XBRL Taxonomy Extension Calculation Linkbase 101.LAB XBRL Taxonomy Extension Label Linkbase 101.PRE XBRL Taxonomy Presentation Linkbase 101.DEF XBRL Taxonomy Definition Linkbase COLUMN A BALANCE, AT BEGINNING OF YEAR COLUMN B CHARGED TO COSTS AND EXPENSES (A) COLUMN C CHARGED TO OTHER ACCOUNTS COLUMN D DEDUCTIONS (DESCRIBE) (B) COLUMN E BALANCE, AT END OF YEAR (in thousands) Allowance for Doubtful Accounts: Year Ended: December 31, 2017 January 1, 2017 January 3, 2016 COLUMN A BALANCE, AT BEGINNING OF YEAR COLUMN B CHARGED TO COSTS AND EXPENSES (A) COLUMN C CHARGED TO OTHER ACCOUNTS(B) COLUMN D DEDUCTIONS (DESCRIBE) (C) COLUMN E BALANCE, AT END OF YEAR (in thousands) Restructuring Reserve: Year Ended: December 31, 2017 January 1, 2017 January 3, 2016 COLUMN A BALANCE, AT BEGINNING OF YEAR COLUMN B CHARGED TO COSTS AND EXPENSES (A) COLUMN C CHARGED TO OTHER ACCOUNTS COLUMN D DEDUCTIONS (DESCRIBE) (B) COLUMN E BALANCE, AT END OF YEAR (in thousands) Warranty and Sales Allowances Reserves : Year ended: December 31, 2017 January 1, 2017 January 3, 2016 Daniel T. Hendrix President, Chief Executive Officer and Chairman of the Board and Director March /s/ BRUCE A. HAUSMANN March Bruce A. Hausmann /s/ March /s/ JOHN P. BURKE John P. Burke /s/ /s/ CHRISTOPHER G. KENNEDY Christopher G. Kennedy /s/ JOSEPH KEOUGH K. David Kohler /s/ Sheryl D. PalmerWe distribute our products through two primary channels: (1) direct sales to end users;(2) indirect sales through independent contractors or distributors. In each case, we may also call upon architects, engineers, interior designers, contracting firms and other specifiers who often make or substantially influence purchasing decisions.Manufacturingtwotwo locations in the United States and at facilities in the Netherlands, the United Kingdom, Thailand, China and Australia.Having foreign manufacturing operations enables us to supply our customers with We also have manufactured carpet fromtile at a location in Thailand for many years, but in 2021 we announced that we are closing the location offeringThailand plant (anticipated closure at the most advantageous delivery times, duties and tariffs, exchange rates, and freight expense, and enhances our ability to develop a strong local presence in foreign markets. We believe that the ability to offer consistent products and services on a worldwide basis at attractive prices is an important competitive advantage in servicing multinational customers seeking global supply relationships. We will consider additional locations for manufacturing operations in other partsend of the world as necessary to meet the demandsfirst quarter of customers2022). We manufacture rubber flooring in international markets.–— both regionally and globally –— with the exception of synthetic fiber (nylon yarn). For yarn, we principally rely upon two major global suppliers, but we also have significant relationships with at least two other suppliers. Although our number of principal yarn suppliers is limited, we do have the capability to manufacture carpet using face fiber produced from two separate polymer feedstocks –— nylon 6 and nylon 6,6 –— which provides additional flexibility with respect to yarn supply inputs, if needed. Our global sourcing strategy, including with respect to our principal yarn suppliers and dual polymer manufacturing capability, allows us to help guard against any potential shortages of raw materials or raw material suppliers in a specific polymer supply chain.We have a flexible-inputs carpet backing line, which For rubber flooring, the key polymer raw materials are available from multiple sources, and we call “Cool Blue™”, at our modular carpet manufacturing facility in LaGrange, Georgia. Using next generation thermoplastic technology, the custom-designed backing line dramatically improves our ability to keep reclaimedcan source both synthetic and waste carpet in the production “technical loop,”natural rubber depending on product specification and further permits us to explore other plastics and polymers as inputs. material availability.the Cool Blue process.our CQuestGB carpet backing. This technology, which is part of our ReEntry®2.0 carpet reclamation program, allows us to send some of the reclaimed face fiber back to our fiber supplier to be blended with virgin or other post-industrial materials and extruded into new fiber., Georgia, West Point, Georgia, Northern Ireland, the Netherlands, Thailand (anticipated closure at the end of the first quarter of 2022), China and Australia are certified under International Standards Organization (ISO) Standard No. 14001.Our significant international operations are subject Nora’s manufacturing facility, which is located in Weinheim, Germany, is ISO14001 certified as well and sells the majority of its products with the Blauer Engel label. Blauer Engel is the leading German institute that recognizes products that have environmentally friendly aspects.various political, economicend users; and (2) indirect sales through independent contractors, installers and distributors. We have traditionally focused our carpet marketing strategy on major accounts, seeking to build lasting relationships with national and multinational end-users, and on architects, interior designers, engineers, contracting firms, and other uncertainties,specifiers who often make or significantly influence purchasing decisions. While the corporate office market segment, including risksnew construction and renovation, is our largest, we also emphasize sales in other market segments, including schools and educational facilities, government institutions, retail space, healthcare facilities, tenant improvement space, hospitality centers, residences and home office space. Our marketing efforts are enhanced by the established and well-known brand names of restrictive taxation policies, foreign exchange restrictions, changing political conditionsour carpet products, including Interface and governmental regulations.FLOR, as well as the strength of the nora rubber flooring brands of noraplan and norament.receive a substantial portionuse technology which allows us to provide digital, simulated samples of our products, which helps reduce raw material and energy consumption associated with our samples.in currencies other than U.S. dollars, which makes us subjectand profitability by pursuing the following key initiatives:risks inherenteconomic cyclicality of the corporate office segment, and it has become a principal strategy generally for growing our business and enhancing profitability. currency translations. Althoughthe high growth LVT market, we plan to expand our LVT product offerings while also seeking to introduce new products in the resilient flooring category, such as rigid core LVT that was launched in early 2022. We believe our ability to manufactureoffer and shipsell our soft and hard surfaces in an integrated flooring design helps meet the needs of our customers by complementing and enhancing our carpet tile portfolio with true modular installation, no transition strips between surfaces, carpet tile and resilient products that are in some cases the same size and shape, and favorable acoustic properties. Our acquisition of nora, with its rubber flooring products, is also a key component of our strategy in this area.facilities in several foreign countries reduces the riskseconomic impacts of foreign currency fluctuations we might otherwise experience, we also engage from time to time in hedging programs intended to further reduce those risks.We believe we are the largest manufacturer of modular carpet in the world. However, aA number of domestic and foreign competitors manufacture modular carpet as one segment of their business, and some of these competitors have financial resources greater than ours. In addition, some of the competing carpet manufacturers have the ability to extrude at least some of their requirements for fiber used in carpet products, which decreases their dependence on third party suppliers of fiber.8pricing.sustainability. In the corporate office market segment, modular carpet competes with various floorcoverings of whichincluding broadloom carpet, is the most common. LVT and polished concrete. We believe the quality, service, design, better and longer average product performance, flexibility (design options, selective rotation or replacement, use in combination with our LVT or roll goods)resilient products), environmental footprint and convenience of our modular carpet are our principal competitive advantages.LVTresilient products to our customers. Additionally, we believe that our global carpet tile manufacturing capabilities are an important competitive advantage in serving the needs of multinational corporate customers. We believe that the incorporation of theIntersept antimicrobial chemical agent into the backing of some modular carpet products enhances our ability to compete successfully across allsome of our market segments generally, and specifically with resilient tile in the healthcare market.In addition, we believe that our environmentalsegments.and commitment to eliminate our negative impact on the environment by 2020 isare a brand-enhancing, competitive strength as well as a strategic initiative. Our customers are increasingly concerned about the environmental and broader ecological implications of their operations and the products they use in them. Our leadership, knowledge and expertise in the area, especially in the “green building” movement and related environmental certification programs, resonate deeply with many of our customers and prospects around the globe. Our modular carpet products historically have had inherent installation and maintenance advantages that have translated into greater efficiency and waste reduction. We are using raw materials and production technologies, such as our Cool Blue backing line and our ReEntry 2.0 reclaimed carpet separation process and our new CQuest backings, that directly reduce the adverse impact of those operations on the environment and limit our dependence on petrochemicals.80150 people and also draw on the research and development efforts of our suppliers, particularly in the areas of fibers, yarns and modular carpet backing materials. Our research and development costs were $14.0 million, $14.3 million, and $14.5 million in 2017, 2016, and 2015, respectively.OurThe research and development team provides us with technical support and advanced materials research and development for us. The team assisted in the development of ourpost-consumer recycled content, polyvinyl chloride, or PVC, extruded sheet process that has been incorporated into our GlasBacRE modular carpet backing. Our post-consumer recycled content PVC extruded sheet exemplifies our commitment to “closing-the-loop” in recycling. More recently, this team developed our TacTiles carpet tile installation system, which uses small squares of adhesive plastic film to connect intersecting carpet tiles. The team also helped implement our Cool Blue flexible inputs backing line and our ReEntry 2.0 reclaimed carpet separation technology and post-consumer recycling technology for nylon face fibers. With a goal of supporting sustainable product designs in floorcoverings applications, we continue to evaluate bio-based and renewable polymers for use in our products. Our research and development team also supports the dissemination, consultancies and technical communication of our global sustainability endeavors. This team also provides all biochemical and technical support to Intersept antimicrobial chemical product initiatives., and this focus has led to several design breakthroughs such as our Skinny PlankSkinny Plank products, as well as our i2 product line. Our carpet design and development team is recognized as an industry leader in carpet design and product engineering for the commercial and institutional markets. David Oakey Designs also contributedour ability to efficiently produce many products from a single yarn system. Our mass customization production approach evolved, in major part, from this concept and increases the number and variety of product designs, which in turn enables us to offer products with competitive margins.In the latter part of 1994, we commenced a within our business that we now call Mission Zero,began more than 25 years ago with initiatives aimed at reducing waste, environmental footprint and costs. Mission Zero, which includesWith our QUEST waste reduction initiative, is directed towards the elimination of energy and raw materials waste in our businesses, and, on a broader and more long-term scale, the practical reclamation — and ultimate restoration — of shared environmental resources. The initiative involves a commitment by us:We have engaged some of the world’s leading authorities on global ecology as environmental advisors. The list of advisors includes: Paul Hawken, author of The Ecology of Commerce: A Declaration of Sustainability and The Next Economy, and co-author of Natural Capitalism: Creating the Next Industrial Revolution; Amory Lovins, energy consultant and co-founder of the Rocky Mountain Institute; Bill Browning, fellow and former director of the Rocky Mountain Institute’s Green Development Services; Janine M. Benyus, author of Biomimicry; and Bob Fox, renowned architect.As more customers in our target markets share our view that sustainability is an important factor in making purchasing and design decisions, and not just good deeds, our acknowledged leadership position should strengthen our brands and provide a differentiated advantage in competing for business. To further raise awareness of our goal of becoming sustainable, we launched our Mission Zero global branding initiative, which represents our mission to eliminate any negative impact our companies may have on the environment by the year 2020. In 2016, we launched the recent in which we seek to lead industry in designing and making products in ways that will maintain a climate fit for life. Our Mission Zeroand Climate Take Back logos appear logo appears on many of our marketing and merchandising materials distributed throughout the world.high pointhighlight in our pursuit of sustainability has beenwas our creation with the Zoological Society of London of a program called Net-Works®Net-Works® in which we’vewe worked with communities in the Philippines to collect discarded fishing nets that are damaging a large coral reef, and divert them to our yarn supplier where they are recycled into new carpet fiber. Net-Works provides a source of income for members of these communities in the Philippines, while also cleaning up the beaches and waters where they live and work. Our Net Effect Collection of carpet tile products, among others, contains yarn that is partly made from the recycled fishing nets collected through the Net-Works program. Through 2017, this program has collected more than 142 tons of discarded fishing nets. Net-Works is a big step in redesigning our supply chain from a linear take-make-waste process toward a closed loop system, and it advances our ultimate goal of becoming a restorative enterprise. $122.9 $215.6 million at February 11, 2018,6, 2022, compared with approximately $107.8$177.7 million at February 12, 2017.7, 2021. Historically, backlog is subject to significant fluctuations due to the timing of orders for individual large projects and currency fluctuations. AllDisruptions in supply and distribution chains, global travel restrictions and government shelter in place orders due to the impact of the backlog orders at February 11, 2018 are expected to be shipped during the succeeding six to nine months.Intersept, GlasBac, Mission Zero, CQuest, Climate Take Back, nora, norament, noraplan, nTX solution, noraplan unita, noraplan valua, and Net-Works.TacTiles.Trademark registrations in the United States are valid for a period of 10 years and are renewable for additional 10-year periods as long as the mark remains in actual use. The duration of trademarks registered in other jurisdictions varies.Financial InformationOperating Segmentsliving our values. Our core values represent who we are, how we see the world, how we treat each other and Geographic AreasThe Notes to Consolidated Financial Statements appearing in Item 8our external customers and stakeholders, and how we approach our work every day. These core values are:December 31, 2017,January 2, 2022, we employed a total of 3,0923,646 employees worldwide. Of such employees, 1,781total, 1,463 were clerical, staff, sales, supervisory and management personnel and 1,3112,183 were manufacturing personnel. We also utilized the services of 227251 temporary personnel as of December 31, 2017.production employees in Australia, and the United Kingdom and China are represented by unions. In the Netherlands, a Works Council, the members of which are Interface employees, is required to be consulted by management with respect to certain matters relating to our operations in that country, such as a change in control of Interface Europe B.V. (our modular carpet subsidiary based in the Netherlands), and the approval of the Works Council is required for some of our actions, including changes in compensation scales or employee benefits. The majority of our employees in Germany are represented by a Works Council as well. Our management believes that its relations with the Works Council,Councils, the unions and all of our employees are good.10Environmental Mattersoperations are subject to laws and regulations relating to the generation, storage, handling, emission, transportation and discharge of materials into the environment. The costs of complying with environmental protection laws and regulations have not had a material adverse impact on our financial condition or results of operations in the past and are not expected to have a material adverse impact in the future. The environmental management systems of our floorcovering manufacturing facilities in LaGrange, Georgia, West Point, Georgia, Northern Ireland, the Netherlands, Thailand, China and Australia are certified under ISO Standard No. 14001.of the RegistrantDecember 31, 2017,January 2, 2022, and their principal positions with us are set forth below. Executive officers serve at the pleasure of the Board of Directors.NameAgePrincipal Position(s)Jay D. Gould58Daniel T. Hendrix 67 President and Chief Executive Officer Robert A. Coombs59Senior Vice President (President - Asia-Pacific)4748Matthew J. Miller49Kathleen R. Owen54Vice President and Chief Human Resources OfficerJ. Chadwick Scales54Vice President and Chief Marketing, Innovation & Design Officer50Europe)Gould Hendrixjoined us as Executive Vice President and Chief Operating Officer in January 2015, was promoted to President and Chief Operating Officer in January 2016, and was promoted to Chief Executive Officer effective March 3, 2017. From 2012 to January 2015, Mr. Gould was the Chief Executive Officer of American Standard Brands,1983 after having worked previously for a kitchen and bath products company. Prior to his employment with American Standard Brands, Mr. Gould held senior executive roles at Newell Rubbermaid Inc., a global marketer of consumer and commercial products, serving as President of its Home & Family business group from 2008 to 2012 and President of its Parenting Essentials business group from 2006 to 2008. He also previously held executive level positions at The Campbell Soup Company (2002-2006) and The Coca-Cola Company (1995-2002).Mr. Coombs originally worked for us from 1988 to 1993 as a marketing manager for our Heuga carpet tile operations in the United Kingdom and later for all of our European floorcovering operations. In 1996, Mr. Coombs returned to us as Managing Director of our Australian operations. He was promoted in 1998 to Vice President-Sales and Marketing, Asia-Pacific, with responsibility for Australian operations and sales and marketing in Asia, which was followed by a promotion to Senior Vice President, Asia-Pacific.national accounting firm. He was promoted to Treasurer in 1984, Chief Financial Officer in 1985, Vice President-Finance in 1986, Senior Vice President European Sales, in May 1999 and SeniorOctober 1995, Executive Vice President European Salesin October 2000, and Marketing, in April 2000. In February 2001, he was promoted to President of Interface Overseas Holdings, Inc. with responsibility for all of our floorcoverings operations in both Europe and the Asia-Pacific region, and he became a Vice President of Interface. In September 2002, Mr. Coombs relocated back to Australia, retaining responsibility for our floorcovering operations in the Asia-Pacific region while another executive assumed responsibility for floorcovering operations in Europe. Mr. Coombs was promoted to Senior Vice President of InterfaceChief Executive Officer in July 2008.Refreshment Services business unitDirect Store Delivery segment since 2014. Prior to joining Aramark, he served as Vice President and Segment Controller for the Interactive Media Group of The Walt Disney Company, which he joined in 2002. He has also previously held finance and controller positions with several software and internet companies.Miller Poppensjoined us in June 2015 as Vice President and Chief Strategy Officer, and became President2017 to lead the restructuring of our AmericasFLOR business in June 2016. He came to Interface from American Standard Brands, where he was Senior Vice President of Innovation and Strategy from April 2013 to May 2015. Mr. Miller also was an independent consultant to American Standard Brands from February 2012 to April 2013. Previously, he served as Global Vice President-Finance of the Juvenile Products Segment of Newell Rubbermaid Inc. from 2008 to 2011, and as Director of Strategy and Corporate Development for Newell Rubbermaid from 2006-2008. He also has worked with a number of other global organizations, including Kraft Foods and Zyman Group.Ms. Owen joined us in June 2015 as Vice President and Chief Human Resources Officer. Ms. Owen is responsible for the development and oversight of human resources strategies and initiatives for talent management, organization development, learning, compensation, culture and diversity for Interface associates, globally. She came to Interface from Taylor Morrison Home Corporation, a publicly traded North American real estate developer and home builder, where shethen served as Vice President of Human Resources from June 2005 to December 2014. Prior to that, she held several human resources positions with experience across the U.S.Corporate Marketing and Europe with companies including McKesson Technology Solutions, Check-Free Corporation and Lanier Worldwide.Mr. Scales joined us in April 2016 as Vice President and Chief Innovation Officer with responsibility for the Company’s innovation strategy and platforms globally. In August 2016, he also becamewas responsible for the Company’s marketing and designglobal andglobal product commercialization planning as well as leading the FLOR business. He was named Chief Marketing, Innovation and Design Officer. Prior to Interface, Mr. Scales served as Senior Vice President and General Manager for the Consumer Packaged Goods division of FOCUS Brands Inc.our Americas business in February 2020. Prior to joining FOCUS Brands,us, Mr. Scales was Global Vice PresidentPoppens held leadership roles at Newell Rubbermaid, Kellogg Company, REI, and Coca-Cola. MRP manufacturing software systems at seven of our manufacturing plants. In 1999, he returned to Firth Carpets as Operations Director. In 2002, he became a member of our European research and development team focusing on our sustainability initiatives, and in 2004, he became Product and Innovations Director for all of our European Operations. In 2010, he joined our European management team as Senior Vice President of Product, Design and Innovation, before being named Vice President and Chief Innovations Officer for the Company in March 2012. In December 2016, he became President of our business serving Europe, the Middle East and Africa. annual reportAnnual Report on Form 10-K, quarterly reports on Form 10-Q, current reports on Form 8-K and amendments to those reports filed or furnished pursuant to Section 13(a) or 15(d) of the Securities Exchange Act of 1934 as soon as reasonably practicable after we electronically file such material with, or furnish it to, the SEC. Our Internet address is http://www.interface.com. The SEC maintains a website that contains annual, quarterly and current reports, proxy statements and other information that issuers (including the Company) file electronically with the SEC. The SEC’s website is http://www.sec.gov.Factors”.Factors.”12stock.stock.Any or all of the following risk factors could have a material adverse effecton our business, financial condition, results of operations and prospects.Salesand construction of commercial and institutional buildings.country’scountry’s or region’s general economy, prevailing interest rates and other factors that lead to cost control measures, or reduction in the use of space, by businesses and other users of commercial or institutional space. TheFor example, the COVID-19 pandemic may have cyclical and structural impacts on this activity resulting from job losses for office workers, reductions in the use of coworking spaces, and increases in the number of people working from home. As the COVID-19 pandemic continues, the future of the office, and what the office of the future might look like, is being highly debated by senior executives, commercial real estate firms, architects, designers and other global experts which could adversely affect the amount of money that customers spend on our products. In addition, the effects of cyclicality uponand other factors affecting the corporate office segment tendhave traditionally tended to be more pronounced than the effects upon the institutional segment.on other market segments. Historically, we have generated more sales in the corporate office segment than in any other market.segment. The effects of cyclicality uponand other factors on the new construction segment of the market have also tendtended in the past to be more pronounced than the effects uponon the renovation segment. These effects may recur and could be more pronounced if global economic conditions do not improve or are weakened.manufacturersmanufacturers and manufacturers of other types of floorcovering. Although the industry has experienced significant consolidation, a large number of manufacturers remain in the industry. Moreover, some of our competitors are adding manufacturing capacity into the industry throughout the globe which could increase the amount of supply in the market. Increased capacity at our competitors could result in pricing pressure on our products (including products, like LVT, which may currently carry attractive margins) and less demand for our products, thus adversely affecting both revenues and profitability.havehave greater financial resources than we do. Competing effectively may require us to make additional investments in our product development efforts, manufacturing facilities, distribution network and sales and marketing activities. (including(including experienced sales personnel)and manufacturing personnel), and our lossof any of them could affect us adversely.strongexperienced sales leaders.carpetflooring industry –— particularly in the areas of sales, marketing, operations, product design and management –— could have an adverse impact on our business. We may not be able to easily replace such personnel, particularly if the underlying reasons for the loss make the Company relatively unattractive as an employer.are implementingcontinue to implement a multi-year transformation of our sales organization, including the implementation of standardized processes in whichand systems that our sales force goesuses to go to market, interactsinteract with customers, workswork with architects and the architect and design community and, in general, operatesgeneral, operate day-to-day. We are also implementingcontinue to improve and change the technology tools that the sales force will beis required to use as part of their day-to-day jobs, and new managementmonitor managerial positions that are designed to actively manage and coach the sales force. All of these changes are disruptive, which may create challenges for our sales force to adapt, particularly for long tenured employees, which comprise a large portion of our sales force. There are no guarantees that these efforts will increase sales or improve profitability of the business, or that they will not instead adversely disrupt the business, decrease sales, and decrease overall profitability.Our substantial international operations are subject to various political, economicand other uncertainties that could adversely affect our business results, includingby restrictive taxation or other government regulation and by foreign currencyfluctuations.We have substantial international operations. In 2017, approximately half of our net sales and a significant portion of our production were outside the United States, primarily in Europe and Asia-Pacific. Our corporate strategy includes the expansion and growth of our international business on a worldwide basis. As a result, our operations are subject to various political, economic and other uncertainties, including risks of restrictive taxation policies, changing political conditions and governmental regulations. This includes, for example, the uncertainty surrounding the implementation and effect of the United Kingdom’s June 2016 referendum in which voters approved the United Kingdom’s exit from the European Union, including changes to the legal and regulatory framework that apply to the United Kingdom and its relationship with the European Union. We also make a substantial portion of our net sales in currencies other than U.S. dollars (approximately half of 2017 net sales), which subjects us to the risks inherent in currency translations. The scope and volume of our global operations make it impossible to eliminate completely all foreign currency translation risks as an influence on our financial results. In addition, political unrest, terrorist acts, military conflict and disease outbreaks have increased the risks of doing business abroad generally.13Concerns regardingEuropean sovereign debtand market perceptions about the instability of the euro, the potential re-introduction of individual currencies within the Eurozone, the potential dissolution of the euro entirely, or the U.K. exiting the European Union, could adversely affect our business, results of operations or financial condition.Following the European sovereign debt crisis that began in 2011, concerns still persist regarding the debt burden of certain countries using the euro as their currency (the “Eurozone”) and their ability to meet future financial obligations, the overall stability of the euro and the suitability of the euro as a single currency given the diverse economic and political circumstances in individual Eurozone countries. Despite remedial efforts undertaken by the European Commission and others, these concerns have caused instability in the euro and could lead to the re-introduction of individual currencies in one or more Eurozone countries, or, in more extreme circumstances, the possible dissolution of the euro currency entirely. Should the euro dissolve entirely, the legal and contractual consequences for holders of euro-denominated obligations would be determined by laws in effect at such time. These potential developments, or market perceptions concerning these and related issues, could adversely affect the value of our euro-denominated assets and obligations or increase the risks of foreign currency fluctuations or cause the failure of hedging programs intended to reduce those risks. In addition, concerns over these effects on financial institutions in Europe and globally could have an adverse impact on the capital markets generally, and more specifically on our ability and the ability of our customers, suppliers and lenders to finance our and their respective businesses, to access liquidity at acceptable financing costs, if at all, on the availability of supplies and materials, and on the demand for our products.In addition, the results of a June 2016 referendum vote in the U.K. were in favor of the U.K. exiting the European Union (the “Brexit Vote”). On March 29, 2017, the U.K. notified the European Union of its intention to withdraw pursuant to Article 50 of the Lisbon Treaty. The terms of the withdrawal are subject to a negotiation period that could last at least two years from the withdrawal notification date. The uncertainty leading up to and following the Brexit Vote has had a negative impact on our business and demand for our products in Europe, and particularly in the U.K. In addition, the Brexit Vote has had a detrimental effect, and could have further detrimental effects, on the value of either or both of the euro and the British Pound Sterling, which could negatively impact our business (principally from the translation of sales and earnings in those foreign currencies into our reporting currency of U.S. dollars). Such a development could have other unpredictable adverse effects, including a material adverse effect on demand for office space and our carpet products in the U.K. and in Europe if a U.K. exit leads to economic difficulties in Europe.petroleum-basedour raw materials, shipping costs, duties or tariffs could adversely affectus if we are unable to pass these cost increases through to our customers.manufacturing.manufacturing carpet. Synthetic rubber uses petroleum-based products as feedstock as well. We also incur significant shipping and transport costs to move our products around the globe, and those costs have increased dramatically due to recent global supply chain challenges. While we attempt to match cost increases with corresponding price increases, continued inflation and volatility in the cost of petroleum-based raw materials, transportation and shipping costs could adversely affect our financial results if we are unable to pass through such pricecost increases to our customers.third partythird-party suppliers of synthetic fiber or our sole third partyprimary third-party supplier for luxury vinyl tile (“LVT”) or other key raw materials could have a material adverse effect on us.third partythird-party suppliers of synthetic fiber and a single supplierare largely dependent upon two primary suppliers for our LVT products. The unanticipated termination or interruption of any of our supply arrangements with our current suppliers of synthetic fiber (nylon), our primary suppliers of LVT, or sole supplier of LVT,other key raw material suppliers, including failure by any third party supplier to meet our product specifications, could have a material adverse effect on us because we do not have the capability to manufacture our own fiber for use in our carpet products or our own LVT. Our suppliers may not be able to meet our demand for a variety of reasons, including our inability to forecast our future needs accurately or a shortfall in production by the supplier for reasons unrelated to us, such as work stoppages, acts of war, terrorism, pandemics, epidemics, fire, earthquake, energy shortages, flooding or other natural disasters. The primary manufacturing facility of our largest supplier of LVT is located in South Korea. If any of our supply arrangements with our primary suppliers of synthetic fiber, or our sole supplierprimary suppliers of LVT, isor suppliers of other key raw materials are terminated or interrupted, we likely would incur increased manufacturing costs and experience delays in our manufacturing process (thus resulting in decreased sales and profitability) associated with shifting more of our synthetic fiber purchasing to another synthetic fiber supplier or developing new supply chain sources for LVT. A prolonged inability on our part to source synthetic fiber included in our products, LVT, or LVTother key raw materials on a cost-effective basis could adversely impact our ability to deliver products on a timely basis, which could harm our sales and customer relationships.We have a significant amount of indebtedness, which could have important negativeconsequences to us.Our significant indebtedness could have important negative consequences to us, including:making it more difficult for us to satisfy our obligations with respect to such indebtedness;increasing our vulnerability to adverse general economic and industry conditions;limiting our ability to obtain additional financing to fund capital expenditures, acquisitions or other growth initiatives, and other general corporate requirements;requiring us to dedicate a substantial portion of our cash flow from operations to interest and principal payments on our indebtedness, thereby reducing the availability of our cash flow to fund capital expenditures, acquisitions or other growth initiatives, and other general corporate requirements;limiting our flexibility in planning for, or reacting to, changes in our business and the industry in which we operate;placing us at a competitive disadvantage compared to our less leveraged competitors; andlimiting our ability to refinance our existing indebtedness as it matures.As a consequence of our level of indebtedness, a substantial portion of our cash flow from operations must be dedicated to debt service requirements. In addition, borrowings under our Syndicated Credit Facility have variable interest rates, and therefore our interest expenses will increase if the underlying market rates (upon which the variable interest rates are based) increase. The terms of our Syndicated Credit Facility also limit our ability and the ability of our subsidiaries to, among other things, incur additional indebtedness, pay dividends or make certain other restricted payments or investments in certain situations, consummate certain asset sales, enter into certain transactions with affiliates, create liens, merge or consolidate with any other person, or sell, assign, transfer, lease, convey or otherwise dispose of all or substantially all of our assets. They also require us to comply with certain other reporting, affirmative and negative covenants and meet certain financial tests. If we fail to satisfy these tests or comply with these covenants, a default may occur, in which case the lenders could accelerate the debt as well as any other debt to which cross-acceleration or cross-default provisions apply. Our Syndicated Credit Facility matures in August 2022. We cannot assure you that we would be able to renegotiate, refinance or otherwise obtain the necessary funds to satisfy these obligations.It is important for you to consider that we have a significant amount of indebtedness. We cannot assure you that we will be able to renegotiate or refinance any of our debt on commercially reasonable terms, or at all. If we are unable to refinance our debt or obtain new financing, we would have to consider other options, such as selling assets to meet our debt service obligations and other liquidity needs, or using cash, if available, that would have been used for other business purposes.Thethus cannot predict the market price for our common stock going forward.Our earnings in a future period could be adversely affected by non-cash adjustmentsto goodwill, if a future test of goodwill assets indicates a material impairment ofthose assets.As prescribed by accounting standards governing goodwill and other intangible assets, we undertake an annual review of the goodwill asset balance reflected in our financial statements. Our review is conducted during the fourth quarter of the year, unless there has been a triggering event prescribed by applicable accounting rules that warrants an earlier interim testing for possible goodwill impairment. In the past, we have had non-cash adjustments for goodwill impairment as a result of such testings ($61.2 million in 2008 and $44.5 million in 2007). A future goodwill impairment test may result in a future non-cash adjustment, which could adversely affect our earnings for any such future period.or move operations to new ones.other sites, and change our manufacturing processes. We are also in the process of closing our carpet tile manufacturing facility in Thailand. Large scale changes or moves could disrupt our normal operations, leading to possible loss of productivity, which may adversely affect our results.The company will be moving its corporate headquarters in 2018. The transition and relocation of the company’s headquarters could be disruptive and could create a distraction to management in running day-to-day operations which could adversely affect the business.in LaGrange Georgia. At times this processprocesses, product compositions, and product construction including but not limited to the production of our new disruptive, and theredisruptive. There is also no guarantee that theseour CQuest™ backings will not fail to perform as expected and will not increase warranty claims or customer complaints. These efforts willmay also not yield the financial returns and improvements in the business that we hope to achieve from them. In addition, whileWhile these changes are intended to yield stronger financial results, they could potentially adversely affectimpact our financial results in negative ways due to project delays, business disruption as new facilities and equipment come online, increase customer complaints, or increase warranty claims; all of which could negatively affect our operations, reputation, financial condition and general disruption as we make changes and modifications to our manufacturing facilities and processes. For example, in July 2012, a fire occurred at our manufacturing facility in Picton, Australia, causing extensive damage and rendering the facility inoperable. In January 2014, we commenced operations at a new manufacturing facility in Minto, Australia. We could incur uninsured losses and liabilities arising from such events, including damage to our reputation, and/orand suffer material losses in operational capacity, which could have a material adverse impact on our business, financial condition and results of operations.effect onaffect our business.systems—systems—both software and computer hardware—to operate our business. We rely on these systems to, among other things:● plan the purchase, management and distribution of, and payment for, inventory and raw materials;●Control our production processes;●manage and monitor our distribution network and logistics;●receive, process and ship orders;●manage billing, collections and payables;●manage financial reporting; and●manage payroll and human resources information.15Table of, Contentsand payment for, inventory and raw materials;●natural disasters, like fires;●power loss;●software “bugs”, hardware defects or human error; or●hacking, computer viruses, malware, ransomware or other cyber attacks.Our Rights Agreement could discourage tender offersother transactions for our stock that couldformer employees, or claims relating to intellectual property matters. Litigation might result in shareholders receiving a premium oversubstantial costs and may divert management’s attention and resources, which may adversely affect our business, results of operations and financial condition. An unfavorable judgment against us in any legal proceeding or claim could require us to pay monetary damages. Insurance might not cover such claims, might not provide sufficient payments to cover all the market price for our stock.Our Board of Directors has adopted a Rights Agreement pursuantcosts to which holders of our common stock will be entitled to purchase from us a fraction of a share of our Series B Participating Cumulative Preferred Stock if a third party acquires beneficial ownership of 15%resolve one or more of our common stock without our consent.such claims, and might not continue to be available on terms acceptable to us. In addition, an unfavorable judgment in which the holderscounterparty is awarded equitable relief, such as an injunction, could harm our business, results of our common stock will be entitledoperations and financial condition.purchase the stockItem 3, “Legal Proceedings,” within this Report for additional information related to litigation and claims.an Acquiring Person (as defined in the Rights Agreement) at a discount upon the occurrence of triggering events. These provisions of the Rights Agreement could have the effect of discouraging tender offers or other transactions that could result in shareholders receiving a premium over the market price for our common stock.20,00042,000 square feet of leased space. The following table lists our principal manufacturing facilities and other material physical locations (some locations are comprised of multiple buildings), by reportable segment, all of which we own except as otherwise noted:LocationLocation Floor
Space
(Sq. Ft.)Bangkok, Thailand275,946Craigavon, N. Ireland(1)669,145 80,986717,205 539,545LaGrange, Georgia(1)370,000 322,096Union City, Georgia(1)370,000Valley, Alabama(1)338,086Minto, Australia259,356Scherpenzeel, the Netherlands360,800250,000 299,600109,129 EAAA 275,946 72,200 Minto, Australia 240,000 Scherpenzeel, Netherlands 1,250,960 831,113 China(1)China(1)142,500 142,500__________(1)Leased.7050 locations in over 30more than 25 countries and a number of other distribution facilities in several countries. Most of our sales and marketing locations and many of our distribution facilities are leased.expanding global market demands. Substantially all of our owned properties in the United States are subject to mortgages, which secure borrowings under our Syndicated Credit Facility.16Wesubjecta party to various legal proceedings, whether arising in the ordinary course of business noneor otherwise. The disclosure set forth in Note 18 to the consolidated financial statements included in Item 8 of which we believe are required to be disclosed under this Item 3.MINEMINE SAFETY DISCLOSURES2018,2022, we had 624643 holders of record of our Common Stock. We estimate that there are in excess of 10,0009,000 beneficial holders of our Common Stock. The following table sets forth, for the periods indicated, the high and low sale prices of the Company’s Common Stock on the Nasdaq Global Select Market as well as dividends paid during such periods. $ 26.25 $ 22.10 $ 0.00 $ 25.70 $ 21.21 $ 0.065 22.60 18.30 0.065 21.05 18.15 0.06 19.93 17.18 0.06 $ 19.10 $ 14.59 $ 0.06 18.45 15.02 0.06 18.71 14.56 0.05 18.99 13.70 0.05 On February 21, 2018, our Board also declared a regular quarterly cash dividend of $0.065 per share, payable March 23, 2018 to shareholders of record as of March 9, 2018. specifiesspecify conditions as to when any dividend payments may be made. As such, we may discontinue our dividend payments in the future if our Board determines that a cessation of dividend payments is proper in light of the factors indicated above.17five-year period comprised of the Company’s five preceding fiscal years ended December 31, 2017,January 2, 2022, the Company’s total returns to shareholders (stock price plus(assuming all dividends divided by beginning stock price)were reinvested) with that of (i) all companies listed on the Nasdaq Composite Index, and (ii) aour previous self-determined peer group, comprised primarily of companies in the commercial interiors industry,and (iii) our new self-determined peer group, assuming an initial investment of $100 in each on December 30, 2012January 1, 2017 (the last day of the fiscal year 2012)2016). In 2021, the Company updated its self-determined peer group to exclude FLIR Systems, Inc. and Knoll, Inc. as both of these companies were acquired in 2021 and no longer trade publicly. In determining its peer group companies, the Company considered various factors, including the potential peer’s industry, business model, size and complexity. The Company chose a peer group that it believes provides a robust sample size with minimal revenue dispersion, with companies in similar industries or lines of business or subject to similar economic and business cycles, including companies with a significant international presence that are also focused on sustainability.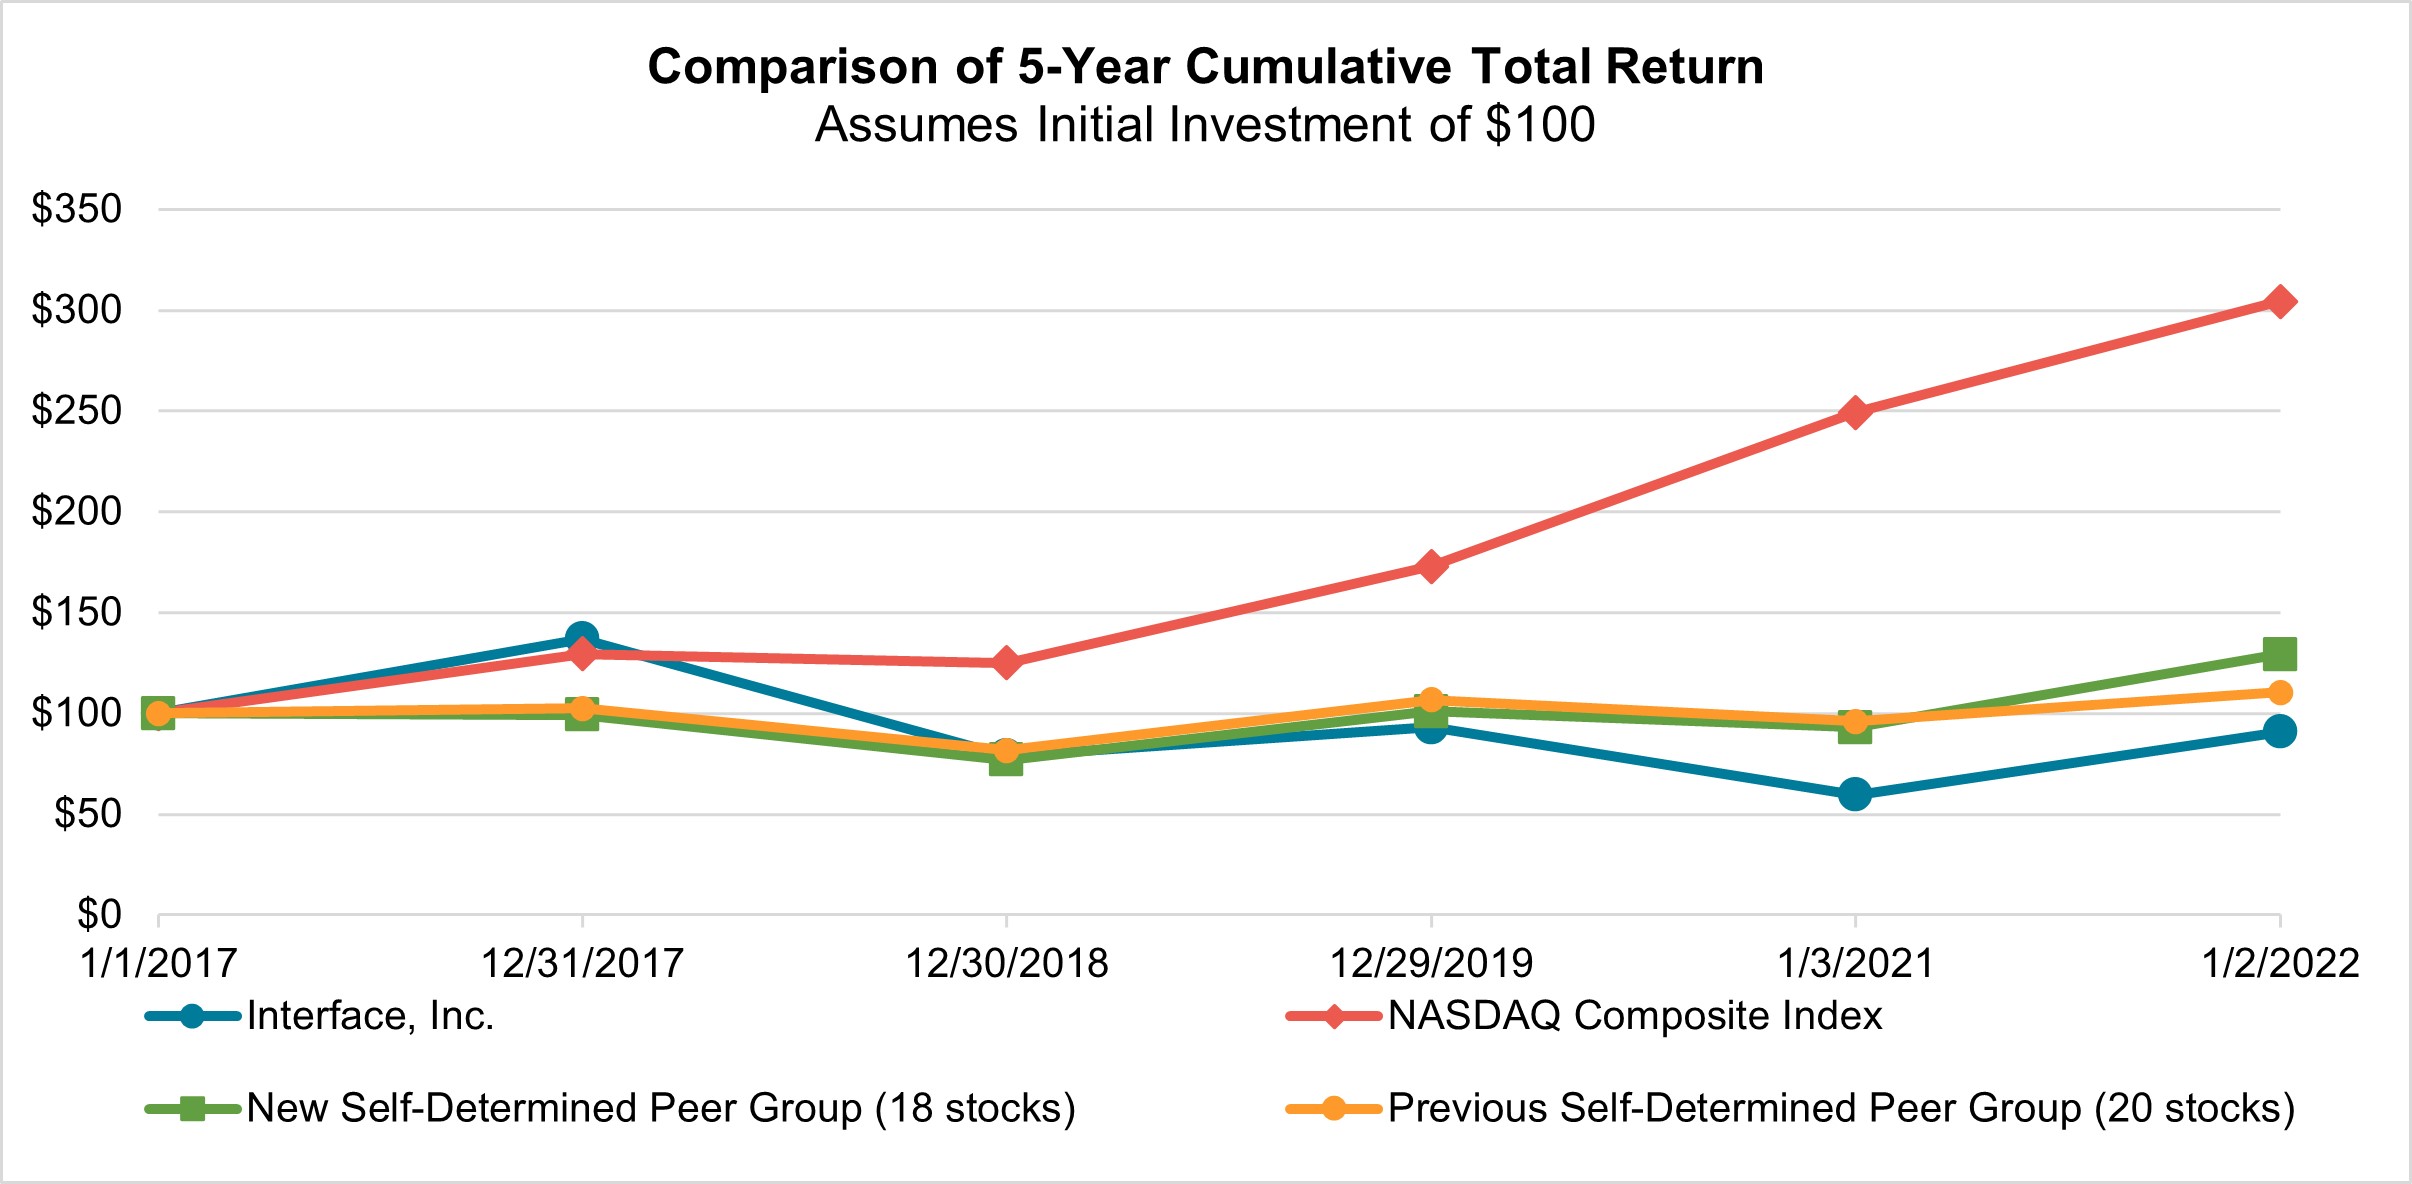

January 1, 2017 December 31, 2017 December 30, 2018 December 29, 2019 January 3, 2021 January 2, 2022 Interface, Inc. $100 $137 $79 $93 $60 $91 NASDAQ Composite Index $100 $130 $125 $173 $249 $304 Previous Self-Determined Peer Group (20 Stocks) $100 $102 $82 $107 $96 $110 New Self-Determined Peer Group (18 Stocks) $100 $99 $77 $101 $93 $129 (1)The lines represent annual index levels derived from compound daily returns that include all dividends.(2)The indices are re-weighted daily, using the market capitalization on the previous trading day.(3)If the annual interval, based on the fiscal year-end, is not a trading day, the preceding trading day is used.(4)The index level was set to $100 as of December 30, 2012 (the last day of fiscal year 2012).(5)The Company’s fiscal year ends on the Sunday nearest December 31.(6)The following companies are included in the Self-Determined Peer Group depicted above: Acuity Brands, Inc.; Albany International Corp.; Apogee Enterprises, Inc.; Armstrong World Industries, Inc.; BE Aerospace, Inc.; The Dixie Group, Inc.; Herman Miller, Inc.; HNI Corporation; Kimball International, Inc.; Knoll, Inc.; Mohawk Industries, Inc.; Steelcase, Inc.; Unifi, Inc.; and USG Corp.IIIIII of this Annual Report on Form 10-K.18The following table contains information with respect toDecember 31, 2017: 0 $ 0.00 0 $ 50,077,293 436,399 23.28 435,399 39,940,933 15,201 23.99 15,201 39,576,216 451,600 $ 23.30 450,600 $ 39,576,216 (1)January 2, 2022.monthly periods identified above correspondCOVID-19 pandemic has had material adverse effects on our business, results of operations, and financial condition, and it is anticipated that this will continue for an indefinite period of time. The duration of the pandemic will ultimately determine the extent to which our operations are impacted. We continue to monitor our operations and have implemented various programs to mitigate the effects on our business including reductions in employees, labor costs, marketing expenses, consulting expenses, travel costs, various other costs, and capital expenditures, as well as reducing the amount of the cash dividend that we pay on our common stock. We continue to focus on the impact COVID-19 has on our employees in accordance with the Company’s ongoing safety measures, as well as any local government orders and “shelter in place” directives in place from time to time.Company’s fiscal fourth quarterCOVID-19 pandemic, we recognized a charge of 2017, which commenced October 2, 2017 and ended December 31, 2017.(2) In April 2017, the Company announced a new share purchase program authorizing the repurchase of up to $100$121.3 million of common stock. This program has no specific expiration date.(3) Includes 1,000 shares acquired by the Company from an employee at a price of $22.75 per share to satisfy income tax withholding obligations in connection with the vesting of a previous grant of an equity award.ITEM 6. SELECTED FINANCIAL DATAWe derived the summary consolidated financial data presented below from our audited consolidated financial statements and the notes thereto for the years indicated. You should read the summary financial data presented below together with “Management’s Discussionimpairment of goodwill and Analysiscertain intangible assets. See Note Financial Condition and ResultsPart II, Item 8 of Operations” and the audited consolidated financial statements and notes thereto included within this document. AmountsAnnual Report for all periods presented have been adjusted for discontinued operations. $ 996,443 $ 958,617 $ 1,001,863 $ 1,003,903 $ 959,989 610,422 589,973 618,974 663,876 618,880 109,844 84,937 113,593 70,295 95,630 53,246 54,162 72,418 24,808 48,255 $ 0.86 $ 0.83 $ 1.10 $ 0.37 $ 0.73 $ 0.86 $ 0.83 $ 1.10 $ 0.37 $ 0.73 61,996 65,098 66,027 66,389 66,194 62,040 65,136 66,075 66,448 66,297 $ 0.25 $ 0.22 $ 0.18 $ 0.14 $ 0.11 30,474 28,071 27,188 38,922 91,851 37,508 36,505 44,751 34,675 32,605 $ 254,221 $ 311,799 $ 245,391 $ 240,881 $ 257,918 800,600 835,439 756,549 774,914 796,335 229,928 270,347 213,531 263,338 273,826 330,091 340,729 342,366 306,639 340,787 2.4 3.0 2.6 2.7 3.0 __________
additional information.(1)The following charges and items are included in our operating income. In 2017, we recorded restructuring and asset impairment charges of $7.3 million. In 2016, we recorded restructuring and asset impairment charges of $19.8 million. In 2014, we recorded restructuring and asset impairment charges of $12.4 million. In 2013, we recorded a gain of approximately $7.0 million related to the final settlement of our insurance claim relating to the Australia fire.(2)Included in 2017 net income are provisional tax charges of $15.2 million due to the recently enacted U.S. Tax Cuts and Jobs Act. Please see Item 8, Note 13 “Taxes on Income” for further discussion of these charges. Included in 2014 net income is $9.2 million of pre-tax expenses related to the premium paid to redeem senior note debt as well as $2.8 million related to the unamortized debt cost that related to these notes at redemption. Included in the 2013 net income are $1.7 million of expenses related to the retirement of debt, and a one-time tax dispute resolution benefit of $1.9 million.(3)Includes stock compensation amortization. (4)Current ratio is the ratio of current assets to current liabilities.20Executive OverviewMANAGEMENT’S DISCUSSION AND ANALYSIS OF FINANCIAL CONDITION AND RESULTS OF OPERATIONSGeneralOurand luxury vinyl tile (“LVT”). and rubber flooring products. Our business, as well as the commercial interiors industry in general, is cyclical in nature and is impacted by economic conditions and trends that affect the markets for commercial and institutional business space. The commercial interiors industry, including the market for floorcovering products, is largely driven by reinvestment by corporations into their existing businesses in the form of new fixtures and furnishings for their workplaces. In significant part, the timing and amount of such reinvestments are impacted by the profitability of those corporations. As a result, macroeconomic factors such as employment rates, office vacancy rates, capital spending, productivity and efficiency gains that impact corporate profitability in general, also affect our business.Mostcustomersinclude the United States, Canada and Latin America geographic areas. See Note 20 entitled “Segment Information” included in the corporate office marketItem 8 of this Annual Report on Form 10-K for additional information. The results of operations discussion below also includes segment but we alsoinformation.Our mixMore than half of corporate office versusour consolidated net sales were in non-corporate office modular carpet salesmarkets in the Americas was 44%fiscal year 2021 and 56%, respectively,fiscal year 2020, primarily in education, healthcare, government, retail, and residential/living market segments. See Item 1, “Business” of this Annual Report on Form 10-K for 2017. Company-wide,additional information regarding our mix of modular carpet and resilient flooring sales in corporate office versusverses non-corporate office sales was 59% and 41%, respectively, in 2017.2017,2021, we had consolidated net sales of $996.4$1,200.4 million, up 3.9%8.8% compared to $958.6$1,103.3 million in 2016. Operating2020, primarily due to the rebound in economic activity in certain countries following the impacts of COVID-19. Consolidated operating income for 20172021 was $109.8$104.8 million as compared to $84.9consolidated operating loss of $39.3 million in 2016. Net2020 primarily due to higher sales in 2021 and a $121.3 million impairment of goodwill and certain intangible assets in 2020. Fiscal year 2021 also included $3.9 million of restructuring charges in connection with the planned closure of our Thailand manufacturing operations anticipated to occur in 2022. Consolidated net income for 20172021 was $53.2$55.2 million or $0.86$0.94 per share, compared with $54.2to consolidated net loss of $71.9 million, or $0.83$1.23 per share, in 2016. Included in our results for 2017 were $7.3 million of restructuring and asset impairment charges as well as $15.2 million of tax charges related to the recently enacted U.S. Tax Cuts and Jobs Act. Please see Item 8, Note 13 “Taxes on Income” for further discussion of these tax charges.2016, 2020, we had consolidated net sales of $958.6$1,103.3 million, down 4.3%17.9% compared to $1.0 billion$1,343.0 million in 2015. Operating income2019, primarily due to the impacts of COVID-19. The consolidated operating loss for 20162020 was $84.9$39.3 million as compared to $113.6consolidated operating income of $130.9 million in 2019, due primarily to a $121.3 million goodwill and intangible asset impairment charge recorded in fiscal 2020 due to the impacts of COVID-19. The consolidated net loss for 2015. Net income for 20162020 was $54.2$71.9 million, or $0.83$1.23 per share, compared with $72.4to consolidated net income of $79.2 million, or $1.10$1.34 per share, in 2015. Included in2019.results for 2016 was a restructuring2021 and asset impairment charge2020 consolidated and segment performance appears below under “Analysis of $19.8 million, as discussed below.2016 Restructuring PlanIn the fourth quarterResults of 2016, we committed to a new restructuring plan in our continuing efforts to improve efficiencies and decrease costs across our worldwide operations, and more closely align our operating structure with our business strategy. The plan involved (i) a substantial restructuring of the FLOR business model that included closure of its headquarters office and most retail FLOR stores, (ii) a reduction of approximately 70 FLOR employees and a number of employees in the commercial carpet tile business, primarily in the Americas and Europe regions, and (iii) the write-down of certain underutilized and impaired assets that included information technology assets, intellectual property assets, and obsolete manufacturing, office and retail store equipment.As a result of this plan, we incurred a pre-tax restructuring and asset impairment charge in the fourth quarter of 2016 of $19.8 million. In connection with this plan, in the first quarter of 2017, the Company recorded an additional charge of $7.3 million, primarily related to exit costs associated with the closure of most FLOR retail stores in the first quarter of 2017. The charge in the fourth quarter of 2016 was comprised of $10.1 million of severance charges, $8.0 million of asset impairment charges and lease exit costs of $1.7 million. The charge in the first quarter of 2017 was comprised of lease exit costs of $3.4 million, asset impairment charges of $3.3 million and severance charges of $0.6 million. Approximately $16 million of the charges were expected to result in cash expenditures, primarily for severance payments (approximately $11 million) and lease exit costs (approximately $5 million)Operations”. This restructuring plan was substantially completed in 2017.21Our that were denominated in currencies other than the U.S. dollar were approximately 46%50% in 2017,2021, 51% in 2020, and 48%49% in 2016 and 2015.2019. Because we have such substantial international operations, we are impacted, from time to time, by international developments that affect foreign currency transactions. In 2017,2021, the strengthening of the euro,Euro, Australian dollar, Chinese Renminbi and CanadianBritish Pound sterling against the U.S. dollar had a small positive impact on our net sales and operating income. During 2016, our sales and operating income were negatively impacted byIn 2020, the strengthening of the Euro, British Pound sterling, and Chinese Renminbi against the U.S. dollar had a positive impact on our net sales and euro againstoperating income. In 2019, the British Pound Sterling, with smaller impacts due to weakening of the Euro, British Pound sterling, Australian dollar, and Canadian dollar and Chinese Renminbi against the U.S. dollar. In 2015, the strengthening of the U.S. dollar led tohad a significantnegative impact on our consolidated operations. In particular, the euro, Australian dollarnet sales and Canadian dollar were translated at lower rates compared to prior years. operating income.converting euros,translating Euros, British Pounds sterling, Australian dollars, Chinese Renminbi and Canadian dollars into U.S. dollars have affected our consolidated net sales and operating income or loss during the past three years: $ 5.5 $ (10.9 ) $ (79.5 ) 1.0 (1.0 ) (9.8 ) 2021 2020 2019 (in millions) Impact of changes in foreign currency on consolidated net sales $ 23.9 $ 7.1 $ (26.2) Impact of changes in foreign currency on consolidated operating income (loss) 3.2 0.9 (3.9) Consolidated Statementsconsolidated statements of Operations operations during the past three years: 100.0 % 100.0 % 100.0 % 61.3 61.5 61.8 38.7 38.5 38.2 27.0 27.5 26.9 0.7 2.1 0.0 11.0 8.9 11.3 0.9 0.6 0.7 10.1 8.3 10.6 4.7 2.6 3.3 5.3 5.7 7.2 Fiscal Year 2021 2020 2019 Net sales 100.0 % 100.0 % 100.0 % Cost of sales 64.0 62.8 60.3 Gross profit on sales 36.0 37.2 39.7 Selling, general and administrative expenses 27.0 30.2 29.0 Restructuring, asset impairment and other charges 0.3 (0.4) 1.0 Goodwill and intangible asset impairment charge — 11.0 — Operating income (loss) 8.7 (3.6) 9.7 Interest/Other expense 2.7 3.6 2.2 Income (loss) before income tax expense 6.0 (7.2) 7.5 Income tax expense (benefit) 1.4 (0.7) 1.7 Net income (loss) 4.6 % (6.5) % 5.8 % 2015 was a 53-week period. Fiscal years 20172021 included 52 weeks, fiscal year 2020 included 53 weeks, and 2016 were 52-week periods. 996,443 $ 958,617 1,001,863 3.9 % (4.3 %) Netfiscal year 2019 included 52 weeks. Fiscal Year Percentage Change 2021 2020 2019 2021 compared with 2020 2020 compared with 2019 (in thousands) Consolidated net sales $ 1,200,398 $ 1,103,262 $ 1,343,029 8.8 % (17.9) % 20172021 compared with 20162017,2021, our consolidated net sales increased $37.8$97.1 million (3.9%(8.8%) as compared to 2016.2020, comprised of higher sales volumes (approximately 5.1%) and higher prices (approximately 3.7%). Fluctuations in currency exchange rates had a positive impact on theour year-over-year consolidated sales comparison of approximately $5.5$23.9 million, meaning that if currency levels had remained constant year over year our 20172021 sales would have been lower by this amount. On a geographic basis, we experienced sales growth across all our regions. Sales in the Americas were up 3.5%, sales in Europe were up 2.0% in U.S. dollars (1.5% increase in local currencies), and sales in Asia-Pacific were up 8.7%.In the Americas, our weighted average selling price per square yard for our modular carpet decreased 1% in 2017 as compared to 2016. The sales increase in the Americas was due primarily to the introduction of our LVT products in early 2017, as our modular carpet sales in the Americas declined versus 2016. This decline in modular carpet sales was due entirely to the closure of our FLOR specialty retail stores in the first quarter of 2017, as our commercial modular business was up approximately 1% in 2017 as compared to 2016. The corporate office market segment increased 2% for the year. Other market segments showing growth were the government (up 19%), retail (up 5%) and education (up 4%) market segments. The increase in the government market segment was seen across most government customers, with sales to state and municipal governments representing the most significant increase. The increase in retail was due to the performance of our Interface SERVICES™ business, which has a larger percentage of its sales to the retail segment. These increases were offset by declines in the hospitality (down 7%) and healthcare (down 6%) market segments.In Europe, our weighted average selling price per square meter increased 3% in 2017 compared with 2016. Sales in the region were up in both U.S. dollars (2%) and local currency (1.5%). Within the region, the weakening of the British Pound versus the euro had a negative impact on sales, however this was offset by the strengthening of the euro versus the U.S. dollar during 2017 as compared to 2016. The United Kingdom, which has historically been our third largest market, experienced a sales increase in local currency of 3% for the year, but a decline of 2% when translated into U.S. dollars. We also experienced growth in Germany in 2017, but this was partially offset by other declines in central Europe. The increase in sales was entirely within the corporate office market segment (up 3%) as no other market segment had a significant increase in sales. The corporate office market comprises the majority of sales in the Europe region. This increase was partially offset by declines in the retail (down 17%), education (down 12%), and residential (down 52%) market segments.In Asia-Pacific, our weighted average selling price increased 5.6% for the year, with the appreciation of the Australian dollar having a positive impact on this increase. Within the region, Asia sales increased 5% while Australia sales increased 12% as translated into U.S. dollars. As noted, the appreciation of the Australian dollar had a positive impact onbasis, the sales increase aswas most significant in local currency sales in Australia increased 9%. The increase innon-corporate office market segments including retail, education and healthcare. See the segment results discussion below for additional information on market segments.the region was2020 compared with 2019strengthimpacts of the corporate office market (which comprises the bulk of the region’sCOVID-19 resulting in lower sales and was up 8%). Other non-office market segments showing growth for the year were education (up 16%) and healthcare (up 36%). The increase in the education segment was due to our success in the Australian education market, a result of increased government education spending in the market, as well as growth of student accommodation projects at the university level. These increases were only slightly offset by declines in the retail, government and residential market segments.Net sales for 2016 compared with 2015For 2016, our net sales declined $43.3 million (4.3%) as compared to 2015.volumes globally. Fluctuations in currency exchange rates had a negativepositive impact on theour year-over-year sales comparison of approximately $10.9$7.1 million, meaning that if currency levels had remained constant year over year, our 20162020 sales would have been higherlower by this amount. On a geographic basis, we experienced sales declines in the Americas (down 4.2%) and Europe (down 8.1%), partially offset by an increase of 2% in Asia-Pacific.In the Americas, our weighted average selling price per square yard increased approximately 1% in 2016 compared with 2015. The sales decline in the Americas was experienced across the majority of our customer segments, with the most significant decline occurring in the corporate office segment (down 5%), which is the largest single customer segment in the Americas. We saw lower levels of customer orders during the first three quarters of the year, although this trend somewhat reversed during the fourth quarter, as sales in the corporate segment were effectively flat for the quarter. We also experienced a decline in the residential market segment of 15%, due largely to the performance of our FLOR consumer business. Other declines were seen in the government (down 19%) and retail (down 5%) market segments. The decline in government segment sales in the region was primarily a result of reduced order activity in light of the election cycle. The hospitality market segment in the region increased 11% versus 2015, as we continued to convert customers to modular carpet.In Europe, our weighted average selling price per square meter declined approximately 3% in 2016 compared with 2015. The largest single factor impacting our performance in this region was the turmoil surrounding the decision of the United Kingdom to exit the European Union. This had a significant negative impact on our sales performance in the United Kingdom, which has historically been our third largest market. Not only were sales impacted by the uncertainty around the exit vote, the significant decline in the British Pound led to a translation effect on sales in the U.K. as reported in U.S. dollars. In local currency, the sales decline in the U.K. was 13%, but when translated into U.S. dollars the decline was over 25%. This decrease was partially offset by double digit increases in other countries, notably Germany, Spain and Italy. On a market segment basis, the declinedecrease in consolidated net sales was most significantprimarily in the corporate office, market (down 6%), which represents the majority of sales within Europe. With the exception of theretail, hospitality (up 19%) and healthcare (up 17%) market segments, all other non-office market segments in the region were down year over year, with the most significant declines occurring in the education (down 29%) and government (down 13%) market segments.In See the Asia-Pacific region, our weighted average selling price per square meter declined approximately 1% in 2016 compared with 2015. The 2% sales increase in the region was evenly split between Australia and Asia, with both geographic markets seeing a 2% increase in revenue. In local currency, the increase in Australia was approximately 3%. The increase in sales in the Asia-Pacific region was experienced in the corporate officesegment results discussion below for additional information on market segment (up 5%), which represents the majority of sales within the region. This increase was a result of large development projects that led to increases in the first half of the year, particularly in Australia. The only other market segment in the region that experienced an increase of significance was the hospitality segment (up 24%), due to investment in additional selling resources in the region which led to greater market share. Within the region, the sales increases in corporate and hospitality segments were offset by declines in the retail (down 31%) and education (down 11%) market segments.23overallconsolidated cost of sales and selling, general and administrative (“SG&A”) expenses during the past three years: $ 610,422 $ 589,973 $ 618,974 3.5 % (4.7 %) 268,878 263,919 269,296 1.9 % (2.0 %) $ 879,300 $ 853,892 $ 888,270 3.0 % (3.9 %) Fiscal Year Percentage Change 2021 2020 2019 2021 compared
with 20202020 compared
with 2019 (in thousands) Consolidated cost of sales $ 767,665 $ 692,688 $ 810,062 10.8 % (14.5) % Consolidated selling, general and administrative expenses 324,315 333,229 389,117 (2.7) % (14.4) % 2017,2021, our consolidated costs of sales increased $20.4$75.0 million (3.5%(10.8%) compared with 2016. Fluctuations in currency exchange rates did not haveto 2020, primarily due to higher net sales and the continued adverse impacts of COVID-19. Currency translation had a significant$16.2 million (2.3%) negative impact (less than 1%) on the year-over-year comparison. In absolute dollars,2021, the increase in costsimpact of COVID-19 continued to challenge our global supply chain which contributed to higher cost of sales was a result ofand lower gross profit margins — particularly in the higher sales for 2017 as compared to 2016. As noted above, sales increased 3.9% in 2017.United States. As a percentage of net sales, our consolidated costs of sales improvedincreased to 61.3%64.0% in 20172021 versus 61.5%62.8% in 2016. This improvement was a result of (1) productivity initiatives, including our investment2020, primarily due to inflationary pressures on raw materials, freight and labor costs driving an approximately 3.4% increase in our manufacturing facilities in LaGrange Georgia, (2) lower cost of sales as a percentage of net sales duecompared to the introduction of our LVT product offerings, which commanded margins in 2017 that were accretive to our modular carpet products, and (3) non-recurring charges in 2016 related to the transition to a centralized warehouse and distribution centerprior year. The increase in our Americas business. These benefits were partially offset by (1) higher raw materials costs due to input cost inflation, particularly in our European business, and (2) negative gross margin impacts due to the exit of our FLOR specialty retail business. Our FLOR business delivers higher gross margins than our commercial business, and with the closure of the specialty retail stores the decline in sales had a negative impact on ourconsolidated cost of sales as a percentage of sales.2016,2020, our costconsolidated costs of sales decreased $29.0$117.4 million (4.7%(14.5%) compared with 2015. Fluctuations in currency exchange rates did not have a significant impact (less than 1%) on the comparison. In absolute dollars, the decrease in cost of sales was2019, primarily due to lower sales and production versusnet sales. Currency translation had a $4.7 million (0.6%) negative impact on the prior year, as production for 2016 was down 11% in Americas, 3% in Europe and 3% in Asia-Pacific versus 2015.year-over-year comparison. As a percentage of net sales, our costconsolidated costs of sales declinedincreased to 61.5%62.8% in 20162020 versus 61.8%60.3% in 2015. The most significant reason for this decline was lower raw materials costs during the year as a result of lower feedstock prices for our raw materials,2019, primarily yarn. These lower prices produced a benefit in cost of sales of approximately $12 million, meaning that our raw materials costs for 2016 were lower by this amount. We also experienced more favorable production and utilization efficiencies in 2016 versus 2015. Our cost of sales was, however, negatively impacted by approximately $5 million in the second half of 2016, as there were additional costs within our Americas business as a result of the transition to a new centralized warehouse and distribution center operated by a third party for the region.For 2017, our SG&A expenses increased $5.0 million (1.9%) versus 2016. Currency fluctuations had only a slight (less than 1%) unfavorable impact on SG&A expenses. The increase in SG&A expenses during the year was due to (1) higher incentive-based compensation (approximately $6 million) and performance-based stock compensation (approximately $1.5 million) as performance targets were met to a higher degreechanges in 2017 as comparted to 2016, and (2) higher administrative expenses of $5 million as we centralize certain support functions. These increases were partially offsetfixed cost absorption driven by (1) lower marketing expenses of $3.9 million, a result of our restructuring efforts as well as global consolidation of costs for marketing expenditures leading to lower levels of total spend, and (2) lower selling costs of $4.2 million due primarily to exiting our FLOR specialty retail business in 2017. Despite the higher SG&A expense in absolute dollars,production volumes due to the increase in sales noted above, SG&A expenses declined as a percentageimpacts of sales in 2017 to 27.0% versus 27.5% in 2016.2016,2021, our consolidated SG&A expenses decreased $5.4$8.9 million (2.0%(2.7%) versus 2015.2020. Currency fluctuationstranslation had only a slight (less than 1%$5.3 million (1.6%) favorablenegative impact on the year-over-year comparison. Consolidated SG&A expenses. On an absolute dollar basis, the decrease was almost entirely related toexpenses were lower administrative expenses of $9.4 million resulting from lower incentive-based compensation, including share-based compensation,in 2021 primarily due to performance targets not being met in 2016(1) lower legal fees and other related costs of $12.6 million primarily due to the same degreesettlement of the SEC matter in the prior year period, and (2) lower severance costs of $9.1 million as the prior year included additional cost reduction initiatives implemented in 2015. These declines were primarily at the corporate and Americas level. Other declines were lower selling expenses of $1.2 million dueresponse to reduced commissions on lower sales volumes.COVID-19 as discussed above. These decreases were partially offset by higher marketing expenses in 2016labor costs of approximately $5.2$11.0 million due to higher performance-based compensation as we continuedtarget performance measures were achieved in 2021, partially offset by cost savings from prior year headcount reduction initiatives. As a percentage of net sales, SG&A expenses decreased to expand27.0% in 2021 versus 30.2% in 2020.marketing effortsconsolidated SG&A expenses decreased $55.9 million (14.4%) versus 2019. Currency translation had a $1.5 million (0.4%) negative impact on the year-over-year comparison. Consolidated SG&A expenses were lower in 2020 primarily due to (1) lower selling expenses of $54.8 million due to lower net sales, (2) $7.3 million of payroll expense credits related to the early rollout of our modular resilient flooring (“MRF”) products as well as other initiatives to drive product adoption. These marketing increases were most significant in the Americas region (up $1.7 million)COVID-19 wage support government assistance programs, and (3) $9.2 million lower performance-based compensation due to the MRF rolloutstock compensation forfeitures and in the Asia-Pacific region (up $1.9 million), primarily in Asia related to additional customer events, product rollout support and increased marketing management. Despite the overall decline in SG&A expenses in absolute dollars,target performance measures not being met due to COVID-19. These reductions were partially offset by $12.9 million of severance expenses due to voluntary and involuntary separations, and a $5.0 million fine to settle the lowerSEC matter as referenced in Item 8 Note 18 - “Commitments and Contingencies”. As a percentage of sales, in 2016 versus 2015 our SG&A expenses increased as a percentage of sales to 27.5%30.2% in 20162020 versus 26.9%29.0% in 2015, as the decline in SG&A expenses was less than the decline in2019, primarily due to lower net sales.242017,2021, our interest expense increased $1.0$0.5 million to $7.1$29.7 million, versus $6.1$29.2 million in 2016. This increase was a result of2020, primarily due to (1) higher averagefixed-rate interest ratesexpense on the Senior Notes debt, which replaced variable-rate debt under ourthe Syndicated Credit Facility, during 2017 (the averageand (2) $4.9 million of deferred losses recognized on terminated interest rate for 2016 was 2.5% as compared to 2.9% for 2017), and (2) in 2017 we fixedswaps that were reclassified from accumulated other comprehensive loss into interest expense during the variable interest rate on $100year. These increases were partially offset by $60 million of our term loanlower outstanding borrowings under the Syndicated Credit Facility by entering into ancompared to 2020. Our average borrowing rate under the Syndicated Credit Facility was 1.91% for 2021 compared to 1.89% in 2020.transaction. The effectlosses due to the termination of this interest rate swap was to increase thecontracts. These increases were partially offset by lower average interest raterates on the $100 million notional amount of the swap above the variable rate in effect for our other term loan borrowings under the Syndicated Credit Facility.For 2016, our interest expense decreased $0.3 millionFacility (our average borrowing rate for 2020 was 1.89% compared to $6.1 million, versus $6.4 million3.27% in 2015. This decrease was due to2019) and lower average outstanding debt balances in 2016 versus 2015. During 2016, we repaid a net amount of $6.2 millionborrowings under ourthe Syndicated Credit Facility and this lower levelcompared to 2019.debt led to lower interest expense during 2016. We did incur additional Syndicated Credit Facility borrowings of approximately $63.5 milliondamaged raw material inventory in December of 2016, but this debt was outstanding for only2020, which resulted from a fire at a leased storage facility.final month of 2016 and did not have a significant impact on interest expense (less than $0.1 million).TaxOn December 22, 2017, the U.S. Tax Cuts and Jobs Act (the “Tax Act”) was enacted into law. Among the significant changes resulting from the law, the Tax Act reduces the U.S. federal income tax rate from 35% to 21% effectiveyear ended January 1, 2018 and creates a modified territorial tax system with a one-time mandatory “transition tax” on previously unrepatriated foreign earnings.Due to the tax legislation, 2, 2022, the Company has recorded a provisionalincome tax expense of $3.5$17.4 million related to the remeasurementon pre-tax income of its net deferred tax assets. The Company also recorded a provisional tax expense of $11.7$72.6 million related to the one-time transition toll tax. These amounts are considered provisional because they use reasonable estimates of which tax returns have not been filed and because estimated amounts may be impacted by future regulatory and accounting guidance if and when issued. The Company will adjust these provisional amounts as further information becomes available and as we refine our calculations. Please see Item 8, Note 13 entitled “Taxes on Income” for further information on the financial statement impact of the Tax Act.Our effective tax rateresulting in 2017 was 47.0%, compared with an effective tax rate of 31.6% in 2016. The increase in our effective tax rate in 201724.0%, as compared to 2016 was primarily due to a $15.2an income tax benefit of $7.5 million tax charge for the impactson pre-tax loss of the Tax Act as discussed above and an increase in U.S. earnings$79.4 million resulting in more U.S. state tax expense.Our effective tax rate in 2016 was 31.6%, compared with an effective tax rate of 31.5%9.4% for the year ended January 3, 2021. The effective tax rate for the year ended January 3, 2021 was significantly impacted by a non-deductible goodwill impairment charge and recognition of income tax benefits related to uncertain tax positions taken in 2015. The 2016prior years on discontinued operations. Excluding the impact of the non-deductible goodwill impairment charge and recognition of income tax benefits related to uncertain tax positions on discontinued operations, the effective tax rate was favorably14.1% for the year ended January 3, 2021. The increase in the effective tax rate for the year ended January 2, 2022 as compared to the year ended January 3, 2021 was primarily due to the one-time favorable impacts of amending prior year tax returns during the period ended January 3, 2021, an increase in non-deductible employee compensation and an increase in the valuation allowance on net operating loss and interest carryforwards. This increase was partially offset by a decrease in non-deductible business expenses.higher portionnon-deductible goodwill impairment charge and recognition of income earnedtax benefits related to uncertain tax positions taken in foreign jurisdictions which are taxed at lowerprior years on discontinued operations. Excluding the impact of the non-deductible goodwill impairment charge and recognition of income tax rates thanbenefits related to uncertain tax positions on discontinued operations, the U.S federal tax rate. The favorable impact to the 2016 effective tax rate was 14.1% for 2020 compared to 22.2% in 2019. The decrease in the effective tax rate, excluding the goodwill impairment charge and recognition of income tax benefits related to uncertain tax positions on discontinued operations, was primarily due to the favorable impacts of amending prior year tax returns, retroactive election of the GILTI High-tax Exclusion in the 2019 tax return and reduction in non-deductible employee compensation. This decrease was partially offset by the non-deductible SEC fine.Fiscal Year Percentage Change 2021 2020 2019 2021 compared with 2020 2020 compared with 2019 (in thousands) AMS segment net sales $ 651,216 $ 593,418 $ 757,112 9.7 % (21.6) % 85,014 89,097 120,921 (4.6) % (26.3) % Fiscal Year Percentage Change 2021 2020 2019 2021 compared with 2020 2020 compared with 2019 (in thousands) EAAA segment net sales $ 549,182 $ 509,844 $ 585,917 7.7 % (13.0) % 37,268 21,403 28,832 74.1 % (25.8) % releaseeducation (down 2.6%) market segment.valuation allowances relatedCOVID-19 and lower carpet tile sales volumes. Currency fluctuations had an approximately $7.3 million (1.3%) positive impact on EAAA’s fiscal year 2020 sales compared with 2019, due primarily to statethe strengthening of the Euro and British Pound sterling against the U.S. dollar. On a market segment basis, the EAAA sales decrease was most significant in the hospitality (down 40.3%), corporate office (down 19.1%), public buildings (down 16.0%) and retail (down 12.9%) market segments.operating loss carryforwards utilizedsales decreased to 23.0% in 20162021 compared to 2015. For additional information24.6% in 2020 due to savings from cost reduction initiatives implemented in the prior year. AOI as a percentage of net sales increased to 6.8% in 2021 compared to 4.2% in 2020, due primarily to higher sales as discussed above.taxes and a reconciliation of effective tax rates to statutory tax rates, see the Note 13 entitled “Taxes on Income” in Item 8 of this Report. Payments Due by Period Total Payments
DueLess than
1 year1-3 years 3-5 years More than
5 years (in thousands) Long-term debt obligations $ 525,131 $ 15,002 $ 30,004 $ 180,125 $ 300,000 Operating and finance lease obligations 130,820 19,802 28,625 21,726 60,667 Expected interest payments 132,949 21,941 42,756 35,252 33,000 Purchase obligations 17,787 16,531 1,193 63 — Pension cash obligations 33,917 5,970 5,973 6,211 15,763 Total $ 840,604 $ 79,246 $ 108,551 $ 243,377 $ 409,430 In December 2016, one of the Company’s foreign subsidiaries borrowed 61 million euros (approximately $63.5 million)fiscal year 2022, which includes, among other things, scheduled debt repayments under the Syndicated Credit Facility. The funds were distributedFacility, pension contributions, interest payments on our debt and lease commitments. Our long-term debt obligations include the contractually scheduled principal repayment of our term loan borrowings under the Syndicated Credit Facility, which matures in 2025, and $300 million on our Senior Notes due in 2028. Operating and finance lease obligations consist of undiscounted lease payments due over the term of the lease. Expected interest payments are those associated with borrowings under the Syndicated Credit Facility and Senior Notes consistent with our contractually scheduled principal repayments. Our purchase obligations are for non-cancellable agreements primarily for raw material purchases and capital expenditures. Our current and long-term pension obligations include contributions and expected benefit payments to its U.S. parent companybe paid by the Company related to fund then-currentcertain defined benefit pension plans and projected U.S. cash needs. A significant portionexcludes the expected benefit payments for two of our funded foreign defined benefit plans as these borrowings were repaidobligations will be paid by the plans over the next ten years.the first quarter of 2017.December 31, 2017,January 2, 2022, we had $87.0$97.3 million in cash. Approximately $14.1$1.7 million of this cash was located in the U.S., and the remaining $72.9$95.6 million was located outside of the U.S. The cash located outside of the U.S. is indefinitely reinvested in the respective jurisdictions (except as identified below). We believe that our strategic plans and business needs, particularly for working capital needs and capital expenditure requirements in Europe, Asia, Canada, and Australia, support our assertion that a portion of our cash in foreign locations will be reinvested and remittance will be postponed indefinitely. Of the $72.9$95.6 million of cash in foreign jurisdictions, approximately $43.0$12.9 million represents earnings which we have determined are not permanently reinvested, and as such we have provided for foreign withholding and U.S. state income taxes on these amounts in accordance with applicable accounting standards.December 31, 2017,January 2, 2022, we had $229.9$225.1 million of borrowings outstanding under our Syndicated Credit Facility, of which $217.6 million were term loan borrowings and $6.0$7.5 million were revolving loan borrowings. Additionally, $1.6 million in letters of credit were outstanding under ourthe Syndicated Credit Facility. Of those borrowings outstanding, $170.0 million were Term Loan A borrowings and $59.9 million were revolving loan borrowings.Facility at the end of fiscal year 2021. As of December 31, 2017,January 2, 2022, we could have incurred $184.1had additional borrowing capacity of $290.9 million under the Syndicated Credit Facility and $6.0 million of additional revolving loan borrowings under our Syndicated Credit Facility. In addition, we could have incurred the equivalent of $9.8 million of borrowingsborrowing capacity under our other credit facilities in place at other non-U.S. subsidiaries.We have approximately $95.0in contractual cash obligationsaggregate principal amount of 5.50% Senior Notes due by the end2028 (the “Senior Notes”), which are discussed further below. As of fiscal year 2018, which includes, among other things, pension cash contributions, interest payments on our debt and lease commitments. Based on current interest rate and debt levels,January 2, 2022, we expect our aggregate interest expense for 2018 to be between $8had $300.0 million and $11 million. We estimate aggregate capital expenditures in 2018 to be between $50 million and $60 million, although we are not committed to these amounts.AugustNovember of 2022.2025 and the Senior Notes, as discussed below, mature in December 2028. We cannot assure you that we will be able to renegotiate or refinance any of our debt on commercially reasonable terms, or at all. If we are unable to refinance our debt or obtain new financing, we would have to consider other options, such as selling assets to meet our debt service obligations and other liquidity needs, or using cash, if available, that would have been used for other business purposes.thea substantial majorityportion of our indebtedness, and that these borrowings are based on variable interest rates (as described below) that expose the Company to the risk that short-term interest rates may increase. We have, however,During 2020, we entered into anfixed rate Senior Notes (as described below) which reduced the amount of indebtedness subject to interest rate swap transactionrisk. In the fourth quarter of 2020, we terminated our interest rate swaps that were previously being used to fix thea portion of our variable interest rate with respect to $100 million of the term loan borrowings under the Syndicated Credit Facility.debt. For information regarding the current variable interest rates of these borrowings, the potential impact on our interest expense from hypothetical increases in short term interest rates, and the interest rate swap transaction, please see the discussion in Item 7A of this Report. Fiscal Year 2021 2020 2019 (in thousands) Net cash provided by (used in): Operating activities $ 86,689 $ 119,070 $ 141,768 Investing activities (28,071) (61,689) (74,222) Financing activities (60,858) (42,715) (66,677) Effect of exchange rate changes on cash (3,561) 7,086 (557) Net change in cash and cash equivalents (5,801) 21,752 312 Cash and cash equivalents at beginning of period 103,053 81,301 80,989 Cash and cash equivalents at end of period $ 97,252 $ 103,053 $ 81,301 have a syndicated credit facility (the “ended 2019 with $81.3 million in cash, an increase of $0.3 million during the year. The most significant uses of cash in 2019 were (1) repayments on our Syndicated Credit Facility” orFacility of $111.7 million offset by borrowings of $90 million, (2) capital expenditures of $74.6 million, (3) $25.2 million to repurchase 1.6 million shares of the Company’s outstanding common stock, and (3) dividend payments of $15.4 million. These uses were offset by cash flow from operations of $141.8 million, primarily generated from (1) net income of $79.2 million, (2) $19.4 million for increases in accounts payable and accrued expenses, and (3) $2.6 million due to a decrease in inventories. These sources of cash were reduced by working capital uses of (1) $9.7 million due to increases in prepaid expenses, and (2) $0.9 million due to increases in accounts receivable., most recently amended and restated in August 2017) pursuant to which). At January 2, 2022, the lenders provide to usFacility provided the Company and certain of ourits subsidiaries with a multicurrency revolving creditloan facility up to $300 million, as well as other U.S. denominated and provide to us amulticurrency term loan. The key features ofloans. Material terms under the Facility are as follows:●The Facility matures in August of 2022.●The Facility includes a multicurrency revolving loan facility made available to the Company and our principal subsidiaries in Europe and Australia not to exceed $250 million in the aggregate at any one time outstanding. A sublimit of $40 million exists for the issuance of letters of credit under the Facility.●The Facility includes a Term Loan A borrowing that had an original principal amount of $177.5 million.●The Facility provides for required amortization payments of the Term Loan A borrowing, as well as mandatory prepayments of the Term Loan A borrowing (and any term loans made available pursuant to any future multicurrency loan facility increase) from certain asset sales, casualty events and debt issuances, subject to certain qualifications and exceptions as provided for therein.●Advances under the Facility are secured by a first-priority lien on substantially all of Interface, Inc.’s assets and the assets of each of our material domestic subsidiaries, which have guaranteed the Facility.●The Facility contains financial covenants (specifically, a consolidated net leverage ratio and a consolidated interest coverage ratio) that must be met as of the end of each fiscal quarter.●We have the option to increase the borrowing availability under the Facility, either for revolving loans or term loans, by up to $150 million, subject to the receipt of lender commitments for the increase and the satisfaction of certain other conditions.26. Interest1.50% over the applicable base interest rate (which is defined as the greatest of the prime rate, a specified federal funds rate plus 0.50%, or a specified Eurocurrency rate)2.00%, depending on ourthe Company’s consolidated net leverage ratio (as defined in the Facility agreement) as of the most recently completed fiscal quarter. Interest on Eurocurrency-based loans and fees for letters of credit are charged at varying rates computed by applying a margin ranging from 1.25% to 2.50%3.00% over the applicable Eurocurrency rate, depending on ourthe Company’s consolidated net leverage ratio as of the most recently completed fiscal quarter. In addition, we paythe Company pays a commitment fee ranging from 0.20% to 0.35%0.40% per annum (depending on ourthe Company’s consolidated net leverage ratio as of the most recently completed fiscal quarter) on the unused portion of the Facility.Amortization Prepayments. We are requiredmake quarterly amortization paymentssubmit rates for the calculation of $3.75 millionLIBOR after 2021. This announcement indicated that the continuation of LIBOR on the current basis was not guaranteed after 2021, and LIBOR may be discontinued or modified. Additionally, certain U.S. dollar LIBOR rates will be discontinued by June 2023. The Federal Reserve Bank of New York began publishing the Secured Overnight Financing Rate (“SOFR”) in April 2018 as an alternative for LIBOR. SOFR is a broad measure of the Term Loan A borrowing.. ●create or incur liens on assets;●make acquisitions of or investments in businesses (in excess of certain specified amounts);●incur indebtedness or contingent obligations;●sell or dispose of assets (in excess of certain specified amounts);●pay dividends or repurchase our stock (in excess of certain specified amounts);●repay other indebtedness prior to maturity unless we meet certain conditions; and●enter into sale and leaseback transactions.●Consolidated Net Leverage Ratio: Must be no greater than 3.75:1.00.●Consolidated Interest Coverage Ratio: Must be no less than 2.25:1.00.. ●declare all commitments of the lenders under the facility terminated;●declare all amounts outstanding or accrued thereunder immediately due and payable; and●exercise other rights and remedies available to them under the agreement and applicable law.. ana Second Amended and Restated Security and Pledge Agreement, the Facility is secured by substantially all of the assets of Interface, Inc. and our domestic subsidiaries (subject to exceptions for certain immaterial subsidiaries), including all of the stock of our domestic subsidiaries and up to 65% of the stock of our first-tier material foreign subsidiaries. If an event of default occurs under the Facility, the lenders’ Administrative Agent may, upon the request of a specified percentage of lenders, exercise remedies with respect to the collateral, including, in some instances, foreclosing mortgages on real estate assets, taking possession of or selling personal property assets, collecting accounts receivables, or exercising proxies to take control of the pledged stock of domestic and first-tier material foreign subsidiaries.December 31, 2017,January 2, 2022, we had $170.0outstanding $217.6 million of Term Loan A borrowingsterm loan borrowing and $59.9$7.5 million of revolving loan borrowings outstanding under the Facility, and had $6.0$1.6 million in letters of credit outstanding under the Facility.presentlycurrently in compliance with all covenants under theSyndicated Credit Facility and anticipate that we will remain in compliance with the covenants for the foreseeable future.thirdfourth quarter of 2017,2020, we entered into anterminated our interest rate swaps and paid approximately $13 million to terminate the swap transaction that fixed the variable interest rate with respect to $100 million of the term loan borrowings under the Syndicated Credit Facility.agreements. For additional information, on interest rates, please see Item 7A and Note 89 entitled “Borrowings”“Long-Term Debt” in Item 8 of this Report.27Senior NotesContentsAnalysis5.50% Senior Notes due 2028. The Senior Notes bear an interest rate at 5.50% per annum and mature on December 1, 2028. Interest is paid semi-annually on June 1 and December 1 of Cash FlowsWe ended 2017 with $87.0 million in cash, a decrease of $78.6 million duringeach year, beginning on June 1, 2021. The Company used the year. The most significant decrease in cash was duenet proceeds to our share repurchase program which used $91.6repay $269.7 million of cash to repurchase and retire 4.6 million shares of our outstanding common stock, pursuant to our established share repurchase plans. We also used $72.0 million of cash to repay outstanding borrowings under our Syndicated Credit Facility (including $15.0 million of required amortization payments under our term loan), as well as $15.5 million for the payment of dividends. We borrowed $25.0 million during 2017 under our Syndicated Credit Facility. Outside of these financing activities, we also used cash of $30.5 million for capital expenditures during 2017. These uses of cash were partially offset by cash flow from operations of $103.4 million. The significant components of cash flow from operations were (1) net income of $53.2 million, and (2) a $12.0 million increase in accruals and accounts payable. Cash flow from operations was partially offset by (1) an increase of accounts receivable of $10.3 million, and (2) an increase in inventory of $13.6 million. Included in cash flow from operations is a $15.2 million add-back to net income related to the non-cash charge recorded in 2017 in connection with the Tax Act. A portion of this impact (an estimated $9.8 million) will result in cash expenditures over the next eight years as is allowed by the Tax Act. However, this estimated amount could change as the Company completes its analysis of the Tax Act over the course of 2018.We exited 2016 with $165.7 million in cash, an increase of $90.0 million during the year. The most significant increase in cash was a result of borrowings under our Syndicated Credit Facility, the largest portion of which was borrowings of $63.5 million in the December 2016 borrowing transaction discussed above. We also borrowed an additional $23.9 million under our Syndicated Credit Facility during 2016. Outside of these borrowings, our cash flow from operating activities of $98.1 million was the most significant factor in our cash generation. The significant components of this cash flow from operations were (1) net income of $54.2 million, (2) a $12.2 million increase in accounts payable and accruals, and (3) a $2.7 million decrease in inventory. These increases were partially offset by a $7.7 million increase in prepaid expenses and other assets. Other primary uses of cash during 2016 were (1) capital expenditures of $28.1 million, (2) $18.5 million used to repurchase and retire 1.2 million shares of our outstanding common stock pursuant to our established share repurchase plan, (3) $17.6 million of repayments under our Syndicated Credit Facility, (4) $14.3 million for the payment of dividends, and (5) $12.5 million for repayment of term loan borrowings under our Syndicated Credit Facility as required by the applicable amortization schedule.We exited 2015 with $75.7 million in cash, an increase of $20.8 million during the year. The increase in cash was primarily due to improved cash flow from operating activities of $126.5 million in 2015, compared with $46.4 million in 2014. The factors driving the increase in cash flow from operating activities were (1) higher net income in 2015 due to improved operational performance, (2) a $16.2 million reduction in cash paid for interest, (3) an $18.7 million reduction in accounts receivable, and (4) a $15.5 million increase in accounts payable and accrued expenses. The increase in cash from operating activities was partially offset by an increase in inventories of $26.5 million and an increase in prepaid expenses and other assets of $8.3 million. Our other primary uses of cash during 2015 were (1) $45.3$21.0 million of repayments ofoutstanding revolving loan borrowings under our Syndicated Credit Facility, (2) $27.2the Facility. In connection with the issuance of the Senior Notes, the Company recorded $5.7 million of capital expenditures, primary relateddebt issuance costs. These debt issuance costs were recorded as a reduction of long-term debt in the consolidated balance sheets and will be amortized over the life of the outstanding debt.manufacturing locations,full fiscal year 2022 results and beyond are uncertain. We believe the most significant elements of uncertainty are (1) the intensity and duration of the impact on construction, renovation, and remodeling; (2) corporate, government, and consumer spending levels and sentiment; (3) $13.3 million used to repurchase and retire 650,000 sharesthe ability of our outstanding common stock, pursuantsales channels, supply chain, manufacturing, and distribution partners to continue operating through disruptions; and (4) the severity of global supply chain disruptions and their effects on inflation, labor shortages, raw material shortages, and other factors that disrupt our established share repurchase plan, (4) $11.9 million forsupply chain and manufacturing facilities. Any or all of these factors could negatively impact our financial position, results of operations, cash flows, and outlook. As the paymentimpact of dividends,the COVID-19 pandemic continues to affect companies with global operations, specifically as it relates to the global supply chain, we anticipate that, at a minimum, our business and (5) $2.5 million for repaymentresults in the first half of term loan borrowings under our Syndicated Credit Facility as required by2022 will continue to be affected, and the applicable amortization schedule.We believe that ourtimeline and pace of recovery is uncertain.position will provideare expected to be available and sufficient funds to meet foreseeable cash requirements. However, the Company’s cash flows from operations can be affected by numerous factors including the uncertainty of COVID-19 and its impact on global operations, raw material availability and cost, demand for our current commitmentsproducts, and other cash requirements for the foreseeable future.factors described in “Risk Factors” included in Part I, Item 1A of this Annual Report on Form 10-K.28Funding ObligationsWe have various contractual obligations that we must fund as part of our normal operations. The following table discloses aggregate information about our contractual obligations and the periods in which payments are due. The amounts and time periods are measured from December 31, 2017. $ 229,928 $ 15,000 $ 30,000 $ 184,928 $ 0 62,439 16,719 21,789 8,431 15,500 28,842 7,013 12,589 9,240 0 49,383 45,091 3,709 583 0 123,169 11,145 23,044 24,329 64,651 $ 493,761 $ 94,968 $ 91,131 $ 227,511 $ 80,151 ______________________ (1)Our capital lease obligations are insignificant.(2)Expected interest payments to be made in future periods reflect anticipated interest payments related to the $170.0 million of Term Loan A borrowings outstanding and the $59.9 million of revolving loan borrowings outstanding under our Syndicated Credit Facility as of December 31, 2017. We have also assumed in the presentation above that these borrowings will remain outstanding until maturity with the exception of the required amortization payments for our Term Loan A borrowings.(3)Unconditional purchase obligations do not include unconditional purchase obligations that are included as liabilities in our Consolidated Balance Sheet. Our capital expenditure commitments are not significant.(4)We have two foreign defined benefit plans and a domestic salary continuation plan. We have presented above the estimated cash obligations that will be paid under these plans over the next ten years. Such amounts are based on several estimates and assumptions and could differ materially should the underlying estimates and assumptions change. Our domestic salary continuation plan is an unfunded plan, and we do not currently have any commitments to make contributions to this plan. However, we do use insurance instruments to hedge our exposure under the salary continuation plan. Contributions to our other employee benefit plans are at our discretion.(5)The above table does not reflect unrecognized tax benefits of $29.2 million, the timing of which payments are uncertain. See Note 13 entitled “Taxes on Income” in Item 8 of this Report for further information.(6)The above table does not reflect any provisional payments under the U.S. Tax Cuts and Jobs Act enacted December 2017. At this time, the Company estimates it will be required to pay $9.8 million for transition toll taxes over a maximum of eight years. The Company is still analyzing the impact of the U.S. Tax Cuts and Jobs Act and will determine during 2018 the ultimate amount and timing of these payments. The $9.8 million amount is currently included as an accrued liability in our consolidated financial statements. As these amounts and timing are still under review and may increase or decrease during 2018, the Company has not included them in the above table. See Note 13 entitled “Taxes on Income” in Item 8 of this Report for further information.management’smanagement’s judgment, with financial reporting results relying on estimations about the effects of matters that are inherently uncertain. Specific risks for these critical accounting policies are described in the following paragraphs. For all of these policies, management cautions that future events may not develop as forecasted, and the best estimates routinely require adjustment.Revenue Recognition. The vast majority of our revenue is recognized at the date of shipment when the following criteria are met: persuasive evidence of an agreement exists, price to the buyer is fixed and determinable, and collectability is reasonably assured. Delivery is not considered to have occurred until the customer takes title and assumes the risks and rewards of ownership, which is generally on the date of shipment. Provisions for discounts, sales returns and allowances are estimated using historical experience, current economic trends, and the Company’s quality performance. The related provision is recorded as a reduction of sales and cost of sales in the same period that the revenue is recognized. Accordingly, our estimates and assumptions regarding revenue recognition primarily relate to sales returns and allowances, which historically have been in the range of 2.5-3.0% of gross sales. Over the last several years, we have not experienced any significant fluctuation in sales returns and allowances, our estimates and assumptions related thereto have not changed significantly, and we believe our estimates and assumptions to be reasonably accurate. Management also believes this past experience can be relied upon for such estimates and assumptions in future periods, as our business model and customer mix have not changed significantly.29A small percentage (approximately 5%) of our revenue relates to flooring installation projects, which generally involve short time periods (typically less than two weeks) and therefore present little risk of material difference due to changes in experience.Shipping and handling fees billed to customers are classified in net sales in the consolidated statements of operations. Shipping and handling costs incurred are classified in cost of sales in the consolidated statements of operations.December 31, 2017,January 2, 2022, and January 1, 2017,3, 2021, we had state net operating loss carryforwards of $108.6$153.0 million and $108.9$142.7 million, respectively. As of January 1, 2017, we had $3.8 million of foreign net operating loss carryforwards. Certain of these state net operating loss carryforwards are reserved with a valuation allowance because, based on the available evidence, we believe it is more likely than not that we would not be able to utilize those deferred tax assets in the future. The remaining year-end 20172021 amounts are expected to be fully recoverable within the applicable statutory expiration periods. If the actual amounts of taxable income differ from our estimates, the amount of our valuation allowance could be materially impacted Pursuant Prior to applicable accounting standards,the adoption of Accounting Standards Update (“ASU”) 2017-04 “Intangibles-Goodwill and Other”, we testtested goodwill for impairment at least annually using a two steptwo-step approach. In the first step of this approach, we prepareprepared valuations of reporting units, using both a market comparable approach and an income approach, and those valuations arewere compared with the respective book values of the reporting units to determine whether any goodwill impairment exists.existed. In preparing the valuations, past, present and expected future performance iswas considered. If impairment iswas indicated in this first step of the test, a step two valuation approach iswas performed. The step two valuation approach comparescompared the implied fair value of goodwill to the book value of goodwill. The implied fair value of goodwill iswas determined by allocating the estimated fair value of the reporting unit to the assets and liabilities of the reporting unit, including both recognized and unrecognized intangible assets, in the same manner as goodwill is determined in a business combination under applicable accounting standards. After completion of this step two test, a loss iswas recognized for the difference, if any, between the fair value of the goodwill associated with the reporting unit and the book value of that goodwill. IfactualCompany adopted ASU 2017-04, “Intangibles - Goodwill and Other,” that provides for the elimination of Step 2 from the goodwill impairment test described above. Under the new guidance, impairment charges are recognized to the extent the carrying amount of a reporting unit exceeds its fair value with certain limitations.goodwill is determineddevelopment of any forecasts to be less than that estimated, an additional write-down may be required.2017, 20162021, 2020 and 2015,2019, we performed the annual goodwill impairment test. We perform this test at the reporting unit level. For our reporting units which carried a goodwill balance as of December 31, 2017,January 2, 2022, no impairment of goodwill was indicated. As of December 31, 2017,January 2, 2022, if our estimates of the fair value of our reporting units were 10% lower, we believe no additional goodwill impairment would have existed.We estimateby continuously examiningis based on continuous examination of our inventories to determine if there are indicators that carrying values exceed net realizable values. Experience has shown that significant indicators that could require the need for additional inventory write-downs are the age of the inventory, the length of its product life cycles, anticipated demand for our products and current economic conditions. While we believe that adequate write-downs for inventory obsolescence have been made in the consolidated financial statements, consumer tastes and preferences will continue to change and we could experience additional inventory write-downs in the future. Our inventory reserve on December 31, 2017January 2, 2022 and January 1, 2017,3, 2021, was $20.4$27.1 million and $17.6$35.0 million, respectively. To the extent that actual obsolescence of our inventory differs from our estimate by 10%, our 20172021 net income would be higher or lower by approximately $1.5$2.1 million, on an after-tax basis.30 $ (60.1 ) $ 61.5 $ (3.3 ) $ 4.0 Environmental Remediation. We provide for environmental remediation costs and penalties when the responsibility to remediate is probable and the amountForeign Defined Benefit Plans Increase (Decrease) in
Projected Benefit Obligation(in millions) 1% increase in actuarial assumption for discount rate $ (47.1) 1% decrease in actuarial assumption for discount rate 60.2 Domestic Salary Continuation Plan Increase (Decrease) in
Projected Benefit Obligation(in millions) 1% increase in actuarial assumption for discount rate $ (3.0) 1% decrease in actuarial assumption for discount rate 3.6 associated costs is reasonably determinable. Remediation liabilities are accrued based on estimates of known environmental exposures and are discounted in certain instances. We regularly monitor the progress of environmental remediation. Should studies indicate that the cost of remediation is to be more than previously estimated, an additional accrual would be recorded in the period in which such determination is made. As of December 31, 2017, no significant amounts were provided for remediation liabilities.Doubtful Accounts. Expected Credit Losses.We maintain allowances for doubtful accounts for estimatedexpected credit losses resulting from the inability of customers to make required payments. Estimating thisthe amount of future expected losses requires us to analyze the financial strengthsconsider historical losses from our customers, as well as current market conditions and future forecasts of our customers. If the financial condition of our customers were to deteriorate, resulting in an impairment of theircustomers’ ability to make payments additional allowances may be required.for goods and services. By its nature, such an estimate is highly subjective, and it is possible that the amount of accounts receivable that we are unable to collect may be different than the amount initially estimated. Our allowance for doubtful accountsexpected credit losses on December 31, 2017January 2, 2022 and January 1, 2017,3, 2021, was $3.5$5.0 million and $3.8$6.6 million, respectively. To the extent the actual collectability of our accounts receivable differs from our estimates by 10%, our 20172021 net income would be higher or lower by approximately $0.3$0.4 million, on an after-tax basis, depending on whether the actual collectability was better or worse, respectively, than the estimated allowance.December 31, 2017January 2, 2022 and January 1, 2017,3, 2021, was $4.1$2.7 million and $5.5$3.2 million, respectively. Actual warranty expense incurred could vary significantly from amounts that we estimate. To the extent the actual warranty expense differs from our estimates by 10%, our 20172021 net income would be higher or lower by approximately $0.3$0.2 million, on an after-tax basis, depending on whether the actual expense is lower or higher, respectively, than the estimated provision.Off-Balance Sheet ArrangementsWe are not a party to any material off-balance sheet arrangements.31Item 8, Note 2 entitled “Recent Accounting Pronouncements” in Item 8 of this Report for discussion of these items.employhave employed derivative financial instruments as risk management tools and not for speculative or trading purposes. We monitor the use of derivative financial instruments through objective measurable systems, well-defined market and credit risk limits, and timely reports to senior management according to prescribed guidelines. We have established strict counter-party credit guidelines and enter into transactions only with financial institutions with a rating of investment grade or better. As a result, we consider the risk of counter-party default to be minimal.an interest rate swap transactiontransactions with regard to a portion of its term loan debt. The Company’s interest rate swap isswaps were designated and qualifiesqualified as a cash flow hedgehedges of forecasted interest payments. The Company reports the effective portionBoth of the fair value gain or loss on the swap as a component of other comprehensive income (or other comprehensive loss). Gains or losses (if any) on any ineffective portion of derivative instruments in cash flow hedging relationships are recordedCompany’s interest rate swaps were terminated in the period in which they occur as a componentfourth quarter of other expense (or other income) in the Consolidated Condensed Statement of Operations. There were no such gains or losses in 2017. The aggregate notional amount of the swap as of December 31, 2017 was $100 million.NorthernNorthern Ireland, the Netherlands, Germany, China, Thailand and Australia, and sell our products in more than 100 countries. As a result, our financial results have been, and could be, significantly affected by factors such as changes in foreign currency exchange rates or weak economic conditions in the foreign markets in which we distribute our products. Our operating results are exposed to changes in exchange rates between the U.S. dollar and many other currencies, including the euro,Euro, British poundPound sterling, Canadian dollar, Australian dollar Thai baht and Japanese yen.Chinese Renminbi. When the U.S. dollar strengthens against a foreign currency, the value of anticipated sales in those currencies decreases, and vice versa. Additionally, to the extent our foreign operations with functional currencies other than the U.S. dollar transact business in countries other than the United States, exchange rate changes between two foreign currencies could ultimately impact us. Finally, because we report in U.S. dollars on a consolidated basis, foreign currency exchange fluctuations could have a translation impact on our financial position.At December 31, 2017, To mitigate the impact of fluctuations in foreign currency exchange rates, we may enter into derivative transactions from time to time, such as forward contracts and foreign currency options. There were no active foreign currency derivative instruments as of January 2, 2022.$31.6$40.1 million increase in our accumulated other comprehensive loss – foreign currency translation adjustment account compared with January 1, 2017,3, 2021, because of the weakeningstrengthening of the Euro, British Pound sterling, Australian dollar, and Chinese Renminbi against the U.S. dollar against certain foreign currencies during 2017, particularly the euro and the Australian dollar.December 31, 2017.January 2, 2022. The values that result from these computations are then compared with the market values of the financial instruments. The differences are the hypothetical gains or losses associated with each type of risk.32Our weighted average interest rate for our outstanding borrowings in 2017 and 2016 was 3.0% and 2.1%, respectively.December 31, 2017.January 2, 2022. For debt obligations, the table presents principal cash flows and related weighted average interest rates by year of maturity. Variable interest rates presented for variable-rate debt represent theRate-Sensitive Liabilities 2022 2023 2024 2025 Thereafter Total Fair Value (in thousands) Long-term Debt: Variable Rate $ 15,002 $ 15,002 $ 15,002 $ 180,125 $ — $ 225,131 $ 225,131 Fixed Rate — — — — 300,000 300,000 315,039 onfor our outstanding borrowings under the Syndicated Credit Facility borrowings as of December 31, 2017. $ 15,000 $ 15,000 $ 15,000 $ 15,000 $ 169,928 $ 229,928 $ 229,928 3.0 % 3.0 % 3.0 % 3.0 % 3.0 % our current and any future interest rate swap transactions.December 31, 2017,January 2, 2022, a 10% decrease or increase in the levels of foreign currency exchange rates against the U.S. dollar, with all other variables held constant, would result in a decrease in the fair value of our short-term financial instruments (primarily cash, accounts receivable and accounts payable) of $10.1approximately $11.3 million or an increase in the fair value of our financial instruments of $12.3approximately $13.8 million, respectively. As the impact of offsetting changes in the fair market value of our net foreign investments is not included in the sensitivity model, these results are not indicative of our actual exposure to foreign currency exchange risk.33 $ 996,443 $ 958,617 $ 1,001,863 610,422 589,973 618,974 386,021 368,644 382,889 268,878 263,919 269,296 7,299 19,788 0 109,844 84,937 113,593 7,128 6,130 6,401 2,177 (329 ) 1,426 100,539 79,136 105,766 47,293 24,974 33,348 $ 53,246 $ 54,162 $ 72,418 $ 0.86 $ 0.83 $ 1.10 $ 0.86 $ 0.83 $ 1.10 61,996 65,098 66,027 62,040 65,136 66,075 FISCAL YEAR 2021 2020 2019 Net sales $ 1,200,398 $ 1,103,262 $ 1,343,029 Cost of sales 767,665 692,688 810,062 Gross profit on sales 432,733 410,574 532,967 Selling, general and administrative expenses 324,315 333,229 389,117 Restructuring, asset impairment and other charges 3,621 (4,626) 12,947 Goodwill and intangible asset impairment charge — 121,258 — Operating income (loss) 104,797 (39,287) 130,903 Interest expense 29,681 29,244 25,656 Other expense, net 2,483 10,889 3,431 Income (loss) before income tax expense 72,633 (79,420) 101,816 Income tax expense (benefit) 17,399 (7,491) 22,616 Net income (loss) $ 55,234 $ (71,929) $ 79,200 Earnings (loss) per share – basic $ 0.94 $ (1.23) $ 1.34 Earnings (loss) per share – diluted $ 0.94 $ (1.23) $ 1.34 Common shares outstanding – basic 58,971 58,547 58,943 Common shares outstanding – diluted 58,971 58,547 58,948 34 $ 53,246 $ 54,162 $ 72,418 31,579 (19,011 ) (32,575 ) 904 0 0 (1,692 ) (11,572 ) 6,072 $ 84,037 $ 23,579 $ 45,915 FISCAL YEAR 2021 2020 2019 Net income (loss) $ 55,234 $ (71,929) $ 79,200 Other comprehensive income (loss), after tax: Foreign currency translation adjustment (40,110) 52,808 (11,652) Cash flow hedge gain (loss) 3,468 (2,027) (5,489) Pension liability adjustment 15,400 (12,588) (13,090) Other comprehensive income (loss) (21,242) 38,193 (30,231) Comprehensive income (loss) $ 33,992 $ (33,736) $ 48,969 35 $ 87,037 $ 165,672 142,808 126,004 177,935 156,083 23,087 23,123 430,867 470,882 212,645 204,508 18,003 33,117 68,754 61,218 70,331 65,714 Total assets $ 800,600 $ 835,439 $ 50,672 $ 45,380 110,974 98,703 15,000 15,000 176,646 159,083 214,928 255,347 6,935 4,728 72,000 75,552 470,509 494,710 0 0 5,981 6,424 271,271 359,451 187,432 140,238 (78,943 ) (110,522 ) 904 0 (56,554 ) (54,862 ) 330,091 340,729 $ 800,600 $ 835,439 END OF FISCAL YEAR 2021 2020 ASSETS Current assets Cash and cash equivalents $ 97,252 $ 103,053 Accounts receivable, net 171,676 139,869 Inventories, net 265,092 228,725 Prepaid expenses and other current assets 38,320 23,747 Total current assets 572,340 495,394 Property, plant and equipment, net 329,801 359,036 Operating lease right-of-use assets 90,561 98,013 Deferred tax asset 23,994 18,175 Goodwill and intangibles, net 223,204 253,536 Other assets 90,157 81,857 Total assets $ 1,330,057 $ 1,306,011 LIABILITIES AND SHAREHOLDERS’ EQUITY Current liabilities Accounts payable $ 85,924 $ 58,687 Accrued expenses 146,298 105,739 Current portion of operating lease liabilities 14,588 13,555 Current portion of long-term debt 15,002 15,319 Total current liabilities 261,812 193,300 Long-term debt 503,056 561,251 Operating lease liabilities 77,905 86,468 Deferred income taxes 36,723 34,307 Other long-term liabilities 87,163 104,147 Total liabilities 966,659 979,473 Commitments and contingencies 0 0 Shareholders’ equity Preferred stock, par value $1.00 per share; 5,000 shares authorized; none issued or outstanding at January 2, 2022 and January 3, 2021 — — Common stock, par value $0.10 per share; 120,000 shares authorized; 59,055 and 58,664 shares issued and outstanding at January 2, 2022 and January 3, 2021, respectively 5,905 5,865 Additional paid-in capital 253,110 247,920 Retained earnings 261,434 208,562 Accumulated other comprehensive loss – foreign currency translation (100,441) (60,331) Accumulated other comprehensive loss – cash flow hedge (2,722) (6,190) Accumulated other comprehensive loss – pension liability (53,888) (69,288) Total shareholders’ equity 363,398 326,538 Total liabilities and shareholders’ equity $ 1,330,057 $ 1,306,011 36 OPERATING ACTIVITIES: $ 53,246 $ 54,162 $ 72,418 30,261 30,632 30,803 7,247 5,873 13,948 15,174 0 0 219 145 763 8,154 468 9,052 (10,313 ) (372 ) 18,738 (13,629 ) 2,686 (26,452 ) 1,019 (7,720 ) (8,332 ) 11,975 12,184 15,512 103,353 98,058 126,450 (30,474 ) (28,071 ) (27,188 ) (614 ) 1,642 731 (31,088 ) (26,429 ) (26,457 ) 25,000 87,400 0 (57,014 ) (17,575 ) (45,267 ) (15,000 ) (12,500 ) (2,500 ) (91,576 ) (18,496 ) (13,306 ) (15,487 ) (14,285 ) (11,885 ) (1,479 ) (4,895 ) (1,015 ) (1,427 ) 0 0 0 0 359 (156,983 ) 19,649 (73,614 ) (84,718 ) 91,278 26,379 6,083 (1,302 ) (5,579 ) (78,635 ) 89,976 20,800 165,672 75,696 54,896 $ 87,037 $ 165,672 $ 75,696 FISCAL YEAR 2021 2020 2019 OPERATING ACTIVITIES: Net income (loss) $ 55,234 $ (71,929) $ 79,200 Adjustments to reconcile net income (loss) to cash provided by operating activities: Depreciation and amortization 46,345 45,920 44,932 Stock compensation amortization expense (benefit) 5,467 (502) 8,691 Loss on disposal of fixed assets 4,427 4,996 — Bad debt expense (263) 3,843 1,206 Deferred income taxes and other (16,379) (20,794) (9,497) Amortization of acquired intangible assets 5,636 5,457 5,903 Goodwill and intangible asset impairment — 121,258 — Working capital changes: Accounts receivable (36,096) 40,090 (930) Inventories (47,074) 38,667 2,573 Prepaid expenses and other current assets (4,800) 12,967 (9,691) Accounts payable and accrued expenses 74,192 (60,903) 19,381 Cash provided by operating activities 86,689 119,070 141,768 INVESTING ACTIVITIES: Capital expenditures (28,071) (62,949) (74,647) Other — 1,260 425 Cash used in investing activities (28,071) (61,689) (74,222) FINANCING ACTIVITIES: Revolving loan borrowing 76,000 110,000 90,000 Revolving loan repayments (71,500) (131,024) (87,664) Term loan repayments (60,485) (304,425) (24,028) Proceeds from issuance of Senior Notes due 2028 — 300,000 — Repurchase of common stock — — (25,154) Dividends paid (2,362) (5,565) (15,358) Tax withholding payments for share-based compensation (193) (1,511) (3,278) Debt issuance costs (36) (7,896) — Payments for debt extinguishment costs — (660) — Proceeds from issuance of common stock — 93 60 Finance lease payments (2,282) (1,727) (1,255) Cash used in financing activities (60,858) (42,715) (66,677) Net cash provided by (used in) operating, investing and financing activities (2,240) 14,666 869 Effect of exchange rate changes on cash (3,561) 7,086 (557) CASH AND CASH EQUIVALENTS: Net increase (decrease) (5,801) 21,752 312 Balance, beginning of year 103,053 81,301 80,989 Balance, end of year $ 97,252 $ 103,053 $ 81,301 37The Companyrecognized leaderglobal flooring company specializing in the worldwide commercial interiors market, offering modularcarbon neutral carpet tile and resilient flooring, including luxury vinyl tile (“LVT”)., vinyl sheet, and nora® rubber flooring. The Company manufactures modular carpet focusing on the high quality, designer-oriented sector of the market, sources resilient flooring including LVT from a third party parties and focuses on the same sector of the market, and provides specialized carpet replacement, installation and maintenance services. Additionally,The Company also manufactures and sells resilient rubber flooring.offers Intersept, a proprietary antimicrobial used in a numberlargely completed its integration of interior finishes. Investments in which the Company does not have the ability to exercise significant influence are carried at fair value. The Company monitors investments for other than temporary declines in value and makes reductions in carrying values when appropriate. As of December 31, 2017 and January 1, 2017, the Company did not hold significant investments of this nature.Revenue RecognitionRevenuerecognized whenuncertain. A prolonged COVID-19 pandemic may continue to have a material adverse impact on our operations, financial condition, and supply chains. It may negatively impact our ability to collect outstanding receivables, manage inventory, and service customers. The impact of COVID-19 could result in additional impairment losses related to goodwill, intangible assets, and property, plant and equipment.following criteriavirus spreads through communities, it could impact the physical health, mental health, and productivity of our workforce as many of them are met: persuasive evidencerequired to shelter in place and work from home for prolonged periods of an agreement exists, delivery has occurredtime, and it could also impact our ability to reach our customers and collaborate with them as they are required to shelter in place and work from home for prolonged periods of time. The COVID-19 pandemic is having broad and negative implications on the global economy, which affects the size and timing of our customers’ capital budgets, and could result in delays or servicesterminations of new and existing renovation projects, remodeling projects, new construction projects, and other projects where our products are used.rendered, priceavailable globally to provide assistance to companies impacted by the buyer is fixedpandemic. The Coronavirus Aid, Relief and determinable,Economic Security Act (“CARES Act”) enacted in the United States (see Note 17 entitled “Income Taxes” for additional information) and collectability is reasonably assured. Delivery is not considereda payroll protection program enacted in the Netherlands (the “NOW Program”) have provided benefits related to have occurred until the customer takes title and assumes the risks and rewardspayroll costs either as reimbursements, lower payroll tax rates or deferral of ownership, which is generallypayroll tax payments. The NOW Program has provided eligible companies with reimbursement of labor costs as an incentive to retain employees on the datepayroll.shipment. Provisions for discounts, sales returns and allowances are estimated using historical experience, current economic trends, and the Company’s quality performance. The related provision isapproximately $7.3 million, which were recorded as a $6.1 million reduction of salesselling, general and administrative expenses and a $1.2 million reduction of cost of sales in the sameconsolidated statements of operations. We applied a grant analogy method to recognize the reimbursements under the NOW program as the Company believes it is probable that the benefits received will not be repaid.thatand recorded revenue in accordance with the accounting standards for projects which were underway as of the end of 2021, 2020 and 2019. Material differences may result inThere are no other material costs the amountCompany incurs as part of obtaining the sales contract.timing of net sales for any period if management makes different judgments or uses different estimates.the selling, general and administrative expense caption(“SG&A”) expenses and cost of sales in the consolidated statements of operations. Research and development expense was$14.0 $19.3 million, $14.3$18.6 million, and $14.5$17.8 million for the years 2017,20162021, 2020 and 2015,2019, respectively.38December 31, 2017 January 2, 2022 and January 1, 2017.$6.3$22.9 million, $5.5$32.0 million, and $4.8$22.7 million for the years 2017,2016,2021, 2020 and 2015,2019, respectively. 2020 includes cash payments of $12.5 million to terminate the Company’s interest rate swap liabilities. Income tax payments amounted to approximately $19.1$23.1 million, $12.8$19.3 million and $7.2$34.8 million for the years 2017,20162021, 2020 and 2015,2019, respectively. During the years 2017,20162021, 2020 and 2015,2019, the Company received income tax refunds of $0.1$5.4 million, $0.2$7.5 million and $3.1$1.9 million, respectively.first-in, first-outfirst-in, first-out method) or market.net realizable value. Costs included in inventories are based on invoiced costs and/or production costs, as applicable. Included in production costs are material, direct labor and allocated overhead.The Company writes down inventories for the difference between the carrying value of the inventories and their estimated net realizable value. If actual market conditions are less favorable than those projected by management, additional write-downs may be required.Company’sCompany’s products, and current economic conditions. While management believes that adequate write-downs for inventory obsolescence have been made in the consolidated financial statements, consumer tastes and preferences will continue to change, and the Company could experience additional inventory write-downs in the future.eithereither a reduction of cost of sales in the accompanying consolidated statements of operations, or, if the product inventory is still on hand at the reporting date, it is reflected as a reduction of “Inventories” on the accompanying consolidated balance sheets. Vendor rebates are typically dependent upon reaching minimum purchase thresholds. The Company evaluates the likelihood of reaching purchase thresholds using past experience and current year forecasts. When rebates can be reasonably estimated and receipt becomes probable, the Company records a portion of the rebate as the Company makes progress towards the purchase threshold.vendor’svendor’s product or service, the amount received is recorded as an offset to selling, general and administrativeSG&A expenses in the accompanying consolidated statements of operations.Assets and Liabilities of Businesses Held for Saleconsiders businesses to be heldrecords a right-of-use asset and lease liability for sale when the Board or management, having the relevant authority to do so, approvesoperating and commits tofinance leases once a formal plan to actively marketcontract that contains a business for salelease is executed and the saleCompany has the right to control the use of the leased asset. The right-of-use asset is considered probable. Upon designationmeasured as held for sale, the carryingpresent value of the assetslease obligation. The discount rate used to calculate the present value of the business are recordedlease liability is the Company’s incremental borrowing rate, which is based on the estimated rate for a fully collateralized borrowing that fully amortizes over a similar lease term at the lower of their carrying value or their estimated fair value, less costs to sell. commencement date and for the applicable geographical region.ceasesmade an accounting policy election to record depreciation expense atexclude leases with an initial term of 12 months or less from the calculation of the right-of-use asset and lease liability recorded on the consolidated balance sheets. These leases primarily represent month-to-month operating leases for office equipment where we were reasonably certain that time.we would not elect an option to extend the lease. The Company also made an accounting policy election not to separate lease and non-lease components for all asset classes and accounts for the lease payments as a single component.39$0.6$0.5 million, $0.5$1.9 million, and $0.3$2.1 million for the fiscal years 2017,20162021, 2020 and 2015,2019, respectively. Depreciation expense amounted to approximately $29.5$41.9 million, $30.1$42.4 million, and $30.4$41.5 million for the years 2017,2016,2021, 2020 and 20152019 respectively.Other Intangible AssetsGoodwill isexcess of the purchase price overCompany tests goodwill for impairment annually and between annual tests if an event occurs or circumstances change that would more likely than not reduce the fair value of net assets acquired in business combinations accounted for as acquisitions. Accumulated amortization amounted to approximately $77.3 million at both December 31, 2017 and January 1, 2017, and cumulative impairment losses recognized were $212.6 million as of both December 31, 2017 and January 1, 2017.As of December 31, 2017, and January 1, 2017, the neta reporting unit below its carrying amount of goodwill was $68.8 million and $61.2 million, respectively. Other intangible assets were $0.6 million and $1.0 million as of December 31, 2017 and January 1, 2017, respectively. Amortization expense related to intangible assets during the years 2017,2016 and 2015 was $0.7 million, $0.5 million and $0.3 million, respectivelyThe Company capitalizes patent defense costs when it determines that a successful defense is probable. Any patent defense costs are amortized over the remaining useful life of the patent. During 2016, the Company determined that approximately $3.4 million of patent defense costs related to our TacTiles®carpet tile installation system should be impaired as a successful defense was deemed no longer probable. This impairment is included in “Restructuring and Asset Impairment Charges” in our consolidated statement of operations.2017,20162021, 2020 and 2015, as of the last day of the third quarter of each year,2019, the Company performed the annual goodwill impairment test. In addition, during the first quarter of 2020—primarily due to anticipated impacts of the COVID-19 pandemic—the Company determined that there were indicators of impairment, and the Company proceeded with a goodwill impairment test required by applicable accounting standards.as of the end of the first quarter. The Company performs this testtests goodwill at the reporting unit level, which is one level below the operating segment level for the Modular Carpet segment.level. In effectingperforming the impairment testing, the Company prepared valuations of reporting units on both a market comparable methodology and an income methodology, in accordance with the applicable standards, and those valuations were compared with the respective bookcarrying values of the reporting units to determine whether any goodwill impairment existed. In preparing the valuations, past, present and future expectations of performance were considered. TheSee Note 12 entitled “Goodwill and Intangible Assets” for additional information.testing indicated no potential of goodwill impairment in anytests if an event occurs or circumstances change that would more likely than not reduce the fair value of the years presented.Eachintangible asset below its carrying amount. During the first quarter of the Company’s reporting units maintained fair values in excess2020—primarily due to anticipated impacts of their respective carrying valuesthe COVID-19 pandemic—the Company determined that there were indicators of impairment, and the Company proceeded with an impairment test as of the measurement date, and therefore no impairment was indicated during the impairment testing. As of December 31, 2017, if the Company’s estimatesend of the fair valuesfirst quarter. The Company prepared valuations of its reporting unitsthe intangible assets using the present value of cash flows under the relief from royalty method, which carry a goodwill balance were 10% lower, the Company still believes no goodwill impairment would have existed.The changes incompared to the carrying amountsvalue of goodwillintangible assets to determine whether any impairment existed. See Note 12 entitled “Goodwill and Intangible Assets” for additional information.year ended December 31, 2017 are as follows: $ 61,218 $ 0 $ 0 7,536 $ 68,754 40$4.1$2.7 million and $5.5$3.2 million as of December 31, 2017 January 2, 2022 and January 1, 2017, 3, 2021, respectively, and are included in “Accrued Expenses” in the accompanying consolidated balance sheets. on IncomeCompany’sCompany’s financial statements or tax returns. In estimating future tax consequences, the Company generally considers all expected future events other than enactments of changes in tax laws or rates. The effect on deferred tax assets and liabilities of a change in tax rates will be recognized as income or expense in the period that includes the enactment date.The Company does not record taxes collected from customers and remitted to governmental authorities on a gross basis.Company’sCompany’s ongoing assessments of the more likely than not outcomes of tax authority examinations and related tax positions require significant judgment and can increase or decrease the Company’s effective tax rate as well as impact operating results. For further information, see Note 1317 entitled “Taxes on Income.“Income Taxes.”valuesvalues of cash and cash equivalents and short-term debt approximate cost due to the short period of time to maturity. Fair values of debt are based on quoted market prices or pricing models using current market rates.Company’sCompany’s foreign subsidiaries are measured generally using local currencies as the functional currency. Assets and liabilities of these subsidiaries are translated into U.S. dollars at the exchange rate in effect at each year-end. Income and expense items are translated at average exchange rates for the year. The resulting translation adjustments are recorded in the foreign currency translation adjustment account. In the event of a divestiture of a foreign subsidiary, the related foreign currency translation results are reversedreclassified from equity to income. Foreign currency exchange gains and losses are included in net income (loss). Foreign exchange translation gains (losses) were $31.6$(40.1) million, ($19.0)$52.8 million, and ($32.6)$(11.7) million for the years 2017,20162021, 2020 and 2015,2019, respectively.Income (Loss) Perincome (loss)earnings per share is computed based on the average number of common shares outstanding.outstanding, including participating securities. Diluted income (loss)earnings per share reflects the increase in average common shares outstanding that would result from the assumed exercise of outstanding stock options, calculated using the treasury stock method. See Note 15 entitled “Earnings Per Share” for additional information.41The1014 entitled “Shareholders’ Equity”.2017,20162021, 2020 or 2015.Accounting standards require a company to recognize all derivativesDerivativesFor derivatives that do not meet the criteria of an accounting hedge must be adjusted to fair value through income. If the derivative is a fair value hedge, changes in the fair value of the hedged assets, liabilities or firm commitments are recognized through earnings. If the derivative is aas designated cash flow hedge,hedges, the effective portion of changes in the fair value of the derivative are recognized in other comprehensive income (or other comprehensive loss) until the hedged item is recognized in earnings. The ineffective portion of a derivative’s changeChanges in the fair value is immediatelyof derivatives not designated as hedging instruments are recognized in earnings. In 2017,earnings each period. Derivative liabilities are recorded in accrued expenses and derivative assets are recorded in other current assets in the Company entered in to an interest rate swap instrument that it hasconsolidated balance sheets. Cash flows from all derivative instruments, including those not designated as a derivative instrument. See further discussion of this instrument belowhedging instruments, are classified in Note 8 entitled “Borrowings”.Environmental RemediationThe Company provides for remediation costs and penalties whenresponsibility to remediate is probable and the amountfirst quarter of associated costs is reasonably determinable. Remediation liabilities are accrued based on estimates of known environmental exposures and are discounted in certain instances. The Company regularly monitors the progress of environmental remediation. Should studies indicate that the cost of remediation is to be more than previously estimated, an additional accrual would be recorded in the period in which such determination is made. As of December 31, 2017, and January 1, 2017, no significant amounts were provided for remediation liabilities.Allowances for Doubtful AccountsThe Company maintains allowances for doubtful accounts for estimated losses resulting from the inability of customers to make required payments. Estimating this amount requires2021, the Company determined that it has two operating and reportable segments – namely Americas (“AMS”) and Europe, Africa, Asia and Australia (collectively “EAAA”). The AMS operating segment is unchanged from prior year and continues to analyzeinclude the financial strengths of its customers. If the financial condition of the Company’s customers were to deteriorate, resulting in an impairment of their ability to make payments, additional allowances may be required. By its nature, such an estimate is highly subjective,United States, Canada and it is possible that the amount of accounts receivable that the Company is unable to collect may be different than the amount initially estimated.ReclassificationsCertain prior period amountsLatin America geographic areas. Segment disclosures for 2020 and 2019 have been reclassifiedrestated to conform to the current reportable segment structure.financial statement2019 amounts as reported in the Company’s Annual Report on Form 10-K for the year ended December 29, 2019 have been made to conform to the current presentation. These reclassifications had no effect on reported income, comprehensive income, cash flows, or shareholders’ equity as previously reported. Total assets as previously reported was impacted by the adoption of an accounting standard addressing the treatment of deferred taxes as discussed below.Fiscal Year 2019 Statement of Operations Line Item As Reported Reclassification As Reclassified (in thousands) Cost of sales $ 817,575 $ (7,513) $ 810,062 Selling, general and administrative expenses 381,604 7,513 389,117 Total $ 1,199,179 $ — $ 1,199,179 Company’sCompany’s fiscal year is the 52 or 53 week period ending on the Sunday nearest December 31. All references herein to “2017,“2021,”“2016, “2020,” and “2015,“2019,” mean the fiscal years ended December 31, 2017, January 1, 2017, and 2, 2022, January 3, 2016 2021, and December 29, 2019, respectively. Fiscal year 2015 was2021 is comprised of 5352 weeks, while fiscal years 2017 and 2016 were each2020 is comprised of 53 weeks, and 2019 is comprised of 52 weeks.May 2014,November 2021, the Financial Accounting Standards Board (“FASB”) issued an accounting standard regarding recognitionASU 2021-10, “Government Assistance (Topic 832): Disclosures by Business Entities about Government Assistance.”The amendments in this update require annual disclosure of revenue from contractstransactions with customersa government that will supersede the existing revenue recognition under U.S. GAAP. In summary, the core principle of this standard, along with various subsequent amendments, is thatprovides assistance to an entity recognizes revenue to depict the transfer of promised goodsthat is accounted for by applying a grant or services to customers in an amount that reflects the consideration to which the entity expects to be entitled in exchange for those goods or services. Additionally, the new standard requires enhancedcontribution model by analogy. Required disclosures aboutinclude the nature amount, timing,of the transaction and uncertainty of revenue and cash flows arising from customer contracts, including revenue recognition policiesthe accounting policy applied to identify performance obligations, assets recognized from costs incurred to obtain and fulfill a contract,account for the transaction, the financial statement line items affected by the transaction and significant judgments in measurementsterms and recognition.conditions. The standard, as amended, will beamendments are effective for annual periods beginning after December 15, 2017, including interim periods within that reporting period. Nearly 95% of the Company’s current revenue is produced from the sale of carpet, hard surface flooring and related products (TacTiles installation system, etc.) and the revenue from sales of these products is recognized upon shipment, or in certain cases upon delivery to the customer. There does not exist any performance or any other obligation after the sale of these products outside of the product warranty, which has not historically been of significance compared to total product sales. There is a small portion of the Company’s revenues (approximately 5%) that is for the sale and installation of carpet and related products. Of these projects, the overwhelming majority are completed in less than two weeks and therefore the Company does not expect a significant shift in the timing of revenue recognition for these sales either. Upon adoption of this standard, the company will change the accounting for these projects to recognize the major components of revenue over time. However, it is not expected that this change will have a significant impact upon our results of operations given the generally short period of time of these projects. As of the end of 2017, the amount of revenue that would have been recognized under the new standard versus previous guidance was not significant. The standard offers practical expedients to help with adoption. The Company will apply the portfolio approach expedient, which is applicable as its sales contracts share similar characteristics. The Company will apply the practical expedient regarding the accounting for costs to obtain contracts, as its costs for such contracts are primarily sales commissions which are recognized within a year of the sale of product. The Company will use the modified retrospective method of adoption, but as noted the impact as of year-end was insignificant. Given the nature of the Company’s sales, it currently believes that revenue recognition under the new standard will be mostly consistent under both the current and new standards, with performance obligations being satisfied under the majority of contracts with customers upon shipment or delivery of product. Given the nature of the Company’s revenue there is not expected to be significant changes to the Company’s information systems as a result of this adoption.In November 2015, the FASB issued an accounting standard which requires deferred tax assets and liabilities, as well as any related valuation allowance, be classified as noncurrent on the balance sheet. As a result, each jurisdiction will only have one net noncurrent deferred tax asset or liability. This standard does not change the existing requirement that only permits offsetting within a jurisdiction. The amendments in the standard may be applied either prospectively or retrospectively to all prior periods presented. The new guidance is effective for annual periods beginning after December 15, 2016, and interim periods within those annual periods, with early adoption permitted. The Company adopted this standard in the first quarter of 2017 and applied this standard retrospectively by recording a reduction of current assets of $10.0 million and a corresponding increase in long term assets of $5.9 million as well as a reduction of long term liabilities of $4.1 million.In March 2016, the FASB issued an accounting standard update to simplify several aspects of accounting for share-based payment transactions, including the income tax consequences, classification of awards as either equity or liabilities, and the classification on the statement of cash flows. In addition, an entity can make an entity-wide accounting policy election to either estimate the number of awards that are expected to vest, which is the current U.S. GAAP practice, or account for forfeitures when they occur. This update is effective for fiscal periods beginning after December 15, 2016, including interim periods within that reporting period. The element of the new standard having the most impact on the Company’s financial statements is income tax consequences. Excess tax benefits and tax deficiencies on stock-based compensation awards are now included in the tax provision within the consolidated statement of operations as discrete items in the reporting period in which they occur, rather than the previous accounting of recording them in additional paid-in capital on the consolidated balance sheet. The adoption of this standard resulted in an increase in deferred tax assets of approximately $9.4 million, with a corresponding increase to equity accounts, in 2017. See further discussion of this amount in Note 13 “Taxes on Income.” There was an impact of this standard on the consolidated statement of cash flows upon adoption, as under the standard when an employer withholds shares for tax withholding purposes those related tax payments are treated as financing activities, not as operating activities. Upon adoption in the first quarter of 2017, this resulted in a reclassification of $4.6 million of such tax payments in 2016 from operating activities to financing activities, and $1.0 million of such tax payments in 2015 from operating activities to financing activities. The Company has elected to continue its current policy of estimating forfeitures of stock-based compensation awards at the time of grant and revising in subsequent periods to reflect actual forfeitures, which is allowable under the new standard.In February 2016, the FASB issued a new accounting standard regarding leases. The new standard establishes a right-of-use (ROU) model that requires a lessee to record a ROU asset and a lease liability on the balance sheet for all leases with terms longer than 12 months. Leases will be classified as either finance or operating, with classification affecting the pattern of expense recognition in the income statement. The new standard is effective for fiscal years beginning after December 15, 2018, including interim periods within those fiscal years. A modified retrospective transition approach is required for lessees for capital and operating leases existing at, or entered after, the beginning of the earliest comparative period presented in the financial statements, with certain practical expedients available. The Company is currently evaluating the impact of our pending adoption of the new standard on our consolidated financial statements, but the standard will result in the Company recording both assets and liabilities for leases currently classified as operating leases.In January 2017, the FASB issued a new accounting standard that provides for the elimination of Step 2 from the goodwill impairment test. Under the new guidance, impairment charges are recognized to the extent the carrying amount of a reporting unit exceeds its fair value with certain limitations. The new guidance is effective for any annual or any interim goodwill impairment tests in fiscal years beginning after December 15, 2019.2021. Early adoption is permitted. The Company does not anticipate thatadopted this ASU on January 2, 2022 and applied the disclosures retrospectively to transactions reflected in its financial statements at adoption, as permitted by the ASU. See Note 1 entitled “Summary of Significant Accounting Policies” of this Form 10-K for required information as it pertains to government assistance received during the new guidance will have a material effect on its consolidated financial statements.2017, 2020, the FASB issued a new accounting standard regardingASU 2020-04, “Reference Rate Reform (Topic 848): Facilitation of the treatmentEffects of net periodic benefit costs.Reference Rate Reform on Financial Reporting.” This standard will require segregation of these net benefit costs between operating and non-operating expenses. Currently,addresses the Company reportsrisks from the net benefit costs associated with its defined benefit plans as a component of operating income. The new standard is effective for fiscal years beginning after December 15, 2017, including interim periods within those fiscal years. When the new standard is implemented, only the service cost component of defined benefit plan costs will be reported within operating income, while all other components of net benefit cost will be presented within the “Other Expense (income)” line item on the consolidated statements of operations. The standard requires retrospective application, and as such upon adoption this standard will result in offsetting changes in operating income and “Other Expense (income)” on the consolidated statements of operations for all periods presented, with no impact on net income. Upon adoption in 2018 the Company will reclassify $1.9 million and $2.2 million for 2017 and 2016, respectively, from operating expenses to other expense.In February 2018, the FASB issued a new accounting standard to address a narrow-scope financial reporting issue that arose as a consequencediscontinuation of the Tax Act. Existing guidance requiresLondon Interbank Offered Rate (LIBOR) and provides optional expedients and exceptions to contracts, hedging relationships and other transactions that deferred tax liabilities and assets be adjusted for a change in tax laws or rates with the effect included in income from continuing operations in the reporting period that includes the enactment date. That guidance is applicable even in situations in which the related income tax effects of items in accumulated other comprehensive income were originally recognized in other comprehensive income (rather than in net income), such as amounts related to benefit plans and hedging activity. As a result, the tax effects of items within accumulated other comprehensive income do not reflect the appropriate tax rate (the difference is referred to as stranded tax effects). The new guidance allows for a reclassification of these amounts to retained earnings thereby eliminating these stranded tax effects. Thereference LIBOR if certain criteria are met. This new guidance is effective for interim and annual periodsmay be applied beginning afterMarch 12, 2020 through December 15, 2018.31, 2022. As discussed in Note 9 entitled “Long-Term Debt”: the Company adopted this ASU on December 9, 2021 in connection with the fourth amendment to the Syndicated Credit Facility, which among other things, provided amendments to replace the LIBOR interest rate benchmark applicable to loans with specified successor benchmark rates. The Company is currently evaluating the impact of adoption of this standardASU did not have a material impact on itsour consolidated financial statements.Fiscal Year Geography 2021 2020 2019 Americas 54.3% 53.8% 56.4% Europe 31.7% 31.8% 29.3% Asia-Pacific 14.0% 14.4% 14.3% 34–RECEIVABLESreceivables from sales to owners and users of commercial office facilities and with specifiers such as architects, engineers and contracting firms.receivables. Management believes that credit risks are further moderated by the diversity of its end customers and geographic sales areas. The Company performs ongoing credit evaluations of its customers’customers’ financial condition and requires collateral as deemed necessary. The Company maintains allowances for doubtful accounts for estimatedexpected credit losses resulting from the inability of customers to make required payments. If the financial condition of its customers were to deteriorate, resulting in an impairment of their ability to make payments, additional allowances may be required. As of December 31, 2017, January 2, 2022 and January 1, 2017, 3, 2021, the allowance for bad debtsexpected credit losses amounted to $3.5$5.0 million and $3.8$6.6 million, respectively, for all accounts receivable of the Company. Reserves for warranty and returns allowances amounted to $4.1 million and $5.5 million as of December 31, 2017 and January 1, 2017, respectively.45–FAIR VALUE OF FINANCIAL INSTRUMENTSThe Company does not have significant assets and liabilities measured aton a recurring basishierarchy that prioritizes the inputs to valuation techniques used to measure estimated fair value. The hierarchy gives the highest priority to unadjusted quoted prices in active markets for identical assets or liabilities (level 1 measurements) and the lowest priority to unobservable inputs (level 3 measurements). The three levels of the fair value hierarchy under applicable accounting standards are described below:January 2, 2022 January 3, 2021 Carrying Value Fair Value (Level 1) Fair Value (Level 2) Carrying Value Fair Value (Level 2) (in thousands) Assets: Company-owned life insurance $ 22,378 $ — $ 22,378 $ 22,048 $ 22,048 Deferred compensation investments 35,578 15,557 20,021 33,939 33,939 Liabilities: $ 225,131 $ — $ 225,131 $ 285,215 $ 285,215 300,000 — 315,039 300,000 315,999 ofcurrent liabilities on the end of 2017.consolidated balance sheets.Company does have approximately $23.7 millionfair value of Company-owned life insurance which is measured on a readily determinable cash surrender value on a recurring basis. Company-owned life insurance is recorded at fair value within other assets in the consolidated balance sheets.As of December 31, 2017, the carrying value of the Company’s borrowings under its Syndicated Credit Facility approximates fair value as the Facility bears interest rates that are similar to existing market rates. The Company does hedge its interest rate exposureSee Note 19 entitled “Employee Benefit Plans” for additional information on $100 million of borrowings on the Syndicated Credit Facility and this cash flow hedge is measured at fair value. See discussion of this instrument below in Note 8 entitled “Borrowings”.defined benefit plan assets.44NOTE 5– INVENTORIESfollows: $ 115,512 $ 104,742 13,022 8,711 49,401 42,630 Inventory, Net $ 177,935 $ 156,083 End of Fiscal Year 2021 2020 (in thousands) Finished goods $ 182,896 $ 152,836 Work-in-process 15,185 17,109 Raw materials 67,011 58,780 Inventories, net $ 265,092 $ 228,725 $20.4$27.1 million and $17.6$35.0 million as of December 31, 2017 January 2, 2022 and January 1, 2017, 3, 2021, respectively, and have been netted against amounts presented above.NOTE 6– PROPERTY AND EQUIPMENT $ 17,743 $ 16,063 130,919 121,216 371,300 350,539 519,962 487,818 (307,317 ) (283,310 ) Property and Equipment $ 212,645 $ 204,508 The estimated cost to complete construction-in-progress at December 31, 2017, was approximately $61.5 million. End of Fiscal Year 2021 2020 (in thousands) Land $ 17,237 $ 18,348 Buildings and improvements 176,980 176,702 642,390 657,796 836,607 852,846 (506,806) (493,810) Property, plant and equipment, net $ 329,801 $ 359,036 78–ACCRUED EXPENSES $ 71,760 $ 58,927 362 114 2,568 10,291 19,948 11,467 4,569 3,101 4,111 5,529 7,656 9,274 Accrued Expenses $ 110,974 $ 98,703 Other non-current liabilities include pension liability of $43.3 million and $47.3 million as of December 31, 2017 and January 1, 2017, respectively (see the discussion below in Note 15 entitled “Employee Benefit Plans”). End of Fiscal Year 2021 2020 (in thousands) Compensation $ 96,802 $ 79,306 Interest 1,577 2,507 Restructuring 2,354 1,064 Taxes 25,295 2,073 Accrued purchases 5,588 5,916 Warranty and sales allowances 2,702 3,248 Other 11,980 11,625 Accrued Expenses $ 146,298 $ 105,739 45NOTE 8– BORROWINGSJanuary 2, 2022 January 3, 2021 Outstanding Principal Outstanding Principal (in thousands) (in thousands) Syndicated Credit Facility: Revolving loan borrowings $ 7,500 4.00 % $ 3,000 4.00 % Term loan borrowings 217,631 1.84 % 282,215 1.87 % Total borrowings under Syndicated Credit Facility 225,131 1.91 % 285,215 1.89 % 5.50% Senior Notes due 2028 300,000 5.50 % 300,000 5.50 % Total debt 525,131 585,215 Less: Unamortized debt issuance costs (7,073) (8,645) Total debt, net 518,058 576,570 Less: Current portion of long-term debt (15,002) (15,319) Total long-term debt, net $ 503,056 $ 561,251 Pursuant to an Amended and Restated Agreement entered into on August 8, 2017, the Company has a syndicated credit facility (the “Facility”) pursuantprovides to which the lenders provideCompany U.S. denominated and multicurrency term loans and provides to the Company and certain of its subsidiaries a multicurrency revolving credit facility and providefacility. At January 2, 2022, the Facility provided to the Company and certain of its subsidiaries a multicurrency revolving loan facility up to $300.0 million, as well as other U.S. denominated and multicurrency term loan.loans. At January 2, 2022, the Company had available borrowing capacity of $290.9 million under the revolving loan facility.key featurespurpose of this amendment was to provide for certain provisions, including but not limited to the following:areto include additional consolidated net leverage ratio levels with increased pricing at higher levels of leverage; (3) amended interest rate provisions to provide for an interest rate floor of either 0.00% or 0.75%, as follows:●The Facility matures on August 8,2022.●The Facility includes a multicurrency revolving loan facility made available to the Company and its principal subsidiaries in Europe and Australia not to exceed $250 million in the aggregate at any one time outstanding. A sublimit of $40 million exists for the issuance of letters of credit under the Facility.●The Facility includes a Term Loan A borrowing principal that had an original principal amount of $177.5 million.●The Facility provides for required amortization payments of the Term Loan A borrowing, as well as mandatory prepayments of the Term Loan A borrowing (and any term loans made available pursuant to any future multicurrency loan facility increase) from certain asset sales, casualty events and debt issuances, subject to certain qualifications and exceptions as provided for therein.●Advances under the Facility are secured by a first-priority lien on substantially all of the Company’s assets and the assets of each of its material domestic subsidiaries, which have guaranteed the Facility.●The Facility contains financial covenants (specifically, a consolidated net leverage ratio and a consolidated interest coverage ratio) that must be met as of the end of each fiscal quarter.●The Company has the option to increase the borrowing availability under the Facility, either for revolving loans or term loans, by up to $150 million, subject to the receipt of lender commitments for the increase and the satisfaction of certain other conditions.Interest Ratesapplicable, on certain tranches of term loans outstanding; and (4) provided temporary restrictions during the Relief Period on the Company’s ability to make acquisitions, pay dividends, repurchase shares, or enter into new credit facilities without lender consent. The Company incurred approximately $1.5 million in debt issuance costs to execute this amendment. Of this amount, approximately $1.0 million of debt issuance costs associated with term loan borrowings was recorded as a reduction of long-term debt, and approximately $0.5 million of debt issuance costs associated with revolving loan borrowings was recorded in other assets in the consolidated balance sheet. These costs will be amortized over the life of the outstanding debt.. 1.50% over the applicable base interest rate (which is defined as the greatest of the prime rate, a specified federal funds rate plus 0.50%, or a specified Eurocurrency rate)2.00%, depending on the Company’s consolidated net leverage ratio as of the most recently completed fiscal quarter. Interest on Eurocurrency-based loans and fees for letters of credit are charged at varying rates computed by applying a margin ranging from 1.25% to 2.50%3.00% over the applicable Eurocurrency rate, depending on the Company’s consolidated net leverage ratio as of the most recently completed fiscal quarter. In addition, the Company pays a commitment fee ranging from 0.20% to 0.35%0.40% per annum (depending on the Company’s consolidated net leverage ratio as of the most recently completed fiscal quarter) on the unused portion of the Facility.Amortization Payments. The Company is required to make quarterly amortization payments of $3.75 million of the Term Loan A borrowing.. ●create or incur liens on assets;●make acquisitions of or investments in businesses (in excess of certain specified amounts);●incur indebtedness or contingent obligations;●sell or dispose of assets (in excess of certain specified amounts);●pay dividends or repurchase the Company’s stock (in excess of certain specified amounts);●repay other indebtedness prior to maturity unless the Company meets certain conditions; and●enter into sale and leaseback transactions.Company’sCompany’s consolidated results for the year then ended:●Consolidated Net Leverage Ratio: Must be no greater than3.75:1.00.●Consolidated Interest Coverage Ratio: Must be no less than 2.25:1.00.46•Consolidated Secured Net Leverage Ratio: Must be no greater than 3.00:1.00.. $20$20 million), after giving effect to any applicable notice and right to cure provisions, an event of default will exist. If an event of default exists and is continuing, the lenders’ Administrative Agent may, and upon the written request of a specified percentage of the lender group shall:●declare all commitments of the lenders under the facility terminated;●declare all amounts outstanding or accrued thereunder immediately due and payable; and●exercise other rights and remedies available to them under the agreement and applicable law.. ana Second Amended and Restated Security and Pledge Agreement, executed on the same date, the Facility is secured by substantially all of the assets of the Company and its domestic subsidiaries (subject to exceptions for certain immaterial subsidiaries), including all of the stock of the Company’s domestic subsidiaries and up to 65% of the stock of its first-tierfirst-tier material foreign subsidiaries. If an event of default occurs under the Facility, the lenders’ Administrative Agent may, upon the request of a specified percentage of lenders, exercise remedies with respect to the collateral, including, in some instances, foreclosing mortgages on real estate assets, taking possession of or selling personal property assets, collecting accounts receivables, or exercising proxies to take control of the pledged stock of domestic and first-tierfirst-tier material foreign subsidiaries.In December 2016, one of the Company’s foreign subsidiaries borrowed 61 million euros (approximately $63.5 million) under the Syndicated Credit Facility. The funds were distributed to its U.S. parent company to fund then-current and projected U.S. cash needs. A significant portion of these borrowings were repaid in 2017.December 31, 2017, both January 2, 2022 and January 3, 2021, the Company had outstanding $170.0 million of Term Loan A borrowing and $59.9 million of revolving loan borrowings outstanding under the Facility, and had $6.0$1.6 million in letters of credit outstanding under the Facility. As of December 31, 2017, the weighted average interest rate on borrowings outstanding underwas 3.0%.Interest Rate Risk ManagementShortly after entering into the Amended and Restated Facility Agreement,entered intoissued $300.0 million aggregate principal amount of 5.50% Senior Notes due December 2028 (the “Senior Notes”). The Senior Notes bear an interest rate swap transactionat 5.50% per annum and mature on December 1, 2028. Interest is paid semi-annually on June 1 and December 1 of each year, beginning on June 1, 2021. The Company used the net proceeds to fix the variable interest rate on a portionrepay approximately $269.7 million of itsoutstanding term loan borrowings in order to manage a portionand approximately $21.0 million of outstanding revolving loan borrowings under its exposure to interest rate fluctuations. The Company’s objective and strategyexisting Facility. In connection with respect to this interest rate swap is to protectthe issuance of the Senior Notes, the Company against adverse fluctuationsrecorded approximately $5.7 million of debt issuance costs. These costs were recorded as a reduction of long-term debt in interest rates by reducing its exposure to variability to cash flows relating to interest payments on a portionthe consolidated balance sheet and will be amortized over the life of itsthe outstanding debt.is meetingunder its objective by hedgingexisting Facility.riskCompany may redeem the Senior Notes, in whole or in part, at any time at the redemption prices listed below, plus accrued and unpaid interest, if any, to (but excluding) the redemption date, if redeemed during the 12-month period commencing on December 1 of changes in its cash flows (interest payments) attributablethe years set forth below:Period Redemption Price 2023 102.750 % 2024 101.375 % 2025 and thereafter 100.000 % changes in LIBOR,35% of the designated benchmark interest rate being hedged (the “hedged risk”), on anaggregate principal amount of the Company’s debt principalSenior Notes before December 1, 2023 with the proceeds of certain equity offerings at a redemption price of 105.50%, plus accrued and unpaid interest, if any, to (but excluding) the redemption date. The Company may also redeem all or a part of the Senior Notes before December 1, 2023 at a price equal to 100% of the outstanding swap notional amount.Cash Flow Interest Rate SwapCompany’s interest rate swap is designatedindenture governing the Senior Notes contains standard and qualifiescustomary covenants for agreements of this type, including various reporting, affirmative and negative covenants. Among other things, these covenants limit the Company’s and its subsidiaries’ ability to:cash flow hedgebankruptcy or similar event), after giving effect to any applicable notice and right to cure provisions, an event of forecasted interest payments. The Company reportsdefault will exist. If an event of default exists and is continuing, the effective portionterms of the fair value gainindenture permit the trustee or loss on the swap as a componentholders of other comprehensive income (or other comprehensive loss). Gains or losses (if any) on any ineffective portion of derivative instrumentsat least 25% in cash flow hedging relationships are recorded in the period in which they occur as a component of other expense (or other income) in the consolidated condensed statement of operations. There were no such gains or losses in 2017. The aggregate notionalprincipal amount of outstanding Senior Notes to declare the swap as of December 31, 2017 was $100 million.As of December 31, 2017, principal, premium, if any, and accrued but unpaid interest on all the fair value of the cash flow interest rate swap asset was $0.9 millionSenior Notes to be due and was recorded in other assets and accumulated other comprehensive income.$9.8 $6.0 million of other lines of credit available at interest rates ranging from 2.5%3.5% to 6.5%6.0%. As of December 31, 2017, January 2, 2022 and January 1, 2017, 3, 2021, there were no borrowings outstanding under these lines of credit.47Borrowing CostsDeferred$2.3$1.6 million and $1.4$2.0 million, as of December 31, 2017January 2, 2022 and January 1, 2017,3, 2021, respectively. These amounts are included in other long term assets in the Company’s consolidated balance sheets. The Company amortizes these costs over the life of the related debt. Expenses related to such costs for the years 2017, 2016,2021, 2020 and 20152019 amounted to $0.5$0.4 million, for each of those years.20172021 are as follows: $ 15,000 15,000 15,000 15,000 169,928 0 Total Debt $ 229,928 Fiscal Year Amount (in thousands) 2022 $ 15,002 2023 15,002 2024 15,002 2025 180,125 2026 — Thereafter 300,000 Total Debt $ 525,131 910– DERIVATIVE INSTRUMENTSAsset Derivatives as of January 3, 2021 Liability Derivatives as of January 3, 2021 Balance Sheet
LocationFair Value Balance Sheet
LocationFair Value (in thousands) Derivative instruments designated as hedging instruments: Interest rate swap contracts Other current assets $ — Accrued expenses $ — Derivative instruments not designated as hedging instruments: Foreign currency options Other current assets 37 Accrued expenses — $ 37 $ — Fiscal Year 2020 2019 (in thousands) Foreign currency contracts gain $ — $ 468 Interest rate swap contracts loss (2,027) (5,957) Loss recognized in other comprehensive income (loss) $ (2,027) $ (5,489) Fiscal Year Statement of Operations Location 2021 2020 2019 (in thousands) Foreign currency options gain (loss) Other expense $ 408 $ 13 $ (627) January 2, 2022 January 3, 2021 Balance Sheet Location Operating Leases Finance Leases Operating Leases Finance Leases (in thousands) Operating lease right-of-use assets $ 90,561 $ 98,013 Current portion of operating lease liabilities $ 14,588 $ 13,555 Operating lease liabilities 77,905 86,468 Total operating lease liabilities $ 92,493 $ 100,023 Property, plant and equipment, net $ 6,547 $ 6,138 Accrued expenses $ 1,837 $ 1,496 Other long-term liabilities 3,201 2,688 Total finance lease liabilities $ 5,038 $ 4,184 Fiscal Year 2021 2020 2019 (in thousands) Finance lease cost: Amortization of right-of-use assets $ 2,653 $ 1,251 $ 890 Interest on lease liabilities 140 86 51 Operating lease cost 21,581 25,213 24,246 Short-term lease cost 977 525 2,057 Variable lease cost 2,831 3,970 3,665 Total lease cost $ 28,182 $ 31,045 $ 30,909 Fiscal Year 2021 2020 2019 (in thousands) Cash paid for amounts included in the measurement of lease liabilities: Operating cash flows from finance leases $ 108 $ 86 $ 51 Operating cash flows from operating leases 22,210 22,206 22,597 Financing cash flows from finance leases 2,282 1,727 1,255 Right-of-use assets obtained in exchange for new finance lease liabilities 3,259 2,546 2,240 Right-of-use assets obtained in exchange for new operating lease liabilities 13,330 2,504 12,655 End of Fiscal Year 2021 2020 Weighted-average remaining lease term – finance leases (in years) 3.20 3.35 Weighted-average remaining lease term – operating leases (in years) 9.97 10.61 Weighted-average discount rate – finance leases 2.82 % 2.64 % Weighted-average discount rate – operating leases 5.87 % 5.98 % Fiscal Year Operating Leases Finance Leases (in thousands) 2022 $ 17,883 $ 1,919 2023 13,734 1,541 2024 12,189 1,161 2025 10,455 466 2026 10,655 150 Thereafter 60,618 49 Total future minimum lease payments (undiscounted) 125,534 5,286 Less: Present value discount (33,041) (248) Total lease liability $ 92,493 $ 5,038 AMS EAAA Total (in thousands) Goodwill balance, at December 29, 2019 $ 116,202 $ 141,237 $ 257,439 Impairment — (116,495) (116,495) Foreign currency translation 6,142 18,691 24,833 Goodwill balance, at January 3, 2021 122,344 43,433 165,777 Foreign currency translation (13,839) (4,913) (18,752) Goodwill balance, at January 2, 2022 $ 108,505 $ 38,520 $ 147,025 $1.00$1.00 par value preferred stock in one or more series and to determine the rights and preferences of each series, to the extent permitted by the Articles of Incorporation, and to fix the terms of such preferred stock without any vote or action by the shareholders. The issuance of any series of preferred stock may have an adverse effect on the rights of holders of common stock and could decrease the amount of earnings and assets available for distribution to holders of common stock. In addition, any issuance of preferred stock could have the effect of delaying, deferring or preventing a change in control of the Company. As of December 31, 2017, January 2, 2022 and January 1, 2017, 3, 2021, there were no shares of preferred stock issued.Preferred Share Purchase Rights The Company has previously issued one purchase right (a “Right”) in respect of each outstanding share of Common Stock pursuant to a Rights Agreement it entered into in March 2008. Each Right entitles the registered holder of the Common Stock to purchase from the Company one one-hundredth of a share (a “Unit”) of Series B Participating Cumulative Preferred Stock (the “Series B Preferred Stock”).The Rights may have certain anti-takeover effects. The Rights will cause substantial dilution to a person or group that acquires (without the consent of the Company’s Board of Directors) 15% or more of the outstanding shares of Common Stock or if other specified events occur without the Rights having been redeemed or in the event of an exchange of the Rights for Common Stock as permitted under the Shareholder Rights Plan.The dividend and liquidation rights of the Series B Preferred Stock are designed so that the value of one Unit of Series B Preferred Stock issuable upon exercise of each Right will approximate the same economic value as one share of Common Stock, including voting rights. The exercise price per Right is $90, subject to adjustment. Shares of Series B Preferred Stock will entitle the holder to a minimum preferential dividend of $1.00 per share, but will entitle the holder to an aggregate dividend payment of 100 times the dividend declared on each share of Common Stock. In the event of liquidation, each share of Series B Preferred Stock will be entitled to a minimum preferential liquidation payment of $1.00, plus accrued and unpaid dividends and distributions thereon, but will be entitled to an aggregate payment of 100 times the payment made per share of Common Stock. In the event of any merger, consolidation or other transaction in which Common Stock is exchanged for or changed into other stock or securities, cash or other property, each share of Series B Preferred Stock will be entitled to receive 100 times the amount received per share of Common Stock. Series B Preferred Stock is not convertible into Common Stock.Each share of Series B Preferred Stock will be entitled to 100 votes on all matters submitted to a vote of the shareholders of the Company, and shares of Series B Preferred Stock will generally vote together as one class with the Common Stock and any other voting capital stock of the Company on all matters submitted to a vote of the Company’s shareholders.48Further, whenever dividends on the Series B Preferred Stock are in arrears in an amount equal to six quarterly payments, the Series B Preferred Stock, together with any other shares of preferred stock then entitled to elect directors, shall have the right, as a single class, to elect one director until the default has been cured.Prior to entering into the March 2008 Rights Agreement, which expires on March 16, 2018, the Company maintained a substantially similar Rights Agreement that was entered into in 1998.1014–SHAREHOLDERS’ EQUITYPrior to March 5, 2012, the Company had two classes of common stock – Class A Common Stock and Class B Common Stock. On March 5, 2012, the number of issued and outstanding shares of Class B Common Stock constituted less than 10% of the aggregate number of issued and outstanding shares of the Company’s Class A Common Stock and Class B Common Stock, as the cumulative result of varied transactions that caused the conversion of shares of Class B Common Stock into shares of Class A Common Stock. Accordingly, the Class A Common Stock and Class B Common Stock are now, irrevocably from March 5, 2012, a single class of Common Stock in all respects. Following the March 5, 2012 event, the$0.10$0.10 par value Common Stock.Company’sCompany’s Common Stock is traded on the Nasdaq Global Select Market under the symbol TILE.$0.25$0.04 per share in 2017,$0.222021, $0.095 per share in 2016,2020, and $0.18$0.26 per share in 2015,2019, to each share of Common Stock.Stock, including participating securities. The future declaration and payment of dividends is at the discretion of the Company’s Board, and depends upon, among other things, the Company’s investment policy and opportunities, results of operations, financial condition, cash requirements, future prospects, and other factors that may be considered relevant at the time of the Board’s determination. Such other factors include limitations contained in the agreement for its syndicated credit facility,Syndicated Credit Facility and the indenture governing its 5.50% Senior Notes due 2028, which specifiesspecify conditions as to when any dividend payments may be made. As such, the Company may discontinue its dividend payments in the future if its Board determines that a cessation of dividend payments is proper in light of the factors indicated above.On October 7, 2014, the Company announced a program to repurchase up to 500,000 shares of common stock per fiscal year, commencing with the 2014 fiscal year. On November 19, 2015, the Board of Directors amended the program to provide that the 500,000 shares of common stock previously approved for repurchases for the 2016 fiscal year may be repurchased by the Company, in management’s discretion, during the period commencing on November 19, 2015 and ending at the conclusion of fiscal year 2016.2016, the Company amended the share purchase program to authorize the repurchase of up to $50 million of common stock. This amended program had no specific expiration date. During the first three months of 2017, the Company completed the $50 million repurchase program. In the second quarter of 2017, the Company adopted a new share repurchase program in which the Company iswas authorized to repurchase up to $100$100 million of its outstanding shares of common stock. The program has had no specific expiration date.Pursuant to the above-described programs, the Company has repurchased shares in the past three years as follows. During 2015, the Company repurchased and retired 650,000 shares of common stock at an average purchase price of $20.47 per share. During 2016, the Company repurchased and retired 1,177,600 shares of common stock at a weighted average purchase price of $15.68 per share. During 2017,2019, the Company repurchased and retired a combined total of 4,628,3001,556,000 shares, under these plans, at an average purchase price of $19.76$16.13 per share. As of December 31, 2017, 29, 2019, the Company had approximately $39.5 million of availability remaining to purchase shares undercompleted the authorized share repurchase program put in place in 2017.49shareholdersshareholders’ equity for thefiscal years 2015-2017. 65,968 $ 6,597 $ 368,603 $ 39,737 $ (49,362 ) $ (58,936 ) 0 0 0 72,418 0 0 39 4 355 0 0 0 597 59 9,746 0 0 0 0 0 (9,806 ) 0 0 0 0 0 0 (11,885 ) 0 0 (253 ) (25 ) 14,670 0 0 0 (650 ) (65 ) (13,241 ) 0 0 0 0 0 0 0 6,072 0 0 0 0 0 0 (32,575 ) 0 0 0 0 0 0 65,701 $ 6,570 $ 370,327 $ 100,270 $ (43,290 ) $ (91,511 ) 65,701 $ 6,570 $ 370,327 $ 100,270 $ (43,290 ) $ (91,511 ) 0 0 0 54,162 0 0 17 2 251 0 0 0 277 28 4,726 0 0 0 0 0 (4,754 ) 0 0 0 0 0 0 (14,285 ) 0 0 (579 ) (58 ) 979 0 0 0 (1,178 ) (118 ) (18,378 ) 0 0 0 0 0 0 0 (11,572 ) 0 0 0 0 0 0 (19,011 ) 0 0 6,300 0 0 0 0 0 0 91 0 0 64,238 $ 6,424 $ 359,451 $ 140,238 $ (54,862 ) $ (110,522 ) SHARES COMMON STOCK ADDITIONAL
PAID-IN
CAPITALRETAINED
EARNINGSPENSION
LIABILITYFOREIGN
CURRENCY
TRANSLATION
ADJUSTMENTCASH FLOW
HEDGE (in thousands) Balance, at January 3, 2021 58,664 $ 5,865 $ 247,920 $ 208,562 $ (69,288) $ (60,331) $ (6,190) Net income — — — 55,234 — — — Restricted stock issuances 429 43 6,066 — — — — Unamortized compensation expense related to restricted stock awards — — (6,109) — — — — Cash dividends declared — — — (2,362) — — — Compensation expense related to stock awards, net of forfeitures (38) (3) 5,233 — — — — Pension liability adjustment — — — — 15,400 — — Foreign currency translation adjustment — — — — — (40,110) — Reclassification out of accumulated other comprehensive loss - discontinued cash flow hedge — — — — — — 3,468 Balance, at January 2, 2022 59,055 $ 5,905 $ 253,110 $ 261,434 $ (53,888) $ (100,441) $ (2,722) 50 64,238 $ 6,424 $ 359,451 $ 140,238 $ (54,862 ) $ (110,522 ) $ 0 0 0 0 53,246 0 0 0 36 4 508 0 0 0 0 253 25 4,507 0 0 0 0 0 0 (4,532 ) 0 0 0 0 0 0 0 (15,487 ) 0 0 0 (93 ) (9 ) �� 5,574 0 0 0 0 (4,628 ) (463 ) (91,113 ) 0 0 0 0 0 0 0 0 (1,692 ) 0 0 0 0 0 0 0 31,579 0 0 0 0 0 0 0 904 Windfall tax benefit - share-based payment awards 0 0 (3,124 ) 0 0 0 0 0 0 0 9,435 0 0 0 59,806 $ 5,981 $ 271,271 $ 187,432 $ (56,554 ) $ (78,943 ) $ 904 SHARES COMMON STOCK ADDITIONAL
PAID-IN
CAPITALRETAINED
EARNINGSPENSION
LIABILITYFOREIGN
CURRENCY
TRANSLATION
ADJUSTMENTCASH FLOW
HEDGE (in thousands) Balance, at December 29, 2019 58,416 $ 5,842 $ 250,306 $ 286,056 $ (56,700) $ (113,139) $ (4,163) Net loss — — — (71,929) — — — Issuances of stock (other than restricted stock) 239 24 195 — — — — Restricted stock issuances 304 30 3,999 — — — — Unamortized compensation expense related to restricted stock awards — — (4,030) — — — — Cash dividends declared — — — (5,565) — — — Compensation expense related to stock awards, net of forfeitures (295) (31) (2,550) — — — — Pension liability adjustment — — — — (12,588) — — Foreign currency translation adjustment — — — — — 52,808 — Cash flow hedge unrealized loss — — — — — — (2,027) Balance, at January 3, 2021 58,664 $ 5,865 $ 247,920 $ 208,562 $ (69,288) $ (60,331) $ (6,190) SHARES COMMON STOCK ADDITIONAL
PAID-IN
CAPITALRETAINED
EARNINGSPENSION
LIABILITYFOREIGN
CURRENCY
TRANSLATION
ADJUSTMENTCASH FLOW HEDGE (in thousands) Balance, at December 30, 2018 59,508 $ 5,951 $ 270,269 $ 222,214 $ (43,610) $ (101,487) $ 1,326 Net income — — — 79,200 — — — Issuances of stock (other than restricted stock) 511 51 636 — — — — Restricted stock issuances 223 22 3,900 — — — — Unamortized compensation expense related to restricted stock awards — — (4,139) — — — — Cash dividends declared — — — (15,358) — — — Compensation expense related to stock awards, net of forfeitures (270) (26) 4,638 — — — — Share repurchases (1,556) (156) (24,998) — — — — Pension liability adjustment — — — — (13,090) — — Foreign currency translation adjustment — — — — — (11,652) — Cash flow hedge unrealized loss — — — — — — (5,489) Balance, at December 29, 2019 58,416 $ 5,842 $ 250,306 $ 286,056 $ (56,700) $ (113,139) $ (4,163) an Omnibus Stock Incentive Plan (“Omnibus Plan”)a stock incentive plan under which a committee of independent directors is authorized to grant directors and key employees, including officers, restricted stock, incentive stock options, to purchase the Company’s Common Stock. Optionsnonqualified stock options, stock appreciation rights, deferred shares, performance shares and performance units. Stock options are exercisable for shares of Common Stock at a price not less than 100% of the fair market value on the date of grant. The options become exercisable either immediately upon the grant date or ratably over a time period ranging from one to five years from the date of the grant. The Company’s options expire at the end of time periods ranging from three to ten years from the date of the grant.2015,2015, the shareholders approved an amendment and restatement of the then-existing Omnibus Stock Incentive Plan. This amendment and restatement extended the term of the Omnibus Plan until February 2025, and set the number of shares authorized for issuance or transfer on or after the effective date of the amendment and restatement at 5,161,020 shares, except that each share issued under the 2015 plan pursuant to an award other than a stock option reducesreduced the number of such authorized shares by 1.33 shares.costexpense will be recognized over the period in whichthat the employee is required to provide the services – the requisite service period (usually the vesting period) – in exchange for the award. The grant date fair value for options and similar instruments will be estimated using option pricing models. Under accounting standards, the Company is required to select a valuation technique or option pricing model. The Company uses the Black-Scholes model. Accounting standards require that the Company estimate forfeitures for stock options and reduce compensation expense accordingly. The Company has reduced its expense by the assumed forfeiture rate and will evaluate actual experience against the assumed forfeiture rate going forward. This expense reduction is not significant to the Company.2015the end of 2013, and therefore, there were was no stock option compensation expensesexpense during 2017,20162021, 2020 or 2015.The following table summarizes2019. There were no stock options outstanding or exercisable as of December 31, 2017, as well as activity during the previous fiscal year: 87,500 $ 8.75 0 0 5,000 12.43 0 0 82,500 $ 8.53 82,500 $ 8.53 (a)AtDecember 31, 2017, the weighted-average remaining contractual life of options outstanding was 2.0 years.(b)At December 31, 2017, the weighted-average remaining contractual life of options exercisable was 2.0 years.At December 31, 2017, the aggregate intrinsic values of in-the-money options outstanding and options exercisable were $1.4 million and $1.4 million, respectively (the intrinsic value of a stock option is the amount by which the market value of the underlying stock exceeds the exercise price of the option).The range of exercise prices of the remaining stock options is from $4.31 to $13.04 per option.2017,20162021, 2020 and 2015,2019, the Company granted restricted stock awards totaling 253,000,277,000,428,400, 308,100, and 597,000223,500 shares, respectively, of Common Stock. The weighted average grant date fair value of restricted stock awards granted during 2021, 2020 and 2019 was $14.26, $13.08, and $17.54, respectively. These awards (or a portion thereof) vest with respect to each recipient over a twoone to fivethree year period from the date of grant, provided the individual remains in the employment or service of the Company as of the vesting date. Additionally, these shares (or a portion thereof) could vest earlier upon the attainment of certain performance criteria, in the event of a change in control of the Company, or upon involuntary termination without cause.$2.8$3.8 million, $4.7$1.3 million and $13.9$3.3 million for 2017,20162021, 2020 and 2015,2019, respectively. These grants are made primarily to executive-level personnel at the Company and, as a result, no compensation costs have been capitalized. Accounting standards require that the Company estimate forfeitures for restricted stock and reduce compensation expense accordingly. The Company has reduced its expense by the assumed forfeiture rate and will evaluate actual experience against the assumed forfeiture rate going forward. The forfeiture rate has been developed using historical data regarding actual forfeitures as well as an estimate of future expected forfeitures under ourfor restricted stock grants.December 31, 2017, January 2, 2022, as well as activity during the previous fiscal year: 505,000 $ 17.05 253,000 17.91 284,000 16.61 6,000 16.99 468,000 $ 17.79 Restricted Shares Weighted Average
Grant Date
Fair ValueOutstanding at January 3, 2021 436,900 $ 24.73 Granted 428,400 14.26 Vested (167,200) 13.68 Forfeited or canceled (14,300) 15.48 Outstanding at January 2, 2022 683,800 $ 21.06 December 31, 2017, January 2, 2022, the unrecognized total compensation cost related to unvested restricted stock was $4.1$5.1 million. That cost is expected to be recognized by the end of 2020.As stated above, accounting standards require the Company to estimate forfeitures in calculating the expense related to stock-based compensation, as opposed to only recognizing these forfeitures and the corresponding reduction in expense as they occur.522016each of the years 2021, 2020 and 2017,2019, the Company issued awards of performance shares to certain employees. These awards vest based on the achievement of certain performance-based goals over a performance period of one to three years, subject to (among other things) the employee’s continued employment through the last date of the performance period, and will be settled in shares of our common stock or in cash at the Company’s election. The number of shares that may be issued in settlement of the performance shares to the award recipients may be greater (up to 200%) or lesser than the nominal award amount depending on actual performance achieved as compared to the performance targets set forth in the awards. The expense related to these performance shares is captured in selling, general and administrative expenseSG&A expenses on the consolidated statementstatements of operations.December 31, 2017, January 2, 2022, as well as the activity during the year: 368,500 $ 17.20 354,000 17.80 31,000 17.22 22,000 17.29 669,500 $ 17.51 Performance Shares Weighted
Average Grant
Date Fair ValueOutstanding at January 3, 2021 405,300 $ 16.94 Granted 375,800 13.94 Vested — — Forfeited or canceled (63,000) 21.43 Outstanding at January 2, 2022 718,100 $ 14.98 20172021, 2020 and 20162019 was $4.5$1.7 million, $(1.8) million and $1.2$5.4 million, respectively. The Company has reduced its expense for performance shares forfeited during the period. Unrecognized compensation expense related to these performance shares was approximately $6.1$8.7 million as of December 31, 2017. NoJanuary 2, 2022. Depending on the performance of the Company, any compensation expense related to these outstanding performance shares were granted or outstanding during 2015.$2.6$0.7 million, $0.6 million, and $2.0$1.4 million in 20172021, 2020 and 2016,2019, respectively.1115–INCOME (LOSS) EARNINGSPER SHAREThecomputescalculates basic and diluted earnings per common share using the two-class method. Basic earnings (loss) per share (“EPS”) is calculated by dividing net income (loss), by the weighted average common shares outstanding, including participating securities outstanding, during the period as depicted below. Diluted EPS reflects the potential dilution beyond shares for basic EPS that could occur if securities or other contracts to issue common stock were exercised, converted into common stock or resulted in the issuance of common stock that would have shared in the Company’s earnings. Income attributable to non-controlling interest is included in the computation of basic and diluted earnings per share, where applicable.whichthat contain non-forfeitable rights to dividends or dividend equivalents, whether paid or unpaid, in the number of common shares outstanding in our basic and diluted EPS calculations when the inclusion of these shares would be dilutive. Unvested share-based awards of restricted stock are paid dividends equally with all other shares of common stock. As a result, the Company includes all outstanding restricted stock awards in the calculation of basic and diluted EPS. Distributed earnings include common stock dividends and dividends earned on unvested share-based payment awards. Undistributed earnings represent earnings that were available for distribution but were not distributed. The following tables show distributed and undistributed earnings: $ 0.25 $ 0.22 $ 0.18 0.61 0.61 0.92 $ 0.86 $ 0.83 $ 1.10 $ 0.25 $ 0.22 $ 0.18 0.61 0.61 0.92 $ 0.86 $ 0.83 $ 1.10 presents net income that was attributable to participating securities: $ 0.4 $ 0.4 $ 1.6 The weighted average shares for shows the computation of basic and diluted EPS were as follows:Fiscal Year201720162015(in thousands)Weighted Average Shares Outstanding61,52864,59364,557Participating Securities4685051,470Shares for Basic Earnings Per Share61,99665,09866,027Dilutive Effect of Stock Options443848Shares for Diluted Earnings Per Share62,04065,13666,075For all periods presented, there were no stock options excluded from the determination of diluted EPS. Fiscal Year 2021 2020 2019 (in thousands, except per share data) Numerator: Net income (loss) $ 55,234 $ (71,929) $ 79,200 Less: distributed and undistributed earnings available to participating securities (602) (42) (625) Distributed and undistributed earnings (loss) available to common shareholders $ 54,632 $ (71,971) $ 78,575 Denominator: Weighted average shares outstanding 58,328 58,110 58,475 Participating securities 643 437 468 Shares for basic EPS 58,971 58,547 58,943 Dilutive effect of stock options — — 5 Shares for diluted EPS 58,971 58,547 58,948 Basic EPS $ 0.94 $ (1.23) $ 1.34 Diluted EPS $ 0.94 $ (1.23) $ 1.34 1216–RESTRUCTURING CHARGESInAND OTHERFiscal Year 2021 2020 2019 (in thousands) AMS $ (1) $ (288) $ 2,590 EAAA 3,622 (4,338) 10,357 Total restructuring, asset impairment and other charges $ 3,621 $ (4,626) $ 12,947 fourth quarter2021, 2019 and 2018 restructuring plans is presented below:Workforce Reduction Other Exit Costs Asset Impairment 2021 Plan 2019 Plan 2018 Plan 2019 Plan 2018 Plan 2021 Plan Total (in thousands) Balance, at December 30, 2018 $ — $ — $ 10,763 $ — $ 1,144 $ — $ 11,907 Charged to expenses — 8,827 (1,743) 188 672 — 7,944 Deductions — (193) (7,122) — (1,042) — (8,357) Charged to other accounts — — — (49) — — (49) Balance, at December 29, 2019 — 8,634 1,898 139 774 — 11,445 Charged to expenses — (3,704) (223) — (699) — (4,626) Deductions — (3,866) (1,675) (139) (75) — (5,755) Balance, at January 3, 2021 — 1,064 — — — — 1,064 Charged to expenses 2,257 (286) — — — 1,650 3,621 Deductions — (681) — — — — (681) Charged to other accounts — — — — — (1,650) (1,650) Balance, at January 2, 2022 $ 2,257 $ 97 $ — $ — $ — $ — $ 2,354 2016,$3.6 million as a result of the 2021 restructuring plan described below, net of a reduction of $0.3 million of previously recognized restructuring charges under the 2019 plan due to changes in expected cash payments. For 2020, the Company recorded a reduction of $4.6 million of previously recognized restructuring charges due to changes in expected cash payments. For 2019, the Company recorded restructuring, asset impairment and other charges of $12.9 million in the consolidated statements of operations. The 2019 charges include other non-cash charges not included in the above table as further described below. As of January 2, 2022, the total restructuring reserve was $2.4 million for the 2021 and 2019 restructuring plans. The 2018 restructuring plan was completed as of January 3, 2021.involvedinvolved (i) a substantial restructuring of its sales and administrative operations in the FLOR business model that included closure of its headquarters office and most retail FLOR stores,United Kingdom, (ii) a reduction of approximately 70 FLOR200 employees, and a number of employees in the commercial carpet tile business, primarily in the AmericasEurope and EuropeAsia-Pacific geographic regions, and (iii) the write-down of certain underutilized and impaired assets that included information technology assets intellectual property assets, and obsolete manufacturing office and retail store equipment.incurredrecorded a pre-tax restructuring and asset impairment charge in the fourth quarter of 2018 of approximately $20.5 million (comprised of $7.7 million attributable to the AMS reportable segment and $12.8 million attributable to the EAAA reportable segment). The charge was comprised of severance expenses (approximately $10.8 million), impairment of assets (approximately $8.6 million) and other items (approximately $1.1 million). The charge was expected to result in future cash expenditures of $12.0 million, primarily for severance payments (approximately $10.8 million). The restructuring plan was substantially completed at the end of fiscal year 2019. $19.82019, the Company adjusted its previously recorded severance expenses in connection with the 2018 restructuring plan and recognized a reduction in restructuring costs of $1.7 million in 2019. In 2020, the fourth quarterCompany further adjusted its previously recorded severance expenses and other exit costs and recognized a reduction in restructuring costs of 2016$0.9 million. As of January 2, 2022, cumulative charges under the 2018 restructuring plan, net of reductions of previously recognized charges, were $6.4 million within the AMS reportable segment and $7.3$12.1 million inwithin the first quarterEAAA reportable segment. The restructuring plan was completed as of 2017.A summaryJanuary 3, 2021. $ 10,652 $ 1,451 $ 6,633 $ 2,568 11,319 8,019 3,300 0 5,116 27 5,089 0 NOTE 13– TAXES ON INCOMEOn December 22, 2017, the Tax Cuts and Jobs Act (the “Tax Act”) was enacted into law. Among the significant changes resulting from the law, the Tax Act reduces the U.S. federalIncome (loss) before income tax rate from 35% to 21% effective for the year beginning January 1, 2018 and creates a modified territorial tax system with a one-time mandatory “transition tax” on previously unrepatriated foreign earnings. It also applies restrictions on the deductibility of interest expense, allows for immediate capital expensing of certain qualified property, eliminates the domestic manufacturing deduction, applies a broader application of compensation limitations and creates a new minimum tax on earnings of foreign subsidiaries. The Company is continuing to evaluate the Tax Act and its requirements, as well as its application to its business and its impact on the effective tax rate.In accordance with GAAP as determined by ASC 740, “Income Taxes,” the Company is required to record the effects of tax law changes in the period enacted. On December 22, 2017, the SEC staff issued guidance to companies to address the application of U.S. GAAP in situations when a registrant does not have the necessary information available, prepared, or analyzed (including computations) in reasonable detail to complete the accounting for certain income tax effectstaxes consisted of the Tax Act.As further discussed below, the Company’s results for the year ended December 31, 2017 contain provisional estimates of the impact of the Tax Act. These amounts are considered provisional because they use reasonable estimates of which tax returns have not been filed and because estimated amounts may be impacted by future regulatory and accounting guidance if and when issued. The Company will adjust these provisional amounts as further information becomes available and as we refine our calculations. As permitted by recent guidance issued by the SEC, these adjustments will occur during a reasonable “measurement period” not to exceed twelve months from the date of enactment. The two material items that impacted the Company in 2017 were the U.S. statutory rate reduction and the one-time transition tax.Impacts of Deemed Repatriation: The Tax Act imposed a one-time transition tax on unrepatriated post-1986 accumulated earnings and profits of certain foreign subsidiaries (“E&P”). The Company has recorded a provisional tax expense of $11.7 million related to the one-time transition tax. To calculate this tax, the Company must determine the cumulative amount of E&P, as well as the amount of foreign taxes paid on such earnings, among other components of the calculation. The Company computed the amount based on information available to us; however, the Company's calculation of this amount might change with further analysis and further guidance from the U.S. federal and state tax authorities about the application of these new rules. Additionally, the Company may revise this balance during the one-year remeasurement period as a result of amending certain U.S. federal income tax returns; however, the outcome of this is currently unknown, and the Company has made its best estimate of expected, future tax liability as of December 31, 2017. The Company will continue to evaluate the impact of the tax law change as it relates to the accounting for the outside basis difference of its foreign entities. The Company will elect to pay the liability for the deemed repatriation of foreign earnings in installments, as specified by the Tax Act.Remeasurement of Deferred Tax Assets and Liabilities: The Tax Act reduces the U.S. statutory rate from 35% to 21% for years after 2017. Accordingly, U.S. GAAP requires companies to remeasure their deferred tax assets and liabilities as of the date of enactment, with resulting tax effects accounted for in the reporting period of enactment. The Company has recorded a provisional tax expense of $3.5 million related to the remeasurement of its net deferred tax asset. The Company remeasured certain deferred tax assets and liabilities based on the rates at which they are expected to reverse in the future, which is generally 21%. However, we are still analyzing certain aspects of the Tax Act and refining our calculations, which could potentially affect the measurement of these balances or give rise to new deferred tax amounts.While the Tax Act provides for a modified territorial tax system, beginning in 2018, it includes two new U.S. tax base erosion provisions, the global intangible low-taxed income (“GILTI”) provisions and the base-erosion and anti-abuse tax (“BEAT”) provisions. The GILTI provisions require the Company to include in its U.S. income tax return foreign subsidiary earnings in excess of an allowable return on the foreign subsidiary’s tangible assets. The Company does not expect that the GILTI income inclusion will result in significant U.S. tax beginning in 2018. The BEAT provisions in the Tax Act eliminates the deduction of certain base-erosion payments made to related foreign corporations and impose a minimum tax if greater than regular tax. The Company does not expect that the BEAT provision will result in significant U.S. tax beginning in 2018. In addition, the Company intends to account for the GILTI tax in the period in which it is incurred, and therefore has not provided any deferred tax impacts of GILTI in its consolidated financial statements for the year ended December 31, 2017.55 Fiscal Year 2021 2020 2019 (in thousands) U.S. operations $ 4,460 $ (7,104) $ 46,463 Foreign operations 68,173 (72,316) 55,353 Income (loss) before income taxes $ 72,633 $ (79,420) $ 101,816 $ 10,245 $ 6,886 $ 1,524 11,923 12,934 9,279 1,414 1,633 1,403 Current expense 23,582 21,453 12,206 20,467 6,186 19,971 1,214 (1,937 ) 3,795 2,030 (728 ) (2,624 ) Deferred expense 23,711 3,521 21,142 Total income tax expense $ 47,293 $ 24,974 $ 33,348 Income before Fiscal Year 2021 2020 2019 (in thousands) Current expense (benefit): Federal $ 1,987 $ (22,976) $ 8,414 Foreign 21,372 14,822 14,513 State 1,418 529 2,312 Current expense (benefit) 24,777 (7,625) 25,239 Deferred expense (benefit): Federal (2,841) 1,787 (625) Foreign (3,846) (2,422) (2,198) State (691) 769 200 Deferred expense (benefit) (7,378) 134 (2,623) Total income tax expense (benefit) $ 17,399 $ (7,491) $ 22,616 onat the U.S. federal statutory rate of 21% applicable for all periods presented to the Company’s actual income consistedtax expense: Fiscal Year 2021 2020 2019 (in thousands) Income taxes at U.S. federal statutory rate $ 15,253 $ (16,678) $ 21,381 Increase (decrease) in taxes resulting from: State income taxes, net of federal tax effect (87) (2,033) 2,321 Non-deductible business expenses 330 1,792 933 Non-deductible employee compensation 1,213 (210) 1,453 Tax effects of Company-owned life insurance (762) (898) (636) Tax effects of undistributed earnings from foreign subsidiaries not deemed to be indefinitely reinvested 1,219 748 (183) Foreign and U.S. tax effects attributable to foreign operations 1,748 (11,991) 783 Valuation allowance effect 1,349 12,927 133 Research and development tax credits (793) (780) (700) Goodwill impairment — 24,464 — Unrecognized tax benefits (2,663) (14,962) (3,324) Other 592 130 455 Income tax expense (benefit) $ 17,399 $ (7,491) $ 22,616 following:CARES Act include, among other things, the deferral of certain payroll taxes, relief for retaining employees, and certain income tax provisions for corporations. For the tax year ended January 3, 2021, the Company deferred $4.1 million in payroll taxes under the CARES Act which was paid as of January 2, 2022. In addition, for the year ended January 3, 2021, the Company benefited from the relaxed 163(j) limitation and the technical correction related to depreciation of leasehold improvements, both of which did not have a material impact on the Company’s effective tax rate for that year. Some of the provisions of the CARES Act, including the deferral of certain payroll taxes and the relaxed 163(j) limitation, are not applicable for tax years after 2020, and as a result the Company did not benefit from these provisions for the tax year ended January 2, 2022. In addition, the Company did not materially benefit from the provisions of the CARES Act that remained in effect during the tax year ended January 2, 2022. $ 53,407 $ 38,357 $ 58,318 47,132 40,779 47,448 Income before taxes $ 100,539 $ 79,136 $ 105,766 December 31, 2017, January 2, 2022 and January 1, 2017, 3, 2021, reflect the net tax effects of temporary differences between the carrying amounts of assets and liabilities for financial reporting purposes and the amounts used for income tax purposes. End of Fiscal Year 2021 2020 (in thousands) Deferred tax assets Lease liability $ 25,426 $ 28,094 Net operating loss and interest carryforwards 5,962 4,031 Federal tax credit carryforwards 10,054 10,412 Derivative instruments 1,126 2,680 Deferred compensation 19,487 20,244 Inventory 3,100 4,004 Prepaids, accruals and reserves 8,777 3,659 Capitalized costs 4,805 — Pensions 6,431 11,485 Other 175 50 Deferred tax asset, gross 85,343 84,659 Valuation allowance (15,338) (13,919) Deferred tax asset, net $ 70,005 $ 70,740 Deferred tax liabilities Property and equipment $ 25,352 $ 27,322 Intangible assets 30,736 30,745 Lease asset 24,856 27,268 Foreign currency 458 606 Foreign withholding and U.S. state taxes on unremitted earnings 1,332 931 Deferred tax liabilities 82,734 86,872 Net deferred tax liabilities $ 12,729 $ 16,132 expectshas elected to account for tax effects of the global intangible low-taxed income (“GILTI”), Foreign Derived Intangible Income (“FDII”), Internal Revenue Code Section 163(j) interest limitation (“Interest Limitation”) and base-erosion and anti-abuse tax (“BEAT”) provisions included in the Tax Cuts and Jobs Act of 2017 (the “Tax Act”) in the period when incurred, and therefore has not provided any deferred tax impacts for these provisions in its consolidated financial statements.in its 2017 U.S. federalthese foreign tax returncredits before the remaining portionexpiration dates. As of its federal net operating loss carryforwards which are all from share-based payment awards of $23.2 million and has recorded a related tax benefit of $8.1 million to retained earnings in accordance with applicable accounting standards. Also,January 2, 2022, the Company utilized $9.0 million of its federal net operating loss carryforwards in its 2016 U.S. federal tax return which were all from share-based payment awards and recorded a related tax benefit of $3.2 million to additional paid-in capital in accordance with applicable accounting standards. This amount decreased by $3.1 million compared to the amount recorded in 2016 due to less taxable income realized in its 2016 U.S. federal tax return that was filed in 2017.The Company expects to utilize in its 2017 foreign tax returns the remaining portion of its foreign net operating loss carryforwards of $3.8 million.The Company hadhas approximately $108.6$153.0 million in state net operating loss carryforwards relating to continuing operations with expiration dates through 2035. The Company2041 and has provided a valuation allowance against $18.5$90.1 million of such losses, which the Company does not expect to utilize. During 2017, the Company recorded a tax benefitIn addition, as of $1.3 million to retained earnings related to $21.4 million of the state net operating losses carryforwards that were from share-based payment awards, in accordance with applicable accounting standards. In addition,January 2, 2022, the Company has approximately $57.3$25.7 million in state net operating loss carryforwards relating to discontinued operations against which a full valuation allowance has been provided.56The sources of the temporary differences and their effect on the net deferred tax asset are as follows: $ 0 $ 13,281 $ 0 $ 14,419 0 1,157 978 0 0 2,597 0 3,216 2,468 0 3,627 0 (1,186 ) 0 (2,500 ) 0 3,227 0 5,711 0 20,220 0 26,546 0 634 0 4,009 0 1,777 0 6,273 0 2,408 0 3,435 0 0 909 0 223 0 0 0 1,481 0 536 0 351 $ 29,548 $ 18,480 $ 48,079 $ 19,690 Deferred tax assets and liabilities are included in the accompanying balance sheets as follows: $ 18,003 $ 33,117 (6,935 ) (4,728 ) Total net deferred taxes $ 11,068 $ 28,389 Management believes, based on the Company’s history of taxable income and expectations for the future, that it is more likely than not that future taxable income will be sufficient to fully utilize the federal deferred tax assets at December 31, 2017.December 31, 2017, January 2, 2022, and January 1, 2017, 3, 2021, non-current deferred tax assets were reduced by approximately $3.3$2.8 million and $5.0$3.0 million, respectively, of unrecognized tax benefits.57The’s effective tax rate was 47.0%,31.6% and 31.5% has not provided for fiscal years 2017,2016 and 2015, respectively. The following summary reconcilesU.S. income taxes and foreign withholding taxes on the undistributed accumulated earnings of its foreign subsidiaries, with the exception of its Canada subsidiaries and a specific portion of the undistributed earnings of foreign subsidiaries outside of Canada, because such earnings were deemed to be permanently reinvested. In September of 2021, as part of an overall restructuring plan, the Company made the decision to close its manufacturing facility in Thailand. As a result, the Company is no longer asserting that the undistributed earnings in its Thailand subsidiaries are permanently reinvested. The Company provided for U.S. income taxes and foreign withholding taxes on these earnings at January 2, 2022.statutory rateincome taxes on dividends from our foreign subsidiaries, the Company continues to assert that all of 35% to the Company’s actual income tax expense: $ 35,189 $ 27,698 $ 37,018 2,677 1,861 3,003 695 538 614 80 361 168 (1,295 ) (199 ) 128 Tax effects of Tax Act: 11,707 0 0 3,467 0 0 523 463 458 (4,537 ) (3,963 ) (3,347 ) (858 ) (1,272 ) (3,797 ) (442 ) (494 ) (352 ) 87 (19 ) (545 ) $ 47,293 $ 24,974 $ 33,348 The Company previously considered theits undistributed earnings in its non-U.S. subsidiaries, excluding subsidiaries within Canada, to beundistributed earnings for which U.S. income taxes and foreign withholding taxes have been provided, are indefinitely reinvested outside of the U.S. The Company expects that domestic cash resources will be sufficient to fund its domestic operations and accordingly, recorded no deferred income taxes. Prior tocash commitments in the transition tax,future. In the event the Company had approximately $350 milliondetermines not to continue to assert that all or part of foreignits undistributed earnings which was the largest component of the Company’s overall outside basis difference in its foreign subsidiaries. While the transition tax eliminated this portion of the overall outside basis difference in its foreignnon-U.S. subsidiaries are permanently reinvested, an actual repatriation from its non-U.S. subsidiaries could still be subject to additional foreign withholding and U.S. state taxes.The Company has analyzed its global working capital and cash requirements andtaxes, the potential tax liabilities attributable to a repatriation, and has determined that it will be repatriating approximately $37 million which was previously deemed indefinitely reinvested. The Company was able to make a reasonable estimate of the tax effects of such repatriation and has recorded a provisional estimate for foreign withholding and U.S. state taxes of $0.6 million.The Company currently does not intend to repatriate approximately $307 million taxed under the Tax Act and has not recorded any deferred taxes relating to such amounts. The Company considers this portion of its undistributed foreign earnings to be indefinitely reinvested outside of the U.S. and determination of any deferred taxes on this amountwhich is not practicable.Company’s undistributed earnings from foreign subsidiaries within Canada are not deemed to be indefinitely reinvested. At December 31, 2017, the Company’s Canadian subsidiaries had approximately $6 million of undistributed earnings from which approximately $2 million in deferred income taxes and approximately $0.3 million in foreign withholding taxes had been provided. As these earnings are taxed under the transition tax, the Company reversed the $2 million deferred income tax provision. However, the Company retained the $0.3 million provision for withholding taxes as it expects to incur these taxes upon repatriation.The Company’s federal income tax returns are subject to examination for the years 20032018 to the present. The Company files returns in numerous state and local jurisdictions and in general it is subject to examination by the state tax authorities for the years 20122016 to the present. The Company files returns in numerous foreign jurisdictions and in general it is subject to examination by the foreign tax authorities for the years 20062010 to the present.DecemberJanuary 2, 2022, and January 3,1,2017, and January 1, 2017, 2021, the Company had $29.2$8.2 million and $27.9$10.8 million, respectively, of unrecognized tax benefits. For the years ended January 2, 2022 and January 3, 2021, the Company recognized as income tax benefits $2.7 million and $15.0 million, respectively, of previously unrecognized tax benefits. Of the $15.0 million income tax benefits recognized for the year ended January 3, 2021, $12.7 million related to a worthless stock loss claimed on the Company’s exit of its broadloom business (discontinued operations). It is reasonably possible that approximately $2.5 million of unrecognized tax benefits may be recognized within the next 12 months due to a lapse of statute of limitations.$29.2$8.2 million of unrecognized tax benefits as of December 31, 2017 January 2, 2022 are recognized, there would be a favorable impact on the Company’s effective tax rate of approximately $7.5 million in future periods. If the unrecognized tax benefits are not favorably settled, $25.9$5.4 million of the total amount of unrecognized tax benefits would require the use of cash in future periods. The Company recognizes accrued interest and income tax penalties related to unrecognized tax benefits as a component of income tax expense. As of December 31, 2017, January 2, 2022, the Company had accrued interest and penalties of $1.6$0.9 million, which is included in the total unrecognized tax benefit noted above.Management believes changes to our unrecognized tax benefits that are reasonably possible in the next 12 months will not have a significant impact on our financial position or results of operations. The timing of the ultimate resolution of the Company’s tax matters and the payment and receipt of related cash is dependent on a number of factors, many of which are outside the Company’s control.follows: $ 27,888 $ 28,271 $ 27,301 627 690 641 Increases related to tax positions taken during the prior years 709 148 1,230 0 (695 ) (194 ) 0 0 0 (462 ) (403 ) (367 ) 459 (123 ) ( 340 ) $ 29,221 $ 27,888 $ 28,271 Fiscal Year 2021 2020 2019 (in thousands) Balance at beginning of year $ 10,799 $ 25,486 $ 28,143 Increases related to tax positions taken during the current year 265 271 318 Increases related to tax positions taken during the prior years 198 536 1,093 Decreases related to tax positions taken during the prior years — (673) (2,809) Decreases related to lapse of applicable statute of limitations (2,309) (14,992) (1,266) Changes due to settlements (836) — — Changes due to foreign currency translation 103 171 7 Balance at end of year $ 8,220 $ 10,799 $ 25,486 1418–COMMITMENTS AND CONTINGENCIESThe Company leases certain production, distribution and marketing facilities and equipment. At December 31, 2017, aggregate minimum rent commitments under operating leases with initial or remaining terms of one year or more consisted of the following: $ 16,719 13,300 8,489 5,314 3,117 15,500 Rental expense amounted to approximately $22.0 million, $24.5 million, and $24.4 million for the years 2017,2016, and 2015, respectively.The Company is fromroutine litigation incidentallegal proceedings, whether arising in the ordinary course of business or otherwise. Some of the proceedings the Company is involved in are summarized below.its business. Management does not believeterminate for cause the employment of Jay D. Gould, then President and Chief Executive Officer, effective immediately, for violations of the Company’s working environment policies. On February 14, 2020, Mr. Gould filed a lawsuit against the Company in the United States District Court of the Northern District of Georgia, Gould v. Interface, Inc., Case No. 1:20-cv-00695. In his lawsuit, Mr. Gould asserted several claims against the Company in connection with his termination, including that the resolutiontermination was a wrongful retaliation against Mr. Gould and breached his employment contract with the Company, that public statements made by the Company in connection with his termination defamed Mr. Gould (two counts) and that the Company’s investigation into Mr. Gould’s conduct that preceded the termination was negligently performed. Among other unspecified relief, Mr. Gould seeks in excess of any or all$10 million in damages for the breach of such litigation will have a material adverse effectcontract claim and $100 million for each of the other claims, as well as attorneys’ fees. The Court granted judgment on the pleadings in favor of the Company’s on Mr. Gould’s putative claim of negligent investigation, and Mr. Gould’s defamation claims were dismissed with prejudice by stipulation of the parties. The Company filed a motion for summary judgment on Mr. Gould’s remaining claims. On February 9, 2022, the U.S. Magistrate Judge overseeing the motion for summary judgment issued a Final Report and Recommendation that the Company’s motion for summary judgment be granted on all remaining claims, and each party has since filed objections to certain aspects of the report and recommendation. The motion for summary judgement remains pending with the Court.condition or resultsofficer were named as defendants in a lawsuit filed in the United States District Court for the Eastern District of operations.New York, Swanson v. Interface, Inc. et al. (case :120-cv-05518). The lawsuit is a federal securities law class action that alleges that the defendants made materially false and misleading statements regarding the Company’s business, operational and compliance policies. The specific allegations relate to the subject matter of the concluded SEC investigation described above. The complaint does not quantify the damages sought.NOTE 15– EMPLOYEE BENEFIT PLANS401(k)401(k) retirement investment plan (“401(k)(“401(k) Plan”), which is open to all otherwise eligible U.S. employees with at least six months of service. The 401(k)401(k) Plan calls for Company matching contributions on a sliding scale based on the level of the employee’s contribution. The Company may, at its discretion, make additional contributions to the 401(k)401(k) Plan based on the attainment of certain performance targets by its subsidiaries. The Company’s matching contributions are funded bi-monthly and totaled approximately $3.0$3.0 million, $3.1$1.6 million, and $2.9$3.3 million for the years 2017,2016,2021, 2020 and 2015,2019, respectively. No discretionary contributions were made in 2017,2016,2021, 2020 or 2015.2019.59Company’sCompany’s nonqualified savings plans (“NSPs”), the Company provides eligible employees the opportunity to enter into agreements for the deferral of a specified percentage of their compensation, as defined in the NSPs. The NSPs call for Company matching contributions on a sliding scale based on the level of the employee’s contribution. The obligations of the Company under such agreements to pay the deferred compensation in the future in accordance with the terms of the NSPs are unsecured general obligations of the Company. Participants have no right, interest or claim in the assets of the Company, except as unsecured general creditors. The Company has established a rabbi trust to hold, invest and reinvest deferrals and contributions under the NSPs. If a change in control of the Company occurs, as defined in the NSPs, the Company will contribute an amount to the rabbi trust sufficient to pay the obligation owed to each participant. DeferredThe deferred compensation liability in connection with the NSPs totaled $31.9$34.2 million and $33.1 million at December 31, 2017. January 2, 2022 and January 3, 2021, respectively. The Company invests the deferrals in insurance instruments with readily determinable cash surrender values.values and in exchange traded mutual funds beginning in fiscal 2021. The value of the insurance instruments was $28.0$20.0 million and $33.9 million as of January 2, 2022 and January 3, 2021, respectively. The fair value of the mutual fund investments at January 2, 2022 was $15.6 million.2017.employee’semployee’s average monthly compensation. In connection with the nora acquisition in 2018, the Company acquired an additional defined benefit plan, which covers certain employees in Germany (the “nora Plan”). The nora plan has no plan assets. The Company uses a year-end measurement date for the plans, which is the closest practical date to the Company’s fiscal year end.$1.9$2.5 million, $1.2$2.5 million, and $2.1$2.3 million for the years 2017, 20162021, 2020 and 2015,2019, respectively. Plan assets are primarily invested in insurance contracts and equity and fixed income securities. The Company uses a year-end measurement date for the plans. As of December 31, 2017,January 2, 2022, for the European plans, the Company had a net liability recorded of $13.4$38.8 million, an amount equal to their underfunded status, and hashad recorded in Other Comprehensive Incomeaccumulated other comprehensive loss an amount equal to $48.0$45.2 million (net of taxes of approximately $15$15.4 million) related to the future amounts to be recorded in net post-retirementperiodic benefit costs.Company’sCompany’s significant foreign defined benefit plans and required disclosures in accordance with applicable accounting standardsstandards: $ 277,813 $ 243,717 1,628 1,032 5,559 6,580 (10,267 ) (8,551 ) 13,351 73,600 262 225 32,202 (38,790 ) $ 320,548 $ 277,813 Fiscal Year 2021 2020 (in thousands) Change in benefit obligation: Benefit obligation, beginning of year $ 364,443 $ 314,841 Service cost 1,087 1,070 Interest cost 2,687 4,038 Benefits and expenses paid (11,339) (12,041) Actuarial loss (gain) (19,723) 31,618 Currency translation adjustment (12,747) 24,917 Benefit obligation, end of year $ 324,408 $ 364,443 Change in plan assets: Plan assets, beginning of year $ 303,531 $ 266,450 Actual return on assets (2,817) 25,239 Company contributions 5,393 4,451 Benefits paid (11,339) (12,041) Currency translation adjustment (9,168) 19,432 Plan assets, end of year $ 285,600 $ 303,531 Funded status $ (38,808) $ (60,912) Amounts recognized in consolidated balance sheets: Other assets $ 10,975 $ — Current liabilities (1,049) (1,089) Other long-term liabilities, net of current portion (48,734) (59,823) Under funded status at end of fiscal year $ (38,808) $ (60,912) Amounts recognized in accumulated other comprehensive loss, after tax: Unrecognized actuarial loss $ 45,209 $ 58,257 Unamortized prior service credits — — Total amount recognized $ 45,209 $ 58,257 Accumulated benefit obligation $ 324,408 $ 364,443 60 $ 258,365 $ 239,281 25,691 59,364 2,812 4,991 (10,267 ) (8,552 ) 30,565 (36,719 ) $ 307,166 $ 258,365 $ (13,382 ) $ (19,448 ) Net amount recognized $ (13,382 ) $ (19,448 ) $ 48,443 $ 49,547 (471 ) (311 ) $ 47,972 $ 49,236 $ 313,257 $ 274,414 Company’s twoCompany’s 3 defined benefit plans which cover many of its European employees. As of December 31, 2017, and January 1, 2017, 2, 2022, one of these plans, which primarily covers certain employees in the United Kingdom (the “UK Plan”), had an accumulated benefit obligation in excess of the plan assets. The other plan, which covers certain employees in the Netherlands (the “Dutch Plan”), had assets in excess of the accumulated benefit obligation. The accumulated benefit obligation of the Dutch Plan exceeded plan assets as of January 2, 2022. The nora Plan is an unfunded defined benefit plan and the accumulated benefit obligation exceeded plan assets as of January 2, 2022. The following table summarizes this information as of December 31, 2017 January 2, 2022 and January 1, 2017. UK Plan $ 190,992 $ 171,172 190,992 171,172 179,322 153,132 $ 129,554 $ 106,641 122,265 103,242 127,844 105,233 $ 1,628 $ 1,032 $ 1,061 5,559 6,580 8,384 (6,496 ) (7,553 ) (8,764 ) (34 ) 33 33 1,287 1076 1,359 $ 1,944 $ 1,168 $ 2,073 61The Company reconciles End of Fiscal Year 2021 2020 (in thousands) UK Plan Projected benefit obligation $ 181,997 $ 198,215 Accumulated benefit obligation 181,997 198,215 Plan assets 192,971 193,991 Projected benefit obligation $ 97,108 $ 116,379 Accumulated benefit obligation 97,108 116,379 Plan assets 92,629 109,540 nora Plan Projected benefit obligation $ 45,303 $ 49,849 Accumulated benefit obligation 45,303 49,849 Plan assets — — Fiscal Year 2021 2020 2019 (in thousands) Components of net periodic benefit cost: Service cost $ 1,087 $ 1,070 $ 1,589 Interest cost 2,687 4,038 5,676 Expected return on plan assets (3,312) (4,256) (5,561) Amortization of prior service cost 114 106 63 Amortization of net actuarial (gains) losses 1,968 1,549 991 Curtailment gain — — (453) Net periodic benefit cost $ 2,544 $ 2,507 $ 2,305 pensionbenefit costs are presented within other expense by comparing the beginning balance of assets and the beginning projected obligation against the assumptions of asset return and interest costs. Any significant differences will be explained. There were no such differences in 2017.For 2018, it is estimated that approximately $1.2 million of expenses related to the amortization of unrecognized items will be included in the net periodic benefit cost. consolidated statements of operations.2017,2021, other comprehensive incomeloss was impacted by a net gain of approximately $7.0$11.8 million (net of $3.9 million of tax), comprised of actuarial gain of approximately $5.8$10.3 million (net of $3.4 million of tax) and amortization of $1.2 million. This decrease was offset by the strengtheningloss of the euro and British Pound against the dollar during 2017.$1.5 million (net of $0.5 million of tax). FISCAL YEAR201720162015Weighted average assumptions used to determine net periodic benefit costDiscount rate2.0%2.7%3.0%Expected return on plan assets2.3%3.1%4.0%Rate of compensation1.75%2.0%2.0%Weighted average assumptions used to determine benefit obligationsDiscount rate2.2%2.3%3.4%Rate of compensation1.75%2.0%2.0% Fiscal Year 2021 2020 2019 Weighted average assumptions used to determine net periodic benefit cost: Discount rate 0.9 % 1.0 % 1.9 % Expected return on plan assets 1.5 % 1.2 % 2.1 % Rate of compensation — % — % 1.75 % Weighted average assumptions used to determine benefit obligations: Discount rate 1.6 % 1.0 % 1.7 % Rate of compensation — % — % 1.75 % without exceeding the limits of the prudent pension fund investment, to ensure that the assets would beare sufficient to exceed minimum funding requirements, and to achieve a favorable return against the performance expectationexpectations based on historichistorical and projected rates of return over the short term. The goal is to optimize the long-term return on plan assets at a moderate level of risk, by balancing higher-returning assets, such as equity securities, with less volatile assets, such as fixed income securities. The assets are managed by professional investment firms and performance is evaluated periodically against specific benchmarks. The plans’plans’ net assets did not include the Company’s own stock at December 31, 2017 January 2, 2022 or January 1, 2017.ThePrior to December 31, 2019, the Contract guaranteesguaranteed payment of vested amounts,benefits, regardless of whether Dutch Plan assets held through the Contract arewere ultimately sufficient to pay vested amounts, and also providesprovided for payment of the indexation amount on a contingent basis if the actual return on Dutch Plan assets iswere sufficient to pay it. This type of insurance arrangement is common in The Netherlands, although not necessarily common in other jurisdictions.Because After the prior actual and future projected returns on Dutch Plan curtailment on December 31, 2019, as discussed above, any shortfall in plan assets have been determined to pay vested benefits will be sufficient to provide for the indexation benefit, the Company and the insurer agreed that it was appropriate to provide the indexation benefit under the Contract. The indexation benefit thus becomes an amount payablefunded by the insurer under the Contract, and consequently is recorded as a Plan asset.Company. The corresponding obligation to pay the indexation amount to pensioners thus became a pension liability. As of December 31, 2017, and January 1, 2017, this indexation liability and corresponding asset was $32.7 million and $32.2 million, respectively. The inclusion of this amount does not have any impact on the funded status of the plan, as both the indexation asset and liability are recorded at the same amount. This indexation asset, along with the remainder of the assets under the Dutch Plan, including any indexation benefit, are identified as Level Threelevel 3 assets under the fair value hierarchy.62 (i.e., the benefit amount guaranteed by the insurance company), and (ii) the fair value of the underlying investment assets held by the insurance company under the Contract. As between those two values, the former was the greater for 20172021 and 20162020 and this represents the plan assets as shown above for the Dutch Plan. However, asBecause the Company will fund the cost to guarantee vested benefits, the Company has recorded a provision, which reduces the Dutch Plan assets, that consists of the net present value of the expected future guarantee payments due to the insurance company pursuant to the Company’s guarantee.Therefore, in addition to the value of the discounted vested benefits of the Dutch Plan, in determining the fair value of the Contract, the Company believed that it was appropriate to include the value of theThe indexation payments that are being added to the vested benefit amounts. As explained above, these indexation benefits will be paid out of the Contract if asset returns continue to exceed expectations. If the asset returns are not of an expected amount to allow for indexation, the Company can, at any time, remove this indexation benefit.Company’sCompany’s actual weighted average asset allocations for 20172021 and 2016,2020, and the targeted asset allocation for 2018,2022, of the foreign defined benefit plans by asset category, are as follows: 15% - 20% 16 % 15 % 35% - 45% 32 % 36 % 40% - 50% 52 % 49 % 100% 100 % 100 % Fair Value Measurements of Plan AssetsAccounting standards establish a fair value hierarchy that prioritizes the inputs to valuation techniques used to measure estimated fair value. The hierarchy gives the highest priority to unadjusted quoted prices in active markets for identical assets or liabilities (level 1 measurements) and the lowest priority to unobservable inputs (level 3 measurements). The three levels of the fair value hierarchy under applicable accounting standards are described below:Level 1Unadjusted quoted prices in active markets that are accessible at the measurement date for identical, unrestricted assets or liabilities.Level 2Inputs to the valuation methodology include:●quoted prices for similar assets in active markets;●quoted prices for identical or similar assets in inactive markets;●inputs other than quoted prices that are observable for the asset; and●inputs that are derived principally or corroborated by observable data by correlation or other means.Level 3Prices or valuations that require inputs that are both significant to the fair value measurement and unobservable.A financial instrument’s level within the fair value hierarchy is based on the lowest level of any input that is significant to the fair value measurement. Fiscal Year 2022 2021 2020 Asset Category Target Allocation Percentage of Plan Assets at Year End Equity securities —% — 3% —% 3% Debt and debt securities 50% — 60% 63% 60% Short-term investments 1% — 2% 4% —% Other investments 35% — 40% 33% 37% 100% 100% 100% 63December 31, 2017 January 2, 2022 and January 1, 2017. 3, 2021. The nora plan is currently unfunded. As required by accounting standards, assets are classified in their entirety based on the lowest level of input that is significant to the fair value measurement. As noted above, the Dutch pension planPlan assets as represented by the insurance contactcontract are classified as a Level level 3 asset and included in the “Other” asset category. $ 0 $ 87,521 $ 87,521 0 68,668 68,668 127,844 23,133 150,977 $ 127,844 $ 179,322 $ 307,166 Pension Plan Assets by Category as of January 2, 2022 Dutch Plan UK Plan Total (in thousands) $ 0 $ 80,048 $ 80,048 Level 1 $ — $ 57,338 $ 57,338 0 50,364 50,364 Level 2 — 107,136 107,136 105,233 22,720 127,953 Level 3 92,629 28,497 121,126 $ 105,233 $ 153,132 $ 258,365 Total $ 92,629 $ 192,971 $ 285,600 Pension Plan Assets by Category as of January 3, 2021 Dutch Plan UK Plan Total (in thousands) Level 1 $ — $ 70,904 $ 70,904 Level 2 — 95,004 95,004 Level 3 109,540 28,083 137,623 Total $ 109,540 $ 193,991 $ 303,531 plans’plans’ assets by asset allocation and fair value hierarchy: $ 48,285 $ 0 $ 0 36,780 41,381 19,883 2,456 27,287 131,094 $ 87,521 $ 68,668 $ 150,977 $ 37,696 $ 0 $ 0 37,175 36,378 19,224 5,177 13,986 108,729 $ 80,048 $ 50,364 $ 127,953 End of Fiscal Year 2021 Asset Category Level 1 Level 2 Level 3 (in thousands) Equity securities $ — $ — $ — Debt and debt securities 45,516 107,136 27,176 11,822 — — — — 93,950 $ 57,338 $ 107,136 $ 121,126 End of Fiscal Year 2020 Asset Category Level 1 Level 2 Level 3 (in thousands) Equity securities $ 9,113 $ — $ — Debt and debt securities 60,699 95,004 25,927 1,092 — — — — 111,696 $ 70,904 $ 95,004 $ 137,623 6420172021 and 20162020 relate to insured annuities and direct lending assets held by the UK Plan. The fair value of these assets was calculated using the present value of the future cash flows due under the insurance annuities, and for the direct lending assets the value is based on the asset value from the latest available valuation with adjustments for any drawdowns and distribution payments made between the valuation date and the reporting date. The range of discount rates used in the fair value calculation of level 3 assets held by the Dutch Plan and the UK Plan were 1.00% to 1.85% for 2021 and 0.50% to 1.30% for 2020. The weighted average discount rates were 1.01% and 0.52% for 2021 and 2020, respectively. These amounts are weighted based on the fair value of level 3 plan assets subject to fluctuations in the discount rate. Any changes in these variables will impact the fair value of level 3 assets.2017: $ 127,953 2,633 (3,728 ) (2,089 ) 8,753 17,455 $ 150,977 Fiscal Year 2021 2020 (in thousands) Balance of level 3 assets, beginning of year $ 137,623 $ 115,252 (10,189) 6,767 Purchases, sales and settlements, net 440 437 Assets transferred into level 3 732 3,934 Translation adjustment (7,480) 11,233 Balance of level 3 assets, end of year $ 121,126 $ 137,623 2018,2022, the Company expects to contribute $3.3$4.1 million to the plans. It is anticipated that future benefit payments for the foreign defined benefit plans will be as follows: $ 9,115 9,334 9,650 10,011 10,257 2023 - 2027 54,661 Fiscal Year Expected Payments (in thousands) 2022 $ 10,880 2023 11,090 2024 11,321 2025 11,485 2026 11,632 2027-2031 60,632 nonqualifiednon-qualified salary continuation plan (“SCP”), which is designed to induce selected officers of the Company to remain in the employ of the Company by providing them with retirement, disability and death benefits in addition to those which they may receive under the Company’s other retirement plans and benefit programs. The SCP entitles participants to: (i) retirement benefits upon normal retirement at age 65 (or early retirement as early as age 55)55) after completing at least 15 years of service with the Company (unless otherwise provided in the SCP), payable for the remainder of their lives (or, if elected by a participant, a reduced benefit is payable for the remainder of the participant’s life and any surviving spouse’s life) and in no event less than 10 years under the death benefit feature; (ii) disability benefits payable for the period of any total disability; and (iii) death benefits payable to the designated beneficiary of the participant for a period of up to 10 years. Benefits are determined according to one of three formulas contained in the SCP, and the SCP is administered by the Compensation Committee of the Company’s Board of Directors, which has full discretion in choosing participants and the benefit formula applicable to each. The Company’s obligations under the SCP are currently unfunded (although the Company uses insurance instruments to hedge its exposure thereunder). The Company is required to contribute the present value of its obligations thereunder to an irrevocable grantor trust in the event of a change in control as defined in the SCP. The Company uses a year-end measurement date for the domestic SCP.20172021 and 2020 as there are no longer any active participants accruing benefits in the plan. $ 29,700 $ 25,860 0 440 1,256 1,269 (1,943 ) (1,012 ) 2,906 3,143 $ 31,919 $ 29,700 Fiscal Year 2021 2020 (in thousands) Change in benefit obligation: Benefit obligation, beginning of year $ 33,834 $ 31,740 Interest cost 706 938 Benefits paid (1,965) (2,030) Actuarial loss (gain) (2,522) 3,186 Benefit obligation, end of year $ 30,053 $ 33,834 65 $ 2,030 $ 1,890 29,889 27,810 Total benefit obligation $ 31,919 $ 29,700 End of Fiscal Year 2021 2020 (in thousands) Current liabilities $ 1,873 $ 2,030 Non-current liabilities 28,180 31,804 Total benefit obligation $ 30,053 $ 33,834 income,loss, after tax, are as follows: 8,582 $ 5,626 Fiscal Year 2021 2020 (in thousands) Unrecognized actuarial loss $ 8,679 $ 11,031 $31.9$30.1 million and $29.7$33.8 million as of December 31, 2017 January 2, 2022 and January 1, 2017, 3, 2021, respectively. The SCP is currently unfunded; as such, the benefit obligations disclosed are also the benefit obligations in excess of the plan assets. The Company uses insurance instruments to help limit its exposure under the SCP. 3.85 % 4.25 % 4.0 % - 4.0 % 4.0 % 3.5 % 3.85 % 4.25 % - 4.0 % 4.0 % $ 0 $ 440 $ 594 1,256 1,269 1,113 364 811 522 $ 1,620 $ 2,520 $ 2,229 Fiscal Year 2021 2020 2019 (in thousands, except for assumptions) Assumptions used to determine net periodic benefit cost: Discount rate 2.15 % 3.05 % 4.10 % Assumptions used to determine benefit obligations: Discount rate 2.65 % 2.15 % 3.05 % Components of net periodic benefit cost: Interest cost $ 706 $ 938 $ 1,154 Amortizations 743 558 375 Net periodic benefit cost $ 1,449 $ 1,496 $ 1,529 incomeloss during 20172021 related to the SCP as a result of plan activity and valuation werewas a net gain of approximately $1.7$2.3 million after tax,(net of $1.0 million of tax), primarily comprised of a net lossgain during the period of $2.0$1.8 million (net of $0.8 million of tax) and amortization of loss of $0.3 million. In addition to these items, as a result$0.5 million (net of the recently enacted U.S. Tax Cuts and Jobs Act changes, the Company increased its minimum pension liability which resides in accumulated other comprehensive income by $1.3 million to record the liability net of the new lower U.S. federal tax rate.For 2018, the Company estimates that approximately $0.5$0.2 million of expenses related to the amortization of unrecognized items will be included in net periodic benefit cost for the SCP.662017,2021, the Company contributed $1.9$2.0 million in the form of direct benefit payments for its domestic SCP. It is anticipated that future benefit payments for the SCP will be as follows: $ 2,030 2,030 2,030 2,030 2,030 2023 - 2027 9,990 Fiscal Year Expected Payments (in thousands) 2022 $ 1,873 2023 1,873 2024 1,873 2025 1,873 2026 1,873 2027-2031 8,886 1620–ENTERPRISE-WIDE DISCLOSURESBased on applicablethree operating2 reportable segments – namely, the Americas, EuropeAMS and Asia-Pacific geographic regions. Pursuant to accounting standards, the Company has aggregated the three operating segments into one reporting segment because they have similar economic characteristics, and the operating segments are similar in all of the following areas: (a) the nature of the products and services; (b) the nature of the production processes; (c) the type or class of customer for their products and services; (d) the methods used to distribute their products or provide their services; and (e) the nature of the regulatory environment.While the Company operatesEAAA as one reporting segment for the reasons discussed, included below is selected information on our operating segments.Summary information by each operating segment follows: $ 588,052 $ 246,399 $ 161,992 $ 996,443 13,548 6,049 8,662 28,259 272,883 253,519 193,555 719,957 $ 568,138 $ 241,463 $ 149,016 $ 958,617 14,639 5,698 8,729 29,066 237,900 261,182 238,317 737,399 $ 593,163 $ 262,671 $ 146,029 $ 1,001,863 15,390 5,007 9,167 29,564 Fiscal Year 2021 2020 2019 (in thousands) Net Sales AMS $ 651,216 $ 593,418 $ 757,112 EAAA 549,182 509,844 585,917 Total net sales $ 1,200,398 $ 1,103,262 $ 1,343,029 Segment AOI AMS $ 85,014 $ 89,097 $ 120,921 EAAA 37,268 21,403 28,832 Depreciation and Amortization AMS $ 17,963 $ 17,164 $ 15,884 EAAA 28,382 28,756 29,048 Total depreciation and amortization $ 46,345 $ 45,920 $ 44,932 67Company’sCompany’s total operating segment depreciation and amortization, and assets to the corresponding consolidated amounts follows: $ 28,259 $ 29,066 $ 29,564 2,002 1,566 1,239 $ 30,261 $ 30,632 $ 30,803 $ 719,957 $ 737,399 80,643 98,040 $ 800,600 $ 835,439 End of Fiscal Year 2021 2020 (in thousands) Assets AMS $ 652,423 $ 800,068 EAAA 691,844 682,295 Total segment assets 1,344,267 1,482,363 Corporate assets 146,204 111,073 Eliminations (160,414) (287,425) Total reported assets $ 1,330,057 $ 1,306,011 End of Fiscal Year Operating Lease Right-of-Use Assets 2021 2020 (in thousands) AMS $ 12,662 $ 11,945 EAAA 67,741 74,265 Total segment operating lease right-of-use assets 80,403 86,210 Corporate operating lease right-of-use assets 10,158 11,803 Total operating lease right-of-use assets $ 90,561 $ 98,013 Fiscal Year 2021 2020 2019 (in thousands) AMS operating income $ 81,445 $ 73,234 $ 118,332 EAAA operating income (loss) 23,352 (112,521) 12,571 Consolidated operating income (loss) 104,797 (39,287) 130,903 Interest expense 29,681 29,244 25,656 Other expense 2,483 10,889 3,431 Income (loss) before income tax expense $ 72,633 $ (79,420) $ 101,816 Fiscal Year 2021 2020 2019 AMS EAAA AMS EAAA AMS EAAA (in thousands) Operating income (loss) $ 81,445 $ 23,352 $ 73,234 $ (112,521) $ 118,332 $ 12,571 Purchase accounting amortization — 5,636 — 5,457 — 5,903 Goodwill and intangible asset impairment — — 2,695 118,563 — — Impact of change in equity award forfeiture accounting — — 757 650 — — Restructuring, asset impairment, severance and other charges 3,569 8,280 9,722 6,943 2,589 10,358 SEC fine — — 2,689 2,311 — — AOI $ 85,014 $ 37,268 $ 89,097 $ 21,403 $ 120,921 $ 28,832 2017,20162021, 2020 and 20152019 were approximately 48%50%,48% 51% and 48%49%, respectively, of total net sales. These sales were primarily to customers in Europe, Canada, Asia, Australia and Latin America. With the exception ofOther than the United States in 2021, 2020 and 2019, and Germany in 2020, noone country represented more than 10% of the Company’s net sales.sales during the past three years. Revenue and long-lived assets related to operations in the United States and other countries are as follows: $ 514,783 $ 501,206 $ 520,375 57,391 58,266 72,445 87,591 78,141 76,600 336,678 321,004 332,443 $ 996,443 $ 958,617 $ 1,001,863 $ 76,557 $ 79,365 7,902 8,122 55,132 43,907 45,067 44,209 16,543 16,645 8,361 9,675 3,083 2,585 $ 212,645 $ 204,508 (1) Fiscal Year 2021 2020 2019 (in thousands) United States $ 596,844 $ 545,183 $ 681,868 Germany 115,712 115,402 117,418 Other foreign countries 487,842 442,677 543,743 Total net sales $ 1,200,398 $ 1,103,262 $ 1,343,029 End of Fiscal Year 2021 2020 (in thousands) United States $ 157,194 $ 163,983 Germany 71,114 79,294 Netherlands 47,476 51,190 Other foreign countries 54,017 64,569 Total long-lived assets $ 329,801 $ 359,036 (2)include tangible assets physically locatedattributed to geographic areas are based on the physical location of the asset. 2021 includes $1.6 million and $4.9 million of leased equipment, net of accumulated amortization, in the United States and foreign countries.countries, respectively. 2020 includes $1.8 million and $4.3 million of leased equipment, net of accumulated amortization, in the United States and foreign countries, respectively.681721 –QUARTERLY DATA AND SHARE INFORMATION (UNAUDITED)The following tables set forth, for the fiscal periods indicated, selected consolidated financial data and information regarding the market price per share of the Company’s Common Stock. The prices represent the reported high and low sale prices during the period presented. $ 221,102 $ 251,700 $ 257,431 $ 266,210 87,802 97,897 98,544 101,778 8,547 20,938 19,439 4,322 $ 0.13 $ 0.33 $ 0.32 $ 0.07 $ 0.13 $ 0.33 $ 0.32 $ 0.07 $ 19.93 $ 21.05 $ 22.60 $ 25.70 $ 17.18 $ 18.15 $ 18.30 $ 21.21 (1)Results for the first quarter of 2017 include restructuring and asset impairment charges of $7.3 million.(2)Results for the fourth quarter of 2017 include tax charges of $15.2 million as a result of the recently enacted U.S. Tax Cuts and Jobs Act. $ 222,554 $ 248,207 $ 248,349 $ 239,507 86,632 99,126 92,918 89,968 12,894 20,657 15,904 4,707 $ 0.20 $ 0.32 $ 0.25 $ 0.07 $ 0.20 $ 0.32 $ 0.25 $ 0.07 $ 18.99 $ 18.71 $ 18.45 $ 19.10 $ 13.70 $ 14.56 $ 15.02 $ 14.59 (1) Results for the fourth quarter of 2016 include restructuring and asset impairment charges of $19.8 million.NOTE 18– ITEMS RECLASSIFIED FROM ACCUMULATED OTHER COMPREHENSIVE INCOMEDuring 2017, the Company did not reclassify any significant amountsLOSSincome. The only reclassifications that occurredloss (“AOCI”), before tax, to the consolidated statements of operations for the fiscal years 2021, 2020 and 2019, are reflected in that period were comprisedthe tables below:Fiscal Year Statement of Operations Location 2021 2020 2019 (in thousands) Foreign currency contracts loss Cost of sales $ — $ — $ (450) Interest expense (4,861) (7,287) 151 Other expense (2,825) (2,213) (976) Total loss reclassified from AOCI $ (7,686) $ (9,500) $ (1,275) $1.6$1.4 million, $(2.5) million and $(1.6) million for 2021, 2020 and 2019, respectively, related to cash flow hedges.retirement benefit plans and salary continuation plan. These reclassifications were included in the selling, general and administrative expenses line item of the Company’s consolidated statement of operations.plans.69 and Subsidiariesand Subsidiaries (the “Company”“Company”) as of December 31, 2017January 2, 2022 and January 1, 2017 and3, 2021, the related consolidated statements of operations, comprehensive income (loss), and cash flows for each of the three years in the period ended December 31, 2017,January 2, 2022, and the related notes and financial statement schedule listed in the accompanying index (collectively referred to as the “consolidated financial statements”). In our opinion, the consolidated financial statements present fairly, in all material respects, the financial position of the Company and subsidiaries at December 31, 2017January 2, 2022 and January 1, 2017,3, 2021, and the results of theirits operations and theirits cash flows for each of the three years in the period ended December 31, 2017January 2, 2022, in conformity with accounting principles generally accepted in the United States of America.December 31, 2017,January 2, 2022, based on criteria established in Internal Control – Integrated Framework (2013) issued by the Committee of Sponsoring Organizations of the Treadway Commission (“COSO”) and our report dated March 1, 20182, 2022 expressed an unqualified opinion thereon.Company’sCompany’s management. Our responsibility is to express an opinion on the Company’s consolidated financial statements based on our audits. We are a public accounting firm registered with the Public Company Accounting Oversight Board (United States) (“PCAOB”) and are required to be independent with respect to the Company in accordance with the U.S. federal securities laws and the applicable rules and regulations of the Securities and Exchange Commission and the PCAOB.reasonablereasonable assurance about whether the consolidated financial statements are free of material misstatement, whether due to error or fraud.statements,statements, whether due to error or fraud, and performing procedures that respond to those risks. Such procedures included examining, on a test basis, evidence regarding the amounts and disclosures in the consolidated financial statements. Our audits also included evaluating the accounting principles used and significant estimates made by management, as well as evaluating the overall presentation of the consolidated financial statements. We believe that our audits provide a reasonable basis for our opinion./s/ BDO USA, LLP1, 2,018 202270 and Subsidiaries and Subsidiaries’’s (the “Company’s”) internal control over financial reporting as of December 31, 2017,January 2, 2022, based on criteria established in Internal Control – Integrated Framework (2013) issued by the Committee of Sponsoring Organizations of the Treadway Commission (the “COSO criteria”). In our opinion, the Company maintained, in all material respects, effective internal control over financial reporting as of December 31, 2017,January 2, 2022, based on the COSO criteria.inin accordance with the standards of the Public Company Accounting Oversight Board (United States) (“PCAOB”), the consolidated balance sheets of the Company as of December 31, 2017January 2, 2022 and January 1, 2017, and3, 2021, the related consolidated statements of operations, comprehensive income (loss), and cash flows for each of the three years in the period ended December 31, 2017,January 2, 2022, and the related notes and schedule and our report dated March 1, 20182, 2022 expressed an unqualified opinion thereon.Company’sCompany’s management is responsible for maintaining effective internal control over financial reporting and for its assessment of the effectiveness of internal control over financial reporting, included in the accompanying Item 9A, Management’s Annual Report on Internal Control over Financial Reporting. Our responsibility is to express an opinion on the Company’s internal control over financial reporting based on our audit. We are a public accounting firm registered with the PCAOB and are required to be independent with respect to the Company in accordance with U.S. federal securities laws and the applicable rules and regulations of the Securities and Exchange Commission and the PCAOB.company’scompany’s internal control over financial reporting is a process designed to provide reasonable assurance regarding the reliability of financial reporting and the preparation of financial statements for external purposes in accordance with generally accepted accounting principles. A company’s internal control over financial reporting includes those policies and procedures that (1) pertain to the maintenance of records that, in reasonable detail, accurately and fairly reflect the transactions and dispositions of the assets of the company; (2) provide reasonable assurance that transactions are recorded as necessary to permit preparation of financial statements in accordance with generally accepted accounting principles, and that receipts and expenditures of the company are being made only in accordance with authorizations of management and directors of the company; and (3) provide reasonable assurance regarding prevention or timely detection of unauthorized acquisition, use, or disposition of the company’s assets that could have a material effect on the financial statements.1, 20182, 202271CHANGES IN AND DISAGREEMENTS WITH ACCOUNTANTS ON ACCOUNTING AND FINANCIAL DISCLOSUREManagement’s December 31, 2017 January 2, 2022 based on the criteria set forth by the Committee of Sponsoring Organizations of the Treadway Commission (COSO) in “Internal Control – Integrated Framework (2013).” Based on that assessment, management concluded that, as of December 31, 2017,January 2, 2022, our internal control over financial reporting was effective based on those criteria.OTHER INFORMATION“Section“Delinquent Section 16(a) Beneficial Ownership Reporting Compliance”Reports” and “Meetings and Committees of the Board of Directors”Board” in our definitive Proxy Statement for our 20182022 Annual Meeting of Shareholders, to be filed with the Securities and Exchange Commission pursuant to Regulation 14A not later than 120 days after the end of our 20172021 fiscal year, is incorporated herein by reference. Pursuant to Instruction 3 to Paragraph (b) of Item 401 of Regulation S-K, information relating to our executive officers is included in Item 1 of this Report.72EXECUTIVE COMPENSATION20182022 Annual Meeting of Shareholders, to be filed with the Securities and Exchange Commission pursuant to Regulation 14A not later than 120 days after the end of our 20172021 fiscal year, is incorporated herein by reference.SECURITY OWNERSHIP OF CERTAIN BENEFICIAL OWNERS AND MANAGEMENT AND RELATED STOCKHOLDER MATTERS20182022 Annual Meeting of Shareholders, to be filed with the Securities and Exchange Commission pursuant to Regulation 14A not later than 120 days after the end of our 20172021 fiscal year, is incorporated herein by reference.CERTAIN RELATIONSHIPS AND RELATED TRANSACTIONS, AND DIRECTOR INDEPENDENCE20182022 Annual Meeting of Shareholders, to be filed with the Securities and Exchange Commission pursuant to Regulation 14A not later than 120 days after the end of our 20172021 fiscal year, is incorporated herein by reference.ITEM 14.PRINCIPAL ACCOUNTANT FEES AND SERVICES20182022 Annual Meeting of Shareholders, to be filed with the Securities and Exchange Commission pursuant to Regulation 14A not later than 120 days after the end of our 20172021 fiscal year, is incorporated herein by reference.Consolidated Financial Statementsconsolidated financial statements and Notesnotes thereto of Interface, Inc. and subsidiaries and related Reports of Independent Registered Public Accounting Firm are contained in Item 8 of this Report:31, 2017,29, 2019.1, 20172, 2022 and January 3, 2016.Consolidated Balance Sheets — December 31, 2017 and January 1, 2017.December 31, 2017, January 1, 2017 and2, 2022, January 3, 2016.2021, and December 29, 2019.73Consolidated Financial Statement Scheduleconsolidated financial statement schedule of Interface, Inc. and subsidiaries areis included as part of this Report (see the pages immediately preceding the signatures in this Report).included as part offiled or furnished with this Report:21 ————— — — — Document — Document— Document — Document— Document104 The cover page from this Annual Report on Form 10-K for the year ended January 2, 2022, formatted in Inline XBRL. __________None.INTERFACE,None. $ 3,780 $ 635 $ 0 $ 922 $ 3,493 4,479 (243 ) 0 456 3,780 5,896 212 0 1,629 4,479 ______________ COLUMN A
BALANCE, AT
BEGINNING
OF YEARCOLUMN B
CHARGED TO
COSTS AND
EXPENSES (A)COLUMN C
CHARGED TO
OTHER
ACCOUNTSCOLUMN D
DEDUCTIONS
(DESCRIBE) (B)COLUMN E
BALANCE, AT
END OF YEAR (in thousands) Allowance for Expected Credit Losses Year ended: January 2, 2022 $ 6,643 $ (705) $ — $ 978 $ 4,960 January 3, 2021 3,793 3,777 — 927 6,643 December 29, 2019 3,540 881 — 628 3,793 WriteWrite off of bad debt, and recoveringrecovery of previously provided for amounts. $ 10,291 $ 3,999 $ 3,300 $ 3,724 $ 2,568 104 11,769 8,019 1,582 10,291 7,179 (481 ) 0 6,594 104 ______________ COLUMN A
BALANCE, AT
BEGINNING
OF YEARCOLUMN B
CHARGED TO
COSTS AND
EXPENSES (A)COLUMN C
CHARGED
TO OTHER
ACCOUNTSCOLUMN D
DEDUCTIONS
(DESCRIBE) (B)COLUMN E
BALANCE, AT
END OF YEAR (in thousands) Warranty and Sales Allowances Reserves Year ended: January 2, 2022 $ 3,248 $ 366 $ — $ 912 $ 2,702 January 3, 2021 3,853 1,062 — 1,667 3,248 December 29, 2019 3,495 1,519 — 1,161 3,853 Direct reduction of asset carrying value, not included in restructuring reserve.(C) Cash payments. $ 5,529 $ 2,071 $ 0 $ 3,489 $ 4,111 4,759 3,149 0 2,379 5,529 3,954 2,584 0 1,779 4,759 ______________ (A) Includes changes in foreign currency exchange rates.(B) Company's Consolidated Financial StatementsCompany’s consolidated financial statements or the Notesnotes thereto.)78Date: March 1, 2018INTERFACE, INC.Date: March 2, 2022 INTERFACE, INC. By:/s/ JAYD. GOULDBy: Jay D. GouldPresident and Chief Executive Officer SignatureCapacityDateSignature Capacity Date /s/ DANIEL T. HENDRIX Chairman of the Board and DirectorMarch 1, 2018Daniel T. Hendrix/s/ JAY D. GOULD1, 2018Jay D. Gould(Principal Executive Officer) Vice President and Chief Financial Officer 1, 2018(Principal Financial Officer) GREGORY J. BAUERVice President and Chief Accounting Officer 1, 2018Gregory J. Bauer(Principal Accounting Officer) DirectorDirector March 1, 2018 2, 2022ANDREW B. COGANDirectorDirector March 1, 2018 2, 2022Andrew B. Cogan/s/ CARL I. GABLEDirectorMarch 1, 2018Carl I. GableDirectorDirector March 1, 2018 2, 2022Director March 2, 2022 Joseph Keough /s/ CATHERINE M. KILBANE Director March 2, 2022 Catherine M. Kilbane /s/ K. DAVID KOHLER DirectorDirector March 1, 2018 2, 2022ERIN A. MATTSDirectorMarch 1, 2018Erin A. Matts/s/ JAMES B. MILLER, JR.DirectorMarch 1, 2018James B. Miller, Jr./s/ SHERYL D. PALMERDirectorDirector March 1, 2018 2, 2022ExhibitNumberDescription of Exhibit21Subsidiaries of the Company.23Consent of BDO USA, LLP.24Power of Attorney.31.1Certification of Chief Executive Officer with respect to the Company’s Annual Report on Form 10-K for the fiscal year ended December 31, 2017.31.2Certification of Chief Financial Officer with respect to the Company’s Annual Report on Form 10-K for the fiscal year ended December 31, 2017.32.1Certification Pursuant to Section 1350 of Chapter 63 of Title 18 of United States Code by Chief Executive Officer with respect to the Company’s Annual Report on Form 10-K for the fiscal year ended December 31, 2017.32.2Certification Pursuant to Section 1350 of Chapter 63 of Title 18 of United States Code by Chief Financial Officer with respect to the Company’s Annual Report on Form 10-K for the fiscal year ended December 31, 2017.101.INSXBRL Instance Document 101.SCHXBRL Taxonomy Extension Schema Document 101.CALXBRL Taxonomy Extension Calculation Linkbase Document 101.LABXBRL Taxonomy Extension Label Linkbase Document 101.PREXBRL Taxonomy Presentation Linkbase Document 101.DEFXBRL Taxonomy Definition Linkbase Document 
81