Table of Contents

UNITEDUNITED STATES

SECURITIES AND EXCHANGE COMMISSION

Washington, D.C. 20549


FORM 10-K10-K


[X]

ANNUAL REPORT PURSUANT TO SECTION 13 OR 15(d) OF THE SECURITIES EXCHANGE ACT OF 1934

For the fiscal year ended December 31, 20172023     

or

[ ]

TRANSITION REPORT PURSUANT TO SECTION 13 OR 15(d) OF THE SECURITIES EXCHANGE ACT OF 1934

For the transition period from  to 

For the transition period from _______________ to _______________

Commission file number: 001-35929File Number 001-35929

National Research Corporation

(Exact name of registrantRegistrant as specified in its charter)


                 Wisconsin                  Delaware

47-0634000

(State or other jurisdiction of

of (I.R.S. Employer

incorporation or organization)

    47-0634000     

(I.R.S. Employer

Identification No.)


1245 Q Street, Lincoln, Nebraska 68508


1245 Q Street

                Lincoln, Nebraska                 

(Address of principal executive offices) (Zip Code)

  68508   

(Zip code)


Registrant’s telephone number, including area code: (402) 475-2525

(Registrant’s telephone number, including area code)


Securities registered pursuant to Section 12(b) of the Act:

Title of Each Class

Trading Symbol(s)

Name of Each Exchangeeach exchange on Which Registeredwhich registered

Class A

Common Stock, $.001 par value

NRC

The NASDAQ Stock Marketstock market

Class B Common Stock, $.001 par valueThe NASDAQ Stock Market

Securities registered pursuant to Section 12(g) of the Act: None

Indicate by check mark if the registrant is a well-known seasoned issuer, as defined in Rule 405 of the Securities Act.

Yes ☐ No ☒


Indicate by check mark if the registrant is not required to file reports pursuant to Section 13 or Section 15(d) of the Act.


Yes ☐ No ☒


Indicate by check mark whether the registrant (1) has filed all reports required to be filed by Section 13 or 15(d) of the Securities Exchange Act of 1934 during the preceding 12 months (or for such shorter period that the registrant was required to file such reports), and (2) has been subject to such filing requirements for the past 90 days.

Yes  ☒  No ☐


Indicate by check mark whether the registrant has submitted electronically and posted on its corporate Web site, if any, every Interactive Data File required to be submitted and posted pursuant to Rule 405 of Regulation S-T during the preceding 12 months (or for such shorter period that the registrant was required to submit and post such files). Yes  ☒  No ☐

Indicate by check mark if disclosure of delinquent filers pursuant to Item 405 of Regulation S-K is not contained herein, and will not be contained, to the best of registrant’s knowledge, in definitive proxy or information statements incorporated by reference in Part III of this Form 10-K or any amendment to this Form 10-K. ☐


Indicate by check mark whether the registrant is a large accelerated filer, an accelerated filer, a non-accelerated filer, a smaller reporting company, or an emerging growth company. See the definitions of “large"large accelerated filer,” “accelerated" "accelerated filer,” “smaller" "smaller reporting company”company," and “emerging"emerging growth company”company" in Rule 12b-2 of the Exchange Act.

Large accelerated filer

☐       

Accelerated filer     

Non-accelerated filer

Smaller reporting company

Non-accelerated filer ☐ (Do not check if a smaller reporting company)

Emerging growth company


If an emerging growth company, indicate by check mark if the registrant has elected not to use the extended transition period for complying with any new or revised financial accounting standards provided pursuant to Section 13(s)13(a) of the Exchange Act.    ☐

Indicate by check mark whether the registrant has filed a report on and attestation to its management’s assessment of the effectiveness of its internal control over financial reporting under Section 404(b) of the Sarbanes-Oxley Act (15 U.S.C. 7262(b)) by the registered public accounting firm that prepared or issued its audit report ☒

If securities are registered pursuant to Section 12(b) of the Act, indicate by check mark whether the financial statements of the registrant included in the filing reflect the correction of an error to previously issued financial statements. ☐

Indicate by check mark whether any of those error corrections are restatements that required a recovery analysis of incentive-based compensation received by any of the registrant’s executive officers during the relevant recovery period pursuant to §240.10D-1(b). ☐


Indicate by check mark whether the registrant is a shell company (as defined in Rule 12b-2 of the Act.) Yes ☐    No  ☒ 


Aggregate market value of the class A common stock and the class B common stock held by non-affiliates of the registrant at June 30, 2017: $458,611,975.2023: $531,062,262.


Indicate the number of shares outstanding of each of the issuer’sissuer’s classes of common stock as of the latest practicable date.

Class A

Common Stock, $0.001 par value, outstanding as ofFebruary28, 2018: 20,970,575shares

Class B Common Stock, $0.001$.001 par value, outstanding as of February 28, 2018: 3,540,857shares13, 2024: 23,854,428

DOCUMENTS INCORPORATED BY REFERENCE

Portions of the Proxy Statement for the 20182024 Annual Meeting of Shareholders are incorporated by reference into Part III.


TABLE OF CONTENTS


Page

PART I


Item 1.

Business

1

Item 1A.

Risk Factors

8

7

Item 1B.

Unresolved Staff Comments

15

13Item 1C.

Cybersecurity

15

Item 2.

Properties

13

16

Item 3.

Legal Proceedings

14

16

Item 4.

Mine Safety Disclosures

14

16
   

PART II


Item 5.

Market for Registrant’sRegistrant’s Common Equity, Related Stockholder Matters and Issuer Purchases of Equity Securities

15

17

Item 6.

Selected Financial Data[Reserved]

17

18

Item 7.

Management’sManagement’s Discussion and Analysis of Financial Condition andand Results of Operations

18

19

Item 7A.

Quantitative and Qualitative Disclosure About Market Risk

28

26

Item 8.

Financial Statements and Supplementary Data

29

26

Item 9.

Changes in and Disagreements with Accountants on Accounting and Financial Disclosure

57

56

Item 9A.

Controls and Procedures

57

56

Item 9B.

Other Information

56

57Item 9C.

Disclosure Regarding Foreign Jurisdictions that Prevent Inspections

56
   

PART III


Item 10.

Directors,, Executive Officers and Corporate Governance

60

57

Item 11.

Executive Compensation

60

57

Item 12.

Security Ownership of Certain Beneficial Owners and Management andand Related Shareholder Matters

60

57

Item 13.

Certain Relationships and Related Transactions,, and Director Independence

61

58

Item 14.

Principal Accountant Fees and Services

61

58
   

PART IV


Item 15.

Exhibits

62

59

Item 16.

Form 10-K Summary

64

60

Signatures

66

62


i


PART I I


Item 1.

Business


Special Note Regarding Forward-Looking Statements


Certain matters discussed in this Annual Report on Form 10-K are “forward-looking statements” within the meaning of Section 21E of the Securities Exchange Act of 1934, as amended. These forward-looking statements can generally be identified as such because the context of the statement includes phrases such as National Research Corporation, doing business as NRC Health (“NRC Health,” the “Company,” “we,” “our,” “us” or similar terms), “believes,” “expects,” “may,” “could,” “anticipates,” “estimates,” “plans,” “intends,” or the use of words such as “would,” “will,” “may,” “could,” “goal,” “focus,” or “should,” or other words of similar import. Similarly, statements that describe the Company’sour future plans, objectives or goals are also forward-looking statements. In this Annual Report on Form 10-K, statements regarding the value and utility of, and market demand for, our service offerings, future opportunities for growth with respect to new and existing clients, our future ability to compete and the types of firms with which we will compete, future consolidation in the healthcare industry, future adequacy of our liquidity sources, future revenue sources, future revenue growth, future revenue estimates used to calculate recurring contract value, the expected impact of economic factors, including interest rates and inflation, future capital expenditures including, without limitation, our headquarters renovation costs, and the timing, amount, and sources of cash to fund such capital expenditures, future stock repurchases and dividends, the expected impact of pending claims and contingencies, the future outcome of uncertain tax positions, our future use of owned and leased real property, and the expected impact of global conflicts, among others, are forward-looking statements. Such forward-looking statements are subject to certain risks and uncertainties which could cause actual results or outcomes to differ materially from those currently anticipated. Factors that could affect actual results or outcomes include, without limitation, the following factors:


The possibility of non-renewal of the Company’sour client service contracts, reductions in services purchased or prices, and retention offailure to retain key clients;


The Company’sOur ability to compete in itsour markets, which are highly competitive with new market entrants, and the possibility of increased price pressure and expenses;


The effects of an economic downturn;likelihood that a pandemic will adversely affect our operations, sales, earnings, financial condition and liquidity;


The impact of consolidation in the healthcare industry;likelihood that global conflicts will adversely affect our operations, sales, earnings, financial condition and liquidity;


The effects of an economic downturn;


The impact of federalconsolidation in the healthcare reform legislation or other regulatory changes;industry;


The Company’simpact of federal healthcare reform legislation or other regulatory changes;

Our ability to attract and retain key managers and other personnel;


The possibility that the Company’sour intellectual property and other proprietary information technology could be copied or independently developed by itsour competitors;


Our ability to maintain effective internal controls;

The possibility for failures or deficiencies in our information technology platform;


The possibility that the Companywe or our third-party providers could be subject to cyber-attacks, security breaches or computer viruses; and


The factors set forth under the caption “Risk Factors” in Part I, Item 1A of this Annual Report on Form 10-K.10-K and various disclosures in our press releases, stockholder reports, and other filings with the Securities and Exchange Commission.


Shareholders, potential investors and other readers are urged to consider these and other factors in evaluating the forward-looking statements and are cautioned not to place undue reliance on such forward-looking statements. The forward-looking statements included are only made as of the date of this Annual Report on Form 10-K and the Company undertakeswe undertake no obligation to publicly update such forward-looking statements to reflect subsequent events or circumstances,, except as required by the federal securities laws.

1


General


The Company is aFor more than 40 years, NRC Health has led the charge to humanize healthcare and support organizations in their understanding of each unique individual. NRC Health’s commitment to Human Understanding® helps leading provider of analyticshealthcare systems get to know each person they serve not as point-in-time insights, but as an ongoing relationship. Guided by its uniquely empathic heritage, NRC Health’s patient-focused approach, unmatched market research, and insights that facilitate measurementemphasis on consumer preferences are transforming the healthcare experience, creating strong outcomes for patients and improvement of the patient and employee experience while also increasing patient engagement and customer loyalty forentire healthcare providers, payers and other healthcare organizations. The Company’ssystems.

Our end-to-end solutions enable itsour clients to understand what matters most to each person they serve – before, during, after, and beyond clinical encounters – to gain a longitudinal understanding of how life and health intersect, with the voicegoal of the customer with greater clarity, immediacy and depth. NRC Health’s heritage, proprietary methods, and holistic approach enable our partners to better understand the people they care for and design experiences that inspire loyalty and trust, while also facilitating regulatory compliance and the shift to population-based health management. The Company’sdeveloping lasting, trusting relationships. Our ability to measure what matters most and systematically capture, analyze, and deliver insights based on self-reported information from patients, families, and consumers is critical in today’s healthcare market. NRC Health believes thatWe believe access to, and analysis of, itsour extensive consumer-driven information is becoming moreincreasingly valuable as healthcare providers increasingly need to more deeplybetter understand and engage patientsthe people they serve to create long-term relationships and consumers in an effort towards effective population-based health management.build loyalty.


1

Table of Contents

NRC Health’sOur expertise includes the efficient capture, interpretation, transmittal, analysis, and benchmarkinginterpretation of critical data elements from millions of healthcare consumers. Using its portfolio ofour solutions, through internet-based business intelligence tools, the Company’s clientsour partners gain insights into what people think and how they feel about their organizations in real-time, allowing them to build on their strengths and resolveimplement service issuesrecovery with greater speed and personalization. The Company’s clients areWe also ableprovide legacy experience-based solutions and shared intelligence from industry thought leaders and the nation’s largest member network focused on healthcare governance and strategy to access networking groups, on-line educationmember boards and an extensive library of performance improvement material that can be tailored to each of their unique needs.executives.


The Company’sOur portfolio of subscription-based solutions provideprovides actionable information and analysis to healthcare organizations and payers across a range of mission-critical, constituent-related elements, including patient experience, service recovery, care transitions, employee engagement, reputation management, and satisfaction, community population health risks, workforce engagement, community perceptions, and physician engagement. NRC Health partnersbrand loyalty. We partner with clients across the continuum of healthcare services. The Company’s clients range from integrated health systemsservices and post-acute providers, such as home health, long term care and hospice, to numerous payer organizations. The Company believesbelieve this cross-continuum positioning is a unique and an increasingly important capability as evolving payment models drive healthcare providers and payers towards a more collaborative and integrated service model.


NRC Health hasWe have a broad and diversified client base that is distributed primarily across the United States. Our ten largest clients collectively accounted for 15%, 15%, and 14% of our total revenue in 2023, 2022 and 2021, respectively.

We have achieved a market leadership position through itsour more than 3640 years of industry innovation and experience, as well as itsour long-term, recurring revenue relationships (solutions that are used or required by a client each year) with many of the healthcare industry’s largest organizations. Since itsour founding in 1981, the Company haswe have focused on meeting the evolving information needs of the healthcare industry through internal product development, as well as select acquisitions. The Company isWe are a WisconsinDelaware corporation headquartered in Lincoln, Nebraska.


Industry and Market OpportunityHuman Understanding Solutions


AccordingNRC Health recognizes that behind every person is a story. We help our partners get to the Centers for Medicareknow each person they serve - their behaviors, preferences, wants, and Medicaid Services (“CMS”), health expenditures in the United States were approximately $3.3 trillion in 2016, or $10,348 per person. In total, health spending accounted for 17.9% of the nation’s Gross Domestic Product in 2016. Addressing this growing expenditure burden continues to be a major policy priority at both federal and state levels. In addition, increased co-pays and deductibles in healthcare plans have focused even more consumer attention on health spending and affordability. In the public sector, Medicare provides health coverage for individuals aged 65 and older, while Medicaid provides coverage for low income families and other individuals in need. Both programs are administered by the CMS. With the aging of the U.S. population, Medicare enrollment has increased significantly.  In addition, longer life spans and greater prevalence of chronic illnesses among both the Medicare and Medicaid populations have placed tremendous demands on the health care system.needs—not as point-in-time insights, but as an ongoing relationship.


Driven by escalating costsWith the complexity and a growing recognition ofdemands associated with healthcare delivery today, seeing the challenges of chronic carewhole picture is now more important than ever. The end-to-end Human Understanding solutions are designed to help capture and unnecessary hospitalizations, Medicare reimbursement for healthcare providers is shifting from a volume-based approach (fees paid for each element of service rendered, independent of outcome)act on what matters most to a more value-based model, where reimbursement is based on the value (or quality) of the healthcare service delivered. The establishment of standardized quality-focused datasetspatients and their families, frontline employees, and the requirement that providers capturebroader community hospitals and transmit this data to CMS has enabled this shift.health systems serve.


An increasing percentageThe Human Understanding solutions deliver the capabilities needed to turn strategic aspiration into action in critical focus areas. Each set of Medicare reimbursementcapabilities unlocks Human Understanding at the right time and reimbursement from commercial payers will be determined under value payment models, based on factors such as patient readmission rates and provider adherence to certain quality-related protocols. At the same time, many hospitals and other providers are creating new models of care deliveryplace to improve patient experience, reduce costcare, enhance performance, and provide better clinical outcomes. These new models are based on sharing financial riskcatalyze growth.

Our digital solutions consist of three primary solution categories which can be implemented both collectively as an enterprise solution or individually to meet specific needs within the organization. The primary solution categories include Marketing, Reputation, and managing the health and behaviors of large populations of patients and consumers. Certain of these new models are known as accountable care organizations, or ACOs, and medical homes, in which multiple provider organizations are coordinated in providing care and bearing shared financial risk in serving a defined patient population. This transformation towards value-based payment models and increased engagement of healthcare consumers is resulting in a greater need for providers to deliver more customer-centric healthcare.Experience.


2

NRC Health believes that its current portfolio of solutions is aligned to address this evolving market opportunity. The Company provides tools and solutions to capture, interpret and improve the data required by CMS as well as enhanced capabilities that capture insights about patient health risks, behaviors and perceptions. The information and analytics provided through these solutions enable payers and providers to better understand what matters most to people at key moments in their relationship with a health organization. NRC Health’s solutions enable its clients to design experiences to improve the wellbeing of the people and communities they care for. In addition, the Company’s portfolio of experience solutions helps providers address and impact the types of behaviors that could result in reduced hospital re-admission rates, and a direct and measurable impact on providers’ revenue.

Finally, the Company believes that its ability to offer these insights across the entire care continuum is particularly relevant as new reimbursement models reward collaboration amongst different types of providers. Bundled payments, medical home, ACOs and other models of reimbursement for population-based health management all require effective coordination of care both within and outside of the traditional acute care settings.


NRC Health’sMarketing Solutions

NRC Health’s portfolio of solutions are designed to help healthcare companies understand the totality of how their organizations are experienced by the people they serve. NRC Health’s solutions address specific needs around market insight, experience, transparency, and governance for healthcare providers, payers and other healthcare organizations. While each distinct solution provides discernible value on a stand-alone basis, the Company believes that in combination, its solutions provide value through a comprehensive view of healthcare consumers both within healthcare settings and outside of those settings—creating a differentiated solution set to address the emerging needs for population-based health management.

NRC Health’s Market Insights Solutions NRC Health’s Market Insights Our Marketing solutions are subscription-based services that allow for improved tracking of awareness, perception, and consistency of healthcare brands; real-time assessment of competitive differentiators; and enhanced segmentation tools to evaluate the needs, wants, and behaviors of communities through real-time competitive assessments and enhanced segmentation tools. NRC Health’s Market Insights is the largest U.S. healthcare consumer database of its kind, measuring the opinions and behaviors of more than 292,000approximately 300,000 healthcare consumers in the top 300 markets across the countrycontiguous United States annually. NRC Health’s Market Insights is a syndicated survey that provides clients with an independent third-party source of information that is used to understand consumer perception and preferences and optimize marketing strategies. NRC Health’s Market InsightsOur Marketing solutions provide clients with on-demand tools to measure brand value and build brand equity in their markets, evaluate and optimize advertising efficacy and consumer recall, and tailor research to obtain the real time voice of customer feedback to support branding and loyalty initiatives. The Company’s Market Insights solutions were historically marketed under the Healthcare Market Guide and Ticker brands.


NRC Health’sExperience SolutionsNRC Health’sOur Experience solutions are provided on a subscription basis via a cross-continuum multi-mode digital platform that collects and measures data and then delivers business intelligence that our clients utilize to improve patient experience, engagement, and loyalty. Patient experience data can also be collected on a periodic basis using Consumer Assessment of Healthcare Providers and Systems (“CAHPS”) compliant mail and telephone survey methods for regulatory compliance purposes and to monitor and measure improvement in CAHPS survey scores. CAHPS survey data can be collected and measured as an integrated service within our digital platform or independently as a legacy service offering. Our Experience solutions provide hospitals and healthcare providerssystems with the ability to receive and take actionact on customer and employee feedback across all care settings in real-time. Experience solutions include patient and resident experience, workforceemployee engagement, health risk assessments, transitions,care transition, and improvement tools, which are provided through the Experience, Transitions and National Research Canada Corporation operating segments.tools. These solutions enable clients to comply with regulatory requirements and to improve their reimbursement under value-based purchasing models. More importantly, NRC Health’sour Experience solutions provide quantitative and qualitative real-time feedback, improvement plans, and coaching tools to enable clients to improve the experiences of patients, residents, physicians and staff.insights. By illuminating the complete care journey in real time, the Company’sour clients are able tocan ensure each individual receives the care, respect, and experience he or she deserves.they deserve. Developing a longitudinal profile of what healthcare customers want and need allows for organizational improvement and increased clinician and staff engagement, loyal relationships and personal well-being.

3

Table of Contents

NRC Health’s Experience solutions are provided on a subscription basis via a cross-continuum platform that collects and measures data and then delivers business intelligence that the Company’s clients utilize to improve patient experience, engagement andcustomer loyalty. Patient data can be collected on a longitudinal basis for improvement and regulatory compliance purposes as well as on a real time basis to support service recovery, rapid cycle improvement, and engagement activities. NRC Health provides these performance results and prescriptive analytics to its clients via web-based improvement planning and business intelligence portals. These solutions have previously been marketed under NRC Picker, My InnerView (“MIV”), Customer-Connect LLC (doing business as Connect), and NRC Canada.


NRC Health’s Health Risk AssessmentOur Experience solutions (formerly Payer Solutions) enable the Company’s clients to understand the health risks associated with populations of patients, analyze and address readmission risks, and efficiently reach out to patients to impact their behaviors outside of the healthcare provider settings. These health risk assessment solutions enable clients to effectively segment populations and manage care for those who are most at-risk, engage individuals, increase preventative care and manage wellness programs to improve patient experience and outcomes.

NRC Health’s Transitions solutions are provided to healthcare organizations on a subscription basisalso include tools to drive effective communication between healthcare providers and patients in the critical 24-72 hours post discharge using aan automated discharge call program.workflow supported by our digital platform. Through preference-based communications and real-time alerts, these solutions enable organizations to identify and manage high-risk patients to reduce readmissions, increase patient satisfaction and support safe care transitions. Tracking, trending, and benchmarking tools isolate the key areas for process improvement allowing organizations to implement changes and reduce future readmissions. NRC Health’s Transitions solutions were previously provided by Connect. Connect was formed in June 2013 to develop and provide patient outreach and discharge call solutions. NRC Health originally had a 49% ownership interest in Connect but by March 2016 had acquired all of the remaining interest and subsequently dissolved Customer-Connect LLC in June 2016.


NRC Health’s TransparencyReputation Solutions NRC Health’s Transparency Our Reputation solutions allow healthcare organizations to share a picture of their organization and ensure that timely and relevant content informs better consumer decision-making. NRC Health’sOur star ratings solution (formerly Reputation) enables clientstools enable our partners to publish a five-star rating metric and verified patient feedback derived from actual patient survey data to complement their online physician information. Sharing this feedback not only results in better-informed consumer decision-making but also has the ability to drive new patient acquisition and grow online physician reputation. NRC Health’sOur reputation monitoring solutiontool alerts clientsour partners to ratings and reviews on third-party websites and provides workflows for response and service recovery. These solutions raise physician awareness of survey results and provide access to improvement resources and educational development opportunities designed to improve the way care is delivered.


NRC Health’sThe Governance Solutions – NRC Health’sInstitute

Our Governance solutions, branded as The Governance Institute (“TGI”), serves not-for-profit hospital and health system boards of directors, executives, and physician leadership. TGI’s subscription-based, value-driven membership services are provided through national conferences, publications, advisory services, and an on-lineonline portal designed to improve the effectiveness of hospital and healthcare systems by continually strengthening their board governance, strategic planning, medical leadership, management performance and transparency positioning.customer loyalty. TGI also conducts research studies and tracks industry trends showcasing emerging healthcare trends and best practice solutions of healthcare system boards across the country. TGI thought leadership helps our client board members and executives inform and guide their organization’s strategic priorities in alignment with the rapidly changing healthcare market.

For additional information on our operating segment and our revenue and assets by geographic area, see Note 13, “Segment Information,” to our consolidated financial statements.


43

NRC Health’s Competitive Strengths

The Company believes that its competitive strengths include the following:

A leading provider of patient experience solutions for healthcare providers, payers and other healthcare organizations. The Company’s history is based on capturing the voice of the consumer in healthcare markets. The Company’s solutions build on the “Eight Dimensions of Patient-Centered Care,” a philosophy developed by noted patient advocate Harvey Picker, who believed patients’ experiences are integral to quality healthcare. NRC Health has extended this philosophy to include families, caregivers, employees and other stakeholders.

Premier client portfolio across the care continuum. NRC Health’s client portfolio encompasses leading healthcare organizations across the healthcare continuum, from acute care hospitals and post-acute providers to healthcare payers. The Company’s client base is diverse, with its top ten clients representing approximately 19% of total revenue for the year ended December 31, 2017 and no single client representing more than 5% of the Company’s revenue.

Highly scalable and visible revenue model. The Company’s solutions are offered to healthcare providers, payers and other healthcare organizations primarily through subscription-based service agreements. The solutions NRC Health provides are also recurring in nature, which enables an ongoing relationship with its clients. This combination of subscription-based revenue, a base of ongoing client renewals and automated platforms creates a highly visible and scalable revenue model for the Company.

Comprehensive portfolio of solutions. Since NRC Health offers solutions encompassing market insights, experience, transparency, and governance, its clients can engage with the Company at multiple levels and, over time, increase their commitment and the financial value of their business relationship.

Exclusive focus on healthcare. The Company focuses exclusively on healthcare and serving the unique needs of healthcare organizations across the continuum, which NRC Health believes gives it a distinct competitive advantage compared to other survey and analytics software providers. The Company’s platform includes features and capabilities built specifically for healthcare providers, including a library of performance improvement content which can be tailored to the provider based on their specific customer feedback profile.


Experienced senior management team led by NRC Health’s founder. NRC Health’s senior management team has extensive industry and leadership experience. Michael D. Hays, the Company’s Chief Executive Officer, founded NRC Health in 1981. Prior to launching the Company, Mr. Hays served as Vice President and as a Director of SRI Research Center, Inc. (now known as the Gallup Organization). The Chief Financial Officer, Kevin Karas, CPA, has extensive financial experience having served as CFO at two previous companies, along with healthcare experience at Rehab Designs of America, Inc. and NovaCare, Inc. Steven D. Jackson, the Company’s President, served as Chief Strategy Officer for Vocera Communications, and he also served as Chief Operating Officer for ExperiaHealth.

Competition

The healthcare information and market research services industry is highly competitive. The Company has traditionally competed with healthcare organizations’ internal marketing, market research, and/or quality improvement departments which create their own performance measurement tools, and with relatively small specialty research firms which provide survey-based healthcare market research and/or performance assessment. The Company’s primary competitors among such specialty firms include Press Ganey, which has significantly higher annual revenue than the Company, and three or four other organizations that NRC Health believes have less annual revenue than the Company. The Company, to a certain degree, currently competes with, and anticipates that in the future it may increasingly compete with, (1) market research firms and technology solutions which provide survey-based, general market research or Voice of the Customer feedback capabilities and (2) firms which provide services or products that complement healthcare performance assessments such as healthcare software or information systems. Although only a few of these competitors have offered specific services that compete directly with the Company’s solutions, many of these competitors have substantially greater financial, information gathering, and marketing resources than the Company and could decide to increase their resource commitments to the Company’s market. There are relatively few barriers to entry into the Company’s market, and the Company expects increased competition in its market which could adversely affect the Company’s operating results through pricing pressure, increased marketing expenditures, and market share losses, among other factors. There can be no assurance that the Company will continue to compete successfully against existing or new competitors.


The Company believes the primary competitive factors within its market include quality of service, timeliness of delivery, unique service capabilities, credibility of provider, industry experience, and price. NRC Health believes that its industry leadership position, exclusive focus on the healthcare industry, cross-continuum presence, comprehensive portfolio of solutions and relationships with leading healthcare payers and providers position the Company to compete in this market.Markets


Growth Strategy


NRC Health believesWe believe that the value proposition of itsour current solutions, combined with the favorable alignment of itsour solutions with emerging market demand, positions the Companyus to benefit from multiple growth opportunities. The Company believesWe believe that itwe can accelerate itsour growth through (1) increasing scope of services and sales of itsour existing solutions to itsour existing clients (or cross-selling), (2) winning additional new clients through market share growth in existing market segments, (3) developing and introducing new solutions to new and existing clients, and (4) pursuing acquisitions of, or investments in, firms providing products, solutions or technologies which complement those of the Company.ours.


Selling additional solutions toIncreasing contract value with existing clients. Approximately 22% of the Company’s existing clients purchase more than one of its solutions. NRC Health’s sales organizationOur growth team actively identifies and pursues these cross-sell opportunities for clients to add additional solutions in order to accelerate our growth. Organic contract value growth is also realized by the growthincreased scope of solution adoption as the Company.size of client organizations increase from market expansion and consolidation.


Adding new clients. NRC Health believesWe believe that there is an opportunity to add new clients in each of the acute care, post-acute care and health plan market segments. The Company’sacross all solutions. Our sales organization is actively identifying and engaging new client prospects in each of the segments noted above, with a focus on featuring its comprehensive cross continuumdemonstrating the economic value derived from adopting the portfolio of solutions.solutions in alignment with the prospect’s strategic objectives.


Adding new solutions. The need for growth, engagement and informingeffective solutions in the market segments that NRC Health serveswe serve is evolving to align with emerging healthcare regulatory and reimbursementconsumerism trends. The evolving market creates an opportunity for the Companyus to introduce new solutions that leverage itsand extend our existing core competencies. The Company believesWe believe that there is an opportunity to drive sales growth with both existing and new clients, across all of the market segments that it serves,we serve, through the introduction of new solutions.


Pursue strategic acquisitions and investmentsinvestments. . The Company hasWe have historically complemented itsour organic growth with strategic acquisitions, having completed seveneight such transactions over the past sixteen years.since 2001. These transactions have added new capabilities and access to market segments that are adjacent and complementary to the Company’sour existing solutions and market segments. NRC Health believesWe believe that additional strategic acquisition and/or investment opportunities will exist for the Companyfrom time to time to complement itsour organic growth by further expanding itsour service capabilities, technology offerings and end markets.


Sales and Marketing

The Company generatesWe generate the majority of itsour revenue from the renewal of subscription-based client service agreements, supplemented by sales of otheradditional solutions to existing clients and the addition of new clients. NRC HealthOur sales activities are carried out by a direct sales organizationour growth team staffed with professional, trained sales associates. As compared

We engage in marketing activities that enhance our brand visibility in the marketplace, generate demand for our solutions and engage existing clients. Strategic campaigns and programs focus on (1) ensuring coverage of prospective clients via targeted advertising and account-based campaigns, (2) elevating client value evidence and success stories to the typicalan executive level profile, (3) engaging key stakeholders with content, programming and events and (4) amplifying thought leadership through public and media relations programs that include earning placement in national media and trade publications, securing podium presentations at key industry practiceevents, and winning awards on behalf of compensating sales associatesus and our executives.

Competition

The healthcare information and market research services industry is highly competitive. We have traditionally competed with healthcare organizations’ internal marketing, market research, and/or quality improvement departments which create their own performance measurement tools, and with relatively high base paysmall specialty research firms which provide survey-based healthcare market research and/or performance assessment. Our primary competitors among such specialty firms include Press Ganey, which we believe has significantly higher annual revenue than us, and a relatively small sales commission, NRC Health compensates its sales staffseveral other organizations that we believe have less annual revenue than us. We also compete with relatively low base paymarket research firms and a relatively high commission component. The Company believestechnology solutions which provide survey-based, general market research or voice of the customer feedback capabilities and firms that provide services or products that complement healthcare performance assessments such as healthcare software or information systems.

We believe the primary competitive factors within our market include quality of service, timeliness of delivery, unique service capabilities, credibility of provider, industry experience, and price. We believe that our industry leadership position, exclusive focus on the healthcare industry, cross-continuum presence, comprehensive portfolio of solutions and relationships with leading healthcare providers position us to compete in this compensation structure provides incentives to its sales associates to surpass sales goals and increases the Company’s ability to attract top-quality sales associates.market.


NRC Health conducts variousAlthough only a few of these competitors have offered specific services that compete directly with our solutions, many of these competitors have substantially greater financial, information gathering, and marketing programsresources than us and could decide to generateincrease their resource commitments to our market. There are relatively few barriers to entry into our market, and we expect increased competition in our market which could adversely affect our operating results through pricing pressure, increased marketing expenditures, and market share losses, among other factors. There can be no assurance that we will continue to compete successfully against existing or new opportunities for its sales organization. The Company also maintains an active public relations program which includes (1) an ongoing presence in leading industry trade press and in the mainstream press, (2) public speaking at strategic industry conferences, (3) fostering relationships with key industry constituencies, and (4) annual awards programs that recognize top-ranking healthcare organizations.competitors.


ClientsWe believe that our competitive strengths include the following:


NRC Health’s clients include manyA leading provider of patient experience solutions for healthcare providers and other healthcare organizations. Our history is based on capturing the voice of the nation’s largestconsumer in healthcare systems. The Companymarkets. Our solutions build on the “Eight Dimensions of Patient-Centered Care,” a philosophy developed by noted patient advocate Harvey Picker, who believed patients’ experiences are integral to quality healthcare. This foundation has been enhanced through our digital platform offering that provides solutionsthe delivery of data and insights on a real time basis to over 47 payer health plansunderstand what matters most to each individual. Based on our more than 40 years of experience, we are able to deliver unique and 148relevant healthcare domain expertise to the clients we serve.

Established client base of leading healthcare organizations. Our client portfolio encompasses a majority of the 200 largest health systems.leading healthcare systems across the United States. Over 260 of the top 400 healthcare systems based on net patient revenue are currently using one or more of our solutions. Our client base provides a unique network effect to share best practices among existing clients and to attract new clients. Our existing client base also provides a significant organic growth opportunity to upsell and cross sell additional solutions.


Highly scalable and visible revenue model. Our solutions are offered primarily through fixed price, subscription-based service agreements. The Company’s ten largestsolutions we provide are also recurring in nature, which enables an ongoing relationship with our clients accounted for 19%, 17%, and 15%favorable retention. This combination of subscription-based revenue, a base of ongoing client renewals and automated platforms creates a highly visible and scalable revenue model.

Comprehensive portfolio of solutions. Our portfolio of subscription-based solutions provides actionable information and analysis to healthcare organizations across a range of mission-critical, constituent-related elements, including patient experience, service recovery, care transitions, employee engagement, reputation management, and brand loyalty. Our end-to-end solutions enable our clients to understand what matters most to each person they serve – before, during, after, and beyond clinical encounters – to gain a longitudinal understanding of each individual. We partner with clients across the Company’s total revenue in 2017, 2016continuum of healthcare services and 2015, respectively. Approximately 4%, 5%believe this cross-continuum positioning is a unique and 5%an increasingly important capability as evolving payment models drive healthcare providers and payers towards a more collaborative and integrated service model.

Exclusive focus on healthcare. We focus exclusively on healthcare and serving the unique needs of healthcare organizations across the Company’s revenue wascontinuum, which we believe gives us a distinct competitive advantage compared to other survey and analytics software providers. Our value proposition incorporates the benefits to clients derived from foreign customers in 2017, 2016,our deep subject matter expertise that has been built from helping healthcare organizations over the past 40 years. Our platform includes features and 2015, respectively.capabilities built specifically for healthcare providers, including a library of performance improvement content which can be tailored to the provider based on their specific customer feedback profile.


For financialExperienced senior management team led by our founder. Our senior management team has extensive industry and leadership experience. Michael D. Hays, our Chief Executive Officer and President, founded NRC Health in 1981. Prior to launching the Company, Mr. Hays served as Vice President and as a Director of SRI Research Center, Inc. (now known as the Gallup Organization). Helen Hrdy was appointed as our Chief Customer Officer in January 2024. Prior to this position Ms. Hrdy served as our Chief Growth Officer for three years and our Senior Vice President, Customer Success, for eight years. In January 2024, Jason Hahn, Christophe Louvion, and Andy Monnich joined our management team as Chief Revenue Officer, Chief Product Technology Officer and Chief Corporate Development Officer, respectively. They have track records of success in similar positions at leading healthcare information by geographic area, see Note 1and technology companies such as Press Ganey, Perceptyx, Episource, PatientPop, and Practicing Excellence.

5 to the Company’s consolidated financial statements.

Resources


Intellectual Property and Other Proprietary Rights

The Company’sOur success depends in part upon itsour data collection processes, research methods, data analysis techniques and internal systems, and procedures that it haswe have developed specifically to serve clients in the healthcare industry. The Company hasWe have no patents.patents for most of our intellectual property. Consequently, it relieswe rely on a combination of copyright and trade secret laws and associate nondisclosure agreements to protect itsour systems, survey instruments and procedures. There can be no assurance that the steps we have taken by the Company to protect itsour rights will be adequate to prevent misappropriation of such rights or that third parties will not independently develop functionally equivalent or superior systems or procedures. The Company believesWe believe that itsour systems and procedures and other proprietary rights do not infringe upon the proprietary rights of third parties. There can be no assurance, however, that third parties will not assert infringement claims against the Companyus in the future or that any such claims will not result in protracted and costly litigation, regardless of the merits of such claims or whether the Company iswe are ultimately successful in defending against such claims.


AssociatesGovernment Regulation

According to the Centers for Medicare and Medicaid Services (“CMS”), health expenditures in the United States were approximately $4.5 trillion in 2022, or $13,493 per person. In total, health spending accounted for 17% of the nation’s Gross Domestic Product in 2022. Addressing this growing expenditure burden continues to be a major policy priority at both federal and state levels. In addition, increased co-pays and deductibles in healthcare plans have focused even more consumer attention on health spending and affordability. In the public sector, Medicare provides health coverage for individuals aged 65 and older, while Medicaid provides coverage for low-income families and other individuals in need. Both programs are administered by the CMS. With the aging of the U.S. population, Medicare enrollment has increased significantly. In addition, longer life spans and greater prevalence of chronic illnesses among both the Medicare and Medicaid populations have placed tremendous demands on the health care system.

An increasing percentage of Medicare reimbursement and reimbursement from commercial payers has been determined under value payment models, based on factors such as patient readmission rates and provider adherence to certain quality-related protocols. At the same time, many hospitals and other providers are creating new models of care delivery to improve patient experience, reduce cost and provide better clinical outcomes. These new models are based on sharing financial risk and managing the health and behaviors of large populations of patients and consumers. This transformation towards value-based payment models and increased engagement of healthcare consumers is resulting in a greater need for existing healthcare providers to deliver more customer-centric healthcare. At the same time, organizations that have successfully developed effective customer service models and brand loyalty in other industry verticals are entering the healthcare services market.

We believe that our current portfolio of solutions is uniquely aligned to address these healthcare market trends and related business opportunities. We provide tools and solutions to capture, interpret and improve the CAHPS data required by CMS as well as real time feedback that enables clients to better understand what matters most to people at key moments in their relationship with a health organization. Our solutions enable our clients to both satisfy patient survey compliance requirements and design experiences to build loyalty and improve the wellbeing of the people and communities they care for.

Human Capital


As of December 31, 2017, the Company2023, we employed a total of 430 persons on a full-time basis. In addition, as of such date, the Company had 28 part-time associates primarily in its survey operations, representing approximately 14 full-time equivalent435 associates. None of the Company’sour associates are represented by a collective bargaining unit. The Company considers its relationshipMost of our associates work remotely. We attract a passionate team of associates who care deeply about making a difference in advancing “Human Understanding” in healthcare. We consider our relationships with itsour associates to be good.


Executive OfficersWe are committed to providing a workplace free of the Companyharassment or discrimination based on race, color, religion, sex, sexual orientation, gender identity, national origin, genetic information, ancestry, veteran status, or disability. We are an equal opportunity employer committed to inclusion and diversity.


The following table sets forth certain information as of February 1, 2018, regarding the executive officers of the Company:

Name

Age

Position

Michael D. Hays

63

Chief Executive Officer

Steven D. Jackson

42

President

Kevin R. Karas

60

Senior Vice President Finance, Chief Financial Officer, Treasurer and Secretary

Michael D. Hays has served as Chief Executive Officer and a director since he founded the Company in 1981. He also served as President of the Company from 1981 to 2004 and from July 2008 to July 2011. Prior to founding the Company, Mr. Hays served for seven years as a Vice President and a director of SRI Research Center, Inc. (n/k/a the Gallup Organization).

Steven D. Jackson has served as President of the Company since October 2015. He served as Group President from October 2014 until September 2015, during which time he oversaw the Company’s Market Insights, Transparency, and Predictive Analytics business units. Prior to joining the Company, Mr. Jackson served as Chief Strategy Officer for Vocera Communications where he was employed from 2007 to 2014. He also served as Chief Operating Officer for ExperiaHealth, a subsidiary of Vocera. Earlier in his career, Mr. Jackson held positions of increasing responsibility at The Advisory Board Company, Neoforma, and Stockamp & Associates.

Kevin R. Karas has served as Chief Financial Officer, Treasurer and Secretary of the Company since September 2011, and as Senior Vice President Finance since he joined the Company in December 2010. From 2005 to 2010, he served as Vice President of Finance for Lifetouch Portrait Studios, Inc., a national retail photography company.  Mr. Karas also previously served as Chief Financial Officer at CARSTAR, Inc., an automobile collision repair franchise business, from 2000 to 2005, Chief Financial Officer at Rehab Designs of America, Inc., a provider of orthotic and prosthetic services, from 1993 to 2000, and as a regional Vice President of Finance and Vice President of Operations at Novacare, Inc., a provider of physical rehabilitation services, from 1988 to 1993.  He began his career as a Certified Public Accountant at Ernst & Young.

Executive officers of the Company are elected by and serve at the discretion of the Company’s Board of Directors. There are no family relationships between any directors or executive officers of NRC Health.

Available Information


More information regarding NRC Health is available on the Company'sour website at www.nrchealth.com. NRC Health isWe are not including the information contained on or available through itsour website as part of, or incorporating such information by reference into, this Annual Report on Form 10-K. The Company'sOur Annual Reports on Form 10-K, Quarterly Reports on Form 10-Q, Current Reports on Form 8-K and any amendments to those reports are made available to the public at no charge through a link appearing on the Company'sour website. NRC Health providesWe provide access to such materials through itsour website as soon as reasonably practicable after electronically filing such material with, or furnishing it to, the Securities and Exchange Commission. Reports and amendments posted on the Company’sour website do not include access to exhibits and supplemental schedules electronically filed with the reports or amendments.


Item 1A.

Risk Factors


You should carefully consider each of the risks described below, together with all of the other information contained in this Annual Report on Form 10-K, before making an investment decision with respect to our securities. If any of the following risks develop into actual events, our business, financial condition or results of operations could be materially and adversely affected and you may lose all or part of your investment.

Risks Related to our Business


We depend on contract renewals, including retention of key clients, for a large share of our revenue and our operating results could be adversely affected.


We expect that a substantial portion of our revenue for the foreseeable future will continue to be derived from renewable service contracts. Substantially all contracts are renewable annually at the option of our clients, although contracts with clients under unit-based arrangements generally have no minimum purchase commitments.clients. Client contracts are generally cancelable on short notice without penalty,penalty; however we are entitled to payment for services through the cancellation date. To the extent that clients fail to renew or defer their renewals, we anticipate our results may be materially adversely affected. We rely on a limited number of key clients for a substantial portion of our revenue. The Company’sOur ten largest clients collectively accounted for 19%15%, 17%15%, and 15%14% of the Company’sour total revenue in 2017, 2016,2023, 2022 and 2015,2021, respectively. Our ability to secure renewals depends on, among other things, our ability to gather and analyze performance data in a consistent, high-quality, and timely fashion. In addition, the service needs of our clients are affected by accreditation requirements, enrollment in managed care plans, the level of use of satisfaction measures in healthcare organizations’ overall management and compensation programs, the size of operating budgets, clients’ operating performance, industry and economic conditions, and changes in management or ownership. As these factors are beyond our control, we cannot ensure that we will be able to maintain our renewal rates. Any material decline in renewal rates from existing levels would have an adverse effect on our revenue and a corresponding effect on our operating and net income.

Our operating results may fluctuate and this may cause our stock price to decline.

Our overall operating results may fluctuate as a result of a variety of factors, including the size and timing of orders from clients, client demand for our services (which, in turn, is affected by factors such as accreditation requirements, enrollment in managed care plans, operating budgets and clients’ operating performance), the hiring and training of additional staff, expense increases, and industry and general economic conditions. Because a significant portion of our overhead is fixed in the short-term, particularly some costs associated with owning and occupying our building and full-time personnel expenses, our results of operations may be materially adversely affected in any particular period if revenue falls below our expectations. These factors, among others, make it possible that in some future period our operating results may be below the expectations of securities analysts and investors which would have a material adverse effect on the market price of our class A common stock and/or our class B common stock.


We operate in a highly competitive market and could experience increased price pressure and expenses as a result.


The healthcare informationanalytics and market research services industry is highly competitive. We have traditionally competed with healthcare organizationsorganizations’ internal marketing, market research and/or quality improvement departments that create their own performance measurement tools, and with relatively small specialty researchother firms that provide survey-based healthcare market research and/or performance assessment. The Company’sOur primary competitors among such specialty firms include Press Ganey, which we believe has significantly higher annual revenue than us, and three or fourseveral other firms that provide similar services in the market we believe have lower annual revenue than us. To a certain degree, we currentlyserve. We also compete with and anticipate that in the future we may increasingly compete with, (1) market research firms and technology solutions which provide survey-based, general market research or Voicevoice of the Customer Feedbackcustomer feedback capabilities and (2) firms whichthat provide services or products that complement healthcare performance assessments, such as healthcare software or information systems. Although only a few of these competitors have offered specific services that compete directly with our services, many of these competitors have substantially greater financial, information gathering, and marketing resources than the Companyus and could decide to increase their resource commitments to our market. Furthermore, we do not have a publicly traded group of peers, which makes it difficult to compare and benchmark performance to other similar companies. There are relatively few barriers to entry into the Company’sour market, and we expect increased competition in our market which could adversely affect our operating results through pricing pressure, increased marketing expenditures, and market share losses, among other factors. There can be no assurance that the Companywe will continue to compete successfully against existing or new competitors.


Because our clients are concentrated in the healthcare industry, our revenue and operating results may be adversely affected by changes in regulations, a business downturn or consolidation with respect to the healthcare industry.


Substantially all of our revenue is derived from clients in the healthcare industry. As a result, our business, financial condition and results of operations are influenced by conditions affecting this industry, including changing political, economic, competitive and regulatory influences that may affect the procurement practices and operation of healthcare providers and payers. The 2010 Federal comprehensive healthcare reform plan, which includesFuture legislative changes, including additional provisions to control healthcare costs, improve healthcare quality and expand access to affordable health insurance, could result in lower reimbursement rates and otherwise change the environment in which providers and payers operate. In addition, large private purchasers of healthcare services are placing increasing cost pressure on providers. Healthcare providers may react to these cost pressures and other uncertainties by curtailing or deferring purchases, including purchases of our services.

Moreover, there has been consolidation of companies in the healthcare industry, a trend which we believe will continue to grow. Consolidation in this industry, including the potential acquisition of certain of our clients, could adversely affect aggregate client budgets for our services, could result in clients performing more marketing, market research and/or quality improvement functions internally or could result in the termination of a client’s relationship with us. The impact of these developments on the healthcare industry is difficult to predict and could have an adverse effect on our revenue and a corresponding effect on our operating and net income.


We could be negatively impacted by outbreaks or pandemics.


We rely on third parties whose actionsIn May 2023, the federal government lifted its Federal Public Health Emergency Declaration related to COVID-19. However, the continued spread of COVID-19, including its variants, together with any other outbreak of other contagious diseases or public heath environments could adversely affect our business, results of operations, financial condition, and stock price. While the risk of such similar outbreaks is unpredictable, and the extent of such risk is highly uncertain, the possibility of future outbreaks remains a risk that could have a material adverse effect on our business.business and it may also have the effect of heightening many of the other risks described in this Part I, Item 1A of this Form 10-K.


We could be negatively impacted by the global conflicts or similar events.

The aforementioned areas of conflict, and any expansion of such conflicts, could adversely affect our business and operations. We outsource certain software development services to third parties in the Ukraine. Since the onset of the active Russian-Ukraine conflict, our contractors have been able to continue their work. However, those services could be more negatively impacted in the future.

Civil unrest, political instability or uncertainty, military activities, utility service breakdowns or broad-based sanctions, should they continue for the long term or escalate, could interrupt our contractors’ ability to provide services and require our associates to perform the services or replace the contractors which could have an adverse effect on our operations and financial performance, including higher volatility in foreign currency exchange rates, increased use of less cost-efficient resources and negative impacts to our business resulting from deteriorating general economic conditions. Further, we cannot predict the impact of the military actions and any heightened military conflict or geopolitical instability that may follow, including additional sanctions or countersanctions, heightened inflation, cyber disruptions or attacks, higher energy costs, and supply chain disruptions. 

General economic factors could adversely impact our profitability.

Negative changes in general economic conditions, in the geographic areas in which we operate may reduce our profitability. An economic downturn, a rise in interest rates, and inflationary pressures can reduce the demand for our services and result in terminations as well as slower client payments or client defaults on receivables. Additionally, in 2023, we experienced increased costs including salary and benefits costs in sales and client support, software costs, contracted services, costs associated with our building improvements and equipment purchases and we expect inflationary pressures to continue in 2024. Inflation may increase our costs without a corresponding increase in our contract revenue due to fixed contract arrangements, which could result in decreased margins and profitability.

We face several risks relating to our ability to collect the data on which our business relies.

Our ability to provide timely and accurate performance measurement and improvement services to our clients depends on our ability to collect large quantities of high-quality data through surveys. If survey operations are disrupted and we are unable to process surveys in a timely manner, then our revenue and net income could be negatively impacted. We outsource certain operations and engage third parties to perform work needed to fulfill our client services. For example, we use vendors to perform certain printing, mailing, information transmittaloutreach and otherdata collection services related to our survey operations. If any of these vendors cease to operate or fail to adequately perform the contracted services and alternative resources and processes are not utilized in a timely manner, our business could be adversely affected. The loss of any of our key vendors could impair our ability to perform our client services and result in lower revenues and income. It would also be time-consuming and expensive to replace, either directly or through other vendors, the services performed by these vendors, which could adversely impact revenues, expenses and net income. Furthermore, our ability to monitor and direct our vendorsvendors’ activities is limited. If their actions and business practices violate policies, regulations or procedures otherwise considered illegal, we could be subject to reputational damage or litigation which would adversely affect our business.


We face several risks relating to our ability to collect the data on which our business relies.


Our ability to provide timely and accurate performance measurement and improvement services to our clients depends on our ability to collect large quantities of high-quality data through surveys and interviews. If our mail survey operations are disrupted and we are unable to mail our surveys in a timely manner, then our revenue and net income could be negatively impacted. If receptivity to our survey and interview methods by respondents declines, or, for some other reason, their willingness to complete and return surveys declines, or if we, for any reason, cannot rely on the integrity of the data we receive, then our revenue could be adversely affected with a corresponding effect on our operating and net income. We also rely on third-party panels of pre-recruited consumer households to produce NRC Health’s Market Insights in a timely manner. If we are not able to continue to use these panels, or the time period in which we use these panels is altered and we cannot find alternative panels on a timely, cost-competitive basis, we could face an increase in our costs or an inability to effectively produce NRC Health’s Market Insights. In either case, our operating and net income could be negatively affected.

Our principal shareholder effectively controls the Company, and holders of class A common stock are not able to independently elect directors of NRC Health or control any of the Company's management policies or business decisions because the holders of class A common stock have substantially less voting power than the holders of the Company's class B common stock, a majority of which is beneficially owned by our principal shareholder.

The Company's outstanding stock is divided into two classes of common stock: class A common stock and class B common stock. The class B common stock has one vote per share on all matters and the class A common stock has one-one-hundredth (1/100th) of one vote per share. As of February 16, 2018, the class B common stock constituted approximately 94% of NRC Health's total voting power. As a result, holders of class B common stock are able to exercise a controlling influence over the Company's business, have the power to elect its directors and indirectly control decisions such as whether to issue additional shares, declare and pay dividends or enter into significant corporate transactions. A majority of the class B common stock was historically owned by Michael D. Hays, our Chief Executive Officer. However, in January and February 2018 Mr. Hays, for estate planning purposes, gifted and/or transferred all of his directly owned class B common stock and class A common stock indirectly to the Amandla MK Trust (the “New Trust”), a trust for the benefit of Mr. Hays’ family.

As of February 16, 2018, approximately 53% of the outstanding class B common stock and approximately 26% of the outstanding class A common stock was owned by the New Trust, and that collectively constituted approximately 52% of the Company's total voting power. As a result, the New Trust can control matters requiring shareholder approval, including the election of directors and the approval of significant corporate matters such as change of control transactions. The effects of such influence could be to delay or prevent a change of control of the Company unless the terms are approved by the New Trust.

The market prices of our two classes of common stock may be volatile and shareholders may be unable to resell shares at or above the price at which the shares were acquired.

The market price of stock can be highly volatile. As a result, the market prices and trading volumes of each of our two classes of common stock may also be highly volatile, and investors in our common stock may experience a decrease in the value of their shares, including decreases that are in response to factors beyond our control, including, but not limited to:

Variations in our financial performance and that of similar companies;

Regulatory and other developments that may impact the demand for our services;

Reaction to our press releases, public announcements and filings with the Securities and Exchange Commission;

Client, market and industry perception of our services and performance;

Actions of our competitors;

Changes in earnings estimates or recommendations by analysts who follow our stock;

Loss of key personnel;

Investor or management team sales of our stock;

Changes in accounting principles; and

Variations in general market, economic and political conditions or financial markets.

Any of these factors, among others, may result in changes in the trading volumes and/or market prices of each of our classes common stock. Following periods of volatility in the market price of a company’s securities, shareholders have often filed securities class-action lawsuits. Our involvement in a class-action lawsuit would result in substantial legal fees and divert our senior management’s attention from operating our business, which could harm our business and net income.

Our business and operating results could be adversely affected if we are unable to attract or retain key managers and other personnel.


Our future performance may depend, to a significant extent, upon the efforts and ability of our key personnel who have expertise in gathering, interpreting and marketing survey-based performance information for healthcare markets. Although client relationships are managed at many levels within our company, the loss of the services of Michael D. Hays, our Chief Executive Officer, or one or more of our other senior managers, could have a material adverse effect, at least in the short to medium term, on most significant aspects of our business, including strategic planning, product development, and sales and customer relations. Our success will also depend on our ability to hire, train and retain skilled personnel in all areas of our business. Currently, we do not have employment agreements with our officers or our other key personnel. Competition for qualified personnel in our industry is intense, and many of the companies that compete with us for qualified personnel have substantially greater financial and other resources than us. Furthermore, we expect competition for qualified personnel to become more intense as competition in our industry increases. We cannot assure you that we will be able to recruit, retain and motivate a sufficient number of qualified personnel to compete successfully.


If intellectual property and other proprietary information technology were copied or independently developed by our competitors, our operating results could be negatively affected.


Our success depends in part upon our data collection process, research methods, data analysis techniques, and internal systems and procedures that we have developed specifically to serve clients in the healthcare industry. We have no patents.do not hold patents for our intellectual property. Consequently, we rely on a combination of copyright, trade secret laws and associate nondisclosure agreements to protect our systems, survey instruments and procedures. We cannot assure you that the steps we have taken to protect our rights will be adequate to prevent misappropriation of such rights, or that third parties will not independently develop functionally equivalent or superior systems or procedures. We believe that our systems and procedures and other proprietary rights do not infringe upon the proprietary rights of third parties. We cannot assure you, however, that third parties will not assert infringement claims against us in the future, or that any such claims will not result in protracted and costly litigation, regardless of the merits of such claims, or whether we are ultimately successful in defending against such claims.


Our business and operating results could be adversely affected if we experience businessFailures, interruptions or failure ofdeficiencies in our information technology and communication systems.communications systems could negatively impact our business and operating results.


Our ability to provide timely and accurate performance measurement and improvement servicesservice to our clients depends onis dependent, to a significant extent, upon the technology that we develop internally as well as the efficient and uninterrupted operation of our information technology and communication systems, and those of our external service providers. Investment in the enhancement of existing and development of new information technology processes is costly and affects our ability to successfully serve our clients. The failure or deficiency of the technology we develop and implement could negatively impact the willingness or ability for our clients to use our services and our ability to perform our services. Our failure to anticipate clients’ expectation and needs, adapt to emerging technological trends, or design efficient and effective information technology platforms, could result in lower utilization, loss of customers, damage to customer relationships, reduced revenue and profits, refunds to customers and damage to our reputation. Although we have procedures to monitor the efficacy of our information technology platforms, the procedures may not prevent failures or deficiencies in the information technology platforms we develop and implement, we may not adapt quickly enough and may incur significant costs and delays that could harm our business. Additional costs will be incurred to further develop and improve our information technology platforms.

Our systems and those of our external service providers could be exposed to damage or interruption from fire, natural disasters, which may increase in frequency and severity due to climate change, energy loss, telecommunication failure, security breach and computer viruses. An operational failure or outage in our information technology and communication systems or those of our external service providers, could result in loss of customers, damage to customer relationships, reduced revenue and profits, refunds of customer charges and damage to our reputation and may result in additional expense to repair or replace damaged equipment and recover data loss resulting from the interruption. Although we have taken steps to prevent system failures and have back-up systems and procedures to prevent or reduce disruptions, such steps may not prevent an interruption of services and our disaster recovery planning may not account for all contingencies. Additionally, our insurance may not adequately compensate us for all losses or failures that may occur. Any one of the above situations could have a material adverse effect on our business, financial condition, results of operations and reputation.


Security

If we or our third-party service providers sustain cyber-attacks or other privacy or data security incidents that result in security breaches that disrupt our operations or computer virusesresult in the unintended dissemination of protected personal information or proprietary or confidential information or Artificial Intelligence (AI) impacts our demand for, or providing of, services, we could suffer a loss of revenue and increased costs, exposure to significant liability, reputational harm our business.and other serious negative consequences.


In connection with our client services, we and our third-party service providers receive, process, store and transmit sensitive business information and, in certain circumstances, personal medical information of our clients’ patients, electronically over the internet. ComputerWe or our third-party service providers may become the target of attempted cyber-attacks and other security threats and may be subject to breaches of the information technology systems we use. Experienced computer programmers and hackers may be able to penetrate our security controls and access, misappropriate or otherwise compromise protected personal information or proprietary or confidential information or that of third parties, create system disruptions or cause system shutdowns that could negatively affect our operations. They also may be able to develop and deploy viruses, could spread throughoutworms, ransomware, and other malicious software programs that attack our systems or otherwise exploit any security vulnerabilities.

In addition, the risk of cyber-attacks has increased in connection with the military conflict between Russia and Ukraine and the resulting geopolitical conflict. In light of those and other geopolitical events, nation-state actors or their supporters may launch retaliatory cyber-attacks and may attempt to cause supply chain and other third-party service provider disruptions, or take other geopolitically motivated retaliatory actions that may disrupt our business operations, result in data compromise, or both. Nation-state actors have in the past carried out, and may in the future carry out, cyber-attacks to achieve their aims and goals, which may include espionage, information operations, monetary gain, ransomware, disruption, and destruction. In February 2022, the U.S. Cybersecurity and Infrastructure Security Agency issued a “Shields Up” alert for American organizations noting the potential for Russia’s cyber-attacks on Ukrainian government and critical infrastructure organizations to impact organizations both within and beyond the United States, particularly in the wake of sanctions imposed by the United States and its allies, which is still in effect. These circumstances increase the likelihood of cyber-attacks and/or security breaches.

We were the target of a cyber-attack in 2020, which resulted in temporary suspension of our services to clients. One of our third-party service providers was the target of a cyber-attack in December 2022, which resulted in a temporary suspension of certain services to our clients. In both instances no protected data was compromised or exfiltrated. We, and our service providers, will likely continue to be the target of other attempted cyber-attacks and security threats. Such cyber-attacks may subject us to litigation and regulatory risk, civil and criminal penalties, additional costs and diversion of management attention due to investigation, remediation efforts and engagement of third-party consultants and legal counsel in connection with such incidents, payment of “ransoms” to regain access to our systems and disrupt operationsinformation, loss of clients, damage to client relationships, reduced revenue and service delivery. Unauthorized accessprofits, refunds of client charges and damage to our computerreputation, any of which could have a material adverse effect on our business, cash flows, financial condition and results of operations. While we have contingency plans and insurance coverage for potential liabilities of this nature, they may not be sufficient to cover all claims and liabilities and in some cases are subject to deductibles and layers of self-insured retention. Any system failure, inability to upgrade or update, or security breach (including cyber-attacks) related to our information technology systems or databasesmay also impact third parties that we rely on in our business and could result in a hinderance to the theftservices provided by the Company or publication of confidential information orsuch third parties, as the deletion or modification of records or could otherwise cause interruption incase may be, and may have a material adverse effect on our operations. business.

We cannot ensure that we or our third-party service providers will be certainable to identify, prevent or contain the effects of cyber-attacks or other cybersecurity risks that thebypass our security measures or disrupt our information technology protecting our networkssystems or business. We have security technologies, processes and information will successfully prevent computer viruses, data thefts, release of confidential information orprocedures in place to protect against cybersecurity risks and security breaches. AHowever, hardware, software or applications we develop or procure from third parties may contain defects in design, manufacturer defects or other problems that could unexpectedly compromise information security. In addition, because the techniques used to obtain unauthorized access, disable or degrade service or sabotage systems change frequently, are becoming increasingly sophisticated, and may not immediately produce signs of intrusion, we may be unable to anticipate these techniques, timely discover or counter them or implement adequate preventative measures.

In addition, we use third-party technology, systems and services for a variety of reasons, including, without limitation, encryption and authentication technology, employee email, content delivery to clients, back-office support, and other functions that in some cases involve processing, storing and transmitting large amounts of data for our databusiness. These third-party providers may also experience security breaches or interruptions to their information technology hardware and software infrastructure and communications systems that results in inappropriate disclosurecould adversely impact us.

Under the Health Insurance Portability and Accountability Act of 1996, as amended by the Health Information Technology for Economic and Clinical Health Act of 2009, or HITECH, implementing regulations promulgated by the U.S. Department of Health and Human Services, or “HHS,” including what are referred to as the “Privacy Rule” and the “Security Rule” (collectively, “HIPAA”), we face potential liability related to the privacy of health information we obtain.  We are required through our associates', customers'contracts with our clients and by HIPAA to protect the privacy and security of certain health information and to make certain disclosures to our clients or vendors' confidentialto the public if this information could harm our reputation and expose us to regulatory action and claims. is unlawfully accessed. 

Changes in privacy and information security laws and standards may require that we incur significant expense to ensure compliance due to increased technology investment and operational procedures. An inabilityNoncompliance with any privacy or security laws and regulations, including, without limitation, HIPPA, or any security breach, cyber-attack or cybersecurity breach, and any incident involving the misappropriation, loss or other unauthorized disclosure or use of, or access to, prevent securitysensitive or confidential information, whether by us or by one of our third-party service providers, could require us to expend significant resources to continue to modify or enhance our protective measures and to remediate any damage. In addition, this could negatively affect our operations, cause system disruptions, damage our reputation, cause client losses and contract breaches, and could also result in regulatory enforcement actions, material fines and penalties, litigation or computer virusesother actions that could have a material adverse effect on our business, cash flows, financial condition and results of operations.  Even if cyber-attacks or failure to complyother cybersecurity breaches do not result in noncompliance with privacy and informationor security laws, the perception that such noncompliance may have occurred by our clients or in the news media may have an adverse impact on our stock price and could result in litigation and regulatory risk,damage to our reputation or loss of customers, damage to customer relationships, reduced revenue and profits, refunds of customer charges and damage our reputation,clients, which could adversely affecthave a material adverse effect on our business, cash flows, financial condition and results of operationsoperations.

In addition, the adoption of AI and reputation.other emerging technologies may become significant to operational results in the future. While AI and other technologies may offer substantial benefits, they may also introduce additional risk. We use AI for certain limited processes and expect our AI usage to increase in the future. However, if we are unable to successfully implement and utilize such emerging technologies as effectively as competitors or our customers are able to use AI as a replacement to our services, the Company may be negatively affected in the larger marketplace.

Some of our employees work remotely, which may increase the cybersecurity risks to our business, including an increased demand for information technology resources, increased risk of phishing, and other cybersecurity risks.

We have, and will continue to have, a portion of our employee population that works from home full-time or under flexible work arrangements, and we have provided associates with expanded remote network access options which enable them to work outside of our corporate infrastructure and, in some cases, use their own personal devices, which exposes us to additional cybersecurity risks. Our employees working remotely may expose us to cybersecurity risks through: (i) unauthorized access to sensitive information as a result of increased remote access, including our employees’ use of Company-owned and personal devices and videoconferencing functions and applications to remotely handle, access, discuss, or transmit confidential information, and (ii) increased exposure to phishing and other scams as cybercriminals may, among other things, install malicious software and access sensitive information. We believe that the increased number of employees working remotely has incrementally increased our cyber risk profile, but we are unable to predict the extent or impacts of those risks at this time. A significant disruption of our information technology systems, unauthorized access to or loss of confidential information, or legal claims resulting from our violation of privacy laws could each have a material adverse effect on our business.


Reputational harm could have a material adverse effect on our business, financial condition and results of operations.


Our ability to maintain a goodpositive reputation is critical to selling our services. Our reputation could be adversely impacted by any of the following (whether or not valid): the failure to maintain high ethical and social standards; the failure to perform our client services in a timely manner; violations of laws and regulations; failure to adequately preserve information security; and the failure to maintain an effective system of internal controls or to provide accurate and timely financial information. Damage to our reputation or loss of our clientsclients’ confidence in our services for any of these, or any other reasons, could adversely impact our business, revenues, financial condition, and results of operations, as well as require additional resources to rebuild our reputation.


Our operations are subject to laws and regulations that impose significant compliance costs and create reputational and legal risk.


Due to the nature of the services we offer, we are subject to significant commercial, trade and privacy regulations. We cannot predict the nature, scope or effect of future regulatory requirements to which our operations might be subject or the manner in which existing laws might be administered or interpreted, which could have a material and negative impact on our business and our results of operation. For example, recent years have seen an increase in the development or enforcement of legislation related to healthcare reform, privacy, trade compliance and anti-corruption. Additionally, some of the services we provide include information our clients need to fulfill regulatory reporting requirements. If our services result in errors or omissions in our clientsclients’ regulatory reporting, we may be subject to loss of clients, reputational harm or litigation, each potentially adversely impacting our business. Furthermore, although we maintain a variety of internal policies and controls designed to educate, discourage, prevent and detect violations of such laws, we cannot guarantee that such actions will be effective or sufficient or that individual employees will not engage in inappropriate behavior in breach of our policies. Such conduct, or even an allegation of misbehavior, could result in material adverse reputational harm, costly investigations, severe criminal or civil sanctions, or could disrupt our business, and could negatively affect our results of operations or financial condition.


Failure to comply with public company regulationsIneffective internal controls could adverselyhave a negative impact on our profitability.business, results of operations, and our reputation.


As a public company, we are subjectOur internal controls over financial reporting may not prevent or detect misstatements because of its inherent limitations, including the possibility of human error, failure or interruption of information technology systems, the circumvention or overriding of controls, or fraud. Even effective internal controls can provide only reasonable assurance with respect to the reporting requirementspreparation and fair presentation of the Securities Exchange Act of 1934, the Sarbanes-Oxley Act of 2002, the Dodd-Frank Act Wall Street Reform and Consumer Protection Act, the listing requirements of NASDAQ and other applicable securities rules and regulations. Additionally, laws, regulations and standards relating to corporate governance and public disclosure are subject to varying interpretations and continue to develop and change.financial statements. If we misinterpret or fail to complymaintain the adequacy of our internal controls, including any failure to implement required new or improved controls, or if we experience difficulties in their implementation, including with these rulesthe implementation of our internal controls in acquired companies, our business and regulations,operating results could be harmed and we could fail to meet our legal and financial compliance costs and net income may be adversely affected.reporting obligations, which also could have a negative impact on our reputation.


Our growth strategy includes future acquisitions and/or investments which involve inherent risk.


In order to expand services or technologies to existing clients and increase our client base, we have historically, and may in the future, make strategic business acquisitions and/or investments that we believe complement our business. Acquisitions have inherent risks which may have material adverse effects on our business, financial condition, or results of operations, including, among other things: (1) failure to successfully integrate the purchased operations, technologies, products or services and maintain uniform standard controls, policies and procedures; (2) substantial unanticipated integration costs; (3) loss of key associates including those of the acquired business; (4) diversion of management’s attention from other operations; (5) failure to retain the customers of the acquired business; (6) failure to achieve any projected synergies and performance targets; (7) additional debt and/or assumption of known or unknown liabilities; (8) dilutive issuances of equity securities; and (9) a write-off of goodwill, software development costs, client lists, other intangibles and amortization of expenses. If we fail to successfully complete acquisitions or integrate acquired businesses, we may not achieve projected results and there may be a material adverse effect on our business, financial condition and results of operations. In addition, volatility in the equity markets could impair our financial position in general terms and our ability to effectively capitalize on potential merger and acquisition opportunities. 

Risks Related to our Common Stock

Our principal shareholders effectively control the Company.

A majority of our common stock and voting power was historically owned and/or held by Michael D. Hays, our Chief Executive Officer and President. However, over the years Mr. Hays, for estate planning purposes, gifted and/or transferred almost all of his directly owned shares to trusts for the benefit of his family. Currently, the principal holders of shares previously owned by Mr. Hays are the Common Property Trust and the Amandla MK Trust (collectively the “Trusts”).

As of February 13, 2024, approximately 38.6% of our outstanding common stock was owned by the Trusts and approximately 46.2% of our outstanding common stock was held by the Trusts and other entities controlled by trustees or special power holders for the benefit of members of Mr. Hays’ family. As a result, the Trusts and these other entities, through the trustees or special power holders, have the power to indirectly control decisions such as whether to issue additional shares or declare and pay dividends and can control matters requiring shareholder approval, including the election of directors and the approval of significant corporate matters such as change of control transactions. The effects of such influence could be to delay or prevent a change of control of the Company unless the terms are approved by the Trusts and these other entities.

The market price of our common stock may be volatile and shareholders may be unable to resell shares at or above the price at which the shares were acquired.

The market price and trading volume of our common stock has historically been and may continue to be highly volatile, and investors in our common stock may experience a decrease in the value of their shares, including decreases that are in response to factors beyond our control, including, but not limited to:


Variations in our financial performance and that of similar companies;

Regulatory and other developments that may impact the demand for our services;

Reaction to our press releases, public announcements and filings with the Securities and Exchange Commission;

Client, market and industry perception of our services and performance;

Actions of our competitors;

Changes in earnings estimates or recommendations by analysts who follow our stock;

Loss of key personnel;

Investor, management team or large shareholder sales of our stock;

Changes in accounting principles; and

Variations in general market, economic and political conditions or financial markets.

Any of these factors, among others, may result in changes in the trading volume and/or market price of our common stock. Following periods of volatility in the market price of securities, shareholders have often filed securities class-action lawsuits. Our involvement in a class-action lawsuit would result in substantial legal fees and divert our senior management’s attention from operating our business, which could harm our business and net income.

General Risk Factors

Our operating results may fluctuate and this may cause our stock price to decline.

Our overall operating results may fluctuate as a result of a variety of factors, including the size and timing of orders from clients, client demand for our services (which, in turn, is affected by factors such as accreditation requirements, enrollment in managed care plans, operating budgets and clients’ operating performance), the hiring and training of additional staff, expense increases, and industry and general economic conditions. Because a significant portion of our overhead is fixed in the short-term, particularly some costs associated with owning and occupying our building and full-time personnel expenses, our results of operations may be materially adversely affected in any particular period if revenue falls below our expectations. These factors, among others, make it possible that in some future period our operating results may be below the expectations of securities analysts and investors which would have a material adverse effect on the market price of our common stock. 

Our business and operating results could be adversely affected if we are unable to attract or retain key managers and other personnel.

Our future performance may depend, to a significant extent, upon the efforts and ability of our key personnel who have expertise in gathering, interpreting and marketing survey-based performance information for healthcare markets. Although client relationships are managed at many levels within our company, the loss of the services of Michael D. Hays, our Chief Executive Officer and President, or one or more of our other executive officers, could have a material adverse effect, at least in the short to medium term, on most significant aspects of our business, including strategic planning, product development, and sales and customer relations. Our success will also depend on our ability to hire, train and retain skilled personnel in all areas of our business. Competition for qualified personnel in our industry is intense, and many of the companies that compete with us for qualified personnel have substantially greater financial and other resources than us. Furthermore, we expect competition for qualified personnel to become more intense as competition in our industry increases. We cannot assure you that we will be able to recruit, retain and motivate a sufficient number of qualified personnel to compete successfully.

In January 2024, we announced the appointment of four newly created executive officer positions: Helen Hrdy as Chief Customer Officer, Jason Hahn as Chief Revenue Officer, Christophe Louvion as Chief Product Technology Officer, and Andy Monnich as Chief Corporate Development Officer. These newly appointed executives reflect one of our investments to achieve our strategic initiatives, which include capturing expanded market opportunities through serving clients across increasingly interconnected patient, customer, and employee experience markets. We may not be successful in achieving our strategic initiatives within the timeframe we expect or at all, such executives may leave, or we may not realize the expected benefits and results from compensation structures we have put in place. Additionally, Kevin R. Karas, our Senior Vice President Finance, Treasurer, Secretary and Chief Financial Officer has announced his retirement, effective March 31, 2024. The retirement of Mr. Karas may result in a lack of continuity or operational issues.

Like many other companies, we experienced higher attrition rates in the last three years. We may incur higher costs to attract, train and retain these associates. Attrition in our sales and service areas can also impact our ability to retain and attract new business. We may need to develop or adapt to new ways of doing business that challenge our leadership, our associate training, our human resources, and our business practices, and we cannot assure you that we will be successful in doing so. The short and long-term costs associated with these potential changes are difficult to quantify. 

Increases in income tax rates, changes in income tax laws or regulations, or unfavorable resolutions of tax matters could adversely impact our profitability.

We are subject to income tax in the United States. Our overall effective income tax rate is a function of the federal and local tax rates and the geographic mix of our income before taxes in the jurisdictions in which we operate. Changes in tax rates could negatively impact our net income. Tax laws and regulations, including rates of taxation, are subject to revisions by individual taxing jurisdictions. It is possible that these types of changes could materially impact our net income and cash flows. Significant judgment is required in determining our annual income tax expense and in evaluating our tax positions. Although we believe our tax estimates are reasonable, the final determination of tax audits could materially differ from our historical income tax provisions, estimates and accruals and could materially adversely impact our financial statements for the period or periods which the statute of limitations is open.

Failure to comply with public company regulations could adversely impact our profitability.

As a public company, we are subject to the reporting requirements of the Securities Act of 1933, the Securities Exchange Act of 1934, the Sarbanes-Oxley Act of 2002, the Dodd-Frank Act Wall Street Reform and Consumer Protection Act, the listing requirements of NASDAQ and other applicable securities rules and regulations. Additionally, laws, regulations and standards relating to corporate governance and public disclosure are subject to varying interpretations and continue to develop and change. If we misinterpret or fail to comply with these rules and regulations, our legal and financial compliance costs and net income may be adversely affected.

Item 1B.

Unresolved Staff Comments


The Company hasWe have no unresolved staff comments to report pursuant to this item.


Item 1C.

Cybersecurity

We have a robust information security program to safeguard our information and systems as well as third parties that create, receive, or transmit our information or are critical to our operations. The controls within the program are constantly updated to adapt to technological advancements, regulatory changes, and operational needs, ensuring that we uphold our strict standards and unwavering commitment to maintaining confidentiality, integrity, and availability of our valuable information assets.

Risk management & strategy

Our information security program, including cybersecurity risk management is integrated into our overall Enterprise Risk Management Program (“ERMP”) framework. Our ERMP assesses strategic, operational, and environmental factors to identify key and emerging risks across the organization including cybersecurity risks. A key risk matrix is maintained to evaluate the potential impact of key risks and monitor the effectiveness of mitigation and controls. We, our customers, suppliers, and subcontractors face cybersecurity risks such as phishing, ransomware, zero-day exploits, malware attacks, and social engineering attacks. A cybersecurity incident impacting us or our subcontractors could materially adversely affect our performance and results of operations. For more information on about the cybersecurity risks we face, see the factors set forth under the caption “Risk Factors” in Part I, Item 1A of this Annual Report on Form 10-K.

Our cybersecurity risk management procedures encompass comprehensive administrative, technical, and physical security measures. Our Security Team meets, subscribes to intelligence sources, and actively participates in professional organizations to stay informed and have reliable access to the latest information on emerging threats and vulnerabilities. We utilize both internal tools and third-party resources to perform risk and vulnerability assessments, as well as penetration testing. This includes a comprehensive managed security service that operates 24/7, dedicated to scanning and analyzing potential threats. Our Contractors and Third Parties Policy requires certain vendors to undergo annual reviews including security assessments and site visits. Additionally, our subcontractor agreements require that they report any security incidents. Risk assessment results and recommendations are documented in our risk register, reported, and closely monitored by our security team. Annually, we engage independent auditors to issue a System and Organization Control (SOC) 2 - Type II report based on their examination of our critical systems used to provide services to our clients for the suitability of design and operating effectiveness of controls.

Governance

The Board of Directors has the responsibility to oversee our enterprise risk management framework and associated policies and procedures. The Audit Committee of the Board has been assigned the responsibility to inquire of management, the independent accountants and the internal auditor about significant risks and exposures, including risks and exposures relating to data privacy, information security, and cybersecurity, and assess the steps management has taken to minimize such risks and exposures; and to make recommendations to the Board, as and when appropriate, as to the scope, direction, investment levels, and execution of the our data privacy, information security and cybersecurity initiatives.

Our Enterprise Risk Management Committee (ERMC), which includes certain associates with data privacy, information security, and cybersecurity experience, supports our Board of Directors in this oversight. The ERMC reports to the Audit Committee of the Board of Directors. The ERMC manages the ERMP and provides regular updates to the Audit Committee regarding our key risk tolerance scorecard results and ERMP developments. Our Chief Security and Privacy Officer (“CSPO”) also reports to the Audit Committee on a regular basis, providing an Information Security Report, which includes information such as our information system risk profile, our top risk challenges, and security initiatives and strategies. Additionally, the ERMC communicates emerging risks and the mitigation of those risks to the Audit Committee, among other things. Significant cybersecurity matters, and strategic risk management decisions are elevated to the overall Board of Directors to enable oversight and guidance on critical cybersecurity issues.

Our CSPO, Dr. Cris V. Ewell is an ERMC member and has primary responsibility for our Information Security Program, including the maintenance and enforcement of our security policies. Dr. Ewell serves as an advisor to our leadership team, assisting them in optimizing security measures, mitigating risk, fortifying defenses, and minimizing vulnerabilities. Dr. Ewell develops written policies and procedures and conducts training to ensure our entire organization is well-protected. He is responsible for overseeing and executing the strategic plan for our data protection program, information security systems, compliance, computer networks and business continuance/disaster recovery. Additionally, Dr. Ewell actively participates in project management duties and manages information security integration efforts, working closely with internal teams, vendors, subcontractors, and clients. Dr. Ewell has over 25 years of experience in information security and spent over 20 years in CISO or equivalent roles. He previously held CISO positions at PEMCO Corporation, Seattle Children’s Hospital and University of Washington Medicine before joining us as our Chief Security and Privacy Officer. He has worked as an Adjunct Professor specializing in risk management and operational controls courses throughout his career. Dr. Ewell is an Associate Professor currently teaching graduate information and technology security courses at City University of Seattle. He was named as one of the Top 100 CISOs by CISOs Connect in 2021 and Becker’s Hospital Review CISO’s to know in 2018-2020.

Item 2.

Properties


The Company’sOur headquarters is located in an owned office building in Lincoln, Nebraska, of which 62,000 square feet arehave been used for the Company’s operations. This facility houses all the capabilities necessary for NRC Health’s survey programming, printing and distribution, data processing, analysis and report generation, marketing, and corporate administration. The Company’s term note isOur credit facilities are secured by this property amongand our other things.

The Company isassets. We are currently renovating the building and expect renovations to be complete in 2025. In February 2021, we began leasing 4,00019,300 square feet of office space in Markham, Ontario, 3,900 square feet of office space in San Diego, California, 8,100 square feet of office space in Seattle, Washington and 6,200 square feet of office space in Atlanta, Georgia.Lincoln, Nebraska for our mail survey processing operations that were previously housed at our headquarters.


Item 3.

Legal Proceedings


From time to time, the Company iswe are involved in certain claims and litigation arising in the normal course of business. Management assesses the probability of loss for such contingencies and recognizes a liability when a loss is probable and estimable.


Since For additional information, see Note 1, under the September 2017 announcementheading “Commitments and Contingencies,” to our consolidated financial statements. Regardless of the original proposed recapitalization plan (see Note 13final outcome, any legal proceedings, claims, inquiries and investigations, however, can impose a significant burden on management and employees, may include costly defense and settlement costs, and could cause harm to the Company’s consolidated financial statements), three purported class action and/or derivative complaints have been filed in state or federal courts by three individuals claiming to be shareholders of the Company. All of the complaints name as defendants the Companyour reputation and the individual directors of the Company. Two of these lawsuits were filed in the United States District Court for the District of Nebraska— a putative class action lawsuit captioned Gennaro v. National Research Corporation, et al., which was filed on November 15, 2017,brand, and a putative class and derivative action lawsuit captioned Gerson v. Hays, et al., which was filed on November 16, 2017. These lawsuits were consolidated by order of the federal court. A third lawsuit was filed the Circuit Court for Milwaukee County, Wisconsin—a putative class action lawsuit captioned Apfel v. Hays, et al, which was filed on December 1, 2017. The allegations in all of the lawsuits are very similar. The plaintiffs allege, among other things, that the defendants breached their fiduciary duties in connection with the allegedly unfair proposed transaction, at an allegedly unfair price, conducted in an allegedly unfair and conflicted process and in alleged violation of Wisconsin law and the Company’s Articles of Incorporation. One of the lawsuits also alleges the proposed transaction is a voidable “conflict of interest transaction” under Wisconsin statutes. The plaintiffs in these lawsuits seek, among other things, an injunction enjoining the defendants from consummating the original proposed recapitalization plan, damages, equitable relief and an award of attorneys’ fees and costs of litigation. The Company believes that the allegations of the complaints are without merit and intends to defend these lawsuits vigorously. Despite the changes to the original proposed recapitalization plan that culminated in the December 13, 2017 announcement of a revised proposed recapitalization plan (the “Proposed Recapitalization”), the Company expects that these shareholders or other shareholders might assert similar claims regarding the Proposed Recapitalization. The Company will defend any such lawsuits vigorously.As of December 31, 2017, no losses have been accrued as the Company does not believe the losses are probable or estimable.factors.


Item 4.

Mine Safety Disclosures


Not applicable.


PART II


Item 5.5.

Market for the Registrant’sRegistrants Common Equity,, Related Stockholder Matters and IssuerPurchases of Equity Securities


In May 2013, the Company consummated a recapitalization (the “May 2013 Recapitalization”) pursuant toWe have one class of outstanding capital stock, which the Company established two classes ofis our common stock, (class Apar value $.001 per share. Our common stock and class B common stock), issued a dividend of three shares of class A common stock for each share of the Company’s then existing common stock and reclassified each then existing share of common stock as one-half of one share of class B common stock. Following the May 2013 Recapitalization, the Company’s class A common stock and the Company’s class B common stock are tradedtrades on the NASDAQ Global Select Market under the symbols “NRCIA” and “NRCIB,” respectively.symbol “NRC”.


The following table sets forth the range of high and low sales prices for, and dividends declared on the class A common stock and class B common stock for the period from January 1, 2016, through December 31, 2017:


Class A


Class B


High


Low


Dividends Declared Per Common Share


High


Low


Dividends Declared Per Common Share


2016 Quarter Ended:


March 31

 $16.10  $13.70  $0.08  $36.87  $32.99  $0.48 

June 30

 $16.67  $12.53  $0.08  $44.60  $33.19  $0.48 

September 30

 $17.14  $13.26  $0.08  $38.50  $32.18  $0.48 

December 31

 $20.00  $14.35  $0.10  $46.37  $32.57  $0.60 

2017 Quarter Ended


March 31

 $20.93  $16.50  $0.10  $41.73  $38.76  $0.60 

June 30

 $28.75  $19.15  $0.10  $49.29  $39.00  $0.60 

September 30

 $41.99  $26.70  $0.10  $57.21  $47.07  $0.60 

December 31

 $39.00  $31.40  $0.10  $58.16  $50.46  $0.60 


Cash dividends in the aggregate amount of $16.9$36.3 million, $20.9 million, and $12.2 million were declared in 2017 with $12.7 million paid in 20172023, 2022 and the remaining $4.2 million paid in January 2018. Cash dividends in the aggregate amount of $14.3 million were declared in 2016 with $10.1 million paid in 2016 and the remaining $4.2 million paid in January 2017.2021 respectively. The payment and amount of future dividends, if any, is at the discretion of the Company’sour Board of Directors and will depend on the Company’sour future earnings, financial condition, general business conditions, alternative uses of the Company’sour earnings and cash and other factors.


On February 16, 2018,13, 2024, there were approximately 1510 shareholders of record and approximately 3,86313,981 beneficial owners of the class Aour common stock and approximately 11 shareholders of record and approximately 1,447 beneficial owners of the class B common stock.


In February 2006, the May 2022, our Board of Directors of the Company authorized the repurchase of 2,250,0002,500,000 shares of class A common stock and 375,000 shares(the “2022 Program”). 

The table below summarizes repurchases of class B common stock (on a post-May 2013 Recapitalization basis) in the open market or in privately negotiated transactions. Unless terminated earlier by resolution of the Company’s Board of Directors, the repurchase program will expire when the Company has repurchased all shares authorized for repurchase thereunder. As of February 16, 2018, 1,969,509 shares of class A common stock and 305,509 shares of class B common stock have been repurchased under that authorization. No class A or class B common stock was repurchased during the three-month period ended December 31, 2017. The remaining2023.

Period


Total Number

of Shares

Purchased


Average Price

Paid per Share


Total Number of

Shares

Purchased as Part of

Publicly Announced

Plans or Programs(1)


Maximum Number

of

Shares that May Yet

Be

Purchased Under the

Plans or Programs(1)


Oct 1 – Oct 31, 2023

  14,823   41.91   14,823   1,809,218 

Nov 1 – Nov 30, 2023

  180,633   41.83   180,633   1,628,585 

Dec 1 – Dec 31, 2023

  166,281   41.02   166,281   1,462,304 

Total

  361,737       361,737     

(1)

Shares were repurchased pursuant to the 2022 program.

See Item 12 in Part III of this Annual Report on Form 10-K for certain information concerning shares that may be purchased under that authorization are 280,491 and 69,491 for class A and class Bof our common stock respectively.authorized for issuance under our equity compensation plans.


The following graph compares the cumulative 5-year total return provided shareholders on the Company’sour common stock relative to the cumulative total returns of the NASDAQ Composite Index and the Russell 2000 Index. Because of the uniqueness of our markets and products and lack of publicly traded peers, we do not believe that a combination of peer issuers can be selected on an industry or line-of-business basis to provide a meaningful basis for comparing shareholder return. Accordingly, the Russell 2000 Index, which is comprised of issuers with generally similar market capitalizations to that of the Company, is included in the graph as permitted by applicable regulations. An investment of $100 (with reinvestment of all dividends) is assumed to have been made in our common stock and in each of the indexes on December 31, 2012 (or on May 23, 2013 for2018, and our class A common stock which was the first day it was traded), and its relative performance is tracked through December 31, 2017. In accordance with Securities and Exchange Commission guidance, in calculating the cumulative 5-year total return on our class B common stock, we gave retroactive effect to the May 2013 Recapitalization (i.e., as if it had occurred on December 31, 2012).   

2023. 


   graph23.jpg


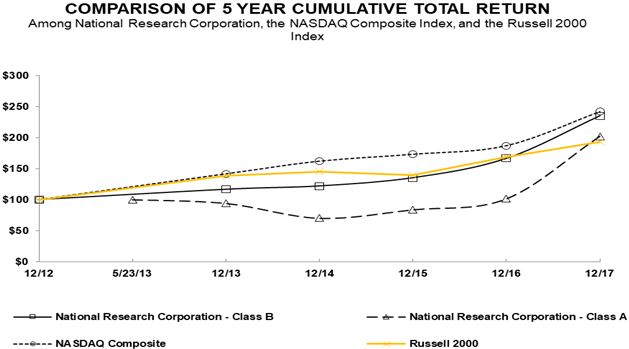
The stock price performance included in this graph is not necessarily indicative of future stock price performance.


12/12


5/23/13


12/13


12/14


12/15


12/16


12/17


National Research Corporation - Class B

  100.00   --   116.56   122.01   135.26   166.45   235.18 
                             

National Research Corporation - Class A

  ---   100.00   94.10   70.25   83.85   101.51   202.11 
                             

NASDAQ Composite

  100.00   --   141.63   162.09   173.33   187.19   242.29 
                             

Russell 2000

  100.00   --   138.82   145.62   139.19   168.85   193.58 


12/18


12/19


12/20


12/21


12/22


12/23


National Research Corporation Common Stock

  100.00   175.47   114.29   112.20   102.99   112.89 

NASDAQ Composite

  100.00   136.69   198.10   242.03   163.28   236.17 

Russell 2000

  100.00   125.52   150.58   172.90   137.56   160.85 


Item 6.

Selected Financial Data[Reserved]

The selected statement of income data for the years ended December 31, 2017, 2016 and 2015, and the selected balance sheet data at December 31, 2017 and 2016, are derived from, and are qualified by reference to, the audited consolidated financial statements of the Company included elsewhere in this Annual Report on Form 10-K. The selected statement of income data for the year ended December 31, 2014 and 2013, and the balance sheet data at December 31, 2015, 2014 and 2013, are derived from audited consolidated financial statements not included herein. The Company acquired Digital Assent, LLC on October 28, 2014 and disposed of selected assets and liabilities related to the clinical workflow product of its Predictive Analytics operating segment on December 21, 2015. The acquisition and disposal did not have a significant impact on the Company’s financial results, therefore, the historical data in the table below have not been adjusted.


Year Ended December 31, (a)


2017


2016


2015


2014


2013


(In thousands, except per share data)


Statement of Income Data:


Revenue

 $117,559  $109,384  $102,343  $98,837  $92,590 

Operating expenses:


Direct

  49,068   45,577   44,610   41,719   38,844 

Selling, general and administrative

  29,686   28,385   27,177   25,018   25,208 

Depreciation and amortization

  4,586   4,225   4,109   3,804   3,732 

Total operating expenses

  83,340   78,187   75,896   70,541   67,784 

Operating income

  34,219   31,197   26,447   28,296   24,806 

Other income (expense)

  64   159   913   (204)  (318)

Income before income taxes

  34,283   31,356   27,360   28,092   24,488 

Provision for income taxes

  11,340   10,838   9,750   9,936   9,004 

Net income

 $22,943  $20,518  $17,610  $18,156  $15,484 

Earnings per share common stock:

Basic Earnings per share:


Class A

 $0.54  $0.49  $0.42  $0.44  $0.37 

Class B

 $3.26  $2.93  $2.52  $2.62  $2.25 

Diluted Earnings per share:


Class A

 $0.52  $0.48  $0.41  $0.43  $0.37 

Class B

 $3.18  $2.88  $2.49  $2.57  $2.20 
Weighted average share and share equivalents outstanding:                    

Class A – basic

  20,770   20,713   20,741   20,764   20,677 

Class B – basic

  3,514   3,505   3,478   3,473   3,447 

Class A – diluted

  21,627   21,037   20,981   21,076   21,099 

Class B – diluted

  3,603   3,560   3,522   3,536   3,514 


2017


2016


2015


2014


2013


(In thousands)


Balance Sheet Data:


Working capital surplus (deficiency)

 $19,949  $15,551  $10,890  $25,262  $12,784 

Total assets

  127,316   120,624   128,049   129,510   111,088 

Total debt and capital lease obligations, including current portion

  1,225   3,732   5,917   8,386   10,546 

Total shareholders’ equity

 $90,041  $82,806  $74,222  $87,748  $71,755 

(a)

All share and per share data have been retroactively adjusted to give effect to the May 2013 Recapitalization as further described in Item 5.


Item 7.

Management’sManagements Discussion and Analysis of Financial Condition and Results of Operations

The following discussion and analysis provides a summary of significant factors relevant to our financial performance and condition. It should be read in conjunction with the consolidated financial statements and accompanying notes included in Part II, Item 8 of this Form 10-K. This section of this Form 10-K generally discusses 2023 and 2022 items and year-to-year comparisons between 2023 and 2022. Discussions of 2021 items and year-to-year comparisons between 2022 and 2021 are not included in this Form 10-K and can be found in “Management’s Discussion and Analysis of Financial Condition and Results of Operations” in Part II, Item 7 of the Company’s Annual Report on Form 10-K for the fiscal year ended December 31, 2022.


Overview


The CompanyOur purpose is ato humanize healthcare and support organizations in their understanding of each unique individual. Our commitment to Human Understanding® helps leading provider of analytics andhealthcare systems get to know each person they serve not as point-in-time insights, that facilitate measurement and improvement of the patient and employee experience while also increasing patient engagement and customer loyalty for healthcare providers, payers and other healthcare organizations. The Company’sbut as an ongoing relationship. Our end-to-end solutions enable itsour clients to understand what matters most to each person they serve – before, during, after, and beyond clinical encounters – to gain a longitudinal understanding of how life and health intersect, with the voicegoal of the customer with greater clarity, immediacy and depth. NRC Health’s heritage, proprietary methods, and holistic approach enable our partners to better understand the people they care for and design experiences that inspire loyalty and trust, while also facilitating regulatory compliance and the shift to population-based health management. The Company’sdeveloping lasting, trusting relationships. Our ability to measure what matters most and systematically capture, analyze, and deliver insights based on self-reported information from patients, families, and consumers is critical in today’s healthcare market. NRC Health believes thatWe believe access to and analysis of itsour extensive consumer-driven information is becoming moreincreasingly valuable as healthcare providers increasingly need to more deeplybetter understand and engage patientsthe people they serve to create long-term relationships and consumers in an effort towards effective population-based health management.build loyalty.


The Company’sOur portfolio of subscription-based solutions provideprovides actionable information and analysis to healthcare organizations and payers across a range of mission-critical, constituent-related elements, including patient experience, service recovery, care transitions, employee engagement, reputation management, and satisfaction, community population health risks, workforce engagement, community perceptions, and physician engagement. NRC Health partnersbrand loyalty. We partner with clients across the continuum of healthcare services. The Company’s clients range from integrated health systemsservices and post-acute providers, such as home health, long term care and hospice, to numerous payer organizations. The Company believesbelieve this cross-continuum positioning is a unique and an increasingly important capability as evolving payment models drive healthcare providers and payers towards a more collaborative and integrated service model.


Investments

The Company makes equity investments to promote business and strategic objectives. For investments that do not have a readily determinable fair value, the Company applies either cost or equity method of accounting depending on the nature of its investment and its ability to exercise significant influence. Investments are periodically analyzed to determine whether or not there are any indicators of impairment and written down to fair value if the investment has incurred an other than temporary impairment. During 2017, the Company acquired a $1.3 million investment in convertible preferred stock of PracticingExcellence.com, Inc., a privately-held Delaware Corporation (“PX”), which is carried at cost and included in other non-current assets. The Company has a seat on PX's board of directors and the Company's investment, which is not considered to be in-substance common stock, represents approximately 15.7% of the issued and outstanding equity interests in PX.

Divestitures

On December 21, 2015, the Company completed the sale of selected assets and liabilities related to the clinical workflow product of the former Predictive Analytics operating segment, for a net cash amount of approximately $1.6 million.  The Company recorded a gain of approximately $1.1 million from the sale in the fourth quarter of 2015, which is included in other income on the Consolidated Statement of Income. An additional gain was recorded in December 2016, when $223,000 was received from proceeds placed in escrow at the time of sale.

Critical Accounting Policies and Estimates


The preparation of financial statements requires management to make estimates and assumptions that affect amounts reported therein. The mostfollowing areas are considered critical accounting estimates because they involve significant of these areas involving difficultjudgments or assumptions, involve complex judgments made by management with respector uncertain matters or they are susceptible to change and the preparation of the Company’s consolidatedimpact could be material to our financial statements for 2017 include:condition or operating results:


Revenue recognition; and


Valuation of goodwill and identifiable intangible assets; and

Income taxes.assets.


Revenue Recognition


The Company derivesWe derive a majority of its operatingour revenue from its annually renewable services, which include performance measurement and improvement services, healthcare analytics and governance education services. The Company provides these services to its clients under annual clientsubscription-based service contracts, although such contractsagreements with our customers. Such agreements are generally cancelable on short or no notice without penalty. However, We also derive revenue from fixed, non-subscription arrangements. Our revenue recognition policy requires management to estimate, among other factors, the Company is entitledfuture contract consideration we expect to payment for services through the cancellation date.

Services are providedreceive under subscription-based service agreements. The Company recognizes subscription-based service revenuevariable consideration subscription arrangements as well as future total estimated contract costs over the period of time the service is provided. Generally, the subscription periods are for twelve months and revenue is recognized equally over the subscription period.

Certain contracts, excluding subscription-based service agreements, are fixed-fee arrangementscontract term with a portion of the project fee billed in advance and the remainder billed periodically over the duration of the project. Revenue and direct expenses for services provided under these contracts are recognized under the proportional performance method. Under the proportional performance method, the Company recognizes revenue based on output measures or key milestones such as survey set-up, survey mailings, survey returns and reporting. The Company measures its progress based on the level of completion of these output measures and recognizes revenue accordingly. Management judgments and estimates must be made and used in connection with revenue recognized using the proportional performance method.respect to fixed, non-subscription arrangements. If management made different judgments and estimates, then the amount and timing of revenue for any period could differ materially from the reported revenue.

The Company’s revenue arrangements with See Notes 1 and 3 to our consolidated financial statements for a client may include combinationsdescription of performance measurement and improvement services, healthcare analytics or governance education services which may be executed at the same time, or within close proximity of one another (referred to as a multiple-element arrangement). When the periods or patterns ofour revenue recognition differ, each element of a multiple-element arrangement is accounted for as a separate unit of accounting provided each delivered element is sold separately by the Company or another vendor; and for an arrangement that includes a general right of return relative to the undelivered elements, delivery or performance of the undelivered services are considered probable and substantially in the control of the Company. The Company’s arrangements generally do not include a general right of return related to the delivered services. If these criteria are not met, the arrangement is accounted for as a single unit of accounting with revenue generally recognized equally over the subscription period or recognized under the proportional performance method.


When a contract contains multiple elements, revenue is allocated to each separate unit of accounting based on relative selling price using a selling price hierarchy: vendor specific objective evidence (“VSOE”), if available, third-party evidence (“TPE”) if VSOE is not available, or estimated selling price if VSOE nor TPE is available. VSOE is established based on the services normal selling price and discounts for the specific services when sold separately. TPE is established by evaluating similar competitor services in standalone arrangements. If neither exists for a deliverable, the best estimate of the selling price (“ESP”) is used for that deliverable based on list price, representing a component of management’s market strategy, and an analysis of historical prices for bundled and standalone arrangements. Revenue allocated to an element is limited to revenue that is not subject to refund or otherwise represents contingent revenue. VSOE, TPE, and ESP are periodically adjusted to reflect current market conditions. These adjustments are not expected to differ significantly from historical results.policies. 


Valuation of Goodwill and Identifiable Intangible Assets


Intangible assets include customer relationships, trade names, technology, non-compete agreements and goodwill. Intangible assets with estimable useful lives are amortized over their respective estimated useful lives to their estimated residual values and reviewed for impairment with other long-lived assets in the related asset group whenever events or changes in circumstances indicate that the carrying amount of the assets may not be recoverable. The Company reviewsWe review intangible assets with indefinite lives for impairment annually as of October 1 and whenever events or changes in circumstances indicate that the carrying value of an asset may not be recoverable.

When performing the impairment assessment, the Company will first This review requires management to assess qualitative factors to determine whether it is necessary to recalculatean impairment may have occurred, which inherently involves management’s judgment. This assessment also requires a determination of the fair value of the asset, which often includes several significant estimates and assumptions, including future cash flow estimates, determination of appropriate discount rates, and other assumptions that management believed reasonable under the circumstances. Changes in these estimates and assumptions could materially affect the determination of fair value and/or impairment of goodwill or other intangible assets with indefinite lives. Ifassets. See Notes 1 and 6 to our consolidated financial statements for a description of our goodwill and intangible asset valuation and impairment policies and associated impacts for the Company believes,reported periods. At December 31, 2023, we assessed our current market capitalization compared to book value, forecasts and margins in our last quantitative impairment testing. We concluded that a triggering event had not occurred which would require an additional interim impairment test to be performed as a result of the qualitative assessment, that it is not more likely than not that the fair value of the indefinite-lived intangibles is less than their carrying amount, the Company calculates the fair value using a market or income approach. If the carrying value of intangible assets with indefinite lives exceeds their fair value, then the intangible assets are written-down to their fair values. The Company did not recognize any impairments related to indefinite-lived intangibles during 2017, 2016 or 2015.

Goodwill is an asset representing the future economic benefits arising from other assets acquired in a business combination that are not individually identified and separately recognized. All of the Company’s goodwill is allocated to its reporting units, which are the same as its six operating segments: Experience, The Governance Institute, Market Insights, Transparency, National Research Corporation Canada and Transitions. Goodwill is reviewed for impairment loss had been incurred at least annually, as of October 1, and whenever events or changes in circumstances indicate that the carrying value of goodwill may not be recoverable.

The Company reviews for goodwill impairment by first assessing qualitative factors to determine whether any impairment may exist. If the Company believes, as a result of the qualitative assessment, that it is more likely than not that the fair value of a reporting unit is less than its carrying amount, a quantitative analysis will be performed, and the fair value of the reporting unit is compared with its carrying value (including goodwill). If the fair value of the reporting unit exceeds its carrying value, no impairment exists. If the fair value of the reporting unit is less than its carrying value, then goodwill is written down by this difference. The Company performed a qualitative analysis as of October 1, 2017 and determined the fair value of each reporting unit likely significantly exceeded its carrying value. No impairments were recorded during the years ended December 31, 2017, 2016 or 2015.

Income Taxes

The Company uses the asset and liability method of accounting for income taxes. Under that method, deferred income tax assets and liabilities are recognized for the future tax consequences attributable to differences between the financial statement carrying amounts of existing assets and liabilities and their respective tax bases using enacted tax rates. The effect on deferred tax assets and liabilities of a change in tax rates is recognized in income in the period that includes the enactment date. Valuation allowances, if any, are established when necessary to reduce deferred tax assets to the amount that is more likely than not to be realized. The Company recognizes the effect of income tax positions only if those positions are more likely than not of being sustained. Recognized income tax positions are measured at the largest amount that is greater than 50% likely of being realized. Changes in recognition or measurement are reflected in the period in which the change in judgment occurs. Management judgment is required to determine the provision for income taxes and to determine whether deferred income taxes will be realized in full or in part. Such judgments include, but are not limited to, the likelihood we would realize the benefits of net operating loss carryforwards, the adequacy of valuation allowances, the election to capitalize or expense costs incurred, and the probability of outcomes of uncertain tax positions. It is possible that the various taxing authorities could challenge those judgments or positions and reach conclusions that would cause us to incur tax liabilities in excess of, or realize benefits less than, those currently recorded. In addition, changes in the geographical mix or estimated amount of annual pretax income could impact our overall effective tax rate.2023.


On December 22, 2017, the U.S. government enacted comprehensive tax legislation commonly referred to as the Tax CutKey Financial Metrics and Jobs Act (the “Tax Act”). The Tax Act makes broad and complex changes to the U.S. tax code that affects 2017, including, but not limited to, a federal corporate tax rate decrease from 35% to 21% for tax years beginning after December 31, 2017, the transition of U.S international taxation from a worldwide tax system to a territorial system, a one-time transition tax on the mandatory deemed repatriation of foreign earnings and accelerated depreciation that will allow for full expensing of qualified property.

On December 22, 2017, the staff of the United States Securities and Exchange Commission issued Staff Accounting Bulletin No. 118 (“SAB 118”), which provides guidance on accounting for the tax effects of the Tax Act.  SAB 118 provides a measurement period that should not extend beyond one year from the Tax Act enactment date for companies to complete the accounting under ASC 740, Income Taxes.  In accordance with SAB 118, a company must reflect the income tax effects of those aspects of the Tax Act for which the accounting under ASC 740 is complete.  To the extent that a company’s accounting for certain income tax effects of the Tax Act is incomplete but it is able to determine a reasonable estimate, it must record and provisional estimate in the financial statements.

Results of Operations


The following table and graphs set sets forth, for the periods indicated, selected financial information derived from the Company’sour consolidated financial statements including amounts expressed as a percentage of total revenue and the percentage change in such items versus the prior comparable period, (please note that all columns may not add up to 100% due to rounding). The trends illustrated in the following table and graphs may not necessarily be indicative of future results.as well as other key financial metrics. The discussion that follows the information should be read in conjunction with the Company’sour consolidated financial statements.


Percentage of Total Revenue
Year Ended December 31,


Percentage

Increase (Decrease)


2017


2016


2015


2017 over

2016


2016 over

2015


Revenue

  100.0%  100.0%  100.0%  7.5%  6.9%

Operating expenses:


Direct

  41.7   41.7   43.6   7.7   2.2 

Selling, general and administrative

  25.3   25.9   26.6   4.6   4.4 

Depreciation and amortization

  3.9   3.9   4.0   8.5   2.8 

Total operating expenses

  70.9   71.5   74.2   6.6   3.0 

Operating income

  29.1%  28.5%  25.8%  9.7%  18.0%

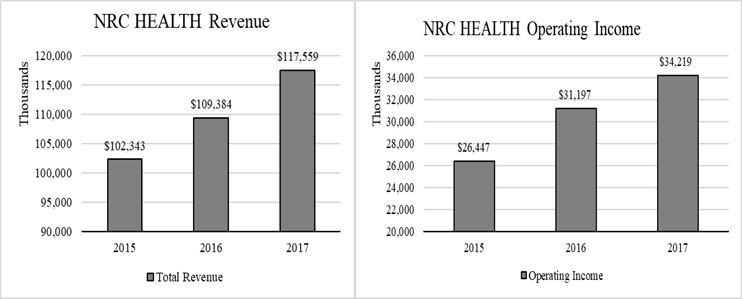
Year Ended December 31, 2017, Compared to Year Ended December 31, 2016


(In thousands, except percentages)
Year Ended December 31,


Percentage

Increase (Decrease)


2023


2022


2021


2023 over

2022


2022 over

2021


Revenue

 $148,580  $151,568  $147,954   (2)  2 

Direct expenses

  56,015   57,049   52,350   (2)  9 

Selling, general, and administrative

  46,621   42,699   38,960   9   10 

Depreciation, amortization and impairment

  5,899   5,277   6,374   12   (17)

Operating income

  40,045   46,543   50,270   (14)  (7)

Total other income (expense)

  (83)  (3,728)  (1,649)  (98)  126 

Provision for income taxes

  8,991   11,015   11,155   (18)  (1)

Effective Tax Rate

  22%  26%  23%  (4)  3 
                     

Operating Margin

  27%  31%  34%  (4)  (3)

Recurring Contract Value

  141,855   146,839   150,937   (3)  (3)

Cash provided by operating activities

  38,113   36,265   46,344   5   (22)


RevenueRevenue.. Revenue in 2017 increased 7.5% to $117.6 million,2023 decreased compared to $109.42022 with reductions in US revenue of $2.2 million in 2016, which was driven primarily by a combinationand Canadian revenue of continued gains in market share and vertical growth$793,000 due to the closure of our Canadian office. US recurring revenue in our existing client base. Revenuebase decreased $819,000 which included $439,000 attributed to elimination of a non-core solution. US recurring revenue decreased from subscription-based agreements comprised 89.3%new customer sales by $1.4 million and from non-recurring revenues by $4,000. We do not expect Canadian revenues in the future due to the closure of the total revenue in 2017, compared to 88.0 % of total revenue in 2016.Canadian office.

Direct expenses. DirectVariable expenses increased 7.7% to $49.1 million$906,000 in 2017,2023 compared to $45.6 million in 2016. This was due to an increase in variable2022 primarily from higher data collection expenses. Variable expenses of $555,000 and fixed expenses of $2.9 million. Variable expense increased mainly due to increased costs to support the larger revenue and higher contracted voice recognition technology, phone costs, and labor costs, partially offset by decreased postage, printing and paper costs due to a reduction in postage fees and changes in survey methodologies. Conference expenses also decreased over the same period in 2016. Fixed expenses increased primarily as a result of increased salary and benefit costs in the customer service area, partially offset by decreased contracted service costs. Direct expenses remained the same as a percentage of revenue at 41.7%were 15% and 14% in 20172023 and 2016 as2022, respectively. Fixed expenses decreased $1.9 million primarily due to decreased salary and benefit costs from workforce reduction and automation partially offset by increased by 7.7% while revenue for the same period increased by 7.5%.contracted services to support our Human Understanding solutions and higher travel costs.


Selling, general and administrative expenses. Selling, general and administrative expenses increased 4.6% to $29.7 million in 20172023 compared to $28.4 million in 2016,2022 primarily due to growth in marketing initiative expenses associated with the Proposed Recapitalization of $1.4$2.8 million higher computer suppliesto expand brand recognition and software license fees of $513,000, and higher recruiting fees of $412,000, partially offset by lowersupport sales development, increased salary and benefit costs of $308,000,  lower$1.5 million in sales and client support, increased travel costs of $234,000, lower development and training costs$512,000, additional technology services of $205,000, $177,000 reduction for shelf registration fees expensed in 2016, and lower marketing expenses of $162,000. Selling, general, and administrative expenses decreased as a percentage of revenue to 25.3% in 2017, from 25.9% for the same period in 2016 as expenses increased by 4.6% while revenue increased by 7.5% during the same period.

Depreciation and amortization. Depreciation and amortization expenses increased 8.5% to $4.6 million in 2017 compared to $4.2 million in 2016 due to increased depreciation and amortization of $405,000 primarily from additional computer software investments,$736,000 partially offset by a reduction in innovation investments of $1.1 million and decreased amortizationbuilding demolition costs of $45,000 as a result of certain intangibles becoming fully amortized. Depreciation and amortization expenses as a percentage of revenue remained the same at 3.9% in 2017 and 2016.

Other income (expense). Other income (expense) decreased to $64,000 in 2017 compared to $159,000 in 2016. In December 2016, an additional gain of $223,000 was recorded due to receipt of funds placed in escrow at the time of the sale of selected assets and liabilities$384,000 related to the clinical workflow productremodel of the Company’s former Predictive Analytics operating segment. This was partially offset by lower interest expense on the term loanour headquarters. We expect salary and benefit costs to increase in 2017.2024 due to our new executive officer positions and changes to our commission structure, although we hope to have meaningful offsets from ongoing efficiency and cost controls.


Depreciation, amortization and impairment. Depreciation, amortization and impairment expenses increased in 2023 compared to the 2022 period primarily due to additional depreciation expense from shortening the estimated useful lives of certain building assets and increased software investment amortization.

Operating income and margin. Operating income and margin decreased in 2023 compared to 2022 primarily due to a decline in revenue and growth in marketing and technology investments and higher data collection expenses.

Total other income (expense). Total other expense decreased in 2023 compared to 2022 primarily due to the reclassification of the cumulative foreign currency translation adjustment of $2.6 million to other expense as a result of the substantial liquidation of our Canadian subsidiary in December 2022. Interest income increased $652,000 from additional money market funds investments and interest expense decreased $347,000 from the declining balance on our term loan partially offset from interest expense due to drawing on the line of credit. In future periods we expect total other expense to increase due to an expected decrease in interest income resulting from reduced money market fund investments and increased interest expense due to borrowings on our line of credit and delayed draw term loan. 


Provision for income taxes and effective tax rate. Provision for income taxes was $11.3 million (33.1% effective tax rate)decreased in 2017,2023 compared to $10.8 million (34.6% effective tax rate) in 2016.2022 primarily due to decreased taxable income. The effective tax rate for the year ended December 31, 2017 decreased primarily due to the net benefitlower state income taxes of approximately $1.9 million associated with remeasuring deferred tax assets$864,000 which fluctuate based on various apportionment factors and liabilities torates for the new lower federal rate, partially offset by a one-time mandatory deemed repatriation tax understates we operate in, the Tax Act. In addition, as a resultnon-deductible reclassification of the Tax Act,cumulative foreign currency translation adjustment of $539,000 in 2022 and increased tax benefits of $250,000 from the Company determined that it would no longer indefinitely reinvest the earnings of its Canadian subsidiary and recorded the withholding tax of $706,000 associated with this planned repatriation. The 2017 effective tax rate was also impacted by a benefit of $609,000 related to the vesting and exercise of stock awards, net of certain excessshare-based compensation limits, $504,000 of tax expense due to non-deductible recapitalization expenses and increases in the estimated state tax rates. Pursuant to the guidance in SAB 118, the Company’s estimate of impacts of the Tax Act are provisional and are subject to adjustment during 2018 based upon further analysis and interpretation of the Tax Act.awards. See Note 7, “Income Taxes,” to the Company’s consolidated financial statementsour Consolidated Financial Statements contained in this report for more details on tax adjustments related to the Tax Act.


Year Ended December 31, 2016, Compared to Year Ended December 31, 2015

Revenue. Revenue in 2016 increased 6.9% to $109.4 million, compared to $102.3 million in 2015, which was driven primarily by a combination of continued gains in market share and vertical growth in our existing client base. Revenue from subscription-based agreements comprised 88.0% of the total revenue in 2016, compared to 86.6% of total revenue in 2015.

Direct expenses. Direct expenses increased 2.2% to $45.6 million in 2016, compared to $44.6 million in 2015. Variable expenses increased by $327,000 due to higher survey volumes and increased contracted survey costs, partially offset by decreased survey operations expenses due to a reduction in postage fees and changes in survey methodologies. Fixed expenses increased $641,000 as a result of higher salary and benefit costs in the client service area, increased travel expenses and increased software license amortization. Direct expenses decreased as a percentage of revenue to 41.7% in 2016 from 43.6% in 2015 as expenses increased by 2.2% while revenue for the same period increased by 6.9%.

Selling, general and administrative expenses. Selling, general and administrative expenses increased 4.4% to $28.4 million in 2016 compared to $27.2 million in 2015, primarily due to increased salary and benefits of $991,000 (mainly from increased incentives and share based compensation expense), increased marketing expenses of $510,000, higher annual incentive trip expenses of $348,000, Securities and Exchange Commission registration fees expensed in 2016 of $177,000, and increased professional development costs for associates of $172,000. These were partially offset by a reduction of $238,000 in repairs and maintenanceadditional information on the Company’s headquarters building and the $657,000 write off of a purchase option in 2015 when the Company chose not to exercise the option and it expired. Selling, general, and administrative expenses decreased as a percentage of revenue to 25.9% in 2016, from 26.6% for the same period in 2015 as expenses increased by 4.4% while revenue increased by 6.9% during the same period.

Depreciation and amortization. Depreciation and amortization expenses increased 2.8% to $4.2 million in 2016 compared to $4.1 million in 2015 primarily due to increased depreciation and amortization from increased computer software investments and computer software license expense being included in depreciation and amortization in 2016, resulting from the adoption of Accounting Standards Update (“ASU”) 2015-05, Intangibles - Goodwill and Other - Internal-Use Software (Subtopic 350-40): Customer's Accounting for Fees Paid in a Cloud Computing Arrangement. These increases were offset by decreased amortization as a result of the sale of the clinical workflow product of the former Predictive Analytics operating segment in 2015 and other intangibles becoming fully amortized. Depreciation and amortization expenses as a percentage of revenue decreased to 3.9% in 2016 from 4.0% during in 2015.

Other income (expense). Other income (expense) decreased to $159,000 in 2016 compared to $913,000 in 2015. This was primarily due to the $1.1 million gain on the sale of selected assets and liabilities related to the clinical workflow product of the former Predictive Analytics operating segment in 2015. In December 2016, an additional gain of $223,000 was recorded due to receipt of funds placed in escrow at the time of the sale.

Provision for income taxes. Provision for income taxes was $10.8 million (34.6% effective tax rate) in 2016, compared to $9.8 million (35.6% effective tax rate) in 2015. The decreasechange in the effective tax rate was mainly due to the prospective adoption of ASU 2016-09, Compensation – Stock Compensation (Topic 718) Improvements to Employee Share-Based Payment Accounting (“ASU 2016-09”),which reduced tax expense by $460,000 in 2016. ASU 2016-09 requires excess tax benefits and tax deficiencies to be recorded in the income statement when share based compensation awards vest or are settled rather than to additional paid-in capital.rates.


InflationRecurring Contact Value. Recurring contract value declined in 2023 compared to 2022 primarily from our strategy to focus on our core digital solutions and Changing Priceslower net sales, although the trend improved later in 2023. Our recurring contract value metric represents the total revenue projected under all renewable contracts for their respective next annual renewal periods, assuming no upsells, downsells, price increases, or cancellations, measured as of the most recent quarter end. 


Inflation and changing prices have not had a material impact on revenue or net income in the last three years.

Liquidity and Capital Resources


Our Board of Directors has established priorities for capital allocation, which prioritize funding of innovation and growth investments, including merger and acquisition activity as well as internal projects. The Company believessecondary priority is capital allocation for quarterly dividends and share repurchases.

As of December 31, 2023, our principal sources of liquidity included $6.7 million of cash and cash equivalents, up to $30 million of unused borrowings under our line of credit and an additional $56 million on our delayed draw term note. Of this cash, $155,000 was held in Canada. The delayed draw term note can only be used to fund permitted future business acquisitions or repurchasing our common stock.

Our cash flows from operating activities consist of net income adjusted for non-cash items including depreciation, amortization, and impairments, reclassification of cumulative foreign currency translation adjustment into earnings, deferred income taxes, share-based compensation and related taxes, reserve for uncertain tax positions, loss on disposal of property and equipment and the effect of working capital changes. Cash provided by operating activities increased primarily due to working capital changes, mainly consisting of changes in deferred revenue and trade accounts receivable primarily due to timing of initial billings and collections for new and renewal contracts, changes in accrued expenses, wages and bonuses mainly due to decreased bonuses and reductions in accruals for paid time off due to a new unlimited plan, partially offset by changes in prepaid expenses and other current assets primarily due to the timing of our annual business insurance payment and growth in operating lease assets and liabilities due to changes in our leases and a reassessment. Cash provided by operating activities was also partially offset by decreased net income net of non-cash items.

See the Consolidated Statements of Cash Flows included in this report for the detail of our operating cash flows.

We had a working capital deficit of $11.8 million and surplus of $10.3 million on December 31, 2023 and 2022, respectively. The change was primarily due to decreases in cash and cash equivalents and trade accounts receivable and an increase in the current portion of notes payable. These were partially offset by increases in prepaid expenses primarily due to the timing of our annual business insurance payment. Cash and cash equivalents decreased mainly due to the repurchase of shares of our common stock for treasury. We also borrowed on our delayed draw term loan to fund the share repurchases which increased the current portion of notes payable. Trade accounts receivable decreased due to timing of billing and collections, as well decreases in our overall recurring contract value. Our working capital is significantly impacted by our large deferred revenue balances which will vary based on the timing and frequency of billings on annual agreements. Notwithstanding our working capital deficit on December 31, 2023, we believe that itsour existing sources of liquidity, including cash and cash equivalents, borrowing availability, and operating cash flows will be sufficient to meet itsour projected capital and debt maturity needs and dividend policy for the foreseeable future.


AsCash used in investing activities primarily consisted of December 31, 2017, our principal sourcespurchases of liquidity included $34.7 millionproperty and equipment including computer software and hardware, building improvements, and furniture and equipment.

Cash used in financing activities consisted of cash and cash equivalents and up to $12 million of unusedpayments for borrowings under the term note, line of credit and finance lease obligations. We also used cash to repurchase shares of our revolving credit note. The amount of unused borrowings actually available under the revolving credit note varies in accordance with the terms of the agreement. Of this cash, $14.2 million was held in Canada.

Working Capital

The Company had a working capital surplus of $19.9 millioncommon stock for treasury and $15.6 millionto pay dividends on December 31, 2017 and 2016, respectively.

The change was primarily due to increases in cash and cash equivalents of $1.7 million, $2.5 million increase in trade accounts receivable and $1.6 million reduction in current portion of notes payable.common stock. This was partially offset by increases in accrued wages of $2.1 million and deferred revenue of $1.4 million. Trade accounts receivable increased due to the timing of billings and collections on new and renewal contracts. Current notes payable decreased due to monthly payments on the term note that will be fully paid in April 2018. Accrued wages increased mainly due to a payroll tax accrual from the vesting of non-vested stock award at year end. The Company’s working capital is significantly impacted by its large deferred revenue balances which will vary based on the timing and frequency of billings on annual agreements. The deferred revenue balances as of December 31, 2017 and December 31, 2016, were $16.9 million and $15.5 million, respectively.

The deferred revenue balance is primarily due to timing of initial billings on new and renewal contracts. The Company typically invoices clients for performance tracking services and custom research projects before they have been completed. Billed amounts are recorded as billings in excess of revenue earned, or deferred revenue, on the Company’s consolidated financial statements, and are recognized as income when earned. In addition, when work is performed in advance of billing, the Company records this work as revenue earned in excess of billings, or unbilled revenue. Substantially all deferred revenue and all unbilled revenue will be earned and billed respectively, within 12 months of the respective period ends.

Cash Flow Analysis

A summary of operating, investing, and financing activities are shown in the following table:


For the Year Ended December 31,


2017


2016


2015


(In thousands)


Provided by operating activities

 $28,091  $26,843  $21,886 

Used in investing activities

  (6,118)  (3,750)  (1,326)

Used in financing activities

  (21,116)  (32,502)  (16,869)

Effect of exchange rate changes on cash

  855   285   (1,588)

Net increase (decrease) in cash and cash equivalents

  1,712   (9,124)  2,103 

Cash and cash equivalents at end of period

 $34,733  $33,021  $42,145 

Cash Flows from Operating Activities

Cash flows from operating activities consist of net income adjusted for non-cash items including depreciation and amortization, deferred taxes, share-based compensation and related taxes, gain on sale from operating segment and the effect of working capital changes.

Net cash provided by operating activities was $28.1 million for the year ended December 31, 2017, which included net income of $22.9 million, plus non-cash charges (benefits) for deferred tax expense, depreciation and amortization, reserve for uncertain tax positions, loss on disposal of property and equipment and non-cash stock compensation totaling $6.0 million. Changes in working capital decreased cash flows from operating activities by $806,000, primarily from increases in prepaid expenses, income taxes recoverable and accounts receivables, which fluctuate due to the timing and frequency of billings on new and renewal contracts. These decreases to cash flows were partially offset by the timing of payments on accounts payable, accrued expenses, wages, bonus and profit sharing, decreases in unbilled revenue and increases in deferred revenue.


Net cash provided by operating activities was $26.8 million for the year ended December 31, 2016, which included net income of $20.5 million, plus non-cash charges (benefits) for deferred tax expense, depreciation and amortization, reserve for uncertain tax positions, gain on sale from operating segment, loss on disposal of property and equipment and non-cash stock compensation totaling $6.8 million. Changes in working capital decreased cash flows from operating activities by $499,000, primarily due to the timing of payments on accounts payable and increases in prepaid expenses, accounts receivables, and unbilled revenue, which fluctuate due to the timing and frequency of billings on new and renewal contracts. These decreases to cash flows were partially offset by decreases in income taxes recoverable, and timing of payments related to accrued expenses, wages, bonus and profit sharing and deferred revenue.

Net cash provided by operating activities was $21.9 million for the year ended December 31, 2015, which included net income of $17.6 million, plus non-cash charges (benefits) for deferred tax expense, depreciation and amortization, reserve for uncertain tax positions, gain on sale from operating segment, write off of purchase option, tax benefit from exercise of stock options, and non-cash stock compensation totaling $3.8 million. Changes in working capital increased cash flows from operating activities by $472,000, primarily due to decreases in income taxes recoverable, and timing of payments related to accrued expenses, wages, bonus and profit sharing and deferred revenue. These increases were offset in part by decreases in accounts payable, and increases in accounts receivables and unbilled revenues which fluctuate due to the timing and frequency of billings on new and renewal contracts and increases in prepaid expenses. .

Cash Flows from Investing Activities

Net cash of $6.1 million was used for investing activities in the year ended December 31, 2017. Purchases of property and equipment totaled $4.6 million. In addition, the Company used $1.3 million of cash to acquire a strategic investment in convertible preferred stock of PX, which is carried at cost and included in other non-current assets.

Net cash of $3.8 million was used for investing activities in the year ended December 31, 2016. Purchases of property and equipment totaled $4.0 million. The Company received $223,000 in cash from funds put in escrow at the time of the December 21, 2015 sale of selected assets and liabilities related to the clinical workflow product of the former Predictive Analytics operating segment.

Net cash of $1.3 million was used for investing activities in the year ended December 31, 2015. Purchases of property and equipment totaled $2.9 million. The Company received $1.6 million in cash for the December 21, 2015 sale of selected assets and liabilities related to the clinical workflow product of the former Predictive Analytics operating segment.

Cash Flows from Financing Activities

Net cash used in financing activities was $21.1 million in the year ended December 31, 2017. Cash was used to repay borrowings under the term note totaling $2.5 million and for capital lease obligations of $108,000. Cash was used to pay $16.9 million of dividends, and repurchase shares for payroll tax withholdings related to share-based compensation of $1.7 million.

Net cash used in financing activities was $32.5 million in the year ended December 31, 2016. Cash was used to repay borrowings under the term note totaling $2.2 million and for capital lease obligations of $95,000. Cash was used to pay $28.6 million of dividends, purchase non-controlling interests in Connect totaling $2.0 million, and repurchase shares for payroll tax withholdings related to share-based compensation of $204,000. These were partially offset by the cash provided from the proceeds from the exercise of stock optionsshare-based awards, borrowings on the line of $548,000.credit and delayed draw term loan.


NetOur material cash used in financing activities was $16.9 millionrequirements include the following contractual and other obligations:

Dividends

Cash dividends in the year ended December 31, 2015. Cash was used to repay borrowings under the term note totaling $2.3aggregate amount of $36.3 million, $20.9 million and for capital lease obligations$12.2 million were declared in 2023, 2022 and 2021 respectively. Dividends were paid from cash on hand and borrowings on our line of $173,000. Cash was used to pay $10.1 millioncredit. The payment and amount of future dividends, purchase non-controlling interests in Connect totaling $2.8 million, purchase treasury stock totaling $1.7 millionif any, is at the discretion of our Board of Directors and repurchase shares for payroll tax withholdings related to share-based compensationwill depend on our future earnings, financial condition, general business conditions, alternative uses of $92,000. These were partially offset by theour earnings and cash provided from the excess tax benefit from share-based compensation of $240,000.and other factors.


Capital Expenditures


CapitalWe paid cash of $15.8 million for capital expenditures forin the year ended December 31, 2017 were $4.6 million.2023. These expenditures consisted mainly of computer equipmentsoftware development for our Human Understanding solutions and software. The Company expects similar capital expenditure purchases in 2018 consisting primarily of computer equipment and software and other equipment,building renovations to our headquarters. We estimate future costs related to our headquarters building renovations to be funded$11.6 million in 2024 and $1.4 million in 2025, which we expect to fund through operating cash generated from operations.flows and borrowings on the line of credit.


Debt and Equity


The Company’s term note is payable in monthly installments of $212,468. Borrowings under the term note bear interest at an annual rate of 3.12%. The outstanding balance of the term note at December 31, 2017 was $1.1 million which will be fully paid in April 2018.

The Company also has a revolving credit note which wasOur amended and extended effective June 30, 2017 with a maturity date of June 30, 2018. The maximum aggregate amount available under the revolvingrestated credit note is $12.0 million. Borrowings under the revolving credit note bear interest at a variable annual rate, with three rate options at the discretion of management as follows: (1) 2.1% plus the one-month London Interbank Offered Rate (“LIBOR”) or (2) 2.1% plus the one-, two- or three- month LIBOR rate, or (3) the bank’s one-, two, three, six, or twelve month Money Market Loan Rate. As of December 31, 2017 the revolving credit note did not have a balance and the Company had the capacity to borrow $12.0 million.

The term note and revolving credit note are secured by certain of the Company’s assets, including the Company’s land, building, accounts receivable and intangible assets. The term note and the revolving credit note contain various restrictions and covenants applicable to the Company, including requirements that the Company maintain certain financial ratios at prescribed levels and restrictions on the ability of the Company to consolidate or merge, create liens, incur additional indebtedness or dispose of assets. As of December 31, 2017, the Company was in compliance with the financial covenants.

The Company has capital leases for computer equipment, office equipment, printing and inserting equipment. The balance of the capital leases as of December 31, 2017 was $158,000.

In December 2017, the Company’s Board of Directors approved the Proposed Recapitalization that will exchange each share of class B common stock for one share of class A common stock plus $19.59 in cash, for total value of $53.44 per class B share. The Proposed Recapitalization replaces the proposed plan announced in September 2017. The Proposed Recapitalization is designed to eliminate the public market trading confusion related to the Company’s two classes of common stockagreement (the class A common stock and class B common stock), to simplify the corporate structure of the Company and to provide a timely and cost-effective liquidity event for the holders of the Company’s class B common stock. The transaction will be funded by cash on hand and a $40 million term loan. The Proposed Recapitalization is subject to closing of financing and approval by the holders of the Company’s class A common stock, class B common stock and both classes of stock voting together as a group.

In December 2017, the Company entered into a commitment letter“Credit Agreement”) with First National Bank of Omaha (“FNB”) includes (i) a $30,000,000 revolving credit facility (the “Line of Credit”), which expires on April 30, 2018, to provide(ii) a senior secured$23,412,383 term loan of $40 million (the “Term Loan”), and (iii) a senior secured$75,000,000 delayed drawdraw-down term loan facility of $15 million (the “Delayed Draw Term Loan”) and, a senior secured revolving line of credit facility of $15 million (“the “Line of Credit” and, collectivelytogether with the Term LoanLine of Credit and Delayed Drawthe Term Loan, the “Credit Facilities”). IfWe may use the Company closes on the Credit Facilities with FNB, any balances remaining on the existing term note and revolving credit note will be repaid. The Term Loan will be used to fund, in part, the Proposed Recapitalization and related costs. The Delayed Draw Term Loan if used, is designated to fund any permitted future business acquisitions or repurchasingrepurchases of class Aour common stock. Thestock and the Line of Credit has a three year term and will be used to fund ongoing working capital needs and for other general purpose corporate purposes.

The Company will also pay loan origination fees equal to 0.25% of the amount borrowed underoutstanding balance on the Term Loan was $17.8 million at closing.December 31, 2023 and is payable in monthly installments of $462,988 through May 2027. The Company will also beTerm Loan bears interest at a fixed rate per annum of 5%.  

Borrowings under the Delayed Draw Term Loan and Line of Credit, if any, bear interest at a floating rate equal to the 30-day Secured Overnight Financing Rate (“SOFR”) plus 235 basis points (7.68% at December 31, 2023). Interest on the Line of Credit and Delayed Draw Term Loan accrues and is payable monthly.

Principal amounts outstanding under the Line of Credit are due and payable in full at maturity, in May 2025. The Line of Credit did not have a balance at December 31, 2023 and we had the availability to borrow $30,000,000. The weighted average borrowings on the Line of Credit for year ended December 31, 2023 was $1.7 million. The weighted average interest rate on borrowings on the Line of Credit during the year ended December 31, 2023 was 7.67%.

The outstanding balance on the Delayed Draw Term Loan was $19.0 million at December 31, 2023. Principal payments are due in monthly installments of $226,190 through April 2027 and a balloon payment for the remaining balance of $10.2 million is due in May 2027. We had the availability to borrow an additional $56.0 million on the Delayed Draw Term Loan at December 31, 2023.

We are obligated to pay ongoing unused commitment fees quarterly in arrears.arrears pursuant to the Line of Credit and the Delayed Draw Term Loan facility at a rate of 0.20% per annum based on the actual daily unused portions of the Line of Credit and the Delayed Draw Term Loan facility.


The Company incurred expenses relatedCredit Agreement contains customary representations, warranties, affirmative and negative covenants (including financial covenants) and events of default. The negative covenants include, among other things, restrictions regarding the incurrence of indebtedness and liens, repurchases of our common stock and acquisitions, subject in each case to certain exceptions. In June 2023, the Credit Agreement was amended to exclude our costs associated with our building renovation from or after January 1, 2023 from the fixed charge coverage ratio calculation. Pursuant to the Proposed RecapitalizationCredit Agreement, we are required to maintain a minimum fixed charge coverage ratio of approximately $1.41.10x for all testing periods throughout the term(s) of the Credit Facilities, which calculation excludes, unless our liquidity falls below a specified threshold, (i) any cash dividend in a fiscal quarter that, together with all other cash dividends paid or declared during such fiscal quarter, exceeds $5.5 million in total cash dividends paid or declared, (ii) the year endedportion of the purchase price for any permitted share repurchase of our shares paid with cash on hand, (iii) the portion of any acquisition consideration for a permitted acquisition paid with cash on hand, and (iv) up to $25 million of costs associated with our building renovation from or after January 1, 2023 . We are also required to maintain a cash flow leverage ratio of 3.00x or less for all testing periods throughout the term(s) of the Credit Facilities. All obligations under the Credit Facilities are to be guaranteed by each of our direct and indirect wholly owned domestic subsidiaries, if any, and, to the extent required by the Credit Agreement, direct and indirect wholly owned foreign subsidiaries. As of December 31, 2017, which are included2023, we were in selling and administrative expenses.compliance with our financial covenants.


Contractual ObligationsThe Credit Facilities are secured, subject to permitted liens and other agreed upon exceptions, by a first-priority lien on and perfected security interest in substantially all of our and our guarantors’ present and future assets (including, without limitation, fee-owned real property, and limited, in the case of the equity interests of foreign subsidiaries, to 65% of the outstanding equity interests of such subsidiaries). 


The CompanyLeases

We have lease arrangements for certain computer, office, printing and inserting equipment as well as office and data center space. As of December 31, 2023, we had contractualfixed lease payments of $678,000 and $23,000 for operating and finance leases, respectively payable within 12 months. A summary of our operating and finance lease obligations to make payments in the following amounts in the future as of December 31, 2017:2023 can be found in Note 10, "Leases", to the Consolidated Financial Statements contained in this report.


Contractual Obligations(1)


Total

Payments


Less than

One Year


One to

Three Years


Three to

Five Years


After

Five Years


(In thousands)


Operating leases

 $2,966  $708  $1,164  $567  $527 

Capital leases

  172   80   85   7   -- 

Uncertain tax positions(2)

  --   --   --   --   -- 

Long-term debt

  1,075   1,075   --   --   -- 

Total

 $4,213  $1,863  $1,249  $574  $527 

Taxes 

(1)

Amounts are inclusive of interest payments, where applicable.

(2)

We have $848,000 in liabilities associated with uncertain tax positions. We are unable to reasonably estimate the expected cash settlement dates of these uncertain tax positions with the taxing authorities.


The Companyliability for gross unrecognized tax benefits related to uncertain tax positions was $2.0 million as of December 31, 2023. See Note 7, "Income Taxes", to the Consolidated Financial Statements contained in this report for income tax related information.

We generally doesdo not make unconditional, non-cancelable purchase commitments. The Company entersWe enter into purchase orders in the normal course of business, but these purchase obligations do not exceed one year.year.


Stock Repurchase Program


In February 2006, theMay 2022, our Board of Directors approved the 2022 Program with a repurchase authorization of the Company authorized the repurchase of 2,250,000 2,500,000 shares of class Acommon stock. Under the 2022 Program we are authorized to repurchase from time-to-time shares of our outstanding common stock and 375,000 shares of class B common stock (on a post-May 2013 Recapitalization basis) inon the open market or in privately negotiated transactions. The timing and amount of stock repurchases will depend on a variety of factors, including market conditions as well as corporate and regulatory considerations. The 2022 Program may be suspended, modified, or discontinued at any time and we have no obligation to repurchase any amount of common stock in connection with the 2022 Program. The 2022 Program has no set expiration date.

During 2023, we repurchased 462,140 shares of our common stock for an aggregate of $19.1 million under the 2022 Program. As of December 31, 2017,2023, the remaining number of shares of common stock that could be purchased under this authorizationthe 2022 Program was 280,491 shares of class A common stock and 69,491 shares of class B common stock.1,462,304 shares.


Off-Balance Sheet ObligationsRecent Accounting Pronouncements


The Company hasThere are no significant off-balance sheet obligations other than the operating lease commitments disclosed in “Liquidity and Capital Resources.”

Recent Accounting Pronouncements

See Note 1 to the Company’s consolidated financial statements for a description of recently issued accounting pronouncements.pronouncements we believe will have a material impact on our financial position, results of operations or cash flows.


Item 7A.

Quantitative and Qualitative Disclosure About Market Risk


The Company’sOur primary market risk exposure is interest rate risk. Our future income, cash flows and fair values of financial instruments are impacted by changes in foreign currency exchange rates andmarket interest rates.

The Company’s Canadian subsidiary uses as its functional currency the local currency of the country in which it operates. It translates its assets and liabilities into U.S. dollars at the exchange rate in effect at the balance sheet date. It translates its revenue and expenses at the average exchange rate during the period. The Company includes translation gains and losses in accumulated other comprehensive income (loss), a component of shareholders’ equity. Foreign currency translation gains (losses) were $991,000, $369,000, and ($2.2 million) in 2017, 2016 and 2015, respectively. Gains and losses related to transactions denominated in a currency other than the functional currency of the countries in which the Company operates and short-term intercompany accounts are included in other income (expense) in the consolidated statements of income. A portion of our cash in our Canadian subsidiary is denominated in foreign currencies, where fluctuations in exchange rates will impact our cash balances in U.S. dollar terms. A sensitivity analysis assuming a hypothetical 10% change in the value of the U.S. dollar would impact our reported cash balance by approximately $1.8 million. We have not purchased or used any derivative instruments or entered into any foreign currency hedging transactions. We do not purchase or hold any derivative financial instruments for the purpose of speculation or arbitrage.

We are exposed to interest rate risk with both our fixed-rate term debtTerm Loan and variable rate revolving lineDelayed Draw Term Note and Line of credit facility. Credit.

Interest rate changes for borrowings under our fixed-rate term debtTerm Loan would impact the fair value of such debt, but do not impact earnings or cash flow. At December 31, 2017,2023, our fixed-rate term debtTerm Loan totaled $1.1$17.8 million. Based on a sensitivity analysis, a hypothetical one percent per annum change in market interest rates as of December 31, 2017,2023, would not have a material effect onimpact the estimated fair value of our fixed-rate debtTerm Loan outstanding at December 31, 2017.2023 by approximately $300,000.


Borrowings under our revolving credit noteDelayed Draw Term Loan and Line of Credit, if any, bear interest at a variable annualfloating rate with threeequal to the 30-day SOFR plus 235 basis points. Interest rate options atchanges for borrowings under our Delayed Draw Term Note and Line of Credit do not affect the discretionfair value of management.the related debt but affect future earnings and cash flows. Borrowings under the revolving credit noteLine of Credit and Delayed Draw Term Note may not exceed the $12.0 million.$30.0 million and $75.0 million, respectively. There were no borrowings outstanding under our revolving credit notethe Line of Credit at December 31, 2017, or2023. We had $19.0 million of borrowings outstanding under the Delayed Draw Term Note at any time during 2017. A sensitivity analysis assumingDecember 31, 2023. The change in interest expense resulting from a hypothetical 10% movement in interest rateschange of 100 basis points of the benchmark index rate applied to the average daily borrowings and the maximum borrowings available under the revolving credit note indicated that such a movementLine of Credit and the balance outstanding under the Delayed Draw Term Loan at December 31, 2023 would not have a material impact on our consolidated financial position, results of operationsincrease or decrease future earnings and cash flows.flows by approximately $370,000 annually.


Item 8.

Financial Statements and Supplementary Data

Quarterly Financial Data (Unaudited)

The following table sets forth selected financial information for each of the eight quarters in the two-year period ended December 31, 2017. This unaudited information has been prepared by the Company on the same basis as the consolidated financial statements and includes all normal recurring adjustments necessary to present fairly this information when read in conjunction with the Company’s audited consolidated financial statements and the notes thereto.


(In thousands, except per share data)


Quarter Ended


Dec. 31,

2017


Sept 30,

2017


June 30,

2017


Mar. 31,

2017


Dec. 31,

2016


Sept 30,

2016


June 30,

2016


Mar. 31,

2016


Revenue

 $29,897  $28,951  $28,435  $30,276  $28,368  $27,032  $26,114  $27,870 

Direct expenses

  12,362   12,267   11,939   12,500   11,836   11,468   10,734   11,539 

Selling, general and administrative expenses

  7,665   8,430   6,905   6,686   6,619   7,139   7,270   7,357 

Depreciation and amortization

  1,209   1,132   1,139   1,106   1,079   1,086   1,092   968 

Operating income

  8,661   7,122   8,452   9,984   8,834   7,339   7,018   8,006 

Other income (expense)

  (2)  51   19   (4)  171   (30)  18   -- 

Provision for income taxes

  2,142   3,020   2,719   3,459   3,280   2,580   2,478   2,500 

Net income

 $6,517  $4,153  $5,752  $6,521  $5,725  $4,729  $4,558  $5,506 

Earnings per share of common stock:


Basic earnings per share


Class A

 $0.15  $0.10  $0.14  $0.15  $0.14  $0.11  $0.11  $0.13 

Class B

 $0.93  $0.59  $0.82  $0.93  $0.82  $0.67  $0.65  $0.79 

Dilutive earnings per share


Class A

 $0.15  $0.09  $0.13  $0.15  $0.13  $0.11  $0.11  $0.13 

Class B

 $0.90  $0.57  $0.80  $0.91  $0.80  $0.66  $0.64  $0.77 

Weighted average shares outstanding – basic


Class A

  20,802   20,788   20,752   20,737   20,717   20,716   20,711   20,710 

Class B

  3,515   3,514   3,514   3,513   3,511   3,511   3,508   3,489 

Weighted average shares outstanding - diluted


Class A

  21,843   21,740   21,525   21,245   21,118   21,068   20,992   21,012 

Class B

  3,625   3,620   3,591   3,576   3,569   3,556   3,565   3,549 


Report of Independent Registered Public Accounting Firm


To the Shareholders and the Board of Directors

National Research Corporation:


OpinionOpinions on the ConsolidatedFinancial Statements and Internal Control Over Financial Reporting


We have audited the accompanying consolidated balance sheets of National Research Corporation and subsidiary (the “Company”)Company) as of December 31, 20172023 and 2016,2022, the related consolidated statements of income, comprehensive income, shareholders’ equity, and cash flows for each of the years in the three-year period ended December 31, 2017,2023, and the related notes (collectively, the consolidated financial statements.) statements). We also have audited the Company’s internal control over financial reporting as of December 31, 2023, based on criteria established in Internal Control Integrated Framework (2013) issued by the Committee of Sponsoring Organizations of the Treadway Commission.

In our opinion, the consolidated financial statements referred to above present fairly, in all material respects, the financial position of the Company as of December 31, 20172023 and 2016,2022, and the results of its operations and its cash flows for each of the years in the three-year period ended December 31, 2017,2023, in conformity with U.S. generally accepted accounting principles.

We also have audited, Also in accordance withour opinion, the standards of the Public Company Accounting Oversight Board (United States) (“PCAOB”), the Company’smaintained, in all material respects, effective internal control over financial reporting as of December 31, 2017,2023 based on criteria established in Internal Control Integrated Framework (2013) issued by the Committee of Sponsoring Organizations of the Treadway Commission, and our report dated March 14, 2018 expressed an unqualified opinion on the effectiveness of the Company’s internal control over financial reporting.Commission.


Basis for OpinionOpinions


TheseThe Company’s management is responsible for these consolidated financial statements, are the responsibilityfor maintaining effective internal control over financial reporting, and for its assessment of the Company’s management.effectiveness of internal control over financial reporting, included in the accompanying Management’s Report on Internal Control over Financial Reporting. Our responsibility is to express an opinion on thesethe Company’s consolidated financial statements and an opinion on the Company’s internal control over financial reporting based on our audits. We are a public accounting firm registered with the PCAOBPublic Company Accounting Oversight Board (United States) (PCAOB) and are required to be independent with respect to the Company in accordance with the U.S. federal securities laws and the applicable rules and regulations of the Securities and Exchange Commission and the PCAOB.


We conducted our audits in accordance with the standards of the PCAOB. Those standards require that we plan and perform the auditaudits to obtain reasonable assurance about whether the consolidated financial statements are free of material misstatement, whether due to error or fraud. fraud, and whether effective internal control over financial reporting was maintained in all material respects.

Our audits of the consolidated financial statements included performing procedures to assess the risks of material misstatement of the consolidated financial statements, whether due to error or fraud, and performing procedures that respond to those risks. Such procedures included examining, on a test basis, evidence regarding the amounts and disclosures in the consolidated financial statements. Our audits also included evaluating the accounting principles used and significant estimates made by management, as well as evaluating the overall presentation of the consolidated financial statements. Our audit of internal control over financial reporting included obtaining an understanding of internal control over financial reporting, assessing the risk that a material weakness exists, and testing and evaluating the design and operating effectiveness of internal control based on the assessed risk. Our audits also included performing such other procedures as we considered necessary in the circumstances. We believe that our audits provide a reasonable basis for our opinion.opinions.


Definition and Limitations of Internal Control Over Financial Reporting

A company’s internal control over financial reporting is a process designed to provide reasonable assurance regarding the reliability of financial reporting and the preparation of financial statements for external purposes in accordance with generally accepted accounting principles. A company’s internal control over financial reporting includes those policies and procedures that (1) pertain to the maintenance of records that, in reasonable detail, accurately and fairly reflect the transactions and dispositions of the assets of the company; (2) provide reasonable assurance that transactions are recorded as necessary to permit preparation of financial statements in accordance with generally accepted accounting principles, and that receipts and expenditures of the company are being made only in accordance with authorizations of management and directors of the company; and (3) provide reasonable assurance regarding prevention or timely detection of unauthorized acquisition, use, or disposition of the company’s assets that could have a material effect on the financial statements.

Because of its inherent limitations, internal control over financial reporting may not prevent or detect misstatements. Also, projections of any evaluation of effectiveness to future periods are subject to the risk that controls may become inadequate because of changes in conditions, or that the degree of compliance with the policies or procedures may deteriorate.

Critical Audit Matter

The critical audit matter communicated below is a matter arising from the current period audit of the consolidated financial statements that was communicated or required to be communicated to the audit committee and that: (1) relates to accounts or disclosures that are material to the consolidated financial statements and (2) involved our especially challenging, subjective, or complex judgments. The communication of a critical audit matter does not alter in any way our opinion on the consolidated financial statements, taken as a whole, and we are not, by communicating the critical audit matter below, providing a separate opinion on the critical audit matter or on the accounts or disclosures to which it relates.

Sufficiency of audit evidence over new and modified subscription-based service agreement terms

As discussed in Notes 1 and 3 to the consolidated financial statements, revenue consists of service arrangement contracts with customers that can include more than one separately identifiable performance obligation. The Company’s revenue for the year ended December 31, 2023 included $140.2 million for subscription-based service agreements, a portion of which was revenue from new and modified subscription-based service agreements, that was recognized ratably over the subscription period and which agreements are renewable at the option of the customer. Subscription-based service agreements represent a single promise to stand ready to provide reporting, tools and services throughout the subscription period.

We identified the evaluation of the sufficiency of audit evidence over the key terms within new and modified subscription-based service agreements as a critical audit matter. Specifically, the nature and extent of procedures performed over the key terms within the new and modified subscription-based service agreements required subjective auditor judgment as recognition of revenue by the Company is dependent on the accuracy of the key terms within the related information technology (IT) application used to calculate revenue. The key terms within the new subscription-based service agreements included the description of service, transaction price, renewal price and contract term, and the key terms within the modified subscription-based service agreements were the transaction price and contract term.

The following are the primary procedures we performed to address this critical audit matter. We applied auditor judgment to determine the nature and extent of procedures to be performed over the accuracy of key terms within the IT application, including the identification of key terms. We evaluated the design and tested the operating effectiveness of certain internal controls related to the Company’s subscription-based service revenue process, including controls related to the key terms within the new and modified subscription-based service agreements. We also tested certain internal controls over the accurate input of the underlying key terms of the subscription-based service agreement into the related IT application. For a sample of revenue transactions, we compared the key terms used in the revenue calculation to the underlying contract with the customer. We evaluated the sufficiency of audit evidence obtained over the key terms within new and modified subscription-based service agreements by assessing the results of procedures performed, including the appropriateness of the nature and extent of audit effort.


/s/ KPMG LLP


We have served as the Company’sCompany’s auditor since 1997.


Lincoln,Omaha, Nebraska

March 14, 2018
February 27, 2024


3028


NATIONAL RESEARCH CORPORATION AND SUBSIDIARY


Consolidated Balance SheetsNATIONAL RESEARCH CORPORATION AND SUBSIDIARY

CONSOLIDATED BALANCE SHEETS

(InIn thousands, except share amounts)


2017


2016


2023


2022

 
Assets                

Current assets:


Cash and cash equivalents

 $34,733  $33,021  $6,653  $25,026 

Trade accounts receivable, less allowance for doubtful accounts of $200 and $169, respectively

  13,343   10,864 

Unbilled revenue

  1,463   1,546 

Trade accounts receivable, less allowance for doubtful accounts of $75 and $65, respectively

 12,378  14,461 

Prepaid expenses

  2,310   1,585  4,228  2,386 

Income taxes receivable

  375   14  161  733 

Other current assets

  35   35   940   1,110 

Total current assets

  52,259   47,065  24,360  43,716 
         

Net property and equipment

  12,359   11,806  28,205  17,248 

Intangible assets, net

  2,764   3,124  1,471  1,611 

Goodwill

  58,021   57,861  61,614  61,614 

Operating lease right-of-use assets

 2,060  556 

Deferred contract costs, net

 1,453  2,441 

Deferred income taxes

   14 

Other

  1,913   768   3,274   3,261 
         

Total assets

 $127,316  $120,624  $122,437  $130,461 
         

Liabilities and Shareholders’ Equity


Current liabilities:


Current portion of notes payable

 $1,067  $2,683 

Current portion of notes payable, net of unamortized debt issuance costs

 $7,214  $4,491 

Accounts payable

  593   765  1,301  1,153 

Accrued wages, bonus and profit sharing

  6,597   4,543 

Accrued wages and bonuses

 3,953  4,551 

Accrued expenses

  2,882   3,069  4,893  3,983 

Current portion of capital lease obligations

  71   82 

Income taxes payable

  --   662 

Dividends payable

  4,222   4,213  2,906  2,956 

Deferred revenue

  16,878   15,497  14,834  15,198 

Income Taxes Payable

 222   

Other current liabilities

  880   1,085 

Total current liabilities

  32,310   31,514  36,203  33,417 
         

Notes payable, net of current portion

  -   857 

Notes payable, net of current portion and unamortized debt issuance costs

 29,470  17,690 

Deferred income taxes

  4,030   4,670  4,139  5,274 

Other long term liabilities

  935   777 

Other long-term liabilities

  3,670   2,047 

Total liabilities

  37,275   37,818  73,482  58,428 
         

Shareholders’ equity:


Preferred stock, $0.01 par value, authorized 2,000,000 shares, none issued

  --   -- 

Class A Common stock, $0.001 par value; authorized 60,000,000 shares, issued 25,835,230 in 2017 and 25,656,760 in 2016, outstanding 20,936,703 in 2017 and 20,891,069 in 2016

  26   26 

Class B Common stock, $0.001 par value; authorized 80,000,000 shares, issued 4,319,256 in 2017 and 4,308,875 in 2016, outstanding 3,535,238 in 2017 and 3,539,931 in 2016

  4   4 

Shareholders’ equity:


Preferred stock, $0.01 par value, authorized 2,000,000 shares, none issued


Common stock, $0.001 par value; authorized 110,000,000 shares, issued 31,002,919 in 2023 and 30,922,181 in 2022, outstanding 24,219,887 in 2023 and 24,628,173 in 2022

 31  31 

Additional paid-in capital

  51,025   46,725  178,213  175,453 

Retained earnings

  77,574   71,507 

Accumulated other comprehensive (loss) income, foreign currency translation adjustment

  (1,635)  (2,626)

Treasury stock, at cost; 4,898,527 Class A shares, 784,018 Class B shares in 2017 and 4,765,691 Class A shares, 768,944 Class B shares in 2016

  (36,953)  (32,830)

Total shareholders’ equity

  90,041   82,806 

Retained earnings (accumulated deficit)

 (30,530) (25,184)

Accumulated other comprehensive loss, foreign currency translation adjustment


Treasury stock, at cost; 6,783,032 Common shares in 2023 and 6,294,008 Common shares in 2022

  (98,759)  (78,267)

Total shareholders’ equity

  48,955   72,033 
         

Total liabilities and shareholders’ equity

 $127,316  $120,624 

Total liabilities and shareholders’ equity

 $122,437  $130,461 


See accompanying notes to consolidated financial statements.


3129


NATIONAL RESEARCH CORPORATION AND SUBSIDIARY


Consolidated Statements of IncomeNATIONAL RESEARCH CORPORATION AND SUBSIDIARY

CONSOLIDATED STATEMENTS OF INCOME

(InIn thousands, except share amounts)


2017


2016


2015


2023


2022


2021


Revenue

 $117,559  $109,384  $102,343  $148,580  $151,568  $147,954 
             

Operating expenses:


Direct

  49,068   45,577   44,610  56,015  57,049  52,350 

Selling, general and administrative

  29,686   28,385   27,177  46,621  42,699  38,960 

Depreciation and amortization

  4,586   4,225   4,109 

Depreciation, amortization and impairment

  5,899   5,277   6,374 

Total operating expenses

  83,340   78,187   75,896   108,535   105,025   97,684 
             

Operating income

  34,219   31,197   26,447   40,045   46,543   50,270 
             

Other income (expense):


Interest income

  96   47   60  820  168  14 

Interest expense

  (82)  (190)  (220) (862) (1,209) (1,667)

Reclassification of cumulative foreign currency translation adjustment into earnings

   (2,569)  

Other, net

  50   302   1,073   (41)  (118)  4 
             

Total other income

  64   159   913 

Total other income (expense)

  (83)  (3,728)  (1,649)
             

Income before income taxes

  34,283   31,356   27,360  39,962  42,815  48,621 
             

Provision for income taxes

  11,340   10,838   9,750   8,991   11,015   11,155 
             

Net income

 $22,943  $20,518  $17,610  $30,971  $31,800  $37,466 
        

Earnings per share of common stock:

             
Basic earnings per share:       

Class A

 $0.54  $0.49  $0.42 

Class B

 $3.26  $2.93  $2.52 
Diluted earnings per share:            

Class A

 $0.52  $0.48  $0.41 

Class B

 $3.18  $2.88  $2.49 

Basic earnings per share

 $1.26  $1.28  $1.47 

Diluted earnings per share

 $1.25  $1.27  $1.46 
             

Weighted average shares and share equivalents outstanding


Class A - basic

  20,770   20,713   20,741 

Class B - basic

  3,514   3,505   3,478 

Class A - diluted

  21,627   21,037   20,981 

Class B - diluted

  3,603   3,560   3,522 

Basic

  24,540   24,922   25,422 

Diluted

  24,673   25,052   25,640 


See accompanying notes to consolidated financial statements.

30

NATIONAL RESEARCH CORPORATION AND SUBSIDIARY

CONSOLIDATED STATEMENTS OF COMPREHENSIVE INCOME

(In thousands)


2023


2022


2021


Net income

 $30,971  $31,800  $37,466 
             

Other comprehensive income (loss):


Cumulative foreign currency translation adjustment

 $  $(194) $24 

Reclassification of cumulative foreign currency translation into earnings

     2,569    

Other comprehensive income (loss)

 $  $2,375  $24 
             

Comprehensive income

 $30,971  $34,175  $37,490 

See accompanying notes to consolidated financial statements.

31

NATIONAL RESEARCH CORPORATION AND SUBSIDIARY

CONSOLIDATED STATEMENTS OF SHAREHOLDERS EQUITY

(In thousands except share and per share amounts)


Common

Stock


Additional

Paid-in

Capital


Retained

Earnings

(Accumulated

Deficit)


Accumulated

Other

Comprehensive

Income (Loss)


Treasury

Stock


Total


Balances at December 31, 2020

 $31  $171,785  $(61,375) $(2,399) $(43,727) $64,315 

Purchase of 153,005 shares treasury stock

              (6,422)  (6,422)

Issuance of 116,753 common shares for the exercise of stock options

     1,534            1,534 

Non-cash stock compensation expense

     623            623 

Dividends declared of $0.48 per common share

        (12,203)        (12,203)

Other comprehensive income, foreign currency translation adjustment

           24      24 

Net income

        37,466         37,466 

Balances at December 31, 2021

 $31  $173,942  $(36,112) $(2,375) $(50,149) $85,337 

Purchase of 756,817 shares treasury stock

              (28,118)  (28,118)

Issuance of 23,581 common shares for the exercise of stock options

     311            311 

Non-cash stock compensation expense

     1,200            1,200 

Dividends declared of $0.84 per common share

        (20,872)        (20,872)

Other comprehensive income, foreign currency translation adjustment

           (194)     (194)

Reclassification of cumulative foreign currency translation adjustment into earnings

           2,569      2,569 

Net income

        31,800         31,800 

Balances at December 31, 2022

 $31  $175,453  $(25,184) $  $(78,267) $72,033 

Purchase of 489,024 shares treasury stock

              (20,492)  (20,492)

Issuance of 87,378 common shares for the exercise of stock options

     1,825            1,825 

Non-cash stock compensation expense

     935            935 

Dividends declared of $1.48 per common share

        (36,317)        (36,317)

Net income

        30,971         30,971 

Balances at December 31, 2023

 $31  $178,213  $(30,530) $  $(98,759) $48,955 

See accompanying notes to consolidated financial statements.


32


NATIONAL RESEARCH CORPORATION AND SUBSIDIARY


Consolidated Statements of comprehensive incomeNATIONAL RESEARCH CORPORATION AND SUBSIDIARY

CONSOLIDATED STATEMENTS OF CASH FLOWS

(In thousands)In thousands)


2017


2016


2015


Net Income

 $22,943  $20,518  $17,610 
             

Other comprehensive income (loss):


Cumulative translation adjustment

 $991  $369  $(2,222)

Other comprehensive income (loss)

 $991  $369  $(2,222)
             

Comprehensive Income

 $23,934  $20,887  $15,388 
  

2023


2022


2021


Cash flows from operating activities:


Net income

 $30,971  $31,800  $37,466 

Adjustments to reconcile net income to net cash provided by operating activities:


Depreciation, amortization and impairment

  5,899   5,277   6,374 

Reclassification of cumulative translation adjustment into earnings

     2,569    

Deferred income taxes

  (1,121)  (1,729)  (277)

Reserve for uncertain tax positions

  404   488   310 

Loss on disposal of property and equipment

     11   7 

Non-cash share-based compensation expense

  935   1,200   623 

Change in assets and liabilities:


Trade accounts receivable

  2,084   (733)  343 

Prepaid expenses and other current and long-term assets

  (1,767)  1,634   (842)

Operating lease assets and liability, net

  (127)  (39)  (34)

Deferred contract costs, net

  988   1,331   783 

Accounts payable

  184   (589)  4 

Accrued expenses, wages and bonuses

  (768)  (2,947)  (285)

Income taxes receivable and payable

  795   6   484 

Deferred revenue

  (364)  (2,014)  1,388 

Net cash provided by operating activities

  38,113   36,265   46,344 
             

Cash flows from investing activities:


Purchases of property and equipment

  (15,779)  (9,835)  (5,514)

Acquisition consideration

        (3,000)

Proceeds from the sale of property and equipment

  1       

Net cash used in investing activities

  (15,778)  (9,835)  (8,514)
             

Cash flows from financing activities:


Payments on notes payable

  (4,528)  (4,305)  (4,093)

Payment of debt issuance costs

  (8)  (92)   

Borrowings on notes payable

  19,000       

Borrowings on line of credit

  15,000       

Payments on line of credit

  (15,000)      

Payments on finance lease obligations

  (290)  (469)  (493)

Proceeds from the exercise of stock options

  584      446 

Payment of payroll tax withholdings on share-based awards exercised

     (190)  (721)

Payment of deferred acquisition consideration

     (1,950)   

Repurchase of shares for treasury

  (19,099)  (27,616)  (4,142)

Payment of dividends on common stock

  (36,366)  (20,961)  (9,159)

Net cash used in financing activities

  (40,707)  (55,583)  (18,162)
             

Effect of exchange rate changes on cash

  (1)  (182)  3 

Net increase (decrease) in cash and cash equivalents

  (18,373)  (29,335)  19,671 

Cash and cash equivalents at beginning of period

  25,026   54,361   34,690 

Cash and cash equivalents at end of period

 $6,653  $25,026  $54,361 
             

Supplemental disclosure of cash paid for:


Interest expense, net of capitalized amounts

 $803  $1,227  $1,684 

Income taxes

 $8,932  $12,233  $10,644 

Supplemental disclosure of non-cash investing and financing activities:


Finance lease obligations originated for property and equipment

 $  $  $40 

Purchase of property and equipment in accounts payable and accrued expenses

 $2,066  $1,109  $979 

Stock tendered to the Company for cashless exercise of stock options in connection with equity incentive plans

 $1,241  $311  $1,088 

Repurchase of shares for treasury in accounts payable and accrued expenses

 $152  $  $ 

Deferred acquisition consideration

 $  $  $1,950 


See accompanying notes to consolidated financial statements.


33

Table of Contents

NATIONAL RESEARCH CORPORATION AND SUBSIDIARY

Consolidated Statements of Shareholders’ Equity
(In thousands except share and per share amounts)


Common
Stock
A


Common
Stock
B


Additional
Paid-in
Capital


Retained
Earnings


Accumulated

Other
Comprehensive
Income
(Loss)


Treasury

Stock


Total


Balances at December 31, 2014

 $25  $4  $44,864  $73,686  $(773) $(30,058) $87,748 

Purchase of 163,268 shares of class A and 4,239 shares of class B treasury stock

  --   --   --   --   --   (2,171)  (2,171)

Issuance of 43,983 class A common shares and 7,330 class B shares for the exercise of stock options

  --   --   406   --   --   --   406 

Tax benefit from the exercise of options and restricted stock

  --   --   240   --   --   --   240 

Issuance of restricted common shares, net of forfeitures (73,168 class A and 12,194 class B)

  1   --   (1)  --   --   --   -- 

Non-cash stock compensation expense

  --   --   1,383   --   --   --   1,383 

Dividends declared of $0.62 and $3.72 per A and B common share, respectively

  --   --   --   (25,983)  --   --   (25,983)

Acquisition of non-controlling interest

  --   --   (2,789)  --   --   --   (2,789)

Other comprehensive loss, foreign currency translation adjustment

  --   --   --   --   (2,222)  --   (2,222)

Net income

  --   --   --   17,610   --   --   17,610 

Balances at December 31, 2015

 $26  $4  $44,103  $65,313  $(2,995) $(32,229) $74,222 

Purchase of 21,047 shares of class A and 7,681 shares of class B treasury stock

  --   --   --   --   --   (601)  (601)

Issuance of 52,383 class A common shares and 35,534 class B shares for the exercise of stock options

  --   --   945   --   --   --   945 

Issuance of restricted common shares, net of forfeitures (11,565 class A and 1,928 class B)

  --   --   --   --   --   --   -- 

Non-cash stock compensation expense

  --   --   1,929   --   --   --   1,929 

Dividends declared of $0.34 and $2.04 per A and B common share, respectively

  --   --   --   (14,324)  --   --   (14,324)

Acquisition of non-controlling interest

  --   --   (252)  --   --   --   (252)

Other comprehensive income, foreign currency translation adjustment

  --   --   --   --   369   --   369 

Net income

  --   --   --   20,518   --   --   20,518 

Balances at December 31, 2016

 $26  $4  $46,725  $71,507  $(2,626) $(32,830) $82,806 

Purchase of 132,836 shares of class A and 15,074 shares of class B treasury stock

  --   --   --   --   --   (4,123)  (4,123)

Issuance of 197,784 class A common shares and 13,600 class B shares for the exercise of stock options

  --   --   2,455   --   --   --   2,455 

Issuance of restricted common shares, net of forfeitures (19,314 class A and 3,219 class B)

  --   --   --   --   --   --   -- 

Non-cash stock compensation expense

  --   --   1,845   --   --   --   1,845 

Dividends declared of $0.40 and $2.40 per A and B common share, respectively

  --   --   --   (16,876)  --   --   (16,876)

Other comprehensive income, foreign currency translation adjustment

  --   --   --   --   991   --   991 

Net income

  --   --   --   22,943   --   --   22,943 

Balances at December 31, 2017

 $26  $4  $51,025  $77,574  $(1,635) $(36,953) $90,041 

See accompanying notes to consolidated financial statements.

34

NATIONAL RESEARCH CORPORATION AND SUBSIDIARY

Consolidated Statements of Cash Flows
(In thousands)


2017


2016


2015


Cash flows from operating activities:


Net income

 $22,943  $20,518  $17,610 

Adjustments to reconcile net income to net cash provided by operating activities:


Depreciation and amortization

  4,586   4,225   4,109 

Deferred income taxes

  (684)  798   (1,387)

Reserve for uncertain tax positions

  181   73   119 

Loss on disposal of property and equipment

  26   22   - 

Gain on sale from operating segment

  --   (223)  (1,102)

Write-off of purchase option

  --   --   657 

Tax benefit from exercise of stock options

  --   --   25 

Non-cash share-based compensation expense

  1,845   1,929   1,383 

Change in assets and liabilities, net of effect of acquisition and disposal:


Trade accounts receivable

  (2,463)  (1,044)  (1,777)

Unbilled revenue

  123   (93)  (390)

Prepaid expenses and other current assets

  (565)  (535)  207 

Accounts payable

  12   (15)  (224)

Accrued expenses, wages, bonus and profit sharing

  1,759   440   755 

Income taxes receivable and payable

  (1,023)  105   1,504 

Deferred revenue

  1,351   643   397 

Net cash provided by operating activities

  28,091   26,843   21,886 
             

Cash flows from investing activities:


Purchases of property and equipment

  (4,568)  (3,973)  (2,939)

Purchase of equity investment

  (1,300)  --   -- 

Purchase of intangible content license

  (250)  --   -- 

Net proceeds from sale of operating segment

  --   223   1,613 

Net cash used in investing activities

  (6,118)  (3,750)  (1,326)
             

Cash flows from financing activities:


Payments on notes payable

  (2,473)  (2,199)  (2,328)

Payments on capital lease obligations

  (108)  (95)  (173)

Cash paid for non-controlling interest

  --   (2,000)  (2,789)

Proceeds from exercise of stock options

  --   548   - 

Excess tax benefit from share-based compensation

  --   -   240 

Repurchase of shares for payroll tax withholdings related to share-based compensation

  (1,668)  (204)  (92)

Purchase of Treasury Stock

  --   --   (1,673)

Payment of dividends on common stock

  (16,867)  (28,552)  (10,054)

Net cash used in financing activities

  (21,116)  (32,502)  (16,869)
             

Effect of exchange rate changes on cash

  855   285   (1,588)

Net increase (decrease) in cash and cash equivalents

  1,712   (9,124)  2,103 
             

Cash and cash equivalents at beginning of period

  33,021   42,145   40,042 
             

Cash and cash equivalents at end of period

 $34,733  $33,021  $42,145 
             

Supplemental disclosure of cash paid for:


Interest expense, net of $0, $10, and $14 capitalized, respectively

 $76  $192  $207 

Income taxes

 $12,827  $9,963  $9,377 

Supplemental disclosure of non-cash investing and financing activities:


Capital lease obligations originated for property and equipment

 $74  $109  $32 

Stock tendered to the Company for cashless exercise of stock options in connection with equity incentive plans

 $2,455  $397  $406 

See accompanying notes to consolidated financial statements.

35

Table of Contents


NATIONAL RESEARCH CORPORATION AND SUBSIDIARY

Notes to Consolidated Financial Statements

NOTES TO CONSOLIDATED FINANCIAL STATEMENTS


(1)

Summary of Significant Accounting Policies


Description of Business and Basis of Presentation


National Research Corporation,, doing business as NRC Health (“NRC Health,” the “Company,” “we,” “our,” “us” or similar terms), is a leading provider of analytics and insights that facilitate measurement and improvement of the patient and employee experience while also increasing patient engagement and customer loyalty for healthcare providers, payers and other healthcare organizations in the United StatesStates. Our purpose is to humanize healthcare and Canada. The Company’ssupport organizations in their understanding of each person they serve not as point-in-time insights, but as an ongoing relationship. We believe that understanding the story is the key to unlocking the highest-quality and truly personalized care. Our end-to-end solutions enable its clientshealth care organizations to understand what matters most to each person they serve – before, during, after, and outside of clinical encounters – to gain a longitudinal understanding of how life and health intersect, with the voicegoal of the customer with greater clarity, immediacydeveloping lasting, trusting relationships. Our portfolio of solutions represents a unique set of capabilities that individually and depth.collectively provide value to our clients.


Principles of Consolidation


The consolidated financial statements include the accounts of the Company and itsour wholly-owned subsidiary, National Research Corporation Canada. Prior to becoming a wholly-owned subsidiary in March 2016, the accounts of Customer-Connect LLC (“Connect”), then a variable interest entity for which NRC Health was deemed the primary beneficiary, were included in the consolidated financial statements of the Company. On June 30, 2016, Customer-Connect LLC was dissolved. All significant intercompany transactions and balances have been eliminated.


Use of Estimates


The preparation of financial statements in conformity with accounting principles generally accepted in the United States of America requires management to make certain estimates and assumptions that affect the reported amounts of assets and liabilities at the date of the financial statements and the reported amounts of revenue and expenses during the reporting period. Actual results could differ from those estimates.


Translation of Foreign Currencies


The Company’s Canadian subsidiary uses as its functional currency the local currency of the country in which it operates. It translates its assets and liabilities into U.S. dollars at the exchange rate in effect at the balance sheet date. It translates its revenue and expenses at the average exchange rate during the period. The Company includes translation gains and losses in accumulated other comprehensive income (loss), a component of shareholders’ equity. Gains and losses related to transactions denominated in a currency other than the functional currency of the country in which the Company operateswe operate and short-term intercompany accounts are included in other income (expense) in the consolidated statements of income.


Revenue Recognition Our Canadian subsidiary uses Canadian dollars as its functional currency. We translate its assets and liabilities into U.S. dollars at the exchange rate in effect at the balance sheet date. We translate its revenue and expenses at the average exchange rate during the period. We included foreign currency translation gains and losses in accumulated other comprehensive income (loss), a component of shareholders’ equity. During December 2022, we substantially liquidated our investment in Canada. As a result, we reclassified the cumulative foreign currency translation adjustment balance into earnings and recognized a net cumulative foreign currency translation loss of $2.6 million, which is included in Other income (expense), net in our Consolidated Statements of Income. Any future currency changes after 2022 are recognized in Other income (expense), net in our Consolidated Statements of Income.


The Company derives

Revenue Recognition

We derive a majority of its operating revenueour revenues from itsour annually renewable services,subscription-based service agreements with our customers, which include performance measurement and improvement services, healthcare analytics and governance education services. The Company provides these services to its clients under annual client service contracts, although such contractsSuch agreements are generally cancelable on short or no notice without penalty. Services are provided under subscription-based service agreements. The Company recognizes subscription-based serviceSee Note 3 for further information about our contracts with customers. We account for revenue overusing the period of time the service is provided. Generally, the subscription periods are for twelve months and revenue is recognized equally over the subscription period.following steps:


Certain contracts, excluding subscription-based service agreements, are fixed-fee arrangements with a portion of the project fee billed in advance and the remainder billed periodically over the duration of the project. Revenue for services provided under these contracts are recognized under the proportional performance method. Under the proportional performance method, the Company recognizes revenue based on output measures or key milestones such as survey set-up, survey mailings, survey returns and reporting. The Company measures its progress based on the level of completion of these output measures and recognizes revenue accordingly. Management judgments and estimates must be made and used in connection with revenue recognized using the proportional performance method. If management made different judgments and estimates, then the amount and timing of revenue for any period could differ materially from the reported revenue.

Identify the contract, or contracts, with a customer;

Identify the performance obligations in the contract;

Determine the transaction price;

Allocate the transaction price to the identified performance obligations; and

Recognize revenue when, or as, we satisfy the performance obligations.


3634

The Company’sOur revenue arrangements with a client may include combinations of NRC Health’s Experience, Transparency, Governance, and Market Insights solutionsmore than one service offering which may be executed at the same time, or within close proximity of one another (referred to as a multiple-element arrangement). Whenanother. We combine contracts with the periods or patterns of revenue recognition differ, each element of a multiple-element arrangement is accounted for as a separate unit of accounting provided each delivered element is sold separately by the Company or another vendor; and for an arrangement that includes a general right of return relative to the undelivered elements, delivery or performance of the undelivered services are considered probable and substantially in the control of the Company. The Company’s arrangements generally do not include a general right of return related to the delivered services. If these criteria are not met, the arrangement is accounted for assame customer into a single unit ofcontract for accounting with revenue generally recognized equally overpurposes when the subscription periodcontract is entered into at or recognized undernear the proportionalsame time and the contracts are negotiated together. For contracts that contain more than one separately identifiable performance method.


When a contract contains multiple elements, revenueobligation, the total transaction price is allocated to each separate unitthe identified performance obligations based upon the relative stand-alone selling prices of accountingthe performance obligations. The stand-alone selling prices are based on relativean observable price for services sold to other comparable customers, when available, or an estimated selling price using a selling price hierarchy: vendor-specific objective evidence (“VSOE”), if available, third-party evidence (“TPE”) if VSOE is not available,cost-plus margin or estimated selling price if VSOE nor TPE is available. VSOE is establishedresidual approach. We estimate the amount of total contract consideration we expect to receive for variable arrangements based on the most likely amount we expect to earn from the arrangement based on the expected quantities of services normal sellingwe expect to provide and the contractual pricing based on those quantities. We only include some or a portion of variable consideration in the transaction price when it is probable that a significant reversal in the amount of cumulative revenue recognized will not occur. We consider the sensitivity of the estimate, our relationship and discounts forexperience with the specificclient and variable services being performed, the range of possible revenue amounts and the magnitude of the variable consideration to the overall arrangement. Our revenue arrangements do not contain any significant financing element due to the contract terms and the timing between when sold separately. TPEconsideration is established by evaluating similar competitorreceived and when the service is provided.

Our arrangements with customers consist principally of four different types of arrangements: 1) subscription-based service agreements; 2) one-time specified services performed at a single point in standalone arrangements. If neither existstime; 3) fixed, non-subscription service agreements; and 4) unit-priced service agreements.

Subscription-based services Services that are provided under subscription-based service agreements are usually for a deliverable,twelve- month period and represent a single promise to stand ready to provide reporting, tools and services throughout the best estimatesubscription period as requested by the customer. These agreements are renewable at the option of the selling price (“ESP”) is used for that deliverable based on list price, representing a component of management’s market strategy, and an analysis of historical prices for bundled and standalone arrangements. Revenue allocated to an element is limited to revenue that is not subject to refund or otherwise represents contingent revenue. VSOE, TPE and ESP are periodically adjusted to reflect current market conditions. These adjustments are not expected to differ significantly from historical results.

Business Combinations

The Company uses the acquisition method of accounting for acquired businesses. Under the acquisition method, the financial statements reflect the operations of an acquired business starting fromcustomer at the completion of the acquisition. The assets acquiredinitial contract term for an agreed upon price increase each year. These agreements represent a series of distinct monthly services that are substantially the same, with the same pattern of transfer to the customer as the customer receives and liabilities assumedconsumes the benefits throughout the contract period. Accordingly, subscription services are recorded at their respective estimated fair valuesrecognized ratably over the subscription period. Subscription services are typically billed either annually or quarterly in advance but may also be billed on a monthly basis.

One-time services These agreements typically require us to perform a specific one-time service in a particular month. We are entitled to a fixed payment upon completion of the service. Under these arrangements, we recognize revenue at the point in time we complete the service and it is accepted by the customer.

Fixed, non-subscription services These arrangements typically require us to perform an unspecified amount of services for a fixed price during a fixed period of time. Revenues are recognized over time based upon the costs incurred to date ofin relation to the acquisition. Any excess of the purchase price over thetotal estimated fair values of the identifiable net assets acquiredcontract costs. In determining cost estimates, management uses historical and forecasted cost information which is recorded as goodwill. Significant judgment is requiredbased on estimated volumes, external and internal costs and other factors necessary in estimating the fair valuetotal costs over the term of assets acquired, especially intangible assets. Asthe contract. Changes in estimates are accounted for using a result,cumulative catch-up adjustment which could impact the amount and timing of revenue for any period.

Unit-price services These arrangements typically require us to perform certain services on a periodic basis as requested by the customer for a per-unit amount which is typically billed in the casemonth following the performance of significant acquisitions the Company typically engagesservice. Revenue under these arrangements is recognized over the time the services are performed at the per-unit amount.

Revenue is presented net of any sales tax charged to our clients that we are required to remit to taxing authorities. We recognize contract assets or unbilled receivables related to revenue recognized for services completed but thirdnot-party valuation specialists invoiced to the clients. Unbilled receivables are classified as receivables when we have an unconditional right to contract consideration. A contract liability is recognized as deferred revenue when we invoice clients in estimating fair valuesadvance of tangible and intangible assets. The fair value estimates are based on available historical information and on expectations and assumptions aboutperforming the future, consideringrelated services under the perspectiveterms of marketplace participants.a contract. Deferred revenue is recognized as revenue when we have satisfied the related performance obligation.


3735

Deferred Contract Costs


Deferred contract costs, net is stated at gross deferred costs less accumulated amortization. We defer commissions and incentives, including payroll taxes, if they are incremental and recoverable costs of obtaining a renewable customer contract. Deferred contract costs are amortized over the estimated term of the contract, including renewals, which generally ranges from three to five years. The contract term was estimated by considering factors such as historical customer attrition rates and product life. The amortization period is adjusted for significant changes in the estimated remaining term of a contract. An impairment of deferred contract costs is recognized when the unamortized balance of deferred contract costs exceeds the remaining amount of consideration we expect to receive net of the expected future costs directly related to providing those services. We have elected the practical expedient to expense contract costs when incurred for any nonrenewable contracts with a term of one year or less. We deferred incremental costs of obtaining a contract of $395,000, $454,000 and $1.9 million in the years ended December 31, 2023, 2022 and 2021, respectively. Deferred contract costs, net of accumulated amortization was $1.5 million and $2.4 million at December 31, 2023 and 2022, respectively. Total amortization by expense classification for the years ended December 31, 2023, 2021 and 2021 was as follows:


2023


2022


2021


(In thousands)


Direct expenses

 $181  $146  $157 

Selling, general and administrative expenses

 $1,161  $1,625  $2,494 

Total amortization

 $1,342  $1,771  $2,651 

Additional expense included in selling, general and administrative expenses for impairment of costs capitalized due to lost clients was $41,000, $14,000 and $31,000 for the years December 31, 2023, 2022 and 2021, respectively.

Trade Accounts Receivable


Trade accounts receivable are recorded at the invoiced amount. The allowance for doubtful accounts is the Company’sour best estimate of the amount of probable credit losses in the Company’sour existing accounts receivable. The Company determines the allowancereceivable, determined based on the Company’sour historical write-off experience, and current economic conditions. The Company reviewsconditions and reasonable and supportable forecasts about the future. We review the allowance for doubtful accounts monthly. Account balances are charged off against the allowance after all means of collection have been exhausted and the potential for recovery is considered remote.

The following table provides the activity in the allowance for doubtful accounts for the years ended December 31, 2017,2023, 20162022 and 2015:2021 (in thousands):


Balance at

Beginning

of Year


Bad Debt

Expense


Write-offs

Net of

Recoveries


Balance

at End

of Year


(In thousands)


Year Ended December 31, 2015

 $206  $111  $144  $173 

Year Ended December 31, 2016

 $173  $218  $222  $169 

Year Ended December 31, 2017

 $169  $249  $218  $200 
  

Balance at

Beginning of

Period


Bad Debt

Expense


Write-offs


Recoveries


Balance at

End of

Period


Year Ended December 31, 2021

 $120  $38  $76  $12  $94 

Year Ended December 31, 2022

 $94  $19  $50  $2  $65 

Year Ended December 31, 2023

 $65  $99  $99  $10  $75 


Property and Equipment


Property and equipment is stated at cost. Major expenditures to purchase property or to substantially increase useful lives of property are capitalized. Maintenance, repairs and minor renewals are expensed as incurred. When assets are retired or otherwise disposed of, their costs and related accumulated depreciation are removed from the accounts and resulting gains or losses are included in income.


The Company capitalizesWe capitalize certain costs incurred in connection with obtaining or developing internal-use software, including payroll and payroll-related costs for employees who are directly associated with the internal-use software projects and external direct costs of materials and services. Capitalization of such costs ceases when the project is substantially complete and ready for its intended purpose. Costs incurred during the preliminary project and post-implementation stages, as well as software maintenance and training costs are expensed as incurred. The CompanyWe capitalized approximately $3.0$4.3 million, $3.6 million and $2.5$2.8 million of costs incurred for the development of internal-use software for the years ended December 31, 20172023, 2022and 2016,2021, respectively.

36

When a software license is included in a cloud computing arrangement and we have the legal right, ability and feasibility to download the software, it is accounted for as software, included in property and equipment, and amortized. If a software license is not included or we do not have the ability or feasibility to download software included in a cloud computing arrangement, it is accounted for as a service contract, which is expensed to direct expenses or selling, general and administrative expenses during the service period.


The Company providesWe provide for depreciation and amortization of property and equipment using annual rates which are sufficient to amortize the cost of depreciable assets over their estimated useful lives. The Company usesWe use the straight-line method of depreciation and amortization over estimated useful lives of threetwo to ten years for furniture and equipment, three to five years for computer equipment, one to five years for capitalized software, and seven to forty years for the Company’sour office building and related improvements. Software licenses are amortized over the term of the license.


Leases are categorized as operating or capital at the inception of the lease. Assets under capital lease obligations are reported at the lower of fair value or the present value of the aggregate future minimum lease payments at the beginning of the lease term. The Company depreciates capital lease assets without transfer-of-ownership or bargain-purchase-options using the straight-line method over the lease terms, excluding any lease renewals, unless the lease renewals are reasonably assured. Capital lease assets with transfer-of-ownership or bargain-purchase-options are depreciated using the straight-line method over the assets’ estimated useful lives.

Impairment of Long-LivedLong-Lived Assets and Amortizing Intangible Assets


Long-lived assets, such as property and equipment and purchased intangible assets subject to depreciation or amortization, are reviewed for impairment whenever events or changes in circumstances indicate that the carrying amount of an asset may not be recoverable. If circumstances require a long-lived asset or asset group be tested for possible impairment, the Companywe first comparescompare undiscounted cash flows expected to be generated by that asset or asset group to its carrying value. If the carrying value of the long-lived asset or asset group is not recoverable on an undiscounted cash flow basis, an impairment is recognized to the extent that the carrying value exceeds its fair value. Fair value is determined through various valuation techniques including discounted cash flow models, quoted market values and third-party independent appraisals, as considered necessary. No significant impairments were recorded during the years ended December 31, 2017,2023, 2016,2022, or 2015.2021.


Among others, managementmanagement believes the following circumstances are important indicators of potential impairment of such assets and as a result may trigger an impairment review:


Significant underperformance in comparison to historical or projected operating results;


Significant changes in the manner or use of acquired assets or the Company’sour overall strategy;


Significant negative trends in the Company’sour industry or the overall economy;


A significant decline in the market price for the Company’sour common stock for a sustained period; and


The Company’sOur market capitalization falling below the book value of the Company’sour net assets.


Goodwill and Intangible Assets


Intangible assets include customer relationships, trade names, technology, non-compete agreements and goodwill. Intangible assets with estimable useful lives are amortized over their respective estimated useful lives to their estimated residual values and reviewed for impairment whenever events or changes in circumstances indicate that the carrying amount of the assets may not be recoverable. The Company reviewsWe review intangible assets with indefinite lives for impairment annually as of October 1 and whenever events or changes in circumstances indicate that the carrying value of an asset may not be recoverable.


37

When performing the impairment assessment, the Companywe will first assess qualitative factors to determine whether it is necessary to recalculatedetermine the fair value of the intangible assets with indefinite lives. If the Company believes,we believe, as a result of the qualitative assessment, that it is more likely than not that the fair value of the indefinite-lived intangiblesan indefinite-lived intangible is less than theirits carrying amount, the Company calculateswe calculate the fair value using a market or income approach. If the carrying value of the indefinite-lived intangible assets with indefinite livesasset exceeds theirits fair value, then the intangible assets areasset is written-down to theirits fair values. The Companyvalue. We did not recognize any impairments related to indefinite-lived intangibles during 2017,2023, 20162022 or 2015.2021.


Goodwill is an asset representing the future economic benefits arising from other assets acquired in a business combination that are not individually identified and separately recognized. All of the Company’sour goodwill is allocated to itsour reporting units,unit, which areis the same as itsour operating segments.segment. Goodwill is reviewed for impairment at least annually, as of October 1, and whenever events or changes in circumstances indicate that the carrying value of goodwill may not be recoverable.


In January 2017, the FASB issued Accounting Standards Update (“ASU”) 2017-04,Intangibles—Goodwill and Other (Topic 350), Simplifying the TestWe review goodwill for Goodwill Impairment (“ASU 2017-04”). In connection with the October 1, 2017 annual impairment analysis, the Company early adopted ASU 2017-04, which eliminates the need to determine the fair value of individual assets and liabilities of a reporting unit to measure goodwill impairment (Step 2). The new guidance may result in more or less impairment than could previously be recognized. The adoption of this guidance did not impact the Company's results of operations or financial position since only a qualitative analysis was performed as part of the October 1, 2017 annual impairment analysis.

The Company reviews for goodwill impairment by first assessing qualitative factors to determine whether any impairment may exist. If the Company believes,we believe, as a result of the qualitative assessment, that it is more likely than not that the fair value of a reporting unit is less than its carrying amount, a quantitative analysis will be performed, and the fair value of the reporting unit is compared with its carrying value (including goodwill). If the faircarrying value of the reporting unit exceeds its carryingthe fair value, then goodwill is written down by this difference. The CompanyWe performed a qualitative analysis as of October 1, 20172023 and determined the fair value of eachour reporting unit likely significantly exceeded itsthe carrying value. At December 31, 2023, we assessed our current market capitalization compared to book value, forecasts and margins in our last quantitative impairment testing. We concluded that a triggering event has not occurred which would require an additional interim impairment test to be performed as it is not more likely than not that an impairment loss had been incurred at December 31, 2023. No impairments were recorded during the years ended December 31, 2017,2023, 20162022, or 2015.2021.


our reporting units likely exceeded the carrying values and no impairments were recorded.


Income Taxes


The Company usesWe use the asset and liability method of accounting for income taxes. Under that method, deferred income tax assets and liabilities are recognized for the future tax consequences attributable to differences between the financial statement carrying amounts of existing assets and liabilities and their respective tax basisbasis using enacted tax rates. The effect on deferred tax assets and liabilities of a change in tax rates is recognized in income in the period that includes the enactment date. Valuation allowances, if any, are established when necessary to reduce deferred tax assets to the amount that is more likely than not to be realized. The Company usesWe use the deferral method of accounting for itsour investment tax credits related to state tax incentives. During the years ended December 31, 2017,2023, 20162022, and 2015,2021, the Companywe recorded income tax benefits relating to these tax credits of $4,000,$77,000,$2,000, $36,000, and $156,000,$10,000, respectively. Interest and penalties related to income taxes are included in income taxes in the Consolidated Statements of Income.


The Company recognizesWe recognize the effect of income tax positions only if those positions are more likely than not of being sustained. Recognized income tax positions are measured at the largest amount that is greater than 50% likely of being realized. Changes in recognition or measurement are reflected in the period in which the change in judgment occurs.


In 2021, we adopted ASU 2019-12, Simplifying the Accounting for Income Taxes (Topic 740). Among other clarifications and simplifications related to income tax accounting, this ASU simplifies the accounting for income taxes by eliminating certain exceptions related to the approach for intraperiod tax allocation, the methodology for calculating income taxes in an interim period, hybrid taxes and the recognition of deferred tax liabilities for outside basis differences.  The adoption of this standard had no material impact to our consolidated financial statements.

38

Share-Based Compensation


The compensation expense on share-based payments is recognized based on the grant-date fair value of those awards. All of the Company’sour existing stock option awards and non-vested stock awards have been determined to be equity-classified awards. The Company prospectively elected ASU 2016-09, Compensation – Stock Compensation (Topic 718) Improvements to Employee Share-Based Payment Accounting (“ASU 2016-09”)compensation expense on share-based payments is recognized based on the grant-date fair value of those awards. We recognize the excess tax benefits and tax deficiencies in 2016. As a result, the tax benefit from stockincome statement when options exercised was recognized as a reduction to our provision for income taxes for the years ended December 31, 2017 and 2016 rather than as an increase to additional paid-in capital for the year ended December 31, 2015 prior to adoption.

are exercised. Amounts recognized in the financial statements with respect to these plans:
plans are as follows:


2017


2016


2015


2023


2022


2021


(In thousands)


(In thousands)


Amounts charged against income, before income tax benefit

 $1,845  $1,929  $1,383  $935  $1,200  $623 

Amount of related income tax benefit

  (2,310)  (1,164)  (505)  (617)  (436)  (919)

Net (benefit) expense to net income

 $(465) $765  $878  $318  $764  $(296)


We refer to our restricted stock awards as “non-vested” stock in these consolidated financial statements.  

Cash and Cash Equivalents


The Company considersWe consider all highly liquid investments with original maturities of three months or less to be cash equivalents. Cash equivalents were $34.5$6.5 million and $32.7$24.9 million as of December 31, 2017,2023, and 2016,2022, respectively, consisting primarily of money market accounts, Eurodollar deposits and funds invested in commercial paper.accounts. At certain times, cash equivalent balances may exceed federally insured limits.


Reclassifications

Leases


Reclassifications ofWe determine whether a lease is included in an agreement at inception. We recognize a lease liability and a right-of-use (“ROU”) asset on the balance sheet for our operating leases under which we are lessee. Operating lease ROU assets are included in operating lease right-of-use assets in our consolidated balance sheet. Finance lease assets are included in property and equipment. Operating and finance lease liabilities are included in other current liabilities and other long-term liabilities. Certain lease arrangements $191,000may have been made from noncurrent deferred income taxesinclude options to other noncurrent liabilitiesextend or terminate the lease. We include these provisions in the ROU asset and lease liabilities only when it is reasonably certain that we will exercise that option. Lease expense for operating lease payments is recognized on a straight-line basis over the lease term and is included in direct expenses and selling, general and administrative expenses. Our lease agreements do 2016not consolidated balance sheetcontain any residual value guarantees.

ROU assets represent our right to presentuse an underlying asset for the unrecognized tax benefits relatedlease term and lease liabilities represent our obligation to state taxes gross of federal tax benefits, consistent withmake lease payments during the 2017 financial statement presentation. There was no impactlease term. ROU assets and lease liabilities are recorded at lease commencement based on the previously reported net incomeestimated present value of lease payments. Because the rate of interest implicit in each lease is not readily determinable, we use our estimated incremental collateralized borrowing rate at lease commencement, to calculate the present value of lease payments. When determining the appropriate incremental borrowing rate, we consider our available credit facilities, recently issued debt and earnings per share.public interest rate information.


4039

Fair Value MeasurementsDue to remote working arrangements, we reassessed our office needs and subleased our Seattle location under an agreement considered to be an operating lease beginning in May 2021. We have not been legally released from our primary obligations under the original lease and therefore we continue to account for the original lease separately. We recorded an ROU asset impairment charge in 2021 of $324,000, which was the amount by which the carrying value of the Seattle office lease ROU asset exceeded the fair value. We estimated the fair value based on the discounted cash flows of estimated net rental income for the office space subleased. The ROU asset impairment charge is included in depreciation, amortization and impairment expenses. There were no ROU asset impairment charges in 2023 or 2022. Rent income from the sublessee are included in the statement of operations on a straight-line basis as an offset to rent expense associated with the original operating lease included in other expenses.


The Company’s

Fair Value Measurements

Our valuation techniques are based on maximizing observable inputs and minimizing the use of unobservable inputs when measuring fair value. Observable inputs reflect readily obtainable data from independent sources, while unobservable inputs reflect the Company’sour market assumptions. The inputs are then classified into the following hierarchy: (1) Level 1 Inputs—quoted prices in active markets for identical assets and liabilities; (2) Level 2 Inputs—observable market-based inputs other than Level 1 inputs, such as quoted prices for similar assets or liabilities in active markets, quoted prices for similar or identical assets or liabilities in markets that are not active, or other inputs that are observable or can be corroborated by observable market data; (3) Level 3 Inputs—unobservable inputs.


Commercial paper and Eurodollar deposits are included in cash equivalents and are valued at amortized cost, which approximates fair value due to its short-term nature. Eurodollar deposits are United States dollars deposited in a foreign bank branch of a United States bank and have daily liquidity. Both of these are included as a Level 2 measurement in the table below.


The following details the Company’sour financial assets within the fair value hierarchy at December 31, 20172023 and 2016:2022:


Level 1


Level 2


Level 3


Total

 
  (In thousands) 
As of December 31, 2017                
Money Market Funds $13,971  $--  $--  $13,971 
Commercial Paper  --   10,490   --   10,490 
Eurodollar Deposits  --   10,017   --   10,017 
Total Cash Equivalents $13,971  $20,507  $--  $34,478 
As of December 31, 2016                
Money Market Funds $11,200  $--  $--  $11,200 
Commercial Paper  --   21,450   --   21,450 
Total Cash Equivalents $11,200  $21,450  $--  $32,650 
  

Level 1


Level 2


Level 3


Total


(In thousands)


As of December 31, 2023


Money Market Funds

 $6,471  $  $  $6,471 

Total Cash Equivalents

 $6,471  $  $  $6,471 
                 

As of December 31, 2022


Money Market Funds

 $24,927  $  $  $24,927 

Total Cash Equivalents

 $24,927  $  $  $24,927 


There were no transfers between levels during the years ended December 31, 2023 2017and 2016.2022.


The Company'sOur long-term debt described in Note 8 is recorded at historical cost. The fair value of fixed rate long-term debt is classified in Level 2 of the fair value hierarchy and was estimated based primarily on estimated current rates available for debt of the same remaining duration and adjusted for nonperformance and credit. The fair value of our variable rate long-term debt is believed to approximate the carrying value because we believe the current rate reasonably estimates the current market rate for our debt.


The following are the carrying amountamount and estimated fair values of long-term debt:


December 31, 2017


December 31, 2016


December 31,

2023


December 31,

2022


(In thousands)


(In thousands)


Total carrying amount of long-term debt

 $1,067  $3,540  $36,787  $22,315 

Estimated fair value of long-term debt

 $1,066  $3,533  $36,403  $21,668 


The carrying amounts of accounts receivable, accounts payable, and accrued expenses approximate their fair value. All non-financial assets that are not recognized or disclosed at fair value in the financial statements on a recurring basis, which includes ROU assets, property and equipment, goodwill, intangibles and cost method investments, are measured at fair value in certain circumstances (for example, when there is evidence of impairment). We estimated the fair value of the Seattle office ROU asset using discounted cash flows of the sublease based on management’s most recent projections, which are considered level 3 inputs in the fair value hierarchy and recorded an ROU asset impairment charge of $324,000 during 2021.As of December 31, 20172023 and 2016,2022, there was no indication of impairment related to these assets.


40

ContingenciesCommitments and Contingencies


From time to time, the Company iswe are involved in certain claims and litigation arising in the normal course of business. Management assesses the probability of loss for such contingencies and recognizes a liability when a loss is probable and estimable.
Legal fees, net of estimated insurance recoveries, are expensed as incurred. We do not believe the final disposition of claims at December 31, 2023 will have a material adverse effect on our consolidated financial position, results of operations or liquidity.


Since the September 2017 announcement of the original proposed recapitalization plan (see Note 13), three purported class action and/or derivative complaints have been filed in state or federal courts by three individuals claiming to be shareholders of the Company. All of the complaints name as defendants the CompanyWe are self-insured for group medical and the individual directors of the Company. Two of these lawsuits were fileddental insurance.   We carry excess loss coverage in the United States District Courtamount of $150,000 per covered person per year for the Districtgroup medical insurance. We do not self-insure for any other types of Nebraska—losses, and therefore do not carry any additional excess loss insurance. In addition, we had aggregate claims loss coverage with a putative class action lawsuit captioned Gennaro v. National Research Corporation, et al.,minimum aggregate deductible of $5.4 million, $4.7 million and $3.2 million, in 2023,2022 and 2021, respectively. We record a reserve for our group medical and dental insurance for all unresolved claims and for an estimate of incurred but not reported (“IBNR”) claims.  On a quarterly basis, we adjust our accrual based on a review of our claims experience and a putative class and derivative action lawsuit captioned Gerson v. Hays, et al.,. These lawsuits were consolidated by order of the federal court. A third lawsuit was filed the Circuit Court for Milwaukee County, Wisconsin—a putative class action lawsuit captioned Apfel v. Hays, et al. The allegations in all of the lawsuits are very similar. The plaintiffs allege, among other things, that the defendants breached their fiduciary duties in connection with the allegedly unfair proposed transaction, at an allegedly unfair price, conducted in an allegedly unfair and conflicted process and in alleged violation of Wisconsin law and the Company’s Articles of Incorporation. One of the lawsuits also alleges the proposed transactions is a voidable “conflict of interest transaction” under Wisconsin statutes. The plaintiffs in these lawsuits seek, among other things, an injunction enjoining the defendants from consummating the original proposed recapitalization plan, damages, equitable relief and an award of attorneys’ fees and costs of litigation. The Company believes that the allegations of the complaints are without merit and intends to defend these lawsuits vigorously. Despite the changes to the original proposed recapitalization plan that culminated in the December 13, 2017 announcement of a revised proposed recapitalization plan, the Company expects that these shareholders or other shareholders might assert similar claims regarding the proposed recapitalization plan. The Company will defend any such lawsuits vigorously.-party actuarial IBNR analysis.  As of December 31, 2017,2023 and no2022, losses have been accrued as the Company does not believe the losses are probable or estimable.our accrual related to self-insurance was $449,000 and $424,000, respectively.


Earnings Per Share


Net income per share of class A common stock and class B common stock is computed using the two-class method. Basic net income per share iswas computed by allocating undistributed earnings to common shares and using the weighted-average number of common shares outstanding during the period.


Diluted net income per share iswas computed using the weighted-average number of common shares and, if dilutive, the potential common shares outstanding during the period. Potential common shares consist of the incremental common shares issuable upon the exercise of stock options and vesting of restricted stock. The dilutive effect of outstanding stock options is reflected in diluted earnings per share by application of the treasury stock method.


The liquidation rightsWe had 263,909, 315,764 and the rights upon the consummation127,185 options of an extraordinary transaction are the samecommon stock for the holders of class A common stock and class B common stock. Other than share distributions and liquidation rights, the amount of any dividend or other distribution payable on each share of class A common stock will be equal to one-sixth (1/6th) of the amount of any such dividend or other distribution payable on each share of class B common stock. As a result, the undistributed earnings for each year are allocated based on the contractual participation rights of the class A and class B common stock as if the earnings for the year had been distributed.

Atyears ended December 31, 2023, 2016,2022 and 2015,2021, the Company had 156,610 and 487,639 options of class A shares and 49,262, and 58,429 options of class B shares, respectively, which have been excluded from the diluted net income per share computation because the exercise price exceeds the fair market value. At December 31, 2017, 2016, and 2015 an additional 104,647,390,300, and 68,779 options of class A shares and 1,858,34,178, and 1,101 options of class B shares, respectively were excluded as their inclusion would be anti-dilutive.


2023


2022


2021


(In thousands, except per share data)


Numerator for net income per share – basic:


Net income

 $30,971  $31,800  $37,466 

Allocation of distributed and undistributed income to unvested restricted stock shareholders

  (8)  (16)  (18)

Net income attributable to common shareholders

 $30,963  $31,784  $37,448 

Denominator for net income per share – basic:


Weighted average common shares outstanding – basic

  24,540   24,922   25,422 

Net income per share – basic

 $1.26  $1.28  $1.47 

Numerator for net income per share – diluted:


Net income attributable to common shareholders for basic computation

 $30,963  $31,784  $37,448 

Denominator for net income per share – diluted:


Weighted average common shares outstanding – basic

  24,540   24,922   25,422 

Weighted average effect of dilutive securities – stock options

  133   130   218 

Denominator for diluted earnings per share – adjusted weighted average shares

  24,673   25,052   25,640 

Net income per share – diluted

 $1.25  $1.27  $1.46 

41

  2017  2016  2015 
  

Class A


Class B


Class A


Class B


Class A


Class B


(In thousands, except per share data)


Numerator for net income per share - basic:


Net income

 $11,388  $11,555  $10,178  $10,341  $8,759  $8,851 

Allocation of distributed and undistributed income to unvested restricted stock shareholders

  (88)  (87)  (88)  (88)  (76)  (77)

Net income attributable to common shareholders

 $11,300  $11,468  $10,090  $10,253  $8,683  $8,774 

Denominator for net income per share - basic:


Weighted average common shares outstanding - basic

  20,770   3,514   20,713   3,505   20,741   3,478 

Net income per share - basic

 $0.54  $3.26  $0.49  $2.93  $0.42  $2.52 

Numerator for net income per share - diluted:


Net income attributable to common shareholders for
basic computation

 $11,300  $11,468  $10,090  $10,253  $8,683  $8,774 

Denominator for net income per share - diluted:


Weighted average common shares outstanding - basic

  20,770   3,514   20,713   3,505   20,741   3,478 

Weighted average effect of dilutive securities – stock options:

  857   89   324   55   240   44 

Denominator for diluted earnings per share – adjusted weighted average shares

  21,627   3,603   21,037   3,560   20,981   3,522 

Net income per share - diluted

 $0.52  $3.18  $0.48  $2.88  $0.41  $2.49 


Recent Accounting Pronouncements Not Yet Adopted

(2)

Acquisition


InOn May 2014,January 4, 2021, we acquired substantially all assets and assumed certain liabilities of PatientWisdom, Inc., a company with a health engagement solution that will further our purpose of operationalizing human understanding through tangible and actionable insights. $3.0 million of the FASB issued ASUtotal $5.0 million all-cash consideration was paid at closing. We paid the remaining $2.0 million in 2014January 2022. -09,Revenue from ContractsAll payments were made with Customers (Topic 606) (“ASU 2014-09”). ASU 2014-09cash on hand. The acquisition was accounted for as a business combination, using the acquisition method of accounting, which requires, an entity to recognize the amount of revenue to which it expectsamong other things, certain assets acquired and liabilities assumed to be entitled for the transfer of promised goods or services to customers. ASU 2014-09 will replace most existing revenue recognition guidance in accounting principles generally accepted in the United States when it becomes effective. The standard is effective for annual and interim reporting periods in fiscal years beginning after December 15, 2017. An entity may choose to adopt ASU 2014-09 either retrospectively or through a cumulative effect adjustmentrecognized at their fair values as of the startacquisition date. The following table summarizes the fair value of assets acquired and liabilities assumed at the acquisition date.

Amount of Identified Assets Acquired and Liabilities Assumed


(In thousands)


Current Assets

 $184 

Property and equipment

  10 

Customer related

  100 

Technology

  600 

Goodwill

  4,340 

Total assets acquired

 $5,234 

Current liabilities

  284 

Net assets acquired

 $4,950 

The identifiable intangible assets are being amortized over their estimated useful lives of 5 years. The goodwill and identifiable intangible assets are deductible for tax purposes. Goodwill related to the acquisition was primarily attributable to anticipated synergies and other intangibles that do firstnot periodqualify for which it appliesseparate recognition.

The financial results associated with the standard. The Company has completed system changesPatientWisdom assets we acquired and is analyzing the resulting impact that this new guidance will have on itsliabilities we assumed are included in our consolidated financial statements. The Company will adopt this new guidance usingstatements from the modified retrospective approach beginningdate of acquisition, although the amounts are insignificant. Pro-forma information has January 1, 2018 notby recording a cumulative effect adjustment. The Company expects been presented because the most significant change to result from deferring direct and incrementalamounts for 2021 are insignificant. Acquisition-related costs of obtaining a contract, consisting of commissions$119,000 are included in selling, general and incentives, and recognizingadministrative expenses for the expense over the estimated life of the client contract, including renewal periods, rather than expensing as incurred, which is the Company’s current practice. The Company expects adjustments to retained earnings ofyear ended noDecember 31, 2021. more than $2.7 million, net of related tax effects, upon adoption of deferring and amortizing direct and incremental contract costs. The Company also expects to record other immaterial adjustments, related to performance obligation determinations and estimating variable contingent consideration for certain contracts which were previously only recognized once the contingency was resolved and the services were performed. These amounts are only estimates and involve significant judgements by management including estimating the lives of its contracts, the value of performance deliverables and the expected amount to be earned from the satisfaction of those deliverables. The Company will finalize its calculation of the financial impact of the adoption of ASU 2014-09 in the first quarter of 2018. ASU 2014-09 also requires additional disclosure about the nature, amount, timing and uncertainty of revenue and cash flows arising from customer contracts, including significant judgments and changes in judgments and assets recognized from costs incurred to obtain or fulfill a contract.


4342

In January 2016, the FASB issued ASU 2016-01, Financial Instruments—Overall: Recognition and Measurement of Financial Assets and Financial Liabilities. ASU 2016-01 changes certain recognition, measurement, presentation and disclosure aspects related to financial instruments. ASU 2016-01 is effective for financial statements issued for fiscal years beginning after December 15, 2017, and interim periods within those fiscal years. Early adoption is not permitted. The Company believes its adoption will not significantly impact the Company’s results of operations and financial position. 

In February 2016, the FASB issued ASU 2016-02, Leases (Topic 842). This ASU requires lessees to recognize a lease liability and a right-to-use asset for all leases, including operating leases, with a term greater than twelve months on its balance sheet. This ASU is effective in fiscal years beginning after December 15, 2018, with early adoption permitted, and requires a modified retrospective transition method. As of December 31, 2017, the Company had approximately $3.0 million of operating lease commitments which would be recorded on the balance sheet under the new guidance. However, the Company is currently in the process of further evaluating the impact that this new guidance will have on its consolidated financial statements and does not plan to elect early adoption.  

In June 2016, the FASB issued ASU 2016-13, Financial Instruments – Credit Losses (Topic 326):  Measurement of Credit Losses on Financial Instruments.  This ASU will require the measurement of all expected credit losses for financial assets, including trade receivables, held at the reporting date based on historical experience, current conditions, and reasonable and supportable forecasts. The guidance is effective for annual reporting periods beginning after December 15, 2019 and interim periods within those fiscal years. The Company believes its adoption will not significantly impact the Company’s results of operations and financial position.  

In August 2016, the FASB issued ASU 2016-15, Statement of Cash Flows (Topic 230) Classification of Certain Cash Receipts and Cash Payments which eliminates the diversity in practice related to eight cash flow classification issues.  This ASU is effective for the Company on January 1, 2018 with early adoption permitted.  The Company will adopt this ASU on January 1, 2018 and believes it will not impact the Company’s results of operations and financial position.

In October 2016, the FASB issued ASU 2016-16, Intra-Entity Transfers of Asset Other Than Inventory (“ASU 2016-16”), which requires entities to recognize the tax consequences of intercompany asset transfers other than inventory transfers in the period in which the transfer takes place. ASU 2016-16 is effective for fiscal years and interim periods within fiscal years beginning after December 15, 2017. ASU 2016-16 is to be adopted using a modified retrospective approach with a cumulative effect adjustment to retained earnings as of the beginning of the period of adoption. The cumulative effect adjustment will include recognition of the income tax consequences of intra-entity transfers of assets other than inventory that occur before the adoption date.  The Company believes the adoption of ASU 2016-16 will not impact the Company’s consolidated financial statements.


(23)

Equity InvestmentsContracts with Customers


The Company makesfollowing table disaggregates revenue for the years ended December 31, 2023, 2022 and 2021 based on timing of revenue recognition (in thousands):


2023


2022


2021


Subscription services recognized ratably over time

 $140,172  $141,981  $137,008 

Services recognized at a point in time

  4,071   4,231   3,216 

Fixed, non-subscription recognized over time

  3,503   3,134   3,065 

Unit price services recognized over time

  834   2,222   4,665 

Total revenue

 $148,580  $151,568  $147,954 

The following table provides information about receivables, contract assets, and contract liabilities from contracts with customers (in thousands):


December 31,

2023


December 31,

2022


Accounts receivables

 $12,378  $14,461 

Contract assets included in other current assets

 $84  $102 

Deferred revenue

 $14,834  $15,198 

Significant changes in contract assets and contract liabilities during the years ended December 31, 2023 and 2022 are as follows (in thousands):


2023


2022


Contract

Asset


Deferred

Revenue


Contract

Asset


Deferred

Revenue


Increase (Decrease)


Revenue recognized that was included in deferred revenue at beginning of year due to completion of services

 $-  $(15,100) $-  $(17,170)

Increases due to invoicing of client, net of amounts recognized as revenue

  -   14,837   -   15,081 

Decreases due to completion of services (or portion of services) and transferred to accounts receivable

  (102)  -   (99)  - 

Change due to cumulative catch-up adjustments arising from changes in expected contract consideration

  -   (101)  -   74 

Increases due to revenue recognized in the period with additional performance obligations before invoicing

  84   -   102   - 

We have elected to apply the practical expedient to not disclose the value of unsatisfied performance obligations for contracts with an original expected length of one year or less. Total remaining contract revenue for contracts with original duration of greater than one year expected to be recognized in the future related to performance obligations that are unsatisfied at December 31, 2023 approximated $14.5 million of which $5.9 million, $4.7 million, 4.0 million and $12,000 is expected to be recognized during 2024,2025,2026 and 2027, respectively.

43

(4)

Equity Investments

We make equity investments to promote business and strategic objectives. For investments that do not have a readily determinable fair value, the Company applieswe apply either cost or equity method of accounting depending on the nature of itsour investment and itsour ability to exercise significant influence. Investments are periodically analyzed to determine whether or not there are any indicators of impairment and written down to fair value if the investment has incurred an other than temporary impairment. During 2017, the Company acquired a $1.3Our investment of $1.3 million investment in convertible preferred stock of Practicing Excellence.com,PracticingExcellence.com, Inc., a privately-held Delaware Corporationcorporation (“PX”), which is included in non-current assets. It is not practicable for us to estimate fair value at each reporting date due to the cost and complexity of the calculations for this non-public entity. Therefore, it is carried at cost and includedless impairment, plus or minus changes resulting from observable price changes in other non-current assets. The Company hasorderly transactions for the identical or a similar investment of the same issuer, if any. We have a seat on PX'sPX’s board of directors and the Company'sour investment, which is not considered to be in-substance common stock, represents approximately 15.7%16% of the issued and outstanding equity interests in PX.


(3)

Divestitures

On December 21, 2015, the Company completed the sale of selected assets and liabilities related to the clinical workflow product of the Predictive Analytics operating segment, for a net cash amount of approximately $1.6 million.  The Company recorded a gain of approximately $1.1 million from the sale, which is included in other income on the Statement of Income.  In connection with the closing of the transaction, $300,000 was placed in escrow to cover certain indemnification claims for one year following the transaction pursuant to the purchase agreement. Due to the uncertainty related to the settlement of the claims, escrowed amounts were recognized when the contingency was removed and the cash was released from escrow rather than at the time of sale. The Company received $223,000 of the escrow funds in December 2016 upon final resolution of the claims and recorded an additional gain on the sale from these funds.  The lack of operating results from this business due to its divestiture did not have a major effect on our operations and financial results, and, accordingly, it was not classified as a discontinued operation for any of the periods presented. 

(4)

Connect

Customer-Connect LLC was formed in June 2013 to develop and commercialize the Connect programs. Connect programs provide healthcare organizations the technology to engage patients through real-time identification and management of individual patient needs, preferences, risks, and experiences.  The platform ensures that organizations have access to a longitudinal view of the patient to more effectively manage patient engagement across the continuum of care. At inception, NRC Health had a 49% ownership interest in Connect. NG Customer-Connect, LLC held a 25% interest, and the remaining 26% was held by Illuminate Health, LLC. Profits and losses were allocated under the hypothetical liquidation at book value approach.

In July 2015, the Company acquired all of NG Customer-Connect, LLC’s interest in Connect and a portion of Illuminate Health LLC’s interest in Connect for combined consideration of $2.8 million. As a result, as of December 31, 2015, the Company owned approximately 89% of Connect and Illuminate Health, LLC owned 11%. Under the amended operating agreement, NRC Health had the option to acquire additional equity units from Illuminate Health when new annual recurring contract value reached targeted levels. On March 7, 2016, the Company elected to exercise its first option to acquire one-third of the outstanding non-controlling interest for $1.0 million. Subsequently, on March 28, 2016, NRC Health and Illuminate Health reached an agreement whereby NRC Health acquired the remaining interest held by Illuminate Health for $1.0 million. Following these transactions, Customer-Connect LLC was a wholly owned subsidiary of NRC Health. All of Connect’s previous net income (losses) had been attributable to NRC Health. Since the Company previously consolidated Connect, the transactions to acquire additional ownership interests in Connect were accounted for as equity transactions, resulting in a reduction to additional paid-in capital of $252,000 and $2.8 million in 2016 and 2015, respectively. The acquisition of the remaining interest resulted in differences between the book and tax basis of Connect’s assets. As a result, the Company recorded deferred tax assets of $1.7 million, with a corresponding increase to additional paid-in capital during 2016.   On June 30, 2016, Customer-Connect LLC was dissolved.

(5)

Property and Equipment


At December 31, 2023, 2017,and 2016,2022, property and equipment consisted of the following:


2017


2016


2023


2022


(In thousands)


(In thousands)


Furniture and equipment

 $5,064  $4,737  $3,886  $4,753 

Computer equipment

  2,721   2,750  2,498  2,639 

Computer software

  22,569   20,592  34,143  29,876 

Building

  9,386   9,386  22,434  12,561 

Leaseholds

  41   --  488  502 

Land

  425   425   425   425 

Property and equipment at cost

  40,206   37,890  63,874  50,756 

Less accumulated depreciation and amortization

  27,847   26,084   35,669   33,508 

Net property and equipment

 $12,359  $11,806  $28,205  $17,248 


Work in progress included in computer equipment, computer software and building at December 31, 2023 was $322,000, $129,000 and $14.6 million, respectively. Work in progress included in computer equipment, computer software and building at December 31, 2022 was $77,000, $545,000 and $7.0 million, respectively. Depreciation and amortization expense related to property and equipment,, including assets under capital lease, for the years ended December 31, 2017,2023, 2016,2022, and 20152021 was $4.0$5.8 million, $3.6$5.1 million and
$3.1 $5.7 million, respectively.

Property We capitalize interest expense on major construction and development projects while in progress. Interest capitalized for 2023 and 2022 was $566,000 and $216,000, respectively. We did not capitalize interest in 2021. There were no significant impairments in property and equipment includedduring 2023,2022, and 2021. However, we did shorten the following amounts under capital lease:useful lives of certain assets to reflect our best estimate of when assets are expected to be disposed of or replaced.


2017


2016


(In thousands)


Furniture and equipment

 $843  $769 

Property and equipment under capital lease, gross

  843   769 

Less accumulated amortization

  684   530 

Net assets under capital lease

 $159  $239 
44


(6)

Goodwill and Intangible Assets


Goodwill and intangible assets consisted of the following at December 31, 2023:2017:


Useful Life


Gross


Accumulated Amortization


Net


(In years)


(In thousands)


Goodwill

      $58,021      $58,021 

Non-amortizing intangible assets:


Indefinite trade name

       1,191       1,191 

Amortizing intangible assets:


Customer related

  5-15   9,347   8,611   736 

Technology

  7    1,360   523   837 

Trade names

  5-10   1,572   1,572   -- 

Total amortizing intangible assets

       12,279   10,706   1,573 

Total intangible assets other than goodwill

      $13,470  $10,706  $2,764 
  

Gross


Accumulated

Impairment


Net


(In thousands)


Goodwill

 $62,328  $(714) $61,614 


Useful Life


Gross


Accumulated

Amortization


Net


(In years)


(In thousands)


Non-amortizing intangible assets:


Indefinite trade name

        1,191       1,191 

Amortizing intangible assets:


Customer related

  5-15   9,192   9,152   40 

Technology

  3-7   1,959   1,719   240 

Trade names

   10    1,572   1,572    

Total amortizing intangible assets

        12,723   12,443   280 

Total intangible assets other than goodwill

       $13,914  $12,443  $1,471 


GoodwillGoodwill and intangible assets consisted of the following at December 31, 2016:2022:


Useful Life


Gross


Accumulated Amortization


Net


(In years)


(In thousands)


Goodwill

      $57,861      $57,861 

Non-amortizing intangible assets:


Indefinite trade name

       1,191       1,191 

Amortizing intangible assets:


Customer related

  5-15   9,331   8,164   1,167 

Technology

  7    1,110   344   766 

Trade names

  5-10   1,572   1,572   -- 

Total amortizing intangible assets

       12,013   10,080   1,933 

Total intangible assets other than goodwill

      $13,204  $10,080  $3,124 
  

Gross


Accumulated

Impairment


Net


(In thousands)


Goodwill

 $62,328  $(714) $61,614 


The following represents a summary of


Useful Life


Gross


Accumulated

Amortization


Net


(In years)


(In thousands)


Non-amortizing intangible assets:


Indefinite trade name

        1,191       1,191 

Amortizing intangible assets:


Customer related

  5-15   9,192   9,132   60 

Technology

  3-7   1,959   1,599   360 

Trade names

   10    1,572   1,572    

Total amortizing intangible assets

        12,723   12,303   420 

Total intangible assets other than goodwill

       $13,914  $12,303  $1,611 

There were no changes in goodwill during the Company’s carrying amount of goodwillyears ending December 2023, 2022 and 2021.

Aggregate amortization expense for customer related intangibles, trade names, and technology for the years ended December 31, 2017,2023, 2022and 20162021 (in thousands):

Balance as of December 31, 2015

$57,792

Foreign currency translation

69

Balance as of December 31, 2016

$57,861

Foreign currency translation

160

Balance as of December 31, 2017

$58,021

Aggregatewas $140,000, $180,000, and $320,000, respectively. Estimated future amortization expense for customer related intangibles, trade names, technology2024 and non-competes for2025 is $140,000 and $140,000, respectively. No amortization expense is projected beyond 2025.

45

(7)

Income Taxes

For the years ended December 31, 2017,2023, 20162022, and 2015 was $610,000,$654,000, and $995,000, respectively. Estimated amortization expense for the next five years is: 2018—$662,000;2019—$374,000;2020—$318,000;2021—$180,000;2022—$39,000.

(7)

Income Taxes

For the years ended December 31, 2017, 2016, and 2015,2021, income before income taxes consists of the following:


2017


2016


2015


(In thousands)


U.S. Operations

 $32,750  $29,848  $25,536 

Foreign Operations

  1,533   1,508   1,824 

Income before income taxes

 $34,283  $31,356  $27,360 


2023


2022


2021


(In thousands)


U.S. Operations

 $40,031  $43,156  $48,145 

Foreign Operations

  (69)  (341)  476 

Income before income taxes

 $39,962  $42,815  $48,621 


Income tax expense consisted of the following components:components:


 2017  2016  2015  

2023


2022


2021

 
 (In thousands)  

(In thousands)

 
Federal:            

Federal:


Current

 $10,947  $8,930  $9,955  $8,220  $9,988  $9,092 

Deferred

  (1,596)  847   (1,232)  (891)  (1,427)  (224)

Total

 $9,351  $9,777  $8,723  $7,329  $8,561  $8,868 
             

Foreign:


Current

 $387  $409  $455  $(32) $(90) $143 

Deferred

  704   (18)  (23)  14      (17)

Total

 $1,091  $391  $432  $(18) $(90) $126 
             

State:


Current

 $837  $634  $680  $1,924  $2,846  $2,197 

Deferred

  61   36   (85)  (244)  (302)  (36)

Total

 $898  $670  $595  $1,680  $2,544  $2,161 
             

Total

 $11,340  $10,838  $9,750  $8,991  $11,015  $11,155 


Federal Tax Reform

On December 22, 2017, As a result of the Tax CutCuts and Jobs Act (the “Tax Act”) was enacted which, among other changes, reduces the U.S. federal corporate tax rate from 35% to 21% effective January 1, 2018. The Tax Act makes broad and complex changes to the U.S. tax code and it will take time to fully analyze the impact of the changes. Based on the information available, and the current interpretation of the Tax Act, the Company was able to make a reasonable estimate and recorded a provisional net tax benefit related to the remeasurement of the deferred tax assets and liabilities due to the reduction in the U.S. federal corporate tax rate, offset by the one-time mandatory deemed repatriation tax, payable over eight years. Pursuant to the Staff Accounting Bulletin published by the United States Securities and Exchange Commission on December 22, 2017, addressing the challenges in accounting for the effects of the Tax Act in the period of enactment, companies must report provisional amounts for those specific income tax effects of the Tax Act for which the accounting is incomplete but a reasonable estimate can be determined. Those provisional amounts will be subject to adjustment during a measurement period of up to one year from the enactment date. Pursuant to this guidance, the estimated impact of the Tax Act is based on a preliminary review of the new tax law and projected future financial results and is subject to revision based upon further analysis and interpretation of the Tax Act and to the extent that future results differ from currently available projections. The Company’s accounting for the following elements of the Tax Act is incomplete. However, the Company was able to make reasonable estimates and recorded a provisional net tax benefit of $1.9 million related to the following elements of the Tax Act pursuant to the Staff Accounting Bulletin referred to above:

Reduction of U.S. Federal Corporate Tax Rate: The Tax Act reduces the corporate tax rate to 21%, effective January 1, 2018. Consequently, we have recorded a decrease related to deferred tax assets and liabilities with a corresponding net adjustment to deferred income tax benefit for the year ended December 31, 2017. Since the Company has recorded provisional amounts related to certain portions of the Tax Act, any corresponding deferred tax remeasurement is also provisional. For example, the Tax Act had several changes that were depreciation related.  The primary change for the Company would be the availability of 100% bonus depreciation on assets placed in service after September 27, 2017. The Company is still evaluating which assets meet the requirements of this and therefore, no adjustments have been recorded related to this portion of the Tax Act as of December 31, 2017. In addition, under the Tax Act, expense under certain stock compensation plans may now be subject to limitations as to deductibility and the Company is still reviewing and analyzing each plan to determine the impact.

One-Time Mandatory Deemed Repatriation Tax: Under the Tax Act, the Company will be subject to a one-time mandatory deemed repatriation tax on accumulated non-U.S. earnings. The estimated impact of the Tax Act is based on a preliminary review of the new law. Several estimates were used in these calculations and the Company is still finalizing the material inputs, therefore all repatriation adjustments are considered provisional. For example, the Company’s expected use of foreign tax credits and credit carryforwards may be impacted once the analysis is completed. Currently, the Company estimates that it will be unable to use approximately $535,000 of foreign tax credit carryforwards and has provided a full valuation allowance against such amount.

Global Intangible Low-Taxed Income (“GILTI”) Policy Election: The GILTI provisions of the Tax Act do not apply to the Company until 2018 and we are still evaluating its impact. The FASB allows companies to adopt an accounting policy to either recognize deferred taxes for GILTI or treat such tax cost as a current-period expense when incurred. We have not yet determined our accounting policy because determining the impact of the GILTI provisions requires analysis of our existing legal entity structure, the reversal of our U.S. generally accepted accounting principles and U.S. tax basis differences in the assets and liabilities of our foreign subsidiary, and our ability to offset any tax with foreign tax credits. As such, we have not made a policy decision regarding whether to record deferred taxes on GILTI or treat such tax cost as a current-period expense.


In addition, as a result of the Tax Act, the Company determined that itwe would no longer indefinitely reinvest the earnings of itsour Canadian subsidiary. Our Canadian subsidiary and recordeddeclared a deemed dividend to the Company of $1.4 million in 2022. Additionally, a withholding tax of 5% was paid for the dividend distribution. Due to the closure of the Canadian office, we also processed a return of capital from the Canadian subsidiary to the Company of $1.2 million in $706,0002022. associated with this planned repatriation.


We qualify for tax incentives through the Nebraska Advantage LB312 Act (“NAA”). The difference betweenNAA provides direct refunds of sales tax on qualified property, as well as investment credits and employment credits that can be claimed through credits of Nebraska income tax, employment tax, and sales tax on non-qualified property. For the Company’syear ended December 31, 2023, 2022 and 2021, the amortization of credits reduced operating expenses by approximately $200,000, $510,000 and $473,000, respectively. In addition, income tax credits of $2,000, $36,000 and $10,000 were recorded as a reduction to income tax expense as reportedfor the years ended December 31, 2023, 2022 and 2021, respectively. Credits were lower in the accompanying consolidated financial statements2023 year due to not meeting certain full time equivalent thresholds in Nebraska, causing certain credits to be recaptured and no additional credits to be earned. The NAA credit earning years are now complete. We have applied for the ImagiNE Act, the new economic development incentive program that replaces the NAA. When we meet certain investment criteria we will have the ability to earn similar credits as with the NAA.

46

The differences between income tax expense that would be calculated applyingtaxes expected at the U.S. federal statutory income tax rate of 35%21 for 2017,2016,percent and 2015 on pretaxthe reported income wastax (benefit) expense are summarized as follows:


2017


2016


2015


(In thousands)


Expected federal income taxes

 $11,999  $10,975  $9,576 

Foreign tax rate differential

  (131)  (129)  (139)

State income taxes, net of federal benefit and state tax credits

  608   436   391 

Federal tax credits

  (130)  (165)  (150)

Uncertain tax positions

  151   6   93 

Nondeductible expenses related to proposed recapitalization

  504   --   -- 

Share based compensation

  (1,564)  (441)  -- 

Compensation limit for covered employees

  955   --   -- 

Impact of 2017 Tax Act

  (2,415)  --   -- 

Valuation allowance

  535   --   -- 

Withholding tax on repatriation of foreign earnings

  706   --   -- 

Other

  122   156   (21)

Total

 $11,340  $10,838  $9,750 


2023


2022


2021


(In thousands)


Expected federal income taxes

 $8,392  $8,991  $10,210 

Foreign tax rate differential

  (4)  (24)  26 

State income taxes, net of federal benefit and state tax credits

  1,323   2,100   1,531 

Share-based compensation

  (334)  (120)  (660)

Federal tax credits

  (569)  (408)  (272)

Uncertain tax positions

  73   22   254 

Reclassification of cumulative translation adjustment into earnings

     539    

Withholding tax on repatriation of foreign earnings

     (100)  8 

Non-deductible expenses

  92   30    

Other

  18   (15)  58 
  $8,991  $11,015  $11,155 


Deferred tax assets and liabilities at December 31, 2023 2017and 2016,2022, were comprised of the following:


2023


2022


(In thousands)


Deferred tax assets:


Allowance for doubtful accounts

 $18  $16 

Accrued expenses

  581   691 

Share-based compensation

  1,177   1,072 

Accrued bonuses

  12   96 

Uncertain tax positions

  326   256 

Research & experimental expenditures

  2,903   856 

Other

     78 

Gross deferred tax assets

  5,017   3,065 

Less valuation allowance


Deferred tax assets

  5,017   3,065 

Deferred tax liabilities:


Prepaid expenses

  145   135 

Deferred contract costs

  354   601 

Property and equipment

  1,966   1,066 

Intangible assets

  6,636   6,523 

Other

  55    

Deferred tax liabilities

  9,156   8,325 

Net deferred tax liabilities

 $(4,139) $(5,260)

In March 27, 2020, the U.S. federal government enacted the Coronavirus Aid, Relief, and Economic Security Act (the “CARES Act”). The CARES Act is an emergency economic stimulus package in response to the coronavirus outbreak which, among other things, contains numerous income tax provisions. As a result of the CARES Act, we had deferred $1.3 million of employer social security tax payments as of December 31, 2020. In accordance with the CARES Act, we paid half of this liability in December 2021, and paid the remaining $656,000 in December 2022. We have had no other impacts to our consolidated financial statements or related disclosures from the CARES Act.


2017


2016


(In thousands)


Deferred tax assets:


Allowance for doubtful accounts

 $46  $62 

Accrued expenses

  416   580 

Share based compensation

  1,457   2,357 

Accrued bonuses

  113   84 

Foreign tax credit from repatriation

  535   -- 

Other

  166   244 

Gross deferred tax assets

  2,733   3,327 

Less Valuation Allowance

  (535)  -- 

Deferred Tax Assets

  2,198   3,327 
Deferred tax liabilities:        

Prepaid expenses

  169   270 

Property and equipment

  856   1,206 

Intangible assets

  4,497   6,521 

Repatriation withholding

  706   -- 

Deferred tax liabilities

  6,228   7,997 

Net deferred tax liabilities

 $(4,030) $(4,670)
47

On August 16, 2022, the Inflation Reduction Act of 2022 (“IRA”) was signed into U.S. law. The IRA includes implementation of a new alternative minimum tax, an excise tax on stock buybacks, and significant tax incentives for energy and climate initiatives, among other provisions. We accrued excise taxes that increased the cost of treasury stock we acquired by $152,000 in 2023 due to the IRA. The excise tax will be paid in early 2024. We have no other financial impacts from the IRA.


In assessing the realizability of deferred tax assets, the Company considerswe consider whether it is more likely than not that some portion,, or all, of the deferred tax assets will not be realized. The ultimate realization of deferred tax assets is dependent upon the generation of future taxable income during the periods in which those temporary differences become deductible. The Company considersWe consider projected future taxable income, carry-back opportunities, and tax planning strategies in making this assessment. Based upon the level of historical taxable income and projections for future taxable income over the periods which the deferred tax assets are deductible, the Company believeswe believe it is more likely than not that itwe will realize the benefits of these deductible differences excluding the foreign tax credit carryforward.differences.


The CompanyTax Act amended Section 174 rules for the federal tax treatment of research or experimental (“R&E”) expenditures paid or incurred during the taxable year. The new Section 174 rules require taxpayers to capitalize and amortize specified R&E expenditures over a period of five years (attributable to domestic research) or 15 years (attributable to foreign research), beginning with the midpoint of the taxable year in which the expenses are paid or incurred. Software development costs are expressly included in the definition of specified R&E expenditures after 2021. Due to this change in legislation we capitalized costs of $7.8 million and $7.1 million for tax purposes in 2023 and 2022, respectively, resulting in deferred tax assets of $2.9 million and $856,000 at December 31, 2023 and 2022, respectively.

We had an unrecognized tax benefit at December 31, 2023 2017and 2016,2022, of $843,000$1.9 million and $662,000,$1.6 million, respectively, excluding interest of $5,000$43,000 and $2,000$25,000 at December 31, 20172023 and 2016,2022, respectively. Of these amounts, $620,000$1.6 million and $472,000$1.3 million at December 31, 20172023 and 2016,2022, respectively, represents the net unrecognized tax benefits that, if recognized, would favorably impact the effective income tax rate. The change in the unrecognized tax benefits for 20172023 and 20162022 iswas as follows:


(In thousands)


Balance of unrecognized tax benefits at December 31, 2021

 $1,075 

Reductions due to lapse of applicable statute of limitations

  (76)

Reductions due to tax positions of prior years


Reductions due to settlement with taxing authorities


Additions based on tax positions related to the current year

  558 

Balance of unrecognized tax benefits at December 31, 2022

 $1,557 

Reductions due to lapse of applicable statute of limitations

  (92)

Additions due to tax positions of prior years


Reductions due to settlement with taxing authorities


Additions based on tax positions related to the current year

  478 

Balance of unrecognized tax benefits at December 31, 2023

 $1,943 

We file income tax returns in the U.S. federal jurisdiction, various state jurisdictions, and Canada federal and provincial jurisdictions. Tax years 2020 and forward remain subject to U.S. federal examination. Tax years 2017 and forward remain subject to state examination. Tax years 2019 and forward remain subject to Canadian federal and provincial examination.  


   (In thousands) 

Balance of unrecognized tax benefits at December 31, 2015

 $589 

Reductions due to lapse of applicable statute of limitations

  (148)

Additions based on tax positions of prior years

  5 

Additions based on tax positions related to the current year

  216 

Balance of unrecognized tax benefits at December 31, 2016

 $662 

Reductions due to lapse of applicable statute of limitations

  -- 

Reductions due to tax positions of prior years

  (7)

Additions based on tax positions related to the current year

  188 

Balance of unrecognized tax benefits at December 31, 2017

 $843 

5048

The Company files a U.S. federal income tax return, various state jurisdictions returns and a Canada federal and provincial income tax return. All years prior to 2014 are now closed for US federal income tax and for years prior to 2014 for state income tax returns, and no exposure items exist for these years. The Company completed a United States federal tax examination for the tax year ended December 31, 2013 in the first quarter of 2016. The 2013 to 2017 Canada federal and provincial income tax returns remain open to examination.


(8)

Notes Payable


Notes payable consistedOur long-term debt consists of the following:


2017


2016


(In thousands)


Revolving credit note with U.S. Bank, maximum available $12.0 million, matures June 30, 2018

 $--  $-- 

Note payable to U.S. Bank for $11.8 million, interest at a 3.12% fixed rate, monthly principal and interest payments of $212,468 through April 2018

  1,067   3,540 

Total notes payable

  1,067   3,540 

Less current portion

  1,067   2,683 

Note payable, net of current portion

 $--  $857 
  

2023


2022


(In thousands)


Term Loan

 $17,787  $22,315 

Delayed Draw Term Loan

  19,000   - 

Less: current portion

  (7,214)  (4,491)

Less: unamortized debt issuance costs

  (103)  (134)

Notes payable, net of current portion

 $29,470  $17,690 

Our amended and restated credit agreement (the “Credit Agreement”) with First National Bank of Omaha (“FNB”) includes (i) a $30,000,000 revolving credit facility (the “Line of Credit”), (ii) a $23,412,383 term loan (the “Term Loan”) and (iii) a $75,000,000 delayed draw-down term facility (the “Delayed Draw Term Loan” and, together with the Line of Credit and the Term Loan, the “Credit Facilities”). We may use the Delayed Draw Term Loan to fund any permitted future business acquisitions or repurchases of our common stock and the Line of Credit to fund ongoing working capital needs and for other general corporate purposes.


The Company’s revolving credit note was amended Term Loan is payable in monthly installments of $462,988 through May 2027 and extended effective June 30, 2017 withbears interest at a maturity datefixed rate per annum of June 30, 2018. The maximum aggregate amount available under the revolving credit note is $12.0 million. 5%.

Borrowings under the revolving credit noteDelayed Draw Term Loan and Line of Credit, if any, bear interest at a variable annualfloating rate with three rate options at the discretion of management as follows: (1) 2.1% plusequal to the one30-month London Interbank Offered-day Secured Overnight Financing Rate (“LIBOR”SOFR”) or (2) 2.1%plus the one-, two- or three- month LIBOR rate, or (3) the bank’s one-, two, three, six, or twelve month Money Market Loan Rate. As of235 basis points (7.68% at December 31, 20172023). Interest on the revolving credit noteLine of Credit and Delayed Draw Term Loan accrues and is payable monthly.

Principal amounts outstanding under the Line of Credit are due and payable in full at maturity, in May 2025. The Line of Credit did not have a balance at December 31, 2023 and the Companywe had the capacityavailability to borrow $30,000,000. The weighted average borrowings on the Line of Credit for year ended $12.0December 31, 2023 was $1.7 million. There were no borrowings on the Line of Credit in the years ended December 31, 2022 or 2021. million.The weighted average interest rate on borrowings on the Line of Credit during the year ended December 31, 2023 was 7.67%.


The term note initial borrowing on the Delayed Draw Term Loan was in December 2023. Principal payments are due in monthly installments of $226,190 through April 2027 and revolving credit notea balloon payment for the remaining balance of $10.2 million is due in May 2027. We had the availability to borrow an additional $56.0 million on the Delayed Draw Term Loan at December 31, 2023.

We are secured by certainobligated to pay ongoing unused commitment fees quarterly in arrears pursuant to the Line of Credit and the Delayed Draw Term Loan facility at a rate of 0.20% per annum based on the actual daily unused portions of the Company’s assets, including the Company’s land, building, accounts receivable and intangible assets. The term noteLine of Credit and the revolving credit note contain variousDelayed Draw Term Loan facility.

49

The Credit Agreement contains customary representations, warranties, affirmative and negative covenants (including financial covenants) and events of default. The negative covenants include, among other things, restrictions regarding the incurrence of indebtedness and covenants applicableliens, repurchases of our common stock and acquisitions, subject in each case to certain exceptions. In June 2023, the Credit Agreement was amended to exclude our costs associated with our building renovation from or after January 1, 2023, from the fixed charge coverage ratio calculation. Pursuant to the Company, including requirements thatCredit Agreement, we are required to maintain a minimum fixed charge coverage ratio of 1.10x for all testing periods throughout the Company maintain certain financial ratios at prescribed levels and restrictions on the abilityterm(s) of the CompanyCredit Facilities, which calculation excludes, unless our liquidity falls below a specified threshold, (i) any cash dividend in a fiscal quarter that, together with all other cash dividends paid or declared during such fiscal quarter, exceeds $5,500,000 in total cash dividends paid or declared, (ii) the portion of the purchase price for any permitted share repurchase of our shares paid with cash on hand, (iii) the portion of any acquisition consideration for a permitted acquisition paid with cash on hand, and (iv) up to consolidate$25 million of costs associated with our building renovation from or merge, create liens, incur additional indebtednessafter January 1, 2023. We are also required to maintain a cash flow leverage ratio of 3.00x or disposeless for all testing periods throughout the term(s) of assets.the Credit Facilities. All obligations under the Credit Facilities are to be guaranteed by each of our direct and indirect wholly owned domestic subsidiaries, if any, and, to the extent required by the Credit Agreement, direct and indirect wholly owned foreign subsidiaries. As of December 31, 2017,2023, the Company waswe were in compliance with theour financial covenants.

(9)

Share-Based Compensation


The Company measuresCredit Facilities are secured, subject to permitted liens and recognizesother agreed upon exceptions, by a first-priority lien on and perfected security interest in substantially all of our and our guarantors’ present and future assets (including, without limitation, fee-owned real property, and limited, in the case of the equity interests of foreign subsidiaries, to 65% of the outstanding equity interests of such subsidiaries). 

Scheduled maturities of notes payable at December 31, 2023 are as follows (in thousands):

2024

  7,250 

2025

  7,725 

2026

  7,986 

2027

  13,826 

(9)

Share-Based Compensation

We measure and recognize compensation expense for all share-based payments based on the grant-date fair value of those awards. All of the Company’sour existing stock option awards and non-vestedunvested stock awards have been determined to be equity-classified awards. We account for forfeitures as they occur.


The National Research Corporation 2001 Equity Incentive Plan (“2001 Equity Incentive Plan”) provided for the granting of stock options, stock appreciation rights, restricted stock, performance shares and other share-based awards and benefits up to an aggregate of 1,800,000 shares of class A common stock and 300,000 shares of class B common stock. Stock options granted could have been either nonqualified or incentive stock options. Stock options vest over one to five years following the date of grant and option terms are generally five to ten years following the date of grant. Due to the expiration of the 2001 Equity Incentive Plan, at December 31, 2015, there were no shares of stock available for future grants. The Company has accounted for grants of 1,683,309 class A and 280,552 class B options and restricted stock under the 2001 Equity Incentive Plan using the date of grant as the measurement date for financial accounting purposes.

The Company’sOur 2004 Non-Employee Director Stock Plan, as amended (the “2004 Director Plan”), is a nonqualified plan that provides for the granting of options with respect to 3,000,000 shares of class A common stock and 500,000 shares of class Bour common stock. The 2004 Director Plan provides for grants of nonqualified stock options to each director of the Companyour directors who iswe do not employed by the Company.employ. On the date of each annual meeting of shareholders, of the Company, options to purchase 36,000shares of class A common stock and 6,000 sharesequal to an aggregate grant date fair value of class B common stock$100,000 are granted to directorseach non-employee director that areis elected or retained as a director at each such meeting. Stock options vest approximately one year following the date of grant and option terms are generally the earlier of ten years following the date of grant, or three years infrom the case of termination of the outside director’s service. At December 31, 2017,2023, there were 921,000670,932 shares of class A common stock and 153,500 shares of class B common stock available for issuance pursuant to future grants under the 2004 Director Plan. The Company hasWe have accounted for grants of 2,079,000 class A and 346,500 class B options2,329,068 shares of common stock under the 2004 Director Plan using the date of grant as the measurement date for financial accounting purposes.


The National Research CorporationOur 2006 Equity Incentive Plan (the “2006 Equity Incentive Plan”), as amended, provides for the granting of stock options, stock appreciation rights, restricted stock, performance shares and other share-based awards and benefits up to an aggregate of 1,800,000 shares of class A common stock and 300,000 shares of class B common stock. Stock options granted may be either incentive stock options or nonqualified stock options. Vesting terms vary with each grant and option terms are generally five to ten years following the date of grant. At December 31, 2017,2023, there were 865,465720,088 shares of class A common stock and 145,189 shares of class B common stock available for issuance pursuant to future grants under the 2006 Equity Incentive Plan. The Company hasWe have accounted for grants of 934,535 class A and 154,811 class B options1,079,912 shares of common stock and restricted stock under the 2006 Equity Incentive Plan using the date of grant as the measurement date for financial accounting purposes.


50

The CompanyDuring 2023,2022 and 2021, we granted options to purchase 299,91796,359, 127,227, and 101,091 shares of class A common stock, and 49,986 shares of class B common stock during 2017. During 2016, the Company granted options to purchase 315,620 shares of class A common stock and 52,603 shares of class B common stock, and during 2015 granted options to purchase 261,306 shares of class A common stock and 43,551 shares of class B common stock.respectively. Options to purchase shares of common stock are typically granted with exercise prices equal to the fair value of the common stock on the date of grant. The Company does,We do, in certain limited situations, grant options with exercise prices that exceed the fair value of the common shares on the date of grant. The fair value of stock options granted was estimated using a Black-Scholes valuation model with the following weighted average assumptions:


2017


2016


2015


Class A


Class B


Class A


Class B


Class A


Class B


2023


2022


2021


Expected dividend yield at date of grant

  2.62%  8.06%  2.99%  7.29%  2.22%  5.48% 2.13% 3.39% 2.15%

Expected stock price volatility

  32.45%  26.75%  32.74%  29.41%  31.97%  31.17% 35.12% 35.52% 34.85%

Risk-free interest rate

  2.18%  2.18%  1.69%  1.69%  1.58%  1.60% 3.61% 2.33% 0.91%

Expected life of options (in years)

  6.80   6.80   6.86   6.86   5.49   5.62  6.85  6.29  7.01 


The risk-free interest rate assumptions were based on the U.S. Treasury yield curve in effect at the time of the grant. The expected volatility was based on historical monthly price changes of the Company’sour stock based on the expected life of the options at the date of grant. The expected life of options is the average number of years the Company estimateswe estimate that options will be outstanding. The Company considersWe consider groups of associates that have similar historical exercise behavior separately for valuation purposes.


The following table summarizes stock option activity under the 2001 and 2006 Equity Incentive PlansPlan and the 2004 Director Plan for the year ended December 31, 2017:2023:


Number of
Options


Weighted

Average

Exercise

Price


Weighted

Average

Remaining Contractual

Terms (Years)


Aggregate

Intrinsic

Value

(In thousands)


Class A


Outstanding at December 31, 2016

  1,705,483  $12.31         

Granted

  299,917  $22.13         

Exercised

  (197,784) $10.55      $2,681 

Forfeited

  (60,982) $21.35         

Outstanding at December 31, 2017

  1,746,634  $13.88   5.39  $40,901 

Exercisable at December 31, 2017

  1,274,361  $12.14   4.32  $32,060 


Class B


Outstanding at December 31, 2016

  250,493  $29.70         

Granted

  49,986  $42.90         

Exercised

  (13,600) $27.04      $202 

Forfeited

  (10,163) $41.53         

Outstanding at December 31, 2017

  276,716  $31.78   5.52  $6,719 

Exercisable at December 31, 2017

  198,950  $29.16   4.44  $5,353 
  

Number of
Options


Weighted

Average

Exercise

Price


Weighted

Average

Remaining

Contractual

Terms

(Years)


Aggregate

Intrinsic

Value

(In

thousands)


Common Stock


Outstanding at December 31, 2022

  581,286  $32.86         

Granted

  96,359  $40.55         

Exercised

  87,378  $20.89         

Forfeited

  21,099  $40.52         

Outstanding at December 31, 2023

  569,168  $35.72   5.75  $3,971 

Exercisable at December 31, 2023

  346,032  $30.73   4.55  $3,894 


The following table summarizes information related to stock options for the years ended December 31, 2017,2023, 20162022 and 2015:2021:


2017


2016


2015


Class A


Class B


Class A


Class B


Class A


Class B


2023


2022


2021


Weighted average grant date fair value of stock options granted

 $5.83  $3.66  $3.62  $3.90  $3.49  $5.45  $9.16  $9.43  $12.55 

Intrinsic value of stock options exercised (in thousands)

  2,681   202   459   632   350   151  $2,037  $648  $3,535 

Intrinsic value of stock options vested (in thousands)

  5,258   787   1,627   535   1,351   415  $3,894  $4,369  $4,805 


As of December 31, 2017,2023, the total unrecognized compensation cost related to non-vested stock option awards was approximately $1.2$1.2 million and $152,000 for class A and class B common stock shares, respectively, which was expected to be recognized over a weighted average period of 2.53 years and 2.57 years for class A and class B common stock shares, respectively.2.76 years.


CashThere was $584,000 and $446,000 in cash received from stock options exercised for the years ended December 31, 2023 and 31,2021, 2016respectively. No cash was $548,000. There was no cash received fromfor stock options exercised for the year ended December 31, 20172022. or 2015. The CompanyWe recognized $1.2$997,000, $1.1 million, $964,000and $828,000$607,000 of non-cash compensation for the years ended December 31, 2017,2023, 2016,2022, and 2015,2021, respectively, related to options, which is included in direct and selling, general and administrative expenses.

The actual tax benefit realized for the tax deduction from stock options exercised was $1.1 million, $398,000$498,000, $160,000, and $183,000$862,000 for the years ended December 31, 2017,2023, 20162022, and 2015,2021, respectively. The Company prospectively elected ASU 2016-09, Compensation – Stock Compensation (Topic 718) Improvements to Employee Share-Based Payment Accounting(“ASU 2016-09”) in 2016. As a result, the excess tax benefit from stock options exercised was recognized as a reduction to our provision for income taxes for the years ended December 31, 2017 and 2016 rather than as an increase to additional paid-in capital for the years ended December 31, 2015 prior to adoption.


5351

During 20162021 and 2015, the Companywe granted 20,578 and 89,41612,698 non-vested shares of class A and 3,430 and 14,902 non-vested shares of class B common stock respectively, under the 2006 Equity Incentive Plan. No shares of non-vested common stock were granted during the years ended December 31, 2023 or 2022 and 6,640 shares were forfeited during the year ended December 31, 2017.2023. As of December 31, 2017,2023, the Companywe had 81,677 and 13,6116,058 non-vested shares of class A and class B common stock respectively, outstanding under the 2006 Equity Incentive Plan. These shares vest over five years following the date of grant and holders thereof are entitled to receive dividends from the date of grant, whether or not vested. The fair value of the awards is calculated as the fair market value of the shares on the date of grant. The CompanyWe recognized $629,000,$966,000a $62,000 benefit, $109,000 expense, and $555,00017,000 expense of non-cash compensation for the years ended December 31, 2017,2023, 2016,2022, and 2015,2021, respectively, related to this non-vested stock, which is included in direct and selling, general and administrative expenses. The actual tax benefit realized for the tax deduction from vesting ofNo restricted stock was $1.3 million and $161,000 forvested during the years endedend December 31, 20172023, 2022and 2016,2021. respectively. There were no shares that vested in the year ended December 31, 2015.


The following table summarizes information regarding non-vested stock granted to associates under the 2006 Equity Incentive Plans for the year ended December 31, 2017:2023:


 Class A Shares Outstanding  

Class A

Weighted

Average Grant

Date Fair Value

Per Share

  Class B Shares Outstanding  

Class B

Weighted

Average Grant

Date Fair Value

Per Share


Common Stock

Outstanding


Common Stock

Weighted

Average Grant

Date Fair Value

Per Share


Outstanding at December 31, 2016

  174,487  $13.93   29,081  $37.21 

Outstanding at December 31, 2022

 12,698  $42.92 

Granted

  --  $--   --  $--    $ 

Vested

  (73,506) $13.99   (12,251) $38.50    $ 

Forfeited

  (19,314) $14.27   (3,219) $34.69   6,640  $42.92 

Outstanding at December 31, 2017

  81,677  $13.80   13,611  $36.65 

Outstanding at December 31, 2023

  6,058  $42.92 


As of December 31, 2017,2023, the total unrecognized compensation cost related to non-vested stock awards was approximately $806,000$104,000 and is expected to be recognized over a weighted average period of 2.542.00 years.


(10)

Leases


The Company leases We lease printing, computer, other equipment and office space in the United States and office space in Canada, California, Georgia, and Washington.Canada. The Company also leased additional office space in Nebraska through June 2016. The Company recorded rent expense in connection with its operating leases remaining terms as of $869,000,December 31, 2023 $920,000 and $1.0 million in 2017,2016, and 2015, respectively. The Company also has capital leases for production, mailing and computer equipment.range from less than one year to 7.09 years.


Payments under non-cancelable operating leasesCertain equipment and capital leases at December 31, 2017 office lease agreements include provisions for periodic adjustments to rates and charges. The rates and charges are adjusted based on actual usage or actual costs for internet, common area maintenance, taxes or insurance, as determined by the next five years are:

Year Ending December 31,


Capital
Leases


Operating Leases


(In thousands)


2018

 $80  $708 

2019

  51   679 

2020

  34   485 

2021

  6   377 

2022

  1   190 

Total minimum lease payments

  172     

Less: Amount representing interest

  14     

Present value of minimum lease payments

  158     

Less: Current maturities

  71     

Capital lease obligations, net of current portion

 $87     

(11)

Related Party

A director of the Company also serves as an officer of Ameritas Life Insurance Corp. (“Ameritas”). In connection with the Company’s regular assessment of its insurance-based associate benefits, which is conducted by an independent insurance broker,lessor and the costs associated therewith, the Company purchases dental and vision insurance for certain of its associates from Ameritas. The total value of these purchases was $248,000,$232,000 and $227,000 in 2017,2016 and 2015 respectively.are considered variable lease costs.


Mr. Hays, the Chief Executive Officer and directorThe components of the Company, is an owner of 14% of the equity interest of Nebraska Global Investment Company LLC (“Nebraska Global”).  The Company, directly or indirectly through its former subsidiary Customer-Connect LLC, purchased certain services from Nebraska Global, primarily consisting of software development services.  The total value of these purchases were $12,500,$488,000 and $440,000 in 2017,2016 and 2015, respectively.

Mr. Hays personally incurred approximately $538,000 of fees and expenses in connection with exploring strategic alternativeslease expense for the Company, including the proposed recapitalization (see Note 13), for which the Company has reimbursed Mr. Hays in 2017. These fees and expenses were attributable to the evaluation of alternatives and the sourcing and negotiating of financing for the alternatives, all of which would have been borne directly by the Company if they had been advanced by Mr. Hays. Mr. Hays advanced these funds personally in order to maintain the confidentiality of the evaluation of such alternatives and allow the management team to maintain its focus on the Company’s business and operations.

During 2017, the Company acquired a cost method investment in convertible preferred stock of PX (see Note 2). Also in 2017, the Company paid $250,000 to acquire certain perpetual content licenses from PX for content the Company includes in certain of its subscription services. The Company also has an agreement with PX which commenced in 2016 under which the Company acts as a reseller of PX services and receives a portion of the revenues. The total revenue earned from the PX reseller agreement in the years ended December 31, 20172023, and 2016 was $633,0002022 and $28,000,2021 respectively.included (in thousands):


2023


2022


2021


Operating leases

 $503  $527  $669 

Finance leases:


Asset amortization

  310   462   489 

Interest on lease liabilities

  6   19   34 

Variable lease cost

  101   95   99 

Short-term lease cost

  25   87   59 

Sublease income

  (125)  (123)  (81)

Total net lease cost

 $820  $1,067  $1,269 

52

Supplemental balance sheet information related to leases (in thousands):


December 31,

2023


December 31,

2022


Operating leases:


Operating ROU assets

 $2,060  $556 
         

Current operating lease liabilities

  581   522 

Noncurrent operating lease liabilities

  1,650   333 

Total operating lease liabilities

 $2,231  $855 


December 31,

2023


December 31,

2022


Finance leases:


Furniture and equipment

 $179  $1,042 

Computer Equipment

  593   659 

Computer Software

  207   207 

Property and equipment under finance lease, gross

  979   1,908 

Less accumulated amortization

  937   1,537 

Property and equipment under finance lease, net

 $42  $371 
         

Current obligations of finance leases

 $22  $311 

Noncurrent obligations of finance leases

  19   39 

Total finance lease liabilities

 $41  $350 
         

Weighted average remaining lease term (in years):


Operating leases

  4.81   1.95 

Finance leases

  2.18   1.15 
         

Weighted average discount rate:


Operating leases

  5.05%  3.97%

Finance leases

  5.78%  3.54%

Supplemental cash flow and other information related to leases were as follows (in thousands):


2023


2022


2021


Cash paid for amounts included in the measurement of lease liabilities:


Operating cash flows from operating leases

 $684  $563  $680 

Operating cash flows from finance leases

  4   18   34 

Financing cash flows from finance leases

  290   469   493 
             

ROU assets obtained in exchange for operating lease liabilities

  1,971   83   560 

ROU assets obtained in exchange for finance lease liabilities

        40 

53

Undiscounted payments under non-cancelable finance and operating leases at December 31, 2023 were as follows (in thousands):


Finance Leases


Operating Leases


2024

 $23  $678 

2025

  11   589 

2026

  10   471 

2027

     231 

2028

     184 

Thereafter

     383 

Total minimum lease payments

  44   2,536 

Less: Amount representing interest

  3   305 

Present value of minimum lease payments

  41   2,231 

Less: Current portion

  22   581 

Lease obligations, net of current portion

 $19  $1,650 

Undiscounted cash receipts due under the sublease agreement at December 31, 2023 are as follows (in thousands):


Operating Lease


2024

 $127 

2025

  65 

Total minimum lease receipts

 $192 


(1211)

Associate BenefitsRelated Party


The Company sponsorsA director who began serving on our board in May 2021, also served until her retirement at the end of 2021 as chief executive officer of Allina Health, a not-for-profit healthcare system. In connection with its routine business operations, Allina Health purchases certain of our products and services. Total revenue we earned from Allina Health in the year ended December 31, 2021 approximated $1.7 million.

54

(12)

Associate Benefits

We sponsor a qualified 401(k) plan covering substantially all associates with no eligibility service requirement. Under the 401(k) plan, the Company matches 25.0%we match 25% of the first 6.0%6% of compensation contributed by each associate. The Employer contributions, which are discretionary, vest to participants at a rate of 20% per year. The CompanyWe contributed $561,000, $588,000, and $531,000, in $350,000,2023, $291,0002022, and $330,000 in 2017,2016 and 2015,2021, respectively, as a matching percentage of associate 401(k) contributions.


(1313)

Proposed RecapitalizationSegment Information


In December 2017,March 2021, the Company’s Board of Directors approved a recapitalization plan that will exchange each share of class B common stock for one share of class A common stock plus $19.59 in cash, for total value of $53.44 per class B share. This proposed recapitalization plan replaces the proposed plan announced in September 2017.

In December 2017, the Company entered into a commitment letter with First National Bank of Omaha, which expires on April 30, 2018, to provide a senior secured term loan of $40 million, a delayed draw term loan facility of $15 million and a senior secured revolving line of credit facility of $15 million.

The proposed recapitalization is subject to closing of financing and approval by the holders of the Company’s class A common stock, class B common stock and both classes of stock voting together as a group. The Company incurred expenses related to the proposed recapitalization of approximately $1.4 million in the year ended December 31, 2017, which are included in selling and administrative expenses. These expenses include certain amounts reimbursed to Mr. Hays (see Note 11).

(14)

Segment Information

The Company’s six operating segments are aggregated into one reporting segment because they have similar economic characteristics and meet the other aggregation criteria from the FASB guidance on segment disclosure. The six operating segments are Experience, The Governance Institute, Market Insights, Transparency, National Research Corporation Canada and Transitions, which offer a portfolio of solutions that address specific needs around market insight, experience, transparency and governance for healthcare providers, payers and other healthcare organizations. On December 21, 2015, selected assets and liabilities were sold from a seventh operating segment, Predictive Analytics, reducing the number ofwe changed our operating segments from six to one to reflect a change in the way we operated and managed our business, including changes to our corporate reporting structure to our Chief Executive Officer and chief operating decision maker.

We closed the Canada office in seven2022. As a result, no Canadian revenue is expected to be generated after six2022. as of December 31, 2015.


The table below presents entity-wide information regarding the Company’sour revenue and assets by geographic area:area (in thousands):


2017


2016


2015


(In thousands)


2023


2022


2021


Revenue:


United States

 $112,885  $104,445  $97,097  $148,580  $150,775  $144,987 

Canada

  4,674   4,939   5,246   -   793   2,967 

Total

 $117,559  $109,384  $102,343  $148,580  $151,568  $147,954 

Long-lived assets:


United States

 $72,562  $71,192  $70,624  $98,077  $86,718  $83,722 

Canada

  2,495   2,367   2,364      27   111 

Total

 $75,057  $73,559  $72,988  $98,077  $86,745  $83,833 

Total assets:


United States

 $110,785  $106,288  $115,480  $122,232  $130,151  $153,879 

Canada

  16,531   14,336   12,569   205   310   3,661 

Total

 $127,316  $120,624  $128,049  $122,437  $130,461  $157,540 


5655


Item 9.9.

Changes in and Disagreements with Accountants on Accounting and Financial DisclosureDisclosure


Not applicable.


Item 9A.

Controls and Procedures


Evaluation of Disclosure Controls and Procedures


In accordance with Rule 13a-15(b) of the Securities Exchange Act of 1934 (the “Exchange Act”), the Company’sour management evaluated, with the participation of the Company’sour Chief Executive Officer and the Company’sour Chief Financial Officer, the effectiveness of the design and operation of the Company’sour disclosure controls and procedures (as defined in Rule 13a-15(e) and 15d-15(e) under the Exchange Act) as of December 31, 2017.2023. Based upon their evaluation of these disclosure controls and procedures, the Chief Executive Officer and the Chief Financial Officer concluded that the disclosure controls and procedures were effective as of December 31, 2017.2023.


Management’ss Report on Internal Control over Financial Reporting


The Company’sOur management is responsible for establishing and maintaining adequate internal control over financial reporting (as defined in Rule 13a-15(f) of the Exchange Act). The Company’sOur internal control over financial reporting is designed to provide reasonable assurance regarding the reliability of financial reporting and the preparation of financial statements for external purposes in accordance with generally accepted accounting principles. Because of its inherent limitations, however, internal control over financial reporting may not prevent or detect misstatements. Also, projections of any evaluation of effectiveness to future periods are subject to the risk that controls may become inadequate because of changes in conditions, or that the degree of compliance with the policies of procedures may deteriorate. Accordingly, even effective internal control over financial reporting can only provide reasonable assurance of achieving its control objectives.


The Company’sOur management, with the participation of the Company’sour Chief Executive Officer and Chief Financial Officer, has evaluated the effectiveness of the Company’sour internal control over financial reporting using the framework in Internal Control Integrated Framework (2013) (2013) issued by the Committee of Sponsoring Organizations of the Treadway Commission (“COSO”). Based on such evaluation, the Company’sour management concluded that the Company’sour internal control over financial reporting was effective as of December 31, 2017.2023.


The effectiveness of the Company’sour internal control over financial reporting as of December 31, 2017,2023, has been audited by KPMG LLP, an independent registered public accounting firm, as stated in their report, a copy of which is included in this Annual Report on Form 10-K.

We have confidence in our internal controls and procedures. Nevertheless, our management, including our Chief Executive Officer and Chief Financial Officer, does not expect that our disclosure procedures and controls or our internal controls will prevent all errors or intentional fraud. An internal control system, no matter how well-conceived and operated, can provide only reasonable, not absolute, assurance that the objectives of such internal controls are met. Further, the design of an internal control system must reflect the fact that there are resource constraints, and the benefits of controls must be considered relative to their costs. As a result of the inherent limitations in all internal control systems, no evaluation of controls can provide absolute assurance that all our control issues and instances of fraud, if any, have been detected.


Changes in Internal Control over Financial Reporting


There was no change in the Company’sour internal control over financial reporting that occurred during the quarter ended December 31, 2017,2023, that has materially affected, or is reasonably likely to materially affect, the Company’sour internal control over financial reporting.


Item 9B.

Other Information


The Company has We have no other information to report pursuant to this item.


Item 9C.

Disclosure Regarding Foreign Jurisdictions that Prevent Inspections

Not applicable.

57
56

Report of Independent Registered Public Accounting Firm

To the Shareholders and Board of Directors
National Research Corporation:

Opinion on Internal Control Over Financial Reporting

We have audited National Research Corporation and subsidiary’s (the “Company”) internal control over financial reporting as of December 31, 2017, based on criteria established in Internal Control – Integrated Framework (2013) issued by the Committee of Sponsoring Organizations of the Treadway Commission. In our opinion, the Company maintained, in all material respects, effective internal control over financial reporting as of December 31, 2017, based on criteria established in Internal Control – Integrated Framework (2013) issued by the Committee of Sponsoring Organizations of the Treadway Commission.

We also have audited, in accordance with the standards of the Public Company Accounting Oversight Board (United States) (“PCAOB”), the consolidated balance sheets of the Company as of December 31, 2017 and 2016, the related consolidated statements of income, comprehensive income, shareholders’ equity, and cash flows for each of the years in the three-year period ended December 31, 2017, and the related notes (collectively, the consolidated financial statements), and our report dated March 14, 2018 expressed an unqualified opinion on those consolidated financial statements.

Basis for Opinion

The Company’s management is responsible for maintaining effective internal control over financial reporting and for its assessment of the effectiveness of internal control over financial reporting, included in the accompanying Management’s Report on Internal Control over Financial Reporting. Our responsibility is to express an opinion on the Company’s internal control over financial reporting based on our audit. We are a public accounting firm registered with the PCAOB and are required to be independent with respect to the Company in accordance with the U.S. federal securities laws and the applicable rules and regulations of the Securities and Exchange Commission and the PCAOB.

We conducted our audit in accordance with the standards of the PCAOB. Those standards require that we plan and perform the audit to obtain reasonable assurance about whether effective internal control over financial reporting was maintained in all material respects. Our audit of internal control over financial reporting included obtaining an understanding of internal control over financial reporting, assessing the risk that a material weakness exists, and testing and evaluating the design and operating effectiveness of internal control based on the assessed risk. Our audit also included performing such other procedures as we considered necessary in the circumstances. We believe that our audit provides a reasonable basis for our opinion.

Definition and Limitations of Internal Control Over Financial Reporting

A company’s internal control over financial reporting is a process designed to provide reasonable assurance regarding the reliability of financial reporting and the preparation of financial statements for external purposes in accordance with generally accepted accounting principles. A company’s internal control over financial reporting includes those policies and procedures that (1) pertain to the maintenance of records that, in reasonable detail, accurately and fairly reflect the transactions and dispositions of the assets of the company; (2) provide reasonable assurance that transactions are recorded as necessary to permit preparation of financial statements in accordance with generally accepted accounting principles, and that receipts and expenditures of the company are being made only in accordance with authorizations of management and directors of the company; and (3) provide reasonable assurance regarding prevention or timely detection of unauthorized acquisition, use, or disposition of the company’s assets that could have a material effect on the financial statements.

Because of its inherent limitations, internal control over financial reporting may not prevent or detect misstatements. Also, projections of any evaluation of effectiveness to future periods are subject to the risk that controls may become inadequate because of changes in conditions, or that the degree of compliance with the policies or procedures may deteriorate.

/s/ KPMG LLP

Lincoln, Nebraska
March 14, 2018


PART III


Item 10.

Directors,, Executive Officers and Corporate Governance


The information required by this Item with respect to directors and Section 16 compliance is included under the captions “Election of Directors” and “Section 16(a) Beneficial Ownership Reporting Compliance,” respectively, in the Company’s definitive Proxy Statement for its 2018 Annual Meeting of Shareholders (“Proxy Statement”) and is hereby incorporated herein by reference. Information with respect to the executive officers of the Company appears in Item 1 of this Annual Report on Form 10-K. The information required by this Item with respect to audit committees and audit committee financial experts is included under the caption “Corporate Governance” in the Proxy Statement and is incorporated herein by reference.

The Company hasWe have adopted a Code of Business Conduct and Ethics that applies to all of the Company’sour associates, including the Company’sour Chief Executive Officer and Chief Financial Officer and other persons performing similar functions. The Company hasWe have posted a copy of the Code of Business Conduct and Ethics on itsour website at www.nrchealth.com, and such Code of Business Conduct and Ethics is available, in print, without charge, to any shareholder who requests it from the Company’sour Secretary. The Company intendsWe intend to satisfy the disclosure requirements under Item 5.05 of Form 8-K regarding amendments to, or waivers from, the Code of Business Conduct and Ethics by posting such information on itsour website at www.nrchealth.com. The Company isWe are not including the information contained on itsour website as part of, or incorporating it by reference into, this report.

The remaining information required by this Item will be included in our definitive proxy statement to be filed with the SEC within 120 days after December 31, 2023, in connection with the solicitation of proxies for the Company’s 2024 Annual Meeting of Stockholders (the “2024 Proxy Statement”), and is incorporated herein by reference.


Item 11.

Executive Compensation


The information required by this Item is will be included under the captions “Compensation Discussion and Analysis,” “2017 Summary Compensation Table,” “Grants of Plan-Based Awards in 2017,” “Outstanding Equity Awards at December 31, 2017,” “2017 Director Compensation,” “Compensation Committee Report,” “Corporate Governance-Transactions with Related Persons” and “CEO Pay Ratio” in theour definitive 2024 Proxy Statement, and is hereby incorporated herein by reference.


Item 12.

Security Ownership of Certain Beneficial Owners and Management and RelatedShareholder Matters

The information required by this Item with respect to security ownership of certain beneficial owners and management is included under the caption “Principal Shareholders” in the Proxy Statement and is hereby incorporated by reference.


The following table sets forth information with respect to compensation plans under which equity securities of the Company are authorized for issuance as of December 31, 2017.2023. 


Plan Category Class A shares


Number of securities

to be issued upon

the exercise of

outstanding options, warrants and rights


Weighted-average

exercise price of outstanding

options,

warrants and rights


Number of securities

remaining available for

future issuance under

equity compensation

plans (excluding

securities reflected

in the first column)


Equity compensation plans approved by security holders (1)

  1,746,634  $13.88   1,786,465(2)

Plan Category Common Shares


Number of

Securities to be

issued upon

the exercise of

outstanding

options,

warrants and

rights


Weighted-

average

exercise price

of

outstanding

options,

warrants and

rights


Number of

securities

remaining available

for future issuance

under equity

compensation

plans (excluding

securities reflected

in the first column)


Equity compensation plans approved by security holders(1)

 569,168  $35.72  1,391,020(2)

Equity compensation plans not approved by security holders

  --   --   --          

Total

  1,746,634  $13.88   1,786,465   569,168  $35.72   1,391,020 


Plan Category Class B shares


Number of securities

to be issued upon

the exercise of

outstanding options, warrants and rights


Weighted-average

exercise price of outstanding

options,

warrants and rights


Number of securities

remaining available for

future issuance under

equity compensation

plans (excluding

securities reflected

in the first column)


Equity compensation plans approved by security holders (1)

  276,716  $31.78   298,689(2)

Equity compensation plans not approved by security holders

  --   --   -- 

Total

  276,716  $31.78   298,689 

(1)

Includes the Company’sour 2006 Equity Incentive Plan and 2004 Director Plan, and the 2001 Equity Incentive Plan.

(2)

Under the 2006 Equity Incentive Plan, the Companywe had authority to award up to 327,590331,821 additional shares of restricted class A common stock and 54,599 additional shares of restricted class B common stock to participants, provided that the total of such shares awarded may not exceed the total number of shares remaining available for issuance under the 2006 Equity Incentive Plan, which totaled 865,465720,088, shares of class A common stock and 145,189 shares of class B common stock as of December 31, 2017.2023. The Director Plan provides for granting options for 3,000,000 shares of Class A common stock and 500,000 shares of Class B common stock. Option awards through December 31, 20172023 totaled 2,079,0002,329,068 shares of Class A common stock and 346,500 of Class B common stock. No future awards are available under the 2001 Equity Incentive Plan due to its expiration.


The remaining information required by this Item will be included in our definitive 2024 Proxy Statement and is incorporated herein by reference.

Item 13.Certain Relationships and Related Transactions, and Director Independence

Certain Relationships and Related Transactions, and Director Independence


The information required by this Item iswill be included under the caption “Corporate Governance” in theour definitive 2024 Proxy Statement and is hereby incorporated herein by reference.


Item 14.Principal Accountant Fees and Services

Principal Accountant Fees and Services


The information required by this Item iswill be included under the caption “Miscellaneous — Independent Registered Public Accounting Firm” in theour definitive 2024 Proxy Statement and is hereby incorporated herein by reference.


PART IVIV


Item 15.

Exhibits, Financial Statement Schedules


1.

Consolidated financial statements. The consolidated financial statements listed in the accompanying index to the consolidated financial statements are filed as part of this Annual Report on Form 10-K.

2.

Financial statement schedules. All financial statement schedules have been omitted because they are not applicable or the required information is included in the consolidated financial statements are filed as part of this Annual Report on Form 10-K.and the related notes thereto.


2.

Financial statement schedules. All financial statement schedules have been omitted because they are not applicable or the required information is included in the consolidated financial statements and the related notes thereto.

3.

Exhibits. The exhibits listed in the exhibit index below are filed as part of this Annual Report on Form 10-K.


EXHIBIT INDEX


Exhibit

Number


Exhibit Description


(3.1)

Amended and Restated ArticlesCertificate of Incorporation of National Research Corporation, effective May 22, 2013June 30, 2021 [Incorporated by reference to Exhibit (3.2)3.3 to National Research Corporation’sCorporation’s Current Report on Form 8-K dated May 22, 2013June 29, 2021, and filed May 24, 2013on July 2, 2021 (File No. 0-29466)001-35929)]


(3.2)

By-LawsBylaws of National Research Corporation, as amended to date [Incorporated by reference to Exhibit (3.2)3.4 to National Research Corporation’sCorporation’s Current Report on Form 8-K dated October 26, 2015June 29, 2021 and filed on October 28, 2015July 2, 2021 (File No. 0-29466)001-35929)]


(4)(4.1)

Installment Note, dated asCertificate of May 9, 2013, fromIncorporation of National Research Corporation, to U.S. Bank National Associationeffective June 30, 2021 [Incorporated by reference to Exhibit (4)3.3 to National Research Corporation’s Current Report on Form 8-K dated June 29, 2021, and filed on July 2, 2021 (File No. 001-35929)]

(4.2)

Bylaws of National Research Corporation,’s as amended to date [Incorporated by reference to Exhibit 3.4 to National Research Corporation’s Current Report on Form 8-K dated June 29, 2021 and filed on July 2, 2021 (File No. 001-35929)]

(4.3)

Description of the Securities of the Registrant. [Incorporated by reference to Exhibit 4.3 to National Research Corporation’s Annual Report on Form 10-K for the year ended December 31, 2021 and filed on March 4, 2022 (File No. 001-35929)]

(10.1)

Amended and Restated Credit Agreement dated May 28, 2020, between National Research Corporation and First National Bank of Omaha [Incorporated by reference to Exhibit 10.1 to National Research Corporation’s Quarterly Report on Form 10-Q for the quarter ended June 30, 20132020 and filed on August 8, 20157, 2020 (File No. 0-29466)001-35929)]

(10.1)*

National Research Corporation 2001 Equity Incentive Plan [Incorporated by reference to Appendix A to National Research Corporation’s Proxy Statement for the 2002 Annual Meeting of Shareholders filed on April 3, 2002 (File No. 0-29466)]


(10.2)*


First Amendment to Amended and Restated Credit Agreement between National Research Corporation 2006 Equity Incentive Plan, as amendedand First National Bank of Omaha dated September 30, 2022 [Incorporated by reference to Exhibit (4.3)10.1 to National Research Corporation’s Registration StatementCorporation’s Quarterly Report on Form S-8 (Registration No. 333-189141)10-Q for the quarter ended September 30, 2022 and filed on June 6, 2013]November 4, 2022 (File No. 001-35929)]


(10.3)

Second Amendment to Amended and Restated Credit Agreement between National Research Corporation and First National Bank of Omaha dated June 16, 2023 [Incorporated by reference to Exhibit 10.1 to National Research Corporation’s Quarterly Report on Form 10-Q for the quarter ended June 30, 2023 and filed on August 4, 2023 (File No. 001-35929)]

(10.4)*

National Research Corporation 2004 Non-Employee Director Stock Plan, as amended [Incorporated by reference to Appendix A to National Research Corporation’sCorporation’s Proxy Statement for its 2015the 2018 Annual Meeting of Shareholders filed on April 1, 2015]

(10.4)*

Form of Nonqualified Stock Option Agreement (for new associates) used in connection with the 2001 Equity Incentive Plan [Incorporated by reference to Exhibit 4.4 to National Research Corporation’s Registration Statement on Form S-8 (Registration27, 2018 (File No. 333-120530) filed on November 16, 2004]001-35929)]


(10.5)*

Form of Nonqualified Stock Option Agreement (for officers) used in connection with the 2001 Equity Incentive Plan [Incorporated by reference to Exhibit 4.5 to National Research Corporation’s Registration Statement on Form S-8 (Registration No. 333-120530) filed on November 16, 2004]

Exhibit
Number
Exhibit Description

(10.6)*

Form of Restricted Stock Agreement for executive officers used in connection with the 2001 Equity Incentive Plan [Incorporated by reference to Exhibit 10.2 to National Research Corporation’s Current Report on Form 8-K dated March 19, 2005 and filed on March 23, 2005 (File No. 0-29466)]

 (10.7)*

Form of Restricted Stock Agreement (one year vesting) used in connection with the 2001 Equity Incentive Plan [Incorporated by reference to Exhibit 4.6 to National Research Corporation’s Registration Statement on Form S-8 (Registration No. 333-120530) filed on November 16, 2004]

(10.8)*

Form of Restricted Stock Agreement (five year vesting) used in connection with the 2001 Equity Incentive Plan [Incorporated by reference to Exhibit 4.7 to National Research Corporation’s Registration Statement on Form S-8 (Registration No. 333-120530) filed on November 16, 2004]

(10.9)*

Form of Nonqualified Stock Option Agreement used in connection with the 2006 Equity Incentive Plan [Incorporated by reference to Exhibit (10.14)10.14 to National Research Corporation’sCorporation’s Annual Report on Form 10-K for the year ended December 31, 2006 and filed on April 2, 2007 (File No. 0-29466)000-29466)]


(10.10)(10.6)*

Form of Restricted Stock Agreement used in connection with the National Research Corporation 2006 Equity Incentive Plan [Incorporated by reference to Exhibit (10.15)10.15 to National Research Corporation’sCorporation’s Annual Report on Form 10-K for the year ended December 31, 2006 and filed on April 2, 2007 (File No. 0-29466)000-29466)]

Exhibit
Number

Exhibit Description

(10.7)*

National Research Corporation 2006 Equity Incentive Plan, [Incorporated by reference to Appendix A to National Research Corporation’s Proxy Statement for the 2006 Annual Meeting of Shareholders filed on April 3, 2006 (File No. 000-29466)]


(11)(10.8)*

ComputationForm of per share earnings (containedGrant used in Note 1 of “Notesconnection with the National Research Corporation 2004 Non-Employee Director Stock Plan, as amended [Incorporated by reference to Consolidated Financial Statements” of the Company’s AnnualExhibit 10.1 to National Research Corporation’s Quarterly Report inon Form 10-K10-Q for the yearquarter ended December 31, 2017).September 30, 2021 and filed on November 5, 2021 (File No. 001-35929)]


(21)**

Subsidiary of National Research Corporation


(23)**

Consent of Independent Registered Public Accounting Firm


(31.1)**

Certification of the Chief Executive Officer pursuant to Section 302 of the Sarbanes-Oxley Act of 2002


(31.2)**

Certification of the Chief Financial Officer pursuant to Section 302 of the Sarbanes-Oxley Act of 2002


(32)***

Certification of Periodic Financial Report by the Chief Executive Officer and Chief Financial Officer pursuant to Section 906 of the Sarbanes-Oxley Act of 2002


(99)(97)**

Proxy Statement for the 2018 Annual Meeting of Shareholders [To be filed with the Securities and Exchange Commission under Regulation 14A within 120 days after December 31, 2017; except to the extent specifically incorporated by reference, the Proxy Statement for the 2018 Annual Meeting of Shareholders shall not be deemed to be filed with the Securities and Exchange Commission as part of this Annual Report on Form 10-K]Clawback Policy

Exhibit
Number
Exhibit Description
  

(101)**

Financial statements from the Annual Report on Form 10-K of National Research Corporation for the year ended December 31, 2017,2023, formatted in Inline eXtensible Business Reporting Language (XBRL)(iXBRL): (i) the Consolidated Balance Sheets, (ii) the Consolidated Statements of Income, (iii) Consolidated Statements of Comprehensive Income, (iv) Consolidated Statements of Shareholders’ Equity, (v) the Consolidated Statements of Cash Flows, (vi) the Notes to the Consolidated Financial Statements, and (vii) document and entity information.

(104)**

Cover Page Interactive Data File (formatted in the Inline XBRL and contained in Exhibit 101).


*

*A management contract or compensatory plan or arrangement.

A management contract or compensatory plan or arrangement.

**

In accordance with Rule 406T of Regulation S-T, the information in these exhibits shall not be deemed to be “filed” for purposes of Section 18 of the Securities Exchange Act of 1934, as amended, or otherwise subject to liability under that section, and shall not be incorporated by reference into any registration statement or other document filed under the Securities Act of 1933, as amended, except as expressly set forth by specific reference in such filing.Filed herewith.

***

Furnished herewith.


Item 116.6.

Form 10-K Summary


None.


INDEX TO CONSOLIDATED FINANCIAL STATEMENTS


Page in

this

Form 10-K


Report of Independent Registered Public Accounting Firm (KPMG LLP, PCAOB ID: 185)

30

27

Consolidated BalanceBalance Sheets as of December 31, 20172023 and 20162022

31

29

Consolidated Statements of Income for the Three Years EndedEnded December 31, 20172023

32

30
  

Consolidated Statements of Comprehensive Income for the ThreeThree Years Ended December 31, 20172023

3331
  

Consolidated Statements of ShareholdersShareholders’ Equity for the Three Years Ended December 31, 20172023

32
34

Consolidated Statements of Cash Flows for the Three Years Ended December 31, 20172023

35

33

Notes to Consolidated Financial Statements

36

34


All other financial statement schedules are omitted since the required information is not present or is not present in amounts sufficient to require submission of the schedules, or because the information required is included in the consolidated financial statements and notes thereto.


SIGNATURES


Pursuant to the requirements of Section 13 or 15(d) of the Securities Exchange Act of 1934, the Registrant has duly caused this report to be signed on its behalf by the undersigned, thereunto duly authorized, on this 14th27th day of March 2018.February 2024.


NATIONAL RESEARCH CORPORATION

By:

/s/ Michael D. Hays

Michael D. Hays

Chief Executive Officer and President


Pursuant to the requirements of the Securities Exchange Act of 1934, this report has been signed below by the following persons on behalf of the Registrant and in the capacities and on the dates indicated.


Signature


Title


Date


/s/ Michael D. Hays


Chief Executive Officer, President and Director


March 14, 2018February 27, 2024

Michael D. Hays


(Principal Executive Officer)


/s/ Kevin R. Karas


Senior Vice President Finance, Chief Financial


March 14, 2018February 27, 2024

Kevin R. Karas


Officer, Treasurer and Secretary (Principal


Financial and Accounting Officer)


/s/ Donald M. Berwick


Director


March 14, 2018February 27, 2024

Donald M. Berwick


/s/ JoAnn M. Martin

Director

March 14, 2018

JoAnn M. Martin

/s/ Barbara J. Mowry

Director

March 14, 2018

Barbara J. Mowry    
     

/s/ John N. Nunnelly


Director


March 14, 2018February 27, 2024

John N. Nunnelly


/s/ Penny A. Wheeler

Director

February 27, 2024

Penny A. Wheeler

/s/ Stephen H. Lockhart

Director

February 27, 2024

Stephen H. Lockhart

/s/ Parul Bhandari

Director

February 27, 2024

Parul Bhandari


66

62