UNITED
UNITED STATES
SECURITIES AND EXCHANGE COMMISSION
Washington, D.C. 20549
FORM 10-K
| (Mark One) |
| [X]ANNUAL REPORT PURSUANT TO SECTION 13 OR 15(d) OF THE SECURITIES EXCHANGE ACT OF 1934 |
For the fiscal year ended June 30, 2018 |
OR |
| [ ]TRANSITION REPORT PURSUANT TO SECTION 13 OR 15(d) OF THE SECURITIES EXCHANGE ACT OF 1934 |
(Mark One)
☒ ANNUAL REPORT PURSUANT TO SECTION 13 OR 15(d) OF THE SECURITIES EXCHANGE ACT OF 1934
For the fiscal year ended June 30, 2020
OR
☐ TRANSITION REPORT PURSUANT TO SECTION 13 OR 15(d) OF THE SECURITIES EXCHANGE ACT OF 1934
For the transition period from to
Commission file number 1-11692
_________________________________________________

Ethan Allen Interiors Inc.
(Exact name of registrant as specified in its charter)
Delaware | | | 06-1275288 |
(State or other jurisdiction of incorporation or organization) | | | (I.R.S. Employer Identification No.) |
25 Lake Avenue Extension,Ext., Danbury, CTConnecticut | | | | 0681106811-5286
|
(Address of principal executive offices) | | | (Zip(Zip Code)
|
(203) 743-8000
(Registrant's telephone number, including area code(203) 743-8000code)
Securities registered pursuant to Section 12(b) of the Act:
| Title of Each Class Common stock $0.01parvalue
| | ETH | | Name of Each Exchange On Which Registered
|
Common Stock, $.01 par value
| | | New York Stock Exchange Inc. | |
| (Title of each class) | | (Trading symbol) | | (Name of exchange on which registered) | |
Securities registered pursuant to Section 12(g) of the Act:None
None
(Title of Class)
Indicate by check mark if the Registrantregistrant is a well-known seasoned issuer, as defined in Rule 405 of the Securities Act. [ X ]☐ Yes [ ]☒ No
Indicate by check mark if the Registrantregistrant is not required to file reports pursuant to Section 13 or Section 15(d) of the Act. [ ]☐ Yes [X]☒ No
Indicate by check mark whether the Registrantregistrant (1) has filed all reports required to be filed by Section 13 or 15(d) of the Securities Exchange Act of 1934 during the preceding 12 months (or for such shorter period that the Registrantregistrant was required to file such reports), and (2) has been subject to such filing requirements for the past 90 days.
[X] ☒ Yes [ ]☐ No
Indicate by check mark whether the Registrantregistrant has submitted electronically and posted on its corporate Web site, if any, every Interactive Data File required to be submitted and posted pursuant to Rule 405 of Regulation S-T (§232.405 of this chapter) during the preceding 12 months (or for such shorter period that the registrant was required to submit and post such files). [X]☒ Yes [ ]☐ No
Indicate by check mark if disclosure of delinquent filers pursuant to Item 405 of Regulation S-K is not contained herein, and will not be contained, to the best of Registrant's knowledge, in definitive proxy or information statements incorporated by reference in Part III of this Form 10-K or any amendment to this Form 10-K. [ X ]
Indicate by check mark whether the registrant is a large accelerated filer, an accelerated filer, a non-accelerated filer, smaller reporting company or an emerging growth company. See the definitions of “large accelerated filer,” “accelerated filer,” “smaller reporting company,” and “emerging growth company”in Rule 12b-2 of the Exchange Act:
| Large accelerated filer | [X]☐ | Accelerated filer | [ ]☒ |
| Non-accelerated filer | [ ] Do not check if smaller reporting company)☐ | Smaller reporting company | [ ]☐ |
| Emerging growth company | [ ]
☐ | | |
If an emerging growth company, indicate by check mark if the registrant has elected not to use the extended transition period for complying with any new or revised financial accounting standards provided pursuant to sectionSection 13(a) of the Exchange Act. [ ]☐
Indicate by check mark whether the Registrantregistrant has filed a report on and attestation to its management’s assessment of the effectiveness of its internal control over financial reporting under Section 404(b) of the Sarbanes-Oxley Act (15 U.S.C. 7262(b)) by the registered public accounting firm that prepared or issued its audit report. ☒
Indicate by check mark whether the registrant is a shell company (as defined in Rule 12b-2 of the Act). [ ]☐ Yes [X]☒ No
The aggregate market value of the voting and non-voting common stock held by non-affiliates of the registrant on December 31, 2017,2019, the last business day of the registrant’s most recently completed second fiscal quarter, was approximately $716,611,000. As$443,379,667. The number of July 27, 2018, there were 26,529,294 shares outstanding of the registrant’s common stock, $0.01 par value, $.01 per share, outstanding.as of August 20, 2020 was 25,053,082.
DOCUMENTS INCORPORATED BY REFERENCE: Certain designated information contained inREFERENCE
Portions of the registrant’s definitive Proxy Statement for the 2018 Annual Meeting of stockholders, which willproxy statement to be filed with the Securities and Exchange Commission pursuant to Regulation 14A for its 2020 Annual Meeting of the Securities Exchange ActStockholders to be held as of 1934, isNovember 12, 2020 are incorporated by reference into Part III hereof toof this Annual Report on Form 10-K where indicated. Such proxy statement will be filed with the extent described herein.Securities and Exchange Commission within 120 days of the registrant’s fiscal year ended June 30, 2020.
ETHAN ALLEN INTERIORS INC. AND SUBSIDIARIES
TABLE OF CONTENTS
Item
PART I | | Page
|
| |
PART I
|
| |
Item 1.
| Business
| 3
|
| | | |
Item 1A. 1. | Risk Factors
Business | 8
5 |
| | | |
Item 1B. 1A. | Unresolved Staff Comments
Risk Factors | 13
14 |
| | | |
Item 2. 1B. | Properties
Unresolved Staff Comments | 13
22 |
| | | |
Item 3. 2. | Legal Proceedings
Properties | 14
22 |
| | | |
Item 4. 3. | Mine Safety Disclosures
Legal Proceedings | 15
23 |
| | | |
PART II
Item 4. | Mine Safety Disclosures | 23 |
| | | |
PART II | | |
| | |
| Item 5. | Market for Registrant's Common Equity, Related Stockholder Matters and Issuer Purchases of Equity Securities | 15
24 |
| | | |
Item 6. | Selected Financial Data | 17
26 |
| | | |
Item 7. | Management's Discussion and Analysis of Financial Condition and Results of Operation Operations | 18
27 |
| | | |
Item 7A. | Quantitative and Qualitative Disclosures About Market Risk | 28
43 |
| | | |
Item 8. | Financial Statements and Supplementary Data | 28
44 |
| | | |
Item 9. | Changes in and Disagreements with Accountants on Accounting and Financial Disclosure | 50
80 |
| | | |
Item 9A. | Controls and Procedures | 51
80 |
| | | |
Item 9B. | Other Information | 51
80 |
| | | |
PART III | | |
| | | |
Item 10. | Directors, Executive Officers and Corporate Governance | 52
81 |
| | | |
Item 11. | Executive Compensation | 52
81 |
| | | |
Item 12. | Security Ownership of Certain Beneficial Owners and Management and Related ShareholderStockholder Matters | 52
81 |
| | | |
Item 13. | Certain Relationships and Related Transactions, and Director Independence | 52
82 |
| | | |
Item 14. | Principal AccountingAccountant Fees and Services | 52
82 |
| | | |
PART IV | | |
| | | |
Item 15. | Exhibits and Financial Statement Schedules | 52
83 |
| | | |
Item 16. | Form 10-K Summary | 56
86 |
| | | |
SIGNATURES | 57
| 87 |
ETHAN ALLEN INTERIORS INC. AND SUBSIDIARIES
CAUTIONARY NOTE REGARDING FORWARD-LOOKING STATEMENTS (SAFE-HARBOR)
This Annual Report on Form 10-K contains certain statements which may constitute “forward-looking statements” within the meaning of the Private Securities Litigation Reform Act of 1995, Section 27A of the Securities Act of 1933 and Section 21E of the Securities Exchange Act of 1934. Generally, forward-looking statements give current expectations and projections relating to financial condition, results of operations, plans, objectives, future performance and business. A reader can identify forward-looking statements by the fact that they do not relate strictly to historical or current facts. These statements may include words such as “anticipate,” “estimate,” “expect,” “project,” “plan,” “intend,” “believe,” “continue,” “may,” “will,” “short-term,” “target,” “outlook,” “forecast,” “future,” “strategy,” “opportunity,” “would,” “guidance,” “non-recurring,” “one-time,” “unusual,” “should,” “likely,” “COVID-19 impact,” and other words and terms of similar meaning in connection with any discussion of the timing or nature of future operating or financial performance or other events.
Forward-looking statements are subject to risks and uncertainties that may cause actual results to differ materially from those that are expected. Ethan Allen Interiors Inc. and its subsidiaries (the “Company”) derive many of its forward-looking statements from operating budgets and forecasts, which are based upon many detailed assumptions. While the Company believes that its assumptions are reasonable, it cautions that it is very difficult to predict the impact of known factors and it is impossible for the Company to anticipate all factors that could affect actual results and matters that are identified as “short term,” “non-recurring,” “unusual,” “one-time,” or other words and terms of similar meaning may in fact recur in one or more future financial reporting periods. Important factors that could cause actual results to differ materially from the Company’s expectations, or cautionary statements, are disclosed in Item 1A, Risk Factors, Item 7, Management’s Discussion and Analysis of Financial Condition and Results of Operations, and elsewhere in this Annual Report Form 10-K. All forward-looking statements attributable to the Company, or persons acting on its behalf, are expressly qualified in their entirety by these cautionary statements, as well as other cautionary statements. A reader should evaluate all forward-looking statements made in this Annual Report on Form 10-K in the context of these risks and uncertainties. Given the risks and uncertainties surrounding forward-looking statements, you should not place undue reliance on these statements. Many of these factors are beyond our ability to control or predict.
The forward-looking statements included in this Annual Report on Form 10-K are made only as of the date hereof. The Company undertakes no obligation to publicly update or revise any forward-looking statement, whether as a result of new information, future events or otherwise, except as otherwise required by law.
ETHAN ALLEN INTERIORS INC. AND SUBSIDIARIES
PART I
ItemITEM 1. BusinessBUSINESS
Overview
Founded in 1932 and incorporated in Delaware in 1989, Ethan Allen Interiors Inc., through its wholly-owned subsidiary, Ethan Allen Global, Inc., and Ethan Allen Global, Inc.’s subsidiaries (collectively, "We," "Us," "Our," "Ethan Allen"“we,” “us,” “our,” “Ethan Allen” or the "Company"“Company”), is a leading interior design company, and manufacturer and retailer of qualityin the home furnishings.furnishings marketplace. Today we are a leadingglobal luxury international home fashion brand doing business in North America, Asia, the Middle East and Europe. We arethat is vertically integrated from design through delivery, affordingwhich affords our clientele a value proposition of style, quality and price. We offerprovide complimentary interior design service to our clients and sell a full range of furniture products and decorative accents through ethanallen.com and a retail network of approximately 300 design centers in the United States and abroad.abroad as well as online at ethanallen.com. The design centers represent a mix of independent licensees and our ownCompany-owned and operated locations. Our Company operates retail design centers located in the United States and Canada. The independently operated retail segment.design centers are located in the United States, Asia, the Middle East and Europe. We also own and operate nine manufacturing facilities, including six manufacturing plants and one sawmill in the United States, two manufacturing plants in Mexico and one manufacturing plant in Mexico and one in Honduras. Approximately 75% of theour products sold by the Company are manufactured or assembled in ourthese North American plants.facilities.
Available InformationBusiness Strategy
Our website is www.ethanallen.com. Information contained on our website is not part of this Annual Report on Form 10-K. Information that we furnish or file with the Securities and Exchange Commission (the "SEC"), including our Annual Reports on Form 10-K, Quarterly Reports on Form 10-Q, Current Reports on Form 8-K and any amendments to, or exhibits included in, these reports are available for download, free of charge, on our website soon after such reports are filed with or furnished to the SEC. Our SEC filings, including exhibits filed therewith, are also available on the SEC’s website at www.sec.gov. You may obtain and copy any document we furnish or file with the SEC at the SEC’s public reference room at 100 F Street, NE, Room 1580, Washington, D.C. 20549. You may obtain information on the operation of the SEC’s public reference facilities by calling the SEC at 1-800-SEC-0330. You may request copies of these documents, upon payment of a duplicating fee, by writing to the SEC at its principal office at 100 F Street, NE, Room 1580, Washington, D.C. 20549.
Operating Segments
Our two operating segments, the wholesale segment and the retail segment, represent strategic business areas of our vertically integrated enterprise that operate separately and provide their own distinctive services. This vertical structure enables us to offer our complete line of home furnishings and accents while controlling quality and cost more effectively. We evaluate performance of the respective segments based upon revenues and operating income. Inter-segment transactions result, primarily, from the wholesale sale of inventory to the retail segment, including the related profit margin. For certain financial information regarding our operating segments, see Note 15 to the Consolidated Financial Statements included under Item 8 of this Annual Report and incorporated herein by reference.
As of June 30, 2018, the Company operated 148 design centers (our retail segment) and our independent retailers operated 148. Our wholesale segment net sales include sales to our retail segment, which are eliminated in consolidation, sales to our independent retailers and contract sales to unaffiliated third parties. Our retail segment net sales accounted for 77% of our consolidated net sales in fiscal 2018. Our wholesale segment net sales accounted for 23%, including 15.5% of our consolidated net sales in fiscal 2018 to ten of our largest customers, which includes the General Services Administration (“GSA”) government contract business, and licensees operating 105 design centers.
Wholesale Segment Overview:
The wholesale segment, principally involved in the development of the Ethan Allen brand, encompasses all aspects of design, manufacture, sourcing, marketing, sale, and distribution of our broad range of home furnishings and accents. Wholesale revenue is generated upon the sale and shipment of our products to our retail network of independently operated design centers, Company operated design centers and other contract customers.
Within the wholesale segment, we maintain revenue information according to each respective product line (i.e. case goods, upholstery, and home accents and other). Case goods include items such as beds, dressers, armoires, tables, chairs, buffets, entertainment units, home office furniture, and wooden accents. Upholstery items include sleepers, recliners and other motion furniture, chairs, ottomans, custom pillows, sofas, loveseats, cut fabrics and leather. Skilled artisans cut, sew and upholster custom-designed upholstery items which are available in a variety of frame, fabric and trim options. Home accent and other items include window treatments and drapery hardware, wall decor, florals, lighting, clocks, mattresses, bedspreads, throws, pillows, decorative accents, area rugs, wall coverings and home and garden furnishings.
ETHAN ALLEN INTERIORS INC. AND SUBSIDIARIES
Wholesale net sales for each of the last three fiscal years, allocated by product line, were as follows:
| | | Fiscal Year Ended June 30, | |
| | | 2018 | | | 2017 | | | 2016 | |
Case Goods | | | 32 | % | | | 33 | % | | | 32 | % |
Upholstered Products | | | 51 | % | | | 51 | % | | | 51 | % |
Home Accents and Other | | | 17 | % | | | 16 | % | | | 17 | % |
| | | | 100 | % | | | 100 | % | | | 100 | % |
As of June 30, 2018, our wholesale backlog was $56.5 million (as compared to $47.4 million as of June 30, 2017) which is anticipated to be serviced in the first quarter of fiscal 2019. This backlog fluctuates based on the timing of net orders booked, manufacturing schedules and efficiency, the timing of sourced product receipts, the timing and volume of wholesale shipments, and the timing of various promotional events. Because orders may be rescheduled and/or canceled and the sourcing timing may change, the measure of backlog at a point in time is not necessarily indicative of future sales performance.
Our independent retailers are required to enter into license agreements with us, which (i) authorize the use of certain Ethan Allen trademarks and (ii) require adherence to certain standards of operation, including a requirement to fulfill related warranty service agreements. We are not subject to any territorial or exclusive retailer agreements in North America.
Wholesale profitability includes (i) the wholesale gross margin, which represents the difference between the wholesale net sales price and the cost associated with manufacturing and/or sourcing the related product, and (ii) other operating costs associated with wholesale segment activities.
Retail Segment Overview:
The retail segment sells home furnishings and accents to consumers through a network of Company operated design centers. Retail revenue is generated upon the retail sale and delivery of our products to our retail customers through our network of service centers. Retail profitability reflects (i) the retail gross margin, which represents the difference between the retail net sales price and the cost of goods, purchased primarily from the wholesale segment, and (ii) other operating costs associated with retail segment activities.
We measure the performance of our design centers based on net sales and written orders booked on a comparable period basis. Comparable design centers are those which have been operating for at least 15 months, including relocated design centers provided the original and relocated design center location had been operating for at least 15 months on a combined basis. During the first three months of operations of newly opened design centers, written orders are booked but minimal net sales are achieved through the delivery of products. Design centers we acquire from independent retailers are included in comparable design center sales in their 13th full month of Ethan Allen-owned operations. The frequency of our promotional events as well as the timing of the end of those events can also affect the comparability of orders booked during a given period. During fiscal 2018, the Company added five new design centers in the United States, including two acquired from independent retailers and one relocation, and closed five locations, including one relocation. The geographic distribution of retail design center locations is included under Item 2 of Part I of this Annual Report.
Retail net sales for each of the last three fiscal years, allocated by product line, were as follows:
| | | Fiscal Year Ended June 30, | |
| | | 2018 | | | 2017 | | | 2016 | |
Case Goods | | | 30 | % | | | 30 | % | | | 31 | % |
Upholstered Products | | | 48 | % | | | 48 | % | | | 47 | % |
Home Accents and Other | | | 22 | % | | | 22 | % | | | 22 | % |
| | | | 100 | % | | | 100 | % | | | 100 | % |
ETHAN ALLEN INTERIORS INC. AND SUBSIDIARIES
Products
Our strategy has been to position Ethan Allen as a preferred brand offering complimentary design service together with products of superior style, quality and value to provide consumerscustomers with a comprehensive, one-stop shopping solution for their home furnishing and interior design needs. In carrying out our strategy, we continue to expand our reach to a broader consumer base through a diverse selection of attractively priced products, designed to complement one another, reflecting current fashion trends in home decorating. We continuously monitor changes in home fashion trends through attendance at international industry events and fashion shows, internal market research, and regular communication with our retailers and design center design consultants who provide valuable input on consumer trends. We believe that the observations and input gathered enable us to incorporate appropriate style details into our products to react quickly to changing consumercustomer tastes. We are receiving strong customer interest in our recently introduced products including Lucy, a mid-century modern inspired upholstery collection and Farmhouse, a country cottage inspired furniture collection.
75%Our strong network of North American interior design consultants continues to create design solutions that best satisfy our customers’ needs. We believe changes in consumer spending and new habits being formed as a result of social distancing and sheltering in place brought about by the COVID-19 pandemic will create opportunities for our brand. Now more than ever, home is a haven, and we are here to help the customer reimagine their homes. We continue to generate business through our retail design center network and by interacting virtually with our customers through ethanallen.com. Our design consultants engage with customers working safely in our design centers and remotely utilizing technology, including the Ethan Allen inHome augmented reality app, the 3D room planner tool, Live Chat on ethanallen.com, Skype and FaceTime.
At Ethan Allen, our internet strategy is to generate business by combining technology with excellent personal service. Though our customers have the opportunity to buy our products online, we take the process further. With so much of our furniture is builtproduct customizable, we encourage our website customers to get personal help from our interior design professionals either in person or by artisans,chatting online with one pieceof our qualified design consultants. This complimentary direct contact with one of our knowledgeable interior design consultants, whether remotely or in-person, creates a competitive advantage through our excellent personal service. This enhances the online experience and regularly leads to internet customers becoming customers of our network of interior design centers. In the past three months, we have seen our internet business double as we have increased our use of technology and the related customer experience.
We plan to further invest in our digital footprint, including our website, in order to enhance our customer experience. We are also continually improving our customers’ journey from the time they land on our website to the delivery of their purchase through our white glove home delivery service. We view the combination of online traffic and design center traffic in a holistic fashion whereby our customer generally experiences our brand on our website before visiting a design center in person. Our online traffic continues to increase each year and our marketing teams remain focused on enhancing our digital outreach strategies to further drive more traffic and keep our brand relevant in today’s social media oriented world.
ETHAN ALLEN INTERIORS INC. AND SUBSIDIARIES
Developments Regarding, and Actions Taken in Response to, COVID-19
On March 11, 2020, the World Health Organization declared the COVID-19 outbreak to be a global pandemic. In response to this declaration and the rapid ongoing spread of COVID-19 within the United States and around the world, federal, state and local governments have imposed varying degrees of restrictions on social and commercial activity to promote social distancing in an effort to slow the spread of the virus. Such measures included quarantines, shelter-in-place orders and directives, restrictions on travel, and closures of non-essential businesses, which included many sectors within retail commerce. In response to these requirements and for the protection of our employees and customers, we implemented certain business continuity plans to ensure the ongoing availability of our services, while prioritizing health and safety measures, including temporarily closing of our design centers and most of our manufacturing plants, implementing enhanced cleaning and hygiene protocols as recommended by the Centers for Disease Control and Prevention (“CDC”), and implementing remote work policies, where possible.
The Company began to experience the initial impact of COVID-19 on customer demand in the second half of February 2020 and the decreased demand continued to persist into our fiscal 2020 fourth quarter. As a result, the Company implemented a number of mitigating safety and cost-saving measures.
On March 19, 2020, we announced that our Company-owned retail design centers in North America were temporarily closed or remained open by appointment only, in response to the COVID-19 health crisis. We continued to serve our clients by appointment in our physical locations or virtually. For the well-being of our associates, we also provided them the ability to work from home during this national health crisis, where possible.
On March 23, 2020, we borrowed an aggregate principal amount of $80 million under our existing revolving credit facility. Prior to such borrowing, there were no borrowings outstanding under the credit facility. On March 30, 2020, we borrowed an additional $20 million under the credit facility. We subsequently repaid $50 million of our borrowings in June 2020. The outstanding borrowings bear interest at a rate equal to the one-month LIBOR rate plus a spread using a debt leverage pricing grid. We may repay amounts borrowed at any time without penalty. The Company, while currently having available cash on its balance sheet and no outstanding debt, elected to draw on the credit facility to increase its cash position as a precautionary measure and to maximize financial flexibility in light of the uncertainty surrounding the ongoing impact of COVID-19.
On April 1, 2020, we announced our comprehensive action plan in response to the COVID-19 health crisis, which combined both health and safety as well as cost-saving initiatives. Measures taken included, among other things, the temporary closure of design centers and manufacturing facilities, the furlough of 70% of our global workforce, the decision by our CEO to temporarily forego his salary through June 30, 2020, a temporary reduction in salaries of up to 40% for all senior management and up to 20% for other salaried employees through June 30, 2020, a temporary reduction of 50% in the cash compensation of the Company’s directors through June 30, 2020, the elimination of all non-essential operating expenses, a delay of capital expenditures, the temporary suspension of the regular quarterly dividend and temporarily halted the share repurchase program.
On April 22, 2020, we issued a press release providing business updates, including an update to our COVID-19 action plan which emphasized our continued focus on the health, safety and well-being of our associates, our customers, and the communities in which we operate. Our update emphasized the continued evaluation of plans and timing as it related to the planned reopening of our design centers and to restarting production in our North American workshops.manufacturing plants.
On May 11, 2020, we reported our fiscal 2020 third quarter results and provided an update on our COVID-19 action plan. In addition to the financial results disclosed in our press release, we also announced that we began reopening design centers in a number of U.S. states since May 1, 2020 and began resuming production in some of its North American manufacturing plants in a limited capacity to work through existing backlog and to be in a position to service expected demand as the economy begins to reopen for business. We further announced that our distribution and home delivery centers were open and making home deliveries.
On August 4, 2020, we announced that all of our Company-operated retail design centers reopened, including 14% open by appointment only. We also resumed production in our North American manufacturing plants during the second half of our fiscal 2020 fourth quarter, some in a limited capacity, and expect to work through existing order backlog and ramp up to full production by the end of August 2020. The temporary salary reductions were lifted, effective June 30, 2020, as planned. The Board of Directors also reinstated the regular quarterly dividend. Lastly, we have brought back approximately 56% of our associates previously furloughed in April 2020.
ETHAN ALLEN INTERIORS INC. AND SUBSIDIARIES
The COVID-19 crisis challenged our operations during fiscal 2020, but our associates did well in persevering through these challenges. Our primary focus was operating in a safe manner, for our associates and clients. As our design centers began to reopen, we implemented various mitigating and safety protocols recommended by the CDC guidelines for operating businesses safely. We established logistics for the supply of hand sanitizer and related dispensers, disinfectant cleaning supplies, masks and nitrile gloves, and we increased the cleaning frequency of our design centers and other facilities. As a result of these additional supplies and cleaning regimes based on the CDC’s safe business protocols, we incurred incremental costs during fiscal 2020. These costs, which were less than $1.0 million, are reflected within our selling, general and administrative expenses. We expect to incur a similar level of expenses associated with safety and additional hygiene measures on an ongoing basis for the foreseeable future. For the safety of our associates in our design centers we require all associates and clients to wear masks. So far, we have been fortunate with very few cases of COVID-19 throughout our enterprise, which resulted in no disruptions to our operations.
We continue to manage the impact of the COVID-19 crisis on a daily basis. As of the date of this filing, we are unable to predict the ultimate impact COVID-19 will have on our financial operations in the near and long term remains unknown. The timing of any future actions in response to COVID-19 is largely dependent on the mitigation of the spread of the virus, status of government orders, directives and guidelines, recovery of the business environment, economic conditions, and consumer demand for our products.
Product
The majority of the products we sell are built by artisans in our North American plants. Most upholstery frames are hand-assembled and stitching is guided by hand. We select international partners who are as committed to quality and social responsibility as we are. All case goods frames are made with premium lumber and veneers. We use best-in-class construction techniques, including mortise and tenon joinery and four-corner glued dovetail joinery on drawers. We combine technology with personal service and maintain an up-to-date broad range of styles and custom options in keeping with today’s home decorating trends. These factors continue to define Ethan Allen, positioning us as a fashion leader in the home furnishing industry.
The interior of our design centers which were substantially refreshed during the past three fiscal years, are organized to facilitate display of our product offerings, both in room settings that project the category lifestyle and by product grouping to facilitate comparisons of the styles and tastes of our clients.customers. To further enhance the experience, technology is used to expand the range of products viewed by including content from our website and 3D digital images in applications used on large touch-screen flat panel displays.
Product Development and Sourcing Activities
Using a combination of on staffemployees and outsourced product designers, we design and build the majority of the products we sell. All of our products are branded Ethan Allen.Allen branded. This important facet of our vertically integrated business enables us to control the design specifications and establish consistent levels of quality across the products inall our own North American plants.product programs. In addition to our seven U.S.six United States manufacturing facilities, we have antwo upholstery manufacturing facilityplants in Mexico and a case goods manufacturing facility in Honduras. Approximately 75% of the products we sell are manufactured or assembled in these North American facilities. We selectively outsource the remaining 25%, mostly of our products, primarily from Asia. We carefully select our sourcing partners and require them to provide products according tostrict compliance with our specifications, quality and qualitysocial responsibility standards. We believe that our strategic investments in our manufacturing facilities balanced with outsourcing from foreign and domestic suppliers will enable us to accommodate any significant future sales growth and allow us to maintain an appropriate degree of control over cost, quality and service to our customers.
Environmental Sustainability and Social Responsibility
We are focused on environmental and social responsibility and incorporating uniform social, environmental, health and safety programs into our manufacturing standards.
Our “green” initiatives include but are not limited to the use of responsibly harvested Appalachian woods, water-based finishes and measuring our carbon footprint, greenhouse gases and recycled materials from our operations. We have eliminated the use of heavy metals and hydrochloroflourocarbons in all packaging. Our mattresses and custom upholstery use foam made without harmful chemicals and substances. We have implemented the Enhancing Furniture’s Environmental Culture (EFEC) environmental management system sponsored by the American Home Furnishing Alliance (AHFA) at all our domestic manufacturing, distribution and service center facilities, and have expanded these efforts to our retail design centers, which have now been registered in EFEC. Our Mexico and Honduras facilities have been audited and are registered under the AHFA's EFEC program. Our domestic manufacturing, distribution and service centers have also achieved Sustainable by Design (SBD) registration status under the EFEC program. SBD provides a framework for home furnishings companies to create and maintain a corporate culture of conservation and environmental stewardship by integrating socio-economic policies and sustainable business practices into their manufacturing operations and sourcing strategies.
The Company requires its sourcing facilities that manufacture Ethan Allen branded products to implement a labor compliance program and meet or exceed the standards established for preventing child labor, involuntary labor, coercion & harassment, discrimination, and restrictions to freedom of association. These facilities must also provide a safe and healthy environment in all workspaces, compliance with all local wage and hour laws and regulations, compliance with all applicable environmental laws and regulations, and they must authorize Ethan Allen and/or its designated agents (including third-party auditing companies) to engage in monitoring activities to confirm compliance.
We work to ensure our products are safe in our customers’ homes through responsible use of chemicals and manufacturing substances.
Raw Materials and Other Suppliers
The most important raw materials we use in furniture manufacturing are lumber, veneers, plywood, hardware, glue, finishing materials, glass, laminates, steel, fabrics, foam, and filling material. The various types of wood used in our products include cherry, ash, oak, maple, prima vera, African mahogany, birch, rubber wood and poplar.
ETHAN ALLEN INTERIORS INC. AND SUBSIDIARIES
Fabrics and other raw materials are purchased both domestically and outside the United States.States . We have no significant long-term supply contracts and have sufficient alternate sources of supply to prevent disruption in supplying our operations. We maintain a number of sources for our raw materials, which we believe contribute to our ability to obtain competitive pricing. Lumber prices and availability fluctuate over time based on factors such as weather and demand. The cost of some of our raw materials such as foam and shipping costs are dependent on petroleum cost. Higher material prices, cost of petroleum, and costs of sourced products could have an adverse effect on margins.
Appropriate amounts of lumber and fabric inventory are typically stocked to maintain adequate production levels. We believe that our sources of supply for these materials are sufficient and that we are not dependent on any one supplier.
We enter into standard purchase agreements with certain foreign and domestic suppliers to source selected products. The terms of these arrangements are customary for the industry and do not contain any long-term contractual obligations on our behalf. We believe we maintain good relationships with our suppliers.
ETHAN ALLEN INTERIORS INC. AND SUBSIDIARIES
Segments
We have strategically aligned our business into two reportable segments: Wholesale and Retail. Our operating segments are aligned with how the Company, including our chief operating decision maker, manages the business. These two segments represent strategic business areas of our vertically integrated enterprise that operate separately and provide their own distinctive services. This vertical structure enables us to offer our complete line of home furnishings and accents while controlling quality and cost. We evaluate performance of the respective segments based upon net sales and operating income. Inter-segment transactions result, primarily, from the sale of wholesale inventory to the retail segment, including the related profit margin. Financial information, including sales, operating income and long-lived assets related to our segments are disclosed in Note 19, Segment Information, of the notes to our consolidated financial statements included under Item 8 of this Annual Report on Form 10-K.
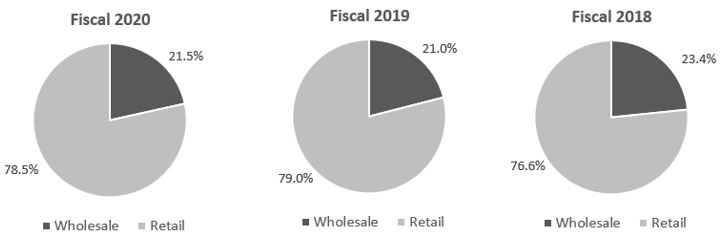
As of June 30, 2020, the Company operated 144 design centers (our retail segment) and our independent retailers operated 160 design centers. Our wholesale segment’s net sales include sales to our retail segment, which are eliminated in consolidation, and sales to our independent retailers and other unaffiliated third parties. Our retail segment net sales accounted for 78.5% of our consolidated net sales in fiscal 2020. Our wholesale segment net sales accounted for the remaining 21.5%.
The following charts depict net sales related to our reportable segments.
We believe that the demand for furniture generally reflects sensitivity to overall economic conditions, including consumer confidence, discretionary spending, housing starts, sales of new and existing homes, housing values, the level of mortgage refinancing, debt levels, retail trends and unemployment rates. For both our segments, the second and fourth quarters are historically the seasonally highest-volume sales quarters. However, during fiscal 2020, we experienced our largest sales volume quarter for our wholesale business during the first quarter while our retail segment had its highest sales volume during the second quarter. We believe this fiscal 2020 experience was not an indicator that our seasonal trends are changing and was primarily due to disruptions in the market caused by the COVID-19 pandemic in the second half of fiscal 2020.
Retail Segment
The retail segment, which accounted for 78.5% of net sales during fiscal 2020, sells home furnishings and accents to clients through a network of Company-operated design centers. Retail revenue is generated upon the retail sale and delivery of our products to our retail customers through our network of retail home delivery centers. Retail profitability reflects (i) the retail gross margin, which represents the difference between the retail net sales price and the cost of goods, purchased from the wholesale segment, and (ii) other operating costs associated with retail segment activities.
We measure the performance of our design centers primarily based on net sales and profitability on a comparable period basis. The frequency of our promotional events as well as the timing of the end of those events can affect the comparability of net sales during a given period. Due to the nature of the business in which the retail segment operates, there are no customer concentration risks.
The retail segment’s product line revenue, expressed as a percentage of net sales, is comprised of approximately 48% in upholstered products, 29% case goods and the remaining 23% in home accents and other.
During fiscal 2020, we acquired one new design center in the United States from an independent retailer, opened two and closed three locations, which is net of seven relocations. The geographic distribution of retail design center locations is disclosed under Item 2, Properties, contained in Part I of this Annual Report on Form 10-K.
ETHAN ALLEN INTERIORS INC. AND SUBSIDIARIES
Wholesale Segment
The wholesale segment, which accounted for 21.5% of net sales during fiscal 2020, is principally involved in the development of the Ethan Allen brand and encompasses all aspects of design, manufacturing, sourcing, marketing, sale and distribution of our broad range of home furnishings and accents. Wholesale revenue is generated upon the sale and shipment of our products to our retail network of independently operated design centers, Company-operated design centers and other contract customers. Sales to ten of our largest customers accounted for 27% of revenues within our wholesale segment during fiscal 2020.
Within the wholesale segment, we maintain revenue information according to each respective product line (i.e. case goods, upholstery and home accents). Case goods include items such as beds, dressers, armoires, tables, chairs, buffets, entertainment units, home office furniture and wooden accents. Upholstery items include sleepers, recliners and other motion furniture, chairs, ottomans, custom pillows, sofas, loveseats, cut fabrics and leather. Skilled artisans cut, sew and upholster custom-designed upholstery items which are available in a variety of frame, fabric and trim options. Home accent items include window treatments and drapery hardware, wall décor, florals, lighting, clocks, mattresses, bedspreads, throws, pillows, decorative accents, area rugs, wall coverings and home and garden furnishings.
Wholesale profitability includes (i) the wholesale gross margin, which represents the difference between the wholesale net sales price and the cost associated with manufacturing and/or sourcing the related product, and (ii) other operating costs associated with wholesale segment activities.
The wholesale segment’s product line revenue, expressed as a percentage of net sales, is comprised of approximately 48% in upholstered products, 34% case goods and the remaining 18% in home accents and other.
As of June 30, 2020, our wholesale backlog was $63.8 million, up 37.6% compared with $46.4 million a year ago. Our backlog increased due to a 17.5% increase in wholesale orders booked in June 2020 combined with our inability to quickly return our manufacturing plants to desired staffing levels due to COVID-19 related restrictions, including safe workplace environment requirements and social distancing. These restrictions have kept production and net shipments below the prior year rate. The strong product demand, coupled with ramping up manufacturing, has also resulted in extended lead times between order and delivery and slower-than-normal delivered sales. We resumed production in our North American manufacturing plants during the second half of the fourth quarter of fiscal 2020, some in a limited capacity, and expect to work through this existing order backlog during the first half of fiscal 2021. Our wholesale backlog fluctuates based on the timing of net orders booked, manufacturing schedules and efficiency, the timing of sourced product receipts, the timing and volume of wholesale shipments, and the timing of various promotional events.
Our independent retailers are required to enter into license agreements with us, which (i) authorize the use of certain Ethan Allen trademarks and (ii) require adherence to certain standards of operation, including a requirement to fulfill related warranty service agreements. We are not subject to any territorial or exclusive retailer agreements in North America.
The geographic distribution of manufacturing and distribution locations is disclosed under Item 2, Properties, contained in Part I of this Annual Report on Form 10-K.
Talent
Since our founding, we have built a collaborative culture that recognizes and rewards innovation and offers employees a variety of opportunities and experiences. After almost nine decades in business, the name Ethan Allen is well known and highly regarded in the home furnishings marketplace. Our employees are vital to our success and are one of the main reasons we continue to execute at a high level. We believe our employees have an entrepreneurial spirit, a passion for style, a drive for excellence, outstanding communication skills and create a culture that embraces creativity, integrity, diversity, innovation and inclusion of people from all backgrounds. Our continued focus on making employee engagement a top priority will help us provide high quality products and services to our customers.
At June 30, 2020 our employee count totaled 3,369, a decrease from 4,736 a year ago. We are gratified with the work and focus of our teams during the unprecedented crisis caused by the ongoing COVID-19 pandemic. We have had to make many hard decisions including the furlough of approximately 70% of our global workforce in April 2020. Fortunately, we have been able to bring many associates back with 56% of them having returned to work by June 30, 2020. The majority of our employees are employed on a full-time basis and we believe we maintain good relationships with our employees. None of our employees are represented by unions or collective bargaining agreements.
ETHAN ALLEN INTERIORS INC. AND SUBSIDIARIES
Customer Service Offerings
We offer numerous customer service programs, each of which has been developed and introduced to customers in an effort to make their shopping experience easier and more enjoyable.
Gift Card. This program allows customers to purchase and redeem gift cards through our website or at any participating retail design center, which can be used for any of our products or services.
Ethan Allen Consumer Credit. The Ethan Allen Platinum Card consumer credit program offers customers a menu of custom financing options. Financing offered through this program is administered by a third-party financial institution and is granted to our customers on a non-recourse basis to the Company. Customers may apply for an Ethan Allen Platinum card at any participating design center or online at ethanallen.com.
Marketing
“We Make the American HomeTM,” Ethan Allen’s marketing mission statement, drives home our core brand values: Quality and Craftsmanship, Complimentary Design Service and Premier In-Home Delivery. We amplify those values through a dynamic brand story told across three predominant lifestyles—Classic, Country/Coastal and Modern—thus promoting a broad, yet curated range of products, resulting in a superlative combination of product value and personal service.
By adopting a fresh, ever-evolving creative approach, we have reinvigorated our brand, enhancing its desirability and visibility while driving both new and repeat client traffic to our approximately 300 design centers network-wide and to our primary website, ethanallen.com. We consider the breadth and depth of our product offerings, enhanced by the countless custom options we offer, to be a key competitive advantage.
Using our fully integrated customer relationship management system, we create personalized customer journeys, targeted communications, and retargeting campaigns. We develop persuasive, aspirational, and relevant messaging, and we convey it through a variety of media including direct mail, national and local TV and radio, digital and social channels and email marketing, which has positively impacted both traffic and conversion nationwide.
As our e-commerce sales continue increasing at double-digit rates, we have implemented conversion rate optimization updates on both ethanallen.com and ethanallen.ca. We also invest in targeted search engine optimization and paid search marketing, for both national and local markets, driving both referral traffic to our website and physical traffic to our design centers. In addition, improved on-site search capabilities, expanded Live Chat services, online appointment booking capability, and product listing and display page enhancements have elevated the user experience.
We have increased brand visibility on Facebook, Instagram, and Pinterest, with a greater emphasis on visual and video-driven content. Both paid social media campaigns and organic social media presence have helped us grow our social following by 20%, drive revenue, and take a more prominent place in the cultural conversation.
By investing in digital design technologies, we have expanded our virtual design appointment capabilities. EA inHome®, an augmented reality mobile app, empowers clients to preview Ethan Allen products in their homes, at scale, in a variety of fabrics and finishes. With the 3D Room Planner, our designers generate both 2D floor plans and immersive, incredibly realistic 3D walk-throughs of the designs they create. These technologies have been pivotal to our ability to serve clients remotely during the ongoing COVID-19 pandemic. Clients can shop with confidence, knowing that they’re investing in beautiful, cohesive room designs and pieces that suit their space.
Once clients reach the point of purchase, we offer enticing financing options through the Ethan Allen Platinum Card, a third party-administered consumer credit program. Designed to make Ethan Allen accessible to everyone, the card launched successfully nationwide and continues to attract both new and recurring clients, driven by a recent offer of 0% APR for 48-months, which aided conversion and order size.
Competition
We believe the home furnishings industry competes primarily on the basis of product styling and quality, personal service, prompt delivery, product availability and price. We further believe that we effectively compete on the basis of each of these factors and that, more specifically under our vertical structure, our complimentary interior design service, direct manufacturing, white glove delivery service, product presentations, and website create a competitive advantage, further supporting our mission of providing customers with a complete home decorating and design solution. We also believe that we differentiate ourselves further with the quality of our interior design service through our intensive training and the caliber of our design consultants. Our objective is to continue to develop and strengthen our retail network by (i) expanding the Company-operated retail business through the repositioning and opening of new design centers, (ii) obtaining and retaining independent retailers, encouraging such retailers to expand their business through the opening or relocation of new design centers with the objective of increasing the volume of their sales, (iii) further expanding our sales network through our independent design associates and realtor referral programs, and (iv) further expanding our ecommerce.
ETHAN ALLEN INTERIORS INC. AND SUBSIDIARIES
Retail Design Centers
We continue to strengthen the Ethen Allen brand with many initiatives, including the opening of new design centers and relocating or consolidating certain existing design and home delivery centers, regularly updating presentations and floor plans, and strengthening of the qualifications of our designers through training and certification. Combining technology with personal service in our design centers has allowed us to reduce the size of our design centers. In the past five years, we have either opened or relocated a total of 29 new design centers that have an average size of approximately 9,300 square feet. These smaller footprint design centers reflect our direction as we move forward in repositioning our retail design centers. These new and relocated design centers also reflect our shift from destination and shopping mall locations to lifestyle centers that better project our brand and offer increased traffic opportunities.
Ethan Allen design centers are typically located in busy retail settings as freestanding destinations or as part of town centers, lifestyle centers, suburban strip malls or shopping malls, depending upon the real estate opportunities in a particular market. Our 144 Company-operated retail design centers average approximately 15,000 square feet in size with 59% of them ranging between 10,000 and 20,000 square feet, while 25% being less than 10,000 square feet and the remaining 16% being greater than 20,000 square feet. During the past 10 years, 52% of our design centers are new or have been relocated.
We strive to maintain consistency of presentation throughout our retail design centers through a comprehensive set of standards and display planning assistance. These interior display design standards enable each design center to present a high-quality image by using focused lifestyle settings and select product category groupings to display our products and information to facilitate design solutions and to educate consumers. We also create a consistent brand projection through our exterior facades and signage.
Distribution and Logistics
We distribute our products through threefour distribution centers, owned by the Company, strategically located in New Jersey,North Carolina, Oklahoma, and Virginia. These distribution centers provide efficient cross-dock operations to receive and ship product from our manufacturing facilities and third-party suppliers to our retail network of Company and independently operated retail servicehome delivery centers. Retail servicehome delivery centers prepare products for delivery into clients’customers’ homes. At June 30, 2018, the Company operated2020, our Company-operated retail design centers were supported by 14 Company operated16 Company-operated retail servicehome delivery centers and 15 service10 home delivery centers operated by third parties.
While we manufacture to custom order the majority of our products, we also stock selectedcertain case goods, upholstery and home accents to provide for quick delivery of in-stock items and to allow for more efficient production runs. We utilize independent carriers to ship our products.
Our practice has been to sell our products at the same delivered cost to all Company and independently operated design centers in North America,throughout the United States, regardless of their shipping point. This policy creates pricing credibility with our wholesale customers while providing our retail segment the opportunity to achieve more consistent margins by removing fluctuations attributable to the cost of shipping. Further, this policy eliminates the need for our independent retailers to carry significant amounts of inventory in their own warehouses. As a result, we obtain more accurate consumer product demand information.
Marketing ProgramsEnvironmental Sustainability and Social Responsibility
We continue to be focused on environmental and social responsibility while incorporating uniform social, environmental, health and safety programs into our global manufacturing standards.
Our multifaceted, multichannel marketingenvironmental (green) initiatives include but are not limited to the use of responsibly harvested Appalachian woods, and advertising strategies drive traffic bothwater-based finishes and measuring our carbon footprint, greenhouse gases and recycled materials from our operations. We have eliminated the use of heavy metals and hydrochlorofluorocarbons in all packaging. Our mattresses and custom upholstery use foam made without harmful chemicals and substances. We have implemented the Enhancing Furniture’s Environmental Culture (“EFEC”) environmental management system sponsored by the American Home Furnishing Alliance (“AHFA”) at all our domestic manufacturing, distribution and home delivery center facilities, and have expanded these efforts to our retail design centers, which have now been registered in EFEC. Our Mexico and our digital mediums. We believe these efforts give usHonduras facilities are also registered under the AHFA's EFEC program. Our United States manufacturing, distribution and home delivery centers have also achieved Sustainable by Design (“SBD”) registration status under the EFEC program. SBD provides a strong competitive advantage in theframework for home furnishings industry while benefiting our worldwide retail networkcompanies to create and maintain a corporate culture of approximately 300 design centers as well as the independent members of our Interior Design Affiliate program.
Our team of advertising specialists work to position Ethan Allen as an authority on design, a leader in exemplary service,conservation and a source of style for everyone. In our marketing campaigns, we capitalize on Ethan Allen's strong brand equity, finding creativeenvironmental stewardship by integrating socio-economic policies and compelling ways to promote our tremendous range of products, services, special programs,sustainable business practices into their manufacturing operations and custom options. We deliver these messages in a variety of ways – locally, nationally, and globally – to connect and engage with our target audience and drive sales.
As digital channels have taken on increasing importance, we continue to expand our digital marketing reach – supplementing traditional advertisingsourcing strategies. Our channels include digital and social media, national and local television, direct mail, national and local newspapers, local and satellite radio, and local shelter magazines. Additionally, our robust email marketing program delivers inspiration, sales messages, design solutions, and product information to an ever-expanding database of current and potential clients.
Our direct mail magazine, which emphasizes the breadth of our products and services, is one of Ethan Allen's key marketing tools. We produce these magazines multiple times a year; in fiscal 2018, we distributed approximately 17 million copies. We distribute them to targeted marketing segments based on data collected internally and through independent market research. We continually refine our direct mail marketing lists to target clients and potential clients who are most likely to purchase, which provides better returns on direct mail expenditures.
ETHAN ALLEN INTERIORS INC. AND SUBSIDIARIES
Our websites – ethanallen.comThe Company requires its sourcing facilities that manufacture Ethan Allen branded products to implement a labor compliance program and ethanallen.ca – undergo continuous conversion optimizationmeet or exceed the standards established for preventing child labor, involuntary labor, coercion and harassment, discrimination, and restrictions to boost sales as clients shop, design,freedom of association. These facilities are also required to provide a safe and purchase. We also have a web presence to support our international licensees – in some cases, using local languages;healthy environment in all cases, linking backworkspaces, compliance with all local wage and hour laws and regulations, compliance with all applicable environmental laws and regulations, and are required to ethanallen.com. These websites positionauthorize Ethan Allen or its designated agents (including third-party auditing companies) to engage in a manner consistent with our brand yet specificmonitoring activities to the region.
A robust and informative Extranet connects our retail network, keeping the lines of communication open among our retailers, design professionals, merchandisers, trainers, and corporate personnel. Information about every aspect of Ethan Allen's retail business is shared here, including advertising materials, prototype floor plan displays, and extensive product details.
Retail Design Centers
Ethan Allen design centers are typically located in busy retail settings as freestanding destinations or as part of town centers, lifestyle centers, suburban strip malls or shopping malls, depending upon the real estate opportunities in a particular market. Our design centers average approximately 15,000 square feet in size with 46% between 15,000 and 25,000 square feet and 50% less than or equal to 15,000 square feet and 4% greater than 25,000 square feet.
Combining technology with personal service in our design centers has allowed us to reduce the size of our design centers. As of June 30, 2018 we operated 18 new design centers that have opened in the past three years, and these average 9,300 square feet. These smaller footprint design centers reflect our direction as we move forward in repositioning our retail design centers. These new and relocated design centers also reflect our shift from destination and shopping mall locations to lifestyle centers that better project our brand and offer increased traffic opportunities.confirm compliance.
We strivework to maintain consistency of presentation throughout our retail design centers through a comprehensive set of standards and display planning assistance. These interior display design standards assist each design center in presenting a high quality image by using focused lifestyle settings and select product category groupings to displayensure our products are safe in our customers’ homes through responsible use of chemicals and information to facilitate design solutions and to educate consumers. We also create a consistent brand projection through our exterior facades and signage. The establishment of these standards has helped position Ethan Allen as a leader in the home furnishings industry.manufacturing substances.
We continue to strengthen the Ethen Allen brand with many initiatives, including the opening of new and relocating design centers in desirable locations, updating presentations and floor plans, strengthening of the professionalism of our designers through training and certification, and the consolidation of certain design centers and service centers.
PeopleIntellectual Property
At June 30, 2018 and June 30, 2017, the Company, through its subsidiaries, had approximately 5,200 employees. The majority of our employees are employed on a fulltime basis and we believe we maintain good relationships with our employees, none of whom are represented by unions.
Customer Service Offerings
We offer numerous customer service programs, each of which has been developed and introduced to consumers in an effort to make their shopping experience easier and more enjoyable.
Gift Card
This programallows customers to purchase and redeem gift cards through our website or at any participating retail design center, which can be used for any of our products or services.
Ethan Allen Consumer Credit Programs
The Ethan Allen Platinum program offers consumers (clients) a menu of custom financing options. Financing offered through this program is administered by a third-party financial institution and is granted to our customers on a non-recourse basis to the Company. Clients may apply for an Ethan Allen Platinum card at any participating design center or on-line at ethanallen.com.
Competition
We believe the home furnishings industry competes primarily on the basis of product styling and quality, personal service, prompt delivery, product availability and price. We further believe that we effectively compete on the basis of each of these factors and that, more specifically, our complimentary interior design service, direct manufacturing, product presentations, and website create a distinct competitive advantage, further supporting our mission of providing consumers with a complete home decorating and design solution. We also believe that we differentiate ourselves further with the quality of our interior design service through our intensive training. Our objective is to continue to develop and strengthen our retail network by (i) expanding the Company operated retail business through the repositioning of and opening of new design centers, (ii) obtaining and retaining independent retailers, encouraging such retailers to expand their business through the opening or relocation of new design centers with the objective of increasing the volume of their sales, (iii) further expanding our sales network through our IDA and realtor referral programs and (iv) further expanding our ecommerce.
The internet provides a highly competitive medium for the sale of a significant amount of home furnishings each year, and we believe it is becoming increasingly important. Much of that product is sold through commodity oriented, low priced and low service retailers. We believe consumers are spending more time researching on the internet and are thus better informed when they do visit our brick and mortar facilities. At Ethan Allen our internet strategy is to drive traffic into our design centers by combining technology with excellent personal service. Though our customers have the opportunity to buy our products on-line, we take the process further. With so much of our product customizable, we encourage our website customers to get personal help from our interior design professionals either in person or by chatting on-line with one of our qualified design consultants. This complimentary direct contact with one of our knowledgeable interior designers creates a competitive advantage through our excellent personal service. This enhances the online experience and regularly leads to internet customers becoming clients of our network of interior design centers.
ETHAN ALLEN INTERIORS INC. AND SUBSIDIARIES
The internet provides a highly competitive medium for the sale of a significant amount of home furnishings each year, and we believe it is becoming increasingly important. Much of that product is sold through commodity oriented, low priced and low service retailers. We believe consumers are spending more time researching on the internet and are thus better informed when they do visit our brick and mortar facilities. At Ethan Allen our internet strategy is to drive traffic into our design centers by combining technology with excellent personal service. Though our customers have the opportunity to buy our products on-line, we take the process further. With so much of our product customizable, we encourage our website customers to get personal help from our interior design professionals either in person or by chatting on-line with one of our qualified design consultants. This complimentary direct contact with one of our knowledgeable interior designers creates a competitive advantage through our excellent personal service. This enhances the online experience and regularly leads to internet customers becoming clients of our network of interior design centers.
Trademarks
We currently hold, or have registration applications pending for, numerous trademarks, service marks and copyrights for the Ethan Allen name, logos and designs in a broad range of classes for both products and services in the United States and in many foreign countries. In addition, we have registered, or have applications pending for certain of our slogans utilized in connection with promoting brand awareness, retail sales and other services and certain collection names. In addition, we have registered and maintain the internet domain name of ethanallen.com. We view such trademarks, andlogos, service marks and domain names as valuable assets and have an ongoing program to diligently monitor and defend, through appropriate action, against their unauthorized use.
Executive OfficersGovernment Regulation
The Company is subject to reporting requirements, disclosure obligations and other recordkeeping requirements of the RegistrantSecurities and Exchange Commission (“SEC”) and the various local authorities that regulate each location in which we operate.
Set forth
Corporate Contact Information
Ethan Allen’s principal executive office is in Danbury, Connecticut.
| ● | Mailing address of the Company’s headquarters: 25 Lake Avenue Ext., Danbury, Connecticut 06811-5286 |
| ● | Telephone number: +1 (203) 743-8000 |
| ● | Website address: ethanallen.com |
Available Information
Information contained in our Investor Relations section of our website at https://ir.ethanallen.com is not part of this Annual Report on Form 10-K. Information that we furnish or file with the tableSEC, including our Annual Reports on Form 10-K, Quarterly Reports on Form 10-Q, Current Reports on Form 8-K or exhibits included in these reports are available for download, free of charge, on our Investor Relations website soon after such reports are filed with or furnished to the SEC. Our SEC filings, including exhibits filed therewith, are also available on the SEC’s website at sec.gov.
Information about our Executive Officers
Listed below is a listare the name, age, and current position for each of our executive officers together with certain biographical information, including their ages as of the date of this Report:Annual Report on Form 10-K.
M. Farooq Kathwari*, age 75 | M. Farooq Kathwari, age 73
|
| | ● | Chairman of the Board, President and Chief Executive Officer since 1988 |
| ●
| Senior Vice-President, Retail since October 2017
|
| ●
| Vice-President, Retail since August 2013
|
Daniel M. Grow, age 74
| | ● | Senior Vice President, Business Development since February 2015 |
| | ● | Vice-President,Vice President, Business Development from 2009 to 2015
|
Rodney A. Hutton, age 52
| ● | Eric D. Koster, age 71Chief Marketing Officer since joining the Company on a full-time basis in January 2020
|
| | ● | Vice-President,Consultant to Ethan Allen from September 2019 to January 2020
|
| ● | Previously held senior marketing, brand management and merchandising roles in a number of leading enterprises including Ralph Lauren, Giorgio Armani, Karl Lagerfeld, Ann Klein and Iconix Brand Group |
ETHAN ALLEN INTERIORS INC. AND SUBSIDIARIES
Eric D. Koster, age 73
| ● | Vice President, General Counsel and Secretary since April 2013 |
| | ● | Private practice prior to joining the Company in April 2013 |
| ●
| Senior Vice-President, Merchandising since July 2017
|
| ●
| Vice-President, Merchandising since June 2009
|
Christopher Robertson, age 51
| Christopher Robertson, age 49
|
| | ● | Vice President, Logistics and Service since January 2016 |
| | ● | Director, Operations Support since May 2011 |
Clifford Thorn, age 68 | Clifford Thorn, age 66
|
| | ● | Vice-President,Vice President, Upholstery Manufacturing since May 2001
|
Corey Whitely, age 60 | Corey Whitely, age 58
|
| | ● | Executive Vice-President,Vice President, Administration, Chief Financial Officer and Treasurer since July 2014 |
| | ● | Executive Vice-President,Vice President, Operations from October 2007 through July 2014 |
Michael Worth, age 53 | Michael Worth, age 51
|
| | ● | Vice-President,Vice President, Case Goods Manufacturing since December 2016
|
| | ● | Regional Operations Manager, Case Goods since February 2004 |
* Mr. Kathwari is the only one of our executive officers who operates under a written employment agreement.
Additional Information
Additional information with respect to the Company’s business is included in the following pages and is incorporated herein by reference:
| Page |
Five-Year Summary of Selected Financial Data | 26 |
Management’s Discussion and Analysis of Financial Condition and Results of Operations | 27 |
Quantitative and Qualitative Disclosures about Market Risk | 43 |
Note 1 to Consolidated Financial Statements entitled Organization and Nature of Business | 52 |
Note 19 to Consolidated Financial Statements entitled Segment Information | 76 |
ETHAN ALLEN INTERIORS INC. AND SUBSIDIARIES
ItemITEM 1A. Risk FactorsRISK FACTORS
The following risks could materially and adversely affect our business, financial condition, cash flows, results of operations and the trading price of our common stock could decline. These risk factors do not identify all risks that we face; our operations could also be affected by factors that are not presently known to us or that we currently consider to be immaterial to our operations. Investors should also refer to the other information set forth in this Annual Report on Form 10-K, including TheManagement’s Discussion and Anfollowinginformationdescribescertainsignificantrisksanduncertaintiesinherentinourbusinessthatshouldbecarefully considered, alongwithotherinformation containedelsewhereinthis AnnualReportalysis of Financial Condition and inResults of Operationsother filings,whenmaking and our financial statements including the related notes. Investors should carefully consider all risks, including those disclosed, before making an investmentdecisionwithrespecttous.Ifoneormoreoftheserisksoccurs,theimpactonourbusiness,includingourfinancial condition, results ofoperations,and cash flows couldbe adverse.investment decision.
The ongoing global COVID-19 pandemic has and may continue to materially adversely affect our business, our results of operations and our overall financial performance.
The ongoing global COVID-19 pandemic has negatively impacted the world economy, disrupted financial markets and international trade, resulted in increased unemployment levels and significantly impacted global supply chains, all of which have negatively affected and continue to materially negatively affect the retail industry and the Company’s business. COVID-19 continues to spread both in the U.S. and globally, and related government and private sector mitigation efforts, including travel restrictions, border closings, restrictions on public gatherings, especially when congregating in heavily populated areas, such as malls and shopping centers, shelter-in-place restrictions and limitations on business, including requiring reduction of operating hours and forced temporary closures of non-essential retailers and other businesses, have adversely affected and are expected to continue to adversely affect our business operations, financial condition and liquidity. In particular, the continued spread of COVID-19 and efforts to contain the virus:
| ● | resulted in significant declines in net sales across our segments and could continue to impact customer demand for our products and services and customer spending levels, including a sustained long-term adverse impact on future foot traffic to our retail locations as a result of any changes to customer shopping patterns and behaviors, such as consumer willingness to visit physical retail locations, including our design centers; |
| ● | continue to reduce the availability and productivity and impact the health and well-being of our employees, customers and business partners; |
| ● | continue to cause us to experience a material increase in costs as a result of sustained mitigation measures, delayed payments from our customers and uncollectable accounts; |
| ● | continue to cause disruptions in the availability of and timely delivery of materials used in our operations; |
| ● | may materially and adversely impact our liquidity position and cost of, and ability to access, funds from financial institutions and capital markets; and |
| ● | cause other unpredictable events that we currently cannot anticipate. |
We have instituted measures to ensure our supply chain remains open to us; however, there has been some recent raw material supply chain challenges related to suppliers negatively impacted by COVID-19 shutdowns and shipping delays. These global supply chain challenges could continue and in turn materially adversely impact our manufacturing production and fulfillment of backlog. Furthermore, any significant reduction in consumer willingness to visit our design centers, levels of consumer spending, employee willingness to work in our design centers, or additional closures of our design centers or distribution centers, relating to COVID-19 or its impact on the economy, consumer sentiment or health concerns, already resulted and could result in a further loss of revenues, profits, cash flows, and other materially impactful effects on our business and operations. Our customers may have been, and may continue to be negatively affected by layoffs or work reductions as a result of the global economic downturn caused by COVID-19, which may have negatively impacted, and could continue to negatively impact demand for our products as customers delay or reduce discretionary purchases. Any significant reduction in customer traffic and spending at our design center, caused directly or indirectly by COVID-19, would continue to result in a loss of revenue and profits and could result in other material adverse effects.
In addition, we implemented work-from-home policies for certain employees. These working arrangements as well as other related restrictions including severe limitations on travel may have an impact on our operations and management effectiveness. Although we have technology and other resources to support these new work requirements, there can be no assurance that we will not suffer material risks to our business, operations, productivity and results of operations as a result of these restrictions. If a significant percentage of our workforce is unable to work, including because of illness or travel or government restrictions in connection with COVID-19, our retail, distribution and manufacturing operations may be negatively impacted, potentially materially adversely affecting our business, liquidity, financial condition or results of operations.
ETHAN ALLEN INTERIORS INC. AND SUBSIDIARIES
Although our distribution centers were fully operational as of the date of filing of this Annual Report, governmental mandates or illness or absence of a substantial number of distribution center employees could require that we temporarily close one or more of our distribution centers, or may prohibit or significantly limit us, or our third party logistics providers, from delivering to our customers and our design centers, which would complicate or prevent our fulfilling orders and, once our design centers reopen, would complicate or prevent our ability to supply merchandise to these design centers. Further, although we continue to implement strong physical and cyber-security measures to ensure that our business operations remain functional and to ensure uninterrupted service to our customers, our systems and our operations remain vulnerable to cyber-attacks and other disruptions due to the fact that a significant portion of our employees work remotely as a result of the ongoing COVID-19 crisis, and we cannot be certain that our mitigation efforts will be effective.
The extent of the impact of COVID-19 on our operational and financial performance will depend on future developments, including the duration and spread of the virus and related restrictions. At this time, given the uncertainty of the lasting effect of COVID-19, the financial impact on the world economy, and in particular, our business, cannot be determined. Further, despite our efforts to manage various impacts, the situation surrounding COVID-19 remains fluid and the potential for a material impact on our results of operations, financial condition and liquidity increases the longer the virus impacts activity levels in the U.S. and globally. The ultimate impact of the COVID-19 pandemic depends on factors beyond our knowledge or control, including the duration and severity of the COVID-19 outbreak as well as third-party actions taken to contain its spread and mitigate its public health effects. Therefore, we currently cannot estimate with any degree of certainty the potential impact to our financial position, results of operations and cash flows.
We may require funding from external sources, which may not be available at the levels we require, or may cost more than we expect, and, as a consequence, our expenses and operating results could be negatively affected.
Our liquidity could be further negatively impacted if the COVID-19 pandemic continues to persist for a significant period of time and we may be required to pursue additional sources of financing to obtain working capital, maintain appropriate inventory levels and meet our financial obligations. Depending on the continued impact of the crisis, further actions may be required to improve our cash position and capital structure. Concerns over the economic impact of the COVID-19 pandemic have caused extreme volatility in financial and capital markets, which has adversely impacted our stock price and may materially adversely affect our ability to access capital markets.
We regularly review and evaluate our liquidity and capital needs. We believe that our available cash, cash equivalents and cash flow from operations will be sufficient to finance our operations and expected capital requirements for at least the next 12 months. However, we might experience periods during which we encounter additional cash needs, and we might need additional external funding to support our operations.
In the event we require additional liquidity from our lenders, such funds may not be available to us on acceptable terms, or at all. In addition, in the event we were to breach any of our financial covenants, our banks would not be required to provide us with additional funding, or they may require us to renegotiate our existing credit facility on less favorable terms. In addition, we may not be able to renew our letters of credit that we use to help pay our suppliers, on terms that are acceptable to us, or at all, as the availability of credit facilities may become limited. Further, the providers of such credit may reallocate the available credit to other borrowers. If we are unable to access additional credit at the levels we require, or the cost of credit is greater than expected, it could adversely affect our operating results.
Declines in certain economic conditions, which impact consumer confidence and consumer spending, could negatively impact our sales, results of operations and liquidity.
The furniture industry and our business is particularly sensitive to declines in general economic conditions and to uncertainty regarding future economic prospects, including the current and evolving negative economic impact of the COVID-19 pandemic. Our principal products are consumer goods that may be considered postponable purchases. Economic downturns and prolonged negative conditions in the economy could affect consumer spending habits by decreasing the overall demand for discretionary items, including home furnishings. Consumer purchases of discretionary items, including our products, generally decline during periods when disposable income is limited, unemployment rates increase or there is uncertainty about future economic prospects. In addition, changes in interest rates, consumer confidence, new housing starts, existing home sales, the availability of consumer credit and broader national or geopolitical factors also impact our business. We have seen negative effects on certain of these measures due to the COVID-19 pandemic. Consumer spending could remain depressed for an extended time and improvement in our sales could lag behind a general economic recovery as consumers may postpone the purchase of relatively higher-cost discretionary items.
ETHAN ALLEN INTERIORS INC. AND SUBSIDIARIES
An overall decline in the health of the economy and consumer spending may affect consumer purchases of discretionary items, which could reduce demand for our products and materially harm our sales, profitability and financial condition.
Our business depends on consumer demand for our products and, consequently, is sensitive to a number of factors that influence general consumer spending on discretionary items in particular. Factors influencing consumer spending include general economic conditions, consumer disposable income, fuel prices, recession and fears of recession, unemployment, war and fears of war, inclement weather, availability of consumer credit, consumer debt levels, conditions in the housing market, interest rates, sales tax rates and rate increases, inflation, civil disturbances and terrorist activities, foreign currency exchange rate fluctuations, consumer confidence in future economic and political conditions, natural disasters, and consumer perceptions of personal well-being and security, including health epidemics or pandemics, such as the COVID-19 pandemic. For example, demand for certain of our products decreased during the fourth quarter of fiscal 2020 as a result of the economic impact of the COVID-19 pandemic and weakened consumer confidence in the economy and financial markets. Prolonged or pervasive economic downturns could slow the pace of new design center openings or cause current design centers to temporarily or permanently close. Adverse changes in factors affecting discretionary consumer spending have reduced and may continue to further reduce consumer demand for our products, thus reducing our sales and harming our business and operating results.
Historically, the home furnishings industry has been subject to cyclical variations in the general economy and to uncertainty regarding future economic prospects. Should the current economic recovery falter or the current recovery in housing starts to stall, consumer confidence and demand for home furnishings could deteriorate, which could adversely affect our business through its impact on the performance of our Company-owned design centers, as well as on our independent licensees and the ability of a number of them to meet their obligations to us.
Our business and results of operations are affected by international, national and regional economic conditions. Regional economic conditions in the United States and in other regions of the world where we have a concentration of design centers such as Canada or China, may have a greater impact on the Company compared to economic conditions in other parts of the world where we have lesser concentration of design centers. An economic downturn of significance or extended duration could adversely affect consumer demand and discretionary spending habits and, as a result, our business performance, profitability, and cash flows.
Other financial or operational difficulties due to competition may result in a decrease in our sales, earnings, and liquidity.
The residential furniture industry is highly competitive and fragmented. We currently compete with many other manufacturers and retailers, including online retailers, some of which offer widely advertised products, and others, several of which are large retail furniture dealers offering their own store-branded products. Competition in the residential furniture industry is based on quality, style of products, perceived value, price, service to the customer, promotional activities, and advertising. The highly competitive nature of the industry means we are constantly subject to the risk of losing market share, which would likely decrease our future sales, earnings, and liquidity.
A significant shift in consumer preference toward purchasing products online could have a materially adverse impact on our sales and operating margin.
A majority of our business relies on physical design centers that merchandise and sell our products and a significant shift in consumer preference toward purchasing products online could have a materially adverse impact on our sales and operating margin. In the past year we have experienced lower traffic to our company-owned design centers, similar to other furniture retailers, as consumers have shifted to purchasing more furniture product online. The COVID-19 pandemic has accelerated the shift to online furniture purchases by changing customer shopping patterns and behaviors, including decreased consumer willingness to visit physical retail locations. We are attempting to meet consumers where they prefer to shop by expanding our online capabilities and improving the user experience at ethanallen.com to drive more traffic to both our online site and our physical design centers.
Rapidly evolving technologies are altering the manner in which the Company and its competitors communicate and transact with customers. Our strategy designed to adapt to these changes, in the context of competitors’ actions, customers adoption of new technology, and related changes in customer behavior, presents a specific risk in the event we are unable to successfully execute our plans or adjust them over time if needed. Further, unanticipated changes in pricing and other practices of competitors, including promotional activity, such as thresholds for free shipping and rapid price fluctuation enabled by technology, may adversely affect our performance.
ETHAN ALLEN INTERIORS INC. AND SUBSIDIARIES
Inability to maintainandenhanceourbrand may materially adversely impactourbusiness.
Maintaining and enhancing our brand is critical to our ability to expand our base of customers and may require us to make substantial investments. Our advertising campaign utilizes television, direct mail, digital, newspapers, magazines and radio to maintain and enhance our existing brand equity. We cannot provide assurance that our marketing, advertising and other efforts to promote and maintain awareness of our brand will not require us to incur substantial costs. If these efforts are unsuccessful or we incur substantial costs in connection with these efforts, our business, operating results and financial condition could be materially adversely affected.
Failureto successfullyanticipateorrespondtochangesinconsumertastesandtrendsina timelymannercould materially adversely impact our business,operating results andfinancial condition.
Sales of our products are dependent upon consumer acceptance of our product designs, styles, quality and price. We continuously monitor changes in home design trends through attendance at international industry events and fashion shows, internal marketing research, and regular communication with our retailers and design consultants who provide valuable input on consumer tendencies. However, as with all retailers, our business is susceptible to changes in consumer tastes and trends. Such tastes and trends can change rapidly and any delay or failure to anticipate or respond to changing consumer tastes and trends in a timely manner could materially adversely impact our business, operating results and financial condition.
Global andlocal economic uncertaintymaymaterially adverselyaffect our manufacturing operations or sourcesof merchandise and international operations.
The current economic challenges in China, including global economic ramifications of the softening of the Chinese economy and trade agreement negotiations, may continue to put pressure on global economic conditions. This economic uncertainty, as well as other variations in global economic conditions such as fuel costs, wage and benefit inflation, and currency fluctuations, may cause inconsistent and unpredictable consumer spending habits, while increasing our own input costs. These risks resulting from global and local economic uncertainty could also severely disrupt our manufacturing operations, which could have a material adverse effect on our financial performance. We import a portion of our merchandise from foreign countries and operate manufacturing plants in Mexico and Honduras and retail design centers in Canada. As a result, our ability to obtain adequate supplies or to control our costs may be adversely affected by events affecting international commerce and businesses located outside the United States, including natural disasters, public health crises such as the ongoing COVID-19 pandemic, changes in international trade including tariffs, central bank actions, changes in the relationship of the United States dollar versus other currencies, labor availability and cost, and other governmental policies of the United States and the countries from which we import our merchandise or in which we operate facilities.
The United States, Mexico and Canada recently entered into a signed trade agreement called The United States - Mexico - Canada Agreement (“USMCA”) that has been ratified by all three countries. The USMCA will govern trade in North America and replaces the North American Free Trade Agreement (“NAFTA”). Compared to the previous NAFTA trade agreement, USMCA will increase environmental and labor regulations and will create incentives for more U.S. production of cars and trucks and impose a quota for Canadian and Mexico automotive production. Although we have determined that there have been no immediate effects on our operations with respect to USMCA, we cannot predict future developments in the political climate involving the United States, Mexico and Canada and thus these may have an adverse and material impact on our operations and financial growth.
Competitionifromonfromoverseas manufacturersurersand domestic retailersmay materially adverselyaffectaourffbusiness,opectourbusiness,operating resultsresultsor financial condiition.tion.
Our wholesale business segment is involved in the development of our brand, which encompasses the design, manufacture, sourcing, sales and distribution of our home furnishings products, and competes with other U.S.United States and foreign manufacturers. Our retail network sells home furnishings to consumers through a network of independently operated and Company operatedCompany-operated design centers, and competes against a diverse group of retailers ranging from specialty stores to traditional furniture and department stores, any of which may operate locally, regionally, nationally or globally, as well as over the internet. We also compete with these and other retailers for appropriate retail locations as well as for qualified design consultants and management personnel. Such competition could adversely affect our future financial performance.
ETHAN ALLEN INTERIORS INC. AND SUBSIDIARIES
Industry globalization has led to increased competitive pressures brought about by the increasing volume of imported finished goods and components, particularly for case good products, and the development of manufacturing capabilities in other countries, specifically within Asia. The increase in overseas production has created over‐capacity for many manufacturers, including us, which has led to industry‐wide plant consolidation. In addition, because many foreign manufacturers are able to maintain substantially lower production costs, including the cost of labor and overhead, imported product may be capable of being sold at a lower price to consumers, which, in turn, could lead to some measure of further industry‐wide price deflation.
ETHAN ALLEN INTERIORS INC. AND SUBSIDIARIES
We cannot provide assurance that we will be able to establish or maintain relationships with sufficient or appropriate manufacturers, whether foreign or domestic, to supply us with selected case goods, upholstery and home accent items to enable us to maintain our competitive advantage. In addition, the emergence of foreign manufacturers has served to broaden the competitive landscape. Some of these competitors produce furniture types not manufactured by us and may have greater financial resources available to them or lower costs of operating. This competition could materially adversely affect our future financial performance.
Disruptions of our supFailureply chato successfullyanticipateorrespondtochangesinconsumertastesandtrendsin could have a timmaterial adverse effectelymannercouldadversely impact our business,operating results on our operating andfinancial condresults.ition.
SalesDisruption of our products are dependent upon consumer acceptancethe Company’s supply chain capabilities due to trade restrictions, political instability, severe weather, natural disasters, public health crises such as the ongoing COVID-19 pandemic, terrorism, product recalls, labor supply or stoppages, the financial and/or operational instability of our product designs, styles, qualitykey suppliers and price. We continuously monitor changes in home design trends through attendance at international industry events and fashion shows, internal marketing research, and regular communication with our retailers and design consultants who provide valuable input on consumer tendencies. However, as with all retailers, our business is susceptible to changes in consumer tastes and trends. Such tastes and trends can change rapidly and any delaycarriers, or failure to anticipate or respond to changing consumer tastes and trends in a timely mannerother reasons could adversely impact our business, operating results and financial condition.
Our successdependsupon ourbrand,marketingand advertising efforts andpricingstrategies. If wearenot ableto maintainandenhanceourbrand,orifwearenotsuccessfulintheseotherefforts,ourbusinessandoperatingresultscould be adverselyaffected.
Maintaining and enhancing our brand is critical to ourimpair the Company’s ability to expand our basedistribute its products. To the extent we are unable to mitigate the likelihood or potential impact of customers and may require us to make substantial investments. Our advertising campaign utilizes television, direct mail, digital, newspapers, magazines and radio to maintain and enhance our existing brand equity. We cannot provide assurance that our marketing, advertising and other efforts to promote and maintain awareness of our brand will not require us to incur substantial costs. If these efforts are unsuccessful or we incur substantial costs in connection with these efforts, our business, operating results and financial conditionsuch events, there could be adversely affected.
Weface changesin global andlocal economic conditions thatmayadverselyaffect consumerdemandand spending,our manufacturing operations or sourcesof merchandise and international operations.
Historically, the home furnishings industry has been subject to cyclical variations in the general economy and to uncertainty regarding future economic prospects. Such uncertainty, as well as other variations in global economic conditions such as rising fuel costs, wage and benefit inflation, currency fluctuations, and increasing interest rates, may continue to cause inconsistent and unpredictable consumer spending habits, while increasing our own input costs. These risks, as well as industrial accidents or work stoppages, could also severely disrupt our manufacturing operations, which could have a material adverse effect on our financial performance.
We import a portion of our merchandise from foreign countries and operate manufacturing plants in Mexico and Honduras and operate retail design centers in Canada. As a result, our ability to obtain adequate supplies or to control our costs may be adversely affected by events affecting international commerce and businesses located outside the United States, including natural disasters, changes in international trade, central bank actions, changes in the relationship of the U.S. dollar versus other currencies, labor availability and cost, and other governmental policies of the U.S. and the countries from which we import our merchandise or in which we operate facilities. The inability to import products from certain foreign countries or the imposition of significant tariffs could have a material adverse effect on our results of operations.
The Company’s business may be adversely affected by changes in U.S. policy related to imported merchandise.
A significant amount of the Company’s merchandise is sourced from outside of the United States. The U.S. government is considering proposals for substantial changes to its trade and tax policies, which could include import restrictions, increased import tariffs, changes to or withdrawal from existing trade agreements, and border-adjustment taxes among other possible measures. Material changes in these policies could increase the Company’s tax obligations or require the Company to increase prices to customers, which would likely adversely affect sales. Any significant change in U.S. policy related to imported merchandise could have a material adverse effect on the Company’s businessoperating and financial results.
ETHAN ALLEN INTERIORS INC. AND SUBSIDIARIES
OurAn economnumberofmanufacturingc andldogistiownturn may materiallyadverselyaffect our business.
Our business and results of operations are affected by international, national and regional economic conditions. Regional economic conditions in the United States and in other regions of the world where we have a concentration of design centers such as Canada or China may impact the Company greater compared to economic conditions in other parts of the world where we have lesser concentration of design centers. An economic downturn of significance or extended duration could adversely affect consumer demand and discretionary spending habits and, as a result, our business performance, profitability, and cash flows.
Our business may be materially affected by changes to fiscal and tax policies. Potentially negative or unexpected tax consequences of these policies, or the uncertainty surrounding their potential effects, could adversely affect our results of operations and share price.
The U.S. Tax Cuts and Jobs Act of 2017 (the “TCJA”) was approved by the U.S. Congress on December 20, 2017 and signed into law on December 22, 2017. This legislation makes significant changes to the U.S. Internal Revenue Code of 1986, as amended (the “IRC”). Such changes include a reduction in the corporate tax rate from 35% to 21% and limitations on certain corporate deductions and credits, among other changes. In addition, the TCJA requires complex computations to be performed that were not previously required in U.S. tax law, significant judgments to be made in interpretation of the provisions of the TCJA and significant estimates in calculations, and the preparation and analysis of information not previously relevant or regularly produced.
While we have provided for the effect of the TCJA in our Consolidated Financial Statements the final impacts of the TCJA could be materially different from our expectations. For example, adverse changes in the underlying profitability and financial outlook of our operations or changes in tax law could lead to changes in our valuation allowances against deferred tax assets on our consolidated balance sheets, which could materially affect our results of operations. The U.S. Treasury Department, the Internal Revenue Service (the “IRS”), and other standard-setting bodies could interpret or issue guidance on how provisions of the TCJA will be applied or otherwise administered that is different from our interpretation. Finally, foreign governments may enact tax laws in response to the TCJA that could result in further changes to global taxation and materially affect our financial position and results of operations. The uncertainty surrounding the effect of the reforms on our financial results and business could also weaken confidence among investors in our financial condition. This could, in turn, have a materially adverse effect on the price of our ordinary shares.
Ournumberofmanufacturingandlogistics sitesmaymiayincrease ouruerexposure to businessudissinessruptionsdisruptionsand couuld resultultin higher transportationcosts.ransportationcosts.
We have a limited number of manufacturing sites in our case goods and upholstery operations and consolidated our distribution network into fewer centers for both wholesale and retail segments, and operate a single home accents plant.segments. Our upholstery operations consist of threetwo upholstery plants at our North Carolina campus and one planttwo plants in Mexico. The Company operates threetwo manufacturing plants (North Carolina, Vermont,(Vermont and Honduras) and one sawmill, one rough mill and one lumberyard in support of our case goods operations. Our plants require various raw materials and commodities such as logs and lumber for our case goods plants and foam, springs and engineered hardwood board for our upholstery plants. As a result of the consolidation of our manufacturing operations into fewer facilities, if any of our manufacturing or logistics sites experience significant business interruption, our ability to manufacture or deliver our products in a timely manner would likely be impacted. While we have long‐standing relationships with multiple outside suppliers of our raw materials and commodities, there can be no assurance of their ability to fulfill our supply needs on a timely basis. The consolidation to fewer locations has resulted in longer distances for delivery and could result in higher costs to transport products if fuel costs increase significantly.
FluctuFluctuationsainthetionsprice,availabilityandqualityofrawmaterialscouldresultinincreastheedcostsprice,orcauseavaproductionidelaylabilityandqualityofrawmaterialscouldresultinincreasedcostsorcauseproductiondelays which mightresult ina decleicline in saales, eietither of which couldmaterially adverselyadverselyimpact our eaarnings.rnings.
We use various types of wood, foam, fibers, fabrics, leathers, and other raw materials in manufacturing our furniture. Certain of our raw materials, including fabrics, are purchased domestically andas well as outside North America. Fluctuations in the price, availability and quality of raw materials could result in increased costs or a delay in manufacturing our products, which in turn could result in a delay in delivering products to our customers. For example, lumber prices fluctuate over time based on factors such as weather and demand, which, in turn, impact availability. Production delays or upward trends in raw material prices could result in lower sales or margins, thereby materially adversely impacting our earnings.
In addition, certain suppliers may require extensive advance notice of our requirements in order to produce products in the quantities we desire. This long lead time may require us to place orders far in advance of the time when certain products will be offered for sale, thereby exposing us to risks relating to shifts in consumer demand and trends, and any significant downturn in the U.S.United States economy.
ETHAN ALLEN INTERIORS INC. AND SUBSIDIARIES
Our current andformeformer manufacturiungriandrnegandretail operationsandproductsarensubjectdproductsaresubjectto increasingalysingstringenlystringent environmentall, health aand saafety requiremients.rements.
We use and generate hazardous substances in our manufacturing and retail operations. In addition, both the manufacturing properties on which we currently operate and those on which we have ceased operations are and have been used for industrial purposes. Our manufacturing operations and, to a lesser extent, our retail operations involve risk of personal injury or death. We are subject to increasingly stringent environmental, health and safety laws and regulations relating to our products, current and former properties and our current operations. These laws and regulations provide for substantial fines and criminal sanctions for violations and sometimes require product recalls and/or redesign, the installation of costly pollution control or safety equipment, or costly changes in operations to limit pollution or decrease the likelihood of injuries. In addition, we may become subject to potentially material liabilities for the investigation and cleanup of contaminated properties and to claims alleging personal injury or property damage resulting from exposure to or releases of hazardous substances or personal injury because of an unsafe workplace.
ETHAN ALLEN INTERIORS INC. AND SUBSIDIARIES
In addition, noncompliance with, or stricter enforcement of, existing laws and regulations, adoption of more stringent new laws and regulations, discovery of previously unknown contamination or imposition of new or increased requirements could require us to incur costs or become the basis of new or increased liabilities that could be material.
The Company'sProduct recalls or product safety concerns could materially adversely affect our sales and operating results could be adversely affected by product safety concerns.results.
If the Company's merchandise offerings do not meet applicable safety standards or consumers' expectations regarding safety, the Company could experience decreased sales, increased costs and/or be exposed to legal and reputational risk. Events that give rise to actual, potential or perceived product safety concerns could expose the Company to government enforcement action and/or private litigation. Reputational damage caused by real or perceived product safety concerns or product recalls could negatively affect the Company's business and results of operations.
The Company reliesheavilyWe rely extensively oninformation information technology systems to process transactions, summarize results, and tmanage our business and that of certain independent retaileers. Disruptions in both our primary and back-up systems could adversely affect our business and operating results.chnology
Our primary and back-up information technology systems are subject to operateitsbusiness, andanydisruption toitstechnology infrastructure (including cyber attacks)damage or interruption from power outages, computer and telecommunications failures, viruses, phishing attempts, cyber-attacks, malware and ransomware attacks, security breaches, severe weather, natural disasters, and errors by employees. Though losses arising from some of these issues would be covered by insurance, interruptions of our critical business information technology systems or failure of our back-up systems could result in longer production times or negatively impact customers resulting in damage to our reputation and a reduction in sales. If our critical information technology systems or back-up systems were damaged or ceased to function properly, we might have to make a significant investment to repair or replace them.
Successthe internet could harmful cyber-attacks and the Company's failure to maintain adequate cyber-security systems and procedures could materially harm our operations.
In the current environment, there are numerous and evolving risks to cybersecurity and privacy, including criminal hackers, hacktivists, state-sponsored intrusions, industrial espionage, employee malfeasance and human or technological error. High-profile security breaches at other companies and in government agencies have increased in recent years, and security industry experts and government officials have warned about the risks of hackers and cyberattacks targeting businesses such as ours. Cyber-attacks are becoming more sophisticated and frequent, and in some cases have caused significant harm. Computer hackers and others routinely attempt to breach the security of technology products, services and systems, and to fraudulently induce employees, customers, or others to disclose information or unwittingly provide access to systems or data. We operate many aspects of our business including financial reporting, and customer relationship management through server and web‐based technologies, and store various types of data on such servers or with third‐parties who in turn store it on servers and in the “cloud”.“cloud.” Any disruption to the internet or to the Company's or its service providers' global technology infrastructure, including malware, insecure coding, “Acts of God,” attempts to penetrate networks, data theft or loss and human error, could have adverse effects on the Company's operations. A cyber attackcyber-attack of our systems or networks that impairs our information technology systems could disrupt our business operations and result in loss of service to customers. The risk of cyberattacks to our Company also includes attempted breaches of contractors, business partners, vendors and other third parties. We have a comprehensive cybersecurity program designed to protect and preserve the integrity of our information technology systems. We have experienced and expect to continue to experience actual or attempted cyber attackscyber-attacks of our IT systems or networks; however, none of these actual or attempted cyber attackscyber-attacks had a material impact on our operations or financial condition.
Additionally,While we devote significant resources to network security, data encryption and other security measures to protect our systems and data, including our own proprietary information and the confidential and personally identifiable information of our customers, employees, and business partners, these measures cannot provide absolute security. The costs to eliminate or alleviate network security problems, bugs, viruses, worms, malicious software programs and security vulnerabilities could be significant, and our efforts to address these problems may not be successful, resulting potentially in the theft, loss, destruction or corruption of information we store electronically, as well as unexpected interruptions, delays or cessation of service, any of which could cause harm to our business operations. Moreover, if a computer security breach or cyber-attack affects our systems or results in the unauthorized release of proprietary or personally identifiable information, our reputation could be materially damaged, our customer confidence could be diminished, and our operations, including technical support for our devices, could be impaired. We would also be exposed to a risk of loss or litigation and potential liability, which could have a material adverse effect on our business, results of operations and financial condition.
ETHAN ALLEN INTERIORS INC. AND SUBSIDIARIES
Loss, corruption and misappropriation of data and information relating to customers could materially adversely affect our operations.
We have access to sensitive customer information in the ordinary course of business. If a significant data breach occurred, our reputation may be adversely affected, customer confidence may be diminished, or we may be subject to legal claims, or legal proceedings, including regulatory investigations and actions, may have a negative impact on our reputation, may lead to regulatory enforcement actions against us, and may materially adversely affect our business, operating results and financial condition. The loss, disclosure or misappropriation of our business information may materially adversely affect our business, operating results and financial condition. Further, legislative or regulatory action in these areas is evolving, and we may be unable to adapt our IT systems or to manage the IT systems of third parties to accommodate these changes. Finally, if a significant data breach occurred, our reputation could be materially and adversely affected, and confidence among our customers may be diminished.
ETHAN ALLEN INTERIORS INC. AND SUBSIDIARIESChanges in United States trade and tax policy could materially adversely affect our business and results of operations.
WhileChanges in the political environment in the United States may require us to modify our current business practices. Because we manufacture components and finished goods in Mexico and Honduras and purchase components and finished goods manufactured in foreign countries, including China, we are subject to risks relating to increased tariffs on United States imports, changes in the North American Free Trade Agreement, and other changes affecting imports. Recently, the United States administration considered enacting certain tariffs on many items sourced from China, including certain furniture, accessories, furniture parts, and raw materials that are imported into the United States and used in our domestic operations. We may not be able to fully or substantially mitigate the impact of such tariffs, pass price increases on to our customers, or secure adequate alternative sources of products or materials. The tariffs, along with any additional tariffs or retaliatory trade restrictions implemented by other countries, could negatively impact customer sales, including potential delays in product received from our vendors, our cost of goods sold and results of operations.
Approximately 25% of our merchandise is sourced from outside of the United States. The United States government has also expressed its intent to alter its approach to trade policy, including, in some instances, to revise, renegotiate or terminate certain multilateral trade agreements. It has also imposed new tariffs on certain foreign goods and raised the possibility of imposing additional increases or new tariffs on other goods. Such actions have, investedin some cases, already led to retaliatory trade measures by certain foreign governments. Such policies could make it more difficult or costly for us to do business in or import our products from those countries. In turn, we may need to raise prices or make changes to our operations, which could negatively impact our net sales or operating results. At this time, it remains unclear what additional actions, if any, will be taken by the United States government or foreign governments with respect to tariff and continueinternational trade agreements and policies, and we cannot predict future trade policy or the terms of any revised trade agreements or any impact on our business.
Our business is dependent on certain key personnel; if we lose key personnel or are unable to investhire additional qualified personnel, our business may be harmed.
The success of our business depends upon our ability to retain continued service of certain key personnel, particularly our Chairman of the Board, President and Chief Executive Officer, M. Farooq Kathwari, and to attract and retain additional qualified key personnel in information technology risk management, cybersecuritythe future. We face risks related to loss of any key personnel and disaster recovery plans, these measures cannot fully insulatewe also face risks related to any changes that may occur in key senior leadership executive positions. Any disruption in the Company from technology disruptions or data theft or lossservices of our key personnel could make it more difficult to successfully operate our business and the resulting adverse effect on the Company's operationsachieve our business goals and could adversely affect our results of operation and financial results.
Ourbusinessissensitivetoincreasinglaborcosts, competitivelabormarkets,condition. These changes could also increase the volatility of our continuedabilitytoretainhigh‐quality personneland risks of workstoppages.stock price.
The market for qualified employees and personnel in the retail and manufacturing industries is highly competitive. Our success depends upon our ability to attract, retain and motivate qualified artisans, professional and clerical employees and upon the continued contributions of these individuals. We cannot provide assurance that we will be successful in attracting and retaining qualified personnel. A shortage of qualified personnel may require us to enhance our wage and benefits package in order to compete effectively in the hiring and retention of qualified employees. Our labor and benefit costs may continue to increase and such increases may not be recovered. This could have a material adverse effect on our business, operating results and financial condition.
We depend onkey personnelIn addition, COVID-19 increases the risk that certain senior executive officers or a member of the board of directors could become ill, causing them to be incapacitated or otherwise unable to perform their duties for an extended absence. Furthermore, because of the nature of the disease, multiple people working in close proximity could also become ill simultaneously which could result in the same department having extended absences. This could negatively impact the efficiency and could beaffectedby the losseffectiveness of theirprocesses and internal controls throughout the Company.
ETHAN ALLEN INTERIORS INC. AND SUBSIDIARIES
Our total assets include substantial amounts of long-lived assets. Changes to estimates servicor projections used to assess the fair value of these assets, financial results that are lower than current estimates at certain edesign center locations or determinations to close underperforming locations may cause us to incur future impairment charges, negatively affecting its financial results.s.
We make certain accounting estimates and projections with regard to individual design center operations as well as overall Company performance in connection with our impairment analysis for long-lived assets in accordance with applicable accounting guidance. An impairment charge may be required if the impairment analysis indicates that the carrying value of an asset exceeds the sum of the expected undiscounted cash flows of the asset. The successprojection of future cash flows used in this analysis requires the use of judgment and a number of estimates and projections of future operating results. If actual results differ from Company estimates, additional charges for asset impairments may be required in the future. If impairment charges are significant, our financial results could be negatively affected.
Access toconsumer credit could be interrupted as a result of conditions outside of our business depends upon the services of certain senior executives, and in particular, the services of M. Farooq Kathwari, Chairman of the Board, President and Chief Executive Officer, who is the only one of our senior executives who operates under a written employment agreement. The loss of any such person or other key personnelcontrol, which could have a material adverse effect on our business and results of operations.
redWe may ube unable to obtain sufficient external funding to finance our operations and growth.
Historically, we have relied upon our cash from operations to fund our debt service, operations and growth. As we operate and expand our business, we may rely on external funding sources, including the proceeds from the issuance of additional debt or use of the $115 million revolving bank line of credit under our existing credit facility. The credit facility bears interest at a floating rate and there is a risk that the rate will increase and as we are not hedging our interest rate for the credit facility, our debt service costs could increase. Any unexpected reduction in cash flow from operations could increase our external funding requirements to levels above those currently available. There can be no assurance that we will not experience unexpected cash flow shortfalls in the future or that any increase in external funding required by such shortfalls will be available on acceptable terms or at all.
Access toconsumer credit could be interrupted and reduce salees andprofitability.profitability.
Our ability to continue to access consumer credit for our clientscustomers could be negatively affected by conditions outside our control. If capital market conditions have a material negative change, there is a risk that our business partner that issues our private label credit card program may not be able to fulfill its obligations under that agreement. In addition, the tightening of credit markets may restrict the ability and willingness of customers to make purchases.
WeOperatmaynotbeabletomaintainourcurrentdesignng losses coucenterlocationsatcurrentcosts.Wemayalsod redfailtosuccece ourssfullyseleliquidity and impact our dividend policy.
Historically, we have relied on our cash from operations or debt issuances to fund our operations and the payment of cash dividends. If the Company’s financial performance were to deteriorate resulting in financial losses we may not be able to fund a shortfall from operations and would require external funding. Some financing instruments used by the Company historically may not be available to the Company in the future. We cannot assure that additional sources of financing would be available to the Company on commercially favorable terms should the Company's capital requirements exceed cash available from operations and existing cash and cash equivalents. In such circumstances, the Company may reduce its quarterly dividends.
Additional impairment charges could reduce our profitability.
We have significant long‐lived tangible and intangible assets recorded on our balance sheets. If our operating results decline, we may incur impairment charges in the future, which could have a material impact on our financial results. We evaluate the recoverability of the carrying amount of our long‐lived tangible and intangible assets on an ongoing basis. There can be no assurance that the outcome of such future reviews will not result in substantial impairment charges. Impairment assessment inherently involves judgments as to assumptions about expected future cash flows and the impact of market conditions on those assumptions. Future events and changing market conditions may impact our assumptions as to prices, costs or other factors that may result in changes in our estimates of future cash flows. Although we believe the assumptions we use in testing for impairment are reasonable, significant changes in any of our assumptions could produce a significantly different result.
ETHAN ALLEN INTERIORS INC. AND SUBSIDIARIES
Wemaynotbeabletomaintainourcurrentdesigncenterlocationsatcurrentcosts.Wemayalsofailtosuccessfullyselect and secuure desesign center locoations.cations.
Our design centers are typically located in busy urban settings as freestanding destinations or as part of suburban strip malls or shopping malls, depending upon the real estate opportunities in a particular market. Our business competes with other retailers and as a result, our success may be affected by our ability to renew current design center leases and to select and secure appropriate retail locations for existing and future design centers.
Our business may be materially Ouradversely affected by changes to tax policies.results ofoperationsforany quarterare not necessarily indicative of our results of operations for a fullyear.
SalesChanges in United States or international income tax laws and regulations may have a material adverse effect on our business in the future or require us to modify our current business practices. In the ordinary course of furniturebusiness, we are subject to tax examinations by various governmental tax authorities. The global and diverse nature of our business means that there could be additional examinations by governmental tax authorities and the resolution of ongoing and other home furnishing products fluctuate from quarterprobable audits, which could impose a future risk to quarter due to such factors as changes in global and regional economic conditions, changes in competitive conditions, changes in production schedules in response to seasonal changes in energy costs and weather conditions, changes in consumer order patterns, and the timing of various promotional events. From time to time, we have experienced, and may continue to experience, volatility with respect to demand for our home furnishing products. Accordingly, results of operations for any quarter are not necessarily indicative of the results of operations for a full year.our business.
Our operations present hazards and risks which may not be fully covered by insurance, if insured.
The scope and nature of our operations present a variety of operational hazards and risks that must be managed through continual oversight and control. As protection against hazards and risks, we maintain insurance against many, but not all, potential losses or liabilities arising from such risks. Uninsured losses and liabilities from operating risks could reduce the funds available to us for capital and investment spending and could have a material adverse impact on the results of operations.
Failure to protect our intellectual property could materially adversely affect us.
We believe that our copyrights, trademarks, service marks, trade secrets, and all of our other intellectual property are important to our success. We rely on patent, trademark, copyright and trade secret laws, and confidentiality and restricted use agreements, to protect our intellectual property and may seek licenses to intellectual property of others. Some of our intellectual property is not covered by any patent, trademark, or copyright or any applications for the same. We cannot provide assurance that agreements designed to protect our intellectual property will not be breached, that we will have adequate remedies for any such breach, or that the efforts we take to protect our proprietary rights will be sufficient or effective. Any significant impairment of our intellectual property rights or failure to obtain licenses of intellectual property from third parties could harm our business or our ability to compete. Moreover, we cannot provide assurance that the use of our technology or proprietary know‐how“know‐how” or information does not infringe the intellectual property rights of others. If we have to litigate to protect or defend any of our rights, such litigation could result in significant expense.
ETHAN ALLEN INTERIORS INC. AND SUBSIDIARIES
ItemITEM 1B. Unresolved Staff CommentsUNRESOLVED STAFF COMMENTS
None.
ItemITEM 2. PropertiesPROPERTIES
OurEthan Allen’s 144,000 sq. ft.square foot corporate headquarters building, located in Danbury, Connecticut, and adjacent Ethan Allen Hotel and Conference Center, containing approximately 200 guestrooms, areis owned by the Company. The hotel is used primarily for functions and accommodations for the general public as well as in connection with Ethan Allen functions and training programs.
We operate nine manufacturing facilities located in the U.S.,United States, Mexico and Honduras. These facilities are owned by the Company and include fourfive case goods plants (including one sawmill)sawmill, one rough mill and one lumberyard) totaling 1,789,0001,306,000 square feet and four upholstery furniture plants totaling 1,261,000 square feet, and one home accent plant of 177,0001,171,000 square feet. Our wholesale division also owns and operates three national distribution and fulfillment centers, one of which shares a facility with our manufacturing, which are a combined 1,001,000 square feet. TwoThree of our case goods manufacturing facilities are located in Vermont, one is in North CarolinaHonduras and one is in Honduras.North Carolina. We have threetwo upholstery manufacturing facilities at our North Carolina campus and onetwo in Mexico. Our home accents plant is located in New Jersey,wholesale division also owns and ouroperates four national distribution and fulfillment centers, which are a combined 1,427,000 square feet. Our distribution facilities are located in New Jersey,North Carolina, Oklahoma, and Virginia.
We own three and lease 1113 retail servicehome delivery centers, totaling approximately 775,000860,000 square feet. Our retail servicehome delivery centers are located throughout the United States and Canada and serve to support our various retail sales districts.design centers.
ETHAN ALLEN INTERIORS INC. AND SUBSIDIARIESAs of June 30, 2020, there were 144 Company-operated retail design centers totaling 2,159,000 square feet and averaging approximately 15,000 square feet in size per location. Of the 144 Company-operated retail design centers, 51 of the properties are owned and 93 are leased.
The location activity and geographic distribution of our retail network for fiscal years ended June 30 are as follows:
| | | Fiscal 2018 | | | Fiscal 2017 | |
| | | Independent | | | Company- | | | | | | | Independent | | | Company- | | | | | |
| | | retailers | | | operated | | | Total | | | retailers | | | operated | | | Total | |
Retail Design Center location activity: | | | | | | | | | | | | | | | | | | | | | | | | |
Balance at beginning of period | | | 155 | | | | 148 | | | | 303 | | | | 153 | | | | 143 | | | | 296 | |
New locations | | | 11 | | | | 3 | | | | 14 | | | | 8 | | | | 6 | | | | 14 | |
Closures | | | (11 | ) | | | (5 | ) | | | (16 | ) | | | (5 | ) | | | (2 | ) | | | (7 | ) |
Transfers | | | (2 | ) | | | 2 | | | | - | | | | (1 | ) | | | 1 | | | | - | |
Balance at end of period | | | 153 | | | | 148 | | | | 301 | | | | 155 | | | | 148 | | | | 303 | |
Relocations (in new and closures) | | | 0 | | | | 1 | | | | 1 | | | | 1 | | | | 2 | | | | 3 | |
| | | | | | | | | | | | | | | | | | | | | | | | | |
Retail Design Center geographic locations: | | | | | | | | | | | | | | | | | | | | | | | | |
United States | | | 44 | | | | 142 | | | | 186 | | | | 48 | | | | 142 | | | | 190 | |
Canada | | | - | | | | 6 | | | | 6 | | | | - | | | | 6 | | | | 6 | |
China | | | 87 | | | | - | | | | 87 | | | | 82 | | | | - | | | | 82 | |
Other Asia | | | 9 | | | | - | | | | 9 | | | | 12 | | | | - | | | | 12 | |
Europe | | | 6 | | | | - | | | | 6 | | | | 6 | | | | - | | | | 6 | |
Middle East | | | 7 | | | | - | | | | 7 | | | | 7 | | | | - | | | | 7 | |
Total | | | 153 | | | | 148 | | | | 301 | | | | 155 | | | | 148 | | | | 303 | |
Of the 148 Company operated retail design centers, 50 of the properties are owned and 98 are leased. We own one and lease six additional retail properties, which we lease to three independent Ethan Allen retailers, and four unaffiliated third parties. See Note 7 to the Consolidated Financial Statements included under Item 8 of this Annual Report for more information with respect to our operating lease obligations.
| | | Fiscal 2020 | | | Fiscal 2019 | |
| | | Independent | | | Company- | | | | | | | Independent | | | Company- | | | | | |
| | | retailers | | | operated | | | Total | | | retailers | | | operated | | | Total | |
Retail Design Center activity: | | | | | | | | | | | | | | | | | | | | | |
Balance at July 1 | | | 158 | | | | 144 | | | | 302 | | | | 148 | | | | 148 | | | | 296 | |
New locations | | | 13 | | | | 9 | | | | 22 | | | | 21 | | | | 3 | | | | 24 | |
Closures | | | (10 | ) | | | (10 | ) | | | (20 | ) | | | (9 | ) | | | (9 | ) | | | (18 | ) |
Transfers | | | (1 | ) | | | 1 | | | | - | | | | (2 | ) | | | 2 | | | | - | |
Balance at June 30 | | | 160 | | | | 144 | | | | 304 | | | | 158 | | | | 144 | | | | 302 | |
Relocations (in new and closures) | | | 1 | | | | 7 | | | | 8 | | | | - | | | | 3 | | | | 3 | |
| | | | | | | | | | | | | | | | | | | | | | | | | |
Retail Design Center geographic locations: | | | | | | | | | | | | | | | | | | | | | |
United States | | | 35 | | | | 138 | | | | 173 | | | | 40 | | | | 138 | | | | 178 | |
Canada | | | - | | | | 6 | | | | 6 | | | | - | | | | 6 | | | | 6 | |
China | | | 107 | | | | - | | | | 107 | | | | 100 | | | | - | | | | 100 | |
Other Asia | | | 11 | | | | - | | | | 11 | | | | 11 | | | | - | | | | 11 | |
Europe | | | 1 | | | | - | | | | 1 | | | | 1 | | | | - | | | | 1 | |
Middle East | | | 6 | | | | - | | | | 6 | | | | 6 | | | | - | | | | 6 | |
Total | | | 160 | | | | 144 | | | | 304 | | | | 158 | | | | 144 | | | | 302 | |
We believe that all our properties are well maintained, and in good condition. We estimate thatcondition, are being used productively and are adequate to meet our requirements for the foreseeable future. In an effort to further improve and optimize our manufacturing plants are currently operating at approximately 54%and logistics operations, we executed on the following projects during fiscal 2020: (i) converted our Old Fort, North Carolina plant into a state-of-the-art distribution center to support our national distribution structure and growing United States government General Services Administration (“GSA”) contract business; (ii) consolidated our United States case goods manufacturing to Vermont; (iii) expanded our Maiden, North Carolina campus; and (iv) moved the distribution operations from our Passaic, New Jersey facility to our operations in North Carolina and outsourced the art framing operations.
For additional information regarding leases for our properties, see Note 6, Leases, of capacity basedthe notes to our consolidated financial statements included under Item 8 of this Annual Report on their current shifts and staffing. We believe we have additional capacity at selected facilities, which we could utilize with minimal additional capital expenditures.Form 10-K.
ETHAN ALLEN INTERIORS INC. AND SUBSIDIARIES
ItemITEM 3. Legal ProceedingsLEGAL PROCEEDINGS
InFrom time to time, we are subject to legal proceedings, claims, litigation and other proceedings arising in the ordinary course of business. Such legal proceedings may include claims related to our employment practices, wage and hour claims, claims of intellectual property infringement, including with respect to trademarks, claims asserting unfair competition and unfair business practices, and consumer class action claims relating to our consumer practices. In addition, from time to time, we are subject to product liability and personal injury claims for the products that we sell and the design centers we operate. We could also face a wide variety of employee claims against us, including general discrimination, privacy, labor and employment, ERISA and disability claims. Any claims could result in litigation against us and could also result in regulatory proceedings being brought against us by various federal and state agencies that regulate our business, including the U.S. Equal Employment Opportunity Commission.
Based on a review of all currently known facts and our experience with previous legal matters, we have recorded expense in respect of probable and reasonably estimable losses arising from legal matters and we currently do not believe it is probable that we will have any additional loss that would have a material adverse effect on our consolidated financial position, our annual results of operations or our annual cash flows. However, these matters are partysubject to variousinherent uncertainties and our view of these matters may change in the future. For additional information regarding legal proceedingsmatters, refer to Note 20, Commitments and claims which we believe are incidental toContingencies, of the operation of our business. Other than as described under Note 13notes to our consolidated financial statements included in Part II,under Item 8 of this Annual Report on Form 10-K, we believe the ultimate outcome of these proceedings to which we are currently a party will not have a material adverse effect on our business, financial position, results of operations or cash flows.10-K.
Regulations issued under the Clean Air Act Amendments of 1990 required the industry to reformulate certain furniture finishes or institute process changes to reduce emissions of volatile organic compounds. Compliance with many of these requirements has been facilitated through the introduction of high solids coating technology and alternative formulations. In addition, we have instituted a variety of technical and procedural controls, including reformulation of finishing materials to reduce toxicity, implementation of high velocity low pressure spray systems, development of storm water protection plans and controls, and further development of related inspection/audit teams, all of which have served to reduce emissions per unit of production. We remain committed to implementing new waste minimization programs and/or enhancing existing programs with the objective of (i) reducing the total volume of waste, (ii) limiting the liability associated with waste disposal, and (iii) continuously improving environmental and job safety programs on the factory floor which serve to minimize emissions and safety risks for employees. To reduce the use of hazardous materials in the manufacturing process, we will continue to evaluate the most appropriate, cost-effective control technologies for finishing operations and production methods. We believe that our facilities are in material compliance with all such applicable laws and regulations. Our currently anticipated capital expenditures for environmental control facility matters are not material.
ETHAN ALLEN INTERIORS INC. AND SUBSIDIARIES
ItemITEM 4. Mine Safety DisclosuresMINE SAFETY DISCLOSURES
Not applicable.
ETHAN ALLEN INTERIORS INC. AND SUBSIDIARIES
PART II
ItemITEM 5. Market for Registrant's Common Equity, Related Stockholder Matters and Issuer Purchases of Equity SecuritiesMARKET FOR REGISTRANT’S COMMON EQUITY, RELATED STOCKHOLDER MATTERS AND ISSUER PURCHASES OF EQUITY SECURITIES
(a) | Market Information, Holders of Record, Dividends, Securities Authorized for Issuance and Stock Performance Graph |
Our
Market Information. Ethan Allen common stock is traded on the New York Stock Exchange (“NYSE”) under ticker symbol "ETH"“ETH”. The following table sets forth, for each quarterly period during the past two fiscal years, (i) the intraday high and low sales prices of our common stock as reported on the NYSE and (ii) the dividends per share declared by us:
| | | Market Price | | | Dividends | |
| | | High | | | Low | | | Per Share | |
Fiscal 2018 | | | | | | | | | | | | |
First Quarter | | $ | 33.12 | | | $ | 27.35 | | | | 0.19 | |
Second Quarter | | | 32.90 | | | | 26.45 | | | | 0.50 | |
Third Quarter | | | 29.40 | | | | 22.15 | | | | 0.19 | |
Fourth Quarter | | | 25.15 | | | | 21.50 | | | | 0.19 | |
| | | | | | | | | | | | | |
Fiscal 2017 | | | | | | | | | | | | |
First Quarter | | $ | 36.77 | | | $ | 30.63 | | | | 0.17 | |
Second Quarter | | | 38.80 | | | | 29.20 | | | | 0.19 | |
Third Quarter | | | 37.90 | | | | 27.75 | | | | 0.19 | |
Fourth Quarter | | | 32.50 | | | | 26.75 | | | | 0.19 | |
Holders of Record.As of July 26, 2018,August 20, 2020, there were 222 shareholders of record of our common stock. Management estimates there are approximately 9,000 beneficial shareholdersstock, including Cede & Co., the nominee of the Depository Trust Company. However, because many of our shares of common stock are held by brokers and other institutions on behalf of shareholders, we are unable to estimate the total number of shareholders represented by these record holders.
Dividends.At the quarterly meeting of the Board of Directors held on April 28, 2020, our Board temporarily suspended the Company’s common stock.regular quarterly cash dividend in consideration of the impacts of the ongoing COVID-19 pandemic. Our Board of Directors met with management at its next quarterly meeting held on August 4, 2020 to review the effects of the COVID-19 pandemic on the business and determined that it was appropriate to return capital to shareholders in the form of a quarterly cash dividend and reinstated the regular quarterly dividend equal to the pre-COVID-19 level of $0.21 per share. The Company’s policy is to issue quarterly dividends, and we expect to continue to declare and pay comparable quarterly dividends for the foreseeable future, business conditions permitting.
Securities Authorized for Issuance under Equity Compensation Plan Information
The Equity Compensation Plan Information required by this Item will appear in the Ethan Allen Interiors Inc. proxy statement for the 2018 Annual Meeting of Shareholders and is incorporated herein by reference in the introductory paragraph ofPlans.Refer to Part III of this Annual Report.Report on Form 10-K.
Stock Performance Graph.Issuer PurchasesThe annual changes for the five-year period shown in the graph below are based on the assumption that $100 had been invested in our common stock, the Standard & Poor’s 500 Index and the Standard & Poor’s Retail Select Industry Index (“SPSIRE”) on June 30, 2015. The total cumulative dollar returns shown on the graph represent the value that such investments would have had on June 30, 2020. Stockholder returns over the indicated period are based on historical data and should not be considered indicative of Equity Securitiesfuture stockholder returns.
Company/Index/Market | | 2015 | | | 2016 | | | 2017 | | | 2018 | | | 2019 | | | 2020 | |
Ethan Allen Interiors Inc. | | $ | 100.00 | | | $ | 125.44 | | | $ | 122.63 | | | $ | 93.01 | | | $ | 79.95 | | | $ | 44.91 | |
S&P 500® Index | | $ | 100.00 | | | $ | 101.73 | | | $ | 117.46 | | | $ | 131.76 | | | $ | 142.59 | | | $ | 150.27 | |
S&P Retail Select Industry Index (SPSIRE) | | $ | 100.00 | | | $ | 85.13 | | | $ | 82.54 | | | $ | 98.52 | | | $ | 86.13 | | | $ | 86.84 | |
*This performance graph shall not be deemed “soliciting material” or to be “filed” with the SEC for purposes of Section 18 of the Securities Exchange Act of 1934, as amended (the “Exchange Act”), or otherwise subject to the liabilities under that Section, and shall not be deemed to be incorporated by reference into any filing of Ethan Allen under the Securities Act of 1933, as amended, or the Exchange Act whether made before or after the date hereof and irrespective of any general incorporation language in any such filing.
ETHAN ALLEN INTERIORS INC. AND SUBSIDIARIES
(b) | Recent Sales of Unregistered Securities |
There were no sales of unregistered equity securities during fiscal 2020.
(c) | Purchases of Equity Securities by the Issuer |
As of April 1, 2020, as part of our COVID-19 action plan, we temporarily halted our share repurchase program. However, in the future we may from time to time make repurchases in the open market and through privately negotiated transactions, subject to market conditions, including pursuant to our previously announced repurchase program. During the fiscal year ended2020 we repurchased 1,538,363 shares at an average price of $15.81 for a total of $24.3 million. At June 30, 2018 the Company repurchased 950,4842020, we had a remaining Board authorization to repurchase 2,007,364 shares of our common stock at an average price of $23.17 per share. Certain information regarding purchases ofpursuant to our common stock made by us during the three months ended June 30, 2018 is as follows:program.
| | | | | | | | | | | Total Number of | | | Maximum Number of | |
| | | | | | | | | | | Shares Purchased | | | Shares that May Yet | |
| | | Number of | | | Average | | | as Part of Publicly | | | Be Purchased | |
| | | Shares | | | Price Paid | | | Announced | | | Under the | |
| | | Purchased | | | Per Share | | | Plans or Programs | | | Plans or Programs | |
Period | | | | | | | | | | | | | | | | |
April 2018 | | | 513,619 | | | $ | 22.53 | | | | 513,619 | | | | 2,954,911 | |
May 2018 | | | 436,865 | | | $ | 23.91 | | | | 436,865 | | | | 2,518,046 | |
June 2018 | | | - | | | $ | - | | | | - | | | | 2,518,046 | |
Total | | | 950,484 | | | $ | 23.17 | | | | 950,484 | | | | | |
ETHAN ALLEN INTERIORS INC. AND SUBSIDIARIES
On November 21, 2002, our Board of Directors approved a share repurchase program authorizing us to repurchase up to 2,000,000 shares of our common stock, from time to time, either directly or through agents, in the open market at prices and on terms satisfactory to us. Subsequent to that date, the Board of Directors increased the aggregate authorization under the repurchase program on several separate occasions, the last of which was on April 24, 2018 when the Board of Directors increased the aggregate authorization to approximately 3,000,000 shares. There is no expiration date on the repurchase authorization and the amount and timing of future share repurchases, if any, will be determined as market and business conditions warrant.
Comparative Company Performance
The following line graph compares the cumulative total stockholder return for the Company with the S&P 500 Index, and the S&P Retail Select Industry Index (SPSIRE), assuming $100 was invested on June 30, 2013.
ETHAN ALLEN INTERIORS INC. AND SUBSIDIARIES
ItemITEM 6. Selected Financial DataSELECTED FINANCIAL DATA
The following table presentstables set forth, for the periods and at the dates indicated, our selected historical consolidated financial data. We have derived the selected consolidated financial data for the fiscal years ended June 30, 2014 through2020, 2019 and 2018, that has beenand as of June 30, 2020 and 2019, from our audited consolidated financial statements and related notes appearing elsewhere in this Annual Report on Form 10-K. We have derived the selected consolidated financial data for the years ended June 30, 2017 and 2016, and as of June 30, 2018, 2017 and 2016 from our consolidated financial statements. The information set forth belowstatements not appearing elsewhere in this report. This financial data should be read in conjunction with Item 7, Management’s Discussion and Analysis of Financial Condition and Results of Operations and Item 8, Financial Statements and Supplementary Data, of this Annual Report on Form 10-K.
The selected financial data as of and for the year ended June 30, 2020 reflects the modified retrospective application of the new lease accounting standard (Accounting Standards Update 2016-02, Leases). Prior year selected financial data was not restated to reflect the impact of the new lease accounting standard. For information regarding recently issued accounting pronouncements, refer to Note 3, Summary of Significant Accounting Policies in our consolidated financial statements within Part II of this Annual Report on Form 10-K.
(in thousands, except per share data) | | Fiscal Year Ended June 30, | |
| | | 2020 | | | 2019 | | | 2018 | | | 2017 | | | 2016 | |
Consolidated Statements of Income Data | | | | | | | | | | | | | | | | | | | | |
Net sales | | $ | 589,837 | | | $ | 746,684 | | | $ | 766,784 | | | $ | 763,385 | | | $ | 794,202 | |
Gross margin | | | 54.8 | % | | | 54.8 | % | | | 54.2 | % | | | 55.0 | % | | | 55.7 | % |
Operating income | | $ | 14,644 | | | $ | 33,947 | | | $ | 48,867 | | | $ | 57,950 | | | $ | 89,179 | |
Operating margin | | | 2.5 | % | | | 4.5 | % | | | 6.4 | % | | | 7.6 | % | | | 11.2 | % |
Provision for income taxes | | $ | 5,289 | | | $ | 8,162 | | | $ | 12,696 | | | $ | 20,801 | | | $ | 31,319 | |
Effective tax rate | | | 37.3 | % | | | 24.1 | % | | | 25.9 | % | | | 36.5 | % | | | 35.6 | % |
Net income | | $ | 8,900 | | | $ | 25,698 | | | $ | 36,371 | | | $ | 36,194 | | | $ | 56,637 | |
| | | | | | | | | | | | | | | | | | | | | |
Per Share Data | | | | | | | | | | | | | | | | | | | | |
Net income per basic share | | $ | 0.34 | | | $ | 0.96 | | | $ | 1.33 | | | $ | 1.31 | | | $ | 2.02 | |
Basic weighted average shares | | | 26,044 | | | | 26,695 | | | | 27,321 | | | | 27,679 | | | | 28,072 | |
Net income per diluted share | | $ | 0.34 | | | $ | 0.96 | | | $ | 1.32 | | | $ | 1.29 | | | $ | 2.00 | |
Diluted weighted average shares | | | 26,069 | | | | 26,751 | | | | 27,625 | | | | 27,958 | | | | 28,324 | |
Cash dividends declared per share | | $ | 0.63 | | | $ | 1.76 | | | $ | 1.07 | | | $ | 0.74 | | | $ | 0.62 | |
| | | | | | | | | | | | | | | | | | | | | |
Other Information | | | | | | | | | | | | | | | | | | | | |
Depreciation and amortization | | $ | 16,859 | | | $ | 19,530 | | | $ | 19,831 | | | $ | 20,115 | | | $ | 19,353 | |
Capital expenditures and acquisitions | | $ | 17,059 | | | $ | 9,654 | | | $ | 18,773 | | | $ | 18,321 | | | $ | 23,132 | |
Cash dividends paid | | $ | 21,469 | | | $ | 46,990 | | | $ | 29,509 | | | $ | 20,031 | | | $ | 16,646 | |
Working capital | | $ | 90,974 | | | $ | 93,464 | | | $ | 93,165 | | | $ | 116,653 | | | $ | 124,857 | |
Current ratio | | | 1.65 | | | | 1.76 | | | | 1.77 | | | | 1.92 | | | | 2.01 | |
| | | | | | | | | | | | | | | | | | | | | |
Consolidated Balance Sheet Data (at end of period) | | | | | | | | | | | | | | | | | | | | |
Cash and cash equivalents | | $ | 72,276 | | | $ | 20,824 | | | $ | 22,363 | | | $ | 57,701 | | | $ | 52,659 | |
Total assets | | $ | 622,789 | | | $ | 510,351 | | | $ | 530,433 | | | $ | 568,222 | | | $ | 577,409 | |
Long-term debt | | $ | 50,000 | | | $ | 516 | | | $ | 1,096 | | | $ | 11,608 | | | $ | 38,837 | |
Total liabilities | | $ | 294,725 | | | $ | 146,422 | | | $ | 146,563 | | | $ | 167,326 | | | $ | 185,207 | |
Shareholders' equity | | $ | 328,064 | | | $ | 363,929 | | | $ | 383,870 | | | $ | 400,896 | | | $ | 392,202 | |
Long-term debt to equity ratio | | | 15.2 | % | | | 0.1 | % | | | 0.3 | % | | | 2.9 | % | | | 9.9 | % |
ETHAN ALLEN INTERIORS INC. AND SUBSIDIARIES
ITEM 7.MANAGEMENT’S DISCUSSION AND ANALYSIS OF FINANCIAL CONDITION AND RESULTS OF OPERATIONS
Management’s Discussion and Analysis of Financial Condition and Results of Operations included under Item 7(“MD&A”) is designed to provide a reader of this Annual Reportour financial statements with a narrative from the perspective of our management on our financial condition, results of operations, liquidity and certain other factors that may affect our Consolidated Financial Statements (including the notes thereto) included under Item 8 of this Annual Report. Dollar amounts are in thousands except per share data.
| | | Fiscal Year Ended June 30, | |
| | | 2018 | | | 2017 | | | 2016 | | | 2015 | | | 2014 | |
Consolidated Operations Data | | | | | | | | | | | | | | | | | | | | | | | | | | | | | | |
Net Sales | | $ | 766,784 | | | $ | 763,385 | | | $ | 794,202 | | | $ | 754,600 | | | $ | 746,659 | |
Cost of Sales | | | 350,820 | | | | 343,662 | | | | 351,966 | | | | 343,437 | | | | 340,163 | |
Selling, general and administrative expenses | | | 367,097 | | | | 361,773 | | | | 353,057 | | | | 345,229 | | | | 336,860 | |
Operating income | | | 48,867 | | | | 57,950 | | | | 89,179 | | | | 65,934 | | | | 69,636 | |
Interest and other expense, net | | | (200 | ) | | | 955 | | | | 1,223 | | | | 9,251 | | | | 7,234 | |
Income before income tax expense | | | 49,067 | | | | 56,995 | | | | 87,956 | | | | 56,683 | | | | 62,402 | |
Income tax expense (benefit) | | | 12,696 | | | | 20,801 | | | | 31,319 | | | | 19,541 | | | | 19,471 | |
Net income | | $ | 36,371 | | | $ | 36,194 | | | $ | 56,637 | | | $ | 37,142 | | | $ | 42,931 | |
| | | | | | | | | | | | | | | | | | | | | | | | | | | | | | | |
Per Share Data | | | | | | | | | | | | | | | | | | | | | | | | | | | | | | |
Net income per basic share | | $ | 1.33 | | | $ | 1.31 | | | $ | 2.02 | | | $ | 1.29 | | | $ | 1.48 | |
Basic weighted average shares outstanding | | | 27,321 | | | | 27,679 | | | | 28,072 | | | | 28,874 | | | | 28,918 | |
Net income per diluted share | | $ | 1.32 | | | $ | 1.29 | | | $ | 2.00 | | | $ | 1.27 | | | $ | 1.47 | |
Diluted weighted average shares outstanding | | | 27,625 | | | | 27,958 | | | | 28,324 | | | | 29,182 | | | | 29,276 | |
Cash dividends per share | | $ | 1.07 | | | $ | 0.74 | | | $ | 0.62 | | | $ | 0.50 | | | $ | 0.40 | |
| | | | | | | | | | | | | | | | | | | | | | | | | | | | | | | |
Other Information | | | | | | | | | | | | | | | | | | | | | | | | | | | | | | |
Depreciation and amortization | | $ | 19,831 | | | $ | 20,115 | | | $ | 19,353 | | | $ | 19,142 | | | $ | 17,930 | |
Capital expenditures and acquisitions | | $ | 18,773 | | | $ | 18,321 | | | $ | 23,132 | | | $ | 21,778 | | | $ | 19,305 | |
Working capital | | $ | 93,165 | | | $ | 116,653 | | | $ | 124,857 | | | $ | 130,012 | | | $ | 169,582 | |
Current ratio | | | 1.77 | to | 1 | | | | 1.92 | to | 1 | | | | 2.01 | to | 1 | | | | 1.92 | to | 1 | | | | 2.25 | to | 1 | |
Effective tax rate | | | 25.9 | % | | | 36.5 | % | | | 35.6 | % | | | 34.5 | % | | | 31.2 | % |
| | | | | | | | | | | | | | | | | | | | | | | | | | | | | | | |
Balance Sheet Data (at end of period) | | | | | | | | | | | | | | | | | | | | | | | | | | | | | | |
Total assets | | $ | 530,433 | | | $ | 568,222 | | | $ | 577,409 | | | $ | 605,977 | | | $ | 654,434 | |
Total debt, including capital lease obligations | | $ | 1,680 | | | $ | 14,339 | | | $ | 41,838 | | | $ | 76,237 | | | $ | 130,912 | |
Shareholders' equity | | $ | 383,870 | | | $ | 400,896 | | | $ | 392,202 | | | $ | 370,535 | | | $ | 367,467 | |
Debt as a percentage of equity | | | 0.4 | % | | | 3.6 | % | | | 10.7 | % | | | 20.6 | % | | | 35.6 | % |
Debt as a percentage of capital | | | 0.4 | % | | | 3.5 | % | | | 9.6 | % | | | 17.1 | % | | | 26.3 | % |
ETHAN ALLEN INTERIORS INC. AND SUBSIDIARIES
Item 7. Management's Discussion and Analysis of Financial Condition and Results of Operationfuture results.
The following discussion of financial condition and results of operationsMD&A is based upon, and should be read in conjunction with, our Consolidated Financial Statements (including the notes thereto)and related Notes included under Item 8 of this Annual Report.
Forward-Looking Statements
Management's discussion and analysis of financial condition and results of operations and other sections of this Annual Report on Form 10-K contain forward-looking statements within the meaning of the Private Securities Litigation Reform Act of 1995, Section 27A of the Securities Act of 1933, as amended, and Section 21E of the Securities Exchange Act of 1934, as amended (the “Exchange Act”), which represent management’s beliefs and assumptions concerning future events based on information currently available to us relating to our future results. Such forward-looking statements are identified in this Annual Report on Form 10-K and in documents incorporated herein by reference by use of forward-looking words such as "anticipate", "believe", "plan", "estimate", "expect", "intend", “will”, “may”, “continue”, “project”, ”target”, “outlook”, “forecast”, “guidance”, and similar expressions and the negatives of such forward-looking words. These forward-looking statements are subject to management decisions and various assumptions about future events, and are not guarantees of future performance. Actual results could differ materially from those anticipated in the forward-looking statements due to a number of risks and uncertainties including, but not limited to: competition from overseas manufacturers and domestic retailers; our anticipating or responding to changes in consumer tastes and trends in a timely manner; our ability to maintain and enhance our brand, marketing and advertising efforts and pricing strategies; changes in global and local economic conditions that may adversely affect consumer demand and spending, our manufacturing operations or sources of merchandise and international operations; changes in U.S. policy related to imported merchandise; an economic downturn; our limited number of manufacturing and logistics sites; fluctuations in the price, availability and quality of raw materials; environmental, health and safety requirements; product safety concerns; disruption to our technology infrastructure (including cyber attacks); increasing labor costs, competitive labor markets and our continued ability to retain high-quality personnel and risks of work stoppages; loss of key personnel; our ability to obtain sufficient external funding to finance our operations and growth; access to consumer credit; the effect of operating losses on our ability to pay cash dividends; our ability to locate new design center sites and/or negotiate favorable lease terms for additional design centers or for the expansion of existing design centers; the effects of terrorist attacks or conflicts or wars involving the United States or its allies or trading partners; and those matters discussed in Items 1A and 7A of this Annual Report on Form 10-K and in our other SEC filings. Accordingly, actual circumstances and results could differ materially from those contemplated by the forward-looking statements.
Given the risks and uncertainties surrounding forward-looking statements, you should not place undue reliance on these statements. Many of these factors are beyond our ability to control or predict. Our forward-looking statements speak only as of the date of this Annual Report on Form 10-K. Other than as required by law, we undertake no obligation
Executive Overview
Who We Are. Founded in 1932 and incorporated in Delaware in 1989, Ethan Allen is a leading interior design company and manufacturer and retailer of quality home furnishings. We are vertically integrated from design through delivery, affording our clientele a value proposition of style, quality and price. We offer complementary interior design service to update or revise forward-looking statements, whetherour clients and sell a full range of furniture products and decorative accents through ethanallen.com and a network of approximately 300 design centers in the United States and abroad. The design centers represent a mix of independent licensees and our own Company-operated retail segment. We own and operate nine manufacturing facilities, including three manufacturing plants, one sawmill, one rough mill and a lumberyard in the United States and two manufacturing plants in Mexico and one manufacturing plant in Honduras. Approximately 75% of our products are made in our North American plants.
Business Model.Our business model is to maintain continued focus on (i) capitalizing on the strength of our interior design consultants in our retail design centers, (ii) investing in new technologies across key aspects of our vertically integrated business, (iii) utilizing ethanallen.com as a resultkey marketing tool to drive traffic to our design centers, (iv) communicating our messages with strong advertising and marketing campaigns, and (v) leveraging the benefits of new information, future events, or otherwise.
Critical Accounting Policiesour vertical integration by maintaining a strong manufacturing capacity in North America.
Our consolidated financial statements have been prepared in conformity with U.S. generally accepted accounting principles that require, in some cases, that certain estimates and assumptions be made that affect the amounts and disclosures reported in those financial statements and the related accompanying notes. Estimates are based on currently known facts and circumstances, prior experience and other reasonable assumptions. We use our best judgment in valuing these estimates and may, as warranted, solicit external advice. Actual results could differ from these estimates, assumptions and judgments, and these differences could be material. The following critical accounting policies, some of which are impacted significantly by estimates, assumptions and judgments, affect our consolidated financial statements.competitive advantages arise from:
| ● | providing fashionable high-quality products of the finest craftsmanship; |
| ● | offering complimentary design service through our motivated interior designer network-wide; |
| ● | offering a wide array of custom products across our upholstery, case goods, and accent product categories; |
| ● | use of technology in all aspects of the business; and |
| ● | leveraging our vertically integrated structure. |
Inventories – Inventories (finished goods, work in process and raw materials) are stated at the lower of cost, determined on a first-in, first-out basis, and net realizable value. Cost is determined based solely on those charges incurred in the acquisition and production of the related inventory (i.e. material, labor and manufacturing overhead costs). We estimate an inventory reserve for excess quantities and obsolete items based on specific identification and historical write-downs, taking into account future demand and market conditions. If actual demand or market conditions in the future are less favorable than those estimated, additional inventory write-downs may be required.
Revenue Recognition – Revenue is recognized when all the following have occurred: persuasive evidence of a sales arrangement exists (e.g., a wholesale purchase order or retail sales order); the sales arrangement specifies a fixed or determinable sales price; title and risk of ownershipOur strategy has passedbeen to the customer; no specific performance obligations remain; product is shipped or services are provided to the customer; collectability is reasonably assured. As such, revenue recognition generally occurs upon the shipment of goods to independent retailers or, in the case ofposition Ethan Allen operated retailas a preferred brand offering complimentary design centers, upon deliveryservice together with products of superior style, quality and value to the customer. Ifprovide consumers with a shipping charge is billedcomprehensive, one-stop shopping solution for their home furnishing and interior design needs. In carrying out our strategy, we continue to customers, this is includedexpand our reach to a broader consumer base through a diverse selection of attractively priced products, designed to complement one another, reflecting current fashion trends in revenue. Recorded sales provide for estimated returns and allowances.home decorating. We permit our customers to return defective products and incorrect shipments, and terms we offer are standard for the industry.
ETHAN ALLEN INTERIORS INC. AND SUBSIDIARIES
Impairment of Long-Lived Assets and Goodwill – Goodwill and other indefinite-lived intangible assets are evaluated for impairment on an annual basis during the fourth quarter of each fiscal year, and between annual tests whenever events or circumstances indicate that the carrying value of the goodwill or other intangible asset may exceed its fair value. When testing goodwill for impairment, we may assess qualitative factors for some or all of our reporting units to determine whether it is more likely than not (that is, a likelihood of more than 50 percent) that the fair value of a reporting unit is less than its carrying amount, including goodwill. Alternatively, we may bypass this qualitative assessment for some or all of our reporting units and determine whether the carrying value exceeds the fair value using a quantitative assessment.
The recoverability of long-lived assets is evaluated for impairment whenever events orcontinuously monitor changes in circumstances indicate that we may not be able to recover the carrying amount of an asset or asset group. Our assessment of recoverability determines whether the carrying value will be recoveredhome fashion trends through the expected undiscounted future cash flows resulting from the use of the asset. In the event the sum of the expected undiscounted future cash flows is less than the carrying value of the asset, an impairment loss equal to the excess of the asset’s carrying value over its fair value is recorded. The long-term nature of these assets requires the estimation of cash inflowsattendance at international industry events and outflows several years into the future.
The fair value offashion shows, internal market research, and regular communication with our trade name, which is the Company’s only indefinite-lived intangible asset other than goodwill, is valued using the relief-from-royalty method. Significant factors used in trade name valuation are rates for royalties, future growth,retailers and the discount rate. Royalty rates are determined using an average of recent comparable values. Future growth rates are baseddesign center design consultants who provide valuable input on market participant assumptions based on the industry in which we operate, and the discount rate is determined using the weighted average cost of capital for companies within our peer group, adjusted for specific company risk premium factors.
Income Taxes – Income taxes are accounted for under the asset and liability method. Deferred tax assets and liabilities are recognized for the future tax consequences attributable to differences between the financial statement carrying amounts of existing assets and liabilities and their respective tax bases and operating loss and tax credit carryforwards. Deferred tax assets and liabilities are measured using enacted tax rates expected to apply to taxable income in the years in which those temporary differences are expected to be recovered or settled. The effect on deferred tax assets and liabilities of a change in tax rates is recognized in income in the period that includes the enactment date. Additional factors that we consider when making judgments about the deferred tax valuation include tax law changes, a recent history of cumulative losses, and variances in future projected profitability.
The Company evaluates, on a quarterly basis, uncertain tax positions taken or expected to be taken on tax returns for recognition, measurement, presentation, and disclosure in its financial statements. If an income tax position exceeds a 50% probability of success upon tax audit, based solely on the technical merits of the position, the Company recognizes an income tax benefit in its financial statements. The tax benefits recognized are measured based on the largest benefit that has a greater than 50% likelihood of being realized upon ultimate settlement. The liability associated with an unrecognized tax benefit is classified as a long-term liability except for the amount for which a cash payment is expected to be made or tax positions settled within one year.consumer trends. We recognize interest and penalties related to income tax matters as a component of income tax expense.
Business Insurance Reserves – We have insurance programs in place to cover workers’ compensation and property/casualty claims. The insurance programs, which are funded through self-insured retention, are subject to various stop-loss limitations. We accrue estimated losses using actuarial models and assumptions based on historical loss experience. Although we believe that the insurance reserves are adequate, the reserve estimates are based on historical experience, which may not be indicative of currentobservations and future losses. In addition, the actuarial calculations usedinput gathered enable us to estimate insurance reserves are based on numerous assumptions, some of which are subjective. We adjust insurance reserves, as needed, in the event that future loss experience differs from historical loss patterns.incorporate appropriate style details into our products to react quickly to changing consumer tastes.
OngoingOther Loss Reserves –Evolution and We have a number of other potential loss exposures incurred in the ordinary course of business such as environmental claims, product liability, litigation, tax liabilities, restructuring charges, and the recoverability of deferred income tax benefits. Establishing loss reserves for these matters requires the use of estimates and judgment with regard to maximum risk exposure and ultimate liability or realization. As a result, these estimates are often developed with our counsel, or other appropriate advisors, and are based on our current understanding of the underlying facts and circumstances. Because of uncertainties related to the ultimate outcome of these issues or the possibilities of changes in the underlying facts and circumstances, additional charges related to these issues could be required in the futureTransformation.
ETHAN ALLEN INTERIORS INC. AND SUBSIDIARIES
Results of Operations
In this Item 7 of this Annual Report , unless otherwise noted, all comparisons are fromOur product offerings continue to evolve and transform to meet the fiscal year ended June 30, 2018 to the prior fiscal year ended June 30, 2017 ($ in millions except per share amounts).
A summarychanging demands and tastes of our consolidated operations for the past three fiscal years is presented in the following table.
| | | Fiscal years ended June 30, | |
| | | 2018 | | | % | | | 2017 | | | % | | | 2016 | | | % | |
Net sales | | $ | 766.8 | | | | 100.0 | % | | $ | 763.4 | | | | 100.0 | % | | $ | 794.2 | | | | 100.0 | % |
Gross profit | | $ | 416.0 | | | | 54.2 | % | | $ | 419.7 | | | | 55.0 | % | | $ | 442.2 | | | | 55.7 | % |
SG&A | | $ | 367.1 | | | | 47.9 | % | | $ | 361.8 | | | | 47.4 | % | | $ | 353.1 | | | | 44.5 | % |
Operating income | | | 48.9 | | | | 6.4 | % | | | 58.0 | | | | 7.6 | % | | | 89.2 | | | | 11.2 | % |
Net income | | | 36.4 | | | | 4.7 | % | | | 36.2 | | | | 4.7 | % | | | 56.6 | | | | 7.1 | % |
Earnings per diluted share | | $ | 1.32 | | | | | | | $ | 1.29 | | | | | | | $ | 2.00 | | | | | |
Net cash provided by operating activities | | $ | 42.5 | | | | | | | $ | 78.6 | | | | | | | $ | 58.4 | | | | | |
A summary of changes from the preceding fiscal year are presented in the following table.
| | | Fiscal years ended June 30, | |
| | | 2018 | | | 2017 | | | 2016 | |
Net sales | | | 0.4 | % | | | (3.9 | %) | | | 5.2 | % |
Operating income | | | (15.7 | %) | | | (35.0 | %) | | | 35.3 | % |
Net income | | | 0.5 | % | | | (36.1 | %) | | | 52.5 | % |
Earnings per diluted share | | | 2.3 | % | | | (35.5 | %) | | | 57.5 | % |
Net cash provided by operating activities | | | (46.0 | %) | | | 34.7 | % | | | 5.9 | % |
customers. We have completed a major transformation of our product offerings, having refreshed overapproximately 70% of our entire product line over the past three years. During fiscal 20182020, we further strengthened our offerings with new products including Lucy, a mid-century modern inspired upholstery collection that launched very successfully, and Farmhouse, a country cottage inspired furniture collection that just recently launched to strong reviews. Prior to that, in fiscal 2019, we introduced our Relaxed Modern product line, a casual, livable, inspired by nature, transitional design made of mixed materials as well as expanded our GSA business with an award of a blanket purchase agreement for the U. S. Department of State “Worldwide Residential Furniture Program”, and partnered with AmazonHome & Garden collection. Our contract sales, including sales to sell products through the Amazon marketplace. During the fall of 2017, we introduced Passport, a focused collection of unique artisan crafted items inspired by designs from around the world, and in the spring of 2018 launched our new Uptown collection, featuring a modern perspective on classic designs.
During the first quarter of fiscal 2018, we were negatively impacted by adverse weather affecting sales, manufacturing and delivery of our products. Additionally, our net sales and profitability were negatively affected by first run production for both the GSA, businesshospitality and floor samples for our new Passport collection. Theother commercial businesses, also continue to grow and the GSA is nowhas become one of our ten largest customers. The high order volume fromOur marketing programs during the GSA business with contractually short lead-times, together withyear were strong. In the new product production runs further impacted production capacity which resulted in production and shipping delays to our retail customers that continued into the third quarter of fiscal 2018.
Beginning in March and continuing through the fourthsecond quarter we launched a major brand-building marketing program utilizing national television. This program targetedfeaturing a broad demographic base beyondmembership with special saving opportunities. In the third quarter, with the effects of the pandemic accelerating, we pivoted our marketing messaging to our core customervalues centered on our quality and service, including offering the opportunity for our customers to shop safely by appointment in-store or online. We also implemented marketing geared to drive customers to our online channels and to interact with our designers virtually, and as a result, we expect that as wehave seen our internet business double during the past three months. We plan for our marketing programs going forward to continue to marketfocus on our core values and the in-store or virtual professional services of our interior design professionals.
ETHAN ALLEN INTERIORS INC. AND SUBSIDIARIES
Business Update Related to Impact of COVID-19. The ongoing COVID-19 health crisis continues to pose significant and widespread risk to our business as well as to the business environment and the markets in which we operate our business. We have already experienced significant disruption to our business as a result of the rapid development of the COVID-19 pandemic. The immediate impact from this broader base,global health crisis has been both direct in terms of disruption in numerous aspects of our brand awarenessbusiness operations, including a 50.2% reduction in revenues during the fourth quarter, the furlough of approximately 70% of our global workforce on April 1, 2020, elimination of non-essential operating expenses which led to a 42.8% decline in expenses in the past three months and the borrowing of $100 million under our revolving credit facility as well as indirect in terms of the adverse effect on overall economic conditions. The magnitude and duration of the negative impact to our business from the COVID-19 pandemic cannot be predicted with certainty. In response to the COVID-19 pandemic, we have taken actions to tightly manage costs, working capital and capital expenditures to preserve the Company’s financial health. We will increasecontinue to monitor the impact of COVID-19 on the Company's business, results of operations, financial position and ultimately drive increased revenues over time.cash flows.
GrossWhen the public health crisis posed by COVID-19 first broke out, we announced immediate actions to mitigate the impact, including temporary closures of our Company-operated retail design centers in North America, effective March 19, 2020. As sales continued to decline, we also had to institute a number of measures to mitigate expenses and reduce costs. On April 1, 2020, we announced our action plan in response to the COVID-19 health crisis. Measures taken included, among other things, the temporary closure of design centers and manufacturing facilities, the furlough of 70% of our global workforce, the decision by our CEO to temporarily forego his salary through June 30, 2020, a temporary reduction in salaries of up to 40% for all senior management and up to 20% for other salaried employees through June 30, 2020, a temporary reduction of 50% in the cash compensation of the Company’s directors through June 30, 2020, the elimination of all non-essential operating expenses, a delay of capital expenditures, the temporary suspension of the regular quarterly dividend and temporarily halted our share repurchase program. These efforts may not be sufficient to offset anticipated declines in revenue resulting from the persistent crisis and may negatively affect our ability to fully resume operations.
In an effort to mitigate the impacts of the ongoing COVID-19 pandemic, we have also taken various actions to preserve our liquidity. As previously announced, in March 2020, the Company drew down $100 million under our revolving credit facility and subsequently repaid $50 million in June 2020. As a result of the drawdown, we had an outstanding cash and cash equivalents balance of $72.3 million as of June 30, 2020. Additionally, we reduced or stopped discretionary spending across all areas of the business. We have also negotiated alternative terms for lease payments and reduced merchandise purchases as we further manage to lower inventory carrying levels. The Company has planned reduced capital expenditures in fiscal 2021 as compared to the previous fiscal year with a primary focus on critical activities, such as maintenance capital and necessary technology investments. At this time, we believe that we have sufficient liquidity on hand to continue business operations and service our debt obligations during this volatile period. If the Company experienced another significant reduction in revenues, we would have additional alternatives to maintain liquidity, including further decreases in capital expenditures and cost reductions as well adjustments to our capital allocation policy. To date, we have halted our share repurchase program but reinstated our temporarily suspended quarterly dividend. Refer to the Liquidity and Capital Resources section for additional information.
The global scale and scope of COVID-19 is unknown, and the duration of the business disruption and related financial impact cannot be reasonably estimated at this time. The extent to which the ongoing COVID-19 pandemic impacts our results will depend on future developments that are highly uncertain and cannot be predicted. For more information, refer to Item 1A, Risk Factors.
Fiscal 2020Financial Year in Review.(1)The impact of the COVID-19 crisis, which accelerated during our fiscal third quarter and caused the temporary closing of all of our North American design centers and most of our manufacturing in March 2020 and through most of our fourth quarter, had a significant negative impact on our fiscal 2020 financial results. Consolidated net sales were 21.0% lower in fiscal 2020 compared to the prior year. Net sales decreased by 23.5% within the wholesale segment and by 21.5% in the retail segment. Consolidated international net sales for fiscal 2020 decreased $17.0 million primarily due to lower sales to China and in Canada. Our adjusted gross margin expanded 60 basis points to 55.7% due to improved retail price optimization and increased wholesale contract business partially offset by plant shutdowns from COVID-19. Adjusted operating income, which excludes pre-tax charges from restructuring initiatives, asset impairments and other corporate actions in both periods presented, decreased 69.0% in fiscal 2020 compared with a year ago primarily due to the $156.8 decline in consolidated net sales partially offset by a higher adjusted gross margin and a 12.6% decrease in adjusted operating expenses. The full year fiscal 2020 effective income tax rate was below37.3% compared with 24.1% in the prior year primarily due to increased raw material costs, andrecording a decreasevaluation allowance on deferred tax assets. Adjusted diluted EPS was $0.52 compared with $1.56 in the retailprior year. This decrease was primarily from net sales mix in relation to total sales. This was partlybeing negatively impacted as a result of the COVID-19 pandemic partially offset by anexpense management. As of June 30, 2020, our balance sheet remains strong with cash and cash equivalents of $72.3 million and inventory write-down of $6.4$126.1 million. During fiscal 2020, we generated $52.7 million during the third quarter of fiscal 2017, and a 4.9% increase in wholesale sales. Operating expenses increased slightly as a percentage of sales, mostly due to an increase in advertising expenses. Income taxes were reduced due to the U.S. Tax Cuts and Jobs Act changes enacted in December 2017. The net result was an increase in earnings per diluted share of $0.03.
Net cash provided byfrom operating activities, along with operatingwhich provided us the ability to pay $21.5 million in regular quarterly cash dividends and letters of creditrepurchase $24.3 million in shares under our existing share repurchase program. Furthermore, we elected to draw down $100.0 million on our credit facility enabled usduring fiscal 2020 to repurchase $22.0increase our cash position as a precautionary measure and to preserve financial flexibility in consideration of the disruption and uncertainty surrounding the ongoing COVID-19 pandemic. We subsequently repaid $50.0 million in June using available cash on hand, which leaves $50.0 million of outstanding borrowings on our common stock under our share repurchase program, pay off the remaining $13.8 millionbalance sheet as of our term loan earlier than scheduled, and return $29.5 million in cash dividends to our shareholders. At June 30, 2018 we had total cash and securities of $22.4 million, and working capital of $93.2 million.2020.
(1) | Refer to the Regulation G Reconciliation of Non-GAAP Financial Measures section within this MD&A for the reconciliation of U.S. GAAP to adjusted key financial metrics. |
ETHAN ALLEN INTERIORS INC. AND SUBSIDIARIES
Optimization of Manufacturing and Logistics.During the fourth quarter of fiscal 2019, we initiated restructuring plans to consolidate our manufacturing and logistics operations as part of an overall strategy to maximize production efficiencies and maintain our competitive advantage. We permanently ceased operations at our Passaic, New Jersey property and ceased using most of our Old Fort, North Carolina case goods manufacturing operations, which we transferred to our other existing case goods operations. We completed this optimization project in fiscal 2020 as we converted the Old Fort facility into a distribution center and expanded our existing Maiden, North Carolina manufacturing campus while finalizing severance and other exit costs. In connection with these initiatives, we recorded pre-tax restructuring and other exit charges totaling $2.1 million, consisting of $1.3 million in abnormal manufacturing variances associated with the Passaic and Old Fort facilities, $0.8 million in employee severance and other payroll and benefit costs and $0.7 million in other exit costs partially offset by $0.7 million in gains from the sale of property, plant and equipment held at our Old Fort facility. As part of our optimization plans, we also completed the sale of our Passaic property in September 2019 to an independent third party and received $12.4 million in cash less certain adjustments, including $0.9 million in selling and other closing costs. As a result of the sale, we recognized a pre-tax gain of $11.5 million in fiscal 2020.
Retail Segment Restructuring and Impairment Charges.During fiscal 2020 we recorded $7.7 million of restructuring and impairment charges within the retail segment. Approximately $5.2 million was an impairment charge for long-lived assets held at a number of our retail design centers. An additional $2.5 million represented remaining contractual obligations under leased space that was exited during fiscal 2020.
Inventory Write-downs.During fiscal 2020 we recorded a non-cash charge of $4.1 million related to the write-down and disposal of certain slow moving and discontinued inventory items, which was due to actual demand and forecasted market conditions for these inventory items being less favorable than originally estimated. Of the total inventory write-down, $3.5 million related to slow moving finished goods with the remaining $0.6 million consisting of raw materials that were disposed.
CARES Act. On March 27, 2020, the Coronavirus Aid, Relief, and Economic Security Act (the “CARES Act”) was signed into law. The CARES Act provides numerous tax provisions and other stimulus measures, including temporary suspension of certain payment requirements for the employer-paid portion of social security taxes, the creation of certain refundable employee retention credits, and technical corrections from prior tax legislation for tax depreciation of certain qualified improvement property. We elected to defer the employer-paid portion of social security taxes beginning with pay dates on and after March 12, 2020. We recorded an estimate for refundable employee retention credits for eligible wages paid to employees affected by the cessation of our operations. We also recorded additional employee retention credits during the fourth quarter of 2020 for additional wages paid, primarily for health care benefits paid for employees furloughed in fiscal 2020.
Leases. We adopted Accounting Standards Update 2016-02, Leases (Topic 842), as of July 1, 2019 using the modified retrospective method and have not restated comparative periods. Upon adoption, we recognized operating lease assets of $129.7 million and operating lease liabilities of $149.7 million on our consolidated balance sheet. In addition, $20.0 million of deferred rent and various lease incentives, which were reflected as other long-term liabilities as of June 30, 2019, were reclassified as a component of the right-of-use assets upon adoption. We also recognized a cumulative adjustment as of July 1, 2019, which decreased opening retained earnings by $1.6 million due to the impairment of certain right-of-use assets. The adoption of the new standard did not have a material impact on the consolidated statements of operations or cash flows during fiscal 2020.
ETHAN ALLEN INTERIORS INC. AND SUBSIDIARIES
Key Operating Metrics
A summary of our key operating metrics is presented in the following table ($ in millions, except per share amounts).
| | | Fiscal Year Ended June 30, | |
| | | 2020 | | | % of Sales | | | % Chg | | | 2019 | | | % of Sales | | | % Chg | | | 2018 | | | % of Sales | | | % Chg | |
Net sales | | $ | 589.8 | | | | 100.0 | % | | | (21.0 | %) | | $ | 746.7 | | | | 100.0 | % | | | (2.6 | %) | | $ | 766.8 | | | | 100.0 | % | | | 0.4 | % |
Gross profit | | $ | 323.1 | | | | 54.8 | % | | | (21.1 | %) | | $ | 409.5 | | | | 54.8 | % | | | (1.6 | %) | | $ | 416.0 | | | | 54.2 | % | | | (0.9 | %) |
Adjusted gross profit(1) | | $ | 328.6 | | | | 55.7 | % | | | (20.2 | %) | | $ | 411.5 | | | | 55.1 | % | | | (1.1 | %) | | $ | 416.0 | | | | 54.2 | % | | | (2.4 | %) |
Operating income | | $ | 14.6 | | | | 2.5 | % | | | (56.9 | %) | | $ | 33.9 | | | | 4.5 | % | | | (30.5 | %) | | $ | 48.9 | | | | 6.4 | % | | | (15.7 | %) |
Adjusted operating income(1) | | $ | 17.1 | | | | 2.9 | % | | | (69.0 | %) | | $ | 55.1 | | | | 7.4 | % | | | 9.8 | % | | $ | 50.1 | | | | 6.5 | % | | | (22.8 | %) |
Net income | | $ | 8.9 | | | | 1.5 | % | | | (65.4 | %) | | $ | 25.7 | | | | 3.4 | % | | | (29.3 | %) | | $ | 36.4 | | | | 4.7 | % | | | 0.5 | % |
Adjusted net income(1) | | $ | 13.5 | | | | 2.3 | % | | | (67.5 | %) | | $ | 41.6 | | | | 5.6 | % | | | 11.6 | % | | $ | 37.3 | | | | 4.9 | % | | | (8.2 | %) |
Diluted EPS | | $ | 0.34 | | | | | | | | (64.6 | %) | | $ | 0.96 | | | | | | | | (27.3 | %) | | $ | 1.32 | | | | | | | | 2.3 | % |
Adjusted diluted EPS(1) | | $ | 0.52 | | | | | | | | (66.7 | %) | | $ | 1.56 | | | | | | | | 15.6 | % | | $ | 1.35 | | | | | | | | (6.9 | %) |
Cash flow from operating activities | | $ | 52.7 | | | | | | | | (4.6 | %) | | $ | 55.2 | | | | | | | | 30.0 | % | | $ | 42.5 | | | | | | | | (46.0 | %) |
(1) | Refer to the Regulation G Reconciliation of Non-GAAP Financial Measures section within this MD&A for the reconciliation of U.S. GAAP to adjusted key financial metrics. |
The components of consolidated revenuesnet sales and operating income (loss) by business segment are as follows (inpresented in the following table ($ in millions):
| | | Fiscal Year Ended June 30, | | | Fiscal Year Ended June 30, | |
| | | 2018 | | | 2017 | | | 2016 | | | 2020 | | | 2019 | | | 2018 | |
Revenue: | | | | | | | | | | | | | |
Net sales | | | | | | | | | | | | | |
Wholesale segment | | $ | 475.7 | | | $ | 453.3 | | | $ | 491.5 | | | $ | 337.9 | | | $ | 441.6 | | | $ | 475.7 | |
Retail segment | | | 587.5 | | | | 603.7 | | | | 626.5 | | | | 462.8 | | | | 589.8 | | | | 587.5 | |
Elimination of inter-segment sales | | | (296.4 | ) | | | (293.6 | ) | | | (323.8 | ) | |
Consolidated revenue | | $ | 766.8 | | | $ | 763.4 | | | $ | 794.2 | | |
Elimination of intersegment sales | | | | (210.9 | ) | | | (284.7 | ) | | | (296.4 | ) |
Consolidated net sales | | | $ | 589.8 | | | $ | 746.7 | | | $ | 766.8 | |
| | | | | | | | | | | | | | | | | | | | | | | | | |
Operating income (loss): | | | | | | | | | | | | | | | | | | | | | | | | |
Wholesale segment | | $ | 48.5 | | | $ | 53.5 | | | $ | 74.4 | | | $ | 33.1 | | | $ | 42.4 | | | $ | 48.5 | |
Retail segment | | | (1.7 | ) | | | 1.2 | | | | 16.5 | | | | (21.4 | ) | | | (10.5 | ) | | | (1.7 | ) |
Adjustment for inter-company profit (1) | | | 2.1 | | | | 3.3 | | | | (1.7 | ) | |
Elimination of intercompany profit(1) | | | | 2.9 | | | | 2.0 | | | | 2.1 | |
Consolidated operating income | | $ | 48.9 | | | $ | 58.0 | | | $ | 89.2 | | | $ | 14.6 | | | $ | 33.9 | | | $ | 48.9 | |
| (1) | Represents the change in wholesale profit contained in Ethan Allen operated design centerthe retail segment inventory existing at the end of the period. |
A summary by business segment of annual percentage changes from the applicable periods in the preceding fiscal years areyear is presented in the following tables:table:
| | Fiscal year ended June 30, | |
| | 2018 | | 2017 | | 2016 | |
Wholesale segment | | | | | | | | | |
Revenue | | 4.9 | % | | (7.8 | %) | | 4.7 | % |
Operating Income | | (9.4 | %) | | (28.1 | %) | | 11.1 | % |
Backlog | | 19.3 | % | | 17.6 | % | | (36.8 | %) |
| | | Fiscal Year Ended June 30, | |
| | | 2020 | | | 2019 | | | 2018 | |
Wholesale segment: | | | | | | | | | | | | |
Net sales | | | (23.5 | %) | | | (7.2 | %) | | | 4.9 | % |
Operating income | | | (22.1 | %) | | | (12.4 | %) | | | (9.4 | %) |
Wholesale orders | | | (17.9 | %) | | | (10.8 | %) | | | 5.8 | % |
| | | | | | | | | | | | | |
Retail segment: | | | | | | | | | | | | |
Net sales | | | (21.5 | %) | | | 0.4 | % | | | (2.7 | %) |
Operating income | | | (103.4 | %) | | | (505.8 | %) | | | (245.1 | %) |
| | | Fiscal year ended June 30, | |
| | | 2018 | | | 2017 | | | 2016 | |
Retail segment | | | | | | | | | | | | |
Revenue | | | (2.7 | %) | | | (3.6 | %) | | | 8.1 | % |
Comparable design center revenue | | | (3.2 | %) | | | (4.6 | %) | | | 8.3 | % |
Total written orders | | | (3.1 | %) | | | (0.9 | %) | | | 1.7 | % |
Comparable design center written orders | | | (3.8 | %) | | | (2.5 | %) | | | 1.8 | % |
Operating Income | | | (245.1 | %) | | | (92.7 | %) | | | 853.1 | % |
Backlog | | | (2.3 | %) | | | (1.0 | %) | | | (13.1 | %) |
ETHAN ALLEN INTERIORS INC. AND SUBSIDIARIES
Business Results:The following table shows selected design center location information.
| | | Fiscal 2020 | | | Fiscal 2019 | |
| | | Independent | | | Company- | | | | | | | Independent | | | Company- | | | | | |
| | | retailers | | | operated | | | Total | | | retailers | | | operated | | | Total | |
Retail Design Center activity: | | | | | | | | | | | | | | | | | | | | | | | | |
Balance at July 1 | | | 158 | | | | 144 | | | | 302 | | | | 148 | | | | 148 | | | | 296 | |
New locations | | | 13 | | | | 9 | | | | 22 | | | | 21 | | | | 3 | | | | 24 | |
Closures | | | (10 | ) | | | (10 | ) | | | (20 | ) | | | (9 | ) | | | (9 | ) | | | (18 | ) |
Transfers | | | (1 | ) | | | 1 | | | | - | | | | (2 | ) | | | 2 | | | | - | |
Balance at June 30 | | | 160 | | | | 144 | | | | 304 | | | | 158 | | | | 144 | | | | 302 | |
Relocations (in new and closures) | | | 1 | | | | 7 | | | | 8 | | | | - | | | | 3 | | | | 3 | |
| | | | | | | | | | | | | | | | | | | | | | | | | |
Retail Design Center geographic locations: | | | | | | | | | | | | | | | | | | | | | |
United States | | | 35 | | | | 138 | | | | 173 | | | | 40 | | | | 138 | | | | 178 | |
Canada | | | - | | | | 6 | | | | 6 | | | | - | | | | 6 | | | | 6 | |
China | | | 107 | | | | - | | | | 107 | | | | 100 | | | | - | | | | 100 | |
Other Asia | | | 11 | | | | - | | | | 11 | | | | 11 | | | | - | | | | 11 | |
Europe | | | 1 | | | | - | | | | 1 | | | | 1 | | | | - | | | | 1 | |
Middle East | | | 6 | | | | - | | | | 6 | | | | 6 | | | | - | | | | 6 | |
Total | | | 160 | | | | 144 | | | | 304 | | | | 158 | | | | 144 | | | | 302 | |
Results of Operations
Our revenues are composedFor an understanding of (i) wholesale sales to independently operatedthe significant factors that influenced our financial performance in fiscal 2020 compared with fiscal 2019, the following discussion should be read in conjunction with the consolidated financial statements and Company operated retail design centers and (ii) retail sales of Company operated design centers. See Note 15 to our Consolidated Financial Statements for the year ended June 30, 2018 includedrelated notes presented under Item 8 ofin this Annual Report.Report on Form 10-K ($ in millions, except per share amounts).
Fiscal 20202018 Compared to Fiscal 20192017
Consolidated revenueConsolidated net sales was $766.8for fiscal 2020 were $589.8 million, a decrease of 21.0% compared to $763.4 million. There was a year-over-year increase inwith the same prior year period. Net sales decreased by 23.5% within the wholesale segment and a decreaseby 21.5% in the retail segment. WholesaleInternational sales increased progressively throughout fiscal 2018 asdecreased $17.0 million primarily related to lower sales to China and in Canada. Consolidated net sales were 21.0% lower in the Company worked through production difficulties associated withcurrent year primarily due to the disruptions in the market caused by the ongoing COVID-19 pandemic and lower written orders when a new marketing program featuring a membership was just getting underway. Partially offsetting these declines was growth in contract sales, which grew 31.6%. The year over year increase in contract sales was attributable to continued growth in sales from the GSA contract business and first production runs discussed previously. This had a negative impact on retail segment sales through the first three quarters of fiscal 2018. Net sales for the fourth quarter of fiscal 2018 increased 11.4% and 1.9% for wholesale and retail respectively.contract.
Wholesale revenuenet sales increased by $22.4decreased 23.5% to $337.9 million or 4.9%,primarily due to $475.7 million from $453.3 million. The year-over-year increase was primarily attributablea 33.3% decrease in sales to higher sales from the GSA contractCompany’s North American retail network and oura 38.3% decrease in international independent design centers. There were 296 design centers globally as of June 30, 2018, a decrease of seven.sales. Our international net sales to independent retailers was 7.0%5.7% of our consolidatedwholesale net sales compared to 6.5%7.0% last year. Wholesale net sales were significantly impacted in fiscal 2020 due to COVID-19-related disruptions and a new marketing program featuring a membership, which caused a dip in orders and subsequent shipments during this marketing transition period. Prior to March 2020, wholesale net sales were improving sequentially each month as customer demand increased. However, due to the disruptions caused by COVID-19 design center and manufacturing plant closings, net shipments decreased 52.0% in the fourth quarter of fiscal 2020, leading to the full fiscal year decrease in net sales of 23.5%. Partially offsetting the net sales decline was growth in our contract sales, which grew 31.6%. This increase was attributable to continued growth in sales from the GSA contract.
Retail revenueWholesale orders booked, which represents orders booked through all of our channels, were down 17.9% in fiscal 2020 compared with last fiscal year. Wholesale orders from Ethan Allen operatedour North American retail network declined 30.5% while orders from China dropped 37.9% from a year ago mainly due to COVID-19 stay-at-home orders, the imposition of tariffs by China and the economic uncertainty surrounding the international trade disputes. Excluding orders from China, our total wholesale orders decreased 17.0%, primarily as the result of the closing of our retail design centers and manufacturing operations for multiple months. These decreases were partially offset by continued growth in our contract business, including the GSA contract. While wholesale orders decreased by $16.2 million, or 2.7%, to $587.5 million17.9% from $603.7 million. Comparable store revenue decreased 3.2%. Year-over-year, written orders fora year ago, the Company operated design centers decreased 3.1%realized sequential improvement in orders each month during the fourth quarter of fiscal 2020, with June orders increasing by 17% year over year. We are focused on our short-term ability to return our wholesale production and comparable design centers written orders decreased 3.8%. The reduction in sales is primarily a reflection of delayed shipmentsshipping to the retail segment from the wholesale segment duelevels that are necessary to the timing of wholesale shipments previously mentioned.properly service our customers.
ETHAN ALLEN INTERIORS INC. AND SUBSIDIARIES
Retail net sales from Company-operated design centers decreased 21.5% to $462.8 million. There was a 21.4% decrease in net sales in the United States, while sales from our Canadian design centers decreased 26.0%. These decreases were primarily due to the temporary closing of our North American design centers for almost three months during fiscal 2020 due to COVID-19, and lower written orders in the second quarter when a new marketing program featuring a membership was just getting underway ahead of the COVID-19 pandemic. In response to COVID-19, we temporarily closed all of our retail design centers in North America, effective March 19, 2020. We gradually began reopening our design centers in May and as of June 30, 2020, have reopened all of our Company-operated retail design centers, including 14% open by appointment only. We continued to generate written business through virtual appointments while our design centers were closed. However, the level of new business was significantly lower due to economic uncertainty as people sheltered at home.
There were 144 Company-operated design centers at the end of fiscal 2020, the same number we ended last year with. We continue to relocate and open new locations while closing older locations. During fiscal 2020, we relocated seven Company-operated design centers, acquired one from an independent retailer and opened two new locations.
Gross profit decreased 21.1% to $416.0$323.1 million from $419.7 million. The $3.8 million decreasecompared with the prior year period due to sales declines within both the wholesale and retail segments. Retail sales, as a percentage of total consolidated sales, were 78.5% in the current year and 79.0% in the prior year. Wholesale gross profit was attributablenegatively impacted by lower sales volumes combined with a reduction in gross margin due to plant shutdowns related to the ongoing COVID-19 pandemic. Retail gross profit was lower due to a $16.2 million decrease21.5% reduction in our retail segment sales, a lower mix of retail net sales to consolidated net sales of 76.6% compared to the 79.1% in the prior fiscal year, and increased raw material costs of $4.7 million. These were partlyshipments partially offset by a higher gross margin. Fiscal 2020 adjusted gross margin was 55.7% compared with 55.1% a year ago. This increase was primarily due to improved retail price optimization and increased wholesale contract business. Restructuring charges negatively impacted the fiscal 2017 write-down of inventory of $6.4 million, and2020 consolidated gross margin by 90 basis points compared with 30 basis points a current fiscal year increase in wholesale net sales of $22.4 million.ago.
Operating expenses increased $5.3decreased to $308.5 million or 1.5% to $367.1compared with $375.5 million or 47.9% of net sales in fiscal 2018 from $361.8 million or 47.4% of net sales in fiscal 2017.the prior year period. The increase in fiscal year 2018 expenses in absolute dollars and as a percent of net sales is primarily17.9% decrease was due to increasedlower selling costs, a reduction in general and administrative expenses and a gain of $11.5 million from the sale of the Passaic property during fiscal 2020. Retail selling expenses were lower due to reduced volume of shipments, less designer selling expenses and lower compensation due to headcount reductions. Wholesale selling costs were down due to a reduction in advertising spend and lower compensation costs. General and administrative expenses decreased due to lower compensation costs coupled with lower depreciation, occupancy costs and regional management charges. Restructuring and impairment charges incurred during fiscal 2020 was a benefit of $3.6 million.$3.0 million compared to a charge of $18.7 million last year.
Operating income totaled $14.6 million compared with $33.9 million for the fiscalprior year ended June 30, 2018 totaled $48.9 million, or 6.4% ofperiod. The decrease in operating income was driven by the $156.8 decline in consolidated net sales partially offset by a 17.9% decrease in operating expenses. Adjusted operating income in fiscal 2020 was $17.1 million compared to $58.0with $55.1 million or 7.6% of net sales, in the prior fiscallast year.
Wholesale operating income for fiscal 2018 totaled $48.5$33.1 million, or 10.2%9.8% of net sales, as compared to $53.5$42.5 million or 11.8%at 9.6% of net sales in the prior year. The 22.1% decrease was primarily due to the 23.5% decrease in wholesale net sales and a 130 basis point reduction in gross margin partially offset by operating expense reductions of 28.4% from the gain on the sale of the Passaic property, COVID-19 related plant closings and actions taken to control and minimize expenditures. The decrease in gross margin was largely due to plant shutdowns from COVID-19.
Retail operating loss was $1.7$21.4 million, or -0.3%4.6% of sales for fiscal 2018,2020, compared to incomea loss of $1.2$10.5 million, or 0.2%1.8% of sales, for fiscal 2017,2019. The retail operating margin decreased to -4.6% from -1.8% due to the $127.0 million reduction in net sales partially offset by a decrease of $2.9 million. The160 basis point improvement in gross margin and a 14.2% decrease in consolidatedoperating expenses from lower selling, administrative, occupancy and regional management costs. Retail restructuring and impairment charges lowered retail operating income was primarily attributableby $7.7 million during fiscal 2020 compared to increased costs of raw materials, higher advertising costs due to national television advertising in the fiscal third and fourth quarters, reduced retail sales, as well as the disruptions caused by the first production runs of the GSA contract product and new product introductions.
Interest and other related financing costs decreased $0.9$12.3 million to $0.3 million from $1.2 million in the prior fiscal year. The decrease is primarily due to lower interest expense throughout fiscal 2018 due to paying off our term loan in the first quarter of the current fiscala year and during late fiscal 2017 paying down $25.0 million on our revolving credit facility to reduce our future debt carrying costs.ago.
Income tax expense was $12.7$5.3 million for fiscal 2018 and $20.82020 compared with $8.2 million for fiscal 2017. Our effective tax rate for fiscal 2018 was 25.9% compared to 36.5% in fiscal 2017.a year ago. The effective tax rate for fiscal year 2018 primarily2020 includes tax expensea provision for income taxes on the fiscalcurrent year’s net income the tax benefit lost on the cancelation of stock options,including federal, state, foreign and also includeslocal income taxes, tax and interest expense on various uncertain tax positions, and tax expense on the establishment and maintenance of a valuation allowance on Retail deferred tax assets, partially offset by the reversal of various uncertain tax benefit from the re-measurement of deferred tax assets and liabilities and the vesting of restricted stock units.positions. The effective tax rate for the prior fiscal year 2017 primarily includes a provision for income taxes on that year’s income, tax expense on that fiscal year’s net income,the establishment and maintenance of a valuation allowance on Canadian deferred tax assets and tax and interest expense on uncertain tax positions,position, partially offset by the reversal of and recognition of somevarious uncertain tax positions.
Net income for fiscal 2018 Income tax expense was $36.4$2.9 million as compared to $36.2 millionlower in fiscal 2017. Net2020 compared with a year ago primarily due to the $19.7 million decrease in income per diluted share totaled $1.32 inbefore income taxes partially offset by a higher effective tax rate. The fiscal 20182020 effective rate increased to 37.3% compared to $1.29 per diluted sharewith 24.1% in the prior fiscal year.
Fiscal 2017 Comparedyear primarily due to Fiscal 2016
Consolidated revenue was $763.4 million compared to $794.2 million. There was a year-over-year decline in sales in both the wholesale and retail segments.
Wholesale revenue decreased by $38.1 million, or 7.8%, to $453.3 million from $491.5 million. The year-over-year decrease was attributable to lower sales to our Company operated design centers and domestic independent retailers, partly offset by an increase to our international independent design centers, primarily in China. There were 303 design centers globally as of June 30, 2017, an increase of seven. There wasvaluation allowance on deferred tax assets. We recorded a net increase of two independently operated retail network locations, which included a decrease of one legacy location in the U.S. and the purchase of one independently owned location by the Company, bringing the total U.S. independent total to 48, and a net decrease of one location in China, bringing the China total to 82. Other international dealers opened five new locations. Our international net sales to independent retailers was 6.5% of our consolidated net sales compared to 5.4%.
Retail revenue from Ethan Allen operated design centers decreased by $22.8 million, or 3.6%, to $603.7 million from $626.5 million. Comparable store revenue decreased 4.6%. Year-over-year, written orders for the Company operated design centers decreased 0.6% and comparable design centers written orders decreased 2.5%. Consumer spending patterns were disruptedvaluation allowance during the fiscal year, especially around the election cycle, and negatively impacted sales.
Gross profit decreased to $419.7 million from $442.2 million. The $22.5 million decrease in gross profit was attributable to decreases in both our retail and wholesale segment net sales and a write-down of inventory of $6.4 million in the thirdfourth quarter of fiscal 2017. This was partly offset by a slightly higher mix of retail net sales to consolidated net sales of 79.1% compared to the 78.9%2020 in the prior fiscal year, and a decrease in costamount of goods sold due to$2.5 million on the net release of intercompany profit previously held in ending inventory.deferred tax assets.
ETHAN ALLEN INTERIORS INC. AND SUBSIDIARIES
Net income was $8.9 million compared with $25.7 million for the prior year, which resulted in $0.34 per diluted share compared to $0.96 in the prior year period. Fiscal 2020 restructuring and impairment charges along with other corporate actions during the year totaled $4.6 million (net of tax), which lowered diluted EPS by $0.18. Fiscal 2019 was negatively impacted by restructuring and impairment charges combined with other corporate actions of $15.9 million (net of tax), which lowered diluted EPS by $0.60. Adjusted diluted EPS of $0.52 in the current year represents a decrease of 66.7% over the prior year of $1.56. Lower net income and diluted EPS was primarily from net sales being negatively impacted from the COVID-19 pandemic partially offset by expense management.
Operating expensesFiscal increased $8.7 million or 2.5%2019 Compared to $361.8 million or 47.4% of net sales in fiscal 2017 from $353.1 million or 44.5% of net sales in fiscal 2016. The increase in fiscal year 2017 expenses in absolute dollars and as a percent of net sales is primarily due to increased advertising costs, a loss on disposal of real estate in fiscal 2017 compared to a gain on real estate sales in the prior fiscal year, and an increase in retail occupancy expense associated with a net increase of five design centers, partly offset by a reduction in incentive compensation.Fiscal 2018
Operating incomeFor a comparison of our results of operations for the fiscal years ended June 30, 2019 and 2018, see Item 7, Management’s Discussion and Analysis of Financial Condition and Results of Operations, of our Annual Report on Form 10-K for the fiscal year ended June 30, 2017 totaled $58.0 million, or 7.6% of net sales, compared to $89.2 million, or 11.2% of net sales, in2019, filed with the prior fiscal year. Wholesale operating income for fiscal 2017 totaled $53.5 million, or 11.8% of net sales, as compared to $74.4 million, or 15.1% of net sales, in the prior year. Retail operating income was $1.2 million, or 0.2% of sales, for fiscal 2017, compared to $16.5 million, or 2.6% of sales, for fiscal 2016, a decrease of $15.3 million. The decrease in consolidated operating income was primarily attributable to decreased net sales, an inventory write-down at both our wholesale and retail segments due to a decision to reduce clearance and discontinued inventory by donation, increased advertising expenses, the net impact of real estate dispositions, and an increase in retail occupancy expense, partly offset by the net release of intercompany profit previously held in ending inventory and a reduction in incentive compensation.SEC on August 9, 2019.
Interest and other related financing costsRegulation G Reconciliations of Non-GAAP Financial Measures decreased $0.4 million to $1.2 million from $1.6 million
To supplement the financial measures prepared in accordance with generally accepted accounting principles in the prior fiscal year. The decrease is primarily due to lower interest expense throughout fiscal 2017 due to debt repayments during fiscal 2017United States, or U.S. GAAP, we use non-GAAP financial measures, including a $25.0 million paydown on our revolving credit facility to reduce our future debt carrying costs.
Income tax expense was $20.8 million for fiscal 2017adjusted gross profit and $31.3 million for fiscal 2016. Our effective tax rate for fiscal 2017 was 36.5% compared to 35.6% in fiscal 2016. The effective tax rate for both fiscal years primarily includes tax expense on that fiscal year’smargin, adjusted operating income, adjusted wholesale operating income and margin, adjusted retail operating income and margin, adjusted net income and taxadjusted diluted earnings per share. The reconciliations of these non-GAAP financial measures to the most directly comparable financial measures calculated and interest expense on uncertain tax positions, partially offsetpresented in accordance with U.S. GAAP are shown in tables below.
These non-GAAP measures are derived from the consolidated financial statements but are not presented in accordance with U.S. GAAP. We believe these non-GAAP measures provide a meaningful comparison of our results to others in our industry and our prior year results. Investors should consider these non-GAAP financial measures in addition to, and not as a substitute for, our financial performance measures prepared in accordance with U.S. GAAP. Moreover, these non-GAAP financial measures have limitations in that they do not reflect all the items associated with the operations of the business as determined in accordance with U.S. GAAP. Other companies may calculate similarly titled non-GAAP financial measures differently than we do, limiting the usefulness of those measures for comparative purposes.
Despite the limitations of these non-GAAP financial measures, we believe these adjusted financial measures and the information they provide are useful in viewing our performance using the same tools that management uses to assess progress in achieving our goals. Adjusted measures may also facilitate comparisons to our historical performance.
ETHAN ALLEN INTERIORS INC. AND SUBSIDIARIES
The following tables below show a reconciliation of non-GAAP financial measures used in this filing to the most directly comparable U.S. GAAP financial measures.
(in thousands, except per share data) | | Fiscal Year Ended June 30, | | | | | |
| | | 2020 | | | 2019 | | | % Change | |
Consolidated Adjusted Gross Profit / Gross Margin | | | | | |
GAAP Gross profit | | $ | 323,132 | | | $ | 409,491 | | | | (21.1 | %) |
Adjustments (pre-tax) * | | | 5,423 | | | | 1,994 | | | | | |
Adjusted gross profit * | | $ | 328,555 | | | $ | 411,485 | | | | (20.2 | %) |
Adjusted gross margin * | | | 55.7 | % | | | 55.1 | % | | | | |
| | | | | | | | | | | | | |
Adjusted Operating Income / Operating Margin | | | | | | | | | |
GAAP Operating income | | $ | 14,644 | | | $ | 33,947 | | | | (56.9 | %) |
Adjustments (pre-tax) * | | | 2,428 | | | | 21,104 | | | | | |
Adjusted operating income * | | $ | 17,072 | | | $ | 55,051 | | | | (69.0 | %) |
| | | | | | | | | | | | | |
Consolidated Net sales | | $ | 589,837 | | | $ | 746,684 | | | | (21.0 | %) |
GAAP Operating margin | | | 2.5 | % | | | 4.5 | % | | | | |
Adjusted operating margin * | | | 2.9 | % | | | 7.4 | % | | | | |
| | | | | | | | | | | | | |
Consolidated Adjusted Net Income / Adjusted Diluted EPS | | | | | | | | | |
GAAP Net income | | $ | 8,900 | | | $ | 25,698 | | | | (65.4 | %) |
Adjustments, net of tax * | | | 4,612 | | | | 15,934 | | | | | |
Adjusted net income | | $ | 13,512 | | | $ | 41,632 | | | | (67.5 | %) |
Diluted weighted average common shares | | | 26,069 | | | | 26,751 | | | | | |
GAAP Diluted EPS | | $ | 0.34 | | | $ | 0.96 | | | | (64.6 | %) |
Adjusted diluted EPS * | | $ | 0.52 | | | $ | 1.56 | | | | (66.7 | %) |
| | | | | | | | | | | | | |
Wholesale Adjusted Operating Income / Adjusted Operating Margin | | | | | |
Wholesale GAAP operating income | | $ | 33,106 | | | $ | 42,481 | | | | (22.1 | %) |
Adjustments (pre-tax) * | | | (5,794 | ) | | | 8,498 | | | | | |
Adjusted wholesale operating income * | | $ | 27,312 | | | $ | 50,979 | | | | (46.4 | %) |
| | | | | | | | | | | | | |
Wholesale net sales | | $ | 337,948 | | | $ | 441,551 | | | | (23.5 | %) |
Wholesale GAAP operating margin | | | 9.8 | % | | | 9.6 | % | | | | |
Adjusted wholesale operating margin * | | | 8.1 | % | | | 11.5 | % | | | | |
| | | | | | | | | | | | | |
Retail Adjusted Operating Income / Adjusted Operating Margin | | | | | |
Retail GAAP operating income (loss) | | $ | (21,414 | ) | | $ | (10,529 | ) | | | (103.4 | %) |
Adjustments (pre-tax) * | | | 8,222 | | | | 12,606 | | | | | |
Adjusted retail operating income (loss) * | | $ | (13,192 | ) | | $ | 2,077 | | | | nm | |
| | | | | | | | | | | | | |
Retail net sales | | $ | 462,800 | | | $ | 589,829 | | | | (21.5 | %) |
Retail GAAP operating margin | | | (4.6 | %) | | | (1.8 | %) | | | | |
Adjusted retail operating margin * | | | (2.9 | %) | | | 0.4 | % | | | | |
ETHAN ALLEN INTERIORS INC. AND SUBSIDIARIES
* Adjustments to reported U.S. GAAP financial measures including gross profit and margin, operating income and margin, net income, and diluted EPS have been adjusted by the reversal and recognition of some uncertain tax positions.following:
Net income for fiscal 2017 was $36.2 million as compared to $56.6 million in fiscal 2016. Net income per diluted share totaled $1.29 in fiscal 2017 compared to $2.00 per diluted share in the prior fiscal year.
(in thousands) | | Fiscal Year Ended June 30, | |
| | | 2020 | | | 2019 | |
Inventory write-downs and additional reserves (wholesale) | | $ | 4,107 | | | $ | - | |
Manufacturing overhead costs and other (wholesale) | | | 1,316 | | | | 1,994 | |
Adjustments to gross profit | | $ | 5,423 | | | $ | 1,994 | |
| | | | | | | | | |
Inventory write-downs and additional reserves (wholesale) | | $ | 4,107 | | | $ | - | |
Optimization of manufacturing and logistics (wholesale) | | | 2,147 | | | | 8,324 | |
Gain on sale of Passaic, New Jersey property (wholesale) | | | (11,497 | ) | | | - | |
Employee retention credit (wholesale) | | | (1,177 | ) | | | - | |
Severance and other professional fees (wholesale) | | | 626 | | | | 174 | |
Retail acquisition costs, severance and other charges (retail) | | | 553 | | | | 556 | |
Impairment of long-lived assets and lease exit costs (retail) | | | 7,669 | | | | 12,050 | |
Adjustments to operating income | | $ | 2,428 | | | $ | 21,104 | |
Adjustments to income before income taxes | | $ | 2,752 | | | $ | 21,104 | |
Related income tax effects on non-recurring items(1) | | | (674 | ) | | | (5,170 | ) |
Income tax expense from valuation allowance | | | 2,534 | | | | - | |
Adjustments to net income | | $ | 4,612 | | | $ | 15,934 | |
(1) | Calculated using a tax rate of 24.5% in all periods presented. |
Liquidity and Capital Resources
At June 30, 2018,2020, we held unrestricted cash and equivalents of $22.4$72.3 million and no restricted cash and investments. Atcompared with $20.8 million at June 30, 2017, we held unrestricted cash and cash equivalents of $57.7 million and restricted cash and investments of $7.3 million. During fiscal 2018 we used cash to further pay down a portion of our debt and for common share repurchases.2019. Our principal sources of liquidity include cash and cash equivalents, marketable securities, cash flow from operations and amounts available under our credit facility,facility. Cash and other borrowings.
ETHAN ALLEN INTERIORS INC. AND SUBSIDIARIES
Under an agreement with the Company’s private label consumer credit card provider (the “Lender”), at the endcash equivalents aggregated to 11.6% of each fiscal quarter we are required to maintain a minimum level of working capital. Due to market opportunities during the fourth quarter of fiscal 2018, the Company used $22 million of its working capital to repurchase shares under our share repurchase program. This caused working capital to fall below this minimumtotal assets at June 30, 2018, creating2020, compared with 4.1% of our total assets a Level 1 Collateral Event as definedyear ago. Our cash and cash equivalents increased $51.5 million during fiscal 2020 due to net borrowings on our revolving credit facility of $50.0 million, net cash provided by operating activities of $52.7 million and net proceeds from the sale of our Passaic property of $11.7 million, partially offset by $24.3 million in our agreement with the Lender. At any time during any Collateral Period, the Lender may require the Company to deliver within fifteen daysshare repurchases, $21.5 million in dividend payments, $15.7 million of Lender’s written request, either an Eligible Letter of Credit or Substitute Collateral. The Lender has not exercised this right but retains the ability to do so.capital expenditures and $1.3 million from retail acquisitions.
For a detailed discussion of our debt obligations and timing of our related cash payments see Note 6 to the Consolidated Financial Statements included under Item 8 of this Annual Report. A summary of net cash provided by (used in) operating, investing and financing activities for each of the last three fiscal years is provided below (in millions):
| | | Fiscal Years Ended June 30, | |
| | | 2018 | | | 2017 | | | 2016 | |
Cash provided by (used in) operating activities | | | | | | | | | | | | |
Net income plus depreciation and amortization | | $ | 56.2 | | | $ | 56.3 | | | $ | 76.0 | |
Working capital items | | | (13.0 | ) | | | 14.5 | | | | (19.3 | ) |
Other operating activities | | | (0.7 | ) | | | 7.8 | | | | 1.7 | |
Total provided by operating activities | | $ | 42.5 | | | $ | 78.6 | | | $ | 58.4 | |
| | | | | | | | | | | | | |
Cash provided by (used in) investing activities | | | | | | | | | | | | |
Capital expenditures & acquisitions | | $ | (18.8 | ) | | $ | (18.3 | ) | | $ | (23.1 | ) |
Net sales of marketable securities | | | - | | | | - | | | | 2.2 | |
Other investing activities | | | 7.9 | | | | 1.9 | | | | 8.4 | |
Total used in investing activities | | $ | (10.9 | ) | | $ | (16.4 | ) | | $ | (12.5 | ) |
| | | | | | | | | | | | | |
Cash provided by (used in) financing activities | | | | | | | | | | | | |
Payments of long-term debt and capital lease obligations | | $ | (14.5 | ) | | $ | (28.4 | ) | | $ | (34.8 | ) |
Borrowings from revolving credit and term loan facilities | | $ | - | | | $ | - | | | $ | - | |
Purchases and retirements of company stock | | | (23.1 | ) | | | (10.2 | ) | | | (19.3 | ) |
Payment of cash dividends | | | (29.5 | ) | | | (20.0 | ) | | | (16.6 | ) |
Other financing activities | | | 0.2 | | | | 1.3 | | | | 1.6 | |
Total used in financing activities | | $ | (66.9 | ) | | $ | (57.3 | ) | | $ | (69.1 | ) |
| | | Fiscal Year Ended June 30, | |
| | | 2020 | | | 2019 | | | 2018 | |
Operating activities | | | | | | | | | | | | |
Net income | | $ | 8.9 | | | $ | 25.7 | | | $ | 36.4 | |
Non-cash operating lease cost | | | 32.0 | | | | - | | | | - | |
Other non-cash items, including depreciation and amortization | | | 22.6 | | | | 37.0 | | | | 20.6 | |
Restructuring payments | | | (9.1 | ) | | | (2.5 | ) | | | - | |
Change in working capital | | | (1.7 | ) | | | (5.0 | ) | | | (14.5 | ) |
Total provided by operating activities | | $ | 52.7 | | | $ | 55.2 | | | $ | 42.5 | |
| | | | | | | | | | | | | |
Investing activities | | | | | | | | | | | | |
Capital expenditures | | $ | (15.7 | ) | | $ | (9.1 | ) | | $ | (12.5 | ) |
Acquisitions, net of cash acquired | | | (1.4 | ) | | | (0.5 | ) | | | (6.3 | ) |
Proceeds from the disposal of property, plant and equipment | | | 12.4 | | | | - | | | | 0.3 | |
Other investing activities | | | 0.1 | | | | 0.1 | | | | 0.3 | |
Total (used in) investing activities | | $ | (4.6 | ) | | $ | (9.5 | ) | | $ | (18.2 | ) |
| | | | | | | | | | | | | |
Financing activities | | | | | | | | | | | | |
Borrowings from revolving credit facility | | $ | 100.0 | | | $ | 16.0 | | | $ | - | |
Payments on borrowings | | | (50.0 | ) | | | (16.0 | ) | | | (13.8 | ) |
Purchases and retirements of company stock | | | (24.3 | ) | | | - | | | | (23.1 | ) |
Payment of cash dividends | | | (21.5 | ) | | | (47.0 | ) | | | (29.5 | ) |
Other financing activities | | | (0.5 | ) | | | (0.3 | ) | | | (0.5 | ) |
Total provided by (used in) financing activities | | $ | 3.7 | | | $ | (47.3 | ) | | $ | (66.9 | ) |
ETHAN ALLEN INTERIORS INC. AND SUBSIDIARIES
Cash Provided By (Used in) Operating ActivitiesActivities.
In fiscal 2018Fiscal 2020 cash of $42.5generated from operations totaled $52.7 million, was provided by operating activities, a decrease of $36.1$2.5 million from $78.6the prior year primarily due to higher restructuring payments made in connection with our previously announced optimization of manufacturing and logistics activities as well as other exit costs partially offset by improved working capital changes. The change in working capital was primarily due to higher retail customer deposits, a reduction in inventory levels from the concerted effort to minimize carrying costs, improved receivable collections and the deferral and abatement of $2.7 million in retail design center rent. These cash flow benefits were partially offset by the timing of accounts payable and accrued expenses. As a result of fiscal 2020 adoption of the new leasing standard, we now report non-cash operating lease costs as a non-cash adjustment to reconcile to net income while our monthly lease payments are reported as a reduction to operating lease liabilities within working capital. Restructuring payments included $2.5 million in severance, $1.3 million of manufacturing overhead costs and $5.3 million in other exit and relocation payments.
Cash Provided by (Used in) Investing Activities.Fiscal 2020 cash used in investing activities was $4.6 million, a decrease from $9.5 million last year due to cash proceeds of $12.4 million received from the sale of the Passaic property and other manufacturing equipment partially offset by higher capital expenditures and design center acquisitions. Cash paid to acquire design centers from our independent retailers in arm’s length transactions totaled $1.4 million during fiscal 2020 compared with $0.5 million a year ago. Capital expenditures were $15.7 million, an increase of $6.6 million compared with $9.1 million spent a year ago. In fiscal 2020, approximately 53% of our total capital expenditures related to opening new and relocating design centers in desirable locations, updating existing design center presentations and floor plans and opening new home delivery centers. The remaining 47% was capital expenditures incurred in connection with the previously announced optimization project as well as investments in additional technology to improve existing workflows.
Cash Provided By (Used in) Financing Activities.Fiscal 2020 total cash provided by financing activities was $3.7 compared with cash used of $47.3 million in the prior year comparable period. Working capital items wereThe significant increase in cash provided by financing activities was due to borrowings of $100.0 million under our revolving credit facility in March 2020 and a $13.0 million use ofdecrease in cash dividends paid due to a special dividend paid in the current year and a $14.5prior year. Cash dividends paid in fiscal 2020 totaled $21.5 million source of cashcompared with $47.0 million in the prior year with a net difference of $27.5 million. Most of the working capital difference was due to an inventory increase of $11.9the $1.00 per share or $26.7 million in the current year compared to a $13.5 million source ofspecial cash dividend paid in the prior year. MuchWe had suspended our regular quarterly cash dividend as of April 28, 2020, due to the COVID-19 impact. However, on August 4, 2020, our Board of Directors reinstated the regular quarterly cash dividend. Our policy is to issue quarterly dividends, and we expect to continue to declare and pay comparable quarterly dividends for the foreseeable future, business conditions permitting. These positive cash flow items were partially offset by the partial repayment of outstanding debt and share repurchases in the current fiscal year. In June 2020 we repaid 50% or $50.0 million of our outstanding borrowings using available cash on hand. In addition, we repurchased 1,538,363 shares under our existing share repurchase program at an average price of $15.81 per share for a total cash outflow of $24.3 million during fiscal 2020.
We believe our liquidity (cash on hand, cash flow from operating activities and amounts available under our credit facility), will be sufficient to fund our operations, including changes in working capital, necessary capital expenditures, fiscal 2021 contractual obligations as presented in our contractual obligations table and other financing activities, as they occur, for at least the next 12 months. During the period of uncertainty and volatility related to the COVID-19 pandemic, we will continue to monitor our liquidity. Included in our cash and cash equivalents at June 30, 2020, is $3.4 million held by foreign subsidiaries, a portion of which we have determined to be indefinitely reinvested.
For a discussion of our liquidity and capital resources as of and our cash flow activities for the fiscal year ended June 30, 2019 and 2018, see Item 7, Management’s Discussion and Analysis of Financial Condition and Results of Operations, of our Annual Report on Form 10-K for the fiscal year ended June 30, 2019, filed with the SEC on August 9, 2019.
Capital Resources
Capital Expenditures. Capital expenditures in fiscal 2020 were $15.7 million compared with $9.1 million in the prior year inventory decrease was due to a $6.4period. The increase of $6.6 million write-down of inventory discussed previously in Business Results. Net income plus depreciation and amortization decreased $0.1 million. Working capital items consist of current assets (accounts receivable, inventories, prepaid and other current assets) less current liabilities (customer deposits, payables, and accrued expenses and other current liabilities).
Cash Provided By (Used in) Investing Activities
In fiscal 2018, cash of $10.9 million was used in investing activities, a decrease in cash used of $5.5 million from $16.4 million which was used during the prior year comparable period. This was duerelated primarily to $7.3 millionincremental spending on retail design center improvements and completion of previously restricted cash being releasedour optimization project. In fiscal 2020, approximately 53% of our total capital expenditures related to opening new and movedrelocating design centers in desirable locations, updating existing design center presentations and floor plans and opening new retail home delivery centers. The remaining 47% was primarily capital expenditures incurred in connection with our optimization project as we converted the Old Fort, North Carolina facility into a distribution center and expanded our existing Maiden, North Carolina manufacturing campus. In fiscal 2019, approximately 65% of our total capital expenditures were within the Company’s operating accounts in exchangeretail segment. We have no material contractual commitments outstanding for a letter of credit. This was offset by less proceeds from the sale of real estate in fiscal 2018 than in the prior fiscal year.future capital expenditures. We anticipate that cash from operations will be sufficient to fund future capital expenditures in the near and longer term.expenditures.
ETHAN ALLEN INTERIORS INC. AND SUBSIDIARIES
Capital NeedsCash Provided By (Used in) Financing Activities.
In fiscalDuring December 2018 $66.9we entered into a five-year, $165 million was used in financing activities,senior secured revolving credit facility, which amended and restated the previously existing facility. During March 2020, we borrowed a decreasetotal of $9.6$100 million under the credit facility and by June 30, 2020 had repaid $50 million from $57.3available cash. Prior to March, there were no borrowings outstanding under the credit facility. The outstanding borrowings of $50 million in the prior year comparable period. During fiscal 2018 we paid $13.8 million to pay off our term loan and utilized $22.0 million to repurchase 950,484 shares atbear a weighted average costinterest rate of $23.17 per share. 1.7%, which is equal to the one-month LIBOR rate plus a spread using a debt leverage pricing grid. Interest on the borrowings outstanding is payable monthly in arrears and the principal balance is payable on the maturity date of December 21, 2023. We are in compliance with all covenants under the agreement as of June 30, 2020. The credit facility will mature in December 2023. We elected to draw down on the credit facility to increase our cash position as a precautionary measure and to preserve financial flexibility in consideration of the disruption and uncertainty surrounding the ongoing COVID-19 pandemic. The outstanding borrowings of $50 million are reported as Long-term debt within the consolidated balance sheet at June 30, 2020.
To partially fund the special cash dividend paid to shareholders in January 2019, we borrowed $16.0 million from the revolving credit facility during fiscal 2019. By June 30, 2019, we had repaid 100% of the total borrowed from cash generated from operating activities.
For a detailed discussion of revolving credit facility, our debt obligations and timing of our related cash payments see Note 11 to the consolidated financial statements included under Part II, Item 8 of this Annual Report on Form 10-K.
Letters of Credit.At June 30, 2020 and 2019, there was $5.8 million and $6.1 million, respectively, of standby letters of credit outstanding under the revolving credit facility.
Total availability under the revolving credit facility was $58.9 million at June 30, 2020 and $158.9 million at June 30, 2019. At both June 30, 2020 and 2019, respectively, we were in compliance with all the covenants under the revolving credit facility.
For a discussion of our liquidity and capital resources as of and our cash flow activities for the fiscal year ended June 30, 2019 and 2018, see Item 7, Management’s Discussion and Analysis of Financial Condition and Results of Operations, of our Annual Report on Form 10-K for the fiscal year ended June 30, 2019, filed with the SEC on August 9, 2019.
Share Repurchase Program
On January 13, 2020, our Board of Directors authorized an increase in the aggregate share repurchase authorization under our existing multi-year share repurchase program (the “Share Repurchase Program”) to 3,000,000 shares. We repurchased 1,538,363 shares under the program during fiscal 2020 at an average price of $15.81 per share. There were no share repurchases under the program during fiscal 2019. As of April 1, 2020, as part of our COVID-19 action plan, we havetemporarily halted our share repurchase program. At June 30, 2020, we had a remaining Board authorization to repurchase 2.52,007,364 shares of our common stock pursuant to our program.
Contractual Obligations
Fluctuations in our operating results, levels of inventory on hand, the degree of success of our accounts receivable collection efforts, the timing of tax and other payments, as well as necessary capital expenditures to support growth of our operations will impact our liquidity and cash flows in future periods. The effect of our contractual obligations on our liquidity and capital resources in future periods should be considered in conjunction with the factors mentioned here.
As of June 30, 2020, we had total contractual obligations of $233.4 million, shares. During fiscal 2018 we paid dividends of $29.5 million, including a special dividend, an increase from $207.0 million a year ago. As disclosed earlier in the Capital Resources section of 47.3%this MD&A, we borrowed $100.0 million under our revolving credit facility during the third quarter of fiscal 2020, of which we repaid $50.0 million during June. The principal loan balance of $50.0 million remains outstanding as of June 30, 2020 and is payable on the maturity date of December 21, 2023. Our operating lease obligations decreased from $169.9 million last year to $149.7 million at June 30, 2020 due to monthly lease payments made to landlords and the priorexiting of certain retail leased spaces during fiscal 2020 partially offset by new leases and modifications entered into throughout the fiscal year. Cash dividends have been paid every quarter since July 1996. The following chart shows our dividend history by payment date from July 2013 to the present.
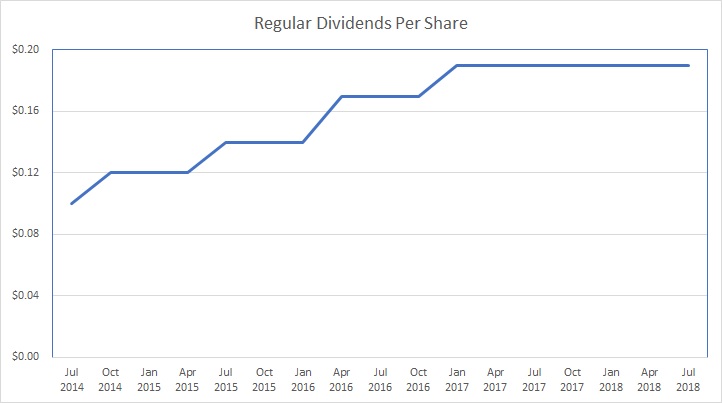
We expect to continue to declare regular quarterly dividends for the foreseeable future, business conditions permitting.
ETHAN ALLEN INTERIORS INC. AND SUBSIDIARIES
The following table summarizes our significant contractual obligations as of June 30, 2018,2020 and the timing ofcorresponding impact that these obligations will have on our liquidity and cash payments related to our outstanding contractual obligationsflows in future periods (in millions):
| | | | | | | Less | | | | | | | | | | | More | |
| | | | | | | than 1 | | | 1-3 | | | 4-5 | | | than 5 | |
| | | Total | | | Year | | | Years | | | Years | | | Years | |
Long-term debt obligations: | | | | | | | | | | | | | | | | | | | | |
Debt maturities | | $ | 1.7 | | | $ | 0.6 | | | $ | 1.0 | | | $ | 0.1 | | | $ | - | |
Contractual interest | | | 0.1 | | | | 0.1 | | | | 0.1 | | | | - | | | | - | |
Operating lease obligations | | | 176.0 | | | | 34.4 | | | | 55.4 | | | | 39.2 | | | | 47.0 | |
Letters of credit | | | 6.2 | | | | 6.2 | | | | - | | | | - | | | | - | |
Purchase obligations (1) | | | - | | | | - | | | | - | | | | - | | | | - | |
Other long-term liabilities | | | 0.2 | | | | - | | | | - | | | | - | | | | 0.2 | |
Total contractual obligations | | $ | 184.2 | | | $ | 41.3 | | | $ | 56.4 | | | $ | 39.3 | | | $ | 47.2 | |
| | | | | | | Payments Due by Period | |
| | | | | | | Less than | | | 1-3 | | | 4-5 | | | More than | |
| | | Total | | | 1 Year | | | Years | | | Years | | | 5 Years | |
Operating leases(1) | | $ | 149.7 | | | $ | 32.1 | | | $ | 49.0 | | | $ | 29.4 | | | $ | 39.1 | |
Financing leases(2) | | | 0.6 | | | | 0.5 | | | | 0.1 | | | | - | | | | - | |
Long-term debt(3) | | | 50.0 | | | | - | | | | - | | | | 50.0 | | | | - | |
Purchase obligations(4) | | | 32.9 | | | | 30.9 | | | | 2.0 | | | | - | | | | - | |
Other long-term liabilities | | | 0.2 | | | | - | | | | - | | | | - | | | | 0.2 | |
Total contractual obligations(5) | | $ | 233.4 | | | $ | 63.5 | | | $ | 51.2 | | | $ | 79.4 | | | $ | 39.3 | |
(1) For purposes of this table, purchase obligations are defined as agreements that are enforceable and legally binding and that specify all significant terms, including fixed or minimum quantities to be purchased; fixed, minimum or variable price provisions; and the approximate timing of the transaction. While we are not a party to any significant long-term supply contracts or purchase commitments, we do, in the normal course of business, regularly initiate purchase orders for the procurement of (i) selected finished goods sourced from third-party suppliers, (ii) lumber, fabric, leather and other raw materials used in production, and (iii) certain outsourced services. All purchase orders are based on current needs and are fulfilled by suppliers within short time periods. At June 30, 2018, our open purchase orders with respect to such goods and services totaled approximately $40 million. | We enter into operating leases in the normal course of business. Most lease arrangements provide us with the option to renew the leases at defined terms. The table above includes future obligations for renewal options that are reasonably certain to be exercised and are included in the measurement of the lease liability. Amounts above do not include future lease payments under leases that have not commenced or estimated contingent rent due under operating and finance leases. For more information on our operating leases, see Note 6, Leases, in the notes to the Consolidated Financial Statements included in Item 8 of this Annual Report on Form 10-K. |
(2) | Financing lease obligations include all future payment obligations under a lease classified as a financing lease pursuant to FASB ASU 2016-02. |
Further discussion of our contractual obligations associated with outstanding debt and lease arrangements can be found in Notes 6 and 7, respectively, to the Consolidated Financial Statements included under Item 8 of this Annual Report.
(3) | Debt obligations mean all payment obligations under long-term borrowings. As of June 30, 2020, we $50.0 million in outstanding borrowings under our revolving credit facility. Further discussion of our contractual obligations associated with long-term debt can be found in Note 11, Debt, in the notes to the Consolidated Financial Statements included in Item 8 of this Annual Report on Form 10-K. |
(4) | Purchase obligations are defined as agreements that are enforceable and legally binding that specify all significant terms, including fixed or minimum quantities to be purchased; fixed, minimum or variable price provisions; and the approximate timing of the transaction. We do, in the normal course of business, regularly initiate purchase orders for the procurement of (i) selected finished goods sourced from third-party suppliers, (ii) lumber, fabric, leather and other raw materials used in production, and (iii) certain outsourced services. All purchase orders are based on current needs and are fulfilled by suppliers within short time periods. At June 30, 2020, our open purchase orders with respect to such goods and services totaled $20.1 million and are to be paid in less than one year. Other purchase commitments included within this table represent payment due for other services such as telecommunication, computer-related software, royalties, web development, insurance and other maintenance contracts. |
(5) | Non-current income taxes payable of $1.5 million and non-current deferred tax liabilities of $1.1 million have been excluded from the table above due to uncertainty regarding the timing of future payments. We do not expect that the net liability for uncertain income tax positions will significantly change within the next 12 months. The remaining balance will be settled or released as tax audits are effectively settled, statutes of limitation expire, or other new information becomes available. |
We believe that our cash flow from operations, together with our other available sources of liquidity, will be adequate to make all required payments of principal and interest on our debt, to permit anticipated capital expenditures, and to fund working capital and other cash requirements. As of June 30, 2018,2020, we had working capital of $93.2$91.0 million compared to $116.7$93.5 million at June 30, 2017, a decrease of $23.5 million2019 and a current ratio of 1.77 to 11.65 at June 30, 2018 and 1.922020 compared to 1 at June 30, 2017. In addition to using available cash to fund changes in working capital, necessary capital expenditures, acquisition activity, the repayment of debt, and the payment of dividends, the Company has been authorized by our board of directors to repurchase our common stock, from time to time, either directly or through agents, in the open market at prices and on terms satisfactory to us.
ETHAN ALLEN INTERIORS INC. AND SUBSIDIARIES1.76 a year ago.
Off-Balance Sheet Arrangements and Other Commitments Contingencies and Contractual ObligationsContingencies
Except as indicated below, we do not utilize or employ any off-balance sheet arrangements, including special-purpose entities, in operating our business. As such, we do not maintain any (i) retained or contingent interests, (ii) derivative instruments (other than as specified below), or (iii) variable interests which could serve as a source of potential risk to our future liquidity, capital resources and results of operations.
We may, from time to time in the ordinary course of business, provide guarantees on behalf of selected affiliated entities or become contractually obligated to perform in accordance with the terms and conditions of certain business agreements. The nature and extent of these guarantees and obligations may vary based on our underlying relationship with the benefiting party and the business purpose for which the guarantee or obligation is being provided. The only such program in place at both June 30, 20182020 and June 30, 20172019, respectively, was for our legacy consumer credit program described below.
Ethan Allen Consumer Credit Program.
The terms and conditionsDuring the fourth quarter of ourfiscal 2019, we launched a new consumer credit program utilizing a non-related third-party financial institution, which replaced the previous program agreement and legacy consumer credit program that was terminated on July 31, 2019. Our new Ethan Allen Platinum consumer credit program, designed to make the Ethan Allen brand accessible to everyone, had a successful national launch and should continue to attract both new prospects and returning clients. Financing offered through this program is financed and administered by a third-party financial institution and is granted to our clients on a non-recourse basis to Ethan Allen, are set forth in an agreement between the Company and that financial service provider (the “Program Agreement”) which was last amended effective January 2014. Any independent retailer choosing to participate in the consumer credit program is required to enter into a separate agreement with that same third-party financial institution which sets forth the terms and conditions under which the retailer is to perform in connection with its offering of consumer credit to its customers (the “Retailer Agreement”). We have obligated ourselves on behalf of any independent retailer choosing to participate in our consumer credit program by agreeing, in the event of default, breach, or failure of the independent retailer to perform under such Retailer Agreement, to take on certain responsibilities of the independent retailer, including, but not limited to, delivery of goods and reimbursement of customer deposits. Customer receivables originated by independent retailers remain non-recourse to Ethan Allen. The Program Agreement will terminate on July 31, 2019, but includes a provision for automatic one-year renewals unless either party gives notice of termination. While the maximum potential amount of future payments (undiscounted) that we could be required to make under this obligation is indeterminable, recourse provisions exist that would enable us to recover, from the independent retailer, any amount paid or incurred by us related to our performance. Based on the underlying creditworthiness of our independent retailers, including their historical ability to perform satisfactorily in connection with the terms of our consumer credit program, we believe this obligation will expire without requiring funding by us. To ensure funding for delivery of products sold, the terms of the Program Agreement also contain a right for the financial services provider to demand from the Company collateral at a variable rate based on the volume of program sales if the Company does not meet certain covenants, including a minimum working capital requirement. At June 30 of 2018, we were below this minimum capital requirement, defined in the agreement as a Level 1 Collateral Event. At any time the lender may require the Company to deliver within fifteen days of lenders request, either an Eligible Letter of Credit, or Substitute Collateral for approximately $4 million. The lender has not made a demand for collateral as of the date of this Annual Report on Form 10-K, but if they were to do so, we have adequate borrowing capacity under our Facility to satisfy this demand.Company.
Product Warranties
ETHAN ALLEN INTERIORS INC. AND SUBSIDIARIES
Product Warranties. Our products, including our case goods, upholstery and home accents, generally carry explicit product warranties that extend up to seven years and are provided based on terms that are generally accepted in the industry. All our domestic independent retailers are required to enter into and perform in accordance with the terms and conditions of a warranty service agreement. We record provisions for estimated warranty and other related costs at time of sale based on historical warranty loss experience and make periodic adjustments to those provisions to reflect actual experience. On rare occasion, certain warranty and other related claims involve matters of dispute that ultimately are resolved by negotiation, arbitration or litigation. In certain cases, a material warranty issue may arise which is beyond the scope of our historical experience. We provide for such warranty issues as they become known and are deemed to be both probable and estimable. It is reasonably possible that, from time to time, additional warranty and other related claims could arise from disputes or other matters beyond the scope of our historical experience. As of June 30, 20182020 and 2017, the Company’s2019, our product warranty liability totaled $1.5$0.9 million and $1.3$1.6 million, respectively.
Dividends
For the full fiscal 2020 year, we paid a total of $0.82 per share in cash dividends for an aggregate total of $21.5 million. In the prior year, total dividends paid were $47.0 million, which included a $1.00 per share special cash dividend totaling $26.7 million, paid in January 2019. With our dividends, we have returned $134.6 million to shareholders over the past five years.
At the quarterly Board of Directors meeting held on April 28, 2020, our Board temporarily suspended the Company’s regular quarterly cash dividend due to the COVID-19 impact. However, on August 4, 2020, our Board of Directors reinstated the regular quarterly cash dividend and declared a regular quarterly cash dividend of $0.21 per share, which will be payable to shareholders of record as of October 8, 2020 and will be paid on October 22, 2020. Our Board of Directors met with management to review the effects of the COVID-19 pandemic on the business and determined that it was appropriate to return capital to shareholders in the form of a quarterly cash dividend equal to the pre-COVID-19 level of $0.21 per share. We will continue to monitor the pace of business as it relates to future dividends and any future cash dividends will depend on our earnings, capital requirements, financial condition and other factors considered relevant by us, subject to final determination by our Board of Directors.
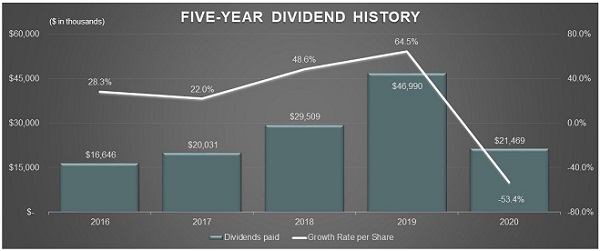
Foreign Currency
Foreign Currency Exposure. Foreign currency exchange risk is primarily limited to our operation of Ethan Allen operated retail design centers located in Canada and our manufacturing plants in Mexico and Honduras, as substantially all purchases of imported parts and finished goods are denominated in U.S. dollars. The financial statements of these foreign locations are translated into U.S. dollars using period-end rates of exchange for assets and liabilities and average rates for the period for revenues and expenses. Translation gains and losses that arise from translating assets, liabilities, revenues and expenses of foreign operations are recorded in accumulated other comprehensive (loss) income as a component of shareholders’ equity. Foreign exchange gains or losses resulting from market changes in the value of foreign currencies did not have a material impact during any of the fiscal periods presented in this Annual Report on Form 10-K.
Impact of Inflation
.We believe inflation had anany inflationary impact on our businessproduct and operating costs during the lastpast three fiscal years but we have generally been ablewas offset by our ability to create operational efficiencies, seek lower cost alternatives orand raise selling prices to offset increases in product and operating costs. It is possible in the future that we will not be successful in our efforts to offset the impacts from inflation.prices.
ETHAN ALLEN INTERIORS INC. AND SUBSIDIARIES
Business OutlookCritical Accounting Estimates
We continueprepare our consolidated financial statements in conformity with U.S. GAAP. In some cases, these principles require management to strengthenmake difficult and subjective judgments regarding uncertainties and, as a result, such estimates and assumptions may significantly impact our vertically integrated structure from concept of idea,financial results and disclosures. We consider an accounting estimate to engineering, to manufacturing, to retail and logistics. We intend to maintain strong manufacturing capabilities in North America, which we believe is a long-term competitive advantage that will allowbe critical if: (i) the accounting estimate requires us to advance our objectives of maintaining fast order delivery, exceptional qualitymake assumptions about matters that were highly uncertain at the time the accounting estimate was made, and improving capacity(ii) changes in the estimate that are reasonably likely to ship stocked and custom made-to-order items more quickly, which in turn will allow usoccur from period to grow our business. In December 2017, the Tax Act substantially reduced our effective tax rate. We expect our effective tax rate to be approximately 24% to 25% for fiscal 2019.
Our network of professionally trained interior design professionals differentiates us significantly from our competitors. We continue to strengthen the level of service, professionalism, and interior design competence, as well as to improve the efficiency of our retail operations. We believe that over time, we will continue to benefit from (i) continuous repositioning of our retail network, (ii) frequent new product introductions, (iii) new and innovative marketing promotions and effectiveperiod, or use of targeted advertising media, and (iv) continued use of the latest technology combined with personal service from our interior design professionals.
We have completed a major transformation of our product offerings, which refreshed over 70% of our entire line of products. During the third quarter of fiscal 2017 we expanded the reach of our Ethan Allen | Disney product program by selling a curated selection on Disneystore.com, we expanded our contract sales with the GSA and other contract customers and entered into an agreement with Amazon to sell products through the Amazon marketplace. Nowdifferent estimates that we reasonably could have completed this major transformation, we believe that we are well positioned to leverage all the actions we have taken.
We expect the home furnishings industry to remain extremely competitive with respect to both the sourcing of products and the wholesale and retail sale of those products for the foreseeable future. Domestic manufacturers continue to face pricing pressures because of the lower manufacturing costs on imports, particularly from Asia. While we also utilize overseas sourcing for approximately one quarter of our products, we choose to differentiate ourselves by maintaining a substantial North American manufacturing base, the majority of which is locatedused in the United States. This structure enables us to leverage our vertically integrated structure to our advantage. We continue to believe that a balanced approach to product sourcing, which includes our own North American manufacturing of about 75% of our product offerings coupled with the import of other selected products, provides the greatest degree of flexibility and shorter lead times and is the most effective approach to ensuring that acceptable levels of quality, service and value are attained.
We therefore remain cautiously optimistic about our performance due to the many strong programs already in place and others we currently plan to introduce in the coming months. Our retail strategy involves (i) a continued focus on providing relevant product offerings, a wide array of product solutions, and superior interior design solutions through our large staff of interior design professionals, (ii) continuing strong advertising and marketing campaigns to get our message across and to continue broadening our customer base, (iii) the opening of new or relocated design centers in more prominent locations, and encouraging independent retailers to do the same, (iv) leveraging the use of technology and personal service within our retail network and online through www.ethanallen.com, and (v) further expansion internationally. We believe this strategy provides an opportunity to grow our business. Further discussion of the home furnishings industry has been included under Item 1 of this Annual Report.
Recent Accounting Pronouncements
In May 2014, the Financial Accounting Standards Board (the “FASB”) issued ASU 2014-09, Revenue from Contracts with Customers. This ASU provides a framework for revenue recognition that replaces most existing GAAP revenue recognition guidance when it becomes effective. The core principle of the ASU is that a company will recognize revenue to depict the transfer of promised goods or services to customers in an amount that reflects the consideration to which the entity expects to be entitled in exchange for those goods or services. The standard also requires expanded disclosures about the nature, amount, timing, and uncertainty of revenue and cash flows arising from contracts with customers. We will adopt the new standard effective July 1, 2018, and plan on using the modified retrospective approach and will record the cumulative effect of applying this standard to opening retained earnings. We have substantially completed a comprehensive review of our revenue streams and contracts as they relate to this guidance and based on the work performed to date, we do not expect that the adoption willcurrent period, would have a material impact on our financial condition or results of operations. We base our estimates on currently known facts and circumstances, prior experience and other assumptions we believe to be reasonable. We use our best judgment in valuing these estimates and may, as warranted, use external advice. Actual results could differ from these estimates, assumptions, and judgments and these differences could be significant. We make frequent comparisons throughout the year of actual experience to our assumptions to reduce the likelihood of significant adjustments and will record adjustments when differences are known.
The following critical accounting estimates affect our consolidated financial statements.
Goodwill and Intangible Assets. We review the carrying value of our goodwill and other intangible assets with indefinite lives at least annually, during the fourth quarter, or more frequently if an event occurs or circumstances change, for possible impairment. For impairment testing, goodwill has been assigned to our wholesale reporting unit. We may elect to evaluate qualitative factors to determine if it is more likely than not that the fair value of a reporting unit or fair value of indefinite lived intangible assets is less than its carrying value. If the qualitative evaluation indicates that it is more likely than not that the fair value of a reporting unit or indefinite lived intangible asset is less than its carrying amount, a quantitative impairment test is required. Alternatively, we may bypass the qualitative assessment for a reporting unit or timingindefinite lived intangible asset and directly perform the quantitative assessment.
The quantitative impairment test involves estimating the fair value of each reporting unit and indefinite lived intangible asset and comparing these estimated fair values with the respective reporting unit or indefinite lived intangible asset carrying value. If the carrying value of a reporting unit exceeds its fair value, an impairment loss will be recognized in an amount equal to such excess, limited to the total amount of goodwill allocated to the reporting unit. If the carrying value of an individual indefinite lived intangible asset exceeds its fair value, such individual indefinite lived intangible asset is written down by an amount equal to such excess. Estimating the fair value of reporting units and indefinite lived intangible assets involves the use of significant assumptions, estimates and judgments with respect to a number of factors, including sales, gross margin, general and administrative expenses, capital expenditures, EBITDA and cash flows, the selection of an appropriate discount rate, as well as market values and multiples of earnings and revenue recognizedof comparable public companies.
To evaluate goodwill, the Company estimates the fair value of the reporting units using a combination of Market and Income approaches. The Market approach uses prices and other relevant information generated by market transactions involving identical or comparable assets or liabilities (including a business). In the Market approach, the “Guideline Company” method is used, which focuses on comparing the Company’s risk profile and growth prospects to reasonably similar publicly traded companies. Key assumptions used for the Guideline Company method include multiples for revenues, EBITDA and operating cash flows, as well as consideration of control premiums. The selected multiples are determined based on public furniture companies within our peer group, and if appropriate, recent comparable transactions are also considered. Control premiums are determined using recent comparable transactions in the open market. Under the Income approach, a discounted cash flow method is used, which includes a terminal value, and is based on management’s forecasts and budgets. The long-term terminal growth rate assumptions reflect our current long-term view of the market in which we compete. Discount rates use the weighted average cost of capital for companies within our peer group, adjusted for specific company risk premium factors.
We also annually evaluate whether our trade name continues to have an ongoing basis. Upon adoption we will recognizeindefinite life. Our trade name is reviewed for impairment annually in the fourth quarter and may be reviewed more frequently if indicators of impairment are present. Conditions that may indicate impairment include, but are not limited to, a significant adverse change in customer demand or business climate that could affect the value of an asset, relateda product recall or an adverse action or assessment by a regulator. Factors used in the valuation of intangible assets with indefinite lives include, but are not limited to, product returnsmanagement’s plans for future operations, recent results of operations and projected future cash flows. The fair value of our trade name, which is the Company’s only indefinite lived intangible asset other than goodwill, is valued using the relief-from-royalty method. Significant factors used in the trade name valuation are rates for royalties, future revenue growth and a corresponding liabilitydiscount factor. Royalty rates are determined using an average of recent comparable values, review of the operating margins and consideration of the specific characteristics of the trade name. Future growth rates are based on the Company’s perception of the long-term values in the market in which we compete, and the discount rate is determined using the weighted average cost of capital for estimated returns and allowances.companies within our peer group, adjusted for specific company risk premium factors.
ETHAN ALLEN INTERIORS INC. AND SUBSIDIARIES
Impairment of Long-lived Assets. The recoverability of long-lived assets is evaluated for impairment whenever events or changes in circumstances indicate that we may not be able to recover the carrying amount of an asset or asset group. Conditions that may indicate impairment include, but are not limited to, a significant adverse change in customer demand or business climate that could affect the value of an asset, change in the intended use of an asset, a product recall or an adverse action or assessment by a regulator. If the sum of the estimated undiscounted future cash flows over the remaining life of the primary asset is less than the carrying value, we recognize a loss equal to the difference between the carrying value and the fair value, usually determined by the estimated discounted cash flow analysis or independent third-party appraisal of the asset or asset group. While determining fair value requires a variety of input assumptions and judgment, we believe our estimates of fair value are reasonable. The asset group is defined as the lowest level for which identifiable cash flows are available and largely independent of the cash flows of other groups of assets, which for our retail segment is the individual design center while for our wholesale segment, it is the individual manufacturing plant. For retail design center level long-lived assets, expected cash flows are determined based on our estimate of future net sales, margin rates and expenses over the remaining expected terms of the leases.
In February 2016,Inventories. Inventories (finished goods, work in process and raw materials) are stated at the FASB issuedlower of cost, determined on a first-in, first-out basis, and net realizable value. Cost is determined based solely on those charges incurred in the acquisition and production of the related inventory (i.e. material, labor and manufacturing overhead costs). We estimate an inventory reserve for excess quantities and obsolete items based on specific identification and historical write-downs, taking into account future demand and market conditions. Our inventory reserves contain uncertainties that require management to make assumptions and to apply judgment regarding a number of factors, including market conditions, the selling environment, historical results and current inventory trends. We adjust our inventory reserves for net realizable value and obsolescence based on trends, aging reports, specific identification and estimates of future retail sales prices. If actual demand or market conditions change from our prior estimates, we adjust our inventory reserves accordingly throughout the period. We have not made any material changes to our assumptions included in the calculations of the lower of cost or net realizable value reserves during the periods presented.
Lease Accounting. We implemented ASU 2016-02, Leases (Topic 842), . This guidance requires an entityin the first quarter of fiscal 2020. Critical accounting estimates and judgments made in applying ASU 2016-02 relate to recognizehow the Company determines the reasonably certain lease term, the incremental borrowing rate and fair market value of the underlying asset. In recognizing the lease right-of-use assets and lease liabilities, we utilize the lease term for which we are reasonably certain to use the underlying asset, including consideration of options to extend or terminate the lease. At lease commencement, we evaluate whether we are reasonably certain to exercise available options based on consideration of a variety of economic factors and the circumstances related to the leased asset. Factors considered include, but are not limited to, (i) the contractual terms compared to estimated market rates, (ii) the uniqueness or importance of the asset or its location, (iii) the potential costs of obtaining an alternative asset, (iv) the potential costs of relocating or ceasing use of the asset, including the consideration of leasehold improvements and other invested capital, and (v) any potential tax consequences. The determination of the reasonably certain lease term affects the inclusion of rental payments utilized in the incremental borrowing rate calculations and the results of the lease classification test. The reasonably certain lease term may materially impact our financial position related to certain design centers which typically have greater lease payments. Although the above factors are considered in our analysis, the assessment involves subjectivity considering our strategy, expected future events and market conditions. While we believe our estimates and judgments in determining the lease term are reasonable, future events may occur which may require us to reassess this determination.
ASU 2016-02 requires companies to use the rate implicit in the lease whenever that rate is readily determinable and if the interest rate is not readily determinable, then a right-of-use assetlessee may use its incremental borrowing rate. As most of our leases do not include an implicit interest rate, we determine the discount rate for each lease based upon the incremental borrowing rate (“IBR”) in order to calculate the present value of the lease liability at the commencement date. The IBR is computed as the rate of interest that we would have to pay to (i) borrow on a collateralized basis (ii) over a similar term (iii) an amount equal to the total lease payments (iv) in a similar economic environment. As we do not have any outstanding public debt, we estimated the incremental borrowing rate based on our estimated credit rating and available market information. The incremental borrowing rate is subsequently reassessed upon a modification to the lease agreement. In the case an interest rate is implicit in a lease we will use that rate as the discount rate for that lease. The lease term for all of our lease arrangements include the noncancelable period of the lease plus, if applicable, any additional periods covered by an option to extend the lease that is reasonably certain to be exercised by the Company. Some of our leases contain variable lease payments based on a Consumer Price Index or percentage of sales, which are excluded from the measurement of the lease liability.
ETHAN ALLEN INTERIORS INC. AND SUBSIDIARIES
Refer to Note 6, Leases, for further details on the balance sheetadoption of ASU 2016-02.
Income Taxes. We are subject to income taxes in the United States and other foreign jurisdictions. Our tax provision is an estimate based on our understanding of laws in Federal, state and foreign tax jurisdictions. These laws can be complicated and are difficult to disclose keyapply to any business, including ours. The tax laws also require us to allocate our taxable income to many jurisdictions based on subjective allocation methodologies and information aboutcollection processes.
We use the entity's leasing arrangements. ASU 2016-02 is effectiveasset and liability method to account for income taxes. We recognize deferred tax assets and liabilities based on the estimated future tax consequences attributable to differences between the financial statement carrying amounts of existing assets and liabilities and their respective tax bases and operating loss and tax credit carryforwards. We measure deferred tax assets and liabilities using enacted tax rates in effect for the Company on July 1, 2019, and early adoption is permitted. ASU 2016-02 isyear in which we expect to recover or settle those temporary differences. When we record deferred tax assets, we are required to estimate, based on forecasts of taxable earnings in the relevant tax jurisdiction, whether we are more likely than not to recover them. In making judgments about realizing the value of our deferred tax assets, we consider historic and projected future operating results, the eligible carry-forward period, tax law changes and other relevant considerations.
The Company evaluates, on a quarterly basis, uncertain tax positions taken or expected to be adoptedtaken on tax returns for recognition, measurement, presentation, and disclosure in its financial statements. If an income tax position exceeds a 50% probability of success upon tax audit, based solely on the technical merits of the position, the Company recognizes an income tax benefit in its financial statements. The tax benefits recognized are measured based on the largest benefit that has a greater than 50% likelihood of being realized upon ultimate settlement. The liability associated with an unrecognized tax benefit is classified as a long-term liability except for the amount for which a cash payment is expected to be made or tax positions settled within one year.
Business Insurance Reserves. We have insurance programs in place to cover workers’ compensation and health care benefits under certain employee benefit plans provided by the Company. The insurance programs, which are funded through self-insured retention, are subject to various stop-loss limitations. We accrue estimated losses using actuarial models and assumptions based on historical loss experience. Although we believe that the insurance reserves are adequate, the reserve estimates are based on historical experience, which may not be indicative of current and future losses. In addition, the actuarial calculations used to estimate insurance reserves are based on numerous assumptions, some of which are subjective. We adjust insurance reserves, as needed, in the event that future loss experience differs from historical loss patterns.
Significant Accounting Policies
See Note 3, Summary of Significant Accounting Policies, in the notes to our consolidated financial statements included under Part II, Item 8, for a modified retrospective approachfull description of our significant accounting policies.
Recent Accounting Pronouncements
See Note 3, Summary of Significant Accounting Policies, in the notes to our consolidated financial statements included under Part II, Item 8, for all leases existing at,a full description of recent accounting pronouncements, including the expected dates of adoption, which we include here by reference.
Business Outlook
Fiscal 2020 saw unprecedented disruption around the world as a result of the rapid spread of COVID-19. Economies throughout the world have been severely disrupted by the effects of the quarantines, business closures and the reluctance or entered into afterinability of individuals to leave their homes as a result of the outbreak of COVID-19. In addition, the capital markets have been impacted and our efforts to raise necessary capital in the future could be adversely impacted by the outbreak of the virus and we cannot forecast with any certainty when the disruptions caused by it will cease to impact our business and the results of our operations.
As of the date of initial adoption, with an option to elect to use certain transition relief. The Company is currently evaluating the impactfiling of this new standardreport, we are gratified with the work and focus of our teams during this crisis and have operated with the foremost focus on its consolidated financial statementssafety of our associates and related disclosures, but expects that it will resultclients. We have been able to bring many previously furloughed associates back and our action plan helped us end the year with strong liquidity. We gradually began reopening our design centers beginning in May 2020 and as of June 30, 2020, reopened all of our Company-operated retail design centers, including 14% open by appointment only. We resumed production in our North American manufacturing plants during the end of fiscal 2020, some in a significant increaselimited capacity, and expect to work through existing order backlog and ramp up to full production during the first half of fiscal 2021. Our distribution centers are fully open and our retail home delivery centers are making home deliveries. As we move forward, we will continue to focus on our advantages, including a strong retail network, the personal service of our interior design professionals, our vertical structure whereby 75% of products are made in our North American workshops and increasing the assetsuse of technology in all aspects of our enterprise, while also maintaining our focus on strong governance and liabilities recorded onsocial responsibility.
ETHAN ALLEN INTERIORS INC. AND SUBSIDIARIES
Our strong network of North American interior design consultants continue to create design solutions that best satisfy our customer’s needs and are able to work with clients in-person or virtually. We believe changes in consumer spending and new habits being formed as a result of social distancing and sheltering in place, will create opportunities for our brand. Now more than ever, home is a haven, and we are here to help the consolidated balance sheet upon adoption.customer reimagine their homes. We continue to generate business through virtual and in-person appointments and by interacting virtually with our customers through Live Chat online. Our design consultants, are available to work with customers in-store and virtually utilizing technology, including the Ethan Allen inHome augmented reality app, the 3D room planner tool, Skype and FaceTime.
In November 2016,We plan to further invest in our digital footprint, including our website, in order to enhance our customer experience. We are also continually improving our customers’ journey from the FASB issued ASU 2016-18, Statement of Cash Flows (Topic 230): Restricted Cash. It is intended to reduce diversity in the presentation of restricted cash and restricted cash equivalents in the statement. The statement requires that restricted cash and restricted cash equivalents be included as components of total cash and cash equivalents as presented on the statement of cash flows. The Company currently does not include restricted cash as a component of cash and equivalents as presented on the statement of cash flows. The new guidance is effective for the Company on July 1, 2018, with early adoption permitted. The Company is currently evaluating the impacttime they land on our consolidated financial statements.website to their visit to one of our design centers to the delivery of their purchase via our white glove home delivery service. We planview the combination of online traffic and design center traffic in a holistic fashion whereby our customer generally experiences our brand on adopting effective July 1, 2018.our website before visiting a design center in person. Our online traffic continues to increase each year and our marketing teams remain focused on enhancing our digital outreach strategies to further drive more traffic and keep our brand relevant in today’s social media oriented world.
We are also making good progress with our new products including Lucy, a mid-century modern inspired upholstery collection that recently launched successfully, and Farmhouse, a country cottage inspired furniture collection that is just now launching in two phases scheduled over the next few months.
ItemITEM 7A. Quantitative and Qualitative Disclosures About Market RiskQUANTITATIVE AND QUALITATIVE DISCLOSURES ABOUT MARKET RISK
WeIn the normal course of business, we are exposed to market risks relating to fluctuations in interest rates and foreign currency exchange rates.rates that could impact our financial position and results of operations.
Interest Rate Risk
Debt.Interest rate risk exists primarily through our borrowing activities. We utilize United StatesU.S. dollar denominated borrowings to fund substantially all our working capital and investment needs. Short-term debt, if required, is used to meet working capital requirements and long-term debt is generally used to finance long-term investments. There is inherent rollover risk for borrowings as they mature and are renewed at current market rates. The extent of this risk is not quantifiable or predictable because of the variability of future interest rates and our future financing requirements.
For floating-rate obligations, interest rate changes do not affect the fair value of the underlying financial instrument but would impact future earnings and cash flows, assuming other factors are held constant. Conversely, for fixed-rate obligations, interest rate changes affect the fair value of the underlying financial instrument but would not impact earnings or cash flows.
At June 30, 2018, we did not have any2020, the fair value of our floating-rate debt obligations outstanding under our Facility.revolving credit facility was $50.0 million, which approximated its carrying amount and was determined based on quoted market prices for debt with a similar maturity. It is anticipated that the fair market value of any future debt under the credit facility will continue to be immaterially affected by fluctuations in interest rates and we do not believe that the value of such debt would be significantly impacted by current market events. The debt bears interest on the outstanding principal amount at a weighted average rate of 1.7%, which is equal to the one-month LIBOR rate plus a spread using a debt leverage pricing grid. During fiscal 2020, we recorded interest expense of $0.5 million on our outstanding debt amounts. We currently do not engage in any interest rate hedging activity and we have no intention of doing so in the foreseeable future. Based onAssuming all terms of our outstanding long-term debt remained the averagesame, a hypothetical 100 basis point change (up or down) in the one-month LIBOR rate would result in a $0.5 million change to our annual interest expense.
LIBOR Transition. Our current outstanding borrowing of $50.0 million under our revolving credit facility has an interest rate tied to LIBOR, which is the subject of recent national, international and other regulatory guidance and proposals for reform. These reforms and other pressure may cause LIBOR to disappear entirely or to perform differently than in the past. It is expected that certain banks will stop reporting information used to set LIBOR at the end of calendar year 2021 when their reporting obligations cease. This will effectively end the usefulness of LIBOR and end its publication. If LIBOR is no longer available, or otherwise at our option, we will pursue alternative interest rate calculations in our Credit Agreement, including the use of the loans underSecured Overnight Financing Rate (SOFR). A number of other alternatives to LIBOR have been proposed or are being developed, but it is not clear which, if any, will be adopted. Any of these alternative methods may result in interest payments that are higher than expected or that do not otherwise correlate over time with the Facility duringpayments that would have been made on such indebtedness for the quarter endedinterest periods if the applicable LIBOR rate was available in its current form.
ETHAN ALLEN INTERIORS INC. AND SUBSIDIARIES
Cash and Cash Equivalents.The fair market value of our cash and cash equivalents at June 30, 2018,2020 was $72.3 million. Our cash and cash equivalents consist of demand deposits and money market funds with original maturities of three months or less and are reported at fair value. It is anticipated that the fair market value of our cash equivalents will continue to be immaterially affected by fluctuations in interest rates. Preservation of principal is the extentprimary goal of our cash and investment policy. Pursuant to our established investment guidelines, we try to achieve high levels of credit quality, liquidity and diversification. Because of our investment policy, our financial exposure to fluctuations in interest rates is expected to remain low. We do not believe that borrowings were outstanding, a 10% change in the interest rate would notvalue or liquidity of our cash and cash equivalents have a material effect on our consolidated results of operations and financial condition.been significantly impacted by current market events.
Foreign Currency Exchange Risk
Foreign currency exchange risk is primarily limited to our operation of Ethan Allen operated retail design centers located in Canada and our manufacturing plants in Mexico and Honduras, as substantially all purchases of imported parts and finished goods are denominated in United States dollars. As such, foreign exchange gains or losses resulting from market changes in the value of foreign currencies have not had, nor are they expected to have, a material effect on our consolidated results of operations. A decrease in the value of foreign currencies (in particular Asian) relative to the United StatesU.S. dollar may affect the profitability of our vendors, but as we employ a balanced sourcing strategy, we believe any impact would be moderate relative to peers in our industry.
A hypothetical 10% weaker United States dollar against all foreign currencies at June 30, 2020 would have had an immaterial impact on our consolidated results of operations and financial condition. We currently do not engage in any foreign currency hedging activity and we have no intention of doing so in the industry.foreseeable future.
Duties and Tariffs Market Risk
We are exposed to market risk with respect to duties and tariffs assessed on raw materials, component parts, and finished goods we import into countries where we operate. Additionally, we are exposed to duties and tariffs on our finished goods that we export from our assembly plants to other countries. As these tariffs and duties increase, we determine whether a price increase to our customers to offset these costs is warranted. To the extent that an increase in these costs would have a material impact on our results of operations, we believe that our competitors would experience a similar impact.
Inflation Risk
Our results of operations and financial condition are presented based on historical cost. While it is difficult to accurately measure the impact of inflation due to the imprecise nature of the estimates required, we believe the effects of inflation, if any, on our consolidated results of operations and financial condition have been immaterial.
ITEM 8. FINANCIAL STATEMENTS AND SUPPLEMENTARY DATA
Item 8.Index to Consolidated Financial Statements and Supplementary Data
Our Consolidated Financial Statements and Supplementary Data are listed in Item 15 of this Annual Report.
ETHAN ALLEN INTERIORS INC. AND SUBSIDIARIES
Consolidated Financial Statements | Page |
Management’s Report to our Shareholders | 45 |
Report of Independent Registered Public Accounting Firm | 46 |
Consolidated Balance Sheets at June 30, 2020 and 2019 | 48 |
Consolidated Statements of Comprehensive Income for the years ended June 30, 2020, 2019 and 2018 | 49 |
Consolidated Statements of Cash Flows for the years ended June 30, 2020, 2019 and 2018 | 50 |
Consolidated Statements of Shareholders’ Equity for the years ended June 30, 2020, 2019 and 2018 | 51 |
Notes to the Consolidated Financial Statements | 52 |
ETHAN ALLEN INTERIORS INC. AND SUBSIDIARIES
Management’s Report to our Shareholders
Management's Responsibility for Financial Information
Management is responsible for the consistency, integrity and preparation of the information contained in this Annual Report on Form 10-K. The consolidated financial statements and other information contained in this Annual Report on Form 10-K have been prepared in accordance with accounting principles generally accepted in the United States of America and include necessary judgments and estimates by management.
To fulfill our responsibility, we maintain comprehensive systems of internal control designed to provide reasonable assurance that assets are safeguarded and transactions are executed in accordance with established procedures. The concept of reasonable assurance is based upon recognition that the cost of the controls should not exceed the benefit derived. We believe our systems of internal control provide this reasonable assurance.
The Board of Directors exercised its oversight role with respect to our systems of internal control primarily through its audit committee, which is comprised of independent directors. The committee oversees our systems of internal control, accounting practices, financial reporting and audits to assess whether their quality, integrity, and objectivity are sufficient to protect shareholders' investments.
In addition, our consolidated financial statements have been audited by KPMG LLP, an independent registered public accounting firm, whose report also appears in this Annual Report on Form 10-K.
Management's Report on Internal Control over Financial Reporting
Our management is responsible for establishing and maintaining adequate internal control over financial reporting, as such term is defined in Rule 13a-15(f) of the Exchange Act. Our internal control over financial reporting is a process designed to provide reasonable assurance regarding the reliability of financial reporting and the preparation of financial statements for external purposes in accordance with U.S. GAAP.
Our internal control over financial reporting includes those policies and procedures that:
| ● | pertain to the maintenance of records that, in reasonable detail, accurately and fairly reflect the transactions and dispositions of our assets; |
| ● | provide reasonable assurance that transactions are recorded as necessary to permit preparation of financial statements in accordance with U.S. GAAP, and that our receipts and expenditures are being made only in accordance with authorizations of our management and directors; and |
| ● | provide reasonable assurance regarding prevention or timely detection of unauthorized acquisition, use, or disposition of our assets that could have a material effect on our financial statements. |
Management has assessed the effectiveness of our internal control over financial reporting based on the framework in “Internal Control – Integrated Framework (2013)” issued by the Committee of Sponsoring Organizations of the Treadway Commission.
Based on the above evaluation, management has concluded that our internal control over financial reporting was effective as of June 30, 2020 to provide reasonable assurance regarding the reliability of financial reporting and the preparation of consolidated financial statements for external reporting purposes in accordance with U.S. GAAP. The effectiveness of our internal control over financial reporting as of June 30, 2020 has been audited by KPMG LLP, an independent registered public accounting firm, as stated in their report, which is included herein.
/s/ M. Farooq Kathwari | /s/ Corey Whitely |
Chairman, President and | Executive Vice President, Administration |
Chief Executive Officer | Chief Financial Officer and Treasurer |
(Principal Executive Officer) | (Principal Financial Officer) |
ETHAN ALLEN INTERIORS INC. AND SUBSIDIARIES
Report of Independent Registered Public Accounting Firm
To the Shareholders and Board of Directors
Ethan Allen Interiors Inc.:
Opinions on the Consolidated Financial Statements and Internal Control Over Financial Reporting
We have audited the accompanying consolidated balance sheets of Ethan Allen Interiors Inc. and subsidiaries (the “Company”)Company) as of June 30, 20182020 and 2017,2019, the related consolidated statements of comprehensive income, shareholders’ equity, and cash flows for each of the years in the three-year period ended June 30, 2018,2020, and the related notes (collectively, the “consolidatedconsolidated financial statements”)statements). We also have audited the Company’s internal control over financial reporting as of June 30, 2018,2020, based on criteria established in Internal Control – Integrated Framework (2013) issued by the Committee of Sponsoring Organizations of the Treadway Commission.
In our opinion, the consolidated financial statements referred to above present fairly, in all material respects, the financial position of the Company as of June 30, 20182020 and 2017,2019, and the results of its operations and its cash flows for each of the years in the three-year period ended June 30, 2018,2020, in conformity with U.S. generally accepted accounting principles. Also in our opinion, the Company maintained, in all material respects, effective internal control over financial reporting as of June 30, 2018,2020 based on criteria established in Internal Control – Integrated Framework (2013) issued by the Committee of Sponsoring Organizations of the Treadway Commission.
Change in Accounting Principle
As discussed in Notes 3 and 6 to the consolidated financial statements, the Company has changed its method of accounting for leases effective July 1, 2019 due to the adoption of Accounting Standards Codification (ASC) Topic 842, Leases.
Basis for OpinionsOpinions
The Company’s management is responsible for these consolidated financial statements, for maintaining effective internal control over financial reporting, and for its assessment of the effectiveness of internal control over financial reporting, included in the accompanying Management’s Report on Internal Control Over Financial Reporting. Our responsibility is to express an opinion on the Company’s consolidated financial statements and an opinion on the Company’s internal control over financial reporting based on our audits. We are a public accounting firm registered with the Public Company Accounting Oversight Board (United States) (“PCAOB”)(PCAOB) and are required to be independent with respect to the Company in accordance with the U.S. federal securities laws and the applicable rules and regulations of the Securities and Exchange Commission and the PCAOB.
We conducted our audits in accordance with the standards of the PCAOB. Those standards require that we plan and perform the audits to obtain reasonable assurance about whether the consolidated financial statements are free of material misstatement, whether due to error or fraud, and whether effective internal control over financial reporting was maintained in all material respects.
Our audits of the consolidated financial statements included performing procedures to assess the risks of material misstatement of the consolidated financial statements, whether due to error or fraud, and performing procedures that respond to those risks. Such procedures included examining, on a test basis, evidence regarding the amounts and disclosures in the consolidated financial statements. Our audits also included evaluating the accounting principles used and significant estimates made by management, as well as evaluating the overall presentation of the consolidated financial statements. Our audit of internal control over financial reporting included obtaining an understanding of internal control over financial reporting, assessing the risk that a material weakness exists, and testing and evaluating the design and operating effectiveness of internal control based on the assessed risk. Our audits also included performing such other procedures as we considered necessary in the circumstances. We believe that our audits provide a reasonable basis for our opinions.
ETHAN ALLEN INTERIORS INC. AND SUBSIDIARIES
Definition and Limitations of Internal Control Over Financial Reporting
A company’s internal control over financial reporting is a process designed to provide reasonable assurance regarding the reliability of financial reporting and the preparation of financial statements for external purposes in accordance with generally accepted accounting principles. A company’s internal control over financial reporting includes those policies and procedures that (1) pertain to the maintenance of records that, in reasonable detail, accurately and fairly reflect the transactions and dispositions of the assets of the company; (2) provide reasonable assurance that transactions are recorded as necessary to permit preparation of financial statements in accordance with generally accepted accounting principles, and that receipts and expenditures of the company are being made only in accordance with authorizations of management and directors of the company; and (3) provide reasonable assurance regarding prevention or timely detection of unauthorized acquisition, use, or disposition of the company’s assets that could have a material effect on the financial statements.
ETHAN ALLEN INTERIORS INC. AND SUBSIDIARIES
Because of its inherent limitations, internal control over financial reporting may not prevent or detect misstatements. Also, projections of any evaluation of effectiveness to future periods are subject to the risk that controls may become inadequate because of changes in conditions, or that the degree of compliance with the policies or procedures may deteriorate.
/s/ KPMG LLP
We have served as the Company’s auditor since 1989.
Stamford, Connecticut
August 2, 201827, 2020
ETHAN ALLEN INTERIORS INC. AND SUBSIDIARIES
Consolidated Balance SheetsCONSOLIDATED BALANCE SHEETS
|
June 30, 2018 and 2017
|
(In thousands, except share data)par value) |
| | | | June 30, | |
| | | 2018 | | | 2017 | | | 2020 | | | 2019 | |
ASSETS | | | | | | | | | | | | | | | | |
Current assets: | | | | | | | | | | | | | | | | |
Cash and cash equivalents | | $ | 22,363 | | | $ | 57,701 | | | $ | 72,276 | | | $ | 20,824 | |
Accounts receivable, net | | | 12,364 | | | | 12,293 | | | | 8,092 | | | | 14,247 | |
Inventories | | | 163,012 | | | | 149,483 | | |
Inventories, net | | | | 126,101 | | | | 162,389 | |
Prepaid expenses and other current assets | | | 16,686 | | | | 23,621 | | | | 23,483 | | | | 18,830 | |
Total current assets | | | 214,425 | | | | 243,098 | | | | 229,952 | | | | 216,290 | |
| | | | | | | | |
Property, plant and equipment, net | | | 267,903 | | | | 270,198 | | | | 236,678 | | | | 245,246 | |
Goodwill and other intangible assets | | | 45,128 | | | | 45,128 | | |
Restricted cash and investments | | | - | | | | 7,330 | | |
Goodwill | | | | 25,388 | | | | 25,388 | |
Intangible assets | | | | 19,740 | | | | 19,740 | |
Operating lease right-of-use assets | | | | 109,342 | | | | - | |
Deferred income taxes | | | | 137 | | | | 2,108 | |
Other assets | | | 2,977 | | | | 2,468 | | | | 1,552 | | | | 1,579 | |
Total assets | | $ | 530,433 | | | $ | 568,222 | | |
LIABILITIES AND SHAREHOLDERS' EQUITY | | | | | | | | | |
TOTAL ASSETS | | | $ | 622,789 | | | $ | 510,351 | |
| | | | | | | | | | |
LIABILITIES | | | | | | | | | |
Current liabilities: | | | | | | | | | | | | | | | | |
Current maturities of long-term debt | | $ | 584 | | | $ | 2,731 | | |
Customer deposits | | | 61,248 | | | | 62,960 | | |
Accounts payable | | | 18,768 | | | | 16,961 | | |
Accounts payable and accrued expenses | | | $ | 25,595 | | | $ | 34,166 | |
Customer deposits and deferred revenues | | | | 64,031 | | | | 56,714 | |
Accrued compensation and benefits | | | 18,926 | | | | 20,352 | | | | 18,278 | | | | 22,646 | |
Accrued expenses and other current liabilities | | | 21,734 | | | | 23,441 | | |
Short-term debt | | | | - | | | | 550 | |
Current operating lease liabilities | | | | 27,366 | | | | - | |
Other current liabilities | | | | 3,708 | | | | 8,750 | |
Total current liabilities | | | 121,260 | | | | 126,445 | | | | 138,978 | | | | 122,826 | |
Long-term debt | | | 1,096 | | | | 11,608 | | | | 50,000 | | | | 516 | |
Operating lease liabilities, long-term | | | | 102,111 | | | | - | |
Deferred income taxes | | | | 1,074 | | | | 1,069 | |
Other long-term liabilities | | | 24,207 | | | | 29,273 | | | | 2,562 | | | | 22,011 | |
Total liabilities | | | 146,563 | | | | 167,326 | | |
Shareholders' equity: | | | | | | | | | |
Common stock, par value $0.01; 150,000,000 shares authorized; 48,989,060 shares issued at June 30, 2018 and 48,979,994 shares issued at June 30, 2017 | | | 490 | | | | 490 | | |
Preferred stock, par value $0.01; 1,055,000 shares authorized; none issued | | | - | | | | - | | |
TOTAL LIABILITIES | | | $ | 294,725 | | | $ | 146,422 | |
| | | | | | | | | | |
Commitments and contingencies (See Note 20) | | | | | | | | | |
| | | | | | | | | | |
SHAREHOLDERS' EQUITY | | | | | | | | | |
Preferred stock, $0.01 par value; 1,055 shares authorized; none issued | | | $ | - | | | $ | - | |
Common stock, $0.01 par value; 150,000 shares authorized; 49,053 and 49,049 shares issued; 25,053 and 26,587 shares outstanding at June 30, 2020 and 2019, respectively | | | | 491 | | | | 491 | |
Additional paid-in-capital | | | 376,950 | | | | 377,550 | | | | 378,300 | | | | 377,913 | |
Less: Treasury stock (at cost), 22,459,766 shares at June 30, 2018 and 21,532,779 shares at June 30, 2017 | | | (656,551 | ) | | | (635,179 | ) | |
Treasury stock, at cost: 24,000 and 22,462 shares at June 30, 2020 and 2019, respectively | | | | (680,916 | ) | | | (656,597 | ) |
Retained earnings | | | 669,013 | | | | 661,976 | | | | 638,631 | | | | 647,710 | |
Accumulated other comprehensive income (loss) | | | (6,171 | ) | | | (4,131 | ) | |
Accumulated other comprehensive loss | | | | (8,441 | ) | | | (5,651 | ) |
Total Ethan Allen Interiors Inc. shareholders' equity | | | 383,731 | | | | 400,706 | | | | 328,065 | | | | 363,866 | |
Noncontrolling interests | | | 139 | | | | 190 | | | | (1 | ) | | | 63 | |
Total shareholders' equity | | | 383,870 | | | | 400,896 | | |
Total liabilities and shareholders' equity | | $ | 530,433 | | | $ | 568,222 | | |
TOTAL SHAREHOLDERS' EQUITY | | | | 328,064 | | | | 363,929 | |
TOTAL LIABILITIES AND SHAREHOLDERS' EQUITY | | | $ | 622,789 | | | $ | 510,351 | |
See accompanying notes to consolidated financial statements. |
ETHAN ALLEN INTERIORS INC. AND SUBSIDIARIES
Consolidated Statements of Comprehensive IncomeCONSOLIDATED STATEMENTS OF COMPREHENSIVE INCOME
|
For Years Ended June 30, 2018, 2017, and 2016
|
(In thousands, except share data) |
| | | | Years ended June 30, | |
| | | 2018 | | | 2017 | | | 2016 | | | 2020 | | | 2019 | | | 2018 | |
Net sales | | $ | 766,784 | | | $ | 763,385 | | | $ | 794,202 | | | $ | 589,837 | | | $ | 746,684 | | | $ | 766,784 | |
Cost of sales | | | 350,820 | | | | 343,662 | | | | 351,966 | | | | 266,705 | | | | 337,193 | | | | 350,820 | |
Gross profit | | | 415,964 | | | | 419,723 | | | | 442,236 | | | | 323,132 | | | | 409,491 | | | | 415,964 | |
| | | | | | | | | | | | | | |
Selling, general and administrative expenses | | | 367,097 | | | | 361,773 | | | | 353,057 | | | | 311,507 | | | | 356,880 | | | | 367,097 | |
Restructuring and other impairment charges, net of gains | | | | (3,019 | ) | | | 18,664 | | | | - | |
Operating income | | | 48,867 | | | | 57,950 | | | | 89,179 | | | | 14,644 | | | | 33,947 | | | | 48,867 | |
Interest and other income (expense) | | | 525 | | | | 268 | | | | 395 | | |
Interest and other related financing costs | | | 325 | | | | 1,223 | | | | 1,618 | | |
| | | | | | | | | | | | | | |
Interest (expense), net of interest income | | | | (455 | ) | | | (87 | ) | | | 200 | |
Income before income taxes | | | 49,067 | | | | 56,995 | | | | 87,956 | | | | 14,189 | | | | 33,860 | | | | 49,067 | |
Income tax expense | | | 12,696 | | | | 20,801 | | | | 31,319 | | |
| | | | | | | | | | | | | | |
Provision for income taxes | | | | 5,289 | | | | 8,162 | | | | 12,696 | |
Net income | | $ | 36,371 | | | $ | 36,194 | | | $ | 56,637 | | | $ | 8,900 | | | $ | 25,698 | | | $ | 36,371 | |
| | | | | | | | | | | | | | | | | | | | | | | | | |
Per share data: | | | | | | | | | | | | | |
Per share data | | | | | | | | | | | | | |
Basic earnings per common share: | | | | | | | | | | | | | |
Net income per basic share | | $ | 1.33 | | | $ | 1.31 | | | $ | 2.02 | | | $ | 0.34 | | | $ | 0.96 | | | $ | 1.33 | |
Basic weighted average common shares | | | 27,321 | | | | 27,679 | | | | 28,072 | | | | 26,044 | | | | 26,695 | | | | 27,321 | |
| | | | | | | | | | | | | | |
Diluted earnings per common share: | | | | | | | | | | | | | |
Net income per diluted share | | $ | 1.32 | | | $ | 1.29 | | | $ | 2.00 | | | $ | 0.34 | | | $ | 0.96 | | | $ | 1.32 | |
Diluted weighted average common shares | | | 27,625 | | | | 27,958 | | | | 28,324 | | | | 26,069 | | | | 26,751 | | | | 27,625 | |
Dividends declared per common share | | $ | 1.07 | | | $ | 0.74 | | | $ | 0.62 | | |
| | | | | | | | | | | | | | | | | | | | | | | | | |
Comprehensive income: | | | | | | | | | | | | | |
Comprehensive income | | | | | | | | | | | | | |
Net income | | $ | 36,371 | | | $ | 36,194 | | | $ | 56,637 | | | $ | 8,900 | | | $ | 25,698 | | | $ | 36,371 | |
Other comprehensive income | | | | | | | | | | | | | |
Curency translation adjustment | | | (2,040 | ) | | | 715 | | | | (2,208 | ) | |
Other comprehensive income (loss), net of tax | | | | | | | | | | | | | |
Foreign curency translation adjustments | | | | (2,790 | ) | | | 520 | | | | (2,040 | ) |
Other | | | (51 | ) | | | (14 | ) | | | 27 | | | | (64 | ) | | | (76 | ) | | | (51 | ) |
Other comprehensive income (loss) net of tax | | | (2,091 | ) | | | 701 | | | | (2,181 | ) | |
Other comprehensive income (loss), net of tax | | | | (2,854 | ) | | | 444 | | | | (2,091 | ) |
Comprehensive income | | $ | 34,280 | | | $ | 36,895 | | | $ | 54,456 | | | $ | 6,046 | | | $ | 26,142 | | | $ | 34,280 | |
See accompanying notes to consolidated financial statements. |
ETHAN ALLEN INTERIORS INC. AND SUBSIDIARIES
Consolidated Statements of Cash FlowsCONSOLIDATED STATEMENTS OF CASH FLOWS
|
For Years Ended June 30, 2018, 2017, and 2016
|
(In thousands) |
| | | 2018 | | | 2017 | | | 2016 | |
Operating activities: | | | | | | | | | | | | |
Net income | | $ | 36,371 | | | $ | 36,194 | | | $ | 56,637 | |
Adjustments to reconcile net income to net cash provided by operating activities: | | | | | | | | | | | | |
Depreciation and amortization | | | 19,831 | | | | 20,115 | | | | 19,353 | |
Compensation expense related to share-based payment awards | | | 954 | | | | 1,259 | | | | 2,356 | |
Provision (benefit) for deferred income taxes | | | (106 | ) | | | 3,507 | | | | 671 | |
Loss (gain) on disposal of property, plant and equipment | | | 201 | | | | 1,033 | | | | (2,267 | ) |
Other | | | (250 | ) | | | (6 | ) | | | (1,295 | ) |
| | | | | | | | | | | | | |
Change in operating assets and liabilities, net of effects of acquired businesses: | | | | | | | | | | | | |
Accounts receivable | | | (682 | ) | | | (2,826 | ) | | | 2,926 | |
Inventories | | | (11,876 | ) | | | 13,507 | | | | (9,982 | ) |
Prepaid and other current assets | | | 3,274 | | | | 1,010 | | | | 5,113 | |
Customer deposits | | | (2,444 | ) | | | 1,883 | | | | (7,275 | ) |
Accounts payable | | | 1,807 | | | | 1,524 | | | | (3,509 | ) |
Accrued expenses and other current liabilities | | | (3,058 | ) | | | (547 | ) | | | (6,550 | ) |
Other assets and liabilities | | | (1,525 | ) | | | 1,980 | | | | 2,191 | |
Net cash provided by operating activities | | | 42,497 | | | | 78,633 | | | | 58,369 | |
| | | | | | | | | | | | | |
Investing activities: | | | | | | | | | | | | |
Proceeds from the disposal of property, plant & equipment | | | 327 | | | | 1,273 | | | | 8,073 | |
Change in restricted cash and investments | | | 7,330 | | | | 490 | | | | 190 | |
Capital expenditures and acquisitions | | | (18,773 | ) | | | (18,321 | ) | | | (23,132 | ) |
Sales of marketable securities | | | - | | | | - | | | | 2,150 | |
Other investing activities | | | 204 | | | | 175 | | | | 193 | |
Net cash used in investing activities | | | (10,912 | ) | | | (16,383 | ) | | | (12,526 | ) |
| | | | | | | | | | | | | |
Financing activities: | | | | | | | | | | | | |
Payments on long-term debt and capital lease obligations | | | (14,456 | ) | | | (28,401 | ) | | | (34,840 | ) |
Purchases and retirements of company stock | | | (23,120 | ) | | | (10,246 | ) | | | (19,346 | ) |
Payment of cash dividends | | | (29,509 | ) | | | (20,031 | ) | | | (16,646 | ) |
Other financing activities | | | 194 | | | | 1,335 | | | | 1,718 | |
Net cash used in financing activities | | | (66,891 | ) | | | (57,343 | ) | | | (69,114 | ) |
Effect of exchange rate changes on cash | | | (32 | ) | | | 135 | | | | (252 | ) |
Net increase (decrease) in cash & cash equivalents | | | (35,338 | ) | | | 5,042 | | | | (23,523 | ) |
Cash & cash equivalents - beginning of year | | | 57,701 | | | | 52,659 | | | | 76,182 | |
Cash & cash equivalents - end of year | | $ | 22,363 | | | $ | 57,701 | | | $ | 52,659 | |
| | | | | | | | | | | | | |
Supplemental cash flow information: | | | | | | | | | | | | |
Income taxes paid | | $ | 14,305 | | | $ | 15,074 | | | $ | 29,003 | |
Interest paid | | $ | 177 | | | $ | 936 | | | $ | 1,352 | |
Non-cash capital lease obligations incurred | | $ | 1,442 | | | $ | 613 | | | $ | - | |
| | | Years ended June 30, | |
| | | 2020 | | | 2019 | | | 2018 | |
Cash Flows from Operating Activities | | | | | | | | | | | | |
Net income | | $ | 8,900 | | | $ | 25,698 | | | $ | 36,371 | |
Adjustments to reconcile net income to net cash provided by operating activities: | | | | | | | | | | | | |
Depreciation and amortization | | | 16,859 | | | | 19,530 | | | | 19,831 | |
Share-based compensation expense | | | 334 | | | | 121 | | | | 954 | |
Non-cash operating lease cost | | | 31,995 | | | | - | | | | - | |
Deferred income taxes | | | 2,524 | | | | (3,511 | ) | | | (106 | ) |
Restructuring and other impairment charges, net of gains | | | 2,407 | | | | 20,658 | | | | - | |
Restructuring payments | | | (9,067 | ) | | | (2,473 | ) | | | - | |
Loss on disposal of property, plant and equipment | | | 199 | | | | 157 | | | | 201 | |
Other | | | 287 | | | | 115 | | | | (250 | ) |
Change in operating assets and liabilities, net of effects of acquisitions: | | | | | | | | | | | | |
Accounts receivable, net | | | 6,020 | | | | (565 | ) | | | (682 | ) |
Inventories, net | | | 33,341 | | | | 957 | | | | (11,876 | ) |
Prepaid expenses and other current assets | | | (2,284 | ) | | | (2,155 | ) | | | 3,274 | |
Customer deposits and deferred revenue | | | 6,707 | | | | (4,924 | ) | | | (2,444 | ) |
Accounts payable and accrued expenses | | | (7,975 | ) | | | 665 | | | | 2,718 | |
Accrued compensation and benefits | | | (1,358 | ) | | | 653 | | | | (1,856 | ) |
Operating lease liabilities | | | (34,765 | ) | | | - | | | | - | |
Other assets and liabilities | | | (1,428 | ) | | | 321 | | | | (3,638 | ) |
Net cash provided by operating activities | | | 52,696 | | | | 55,247 | | | | 42,497 | |
| | | | | | | | | | | | | |
Cash Flows from Investing Activities | | | | | | | | | | | | |
Proceeds from the disposal of property, plant & equipment | | | 12,423 | | | | 1 | | | | 327 | |
Capital expenditures | | | (15,709 | ) | | | (9,120 | ) | | | (12,486 | ) |
Acquisitions, net of cash acquired | | | (1,350 | ) | | | (534 | ) | | | (6,287 | ) |
Other investing activities | | | 20 | | | | 153 | | | | 204 | |
Net cash used in investing activities | | | (4,616 | ) | | | (9,500 | ) | | | (18,242 | ) |
| | | | | | | | | | | | | |
Cash Flows from Financing Activities | | | | | | | | | | | | |
Borrowings on revolving credit facility | | | 100,000 | | | | 16,000 | | | | - | |
Payments on borrowings | | | (50,000 | ) | | | (16,000 | ) | | | (13,833 | ) |
Repurchases of common stock | | | (24,319 | ) | | | (46 | ) | | | (23,120 | ) |
Payment of cash dividends | | | (21,469 | ) | | | (46,990 | ) | | | (29,509 | ) |
Other financing activities | | | (515 | ) | | | (302 | ) | | | (429 | ) |
Net cash provided by (used in) financing activities | | | 3,697 | | | | (47,338 | ) | | | (66,891 | ) |
| | | | | | | | | | | | | |
Effect of exchange rate changes on cash and cash equivalents | | | (325 | ) | | | 52 | | | | (32 | ) |
Net increase (decrease) in cash, cash equivalents and restricted cash | | | 51,452 | | | | (1,539 | ) | | | (42,668 | ) |
Cash, cash equivalents and restricted cash at beginning of period | | | 20,824 | | | | 22,363 | | | | 65,031 | |
Cash, cash equivalents and restricted cash at end of period | | $ | 72,276 | | | $ | 20,824 | | | $ | 22,363 | |
| | | | | | | | | | | | | |
Supplemental Disclosure on Cash Flow Information | | | | | | | | | | | | |
Cash paid during the year for income taxes, net of refunds | | $ | 6,006 | | | $ | 13,339 | | | $ | 14,305 | |
Cash paid during the year for interest | | $ | 538 | | | $ | 306 | | | $ | 177 | |
| | | | | | | | | | | | | |
Supplemental Disclosure on Non-Cash Information | | | | | | | | | | | | |
Non-cash financing lease obligations incurred | | $ | 87 | | | $ | - | | | $ | 1,442 | |
Dividends declared, not paid | | $ | - | | | $ | 5,075 | | | $ | 5,065 | |
See accompanying notes to consolidated financial statements. |
ETHAN ALLEN INTERIORS INC. AND SUBSIDIARIES
Consolidated Statements of Shareholders' EquityCONSOLIDATED STATEMENTS OF SHAREHOLDERS' EQUITY
|
For Years Ended June 30, 2018, 2017, and 2016
|
(In thousands, except share data)thousands) |
| | | | | | | | | | | | | | | Accumulated | | | | | | | | | | | | | |
| | | | | | | Additional | | | | | | | Other | | | | | | | Non- | | | | | |
| | | Common | | | Paid-in | | | Treasury | | | Comprehensive | | | Retained | | | Controlling | | | | | |
| | | Stock | | | Capital | | | Stock | | | Income | | | Earnings | | | Interests | | | Total | |
Balance at June 30, 2015 | | | 489 | | | | 370,914 | | | | (605,586 | ) | | | (2,638 | ) | | | 607,079 | | | | 277 | | | | 370,535 | |
| | | | | | | | | | | | | | | | | | | | | | | | | | | | | |
Stock issued on share-based awards | | | - | | | | 734 | | | | - | | | | - | | | | - | | | | - | | | | 734 | |
Compensation expense associated with share-based awards | | | - | | | | 2,356 | | | | - | | | | - | | | | - | | | | - | | | | 2,356 | |
Tax benefit associated with exercise of share based awards | | | - | | | | 968 | | | | - | | | | - | | | | - | | | | - | | | | 968 | |
Purchase/retirement of company stock | | | - | | | | - | | | | (19,346 | ) | | | - | | | | - | | | | - | | | | (19,346 | ) |
Dividends declared on common stock | | | - | | | | - | | | | - | | | | - | | | | (17,401 | ) | | | - | | | | (17,401 | ) |
Capital distribution | | | - | | | | - | | | | - | | | | - | | | | - | | | | (100 | ) | | | (100 | ) |
Comprehensive income (loss) | | | - | | | | - | | | | - | | | | (2,208 | ) | | | 56,637 | | | | 27 | | | | 54,456 | |
Balance at June 30, 2016 | | | 489 | | | | 374,972 | | | | (624,932 | ) | | | (4,846 | ) | | | 646,315 | | | | 204 | | | | 392,202 | |
| | | | | | | | | | | | | | | | | | | | | | | | | | | | | |
Stock issued on share-based awards | | | 1 | | | | 1,199 | | | | - | | | | - | | | | - | | | | - | | | | 1,200 | |
Compensation expense associated with share-based awards | | | - | | | | 1,259 | | | | - | | | | - | | | | - | | | | - | | | | 1,259 | |
Tax benefit associated with exercise of share based awards | | | - | | | | 120 | | | | - | | | | - | | | | - | | | | - | | | | 120 | |
Purchase/retirement of company stock | | | - | | | | - | | | | (10,247 | ) | | | - | | | | - | | | | - | | | | (10,247 | ) |
Dividends declared on common stock | | | - | | | | - | | | | - | | | | - | | | | (20,533 | ) | | | - | | | | (20,533 | ) |
Capital distribution | | | - | | | | - | | | | - | | | | - | | | | - | | | | - | | | | - | |
Comprehensive income (loss) | | | - | | | | - | | | | - | | | | 715 | | | | 36,194 | | | | (14 | ) | | | 36,895 | |
Balance at June 30, 2017 | | | 490 | | | | 377,550 | | | | (635,179 | ) | | | (4,131 | ) | | | 661,976 | | | | 190 | | | | 400,896 | |
| | | | | | | | | | | | | | | | | | | | | | | | | | | | | |
Stock issued on share-based awards | | $ | - | | | $ | 193 | | | | - | | | | - | | | | - | | | $ | - | | | $ | 193 | |
Compensation expense associated with share-based awards | | | - | | | | 954 | | | | - | | | | - | | | | - | | | | - | | | | 954 | |
Tax benefit associated with exercise of share based awards | | | - | | | | - | | | | - | | | | - | | | | - | | | | - | | | | - | |
Purchase/retirement of company stock | | | - | | | | (1,747 | ) | | | (21,372 | ) | | | - | | | | - | | | | - | | | | (23,119 | ) |
Dividends declared on common stock | | | - | | | | - | | | | - | | | | - | | | | (29,334 | ) | | | - | | | | (29,334 | ) |
Capital distribution | | | - | | | | - | | | | - | | | | - | | | | - | | | | - | | | | - | |
Comprehensive income (loss) | | | - | | | | - | | | | - | | | | (2,040 | ) | | | 36,371 | | | | (51 | ) | | | 34,280 | |
Balance at June 30, 2018 | | $ | 490 | | | $ | 376,950 | | | $ | (656,551 | ) | | $ | (6,171 | ) | | $ | 669,013 | | | $ | 139 | | | $ | 383,870 | |
| | | | | | | | | | | | | | | | | | | | | | | Accumulated | | | | | | | | | | | | | |
| | | | | | | | | | | Additional | | | | | | | | | | | Other | | | | | | | Non- | | | | | |
| | | Common Stock | | | Paid-in | | | Treasury Stock | | | Comprehensive | | | Retained | | | Controlling | | | Total | |
| | | Shares | | | Par Value | | | Capital | | | Shares | | | Amount | | | Loss | | | Earnings | | | Interests | | | Equity | |
Balance at June 30, 2017 | | | 48,980 | | | $ | 490 | | | $ | 377,550 | | | | 21,533 | | | $ | (635,179 | ) | | $ | (4,131 | ) | | $ | 661,976 | | | $ | 190 | | | $ | 400,896 | |
Net income | | | - | | | | - | | | | - | | | | - | | | | - | | | | - | | | | 36,371 | | | | - | | | | 36,371 | |
Common stock issued on share-based awards | | | 9 | | | | - | | | | 193 | | | | - | | | | - | | | | - | | | | - | | | | - | | | | 193 | |
Share-based compensation expense | | | - | | | | - | | | | 954 | | | | - | | | | - | | | | - | | | | - | | | | - | | | | 954 | |
Purchase and retirement of common stock | | | - | | | | - | | | | (1,747 | ) | | | 927 | | | | (21,372 | ) | | | - | | | | - | | | | - | | | | (23,119 | ) |
Cash dividends declared | | | - | | | | - | | | | - | | | | - | | | | - | | | | - | | | | (29,334 | ) | | | - | | | | (29,334 | ) |
Other comprehensive income (loss) | | | - | | | | - | | | | - | | | | - | | | | - | | | | (2,040 | ) | | | - | | | | (51 | ) | | | (2,091 | ) |
Balance at June 30, 2018 | | | 48,989 | | | $ | 490 | | | $ | 376,950 | | | | 22,460 | | | $ | (656,551 | ) | | $ | (6,171 | ) | | $ | 669,013 | | | $ | 139 | | | $ | 383,870 | |
Net income | | | - | | | | - | | | | - | | | | - | | | | - | | | | - | | | | 25,698 | | | | - | | | | 25,698 | |
Common stock issued on share-based awards | | | 52 | | | | 1 | | | | 842 | | | | - | | | | - | | | | - | | | | - | | | | - | | | | 843 | |
Share-based compensation expense | | | - | | | | - | | | | 121 | | | | - | | | | - | | | | - | | | | - | | | | - | | | | 121 | |
Restricted stock vesting | | | 8 | | | | - | | | | - | | | | 2 | | | | (46 | ) | | | - | | | | - | | | | - | | | | (46 | ) |
Cash dividends declared | | | - | | | | - | | | | - | | | | - | | | | - | | | | - | | | | (47,001 | ) | | | - | | | | (47,001 | ) |
Other comprehensive income (loss) | | | - | | | | - | | | | - | | | | - | | | | - | | | | 520 | | | | - | | | | (76 | ) | | | 444 | |
Balance at June 30, 2019 | | | 49,049 | | | $ | 491 | | | $ | 377,913 | | | | 22,462 | | | $ | (656,597 | ) | | $ | (5,651 | ) | | $ | 647,710 | | | $ | 63 | | | $ | 363,929 | |
Net income | | | - | | | | - | | | | - | | | | - | | | | - | | | | - | | | | 8,900 | | | | - | | | | 8,900 | |
Common stock issued on share-based awards | | | 4 | | | | - | | | | 53 | | | | - | | | | - | | | | - | | | | - | | | | - | | | | 53 | |
Share-based compensation expense | | | - | | | | - | | | | 334 | | | | - | | | | - | | | | - | | | | - | | | | - | | | | 334 | |
Impact of ASU 2016-02 adoption, net of tax | | | - | | | | - | | | | - | | | | - | | | | - | | | | - | | | | (1,585 | ) | | | - | | | | (1,585 | ) |
Purchase and retirement of common stock | | | - | | | | - | | | | - | | | | 1,538 | | | | (24,319 | ) | | | - | | | | - | | | | - | | | | (24,319 | ) |
Cash dividends declared | | | - | | | | - | | | | - | | | | - | | | | - | | | | - | | | | (16,394 | ) | | | - | | | | (16,394 | ) |
Other comprehensive income (loss) | | | - | | | | - | | | | - | | | | - | | | | - | | | | (2,790 | ) | | | - | | | | (64 | ) | | | (2,854 | ) |
Balance at June 30, 2020 | | | 49,053 | | | $ | 491 | | | $ | 378,300 | | | | 24,000 | | | $ | (680,916 | ) | | $ | (8,441 | ) | | $ | 638,631 | | | $ | (1 | ) | | $ | 328,064 | |
See accompanying notes to consolidated financial statements. |
ETHAN ALLEN INTERIORS INC. AND SUBSIDIARIES
Notes to the Consolidated Financial Statements
June 30, 2018, 2017 and 2016NOTES TO THE CONSOLIDATED FINANCIAL STATEMENTS
(1)(1)
| SummaryOrganization and Nature of Significant Accounting PoliciesBusiness
|
Basis of Presentation
The following is a summary of significant accounting policies ofFounded in 1932 and incorporated in Delaware in 1989, Ethan Allen Interiors Inc., andthrough its wholly-owned subsidiary, Ethan Allen Global, Inc., and Ethan Allen Global, Inc.’s subsidiaries (collectively, "We," "Us," "Our," "Ethan Allen"“we,” “us,” “our,” “Ethan Allen” or the "Company"“Company”). All significant intercompany accounts, is a leading interior design company, manufacturer and transactions have been eliminatedretailer in the consolidated financial statements. Our consolidated financial statements also include the accounts of an entity in whichhome furnishings marketplace. Today we are a majority shareholder with the power to direct the activitesglobal luxury international home fashion brand that most significantly impact the entity’s performance. Noncontrolling interest amounts in the entity are immaterialis vertically integrated from design through delivery, which affords our customers a value proposition of style, quality and included in the Consolidated Statement of Comprehensive Income within interest and other income, net.
Nature of Operations
price. We are a leading manufacturer and retailer of quality home furnishings and accents, offeringprovide complimentary interior design service to our clientscustomers and sell a full range of furniture products and decorative accents. We sell our productsaccents through onea retail network of the country’s largest home furnishing retail networks and at June 30, 2018 there were a total of 296approximately 300 design centers in our retail network,the United States and abroad as well as online at ethanallen.com. The design centers represent a mix of which 148 are Companyindependent licensees and Company-owned and operated and 148 are independently operated. Nearly alllocations. As of June 30, 2020, our Company operatedoperates 144 retail design centers, arewith 138 located in the United States withand the remaining Company operated design centers locatedsix in Canada. The majority of the independently operated design centers are in Asia, with the remaining independently operated design centers located throughout the United States, the Middle East and Europe. We also own and operate nine manufacturing facilities including six manufacturing plants and one sawmill in the United States, two manufacturing plants in Mexico and one manufacturing plant in MexicoHonduras.
Principles of Consolidation.Ethan Allen conducts business globally and onehas strategically aligned its business into two reportable segments: Wholesale and Retail. These two segments represent strategic business areas of our vertically integrated enterprise that operate separately and provide their own distinctive services. The accompanying consolidated financial statements include the accounts of the Company and its wholly owned subsidiaries. Our consolidated financial statements also include the accounts of an entity in Honduras.which we are a majority shareholder with the power to direct the activities that most significantly impact the entity’s performance. Noncontrolling interest amounts in the entity are immaterial and included in the Consolidated Statements of Comprehensive Income within Interest (expense), net of interest income. All intercompany activity and balances have been eliminated from the consolidated financial statements.
Use of Estimates
Estimates. We prepare our consolidated financial statements in conformityaccordance with accounting principles generally accepted in the United States,U.S. GAAP, which requires management to make estimates and assumptions that affect the reported amounts of assets and liabilities and disclosure of contingent assets and liabilities at the date of the consolidated financial statements and the reported amounts of revenuesnet sales and expenses during the reporting period. Because ofDue to the inherent uncertainty involved in making those estimates, actual results could differ from those estimates. Areas in which significant estimates have been made include, but are not limited to, revenue recognition, the allowance for doubtful accounts receivable, inventory obsolescence, tax valuation allowances,goodwill and indefinite-lived intangible asset impairment analyses, useful lives and impairment analyses for property, plant and equipment, inventory obsolescence, lease accounting, business insurance reserves, tax valuation allowances and definite lived intangible assets, goodwill and indefinite lived intangible asset impairment analyses, the evaluation of uncertain tax positions and the fair value of assets acquired and liabilities assumed in business combinations.positions.
Reclassifications
Reclassifications. Certain reclassifications have been made to prior years’ financial statements to conform to the current year’s presentation. These changes were made for disclosure purposes only and did not have any impact on previously reported results.
The Company has evaluated subsequent events through the date that the financial statements were issued.
(3) | Summary of Significant Accounting Policies |
The significant accounting policies of the Company and its subsidiaries are summarized below.
Cash and Cash Equivalents
Cash and short-term, highly liquid investments with original maturities of three months or less are considered cash and cash equivalents.equivalents and are reported at fair value. Our corporate money market funds are readily convertible into cash and the net asset value of each fund on the last day of the month is used to determine its fair value. We invest excess cash in money market accounts and short-term commercial paper,paper. As of June 30, 2020 and 2019, we had no restricted cash on hand.
We maintain our cash and cash equivalent accounts in financial institutions in both U.S. Treasury Bills.dollar and Canadian dollar denominations. Accounts at the U.S. institutions are insured by the Federal Deposit Insurance Corporation (“FDIC”) up to $250,000 and accounts at the Canadian institutions are insured by the Canada Deposit Insurance Corporation (“CDIC”) up to $100,000 Canadian dollars. As of June 30, 2020 and 2019, and at various times throughout these fiscal years, we had cash in financial institutions in excess of the amount insured by the FDIC and CDIC. We perform ongoing evaluations of these institutions to limit our concentration of credit risk.
ETHAN ALLEN INTERIORS INC. AND SUBSIDIARIES
Accounts Receivable
Accounts receivable arise from the sale of products on trade credit terms and is presented net of allowance for doubtful accounts. We maintain an allowance for estimated losses resulting from the inability of our customers to make required payments. The allowance for doubtful accounts is based on a review of specifically identified accounts in addition to an overall aging analysis. Judgments are made with respect to the collectability of accounts receivable based on historical experience and current economic trends. On a monthly basis, we review all significant accounts as to their past due balances, as well as collectability of the outstanding trade accounts receivable for possible write-off. It is our policy to write-off the accounts receivable against the allowance account when we deem the receivable to be uncollectible. Additionally, we review orders from retailers that are significantly past due, and we ship product only when our ability to collect payment from our customer for the new order is probable. At June 30, 2020 and 2019, the allowance for doubtful accounts was immaterial.
Inventories
Inventories are stated at the lower of cost (first-in, first-out) and(on first-in, first-out basis) or net realizable value. Cost is determined based solely on those charges incurred in the acquisition and production of the related inventory (i.e. material, labor and manufacturing overhead costs).
Property, Plant and Equipment
Property, plant and equipment are stated at cost, net ofless accumulated depreciation and amortization. Depreciation of property, plant and equipment is provided over the estimated useful lives of the respective assets on a straight-line basis. Estimated useful lives of the respective assets typically range from twenty to forty years for buildings and improvements and from three to twenty years for machinery and equipment. Capitalized computer software costs include internal and external costs incurred during the software's development stage and are depreciated over three to five years. Leasehold improvements are amortized over the shorter of the underlying lease term or the estimated useful life. Repairs and maintenance expenditures, which are not considered leasehold improvements and do not extend the useful life of the property and equipment, are expensed as incurred.
Retirement or dispositions of long-lived assets are recorded based on carrying value and proceeds received. Any resulting gains or losses are recorded as a component of operating expenses.
Property, plant and equipment is reviewed for impairment whenever events or changes in circumstances indicate that the carrying amount of assets may not be recoverable. For further discussion regarding impairments refer to the Impairment of Long-Lived Assets accounting policy below.
Assets Held for Sale
An asset is considered to be held for sale when all of the following criteria are met: (i) management commits to a plan to sell the property; (ii) it is unlikely that the disposal plan will be significantly modified or discontinued; (iii) the property is available for immediate sale in its present condition; (iv) actions required to complete the sale of the property have been initiated; (v) sale of the asset is probable and the completed sale is expected to occur within one year; and (vi) the property is actively being marketed for sale at a price that is reasonable given its current market value.
Upon designation as an asset held for sale, the carrying value of the asset is recorded at the lower of its carrying value or its estimated fair value less estimated costs to sell, and the Company ceases depreciating the asset. As of June 30, 2020 and 2019, we did not have any assets held for sale.
Impairment of Long-Lived Assets
We review the carrying value of our long-lived assets for impairment whenever events or changes in circumstances indicate that their carrying amounts may not be recoverable. Our assessment of recoverability is based on our best estimates using either quoted market prices or an analysis of the undiscounted projected future cash flows by asset groups in order to determine if there is any indicator of impairment requiring us to further assess the fair value of our long-lived assets. If the sum of the estimated undiscounted future cash flows related to the asset is less than the carrying value, we recognize a loss equal to the difference between the carrying value and the fair value, usually determined by the estimated discounted cash flow analysis of the assets. Our asset groups consist of our operating segments within our Wholesale reportable segment, each of our retail design centers and other corporate assets. The asset group is defined as the lowest level for which identifiable cash flows are available and largely independent of the cash flows of other groups of assets, which for our retail segment is the individual retail design center and for our wholesale segment is the manufacturing plant level. We estimate future cash flows based on design center-level historical results, current trends, third-party appraisals and operating and cash flow projections. Our estimates are subject to uncertainty and may be affected by a number of factors outside our control, including general economic conditions and the competitive environment. While we believe our estimates and judgments about future cash flows are reasonable, future impairment charges may be required if the expected cash flow estimates, as projected, do not occur or if events change requiring us to revise our estimates. Our retail segment recorded an impairment of long-lived assets held at various retail design centers of $5.2 million and $9.9 million, respectively, during fiscal 2020 and 2019. There were no impairments during fiscal 2018. Refer to Note 10, Restructuring and Impairment Activities, for further disclosure on the long-lived asset impairment.
ETHAN ALLEN INTERIORS INC. AND SUBSIDIARIES
Operating Leases
We record expense for operating leases on a straight-line basis, beginning on the date that we take possession or control of the property. Several of our operating lease agreements contain provisions for tenant improvement allowances, rent holidays, rent concessions, and/or rent escalations.
Incentive payments received from landlords are recorded as deferred lease incentives and are amortized over the underlying lease term on a straight-line basis as a reduction of rent expense. When the terms of an operating lease provide for periods of free rent, rent concessions, and/or rent escalations, we establish a deferred rent liability for the difference between the scheduled rent payment and the straight-line rent expense recognized. This deferred rent liability is also amortized over the underlying lease term on a straight-line basis as a reduction of rent expense.
Goodwill and Other Indefinite-Lived Intangible Assets
Our goodwill and intangible assets are comprised primarily of goodwill, which represents the excess of cost over the fair value of net assets acquired, and our Ethan Allen trade name and related trademarks. We determined theseBoth goodwill and indefinite-lived intangible assets are not amortized as they are estimated to have an indefinite useful lives, and are therefore not amortized.life.
Impairment of Long-Lived AssetsWe are required to test goodwill and Goodwill
indefinite-lived intangibles for potential impairment annually, or more frequently if impairment indicators occur. Goodwill and other indefinite-lived intangible assets are evaluated for impairment on an annual basis during the fourth quarter of each fiscal year, and between annual tests whenever events or circumstances indicate that the carrying value of the goodwill or other intangible asset may exceed its fair value.
Goodwill. When testing goodwill for impairment, we may assess qualitative factors for some or all of our reporting units to determine whether it is more likely than not (that is, a likelihood of more than 50 percent) that the fair value of a reporting unit is less than its carrying amount, including goodwill. Alternatively, we may bypass this qualitative assessment for some or all of our reporting units and determine whether the carrying value exceeds the fair value using a quantitative assessment, as described below.
The recoverability We have two reporting units; wholesale and retail, which are consistent with our reportable operating segments. Only our wholesale reporting unit has goodwill remaining at June 30, 2020. We performed an interim quantitative impairment assessment of long-livedgoodwill and intangible assets is evaluated for impairment whenever events orduring the third quarter of fiscal 2020 due to significant adverse changes in circumstances indicate that we may not be able to recover the carrying amount of an asset or asset group. Our assessment of recoverability determines whether the carrying value will be recovered through the expected undiscounted future cash flows resultingbusiness climate from the useCOVID-19 health crisis, including a significant decrease in wholesale net sales coupled with a meaningful decline in our stock price. Based on the Company’s interim quantitative assessment performed as of March 31, 2020, the asset. In the event the sum of the expected undiscounted future cash flows is less than the carryingfair value of the asset, an impairment loss equal to the excess of the asset’swholesale reporting unit exceeded its related carrying value over its fair value is recorded.by approximately 25%, thus no impairment of goodwill as of March 31, 2020.
Other Indefinite-Lived Intangible Assets (trade name). The fair value of our trade name, which is the Company’s only indefinite-lived intangible asset other than goodwill, is valued usingassessed annually in the relief-from-royalty method. Significant factors usedfourth quarter and may be reviewed more frequently if indicators of impairment are present. Conditions that may indicate impairment include, but are not limited to, a significant adverse change in customer demand or business climate that could affect the value of an asset, a product recall or an adverse action or assessment by a regulator. The fair value of our trade name valuation are rateswas reviewed as of March 31, 2020 for royalties, future growth, and a discount factor. Royalty rates are determined using an average of recent comparable values. Future growth rates areimpairment based on the Company’s perception of the long-term valuessignificant adverse changes in the market in which we compete,business climate from the COVID-19 health crisis. We performed the interim trade name impairment test and concluded that its fair value substantially exceeded the discount rate is determined using the weighted average costcarrying value as of capital for companies within our peer group, adjusted for specific company risk premium factors.March 31, 2020, thus no impairment.
Leases
We determine if an arrangement is a lease at inception. Operating leases are included in operating lease right-of-use (“ROU”) assets, current operating lease liabilities and long-term operating lease liabilities in our consolidated balance sheets. Finance leases are included in property, plant and equipment, other current liabilities, and other long-term liabilities in our consolidated balance sheets.
ROU assets represent our right to use an underlying asset for the lease term and lease liabilities represent our obligation to make lease payments arising from the lease. Operating lease ROU assets and liabilities are recognized at commencement date based on the present value of lease payments over the lease term. As most of our leases do not provide an implicit rate, we generally use our incremental borrowing rate based on the estimated rate of interest for collateralized borrowing over a similar term of the lease payments at commencement date. The operating lease ROU asset also includes any lease payments made and excludes lease incentives. Our lease terms may include options to extend or terminate the lease when it is reasonably certain that we will exercise that option.
Lease concessions, in the form of rent deferrals and/or abatements, related to the effects of the COVID-19 pandemic that do not result in a substantial increase in the rights of the landlord or the obligations of the Company are accounted for as if no changes to the lease contract were made. Under this accounting, we have reflected rent deferrals within our Accounts payable and accrued expenses in our consolidated balance sheet and recognized expense within our consolidated statement of comprehensive income. Rent abatements have been reflected as variable lease payments. During the fourth quarter of fiscal 2020, we received a total of $2.7 million in retail design center rent deferrals and abatements related to the effects of COVID-19.
ETHAN ALLEN INTERIORS INC. AND SUBSIDIARIES
See Note 6, Leases, for further lease accounting details.
Customer Deposits and Deferred Revenue
In many cases we receive deposits from customers before we have transferred control of our product to our customers, resulting in contract liabilities. These customer deposits are reported as a current liability in Customer deposits and deferred revenue on our consolidated balance sheets. At June 30, 2020, we had customer deposits of $62.6 million compared with $56.7 million a year ago. During fiscal 2020, we recognized $55.0 million of revenue related to our contract liabilities as of June 30, 2019.
During the second quarter of fiscal 2020, we launched a marketing program featuring a membership, which for a $100 annual fee, offers special members-only pricing, free shipping and white glove in-home delivery, and in our United States design centers, access to preferred financing plans. New membership fees were recorded as deferred revenue when collected from customers and recognized as revenue on a straight-line basis over the membership period of one year. These non-refundable fees are initially reported as a current liability in Customer deposits and deferred revenue on our consolidated balance sheet while recognized revenue is reported within Net sales on our consolidated statement of comprehensive income. At June 30, 2020, we had $1.4 million of deferred membership revenue on our consolidated balance sheet. During fiscal 2020, we recognized $2.0 million of revenue related to the membership program. We stopped marketing the membership program during the third quarter of fiscal 2020.
We expect that substantially all of the customer deposits and deferred membership fees as of June 30, 2020 will be recognized as revenue within the next twelve months as the performance obligations are satisfied.
Deferred Financing Fees
Deferred financing fees related to our revolving credit facility are included in Prepaid expenses and other current assets (current portion) and Other assets (non-current portion)on our consolidated balance sheets and amortized utilizing the effective interest method. Such amortization is included in Interest (expense), net of interest income on the consolidated statements of comprehensive income.
Insurance
The Company maintains insurance coverage for significant exposures, as well as those risks that, by law, must be insured. In the case of the Company’s health care coverage for employees, the Company has an insurance program related to claims filed. Expenses related to this insured program are computed on an actuarial basis, based on claims experience, regulatory requirements, an estimate of claims incurred but not yet reported (“IBNR”) and other relevant factors. The projections involved in this process are subject to uncertainty related to the timing and amount of claims filed, levels of IBNR, fluctuations in health care costs and changes to regulatory requirements. The Company had liabilities of $2.2 million and $2.5 million related to health care coverage as of June 30, 2020 and 2019, respectively.
We also carry workers’ compensation insurance subject to a deductible amount for which the Company is responsible on each claim. The Company had liabilities of $5.2 and $6.0 million related to workers’ compensation claims, primarily for claims that do not meet the per-incident deductible, as of June 30, 2020 and 2019, respectively.
Fair Value of Financial Instruments
Because of their short-term nature, the carrying value of our cash and cash equivalents, receivables and payables, short-term debt and customer deposit liabilities approximates fair value. AtThe fair value of our long-term debt was $50 million as of June 30, 2018 our debt consists entirely of capital leases, and at June 30,2017 it consisted of our term loan and capital leases. The estimated fair value is equal to2020, which we believe approximates the carrying value on those dates.amount as the terms and interest rate approximate market rates given its floating interest rate basis.
IncomeTaxes
Income taxes are accounted for under the asset and liability method. Deferred tax assets and liabilities are recognized for the future tax consequences attributable to differences between the financial statement carrying amounts of existing assets and liabilities and their respective tax bases and operating loss and tax credit carryforwards.
Deferred tax assets and liabilities are measured using enacted tax rates expected to apply to taxable income in the years in which those temporary differences are expected to be recovered or settled. The effect on deferred tax assets and liabilities of a change in tax rates is recognized in income in the period that includes the enactment date. A valuation allowance must be established for deferred tax assets when it is more likely than not that the assets will not be realized.
ETHAN ALLEN INTERIORS INC. AND SUBSIDIARIES
We recognize the tax benefit from an uncertain tax position only if it is more likely than not that the tax position will be sustained on examination by the taxing authorities, based on the technical merits of the position. Most of the unrecognized tax benefits, if recognized, would be recorded as a benefit to income tax expense.
ETHAN ALLEN INTERIORS INC. AND SUBSIDIARIES
The liability associated with an unrecognized tax benefit is classified as a long-term liability except for the amount for which a cash payment is expected to be made or tax positions settled within one year. We recognize interest and penalties related to income tax matters as a component of income tax expense.
Revenue Recognition
We adopted ASU 2014-09, Revenue from Contracts with Customers (Topic 606) using the cumulative effect approach, which required us to apply the new guidance retrospectively to revenue transactions completed on or after July 1, 2018.
Our reported revenue (net sales) consist substantially of product sales. We report product sales net of discounts and recognize them at the point in time when control transfers to the customer. For sales to our customers in our wholesale segment, control typically transfers when the product is recognized when all the following have occurred: persuasive evidenceshipped. The majority of a sales arrangement exists (e.g. a wholesale purchase order or retail sales order); the sales arrangement specifies a fixed or determinable sales price; titleour shipping agreements are freight-on-board shipping point and risk of ownership has passedloss transfers to our wholesale customer once the customer; no specific performance obligations remain; product is shippedout of our control. Accordingly, revenue is recognized for product shipments on third-party carriers at the point in time that our product is loaded onto the third-party container or services are provided to the customer; collectability is reasonably assured. As such, revenue recognitiontruck. For sales in our retail segment, control generally occurs upon the shipment of goods to independent retailers or, in the case of Ethan Allen operated retail design centers,transfers upon delivery to the customer. If shipping is billed to customers, this is included in revenue. Recorded sales provide for estimated returns and allowances. We permit our customers to return defective products and incorrect shipments, and terms we offer are standard for the industry.
Shipping and Handling Costs
Our practice has been to sell our products at the same delivered cost to all retailers and customers nationwide, regardless of shipping point. Costs incurred by the Company to deliver finished goods are expensed and recorded in selling, general and administrative expenses. We recognize shipping and handling expense as fulfillment activities (rather than as a promised good or service) when the activities are performed even if those activities are performed after the control of the good has been transferred. Accordingly, we record the expenses for shipping and handling activities at the same time we recognize net sales. Shipping and handling costs amounted to $73.6$64.4 million in fiscal year 2018,$71.32020, $75.6 million for fiscal 20172019 and $71.7$73.6 million in fiscal 2016.2018.
We exclude from the measurement of the transaction price all taxes imposed on and concurrent with a specific revenue-producing transaction and collected by the entity from a customer, including sales, use, excise, value-added, and franchise taxes (collectively referred to as sales taxes). Sales taxes collected is not recognized as revenue but is included in Accounts payable and accrued expenses on the consolidated balance sheets as it is ultimately remitted to governmental authorities.
Estimated refunds for returns and allowances are based on our historical return patterns. We record these estimated sales refunds on a gross basis rather than on a net basis and have recorded an asset for product we expect to receive back from customers in Prepaid expenses and other current assets and a corresponding refund liability in Other current liabilities on our consolidated balance sheets. At June 30, 2020 and June 30, 2019, these amounts were immaterial.
We capitalize commission fees paid to our associates as contract assets within Prepaid expenses and other current assets on our consolidated balance sheets. These prepaid commissions are subsequently recognized as a selling expense upon delivery (when we have transferred control of our product to our customer). At June 30, 2020, we had prepaid commissions of $9.0 million, which we expect to recognize to selling expense in the next six months. Prepaid commissions totaled $8.0 million at June 30, 2019, which were fully recognized in selling expenses during fiscal 2020.
We have elected the practical expedient permitted in ASC 606-10-32-18, which allows an entity to recognize the promised amount of consideration without adjusting for the effects of a significant financing component if the contract has a duration of one year or less. As our contracts typically are less than one year in length and do not have significant financing components, we have not adjusted consideration.
Cost of Sales
Our cost of sales consist primarily of the cost to manufacture or purchase our merchandise (i.e. direct material, labor and overhead costs) as well as inspection, internal transfer, in-bound freight and warehousing costs.
Selling, General and Administrative Expenses (“SG&A”)
SG&A expenses include the costs of selling our products and other general and administrative costs. Selling expenses are primarily composed of shipping and handling costs, commissions, advertising, warranty, and compensation and benefits of employees performing various sales functions. Occupancy costs, depreciation, compensation and benefit costs for administration employees and other administrative costs are included in SG&A. All store pre-opening costs are included in SG&A expenses and are expensed as incurred.
ETHAN ALLEN INTERIORS INC. AND SUBSIDIARIES
Advertising Costs
Advertising expenses primarily represent the costs are expensed when first aired or distributed.associated with our direct mailings, national television spots, on-air radio, digital marketing and other mediums. Our total advertising costs were $43.3$29.1 million in fiscal year 2018,$39.72020, $30.5 million in fiscal year 20172019 and $34.1$43.3 million in fiscal year 2016.2018. These amounts include advertising media expenses, outside and inside agency expenses, certain website related fees and photo and video production. Advertising costs from our direct mailers are expensed when provided to the carrier for distribution. Website, print and other advertising expenses, which include e-commerce advertising, web creative content, national television and direct marketing activities such as print media and radio, are expensed as incurred or upon the release of the content or the initial advertisement. Prepaid advertising costs were immaterial at June 30, 2018 totaled $1.1 million compared to $1.5 million at June 30, 2017.2020 and 2019, respectively.
Earnings Per ShareAcquisitions
From time to time we acquire design centers from our independent retailers in arms-length transactions. We compute basic earnings per share by dividing net income byrecord these acquisitions using the weighted average numberacquisition method of common shares outstandingaccounting. All of the assets acquired, liabilities assumed, contractual contingencies and contingent consideration are recognized at their fair value on the acquisition date. Cash paid to acquire design centers during the period. Diluted earnings per share is calculated similarly, except that the weighted average outstanding sharesfiscal 2020, 2019 and 2018 was $1.5 million, $0.5 million and $6.3 million, respectively. Acquisition-related expenses are adjusted to include the effects of converting all potentially dilutive share-based awards issued under our employee stock plans (see Notes 9recognized separately and 10).expensed as incurred.
Share-Based Compensation
Share-based compensation expense is included within selling, general and administrative expenses. Tax benefits associated with our share-based compensation arrangements are included within income tax expense.
We estimate, as of the date of grant, the fair value of stock options awarded using the Black-Scholes option pricing model. Use of a valuation model requires management to make certain assumptions with respect to selected model inputs, including anticipated changes in the underlying stock price (i.e. expected volatility) and option exercise activity (i.e. expected life). Expected volatility is based on the historical volatility of our stock and other contributing factors. The expected life of options granted, which represents the period of time that the options are expected to be outstanding, is based, primarily, on historical data.
We estimate, as of the date of grant, the fair value of non-performance based restricted stock units awarded using a discounted cash flow model, which requires management to make certain assumptions with respect to model inputs including anticipated future dividends not paid during the restriction period, and a discount for lack of marketability for a one-yearone-year holding period after vesting.
Share-based compensation expense is included within selling, general and administrative expenses. Tax benefits associated with our share-based compensation arrangements are included within income tax expense.
All We account for these restricted stock units as equity-based awards because when they vest, they will be settled in shares of our common stock.
We estimate, as of the date of grant, the fair value of performance units with a discounted cash flow model, using as model inputs the risk-free rate of return as the discount rate, dividend yield for dividends not paid during the restriction period, and a discount for lack of marketability for a one-year post-vest holding period. The lack of marketability discount used is the present value of a future put option using the Chaffe model. Performance units require management to make assumptions regarding the likelihood of achieving Company performance targets on a quarterly basis. The number of performance units that vest will be predicated on the Company achieving certain performance levels. A change in the financial performance levels the Company achieves could result in changes to our current estimate of the vesting percentage and related share-based compensation.
As share-based compensation expense recognized is based on awards ultimately expected to vest, it has been reduced for estimated forfeitures. Forfeitures are estimated at the time of grant and revised, if necessary, in subsequent periods if actual forfeitures differ from those estimates. Forfeitures are estimated based primarily on historical experience. Windfall tax benefits, defined as tax deductions that exceed recorded share-based compensation, are classified as cash inflows from operating activities. The value of the portion of the equity-based awards that are ultimately expected to vest is recognized as expense over the requisite service periods in our consolidated statement of income.
Earnings Per Share
We compute basic earnings per share (“EPS”) by dividing net income by the weighted average number of common shares outstanding during the period. Diluted EPS is calculated similarly, except that the weighted average outstanding shares are adjusted to include the effects of converting all potentially dilutive share-based awards issued under our employee stock receivedplans. The number of potential common shares outstanding are determined in connectionaccordance with the treasury stock method to the extent they are dilutive. For the purpose of calculating EPS, common shares outstanding include common shares issuable upon the exercise of outstanding share-based awards have been recorded ascompensation awards. Under the treasury stock method, the exercise price paid by the optionee and result in a reduction in shareholders’ equity.future share-based compensation expense that the Company has not yet recognized are assumed to be used to repurchase shares.
ETHAN ALLEN INTERIORS INC. AND SUBSIDIARIES
Foreign Currency Translation
The functional currency of each Company operatedCompany-operated foreign location is the respective local currency. Assets and liabilities are translated into United StatesU.S. dollars using the current period-end exchange rate and income and expense amounts are translated using the average exchange rate for the period in which the transaction occurred. Resulting translation adjustments are reported as a component of accumulated other comprehensive income (loss) within shareholders’ equity.
Treasury Stock
The Company accounts for repurchased common stock on a trade date basis under the cost method and includes such treasury stock as a component of its shareholders’ equity. We account for the formal retirement of treasury stock by deducting its par value from common stock, reducing additional paid-in capital (“APIC”) by the average amount recorded in APIC when the stock was originally issued and any remaining excess of cost deducted from retained earnings.
RecentAccounting Pronouncements
As of the beginning of fiscal 2020, we implemented all applicable new accounting standards and updates issued by the Financial Accounting Standards Board (“FASB”) that were in effect.
New Accounting Standards or Updates Adopted in fiscal 2020
Leases. In February 2016, the FASB issued accounting standards update (“ASU”) 2016-02, Leases (Topic 842), an update related to accounting for leases. This standard requires an entity to recognize lease liabilities and a right-of-use asset for all leases on the balance sheet and to disclose key information about the entity's leasing arrangements. ASU 2016-02 is effective for annual reporting periods beginning after December 15, 2018, including interim periods within that reporting period, with earlier adoption permitted. In July 2018, the FASB approved an amendment to the new guidance that allows companies the option of using the effective date of the new standard as the initial application (at the beginning of the period in which it is adopted, rather than at the beginning of the earliest comparative period) and to recognize the effects of applying the new ASU as a cumulative effect adjustment to the opening balance sheet or retained earnings.
We adopted ASU 2016-02 as of July 1, 2019 using the modified retrospective method and have not restated comparative periods. We elected the package of practical expedients upon adoption, which permits us (i) to not reassess whether any expired or existing contracts are or contain leases, (ii) to not reassess lease classification for any expired or existing leases, and (iii) to not reassess treatment of initial direct costs, if any, for any expired or existing leases. In addition, we elected not to separate lease and non-lease components when determining the ROU asset and lease liability for our design center real estate leases and did not elect the hindsight practical expedient, which would have allowed us to use hindsight when determining the remaining lease term as of the adoption date on July 1, 2019. Lastly, we elected the short-term lease exception policy for all leases, permitting us to exclude the recognition requirements of this standard from leases with initial terms of 12 months or less.
Upon adoption we recognized operating lease assets of $129.7 million and operating lease liabilities of $149.7 million on our consolidated balance sheet. In addition, $20.0 million of deferred rent and various lease incentives, which were reflected as other long-term liabilities as of June 30, 2019, were reclassified as a component of the right-of-use assets upon adoption. The Company also recognized a cumulative adjustment as of July 1, 2019, which decreased opening retained earnings by $1.6 million due to the impairment of certain right-of-use assets. The adoption of the new standard did not have a material impact on our consolidated statements of operations or cash flows. See Note 6 for further details on new disclosures required under ASU 2016-02.
Goodwill Impairment Test. In January 2017, the FASB issued ASU 2017-04, Intangibles-Goodwill and Other (Topic 350): Simplifying the Test for Goodwill Impairment, which removes the requirement for companies to compare the implied fair value of goodwill with its carrying amount as part of step 2 of the goodwill impairment test. A goodwill impairment will now be the amount by which a reporting unit’s carrying value exceeds its fair value, not to exceed the carrying amount of goodwill. The Company early adopted ASU 2017-04 during fiscal 2020.
ETHAN ALLEN INTERIORS INC. AND SUBSIDIARIES
Recent Accounting Standards or Updates Not Yet Effective
Recently Adopted Accounting Pronouncements
Credit Losses of Financial Instruments.In July 2015, June 2016, the FASB issued ASU 2015-112016-13, , “InventoryFinancial Instruments – Credit Losses (Topic 330)326): Simplifying the Measurement of InventoryCredit Losses on Financial Instruments, ,” which statesan update that inventory shouldrequires measurement and recognition of expected credit losses for financial assets held based on historical experience, current conditions, and reasonable and supportable forecasts that affect the collectability of the reported amount. This accounting standards update will be measured at the lower of cost and net realizable value. Net realizable value is defined as estimated selling priceeffective for us beginning in the ordinary coursefirst quarter of business, less reasonably predictable costs of completion, disposalfiscal 2021 and transportation. We adopted effective July 1, 2017, andwe do not expect the new guidance is being applied prospectively. The adoption did notto have a material impact on our consolidated financial statements.
Implementation Costs in a Cloud Computing Arrangement. In November 2015, August 2018, the FASB issued ASU 2015-17,2018-15, Balance Sheet Classification of Deferred TaxesIntangibles-Goodwill and Other – Internal-Use Software (Subtopic 350-40): Customer’s Accounting for Implementation Costs Incurred in a Cloud Computing Arrangement That is a Service Contract, which requiresan update related to a client’s accounting for implementation costs incurred in a cloud computing arrangement that is a service contract. This guidance aligns the Companyrequirements for capitalizing implementation costs in a cloud computing service contract with the guidance for capitalizing implementation costs to present all deferred tax assetsdevelop or obtain internal-use software. Capitalized implementation costs related to a hosting arrangement that is a service contract will be amortized over the term of the hosting arrangement, beginning when the module or component of the hosting arrangement is ready for its intended use. This accounting standards update will be effective for us beginning in the first quarter of fiscal 2021 and liabilities as noncurrent. We adopted this ASUwe do not expect the adoption to have a material impact on July 1, 2017 on a prospective basis. At June 30, 2017 we had net current deferred tax assets of $3.9 million which would have been classified as noncurrent under the new standard.our consolidated financial statements.
Simplifying the Accounting for Income Taxes.In March 2016, December 2019, the FASB issued ASU 2016-09,2019-12, Improvements to Employee Share-Based PaymentIncome Taxes (Topic 740): Simplifying the Accounting for Income Taxes, whichan update intended to simplify various aspects related to accounting for income taxes. This guidance removes certain exceptions to the general principles in Topic 740 and also clarifies and amends ASC Topic 718, Stock Compensation. The objectiveexisting guidance to improve consistent application. This accounting standards update will be effective for us beginning in the first quarter of fiscal 2022, with early adoption permitted. We are currently evaluating the impact of this amendment is partaccounting standards update, but do not expect the adoption to have a material impact on our consolidated financial statements.
Reference Rate Reform on Financial Reporting. In March 2020, the FASB issued ASU 2020-04, Reference Rate Reform (Topic 848): Facilitation of the FASB’s Simplification InitiativeEffects of Reference Rate Reform on Financial Reporting, an update that provides optional expedients and exceptions for applying GAAP to contracts, hedging relationships, and other transactions affected by reference rate reform if certain criteria are met. The amendments in this update apply only to contracts, hedging relationships, and other transactions that reference LIBOR or another reference rate expected to be discontinued because of reference rate reform. This accounting standards update is intended to ease the process of migrating away from LIBOR to new reference rates and will be effective for us beginning in the first quarter of fiscal 2021. We do not expect the adoption to have a material impact on our consolidated financial statements.
No other new accounting pronouncements issued or effective as of June 30, 2020 have had or are expected to have an impact on our consolidated financial statements.
ETHAN ALLEN INTERIORS INC. AND SUBSIDIARIES
The following table disaggregates our net sales by product category by segment for fiscal 2020:
(Amounts in thousands) | | Wholesale | | | Retail | | | Total | |
Upholstery | | $ | 164,059 | | | $ | 213,903 | | | $ | 377,962 | |
Case goods | | | 115,040 | | | | 129,839 | | | | 244,879 | |
Accents | | | 61,405 | | | | 102,994 | | | | 164,399 | |
Other | | | (2,556 | ) | | | 16,064 | | | | 13,508 | |
Total before intercompany eliminations | | $ | 337,948 | | | $ | 462,800 | | | | 800,748 | |
Intercompany eliminations | | | | | | | | | | | (210,911 | ) |
Consolidated net sales | | | | | | | | | | $ | 589,837 | |
The following table disaggregates our net sales by product category by segment for fiscal 2019:
(Amounts in thousands) | | Wholesale | | | Retail | | | Total | |
Upholstery | | $ | 216,460 | | | $ | 263,744 | | | $ | 480,204 | |
Case goods | | | 151,999 | | | | 172,293 | | | | 324,292 | |
Accents | | | 77,978 | | | | 130,325 | | | | 208,303 | |
Other | | | (4,886 | ) | | | 23,467 | | | | 18,581 | |
Total before intercompany eliminations | | $ | 441,551 | | | $ | 589,829 | | | | 1,031,380 | |
Intercompany eliminations | | | | | | | | | | | (284,696 | ) |
Consolidated net sales | | | | | | | | | | $ | 746,684 | |
The following table disaggregates our net sales by product category by segment for fiscal 2018:
(Amounts in thousands) | | Wholesale | | | Retail | | | Total | |
Upholstery | | $ | 243,511 | | | $ | 270,050 | | | $ | 513,561 | |
Case goods | | | 154,170 | | | | 170,513 | | | | 324,683 | |
Accents | | | 82,870 | | | | 125,968 | | | | 208,838 | |
Other | | | (4,820 | ) | | | 20,971 | | | | 16,151 | |
Total before intercompany eliminations | | $ | 475,731 | | | $ | 587,502 | | | | 1,063,233 | |
Intercompany eliminations | | | | | | | | | | | (296,449 | ) |
Consolidated net sales | | | | | | | | | | $ | 766,784 | |
| ● | Upholstery furniture includes fabric-covered items such as sleepers, recliners and other motion furniture, chairs, ottomans, custom pillows, sofas, loveseats, cut fabrics and leather. |
| ● | Case goods furniture includes items such as beds, dressers, armoires, tables, chairs, buffets, entertainment units, home office furniture, and wooden accents. |
| ● | Accents includes items such as window treatments and drapery hardware, wall décor, florals, lighting, clocks, mattresses, bedspreads, throws, pillows, decorative accents, area rugs, wall coverings and home and garden furnishings. |
| ● | Other includes membership revenue, product delivery sales, the Ethan Allen Hotel room rentals and banquets, sales of third-party furniture protection plans and other miscellaneous product sales less prompt payment discounts, sales allowances and other incentives. |
| ● | Intercompany eliminations represent the elimination of all intercompany wholesale segment sales to the retail segment during the period presented. |
ETHAN ALLEN INTERIORS INC. AND SUBSIDIARIES
(5) | Fair Value Measurements |
Fair value is defined as the price that would be received from selling an asset or paid to transfer a liability (i.e., the “exit price”) in an orderly transaction between market participants at the measurement date. In determining fair value, the use of various valuation methodologies, including market, income and cost approaches is permissible. We consider the principal or most advantageous market in which it applieswould transact and considers assumptions that market participants would use when pricing the asset or liability.
Fair Value Hierarchy. The accounting guidance for fair value measurements establishes a fair value hierarchy that requires an entity to several aspectsmaximize the use of observable inputs and minimize the use of unobservable inputs when measuring fair value. There are three levels of inputs that may be used to measure fair value based on the reliability of inputs. A financial instrument’s categorization within the fair value hierarchy is based upon the lowest level of input that is significant to the fair value measurement. Our assessment of the accountingsignificance of a particular input to the fair value measurement requires judgment and may affect their placement within the fair value hierarchy levels. We have categorized our cash equivalents as Level 1 assets within the fair value hierarchy as there are quoted prices in active markets for share-based payment transactions, includingidentical assets or liabilities. As the income tax consequences, classification of awardsinterest rate on our long-term debt is a variable rate, adjusted based on market conditions, it approximates the current market-rate for similar instruments available to companies with comparable credit quality and maturity, and therefore, our long-term debt is categorized as either equitya Level 2 liability in the fair value hierarchy. There were no Level 3 assets or liabilities and classification onheld by the statementCompany as of cash flows. We adopted effective July 1, 2017. For the fiscal year ended June 30, 2018, 2020 and 2019.
Assets and Liabilities Measured at Fair Value on a Non-Recurring Basis. We measure certain assets at fair value on a non-recurring basis. These assets are recognized at fair value when they are deemed to be other-than-temporarily impaired. With the Company recordedexception of the $5.2 million retail asset impairment charge, we did not record any additional other-than-temporary impairments on those assets required to be measured at fair value on a net tax expensenon-recurring basis during fiscal 2020. In addition, we did not hold any available-for-sale securities during fiscal 2020 and 2019, thus no fair value measurements were required. Refer to Note 10, Restructuring and Impairment Activities, for further disclosure of $0.6 million due to adoptionthe retail impairment charge.
Assets and Liabilities Measured at Fair Value for Disclosure Purposes Only. As of this ASU. For the fiscal year ended June 30, 2017, 2020 the Company recordedfair value of our long-term debt was $50.0 million, which approximated its carrying amount given the application of a creditfloating interest rate equal to additional paid in capital of $0.1 million, that under the new standard would have been recognized in income.monthly LIBOR rate plus a spread using a debt leverage pricing grid.
(2)(6)
| Business AcquisitionsLeases
|
From timeDuring the first quarter of fiscal 2020, we adopted ASU 2016-02 and all related amendments. The guidance requires lessees to timerecognize substantially all leases on their balance sheet as a right-of-use (“ROU”) asset and a lease liability.
Lease Accounting Policy
We have operating leases for many of our design centers that expire at various dates through fiscal 2040. In addition, we also lease certain tangible assets, including computer equipment and vehicles with lease terms ranging from three to five years. We determine if a contract contains a lease at inception based on our right to control the use of an identified asset and our right to obtain substantially all of the economic benefits from the use of that identified asset. Certain operating leases have renewal options and rent escalation clauses as well as various purchase options. We assess these options to determine if we are reasonably certain of exercising these options based on all relevant economic and financial factors. Any options that meet these criteria are included in the lease term at lease commencement.
Lease right-of-use assets represent the right to use an underlying asset pursuant to the lease for the lease term, and lease liabilities represent the obligation to make lease payments arising from the lease. Lease right-of-use assets and lease liabilities are recognized at the commencement of an arrangement where it is determined at inception that a lease exists. These assets and liabilities are initially recognized based on the present value of lease payments over the lease term calculated using our incremental borrowing rate generally applicable to the location of the lease right-of-use asset, unless an implicit rate is readily determinable. We combine lease and certain non-lease components for our design center real estate leases in determining the lease payments subject to the initial present value calculation. Lease right-of-use assets include upfront lease payments and exclude lease incentives, where applicable. Lease terms include options to extend or terminate the lease when it is reasonably certain that those options will be exercised.
Lease expense for operating leases consists of both fixed and variable components. Expense related to fixed lease payments are recognized on a straight-line basis over the lease term. Variable lease payments are generally expensed as incurred, where applicable, and include certain index-based changes in rent, certain non-lease components, such as maintenance and other services provided by the lessor, and other charges included in the lease. Leases with an initial term of twelve months or less are not recorded on the balance sheet. In addition, certain of our equipment lease agreements include variable lease payments, which are based on the usage of the underlying asset. The variable portion of payments are not included in the initial measurement of the asset or lease liability due to uncertainty of the payment amount and are recorded as lease expense in the period incurred.
ETHAN ALLEN INTERIORS INC. AND SUBSIDIARIES
We have elected the short-term lease exemption, whereby leases with initial terms of one year or less are not capitalized and instead expensed on a straight-line basis over the lease term.
Key Estimates and Judgments
Key estimates and judgments in applying ASU 2016-02 relate to how the Company acquiresdetermines the discount rate to discount the unpaid lease payments to present value and the lease term.
ASC 842 requires companies to use the rate implicit in the lease whenever that rate is readily determinable and if the interest rate is not readily determinable, then a lessee may use its incremental borrowing rate. Most of our leases do not have an interest rate implicit in the lease. As a result, for purposes of measuring our ROU asset and lease liability, we determined our incremental borrowing rate by computing the rate of interest that we would have to pay to (i) borrow on a collateralized basis (ii) over a similar term (iii) at an amount equal to the total lease payments and (iv) in a similar economic environment. As we do not have any outstanding public debt, we estimated the incremental borrowing rate based on our estimated credit rating and available market information. We used the incremental borrowing rates we determined as of July 1, 2019 for operating leases that commenced prior to that date. The incremental borrowing rate is subsequently reassessed upon a modification to the lease agreement. In the case an interest rate is implicit in a lease we will use that rate as the discount rate for that lease. The lease term for all of our lease arrangements include the noncancelable period of the lease plus, if applicable, any additional periods covered by an option to extend the lease that is reasonably certain to be exercised by the Company. Our leases generally do not include termination options for either party to the lease or restrictive financial or other covenants. Some of our leases contain variable lease payments based on a Consumer Price Index or percentage of sales, which are excluded from the measurement of the lease liability.
The Company's lease terms and discount rates are as follows:
| | June 30, 2020 | |
Weighted-average remaining lease term (in years) | | | | |
Operating leases | | | 6.6 | |
Financing leases | | | 1.6 | |
Weighted-average discount rate | | | | |
Operating leases | | | 4.2 | % |
Financing leases | | | 4.4 | % |
The following table discloses the location and amount of our operating and financing lease costs within our consolidated statements of comprehensive income (in thousands):
| | Statement of Comprehensive Income Location | | Twelve months ended June 30, 2020 | |
Operating lease cost | Selling, general and administrative (“SG&A”) | | $ | 31,995 | |
Financing lease cost: | | | | | |
Depreciation of property | SG&A | | | 596 | |
Interest on lease liabilities | Interest income, net of interest (expense) | | | 30 | |
Short-term lease cost | SG&A | | | 1,215 | |
Variable lease cost(1) | SG&A | | | 9,457 | |
Less: Sublease income | SG&A | | | (2,181 | ) |
Total lease expense | | $ | 41,112 | |
| (1) | Variable lease payments include index-based changes in rent, maintenance, real estate taxes, insurance and other charges included in the lease. |
ETHAN ALLEN INTERIORS INC. AND SUBSIDIARIES
For the twelve months ended June 30, 2019, operating lease rent expense as reported within SG&A was $32.4 million, net of sublease rental income of $2.1 million.
The following table discloses the operating and financing lease assets and liabilities recognized within our consolidated balance sheet as of June 30, 2020 (in thousands):
| | Consolidated Balance Sheet Location | | June 30, 2020 | |
Assets | | | | | |
Operating leases | Operating lease right-of-use assets (non-current) | | $ | 109,342 | |
Financing leases | Property, plant and equipment, net | | | 590 | |
Total lease assets | | $ | 109,932 | |
| | | | | | |
Liabilities | | | | | |
Current: | | | | | |
Operating leases | Current operating lease liabilities | | $ | 27,366 | |
Financing leases | Other current liabilities | | | 464 | |
Noncurrent: | | | | | |
Operating leases | Operating lease liabilities, long-term | | | 102,111 | |
Financing leases | Other long-term liabilities | | | 121 | |
Total lease liabilities | | $ | 130,062 | |
The ROU assets by segment are as follows as of June 30, 2020 (in thousands):
Retail | | $ | 109,395 | |
Wholesale | | | 537 | |
Total ROU assets | | $ | 109,932 | |
The table below reconciles the undiscounted future minimum lease payments (displayed by year and in the aggregate) under noncancelable leases with terms of more than one year to the total lease liabilities recognized on the condensed consolidated balance sheets as of June 30, 2020 (in thousands):
Fiscal Year | | Operating Leases | | | Financing Leases | |
2021 | | $ | 32,136 | | | $ | 464 | |
2022 | | | 27,701 | | | | 72 | |
2023 | | | 21,327 | | | | 39 | |
2024 | | | 16,463 | | | | 19 | |
2025 | | | 12,913 | | | | 8 | |
Thereafter | | | 39,120 | | | | - | |
Total undiscounted future minimum lease payments | | | 149,660 | | | | 602 | |
Less: imputed interest | | | (20,183 | ) | | | (17 | ) |
Total present value of lease obligations(1) | | $ | 129,477 | | | $ | 585 | |
(1) Excludes future commitments under short-term lease agreements of $0.6 million as of June 30, 2020.
As of June 30, 2020, we have entered into one additional operating lease for a design centers from its independent retailerscenter relocation, which has not yet commenced and is therefore not part of the table above nor included in arms length transactions. There were no material acquisitions completedthe lease right-of-use assets and liabilities. The lease will commence when we obtain possession of the underlying leased asset which is expected to be during the threefirst half of fiscal 2021. The lease is for a period of ten years ended and has aggregate undiscounted future rent payments of $3.2 million.
At June 30, 2018, 20172020, we did not have any financing leases that had not commenced.
ETHAN ALLEN INTERIORS INC. AND SUBSIDIARIES
Other information for our leases is as follows (in thousands):
| | | Twelve months ended June 30, 2020 | |
Cash paid for amounts included in the measurement of lease liabilities | | | | |
Operating cash flows from operating leases | | $ | 34,765 | |
Operating cash flows from financing leases | | $ | 568 | |
Operating lease assets obtained in exchange for new operating lease liabilities | | $ | 18,218 | |
At the beginning of fiscal 2020, we adopted ASU 2016-02, and 2016, respectively.as required, the following disclosure is provided for periods prior to adoption. As of June 30, 2019, future minimum payments under non-cancelable leases were as follows (in thousands):
Fiscal Year | | Operating Leases | | | Financing Leases (1) | |
2020 | | $ | 33,761 | | | $ | 550 | |
2021 | | | 30,534 | | | | 437 | |
2022 | | | 26,443 | | | | 60 | |
2023 | | | 20,276 | | | | 19 | |
2024 | | | 15,345 | | | | - | |
Thereafter | | | 43,500 | | | | - | |
Total | | $ | 169,859 | | | $ | 1,066 | |
(1) | As of June 30, 2019, our capital lease obligations were $1.1 million of which the current and long-term portions were included within Short-term debt and Long-term debt, respectively, in the consolidated balance sheet. Monthly minimum lease payments were accounted for as principal and interest payments. |
Inventories at June 30, 2020 and 2019 are summarized as follows (in thousands):
| | | 2018 | | | 2017 | | | 2020 | | | 2019 | |
| | | | | | | | | | | | | | | | | |
Finished goods | | $ | 124,640 | | | $ | 117,388 | | | $ | 97,718 | | | $ | 128,047 | |
Work in process | | | 12,057 | | | | 10,638 | | | | 9,589 | | | | 9,185 | |
Raw materials | | | 27,947 | | | | 26,269 | | | | 21,343 | | | | 26,661 | |
Valuation allowance | | | (1,632 | ) | | | (4,812 | ) | |
Inventories | | $ | 163,012 | | | $ | 149,483 | | |
Inventory reserve | | | | (2,549 | ) | | | (1,504 | ) |
Inventories, net | | | $ | 126,101 | | | $ | 162,389 | |
(4)(8)
| Property, Plant and Equipment |
Property, plant and equipment at June 30, 2020 and 2019 are summarized as follows (in thousands):
| | | 2018 | | | 2017 | | | 2020 | | | 2019 | |
| | | | | | | | | | | | | | | | | |
Land and improvements | | $ | 82,899 | | | $ | 79,200 | | | $ | 83,081 | | | $ | 83,343 | |
Building and improvements | | | 404,522 | | | | 400,246 | | | | 361,324 | | | | 384,641 | |
Machinery and equipment | | | 123,606 | | | | 125,773 | | | | 122,157 | | | | 123,396 | |
Property, plant and equipment, gross | | | 611,027 | | | | 605,219 | | | | 566,562 | | | | 591,380 | |
Less: accumulated depreciation and amortization | | | (343,124 | ) | | | (335,021 | ) | | | (329,884 | ) | | | (346,134 | ) |
Property, plant and equipment, net | | $ | 267,903 | | | $ | 270,198 | | | $ | 236,678 | | | $ | 245,246 | |
We recorded depreciation expense of $16.9 million, $19.5 million and $19.8 million in fiscal 2020, fiscal 2019 and fiscal 2018, respectively.
ETHAN ALLEN INTERIORS INC. AND SUBSIDIARIES
(5)(9)
| Goodwill and Other Intangible Assets |
Our goodwill and intangible assets are comprised of goodwill, which represents the excess of cost over the fair value of net assets acquired, and our Ethan Allen trade name and related trademarks. Both goodwill and indefinite-lived intangible assets are not amortized as they are estimated to have an indefinite life. At both June 30, 2018 2020 and 2017,2019, we had $25.4$25.4 million of goodwill and $19.7$19.7 million of other indefinite-lived intangible assets, consisting of Ethan Allen trade names, all of which is in our wholesale segment.
InWe test our wholesale goodwill and indefinite-lived intangibles for impairment on an annual basis in the fourth quarter of each fiscal year, and more frequently if events or changes in circumstances indicate that it might be impaired. Due to the economic conditions during the third quarter of fiscal years 2018,2017,2020 as a result of the COVID-19 pandemic, we determined that an impairment triggering event occurred, which required an interim quantitative impairment assessment of goodwill and 2016,intangible assets. Based on the CompanyCompany’s interim quantitative assessment performed qualitative assessmentsas of March 31, 2020, the fair value of the wholesale reporting unit exceeded our related carrying value by approximately 25%, thus no impairment of goodwill. We also performed our annual qualitative goodwill impairment test during the fourth quarter of fiscal 2020, consistent with the timing of previous years, and concluded ittheir remained no impairment.
The fair value of our trade name, which is more likelythe Company’s only indefinite-lived intangible asset other than notgoodwill, was also reviewed as of March 31, 2020 for impairment. We performed the interim trade name impairment test and concluded that its fair value substantially exceeded the carrying value as of March 31, 2020, thus no impairment. We also performed our annual trade name impairment test during the fourth quarter of fiscal 2020, consistent with the timing of previous years, and concluded that there was no impairment.
If the market valuation of our common shares or operating results within the wholesale reporting unit significantly decline beyond current levels, we may again need to conduct an evaluation of the fair value of itsour goodwill exceeded its carrying value. The fair value of theand trade name, exceeded its carrying value by a substantial margin in fiscal years 2018,2017 and 2016. To calculate fair value of these assets, management relies on estimates and assumptions which by their nature have varying degrees of uncertainty. Management therefore looks for third party transactions to provide the best possible support for the assumptions incorporated. Management considers several factors to be significant when estimating fair value including expected financial outlook of the business, changes in the Company’s stock price, the impact of changing market conditions on financial performance and expected future cash flows, and other factors. Deterioration in any of these factors may result in a lower fair value assessment, which could lead toan impairment of the long-lived assets and goodwill of the Company.charge.
(10) | Restructuring and Impairment Activities |
Summary of Restructuring, Impairments and Other related charges (gains)
Restructuring, impairment and other related costs incurred during fiscal 2020 and 2019 were as follows (in thousands):
| | | Fiscal 2020 | | | Fiscal 2019 | |
Optimization of manufacturing and logistics | | $ | 829 | | | $ | 6,330 | |
Gain on sale of Passaic property | | | (11,497 | ) | | | - | |
Impairment of long-lived assets (retail) | | | 5,171 | | | | 9,913 | |
Lease exit costs (remaining lease obligations) | | | 2,372 | | | | 2,662 | |
Other charges (income) | | | 106 | | | | (241 | ) |
Total Restructuring and other impairment charges, net of gains | | $ | (3,019 | ) | | $ | 18,664 | |
| | | | | | | | | |
Manufacturing overhead costs(1) | | | 1,319 | | | | 866 | |
Inventory write-downs(1) | | | 4,107 | | | | 1,128 | |
Total | | $ | 2,407 | | | $ | 20,658 | |
(1) | Manufacturing overhead costs and inventory write-downs are reported within Cost of Sales in the consolidated statements of comprehensive income. |
ETHAN ALLEN INTERIORS INC. AND SUBSIDIARIES
Restructuring and Other Related Charges Rollforward
The Company’s restructuring activity is summarized in the table below (in thousands):
| | | | | | Fiscal 2020 Activity | | | | |
Optimization of Manufacturing and Logistics | | Balance June 30, 2019 | | | New Charges (Income) | | | Non-Cash | | | (Payments) Receipts | | | Balance June 30, 2020 | |
Employee severance, other payroll and benefit costs | | $ | 1,714 | | | $ | 777 | | | $ | 23 | | | $ | (2,468 | ) | | $ | - | |
Manufacturing overhead costs | | | - | | | | 1,319 | | | | - | | | | (1,319 | ) | | | - | |
Sale of Passic property | | | - | | | | (11,497 | ) | | | 245 | | | | 11,742 | | | | - | |
Sale of other property, plant and equipment | | | - | | | | (675 | ) | | | - | | | | 675 | | | | - | |
Other exit costs | | | - | | | | 727 | | | | (522 | ) | | | (1,249 | ) | | | - | |
Sub-total | | | 1,714 | | | | (9,349 | ) | | | (254 | ) | | | 7,381 | | | | - | |
| | | | | | | | | | | | | | | | | | | | | |
Retail Design Center Impairment | | | | | | | | | | | | | | | | | | | | |
Impairment of long-lived assets | | | - | | | | 5,171 | | | | 5,171 | | | | - | | | | - | |
| | | | | | | | | | | | | | | | | | | | | |
Other Restructuring and Impairment Charges | | | | | | | | | | | | | | | | | | | | |
Inventory write-downs | | | - | | | | 4,107 | | | | 4,107 | | | | - | | | | - | |
Lease exit costs (remaining lease rentals) | | | 3,145 | | | | 2,372 | | | | 1,847 | | | | (3,760 | ) | | | (90 | ) (1) |
Other charges (income) | | | 224 | | | | 106 | | | | - | | | | (271 | ) | | | 59 | (2) |
Sub-total | | | 3,369 | | | | 6,585 | | | | 5,954 | | | | (4,031 | ) | | | (31 | ) |
| | | | | | | | | | | | | | | | | | | | | |
Total Restructuring and other impairment activities | | $ | 5,083 | | | $ | 2,407 | | | $ | 10,871 | | | $ | 3,350 | | | $ | (31 | ) |
(1) | The previously recorded vacant space liability as of June 30, 2019 was reclassified from Accounts payable and accrued expenses and Other long-term liabilities to Operating lease right-of-use assets upon the adoption of ASU 2016-02, which requires all right-of-use assets to be measured net of any Topic 420 lease liabilities. The remaining balance as of June 30, 2020 represents a refundable escrow deposit paid in connection with a lease exit and is recorded within Prepaid expenses and other current assets. |
(2) | The remaining balance from the other charges (income) as of June 30, 2020 is recorded within Accounts payable and accrued expenses and is expected to be paid out during the first half of fiscal 2021. |
Optimization of Manufacturing and Logistics
During the fourth quarter of fiscal 2019, we initiated restructuring plans to consolidate our manufacturing and logistics operations as part of an overall strategy to maximize production efficiencies and maintain our competitive advantage. As of June 30, 2019, we permanently ceased operations at our Passaic, New Jersey property and ceased using most of our Old Fort, North Carolina case goods manufacturing operations, which we transferred to our other existing case goods operations.
We completed this optimization project in fiscal 2020 as we converted the Old Fort facility into a distribution center and expanded our existing Maiden, North Carolina manufacturing campus while finalizing severance and other exit costs. In connection with these initiatives, we recorded pre-tax restructuring and other exit charges totaling $2.1 million, consisting of $1.3 million in abnormal manufacturing variances associated with the Passaic and Old Fort facilities, $0.8 million in employee severance and other payroll and benefit costs and $0.7 million in other exit costs partially offset by $0.7 million in gains from the sale of property, plant and equipment held at our Old Fort facility. The abnormal manufacturing overhead variances of $1.3 million were recorded within Cost of Sales with the remaining recorded within the line item Restructuring and other impairment charges, net of gains in the consolidated statements of comprehensive income.
As part of our optimization plans, we also completed the sale of our Passaic property in September 2019 to an independent third party and received $12.4 million in cash less certain adjustments, including $0.9 million in selling and other closing costs. As a result of the sale, the Company recognized a pre-tax gain of $11.5 million in the first quarter of fiscal 2020, which was recorded within the line item Restructuring and other impairment charges, net of gains in the consolidated statements of comprehensive income.
As these optimization plans were initiated in the prior year, we recorded fiscal 2019 pre-tax restructuring, impairment, and other related charges totaling $8.3 million, consisting of $3.1 million in impairments of long-lived assets, $2.8 million in employee severance and other payroll and benefit costs, $2.0 million in inventory write-downs and manufacturing variances and $0.4 million of other associated costs, including freight and relocation expenses. The inventory write-downs and abnormal manufacturing overhead variances of $2.0 million were recorded within Cost of Sales with the remaining $6.3 million recorded within the line item Restructuring and other impairment charges, net of gains in the consolidated statement of comprehensive income.
ETHAN ALLEN INTERIORS INC. AND SUBSIDIARIES
Retail Design Center Long-Lived Assets Impairment
We recorded a non-cash impairment charge of $5.2 million during fiscal 2020 related to the impairment of long-lived assets held at certain retail design center locations. Of this total, we recorded $4.8 million during the fourth quarter of fiscal 2020 due to retail segment operating losses driven by the negative economic impacts from COVID-19 and softened customer demand. The asset group used in the impairment analysis, which represented the lowest level for which identifiable cash flows were available and largely independent of the cash flows of other groups of assets, was the individual retail design center. We estimated future cash flows based on design center-level historical results, current trends, and operating and cash flow projections. The fiscal 2020 impairment charge of $5.2 million was recorded in the consolidated statement of comprehensive income within the line item Restructuring and other impairment charges, net of gains.
In the year ago fourth quarter, we recorded a non-cash impairment charge of $9.9 million related to the impairment of long-lived assets held at certain retail design center locations. Due to the fiscal 2019 organizational realignment, we identified this as a triggering event requiring assessment of recoverability. The asset group used in the impairment analysis was the individual retail design center. The impairment charge of $9.9 million was recorded in the consolidated statement of comprehensive income within the line item Restructuring and other impairment charges, net of gains.
Inventory Write-downs
During fiscal 2020 we recorded a non-cash charge of $4.1 million related to the write-down and disposal of certain slow moving and discontinued inventory items, which was due to actual demand and forecasted market conditions for these inventory items being less favorable than originally estimated. Of the total inventory write-down, $3.5 million related to slow moving finished goods with the remaining $0.6 million consisting of raw materials that were disposed. The non-cash inventory write-down was recorded in the consolidated statement of comprehensive income within the line item Cost of Sales.
Lease Exit Costs
During fiscal 2020 we recorded $2.4 million of restructuring charges within our retail segment related to the remaining contractual obligations under leased retail space that we exited during our fiscal fourth quarter. During April 2020, we entered into an amendment to an existing rental lease, whereby we would return the space back to the landlord effective May 31, 2020 in lieu of termination payments totaling $3.4 million. Partially offsetting these cash payments was a non-cash credit of $1.0 million due to the write-off of the related lease liability, net of the ROU asset. The net pre-tax charge of $2.4 million was recorded in the consolidated statement of comprehensive income within the line item Restructuring and other impairment charges, net of gains.
During fiscal 2019 we recorded $2.7 million of charges primarily related to remaining contractual obligations under leased retail design center space for which we ceased using as of June 30, 2019. The amount of the charge was equal to all costs that will continue to be incurred under our lease for its remaining term without economic benefit and measured at fair value when we ceased using the right conveyed by the contract. The pre-tax charge was recorded in the consolidated statement of comprehensive income within the line item Restructuring and other impairment charges, net of gains.
Total debt obligations at June 30, 2020 and 2019 consist of the following (in thousands):
| | | 2018 | | | 2017 | |
| | | | | | | | | |
Term Loan due 10/21/2019 | | $ | - | | | $ | 13,833 | |
Capital leases | | | 1,680 | | | | 1,085 | |
Total debt obligations | | | 1,680 | | | | 14,918 | |
Unamortized debt issuance costs | | | - | | | | (579 | ) |
Total debt | | | 1,680 | | | | 14,339 | |
Less current maturities | | | 584 | | | | 2,731 | |
Total long-term | | $ | 1,096 | | | $ | 11,608 | |
| | | 2020 | | | 2019 | |
Borrowings under revolving credit facility | | $ | 50,000 | | | $ | - | |
Capital leases(1) | | | - | | | | 1,066 | |
Total debt | | | 50,000 | | | | 1,066 | |
Less current maturities | | | - | | | | 550 | |
Total long-term debt | | $ | 50,000 | | | $ | 516 | |
| (1) | Capital leases were previously reported as debt as of June 30, 2019. Upon the adoption of the new leasing standard, the Company reclassified its capital lease obligations from short and long-term debt to other current liabilities and other long-term liabilities, respectively. Refer to Note 6 for further details regarding capital lease obligations. |
Credit Agreement
TheOn December 21, 2018, the Company and most of its domestic subsidiaries (the “Loan Parties”) entered into a five year, $150Second Amended and Restated Credit Agreement (the “Credit Agreement”) with JPMorgan Chase Bank, N.A. as administrative agent and syndication agent and Capital One, National Association, as documentation agent. The Credit Agreement provides for a $165 million senior secured revolving credit and term loan facility on October 21, 2014, as amended (the “Facility”). The Company intends to use the Facility for working capital and general corporate purposes, including dividend payments and share repurchases. The Facility, which expires on October 21, 2019, provided a term loan of up to $35 million and a revolving credit line of up to $115 million,, subject to borrowing base availability.availability, with the maturity date of December 21, 2023. We incurred financing costs of $1.5$0.6 million, under the Facility, which are being amortized by the interest method, over the remaining life of the Facility.Facility using the effective interest method.
ETHAN ALLEN INTERIORS INC. AND SUBSIDIARIES
At the Company’s option, revolving loans under the Facility bear interest, based on the average availability, at an annual rate of either (a) the London Interbank Offered rate (“LIBOR”) plus 1.5% to 1.75%2.0%, or (b) the higher of (i) the prime rate, (ii) the federal funds effective rate plus 0.50%0.5%, or (iii) LIBOR plus 1.0% plus in each case 0.5% to 0.75%1.0%.
The Company pays a commitment feeavailability of 0.15% to 0.25% per annum oncredit at any given time under the unused portionFacility will be constrained by the terms and conditions of the Facility, including the amount of collateral available, a borrowing base formula based upon numerous factors, including the value of eligible inventory and feeseligible accounts receivable, and other restrictions contained in the Facility. All obligations under the Facility are secured by assets of the Loan Parties, including inventory, receivables and certain types of intellectual property.
Borrowings under the Facility
On March 23, 2020, we provided notice to the administrative agent under the Credit Agreement to borrow a principal amount of $80 million under the Facility. Subsequently, on issued lettersMarch 30, 2020, we borrowed an additional $20 million, bringing our aggregate borrowings to $100 million under the Facility as of credit at an annualMarch 31, 2020. We subsequently repaid $50.0 million during our fiscal fourth quarter using available cash on hand, leaving $50.0 million of outstanding borrowings on our balance sheet as of June 30, 2020. The borrowings bear a weighted average interest rate of 1.5%1.7%, which is equal to 1.75% basedthe one-month LIBOR rate plus a spread using a debt leverage pricing grid. Interest on the average availability. Certain paymentsborrowings outstanding is payable monthly in arrears and the principal balance is payable on the maturity date of December 21, 2023. The outstanding borrowings of $50 million are restricted ifreported as Long-term debt within the availabilityconsolidated balance sheet at June 30, 2020. For the twelve months ended June 30, 2020 and 2019, we recorded interest expense of $0.5 million, respectively, on our outstanding debt.
The fair value of our long-term debt was $50 million as of June 30, 2020, which we believe approximates the carrying amount as the terms and interest rate approximate market rates given its floating interest rate basis.
Covenants and Other Ratios
The Facility contains various restrictive and affirmative covenants, including required financial reporting, limitations on the ability to grant liens, make loans or other investments, incur additional debt, issue additional equity, merge or consolidate with or into another person, sell assets, pay dividends or make other distributions or enter into transactions with affiliates, along with other restrictions and limitations similar to those frequently found in credit agreements of this type and size. Loans under the revolving credit line falls below 20%Facility may become immediately due and payable upon certain events of default (including failure to comply with covenants, change of control or cross-defaults) as set forth in the total revolving credit line, and the Company is subject to pro forma compliance with theFacility.
The Facility does not contain any significant financial ratio covenants or coverage ratio covenants other than a fixed charge coverage ratio if applicable.
In fiscal 2018 the Company repaid the remaining balance of $13.8 millioncovenant based on the term loan with excess operating cash. In fiscal 2017 we repaid $25.0 millionratio of the revolving credit facility with excess operating cash.
The Facility is secured by all property owned, leased or operated by the Company(a) EBITDA, plus cash Rentals, minus Unfinanced Capital Expenditures to (b) Fixed Charges, as such terms are defined in the United StatesFacility (the “FCCR Covenant”). The FCCR Covenant only applies in certain limited circumstances, including when the unused availability under the Facility falls below $18.5 million. The FCCR Covenant ratio is set at 1.0 and includes certain real property owned by the Company and contains customary covenants which may limit the Company’s ability to incur debt; engage in mergers and consolidations; make restricted payments (including dividends and share repurchases); sell certain assets; and make investments.
The Facility includesmeasured on a covenant that requires the Company to maintain a minimum fixed charge coverage ratio of 1.1 to 1.0 at all times unless the outstanding term loans are less than $17.5 million and the fixed charge coverage ratio equals or exceeds 1.25 to 1.0, in which case the fixed charge coverage ratio ceases to apply and thereafter is only triggered if average monthly availability is less than 15% of the amount of the revolving credit line. The Company has met the exemption conditions and is currently exempt from the fixed charge coverage ratio covenant.trailing twelve-month basis.
At June 30, 2018 2020 and June 30, 2017, 2019, there was $6.2$5.8 million and $0.1$6.1 million, respectively, of standby letters of credit outstanding under the Facility. In fiscal 2018 we issued a $5.9 million letter of credit for our workmen’s compensation obligation in lieu of restricted cash, resulting in reclassification of this restricted cash to cash and cash equivalents. Total borrowing base availability under the Facility was $108.8$58.9 million at June 30, 2018 2020 and $114.9$158.9 million at June 30, 2017.
2019. At both June 30, 2018 2020 and June 30, 2017, 2019, we were in compliance with all the covenants under the Facility.
(12) | Other Long-term Liabilities |
The following table summarizes the nature of the amounts within Other long-term liabilities at June 30, 2020 and 2019 (in thousands):
| | | 2020 | | | 2019 | |
| | | | | | | | | |
Deferred rent | | $ | - | | | $ | 16,873 | |
Unrecognized tax benefits | | | 1,487 | | | | 1,616 | |
Accrued lease exit costs | | | - | | | | 2,089 | |
Other long-term liabilities | | | 1,075 | | | | 1,433 | |
Other long-term liabilities | | $ | 2,562 | | | $ | 22,011 | |
ETHAN ALLEN INTERIORS INC. AND SUBSIDIARIES
Income tax expense consists of the following components for the fiscal years ended June 30 (in thousands):
| | | 2020 | | | 2019 | | | 2018 | |
Current: | | | | | | | | | | | | |
Federal | | $ | 2,432 | | | $ | 10,132 | | | $ | 10,289 | |
State | | | 8 | | | | 1,237 | | | | 1,689 | |
Foreign | | | 325 | | | | 304 | | | | 824 | |
Total current | | | 2,765 | | | | 11,673 | | | | 12,802 | |
Deferred: | | | | | | | | | | | | |
Federal | | | 181 | | | | (3,091 | ) | | | 174 | |
State | | | 2,368 | | | | (381 | ) | | | (124 | ) |
Foreign | | | (25 | ) | | | (39 | ) | | | (156 | ) |
Total deferred | | | 2,524 | | | | (3,511 | ) | | | (106 | ) |
Total Income tax expense | | $ | 5,289 | | | $ | 8,162 | | | $ | 12,696 | |
The following is a reconciliation of our effective tax rate to the U.S. federal income tax rate for the fiscal years ended June 30 (in thousands):
| | | 2020 | | | 2019 | | | 2018 | |
| | | | | | | | | | | | | | | | | | | | | | | | | |
Expected income tax expense at U.S. federal income tax rate | | $ | 2,980 | | | | 21.0 | % | | $ | 7,111 | | | | 21.0 | % | | $ | 13,739 | | | | 28.0 | % |
Increase (reduction) in income taxes resulting from: | | | | | | | | | | | | | | | | | | | | | | | | |
State income taxes, net of federal benefit | | | 159 | | | | 1.1 | % | | | 737 | | | | 2.2 | % | | | 1,263 | | | | 2.6 | % |
Change in valuation allowance | | | 2,534 | | | | 17.9 | % | | | 602 | | | | 1.8 | % | | | 42 | | | | 0.1 | % |
Remeasurement of deferred taxes for changes in statutory U.S. tax rate | | | - | | | | 0.0 | % | | | - | | | | 0.0 | % | | | (2,651 | ) | | | -5.4 | % |
Section 199 Qualified Production Activities deduction | | | - | | | | 0.0 | % | | | - | | | | 0.0 | % | | | (678 | ) | | | -1.4 | % |
Section 250 Foreign Derived Intangible Income deduction | | | - | | | | 0.0 | % | | | (161 | ) | | | -0.5 | % | | | - | | | | 0.0 | % |
Unrecognized tax benefits | | | (215 | ) | | | -1.5 | % | | | 26 | | | | 0.1 | % | | | 55 | | | | 0.1 | % |
Stock-based compensation - forfeitures and exercises | | | 17 | | | | 0.1 | % | | | 184 | | | | 0.5 | % | | | 570 | | | | 1.2 | % |
Other, net | | | (186 | ) | | | -1.3 | % | | | (337 | ) | | | -1.0 | % | | | 356 | | | | 0.7 | % |
Actual income tax expense (and corresponding effective tax rate) | | $ | 5,289 | | | | 37.3 | % | | $ | 8,162 | | | | 24.1 | % | | $ | 12,696 | | | | 25.9 | % |
The significant components of deferred tax assets recorded within the consolidated balance sheet were as follows at June 30 (in thousands):
| | | 2020 | | | 2019 | |
Deferred tax assets: | | | | | | | | |
Leases | | $ | 32,184 | | | $ | - | |
Employee compensation accruals | | | 2,259 | | | | 2,697 | |
Stock-based compensation | | | 670 | | | | 715 | |
Deferred rent | | | - | | | | 4,184 | |
Net operating loss carryforwards | | | 2,002 | | | | 4,259 | |
Property, plant and equipment | | | 1,020 | | | | 1,021 | |
Other | | | 2,825 | | | | 2,341 | |
Subtotal deferred tax assets | | | 40,960 | | | | 15,217 | |
Less: Valuation allowance | | | (3,158 | ) | | | (3,197 | ) |
Total deferred tax assets | | $ | 37,802 | | | $ | 12,020 | |
The significant components of deferred tax liabilities recorded within the consolidated balance sheet were as follows at June 30 (in thousands):
| | | 2020 | | | 2019 | |
Operating lease right-of-use assets | | $ | 27,334 | | | $ | - | |
Intangible assets other than goodwill | | | 9,080 | | | | 9,007 | |
Commissions | | | 2,207 | | | | 1,974 | |
Other | | | 118 | | | | - | |
Total deferred tax liabilities | | $ | 38,739 | | | $ | 10,981 | |
ETHAN ALLEN INTERIORS INC. AND SUBSIDIARIES
Deferred tax balances are classified in the consolidated balance sheets as follows at June 30 (in thousands):
| | | 2020 | | | 2019 | |
Other assets | | $ | 137 | | | $ | 2,108 | |
Other non-current liabilities | | | 1,074 | | | | 1,069 | |
Total net deferred tax asset (liability) | | $ | (937 | ) | | $ | 1,039 | |
We evaluate our deferred taxes to determine if the “more likely than not” standard of evidence has not been met thereby supporting the need for a valuation allowance. The evaluation of the amount of net deferred tax assets expected to be realized necessarily involves forecasting the amount of taxable income that will be generated in future years. We have forecasted future results using estimates management believes to be reasonable. Our forecasts are based on our best estimate of expected trends resulting from certain leading economic indicators. The realization of deferred income tax assets is dependent on future events. Actual results inevitably will vary from management's forecasts which may be impacted by the ongoing COVID-19 pandemic, possibly resulting in a sustained economic downturn, or significantly extended economic recovery. Such variances could result in adjustments to the valuation allowance on deferred tax assets in future periods, and such adjustments could be material to the financial statements. A valuation allowance must be established for deferred tax assets when it is more likely than not that assets will not be realized.
At June 30, 2020, a valuation allowance of $3.2 million was in place against the retail segment's U.S. state and local and Canadian tax assets. At June 30, 2019, such an allowance was in place against the Belgian and Canadian foreign tax assets and totaled $3.2 million. With the liquidation of the Belgian subsidiary during fiscal 2020, the valuation allowance of $2.6 million was removed in the fourth quarter of fiscal 2020. During fiscal 2020, we recorded a $2.5 million valuation allowance on our U.S. retail segment’s state and local deferred tax assets that are now not considered more likely than not to be realized.
The weighted-average interest rate applicable under our outstanding debt obligations for each of the last three fiscal years were as follows:
| | | Fiscal Year Ended June 30, | |
| | | 2018 | | | 2017 | | | 2016 | |
Weighted-average interest rate | | | 3.3 | % | | | 2.4 | % | | | 2.0 | % |
Aggregate scheduled maturities of our debt obligations for each of the five fiscal years subsequent to deferred tax assets at June 30, 2018, 2020 associated with net operating loss carryforwards and thereafterthe related expiration dates are as follows (in thousands):
Fiscal Year Ended June 30 | | | | |
2019 | | | 584 | |
2020 | | | 557 | |
2021 | | | 444 | |
2022 | | | 67 | |
2023 | | | 28 | |
Subsequent to 2023 | | | - | |
Total scheduled debt payments | | $ | 1,680 | |
| | | Deferred | | | Net Operating Loss | |
| | | Tax Assets | | | Carryforwards | |
Various U.S. state net operating losses, expiring between 2025 and 2040 | | $ | 1,383 | | | $ | 25,501 | |
Foreign capital losses, expiring between 2034 and 2040 | | $ | 619 | | | $ | 2,335 | |
(7)
Deferred federal income taxes were previously not provided for unremitted foreign earnings of our foreign subsidiaries because we expected those earnings to be indefinitely reinvested. As part of the Tax Act, the Company reported the Deemed Repatriation Transition Tax (the “Transition Tax”) on previously untaxed accumulated earnings and profits (“E&P”) of certain of our foreign subsidiaries. To determine the amount of the Transition Tax, we determined, in addition to other factors, the amount of post- 1986 E&P of the relevant subsidiaries, as well as the amount of non-U.S. income taxes paid on such earnings. We reported a Transition Tax obligation of $0.1 million during fiscal 2018. On December 22, 2017, the Tax Act was enacted. Among the significant changes to the United States Internal Revenue Code, the Tax Act lowered the United States federal corporate income tax rate (“Federal Tax Rate”) from 35% to 21% effective January 1, 2018, introduced a limitation on the deduction of certain interest expenses, introduced a deduction for certain business capital expenditures and introduced a system of taxing foreign-sourced income from multinational corporations. The Company computed its income tax expense for the 2018 fiscal year using a blended Federal Tax Rate of 28%. The 21% Federal Tax Rate applies to fiscal years ending June 30, 2019 and each year thereafter. The Company re-measured its net deferred tax assets and liabilities using the Federal Tax Rate that would apply when these amounts were expected to reverse. At June 30, 2018, the Company’s re-measurement of its deferred tax assets and liabilities resulted in a discrete tax benefit $2.7 million, which lowered the effective tax rate by 5.4% for that fiscal year. Uncertain Tax Positions | Leases
|
We lease real propertyrecognize interest and equipment under various operating lease agreements expiring at various times through 2039. Leases covering retail design center locationspenalties related to income tax matters as a component of income tax expense. If the $1.9 million of unrecognized tax benefits and equipment may require, in additionrelated interest and penalties as of June 30, 2020 were recognized, approximately $1.5 million would be recorded as a benefit to stated minimums, contingent rentals based on retail sales or equipment usage. Generally, the leases provide for renewal for various periods at stipulated rates. Future minimum lease payments under non-cancelable operating leases for eachincome tax expense.
ETHAN ALLEN INTERIORS INC. AND SUBSIDIARIES
A reconciliation of the five fiscal years subsequent to beginning and ending amount of unrecognized tax benefits including related interest and penalties as of June 30, 2018, 2020 and thereafter are shown in the table below. Also shown are minimum future rentals from subleases, which will partially offset lease payments in the aggregate (in thousands):
| | | Future Minimum | | | Future Minimum | |
Fiscal Year Ended June 30, | | Lease Payments | | | Sublease Rentals | |
2019 | | $ | 34,391 | | | $ | 2,313 | |
2020 | | | 29,231 | | | $ | 1,800 | |
2021 | | | 26,120 | | | | 1,611 | |
2022 | | | 22,332 | | | | 1,505 | |
2023 | | | 16,866 | | | | 1,077 | |
Subsequent to 2023 | | | 47,046 | | | | 1,124 | |
Total | | $ | 175,986 | | | $ | 9,430 | |
Total rent expense for each of the past three fiscal years ended June 30 was2019 is as follows (in thousands):
| | | 2018 | | | 2017 | | | 2016 | |
Basic rentals under operating leases | | $ | 33,734 | | | $ | 33,033 | | | $ | 31,692 | |
Contingent rentals under operating leases | | | 133 | | | | 142 | | | | 180 | |
Basic and contingent rentals | | | 33,867 | | | | 33,175 | | | | 31,872 | |
Less: sublease rent | | | (1,853 | ) | | | (1,824 | ) | | | (1,964 | ) |
Total rent expense | | $ | 32,014 | | | $ | 31,351 | | | $ | 29,908 | |
| | | 2020 | | | 2019 | |
Beginning balance | | $ | 2,209 | | | $ | 2,187 | |
Additions for tax positions taken during the current year | | | 214 | | | | 329 | |
Additions for tax positions taken during the prior year | | | 126 | | | | 143 | |
Reductions for tax positions taken during the prior year | | | - | | | | - | |
Decreases related to settlements with taxing authorities | | | - | | | | - | |
Reductions resulting from a lapse of the applicable statute of limitations | | | (616 | ) | | | (450 | ) |
Ending balance | | $ | 1,933 | | | $ | 2,209 | |
ETHAN ALLEN INTERIORS INC. AND SUBSIDIARIESIt is reasonably possible that various issues relating to approximately $0.4 million of the total gross unrecognized tax benefits as of June 30, 2020 will be resolved within the next twelve months as exams are completed or statutes expire. If recognized, approximately $0.4 million of unrecognized tax benefits would reduce our tax expense in the period realized.
Deferred rent creditsThe Company conducts business globally and, deferred lease incentives are reflectedas a result, the Company orone or more of its subsidiaries files income tax returns in the Consolidated Balance SheetsUnited States, various state, and foreign jurisdictions. In the normal course of business, the Company is subject to examination by the taxing authorities in such major jurisdictions as the United States, Canada, Mexico and Honduras. As of June 30, 2020, the Company and certain subsidiaries are currently under audit from 2016 through 2018 in the caption other long-term liabilities,United States. While the amount of uncertain tax benefits with respect to the entities and are amortized overyears under audit may change within the respective underlying lease terms on a straight-line basis as a reductionnexttwelve months, it isnot anticipated that any of rent expense. Amounts recorded are as follows:the changes will be significant.
| | | June 30, | |
| | | 2018 | | | 2017 | |
Deferred rent credits | | $ | 13,157 | | | $ | 13,876 | |
Deferred lease incentives | | $ | 4,532 | | | $ | 5,238 | |
(8)(14)
| Shareholders'Shareholders’ Equity
|
Shares Authorized for Issuance
Our authorized capital stock consists of 150,000,000 shares of Common Stock,common stock, par value $.01$0.01 per share, and 1,055,000 shares of Preferred Stock, par value $.01$0.01 per share. The Board of Directors may provide for the issuance of all or any shares of Preferred Stock in one or more classes or series, and to fix for each such class or series such voting powers, full or limited, or no voting powers, and such distinctive designations, preferences and relative, participating, optional or other special rights and such qualifications, limitations or restrictions thereof, as shall be stated and expressed in the resolution or resolutions adopted by the Board of Directors providing for the issuance of such class or series and as may be permitted by the General Corporation Law of the State of Delaware. As of June 30, 2018 2020 and 2017,2019, there were no shares of Preferred Stock issued or outstanding.
Share Repurchase Program
On November 21, 2002, ourJanuary 13, 2020, the Company’s Board of Directors approved aauthorized an increase in the aggregate share repurchase authorization under the Company’s existing multi-year share repurchase program authorizing us(the “Share Repurchase Program”) to repurchase up to 2.0 million shares of our common stock, from time to time, either directly or through agents, in the open market at prices and on terms satisfactory to us. After that date, the Board of Directors increased the aggregate authorization under the repurchase program on several separate occasions, the last of which was on April 24, 2018 when the Board of Directors increased the aggregate authorization to approximately 3.0 million3,000,000 shares. There is no expiration date on the repurchase authorization and the amount and timing of futureauthorization.
We repurchased 1,538,363 shares for $24.3 million during fiscal 2020. There were no share repurchases if any, will be determined as market and business conditions warrant.during fiscal 2019. As of June 30, 2018 2020, we had a remaining Board authorization to repurchase 2.5 million shares.2,007,364 shares of our common stock pursuant to our program. The timing and amount of any future share repurchases in the open market and through privately negotiated transactions will be determined by the Company’s officers at their discretion and based on a number of factors, including an evaluation of market and economic conditions. The Share Repurchase Program was temporarily halted on April 1, 2020 as part of the Company’s action plan in response to COVID-19.
During the past three fiscal years, we repurchased the following shares of our common stock (trade date basis): under our existing share repurchase program:
| | | 2018 | | | 2017 | | | 2016 | | | 2020 | | | 2019 | | | 2018 | |
Common shares repurchased | | | 950,484 | | | | 357,363 | | | | 697,799 | | | | 1,538,363 | | | | - | | | | 950,484 | |
Cost to repurchase common shares | | $ | 22,019,381 | | | $ | 10,246,302 | | | $ | 19,346,104 | | | $ | 24,319,044 | | | $ | - | | | $ | 22,019,381 | |
Average price per share | | $ | 23.17 | | | $ | 28.67 | | | $ | 27.72 | | | $ | 15.81 | | | $ | - | | | $ | 23.17 | |
For the fiscal years presented above, we funded our purchases of treasury stock with existing cash on hand and cash generated through current period operations, and our credit facility.operations. All our common stock repurchases are recorded as treasury stock and result in a reduction of shareholders’ equity.
ETHAN ALLEN INTERIORS INC. AND SUBSIDIARIES
Basic and diluted earnings per share (“EPS”) are calculated using the following weighted average share data (in thousands):
| | | Fiscal Year Ended June 30, | |
| | | 2020 | | | 2019 | | | 2018 | |
Weighted average shares outstanding for basic calculation | | | 26,044 | | | | 26,695 | | | | 27,321 | |
Dilutive effect of stock options and other share-based awards | | | 25 | | | | 56 | | | | 304 | |
Weighted average shares outstanding adjusted for dilution calculation | | | 26,069 | | | | 26,751 | | | | 27,625 | |
Dilutive potential common shares consist of stock options, restricted stock units and performance units.
As of June 30, 2020, 2019 and 2018, total share-based awards of 403,106, 231,717 and 195,318, respectively, were excluded from the diluted EPS calculations because their inclusion would have been anti-dilutive.
As of June 30, 2020, 2019 and 2018, the number of performance units excluded from the calculation of diluted EPS was 199,107, 187,882 and 210,836, respectively. Performance units are excluded from the calculation of diluted EPS unless the performance criteria are probable of being achieved as of the balance sheet date.
(9)(16)
| Earnings per Share (in thousands)Accumulated Other Comprehensive Income (Loss)
|
Accumulated other comprehensive income (loss) consists of foreign currency translation adjustments which are the result of changes in foreign currency exchange rates related to our operations in Canada, Honduras, and Mexico. Assets and liabilities are translated into U.S. dollars using the current period-end exchange rate and income and expense amounts are translated using the average exchange rate for the period in which the transaction occurred.
The following table sets forth the calculation of weighted average shares for the fiscal years ended June 30:activity in accumulated other comprehensive loss (in thousands):
| | | 2018 | | | 2017 | | | 2016 | |
Weighted average shares of common stock outstanding for basic calculation | | | 27,321 | | | | 27,679 | | | | 28,072 | |
| | | | | | | | | | | | | |
Effect of dilutive stock options and other share-based awards | | | 304 | | | | 279 | | | | 252 | |
| | | | | | | | | | | | | |
Weighted average shares of common stock outstanding adjusted for dilution calculation | | | 27,625 | | | | 27,958 | | | | 28,324 | |
In 2018,2017 and 2016, stock options and share based awards of 195,379 and 460 respectively, were excluded from earnings per share calculation because their impact is anti-dilutive.
| | | 2020 | | | 2019 | |
Beginning balance at July 1 | | $ | (5,651 | ) | | $ | (6,171 | ) |
Other comprehensive income (loss), net of tax | | (2,854 | ) | | | 444 | |
Less AOCI attributable to noncontrolling interests | | | 64 | | | | 76 | |
Ending balance at June 30 | | $ | (8,441 | ) | | $ | (5,651 | ) |
(10)(17)
| Share-Based Compensation |
For the twelve months ended June 30, 2018, 2017, and 2016,We recognized total share-based compensation expense totaled $1.0of $0.3 million, $1.3$0.1 million, and $2.4$1.0 million in fiscal 2020, 2019 and 2018, respectively. These amounts have been included in the Consolidated Statementsconsolidated statements of Comprehensive Incomecomprehensive income within selling, general and administrative expenses. During the twelve months ended As of June 30, 2018, 2017,2020, $1.0 million of total unrecognized compensation expense related to non-vested equity awards is expected to be recognized over a weighted average period of 2.6 years. There was no stock-based compensation capitalized as of June 30, 2020 and 2016, we recognized related tax benefits associated with our share-based compensation arrangements totaling $0.5 million, $0.5 million and $0.8 million, respectively (before valuation allowances). Such amounts have been included in the Consolidated Statements of Comprehensive Income within income tax expense.
ETHAN ALLEN INTERIORS INC. AND SUBSIDIARIES2019, respectively.
At June 30, 2018, we had 1,447,6392020, there were 1,490,986 shares of common stock available for future issuance pursuant to the 1992Ethan Allen Interiors Inc. Stock OptionIncentive Plan (the “Plan”). The maximumUnder this Plan, the initial aggregate number of shares of common stock reserved for issuance under the Plan is that may be issued through awards of any form was 6,487,867 shares. The Plan provides for the grant of non-compensatory stock options, to eligible employeesrestricted stock and non-employee directors. Stock options under the Plan are non-qualified under section 422 of the Internal Revenue Code and allow for the purchase of shares of our common stock.stock units. The Plan also provides for the issuance of stock appreciation rights ("SARs"(“SARs”) on issued options, however no SARs have been issued to date. The awarding of such options is determinedAll share-based awards are approved by the Compensation Committee of the Board of Directors after consideration of recommendations proposed by the Chief Executive Officer. OptionsStock options are generally granted with an exercise price equal to the market price of our common stock at the date of grant, vest ratably over a specified service period and have a contractual term of 10 years. Equity awards can also include performance vesting conditions. Company policy further requires an additional one year holding period beyond the service vest date for certain executives. Beginning January 31, 2014, grants to employees include both company performance and service vesting conditions (as further described below). Grants to independent directors have a 3-yearthree-year service vesting condition. Following is a description of grants made under the Plan.
ETHAN ALLEN INTERIORS INC. AND SUBSIDIARIES
Stock Option AwardsActivity
A summary of stock option activity during fiscal 2020 is presented below.
| | | | | | | | | | | Weighted | | | | | |
| | | | | | | Weighted | | | Average | | | | | |
| | | | | | | Average | | | Remaining | | | Aggregate | |
| | | | | | | Exercise | | | Contractual | | | Intrinsic Value | |
| | | Options | | | Price | | | Term (yrs) | | | ($ in thousands) | |
Outstanding at June 30, 2019 | | | 378,911 | | | $ | 21.95 | | | | | | | | | |
Granted | | | 59,188 | | | $ | 17.27 | | | | | | | | | |
Exercised | | | (4,500 | ) | | $ | 11.74 | | | | | | | | | |
Canceled (forfeited/expired) | | | (30,493 | ) | | $ | 23.81 | | | | | | | | | |
Outstanding at June 30, 2020 | | | 403,106 | | | $ | 21.24 | | | | 4.4 | | | $ | - | |
Exercisable at June 30, 2020 | | | 320,368 | | | $ | 21.66 | | | | 3.2 | | | $ | - | |
The aggregate intrinsic value of stock options exercised during fiscal 2020, 2019 and 2018 was less than $0.1 million, $0.3 million, and $0.1 million, respectively.
A summary of the nonvested shares as of June 30, 2020 and changes during the fiscal year then ended is presented below.
| | | | | | | Weighted Average | |
| | | Options | | | Exercise Price | |
Nonvested at June 30, 2019 | | | 59,887 | | | $ | 26.84 | |
Granted | | | 59,188 | | | $ | 17.27 | |
Vested | | | (33,339 | ) | | $ | 27.86 | |
Canceled (forfeited) | | | (2,998 | ) | | $ | 26.19 | |
Nonvested at June 30, 2020 | | | 82,738 | | | $ | 19.61 | |
As of June 30, 2020, $0.2 million of total unrecognized compensation expense related to non-vested stock options is expected to be recognized over a weighted average period of 2.2 years.
We estimate, as of the date of grant, the fair value of stock options awarded using the Black-Scholes option pricing model. Use of a valuation model requires management to make certain assumptions with respect to selected model inputs, including anticipated changes in the underlying stock price (i.e. expected volatility) and option exercise activity (i.e. expected life). Expected volatility is based on the historical volatility of our stock. The risk-free rate of return is based on the U.S.United States Treasury bill rate extrapolated to the term matching the expected life of the grant. The dividend yield is based on the annualized dividend rate at the grant date relative to the grant date stock price. The expected life of options granted, which represents the period of time that the options are expected to be outstanding, is based, primarily, on historical data. The weighted average assumptions used for fiscal years ended June 30 are noted in the following table:
| | | 2018 | | | 2017 | | | 2016 | |
Volatility | | | 31.5 | % | | | 36.8 | % | | | 48.1 | % |
Risk-free rate of return | | | 1.76 | % | | | 1.03 | % | | | 1.93 | % |
Dividend yield | | | 2.47 | % | | | 1.96 | % | | | 1.95 | % |
Expected average life (years) | | | 4.6 | | | | 5.0 | | | | 6.3 | |
OptionsStock options granted to employees beginning January 1, 2014 vest provided certain performance and service conditions are met (“Performance Options”). The performance conditions allow the potential vesting in three equal tranches, provided attainment of a minimum annual 5% growth in operating income (as defined in the agreement) for each of the ensuing three fiscal years. If the minimum annual growth is not achieved in any fiscal year, that tranche is forfeited, except that if a cumulative compound growth rate of 5% is achieved at the end of the three fiscal years, performance conditions for all three tranches will have been met. Service conditions require an additional period after performance conditions are met. Consequently, assuming both performance and service conditions are met, shares become exercisable between 3 and 5 years from grant date. At June 30, 2017, 196,000 Performance Options achieved the performance conditions, and consequently will vest ratably in three equal tranches on the grant date anniversary in years three, four and five provided service conditions are also met. The remaining 130,000 Performance Options did not achieve the respective performance conditions so the amortization to date was reversed at June 30, 2017, and the options were cancelled during fiscal 2018. The Performance Options are reflected in2020 were valued using the options tables presented below. All optionsBlack-Scholes option pricing model with the following weighted average assumptions. There were issued at the closing stock price on each grant date, and have a contractual term of 10 years. A summary ofno stock option activity occurringawards granted to employees during the fiscal year ended June 30, 2018 is presented below.2019 and 2018.
| | | | | | | | | | | Weighted | | | | | |
| | | | | | | Weighted | | | Average | | | | | |
| | | | | | | Average | | | Remaining | | | | | |
| | | | | | | Exercise | | | Contractual | | | Aggregate | |
Options | | Shares | | | Price | | | Term (yrs) | | | Intrinsic Value | |
Outstanding - June 30, 2017 | | | 836,020 | | | $ | 24.41 | | | | | | | | | |
Granted | | | 19,482 | | | | 30.80 | | | | | | | | | |
Exercised | | | (9,066 | ) | | | 21.37 | | | | | | | | | |
Canceled (forfeited/expired) | | | (284,841 | ) | | | 30.28 | | | | | | | | | |
Outstanding - June 30, 2018 | | | 561,595 | | | | 21.70 | | | | 3.7 | | | $ | 2,205,554 | |
Exercisable - June 30, 2018 | | | 453,423 | | | $ | 20.25 | | | | 2.9 | | | $ | 2,205,554 | |
| | | 2020 | |
Volatility | | | 30.8 | % |
Risk-free rate of return | | | 1.62 | % |
Dividend yield | | | 4.42 | % |
Expected average life (years) | | | 5.9 | |
Grant date fair value | | $ | 2.85 | |
ETHAN ALLEN INTERIORS INC. AND SUBSIDIARIES
Non-employee (independent) directors were granted stock options during the first quarter of each fiscal year presented and valued using the Black-Scholes option pricing model with the following assumptions:
| | | 2020 | | | 2019 | | | 2018 | |
Volatility | | | 30.8 | % | | | 31.3 | % | | | 31.5 | % |
Risk-free rate of return | | | 1.55 | % | | | 2.80 | % | | | 1.76 | % |
Dividend yield | | | 3.97 | % | | | 3.24 | % | | | 2.47 | % |
Expected average life (years) | | | 5.3 | | | | 5.0 | | | | 4.6 | |
Grant date fair value | | $ | 3.30 | | | $ | 5.30 | | | $ | 6.93 | |
Fair value as a % of exercise price | | | 18.8 | % | | | 22.6 | % | | | 22.5 | % |
Restricted Stock Unit Activity
TheA summary of restricted stock unit activity during fiscal 2020 is presented below.
| | | | | | | Weighted | |
| | | Restricted | | | Average | |
| | | Stock Units | | | Fair Value | |
Outstanding at June 30, 2019 | | | - | | | $ | - | |
Granted | | | 58,000 | | | $ | 9.15 | |
Vested | | | - | | | $ | - | |
Canceled (forfeited) | | | (2,000 | ) | | $ | 9.15 | |
Outstanding at June 30, 2020 | | | 56,000 | | | $ | 9.15 | |
During fiscal 2020, we granted 58,000 non-performance based restricted stock units ("RSUs"), with a weighted average grant-dategrant date fair value of options$9.15. The RSUs granted to employees entitle the holder to receive the underlying shares of common stock as the unit vests over the relevant vesting period. The RSUs do not entitle the holder to receive dividends declared on the underlying shares while the RSUs remain unvested. We account for these RSUs as equity-based awards because when they vest, they will be settled in shares of our common stock. The grant date fair value of RSUs is measured by reducing the grant date price of the Company's common stock by the present value of the dividends expected to be paid on the underlying stock during the requisite service period, discounted at the appropriate risk-free interest rate. The RSUs vest 25% annually on the anniversary date of grant and become fully vested after four years. There were no RSUs granted during fiscal 2018,20172019 and 2016 was $6.93,$8.30 and $11.53 respectively. The total intrinsic value of options exercised during fiscal 2018,2017 and 2016 was $0.1 million, $0.8 million, and $0.3 million, respectively. 2018.
As of June 30, 2018, there was $0.32020, $0.5 million of total unrecognized compensation costexpense related to nonvested options granted under the Plan. That costnon-vested restricted stock units is expected to be recognized over a weighted average period of 1.43.7 years. A summary of the nonvested shares as of June 30, 2018 and changes during the year then ended is presented below.
| | | | | | | Weighted Average | |
Options | | Shares | | | Grant Date Fair Value | |
Nonvested June 30, 2017 | | | 285,284 | | | $ | 11.18 | |
Granted | | | 19,482 | | | | 6.93 | |
Vested | | | (69,219 | ) | | | 10.99 | |
Canceled (forfeited/expired) | | | (127,375 | ) | | | 11.40 | |
Nonvested at June 30, 2018 | | | 108,172 | | | $ | 10.27 | |
Performance Stock Unit AwardsUnits
Under the Plan, the Compensation Committee of the Board of Directors was authorized to award common shares to certain employees based on the attainment of certain financial goals over a given performance period. The awards are offered at no cost to the employees. In the event of an employee's termination during the vesting period, the potential right to earn shares under this program is generally forfeited.
Payout of these grants depends on our financial performance (80%) and a market-based condition based on the total return our shareholders receive on their investment in our stock relative to returns earned through investments in other peer companies (20%). The performance award opportunity ranges from 50% of the employee's target award if minimum performance requirements are met to a maximum of 125% of the target award based on the attainment of certain financial and shareholder-return goals over a specific performance period, which is generally three fiscal years. The number of awards that will vest, as well as unearned and canceled awards, depend on the achievement of certain financial and shareholder-return goals over the three-year performance periods, and will be settled in shares if service conditions are met, requiring employees to remain employed with us through the end of the three-year performance periods. We account for performance stock unit awards as equity-based awards because upon vesting, they will be settled in common shares. These awards, which contain time and other vesting conditions, may also contain performance conditions providing recipients a contingent right to receive shares of the Company's common stock ("Performance Units"), conditioned upon the Company's achievement of certain performance targets and goals, and subject to the terms of the agreements. For Performance Units, weWe expense as compensation cost the fair value of the shares as of the grant date and amortize expense ratably over the total performance and time vest period, taking into accountconsidering the probability that we will satisfy the performance goals.
ETHAN ALLEN INTERIORS INC. AND SUBSIDIARIES
The following table summarizes the performance-based stock units’ activity during fiscal 2020 at the maximum award amounts based upon the respective performance units agreements:
| | | | | | | Weighted Average | |
| | | | | | | Grant Date | |
| | | Units | | | Fair Value | |
Outstanding at June 30, 2019 | | | 313,882 | | | $ | 22.82 | |
Granted | | | 99,405 | | | $ | 12.72 | |
Vested | | | - | | | $ | - | |
Canceled (forfeited) | | | (88,180 | ) | | $ | 25.27 | |
Outstanding at June 30, 2020 | | | 325,107 | | | $ | 19.05 | |
During fiscal 2020 we granted 99,405 performance-based units. We estimate, as of the date of grant, the fair value of Performance Unitsperformance units with a discounted cash flow model, using as model inputs the risk-free rate of return as the discount rate, dividend yield for dividends not paid during the restriction period, and a discount for lack of marketability for a one-yearone-year post-vest holding period. The lack of marketability discount used is the present value of a future put option using Monte-Carlo and Black-Scholes pricing models.the Chaffe model. The weighted average assumptions used for the stock units granted during fiscal years ended June 30 are noted in the table following. No Performance based restricted stock unit awards were granted under the Plan prior to December 1, 2015.2020, 2019 and 2018, respectively, is presented below.
| | | 2018 | | | 2017 | |
Volatility | | | 32.9 | % | | | 30.8 | % |
Risk-free rate of return | | | 1.41 | % | | | 0.92 | % |
Dividend yield | | | 2.47 | % | | | 1.97 | % |
Expected average life (years) | | | 1.91 | | | | 2.04 | |
| | | 2020 | | | 2019 | | | 2018 | |
Volatility | | | 30.5 | % | | | 32.1 | % | | | 32.9 | % |
Risk-free rate of return | | | 1.72 | % | | | 2.72 | % | | | 1.41 | % |
Dividend yield | | | 3.97 | % | | | 3.24 | % | | | 2.47 | % |
Expected average life (years) | | | 3.0 | | | | 3.0 | | | | 1.9 | |
ETHAN ALLEN INTERIORS INC. AND SUBSIDIARIES
For each grant of Performance Units, the amount of the grant that will be earned and paid will be determined by reference to the achievement of certain performance goals applicable to such grant. Equity-basedShare-based compensation expensesexpense related to performance-based shares recognized in our consolidated statements of comprehensive income are presented in the following table for the fiscal years ended June 30 (in(in thousands).
Granted within fiscal years ending June 30, | | 2018 | | | 2017 | |
2016 | | $ | 92 | | | $ | 794 | |
2017 | | | (12 | ) | | | 12 | |
2018 | | | 457 | | | | - | |
Total expense | | $ | 537 | | | $ | 806 | |
| | | 2020 | | | 2019 | | | 2018 | |
Fiscal 2016 grants | | $ | - | | | $ | 5 | | | $ | 92 | |
Fiscal 2017 grants | | | - | | | | - | | | | (12 | ) |
Fiscal 2018 grants | | | - | | | | (457 | ) | | | 457 | |
Fiscal 2019 grants | | | 101 | | | | 321 | | | | - | |
Fiscal 2020 grants | | | 59 | | | | - | | | | - | |
Total expense | | $ | 160 | | | $ | (131 | ) | | $ | 537 | |
A summary of stock unit activity occurring during the fiscal year ended Our unrecognized compensation expense at June 30, 2018 is presented below.
| | | | | | | Weighted | |
| | | | | | | Average | |
| | | | | | | Grant Date | |
| | | Units | | | Fair Value | |
Nonvested June 30, 2017 | | | 308,330 | | | $ | 25.92 | |
Granted | | | 162,500 | | | | 25.18 | |
Vested | | | (59,211 | ) | | | 23.96 | |
Canceled (forfeited/expired) | | | (81,250 | ) | | | 24.94 | |
Nonvested at June 30, 2018 | | | 330,369 | | | $ | 26.15 | |
As of June 30, 2018, there was $0.6 million of total unrecognized compensation cost2020, related to nonvestedperformance-based units granted under the Planwas $0.3 million based on our probability estimates. That costthe current estimates of the number of awards that will vest, and is expected to be recognized over a weighted averageweighted-average remaining period of 1 year.
Restricted Stock Awards
A summary of stock unit activity occurring during the fiscal year ended June 30, 2018 is presented below.
| | | | | | Weighted
| |
| | | | | | Average
| |
| | | | | | Grant Date
| |
| | Units
| | | Fair Value
| |
Nonvested June 30, 2017
| | | - | | | $ | - | |
Granted
| | | 16,234 | | | | 25.62 | |
Vested
| | | - | | | | - | |
Canceled (forfeited/expired)
| | | (16,234 | ) | | | (25.62 | ) |
Nonvested at June 30, 2018
| | | - | | | $ | - | |
During fiscal 201816,234 restricted stock awards were granted and then subsequently voided. There was no unrecognized compensation cost related to restricted shares granted under the Plan for fiscal 2018.
ETHAN ALLEN INTERIORS INC. AND SUBSIDIARIES
Income tax expense attributable to income from operations consists of the following for the fiscal years ended June 30 (in thousands):
| | | 2018 | | | 2017 | | | 2016 | |
Current: | | | | | | | | | | | | |
Federal | | $ | 10,289 | | | $ | 15,265 | | | $ | 27,660 | |
State | | | 1,689 | | | | 1,585 | | | | 2,898 | |
Foreign | | | 824 | | | | 445 | | | | 88 | |
Total current | | | 12,802 | | | | 17,295 | | | | 30,646 | |
Deferred: | | | | | | | | | | | | |
Federal | | | 174 | | | | 3,413 | | | | (237 | ) |
State | | | (124 | ) | | | 85 | | | | 207 | |
Foreign | | | (156 | ) | | | 8 | | | | 703 | |
Total deferred | | | (106 | ) | | | 3,506 | | | | 673 | |
Income Tax Expense (Benefit) | | $ | 12,696 | | | $ | 20,801 | | | $ | 31,319 | |
The following is a reconciliation of expected income tax expense (benefit) (computed by applying the federal statutory income tax rate to income before taxes) to actual income tax expense (benefit) (in thousands):
| | | 2018 | | | 2017 | | | 2016 | |
| | | | | | | | | | | | | | | | | | | | | | | | | |
Expected Income Tax Expense | | $ | 13,739 | | | | 28.0 | % | | $ | 19,947 | | | | 35.0 | % | | $ | 30,785 | | | | 35.0 | % |
State income taxes, net of federal income tax | | | 1,263 | | | | 2.6 | % | | | 1,403 | | | | 2.5 | % | | | 2,514 | | | | 2.9 | % |
Valuation allowance | | | 42 | | | | 0.1 | % | | | 329 | | | | 0.6 | % | | | 339 | | | | 0.4 | % |
Re-measurement of deferred taxes | | | (2,651 | ) | | | -5.4 | % | | | - | | | | - | | | | - | | | | - | |
Section 199 Qualified Production Activities deduction | | | (678 | ) | | | -1.4 | % | | | (999 | ) | | | -1.8 | % | | | (1,513 | ) | | | -1.7 | % |
Unrecognized tax expense (benefit) | | | 55 | | | | 0.1 | % | | | (48 | ) | | | -0.1 | % | | | (479 | ) | | | -0.5 | % |
Stock compensation - Cancelations & exercises | | | 570 | | | | 1.2 | % | | | - | | | | - | | | | - | | | | - | |
Other, net | | | 356 | | | | 0.7 | % | | | 169 | | | | 0.3 | % | | | (327 | ) | | | -0.4 | % |
Actual income tax expense (benefit) | | $ | 12,696 | | | | 25.9 | % | | $ | 20,801 | | | | 36.5 | % | | $ | 31,319 | | | | 35.6 | % |
The deferred income tax asset and liability balances at June 30 (in thousands) include:
| | | 2018 | | | 2017 | |
Deferred tax assets: | | | | | | | | |
Employee compensation accruals | | | 2,729 | | | | 4,395 | |
Stock based compensation | | | 933 | | | | 2,878 | |
Deferred rent credits | | | 4,407 | | | | 7,290 | |
Net operating loss carryforwards | | | 3,959 | | | | 3,687 | |
Inventories | | | 62 | | | | 1,254 | |
Goodwill | | | 328 | | | | 953 | |
Other, net | | | 1,645 | | | | 2,396 | |
Total deferred tax assets | | | 14,063 | | | | 22,853 | |
Less: Valuation allowance | | | (2,527 | ) | | | (2,485 | ) |
Net deferred tax assets | | $ | 11,536 | | | $ | 20,368 | |
ETHAN ALLEN INTERIORS INC. AND SUBSIDIARIES
| | | 2018 | | | 2017 | |
Deferred tax liabilities: | | | | | | | | |
Property, plant and equipment | | | 2,827 | | | | 5,360 | |
Intangible assets other than goodwill | | | 8,951 | | | | 14,166 | |
Commissions | | | 2,230 | | | | 3,420 | |
Total deferred tax liability | | | 14,008 | | | | 22,946 | |
Total net deferred tax asset (liability) | | $ | (2,472 | ) | | $ | (2,578 | ) |
The deferred tax balances are classified in the Consolidated Balance Sheets as follows at June 30 (in thousands):
| | | 2018 | | | 2017 | |
Current assets | | | - | | | $ | 3,916 | |
Non-current assets | | | 1,688 | | | | 1,167 | |
Current liabilities | | | - | | | | - | |
Non-current liabilities | | | 4,160 | | | | 7,661 | |
Total net deferred tax asset (liability) | | $ | (2,472 | ) | | $ | (2,578 | ) |
Commencing with fiscal 2018 the Company is prospectively reporting its deferred tax assets and liabilities as non-current in conformance with ASU 2015-17 “Balance Sheet Classification of Deferred Tax Assets. For fiscal 2017, current deferred tax assets and liabilities and non-current deferred tax assets and liabilities have been presented net in the Consolidated Balance Sheets.
We evaluate our deferred taxes to determine if the “more likely than not” standard of evidence has not been met thereby supporting the need for a valuation allowance. A valuation allowance must be established for deferred tax assets when it is less than 50% likely that assets will be realized. At June 30 of 2018 and 2017, such an allowance was in place against the Belgian foreign tax assets, and at June 30, 2018 this valuation allowance was approximately $2.6 million.
The Company’s deferred income tax assets at June 30, 2018 with respect to the net operating losses expire as follows (in thousands):
| | | Deferred | | | Net Operating | |
| | | Income | | | Loss | |
| | | Tax Assets | | | Carryforwards | |
United States (State), expiring between 2025 and 2032 | | $ | 1,340 | | | $ | 23,831 | |
Foreign, expiring between 2034 and 2038 | | | 2,619 | | | | 7,745 | |
Deferred U.S. federal income taxes were previously not provided for unremitted foreign earnings of our foreign subsidiaries because we expected those earnings to be permanently reinvested. As part of the Tax Act the Company must report The Deemed Repatriation Transition Tax (the “Transition Tax”) on previously untaxed accumulated earnings and profits (“E&P”) of certain of our foreign subsidiaries. To determine the amount of the Transition Tax, we must determine, in addition to other factors, the amount of post-1986 E&P of the relevant subsidiaries, as well as the amount of non-U.S. income taxes paid on such earnings. We are able to make a reasonable estimate and recorded a provisional Transition Tax obligation of $125K.
On December 22, 2017 H.R. 1, originally known as the Tax Cuts and Jobs Act, (the “Tax Act”) was enacted. Among the significant changes to the U.S. Internal Revenue Code, the Tax Act lowers the U.S. federal corporate income tax rate (“Federal Tax Rate”) from 35% to 21% effective January 1, 2018, introduces a limitation on the deduction of certain interest expenses, introduces a deduction for certain business capital expenditures and introduces a system of taxing foreign-sourced income from multinational corporations. The Company will compute its income tax expense for the June 30, 2018 fiscal year using a blended Federal Tax Rate of 28%. The 21% Federal Tax Rate will apply to fiscal years ending June 30, 2019 and each year thereafter.
ETHAN ALLEN INTERIORS INC. AND SUBSIDIARIES
The Company must re-measure its net deferred tax assets and liabilities using the Federal Tax Rate that will apply when these amounts are expected to reverse. As of June 30, 2018, the Company can determine a reasonable estimate for the effects of tax reform. The re-measurement of the deferred tax assets and liabilities resulted in a discrete tax benefit $2.7 million at June 30, 2017 which lowered the effective tax rate by 5.4% for the fiscal year.
Uncertain Tax Positions
We recognize interest and penalties related to income tax matters as a component of income tax expense. If the $2.2 million of unrecognized tax benefits and related interest and penalties as of June 30, 2018 were recognized, approximately $1.7 million would be recorded as a benefit to income tax expense. A reconciliation of the beginning and ending amount of unrecognized tax benefits including related interest and penalties as of June 30, 2018 and 2017 is as follows (in thousands):
| | | 2018 | | | 2017 | |
Beginning balance | | $ | 2,106 | | | $ | 2,170 | |
Additions for tax positions taken | | | 467 | | | | 646 | |
Reductions for tax positions taken in prior years | | | (386 | ) | | | (694 | ) |
Settlements | | | - | | | | (16 | ) |
Ending balance | | $ | 2,187 | | | $ | 2,106 | |
It is reasonably possible that various issues relating to approximately $0.3 million of the total gross unrecognized tax benefits as of June 30, 2018 will be resolved within the next twelve months as exams are completed or statutes expire. If recognized, approximately $0.1 million of unrecognized tax benefits would reduce our tax expense in the period realized. However, actual results could differ from those currently anticipated.
The Company conducts business globally and, as a result, the Company or one or more of its subsidiaries files income tax returns in the U.S., various state, and foreign jurisdictions. In the normal course of business, the Company is subject to examination by the taxing authorities in such major jurisdictions as the U.S. Canada, Mexico, Belgium and Honduras. As of June 30, 2018, the Company and certain subsidiaries are currently under audit from 2015 through 2016 in the U.S. While the amount of uncertain tax benefits with respect to the entities and years under audit may change within the next twelve months, it is not anticipated that any of the changes will be significant.1.4 years.
(12)(18)
| Employee Retirement Programs |
The Ethan Allen Retirement Savings Plan (the “401(k) Plan”)
The Ethan Allen Retirement SavingsCompany established its 401(k) Plan (the "Savings Plan")in 1994. The 401(k) Plan is a defined contribution plan whichcovering all full-time, United States employees and is offeredsubject to substantially all ourthe provisions of the Employee Retirement Income Security Act of 1974 and the Internal Revenue Code of 1986 (“IRC”). All United States employees who have completed three consecutive months of service regardlessthe Company are eligible to participate in the 401(k) Plan on the first day of hours worked.any subsequent April, July, October or January coincident with or next following the three-month anniversary of their date of hire. Each year, participants may contribute up to 100% of their eligible annual compensation, subject to annual limitations established by the IRC. We may, at our discretion, make a matching and profit-sharing contribution to the 401(k) portion of the Savings401(k) Plan on behalf of each participant. Total 401(k)eligible participant, which vests immediately. The Company match expense amounted to $3.4contributed $2.9 million, $3.4 million and $3.4 million in 2018,$3.5 million in 2017,matching and $3.4 million in 2016.profit-sharing contributions to employee 401(k) accounts during fiscal 2020, 2019 and 2018, respectively.
Other Retirement Plans and Benefits
Ethan Allen provides additional benefits to selected members of senior and middleselect management in the form of previously entered deferred compensation arrangements and a management cash bonus and other incentive programs.arrangements. The total cost of these benefits was $0.1 million, $1.0 million, and $3.6 million in 2018,2017 and 2016, respectively.were immaterial to the Company during each period presented.
ETHAN ALLEN INTERIORS INC. AND SUBSIDIARIES
(13)(19)
| LitigationSegment Information
|
Operating segments are defined as (i) components of an enterprise that engage in business activities from which they may earn revenue and incur expense, (ii) have operating results that are regularly reviewed by the enterprise’s chief operating decision maker to make decisions about resources to be allocated to the segment and assess its performance, and (iii) for which discrete financial information is available. Our Chief Executive Officer is our chief operating decision maker (“CODM”) and reviews financial information at the operating segment level and is responsible for making decisions about resources allocated amongst the operating segments based on actual results. Our operating segments are aligned with how the Company, including our CODM, manages the business. As such, our reportable operating segments are the Wholesale segment and the Retail segment.
Our wholesale and retail operating segments represent strategic business areas of our vertically integrated enterprise that operate separately and provide their own distinctive services. This vertical structure enables us to offer our complete line of home furnishings and accents more effectively while controlling quality and cost. We evaluate performance of the respective segments based upon revenues and operating income. The accounting policies of the operating segments are the same as those described in Note 3, Summary of Significant Accounting Policies. We account for intersegment revenue transactions between our segments consistent with independent third-party transactions, that is, at current market prices. As a result, the manufacturing profit related to sales to our retail segment is included within our wholesale segment. Operating income realized on intersegment revenue transactions is therefore generally consistent with the operating income realized on our revenue from independent third-party transactions. Segment operating income is based on profit or loss from operations before interest expense, interest income, other expense, net and income taxes. Sales are attributed to countries on the basis of the customer's location.
As of June 30, 2020, the Company operated 144 design centers (our retail segment) and our independent retailers operated 160 design centers. Our wholesale segment net sales include sales to our retail segment, which are eliminated in consolidation, and sales to our independent retailers and other third parties. Our retail segment net sales accounted for 78.5% of our consolidated net sales in fiscal 2020. Our wholesale segment net sales accounted for the remaining 21.5%. Our ten largest customers were all within our wholesale segment and represent 15.4% of our consolidated net sales in fiscal 2020. These customers are the GSA and nine independent retailers.
Information for each of the last three fiscal years ended June 30 is provided below (in thousands):
| | | 2020 | | | 2019 | | | 2018 | |
Net sales | | | | | | | | | | | | |
Wholesale segment | | $ | 337,948 | | | $ | 441,551 | | | $ | 475,731 | |
Retail segment | | | 462,800 | | | | 589,829 | | | | 587,502 | |
Elimination of intercompany sales | | | (210,911 | ) | | | (284,696 | ) | | | (296,449 | ) |
Consolidated Total | | $ | 589,837 | | | $ | 746,684 | | | $ | 766,784 | |
| | | | | | | | | | | | | |
Income before income taxes | | | | | | | | | | | | |
Wholesale segment | | $ | 33,106 | | | $ | 42,481 | | | $ | 48,499 | |
Retail segment | | | (21,414 | ) | | | (10,529 | ) | | | (1,738 | ) |
Adjustment of intercompany profit(a) | | | 2,952 | | | | 1,995 | | | | 2,106 | |
Operating income | | | 14,644 | | | | 33,947 | | | | 48,867 | |
Interest (expense), net of interest income | | | (455 | ) | | | (87 | ) | | | 200 | |
Consolidated Total | | $ | 14,189 | | | $ | 33,860 | | | $ | 49,067 | |
| | | | | | | | | | | | | |
Depreciation and amortization | | | | | | | | | | | | |
Wholesale segment | | $ | 7,107 | | | $ | 7,560 | | | $ | 7,752 | |
Retail segment | | | 9,752 | | | | 11,970 | | | | 12,079 | |
Consolidated Total | | $ | 16,859 | | | $ | 19,530 | | | $ | 19,831 | |
| | | | | | | | | | | | | |
Capital expenditures | | | | | | | | | | | | |
Wholesale segment | | $ | 7,454 | | | $ | 3,340 | | | $ | 4,286 | |
Retail segment | | | 8,255 | | | | 5,780 | | | | 8,200 | |
Consolidated Total | | $ | 15,709 | | | $ | 9,120 | | | $ | 12,486 | |
(a) | Represents the change in wholesale profit contained in the retail segment inventory at the end of the period. |
ETHAN ALLEN INTERIORS INC. AND SUBSIDIARIES
| | | June 30, | |
(in thousands) | | 2020 | | | 2019 | | | 2018 | |
Total Assets | | | | | | | | | | | | |
Wholesale segment | | $ | 255,011 | | | $ | 237,354 | | | $ | 241,616 | |
Retail segment | | | 390,635 | | | | 299,125 | | | | 317,590 | |
Inventory profit elimination(a) | | | (22,857 | ) | | | (26,128 | ) | | | (28,773 | ) |
Consolidated Total | | $ | 622,789 | | | $ | 510,351 | | | $ | 530,433 | |
(a) | Represents the wholesale profit contained in the retail segment inventory that has not yet been realized. These profits are realized when the related inventory is sold. |
Geographic Information
Our international net sales are comprised of our wholesale segment sales to independent retailers and our retail segment sales to customers through our Company-operated design centers. The number of international design centers and the related net sales as a percentage of our consolidated net sales are shown in the following tables.
| | | Fiscal Year Ended June 30, | |
| | | 2020 | | | 2019 | | | 2018 | |
Independent retailer design centers | | | 125 | | | | 118 | | | | 104 | |
Company-operated design centers | | | 6 | | | | 6 | | | | 6 | |
Total international design centers | | | 131 | | | | 124 | | | | 110 | |
% of total design centers international | | | 43.1 | % | | | 41.1 | % | | | 37.2 | % |
% of consolidated net sales | | | 5.7 | % | | | 6.8 | % | | | 10.2 | % |
Sales by Country | | 2020 | | | 2019 | | | 2018 | |
United States | | | 94.3 | % | | | 93.2 | % | | | 89.8 | % |
All Others | | | 5.7 | % | | | 6.8 | % | | | 10.2 | % |
The following table sets forth long-lived assets by geographic area at June 30 (in thousands):
| | | 2020 | | | 2019 | | | 2018 | |
United States | | $ | 319,012 | | | $ | 218,034 | | | $ | 239,567 | |
Mexico | | | 14,474 | | | | 18,144 | | | | 18,323 | |
Honduras | | | 8,049 | | | | 8,057 | | | | 8,637 | |
Canada | | | 4,485 | | | | 1,011 | | | | 1,376 | |
Total long-lived assets(1) | | $ | 346,020 | | | $ | 245,246 | | | $ | 267,903 | |
(1) | Long-lived assets consist of net property, plant and equipment and operating lease right-of-use assets and exclude goodwill, intangible assets, deferred income taxes and other assets. |
(20) | Commitments and Contingencies |
Commitments represent obligations, such as those for future purchases of goods or services that are not yet recorded on the balance sheet as liabilities. We record liabilities for commitments when incurred (i.e., when the goods or services are received).
Purchase Commitments with Suppliers
Purchase obligations are defined as agreements that are enforceable and legally binding that specify all significant terms, including fixed or minimum quantities to be purchased; fixed, minimum or variable price provisions; and the approximate timing of the transaction. We do, in the normal course of business, regularly initiate purchase orders for the procurement of (i) selected finished goods sourced from third-party suppliers, (ii) lumber, fabric, leather and other raw materials used in production, and (iii) certain outsourced services. All purchase orders are based on current needs and are fulfilled by suppliers within a relatively short time period. At June 30, 2020, our open purchase orders with respect to such goods and services totaled $20.1 million and are to be paid in less than one year. Our purchase orders decreased from $23.9 million as of June 30, 2019 as we further improved our efforts to minimize inventory carrying costs, eliminated all non-essential operating expenses and delayed capital expenditures as part of our COVID-19 action plan implemented on April 1, 2020.
Legal Matters
We are routinely party to various legal proceedings, including investigations or as a defendant in litigation, in the ordinary course of business. We are also subject to various federal, state and local environmental protection laws and regulations and are involved, from time to time, in investigations and proceedings regarding environmental matters. Such investigations and proceedings typically concern air emissions, water discharges, and/or management of solid and hazardous wastes. Under these laws, we and/or our subsidiaries are, or may be, required to remove or mitigate the effects on the environment of the disposal or release of certain hazardous materials.
ETHAN ALLEN INTERIORS INC. AND SUBSIDIARIES
Regulations issued under the Clean Air Act Amendments of 1990 required the industry to reformulate certain furniture finishes or institute process changes to reduce emissions of volatile organic compounds. Compliance with many of these requirements has been facilitated through the introduction of high solids coating technology and alternative formulations. In addition, we have instituted a variety of technical and procedural controls, including reformulation of finishing materials to reduce toxicity, implementation of high velocity low pressure spray systems, development of storm water protection plans and controls, and further development of related inspection/audit teams, all of which have served to reduce emissions per unit of production. We remain committed to implementing new waste minimization programs and/or enhancing existing programs with the objective of (i) reducing the total volume of waste, (ii) limiting the liability associated with waste disposal, and (iii) continuously improving environmental and job safety programs on the factory floor which serve to minimize emissions and safety risks for employees. To reduce the use of hazardous materials in the manufacturing process, we will continue to evaluate the most appropriate, cost-effective control technologies for finishing operations and production methods. We believe that our facilities are in material compliance with all such applicable laws and regulations. Our currently anticipated capital expenditures for environmental control facility matters are not material.
On a quarterly basis, we review our litigation activities and determine if an unfavorable outcome to us is considered “remote”, “reasonably possible” or “probable” as defined by ASC 450, – Contingencies. Where we determine an unfavorable outcome is probable and is reasonably estimable, we accrue for potential litigation losses. The liability we may ultimately incur with respect to such litigation matters, in the event of a negative outcome, may be in excess of amounts currently accrued, if any; however, we do not expect that the reasonably possible outcome of these litigation matters would, individually or in the aggregate, have a material adverse effect on our financial condition, results of operations or cash flows. Where we determine an unfavorable outcome is not probable or reasonably estimable, we do not accrue for any potential litigation loss.
Although the outcome of the various claims and proceedings against us cannot be predicted with certainty, management believes that, based on information available at June 30, 2020, the likelihood is remote that any existing claims or proceedings, individually or in the aggregate, will have a material adverse effect on our financial position, results of operations or cash flows.
(14)
| Accumulated Other Comprehensive Income (Loss)
|
The following table sets forth the activity in accumulated other comprehensive income (loss) for the fiscal years ended June 30 (in thousands):Indemnifications
| | | Years ended June 30, | |
| | | 2018 | | | 2017 | |
Beginning balance | | $ | (4,131 | ) | | $ | (4,846 | ) |
Changes before reclassifications | | | (2,040 | ) | | | 715 | |
Amounts reclassified from accumulated other comprehensive income | | | - | | | | - | |
Current period other comprehensive income (loss) | | | (2,040 | ) | | | 715 | |
Ending balance | | $ | (6,171 | ) | | $ | (4,131 | ) |
Foreign currency translation adjustmentsAs permitted or required under Delaware law and to the maximum extent allowable under that law, the Company has certain obligations to indemnify its current and former officers and directors for certain events or occurrences while the officer or director is, or was serving, at our request in such capacity. These indemnification obligations are valid as long as the result of changesdirector or officer acted in foreign currency exchange rates related to our operationsgood faith and in Canada, Belgium, Honduras and Mexico, and exclude income taxes given thata manner the earnings of non-U.S. subsidiaries are deemedperson reasonably believed to be reinvested for an indefinite period.
Our wholesalein, or not opposed to, the best interests of the Company, and retail operating segments represent strategic business areaswith respect to any criminal action or proceeding, had no reasonable cause to believe his or her conduct was unlawful. The maximum potential amount of future payments Ethan Allen could be required to make under these indemnification obligations is unlimited; however, the Company has a director and officer insurance policy that it believes mitigates our vertically integrated enterprise that operate separatelyexposure and provide their own distinctive services. This vertical structure enablesmay enable us to offer our complete linerecover a portion of home furnishings and accents more effectively while controlling quality and cost.any future amounts paid. We evaluate performancebelieve the estimated fair value of the respective segments based upon revenues and operating income. Inter-segment transactions result, primarily, from the wholesale sale of inventory to the retail segment, including the related profit margin.these indemnification obligations is immaterial.
ETHAN ALLEN INTERIORS INC. AND SUBSIDIARIES
As of June 30, 2018, the Company operated 148 design centers (our retail segment) and our independent retailers operated 148 design centers. Our wholesale segment net sales include sales to our retail segment, which are eliminated in consolidation, and sales to our independent retailers. Our retail segment net sales accounted for 77% of our consolidated net sales in fiscal 2018. Our wholesale segment net sales to independent retailers and other third parties accounted for 23%, including approximately 15.5% of our consolidated net sales in fiscal 2018 to our ten largest customers, including the GSA and nine independent retailers who operate 105 design centers. Information for each of the last three fiscal years ended June 30 is provided below (in thousands):
| | | 2018 | | | 2017 | | | 2016 | |
Net sales: | | | | | | | | | | | | |
Wholesale segment | | $ | 475,731 | | | $ | 453,326 | | | $ | 491,467 | |
Retail segment | | | 587,502 | | | | 603,677 | | | | 626,511 | |
Elimination of inter-company sales | | | (296,449 | ) | | | (293,618 | ) | | | (323,776 | ) |
Consolidated Total | | $ | 766,784 | | | $ | 763,385 | | | $ | 794,202 | |
| | | | | | | | | | | | | |
Operating income (loss): | | | | | | | | | | | | |
Wholesale segment | | $ | 48,499 | | | $ | 53,505 | | | $ | 74,412 | |
Retail segment | | | (1,738 | ) | | | 1,198 | | | | 16,450 | |
Adjustment of inter-company profit (1) | | | 2,106 | | | | 3,247 | | | | (1,683 | ) |
Consolidated Total | | $ | 48,867 | | | $ | 57,950 | | | $ | 89,179 | |
| | | | | | | | | | | | | |
Depreciation & Amortization: | | | | | | | | | | | | |
Wholesale segment | | $ | 7,752 | | | $ | 7,550 | | | $ | 7,587 | |
Retail segment | | | 12,079 | | | | 12,565 | | | | 11,766 | |
Consolidated Total | | $ | 19,831 | | | $ | 20,115 | | | $ | 19,353 | |
| | | | | | | | | | | | | |
Capital expenditures: | | | | | | | | | | | | |
Wholesale segment | | $ | 4,286 | | | $ | 8,589 | | | $ | 12,446 | |
Retail segment | | | 14,487 | | | | 9,732 | | | | 10,686 | |
Consolidated Total | | $ | 18,773 | | | $ | 18,321 | | | $ | 23,132 | |
| | | June 30, | | | June 30, | | | June 30, | |
| | | 2018 | | | 2017 | | | 2016 | |
Total Assets: | | | | | | | | | | | | |
Wholesale segment | | $ | 241,616 | | | $ | 279,364 | | | $ | 271,116 | |
Retail segment | | | 317,590 | | | | 319,341 | | | | 339,942 | |
Inventory profit elimination (2) | | | (28,773 | ) | | | (30,483 | ) | | | (33,649 | ) |
Consolidated Total | | $ | 530,433 | | | $ | 568,222 | | | $ | 577,409 | |
| (1) | Represents the change in wholesale profit contained in Ethan Allen design center inventory at the end of the period.
|
| (2)
| The wholesale profit contained in the retail segment inventory that has not yet been realized. These profits are realized when the related inventory is sold.
|
Our international net sales are comprised of our wholesale segment sales to independent retailers and our retail segment sales to consumers through the Company operated design centers. The number of international design centers, and the related net sales as a percent of our consolidated net sales is shown in the following table.
| | | Fiscal Year Ended June 30, | |
| | | 2018 | | | 2017 | | | 2016 | |
Independent design centers | | | 104 | | | | 107 | | | | 103 | |
Company operated design centers | | | 6 | | | | 6 | | | | 6 | |
Total international design centers | | | 110 | | | | 113 | | | | 109 | |
| | | | | | | | | | | | | |
Percentage of consolidated net sales | | | 10.2 | % | | | 10.0 | % | | | 9.2 | % |
ETHAN ALLEN INTERIORS INC. AND SUBSIDIARIES
(16)(21)
| Selected Quarterly Financial Data (Unaudited) |
Tabulated below isThe following table presents selected unaudited financial datainformation for each quarter of the fiscalquarterly periods in the years ended June 30, 2018, 2017,2020 and 20162019. The results for any quarter are not necessarily indicative of future quarterly results and, accordingly, period-to-period comparisons should not be relied upon as an indication of future performance (in thousands, except per share data):
| | | Quarter Ended | |
| | | September 30 | | | December 31 | | | March 31 | | | June 30 | |
Fiscal 2018: | | | | | | | | | | | | | | | | |
Net Sales | | $ | 181,302 | | | $ | 198,481 | | | $ | 181,419 | | | $ | 205,582 | |
Gross profit | | | 100,323 | | | | 107,791 | | | | 96,708 | | | | 111,142 | |
Net income | | | 7,415 | | | | 14,862 | | | | 2,616 | | | | 11,478 | |
Earnings per basic share | | | 0.27 | | | | 0.54 | | | | 0.10 | | | | 0.43 | |
Earnings per diluted share | | | 0.27 | | | | 0.54 | | | | 0.09 | | | | 0.42 | |
Dividends declared per common share | | | 0.19 | | | | 0.50 | | | | 0.19 | | | | 0.19 | |
| | | | | | | | | | | | | | | | | |
Fiscal 2017: | | | | | | | | | | | | | | | | |
Net Sales | | $ | 193,287 | | | $ | 194,672 | | | $ | 180,501 | | | $ | 194,925 | |
Gross profit | | | 108,467 | | | | 108,124 | | | | 94,735 | | | | 108,397 | |
Net income | | | 11,529 | | | | 10,700 | | | | 2,282 | | | | 11,683 | |
Earnings per basic share | | | 0.42 | | | | 0.39 | | | | 0.08 | | | | 0.42 | |
Earnings per diluted share | | | 0.41 | | | | 0.38 | | | | 0.08 | | | | 0.42 | |
Dividends declared per common share | | | 0.17 | | | | 0.19 | | | | 0.19 | | | | 0.19 | |
| | | | | | | | | | | | | | | | | |
Fiscal 2016: | | | | | | | | | | | | | | | | |
Net Sales | | $ | 190,391 | | | $ | 207,535 | | | $ | 190,583 | | | $ | 205,693 | |
Gross profit | | | 104,673 | | | | 116,058 | | | | 105,717 | | | | 115,788 | |
Net income | | | 13,147 | | | | 16,534 | | | | 10,178 | | | | 16,778 | |
Earnings per basic share | | | 0.46 | | | | 0.58 | | | | 0.37 | | | | 0.60 | |
Earnings per diluted share | | | 0.46 | | | | 0.58 | | | | 0.36 | | | | 0.60 | |
Dividends declared per common share | | | 0.14 | | | | 0.14 | | | | 0.17 | | | | 0.17 | |
| | | Quarter Ended | |
Fiscal 2020 | | September 30 (Q1) | | | December 31 (Q2) | | | March 31 (Q3) | | | June 30 (Q4) | |
Net sales | | $ | 173,921 | | | $ | 174,574 | | | $ | 149,774 | | | $ | 91,568 | |
Gross profit | | $ | 93,794 | | | $ | 97,521 | | | $ | 83,949 | | | $ | 47,868 | |
Operating income (loss) | | $ | 18,641 | | | $ | 9,204 | | | $ | (754 | ) | | $ | (12,447 | ) |
Net income (loss) | | $ | 14,106 | | | $ | 7,086 | | | $ | (223 | ) | | $ | (12,069 | ) |
Earnings (loss) per basic share | | $ | 0.53 | | | $ | 0.27 | | | $ | (0.01 | ) | | $ | (0.48 | ) |
Earnings (loss) per diluted share | | $ | 0.53 | | | $ | 0.27 | | | $ | (0.01 | ) | | $ | (0.48 | ) |
Diluted weighted average common shares | | | 26,750 | | | | 26,612 | | | | 25,703 | | | | 25,179 | |
Dividends declared per common share | | $ | 0.21 | | | $ | 0.21 | | | $ | 0.21 | | | $ | - | |
| | | Quarter Ended | |
Fiscal 2019 | | September 30 (Q1) | | | December 31 (Q2) | | | March 31 (Q3) | | | June 30 (Q4) | |
Net sales | | $ | 187,785 | | | $ | 197,152 | | | $ | 177,829 | | | $ | 183,918 | |
Gross profit | | $ | 101,450 | | | $ | 108,860 | | | $ | 98,394 | | | $ | 100,787 | |
Operating income (loss) | | $ | 11,799 | | | $ | 16,128 | | | $ | 10,669 | | | $ | (4,649 | ) |
Net income (loss) | | $ | 8,840 | | | $ | 12,190 | | | $ | 7,978 | | | $ | (3,310 | ) |
Earnings (loss) per basic share | | $ | 0.33 | | | $ | 0.46 | | | $ | 0.30 | | | $ | (0.12 | ) |
Earnings (loss) per diluted share | | $ | 0.33 | | | $ | 0.45 | | | $ | 0.30 | | | $ | (0.12 | ) |
Diluted weighted average common shares | | | 26,940 | | | | 26,923 | | | | 26,751 | | | | 26,711 | |
Dividends declared per common share | | $ | 0.19 | | | $ | 1.19 | | | $ | 0.19 | | | $ | 0.19 | |
ETHAN ALLEN INTERIORS INC. AND SUBSIDIARIES
(17)
| Financial Instruments
|
At June 30, 2017, $7.3 million of cash equivalents were restricted and classified as a long-term asset. We did not hold any restricted cash equivalents at June 30, 2018. We did not hold any available-for-sale securities at June 30 2018 and June 30, 2017.
We measure certain assets, including our cost and equity method investments, at fair value on a nonrecurring basis. These assets are recognized at fair value when they are deemed to be other-than-temporarily impaired. During the year ended June 30, 2018 we did not record any other-than-temporary impairments on those assets required to be measured at fair value on a non-recurring basis.
(18)
| Restricted Cash and Investments
|
At June 30, 2017 we held $7.3 million of cash and investments in lieu of providing letters of credit for the benefit of the provider of our workmen’s compensation and other insurance liabilities. By June 30, 2018, this obligation had been reduced to $5.9 million, which was then exchanged for a letter of credit for the benefit of this provider, and the restrictions were removed. See also Note 17, “Financial Instruments”.
ItemITEM 9. Changes in and Disagreements with Accountants on Accounting and Financial DisclosureCHANGES IN AND DISAGREEMENTS WITH ACCOUNTANTS ON ACCOUNTING AND FINANCIAL DISCLOSURE
None.
ETHAN ALLEN INTERIORS INC. AND SUBSIDIARIES
ItemITEM 9A. Controls and ProceduresCONTROLS AND PROCEDURES
Disclosure Controls and Procedures
We maintain disclosure controls and procedures that are designed to ensure that information required to be disclosed in our Exchange Act reports is recorded, processed, summarized and reported within the time periods specified in the SEC’s rules and forms, and that such information is accumulated and communicated to our management, including our Chairman of the Board and Chief Executive Officer ("CEO"(“CEO”) and Executive Vice President, Administration, and Chief Financial Officer("CFO"Officer and Treasurer (“CFO”), as appropriate, to allow timely decisions regarding required financial disclosure.
We carried out an evaluation, underUnder the supervision and with the participation of our management, including the CEO and the CFO, ofwe have evaluated the effectiveness of the design and operation of our disclosure controls and procedures (as such term is defined inpursuant to Rules 13a-15(e) and 15d-15(e) under the Securities Exchange Act, of 1934, as amended (the "Exchange Act")) as of the end of the period covered by this report. Based on suchthat evaluation, the CEO and CFO have concluded that, as of June 30, 2018,2020, our disclosure controls and procedures wereare effective in ensuringto ensure that material information relating to us (including our consolidated subsidiaries), which is required to be disclosed by us in our periodic reports filedthat we file or submitted tosubmit under the SECExchange Act is (i) recorded, processed, summarized and reported within the time periods specified in the SEC’s rules and forms, and (ii)is accumulated and communicated to our management, including the CEO and CFO, as appropriate, to allow timely decisions regarding required disclosure.
Management's Report on Internal Control over Financial Reporting
Our management is responsible for establishing and maintaining adequate internal control over financial reporting (as such term is defined in Exchange Act Rule 13a-15(f) and 15d-15(f)). OurManagement’s report on our internal control over financial reporting is a process designed to provide reasonable assurance regardingincluded under Part II, Item 8 of the reliabilityAnnual Report on Form 10-K.
Report of financial reporting and the preparation of financial statements for external purposes in accordance with U.S. GAAP.Independent Registered Public Accounting Firm
Our internal control over financial reporting includes those policies and procedures that:
pertain to the maintenance of records that, in reasonable detail, accurately and fairly reflect the transactions and dispositions of our assets;
provide reasonable assurance that transactions are recorded as necessary to permit preparation of financial statements in accordance with U.S. GAAP, and that our receipts and expenditures are being made only in accordance with authorizations of our management and directors; and
provide reasonable assurance regarding prevention or timely detection of unauthorized acquisition, use, or disposition of our assets that could have a material effectindependent registered public accounting firm’s attestation report on our financial statements.
Management has assessed the effectiveness of our internal control over financial reporting based on the framework in Internal Control - Integrated Framework issued by the Committeeis included under Part II, Item 8 of Sponsoring Organizations of the Treadway Commission (2013 framework). Based on that evaluation, management concluded that our internal control over financial reporting was effective as of June 30, 2018 to provide reasonable assurance regarding the reliability of financial reporting and the preparation of consolidated financial statements for external reporting purposes in accordance with U.S. GAAP.
KPMG LLP, the independent registered public accounting firm that audited the consolidated financial statements included in this Annual Report on Form 10-K, has also audited the effectiveness of our internal control over financial reporting as of June 30, 2018, as stated in their report included under Item 8 of this Annual Report.10-K.
Changes in Internal Control over Financial Reporting
There have been no changes in our internal control over financial reporting (as such term is defined in Rules 13a-15(f) and 15d-15(f) under the Exchange Act) during the fourth quarter of fiscal quarter ended June 30, 20182020 that havehas materially affected, or are reasonably likely to materially affect, our internal control over financial reporting.
ItemITEM 9B. Other InformationOTHER INFORMATION
None.
ETHAN ALLEN INTERIORS INC. AND SUBSIDIARIES
PART III
Except as set forth below, the information required by Items 10, 11, 12, 13 and 14 is incorporated by reference to Ethan Allen Interiors Inc. proxy statement for the Annual Meeting of Shareholders scheduled to be held on November 14, 2018 (the "Proxy Statement") to be filed with the SEC pursuant to Regulation 14A within 120 days after the end of our 2018 fiscal year.
ItemITEM 10. Directors, Executive Officers and Corporate GovernanceDIRECTORS, EXECUTIVE OFFICERS AND CORPORATE GOVERNANCE
Code of Ethics
We have adopted a codeCode of ethicsEthics that applies to our principal executive officer, principal financial officer, principal accounting officer or controller, or persons performing similar functions. Ourall other officers and our directors. A copy of this code of ethics can be accessed viaconduct is available at our investor relations website at www.ethanallen.com/governance.
https://ir.ethanallen.com/corporate-governance/governance-documents. We intend to disclose any amendment of our Code of Ethics, or any waiver of any provision thereof, applicable to our principal executive officer and/or principal financial officer, or persons performing similar functions, directors and other executive officers on our website within 4four days of the date of such amendment or waiver. In the case of a waiver, the nature of the waiver, the name of the person to whom the waiver was granted, and the date of the waiver will also be disclosed.
Information contained on, or connected to, our website is not incorporated by reference into this Annual Report on Form 10-K and should not be considered part of this or any other report that we file with, or furnish to, the SEC.
Identification of Executive Officers of the Company
The information set forthrequired relating to our executive officers is included under the heading “ExecutiveInformation About our Executive Officers of the Registrant” in Part I, Item 1 of this formAnnual Report on Form 10-K and all of that information is also incorporated by reference in this section.
Audit Committee Financial Expert
Our Board of Directors has determined that we have three "audit committee financial experts", as defined under Item 407(d)(5)(ii) of Regulation S-K of the Securities Exchange Act of 1934, currently serving on our Audit Committee. Those members of our Audit Committee who are deemed to be audit committee financial experts are as follows:
All persons identified as audit committee financial experts are independent from management as defineditem by the applicable listing standards of the New York Stock Exchange.reference.
The remaining information required by this Item will be included in our proxy statement for our 2020 Annual Meeting of Stockholders and is incorporated hereinin this item by reference from our 2018 Proxy Statement.reference.
ItemITEM 11. Executive CompensationEXECUTIVE COMPENSATION
The information required by this Itemitem will be included in our proxy statement for our 2020 Annual Meeting of Stockholders and is incorporated hereinin this item by reference from our 2018 Proxy Statement.reference.
ItemITEM 12. SECURITY OWNERSHIP OF CERTAIN BENEFICIAL OWNERS AND MANAGEMENT AND RELATED STOCKHOLDER MATTERS
Security Ownership of Certain Beneficial Owners and Management and Related Shareholder Matters
The information required by this Itemitem relating to security ownership of certain beneficial owners and management will be included under the section Security Ownership in our proxy statement for our 2020 Annual Meeting of Stockholders and is incorporated herein by reference to the sections entitled ["reference.
Equity Compensation Plan Information"]Information
The following table summarizes as of June 30, 2020, the number of outstanding equity awards granted to employees and ["Security Ownershipnon-employee directors, as well as the number of Common Stock of Certain Owners and Management"] in the 2018 Proxy Statement.equity awards remaining available for future issuance, under our equity compensation plans:
Plan Category | (a) Number of securities to be issued upon exercise of outstanding options, warrants and rights | (b) Weighted average exercise price of outstanding options, warrants and rights | (c) Number of securities remaining available for future issuance under equity compensation plans (excluding securities reflected in the first column) |
Equity compensation plans approved by security holders | 784,213(1) | $21.24(2) | 1,490,986 |
Equity compensation plans not approved by security holders(3) | - | - | - |
Total | 784,213 | $21.24 | 1,490,986 |
| (1) | Amount includes stock options outstanding under the Company’s Stock Incentive Plan as well as outstanding restricted stock units and performance units which have been provided for under the provisions of the Company’s Stock Incentive Plan. |
| (2) | Calculated without taking into account shares of Company common stock subject to outstanding restricted stock unit and performance unit awards that will become issuable as they vest, without any cash consideration or other payment required for such shares. |
| (3) | As of June 30, 2020, we did not maintain any equity compensation plans that have not been approved by our shareholders. |
ETHAN ALLEN INTERIORS INC. AND SUBSIDIARIES
ItemITEM 13. Certain Relationships and Related Transactions, and Director IndependenceCERTAIN RELATIONSHIPS AND RELATED TRANSACTIONS, AND DIRECTOR INDEPENDENCE
The information required by this Itemitem will be included in our proxy statement for our 2020 Annual Meeting of Stockholders and is incorporated in this item by reference to the section entitled ["Certain Relationships and Related Party Transactions"] and ["Corporate Governance —Director Independence "] in the 2018 Proxy Statement.reference.
ItemITEM 14. Principal Accounting Fees and ServicesPRINCIPAL ACCOUNTANT FEES AND SERVICES
The information required by this item will be included in our proxy statement for our 2020 Annual Meeting of Stockholders and is incorporated in this item by reference to the sections entitled ["Audit Fees"] and ["Audit and Non-Audit Engagement Pre-Approval Policy "] in the 2018 Proxy Statement.reference.
ETHAN ALLEN INTERIORS INC. AND SUBSIDIARIES
PART IV
ItemITEM 15. Exhibits and Financial Statement SchedulesEXHIBITS AND FINANCIAL STATEMENT SCHEDULES
(a) The following documents are filed as part of this Annual Report on Form 10-K:
| | (a)(1)
| Financial Statements. Our Statements. |
The following financial statements are included in Part II, Item 8 of this Annual Report on Form 10-K:
| - | Management’s Report to our Shareholders |
| - | Report of Independent Registered Public Accounting Firm |
| - | Consolidated Financial Statements, included under Item 8 hereof, as requiredBalance Sheets at June 30, 20182020 and 2017, and2019 |
| - | Consolidated Statements of Comprehensive Income for the years ended June 30, 2018, 20172020, 2019 and 2016 consist of the following:2018 |
| | | Consolidated Balance Sheets
|
| | Consolidated Statements of Comprehensive Income
|
| - | Consolidated Statements of Cash Flows for the years ended June 30, 2020, 2019 and 2018 |
ETHAN ALLEN INTERIORS INC. AND SUBSIDIARIES
| | - | Consolidated Statements of Shareholders'Shareholders’ Equity for the years ended June 30, 2020, 2019 and 2018 |
| | - | Notes to the Consolidated Financial Statements |
| | (a)(2)
| Financial Statement Schedules. None. |
Separate financial statement schedules have been omitted either because they are not applicable or because the required information is included in the consolidated financial statements or notes described in Item 15(a)(1) above.
| | (b)(3)
| The following Exhibits are filed as part of this report on Form 10-K:Exhibits.
|
The information required by this item is set forth below.
| | Exhibit
Number
| Exhibit
|
| | 3 (a)Incorporated by Reference
| | |
Exhibit Number | | Exhibit Description | | Form | | File No. | | Exhibit | | Filing Date | | Filed Herewith | |
3.1 | | Amended and Restated Certificate of Incorporation of the Company dated as of November 16, 2016 (incorporated by reference to Exhibit 3.(A) to the Current Report on Form 8-K of the Company filed with the SEC on November 18, 2016) |
| | 8-K | | 001-11692 | | 3(a) | | 11/18/2016 | | - | |
3.2 | 3 (b)
| Certificate of Designations relating to the New Convertible Preferred Stock dated as of March 23, 1993 (incorporated by reference to Exhibit 3(b) to the Annual Report on Form 10-K of the Company filed with the SEC on August 12, 2015) |
| | 10-K | | 001-11692 | | 3(b) | | 8/12/2015 | | - | |
3.3 | 3 (c)
| Certificate of Designations of Series C Junior Participating Preferred Stock dated as of July 3, 1996, and Certificate of Amendment of Certificate of Designations of Series C Junior Participating Preferred Stock dated as of December 27, 2004 (incorporated by reference to Exhibit 3(c) to the Annual Report on Form 10-K of the Company filed with the SEC on August 12, 2015) |
| | 10-K | | 001-11692 | | 3(c) | | 8/12/2015 | | - | |
3.4 | 3 (d)
| Amended and Restated By-laws of the Company (incorporated by reference to Exhibit 3.(D) to the Current Report on Form 8-K of the Company filed with the SEC on November 18, 2016) |
| | 8-K | | 001-11692 | | 3(d) | | 11/18/2016 | | - | |
3.5 | 3 (e)
| Certificate of Incorporation of Ethan Allen Global, Inc. (incorporated by reference to Exhibit 3(e) to the Registration Statement on Form S-4 of Ethan Allen Global, Inc. filed with the SEC on February 3, 2006) |
| | S-4 | | 333-131539-06 | | 3(e) | | 2/3/2006 | | - | |
3.6 | 3 (f)
| By-laws of Ethan Allen Global, Inc. (incorporated by reference to Exhibit 3(f) to the Registration Statement on Form S-4 of Ethan Allen Global, Inc. filed with the SEC on February 3, 2006) |
| | S-4 | | 333-131539-06 | | 3(f) | | 2/3/2006 | | - | |
3.7 | 3 (g)
| Restated Certificate of Incorporation of Ethan Allen Inc. (now known as, Ethan Allen Retail, Inc.) (incorporated by reference to Exhibit 3(g) to the Registration Statement on Form S-4 of Ethan Allen Global, Inc. filed with the SEC on February 3, 2006) |
| | S-4 | | 333-131539-06 | | 3(g) | | 2/3/2006 | | - | |
3.8 | 3 (g)-1
| Certificate of Amendment of Restated Certificate of Incorporation of Ethan Allen Inc. (now known as Ethan Allen Retail, Inc.) as of June 29, 2005 (incorporated by reference to Exhibit 3(g)-1 to the Registration Statement on Form S-4 of Ethan Allen Global, Inc. filed with the SEC on February 3, 2006) |
| | S-4 | | 333-131539-06 | | 3(g)-1 | | 2/3/2006 | | - | |
3.9 | 3 (h)
| Amended and Restated By-laws of Ethan Allen Inc. (now known as Ethan Allen Retail, Inc.) (incorporated by reference to Exhibit 3(h) to the Registration Statement on Form S-4 of Ethan Allen Global, Inc. filed with the SEC on February 3, 2006) |
| | S-4 | | 333-131539-06 | | 3(h) | | 2/3/2006 | | - | |
3.10 | 3 (i)
| Certificate of Incorporation of Ethan Allen Manufacturing Corporation (now known as Ethan Allen Operations, Inc.) (incorporated by reference to Exhibit 3(i) to the Registration Statement on Form S-4 of Ethan Allen Global, Inc. filed with the SEC on February 3, 2006) |
| | S-4 | | 333-131539-06 | | 3(i) | | 2/3/2006 | | - | |
3.11 | 3 (i)-1
| Certificate of Amendment of Certificate of Incorporation of Ethan Allen Manufacturing Corporation (now known as Ethan Allen Operations, Inc.) as of June 29, 2005 (incorporated by reference to Exhibit 3(i)-1 to the Registration Statement on Form S-4 of Ethan Allen Global, Inc. filed with the SEC on February 3, 2006) |
| | S-4 | | 333-131539-06 | | 3(i)-1 | | 2/3/2006 | | - | |
3.12 | 3 (j)
| By-laws of Ethan Allen Manufacturing Corporation (now known as, Ethan Allen Operations, Inc.) (incorporated by reference to Exhibit 3(j) to the Registration Statement on Form S-4 of Ethan Allen Global, Inc. filed with the SEC on February 3, 2006) |
| | S-4 |
| | 3 (k)333-131539-06
| | 3(j) | | 2/3/2006 | | - | |
ETHAN ALLEN INTERIORS INC. AND SUBSIDIARIES
ETHAN ALLEN INTERIORS INC. AND SUBSIDIARIES
| | 3 (l)S-4
| | 333-131539-06 | | 3(k) | | 2/3/2006 | | - | |
3.14 | | Limited Liability Company Operating Agreement of Ethan Allen Realty, LLC (incorporated by reference to Exhibit 3(l) to the Registration Statement on Form S-4 of Ethan Allen Global, Inc. filed with the SEC on February 3, 2006) |
| | S-4 | | 333-131539-06 | | 3(l) | | 2/3/2006 | | - | |
3.15 | 3 (l)-1
| Amendment No. 1 to Operating Agreement of Ethan Allen Realty, LLC as of June 30, 2005 (incorporated by reference to Exhibit 3(l)-1 to the Registration Statement on Form S-4 of Ethan Allen Global, Inc. filed with the SEC on February 3, 2006) |
| | S-4 | | 333-131539-06 | | 3(l)-1 | | 2/3/2006 | | - | |
3.16 | 3 (m)
| Certificate of Incorporation of Lake Avenue Associates, Inc. (incorporated by reference to Exhibit 3(m) to the Registration Statement on Form S-4 of Ethan Allen Global, Inc. filed with the SEC on February 3, 2006) |
| | S-4 | | 333-131539-06 | | 3(m) | | 2/3/2006 | | - | |
3.17 | 3 (n)
| By-laws of Lake Avenue Associates, Inc. (incorporated by reference to Exhibit 3(n) to the Registration Statement on Form S-4 of Ethan Allen Global, Inc. filed with the SEC on February 3, 2006) |
| | S-4 | | 333-131539-06 | | 3(n) | | 2/3/2006 | | - | |
3.18 | 3 (o)
| Certificate of Incorporation of Manor House, Inc. (incorporated by reference to Exhibit 3(o) to the Registration Statement on Form S-4 of Ethan Allen Global, Inc. filed with the SEC on February 3, 2006) |
| | S-4 | | 333-131539-06 | | 3(o) | | 2/3/2006 | | - | |
3.19 | 3 (p)
| Restated By-laws of Manor House, Inc. (incorporated by reference to Exhibit 3(p) to the Registration Statement on Form S-4 of Ethan Allen Global, Inc. filed with the SEC on February 3, 2006) |
| | S-4 | | 333-131539-06 | | 3(p) | | 2/3/2006 | | - | |
4.1 | | 10 (a)Description of Securities
| | - | | - | | - | | - | | X | |
10.1 | | Restated Directors Indemnification Agreement dated March 1993, among the Company and Ethan Allen and their Directors (incorporated by reference to Exhibit 10(c) to the Registration Statement on Form S-1 of the Company filed with the SEC on March 16, 1993) |
| | S-1 | | 33-57216 | | 10(c) | | 3/16/1993 | | - | |
10.2* | 10 (b)
| The Ethan Allen Retirement Savings Plan as Amended and Restated, effective January 1, 2006 (incorporated by reference to Exhibit 10(b)-7 to the Quarterly Report on Form 10-Q of the Company filed with the SEC on November 5, 2007 † |
| | 10-Q | | 001-11692 | | 10(b)-7 | | 11/5/2007 | | - | |
10.3 | 10 (c)
| Sales Finance Agreement, dated June 25, 1999, between the Company and MBNA America Bank, N.A. (incorporated by reference to Exhibit 10(j) to the Annual Report on Form 10-K of the Company filed with the SEC on September 13, 2000) |
| | 10-K | | 001-11692 | | 10(j) | | 9/13/2000 | | - | |
10.4 | 10 (d)
| Second Amended and Restated Private Label Consumer Credit Card Program Agreement, dated as of July 23, 2007, by and between Ethan Allen Global, Inc., Ethan Allen Retail, Inc. and GE Money Bank (incorporated by reference to Exhibit 10(e)-3 to the Quarterly Report on Form 10-Q of the Company filed with the SEC on November 5, 2007)(confidential treatment granted under Rule 24b-2 as to certain portions which are omitted and filed separately with the SEC) |
| | 10-Q | | 001-11692 | | 10(e)-3 | | 11/5/2007 | | - | |
10.5 | 10 (d)-1
| First Amendment to Second Amended and Restated Private Label Consumer Credit Card Program Agreement, dated as of July 25, 2008, by and between Ethan Allen Global, Inc., Ethan Allen Retail, Inc. and GE Money Bank (incorporated by reference as Exhibit 10(e)-1 to the Quarterly Report on Form 10-Q of the Company filed with the SEC on May 10, 2010) |
| | 10-Q | | 001-11692 | | 10(e)-1 | | 5/10/2010 | | - | |
10.6 | 10 (d)-2
| Second Amendment to Second Amended and Restated Private Label Consumer Credit Card Program Agreement, dated as of February 16, 2010, by and between Ethan Allen Global, Inc., Ethan Allen Retail, Inc. and GE Money Bank (incorporated by reference as Exhibit 10(e)-2 to the Quarterly Report on Form 10-Q of the Company filed with the SEC on May 10, 2010) (confidential treatment granted under Rule 24b-2 as to certain portions which are omitted and filed separately with the SEC) |
| | 10-Q | | 001-11692 | | 10(e)-2 | | 5/10/2010 | | - | |
10.7 | 10 (d)-3
| Third Amendment to Second Amended and Restated Private Label Consumer Credit Card Program Agreement, dated as of June 30, 2011, by and between Ethan Allen Global, Inc., Ethan Allen Retail, Inc. and GE Money Bank (incorporated by reference to Exhibit 10(e)-3 to the Quarterly Report on Form 10-Q of the Company filed with the SEC on November 3, 2010) (confidential treatment under Rule 24b-2 requested as to certain portions which are omitted and filed separately with the SEC) |
| | 10-Q | | 001-11692 | | 10(e)-3 | | 11/3/2010 | | - | |
10.8 | 10 (d)-4
| Fourth Amendment to Second Amended and Restated Private Label Consumer Credit Card Program Agreement dated as of January 1, 2014, by and between Ethan Allen Global, Inc., Ethan Allen Retail, Inc., and GE Capital Retail Bank (incorporated by reference to Exhibit 10(d)-4 to the Quarterly Report on Form 10-Q of the Company filed with the SEC on January 31, 2014) (confidential treatment requested under Rule 24b-2 as to certain portions which are omitted and filed separately with the SEC) |
ETHAN ALLEN INTERIORS INC. AND SUBSIDIARIES
| | 10 (d)-510-Q
| | 001-11692 | | 10(d)-4 | | 1/31/2014 | | - | |
10.9 | | Fifth Amendment to Second Amended and Restated Private Label Consumer Credit Card Program Agreement effective as of July 1, 2015, by and between Ethan Allen Global, Inc., Ethan Allen Retail, Inc., and Synchrony Bank (incorporated by reference to Exhibit 10.(D)-5 to the Annual Report on Form 10-K of the Company filed with the SEC on August 12, 2015) (confidential treatment requested under Rule 24b-2 as to certain portions which are omitted and filed separately with the SEC) |
| | 10-K | | 001-11692 | | 10 (d)-5 | | 8/12/2015 | | - | |
10.10* | 10 (e)
| Employment Agreement between the Company and M. Farooq Kathwari dated October 1, 2015 (incorporated by reference to Exhibit 10.1 to the Company’s Current Report on Form 8-K filed with the SEC on October 2, 2015) † |
| | 8-K | | 001-11692 | | 10.1 | | 10/2/2015 | | - | |
10.11* | 10 (e)-1
| Form of Performance-Based Stock Unit Agreement (incorporated by reference to Exhibit 10.2 to the Company’s Current Report on Form 8-K filed with the SEC on October 2, 2015) † |
| | 8-K | | 001-11692 | | 10.2 | | 10/2/2015 | | - | |
10.12* | 10 (e)-2
| Change in Control Severance Plan (incorporated by reference to Exhibit 10.3 to the Company’s Current Report on Form 8-K filed with the SEC on October 2, 2015) † |
| | 8-K |
| | 10 (f)-1001-11692
| Credit Agreement, dated as of May 29, 2009, among Ethan Allen Global, Inc., Ethan Allen Interiors Inc., J.P. Morgan Chase Bank, N.A., and Capital One Leverage Finance Corp (confidential treatment requested as to certain portions (Incorporated by reference to Exhibit 10(g)-2 to the Annual Report on Form 10-K of the Company filed with the SEC on August 24, 2009)
|
| | 10.3 |
| | 10 (f)-210/2/2015
| Amendment No. 1, dated as of October 23, 2009 to the Credit Agreement dated May 29, 2009, among Ethan Allen Global, Inc., Ethan Allen Interiors Inc., J.P.Morgan Chase Bank, N.A., and the lenders thereunder (incorporated by reference to Exhibit 10(g)-3 to the Quarterly Report on Form 10-Q of the Company filed with the SEC on November 9, 2009).
|
| | |
| 10 (f)-3-
| Amendment No. 2, dated as of March 25, 2011, to the Credit Agreement dated May 29, 2009, among Ethan Allen Global, Inc., Ethan Allen Interiors Inc., J.P.Morgan Chase Bank, N.A., and Wells Fargo Bank, National Association (incorporated by reference to Exhibit 10(g)-3 to the Quarterly Report on Form 10-Q of the Company filed with the SEC on May 5, 2011)
|
| | |
| 10 (f)-4
| Amended and Restated Credit Agreement, dated October 21, 2014, among Ethan Allen Global, Inc., Ethan Allen Interiors Inc., J.P. Morgan Chase Bank, N.A., and Capital One, National Association (incorporated by reference to Exhibit 10.1 to the Current Report on Form 8-K of the Company filed with the SEC on October 22, 2014)
|
| | |
| 10 (f)-5
| Amendment No. 2 Dated as of September 10, 2015 to Amended and restated credit agreement dated as of October 21, 2014 among Ethan Allen Global, Inc., and J.P. Morgan Chase Bank, N.A. as Administrative Agent and Syndication Agent, and Capital One, National Association as Documentation Agent dated as of October 21, 2014 (incorporated by reference to Exhibit 10.1 to the Company’s Quarterly Report on Form 8-K filed with the SEC on September 11, 2015)
|
| | |
| 10 (f)-6
| Amendment No. 3, dated as of January 22, 2016, to the Amended and Restated Credit Agreement dated as of October 21, 2014 among Ethan Allen Global, Inc., Ethan Allen Interiors Inc., J.P.Morgan Chase Bank, N.A. and Capital One, National Association (incorporated by reference to the Company’s Quarterly Report on Form 10-Q filed with the SEC on January 27, 2016).
|
| | |
| 10 (g)
| Amended and Restated 1992 Stock Option Plan (incorporated by reference to Exhibit 10(f) to the Current Report on Form 8-K of the Company filed with the SEC on November 19, 2007) †
|
| | |
| 10 (g)-1
| Form of Option Agreement for Grants to Independent Directors (incorporated by reference to Exhibit 10(h)-4 to the Annual Report on Form 10-K of the Company filed with the SEC on September 13, 2005) †
|
| | |
| 10 (g)-2
| Form of Option Agreement for Grants to Employees (incorporated by reference to Exhibit 10(h)-5 to the Annual Report on Form 10-K of the Company filed with the SEC on September 13, 2005 †
|
| | |
| 10 (g)-3
| Form of Restricted Stock Agreement for Executives (incorporated by reference to Exhibit 10(f)-1 to the Current Report on Form 8-K of the Company filed with the SEC on November 19, 2007) †
|
ETHAN ALLEN INTERIORS INC. AND SUBSIDIARIES
10.13 | | Credit Agreement, dated as of May 29, 2009, among Ethan Allen Global, Inc., Ethan Allen Interiors Inc., JPMorgan Chase Bank, N.A., and Capital One Leverage Finance Corp (confidential treatment requested as to certain portions | | 10-K | | 001-11692 | | 10(g)-2 | | 8/24/2009 | | - | |
10.14 | | Amendment No. 1, dated as of October 23, 2009 to the Credit Agreement dated May 29, 2009, among Ethan Allen Global, Inc., Ethan Allen Interiors Inc., JPMorgan Chase Bank, N.A., and the lenders thereunder | | 10-Q | | 001-11692 | | 10(g)-3 | | 11/9/2009 | | - | |
10.15 | | Amendment No. 2, dated as of March 25, 2011, to the Credit Agreement dated May 29, 2009, among Ethan Allen Global, Inc., Ethan Allen Interiors Inc., JPMorgan Chase Bank, N.A., and Wells Fargo Bank, National Association | | 10-Q | | 001-11692 | | 10(g)-3 | | 5/5/2011 | | - | |
10.16 | | Amended and Restated Credit Agreement, dated October 21, 2014, among Ethan Allen Global, Inc., Ethan Allen Interiors Inc., JPMorgan Chase Bank, N.A., and Capital One, National Association | | 8-K | | 001-11692 | | 10.1 | | 10/22/2014 | | - | |
10.17 | | Amendment No. 2 Dated as of September 10, 2015 to Amended and Restated credit agreement dated as of October 21, 2014 among Ethan Allen Global, Inc., and JPMorgan Chase Bank, N.A. as Administrative Agent and Syndication Agent, and Capital One, National Association as Documentation Agent dated as of October 21, 2014 | | 8-K | | 001-11692 | | 10.1 | | 9/11/2015 | | - | |
10.18 | | Amendment No. 3, dated as of January 22, 2016, to the Amended and Restated Credit Agreement dated as of October 21, 2014 among Ethan Allen Global, Inc., Ethan Allen Interiors Inc., JPMorgan Chase Bank, N.A. and Capital One, National Association | | 10-Q | | 001-11692 | | 10.1 | | 1/27/2016 | | - | |
10.19 | | Second Amended and Restated Credit Agreement among Ethan Allen Interiors, Inc., most of its domestic subsidiaries, JPMorgan Chase Bank, N.A., as Administrative Agent and Syndication Agent, and Capital One, National Association, as Documentation Agent, dated as of December 21, 2018 | | 8-K | | 001-11692 | | 10.1 | | 12/21/2018 | | - | |
10.20* | | Ethan Allen Interiors Inc. Stock Incentive Plan | | DEFC14A | | 001-11692 | | Appendix A | | 10/27/2015 | | - | |
10.21* | | Form of Option Agreement for Grants to Independent Directors | | 10-K | | 001-11692 | | 10(h)-4 | | 9/13/2005 | | - | |
10.22* | | Form of Option Agreement for Grants to Employees | | 10-K | | 001-11692 | | 10(h)-5 | | 9/13/2005 | | - | |
10.23* | | Form of Restricted Stock Agreement for Executives | | 8-K | | 001-11692 | | 10(f)-1 | | 11/19/2007 | | - | |
10.24* | | Form of Restricted Stock Agreement for Directors | | 8-K | | 001-11692 | | 10(f)-2 | | 11/19/2007 | | - | |
10.25* | | Form of performance condition option agreement for employees | | 10-Q | | 001-11692 | | 10(g)-5 | | 5/1/2014 | | - | |
21 | | List of subsidiaries of Ethan Allen Interiors Inc. | | - | | - | | - | | - | | X | |
23 | | Consent of KPMG LLP | | - | | - | | - | | - | | X | |
31.1 | | Certification of Principal Executive Officer pursuant to Exchange Act Rule 13a-14(a)/15d-14(a), as adopted pursuant to Section 302 of the Sarbanes-Oxley Act of 2002 | | - | | - | | - | | - | | X | |
31.2 | | Certification of Principal Financial Officer pursuant to Exchange Act Rule 13a-14(a)/15d-14(a), as adopted pursuant to Section 302 of the Sarbanes-Oxley Act of 2002 | | - | | - | | - | | - | | X | |
ETHAN ALLEN INTERIORS INC. AND SUBSIDIARIES
* Furnished herewith.
† Management contract or compensatory plan, contract or arrangement.arrangement
† Furnished herewith
ItemITEM 16. FormFORM 10-K SummarySUMMARY
None.
ETHAN ALLEN INTERIORS INC. AND SUBSIDIARIES
SIGNATURES
Pursuant to the requirements of Section 13 or 15(d) of the Securities Exchange Act of 1934, the Registrant has duly caused this Annual Report on Form 10-K to be signed on its behalf by the undersigned, thereunto duly authorized.
| ETHAN ALLEN INTERIORS INC. (Registrant) |
DATE:
| | | | Date: August 2, 201827, 2020 | By | /s/ M. Farooq Kathwari | | | (M. Farooq Kathwari)Kathwari
| | | Chairman, President and Chief Executive Officer (Principal Executive Officer)
| | By
| /s/ Corey Whitely
| | DATE: August 2, 2018 | (Corey Whitely)
Executive Vice President, Administration, Chief Financial Officer and Treasurer
(Principal Financial Officer)
|
KNOW ALL MEN BY THESE PRESENTS,
POWER OF ATTORNEY Know all persons by these presents, that each individualperson whose signature appears below hereby constitutes and appoints M. Farooq Kathwari and Corey Whitely, and each of them, individually, his or heras such person’s true and lawful agent, proxyattorneys-in-fact and attorney-in-fact,agents, with full power of substitution and resubstitution, for him or hersuch person and in his or hersuch person’s name, place and stead, in any and all capacities, to (i) actsign any and all amendments to this Annual Report on signForm 10-K, and to file the same, with all exhibits thereto, and all other documents in connection therewith, with the Securities and Exchange Commission, any and all amendments to this Report together with all schedules and exhibits thereto, (ii) act on, sign and file with the Securities and Exchange Commission any and all exhibits to this Report and any and all exhibits and schedules thereto, (iii) act on, sign and file any and all such certificates, notices, communications, reports, instruments, agreements and other documents as may be necessary or appropriate in connection therewith and (iv) take any and all such actions which may be necessary or appropriate in connection therewith, granting unto sucheach said attorneys-in-fact and agents, proxies and attorneys-in-fact, and each of them, individually, full power and authority to do and perform each and every act and thing requisite and necessary or appropriate to be done in connection therewith, as fully forto all intents and purposes as he or shesuch person might or could do in person, and hereby approving, ratifying and confirming all that suchsaid attorneys-in-fact and agents, proxies and attorneys-in-fact,or any of them or any of his, hertheir or theirsuch person’s substitute or substitutes, may lawfully do or cause to be done by virtue hereof.thereof. Pursuant to the requirements of the Securities Exchange Act of 1934, this Annual Report on Form 10-K has been signed below by the following persons on behalf of the Registrant and in the capacities andindicated on the date indicated.August 27, 2020. Name | | Title | | | | /s/ M. Farooq Kathwari | | Chairman, President and Chief Executive Officer | (M. Farooq Kathwari) | | (Principal Executive Officer) | | | | | /s/ Corey Whitely | | Executive Vice President, Administration, | (Corey Whitely) | | Chief Financial Officer and Treasurer (Principal Financial Officer) | | | | | /s/ John S. BedfordMatthew J. McNulty | | Vice President, Corporate ControllerFinance | (John S. Bedford)Matthew J. McNulty) | | (Principal Accounting Officer) | | | | | /s/ James B. Carlson | | Director | | (James B. Carlson) | | | | | | | /s/ John J. Dooner Jr. | | Director | | (John J. Dooner Jr.) | | | | | | | /s/ Domenick J. Esposito | | Director | | (Domenick J. Esposito) | | | | | | | /s/ Mary Garrett | | Director | | (Mary Garrett) | | | | | | | /s/ James W. Schmotter | | Director | | (James W. Schmotter) | | | | | | | /s/ Tara I. Stacom | | Director | | (Tara I. Stacom) | | | | | | Date: August 2, 2018
| | |
57
|