Special Note Regarding Forward-Looking Statements
Certain matters discussed in this Annual Report on Form 10-K are “forward-looking statements” within the meaning of Section 21E of the Securities Exchange Act of 1934, as amended. These forward-looking statements can generally be identified as such because the context of the statement includes phrases such as National Research Corporation, doing business as NRC Health (“NRC Health,” the “Company,” “we,” “our,” “us” or similar terms), “believes,” “expects,” “may,” “could,” “anticipates,” or the use of words such as “would,” “may,” “could,” or “should,” or other words of similar import. Similarly, statements that describe our future plans, objectives or goals are also forward-looking statements. In this Annual Report on Form 10-K, statements regarding the future impact of adopting new accounting standards, value and utility of, and market demand for, our service offerings, our ability to compete successfully in the future, future opportunities for growth with respect to new and existing clients, our future acquisition opportunities,ability to compete and the types of firms with which we will compete, future consolidation in the healthcare industry, the future adequacy of our liquidity sources, future revenue sources, future revenue growth, future revenue estimates used to calculate recurring contract value, future capital expenditures and the timing, amount, and sources of cash to fund such capital expenditures, future stock repurchases and dividends, the expected impact of pending claims and contingencies, the future outcome of uncertain tax positions, our future use of owned and leased real property, the source of funds for future payments of deferred purchase price obligations and other cash expenses, the future phase out of LIBOR and applicable replacement benchmark rates and the expected impact of the COVID-19 pandemic and related government mandates and recommendations, among others, are forward-looking statements. Such forward-looking statements are subject to certain risks and uncertainties which could cause actual results or outcomes to differ materially from those currently anticipated. Factors that could affect actual results or outcomes include, without limitation, the following factors:
● | The likelihood that the COVID-19 pandemic will adversely affect our operations, sales, earnings, financial condition and liquidity; |
● | The possibility of non-renewal of our client service contracts, reductions in services purchased or prices, and |
● | Our ability to compete in our markets, which are highly competitive with new market entrants, and the possibility of increased price pressure and expenses; |
● | The effects of an economic downturn; |
● | The impact of consolidation in the healthcare industry; |
● | The impact of federal healthcare reform legislation or other regulatory changes; |
● | Our ability to |
● | The |
|
|
|
|
|
|
● | The possibility |
|
|
● | The possibility that we or our third-party providers could be subject to cyber-attacks, security breaches or computer viruses; and |
● | The factors set forth under the caption “Risk Factors” in Part I, Item 1A of this Annual Report on Form |
Shareholders, potential investors and other readers are urged to consider these and other factors in evaluating the forward-looking statements and are cautioned not to place undue reliance on such forward-looking statements. The forward-looking statements included are only made as of the date of this Annual Report on Form 10-K and we undertake no obligation to publicly update such forward-looking statements to reflect subsequent events or circumstances, except as required by the federal securities laws.
General
Our purpose is to establish human understanding by enabling our clients to understand what matters most to each person they serve. We are a leading provider of analytics and insights that facilitate measurement and improvement of the patient and employee experience while also increasing patient engagement and customer loyalty for healthcare organizations. Our solutions enable our clients to understand the voice of the customer with greater clarity, immediacy and depth. Our heritage, proprietary methods, and holistic approach enable our partners to better understand the people they care for and design experiences that inspire loyalty and trust, while also facilitating regulatory compliance and the shift to population-based health management. Our ability to measure what matters most and systematically capture, analyze and deliver insights based on self-reported information from patients, families and consumers is critical in today’s healthcare market. We believe that access to and analysis of our extensive consumer-driven information is becoming more valuable as healthcare providers increasingly need to more deeply understand and engage the people they serve to build customer loyalty.
Our expertise includes the efficient capture, transmittal, benchmarking, analysis and interpretation of critical data elements from millions of healthcare consumers. Using our digital Voice of the Customer platform,solutions, our clients gain insights into what people think and feel about their organizations in real-time, allowing them to build on their strengths and resolve service issues with greater speed and personalization. We also provide legacy experience-based solutions and shared intelligence from industry thought leaders and the nation’s largest member network focused on healthcare governance and strategy to member boards and executives.
Our portfolio of subscription-based solutions provides actionable information and analysis to healthcare organizations across a range of mission-critical, constituent-related elements, including patient experience, service recovery, care transitions, health risk assessments, employee engagement, reputation management and brand loyalty. We partner with clients across the continuum of healthcare services. Our clients include integrated health systems, post-acute providers and payer organizations. We believe this cross-continuum positioning is a unique and an increasingly important capability as evolving payment models drive healthcare providers and payers towards a more collaborative and integrated service model.
We have a broad and diversified client base that is distributed primarily across the United States. Our ten largest clients collectively accounted for 14%, 14%, and 16% of our total revenue in 2021, 2020 and 2019, respectively. Approximately 2%, 2% and 3% of our revenue was derived from foreign customers in 2021, 2020, and 2019, respectively.
We have achieved a market leadership position through our more than 3840 years of industry innovation and experience, as well as our long-term, recurring revenue relationships (solutions that are used or required by a client each year) with many of the healthcare industry’s largest organizations. Since our founding in 1981, we have focused on meeting the evolving information needs of the healthcare industry through internal product development, as well as select acquisitions. We are a WisconsinDelaware corporation headquartered in Lincoln, Nebraska.
Industry and Market Opportunity
According to the Centers for Medicare and Medicaid Services (“CMS”), health expenditures in the United States were approximately $3.6 trillion in 2018, or $11,172 per person. In total, health spending accounted for 17.7% of the nation’s Gross Domestic Product in 2018. Addressing this growing expenditure burden continues to be a major policy priority at both federal and state levels. In addition, increased co-pays and deductibles in healthcare plans have focused even more consumer attention on health spending and affordability. In the public sector, Medicare provides health coverage for individuals aged 65 and older, while Medicaid provides coverage for low income families and other individuals in need. Both programs are administered by the CMS. With the aging of the U.S. population, Medicare enrollment has increased significantly. In addition, longer life spans and greater prevalence of chronic illnesses among both the Medicare and Medicaid populations have placed tremendous demands on the health care system.
An increasing percentage of Medicare reimbursement and reimbursement from commercial payers will be determined under value payment models, based on factors such as patient readmission rates and provider adherence to certain quality-related protocols. At the same time, many hospitals and other providers are creating new models of care delivery to improve patient experience, reduce cost and provide better clinical outcomes. These new models are based on sharing financial risk and managing the health and behaviors of large populations of patients and consumers. This transformation towards value-based payment models and increased engagement of healthcare consumers is resulting in a greater need for existing healthcare providers to deliver more customer-centric healthcare. At the same time, organizations that have successfully developed effective customer service models and brand loyalty in other industry verticals are entering the healthcare services market.
We believe that our current portfolio of solutions is uniquely aligned to address these healthcare market trends and related business opportunity. We provide tools and solutions to capture, interpret and improve the Consumer Assessment of Healthcare Providers and Systems ("CAHPS") data required by CMS as well as real time feedback that enables clients to better understand what matters most to people at key moments in their relationship with a health organization. Our solutions enable our clients to both satisfy patient survey compliance requirements and design experiences to build loyalty and improve the wellbeing of the people and communities they care for.
OurHuman Understanding Solutions
Our portfolio of solutions represent a unique set of capabilities that individually and collectively provide value to our clients. The solutions are offered at an enterprise level through the Voice of the Customer platform, The Governance Institute, and legacy Experience solutions.
Voice of the Customer Platform Solutions
Our Voice of the Customer (“VoC”) platform represents a portfolio of solutions that collectively provide a comprehensive set of capabilities that enable healthcare providers to collect, measure and analyze data collected across the patient journey to understand the preferences, experiences and needs of the people they serve. TheOur digital platform consistssolutions consist of three primary solution categories which can be implemented both collectively as an enterprise solution or individually to meet specific needs within the organization. The primary solution categories include Market Insights solutions, Transparency solutions, and certain Experience solutions.
Market Insights Solutions – Our Market Insights solutions are subscription-based services that allow for improved tracking of awareness, perception, and consistency of healthcare brands; real-time assessment of competitive differentiators; and enhanced segmentation tools to evaluate the needs, wants, and behaviors of communities through real-time competitive assessments and enhanced segmentation tools. Market Insights is the largest U.S. healthcare consumer database of its kind, measuring the opinions and behaviors of approximately 300,000 healthcare consumers in over the top 300 markets across the countrycontiguous United States annually. Our Market Insights is a syndicated survey that provides clients with an independent third-party source of information that is used to understand consumer perception and preferences and optimize marketing strategies. Our Market Insights solutions provide clients with on-demand tools to measure brand value and build brand equity in their markets, evaluate and optimize advertising efficacy and consumer recall, and tailor research to obtain the real time voice of customer feedback to support branding and loyalty initiatives. Our Market Insights solutions were historically marketed under the Healthcare Market Guide and Ticker brands.
Experience Solutions – Our Experience solutions are provided on a subscription basis via a cross-continuum VoCmulti-mode digital platform that collects and measures data and then delivers business intelligence that our clients utilize to improve patient experience, engagement and loyalty. Patient experience data can also be collected on a periodic basis using CAHPS compliant mail and telephone survey methods for regulatory compliance purposes and to monitor and measure improvement in CAHPS survey scores. CAHPSConsumer Assessment of Healthcare Providers and Systems (“CAHPS”) survey data can be collected and measured as an integrated service within the VoCour digital platform or independently as a legacy service offering. Our Experience solutions provide hospitals and healthcare providerssystems the ability to receive and take action on customer and employee feedback across all care settings in real-time. Experience solutions include patient and resident experience, workforce engagement, health risk assessments, transitions,care transition, and improvement tools, which are provided through the Experience, Transitions and National Research Canada Corporation operating segments.tools. These solutions enable clients to comply with regulatory requirements and to improve their reimbursement under value-based purchasing models. More importantly, our Experience solutions provide quantitative and qualitative real-time feedback, improvement plans, and coaching tools to enable clients to improve the experiences of patients, residents, physicians and staff.insights. By illuminating the complete care journey in real time, our clients are able to ensure each individual receives the care, respect, and experience he or she deserves. Developing a longitudinal profile of what healthcare customers want and need allows for organizational improvement and increased clinician and staff engagement, loyal relationships and personal well-being. These solutions have previously been marketed under the NRC Picker, My InnerView (“MIV”), Customer-Connect LLC (“Connect”), and NRC Canada brands.customer loyalty.
Our Health Risk AssessmentExperience solutions (formerly Payer solutions) enable our clients to understandalso include the health risks associated with populations of patients, analyze and address readmission risks, and efficiently reach out to patients to impact their behaviors outside of the healthcare provider settings. These health risk assessment solutions enable clients to effectively segment populations and manage care for those who are most at-risk, engage individuals, increase preventative care and manage wellness programs to improve patient experience and outcomes.
Our Transitions solutions are provided to healthcare organizations on a subscription basissolution to drive effective communication between healthcare providers and patients in the critical 24-72 hours post discharge using aan automated discharge call program.workflow supported by our digital platform. Through preference-based communications and real-time alerts, these solutions enable organizations to identify and manage high-risk patients to reduce readmissions, increase patient satisfaction and support safe care transitions. Tracking, trending and benchmarking tools isolate the key areas for process improvement allowing organizations to implement changes and reduce future readmissions. Our Transitions solutions were previously provided by Connect.
Transparency Solutions – Our Transparency solutions allow healthcare organizations to share a picture of their organization and ensure that timely and relevant content informs better consumer decision-making. Our Star Ratings solution (formerly Reputation) enables clients to publish a five-star rating metric and verified patient feedback derived from actual patient survey data to complement their online physician information. Sharing this feedback not only results in better-informed consumer decision-making but also has the ability to drive new patient acquisition and grow online physician reputation. Our Reputation Monitoring solution alerts clients to ratings and reviews on third-party websites and provides workflows for response and service recovery. These solutions raise physician awareness of survey results and provide access to improvement resources and educational development opportunities designed to improve the way care is delivered.
The Governance Institute
Our Governance solutions, branded as The Governance Institute (“TGI”), serves not-for-profit hospital and health system boards of directors, executives, and physician leadership. TGI’s subscription-based, value-driven membership services are provided through national conferences, publications, advisory services, and an online portal designed to improve the effectiveness of hospital and healthcare systems by continually strengthening their board governance, strategic planning, medical leadership, management performance and transparency positioning.customer loyalty. TGI also conducts research studies and tracks industry trends showcasing emerging healthcare trends and best practice solutions of healthcare system boards across the country. TGI thought leadership helps our client board members and executives inform and guide their organization’s strategic priorities in alignment with the rapidly changing healthcare market.
For additional information on our operating segmentssegment and our revenue and assets by geographic area, see Note 13, “Segment Information,” to our consolidated financial statements.
Markets
Growth Strategy
We believe that the value proposition of our current solutions, combined with the favorable alignment of our solutions with emerging market demand, positions us to benefit from multiple growth opportunities. We believe that we can accelerate our growth through (1) increasing scope of services and sales of our existing solutions to our existing clients (or cross-selling), (2) winning additional new clients through market share growth in existing market segments, (3) developing and introducing new solutions to new and existing clients, and (4) pursuing acquisitions of, or investments in, firms providing products, solutions or technologies which complement ours.
Increasing contract value with existing clients. Approximately 32% of our existing clients purchase more than one of our solutions. Our sales organization actively identifies and pursues cross-sell opportunities for clients to add additional solutions in order to accelerate our growth. Organic contract value growth is also realized by the increased scope of solution adoption as the size of client organizations increase from market expansion and consolidation.
Our Competitive Strengths
Adding new clients. We believe that our competitive strengths includethere is an opportunity to add new clients across all existing market segments. Our sales organization is actively identifying and engaging new client prospects with a focus on demonstrating the following:economic value derived from adopting the portfolio of solutions in alignment with the prospect’s strategic objectives.
A leading provider of patient experienceAdding new solutions. The need for effective solutions in the market segments that we serve is evolving to align with emerging healthcare consumerism trends. The evolving market creates an opportunity for healthcare providers, payersus to introduce new solutions that leverage and other healthcare organizations. Our historyextend our existing core competencies. We believe that there is based on capturing the voicean opportunity to drive sales growth with both existing and new clients, across all of the consumer in healthcare markets. Our solutions build on the “Eight Dimensions of Patient-Centered Care,” a philosophy developed by noted patient advocate Harvey Picker, who believed patients’ experiences are integral to quality healthcare. This foundation has been enhancedmarket segments that we serve, through the digital VoC platform offering that provides the deliveryintroduction of data and insights on a real time basis.new solutions.
Premier client portfolio acrossPursue strategic acquisitions and investments. We have historically complemented our organic growth with strategic acquisitions, having completed eight such transactions over the care continuum. Our client portfolio encompasses leading healthcare organizations acrosspast nineteen years. These transactions have added new capabilities and access to market segments that are adjacent and complementary to our existing solutions and market segments. We believe that additional strategic acquisition and/or investment opportunities will exist from time to time to complement our organic growth by further expanding our service capabilities, technology offerings and end markets.
We generate the healthcare continuum, from acute care hospitals and post-acute providers to healthcare payers. Our client base is diverse, with our top ten clients representing approximately 16% of total revenue for the year ended December 31, 2019 and no single client representing more than 4%majority of our revenue.
Highly scalable and visible revenue model. Our solutions are offered to healthcare providers, payers and other healthcare organizations primarily through subscription-based service agreements. The solutions we provide are also recurring in nature, which enables an ongoing relationship with our clients. This combinationfrom the renewal of subscription-based revenue, a baseclient service agreements, supplemented by sales of ongoing client renewalsadditional solutions to existing clients and automated platforms creates a highly visible and scalable revenue model.the addition of new clients. Our sales activities are carried out by our direct sales organization staffed with professional, trained sales associates.
Comprehensive portfolio of solutions. We offer a portfolio of solutionsengage in marketing activities that provide insights across the patient journey, which is uniqueenhance our brand visibility in the healthcare industry, enablingmarketplace, generate demand for our clients to initially establish an enterprise relationship utilizing the entire portfolio or begin with an individual solutionsolutions and increase the scope of services over time, increasing overall contract value.
Exclusiveengage existing clients. Strategic campaigns and programs focus on healthcare. We focus exclusively(1) ensuring coverage of prospective clients via targeted advertising and account-based campaigns, (2) elevating client value evidence and success stories to an executive level profile, (3) engaging key stakeholders with content, programming and events and (4) amplifying thought leadership through public and media relations programs that include earning placement in national media and trade publications, securing podium presentations at key industry events and winning awards on healthcarebehalf of us and serving the unique needs of healthcare organizations across the continuum, which we believe gives us a distinct competitive advantage compared to other survey and analytics software providers. Our platform includes features and capabilities built specifically for healthcare providers, including a library of performance improvement content which can be tailored to the provider based on their specific customer feedback profile.
Experienced senior management team led by our founder. Our senior management team has extensive industry and leadership experience. Michael D. Hays, our Chief Executive Officer, founded NRC Health in 1981. Prior to launching the Company, Mr. Hays served as Vice President and as a Director of SRI Research Center, Inc. (now known as the Gallup Organization). Our Chief Financial Officer, Kevin Karas, CPA, has extensive financial experience having served as CFO at two previous companies, along with healthcare experience at Rehab Designs of America, Inc. and NovaCare, Inc. Steven D. Jackson, our President, served as Chief Strategy Officer for Vocera Communications, and he also served as Chief Operating Officer for ExperiaHealth.executives.
Competition
The healthcare information and market research services industry is highly competitive. We have traditionally competed with healthcare organizations’ internal marketing, market research, and/or quality improvement departments which create their own performance measurement tools, and with relatively small specialty research firms which provide survey-based healthcare market research and/or performance assessment. Our primary competitors among such specialty firms include Press Ganey, which we believe has significantly higher annual revenue than us, and several other organizations that we believe have less annual revenue than us. We to a certain degree, currentlyalso compete with and anticipate that in the future we may increasingly compete with, (1) market research firms and technology solutions which provide survey-based, general market research or voice of the customer feedback capabilities and (2) firms that provide services or products that complement healthcare performance assessments such as healthcare software or information systems.
We believe the primary competitive factors within our market include quality of service, timeliness of delivery, unique service capabilities, credibility of provider, industry experience, and price. We believe that our industry leadership position, exclusive focus on the healthcare industry, cross-continuum presence, comprehensive portfolio of solutions and relationships with leading healthcare payers and providers position us to compete in this market.
Although only a few of these competitors have offered specific services that compete directly with our solutions, many of these competitors have substantially greater financial, information gathering, and marketing resources than us and could decide to increase their resource commitments to our market. There are relatively few barriers to entry into our market, and we expect increased competition in our market which could adversely affect our operating results through pricing pressure, increased marketing expenditures, and market share losses, among other factors. There can be no assurance that we will continue to compete successfully against existing or new competitors.
We believe that our competitive strengths include the following:
A leading provider of patient experience solutions for healthcare providers, payers and other healthcare organizations. Our history is based on capturing the voice of the consumer in healthcare markets. Our solutions build on the “Eight Dimensions of Patient-Centered Care,” a philosophy developed by noted patient advocate Harvey Picker, who believed patients’ experiences are integral to quality healthcare. This foundation has been enhanced through our digital platform offering that provides the delivery of data and insights on a real time basis to understand what matters most to each individual. Based on our more than 40 years of experience, we are able to deliver unique and relevant healthcare domain expertise to the clients we serve.
Growth Strategy
We believe thatEstablished client base of leading healthcare organizations. Our client portfolio encompasses a majority of the value propositionleading healthcare systems across the United States. Over 275 of our current solutions, combined with the favorable alignment of our solutions with emerging market demand, positions us to benefit from multiple growth opportunities. We believe that we can accelerate our growth through (1) increasing scope of services and sales of our existing solutions to our existing clients (or cross-selling), (2) winning additional new clients through market share growth in existing market segments, (3) developing and introducing new solutions to new and existing clients, and (4) pursuing acquisitions of,top 400 healthcare systems based on net patient revenue are currently using one or investments in, firms providing products, solutions or technologies which complement ours.
Increasing contract value with existing clients. Approximately 27% of our existing clients purchase more than one of our solutions. Our sales organization actively identifiesclient base provides a unique network effect to share best practices among existing clients and pursues cross-sell opportunities for clients to add additional solutions in order to accelerate our growth. Organic contract value growth is also realized by the increased scope of solution adoption as the size of client organizations increase from market expansion and consolidation.
Addingattract new clients. We believe that there is anOur existing client base also provides a significant organic growth opportunity to add new clients across all existing market segments. Our sales organization is actively identifyingupsell and engaging new client prospects with a focus on demonstrating the economic value derived from adopting the portfolio of solutions in alignment with the prospect’s strategic objectives.
Adding new solutions. The need for effective solutions in the market segments that we serve is evolving to align with emerging healthcare consumerism trends. The evolving market creates an opportunity for us to introduce new solutions that leverage and extend our existing core competencies. We believe that there is an opportunity to drive sales growth with both existing and new clients, across all of the market segments that we serve, through the introduction of newcross sell additional solutions.
Pursue strategic acquisitionsHighly scalable and investments.visible revenue model. Our solutions are offered primarily through fixed price, subscription-based service agreements. The solutions we provide are also recurring in nature, which enables an ongoing relationship with our clients and favorable retention. This combination of subscription-based revenue, a base of ongoing client renewals and automated platforms creates a highly visible and scalable revenue model.
Comprehensive portfolio of solutions. We offer a portfolio of solutions that provide insights across the patient journey, which is unique in the healthcare industry. Our solutions enable the collection of data and insights from individuals prior to receiving care and then throughout their care journey from first encounter to after completion of their care. The data and insights provided through our solutions enable our clients to better understand what matters most to each person they serve to meet expectations and increase customer loyalty.
Exclusive focus on healthcare. We have historically complementedfocus exclusively on healthcare and serving the unique needs of healthcare organizations across the continuum, which we believe gives us a distinct competitive advantage compared to other survey and analytics software providers. Our value proposition incorporates the benefits to clients derived from our organic growth with strategic acquisitions, having completed seven such transactionsdeep subject matter expertise that has been built from helping healthcare organizations over the past eighteen40 years. These transactions have added newOur platform includes features and capabilities and accessbuilt specifically for healthcare providers, including a library of performance improvement content which can be tailored to market segments that are adjacent and complementary to our existing solutions and market segments. We believe that additional strategic acquisition and/or investment opportunities will exist from time to time to complement our organic growth by further expanding our service capabilities, technology offerings and end markets.the provider based on their specific customer feedback profile.
SalesExperienced senior management team led by our founder. Our senior management team has extensive industry and Marketingleadership experience. Michael D. Hays, our Chief Executive Officer and President, founded NRC Health in 1981. Prior to launching the Company, Mr. Hays served as Vice President and as a Director of SRI Research Center, Inc. (now known as the Gallup Organization). Our Chief Financial Officer, Kevin Karas, CPA, has extensive financial experience having served as CFO at two previous companies, along with healthcare experience at Rehab Designs of America, Inc. and NovaCare, Inc. Jona Raasch has served as our Chief Operating Officer for most of the last 30 years and as Chief Executive Officer of the Governance Institute for more than 15 years. Helen Hrdy was appointed as our Chief Growth Officer in 2020. Prior to this position Ms. Hrdy served as our Senior Vice President, Customer Success, for eight years.
We generate the majority of our revenue from the renewal of subscription-based client service agreements, supplemented by sales of additional solutions to existing clients and the addition of new clients. Our sales activities are carried out by a direct sales organization staffed with professional, trained sales associates.
We engage in marketing activities that enhance our brand visibility in the marketplace, generate demand for our solutions and engage existing clients. Strategic campaigns and programs focus on (1) ensuring coverage of prospective clients via targeted advertising and account-based campaigns, (2) elevating client value evidence and success stories to an executive level profile, (3) engaging key stakeholders with content, programming and events and (4) amplifying thought leadership through public and media relations programs that include earning placement in national media and trade publications, securing podium presentations at key industry events and winning awards on behalf of us and our executives.
Clients
We partner with clients across the continuum of healthcare services. Our clients include integrated health systems, post-acute providers and payer organizations. Our ten largest clients accounted for 16%, 17%, and 19% of our total revenue in 2019, 2018 and 2017, respectively. Approximately 3%, 4% and 4% of our revenue was derived from foreign customers in 2019, 2018, and 2017, respectively.
Intellectual Property and Other Proprietary RightsResources
Our success depends in part upon our data collection processes, research methods, data analysis techniques and internal systems, and procedures that it haswe have developed specifically to serve clients in the healthcare industry. We have no patents.patents for most of our intellectual property. Consequently, we rely on a combination of copyright and trade secret laws and associate nondisclosure agreements to protect our systems, survey instruments and procedures. There can be no assurance that the steps we have taken to protect our rights will be adequate to prevent misappropriation of such rights or that third parties will not independently develop functionally equivalent or superior systems or procedures. We believe that our systems and procedures and other proprietary rights do not infringe upon the proprietary rights of third parties. There can be no assurance, however, that third parties will not assert infringement claims against us in the future or that any such claims will not result in protracted and costly litigation, regardless of the merits of such claims or whether we are ultimately successful in defending against such claims.
AssociatesGovernment Regulation
According to the Centers for Medicare and Medicaid Services (“CMS”), health expenditures in the United States were approximately $4.1 trillion in 2020, or $12,530 per person. In total, health spending accounted for 19.7% of the nation’s Gross Domestic Product in 2020. Addressing this growing expenditure burden continues to be a major policy priority at both federal and state levels. In addition, increased co-pays and deductibles in healthcare plans have focused even more consumer attention on health spending and affordability. In the public sector, Medicare provides health coverage for individuals aged 65 and older, while Medicaid provides coverage for low-income families and other individuals in need. Both programs are administered by the CMS. With the aging of the U.S. population, Medicare enrollment has increased significantly. In addition, longer life spans and greater prevalence of chronic illnesses among both the Medicare and Medicaid populations have placed tremendous demands on the health care system.
An increasing percentage of Medicare reimbursement and reimbursement from commercial payers has been determined under value payment models, based on factors such as patient readmission rates and provider adherence to certain quality-related protocols. At the same time, many hospitals and other providers are creating new models of care delivery to improve patient experience, reduce cost and provide better clinical outcomes. These new models are based on sharing financial risk and managing the health and behaviors of large populations of patients and consumers. This transformation towards value-based payment models and increased engagement of healthcare consumers is resulting in a greater need for existing healthcare providers to deliver more customer-centric healthcare. At the same time, organizations that have successfully developed effective customer service models and brand loyalty in other industry verticals are entering the healthcare services market.
We believe that our current portfolio of solutions is uniquely aligned to address these healthcare market trends and related business opportunity. We provide tools and solutions to capture, interpret and improve the CAHPS data required by CMS as well as real time feedback that enables clients to better understand what matters most to people at key moments in their relationship with a health organization. Our solutions enable our clients to both satisfy patient survey compliance requirements and design experiences to build loyalty and improve the wellbeing of the people and communities they care for.
Human Capital
As of December 31, 20192021, we employed a total of 464 persons on a full-time basis. In addition, as511 associates, 10 of such date, we had 16 part-time associates primarilythose were employed in our survey operations, representing approximately 8 full-time equivalent associates.Canada. None of our associates are represented by a collective bargaining unit. As a result of the COVID-19 pandemic, the majority of our associates are working remotely with very successful results. We attract a passionate team of associates who care deeply about making a difference in advancing “Human Understanding” in healthcare. We consider our relationshiprelationships with our associates to be good.
Information About Our Executive OfficersWe are committed to providing a workplace free of harassment or discrimination based on race, color, religion, sex, sexual orientation, gender identity, national origin, genetic information, ancestry, veteran status, or disability. We are an equal opportunity employer committed to inclusion and diversity.
The following table sets forth certain information as of February 1, 2020, regarding our executive officers:
|
|
|
|
|
|
|
|
|
|
|
|
Michael D. Hays has served as our Chief Executive Officer and a director since he founded the Company in 1981. He also served as our President from 1981 to 2004 and from July 2008 to July 2011. Prior to founding the Company, Mr. Hays served for seven years as a Vice President and a director of SRI Research Center, Inc. (n/k/a the Gallup Organization).
Steven D. Jackson has served as our President since October 2015. He served as Group President from October 2014 until September 2015, during which time he oversaw our Market Insights, Transparency, and Predictive Analytics business units. Prior to joining us, Mr. Jackson served as Chief Strategy Officer for Vocera Communications where he was employed from 2007 to 2014. He also served as Chief Operating Officer for ExperiaHealth, a subsidiary of Vocera. Earlier in his career, Mr. Jackson held positions of increasing responsibility at The Advisory Board Company, Neoforma, and Stockamp & Associates.
Kevin R. Karas has served as our Chief Financial Officer, Treasurer and Secretary since September 2011, and as Senior Vice President Finance since he joined us in December 2010. From 2005 to 2010, he served as Vice President of Finance for Lifetouch Portrait Studios, Inc., a national retail photography company. Mr. Karas also previously served as Chief Financial Officer at CARSTAR, Inc., an automobile collision repair franchise business, from 2000 to 2005, Chief Financial Officer at Rehab Designs of America, Inc., a provider of orthotic and prosthetic services, from 1993 to 2000, and as a regional Vice President of Finance and Vice President of Operations at Novacare, Inc., a provider of physical rehabilitation services, from 1988 to 1993. He began his career as a Certified Public Accountant at Ernst & Young.
Our executive officers are elected by and serve at the discretion of our Board of Directors. There are no family relationships between any of our directors or executive officers.
Available Information
More information regarding NRC Health is available on our website at www.nrchealth.com. We are not including the information contained on or available through our website as part of, or incorporating such information by reference into, this Annual Report on Form 10-K. Our Annual Reports on Form 10-K, Quarterly Reports on Form 10-Q, Current Reports on Form 8-K and any amendments to those reports are made available to the public at no charge through a link appearing on our website. We provide access to such materials through our website as soon as reasonably practicable after electronically filing such material with, or furnishing it to, the Securities and Exchange Commission. Reports and amendments posted on our website do not include access to exhibits and supplemental schedules electronically filed with the reports or amendments.
You should carefully consider each of the risks described below, together with all of the other information contained in this Annual Report on Form 10-K, before making an investment decision with respect to our securities. If any of the following risks develop into actual events, our business, financial condition or results of operations could be materially and adversely affected and you may lose all or part of your investment.
Risks Related to our Business
We could be negatively impacted by the Coronavirus or “COVID-19” outbreak or other similar outbreaks.
The outbreak of COVID-19, and the associated responses, have impacted our business in a variety of ways. Governments have implemented business and travel restrictions and recommended social distancing and other guidelines. Many businesses, including many of our clients, have de-emphasized external business opportunities and restricted in-person meetings while shifting their attention toward addressing COVID-19 planning, business disruptions, higher costs, and revenue shortfalls. Although the impact on our healthcare clients has varied, many of our clients have experienced decreased revenues, contracting margins, and cash losses. Some clients’ cost reducing measures have included and could continue to include reducing or eliminating the services they purchase from us. While these circumstances did not significantly impact our financial position or results of operations in 2020 and 2021, the negative impact could continue to increase.
We rely on third-party service providers and business partners, for services or supplies that are critical to providing our clients’ services. These include activities such as internet, cloud data storage, information technology services, and survey related services. These third parties are also subject to risks and uncertainties related to the COVID-19 pandemic, which may interfere with their ability to provide their services in a timely manner and in accordance with the agreed-upon terms or our agreements, which could interfere with our ability to operate our business.
At NRC, the vast majority of our associates are working remotely, and to date we have been capable of providing our services without significant disruption. We have made our facilities available for associates to return to work effective July 1, 2021 at their discretion. Historically, we have relied on national travel as part of our sales efforts, but as a result of the pandemic we had placed a temporary hold on all company related travel. We modified our travel policy and limited travel did resume in the third quarter of 2021. To date, we are still capable of providing our services without interruption and without significant changes to our internal control over financial reporting. However, we may need to develop or adapt to new ways of doing business that challenge our leadership, our associate training, our human resources, and our business practices, and we cannot assure you that we will be successful in doing so. The short and long-term costs associated with these potential changes are difficult to quantify. For these and other reasons, the outbreak and associated responses could negatively affect our business, and the impact could be material.
To the extent the COVID-19 pandemic adversely affects the Company’s business, results of operations, financial condition and stock price, it may also have the effect of heightening many of the other risks described in this Part I, Item 1A of this Form 10-K.
We depend on contract renewals, including retention of key clients, for a large share of our revenue and our operating results could be adversely affected.
We expect that a substantial portion of our revenue for the foreseeable future will continue to be derived from renewable service contracts. Substantially all contracts are renewable annually at the option of our clients, although contracts with clients under unit-based arrangements generally have no minimum purchase commitments. Client contracts are generally cancelable on short notice without penalty, however we are entitled to payment for services through the cancellation date. To the extent that clients fail to renew or defer their renewals, we anticipate our results may be materially adversely affected. We rely on a limited number of key clients for a substantial portion of our revenue. Our ten largest clients collectively accounted for 16%14%, 17%14%, and 19%16% of our total revenue in 2019, 2018,2021, 2020, and 2017,2019, respectively. Our ability to secure renewals depends on, among other things, our ability to gather and analyze performance data in a consistent, high-quality, and timely fashion. In addition, the service needs of our clients are affected by accreditation requirements, enrollment in managed care plans, the level of use of satisfaction measures in healthcare organizations’ overall management and compensation programs, the size of operating budgets, clients’ operating performance, industry and economic conditions, and changes in management or ownership. As these factors are beyond our control, we cannot ensure that we will be able to maintain our renewal rates. Any material decline in renewal rates from existing levels would have an adverse effect on our revenue and a corresponding effect on our operating and net income.
Our operating results may fluctuate and this may cause our stock price to decline.
Our overall operating results may fluctuate as a result
We operate in a highly competitive market and could experience increased price pressure and expenses as a result.
The healthcare information and market research services industry is highly competitive. We have traditionally competed with healthcare organizations’ internal marketing, market research and/or quality improvement departments that create their own performance measurement tools, and with relatively small specialty research firms that provide survey-based healthcare market research and/or performance assessment. Our primary competitors among such specialty firms include Press Ganey, which we believe has significantly higher annual revenue than us, and three or four other firms that we believe have lower annual revenue than us. To a certain degree, we currentlyWe also compete with and anticipate that in the future we may increasingly compete with, (1) market research firms and technology solutions which provide survey-based, general market research or Voicevoice of the Customer Feedbackcustomer feedback capabilities and (2) firms that provide services or products that complement healthcare performance assessments, such as healthcare software or information systems. Although only a few of these competitors have offered specific services that compete directly with our services, many of these competitors have substantially greater financial, information gathering, and marketing resources than us and could decide to increase their resource commitments to our market. There are relatively few barriers to entry into our market, and we expect increased competition in our market which could adversely affect our operating results through pricing pressure, increased marketing expenditures, and market share losses, among other factors. There can be no assurance that we will continue to compete successfully against existing or new competitors.
Because our clients are concentrated in the healthcare industry, our revenue and operating results may be adversely affected by changes in regulations, a business downturn or consolidation with respect to the healthcare industry.
Substantially all of our revenue is derived from clients in the healthcare industry. As a result, our business, financial condition and results of operations are influenced by conditions affecting this industry, including changing political, economic, competitive and regulatory influences that may affect the procurement practices and operation of healthcare providers and payers. Future legislative changes, including additional provisions to control healthcare costs, improve healthcare quality and expand access to health insurance, could result in lower reimbursement rates and otherwise change the environment in which providers and payers operate. In addition, large private purchasers of healthcare services are placing increasing cost pressure on providers. Healthcare providers may react to these cost pressures and other uncertainties by curtailing or deferring purchases, including purchases of our services.
Moreover, there has been consolidation of companies in the healthcare industry, a trend which we believe will continue to grow. Consolidation in this industry, including the potential acquisition of certain of our clients, could adversely affect aggregate client budgets for our services, could result in client’sclients performing more marketing, market research and/or quality improvement functions internally or could result in the termination of a client’s relationship with us. The impact of these developments on the healthcare industry is difficult to predict and could have an adverse effect on our revenue and a corresponding effect on our operating and net income.
We rely on third parties for data collection and other services whose actions could have a material adverse effect on our business.
We outsource certain operations and engage third parties to perform work needed to fulfill our client services. For example, we use vendors to perform certain printing, mailing, information transmittal and other services related to our survey operations. If any of these vendors cease to operate or fail to adequately perform the contracted services and alternative resources and processes are not utilized in a timely manner, our business could be adversely affected. The loss of any of our key vendors could impair our ability to perform our client services and result in lower revenues and income. It would also be time-consuming and expensive to replace, either directly or through other vendors, the services performed by these vendors, which could adversely impact revenues, expenses and net income. Furthermore, our ability to monitor and direct our vendors’ activities is limited. If their actions and business practices violate policies, regulations or procedures otherwise considered illegal, we could be subject to reputational damage or litigation which would adversely affect our business.
We face several risks relating to our ability to collect the data on which our business relies.
Our ability to provide timely and accurate performance measurement and improvement services to our clients depends on our ability to collect large quantities of high-quality data through surveys and interviews. If our mail survey operations are disrupted and we are unable to mail our surveys in a timely manner, then our revenue and net income could be negatively impacted. If receptivity to our survey and interview methods by respondents declines, or, for some other reason, their willingness to complete and return surveys declines, or if we, for any reason, cannot rely on the integrity of the data we receive, then our revenue could be adversely affected with a corresponding effect on our operating and net income. We also rely on third-party panels of pre-recruited consumer households to produce our Market Insights in a timely manner. If we are not able to continue to use these panels, or the time period in which we use these panels is altered and we cannot find alternative panels on a timely, cost-competitive basis, we could face an increase in our costs or an inability to effectively produce our Market Insights. In either case, our operating and net income could be negatively affected.
Our principal shareholders effectively control the Company.
A majority of our common stock and voting power was historically owned and/or held by Michael D. Hays, our Chief Executive Officer. However, over the years Mr. Hays, for estate planning purposes, gifted and/or transferred almost all of his directly owned shares to two trusts for the benefit of his family, The K/I/E Trust under agreement dated October 24, 2018 and the Amandla MK Trust (collectively the “Trusts”).
As of February 27, 2020, approximately 44.7% of our outstanding common stock was owned by the Trusts and approximately 54.2% of our outstanding common stock was held by the Trusts and other entities owned or controlled by members of Mr. Hays’ family. As a result, the Trusts and these other entities have the power to indirectly control decisions such as whether to issue additional shares or declare and pay dividends and can control matters requiring shareholder approval, including the election of directors and the approval of significant corporate matters such as change of control transactions. The effects of such influence could be to delay or prevent a change of control of the Company unless the terms are approved by the Trusts and these other entities.
The market price of our common stock may be volatile and shareholders may be unable to resell shares at or above the price at which the shares were acquired.
The market price and trading volume of our common stock has historically been and may continue to be highly volatile, and investors in our common stock may experience a decrease in the value of their shares, including decreases that are in response to factors beyond our control, including, but not limited to:
|
| |
|
| |
|
| |
|
| |
|
| |
|
| |
|
| |
|
| |
|
| |
|
|
Any of these factors, among others, may result in changes in the trading volume and/or market price of our common stock. Following periods of volatility in the market price of our securities, shareholders have often filed securities class-action lawsuits.
Our involvement in a class-action lawsuit would result in substantial legal fees and divert our senior management’s attention from operating our business, which could harm our business and net income.
Our business and operating results could be adversely affected if we are unable to attract or retain key managers and other personnel.
Our future performance may depend, to a significant extent, upon the efforts and ability of our key personnel who have expertise in gathering, interpreting and marketing survey-based performance information for healthcare markets. Although client relationships are managed at many levels within our company, the loss of the services of Michael D. Hays, our Chief Executive Officer, or one or more of our other senior managers, could have a material adverse effect, at least in the short to medium term, on most significant aspects of our business, including strategic planning, product development, and sales and customer relations. Our success will also depend on our ability to hire, train and retain skilled personnel in all areas of our business. Currently, we do not have employment agreements with our officers or our other key personnel. Competition for qualified personnel in our industry is intense, and many of the companies that compete with us for qualified personnel have substantially greater financial and other resources than us. Furthermore, we expect competition for qualified personnel to become more intense as competition in our industry increases. We cannot assure you that we will be able to recruit, retain and motivate a sufficient number of qualified personnel to compete successfully.
If intellectual property and other proprietary information technology were copied or independently developed by our competitors, our operating results could be negatively affected.
Our success depends in part upon our data collection process, research methods, data analysis techniques, and internal systems and procedures that we have developed specifically to serve clients in the healthcare industry. We have no patents.patents for most of our intellectual property. Consequently, we rely on a combination of copyright, trade secret laws and associate nondisclosure agreements to protect our systems, survey instruments and procedures. We cannot assure you that the steps we have taken to protect our rights will be adequate to prevent misappropriation of such rights, or that third parties will not independently develop functionally equivalent or superior systems or procedures. We believe that our systems and procedures and other proprietary rights do not infringe upon the proprietary rights of third parties. We cannot assure you, however, that third parties will not assert infringement claims against us in the future, or that any such claims will not result in protracted and costly litigation, regardless of the merits of such claims, or whether we are ultimately successful in defending against such claims.
Failures or deficiencies in our information technology platform could negatively impact our operating results.
Our ability to provide client service is dependent, to a significant extent, upon the technology that we develop internally. Investment in the enhancement of existing and development of new information technology processes is costly and affects our ability to successfully serve our clients. The failure or deficiency of the technology we develop could negatively impact the willingness or ability for our clients to use our services and our ability to perform our services. Our failure to anticipate clients’ expectation and needs, adapt to emerging technological trends, or design efficient and effective information technology platforms, could result in lower utilization, loss of customers, damage to customer relationships, reduced revenue and profits, refunds to customers and damage to our reputation. Although we have procedures to monitor the efficacy of our information technology platforms, the procedures may not prevent failures or deficiencies in the information technology platforms we develop, we may not adapt quickly enough and may incur significant costs and delays that could harm our business. Additional costs could be incurred to further develop and improve our information technology platforms.
Our business and operating results could be adversely affected if we experience business interruptions or failure of our information technology and communication systems.
Our ability to provide timely and accurate performance measurement and improvement services to our clients depends on the efficient and uninterrupted operation of our information technology and communication systems, and those of our external service providers. Our systems and those of our external service providers could be exposed to damage or interruption from fire, natural disasters, energy loss, telecommunication failure, security breach and computer viruses. An operational failure or outage in our information technology and communication systems or those of our external service providers, could result in loss of customers, damage to customer relationships, reduced revenue and profits, refunds of customer charges and damage to our reputation and may result in additional expense to repair or replace damaged equipment and recover data loss resulting from the interruption. Although we have taken steps to prevent system failures and have back-up systems and procedures to prevent or reduce disruptions, such steps may not prevent an interruption of services and our disaster recovery planning may not account for all contingencies. Additionally, our insurance may not adequately compensate us for all losses or failures that may occur. Any one of the above situations could have a material adverse effect on our business, financial condition, results of operations and reputation.
If we sustain cyber-attacks or other privacy or data security incidents that result in security breaches that disrupt our operations or result in the unintended dissemination of protected personal information or proprietary or confidential information, we could suffer a loss of revenue and increased costs, exposure to significant liability, reputational harm and other serious negative consequences.
In connection with our client services, we receive, process, store and transmit sensitive business information and, in certain circumstances, personal medical information of our clients’ patients, electronically over the internet. We may become the target of attempted cyber-attacks and other security threats and may be subject to breaches of the information technology systems we use. Experienced computer programmers and hackers may be able to penetrate our security controls and access, misappropriate or otherwise compromise protected personal information or proprietary or confidential information or that of third-parties, create system disruptions or cause system shutdowns that could negatively affect our operations. They also may be able to develop and deploy viruses, worms, ransomware, and other malicious software programs that attack our systems or otherwise exploit any security vulnerabilities. Hardware, software, or applications we develop or procure from third parties may contain defects in design or manufacture or other problems that could unexpectedly compromise information security.
We were the target of an external cyber-attack in February 2020 (the “February incident”) which resulted in a temporary suspension of our services to clients. We will likely continue to be the target of other attempted cyber-attacks and security threats. Such cyber-attacks may subject us to litigation and regulatory risk, civil and criminal penalties, additional costs and diversion of management attention due to investigation, remediation efforts and engagement of third party consultants and legal counsel in connection with such incidents, payment of “ransoms” to regain access to our systems and information, loss of clients, damage to client relationships, reduced revenue and profits, refunds of client charges and damage to our reputation, any of which could have a material adverse effect on our business, cash flows, financial condition and results of operations. While we have contingency plans and insurance coverage for potential liabilities of this nature, they may not be sufficient to cover all claims and liabilities and in some cases are subject to deductibles and layers of self-insured retention.
We cannot ensure that we will be able to identify, prevent or contain the effects of cyber-attacks or other cybersecurity risks that bypass our security measures or disrupt our information technology systems or business. We have security technologies, processes and procedures in place to protect against cybersecurity risks and security breaches. However, hardware, software or applications we develop or procure from third parties may contain defects in design, manufacturer defects or other problems that could unexpectedly compromise information security. In addition, because the techniques used to obtain unauthorized access, disable or degrade service or sabotage systems change frequently, are becoming increasingly sophisticated, and may not immediately produce signs of intrusion, we may be unable to anticipate these techniques, timely discover or counter them or implement adequate preventative measures.
In addition, we use third-party technology, systems and services for a variety of reasons, including, without limitation, encryption and authentication technology, employee email, content delivery to clients, back-office support, and other functions that in some cases involve processing, storing and transmitting large amounts of data for our business. These third-party providers may also experience security breaches or interruptions to their information technology hardware and software infrastructure and communications systems that could adversely impact us.
Under the Health Insurance Portability and Accountability Act of 1996, as amended by the Health Information Technology for Economic and Clinical Health Act of 2009, or HITECH, implementing regulations promulgated by the U.S. Department of Health and Human Services, or “HHS,” including what are referred to as the “Privacy Rule” and the “Security Rule” (collectively, “HIPAA”), we face potential liability related to the privacy of health information we obtain. We are required through our contracts with our clients and by HIPAA to protect the privacy and security of certain health information and to make certain disclosures to our clients or to the public if this information is unlawfully accessed.
Changes in privacy and information security laws and standards may require we incur significant expense to ensure compliance due to increased technology investment and operational procedures. Noncompliance with any privacy or security laws and regulations, including, without limitation, HIPPA, or any security breach, cyber-attack or cybersecurity breach, and any incident involving the misappropriation, loss or other unauthorized disclosure or use of, or access to, sensitive or confidential information, whether by us or by one of our third-party service providers, could require us to expend significant resources to continue to modify or enhance our protective measures and to remediate any damage. In addition, this could negatively affect our operations, cause system disruptions, damage our reputation, cause client losses and contract breaches, and could also result in regulatory enforcement actions, material fines and penalties, litigation or other actions that could have a material adverse effect on our business, cash flows, financial condition and results of operations. Even if cyber-attacks or other cybersecurity breaches do not result in noncompliance with privacy or security laws, the perception that such noncompliance may have occurred by our clients or in the news media may have an adverse impact on our stock price and could result in damage to our reputation or loss of clients, which could have a material adverse effect on our business, cash flows, financial condition and results of operations.
Reputational harm could have a material adverse effect on our business, financial condition and results of operations.
Our ability to maintain a good reputation is critical to selling our services. Our reputation could be adversely impacted by any of the following (whether or not valid): the failure to maintain high ethical and social standards; the failure to perform our client services in a timely manner; violations of laws and regulations; failure to adequately preserve information security; and the failure to maintain an effective system of internal controls or to provide accurate and timely financial information. Damage to our reputation or loss of our clients’ confidence in our services for any of these, or any other reasons, could adversely impact our business, revenues, financial condition, and results of operations, as well as require additional resources to rebuild our reputation.
Our operations are subject to laws and regulations that impose significant compliance costs and create reputational and legal risk.
Due to the nature of the services we offer, we are subject to significant commercial, trade and privacy regulations. We cannot predict the nature, scope or effect of future regulatory requirements to which our operations might be subject or the manner in which existing laws might be administered or interpreted, which could have a material and negative impact on our business and our results of operation. For example, recent years have seen an increase in the development or enforcement of legislation related to healthcare reform, privacy, trade compliance and anti-corruption. Additionally, some of the services we provide include information our clients need to fulfill regulatory reporting requirements. If our services result in errors or omissions in our clients’ regulatory reporting, we may be subject to loss of clients, reputational harm or litigation, each potentially adversely impacting our business. Furthermore, although we maintain a variety of internal policies and controls designed to educate, discourage, prevent and detect violations of such laws, we cannot guarantee that such actions will be effective or sufficient or that individual employees will not engage in inappropriate behavior in breach of our policies. Such conduct, or even an allegation of misbehavior, could result in material adverse reputational harm, costly investigations, severe criminal or civil sanctions, or could disrupt our business, and could negatively affect our results of operations or financial condition.
Failure to comply with public company regulations could adversely impact our profitability.
As a public company, we are subject to the reporting requirements of the Securities Exchange Act of 1934, the Sarbanes-Oxley Act of 2002, the Dodd-Frank Act Wall Street Reform and Consumer Protection Act, the listing requirements of NASDAQ and other applicable securities rules and regulations. Additionally, laws, regulations and standards relating to corporate governance and public disclosure are subject to varying interpretations and continue to develop and change. If we misinterpret or fail to comply with these rules and regulations, our legal and financial compliance costs and net income may be adversely affected.
Our growth strategy includes future acquisitions and/or investments which involve inherent risk.
In order to expand services or technologies to existing clients and increase our client base, we have historically, and may in the future, make strategic business acquisitions and/or investments that we believe complement our business. Acquisitions have inherent risks which may have material adverse effects on our business, financial condition, or results of operations, including, among other things: (1) failure to successfully integrate the purchased operations, technologies, products or services and maintain uniform standard controls, policies and procedures; (2) substantial unanticipated integration costs; (3) loss of key associates including those of the acquired business; (4) diversion of management’s attention from other operations; (5) failure to retain the customers of the acquired business; (6) failure to achieve any projected synergies and performance targets; (7) additional debt and/or assumption of known or unknown liabilities; (8) dilutive issuances of equity securities; and (9) a write-off of goodwill, software development costs, client lists, other intangibles and amortization of expenses. If we fail to successfully complete acquisitions or integrate acquired businesses, we may not achieve projected results and there may be a material adverse effect on our business, financial condition and results of operations.
Risks Related to our Common Stock
Our principal shareholders effectively control the Company.
A majority of our common stock and voting power was historically owned and/or held by Michael D. Hays, our Chief Executive Officer and President. However, over the years Mr. Hays, for estate planning purposes, gifted and/or transferred almost all of his directly owned shares to trusts for the benefit of his family. Currently, the principal holders of shares previously owned by Mr. Hays are the Common Property Trust and the Amandla MK Trust (collectively the “Trusts”).
As of February 25, 2022, approximately 42.6% of our outstanding common stock was owned by the Trusts and approximately 52.4% of our outstanding common stock was held by the Trusts and other entities owned or controlled by members of Mr. Hays’ family. As a result, the Trusts and these other entities have the power to indirectly control decisions such as whether to issue additional shares or declare and pay dividends and can control matters requiring shareholder approval, including the election of directors and the approval of significant corporate matters such as change of control transactions. The effects of such influence could be to delay or prevent a change of control of the Company unless the terms are approved by the Trusts and these other entities.
The market price of our common stock may be volatile and shareholders may be unable to resell shares at or above the price at which the shares were acquired.
The market price and trading volume of our common stock has historically been and may continue to be highly volatile, and investors in our common stock may experience a decrease in the value of their shares, including decreases that are in response to factors beyond our control, including, but not limited to:
| Variations in our financial performance and that of similar companies; | |
● | Regulatory and other developments that may impact the demand for our services; | |
● | Reaction to our press releases, public announcements and filings with the Securities and Exchange Commission; | |
● | Client, market and industry perception of our services and performance; | |
● | Actions of our competitors; | |
● | Changes in earnings estimates or recommendations by analysts who follow our stock; | |
● | Loss of key personnel; | |
● | Investor, management team or large stockholder sales of our stock; | |
● | Changes in accounting principles; and | |
● | Variations in general market, economic and political conditions or financial markets. |
Any of these factors, among others, may result in changes in the trading volume and/or market price of our common stock. Following periods of volatility in the market price of securities, shareholders have often filed securities class-action lawsuits. Our involvement in a class-action lawsuit would result in substantial legal fees and divert our senior management’s attention from operating our business, which could harm our business and net income.
General Risk Factors
Our operating results may fluctuate and this may cause our stock price to decline.
Our overall operating results may fluctuate as a result of a variety of factors, including the size and timing of orders from clients, client demand for our services (which, in turn, is affected by factors such as accreditation requirements, enrollment in managed care plans, operating budgets and clients’ operating performance), the hiring and training of additional staff, expense increases, and industry and general economic conditions. Because a significant portion of our overhead is fixed in the short-term, particularly some costs associated with owning and occupying our building and full-time personnel expenses, our results of operations may be materially adversely affected in any particular period if revenue falls below our expectations. These factors, among others, make it possible that in some future period our operating results may be below the expectations of securities analysts and investors which would have a material adverse effect on the market price of our common stock.
Our business and operating results could be adversely affected if we are unable to attract or retain key managers and other personnel.
Our future performance may depend, to a significant extent, upon the efforts and ability of our key personnel who have expertise in gathering, interpreting and marketing survey-based performance information for healthcare markets. Although client relationships are managed at many levels within our company, the loss of the services of Michael D. Hays, our Chief Executive Officer and President, or one or more of our other senior managers, could have a material adverse effect, at least in the short to medium term, on most significant aspects of our business, including strategic planning, product development, and sales and customer relations. Our success will also depend on our ability to hire, train and retain skilled personnel in all areas of our business. Competition for qualified personnel in our industry is intense, and many of the companies that compete with us for qualified personnel have substantially greater financial and other resources than us. Furthermore, we expect competition for qualified personnel to become more intense as competition in our industry increases. We cannot assure you that we will be able to recruit, retain and motivate a sufficient number of qualified personnel to compete successfully.
Like many other companies, we experienced higher attrition rates in 2021. We may incur higher costs to attract, train and retain these associates. Attrition in our sales and service areas can also impact our ability to retain and attract new business. We may need to develop or adapt to new ways of doing business that challenge our leadership, our associate training, our human resources, and our business practices, and we cannot assure you that we will be successful in doing so. The short and long-term costs associated with these potential changes are difficult to quantify.
Failure to comply with public company regulations could adversely impact our profitability.
As a public company, we are subject to the reporting requirements of the Securities Exchange Act of 1934, the Sarbanes-Oxley Act of 2002, the Dodd-Frank Act Wall Street Reform and Consumer Protection Act, the listing requirements of NASDAQ and other applicable securities rules and regulations. Additionally, laws, regulations and standards relating to corporate governance and public disclosure are subject to varying interpretations and continue to develop and change. If we misinterpret or fail to comply with these rules and regulations, our legal and financial compliance costs and net income may be adversely affected.
Unresolved Staff Comments |
We have no unresolved staff comments to report pursuant to this item.
Our headquarters is located in an owned office building in Lincoln, Nebraska, of which 62,000 square feet arehave been used for our operations. This facility houses all the capabilities necessary for our survey programming, printing and distribution, data processing, analysis and report generation, marketing, and corporate administration. Our credit facilities are secured by this property and our other assets. We are currently renovating the building and expect renovations to complete in early 2023. In February 2021, we began leasing 19,300 square feet of space in Lincoln, Nebraska for our survey programming, printing and distribution previously housed at our headquarters.
We are leasing 4,000 square feet of office space in Markham, Ontario, 6,500 square feet of office space in Atlanta, Georgia, 1,000 square feet of office space in Bethel, Connecticut and 100 square feet of office space in Nashville, Tennessee as a month-to month lease. We are also subleasing as a sublessor 4,300 square feet of office space in Seattle, Washington, 6,200 square feet of officeWashington. In January 2022, the leased space in Atlanta, Georgia and 200will be reduced to a 300 square feet ofmonth-to-month lease. Due to our decision to close the Canadian office, spacethe Markham, Ontario lease will also be terminated in Nashville, Tennessee.late 2022.
From time to time, we are involved in certain claims and litigation arising in the normal course of business. Management assesses the probability of loss for such contingencies and recognizes a liability when a loss is probable and estimable. There were no outstanding claims as of December 31, 2019. For additional information, see Note 1, under the heading “Commitments and Contingencies,” to our consolidated financial statements. Regardless of the final outcome, any legal proceedings, claims, inquiries and investigations, however, can impose a significant burden on management and employees, may include costly defense and settlement costs, and could cause harm to our reputation and brand, and other factors.
Not applicable.
In May 2013,Currently we consummated a recapitalization pursuant tohave one class of outstanding capital stock, which we established two classes of common stock (class A common stock and class B common stock), issued a dividend of three shares of class A common stock for each share ofis our then existing common stock and reclassified each then existing share of common stock as one-half of one share of class B common stock. Following the May 2013 recapitalization, our class A common stock and our class B common stock were traded on the NASDAQ Global Market under the symbols “NRCIA” and “NRCIB,” respectively.
On April 16, 2018, our shareholders approved, among other things, an amendment to our Amended and Restated Articles of Incorporation (the “Articles”) to effect a recapitalization (the “Recapitalization”) pursuant to which each share of our then-existing class B common stock was exchanged for one share of the our then-existing Class A common stock plus $19.59 in cash, without interest. On April 17, 2018, we filed an amendment to our Articles effecting the Recapitalization, followed by an amendment and restatement of our Articles, which resulted in the elimination of our class B common stock and the reclassification of our class A common stock as a share of Common Stock, par value $0.001$.001 per share (“Common Stock”). We issued 3,617,615 shares ofOur Common Stock and paid $72.4 million in exchange for all class B shares outstanding and to settle outstanding share-based awards for class B common stock. The Common Stock continues to tradetrades on the NASDAQ Global Select Market under the revised symbol “NRC.”“NRC”.
Cash dividends in the aggregate amount of $12.2 million were declared in 2021 with $9.2 million paid in 2021 and the remaining $3.0 million paid in January 2022. Cash dividends in the aggregate amount of $5.3 million were declared and paid in 2020. Cash dividends in the aggregate amount of $19.4 million were declared in 2019 with $14.2 million paid in 2019 and the remaining $5.2 million paid in January 2020. Cash dividends in the aggregate amount of $29.7 million were declared in 2018 with $12.6 million paid in 2018 and the remaining $17.1 million paid in January 2019. The payment and amount of future dividends, if any, is at the discretion of our Board of Directors and will depend on the our future earnings, financial condition, general business conditions, alternative uses of our earnings and cash and other factors.
On February 14, 2020,16, 2022, there were approximately 1511 shareholders of record and approximately 6,20111,814 beneficial owners of common stock.our Common Stock.
In February 2006 and subsequently amended in May 2013, ourOur Board of Directors has authorized a stock repurchase program that initially provided for the repurchase of up to 2,250,000 shares of class A common stock and 375,000 sharesour Common Stock.
The table below summarizes repurchases of class B common stock in the open market or in privately negotiated transactions. In connection with the Recapitalization in April 2018, our Board of Directors further amended the stock repurchase program to eliminate the repurchase of the former class B common stock. Unless terminated earlier by resolution of our Board of Directors, the repurchase program will expire when the we have repurchased all shares authorized for repurchase thereunder. No Common Stock was repurchased during the three-month period ended December 31, 2019.2021.
Period | Total Number of Shares Purchased | Average Price Paid per Share | Total Number of Shares Purchased as Part of Publicly Announced Plans or Programs(1) | Maximum Number of Shares that May Yet Be Purchased Under the Plans or Programs(1) | ||||||||||||
Oct 1 – Oct 31, 2021 | -- | -- | -- | 280,491 | ||||||||||||
Nov 1 – Nov 30, 2021 | 24,298 | 41.48 | 24,298 | 256,193 | ||||||||||||
Dec 1 – Dec 31, 2021 | 94,846 | (2) | 41.53 | 87,250 | 168,943 | |||||||||||
(1)Shares were repurchased pursuant to a repurchase plan originally announced on February 14, 2006. The remainingrepurchase plan was subsequently amended to permit the repurchase of up to 2,250,000 shares of Common Stock.
(2)Includes 7,596 shares of Common Stock that may be purchasedwere owned by an associate and surrendered to us as payment of the exercise price for, and to satisfy tax withholding obligations in connection with, the exercise of stock options.
See Item 12 in Part III of this Annual Report on Form 10-K for certain information concerning shares of our Common Stock authorized for issuance under that authorization are 280,491.our equity compensation plans.
The following graph compares the cumulative 5-year total return provided shareholders on our common stockCommon Stock relative to the cumulative total returns of the NASDAQ Composite Index and the Russell 2000 Index. An investment of $100 (with reinvestment of all dividends) is assumed to have been made in our common stockCommon Stock and in each of the indexes on December 31, 2014,2016, and our relative performance is tracked through December 31, 2019.2021.
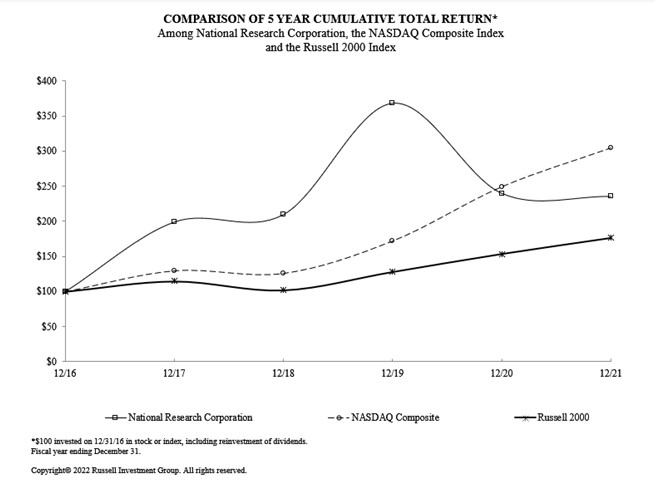
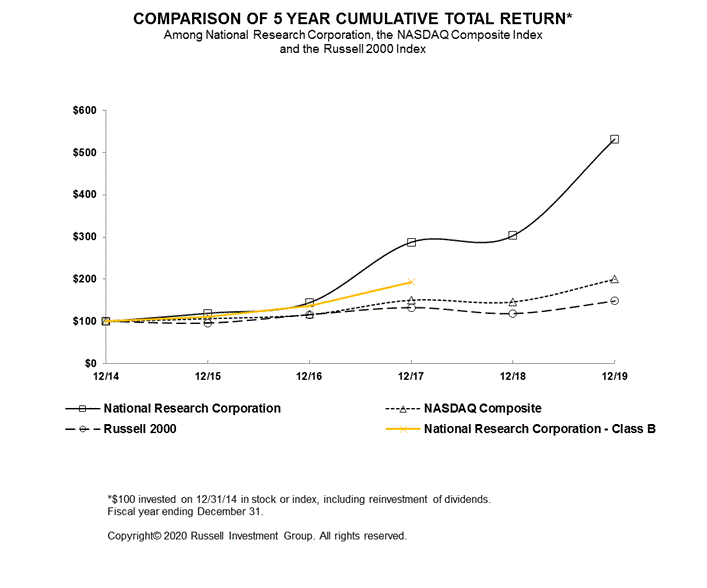
The stock price performance included in this graph is not necessarily indicative of future stock price performance.
|
| 12/14 |
|
| 12/15 |
|
| 12/16 |
|
| 12/17 |
|
| 12/18 |
|
| 12/19 |
| ||||||
|
|
|
|
|
|
|
|
|
|
|
|
|
|
|
|
|
|
|
|
|
|
|
|
|
National Research Corporation – Formerly Class B |
|
| 100.00 |
|
|
| 110.85 |
|
|
| 136.77 |
|
|
| 193.65 |
|
|
| -- |
|
|
| -- |
|
|
|
|
|
|
|
|
|
|
|
|
|
|
|
|
|
|
|
|
|
|
|
|
|
|
National Research Corporation Common Stock - Formerly Class A |
|
| 100.00 |
|
|
| 119.36 |
|
|
| 144.49 |
|
|
| 287.71 |
|
|
| 303.13 |
|
|
| 531.90 |
|
|
|
|
|
|
|
|
|
|
|
|
|
|
|
|
|
|
|
|
|
|
|
|
|
|
NASDAQ Composite |
|
| 100.00 |
|
|
| 106.96 |
|
|
| 116.45 |
|
|
| 150.96 |
|
|
| 146.67 |
|
|
| 200.49 |
|
|
|
|
|
|
|
|
|
|
|
|
|
|
|
|
|
|
|
|
|
|
|
|
|
|
Russell 2000 |
|
| 100.00 |
|
|
| 95.59 |
|
|
| 115.95 |
|
|
| 132.94 |
|
|
| 118.30 |
|
|
| 148.49 |
|
12/16 | 12/17 | 12/18 | 12/19 | 12/20 | 12/21 | |||||||||||||||||||
National Research Corporation Common Stock (1) | 100.00 | 199.11 | 209.79 | 368.11 | 239.77 | 235.38 | ||||||||||||||||||
NASDAQ Composite | 100.00 | 129.64 | 125.96 | 172.17 | 249.51 | 304.85 | ||||||||||||||||||
Russell 2000 | 100.00 | 114.65 | 102.02 | 128.06 | 153.62 | 176.39 | ||||||||||||||||||
(1)Prior to a recapitalization that took place in 2018, our Common Stock was referred to as Class A Common Stock.
[Reserved] |
The selected statement of income data for the years ended December 31, 2019, 2018 and 2017, and the selected balance sheet data at December 31, 2019 and 2018, are derived from, and are qualified by reference to, our audited consolidated financial statements included elsewhere in this Annual Report on Form 10-K. The selected statement of income data for the year ended December 31, 2016 and 2015, and the balance sheet data at December 31, 2017, 2016 and 2015, are derived from audited consolidated financial statements not included herein. We disposed of selected assets and liabilities related to the clinical workflow product of our Predictive Analytics operating segment on December 21, 2015. The acquisition and disposal did not have a significant impact on our financial results.
Year Ended December 31, | ||||||||||||||||||||
| 2019(2)(3) | 2018(1)(2) | 2017 | 2016 | 2015 | ||||||||||||||||
(In thousands, except per share data) | ||||||||||||||||||||
Statement of Income Data: | ||||||||||||||||||||
Revenue | $ | 127,982 | $ | 119,686 | $ | 117,559 | $ | 109,384 | $ | 102,343 | ||||||||||
Operating expenses: | ||||||||||||||||||||
Direct | 46,435 | 47,577 | 49,068 | 45,577 | 44,610 | |||||||||||||||
Selling, general and administrative | 32,973 | 31,371 | 29,686 | 28,385 | 27,177 | |||||||||||||||
Depreciation and amortization | 5,539 | 5,463 | 4,586 | 4,225 | 4,109 | |||||||||||||||
Total operating expenses | 84,947 | 84,411 | 83,340 | 78,187 | 75,896 | |||||||||||||||
Operating income | 43,035 | 35,275 | 34,219 | 31,197 | 26,447 | |||||||||||||||
Other income (expense) | (2,516 | ) | (566 | ) | 64 | 159 | 913 | |||||||||||||
Income before income taxes | 40,519 | 34,709 | 34,283 | 31,356 | 27,360 | |||||||||||||||
Provision for income taxes | 8,113 | 4,662 | 11,340 | 10,838 | 9,750 | |||||||||||||||
Net income | $ | 32,406 | $ | 30,047 | $ | 22,943 | $ | 20,518 | $ | 17,610 | ||||||||||
Earnings per share common stock: Basic Earnings per share: | ||||||||||||||||||||
Common Stock (formerly Class A) | $ | 1.30 | $ | 1.08 | $ | 0.54 | $ | 0.49 | $ | 0.42 | ||||||||||
Class B | $ | -- | $ | 1.31 | $ | 3.26 | $ | 2.93 | $ | 2.52 | ||||||||||
Diluted Earnings per share: | ||||||||||||||||||||
Common Stock (formerly Class A) | $ | 1.26 | $ | 1.04 | $ | 0.52 | $ | 0.48 | $ | 0.41 | ||||||||||
Class B | $ | -- | $ | 1.27 | $ | 3.18 | $ | 2.88 | $ | 2.49 | ||||||||||
Weighted average share and share equivalents outstanding: | ||||||||||||||||||||
Common Stock (formerly Class A) – basic | 24,809 | 23,562 | 20,770 | 20,713 | 20,741 | |||||||||||||||
Class B – basic | -- | 3,527 | 3,514 | 3,505 | 3,478 | |||||||||||||||
Common Stock (formerly Class A) – diluted | 25,653 | 24,448 | 21,627 | 21,037 | 20,981 | |||||||||||||||
Class B – diluted | -- | 3,628 | 3,603 | 3,560 | 3,522 | |||||||||||||||
| 2019(2)(3) | 2018(1)(2) | 2017 | 2016 | 2015 | ||||||||||||||||
(In thousands, except per share data) | ||||||||||||||||||||
Balance Sheet Data: | ||||||||||||||||||||
Working capital surplus (deficiency) | $ | (8,998 | ) | $ | (18,699 | ) | $ | 19,949 | $ | 15,551 | $ | 10,890 | ||||||||
Total assets | 110,685 | 108,032 | 127,316 | 120,624 | 128,049 | |||||||||||||||
Total debt and finance lease obligations, net of unamortized debt issuance costs | 34,959 | 38,723 | 1,225 | 3,732 | 5,917 | |||||||||||||||
Total shareholders’ equity | 32,892 | 19,083 | 90,041 | 82,806 | 74,222 | |||||||||||||||
Cash dividends declared per share: | ||||||||||||||||||||
Common stock (formerly class A) | 0.78 | 1.13 | .40 | .34 | .62 | |||||||||||||||
Class B common stock | $ | -- | $ | .60 | $ | 2.40 | $ | 2.04 | $ | 3.72 | ||||||||||
(1)On January 1, 2018, we adopted Accounting Standards Update 2014-09, Revenue- Revenue from Contracts with Customers and all related amendments using the modified retrospective method for all incomplete contracts as of the date of adoption. See Notes 1 and 3 to our consolidated financial statements.
(2)As described in Note 2 to our consolidated financial statements, we completed the Recapitalization in April 2018 which settled all then-existing outstanding class B share-based awards, resulting in the elimination of the class B common stock and reclassified class A common stock to Common Stock.
(3)On January 1, 2019, we adopted Accounting Standards Update 2016-02, Leases, and all related amendments using the modified retrospective method for all incomplete contracts as of the date of adoption. See Notes 1 and 10 to our consolidated financial statements.
| ’ |
The following discussion and analysis provides a summary of significant factors relevant to our financial performance and condition. It should be read in conjunction with the consolidated financial statements and accompanying notes included in Part II, Item 8 of this Form 10-K. This section of this Form 10-K generally discusses 2021 and 2020 items and year-to-year comparisons between 2021 and 2020. Discussions of 2019 items and year-to-year comparisons between 2020 and 2019 are not included in this Form 10-K, and can be found in “Management’s Discussion and Analysis of Financial Condition and Results of Operations” in Part II, Item 7 of the Company’s Annual Report on Form 10-K for the fiscal year ended December 31, 2020.
Overview
Our purpose is to establish human understanding by enabling our clients to understand what matters most to each person they serve. We are a leading provider of analytics and insights that facilitate measurement and improvement of the patient and employee experience while also increasing patient engagement and customer loyalty for healthcare organizations. Our solutions enable our clients to understand the voice of the customer with greater clarity, immediacy and depth. Our heritage, proprietary methods, and holistic approach enable our partners to better understand the people they care for and design experiences that inspire loyalty and trust, while also facilitating regulatory compliance and the shift to population-based health management. Our ability to measure what matters most and systematically capture, analyze and deliver insights based on self-reported information from patients, families and consumers is critical in today’s healthcare market. We believe that access to and analysis of our extensive consumer-driven information is becoming more valuable as healthcare providers increasingly need to more deeply understand and engage the people they serve to build customer loyalty.
Our portfolio of subscription-based solutions provides actionable information and analysis to healthcare organizations across a range of mission-critical, constituent-related elements, including patient experience, service recovery, care transitions, health risk assessments, employee engagement, reputation management, and brand loyalty. We partner with clients across the continuum of healthcare services. Our clients include integrated health systems, post-acute providers and payer organizations. We believe this cross-continuum positioning is a unique and an increasingly important capability as evolving payment models drive healthcare providers and payers towards a more collaborative and integrated service model.
The outbreak of COVID-19, and the associated responses, have impacted our business in a variety of ways. Governments have implemented business and travel restrictions and recommended social distancing and other guidelines. Many businesses, including many of our clients, have de-emphasized external business opportunities and restricted in-person meetings while shifting their attention toward addressing COVID-19 planning, business disruptions, higher costs, and revenue shortfalls. At NRC, the vast majority of our associates are working remotely, and to date we have been capable of providing our services without significant disruption. We have made our facilities available for associates to return to work effective July 1, 2021 at their discretion. Historically, we have relied on national travel as part of our sales efforts, but as a result of the pandemic we had placed a temporary hold on all company related travel. We modified our travel policy and limited travel did resume in the third quarter of 2021. The duration and severity of the COVID-19 pandemic and associated impacts on our business, including the impact on our revenue, expenses, and cash flows, cannot be predicted at this time. Like many other companies, we experienced higher attrition rates in 2021. We may incur higher costs to attract, train and retain these associates. Attrition in our sales and service areas can also impact our ability to retain and attract new business. Based on the foregoing, we do not expect our recent revenue and earnings growth to be indicative of future expectations. We do, however, expect to have adequate sources of liquidity to meet our current and expected needs for the foreseeable future.
Critical Accounting Policies and Estimates
The preparation of financial statements requires management to make estimates and assumptions that affect amounts reported therein. The following areas are considered critical accounting estimates because they involve significant judgments or assumptions, involve complex or uncertain matters or they are susceptible to change and the impact could be material to our financial condition or operating results:
● | Revenue recognition; and | |
● | Valuation of goodwill and identifiable intangible | |
|
|
Revenue Recognition
We derive a majority of our revenue from annually renewable subscription-based service agreements with our customers. See Notes 1 and 3 to our consolidated financial statements for a description of ourSuch agreements are generally cancelable on short or no notice without penalty. We also derive revenue from fixed, non-subscription arrangements. Our revenue recognition policies.
Our revenue arrangements with a client may include combinations of more than one service offering which may be executed atpolicy requires management to estimate, among other factors, the same time, or within close proximity of one another. We combine contracts with the same customer into a single contract for accounting purposes when the contract is entered into at or near the same time and the contracts are negotiated as a single performance obligation. For contracts that contain more than one separately identifiable performance obligation, the total transaction price is allocated to the identified performance obligations based upon the relative stand-alone selling prices of the performance obligations. The stand-alone selling prices are based on an observable price for services sold to other comparable customers, when available, or an estimated selling price using a cost-plus margin or residual approach. We estimate the totalfuture contract consideration we expect to receive for variable arrangements based on the most likely amount we expect to earn from the arrangement based on the expected quantities. We only include some or a portion ofunder variable consideration in the transaction price when it is probable that a significant reversal in the amount of cumulative revenue recognized will not occur. We consider the sensitivity of the estimate, our relationship and experience with the client and variable services being performed, the range of possible revenue amounts and the magnitude of the variable consideration to the overall arrangement.
Our fixed, non-subscriptionsubscription arrangements typically require us to perform an unspecified amount of services for a fixed price during a fixed period of time. Revenues are recognized over time based upon the costs incurred to date in relation to theas well as future total estimated contract costs. In determining cost estimates, management uses historical and forecasted cost information which is based on estimated volumes, external and internal costs and other factors necessary in estimating the total costs over the contract term of the contract. Changes in estimates are accounted for using a cumulative catch up adjustment which could impact the amount and timing of revenue for any period.
with respect to fixed, non-subscription arrangements. If management made different judgments and estimates, then the amount and timing of revenue for any period could differ from the reported revenue. See Notes 1 and 3 to our consolidated financial statements for a description of our revenue recognition policies.
Valuation of Goodwill and Identifiable Intangible Assets
Intangible assets include customer relationships, trade names, technology, and goodwill. Intangible assets with estimable useful lives are amortized over their respective estimated useful lives to their estimated residual values and reviewed for impairment with other long-lived assets in the related asset group whenever events or changes in circumstances indicate that the carrying amount of the assets may not be recoverable. We review intangible assets with indefinite lives for impairment annually as of October 1 and whenever events or changes in circumstances indicate that the carrying value of an asset may not be recoverable.
When performing the impairment assessment, we will first This review requires management to assess qualitative factors to determine whether it is necessary to recalculatean impairment may have occurred, which inherently involves management’s judgment. This assessment also requires a determination of the fair value of the asset, which often includes several significant estimates and assumptions, including future cash flow estimates, determination of appropriate discount rates, and other assumptions that management believed reasonable under the circumstances. Changes in these estimates and assumptions could materially affect the determination of fair value and/or impairment of goodwill or other intangible assetsassets. See Notes 1 and 6 to our consolidated financial statements for a description of our goodwill and intangible asset valuation and impairment policies and associated impacts for the reported periods.
In March 2021, we changed our operating segments from six to one to reflect a change in corporate reporting structure to the Company’s Chief Executive Officer and chief operating decision maker. In connection with indefinite lives. Ifthe revision to our operating segments, we believe, as a resultperformed an interim qualitative analysis immediately before and after the reorganization and concluded that the fair value of our reporting units likely exceeded the carrying values and no impairments were recorded. Following the reorganization, we considered the current and expected future economic and market conditions, including the impact of the qualitative assessment,COVID-19 pandemic, on our reporting unit. We also assessed our current market capitalization compared to book value, forecasts and margins in our last quantitative impairment testing. We concluded that a triggering event has not occurred which would require an additional interim impairment test to be performed as it is not more likely than not that the fair value of the indefinite-lived intangibles is less than their carrying amount, we calculate the fair value using a market or income approach. If the carrying value of intangible assets with indefinite lives exceeds their fair value, then the intangible assets are written-down to their fair values. We did not recognize any impairments related to indefinite-lived intangibles during 2019, 2018 or 2017.
Goodwill is an asset representing the future economic benefits arising from other assets acquired in a business combination that are not individually identified and separately recognized. All of our goodwill is allocated to our reporting units, which are the same as our six operating segments: Experience, The Governance Institute, Market Insights, Transparency, National Research Corporation Canada and Transitions. Goodwill is reviewed for impairment at least annually, as of October 1, and whenever events or changes in circumstances indicate that the carrying value of goodwill may not be recoverable.
We review for goodwill impairment by first assessing qualitative factors to determine whether any impairment may exist. If we believe, as a result of the qualitative assessment, that it is more likely than not that the fair value of a reporting unit is less than its carrying amount, a quantitative analysis will be performed, and the fair value of the reporting unit is compared with its carrying value (including goodwill). If the fair value of the reporting unit exceeds its carrying value, no impairment exists. If the fair value of the reporting unit is less than its carrying value, then goodwill is written down by this difference. We performed a qualitative analysis as of October 1, 2019 and determined the fair value of each reporting unit likely significantly exceeded its carrying value. No impairments were recorded during the years ended December 31, 2019, 2018 or 2017.
Our Canadian reporting unit generates service revenue from a relatively small number of customers with approximately 56.5% of its revenue concentrated in one customer contract which currently expires in March 2021. While historically we have been successful in renewing or retaining contracts with our customers, should we be unable to or choose not to renew a significant contract, it would likely result in an impairment of goodwill at this reporting unit. The carrying amount of goodwill related to our Canadian reporting unitloss had been incurred at December 31, 2019 was $2.3 million.
Income Taxes
We use the asset and liability method of accounting for income taxes. Under that method, deferred income tax assets and liabilities are recognized for the future tax consequences attributable to differences between the financial statement carrying amounts of existing assets and liabilities and their respective tax bases using enacted tax rates. The effect on deferred tax assets and liabilities of a change in tax rates is recognized in income in the period that includes the enactment date. Valuation allowances, if any, are established when necessary to reduce deferred tax assets to the amount that is more likely than not to be realized. We recognize the effect of income tax positions only if those positions are more likely than not of being sustained. Recognized income tax positions are measured at the largest amount that is greater than 50% likely of being realized. Changes in recognition or measurement are reflected in the period in which the change in judgment occurs. Management judgment is required to determine the provision for income taxes and to determine whether deferred income taxes will be realized in full or in part. Such judgments include, but are not limited to, the likelihood we would realize the benefits of net operating loss carryforwards, the adequacy of valuation allowances, the election to capitalize or expense costs incurred, and the probability of outcomes of uncertain tax positions. It is possible that the various taxing authorities could challenge those judgments or positions and reach conclusions that would cause us to incur tax liabilities in excess of, or realize benefits less than, those currently recorded. In addition, changes in the geographical mix or estimated amount of annual pretax income could impact our overall effective tax rate.2021.
Key Financial Metrics and Results of Operations
The following table and graphs setsets forth, for the periods indicated, selected financial information derived from our consolidated financial statements including amounts expressed as a percentage of total revenue and the percentage change in such items versus the prior comparable period, (please note that all columns may not add up to 100% due to rounding). The trends illustrated in the following table and graphs may not necessarily be indicative of future results.as well as other key financial metrics. The discussion that follows the information should be read in conjunction with our consolidated financial statements.
Percentage of Total Revenue | Percentage Increase (Decrease) | |||||||||||||||||||
2019 | 2018 | 2017 | 2019 over 2018 | 2018 over 2017 | ||||||||||||||||
Revenue | 100.0 | % | 100.0 | % | 100.0 | % | 6.9 | % | 1.8 | % | ||||||||||
Operating expenses: | ||||||||||||||||||||
Direct | 36.3 | 39.7 | 41.7 | (2.4 | ) | (3.0 | ) | |||||||||||||
Selling, general and administrative | 25.8 | 26.2 | 25.3 | 5.1 | 5.7 | |||||||||||||||
Depreciation and amortization | 4.3 | 4.6 | 3.9 | 1.4 | 19.1 | |||||||||||||||
Total operating expenses | 66.4 | 70.5 | 70.9 | 0.6 | 1.3 | |||||||||||||||
Operating income | 33.6 | % | 29.5 | % | 29.1 | % | 22.0 | % | 3.1 | % | ||||||||||
Due to changes in our corporate reporting structure in 2021, certain associates moved between departments. As a result, the related salaries and benefits and company incentive expenses are included in Selling, general and administrative expenses in the 2021 periods instead of Direct as in the 2020 periods. The total amount of the reclassified expenses approximates $1.9 million in 2021.

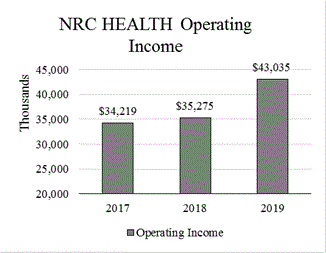
Year Ended December 31, 2019, Compared to Year Ended December 31, 2018
(In thousands, except percentages) | Percentage Increase (Decrease) | |||||||||||||||||||
2021 | 2020 | 2019 | 2021 over 2020 | 2020 over 2019 | ||||||||||||||||
Revenue | $ | 147,954 | $ | 133,277 | $ | 127,982 | 11.0 | 4.1 | ||||||||||||
Direct expenses | 52,350 | 49,187 | 46,435 | 6.4 | 5.9 | |||||||||||||||
Selling, general, and administrative | 38,960 | 34,441 | 32,973 | 13.1 | 4.5 | |||||||||||||||
Depreciation, amortization and impairment | 6,374 | 7,505 | 5,539 | (15.1 | ) | 35.5 | ||||||||||||||
Operating income | 50,270 | 42,677 | 43,035 | 17.8 | (0.8 | ) | ||||||||||||||
Total other income (expense) | (1,649 | ) | (1,210 | ) | (2,516 | ) | 36.3 | (51.9 | ) | |||||||||||
Provision for income taxes | 11,155 | 4,207 | 8,113 | 165.2 | (48.1 | ) | ||||||||||||||
Effective Tax Rate | 22.9 | % | 10.1 | % | 20.0 | % | 12.8 | (9.9 | ) | |||||||||||
Operating margin | 34.0 | % | 32.0 | % | 33.6 | % | 2.0 | (1.6 | ) | |||||||||||
Recurring Contact Value | $ | 150,937 | $ | 145,079 | $ | 136,763 | 4.0 | 6.1 | ||||||||||||
Cash provided by operating activities | 46,344 | 40,636 | 40,917 | 14.0 | (0.7 | ) | ||||||||||||||
RevenueRevenue. . Revenue in 20192021 increased 6.9% to $128.0 million, compared to $119.7 million in 2018, which was driven2020, primarily due to new customer sales, as well as increases in sales to the existing client base. Our solutions within the VoC platformDuring 2020, we also experienced revenue reductions from COVID-19 as some clients reduced or eliminated services they purchased from us as cost reducing measures, which increased our revenue growth in 2019 accounted for 62.7% of total2021. We expect our revenue comparedgrowth in 2022 to 49.6%align more closely in 2018. The remaining revenue consists of legacy Experience and Governance Solutions. Clients with agreements for multiple solutions represented 27% ofrelation to our client base at the end of 2019, up from 24% at the end of 2018.recurring contract value growth.
Direct expenses. Direct expenses decreased 2.4% to $46.4 millionincreased in 2019,2021 compared to $47.6 million in 2018. This was2020 due to a decreasegrowth in variable expenses of $2.6 million,volume-based data collection costs to support the growth in revenue partially offset by an increase in fixed expenses of $1.4 million. Variable expenses decreased mainly due to less postage, printing, and paper costs primarily resulting from increased use of digital survey methodologies. Conference expenses also increased due to lower volumesadditional conferences being held in 2021 compared to 2020 and shift to allow live or virtual attendance at conferences. Variable expenses as a percentage of revenue have leveled with changes in survey methodologies.methodologies at 14.4% and 14.2% in 2021 and 2020, respectively. Fixed expenses increased primarily as a result of increased salary and benefit costs in the customer serviceto attract and information technology areas partially offset by $730,000 of state payrollretain associates, contracted services and sales tax incentivessoftware and lower contracted services. Direct expenses decreased as a percentage of revenue to 36.3% in 2019, from 39.7% in 2018, as expenses decreased by 2.4% while revenue for the same period increased by 6.9%.platform hosting expenses.
Selling, general and administrative expenses. Selling, general and administrative expenses increased 5.1% to $33.0 million in 20192021 compared to $31.4 million in 2018,2020 primarily due to increasedincreases in salary and benefit costs to attract and retain associates, public company and other legal and accounting costs, contracted services, software license fees and platform hosting expenses of $790,000,and other taxes due to a favorable tax ruling in 2020 reversing sales tax expense of $775,000 as a result of a recent sales tax analysis, higher salary and benefit costs of $690,000, additional insurance costs of $285,000, increased travel costs of $196,000, higher marketing program expenses of $89,000 and additional company incentive event costs of $81,000. These were partially offset by decreased contract services of $529,000, a reduction in legal and accounting costs of $469,000 mainly associated with the Recapitalization, the Tax Cut and Jobs Act and adoption of ASC 606 in 2018 and state payroll and sales tax incentives of $917,000. Selling, general, and administrative expenses decreased as a percentage of revenue to 25.8% in 2019, from 26.2% in 2018 as expenses increased by 5.1% while revenue increased by 6.9% during the same period.expense.
Depreciation, amortization and amortizationimpairment. Depreciation, amortization and amortizationimpairment expenses remained at $5.5 milliondecreased in 2021 compared to 2020 primarily due to additional depreciation and impairment expense in 2020 from shortening the estimated useful lives of certain building assets and a goodwill impairment adjustment for the twelve-month period ended December 31, 2019 and 2018, however, thereCanadian reporting unit. This was increased amortization from additional computer software investments primarilypartially offset by our transformation to a distributed workforce environment, which includes building renovation costs for our headquarters, as well as subleasing a remote office location at a discounted rate, which resulted in an intangibleROU asset that has been fully amortized. Depreciation and amortization expenses decreased as a percentage of revenue to 4.3%impairment in 2019, from 4.6% in 2018 as depreciation and amortization expenses increased by 1.4% while revenue increased by 6.9% during the same period.2021.
OtherOperating income and margin. Operating income and margin grew due to leveraging the revenue growth through the efficiencies inherent within our subscription model as well as the discipline in managing our cost structure.
Total other income (expense). Other expense, net was $2.5 million for the twelve-month period ended December 31, 2019, compared to $566,000 for the same period in 2018. Interest expense increased $578,000 due to additional interest related to the term loan originated in April 2018 and borrowings on the line of credit. Other expense, net increased $1.3 million primarily due to revaluation of intercompany transactions for changes in the foreign exchange rates.
Provision for income taxes. Provision for income taxes was $8.1 million (20.0% effective tax rate) in 2019, compared to $4.7 million (13.4% effective tax rate) in 2018. The effective tax rate for the twelve-month period ended December 31, 2019, was higher mainly due to lower income tax benefits from the exercise of share-based compensation awards and higher state income taxes due to requirements to file in more states.
Year Ended December 31, 2018, Compared to Year Ended December 31, 2017
Revenue. Revenue in 2018 increased 1.8% to $119.7 million, compared to $117.6 million in 2017, which was due to new customer sales and increases in sales to the existing client base. Our solutions within the VoC platform in 2018 accounted for 49.6% of total revenue compared to 33.9% in 2017. The remaining revenue consists of legacy Experience and Governance Solutions. Clients with agreements for multiple solutions represented 24% of our client base at the end of 2018, up from 22% at the end of 2017.
Direct expenses. Direct expenses decreased 3.0% to $47.6 million in 2018, compared to $49.1 million in 2017. This was due to a decrease in variable expenses of $2.2 million partially offset by an increase in fixed expenses of $689,000. Variable expenses decreased mainly due to less postage, printing and paper costs due to lower volumes and changes in survey methodologies. Fixed expenses increased primarily as a result of increased salary and benefit costs in the customer service and information technology areas. Direct expenses decreased as a percentage of revenue to 39.7% in 2018 from 41.7% for the same period in 2017 as expenses decreased by 3.0% while revenue for the same period increased by 1.8%.
Selling, general and administrative expenses. Selling, general and administrative expenses increased 5.7% to $31.4 million in 2018 compared to $29.7 million in 2017 primarily due to increased software and platform hosting expenses of $1.8 million, higher salary and benefit costs of $685,000, including acceleration of share-based compensation expense from the vesting of restricted stock and settlement of stock options associated with the Recapitalization of $331,000, and increased contracted services of $529,000. These were offset by decreased legal and accounting expenses primarily associated with the Recapitalization of $516,000, lower recruiting expenses of $568,000 and a reduction in marketing expense of $239,000. Selling, general, and administrative expenses increased as a percentage of revenue to 26.2% in 2018, from 25.3% for the same period in 2017 as expenses increased by 5.7% while revenue increased by 1.8% during the same period.
Depreciation and amortization. Depreciation and amortization expenses increased 19.1% to $5.5 million in 2018 compared to $4.6 million in 2017 due to increased amortization from additional computer software investments. Depreciation and amortization expenses as a percentage of revenue increased to 4.6% in 2018, from 3.9% for the same period in 2017.
Other income (expense). OtherTotal other income (expense) decreased to other expense of $566,000increased in 2018, compared to other income of $64,000 in 2017 primarily due to increased interest expense, partially offset by other income. Interest expense increased to $1.5 million due to interest related to the new term loan originated in April 2018. Other income increased to $885,000total net (expense) primarily due to revaluation on intercompany transactions due to changes in the Canadian to U.S. dollar foreign exchange rate.rate partially offset by lower interest expense due to the declining balance on our term loan.
Provision for income taxes and effective tax rate. Provision for income taxes was $4.7 million (13.4% effective tax rate) in 2018, compared to $11.3 million (33.1% effective tax rate) in 2017. Theand effective tax rate was lowergrew in 2018 mainly2021 compared to 2020 primarily due to incomedecreased tax benefits from the Recapitalization,exercise and vesting of share-based compensation awards and higher state income taxes.
Recurring Contact Value. Recurring contract value grew as sales continued to exceed loss and downsells. Retention rates grew in 2021 compared to 2020, but sales declined due to accelerated vestingthe difficulties of restricted stockselling to our clients during the COVID-19 pandemic as well as increased turnover within our sales force. Our recurring contract value growth declined in 2021 in comparison to 2020 due in part to our strategy to focus on growing our digital core solutions, and settlement of options of $1.1 million, andtherefore, the reduction indecision was made to eliminate certain legacy offerings. Our recurring contract value metric represents the corporate tax rate from 35% to 21%total revenue projected under all renewable contracts for their respective next annual renewal periods, assuming no upsells, downsells, price increases, or cancellations, measured as a result of the Tax Act. In addition, we had increased tax benefits of $1.6 million related to the vesting and exercise of stock awards, net of certain excess compensation limits, a tax depreciation method change election for software development costs creating an income tax benefit of $308,000 and decreased non-deductible Recapitalization expenses of $361,000. This was partially offsetmost recent quarter end.
Cash provided by decreased tax expense of $1.1 million in 2017operating activities. Cash provided by operating activities grew mainly due to Tax Act related adjustments. See Note 7growth in cash collections on trades accounts receivable, change in income taxes receivable and payable, and growth in deferred revenue primarily due to our consolidated financial statements for more detailstiming of initial billings on tax adjustments related to the Tax Act.
Inflationnew and Changing Pricesrenewal contracts.
Inflation and changing prices have not had a material impact on revenue or net income in the last three years.
Liquidity and Capital Resources
Our Board of Directors has established priorities for capital allocation, which prioritize funding of innovation and growth investments, including merger and acquisition activity as well as internal projects. The secondary priority is capital allocation for quarterly dividends and share repurchases. We believe that our existing sources of liquidity, including cash and cash equivalents, borrowing availability, and operating cash flows will be sufficient to meet our projected capital and debt maturity needs and dividend policy for the foreseeable future and therefore we feel that our working capital deficit has little impact on our liquidity. Cash dividends in the aggregate amount of $19.4 million were declared in 2019 with $14.2 million paid in 2019 and the remaining $5.2 million paid in January 2020. The dividends were paid from cash on hand and $4.5 million in borrowings on our line of credit.future.
As of December 31, 2019,2021, our principal sources of liquidity included $13.5$54.4 million of cash and cash equivalents, up to $15$30 million of unused borrowings under our line of credit and up to $15 million on our delayed draw term note. Of this cash, $3.9$6.5 million was held in Canada. The delayed draw term note can only be used to fund permitted future business acquisitions or repurchasing our Common Stock.
Working Capital
We had a working capital deficit of $9.0 million and $18.7 million on December 31, 2019 and 2018, respectively.
The change was primarily due to a decrease in dividends payable of $11.9 million, and an increase in other current assets of $1.7 million. These were partially offset by an increase in other current liabilities of $841,000, an increase in current portion of notes payable of $711,000, an increase of accounts payable of $666,000, an increase in accrued expenses $574,000, and a decrease of $887,000 in prepaid expenses. Dividends payable decreased due to a special dividend of $12.4 million that was declared in 2018 and paid in January of 2019. Deferred contract costs, net increased due to growth in capitalized commission and incentives directly related to new sales. Other current liabilities increased due to adoption of Accounting Standards Update (“ASU”) 2016-02, Leases (Topic 842) (“Topic 842” or the “New Leases Standard”) and deferred income benefits from the state payroll and sales tax incentives. Topic 842 requires lessees to recognize a lease liability and a right-of-use (“ROU”) asset on the balance sheet for operating leases. Accounts payable and accrued expenses increased and prepaid expenses decreased due to timing of payment for services and supplies. Our working capital is significantly impacted by our large deferred revenue balances which will vary based on the timing and frequency of billings on annual agreements. The deferred revenue balances as of December 31, 2019 and December 31, 2018, were $16.4 million and $16.2 million, respectively.
The deferred revenue balance is primarily due to timing of initial billings on new and renewal contracts. We typically invoice clients for services before they have been completed. Billed amounts are recorded as billings in excess of revenue earned, or deferred revenue, on our consolidated financial statements, and are recognized as income when earned. In addition, when work is performed in advance of billing, we record this work as revenue earned in excess of billings, or unbilled revenue. Substantially all deferred revenue and all unbilled revenue will be earned and billed respectively, within 12 months of the respective period ends.
Cash Flow Analysis
A summary of operating, investing, and financing activities are shown in the following table:
For the Year Ended December 31, | ||||||||||||
2019 | 2018 | 2017 | ||||||||||
(In thousands) | ||||||||||||
Provided by operating activities | $ | 40,917 | $ | 39,848 | $ | 28,091 | ||||||
Used in investing activities | (4,656 | ) | (5,971 | ) | (6,118 | ) | ||||||
Used in financing activities | (36,346 | ) | (54,497 | ) | (21,116 | ) | ||||||
Effect of exchange rate changes on cash | 611 | (1,122 | ) | 855 | ||||||||
Net increase (decrease) in cash and cash equivalents | 526 | (21,742 | ) | 1,712 | ||||||||
Cash and cash equivalents at end of period | $ | 13,517 | $ | 12,991 | $ | 34,733 | ||||||
Cash Flows from Operating Activities
Cashcash flows from operating activities consist of net income adjusted for non-cash items including depreciation and amortization, deferred income taxes, share-based compensation and related taxes, reserve for uncertain tax positions, loss on disposal of property and equipment and the effect of working capital changes.
Net cash Cash provided by operating activities grew mainly due to strong cash collections on trades accounts receivable, change in income taxes receivable and payable, decreases in deferred contract costs due to the changes in the costs to acquire new sales and growth in deferred revenue primarily due to timing of initial billings on new and renewal contracts. This was $40.9partially offset by decreased depreciation, amortization and impairment and increased accrued expenses, wages, and bonuses.
We had a working capital surplus of $33.3 million for the year endedand $22.4 million on December 31, 2019,2021 and 2020, respectively. The change was primarily due to increases in cash and cash equivalents and prepaid expenses, partially offset by increases in dividends payable, accrued expenses and deferred revenue. Dividends payable increased due to timing of declaration and payments of dividends. Prepaid expenses and accrued expenses increased due to timing of payment for services and supplies. Our working capital is significantly impacted by our large deferred revenue balances which included net incomewill vary based on the timing and frequency of $32.4 million, plus non-cash charges (benefits)billings on annual agreements.
Cash used in investing activities consisted of acquisition consideration for deferred income taxes, depreciationour January 2021 acquisition of PatientWisdom and amortization, reserve for uncertain tax positions, loss on disposalpurchases of property and equipment including computer software and non-cash share based compensation totaling $7.9 million. Changes in working capital increased cash flows from operating activities by $616,000, primarily from increases in accounts payable, accrued expenses, wages, bonushardware, leasehold and profit sharing, deferred tax incentives,building improvements and deferred contract costs, net, which fluctuate due to the timing of payments of prepaids, accounts payablefurniture and accrued expenses, and the timing of direct and incremental costs directly related to sales. These increases to cash flows were partially offset by decreases in prepaid expenses and other current assets.equipment.
Net cash provided by operating activities was $39.8 million for the year ended December 31, 2018, which included net income of $30.0 million, plus non-cash charges (benefits) for deferred tax expense, depreciation and amortization, reserve for uncertain tax positions, loss on disposal of property and equipment and non-cash share based compensation totaling $8.4 million. Changes in working capital increased cash flows from operating activities by $1.5 million, primarily from increases in income taxes payable and decreases in accounts receivables, which fluctuate due to the timing of income tax payments and the timing and frequency of billings on new and renewal contracts, respectively. These increases to cash flows were partially offset by an increase in prepaid expenses and other current assets and decreases due to the timing of payments on accounts payable, accrued expenses, wages, bonus and profit sharing, deferred contract costs and a decrease in deferred revenue.
Net cash provided by operating activities was $28.1 million for the year ended December 31, 2017, which included net income of $22.9 million, plus non-cash charges (benefits) for deferred tax expense, depreciation and amortization, reserve for uncertain tax positions, loss on disposal of property and equipment and non-cash share based compensation totaling $6.0 million. Changes in working capital decreased cash flows from operating activities by $806,000, primarily from increases in prepaid expenses, income taxes recoverable and accounts receivables, which fluctuate due to the timing and frequency of billings on new and renewal contracts. These decreases to cash flows were partially offset by the timing of payments on accounts payable, accrued expenses, wages, bonus and profit sharing, and an increase in deferred revenue.
Cash Flows from Investing Activities
Net cash of $4.7 million was used for investing activities in the year ended December 31, 2019 for purchases of property and equipment. These expenditures consisted mainly of computer software classified in property and equipment.
Net cash of $6.0 million was used for investing activities in the year ended December 31, 2018 for purchases of property and equipment.
Net cash of $6.1 million was used for investing activities in the year ended December 31, 2017. Purchases of property and equipment totaled $4.6 million. In addition, we used $1.3 million of cash to acquire a strategic investment in convertible preferred stock of PracticingExcellence.com, a privately-held Delaware corporation, which is carried at cost and included in other non-current assets.
Cash Flows from Financing Activities
Net cash used in financing activities was $36.3 million in the year ended December 31, 2019. Cash was used to repayconsisted of payments for borrowings under the term notes totaling $3.7 million, to repay borrowings on the line of credit of $21.0 millionnote and for finance lease obligations of $229,000. Cash wasobligations. We also used to pay $31.3 million of dividends on our common stock, andcash to pay payroll tax withholdings related to share-based compensation, repurchase of $1.1 million. Cash of $21.0 million was provided from borrowings on the line of credit.
Net cash used in financing activities was $54.5 million in the year ended December 31, 2018. Cash was usedshares for the Recapitalization of $72.4 million (see Note 2 to our consolidated financial statements), to repay borrowings under the term notes totaling $3.1 million, to repay borrowings on the line of credit of $2.5 million, to pay loan origination fees on the new credit agreement of $187,000 and for finance lease obligations of $157,000. Cash was also used to pay $16.9 million of dividends on our common stock,treasury, and to pay payroll tax withholdings relateddividends on common stock. This was partially offset by the proceeds from the exercise of share-based awards.
Our material cash requirements include the following contractual and other obligations:
Dividends
Cash dividends in the aggregate amount of $12.2 million were declared in 2021 with $9.2 million paid in 2021 and the remaining $3.0 million paid in January 2022.The dividends were paid from cash on hand. Our board of directors considers whether to share-based compensationdeclare a dividend and the amount of $1.9 million. Cash was provided from proceedsany dividends declared on a quarterly basis.
Acquisition Consideration
On January 4, 2021, we acquired substantially all assets and assumed certain liabilities of PatientWisdom, Inc., a company with a health engagement solution that will further our purpose of operationalizing human understanding through tangible and actionable insights. $3.0 million of the new term loan of $40total $5.0 million andall-cash consideration was paid at closing. We paid the new line of credit of $2.5 million.remaining $2.0 million in January 2022. All payments were made with cash on hand.
Net cash used in financing activities was $21.1 million in the year ended December 31, 2017. Cash was used to repay borrowings under the term note totaling $2.5 million and for finance lease obligations of $108,000. Cash was used to pay $16.9 million of dividends, and to pay payroll tax withholdings related to share-based compensation of $1.7 million.
Capital Expenditures
CapitalWe paid cash of $5.5 million for capital expenditures forin the year ended December 31, 2019 were $4.7 million.2021. These expenditures consisted mainly of computer equipmentsoftware development for our Human Understanding solutions and software. We expect similar capital expenditure purchasesbuilding renovations to our headquarters of $2.8 million and $1.8 million, respectively. Future costs related to our headquarters building renovations are estimated at $15 million and $7 million in 2020 consisting primarily of computer equipment2022 and software and other equipment, to be funded through cash generated from operations.2023, respectively.
Debt and Equity
On April 18, 2018, in connection with the Recapitalization, we entered into aOur amended and restated credit agreement (the “Credit Agreement”) with First National Bank of Omaha (“FNB”) providing forincludes (i) a $15,000,000$30,000,000 revolving credit facility (the “Line of Credit”), (ii) a $40,000,000$33,002,069 term loan (the “Term Loan”) and (iii) a $15,000,000 delayed draw-dawndraw-down term facility (the “Delayed Draw Term Loan” and, together with the Line of Credit and the Term Loan, the “Credit Facilities”). We usedmay use the Term Loan to fund, in part, the cash portion paid to holders of our then-existing class B common stock in connection with the Recapitalization and the accompanying exchange of outstanding equity awards tied to the class B common stock, as well as for the costs of the Recapitalization. The Delayed Draw Term Loan may be used to fund any permitted future business acquisitions or repurchases of our Common Stock and the Line of Credit will be used to fund ongoing working capital needs and for other general corporate purposes.
The Term Loan has an outstanding balance of $26.6 million and is payable in monthly installments of $462,988 through April 2020 and $526,362 thereafter,May 2025, with a balloon payment due at maturity in April 2023.May 2025. The Term Loan bears interest at a fixed rate per annum of 5%.
Borrowings under the Line of Credit and the Delayed Draw Term Loan, if any, bear interest at a floating rate equal to the 30 day30-day London Interbank Offered Rate (“LIBOR”) plus 225 basis points (3.94%(2.35% at December 31, 2019)2021). Interest on the Line of Credit accrues and is payable monthly. Principal amounts outstanding under the Line of Credit are due and payable in full at maturity, in April 2021.May 2023. As of December 31, 2019,2021, and 2020, the Line of Credit did not have a balance. There were no borrowings on the line of credit for the three-month period ended December 31, 2019. The weighted average borrowings on the Line of Credit for year ended December 31, 2019 was $2.4 million. The weighted average interest on borrowings on the Line of Credit for the year ended December 31, 2019 was 4.72%.
In the event that the Delayed Draw Term Loan is used, interest-only payments will be due through the calendar year in which the Delayed Draw Term Loan is drawn upon. After that, amortization will occur at the then current Term Loan rate and schedule with principal and accrued interest amounts outstanding under the Delayed Draw Term Loan due and payable monthly during the term of the Delayed Draw Term Loan, which expires on April 18, 2023.2021. There have been no borrowings on the Delayed Draw Term Loan since origination.
We paid a one-time fee equal to 0.25% of the amount borrowed under the Term Loan at the closing of the Credit Facilities. We are also obligated to pay ongoing unused commitment fees quarterly in arrears pursuant to the Line of Credit and the Delayed Draw Term Loan facility at a rate of 0.20% per annum based on the actual daily unused portions of the Line of Credit and the Delayed Draw Term Loan facility, respectively.
The Credit Agreement contains customary representations, warranties, affirmative and negative covenants (including financial covenants) and events of default. The negative covenants include, among other things, restrictions regarding the incurrence of indebtedness and liens, repurchases of our Common Stock and acquisitions, subject in each case to certain exceptions. Pursuant to the Credit Agreement, we are required to maintain a minimum fixed charge coverage ratio of 1.10x for all testing periods throughout the term(s) of the Credit Facilities, which calculation excludes, unless our liquidity falls below a specified threshold, (i) any cash dividend in a fiscal quarter that, together with all other cash dividends paid or declared during such fiscal quarter, exceeds $5,500,000 in total cash dividends paid or declared, (ii) the portion of the purchase price for any permitted share repurchase of our shares paid with cash on hand, and (iii) the portion of any acquisition consideration for a permitted acquisition paid with cash on hand. We are also required to maintain a cash flow leverage ratio of 3.00x or less for all testing periods throughout the term(s) of the Credit Facilities. All obligations under the Credit Facilities are to be guaranteed by eachour subsidiary. As of December 31, 2021, we were in compliance with our direct and indirect wholly owned domestic subsidiaries, if any, and, to the extent required by the Credit Agreement, direct and indirect wholly owned foreign subsidiaries (each, a “guarantor”).financial covenants.
The Credit Facilities are secured, subject to permitted liens and other agreed upon exceptions, by a first-priority lien on and perfected security interest in substantially all of our and our guarantors’ present and future assets (including, without limitation, fee-owned real property, and limited, in the case of the equity interests of foreign subsidiaries, to 65% of the outstanding equity interests of such subsidiaries).
The Credit Agreement contains customary representations, warranties, affirmativeLeases
We have lease arrangements for certain computer, office, printing and negative covenants (including financial covenants)inserting equipment as well as office and events of default. The negative covenants include, among other things, restrictions regarding the incurrence of indebtedness and liens, repurchases of our Common Stock and acquisitions, subject in each case to certain exceptions. The Credit Agreement also contains certain financial covenants with respect to minimum fixed charge coverage ratio and maximum cash flow leverage ratio. Pursuant to the Credit Agreement, we are required to maintain a minimum fixed charge coverage ratio of 1.10x for all testing periods throughout the terms of the Credit Facilities. We are also required to maintain a maximum cash flow leverage ratio of 3.00x for all testing periods throughout the terms of the Credit Facilities.data center space. As of December 31, 2019,2021, we were in compliance with our financial covenants.
We havehad fixed lease payments of $531,000 and $488,000 for operating and finance leases, for computer equipment, office equipment, printingrespectively payable within 12 months. A summary of our operating and inserting equipment. The balance of the finance leaseslease obligations as of December 31, 2019 was $786,000.2021 can be found in Note 10, "Leases", to the Consolidated Financial Statements contained in this report.
We incurred expensesTaxes
The liability for gross unrecognized tax benefits related to the Recapitalization of approximately $721,000 and $1.4uncertain tax positions was $1.1 million in the year ended December 31, 2018 and 2017, respectively, which were included in selling and administrative expenses.
A sales tax accrual was recorded in 2019 after we became aware that a state sales tax liability was both probable and estimable as of December 31, 2019, due2021. See Note 7, "Income Taxes", to sales taxes that should have been collected from customersthe Consolidated Financial Statements contained in 2019 and certain previous years. As a result, we recorded an expense of $775,000 through selling and administrative expenses and an associated liability through accrued expenses. We are working through voluntary disclosure agreements with certain states and will have procedures in place to start collecting and remitting salesthis report for income tax in the second quarter of 2020. State and local jurisdictions have differing rules and regulations governing sales, use, and other taxes and these rules and regulations can be complex and subject to varying interpretations that may change over time. As a result, we could face the possibility of tax assessment and audits, and our liability for these taxes and associated interest and penalties could exceed our original estimates. In addition, we will incur additional sales tax expense in the first quarter of 2020, since we will not start collecting sales tax from customers until the 2nd quarter of 2020.
Contractual Obligationsrelated information.
We had contractual obligations to make payments in the following amounts in the future asAs of December 31, 2019:2021, the balance of the deemed repatriation tax payable imposed by the U.S. Tax Cuts and Jobs Act of 2017 (the Act”) was $182,000, which we expect to pay by the end of 2022.
Contractual Obligations(1) | Total Payments | Less than One Year | One to Three Years | Three to Five Years | After Five Years | |||||||||||||||
(In thousands) | ||||||||||||||||||||
Operating leases | $ | 1,837 | $ | 591 | $ | 679 | $ | 449 | $ | 118 | ||||||||||
Finance leases | 848 | 257 | 455 | 136 | -- | |||||||||||||||
Uncertain tax positions(2) | -- | -- | -- | -- | -- | |||||||||||||||
Long-term debt | 38,838 | 6,063 | 12,633 | 20,142 | -- | |||||||||||||||
Total | $ | 41,523 | $ | 6,911 | $ | 13,767 | $ | 20,727 | $ | 118 | ||||||||||
|
|
|
|
We generally do not make unconditional, non-cancelable purchase commitments. We enter into purchase orders in the normal course of business, but these purchase obligations do not exceed one year.
Stock Repurchase Program
Our Board of Directors authorized the repurchase of up to 2,250,000 then-existing class A shares and 375,000 then-existing class B shares of common stockCommon Stock in the open market or in privately negotiated transactions under a stock repurchase program that was originally approvedprogram. We repurchase shares of our common stock from time to time after considering market conditions and in February 2006 and subsequently amended in May 2013. In connectionaccordance with the Recapitalization in April 2018,repurchase limits authorized by our BoardBoard. During 2021, we repurchased 111,548 shares of Directors further amended the stock repurchase program to eliminate the repurchaseour Common Stock under this authorization for an aggregate of the former class B common stock.$4.6 million. As of December 31, 2019,2021, the remaining number of shares of Common Stock that could be purchased under this authorization was 280,491 shares.
Off-Balance Sheet Obligations
We have no significant off-balance sheet obligations.168,943 shares, which we expect to repurchase during 2022.
Recent Accounting Pronouncements
See Note 1 to our consolidated financial statements for a description of recently issued accounting pronouncements.
Our primary market risk exposures are changes in foreign currency exchange rates and interest rates.
Our Canadian subsidiary uses Canadian dollars as its functional currency the local currency of the country in which it operates.currency. It translates its assets and liabilities into U.S. dollars at the exchange rate in effect at the balance sheet date. It translates its revenue and expenses at the average exchange rate during the period. We include translation gains and losses in accumulated other comprehensive income (loss), a component of shareholders’ equity. Foreign currency translation gains (losses) were $707,000,$24,000, ($1.3 million)190,000), and 991,000$707,000 in 2019, 20182021, 2020, and 2017,2019, respectively. Gains and losses related to transactions denominated in a currency other than the functional currency of the countries in which we operate and short-term intercompany accounts are included in other income (expense) in the consolidated statements of income and amounted to $10,000, ($333,000), and ($483,000), $893,000 in 2021, 2020, and $63,000 in 2019, 2018 and 2017, respectively. The increasechange is primarily the result of exchange rate changesfluctuation applied to an intercompany loan from our Canadian subsidiary.subsidiary which was paid off in September 2020. A portion of our cash in our Canadian subsidiary is denominated in foreign currencies, where fluctuations in exchange rates will impact our cash balances in U.S. dollar terms. A sensitivity analysis assuming a hypothetical 10% change in the value of the U.S. dollar versus the Canadian dollar would impact our reported cash balance by approximately $507,000.$648,000. We have not entered into any foreign currency hedging transactions. We do not purchase or hold any currency exchange related derivative financial instruments for trading or otherwise forinstruments. We do not expect any foreign currency exposure after the purposeanticpated closure of speculation or arbitrage.our Canadian office by the end of 2022.
We are exposed to interest rate risk with both our fixed-rate term debtTerm Loan and variable rate revolving lineLine of credit facility.Credit. Interest rate changes for borrowings under our fixed-rate term debtTerm Loan would impact the fair value of such debt, but do not impact earnings or cash flow. At December 31, 2019,2021, our fixed-rate term debtTerm Loan totaled $34.3$26.6 million. Based on a sensitivity analysis, a one percent per annum change in market interest rates as of December 31, 2019,2021, would impact the estimated fair value of our fixed-rate debtTerm Loan outstanding at December 31, 20192021 by approximately $863,000.$647,000.
Borrowings under our Line of Credit and Delayed Draw Term Loan, if any, bear interest at a floating rate equal to the 30-day London Interbank Offered RateLIBOR plus 225 basis points. Borrowings under the Line of Credit and Delayed Draw Term Note may not exceed $15.0$30.0 million and $15.0 million, respectively. There were no borrowings outstanding under the Line of Credit at December 31, 2019.2021, or at any time during 2021. There were no borrowings outstanding under the Delayed Draw Term Note at December 31, 2019,2021, or at any time during 2019.2021. A sensitivity analysis assuming a hypothetical 10% movement in interest rates applied to the average daily borrowings and the maximum borrowings available under the Line of Credit for 20192021 indicated that such a movement would not have a material impact on our consolidated financial position, results of operations or cash flows. We have not entered into any interest rate swaps or hedging transactions.
LIBOR is currently expected to be phased out beginning in 2021 through 2023. The one-week and two-month LIBOR rates were retired on December 31, 2021. The overnight, one-month, three-month, six-month and 12-month LIBOR rates are expected to be published through June 2023. We are required to pay interest on borrowings under our Line of Credit and Delayed Draw Term Loan at floating rates based on the one-month LIBOR. Future debt that we may incur may also require that we pay interest based upon LIBOR. Under the terms of our Credit Agreement with FNB, if LIBOR becomes unavailable during the term of the agreement, FNB may, in its reasonable discretion and in a manner consistent with market practice, designate a substitute index. We currently expect that the determination of interest under our Credit Agreement would be revised as to provide for an interest rate that approximates the existing interest rate as calculated in accordance with LIBOR. Despite our current expectations, we cannot be sure that ifwhen LIBOR is phased out or transitioned, the changes to the determination of interest under our agreements would approximate the current calculation in accordance with LIBOR. We do not know what standard, if any, will replace LIBOR ifwhen it is phased out or transitioned.
Quarterly Financial Data (Unaudited)
The following table sets forth selected financial information for each of the eight quarters in the two-year period ended December 31, 2019. This unaudited information has been prepared on the same basis as the consolidated financial statements and includes all normal recurring adjustments necessary to present fairly this information when read in conjunction with our audited consolidated financial statements and the notes thereto.
(In thousands, except per share data) | ||||||||||||||||||||||||||||||||
Quarter Ended | ||||||||||||||||||||||||||||||||
Dec. 31, 2019 | Sept 30, 2019 | June 30, 2019 | Mar. 31, 2019 | Dec. 31, 2018 | Sept 30, 2018 | June 30, 2018 | Mar. 31, 2018 | |||||||||||||||||||||||||
Revenue | $ | 32,623 | $ | 32,465 | $ | 31,414 | $ | 31,480 | $ | 30,639 | $ | 30,013 | $ | 28,017 | $ | 31,017 | ||||||||||||||||
Direct expenses | 11,166 | 12,109 | 11,506 | 11,654 | 11,892 | 11,780 | 10,996 | 12,909 | ||||||||||||||||||||||||
Selling, general and administrative expenses | 8,241 | 8,706 | 8,319 | 7,707 | 7,885 | 7,679 | 7,940 | 7,867 | ||||||||||||||||||||||||
Depreciation and amortization | 1,254 | 1,430 | 1,440 | 1,415 | 1,467 | 1,388 | 1,325 | 1,283 | ||||||||||||||||||||||||
Operating income | 11,962 | 10,220 | 10,149 | 10,704 | 9,395 | 9,166 | 7,756 | 8,958 | ||||||||||||||||||||||||
Other income (expense) | (597 | ) | (411 | ) | (664 | ) | (844 | ) | 145 | (783 | ) | 63 | 9 | |||||||||||||||||||
Provision for income taxes | 2,667 | 1,690 | 2,092 | 1,664 | 1,739 | 1,391 | (129 | ) | 1,661 | |||||||||||||||||||||||
Net income | $ | 8,698 | $ | 8,119 | $ | 7,393 | $ | 8,196 | $ | 7,801 | $ | 6,992 | $ | 7,948 | $ | 7,306 | ||||||||||||||||
Earnings per share of common stock: | ||||||||||||||||||||||||||||||||
Basic earnings per share | ||||||||||||||||||||||||||||||||
Common (formerly class A) | $ | 0.35 | $ | 0.33 | $ | 0.30 | $ | 0.33 | $ | 0.32 | $ | 0.28 | $ | 0.29 | $ | 0.17 | ||||||||||||||||
Class B | $ | - | $ | - | $ | - | $ | - | $ | - | $ | - | $ | 0.27 | $ | 1.04 | ||||||||||||||||
Dilutive earnings per share | ||||||||||||||||||||||||||||||||
Common (formerly class A) | $ | 0.34 | $ | 0.31 | $ | 0.29 | $ | 0.32 | $ | 0.30 | $ | 0.27 | $ | 0.28 | $ | 0.17 | ||||||||||||||||
Class B | $ | - | $ | - | $ | - | $ | - | $ | - | $ | - | $ | 0.26 | $ | 1.01 | ||||||||||||||||
Weighted average shares outstanding – basic | ||||||||||||||||||||||||||||||||
Common (formerly class A) | 24,852 | 24,827 | 24,789 | 24,766 | 24,684 | 24,671 | 23,957 | 20,884 | ||||||||||||||||||||||||
Class B | - | - | - | - | - | - | 3,527 | 3,527 | ||||||||||||||||||||||||
Weighted average shares outstanding – diluted | ||||||||||||||||||||||||||||||||
Common (formerly class A) | 25,715 | 25,741 | 25,586 | 25,509 | 25,534 | 25,526 | 24,846 | 21,837 | ||||||||||||||||||||||||
Class B | - | - | - | - | - | - | 3,620 | 3,630 | ||||||||||||||||||||||||
Report of Independent Registered Public Accounting Firm
To the Shareholders and the Board of Directors
National Research Corporation:
OpinionsOpinions on the ConsolidatedFinancial Statements and Internal Control Over Financial Reporting
We have audited the accompanying consolidated balance sheets of National Research Corporation and subsidiary (the Company) as of December 31, 20192021 and 2018,2020, the related consolidated statements of income, comprehensive income, shareholders’ equity, and cash flows for each of the years in the three-year period ended December 31, 2019,2021, and the related notes (collectively, the consolidated financial statements). We also have audited the Company’s internal control over financial reporting as of December 31, 2019,2021, based on criteria established in Internal Control – Integrated Framework(2013) issued by the Committee of Sponsoring Organizations of the Treadway Commission.
In our opinion, the consolidated financial statements referred to above present fairly, in all material respects, the financial position of the Company as of December 31, 20192021 and 2018,2020, and the results of its operations and its cash flows for each of the years in the three-year period ended December 31, 2019,2021, in conformity with U.S. generally accepted accounting principles. Also in our opinion, the Company maintained, in all material respects, effective internal control over financial reporting as of December 31, 20192021 based on criteria established in Internal Control – Integrated Framework (2013) issued by the Committee of Sponsoring Organizations of the Treadway Commission.
Change in Accounting Principle
As discussed in Note 1 to the consolidated financial statements, the Company changed its method for accounting for revenue from contracts with customers in 2018 due to the adoption of Accounting Standards Update No. 2014-09, Revenue from Contracts with Customers, as amended.
Basis for OpinionsOpinions
The Company’s management is responsible for these consolidated financial statements, for maintaining effective internal control over financial reporting, and for its assessment of the effectiveness of internal control over financial reporting, included in the accompanying Management’s Report on Internal Control over Financial Reporting. Our responsibility is to express an opinion on the Company’s consolidated financial statements and an opinion on the Company’s internal control over financial reporting based on our audits. We are a public accounting firm registered with the Public Company Accounting Oversight Board (United States) (PCAOB) and are required to be independent with respect to the Company in accordance with the U.S. federal securities laws and the applicable rules and regulations of the Securities and Exchange Commission and the PCAOB.
We conducted our audits in accordance with the standards of the PCAOB. Those standards require that we plan and perform the audits to obtain reasonable assurance about whether the consolidated financial statements are free of material misstatement, whether due to error or fraud, and whether effective internal control over financial reporting was maintained in all material respects.
Our audits of the consolidated financial statements included performing procedures to assess the risks of material misstatement of the consolidated financial statements, whether due to error or fraud, and performing procedures that respond to those risks. Such procedures included examining, on a test basis, evidence regarding the amounts and disclosures in the consolidated financial statements. Our audits also included evaluating the accounting principles used and significant estimates made by management, as well as evaluating the overall presentation of the consolidated financial statements. Our audit of internal control over financial reporting included obtaining an understanding of internal control over financial reporting, assessing the risk that a material weakness exists, and testing and evaluating the design and operating effectiveness of internal control based on the assessed risk. Our audits also included performing such other procedures as we considered necessary in the circumstances. We believe that our audits provide a reasonable basis for our opinions.
Definition and Limitations of Internal Control Over Financial Reporting
A company’s internal control over financial reporting is a process designed to provide reasonable assurance regarding the reliability of financial reporting and the preparation of financial statements for external purposes in accordance with generally accepted accounting principles. A company’s internal control over financial reporting includes those policies and procedures that (1) pertain to the maintenance of records that, in reasonable detail, accurately and fairly reflect the transactions and dispositions of the assets of the company; (2) provide reasonable assurance that transactions are recorded as necessary to permit preparation of financial statements in accordance with generally accepted accounting principles, and that receipts and expenditures of the company are being made only in accordance with authorizations of management and directors of the company; and (3) provide reasonable assurance regarding prevention or timely detection of unauthorized acquisition, use, or disposition of the company’s assets that could have a material effect on the financial statements.
Because of its inherent limitations, internal control over financial reporting may not prevent or detect misstatements. Also, projections of any evaluation of effectiveness to future periods are subject to the risk that controls may become inadequate because of changes in conditions, or that the degree of compliance with the policies or procedures may deteriorate.
Critical Audit Matter
The critical audit matter communicated below is a matter arising from the current period audit of the consolidated financial statements that was communicated or required to be communicated to the audit committee and that: (1) relates to accounts or disclosures that are material to the consolidated financial statements and (2) involved our especially challenging, subjective, or complex judgments. The communication of a critical audit matter does not alter in any way our opinion on the consolidated financial statements, taken as a whole, and we are not, by communicating the critical audit matter below, providing a separate opinion on the critical audit matter or on the accounts or disclosures to which it relates.
Sufficiency of audit evidence over new and modified subscription-based service agreement terms
As discussed in Notes 1 and 3 to the consolidated financial statements, revenue consists of service arrangement contracts with customers that can include more than one separately identifiable performance obligation. The Company’s revenue for the year ended December 31, 2021 included $137.0 million for subscription-based service agreements, a portion of which was revenue from new and modified subscription-based service agreements, that was recognized ratably over the subscription period and which agreements are renewable at the option of the customer. Subscription-based service agreements represent a single promise to stand ready to provide reporting, tools and services throughout the subscription period.
We identified the evaluation of the sufficiency of audit evidence over the key terms within new and modified subscription-based service agreements as a critical audit matter. Specifically, the nature and extent of procedures performed over the key terms within the new and modified subscription-based service agreements required subjective auditor judgment as recognition of revenue by the Company is dependent on the accuracy of the key terms within the related information technology (IT) application used to calculate revenue. The key terms within the new subscription-based service agreements included the description of service, transaction price, renewal price and contract term, and the key terms within the modified subscription-based service agreements were the transaction price and contract term.
The following are the primary procedures we performed to address this critical audit matter. We applied auditor judgment to determine the nature and extent of procedures to be performed over the accuracy of key terms within the IT application, including the identification of key terms. We evaluated the design and tested the operating effectiveness of certain internal controls related to the Company’s subscription-based service revenue process, including controls related to the key terms within the new and modified subscription-based service agreements. We also tested certain internal controls over the accurate input of the underlying key terms of the subscription-based service agreement into the related IT application. For a sample of revenue transactions, we compared the key terms used in the revenue calculation to the underlying contract with the customer. We evaluated the sufficiency of audit evidence obtained over the key terms within new and modified subscription-based service agreements by assessing the results of procedures performed, including the appropriateness of the nature and extent of audit effort.
/s/ KPMG LLP
We have served as the Company’s auditor since 1997.
Lincoln, Nebraska
March 6, 20204, 2022
NATIONAL RESEARCH CORPORATION AND SUBSIDIARY
CONSOLIDATED BALANCE SHEETS
(In thousands, except share amounts)
2019 | 2018 | 2021 | 2020 | |||||||||||||
Assets | ||||||||||||||||
Current assets: | ||||||||||||||||
Cash and cash equivalents | $ | 13,517 | $ | 12,991 | $ | 54,361 | $ | 34,690 | ||||||||
Trade accounts receivable, less allowance for doubtful accounts of $144 and $175, respectively | 11,639 | 11,922 | ||||||||||||||
Trade accounts receivable, less allowance for doubtful accounts of $94 and $120, respectively | 13,728 | 13,923 | ||||||||||||||
Prepaid expenses | 2,038 | 2,925 | 3,884 | 2,645 | ||||||||||||
Income taxes receivable | 69 | 348 | 752 | 1,235 | ||||||||||||
Other current assets | 1,894 | 224 | 982 | 1,619 | ||||||||||||
Total current assets | 29,157 | 28,410 | 73,707 | 54,112 | ||||||||||||
Net property and equipment | 13,530 | 14,153 | 12,391 | 11,726 | ||||||||||||
Intangible assets, net | 1,728 | 2,102 | 1,790 | 1,410 | ||||||||||||
Goodwill | 57,935 | 57,831 | 61,614 | 57,255 | ||||||||||||
Operating lease right-of-use assets | 1,628 | -- | 975 | 1,308 | ||||||||||||
Deferred contract costs, net | 4,204 | 3,484 | 3,772 | 4,555 | ||||||||||||
Deferred income taxes | 14 | -- | ||||||||||||||
Other | 2,503 | 2,052 | 3,277 | 3,057 | ||||||||||||
Total assets | $ | 110,685 | $ | 108,032 | $ | 157,540 | $ | 133,423 | ||||||||
Liabilities and Shareholders’ Equity | ||||||||||||||||
Liabilities and Shareholders’ Equity | ||||||||||||||||
Current liabilities: | ||||||||||||||||
Current portion of notes payable, net of unamortized debt issuance costs | $ | 4,378 | $ | 3,667 | $ | 4,278 | $ | 4,061 | ||||||||
Accounts payable | 1,279 | 613 | 1,943 | 1,095 | ||||||||||||
Accrued wages, bonus and profit sharing | 6,086 | 5,798 | ||||||||||||||
Accrued wages and bonuses | 7,139 | 6,460 | ||||||||||||||
Accrued expenses | 3,408 | 2,834 | 5,450 | 3,184 | ||||||||||||
Income taxes payable | 366 | 636 | ||||||||||||||
Dividends payable | 5,239 | 17,113 | 3,044 | -- | ||||||||||||
Deferred revenue | 16,354 | 16,244 | 17,213 | 15,585 | ||||||||||||
Other current liabilities | 1,045 | 204 | 1,321 | 1,296 | ||||||||||||
Total current liabilities | 38,155 | 47,109 | 40,388 | 31,681 | ||||||||||||
Notes payable, net of current portion and unamortized debt issuance costs | 29,795 | 34,176 | 22,269 | 26,547 | ||||||||||||
Deferred income taxes | 7,399 | 6,276 | 7,002 | 7,265 | ||||||||||||
Other long term liabilities | 2,444 | 1,388 | ||||||||||||||
Other long-term liabilities | 2,544 | 3,615 | ||||||||||||||
Total liabilities | 77,793 | 88,949 | 72,203 | 69,108 | ||||||||||||
Shareholders’ equity: | ||||||||||||||||
Preferred stock, $0.01 par value, authorized 2,000,000 shares, none issued | -- | -- | ||||||||||||||
Common stock (formerly Class A), $0.001 par value; authorized 60,000,000 shares, issued 30,151,574 in 2019 and 29,917,667 in 2018, outstanding 24,947,500 in 2019 and 24,800,796 in 2018 | 30 | 30 | ||||||||||||||
Preferred stock, $0.01 par value, authorized 2,000,000 shares, none issued | -- | -- | ||||||||||||||
Common stock, $0.001 par value; authorized 110,000,000 shares in 2021 and 60,000,000 shares in 2020, issued 30,898,600 in 2021 and 30,775,154 in 2020, outstanding 25,361,409 in 2021 and 25,390,968 in 2020 | 31 | 31 | ||||||||||||||
Additional paid-in capital | 162,154 | 157,312 | 173,942 | 171,785 | ||||||||||||
Retained earnings (accumulated deficit) | (93,357 | ) | (106,339 | ) | (36,112 | ) | (61,375 | ) | ||||||||
Accumulated other comprehensive loss, foreign currency translation adjustment | (2,209 | ) | (2,916 | ) | (2,375 | ) | (2,399 | ) | ||||||||
Treasury stock, at cost; 5,204,074 Common (formerly Class A) shares in 2019 and 5,116,871 in 2018 | (33,726 | ) | (29,004 | ) | ||||||||||||
Treasury stock, at cost; 5,537,191 Common shares in 2021 and 5,384,186 Common shares | (50,149 | ) | (43,727 | ) | ||||||||||||
Total shareholders’ equity | 32,892 | 19,083 | 85,337 | 64,315 | ||||||||||||
Total liabilities and shareholders’ equity | $ | 110,685 | $ | 108,032 | $ | 157,540 | $ | 133,423 | ||||||||